
UNITED STATES
SECURITIES AND EXCHANGE COMMISSION
Washington, D.C. 20549
FORM N-CSRS
CERTIFIED SHAREHOLDER REPORT OF REGISTERED
MANAGEMENT INVESTMENT COMPANIES
Investment Company Act file number: 811-09253
Wells Fargo Funds Trust
(Exact name of registrant as specified in charter)
525 Market St., San Francisco, CA 94105
(Address of principal executive offices) (Zip code)
C. David Messman
Wells Fargo Funds Management, LLC
525 Market St., San Francisco, CA 94105
(Name and address of agent for service)
Registrant’s telephone number, including area code: 800-222-8222
Date of fiscal year end: October 31, 2011
Date of reporting period: April 30, 2012
ITEM 1. REPORT TO SHAREHOLDERS

Wells Fargo Advantage International Bond Fund

Semi-Annual Report
April 30, 2012

Reduce clutter. Save trees.
Sign up for electronic delivery of prospectuses and shareholder reports at wellsfargo.com/advantagedelivery
Contents
The views expressed and any forward-looking statements are as of April 30, 2012, unless otherwise noted, and are those of the Fund managers and/or Wells Fargo Funds Management, LLC. Discussions of individual securities, or the markets generally, or any Wells Fargo Advantage Fund are not intended as individual recommendations. Future events or results may vary significantly from those expressed in any forward-looking statements; the views expressed are subject to change at any time in response to changing circumstances in the market. Wells Fargo Funds Management, LLC, disclaims any obligation to publicly update or revise any views expressed or forward-looking statements.
NOT FDIC INSURED ¡ NO BANK GUARANTEE ¡ MAY LOSE VALUE

WELLS FARGO INVESTMENT HISTORY
| | |
| |
| 1932 | | Keystone creates one of the first mutual fund families. |
| |
| 1971 | | Wells Fargo & Company introduces one of the first institutional index funds. |
| |
| 1978 | | Wells Fargo applies Markowitz and Sharpe’s research on Modern Portfolio Theory to introduce one of the industry’s first Tactical Asset Allocation (TAA) models in institutional separately managed accounts. |
| |
| 1984 | | Wells Fargo Stagecoach Funds launches its first asset allocation fund. |
| |
| 1989 | | The Tactical Asset Allocation (TAA) Model is first applied to Wells Fargo’s asset allocation mutual funds. |
| |
| 1994 | | Wells Fargo introduces the LifePath Funds, one of the first suites of target date funds (now the Wells Fargo Advantage Dow Jones Target Date FundsSM). |
| |
| 1996 | | Evergreen Investments and Keystone Funds merge. |
| |
| 1997 | | Wells Fargo launches Wells Fargo Advantage WealthBuilder PortfoliosSM, a fund-of-funds suite of products that includes the use of quantitative models to shift assets among investment styles. |
| |
| 1999 | | Norwest Advantage Funds and Stagecoach Funds are reorganized into Wells Fargo Funds after the merger of Norwest and Wells Fargo. |
| |
| 2002 | | Evergreen Retail and Evergreen Institutional companies form the umbrella asset management company, Evergreen Investments. |
| |
| 2005 | | The integration of Strong Funds with Wells Fargo Funds creates Wells Fargo Advantage Funds, resulting in one of the top 20 mutual fund companies in the United States. |
| |
| 2006 | | Wells Fargo Advantage Funds relaunches the target date product line as Wells Fargo Advantage Dow Jones Target Date Funds. |
| |
| 2010 | | The mergers and reorganizations of Evergreen and Wells Fargo Advantage mutual funds are completed, unifying the families under the brand of Wells Fargo Advantage Funds. |
Wells Fargo Advantage Funds®
Wells Fargo Advantage Funds skillfully guides institutions, financial advisors, and individuals through the investment terrain to help them reach their financial objectives. Everything we do on behalf of investors is backed by our unique combination of qualifications.
Strength
Our organization is built on the standards of integrity and service established by our parent company—Wells Fargo & Company—more than 150 years ago. And, because we’re part of a highly diversified financial enterprise, we offer the depth of resources to help investors succeed.
Expertise
Our multi-boutique model offers investors access to the independent thinking of premier investment managers that have been chosen for their time-tested strategies. While each team specializes in a specific investment strategy, collectively they provide investors a wide choice of distinct investment styles. Our dedication to investment excellence doesn’t end with our expertise in manager selection—risk management, analysis, and rigorous ongoing review seek to ensure each manager’s investment process remains consistent.
Partnership
Our collaborative approach is built around understanding the needs and goals of our clients. By adhering to core principles of sound judgment and steady guidance, we support you through every stage of the investment decision process.
Carefully consider a fund’s investment objectives, risks, charges, and expenses before investing. For a current prospectus and, if available, a summary prospectus, containing this and other information, visit wellsfargoadvantagefunds.com. Read it carefully before investing.
Wells Fargo Funds Management, LLC, a wholly owned subsidiary of Wells Fargo & Company, provides investment advisory and administrative services for Wells Fargo Advantage Funds®. Other affiliates of Wells Fargo & Company provide subadvisory and other services for the Funds. The Funds are distributed by Wells Fargo Funds Distributor, LLC, Member FINRA/SIPC, an affiliate of Wells Fargo & Company.
“Dow Jones®” and “Dow Jones Target Date IndexesSM” are service marks of Dow Jones Trademark Holdings, LLC (“Dow Jones”), have been licensed to CME Group Index Services LLC (“CME Indexes”) and have been sublicensed for use for certain purposes by Global Index Advisors, Inc, and Wells Fargo Funds Management, LLC. The Wells Fargo Advantage Dow Jones Target Date FundsSM based on the Dow Jones Target Date IndexesSM, are not sponsored, endorsed, sold or promoted by Dow Jones, CME Indexes or their respective affiliates and none of them makes any representation regarding the advisability of investing in such product(s).
NOT FDIC INSURED ¡ NO BANK GUARANTEE ¡ MAY LOSE VALUE
Not part of the semi-annual report.
Wells Fargo Advantage Funds offers more than 110 mutual funds across a wide range of asset classes, representing over $211 billion in assets under management, as of April 30, 2012.
| | | | |
| Equity Funds | | | | |
Asia Pacific Fund | | Enterprise Fund† | | Opportunity Fund† |
C&B Large Cap Value Fund | | Equity Value Fund | | Precious Metals Fund |
C&B Mid Cap Value Fund | | Global Opportunities Fund | | Premier Large Company Growth Fund |
Capital Growth Fund | | Growth Fund | | Small Cap Opportunities Fund |
Common Stock Fund | | Index Fund | | Small Cap Value Fund |
Disciplined U.S. Core Fund | | International Equity Fund | | Small Company Growth Fund |
Discovery Fund† | | International Value Fund | | Small Company Value Fund |
Diversified Equity Fund | | Intrinsic Small Cap Value Fund | | Small/Mid Cap Core Fund |
Diversified International Fund | | Intrinsic Value Fund | | Small/Mid Cap Value Fund |
Diversified Small Cap Fund | | Intrinsic World Equity Fund | | Special Mid Cap Value Fund |
Emerging Growth Fund | | Large Cap Core Fund | | Special Small Cap Value Fund |
Emerging Markets Equity Fund | | Large Cap Growth Fund | | Specialized Technology Fund |
Emerging Markets Equity Income Fund | | Large Company Value Fund | | Traditional Small Cap Growth Fund |
Emerging Markets Local Bond Fund | | Omega Growth Fund | | Utility and Telecommunications Fund |
Endeavor Select Fund† | | | | |
| Bond Funds | | | | |
Adjustable Rate Government Fund | | Inflation-Protected Bond Fund | | Short-Term Bond Fund |
California Limited-Term Tax-Free Fund | | Intermediate Tax/AMT-Free Fund | | Short-Term High Yield Bond Fund |
California Tax-Free Fund | | International Bond Fund | | Short-Term Municipal Bond Fund |
Colorado Tax-Free Fund | | Minnesota Tax-Free Fund | | Strategic Municipal Bond Fund |
Government Securities Fund | | Municipal Bond Fund | | Total Return Bond Fund |
High Income Fund | | North Carolina Tax-Free Fund | | Ultra Short-Term Income Fund |
High Yield Bond Fund | | Pennsylvania Tax-Free Fund | | Ultra Short-Term Municipal Income Fund |
Income Plus Fund | | Short Duration Government Bond Fund | | Wisconsin Tax-Free Fund |
| Asset Allocation Funds | | | | |
Absolute Return Fund | | WealthBuilder Equity Portfolio† | | Target 2020 Fund† |
Asset Allocation Fund | | WealthBuilder Growth Allocation Portfolio† | | Target 2025 Fund† |
Conservative Allocation Fund | | WealthBuilder Growth Balanced Portfolio† | | Target 2030 Fund† |
Diversified Capital Builder Fund | | WealthBuilder Moderate Balanced Portfolio† | | Target 2035 Fund† |
Diversified Income Builder Fund | | WealthBuilder Tactical Equity Portfolio† | | Target 2040 Fund† |
Growth Balanced Fund | | Target Today Fund† | | Target 2045 Fund† |
Index Asset Allocation Fund | | Target 2010 Fund† | | Target 2050 Fund† |
Moderate Balanced Fund | | Target 2015 Fund† | | Target 2055 Fund† |
WealthBuilder Conservative Allocation Portfolio† | | | | |
| Money Market Funds | | | | |
100% Treasury Money Market Fund | | Heritage Money Market Fund† | | National Tax-Free Money Market Fund |
California Municipal Money Market Fund | | Money Market Fund | | Prime Investment Money Market Fund |
Cash Investment Money Market Fund | | Municipal Cash Management Money Market Fund | | Treasury Plus Money Market Fund |
Government Money Market Fund | | Municipal Money Market Fund | | |
| Variable Trust Funds1 | | | | |
VT Discovery Fund† | | VT Intrinsic Value Fund | | VT Small Cap Growth Fund |
VT Index Asset Allocation Fund | | VT Omega Growth Fund | | VT Small Cap Value Fund |
VT International Equity Fund | | VT Opportunity Fund† | | VT Total Return Bond Fund |
An investment in a money market fund is not insured or guaranteed by the Federal Deposit Insurance Corporation or any other government agency. Although the Wells Fargo Advantage Money Market Funds seek to preserve the value of your investment at $1.00 per share, it is possible to lose money by investing in a money market fund.
| 1. | The Variable Trust Funds are generally available only through insurance company variable contracts. |
| † | In this report, the Wells Fargo Advantage Discovery FundSM, Wells Fargo Advantage Endeavor Select FundSM, Wells Fargo Advantage Enterprise FundSM, Wells Fargo Advantage Opportunity FundSM, Wells Fargo Advantage WealthBuilder Conservative Allocation PortfolioSM, Wells Fargo Advantage WealthBuilder Equity PortfolioSM, Wells Fargo Advantage WealthBuilder Growth Allocation PortfolioSM, Wells Fargo Advantage WealthBuilder Growth Balanced PortfolioSM, Wells Fargo Advantage WealthBuilder Moderate Balanced PortfolioSM, Wells Fargo Advantage WealthBuilder Tactical Equity PortfolioSM, Wells Fargo Advantage Dow Jones Target Today FundSM, Wells Fargo Advantage Dow Jones Target 2010 FundSM, Wells Fargo Advantage Dow Jones Target 2015 FundSM, Wells Fargo Advantage Dow Jones Target 2020 FundSM, Wells Fargo Advantage Dow Jones Target 2025 FundSM, Wells Fargo Advantage Dow Jones Target 2030 FundSM, Wells Fargo Advantage Dow Jones Target 2035 FundSM, Wells Fargo Advantage Dow Jones Target 2040 FundSM, Wells Fargo Advantage Dow Jones Target 2045 FundSM, Wells Fargo Advantage Dow Jones Target 2050 FundSM, Wells Fargo Advantage Dow Jones Target 2055 FundSM, Wells Fargo Advantage Heritage Money Market FundSM, Wells Fargo Advantage VT Discovery FundSM, and Wells Fargo Advantage VT Opportunity FundSM are referred to as the Discovery Fund, Endeavor Select Fund, Enterprise Fund, Opportunity Fund, WealthBuilder Conservative Allocation Portfolio, WealthBuilder Equity Portfolio, WealthBuilder Growth Allocation Portfolio, WealthBuilder Growth Balanced Portfolio, WealthBuilder Moderate Balanced Portfolio, WealthBuilder Tactical Equity Portfolio, Target Today Fund, Target 2010 Fund, Target 2015 Fund, Target 2020 Fund, Target 2025 Fund, Target 2030 Fund, Target 2035 Fund, Target 2040 Fund, Target 2045 Fund, Target 2050 Fund, Target 2055 Fund, Heritage Money Market Fund, VT Discovery Fund, and VT Opportunity Fund, respectively. |
Not part of the semi-annual report.
| | | | |
| 2 | | Wells Fargo Advantage International Bond Fund | | Letter to Shareholders |

Karla M. Rabusch,
President
Wells Fargo Advantage Funds
Global fixed-income markets experienced some volatility during the six-month period but generally provided positive returns, with the lower-rated segments of the markets largely providing some of the best returns.
Dear Valued Shareholder:
We are pleased to offer you this semi-annual report for the Wells Fargo Advantage International Bond Fund, which covers the six-month period that ended April 30, 2012. Global fixed-income markets experienced some volatility during the six-month period but generally provided positive returns, with the lower-rated segments of the markets largely providing some of the best returns. Concerns over the Greek debt crisis permeated all corners of the global debt markets during the period, but high-yield and emerging market debt performed well nonetheless. Meanwhile, sovereign debt sectors generally underperformed due to the unresolved debt issues facing Greece and extending to Spain and Italy, among others. On the whole, the global macroeconomic environment remained mostly unchanged from prior periods, with the largest economies experiencing low interest rates, low inflation, and low expectations for economic growth.
Lower-quality1 and high-yield global fixed-income securities performed well during the period.
The period began with sovereign debt yields continuing to broadly decline, with the greatest shifts occurring in the longest maturities. However, lower-quality credit also recovered strongly from the sharp declines experienced in August and September 2011 before the period began. Thus, the opening of the period was very much a recovery from escalated global credit fears that had roiled the global bond markets during the summer. Credit spreads largely narrowed throughout the period and long-maturity sovereign yields also declined, creating a landscape of positive returns across nearly every segment of the global bond markets. In the first half of the period, only the bond markets of Greece, Italy and Portugal continued to see declines in their bond valuations, while the rest of the world largely shrugged off the risks and rallied.
In the second half of the period, European credit markets continued to strengthen, inspiring growing confidence across the broader global credit markets. Consequently, lower-rated securities rallied, while higher-quality securities underperformed. Sovereign debt from the countries that had been the best performers in the initial recovery during the first half of the period lagged the stronger returns from the countries that had been in distress—most notably, Ireland, Italy, Portugal and Spain. Countries that are smaller and more growth-oriented were the greatest beneficiaries of the improving credit conditions and strengthening consensus forecasts for global growth. Those trends peaked in February 2012 before pulling back in March and then unwinding a bit in April. Toward the end of the period, Spanish debt problems brought volatility back to the bond markets, causing U.S. Treasury debt to rally as investors flocked to the relative safe-haven asset class. Thus, after several consecutive months of strengthening confidence in the global credit markets, European sovereign debt woes returned to haunt the global credit markets.
Bonds and currencies of smaller economies continued to demonstrate strength.
Bonds and currencies of the smaller economies generally continued to demonstrate the most appreciation during the period, despite some initial
| 1. | We generally define lower quality bonds as bonds with a rating below BBB. The ratings indicated are from Standard & Poor’s. Standard & Poor’s rates the creditworthiness of bonds, ranging from AAA (highest) to D (lowest). Ratings from A to CCC may be modified by the addition of a plus (+) or minus (-) sign to show relative standing within the rating categories. |
| | | | | | |
| Letter to Shareholders | | Wells Fargo Advantage International Bond Fund | | | 3 | |
underperformance in the opening months of the period. On the whole, we continued to see several indications that growth in the largest economies will likely remain restrained for some time while these governments continue to address massive levels of debt. By contrast, the outlook continued to appear better for the smaller, more dynamic economies that have healthier growth prospects, lower deficits, and trade surpluses. Markets demonstrated several trends in that direction throughout the second half of the period as an improvement in the global growth outlook sparked rallies in the currencies of growing economies such as the Czech Republic, Hungary, Malaysia, Mexico, New Zealand, Norway and Poland. In our estimation, the long-term macro trend for the smaller currencies to appreciate remained in place, despite intermittent periods of volatility and risk aversion.
Short-term volatility shouldn’t derail long-term investment goals.
Although we cannot definitively say what near-term fixed-income performance will look like—across either the largest economic regions or the smaller, more dynamic economies—we continue to encourage investors to maintain fully diversified, actively managed portfolios, which we believe may provide better protection from risk and added opportunities to capture relative value. In our opinion, diligent and earnest assessment of the fundamental risks in individual fixed-income securities will be a key factor in determining which investment strategies perform well and which do not. We believe it is important to have the right caretakers in charge of investors’ assets during times of uncertainty and opportunity. At Wells Fargo Advantage Funds, we intend to continue monitoring relative-value opportunities in the international fixed-income markets.
As evidenced by the performance of international fixed-income assets during the recent six-month period, heightened risks often may also entail opportunities. While periods of volatility can present challenges, experience has taught us that maintaining a long-term investment strategy based on individual goals and risk tolerance can be an effective way to plan for the future. To help you create a sound strategy based on your personal goals and risk tolerance, Wells Fargo Advantage Funds offers more than 110 mutual funds and other investments spanning a wide range of asset classes and investment styles. Although diversification cannot guarantee an investment profit or prevent losses, we believe it can be an effective way to manage investment risk and potentially smooth out overall portfolio performance.
Thank you for choosing to invest with Wells Fargo Advantage Funds. We appreciate your confidence in us and remain committed to helping you meet your financial needs. For current information about your fund investments, contact your investment professional, visit our Web site at wellsfargoadvantagefunds.com, or call us directly at 1-800-222-8222. We are available 24 hours a day, 7 days a week.
Sincerely,

Karla M. Rabusch
President
Wells Fargo Advantage Funds
The outlook continued to appear better for the smaller, more dynamic economies that have healthier growth prospects, lower deficits, and trade surpluses.
| | | | |
| 4 | | Wells Fargo Advantage International Bond Fund | | Letter to Shareholders |
Notice to Shareholders
The Board of Trustees for Wells Fargo Advantage Funds has unanimously approved the following modifications to certain net asset value (NAV) waiver privileges and commission schedules:
| | n | | Effective May 1, 2012, automatic investment plan (AIP) purchases and proceeds received from systematic withdrawals will no longer qualify for NAV repurchase privileges. | |
| | n | | Effective May 1, 2012, discretionary rights to waive the upfront commission for Class C and “jumbo” Class A share purchases will no longer be granted to broker/dealers. However, we will continue to waive the Class C shares contingent deferred sales charge for redemptions by employer-sponsored retirement plans where the dealer of record waived its commission at the time of purchase. | |
| | n | | Effective July 31, 2012, NAV purchase privileges for former Evergreen Class IS and Class R shareholders are being modified to remove the ability to purchase Class A shares at NAV unless those shares are held directly with the Fund on or after July 31, 2012. | |
Please contact your investment professional or call us directly at 1-800-222-8222 if you have any questions on this Notice to Shareholders.
| | | | | | |
| Performance Highlights (Unaudited) | | Wells Fargo Advantage International Bond Fund | | | 5 | |
INVESTMENT OBJECTIVE
The Fund seeks total return, consisting of income and capital appreciation.
ADVISER
Wells Fargo Funds Management, LLC
SUB-ADVISER
First International Advisors, LLC
PORTFOLIO MANAGERS
Michael Lee
Tony Norris
Alex Perrin
Christopher Wightman2
Peter Wilson
FUND INCEPTION
December 15, 1993
| | | | |
TEN LARGEST LONG-TERM HOLDINGS1
(AS OF APRIL 30, 2012) | |
Japan, 1.00%, 09/20/2021 | | | 7.18% | |
Canada, 2.75%, 09/01/2016 | | | 5.45% | |
Australia Series 25CI, 3.24%, 09/20/2025 | | | 4.46% | |
Italy Buoni Poliennali del Tesoro, 4.00%, 02/01/2017 | | | 3.92% | |
Norway, 3.75%, 05/25/2021 | | | 3.69% | |
Spain, 4.25% 10/31/2016 | | | 3.10% | |
Mexico, 8.50%, 11/18/2038 | | | 2.95% | |
Malaysia, 4.26%, 09/15/2016 | | | 2.92% | |
Hungary, 6.75%, 02/12/2013 | | | 2.78% | |
Japan, 2.00%, 09/20/2041 | | | 2.73% | |
| | |
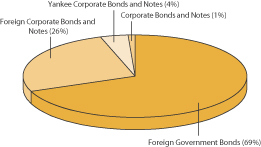
PORTFOLIO ALLOCATION3
(AS OF APRIL 30, 2012) |
|
 |
| 1. | The ten largest long-term holdings are calculated based on the value of the securities divided by total net assets of the Fund. Holdings are subject to change and may have changed since the date specified. |
| 2. | Effective June 29, 2012, Christopher Wightman became co-portfolio manager of the Fund. |
| 3. | Portfolio allocation is subject to change and is calculated based on the total long-term investments of the Fund. |
| | | | |
| 6 | | Wells Fargo Advantage International Bond Fund | | Performance Highlights (Unaudited) |
AVERAGE ANNUAL TOTAL RETURN4 (%) (AS OF APRIL 30, 2012)
| | | | | | | | | | | | | | | | | | | | | | | | | | | | | | | | | | | | | | | | | | | | |
| | | | | | Including Sales Charge | | | Excluding Sales Charge | | | Expense Ratios5 | |
| | | Inception Date | | | 6 Months* | | | 1 Year | | | 5 Year | | | 10 Year | | | 6 Months* | | | 1 Year | | | 5 Year | | | 10 Year | | | Gross | | | Net6 | |
Class A (ESIYX) | | | 09/30/2003 | | | | (4.91 | ) | | | (4.75 | ) | | | 6.49 | | | | 8.33 | | | | (0.42 | ) | | | (0.25 | ) | | | 7.47 | | | | 8.83 | | | | 1.02% | | | | 1.02% | |
Class B (ESIUX)** | | | 09/30/2003 | | | | (5.59 | ) | | | (5.72 | ) | | | 6.36 | | | | 8.30 | | | | (0.74 | ) | | | (0.94 | ) | | | 6.67 | | | | 8.30 | | | | 1.77% | | | | 1.77% | |
Class C (ESIVX) | | | 09/30/2003 | | | | (1.74 | ) | | | (1.98 | ) | | | 6.68 | | | | 8.05 | | | | (0.74 | ) | | | (0.98 | ) | | | 6.68 | | | | 8.05 | | | | 1.77% | | | | 1.77% | |
Administrator Class (ESIDX) | | | 07/30/2010 | | | | | | | | | | | | | | | | | | | | (0.28 | ) | | | (0.07 | ) | | | 7.62 | | | | 9.00 | | | | 0.96% | | | | 0.85% | |
Institutional Class (ESICX) | | | 12/15/1993 | | | | | | | | | | | | | | | | | | | | (0.15 | ) | | | 0.18 | | | | 7.77 | | | | 9.14 | | | | 0.69% | | | | 0.69% | |
BofA Merrill Lynch Global Broad Market Ex. U.S. Index7 | | | | | | | | | | | | | | | | | | | | | | | 0.08 | | | | 0.90 | | | | 6.47 | | | | 8.50 | | | | | | | | | |
| * | Returns for periods of less than one year are not annualized. |
| ** | Class B shares are closed to investment, except in connection with the reinvestment of any distributions and permitted exchanges. |
Figures quoted represent past performance, which is no guarantee of future results and do not reflect the deduction of taxes that a shareholder may pay on fund distributions or the redemption of fund shares. Investment return and principal value of an investment will fluctuate so that an investor’s shares, when redeemed, may be worth more or less than their original cost. Performance shown without sales charges would be lower if sales charges were reflected. Current performance may be lower or higher than the performance data quoted and assumes the reinvestment of dividends and capital gains. Current month-end performance is available on the Fund’s Web site – wellsfargoadvantagefunds.com.
Index returns do not include transaction costs associated with buying and selling securities, any mutual fund fees or expenses or any taxes. It is not possible to invest directly in an index.
For Class A shares, the maximum front-end sales charge is 4.50%. For Class B shares, the maximum contingent deferred sales charge is 5.00%. For Class C shares, the maximum contingent deferred sales charge is 1.00%. Performance including sales charge assumes the sales charge for the corresponding time period. Administrator Class and Institutional Class shares are sold without a front-end sales charge or contingent deferred sales charge.
Bond fund values fluctuate in response to the financial condition of individual issuers, general market and economic conditions, and changes in interest rates. In general, when interest rates rise, bond fund values fall and investors may lose principal value. Foreign investments are especially volatile and can rise or fall dramatically due to differences in the political and economic conditions of the host country. These risks are generally intensified in emerging markets. The use of derivatives may reduce returns and/or increase volatility. Certain investment strategies tend to increase the total risk of an investment (relative to the broader market). This Fund is exposed to high-yield securities risk, mortgage- and asset-backed securities risk, and regional risk. Consult the Fund’s prospectus for additional information on these and other risks.
| 4. | Historical performance shown for Class A, Class B, Class C and Administrator Class shares prior to their inception reflects the performance of the Institutional Class shares, adjusted to reflect the higher expenses applicable to Class A, Class B, Class C and Administrator Class shares. Historical performance shown for all classes of the Fund prior to July 12, 2010 is based on the performance of the Fund’s predecessor, Evergreen International Bond Fund. |
| 5. | Reflects the expense ratios as stated in the most recent prospectuses. |
| 6. | The Adviser has committed through July 11, 2013 to waive fees and/or reimburse expenses to the extent necessary to cap the Fund’s Total Annual Fund Operating Expenses After Fee Waiver, excluding certain expenses, at 1.03% for Class A, 1.78% for Class B, 1.78% for Class C, 0.85% for Administrator Class and 0.73% for Institutional Class. Without this cap, the Fund’s returns would have been lower. |
| 7. | The BofA Merrill Lynch Global Broad Market Ex. U.S. Index tracks the performance of investment grade debt publicly issued in the major domestic and euro bond markets, including sovereign, quasi-government, corporate, securitized and collateralized securities and excludes all securities denominated in U.S. dollars. You cannot invest directly in an index. |
| | | | | | |
| Fund Expenses (Unaudited) | | Wells Fargo Advantage International Bond Fund | | | 7 | |
As a shareholder of the Fund, you incur two types of costs: (1) transaction costs, including sales charges (loads) on purchase payments and contingent deferred sales charges (if any) on redemptions and (2) ongoing costs, including management fees; distribution (12b-1) and/or shareholder service fees; and other Fund expenses. This example is intended to help you understand your ongoing costs (in dollars) of investing in the Fund and to compare these costs with the ongoing costs of investing in other mutual funds.
The example is based on an investment of $1,000 invested at the beginning of the six-month period and held for the entire period from November 1, 2011 to April 30, 2012.
Actual Expenses
The “Actual” line of the table below provides information about actual account values and actual expenses. You may use the information in this line, together with the amount you invested, to estimate the expenses that you paid over the period. Simply divide your account value by $1,000 (for example, an $8,600 account value divided by $1,000 = 8.6), then multiply the result by the number in the “Actual” line under the heading entitled “Expenses Paid During Period” for your applicable class of shares to estimate the expenses you paid on your account during this period.
Hypothetical Example for Comparison Purposes
The “Hypothetical” line of the table below provides information about hypothetical account values and hypothetical expenses based on the Fund’s actual expense ratio and an assumed rate of return of 5% per year before expenses, which is not the Fund’s actual return. The hypothetical account values and expenses may not be used to estimate the actual ending account balance or expenses you paid for the period. You may use this information to compare the ongoing costs of investing in the Fund and other funds. To do so, compare this 5% hypothetical example with the 5% hypothetical examples that appear in the shareholder reports of the other funds.
Please note that the expenses shown in the table are meant to highlight your ongoing costs only and do not reflect any transactional costs, such as sales charges (loads) and contingent deferred sales charges. Therefore, the “Hypothetical” line of the table is useful in comparing ongoing costs only, and will not help you determine the relative total costs of owning different funds. In addition, if these transactional costs were included, your costs would have been higher.
| | | | | | | | | | | | | | | | |
| | | Beginning
Account Value
11-01-2011 | | | Ending
Account Value
04-30-2012 | | | Expenses
Paid During
the Period1 | | | Net Annual
Expense Ratio | |
Class A | | | | | | | | | | | | | | | | |
Actual | | $ | 1,000.00 | | | $ | 995.84 | | | $ | 5.11 | | | | 1.03 | % |
Hypothetical (5% return before expenses) | | $ | 1,000.00 | | | $ | 1,019.74 | | | $ | 5.17 | | | | 1.03 | % |
Class B | | | | | | | | | | | | | | | | |
Actual | | $ | 1,000.00 | | | $ | 992.64 | | | $ | 8.82 | | | | 1.78 | % |
Hypothetical (5% return before expenses) | | $ | 1,000.00 | | | $ | 1,016.01 | | | $ | 8.92 | | | | 1.78 | % |
Class C | | | | | | | | | | | | | | | | |
Actual | | $ | 1,000.00 | | | $ | 992.64 | | | $ | 8.82 | | | | 1.78 | % |
Hypothetical (5% return before expenses) | | $ | 1,000.00 | | | $ | 1,016.01 | | | $ | 8.92 | | | | 1.78 | % |
Administrator Class | | | | | | | | | | | | | | | | |
Actual | | $ | 1,000.00 | | | $ | 997.25 | | | $ | 4.22 | | | | 0.85 | % |
Hypothetical (5% return before expenses) | | $ | 1,000.00 | | | $ | 1,020.64 | | | $ | 4.27 | | | | 0.85 | % |
Institutional Class | | | | | | | | | | | | | | | | |
Actual | | $ | 1,000.00 | | | $ | 998.51 | | | $ | 3.48 | | | | 0.70 | % |
Hypothetical (5% return before expenses) | | $ | 1,000.00 | | | $ | 1,021.38 | | | $ | 3.52 | | | | 0.70 | % |
| 1. | Expenses paid is equal to the annualized expense ratio of each class multiplied by the average account value over the period, multiplied by the number of days in the most recent fiscal half-year divided by the number of days in the fiscal year (to reflect the one-half year period). |
| | | | |
| 8 | | Wells Fargo Advantage International Bond Fund | | Portfolio of Investments—April 30, 2012 (Unaudited) |
| | | | | | | | | | | | | | | | |
| Security Name | | Interest Rate | | | Maturity Date | | | Principal | | | Value | |
| | | | | | | | | | | | | | | | |
| | | | |
Corporate Bonds and Notes: 0.68% | | | | | | | | | | | | | | | | |
| | | | |
| United States: 0.68% | | | | | | | | | | | | | | | | |
Anheuser-Busch In Bev Worldwide Incorporated (Consumer Staples, Beverages) | | | 6.88 | % | | | 11/15/2019 | | | $ | 9,525,000 | | | $ | 12,292,146 | |
| | | | | | | | | | | | | | | | |
| | | | |
Total Corporate Bonds and Notes (Cost $9,496,866) | | | | | | | | | | | | | | | 12,292,146 | |
| | | | | | | | | | | | | | | | |
| | | | |
Foreign Corporate Bonds and Notes @: 25.31% | | | | | | | | | | | | | | | | |
| | | | |
| Australia: 1.25% | | | | | | | | | | | | | | | | |
General Electric Capital Australia Funding (Financials, Diversified Financial
Services, AUD) | | | 6.00 | | | | 03/15/2019 | | | | 1,405,000 | | | | 1,467,282 | |
International Bank for Reconstruction & Development (Financials, Commercial Banks, AUD) | | | 5.75 | | | | 10/01/2020 | | | | 4,000,000 | | | | 4,497,269 | |
New South Wales Treasury Corporation (Financials, Diversified Financial
Services, AUD) | | | 3.15 | | | | 11/20/2025 | | | | 5,000,000 | | | | 6,310,622 | |
Telstra Corporation Limited (Telecommunication Services, Diversified Telecommunication Services, EUR) | | | 4.25 | | | | 03/23/2020 | | | | 7,000,000 | | | | 10,310,948 | |
| | | | |
| | | | | | | | | | | | | | | 22,586,121 | |
| | | | | | | | | | | | | | | | |
| | | | |
| Brazil: 0.02% | | | | | | | | | | | | | | | | |
Banco Do Brasil (Financials, Commercial Banks, EUR) | | | 4.50 | | | | 01/20/2016 | | | | 300,000 | | | | 416,013 | |
| | | | | | | | | | | | | | | | |
| | | | |
| Cayman Islands: 0.02% | | | | | | | | | | | | | | | | |
Voto-Votorantim Limited (Financials, Diversified Financial Services, EUR) | | | 5.25 | | | | 04/28/2017 | | | | 300,000 | | | | 421,532 | |
| | | | | | | | | | | | | | | | |
| | | | |
| France: 0.99% | | | | | | | | | | | | | | | | |
Casino Guichard Perrach (Consumer Staples, Food & Staples
Retailing, EUR) | | | 4.38 | | | | 02/08/2017 | | | | 7,650,000 | | | | 10,649,483 | |
Veolia Environnement SA (Utilities, Multi-Utilities, EUR) | | | 4.38 | | | | 01/16/2017 | | | | 5,000,000 | | | | 7,190,340 | |
| | | | |
| | | | | | | | | | | | | | | 17,839,823 | |
| | | | | | | | | | | | | | | | |
| | | | |
| Germany: 6.45% | | | | | | | | | | | | | | | | |
Dexia Kommunalbank AG (Financials, Commercial Banks, EUR) | | | 3.50 | | | | 06/05/2014 | | | | 25,080,000 | | | | 34,270,049 | |
Eurohypo AG (Financials, Commercial Banks, EUR) | | | 3.75 | | | | 03/24/2014 | | | | 22,080,000 | | | | 30,648,802 | |
KFW Bankengruppe (Financials, Commercial Banks, EUR) | | | 2.25 | | | | 09/21/2017 | | | | 12,650,000 | | | | 17,534,193 | |
KFW Bankengruppe (Financials, Commercial Banks, NOK) | | | 3.75 | | | | 09/25/2015 | | | | 75,500,000 | | | | 13,659,907 | |
KFW Bankengruppe (Financials, Commercial Banks, AUD) | | | 6.25 | | | | 12/04/2019 | | | | 7,700,000 | | | | 8,677,869 | |
Kreditanstalt fur Wiederaufbau (Financials, Commercial Banks, EUR) | | | 3.88 | | | | 01/21/2019 | | | | 6,250,000 | | | | 9,387,492 | |
UPC Holdings BV (Consumer Discretionary, Media, EUR) | | | 9.63 | | | | 12/01/2019 | | | | 1,500,000 | | | | 2,124,539 | |
| | | | |
| | | | | | | | | | | | | | | 116,302,851 | |
| | | | | | | | | | | | | | | | |
| | | | |
| Ireland: 0.12% | | | | | | | | | | | | | | | | |
Smurfit Kappa Funding plc (Financials, Diversified Financial Services, EUR) | | | 7.25 | | | | 11/15/2017 | | | | 1,500,000 | | | | 2,104,684 | |
| | | | | | | | | | | | | | | | |
| | | | |
| Luxembourg: 3.82% | | | | | | | | | | | | | | | | |
EFSF (Financials, Commercial Banks, EUR) | | | 3.38 | | | | 07/05/2021 | | | | 9,000,000 | | | | 12,304,774 | |
European Investment Bank (Financials, Commercial Banks, EUR) | | | 2.63 | | | | 03/16/2020 | | | | 13,100,000 | | | | 17,531,046 | |
European Investment Bank (Financials, Commercial Banks, NZD) | | | 6.50 | | | | 09/10/2014 | | | | 11,189,000 | | | | 9,704,179 | |
European Investment Bank (Financials, Commercial Banks, AUD) | | | 6.50 | | | | 08/07/2019 | | | | 16,400,000 | | | | 17,976,708 | |
European Investment Bank (Financials, Commercial Banks, ZAR) | | | 9.00 | | | | 12/21/2018 | | | | 29,450,000 | | | | 4,018,931 | |
Fiat Industrial Finance Europe SA (Consumer Discretionary,
Automobiles, EUR) | | | 6.25 | | | | 03/09/2018 | | | | 3,000,000 | | | | 3,976,105 | |
Zinc Capital SA (Financials, Diversified Financial Services, EUR) | | | 8.88 | | | | 05/15/2018 | | | | 3,025,000 | | | | 3,483,648 | |
| | | | |
| | | | | | | | | | | | | | | 68,995,391 | |
| | | | | | | | | | | | | | | | |
The accompanying notes are an integral part of these financial statements.
| | | | | | |
| Portfolio of Investments—April 30, 2012 (Unaudited) | | Wells Fargo Advantage International Bond Fund | | | 9 | |
| | | | | | | | | | | | | | | | |
| Security Name | | Interest Rate | | | Maturity Date | | | Principal | | | Value | |
| | | | | | | | | | | | | | | | |
| | | | |
| Netherlands: 2.70% | | | | | | | | | | | | | | | | |
Bank Nederlandse Gemeenten (Financials, Commercial Banks, EUR) | | | 2.63 | % | | | 09/01/2020 | | | | 12,250,000 | | | $ | 16,276,623 | |
Deutsche Telekom International Finance BV (Telecommunication Services, Diversified Telecommunication Services, EUR) | | | 6.00 | | | | 01/20/2017 | | | | 7,000,000 | | | | 10,888,362 | |
Heidelberg Cement AG (Materials, Construction Materials, EUR) | | | 8.50 | | | | 10/31/2019 | | | | 1,730,000 | | | | 2,548,085 | |
New World Resources NV (Materials, Metals & Mining, EUR) | | | 7.38 | | | | 05/15/2015 | | | | 2,765,000 | | | | 3,660,031 | |
Rabobank Nederland (Financials, Commercial Banks, EUR) | | | 4.25 | | | | 01/16/2017 | | | | 5,541,000 | | | | 7,947,065 | |
Rabobank Nederland (Financials, Commercial Banks, NZD) | | | 6.25 | | | | 07/10/2014 | | | | 4,361,000 | | | | 3,732,859 | |
Ziggo Bond Company BV (Consumer Discretionary, Media, EUR) (i)144A | | | 8.00 | | | | 05/15/2018 | | | | 2,500,000 | | | | 3,565,718 | |
| | | | |
| | | | | | | | | | | | | | | 48,618,743 | |
| | | | | | | | | | | | | | | | |
| | | | |
| South Africa: 0.07% | | | | | | | | | | | | | | | | |
Foodcorp Limited (Consumer Staples, Food & Staples Retailing, EUR) | | | 8.75 | | | | 03/01/2018 | | | | 930,000 | | | | 1,231,041 | |
| | | | | | | | | | | | | | | | |
| | | | |
| Switzerland: 0.76% | | | | | | | | | | | | | | | | |
Eurofima (Financials, Commercial Banks, AUD) | | | 6.25 | | | | 12/28/2018 | | | | 12,750,000 | | | | 13,753,113 | |
| | | | | | | | | | | | | | | | |
| | | | |
| United Kingdom: 5.41% | | | | | | | | | | | | | | | | |
Anglian Water Osprey Financing plc (Utilities, Water & Sewer
Revenue, GBP) | | | 7.00 | | | | 01/31/2018 | | | | 4,000,000 | | | | 6,605,202 | |
Aston Martin Capital Limited (Financials, Consumer Finance, GBP) | | | 9.25 | | | | 07/15/2018 | | | | 2,600,000 | | | | 3,417,827 | |
BAA Funding Limited (Transportation Revenue, Airport Revenue, EUR) | | | 4.13 | | | | 10/12/2018 | | | | 4,026,000 | | | | 5,633,963 | |
BAA Funding Limited (Transportation Revenue, Airport Revenue, EUR) | | | 4.60 | | | | 02/15/2018 | | | | 5,450,000 | | | | 7,683,160 | |
British American Tobacco plc (Consumer Staples, Tobacco, EUR) | | | 5.88 | | | | 03/12/2015 | | | | 8,175,000 | | | | 12,130,448 | |
GlaxoSmithKline plc (Health Care, Pharmaceuticals, EUR) | | | 5.63 | | | | 12/13/2017 | | | | 8,000,000 | | | | 12,742,405 | |
Imperial Tobacco Finance Company (Consumer Staples, Tobacco, EUR) | | | 4.50 | | | | 07/05/2018 | | | | 5,000,000 | | | | 7,239,013 | |
Imperial Tobacco Finance Company (Consumer Staples, Tobacco, EUR) | | | 5.00 | | | | 12/02/2019 | | | | 4,100,000 | | | | 6,099,929 | |
Marks & Spencer Group plc (Consumer Discretionary, Multiline Retail, GBP) | | | 6.13 | | | | 12/02/2019 | | | | 4,000,000 | | | | 7,145,108 | |
National Grid plc (Utilities, Multi-Utilities, EUR) | | | 4.38 | | | | 03/10/2020 | | | | 1,412,000 | | | | 2,103,532 | |
Nationwide Building Society (Financials, Thrifts & Mortgage Finance, EUR) | | | 3.75 | | | | 01/20/2015 | | | | 4,000,000 | | | | 5,480,538 | |
ODEON & UCI Cinemas Group (Consumer Discretionary, Hotels, Restaurants & Leisure, GBP) | | | 9.00 | | | | 08/01/2018 | | | | 2,900,000 | | | | 4,612,281 | |
Phones4u Finance plc (Telecommunication Services, Diversified Telecommunication Services, GBP) | | | 9.50 | | | | 04/01/2018 | | | | 2,500,000 | | | | 3,651,524 | |
Tesco plc (Consumer Staples, Food & Staples Retailing, EUR) | | | 5.88 | | | | 09/12/2016 | | | | 5,350,000 | | | | 8,286,410 | |
Virgin Media Finance plc (Consumer Discretionary, Media, GBP) | | | 8.88 | | | | 10/15/2019 | | | | 2,143,000 | | | | 3,895,219 | |
William Hill plc (Consumer Discretionary, Hotels, Restaurants &
Leisure, GBP) | | | 7.13 | | | | 11/11/2016 | | | | 550,000 | | | | 964,002 | |
| | | | |
| | | | | | | | | | | | | | | 97,690,561 | |
| | | | | | | | | | | | | | | | |
| | | | |
| United States: 3.70% | | | | | | | | | | | | | | | | |
General Electric Capital Corporation (Financials, Diversified Financial Services, NZD) | | | 7.63 | | | | 12/10/2014 | | | | 10,200,000 | | | | 8,983,442 | |
International Bank Recronstruction & Development (Financials, Diversified Financial Services, EUR) | | | 3.88 | | | | 05/20/2019 | | | | 14,100,000 | | | | 21,275,293 | |
Iron Mountain Incorporated (Industrials, Commercial Services &
Supplies, EUR) | | | 6.75 | | | | 10/15/2018 | | | | 1,920,000 | | | | 2,541,505 | |
National Grid USA (Utilities, Electric Utilities, EUR) | | | 3.25 | | | | 06/03/2015 | | | | 2,065,000 | | | | 2,881,774 | |
Pernod Ricard SA (Consumer Staples, Beverages, EUR) | | | 4.88 | | | | 03/18/2016 | | | | 3,750,000 | | | | 5,367,142 | |
Pernod Ricard SA (Consumer Staples, Beverages, EUR) | | | 5.00 | | | | 03/15/2017 | | | | 1,900,000 | | | | 2,748,174 | |
Pernod Ricard SA (Consumer Staples, Beverages, EUR) | | | 7.00 | | | | 01/15/2015 | | | | 2,450,000 | | | | 3,639,368 | |
The accompanying notes are an integral part of these financial statements.
| | | | |
| 10 | | Wells Fargo Advantage International Bond Fund | | Portfolio of Investments—April 30, 2012 (Unaudited) |
| | | | | | | | | | | | | | | | |
| Security Name | | Interest Rate | | | Maturity Date | | | Principal | | | Value | |
| | | | | | | | | | | | | | | | |
| | | | |
| United States: (continued) | | | | | | | | | | | | | | | | |
Pfizer Incorporated (Health Care, Pharmaceuticals, EUR) | | | 4.75 | % | | | 06/03/2016 | | | | 6,600,000 | | | $ | 9,865,308 | |
Procter & Gamble Company (Consumer Staples, Household
Products, EUR) | | | 5.13 | | | | 10/24/2017 | | | | 6,000,000 | | | | 9,418,498 | |
| | | | |
| | | | | | | | | | | | | | | 66,720,504 | |
| | | | | | | | | | | | | | | | |
| | | | |
Total Foreign Corporate Bonds and Notes (Cost $440,313,644) | | | | | | | | | | | | | | | 456,680,377 | |
| | | | | | | | | | | | | | | | |
| | | | |
Foreign Government Bonds @: 65.73% | | | | | | | | | | | | | | | | |
Australia Series 25CI (AUD) | | | 3.24 | | | | 09/20/2025 | | | | 58,835,000 | | | | 80,529,011 | |
Brazil (BRL) | | | 12.50 | | | | 01/05/2016 | | | | 8,000,000 | | | | 5,036,330 | |
Brazil (BRL) | | | 12.50 | | | | 01/05/2022 | | | | 6,300,000 | | | | 4,329,670 | |
Caisse d’Amortissement de la Dette Sociale (EUR) | | | 4.13 | | | | 04/25/2017 | | | | 10,735,000 | | | | 15,596,854 | |
Canada (CAD) | | | 2.75 | | | | 09/01/2016 | | | | 92,700,000 | | | | 98,384,837 | |
Canada (NZD) | | | 6.25 | | | | 06/16/2015 | | | | 18,150,000 | | | | 15,947,825 | |
Canada Housing Trust (CAD) 144A | | | 3.15 | | | | 06/15/2014 | | | | 43,800,000 | | | | 45,871,061 | |
Canada Housing Trust (CAD) 144A | | | 3.35 | | | | 12/15/2020 | | | | 31,000,000 | | | | 33,485,398 | |
Czech Republic (CZK) | | | 5.00 | | | | 04/11/2019 | | | | 724,600,000 | | | | 43,468,963 | |
Federal Republic of Brazil (BRL) | | | 8.50 | | | | 01/05/2024 | | | | 71,385,000 | | | | 38,105,206 | |
Hungary (HUF) ¤ | | | 0.00 | | | | 05/02/2012 | | | | 380,000,000 | | | | 1,753,987 | |
Hungary (HUF) | | | 6.75 | | | | 02/12/2013 | | | | 10,925,000,000 | | | | 50,120,488 | |
Italy Buoni Poliennali del Tesoro (EUR) | | | 3.75 | | | | 08/01/2021 | | | | 25,000,000 | | | | 29,402,693 | |
Italy Buoni Poliennali del Tesoro (EUR) | | | 4.00 | | | | 02/01/2017 | | | | 54,300,000 | | | | 70,767,867 | |
Japan (JPY) | | | 1.00 | | | | 09/20/2021 | | | | 10,195,000,000 | | | | 129,625,518 | |
Japan (JPY) | | | 2.00 | | | | 09/20/2041 | | | | 3,840,000,000 | | | | 49,222,365 | |
Korea (KRW) | | | 5.25 | | | | 09/10/2015 | | | | 11,400,000,000 | | | | 10,627,801 | |
Korea (KRW) | | | 5.25 | | | | 03/10/2027 | | | | 33,590,000,000 | | | | 34,235,154 | |
Malaysia (MYR) | | | 4.26 | | | | 09/15/2016 | | | | 153,650,000 | | | | 52,785,782 | |
Mexico (MXN) | | | 7.25 | | | | 12/15/2016 | | | | 66,500,000 | | | | 5,526,837 | |
Mexico (MXN) | | | 8.50 | | | | 11/18/2038 | | | | 617,000,000 | | | | 53,321,585 | |
New Zealand (NZD) | | | 6.00 | | | | 12/15/2017 | | | | 45,190,000 | | | | 41,976,175 | |
Norway (NOK) | | | 3.75 | | | | 05/25/2021 | | | | 335,000,000 | | | | 66,503,027 | |
Poland (PLN) | | | 5.25 | | | | 10/25/2020 | | | | 146,300,000 | | | | 46,154,581 | |
Poland (PLN) | | | 5.50 | | | | 04/25/2015 | | | | 17,550,000 | | | | 5,682,476 | |
Poland (PLN) | | | 5.75 | | | | 10/25/2021 | | | | 8,000,000 | | | | 2,599,436 | |
Province of Ontario (AUD) | | | 6.25 | | | | 09/29/2020 | | | | 13,600,000 | | | | 15,207,376 | |
Queensland Treasury (AUD) | | | 6.25 | | | | 02/21/2020 | | | | 13,650,000 | | | | 15,549,018 | |
Republic of Chile (CLP) | | | 5.50 | | | | 08/05/2020 | | | | 531,500,000 | | | | 1,139,805 | |
Republic of Colombia (COP) | | | 7.75 | | | | 04/14/2021 | | | | 4,600,000,000 | | | | 3,204,193 | |
Republic of Peru (PEN) | | | 7.84 | | | | 08/12/2020 | | | | 4,500,000 | | | | 2,011,468 | |
Republic of Peru (PEN) | | | 8.20 | | | | 08/12/2026 | | | | 1,600,000 | | | | 762,670 | |
Republic of South Africa (ZAR) | | | 8.25 | | | | 09/15/2017 | | | | 32,600,000 | | | | 4,425,734 | |
Republic of South Africa (ZAR) | | | 8.75 | | | | 12/21/2014 | | | | 8,000,000 | | | | 1,101,713 | |
Russia (RUB) | | | 7.85 | | | | 03/10/2018 | | | | 145,000,000 | | | | 5,146,892 | |
South Africa (ZAR) | | | 6.75 | | | | 03/31/2021 | | | | 222,905,000 | | | | 27,009,490 | |
Spain (EUR) | | | 4.25 | | | | 10/31/2016 | | | | 43,000,000 | | | | 55,892,862 | |
Spain (EUR) | | | 5.85 | | | | 01/31/2022 | | | | 17,850,000 | | | | 23,712,639 | |
| | | | |
Total Foreign Government Bonds (Cost $1,156,842,768) | | | | | | | | | | | | | | | 1,186,224,787 | |
| | | | | | | | | | | | | | | | |
The accompanying notes are an integral part of these financial statements.
| | | | | | |
| Portfolio of Investments—April 30, 2012 (Unaudited) | | Wells Fargo Advantage International Bond Fund | | | 11 | |
| | | | | | | | | | | | | | | | |
| Security Name | | Interest Rate | | | Maturity Date | | | Principal | | | Value | |
| | | | | | | | | | | | | | | | |
| | | | |
Yankee Corporate Bonds and Notes: 3.77% | | | | | | | | | | | | | | | | |
| | | | |
| Bermuda: 0.32% | | | | | | | | | | | | | | | | |
Qtel International Finance Limited (Telecommunication Services, Diversified Telecommunication Services) | | | 4.75 | % | | | 02/16/2021 | | | $ | 5,550,000 | | | $ | 5,785,875 | |
| | | | | | | | | | | | | | | | |
| | | | |
| Brazil: 0.03% | | | | | | | | | | | | | | | | |
Banco Votorantim (Financials, Commercial Banks) 144A | | | 5.25 | | | | 02/11/2016 | | | | 220,000 | | | | 226,600 | |
BM&F Bovespa SA (Financials, Diversified Financial Services) | | | 5.50 | | | | 07/16/2020 | | | | 200,000 | | | | 215,000 | |
| | | | |
| | | | | | | | | | | | | | | 441,600 | |
| | | | | | | | | | | | | | | | |
| | | | |
| Cayman Islands: 0.76% | | | | | | | | | | | | | | | | |
International Petroleum Investment Company (Energy, Oil, Gas & Consumable Fuels) 144A | | | 5.00 | | | | 11/15/2020 | | | | 5,700,000 | | | | 5,913,750 | |
Petrobras International Finance Company (Energy, Oil, Gas &
Consumable Fuels) | | | 5.38 | | | | 01/27/2021 | | | | 860,000 | | | | 941,540 | |
Petroplus Finance Limited (Energy, Oil, Gas & Consumable Fuels) | | | 5.75 | | | | 01/20/2020 | | | | 6,185,000 | | | | 6,899,955 | |
| | | | |
| | | | | | | | | | | | | | | 13,755,245 | |
| | | | | | | | | | | | | | | | |
| | | | |
| Luxembourg: 0.51% | | | | | | | | | | | | | | | | |
ArcelorMittal (Materials, Metals & Mining) | | | 6.25 | | | | 02/25/2022 | | | | 8,310,000 | | | | 8,459,713 | |
Eurasian Development Bank (Financials, Commercial Banks) (i) | | | 7.38 | | | | 09/29/2014 | | | | 300,000 | | | | 328,500 | |
TNK BP Finance SA (Financials, Commercial Banks) | | | 6.63 | | | | 03/20/2017 | | | | 400,000 | | | | 442,000 | |
| | | | |
| | | | | | | | | | | | | | | 9,230,213 | |
| | | | | | | | | | | | | | | | |
| | | | |
| Netherlands: 0.65% | | | | | | | | | | | | | | | | |
ABN AMRO Bank NV (Financials, Commercial Banks) 144A | | | 4.25 | | | | 02/02/2017 | | | | 8,000,000 | | | | 8,093,520 | |
Lukoil International Finance Company BV (Energy, Oil, Gas &
Consumable Fuels) | | | 7.25 | | | | 11/05/2019 | | | | 200,000 | | | | 225,500 | |
Mubadala Development Company (Energy, Oil, Gas & Consumable
Fuels) 144A | | | 5.50 | | | | 04/20/2021 | | | | 3,200,000 | | | | 3,458,461 | |
| | | | |
| | | | | | | | | | | | | | | 11,777,481 | |
| | | | | | | | | | | | | | | | |
| | | | |
| Peru: 0.49% | | | | | | | | | | | | | | | | |
Banco De Credito Del Peru (Financials, Commercial Banks) (i) | | | 4.75 | | | | 03/16/2016 | | | | 8,640,000 | | | | 8,899,200 | |
| | | | | | | | | | | | | | | | |
| | | | |
| South Africa: 0.32% | | | | | | | | | | | | | | | | |
Eskom Holdings Limited (Utilities, Electric Utilities) 144A | | | 5.75 | | | | 01/26/2021 | | | | 225,000 | | | | 241,875 | |
Sable International Finance Limited (Telecommunication Services, Diversified Telecommunication Services) | | | 7.75 | | | | 02/15/2017 | | | | 2,795,000 | | | | 2,892,825 | |
Transnet Limited (Industrials, Transportation Infrastructure) 144A | | | 4.50 | | | | 02/10/2016 | | | | 2,500,000 | | | | 2,611,053 | |
| | | | |
| | | | | | | | | | | | | | | 5,745,753 | |
| | | | | | | | | | | | | | | | |
| | | | |
| United Kingdom: 0.69% | | | | | | | | | | | | | | | | |
HSBC Holdings plc (Financials, Commercial Banks) | | | 4.00 | | | | 03/30/2022 | | | | 12,190,000 | | | | 12,376,298 | |
| | | | | | | | | | | | | | | | |
| | | | |
Total Yankee Corporate Bonds and Notes (Cost $66,056,265) | | | | | | | | | | | | | | | 68,011,665 | |
| | | | | | | | | | | | | | | | |
| | | | |
Yankee Government Bonds: 0.01% | | | | | | | | | | | | | | | | |
Croatia 144A | | | 6.25 | | | | 04/27/2017 | | | | 200,000 | | | | 202,329 | |
| | | | | | | | | | | | | | | | |
| | | | |
Total Yankee Government Bonds (Cost $198,946) | | | | | | | | | | | | | | | 202,329 | |
| | | | | | | | | | | | | | | | |
The accompanying notes are an integral part of these financial statements.
| | | | |
| 12 | | Wells Fargo Advantage International Bond Fund | | Portfolio of Investments—April 30, 2012 (Unaudited) |
| | | | | | | | | | | | | | |
| Security Name | | Yield | | | | | Shares | | | Value | |
| | | | |
Short-Term Investments: 3.45% | | | | | | | | | | | | | | |
| | | | |
| Investment Companies: 3.45% | | | | | | | | | | | | | | |
Wells Fargo Advantage Cash Investment Money Market Fund, Select Class (l)(u) | | | 0.11 | % | | | | | 62,289,099 | | | $ | 62,289,099 | |
| | | | | | | | | | | | | | |
| | | | |
Total Short-Term Investments (Cost $62,289,099) | | | | | | | | | | | | | 62,289,099 | |
| | | | | | | | | | | | | | |
| | | | | | | | |
| Total Investments in Securities | | | | | | | | |
| (Cost $1,735,197,588)* | | | 98.95 | % | | | 1,785,700,403 | |
Other Assets and Liabilities, Net | | | 1.05 | | | | 18,986,020 | |
| | | | | | | | |
| Total Net Assets | | | 100.00 | % | | $ | 1,804,686,423 | |
| | | | | | | | |
| @ | Foreign bond principal is denominated in local currency. |
| 144A | Security that may be resold to “qualified institutional buyers” under Rule 144A or security offered pursuant to Section 4(2) of the Securities Act of 1933, as amended. |
| ¤ | Security issued in zero coupon form with no periodic interest payments. |
| (l) | Investment in an affiliate |
| (u) | Rate shown is the 7-day annualized yield at period end. |
| * | Cost for federal income tax purposes is $1,721,968,863 and net unrealized appreciation (depreciation) consists of: |
| | | | |
Gross unrealized appreciation | | $ | 85,494,767 | |
Gross unrealized depreciation | | | (21,763,227 | ) |
| | | | |
Net unrealized appreciation | | $ | 63,731,540 | |
The accompanying notes are an integral part of these financial statements.
| | | | | | |
| Statement of Assets and Liabilities—April 30, 2012 (Unaudited) | | Wells Fargo Advantage International Bond Fund | | | 13 | |
| | | | |
| | | | |
| |
Assets | | | | |
Investments | | | | |
In unaffiliated securities, at value (see cost below) | | $ | 1,723,411,304 | |
In affiliated securities, at value (see cost below) | | | 62,289,099 | |
| | | | |
Total investments, at value (see cost below) | | | 1,785,700,403 | |
Foreign currency, at value (see cost below) | | | 685,362 | |
Receivable for Fund shares sold | | | 4,448,408 | |
Receivable for interest | | | 22,873,363 | |
Unrealized gains on forward foreign currency contracts | | | 8,890,726 | |
Prepaid expenses and other assets | | | 120,613 | |
| | | | |
Total assets | | | 1,822,718,875 | |
| | | | |
| |
Liabilities | | | | |
Payable for investments purchased | | | 4,448,721 | |
Payable for Fund shares redeemed | | | 1,989,037 | |
Unrealized losses on forward foreign currency exchange contracts | | | 10,233,971 | |
Advisory fee payable | | | 751,569 | |
Distribution fees payable | | | 20,206 | |
Due to other related parties | | | 218,112 | |
Accrued expenses and other liabilities | | | 370,836 | |
| | | | |
Total liabilities | | | 18,032,452 | |
| | | | |
Total net assets | | $ | 1,804,686,423 | |
| | | | |
| |
NET ASSETS CONSIST OF | | | | |
Paid-in capital | | $ | 1,744,243,653 | |
Undistributed net investment income | | | 34,736,099 | |
Accumulated net realized losses on investments | | | (23,429,509 | ) |
Net unrealized gains on investments | | | 49,136,180 | |
| | | | |
Total net assets | | $ | 1,804,686,423 | |
| | | | |
| |
COMPUTATION OF NET ASSET VALUE AND OFFERING PRICE PER SHARE1 | | | | |
Net assets – Class A | | $ | 314,128,124 | |
Shares outstanding – Class A | | | 27,256,448 | |
Net asset value per share – Class A | | | $11.52 | |
Maximum offering price per share – Class A2 | | | $12.06 | |
Net assets – Class B | | $ | 5,453,304 | |
Shares outstanding – Class B | | | 472,616 | |
Net asset value per share – Class B | | | $11.54 | |
Net assets – Class C | | $ | 26,096,721 | |
Shares outstanding – Class C | | | 2,274,943 | |
Net asset value per share – Class C | | | $11.47 | |
Net assets – Administrator Class | | $ | 210,891,521 | |
Shares outstanding – Administrator Class | | | 18,319,321 | |
Net asset value per share – Administrator Class | | | $11.51 | |
Net assets – Institutional Class | | $ | 1,248,116,753 | |
Shares outstanding – Institutional Class | | | 108,293,356 | |
Net asset value per share – Institutional Class | | | $11.53 | |
| |
Investments in unaffiliated securities, at cost | | $ | 1,672,908,489 | |
| | | | |
Investments in affiliated securities, at cost | | $ | 62,289,099 | |
| | | | |
Total investments, at cost | | $ | 1,735,197,588 | |
| | | | |
Foreign currency, at cost | | $ | 695,856 | |
| | | | |
| 1. | The Fund has an unlimited amount of authorized shares. |
| 2. | Maximum offering price is computed as 100/95.50 of net asset value. On investments of $50,000 or more, the offering price is reduced. |
The accompanying notes are an integral part of these financial statements.
| | | | |
| 14 | | Wells Fargo Advantage International Bond Fund | | Statement of Operations—Six Months Ended April 30, 2012 (Unaudited) |
| | | | |
| | | | |
| |
Investment income | | | | |
Interest | | $ | 33,303,132 | |
Income from affiliated securities | | | 16,533 | |
| | | | |
Total investment income | | | 33,319,665 | |
| | | | |
| |
Expenses | | | | |
Advisory fee | | | 4,434,175 | |
Administration fees | | | | |
Fund level | | | 424,770 | |
Class A | | | 233,448 | |
Class B | | | 4,927 | |
Class C | | | 21,467 | |
Administrator Class | | | 88,424 | |
Institutional Class | | | 478,972 | |
Shareholder servicing fees | | | | |
Class A | | | 364,762 | |
Class B | | | 7,698 | |
Class C | | | 33,543 | |
Administrator Class | | | 214,401 | |
Distribution fees | | | | |
Class B | | | 23,095 | |
Class C | | | 100,628 | |
Custody and accounting fees | | | 215,692 | |
Professional fees | | | 18,246 | |
Registration fees | | | 87,149 | |
Shareholder report expenses | | | 82,443 | |
Trustees’ fees and expenses | | | 4,019 | |
Other fees and expenses | | | 24,042 | |
| | | | |
Total expenses | | | 6,861,901 | |
Less: Fee waivers and/or expense reimbursements | | | (108,957 | ) |
| | | | |
Net expenses | | | 6,752,944 | |
| | | | |
Net investment income | | | 26,566,721 | |
| | | | |
| |
REALIZED AND UNREALIZED GAINS (LOSSES) ON INVESTMENTS | | | | |
| |
Net realized gains (losses) on: | | | | |
Unaffiliated securities | | | (22,548,220 | ) |
Forward foreign currency contract transactions | | | (772,159 | ) |
| | | | |
Net realized losses on investments | | | (23,320,379 | ) |
| | | | |
| |
Net change in unrealized gains (losses) on: | | | | |
Unaffiliated securities | | | (19,301,234 | ) |
Forward foreign currency contract transactions | | | 11,995,983 | |
| | | | |
Net change in unrealized gains (losses) on investments | | | (7,305,251 | ) |
| | | | |
Net realized and unrealized gains (losses) on investments | | | (30,625,630 | ) |
| | | | |
Net decrease in net assets resulting from operations | | $ | (4,058,909 | ) |
| | | | |
The accompanying notes are an integral part of these financial statements.
| | | | | | |
| Statements of Changes in Net Assets | | Wells Fargo Advantage International Bond Fund | | | 15 | |
| | | | | | | | | | | | | | | | |
| | | Six Months Ended April 30, 2012 (Unaudited) | | | Year Ended October 31, 2011 | |
| | | | |
Operations | | | | | | | | | | | | | | | | |
Net investment income | | | | | | $ | 26,566,721 | | | | | | | $ | 59,707,083 | |
Net realized gains (losses) on investments | | | | | | | (23,320,379 | ) | | | | | | | 47,087,971 | |
Net change in unrealized gains (losses) on investments | | | | | | | (7,305,251 | ) | | | | | | | (56,074,973 | ) |
| | | | | | | | | | | | | | | | |
Net increase (decrease) in net assets resulting from operations | | | | | | | (4,058,909 | ) | | | | | | | 50,720,081 | |
| | | | | | | | | | | | | | | | |
| | | | |
Distributions to shareholders from | | | | | | | | | | | | | | | | |
Net investment income | | | | | | | | | | | | | | | | |
Class A | | | | | | | (5,342,385 | ) | | | | | | | (11,454,422 | ) |
Class B | | | | | | | (105,852 | ) | | | | | | | (289,849 | ) |
Class C | | | | | | | (451,978 | ) | | | | | | | (994,954 | ) |
Administrator Class | | | | | | | (3,278,743 | ) | | | | | | | (1,550,925 | ) |
Institutional Class | | | | | | | (23,502,979 | ) | | | | | | | (60,133,323 | ) |
Net realized gains | | | | | | | | | | | | | | | | |
Class A | | | | | | | (1,455,591 | ) | | | | | | | (1,598,161 | ) |
Class B | | | | | | | (33,044 | ) | | | | | | | (60,416 | ) |
Class C | | | | | | | (140,943 | ) | | | | | | | (191,188 | ) |
Administrator Class | | | | | | | (870,033 | ) | | | | | | | (105,788 | ) |
Institutional Class | | | | | | | (6,108,374 | ) | | | | | | | (8,219,774 | ) |
| | | | | | | | | | | | | | | | |
Total distributions to shareholders | | | | | | | (41,289,922 | ) | | | | | | | (84,598,800 | ) |
| | | | | | | | | | | | | | | | |
| | | | |
Capital share transactions | | | Shares | | | | | | | | Shares | | | | | |
Proceeds from shares sold | | | | | | | | | | | | | | | | |
Class A | | | 5,816,352 | | | | 66,745,696 | | | | 12,826,858 | | | | 151,475,309 | |
Class B | | | 13,695 | | | | 157,272 | | | | 31,483 | | | | 369,688 | |
Class C | | | 199,089 | | | | 2,284,092 | | | | 641,988 | | | | 7,727,087 | |
Administrator Class | | | 5,393,324 | | | | 61,610,898 | | | | 14,800,564 | | | | 174,600,594 | |
Institutional Class | | | 18,726,820 | | | | 214,621,970 | | | | 42,238,819 | | | | 496,446,315 | |
| | | | | | | | | | | | | | | | |
| | | | | | | 345,419,928 | | | | | | | | 830,618,993 | |
| | | | | | | | | | | | | | | | |
Reinvestment of distributions | | | | | | | | | | | | | | | | |
Class A | | | 540,209 | | | | 6,147,363 | | | | 1,011,153 | | | | 11,676,617 | |
Class B | | | 8,440 | | | | 96,485 | | | | 21,656 | | | | 249,476 | |
Class C | | | 35,668 | | | | 405,317 | | | | 65,113 | | | | 749,728 | |
Administrator Class | | | 115,877 | | | | 1,316,084 | | | | 69,499 | | | | 811,895 | |
Institutional Class | | | 1,315,087 | | | | 14,959,716 | | | | 2,850,810 | | | | 32,838,438 | |
| | | | | | | | | | | | | | | | |
| | | | | | | 22,924,965 | | | | | | | | 46,326,154 | |
| | | | | | | | | | | | | | | | |
Payment for shares redeemed | | | | | | | | | | | | | | | | |
Class A | | | (3,281,396 | ) | | | (37,686,744 | ) | | | (10,512,419 | ) | | | (124,295,595 | ) |
Class B | | | (132,423 | ) | | | (1,519,766 | ) | | | (291,228 | ) | | | (3,462,963 | ) |
Class C | | | (318,121 | ) | | | (3,624,755 | ) | | | (887,369 | ) | | | (10,329,423 | ) |
Administrator Class | | | (1,625,438 | ) | | | (18,635,586 | ) | | | (832,282 | ) | | | (9,792,149 | ) |
Institutional Class | | | (15,495,452 | ) | | | (177,835,133 | ) | | | (45,688,690 | ) | | | (551,411,044 | ) |
| | | | | | | | | | | | | | | | |
| | | | | | | (239,301,984 | ) | | | | | | | (699,291,174 | ) |
| | | | | | | | | | | | | | | | |
Net increase in net assets resulting from capital share transactions | | | | | | | 129,042,909 | | | | | | | | 177,653,973 | |
| | | | | | | | | | | | | | | | |
Total increase in net assets | | | | | | | 83,694,078 | | | | | | | | 143,775,254 | |
| | | | | | | | | | | | | | | | |
| | | | |
Net assets | | | | | | | | | | | | | | | | |
Beginning of period | | | | | | | 1,720,992,345 | | | | | | | | 1,577,217,091 | |
| | | | | | | | | | | | | | | | |
End of period | | | | | | $ | 1,804,686,423 | | | | | | | $ | 1,720,992,345 | |
| | | | | | | | | | | | | | | | |
Undistributed net investment income | | | | | | $ | 34,736,099 | | | | | | | $ | 40,851,315 | |
| | | | | | | | | | | | | | | | |
The accompanying notes are an integral part of these financial statements.
| | | | |
| 16 | | Wells Fargo Advantage International Bond Fund | | Financial Highlights |
(For a share outstanding throughout each period)
| | | | | | | | | | | | | | | | | | | | | | | | |
| | | Six Months Ended
April 30, 2012 (Unaudited) | | | Year Ended October 31, | |
| Class A | | | 2011 | | | 20101 | | | 20091 | | | 20081 | | | 20071 | |
Net asset value, beginning of period | | $ | 11.85 | | | $ | 12.23 | | | $ | 11.59 | | | $ | 10.36 | | | $ | 11.57 | | | $ | 10.54 | |
Net investment income | | | 0.16 | 2 | | | 0.39 | 2 | | | 0.40 | | | | 0.39 | 2 | | | 0.47 | 2 | | | 0.43 | 2 |
Net realized and unrealized gains (losses) on investments | | | (0.21 | ) | | | (0.18 | ) | | | 0.65 | | | | 2.20 | | | | (0.92 | ) | | | 0.71 | |
| | | | | | | | | | | | | | | | | | | | | | | | |
Total from investment operations | | | (0.05 | ) | | | 0.21 | | | | 1.05 | | | | 2.59 | | | | (0.45 | ) | | | 1.14 | |
Distributions to shareholders from | | | | | | | | | | | | | | | | | | | | | | | | |
Net investment income | | | (0.22 | ) | | | (0.51 | ) | | | (0.41 | ) | | | (1.36 | ) | | | (0.76 | ) | | | (0.11 | ) |
Net realized gains | | | (0.06 | ) | | | (0.08 | ) | | | 0.00 | | | | 0.00 | | | | 0.00 | | | | 0.00 | |
| | | | | | | | | | | | | | | | | | | | | | | | |
Total distributions to shareholders | | | (0.28 | ) | | | (0.59 | ) | | | (0.41 | ) | | | (1.36 | ) | | | (0.76 | ) | | | (0.11 | ) |
Net asset value, end of period | | $ | 11.52 | | | $ | 11.85 | | | $ | 12.23 | | | $ | 11.59 | | | $ | 10.36 | | | $ | 11.57 | |
Total return3 | | | (0.42 | )% | | | 1.93 | % | | | 9.35 | % | | | 26.34 | % | | | (4.07 | )% | | | 10.90 | % |
Ratios to average net assets (annualized) | | | | | | | | | | | | | | | | | | | | | | | | |
Gross expenses | | | 1.03 | % | | | 1.02 | % | | | 1.10 | % | | | 1.05 | % | | | 1.01 | % | | | 1.05 | % |
Net expenses | | | 1.03 | % | | | 1.02 | % | | | 1.08 | % | | | 1.05 | % | | | 0.99 | % | | | 1.00 | % |
Net investment income | | | 2.78 | % | | | 3.26 | % | | | 3.53 | % | | | 3.65 | % | | | 4.05 | % | | | 4.01 | % |
Supplemental data | | | | | | | | | | | | | | | | | | | | | | | | |
Portfolio turnover rate | | | 50 | % | | | 88 | % | | | 89 | % | | | 118 | % | | | 87 | % | | | 106 | % |
Net assets, end of period (000’s omitted) | | | $314,128 | | | | $286,577 | | | | $255,134 | | | | $246,719 | | | | $66,649 | | | | $49,993 | |
| 1. | After the close of business on July 9, 2010, the Fund acquired the net assets of Evergreen International Bond Fund which became the accounting and performance survivor in the transaction. The information for the periods prior to July 12, 2010 is that of Class A of Evergreen International Bond Fund. |
| 2. | Calculated based upon average shares outstanding. |
| 3. | Total return calculations do not include any sales charges. Returns for periods of less than one year are not annualized. |
The accompanying notes are an integral part of these financial statements.
| | | | | | |
| Financial Highlights | | Wells Fargo Advantage International Bond Fund | | | 17 | |
(For a share outstanding throughout each period)
| | | | | | | | | | | | | | | | | | | | | | | | |
| | | Six Months Ended
April 30, 2012 (Unaudited) | | | Year Ended October 31, | |
| Class B | | | 2011 | | | 20101 | | | 20091 | | | 20081 | | | 20071 | |
Net asset value, beginning of period | | $ | 11.88 | | | $ | 12.25 | | | $ | 11.54 | | | $ | 10.37 | | | $ | 11.58 | | | $ | 10.56 | |
Net investment income | | | 0.12 | 2 | | | 0.31 | | | | 0.29 | | | | 0.30 | 2 | | | 0.38 | 2 | | | 0.35 | 2 |
Net realized and unrealized gains (losses) on investments | | | (0.21 | ) | | | (0.19 | ) | | | 0.67 | | | | 2.21 | | | | (0.91 | ) | | | 0.70 | |
| | | | | | | | | | | | | | | | | | | | | | | | |
Total from investment operations | | | (0.09 | ) | | | 0.12 | | | | 0.96 | | | | 2.51 | | | | (0.53 | ) | | | 1.05 | |
Distributions to shareholders from | | | | | | | | | | | | | | | | | | | | | | | | |
Net investment income | | | (0.19 | ) | | | (0.41 | ) | | | (0.25 | ) | | | (1.34 | ) | | | (0.68 | ) | | | (0.03 | ) |
Net realized gains | | | (0.06 | ) | | | (0.08 | ) | | | 0.00 | | | | 0.00 | | | | 0.00 | | | | 0.00 | |
| | | | | | | | | | | | | | | | | | | | | | | | |
Total distributions to shareholders | | | (0.25 | ) | | | (0.49 | ) | | | (0.25 | ) | | | (1.34 | ) | | | (0.68 | ) | | | (0.03 | ) |
Net asset value, end of period | | $ | 11.54 | | | $ | 11.88 | | | $ | 12.25 | | | $ | 11.54 | | | $ | 10.37 | | | $ | 11.58 | |
Total return3 | | | (0.74 | )% | | | 1.15 | % | | | 8.55 | % | | | 25.44 | % | | | (4.74 | )% | | | 10.08 | % |
Ratios to average net assets (annualized) | | | | | | | | | | | | | | | | | | | | | | | | |
Gross expenses | | | 1.78 | % | | | 1.77 | % | | | 1.85 | % | | | 1.79 | % | | | 1.74 | % | | | 1.74 | % |
Net expenses | | | 1.78 | % | | | 1.77 | % | | | 1.82 | % | | | 1.79 | % | | | 1.74 | % | | | 1.74 | % |
Net investment income | | | 2.01 | % | | | 2.53 | % | | | 2.77 | % | | | 2.86 | % | | | 3.30 | % | | | 3.28 | % |
Supplemental data | | | | | | | | | | | | | | | | | | | | | | | | |
Portfolio turnover rate | | | 50 | % | | | 88 | % | | | 89 | % | | | 118 | % | | | 87 | % | | | 106 | % |
Net assets, end of period (000’s omitted) | | | $5,453 | | | | $6,925 | | | | $10,060 | | | | $11,615 | | | | $10,345 | | | | $7,747 | |
| 1. | After the close of business on July 9, 2010, the Fund acquired the net assets of Evergreen International Bond Fund which became the accounting and performance survivor in the transaction. The information for the periods prior to July 12, 2010 is that of Class B of Evergreen International Bond Fund. |
| 2. | Calculated based upon average shares outstanding. |
| 3. | Total return calculations do not include any sales charges. Returns for periods of less than one year are not annualized. |
The accompanying notes are an integral part of these financial statements.
| | | | |
| 18 | | Wells Fargo Advantage International Bond Fund | | Financial Highlights |
(For a share outstanding throughout each period)
| | | | | | | | | | | | | | | | | | | | | | | | |
| | | Six Months Ended
April 30, 2012 (Unaudited) | | | Year Ended October 31, | |
| Class C | | | 2011 | | | 20101 | | | 20091 | | | 20081 | | | 20071 | |
Net asset value, beginning of period | | $ | 11.81 | | | $ | 12.20 | | | $ | 11.51 | | | $ | 10.35 | | | $ | 11.56 | | | $ | 10.53 | |
Net investment income | | | 0.13 | | | | 0.31 | | | | 0.33 | | | | 0.30 | 2 | | | 0.38 | 2 | | | 0.35 | 2 |
Net realized and unrealized gains (losses) on investments | | | (0.22 | ) | | | (0.19 | ) | | | 0.64 | | | | 2.20 | | | | (0.91 | ) | | | 0.71 | |
| | | | | | | | | | | | | | | | | | | | | | | | |
Total from investment operations | | | (0.09 | ) | | | 0.12 | | | | 0.97 | | | | 2.50 | | | | (0.53 | ) | | | 1.06 | |
Distributions to shareholders from | | | | | | | | | | | | | | | | | | | | | | | | |
Net investment income | | | (0.19 | ) | | | (0.43 | ) | | | (0.28 | ) | | | (1.34 | ) | | | (0.68 | ) | | | (0.03 | ) |
Net realized gains | | | (0.06 | ) | | | (0.08 | ) | | | 0.00 | | | | 0.00 | | | | 0.00 | | | | 0.00 | |
| | | | | | | | | | | | | | | | | | | | | | | | |
Total distributions to shareholders | | | (0.25 | ) | | | (0.51 | ) | | | (0.28 | ) | | | (1.34 | ) | | | (0.68 | ) | | | (0.03 | ) |
Net asset value, end of period | | $ | 11.47 | | | $ | 11.81 | | | $ | 12.20 | | | $ | 11.51 | | | $ | 10.35 | | | $ | 11.56 | |
Total return3 | | | (0.74 | )% | | | 1.11 | % | | | 8.61 | % | | | 25.47 | % | | | (4.85 | )% | | | 10.09 | % |
Ratios to average net assets (annualized) | | | | | | | | | | | | | | | | | | | | | | | | |
Gross expenses | | | 1.78 | % | | | 1.77 | % | | | 1.85 | % | | | 1.79 | % | | | 1.74 | % | | | 1.74 | % |
Net expenses | | | 1.78 | % | | | 1.77 | % | | | 1.82 | % | | | 1.79 | % | | | 1.74 | % | | | 1.74 | % |
Net investment income | | | 2.02 | % | | | 2.50 | % | | | 2.77 | % | | | 2.87 | % | | | 3.31 | % | | | 3.27 | % |
Supplemental data | | | | | | | | | | | | | | | | | | | | | | | | |
Portfolio turnover rate | | | 50 | % | | | 88 | % | | | 89 | % | | | 118 | % | | | 87 | % | | | 106 | % |
Net assets, end of period (000’s omitted) | | | $26,097 | | | | $27,861 | | | | $30,974 | | | | $33,330 | | | | $18,044 | | | | $19,983 | |
| 1. | After the close of business on July 9, 2010, the Fund acquired the net assets of Evergreen International Bond Fund which became the accounting and performance survivor in the transaction. The information for the periods prior to July 12, 2010 is that of Class C of Evergreen International Bond Fund. |
| 2. | Calculated based upon average shares outstanding. |
| 3. | Total return calculations do not include any sales charges. Returns for periods of less than one year are not annualized. |
The accompanying notes are an integral part of these financial statements.
| | | | | | |
| Financial Highlights | | Wells Fargo Advantage International Bond Fund | | | 19 | |
(For a share outstanding throughout each period)
| | | | | | | | | | | | |
| | | Six Months Ended
April 30, 2012 (Unaudited) | | | Year Ended October 31, | |
| Administrator Class | | | 2011 | | | 20101 | |
Net asset value, beginning of period | | $ | 11.83 | | | $ | 12.23 | | | $ | 11.39 | |
Net investment income | | | 0.17 | 2 | | | 0.38 | 2 | | | 0.11 | 2 |
Net realized and unrealized gains (losses) on investments | | | (0.21 | ) | | | (0.16 | ) | | | 0.82 | |
| | | | | | | | | | | | |
Total from investment operations | | | (0.04 | ) | | | 0.22 | | | | 0.93 | |
Distributions to shareholders from | | | | | | | | | | | | |
Net investment income | | | (0.22 | ) | | | (0.54 | ) | | | (0.09 | ) |
Net realized gains | | | (0.06 | ) | | | (0.08 | ) | | | 0.00 | |
| | | | | | | | | | | | |
Total distributions to shareholders | | | (0.28 | ) | | | (0.62 | ) | | | (0.09 | ) |
Net asset value, end of period | | $ | 11.51 | | | $ | 11.83 | | | $ | 12.23 | |
Total return3 | | | (0.28 | )% | | | 2.03 | % | | | 8.21 | % |
Ratios to average net assets (annualized) | | | | | | | | | | | | |
Gross expenses | | | 0.97 | % | | | 0.95 | % | | | 1.05 | % |
Net expenses | | | 0.85 | % | | | 0.85 | % | | | 0.85 | % |
Net investment income | | | 2.96 | % | | | 3.21 | % | | | 3.63 | % |
Supplemental data | | | | | | | | | | | | |
Portfolio turnover rate | | | 50 | % | | | 88 | % | | | 89 | % |
Net assets, end of period (000’s omitted) | | | $210,892 | | | | $170,836 | | | | $4,866 | |
| 1. | For the period from July 30, 2010 (commencement of class operations) to October 31, 2010. |
| 2. | Calculated based upon average shares outstanding |
| 3. | Returns for periods of less than one year are not annualized. |
The accompanying notes are an integral part of these financial statements.
| | | | |
| 20 | | Wells Fargo Advantage International Bond Fund | | Financial Highlights |
(For a share outstanding throughout each period)
| | | | | | | | | | | | | | | | | | | | | | | | |
| | | Six Months Ended
April 30, 2012 (Unaudited) | | | Year Ended October 31, | |
| Institutional Class | | | 2011 | | | 20101 | | | 20091 | | | 20081 | | | 20071 | |
Net asset value, beginning of period | | $ | 11.84 | | | $ | 12.23 | | | $ | 11.59 | | | $ | 10.35 | | | $ | 11.56 | | | $ | 10.54 | |
Net investment income | | | 0.18 | 2 | | | 0.44 | | | | 0.44 | | | | 0.43 | | | | 0.50 | | | | 0.47 | |
Net realized and unrealized gains (losses) on investments | | | (0.20 | ) | | | (0.20 | ) | | | 0.65 | | | | 2.18 | | | | (0.92 | ) | | | 0.69 | |
| | | | | | | | | | | | | | | | | | | | | | | | |
Total from investment operations | | | (0.02 | ) | | | 0.24 | | | | 1.09 | | | | 2.61 | | | | (0.42 | ) | | | 1.16 | |
Distributions to shareholders from | | | | | | | | | | | | | | | | | | | | | | | | |
Net investment income | | | (0.23 | ) | | | (0.55 | ) | | | (0.45 | ) | | | (1.37 | ) | | | (0.79 | ) | | | (0.14 | ) |
Net realized gains | | | (0.06 | ) | | | (0.08 | ) | | | 0.00 | | | | 0.00 | | | | 0.00 | | | | 0.00 | |
| | | | | | | | | | | | | | | | | | | | | | | | |
Total distributions to shareholders | | | (0.29 | ) | | | (0.63 | ) | | | (0.45 | ) | | | (1.37 | ) | | | (0.79 | ) | | | (0.14 | ) |
Net asset value, end of period | | $ | 11.53 | | | $ | 11.84 | | | $ | 12.23 | | | $ | 11.59 | | | $ | 10.35 | | | $ | 11.56 | |
Total return3 | | | (0.15 | )% | | | 2.19 | % | | | 9.73 | % | | | 26.71 | % | | | (3.88 | )% | | | 11.14 | % |
Ratios to average net assets (annualized) | | | | | | | | | | | | | | | | | | | | | | | | |
Gross expenses | | | 0.70 | % | | | 0.69 | % | | | 0.82 | % | | | 0.79 | % | | | 0.73 | % | | | 0.74 | % |
Net expenses | | | 0.70 | % | | | 0.69 | % | | | 0.80 | % | | | 0.79 | % | | | 0.73 | % | | | 0.74 | % |
Net investment income | | | 3.10 | % | | | 3.60 | % | | | 3.79 | % | | | 3.86 | % | | | 4.31 | % | | | 4.31 | % |
Supplemental data | | | | | | | | | | | | | | | | | | | | | | | | |
Portfolio turnover rate | | | 50 | % | | | 88 | % | | | 89 | % | | | 118 | % | | | 87 | % | | | 106 | % |
Net assets, end of period (000’s omitted) | | | $1,248,117 | | | | $1,228,793 | | | | $1,276,184 | | | | $997,308 | | | | $902,304 | | | | $1,032,304 | |
| 1. | After the close of business on July 9, 2010, the Fund acquired the net assets of Evergreen International Bond Fund which became the accounting and performance survivor in the transaction. The information for the periods prior to July 12, 2010 is that of Class I of Evergreen International Bond Fund. |
| 2. | Calculated based upon average shares outstanding |
| 3. | Returns for periods of less than one year are not annualized. |
The accompanying notes are an integral part of these financial statements.
| | | | | | |
| Notes to Financial Statements (Unaudited) | | Wells Fargo Advantage International Bond Fund | | | 21 | |
1. ORGANIZATION
Wells Fargo Funds Trust (the “Trust”), a Delaware statutory trust organized on March 10, 1999, is an open-end management investment company registered under the Investment Company Act of 1940, as amended (the “1940 Act”). These financial statements report on Wells Fargo Advantage International Bond Fund (the “Fund”) which is a diversified series of the Trust.
2. SIGNIFICANT ACCOUNTING POLICIES
The following significant accounting policies, which are consistently followed in the preparation of the financial statements of the Fund, are in conformity with U.S. generally accepted accounting principles which require management to make estimates and assumptions that affect the reported amounts of assets and liabilities, disclosure of contingent assets and liabilities at the date of the financial statements, and the reported amounts of revenues and expenses during the reporting period. Actual results could differ from those estimates.
Securities valuation
Fixed income securities with original maturities exceeding 60 days are valued based on available evaluated prices received from an independent pricing service approved by the Board of Trustees which may utilize both transaction data and market information such as yield, prices of securities of comparable quality, coupon rate, maturity, type of issue, trading characteristics and other market data. If valuations are not available from the pricing service or values received are deemed not representative of market value, values will be obtained from a third party broker-dealer or determined based on the Fund’s Fair Value Procedures.
Debt securities of sufficient credit quality with original maturities of 60 days or less generally are valued at amortized cost which approximates fair value. The amortized cost method involves valuing a security at its cost, plus accretion of discount or minus amortization of premium over the period until maturity.
Investments in open-end mutual funds and non-registered investment companies are generally valued at net asset value.
Investments which are not valued using any of the methods discussed above, are valued at their fair value, as determined by procedures established in good faith and approved by the Board of Trustees. The Board of Trustees has established a Valuation Committee comprised of the Trustees and has delegated to it the authority to take any actions regarding the valuation of portfolio securities that the Valuation Committee deems necessary in determining the fair value of portfolio securities, unless the responsibility has been delegated to the Management Valuation Team of Wells Fargo Funds Management, LLC (“Funds Management”). The Board of Trustees retains the authority to make or ratify any valuation decisions or approve any changes to the Fair Value Procedures as it deems appropriate. On a quarterly basis, the Board of Trustees considers for ratification any valuation actions taken by the Valuation Committee or the Management Valuation Team.
Valuations of fair valued prices are compared to the next actual sales price when available, or other appropriate market information to assess the continued appropriateness of the fair valuation methodology used. The securities are fair valued on a day-to-day basis, taking into consideration changes to appropriate market information and any significant changes to the input factors considered in the valuation process until there is a readily available price provided on the exchange or by an independent pricing service. Valuations received from an independent pricing service or broker quotes are periodically validated by comparisons to most recent trades and valuations provided by other independent pricing services in addition to the review of prices by the adviser and/or sub-adviser. Unobservable inputs used in determining fair valuations are identified based on the type of security, taking into consideration factors utilized by market participants in valuing the investment, knowledge about the issuer and the current market environment.
Foreign currency translation
The accounting records of the Fund are maintained in U.S. dollars. Assets, including investment securities, and liabilities denominated in foreign currency are translated into U.S. dollars at the prevailing rates of exchange at the date of valuation. Purchases and sales of securities, and income and expenses are translated at the prevailing rate of exchange on the respective dates of such transactions. Reported net realized foreign exchange gains or losses arise from sales of foreign currencies, currency gains or losses realized between the trade and settlement dates on securities transactions, and the difference between the amounts of dividends, interest and foreign withholding taxes recorded and the U.S. dollar
| | | | |
| 22 | | Wells Fargo Advantage International Bond Fund | | Notes to Financial Statements (Unaudited) |
equivalent of the amounts actually paid or received. Net unrealized foreign exchange gains and losses arise from changes in the fair value of assets and liabilities other than investments in securities resulting in changes in exchange rates.
The changes in net assets arising from changes in exchange rates and the changes in net assets resulting from changes in market prices of securities are not separately presented. Such changes are recorded with net realized and unrealized gains or losses from investments. Gains and losses from certain foreign currency transactions are treated as ordinary income for U.S. federal income tax purposes.
Forward foreign currency contracts
The Fund may be subject to foreign currency exchange rate risk in the normal course of pursuing its investment objectives. A forward foreign currency contract is an agreement between two parties to purchase or sell a specific currency for an agreed-upon price at a future date. The Fund enters into forward foreign currency contracts to facilitate transactions in foreign-denominated securities and to attempt to minimize the risk to the Fund from adverse changes in the relationship between currencies. Forward foreign currency contracts are recorded at the forward rate and marked-to-market daily. When the contracts are closed, realized gains and losses arising from such transactions are recorded as realized gains or losses on foreign currency related transactions. The Fund could be exposed to risks if the counterparties to the contracts are unable to meet the terms of their contracts or if the value of the foreign currency changes unfavorably. The Fund’s maximum risk of loss from counterparty credit risk is the unrealized gains or losses on the contracts. This risk is mitigated by having a master netting arrangement between the Fund and the counterparty.
Security transactions and income recognition
Securities transactions are recorded on a trade date basis. Realized gains or losses are reported on the basis of identified cost of securities delivered.
Interest income is accrued daily and bond discounts are accreted and premiums are amortized daily based on the effective interest method. To the extent debt obligations are placed on non-accrual status, any related interest income may be reduced by writing off interest receivables when the collection of all or a portion of interest has become doubtful based on consistently applied procedures. If the issuer subsequently resumes interest payments or when the collectability of interest is reasonably assured, the debt obligation is removed from non-accrual status.
Distributions to shareholders
Distributions to shareholders from net investment income and net realized gains, if any, are recorded on the ex-dividend date. Such distributions are determined in conformity with income tax regulations, which may differ from generally accepted accounting principles.
Federal and other taxes
The Fund intends to continue to qualify as a regulated investment company by distributing substantially all of its investment company taxable income and any net realized capital gains (after reduction for capital loss carryforwards) sufficient to relieve it from all, or substantially all, federal income taxes. Accordingly, no provision for federal income taxes was required.
The Fund’s income and federal excise tax returns and all financial records supporting those returns for the prior three fiscal years are subject to examination by the federal and Delaware revenue authorities. Management has analyzed the Fund’s tax positions taken on federal, state, and foreign tax returns for all open tax years and does not believe that there are any uncertain tax positions that require recognition of a tax liability.
Under the recently enacted Regulated Investment Company Modernization Act of 2010, the Fund is permitted to carry forward capital losses incurred in taxable years which began after December 22, 2010 for an unlimited period. However, any losses incurred are required to be utilized prior to the losses incurred in pre-enactment taxable years. As a result of this ordering rule, pre-enactment capital loss carryforwards may be more likely to expire unused. Post-enactment capital losses that are carried forward will retain their character as either short-term or long-term capital losses rather than be considered all short-term as under previous law. In addition, the Fund may elect to defer any portion of a post-October capital loss or qualified late-year ordinary loss to the first day of the following taxable year. A post-October capital loss is the greatest of the net capital loss, net short-term capital loss or net long-term capital loss for the portion of the taxable year after October 31. A qualified late-year ordinary loss is the net loss comprised of (a) net gain or loss from the sale or other disposition of capital assets for the portion of the taxable year after October 31, and (b) other ordinary income or loss for the portion of the taxable year after December 31.
| | | | | | |
| Notes to Financial Statements (Unaudited) | | Wells Fargo Advantage International Bond Fund | | | 23 | |
Class allocations
The separate classes of shares offered by the Fund differ principally in distribution, shareholder servicing and administration fees. Shareholders of each class bear certain expenses that pertain to that particular class. All shareholders bear the common expenses of the Fund, earn income from the portfolio, and are allocated unrealized gains and losses pro rata based on the average daily net assets of each class, without distinction between share classes. Dividends are determined separately for each class based on income and expenses allocable to each class. Realized gains and losses are allocated to each class pro rata based upon the net assets of each class on the date realized. Differences in per share dividend rates generally result from the relative weightings of pro rata income and realized gain allocations and from differences in separate class expenses, including distribution, shareholder servicing and administration fees.
3. FAIR VALUATION MEASUREMENTS
Fair value measurements of investments are determined within a framework that has established a fair value hierarchy based upon the various data inputs utilized in determining the value of the Fund’s investments. The three-level hierarchy gives the highest priority to unadjusted quoted prices in active markets for identical assets or liabilities (Level 1) and the lowest priority to significant unobservable inputs (Level 3). The Fund’s investments are classified within the fair value hierarchy based on the lowest level of input that is significant to the fair value measurement. The inputs are summarized into three broad levels as follows:
| n | | Level 1 – quoted prices in active markets for identical securities |
| n | | Level 2 – other significant observable inputs (including quoted prices for similar securities, interest rates, prepayment speeds, credit risk, etc.) |
| n | | Level 3 – significant unobservable inputs (including the Fund’s own assumptions in determining the fair value of investments) |
The inputs or methodologies used for valuing securities are not necessarily an indication of the risk associated with investing in those securities.
As of April 30, 2012, the inputs used in valuing the Fund’s assets, which are carried at fair value, were as follows:
| | | | | | | | | | | | | | | | |
| Investments in Securities | | Quoted Prices (Level 1) | | | Significant Other
Observable Inputs (Level 2) | | | Significant Unobservable Inputs (Level 3) | | | Total | |
Corporate bonds and notes | | $ | 0 | | | $ | 12,292,146 | | | $ | 0 | | | $ | 12,292,146 | |
Foreign corporate bonds and notes | | | 0 | | | | 456,680,377 | | | | 0 | | | | 456,680,377 | |
Foreign government bonds | | | 0 | | | | 1,186,224,787 | | | | 0 | | | | 1,186,224,787 | |
Yankee corporate bonds and notes | | | 0 | | | | 68,011,665 | | | | 0 | | | | 68,011,665 | |
Yankee government bonds | | | 0 | | | | 202,329 | | | | 0 | | | | 202,329 | |
Short-term investments | | | | | | | | | | | | | | | | |
Investment companies | | | 62,289,099 | | | | 0 | | | | 0 | | | | 62,289,099 | |
| | | $ | 62,289,099 | | | $ | 1,723,411,304 | | | $ | 0 | | | $ | 1,785,700,403 | |
Further details on the major security types listed above can be found in the Portfolio of Investments.
As of April 30, 2012, the inputs used in valuing the Fund’s other financial instruments, which are carried at fair value, were as follows:
| | | | | | | | | | | | | | | | |
| Other financial instruments | | Quoted Prices (Level 1) | | | Significant Other
Observable Inputs (Level 2) | | | Significant Unobservable Inputs (Level 3) | | | Total | |
Forward foreign currency contracts+ | | $ | 0 | | | $ | (1,343,245 | ) | | $ | 0 | | | $ | (1,343,245 | ) |
| + | Forward foreign currency contracts are presented at the unrealized gains or losses on the instrument. |
Transfers in and transfers out are recognized at the end of the reporting period. For the six months ended April 30, 2012, the Fund did not have any significant transfers into/out of Level 1 and Level 2.
| | | | |
| 24 | | Wells Fargo Advantage International Bond Fund | | Notes to Financial Statements (Unaudited) |
4. TRANSACTIONS WITH AFFILIATES AND OTHER EXPENSES
Advisory fee
The Trust has entered into an advisory contract with Funds Management, an indirect wholly owned subsidiary of Wells Fargo & Company (“Wells Fargo”). The adviser is responsible for implementing investment policies and guidelines and for supervising the sub-adviser, who is responsible for day-to-day portfolio management of the Fund.
Pursuant to the contract, Funds Management is entitled to receive an annual advisory fee starting at 0.55% and declining to 0.45% as the average daily net assets of the Fund increase. For the six months ended April 30, 2012, the advisory fee was equivalent to an annual rate of 0.52% of the Fund’s average daily net assets.
Funds Management has retained the services of certain sub-advisers to provide daily portfolio management to the Fund. The fees related to sub-advisory services are borne directly by Funds Management and do not increase the overall fees paid by the Fund. First International Advisors, LLC, an affiliate of Funds Management, is the sub-adviser to the Fund and is entitled to receive a fee from Funds Management at an annual rate starting at 0.35% and declining to 0.20% as the average daily net assets of the Fund increase.
Administration and transfer agent fees
The Trust has entered into an administration agreement with Funds Management. Under this agreement, for providing administrative services, which includes paying fees and expenses for services provided by the transfer agent, sub-transfer agents, omnibus account servicers and record-keepers, Funds Management is entitled to receive from the Fund an annual fund level administration fee starting at 0.05% and declining to 0.03% as the average daily net assets of the Fund increase and a class level administration fee which is calculated based on the average daily net assets of each class as follows:
| | | | |
| | | Class Level Administration Fee | |
Class A, Class B, Class C | | | 0.16 | % |
Administrator Class | | | 0.10 | |
Institutional Class | | | 0.08 | |
Funds Management has contractually waived and/or reimbursed advisory and administration fees to the extent necessary to maintain certain net operating expense ratios for the Fund. Waiver of fees and/or reimbursement of expenses by Funds Management were made first from fund level expenses on a proportionate basis and then from class specific expenses. Funds Management has committed through July 11, 2013 to waive fees and/or reimburse expenses to the extent necessary to cap the Fund’s expenses at 1.03% for Class A, 1.78% for Class B, 1.78% for Class C, 0.85% for Administrator Class and 0.73% for Institutional Class.
Distribution fees
The Trust has adopted a Distribution Plan for Class B and Class C shares of the Fund pursuant to Rule 12b-1 under the 1940 Act. Distribution fees are charged to Class B and Class C shares and paid to Wells Fargo Funds Distributor, LLC, the principal underwriter, at an annual rate of 0.75% of the average daily net assets of Class B and Class C shares.
For the six months ended April 30, 2012, Wells Fargo Funds Distributor, LLC received $5,965 from the sale of Class A shares and $1,965 and $626 in contingent deferred sales charges from redemptions of Class B and Class C shares, respectively.
Shareholder servicing fees
The Trust has entered into contracts with one or more shareholder servicing agents, whereby Class A, Class B, Class C and Administrator Class of the Fund is charged a fee at an annual rate of 0.25% of the average daily net assets of each respective class.
A portion of these total shareholder servicing fees were paid to affiliates of Wells Fargo.
5. INVESTMENT PORTFOLIO TRANSACTIONS
Purchases and sales of investments, excluding U.S. Government obligations (if any) and short-term securities, for the six months ended April 30, 2012 were $925,530,750 and $835,536,715, respectively.
| | | | | | |
| Notes to Financial Statements (Unaudited) | | Wells Fargo Advantage International Bond Fund | | | 25 | |
6. DERIVATIVE TRANSACTIONS
During the six months ended April 30, 2012, the Fund entered into forward foreign currency exchange contracts for economic hedging purposes.
At April 30, 2012, the Fund had forward foreign currency contracts outstanding as follows:
Forward foreign currency contracts to buy:
| | | | | | | | | | | | | | | | |
| Exchange Date | | Counterparty | | Contracts to
Receive | | | U.S. Value at
April 30, 2012 | | | In Exchange
for U.S. $ | | | Unrealized Gains
(Losses) |
| 05/02/2012 | | State Street Bank | | | 310,624,700 | JPY | | $ | 3,890,590 | | | $ | 3,854,861 | | | $35,729 |
| 05/14/2012 | | State Street Bank | | | 36,230,000 | CZK | | | 1,922,596 | | | | 1,910,512 | | | 12,084 |
| 06/04/2012 | | State Street Bank | | | 8,500,000 | MYR | | | 2,802,321 | | | | 2,804,355 | | | (2,034) |
| 06/12/2012 | | State Street Bank | | | 14,500,000,000 | JPY | | | 181,677,233 | | | | 178,338,625 | | | 3,338,608 |
| | | | | | | | | | | | | | | | | | | | |
| Exchange Date | | Counterparty | | Contracts to Receive | | | U.S. Value at
April 30, 2012 | | | In Exchange for | | | U.S. Value at
April 30, 2012 | | | Unrealized
Gains (Losses) |
| 05/02/2012 | | State Street Bank | | | 65,700,000 | CAD | | $ | 66,506,661 | | | | 5,283,396,900 | JPY | | $ | 66,174,811 | | | $331,850 |
| 05/02/2012 | | State Street Bank | | | 24,900,000 | CAD | | | 25,205,721 | | | | 1,997,527,800 | JPY | | | 25,019,136 | | | 186,585 |
| 05/02/2012 | | State Street Bank | | | 6,103,432,000 | JPY | | | 76,445,792 | | | | 80,000,000 | CAD | | | 80,982,236 | | | (4,536,444) |
| 05/02/2012 | | State Street Bank | | | 866,868,000 | JPY | | | 10,857,565 | | | | 10,600,000 | CAD | | | 10,730,146 | | | 127,419 |
| 05/21/2012 | | State Street Bank | | | 3,492,470,000 | JPY | | | 43,750,240 | | | | 145,000,000 | PLN | | | 45,898,802 | | | (2,148,562) |
| 06/04/2012 | | State Street Bank | | | 50,110,000 | CAD | | | 50,689,460 | | | | 4,056,604,940 | JPY | | | 50,823,057 | | | (133,597) |
| 06/04/2012 | | State Street Bank | | | 10,600,000 | CAD | | | 10,722,576 | | | | 866,014,700 | JPY | | | 10,849,840 | | | (127,264) |
| 06/04/2012 | | State Street Bank | | | 78,021,809 | EUR | | | 103,289,978 | | | | 101,600,000 | CAD | | | 102,774,877 | | | 515,101 |
| 06/13/2012 | | State Street Bank | | | 6,556,886,000 | JPY | | | 82,155,084 | | | | 98,000,000 | NZD | | | 79,917,795 | | | 2,237,289 |
| 06/15/2012 | | State Street Bank | | | 9,125,820,000 | JPY | | | 114,345,037 | | | | 110,000,000 | AUD | | | 114,085,725 | | | 259,312 |
| 06/21/2012 | | State Street Bank | | | 1,334,907,700 | JPY | | | 16,727,171 | | | | 10,150,000 | GBP | | | 16,467,416 | | | 259,755 |
| 02/12/2013 | | State Street Bank | | | 19,380,583 | EUR | | | 25,730,300 | | | | 5,901,000,000 | HUF | | | 26,284,502 | | | (554,202) |
| 02/12/2013 | | State Street Bank | | | 16,315,789 | EUR | | | 21,661,379 | | | | 4,960,000,000 | HUF | | | 22,093,057 | | | (431,678) |
Forward foreign currency contracts to sell:
| | | | | | | | | | | | | | | | |
| Exchange Date | | Counterparty | | Contracts to
Deliver | | | U.S. Value at
April 30, 2012 | | | In Exchange
for U.S. $ | | | Unrealized Gains (Losses) |
| 05/02/2012 | | State Street Bank | | | 380,000,000 | HUF | | $ | 1,754,162 | | | $ | 1,621,852 | | | $(132,310) |
| 05/14/2012 | | State Street Bank | | | 850,000,000 | CZK | | | 45,106,442 | | | | 44,435,151 | | | (671,291) |
| 05/16/2012 | | State Street Bank | | | 72,100,000 | BRL | | | 37,722,430 | | | | 39,218,886 | | | 1,496,456 |
| 05/29/2012 | | State Street Bank | | | 21,920,000 | ZAR | | | 2,809,188 | | | | 2,817,209 | | | 8,021 |
| 05/29/2012 | | State Street Bank | | | 225,000,000 | ZAR | | | 28,835,190 | | | | 28,917,707 | | | 82,517 |
| 06/21/2012 | | State Street Bank | | | 1,900,000 | GBP | | | 3,082,571 | | | | 3,019,936 | | | (62,635) |
| 06/21/2012 | | State Street Bank | | | 1,250,000 | GBP | | | 2,028,007 | | | | 1,981,613 | | | (46,394) |
| 06/21/2012 | | State Street Bank | | | 810,000 | GBP | | | 1,314,148 | | | | 1,308,166 | | | (5,982) |
| 06/21/2012 | | State Street Bank | | | 4,135,000 | GBP | | | 6,708,647 | | | | 6,545,622 | | | (163,025) |
| 06/21/2012 | | State Street Bank | | | 400,000 | GBP | | | 648,962 | | | | 642,796 | | | (6,166) |
| 07/18/2012 | | State Street Bank | | | 55,500,000 | EUR | | | 73,495,587 | | | | 72,283,200 | | | (1,212,387) |
The Fund had average contract amounts of $716,047,304 and $170,734,214 in forward foreign currency exchange contracts to buy and forward foreign currency exchange contracts to sell, respectively, during the six months ended April 30, 2012.
| | | | |
| 26 | | Wells Fargo Advantage International Bond Fund | | Notes to Financial Statements (Unaudited) |
The fair value, realized gains or losses and change in unrealized gains or losses, if any, on derivative instruments are reflected in the appropriate financial statements.
7. BANK BORROWINGS
The Trust (excluding the money market funds) and Wells Fargo Variable Trust are parties to a $150,000,000 revolving credit agreement with State Street Bank and Trust Company, whereby the Fund is permitted to use bank borrowings for temporary or emergency purposes, such as to fund shareholder redemption requests. Interest under the credit agreement is charged to the Fund based on a borrowing rate equal to the higher of the Federal Funds rate in effect on that day plus 1.25% or the overnight LIBOR rate in effect on that day plus 1.25%. In addition, an annual commitment fee equal to 0.10% of the unused balance is allocated to each participating fund. For the six months ended April 30, 2012, the Fund paid $1,987 in commitment fees.
For the six months ended April 30, 2012, there were no borrowings by the Fund under the agreement.
8. INDEMNIFICATION
Under the Trust’s organizational documents, the officers and directors are indemnified against certain liabilities that may arise out of performance of their duties to the Trust. Additionally, in the normal course of business, the Trust may enter into contracts with service providers that contain a variety of indemnification clauses. The Trust’s maximum exposure under these arrangements is dependent on future claims that may be made against the Fund and, therefore, cannot be estimated.
9. NEW ACCOUNTING PRONOUNCEMENTS
In December 2011, the Financial Accounting Standards Board (“FASB”) issued Accounting Standard Update (“ASU”) No. 2011-11, Disclosures about Offsetting Assets and Liabilities. ASU 2011-11, which amends FASB ASC Topic 210, Balance Sheet, creates new disclosure requirements which require entities to disclose both gross and net information for derivatives and other financial instruments that are either offset in the Statement of Assets and Liabilities or subject to an enforceable master netting arrangement or similar agreement. The disclosure requirements are effective for interim and annual reporting periods beginning on or after January 1, 2013. Management is currently assessing the potential impact, in addition to expanded financial statement disclosure, that may result from adopting this ASU.
In May 2011, FASB issued ASU No. 2011-04 Amendments to Achieve Common Fair Value Measurement and Disclosure Requirements in U.S. GAAP and IFRSs. ASU No. 2011-04 amends FASB ASC Topic 820, Fair Value Measurements, to establish common requirements for measuring fair value and for disclosing information about fair value measurements in accordance with GAAP. The ASU is effective prospectively for interim and annual periods beginning after December 15, 2011. Management expects that adoption of the ASU will result in additional disclosures in the financial statements, as applicable.
In April 2011, FASB issued ASU No. 2011-03 Reconsideration of Effective Control for Repurchase Agreements. ASU No. 2011-03 amends FASB ASC Topic 860, Transfers and Servicing, specifically the criteria required to determine whether a repurchase agreement (repo) and similar agreements should be accounted for as sales of financial assets or secured borrowings with commitments. ASU No. 2011-03 changes the assessment of effective control by focusing on the transferor’s contractual rights and obligations and removing the criterion to assess its ability to exercise those rights or honor those obligations. This could result in changes to the way entities account for certain transactions including repurchase agreements, mortgage dollar rolls and reverse repurchase agreements. The ASU will become effective on a prospective basis for new transfers and modifications to existing transactions as of the beginning of the first interim or annual period beginning on or after December 15, 2011. Management has evaluated the impact of adopting the ASU and expects no significant changes.
| | | | | | |
| Other Information (Unaudited) | | Wells Fargo Advantage International Bond Fund | | | 27 | |
PROXY VOTING INFORMATION
A description of the policies and procedures that the Fund uses to determine how to vote proxies relating to portfolio securities is available without charge, upon request, by calling 1-800-222-8222, visiting our Web site at wellsfargoadvantagefunds.com, or visiting the SEC Web site at sec.gov. Information regarding how the Fund voted proxies relating to portfolio securities during the most recent 12-month period ended June 30 is available without charge on the Fund’s Web site at wellsfargoadvantagefunds.com or by visiting the SEC Web site at sec.gov.
PORTFOLIO HOLDINGS INFORMATION
The complete portfolio holdings for the Fund are publicly available on the Fund’s Web site (wellsfargoadvantagefunds.com) on a monthly, 30-day or more delayed basis. In addition, top ten holdings information for the Fund is publicly available on the Fund’s Web site on a monthly, seven-day or more delayed basis. The Fund files its complete schedule of portfolio holdings with the SEC for the first and third quarters of each fiscal year on Form N-Q, which is available without charge by visiting the SEC Web site at sec.gov. In addition, the Fund’s Form N-Q may be reviewed and copied at the SEC’s Public Reference Room in Washington, DC, and at regional offices in New York City, at 233 Broadway, and in Chicago, at 175 West Jackson Boulevard, Suite 900. Information about the Public Reference Room may be obtained by calling 1-800-SEC-0330.
| | | | |
| 28 | | Wells Fargo Advantage International Bond Fund | | Other Information (Unaudited) |
BOARD OF TRUSTEES
The following table provides basic information about the Board of Trustees (the “Trustees”) of the Trust and Officers of the Trust. This table should be read in conjunction with the Prospectus and the Statement of Additional Information1 of the Fund. Each of the Trustees and Officers listed below acts in identical capacities for the Wells Fargo Advantage family of funds, which consists of 137 funds comprising the Wells Fargo Funds Trust, Wells Fargo Variable Trust, Wells Fargo Master Trust and four closed-end funds (collectively the “Fund Complex”). All of the Trustees are also Members of the Audit and Governance Committees of each Trust in the Fund Complex. The mailing address of each Trustee and Officer is 525 Market Street, 12th Floor, San Francisco, CA 94105. Each Trustee and Officer serves an indefinite term, however, each Trustee serves such term until reaching the mandatory retirement age established by the Trustees.
Independent Trustees
| | | | | | |
Name and Year of Birth | | Position Held and Length of Service | | Principal Occupations During Past Five Years | | Other Directorships During
Past Five Years |
Peter G. Gordon
(Born 1942) | | Trustee, since 1998; Chairman, since 2005 (Lead Trustee since 2001) | | Co-Founder, Retired Chairman, President and CEO of Crystal Geyser Water Company. Trustee Emeritus, Colby College | | Asset Allocation Trust |
Isaiah Harris, Jr.
(Born 1952) | | Trustee, since 2009 | | Retired. Prior thereto, President and CEO of BellSouth Advertising and Publishing Corp. from 2005 to 2007, President and CEO of BellSouth Enterprises from 2004 to 2005 and President of BellSouth Consumer Services from 2000 to 2003. Emeritus member of the Iowa State University Foundation Board of Governors. Emeritus Member of the Advisory Board of Iowa State University School of Business. Mr. Harris is a certified public accountant. | | CIGNA Corporation; Deluxe Corporation; Asset Allocation Trust |
Judith M. Johnson
(Born 1949) | | Trustee, since 2008 | | Retired. Prior thereto, Chief Executive Officer and Chief Investment Officer of Minneapolis Employees Retirement Fund from 1996 to 2008. Ms. Johnson is an attorney, certified public accountant and a certified managerial accountant. | | Asset Allocation Trust |
Leroy Keith, Jr.
(Born 1939) | | Trustee, since 2010 | | Chairman, Bloc Global Services (development and construction). Trustee of the Evergreen Funds from 1983 to 2010. Former Managing Director, Almanac Capital Management (commodities firm), former Partner, Stonington Partners, Inc. (private equity fund), former Director, Obagi Medical Products Co. and former Director, Lincoln Educational Services. | | Trustee, Virtus Fund Complex (consisting of 40 portfolios as of 12/31/11); Asset Allocation Trust |
David F. Larcker
(Born 1950) | | Trustee, since 2009 | | James Irvin Miller Professor of Accounting at the Graduate School of Business, Stanford University, Director of Corporate Governance Research Program and Senior Faculty of The Rock Center for Corporate Governance since 2006. From 2005 to 2008, Professor of Accounting at the Graduate School of Business, Stanford University. Prior thereto, Ernst & Young Professor of Accounting at The Wharton School, University of Pennsylvania from 1985 to 2005. | | Asset Allocation Trust |
Olivia S. Mitchell
(Born 1953) | | Trustee, since 2006 | | International Foundation of Employee Benefit Plans Professor, Wharton School of the University of Pennsylvania since 1993. Director of Wharton’s Pension Research Council and Boettner Center on Pensions & Retirement Research, and Research Associate at the National Bureau of Economic Research. Previously, Cornell University Professor from 1978 to 1993. | | Asset Allocation Trust |
| | | | | | |
| Other Information (Unaudited) | | Wells Fargo Advantage International Bond Fund | | | 29 | |
| | | | | | |
Name and Year of Birth | | Position Held and Length of Service | | Principal Occupations During Past Five Years | | Other Directorships During
Past Five Years |
Timothy J. Penny
(Born 1951) | | Trustee, since 1996 | | President and CEO of Southern Minnesota Initiative Foundation, a non-profit organization, since 2007 and Senior Fellow at the Humphrey Institute Policy Forum at the University of Minnesota since 1995. Member of the Board of Trustees of NorthStar Education Finance, Inc., a non-profit organization, since 2007. | | Asset Allocation Trust |
Michael S. Scofield
(Born 1943) | | Trustee, since 2010 | | Served on the Investment Company Institute’s Board of Governors and Executive Committee from 2008-2011 as well the Governing Council of the Independent Directors Council from 2006-2011 and the Independent Directors Council Executive Committee from 2008-2011. Chairman of the IDC from 2008-2010. Institutional Investor (Fund Directions) Trustee of Year in 2007. Trustee of the Evergreen Funds (and its predecessors) from 1984 to 2010. Chairman of the Evergreen Funds from 2000-2010. Former Trustee of the Mentor Funds. Retired Attorney, Law Offices of Michael S. Scofield and former Director and Chairman, Branded Media Corporation (multi-media branding company). | | Asset Allocation Trust |
Donald C. Willeke
(Born 1940) | | Trustee, since 1996 | | Principal of the law firm of Willeke & Daniels. General Counsel of the Minneapolis Employees Retirement Fund from 1984 until its consolidation into the Minnesota Public Employees Retirement Association on June 30, 2010. Director and Vice Chair of The Free Trust (non-profit corporation). Director of the American Chestnut Foundation (non-profit corporation). | | Asset Allocation Trust |
Officers
| | | | | | |
Name and Year of Birth | | Position Held and
Length of Service | | Principal Occupations During Past Five Years | | |
Karla M. Rabusch
(Born 1959) | | President, since 2003 | | Executive Vice President of Wells Fargo Bank, N.A. and President of Wells Fargo Funds Management, LLC since 2003. Senior Vice President and Chief Administrative Officer of Wells Fargo Funds Management, LLC from 2001 to 2003. | | |
C. David Messman
(Born 1960) | | Secretary, since 2000; Chief Legal Counsel, since 2003 | | Senior Vice President and Secretary of Wells Fargo Funds Management, LLC since 2001. Vice President and Managing Senior Counsel of Wells Fargo Bank, N.A. since 1996. | | |
Kasey Phillips
(Born 1970) | | Treasurer, since 2009 | | Senior Vice President of Wells Fargo Funds Management, LLC since 2009. Senior Vice President of Evergreen Investment Management Company, LLC from 2006 to 2010. Treasurer of the Evergreen Funds from 2005 to 2010. | | |
David Berardi
(Born 1975) | | Assistant Treasurer, since 2009 | | Vice President of Wells Fargo Funds Management, LLC since 2009. Vice President of Evergreen Investment Management Company, LLC from 2008 to 2010. Assistant Vice President of Evergreen Investment Services, Inc. from 2004 to 2008. Manager of Fund Reporting and Control for Evergreen Investment Management Company, LLC from 2004 to 2010. | | |
Jeremy DePalma
(Born 1974) | | Assistant Treasurer, since 2009 | | Senior Vice President of Wells Fargo Funds Management, LLC since 2009. Senior Vice President of Evergreen Investment Management Company, LLC from 2008 to 2010. Vice President, Evergreen Investment Services, Inc. from 2004 to 2007. Head of the Fund Reporting and Control Team within Fund Administration from 2005 to 2010. | | |
Debra Ann Early
(Born 1964) | | Chief Compliance Officer, since 2007 | | Chief Compliance Officer of Wells Fargo Funds Management, LLC since 2007. Chief Compliance Officer of Parnassus Investments from 2005 to 2007. Chief Financial Officer of Parnassus Investments from 2004 to 2007 and Senior Audit Manager of PricewaterhouseCoopers LLP from 1998 to 2004. | | |
| 1. | The Statement of Additional Information includes additional information about the Trustees and is available, without charge, upon request, by calling 1-800-222-8222 or by visiting the Web site at wellsfargoadvantagefunds.com. |
| | | | |
| 30 | | Wells Fargo Advantage International Bond Fund | | Other Information (Unaudited) |
BOARD CONSIDERATION OF INVESTMENT ADVISORY AND SUB-ADVISORY AGREEMENTS:
Under Section 15 of the Investment Company Act of 1940 (the “1940 Act”), the Board of Trustees (the “Board”) of Wells Fargo Funds Trust (the “Trust”), all the members of which have no direct or indirect interest in the investment advisory and sub-advisory agreements and are not “interested persons” of the Trust, as defined in the 1940 Act (the “Independent Trustees”), must determine whether to approve the continuation of the Trust’s investment advisory and sub-advisory agreements. In this regard, at an in person meeting held on March 29-30, 2012 (the “Meeting”), the Board reviewed and re-approved: (i) an investment advisory agreement with Wells Fargo Funds Management, LLC (“Funds Management”) for Wells Fargo Advantage International Bond Fund (the “Fund”) and (ii) an investment sub-advisory agreement with First International Advisors, LLC (“FIA”) for the Fund. The investment advisory agreement with Funds Management and the investment sub-advisory agreement with FIA are collectively referred to as the “Advisory Agreements.”
At the Meeting, the Board considered the factors and reached the conclusions described below relating to the selection of Funds Management and FIA and the continuation of the Advisory Agreements. Prior to the Meeting, the Trustees conferred extensively among themselves and with representatives of Funds Management about these matters. The Board also met throughout the year and received information that was useful to them in considering the continuation of the Advisory Agreements. The Independent Trustees were assisted in their evaluation of the Advisory Agreements by independent legal counsel, from whom they received separate legal advice and with whom they met separately from Funds Management.
In providing information to the Board, Funds Management was guided by a detailed set of requests submitted by the Independent Trustees’ independent legal counsel on their behalf at the start of the Board’s annual contract renewal process earlier in 2012. In approving the Advisory Agreements, the Board did not identify any particular information or consideration that was all-important or controlling, and each Trustee likely attributed different weights to various factors.
Nature, extent and quality of services
The Board received and considered various information regarding the nature, extent and quality of services provided to the Fund by Funds Management and FIA under the Advisory Agreements. The Board also received and considered, among other things, information about the background and experience of senior management of Funds Management, and the qualifications, backgrounds, tenures and responsibilities of the portfolio managers primarily responsible for the day-to-day portfolio management of the Fund.
The Board evaluated the ability of Funds Management and FIA, based on their respective financial condition, resources, reputation and other attributes, to attract and retain qualified investment professionals, including research, advisory, and supervisory personnel. The Board further considered the compliance programs and compliance records of Funds Management and FIA. In addition, the Board took into account the administrative services provided to the Fund by Funds Management and its affiliates.
The Board’s decision to approve the continuation of the Advisory Agreements was based on a comprehensive evaluation of all of the information provided to it. In considering these matters, the Board considered not only the specific information presented in connection with the Meeting, but also the knowledge gained over time through interaction with Funds Management and FIA about various topics, including Funds Management’s oversight of service providers. The above factors, together with those referenced below, are some of the most important, but not necessarily all, factors considered by the Board in concluding that the nature, extent and quality of the investment advisory services provided to the Fund by Funds Management and FIA supported the re-approval of the Advisory Agreements. Although the Board considered the continuation of the Advisory Agreements for the Fund as part of the larger process of considering the continuation of the advisory agreements for all of the funds in the complex, its decision to continue the Advisory Agreements for the Fund was ultimately made on a fund-by-fund basis.
Fund performance and expenses
The Board considered the performance results for the Fund over various time periods ended December 31, 2011. The Board also considered these results in comparison to the median performance of a universe of relevant funds (the “Universe”) that was determined by Lipper Inc. (“Lipper”) to be similar to the Fund, and in comparison to the Fund’s benchmark index and to other comparative data. Lipper is an independent provider of investment company data. The Board received a description of the methodology used by Lipper to select the mutual funds in the Universe. The Board
| | | | | | |
| Other Information (Unaudited) | | Wells Fargo Advantage International Bond Fund | | | 31 | |
noted that the performance of the Fund was higher than the median performance of the Universe for all periods under review. The Board also noted that the performance of the Fund was higher than or in range of its benchmark, the Lipper International Income Funds Index, for the periods under review.
The Board received and considered information regarding the Fund’s contractual advisory fee and net operating expense ratios and their various components, including actual management fees (which reflect fee waivers, if any), transfer agent, custodian and other non-management fees, Rule 12b-1 and non-Rule 12b-1 fees, service fees and fee waiver and expense reimbursement arrangements. The Board also considered these ratios in comparison to the median ratios of an expense Universe and a narrower expense group of mutual funds (each, an “Expense Group”) that was determined by Lipper to be similar to the Fund. The Board received a description of the methodology used by Lipper to select the mutual funds in the Fund’s Expense Group. The Board noted that the net operating expense ratios of the Fund were lower than or in range of the Fund’s Expense Group’s median net operating expense ratios.
Based on the above-referenced considerations and other factors, the Board concluded that the overall performance and expense structure of the Fund supported the re-approval of the Advisory Agreements for the Fund.
Investment advisory and sub-advisory fee rates
The Board reviewed and considered the contractual investment advisory fee rate that is payable by the Fund to Funds Management for investment advisory services (the “Advisory Agreement Rate”), both on a stand-alone basis and on a combined basis with the Fund’s administration fee rate. The Board took into account the separate administrative and other services covered by the administration fee rate. The Board also reviewed and considered the contractual investment sub-advisory fee rate that is payable by Funds Management to FIA for investment sub-advisory services (the “Sub-Advisory Agreement Rate”). In addition, the Board reviewed and considered the existing fee waiver/cap arrangements applicable to the Advisory Agreement Rate and considered the Advisory Agreement Rate after taking the waivers/caps into account (the “Net Advisory Rate”).
The Board received and considered information comparing the Advisory Agreement Rate and Net Advisory Rate with those of other funds in the Fund’s Expense Group median. The Board noted that the Advisory Agreement Rate and Net Advisory Rate for the Fund were in range of the median rates for the Fund’s Expense Group, except for Class A. The Board noted that Funds Management proposed to extend contractual fee cap arrangements for the Fund designed to lower the Fund’s expenses until February 28, 2014.
The Board also received and considered information about the nature and extent of services offered and fee rates charged by Funds Management and FIA to other types of clients. In this regard, the Board received information about differences between the services, and the compliance, reporting, and other legal burdens and risks of providing investment advice to mutual funds and those associated with providing advice to non-mutual fund clients such as collective funds or institutional separate accounts.
The Board determined that the Advisory Agreement Rate for the Fund, both with and without an administration fee rate and before and after waivers, was reasonable in light of the Fund’s Expense Group information, the net expense ratio commitments, the services covered by the Advisory Agreements and other information provided. The Board also reviewed and considered the Sub-Advisory Agreement Rate and concluded that the Sub-Advisory Agreement Rate was reasonable in light of the services covered by the sub-advisory agreement and other information provided.
Profitability
The Board received and considered a profitability analysis of Funds Management, as well as an analysis of the profitability to the collective Wells Fargo businesses that provide services to the Fund. It considered that the information provided to it was necessarily estimated, and that the profitability information provided to it, especially on a fund-by-fund basis, did not necessarily provide a precise tool for evaluating the appropriateness of the Fund’s Advisory Agreement Rate in isolation. It noted that the levels of profitability reported on a fund-by-fund basis varied widely, depending on, among other things, the size and type of fund. The Board concluded that the profitability reported by Funds Management was not unreasonable.
The Board did not consider separate profitability information with respect to FIA, because, as an affiliate of Funds Management, its profitability information was subsumed in the collective Wells Fargo profitability analysis provided by Funds Management.
| | | | |
| 32 | | Wells Fargo Advantage International Bond Fund | | Other Information (Unaudited) |
Economies of scale
With respect to possible economies of scale, the Board reviewed the breakpoints in the Fund’s advisory fee structure, which operate generally to reduce the effective Advisory Agreement Rate of the Fund (as a percentage of Fund assets) as the Fund grows in size. It considered that, as a fund shrinks in size, breakpoints conversely result in increasing fee levels. The Board noted that it would have on-going opportunities to review the appropriate levels of breakpoints in the future, and concluded that the breakpoints as implemented appeared to be a reasonable step toward sharing economies of scale, if any, with the Fund. However, the Board acknowledged the inherent limitations of any analysis of an investment adviser’s economies of scale and of any attempt to correlate breakpoints with such economies, stemming largely from the Board’s understanding that economies of scale are realized, if at all, by an investment adviser across a variety of products and services, not just with respect to a single fund.
Other benefits to Funds Management and FIA
The Board received and considered information regarding potential “fall-out” or ancillary benefits received by Funds Management and its affiliates, including FIA, as a result of their relationship with the Fund. Ancillary benefits could include, among others, benefits directly attributable to the relationship of Funds Management and FIA with the Fund and benefits potentially derived from an increase in Funds Management’s and FIA’s business as a result of their relationship with the Fund (such as the ability to market to shareholders other financial products offered by Funds Management and its affiliates, including FIA).
The Board considered that Wells Fargo Funds Distributor, LLC, an affiliate of Funds Management, serves as distributor to the Fund and receives certain compensation for those services. The Board noted that various financial institutions, including affiliates of Funds Management may receive distribution-related fees, shareholder servicing payments (including amounts derived from payments under Rule 12b-1 plans) and sub-transfer agency fees in respect of shares sold or held through them and services provided.
The Board also reviewed information about whether and to what extent soft dollar credits are sought and how any such credits are utilized and any benefits that may be realized by using an affiliated broker.
Other factors and broader review
The Board also considered the markets for distribution of the Fund’s shares, including the channels through which the Fund’s shares are offered and sold. The Board noted that the Fund is part of one of the few fund families that have both direct-to-fund and intermediary distribution channels. As discussed above, the Board reviews detailed materials received from Funds Management and FIA annually as part of the re-approval process under Section 15 of the 1940 Act and also reviews and assesses information about the quality of the services that the Fund receives throughout the year. In this regard, the Board has reviewed reports of Funds Management at each of its quarterly meetings, which include, among other things, portfolio reviews and performance reports. In addition, the Board confers with portfolio managers at various times throughout the year.
Conclusion
After considering the above-described factors and based on its deliberations and its evaluation of the information described above, the Board unanimously approved the continuation of the Advisory Agreements for an additional one-year period.
| | | | | | |
| List of Abbreviations | | Wells Fargo Advantage International Bond Fund | | | 33 | |
The following is a list of common abbreviations for terms and entities which may have appeared in this report.
| ACB | — Agricultural Credit Bank |
| ADR | — American Depository Receipt |
| ADS | — American Depository Shares |
| AGC-ICC | — Assured Guaranty Corporation - Insured Custody Certificates |
| AGM | — Assured Guaranty Municipal |
| AMBAC | — American Municipal Bond Assurance Corporation |
| AMT | — Alternative Minimum Tax |
| BAN | — Bond Anticipation Notes |
| BHAC | — Berkshire Hathaway Assurance Corporation |
| CAB | — Capital Appreciation Bond |
| CCAB | — Convertible Capital Appreciation Bond |
| CDA | — Community Development Authority |
| CDO | — Collateralized Debt Obligation |
| COP | — Certificate of Participation |
| DRIVER | — Derivative Inverse Tax-Exempt Receipts |
| DW&P | — Department of Water & Power |
| DWR | — Department of Water Resources |
| ECFA | — Educational & Cultural Facilities Authority |
| EDA | — Economic Development Authority |
| EDFA | — Economic Development Finance Authority |
| ETF | — Exchange-Traded Fund |
| FFCB | — Federal Farm Credit Bank |
| FGIC | — Financial Guaranty Insurance Corporation |
| FHA | — Federal Housing Authority |
| FHLB | — Federal Home Loan Bank |
| FHLMC | — Federal Home Loan Mortgage Corporation |
| FICO | — The Financing Corporation |
| FNMA | — Federal National Mortgage Association |
| GDR | — Global Depository Receipt |
| GNMA | — Government National Mortgage Association |
| HCFR | — Healthcare Facilities Revenue |
| HEFA | — Health & Educational Facilities Authority |
| HEFAR | — Higher Education Facilities Authority Revenue |
| HFA | — Housing Finance Authority |
| HFFA | — Health Facilities Financing Authority |
| IBC | — Insured Bond Certificate |
| IDA | — Industrial Development Authority |
| IDAG | — Industrial Development Agency |
| IDR | — Industrial Development Revenue |
| KRW | — Republic of Korea Won |
| LIBOR | — London Interbank Offered Rate |
| LLC | — Limited Liability Company |
| LLP | — Limited Liability Partnership |
| MBIA | — Municipal Bond Insurance Association |
| MFHR | — Multi-Family Housing Revenue |
| MSTR | — Municipal Securities Trust Receipts |
| MUD | — Municipal Utility District |
| NATL-RE | — National Public Finance Guarantee Corporation |
| PCFA | — Pollution Control Finance Authority |
| PCR | — Pollution Control Revenue |
| PFA | — Public Finance Authority |
| PFFA | — Public Facilities Financing Authority |
| PFOTER | — Puttable Floating Option Tax-Exempt Receipts |
| plc | — Public Limited Company |
| PUTTER | — Puttable Tax-Exempt Receipts |
| R&D | — Research & Development |
| RDA | — Redevelopment Authority |
| RDFA | — Redevelopment Finance Authority |
| REIT | — Real Estate Investment Trust |
| ROC | — Reset Option Certificates |
| SAVRS | — Select Auction Variable Rate Securities |
| SBA | — Small Business Authority |
| SFHR | — Single Family Housing Revenue |
| SFMR | — Single Family Mortgage Revenue |
| SPA | — Standby Purchase Agreement |
| SPDR | — Standard & Poor’s Depositary Receipts |
| STRIPS | — Separate Trading of Registered Interest and Principal Securities |
| TAN | — Tax Anticipation Notes |
| TIPS | — Treasury Inflation-Protected Securities |
| TRAN | — Tax Revenue Anticipation Notes |
| TCR | — Transferable Custody Receipts |
| TTFA | — Transportation Trust Fund Authority |
| TVA | — Tennessee Valley Authority |
| XLCA | — XL Capital Assurance |
This page is intentionally left blank.


FOR MORE INFORMATION
More information about Wells Fargo Advantage Funds is available free upon request. To obtain literature, please write, e-mail, visit the Fund’s Web site, or call:
Wells Fargo Advantage Funds
P.O. Box 8266
Boston, MA 02266-8266
E-mail: wfaf@wellsfargo.com
Web site: wellsfargoadvantagefunds.com
Individual investors: 1-800-222-8222
Retail investment professionals: 1-888-877-9275
Institutional investment professionals: 1-866-765-0778
This report and the financial statements contained herein are submitted for the general information of the shareholders of Wells Fargo Advantage Funds. If this report is used for promotional purposes, distribution of the report must be accompanied or preceded by a current prospectus. For a prospectus containing more complete information, including charges and expenses, call 1-800-222-8222 or visit the Fund’s Web site at wellsfargoadvantagefunds.com. Please consider the investment objectives, risks, charges, and expenses of the investment carefully before investing. This and other information about Wells Fargo Advantage Funds can be found in the current prospectus. Read the prospectus carefully before you invest or send money.
Wells Fargo Funds Management, LLC, a wholly owned subsidiary of Wells Fargo & Company, provides investment advisory and administrative services for Wells Fargo Advantage Funds. Other affiliates of Wells Fargo & Company provide subadvisory and other services for the Funds. The Funds are distributed by Wells Fargo Funds Distributor, LLC, Member FINRA/SIPC, an affiliate of Wells Fargo & Company.
NOT FDIC INSURED ¡ NO BANK GUARANTEE ¡ MAY LOSE VALUE
© 2012 Wells Fargo Funds Management, LLC. All rights reserved.
| | |
 | | 209719 06-12 SA235/SAR235 4-12 |

Wells Fargo Advantage Asia Pacific Fund

Semi-Annual Report
April 30, 2012

Reduce clutter. Save trees.
Sign up for electronic delivery of prospectuses and shareholder reports at wellsfargo.com/advantagedelivery
Contents
The views expressed and any forward-looking statements are as of April 30, 2012, unless otherwise noted, and are those of the Fund managers and/or Wells Fargo Funds Management, LLC. Discussions of individual securities, or the markets generally, or any Wells Fargo Advantage Fund are not intended as individual recommendations. Future events or results may vary significantly from those expressed in any forward-looking statements; the views expressed are subject to change at any time in response to changing circumstances in the market. Wells Fargo Funds Management, LLC, disclaims any obligation to publicly update or revise any views expressed or forward-looking statements.
NOT FDIC INSURED ¡ NO BANK GUARANTEE ¡ MAY LOSE VALUE

WELLS FARGO INVESTMENT HISTORY
| | |
| |
| 1932 | | Keystone creates one of the first mutual fund families. |
| |
| 1971 | | Wells Fargo & Company introduces one of the first institutional index funds. |
| |
| 1978 | | Wells Fargo applies Markowitz and Sharpe’s research on Modern Portfolio Theory to introduce one of the industry’s first Tactical Asset Allocation (TAA) models in institutional separately managed accounts. |
| |
| 1984 | | Wells Fargo Stagecoach Funds launches its first asset allocation fund. |
| |
| 1989 | | The Tactical Asset Allocation (TAA) Model is first applied to Wells Fargo’s asset allocation mutual funds. |
| |
| 1994 | | Wells Fargo introduces the LifePath Funds, one of the first suites of target date funds (now the Wells Fargo Advantage Dow Jones Target Date FundsSM). |
| |
| 1996 | | Evergreen Investments and Keystone Funds merge. |
| |
| 1997 | | Wells Fargo launches Wells Fargo Advantage WealthBuilder PortfoliosSM, a fund-of-funds suite of products that includes the use of quantitative models to shift assets among investment styles. |
| |
| 1999 | | Norwest Advantage Funds and Stagecoach Funds are reorganized into Wells Fargo Funds after the merger of Norwest and Wells Fargo. |
| |
| 2002 | | Evergreen Retail and Evergreen Institutional companies form the umbrella asset management company, Evergreen Investments. |
| |
| 2005 | | The integration of Strong Funds with Wells Fargo Funds creates Wells Fargo Advantage Funds, resulting in one of the top 20 mutual fund companies in the United States. |
| |
| 2006 | | Wells Fargo Advantage Funds relaunches the target date product line as Wells Fargo Advantage Dow Jones Target Date Funds. |
| |
| 2010 | | The mergers and reorganizations of Evergreen and Wells Fargo Advantage mutual funds are completed, unifying the families under the brand of Wells Fargo Advantage Funds. |
Wells Fargo Advantage Funds®
Wells Fargo Advantage Funds skillfully guides institutions, financial advisors, and individuals through the investment terrain to help them reach their financial objectives. Everything we do on behalf of investors is backed by our unique combination of qualifications.
Strength
Our organization is built on the standards of integrity and service established by our parent company—Wells Fargo & Company—more than 150 years ago. And, because we’re part of a highly diversified financial enterprise, we offer the depth of resources to help investors succeed.
Expertise
Our multi-boutique model offers investors access to the independent thinking of premier investment managers that have been chosen for their time-tested strategies. While each team specializes in a specific investment strategy, collectively they provide investors a wide choice of distinct investment styles. Our dedication to investment excellence doesn’t end with our expertise in manager selection—risk management, analysis, and rigorous ongoing review seek to ensure each manager’s investment process remains consistent.
Partnership
Our collaborative approach is built around understanding the needs and goals of our clients. By adhering to core principles of sound judgment and steady guidance, we support you through every stage of the investment decision process.
Carefully consider a fund’s investment objectives, risks, charges, and expenses before investing. For a current prospectus and, if available, a summary prospectus, containing this and other information, visit wellsfargoadvantagefunds.com. Read it carefully before investing.
Wells Fargo Funds Management, LLC, a wholly owned subsidiary of Wells Fargo & Company, provides investment advisory and administrative services for Wells Fargo Advantage Funds®. Other affiliates of Wells Fargo & Company provide subadvisory and other services for the Funds. The Funds are distributed by Wells Fargo Funds Distributor, LLC, Member FINRA/SIPC, an affiliate of Wells Fargo & Company.
“Dow Jones®” and “Dow Jones Target Date IndexesSM” are service marks of Dow Jones Trademark Holdings, LLC (“Dow Jones”), have been licensed to CME Group Index Services LLC (“CME Indexes”) and have been sublicensed for use for certain purposes by Global Index Advisors, Inc, and Wells Fargo Funds Management, LLC. The Wells Fargo Advantage Dow Jones Target Date FundsSM based on the Dow Jones Target Date IndexesSM, are not sponsored, endorsed, sold or promoted by Dow Jones, CME Indexes or their respective affiliates and none of them makes any representation regarding the advisability of investing in such product(s).
NOT FDIC INSURED ¡ NO BANK GUARANTEE ¡ MAY LOSE VALUE
Not part of the semi-annual report.
Wells Fargo Advantage Funds offers more than 110 mutual funds across a wide range of asset classes, representing over $211 billion in assets under management, as of April 30, 2012.
| | | | |
| Equity Funds | | | | |
Asia Pacific Fund | | Enterprise Fund† | | Opportunity Fund† |
C&B Large Cap Value Fund | | Equity Value Fund | | Precious Metals Fund |
C&B Mid Cap Value Fund | | Global Opportunities Fund | | Premier Large Company Growth Fund |
Capital Growth Fund | | Growth Fund | | Small Cap Opportunities Fund |
Common Stock Fund | | Index Fund | | Small Cap Value Fund |
Disciplined U.S. Core Fund | | International Equity Fund | | Small Company Growth Fund |
Discovery Fund† | | International Value Fund | | Small Company Value Fund |
Diversified Equity Fund | | Intrinsic Small Cap Value Fund | | Small/Mid Cap Core Fund |
Diversified International Fund | | Intrinsic Value Fund | | Small/Mid Cap Value Fund |
Diversified Small Cap Fund | | Intrinsic World Equity Fund | | Special Mid Cap Value Fund |
Emerging Growth Fund | | Large Cap Core Fund | | Special Small Cap Value Fund |
Emerging Markets Equity Fund | | Large Cap Growth Fund | | Specialized Technology Fund |
Emerging Markets Equity Income Fund | | Large Company Value Fund | | Traditional Small Cap Growth Fund |
Emerging Markets Local Bond Fund | | Omega Growth Fund | | Utility and Telecommunications Fund |
Endeavor Select Fund† | | | | |
| Bond Funds | | | | |
Adjustable Rate Government Fund | | Inflation-Protected Bond Fund | | Short-Term Bond Fund |
California Limited-Term Tax-Free Fund | | Intermediate Tax/AMT-Free Fund | | Short-Term High Yield Bond Fund |
California Tax-Free Fund | | International Bond Fund | | Short-Term Municipal Bond Fund |
Colorado Tax-Free Fund | | Minnesota Tax-Free Fund | | Strategic Municipal Bond Fund |
Government Securities Fund | | Municipal Bond Fund | | Total Return Bond Fund |
High Income Fund | | North Carolina Tax-Free Fund | | Ultra Short-Term Income Fund |
High Yield Bond Fund | | Pennsylvania Tax-Free Fund | | Ultra Short-Term Municipal Income Fund |
Income Plus Fund | | Short Duration Government Bond Fund | | Wisconsin Tax-Free Fund |
| Asset Allocation Funds | | | | |
Absolute Return Fund | | WealthBuilder Equity Portfolio† | | Target 2020 Fund† |
Asset Allocation Fund | | WealthBuilder Growth Allocation Portfolio† | | Target 2025 Fund† |
Conservative Allocation Fund | | WealthBuilder Growth Balanced Portfolio† | | Target 2030 Fund† |
Diversified Capital Builder Fund | | WealthBuilder Moderate Balanced Portfolio† | | Target 2035 Fund† |
Diversified Income Builder Fund | | WealthBuilder Tactical Equity Portfolio† | | Target 2040 Fund† |
Growth Balanced Fund | | Target Today Fund† | | Target 2045 Fund† |
Index Asset Allocation Fund | | Target 2010 Fund† | | Target 2050 Fund† |
Moderate Balanced Fund | | Target 2015 Fund† | | Target 2055 Fund† |
WealthBuilder Conservative Allocation Portfolio† | | | | |
| Money Market Funds | | | | |
100% Treasury Money Market Fund | | Heritage Money Market Fund† | | National Tax-Free Money Market Fund |
California Municipal Money Market Fund | | Money Market Fund | | Prime Investment Money Market Fund |
Cash Investment Money Market Fund | | Municipal Cash Management Money Market Fund | | Treasury Plus Money Market Fund |
Government Money Market Fund | | Municipal Money Market Fund | | |
| Variable Trust Funds1 | | | | |
VT Discovery Fund† | | VT Intrinsic Value Fund | | VT Small Cap Growth Fund |
VT Index Asset Allocation Fund | | VT Omega Growth Fund | | VT Small Cap Value Fund |
VT International Equity Fund | | VT Opportunity Fund† | | VT Total Return Bond Fund |
An investment in a money market fund is not insured or guaranteed by the Federal Deposit Insurance Corporation or any other government agency. Although the Wells Fargo Advantage Money Market Funds seek to preserve the value of your investment at $1.00 per share, it is possible to lose money by investing in a money market fund.
| 1. | The Variable Trust Funds are generally available only through insurance company variable contracts. |
| † | In this report, the Wells Fargo Advantage Discovery FundSM, Wells Fargo Advantage Endeavor Select FundSM, Wells Fargo Advantage Enterprise FundSM, Wells Fargo Advantage Opportunity FundSM, Wells Fargo Advantage WealthBuilder Conservative Allocation PortfolioSM, Wells Fargo Advantage WealthBuilder Equity PortfolioSM, Wells Fargo Advantage WealthBuilder Growth Allocation PortfolioSM, Wells Fargo Advantage WealthBuilder Growth Balanced PortfolioSM, Wells Fargo Advantage WealthBuilder Moderate Balanced PortfolioSM, Wells Fargo Advantage WealthBuilder Tactical Equity PortfolioSM, Wells Fargo Advantage Dow Jones Target Today FundSM, Wells Fargo Advantage Dow Jones Target 2010 FundSM, Wells Fargo Advantage Dow Jones Target 2015 FundSM, Wells Fargo Advantage Dow Jones Target 2020 FundSM, Wells Fargo Advantage Dow Jones Target 2025 FundSM, Wells Fargo Advantage Dow Jones Target 2030 FundSM, Wells Fargo Advantage Dow Jones Target 2035 FundSM, Wells Fargo Advantage Dow Jones Target 2040 FundSM, Wells Fargo Advantage Dow Jones Target 2045 FundSM, Wells Fargo Advantage Dow Jones Target 2050 FundSM, Wells Fargo Advantage Dow Jones Target 2055 FundSM, Wells Fargo Advantage Heritage Money Market FundSM, Wells Fargo Advantage VT Discovery FundSM, and Wells Fargo Advantage VT Opportunity FundSM are referred to as the Discovery Fund, Endeavor Select Fund, Enterprise Fund, Opportunity Fund, WealthBuilder Conservative Allocation Portfolio, WealthBuilder Equity Portfolio, WealthBuilder Growth Allocation Portfolio, WealthBuilder Growth Balanced Portfolio, WealthBuilder Moderate Balanced Portfolio, WealthBuilder Tactical Equity Portfolio, Target Today Fund, Target 2010 Fund, Target 2015 Fund, Target 2020 Fund, Target 2025 Fund, Target 2030 Fund, Target 2035 Fund, Target 2040 Fund, Target 2045 Fund, Target 2050 Fund, Target 2055 Fund, Heritage Money Market Fund, VT Discovery Fund, and VT Opportunity Fund, respectively. |
Not part of the semi-annual report.
| | | | |
| 2 | | Wells Fargo Advantage Asia Pacific Fund | | Letter to Shareholders |

Karla M. Rabusch,
President
Wells Fargo Advantage Funds
The period was marked by continued concerns about the possible global economic effects of the ongoing European sovereign debt crisis that began in Greece and later spread to the larger economies of Italy and Spain.
The Greek credit crisis was seemingly addressed in March 2012, when the Greek government came to an agreement with its creditors that allowed it to write down the principal on most of its bonds in exchange for increased financial austerity.
Dear Valued Shareholder:
We’re pleased to offer you this semi-annual report for the Wells Fargo Advantage Asia Pacific Fund for the six-month period that ended April 30, 2012. The period was marked by continued concerns about the possible global economic effects of the ongoing European sovereign debt crisis that began in Greece and later spread to the larger economies of Italy and Spain. Widespread support from central banks helped push developed market indexes to gains, but several emerging markets posted losses for the period.
Macroeconomic optimism seemed to fade as global growth slowed and worries rose.
Prior to and throughout the reporting period, concerns about the eurozone sovereign debt situation returned to center stage. Investors became increasingly concerned that Greece would default on its debt, a scenario that only seemed more likely as eurozone leaders began to openly discuss a “voluntary” haircut on Greek debt for private investors. Because many eurozone banks owned Greek debt and many U.S. banks had financial ties to eurozone banks, investors worried about the effects of such an event on the financial systems and on the global economy.
In October 2011, market participants turned their attention to the debt burdens of Italy—which, like the U.S., also had its credit rating downgraded by Standard & Poor’s—because even though it had a relatively modest budget deficit, it had a high amount of outstanding debt and a stagnant economy. French banks were heavily exposed to Italian debt, so Italy’s woes led to fears of a state bailout of French banks and a resulting increase in France’s expenditures.
The Greek credit crisis was seemingly addressed in March 2012, when the Greek government came to an agreement with its creditors that allowed it to write down the principal on most of its bonds in exchange for increased financial austerity. The Greek agreement, combined with unprecedented support for eurozone banks by the European Central Bank (ECB), seemed to calm investor concerns, at least temporarily, and most developed markets—both in Europe and Asia—ended the period with gains, including Japan and Singapore. The news flow from the eurozone dominated stock prices, even for emerging markets, in part because the eurozone economies are key end markets for several exporters. Indexes in major countries such as Brazil and India ended the period with losses. However, China’s stock market ended the period with a gain as investors hoped that the country and the entire southeast Asia region would be able to sustain growth. Some of the largest stock market gains came within smaller markets, such as the Philippines and Thailand.
The U.S. economy reported relatively solid news.
In contrast to worrisome data from the eurozone, U.S. economic data remained moderately positive. Reported gross domestic product (GDP) growth came in at a 1.8% annualized rate in the third quarter of 2011 and then accelerated to a 3.0% annualized rate in the fourth quarter. The initial estimate for GDP growth in the first quarter of 2012 came in at a 2.2% annualized rate, further supporting the case for economic recovery. In addition, the major banks appeared to have taken steps toward repairing their balance sheets; in March, the Federal Reserve (Fed) announced that 15 of the 19 major banks had passed a “stress test” in
| | | | | | |
| Letter to Shareholders | | Wells Fargo Advantage Asia Pacific Fund | | | 3 | |
which the Fed attempted to gauge whether the banks could survive a severe recession that included a 50% drop in the stock market and a 21% percent decline in housing prices.
Financial stocks rebounded and outperformed the broader market for the reporting period after the Fed released details of the stress test. Stocks generally rallied across the market as investors seemed to be increasingly confident that the U.S. would not return to recession.
Central banks continued to provide stimulus.
Throughout the reporting period, the Federal Open Market Committee kept its key interest rates effectively at zero in order to support the economy and financial system. In response to extreme market volatility and signs of a weakening economy, the Fed announced its intention to keep interest rates low until at least late 2014.
Likewise, the Bank of Japan voted in late April to keep its key policy rate in a range of 0.0% to 0.1%. The bank announced that it would expand its government bond purchases by 10 trillion yen ($123.8 billion), targeting a 1.0% inflation rate in an attempt to end the country’s multi-year deflation.
As of November 1, 2011, the ECB had a key rate of 1.50%, which it had increased from 1.0% in an attempt to keep inflation in check. Soon, in response to weakness in the southern European economies, the ECB lowered its key rate to 1.25% in early November 2011 and 1.0% in December 2011. The ECB also continued to provide virtually unlimited liquidity for banks, announcing a Long-Term Refinancing Operation in December through which it provided low-cost three-year loans to lenders.
We use time-tested investment strategies, even as many variables are at work in the market.
Elevated unemployment and debt defaults continue to pressure consumers and businesses alike. In our experience, strict adherence to time-tested investment strategies has its rewards. As a whole, Wells Fargo Advantage Funds represents investments across a range of asset classes and investment styles, giving you an opportunity to create a diversified investment portfolio. While diversification may not prevent losses in a downturn, we believe it helps in managing risk.
Thank you for choosing to invest with Wells Fargo Advantage Funds. We appreciate your confidence in us and remain committed to helping you meet your financial needs. For current information about your fund investments, contact your investment professional, visit our Web site at wellsfargoadvantagefunds.com, or call us directly at 1-800-222-8222. We are available 24 hours a day, 7 days a week.
Sincerely,

Karla M. Rabusch
President
Wells Fargo Advantage Funds
| | | | |
| 4 | | Wells Fargo Advantage Asia Pacific Fund | | Letter to Shareholders |
Notice to Shareholders
The Board of Trustees for Wells Fargo Advantage Funds has unanimously approved the following modifications to certain net asset value (NAV) waiver privileges and commission schedules:
| | n | | Effective May 1, 2012, automatic investment plan (AIP) purchases and proceeds received from systematic withdrawals will no longer qualify for NAV repurchase privileges. | |
| | n | | Effective May 1, 2012, discretionary rights to waive the upfront commission for Class C and “jumbo” Class A share purchases will no longer be granted to broker/dealers. However, we will continue to waive the Class C shares contingent deferred sales charge for redemptions by employer-sponsored retirement plans where the dealer of record waived its commission at the time of purchase. | |
| | n | | Effective July 31, 2012, NAV purchase privileges for former Evergreen Class IS and Class R shareholders are being modified to remove the ability to purchase Class A shares at NAV unless those shares are held directly with the Fund on or after July 31, 2012. | |
Please contact your investment professional or call us directly at 1-800-222-8222 if you have any questions on this Notice to Shareholders.
| | | | | | |
| Performance Highlights (Unaudited) | | Wells Fargo Advantage Asia Pacific Fund | | | 5 | |
INVESTMENT OBJECTIVE
The Fund seeks long-term capital appreciation.
ADVISER
Wells Fargo Funds Management, LLC
SUB-ADVISER
Wells Capital Management Incorporated
PORTFOLIO MANAGERS
Anthony L.T. Cragg
Alison Shimada2
FUND INCEPTION
December 31, 1993
| | | | |
TEN LARGEST EQUITY HOLDINGS1 (AS OF APRIL 30, 2012) | |
Taiwan Semiconductor Manufacturing
Company Limited | | | 3.10% | |
Samsung Electronics Company Limited | | | 2.67% | |
Telecom Corporation of New Zealand Limited | | | 2.50% | |
Mizuho Financial Group Incorporated | | | 2.34% | |
Toyota Motor Corporation | | | 2.17% | |
China Construction Bank | | | 2.01% | |
Industrial & Commercial Bank of China Class H | | | 1.99% | |
iShares MSCI China Index ETF | | | 1.94% | |
PetroChina Company Limited | | | 1.84% | |
China Mobile Limited | | | 1.51% | |
| | |
SECTOR DISTRIBUTION3 (AS OF APRIL 30, 2012) | | |
|
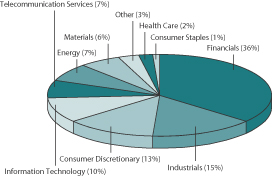 |
| 1. | The ten largest equity holdings are calculated based on the value of the securities divided by total net assets of the Fund. Holdings are subject to change and may have changed since the date specified. |
| 2. | Effective June 8, 2012, Alison Shimada became co-portfolio manager of the Fund. |
| 3. | Sector distribution is subject to change and is calculated based on the total long-term investments of the Fund. |
| | | | |
| 6 | | Wells Fargo Advantage Asia Pacific Fund | | Performance Highlights (Unaudited) |
AVERAGE ANNUAL TOTAL RETURN4 (%) (AS OF APRIL 30, 2012)
| | | | | | | | | | | | | | | | | | | | | | | | | | | | | | | | | | | | | | | | | | | | |
| | | | | | Including Sales Charge | | | Excluding Sales Charge | | | Expense Ratios5 | |
| | | Inception Date | | | 6 Months* | | | 1 Year | | | 5 Year | | | 10 Year | | | 6 Months* | | | 1 Year | | | 5 Year | | | 10 Year | | | Gross | | | Net6 | |
Class A (WFAAX) | | | 07/31/2007 | | | | 2.13 | | | | (10.95 | ) | | | (3.08 | ) | | | 8.61 | | | | 8.39 | | | | (5.53 | ) | | | (1.92 | ) | | | 9.26 | | | | 1.75% | | | | 1.62% | |
Class C (WFCAX) | | | 07/31/2007 | | | | 6.99 | | | | (7.21 | ) | | | (2.69 | ) | | | 8.50 | | | | 7.99 | | | | (6.21 | ) | | | (2.69 | ) | | | 8.50 | | | | 2.50% | | | | 2.37% | |
Administrator Class (WFADX) | | | 07/30/2010 | | | | | | | | | | | | | | | | | | | | 8.35 | | | | (5.40 | ) | | | (1.87 | ) | | | 9.29 | | | | 1.59% | | | | 1.42% | |
Institutional Class (WFPIX) | | | 07/30/2010 | | | | | | | | | | | | | | | | | | | | 8.48 | | | | (5.18 | ) | | | (1.82 | ) | | | 9.32 | | | | 1.32% | | | | 1.27% | |
Investor Class (SASPX) | | | 12/31/1993 | | | | | | | | | | | | | | | | | | | | 8.31 | | | | (5.62 | ) | | | (2.01 | ) | | | 9.21 | | | | 1.82% | | | | 1.67% | |
MSCI All Country Asia Pacific Index (Net)7 | | | | | | | | | | | | | | | | | | | | | | | 4.05 | | | | (7.74 | ) | | | (0.75 | ) | | | 7.32 | | | | | | | | | |
| * | Returns for periods of less than one year are not annualized. |
Figures quoted represent past performance, which is no guarantee of future results and do not reflect the deduction of taxes that a shareholder may pay on fund distributions or the redemption of fund shares. Investment return and principal value of an investment will fluctuate so that an investor’s shares, when redeemed, may be worth more or less than their original cost. Performance shown without sales charges would be lower if sales charges were reflected. Current performance may be lower or higher than the performance data quoted and assumes the reinvestment of dividends and capital gains. Current month-end performance is available on the Fund’s Web site – wellsfargoadvantagefunds.com.
Index returns do not include transaction costs associated with buying and selling securities, any mutual fund fees or expenses or any taxes. It is not possible to invest directly in an index.
For Class A shares, the maximum front-end sales charge is 5.75%. For Class C shares, the maximum contingent deferred sales charge is 1.00%. Performance including sales charge assumes the sales charge for the corresponding time period. Administrator Class, Institutional Class and Investor Class shares are sold without a front-end sales charge or contingent deferred sales charge.
Stock fund values fluctuate in response to the activities of individual companies and general market and economic conditions. Foreign investments are especially volatile and can rise or fall dramatically due to differences in the political and economic conditions of the host country. These risks are generally intensified in emerging markets. The use of derivatives may reduce returns and/or increase volatility. Certain investment strategies tend to increase the total risk of an investment (relative to the broader market). This Fund is exposed to regional risk, and smaller-company securities risk. Consult the Fund’s prospectus for additional information on these and other risks.
| 4. | Historical performance shown for Class A shares prior to their inception reflects the performance of the Investor Class shares, and includes the higher expenses applicable to the Investor Class shares. If these expenses had not been included, returns would be higher. Historical performance shown for Class C shares prior to their inception reflects the performance of the Investor Class shares, adjusted to reflect the higher expenses applicable to Class C shares. Historical performance shown for the Administrator and Institutional Class shares prior to their inception reflects the performance of the Class A shares, and includes the higher expenses applicable to the Class A shares. If these expenses had not been included, returns would be higher. |
| 5. | Reflects the expense ratios as stated in the most recent prospectuses. |
| 6. | The Adviser has committed through February 28, 2013 to waive fees and/or reimburse expenses to the extent necessary to cap the Fund’s Total Annual Fund Operating Expenses After Fee Waiver, excluding certain expenses, at 1.60% for Class A, 2.35% for Class C, 1.40% for Administrator Class, 1.25% for Institutional Class and 1.65% for Investor Class. Without this cap, the Fund’s returns would have been lower. |
| 7. | The Morgan Stanley Capital International (MSCI) All Country Asia Pacific Index (Net) is a total return, capitalization-weighted index that measures the performance of stock markets in 15 Pacific region countries, including Australia, China, Hong Kong, India, Indonesia, Japan, Korea, Malaysia, New Zealand, Pakistan, the Philippines, Singapore, Sri Lanka, Taiwan and Thailand. You cannot invest directly in an index. Source: MSCI. MSCI makes no express or implied warranties or representations and shall have no liability whatsoever with respect to any MSCI data contained herein. The MSCI data may not be further redistributed or used as a basis for other indexes or any securities or financial products. This report is not approved, reviewed, or produced by MSCI. |
| | | | | | |
| Fund Expenses (Unaudited) | | Wells Fargo Advantage Asia Pacific Fund | | | 7 | |
As a shareholder of the Fund, you incur two types of costs: (1) transaction costs, including sales charges (loads) on purchase payments and contingent deferred sales charges (if any) on redemptions and (2) ongoing costs, including management fees; distribution (12b-1) and/or shareholder service fees; and other Fund expenses. This example is intended to help you understand your ongoing costs (in dollars) of investing in the Fund and to compare these costs with the ongoing costs of investing in other mutual funds.
The example is based on an investment of $1,000 invested at the beginning of the six-month period and held for the entire period from November 1, 2011 to April 30, 2012.
Actual Expenses
The “Actual” line of the table below provides information about actual account values and actual expenses. You may use the information in this line, together with the amount you invested, to estimate the expenses that you paid over the period. Simply divide your account value by $1,000 (for example, an $8,600 account value divided by $1,000 = 8.6), then multiply the result by the number in the “Actual” line under the heading entitled “Expenses Paid During Period” for your applicable class of shares to estimate the expenses you paid on your account during this period.
Hypothetical Example for Comparison Purposes
The “Hypothetical” line of the table below provides information about hypothetical account values and hypothetical expenses based on the Fund’s actual expense ratio and an assumed rate of return of 5% per year before expenses, which is not the Fund’s actual return. The hypothetical account values and expenses may not be used to estimate the actual ending account balance or expenses you paid for the period. You may use this information to compare the ongoing costs of investing in the Fund and other funds. To do so, compare this 5% hypothetical example with the 5% hypothetical examples that appear in the shareholder reports of the other funds.
Please note that the expenses shown in the table are meant to highlight your ongoing costs only and do not reflect any transactional costs, such as sales charges (loads) and contingent deferred sales charges. Therefore, the “Hypothetical” line of the table is useful in comparing ongoing costs only, and will not help you determine the relative total costs of owning different funds. In addition, if these transactional costs were included, your costs would have been higher.
| | | | | | | | | | | | | | | | |
| | | Beginning
Account Value
11-01-2011 | | | Ending
Account Value
04-30-2012 | | | Expenses
Paid During
the Period1 | | | Net Annual
Expense Ratio | |
Class A | | | | | | | | | | | | | | | | |
Actual | | $ | 1,000.00 | | | $ | 1,083.87 | | | $ | 8.29 | | | | 1.60 | % |
Hypothetical (5% return before expenses) | | $ | 1,000.00 | | | $ | 1,016.91 | | | $ | 8.02 | | | | 1.60 | % |
Class C | | | | | | | | | | | | | | | | |
Actual | | $ | 1,000.00 | | | $ | 1,079.93 | | | $ | 12.15 | | | | 2.35 | % |
Hypothetical (5% return before expenses) | | $ | 1,000.00 | | | $ | 1,013.18 | | | $ | 11.76 | | | | 2.35 | % |
Administrator Class | | | | | | | | | | | | | | | | |
Actual | | $ | 1,000.00 | | | $ | 1,083.51 | | | $ | 7.25 | | | | 1.40 | % |
Hypothetical (5% return before expenses) | | $ | 1,000.00 | | | $ | 1,017.90 | | | $ | 7.02 | | | | 1.40 | % |
Institutional Class | | | | | | | | | | | | | | | | |
Actual | | $ | 1,000.00 | | | $ | 1,084.80 | | | $ | 6.48 | | | | 1.25 | % |
Hypothetical (5% return before expenses) | | $ | 1,000.00 | | | $ | 1,018.65 | | | $ | 6.27 | | | | 1.25 | % |
Investor Class | | | | | | | | | | | | | | | | |
Actual | | $ | 1,000.00 | | | $ | 1,083.14 | | | $ | 8.55 | | | | 1.65 | % |
Hypothetical (5% return before expenses) | | $ | 1,000.00 | | | $ | 1,016.66 | | | $ | 8.27 | | | | 1.65 | % |
| 1. | Expenses paid is equal to the annualized expense ratio of each class multiplied by the average account value over the period, multiplied by the number of days in the most recent fiscal half-year divided by the number of days in the fiscal year (to reflect the one-half year period). |
| | | | |
| 8 | | Wells Fargo Advantage Asia Pacific Fund | | Portfolio of Investments—April 30, 2012 (Unaudited) |
| | | | | | | | | | | | |
| Security Name | | | | | | Shares | | | Value | |
| | | | | | | | | | | | |
| | | | |
Common Stocks: 91.66% | | | | | | | | | | | | |
| | | | |
| Australia: 4.19% | | | | | | | | | | | | |
Amcor Limited (Materials, Containers & Packaging) | | | | | | | 116,837 | | | $ | 915,472 | |
Insurance Australia Group Limited (Financials, Insurance) | | | | | | | 432,206 | | | | 1,594,193 | |
Macquarie Group Limited (Financials, Capital Markets) | | | | | | | 33,500 | | | | 1,019,584 | |
Newcrest Mining Limited (Materials, Metals & Mining) | | | | | | | 51,097 | | | | 1,400,226 | |
Platinum Asset Management Limited (Financials, Capital Markets) | | | | | | | 235,000 | | | | 1,077,376 | |
Sonic Healthcare Limited (Health Care, Health Care Providers & Services) | | | | | | | 74,400 | | | | 977,541 | |
Transurban Group (Industrials, Transportation Infrastructure) | | | | | | | 155,266 | | | | 949,645 | |
| | | | |
| | | | | | | | | | | 7,934,037 | |
| | | | | | | | | | | | |
| | | | |
| Bermuda: 1.08% | | | | | | | | | | | | |
Biosensors International Group Limited (Health Care, Health Care Equipment & Supplies) † | | | | | | | 1,221,000 | | | | 1,317,200 | |
Silverlake Axis Limited (Information Technology, Software) | | | | | | | 2,595,000 | | | | 733,939 | |
| | | | |
| | | | | | | | | | | 2,051,139 | |
| | | | | | | | | | | | |
| | | | |
| Cayman Islands: 1.60% | | | | | | | | | | | | |
ANTA Sports Products Limited (Consumer Discretionary, Textiles, Apparel & Luxury Goods) | | | | | | | 1,253,000 | | | | 1,238,683 | |
Chow Tai Fook Jewellery Group (Consumer Discretionary, Specialty Retail) † | | | | | | | 1,189,200 | | | | 1,790,241 | |
| | | | |
| | | | | | | | | | | 3,028,924 | |
| | | | | | | | | | | | |
| | | | |
| China: 9.79% | | | | | | | | | | | | |
Bank of China Limited (Financials, Commercial Banks) | | | | | | | 4,508,000 | | | | 1,888,344 | |
China Construction Bank (Financials, Commercial Banks) | | | | | | | 4,887,000 | | | | 3,804,461 | |
China Life Insurance Company Limited (Financials, Insurance) | | | | | | | 475,000 | | | | 1,285,662 | |
China Petroleum & Chemical Corporation (Energy, Oil, Gas & Consumable Fuels) | | | | | | | 828,000 | | | | 892,176 | |
CITIC Securities Company Limited (Financials, Capital Markets) † | | | | | | | 910,000 | | | | 1,911,802 | |
Industrial & Commercial Bank of China Class H (Financials, Commercial Banks) | | | | | | | 5,637,000 | | | | 3,763,498 | |
PetroChina Company Limited (Energy, Oil, Gas & Consumable Fuels) | | | | | | | 2,302,000 | | | | 3,489,205 | |
Zijin Mining Group Company Limited Class H (Materials, Metals & Mining) | | | | | | | 4,616,000 | | | | 1,505,221 | |
| | | | |
| | | | | | | | | | | 18,540,369 | |
| | | | | | | | | | | | |
| | | | |
| Hong Kong: 3.43% | | | | | | | | | | | | |
Cathay Pacific Airways Limited (Industrials, Airlines) | | | | | | | 501,000 | | | | 849,782 | |
China Mobile Limited (Telecommunication Services, Wireless Telecommunication Services) | | | | | | | 259,000 | | | | 2,869,191 | |
China Resources Land Limited (Financials, Real Estate Management & Development) | | | | | | | 514,000 | | | | 989,755 | |
Shangri-La Asia Limited (Consumer Discretionary, Hotels, Restaurants & Leisure) | | | | | | | 538,000 | | | | 1,142,756 | |
Sunlight Real Estate LLC (Financials, REITs) | | | | | | | 1,989,000 | | | | 640,898 | |
| | | | |
| | | | | | | | | | | 6,492,382 | |
| | | | | | | | | | | | |
| | | | |
| India: 3.18% | | | | | | | | | | | | |
Ashok Leyland Limited (Industrials, Machinery) | | | | | | | 1,733,500 | | | | 1,059,178 | |
Coal India Limited (Energy, Oil, Gas & Consumable Fuels) | | | | | | | 215,700 | | | | 1,442,161 | |
Cox & Kings Limited (Consumer Discretionary, Hotels, Restaurants & Leisure) | | | | | | | 407,500 | | | | 1,164,507 | |
ICICI Bank Limited (Financials, Commercial Banks) | | | | | | | 79,300 | | | | 1,327,711 | |
Lupin Limited (Health Care, Pharmaceuticals) | | | | | | | 98,500 | | | | 1,032,474 | |
| | | | |
| | | | | | | | | | | 6,026,031 | |
| | | | | | | | | | | | |
The accompanying notes are an integral part of these financial statements.
| | | | | | |
| Portfolio of Investments—April 30, 2012 (Unaudited) | | Wells Fargo Advantage Asia Pacific Fund | | | 9 | |
| | | | | | | | | | | | |
| Security Name | | | | | | Shares | | | Value | |
| | | | | | | | | | | | |
| | | | |
| Indonesia: 4.04% | | | | | | | | | | | | |
Energi Mega Persada TBK PT (Energy, Oil, Gas & Consumable Fuels) † | | | | | | | 68,891,000 | | | $ | 1,446,707 | |
Jasa Marga TBK PT (Industrials, Transportation Infrastructure) | | | | | | | 2,421,000 | | | | 1,409,319 | |
Lippo Karawaci TBK PT (Financials, Real Estate Management & Development) | | | | | | | 28,554,500 | | | | 2,578,775 | |
Telekomunikasi Indonesia TBK PT (Telecommunication Services, Diversified Telecommunication Services) | | | | | | | 2,407,000 | | | | 2,226,157 | |
| | | | |
| | | | | | | | | | | 7,660,958 | |
| | | | | | | | | | | | |
| | | | |
| Japan: 23.70% | | | | | | | | | | | | |
Bridgestone Corporation (Consumer Discretionary, Auto Components) | | | | | | | 81,300 | | | | 1,939,836 | |
Casio Computer Company Limited (Consumer Discretionary, Household Durables) | | | | | | | 143,700 | | | | 962,920 | |
Hitachi Limited (Information Technology, Electronic Equipment, Instruments & Components) | | | | | | | 151,000 | | | | 968,337 | |
Honda Motor Company Limited (Consumer Discretionary, Automobiles) | | | | | | | 72,200 | | | | 2,618,878 | |
Industrial & Infrastructure Fund Investment Company (Financials, REITs) | | | | | | | 450 | | | | 2,739,228 | |
Japan Retail Fund Investment Corporation (Financials, REITs) | | | | | | | 800 | | | | 1,277,555 | |
Marubeni Corporation (Industrials, Trading Companies & Distributors) | | | | | | | 402,000 | | | | 2,809,569 | |
Mitsubishi Corporation (Industrials, Trading Companies & Distributors) | | | | | | | 122,600 | | | | 2,676,501 | |
Mitsubishi Electric Corporation (Industrials, Electrical Equipment) | | | | | | | 209,000 | | | | 1,850,739 | |
Mitsubishi Estate Company Limited (Financials, Real Estate Management & Development) | | | | | | | 88,000 | | | | 1,569,539 | |
Mitsubishi UFJ Financial Group Incorporated (Financials, Commercial Banks) | | | | | | | 554,000 | | | | 2,685,346 | |
Mitsui Fudosan Company Limited (Financials, Real Estate Management & Development) | | | | | | | 84,000 | | | | 1,553,958 | |
Mizuho Financial Group Incorporated (Financials, Commercial Banks) | | | | | | | 2,787,500 | | | | 4,434,024 | |
Modec Incorporated (Energy, Energy Equipment & Services) | | | | | | | 95,100 | | | | 2,003,484 | |
Nabtesco Corporation (Industrials, Machinery) | | | | | | | 65,000 | | | | 1,401,929 | |
Sanrio Company Limited (Consumer Discretionary, Specialty Retail) | | | | | | | 35,900 | | | | 1,580,517 | |
Taiyo Yuden Company Limited (Information Technology, Electronic Equipment, Instruments & Components) | | | | | | | 191,000 | | | | 2,066,934 | |
THK Company Limited (Industrials, Machinery) | | | | | | | 93,100 | | | | 1,870,396 | |
Toho Titanium Company Limited (Materials, Metals & Mining) | | | | | | | 111,100 | | | | 1,575,215 | |
Toyota Motor Corporation (Consumer Discretionary, Automobiles) | | | | | | | 99,300 | | | | 4,110,552 | |
Yamada Denki Company Limited (Consumer Discretionary, Specialty Retail) | | | | | | | 33,760 | | | | 2,198,798 | |
| | | | |
| | | | | | | | | | | 44,894,255 | |
| | | | | | | | | | | | |
| | | | |
| Malaysia: 2.03% | | | | | | | | | | | | |
Bumi Armada Berhad (Energy, Energy Equipment & Services) | | | | | | | 633,000 | | | | 834,656 | |
Bumiputra Commerce Holdings Berhad (Financials, Commercial Banks) | | | | | | | 370,300 | | | | 906,782 | |
Malayan Banking Berhad (Financials, Commercial Banks) | | | | | | | 344,200 | | | | 981,641 | |
Sunway Berhad (Financials, Real Estate Management & Development) † | | | | | | | 1,405,100 | | | | 1,114,422 | |
| | | | |
| | | | | | | | | | | 3,837,501 | |
| | | | | | | | | | | | |
| | | | |
| New Zealand: 2.50% | | | | | | | | | | | | |
Telecom Corporation of New Zealand Limited (Telecommunication Services, Diversified Telecommunication Services) | | | | | | | 2,202,900 | | | | 4,737,737 | |
| | | | | | | | | | | | |
| | | | |
| Philippines: 2.60% | | | | | | | | | | | | |
GT Capital Holdings Incorporated (Financials, Capital Markets) † | | | | | | | 135,300 | | | | 1,631,163 | |
Megaworld Corporation (Financials, Real Estate Management & Development) | | | | | | | 30,340,000 | | | | 1,559,398 | |
Philex Mining Corporation (Materials, Metals & Mining) | | | | | | | 2,939,100 | | | | 1,736,867 | |
| | | | |
| | | | | | | | | | | 4,927,428 | |
| | | | | | | | | | | | |
The accompanying notes are an integral part of these financial statements.
| | | | |
| 10 | | Wells Fargo Advantage Asia Pacific Fund | | Portfolio of Investments—April 30, 2012 (Unaudited) |
| | | | | | | | | | | | |
| Security Name | | | | | | Shares | | | Value | |
| | | | | | | | | | | | |
| | | | |
| Singapore: 17.90% | | | | | | | | | | | | |
Ascott Residence Trust (Financials, REITs) | | | | | | | 535,000 | | | $ | 484,202 | |
Cache Logistics Trust (Financials, REITs) | | | | | | | 1,750,000 | | | | 1,463,636 | |
CapitaLand Limited (Financials, Real Estate Management & Development) | | | | | | | 569,000 | | | | 1,351,806 | |
CapitaMall Trust (Financials, REITs) | | | | | | | 1,745,000 | | | | 2,538,182 | |
CapitaRetail China Trust (Financials, REITs) | | | | | | | 1,348,200 | | | | 1,410,844 | |
CDL Hospitality Trusts (Financials, REITs) | | | | | | | 1,612,000 | | | | 2,461,964 | |
CSE Global Limited (Information Technology, IT Services) | | | | | | | 1,498,000 | | | | 901,826 | |
DBS Group Holdings Limited (Financials, Commercial Banks) | | | | | | | 215,000 | | | | 2,425,374 | |
Fraser & Neave Limited (Industrials, Industrial Conglomerates) | | | | | | | 282,000 | | | | 1,604,267 | |
Frasers Centrepoint Trust (Financials, REITs) | | | | | | | 1,112,000 | | | | 1,433,244 | |
Indofood Agri Resources Limited (Consumer Staples, Food Products) † | | | | | | | 766,000 | | | | 882,061 | |
Keppel Corporation Limited (Industrials, Industrial Conglomerates) | | | | | | | 101,000 | | | | 901,859 | |
Mapletree Commercial Trust (Financials, REITs) | | | | | | | 1,927,000 | | | | 1,417,026 | |
OSIM International Limited (Consumer Discretionary, Specialty Retail) | | | | | | | 944,000 | | | | 923,022 | |
Oversea-Chinese Banking Corporation Limited (Financials, Commercial Banks) | | | | | | | 163,000 | | | | 1,180,186 | |
Parkway Life Real Estate Investment Trust (Financials, REITs) | | | | | | | 1,322,000 | | | | 1,976,323 | |
SembCorp Industries Limited (Industrials, Industrial Conglomerates) | | | | | | | 627,000 | | | | 2,558,667 | |
SembCorp Marine Limited (Industrials, Machinery) | | | | | | | 226,000 | | | | 927,741 | |
Singapore Exchange Limited (Financials, Diversified Financial Services) | | | | | | | 174,000 | | | | 942,061 | |
Singapore Press Holdings Limited (Consumer Discretionary, Media) | | | | | | | 330,000 | | | | 1,058,667 | |
Singapore Telecommunications Limited (Telecommunication Services, Diversified Telecommunication Services) | | | | | | | 948,000 | | | | 2,390,109 | |
STX OSV Holdings Limited (Energy, Energy Equipment & Services) | | | | | | | 1,262,000 | | | | 1,631,677 | |
Venture Corporation Limited (Information Technology, Electronic Equipment, Instruments & Components) | | | | | | | 152,000 | | | | 1,056,323 | |
| | | | |
| | | | | | | | | | | 33,921,067 | |
| | | | | | | | | | | | |
| | | | |
| South Korea: 6.80% | | | | | | | | | | | | |
Grand Korea Leisure Company Limited (Consumer Discretionary, Hotels, Restaurants & Leisure) | | | | | | | 55,200 | | | | 1,160,049 | |
Hankook Tire Company Limited (Consumer Discretionary, Auto Components) | | | | | | | 25,300 | | | | 1,072,333 | |
Hyundai Heavy Industries Company Limited (Industrials, Machinery) | | | | | | | 3,500 | | | | 876,452 | |
KCC Corporation (Industrials, Building Products) | | | | | | | 3,300 | | | | 849,729 | |
KT Corporation ADR (Telecommunication Services, Diversified Telecommunication Services) | | | | | | | 66,000 | | | | 848,100 | |
KT&G Corporation (Consumer Staples, Tobacco) | | | | | | | 14,500 | | | | 995,642 | |
POSCO (Materials, Metals & Mining) | | | | | | | 3,100 | | | | 1,030,019 | |
Samsung Electronics Company Limited (Information Technology, Semiconductors & Semiconductor Equipment) | | | | | | | 4,110 | | | | 5,055,105 | |
Shinhan Financial Group Company Limited (Financials, Commercial Banks) | | | | | | | 28,600 | | | | 999,624 | |
| | | | |
| | | | | | | | | | | 12,887,053 | |
| | | | | | | | | | | | |
| | | | |
| Taiwan: 4.92% | | | | | | | | | | | | |
Lung Yen Life Service Corporation (Industrials, Construction & Engineering) | | | | | | | 488,000 | | | | 1,480,281 | |
Taiwan Semiconductor Manufacturing Company Limited (Information Technology, Semiconductors & Semiconductor Equipment) | | | | | | | 1,976,000 | | | | 5,872,154 | |
United Microelectronics Corporation ADR (Information Technology, Semiconductors & Semiconductor Equipment) « | | | | | | | 735,700 | | | | 1,971,676 | |
| | | | |
| | | | | | | | | | | 9,324,111 | |
| | | | | | | | | | | | |
| | | | |
| Thailand: 3.38% | | | | | | | | | | | | |
Bangkok Bank PCL (Financials, Commercial Banks) | | | | | | | 329,300 | | | | 2,077,535 | |
Bangkok Expressway PCL (Industrials, Transportation Infrastructure) | | | | | | | 1,247,700 | | | | 949,469 | |
The accompanying notes are an integral part of these financial statements.
| | | | | | |
| Portfolio of Investments—April 30, 2012 (Unaudited) | | Wells Fargo Advantage Asia Pacific Fund | | | 11 | |
| | | | | | | | | | | | | | | | |
| Security Name | | | | | | | | Shares | | | Value | |
| | | | | | | | | | | | | | | | |
| | | | |
| Thailand (continued) | | | | | | | | | | | | | | | | |
Precious Shipping PCL (Industrials, Marine) | | | | | | | | | | | 1,816,300 | | | $ | 956,880 | |
PTT PCL (Energy, Oil, Gas & Consumable Fuels) | | | | | | | | | | | 86,000 | | | | 978,862 | |
Siam Cement PCL (Materials, Construction Materials) | | | | | | | | | | | 127,000 | | | | 1,445,528 | |
| | | | |
| | | | | | | | | | | | | | | 6,408,274 | |
| | | | | | | | | | | | | | | | |
| | | | |
| United Kingdom: 0.52% | | | | | | | | | | | | | | | | |
BHP Billiton plc (Materials, Metals & Mining) | | | | | | | | | | | 30,900 | | | | 990,164 | |
| | | | | | | | | | | | | | | | |
| | | | |
Total Common Stocks (Cost $166,035,854) | | | | | | | | | | | | | | | 173,661,430 | |
| | | | | | | | | | | | | | | | |
| | | | |
Investment Companies: 2.72% | | | | | | | | | | | | | | | | |
| | | | |
| Bermuda: 0.78% | | | | | | | | | | | | | | | | |
Macquarie International Infrastructure Fund Limited (Mutual Funds) | | | | | | | | | | | 3,147,000 | | | | 1,474,955 | |
| | | | | | | | | | | | | | | | |
| | | | |
| Hong Kong: 1.94% | | | | | | | | | | | | | | | | |
iShares MSCI China Index ETF (Exchange Traded Funds) | | | | | | | | | | | 2,543,000 | | | | 3,670,948 | |
| | | | | | | | | | | | | | | | |
| | | | |
Total Investment Companies (Cost $4,979,835) | | | | | | | | | | | | | | | 5,145,903 | |
| | | | | | | | | | | | | | | | |
| | | | | | Expiration Date | | | | | | | |
| Warrants: 0.37% | | | | | | | | | | | | | | | | |
| | | | |
| United Kingdom (continued) | | | | | | | | | | | | | | | | |
HSBC Bank plc (Financials, Commercial Banks) †(a) | | | | | | | 12/07/2020 | | | | 450,100 | | | | 705,446 | |
| | | | | | | | | | | | | | | | |
| | | | |
Total Warrants (Cost $760,444) | | | | | | | | | | | | | | | 705,446 | |
| | | | | | | | | | | | | | | | |
| | | | |
| | | Yield | | | | | | | | | | |
| Short-Term Investments: 9.26% | | | | | | | | | | | | | | | | |
| | | | |
| Investment Companies: 9.26% | | | | | | | | | | | | | | | | |
Wells Fargo Advantage Cash Investment Money Market Fund, Select Class (l)(u) | | | 0.11 | % | | | | | | | 5,964,885 | | | | 5,964,885 | |
Wells Fargo Securities Lending Cash Investments, LLC (l)(u)(v)(r) | | | 0.19 | | | | | | | | 11,587,323 | | | | 11,587,323 | |
| | | | |
Total Short-Term Investments (Cost $17,552,208) | | | | | | | | | | | | | | | 17,552,208 | |
| | | | | | | | | | | | | | | | |
| | | | | | | | |
| Total Investments in Securities | | | | | | | | |
| (Cost $189,328,341) * | | | 104.01 | % | | | 197,064,987 | |
Other Assets and Liabilities, Net | | | (4.01 | ) | | | (7,596,491 | ) |
| | | | | | | | |
| Total Net Assets | | | 100.00 | % | | $ | 189,468,496 | |
| | | | | | | | |
| † | Non-income earning security |
| « | All or a portion of this security is on loan. |
| (a) | Security is fair valued by the Management Valuation Team, and in certain instances by the Board of Trustees, in accordance with procedures approved by the Board of Trustees. |
| (l) | Investment in an affiliate |
| (u) | Rate shown is the 7-day annualized yield at period end. |
| (v) | Security represents investment of cash collateral received from securities on loan. |
| (r) | The investment company is exempt from registration under Section 3(c)(7) of the 1940 Act. |
| * | Cost for federal income tax purposes is $190,584,730 and net unrealized appreciation (depreciation) consists of: |
| | | | |
Gross unrealized appreciation | | $ | 13,379,615 | |
Gross unrealized depreciation | | | (6,899,358 | ) |
| | | | |
Net unrealized appreciation | | $ | 6,480,257 | |
The accompanying notes are an integral part of these financial statements.
| | | | |
| 12 | | Wells Fargo Advantage Asia Pacific Fund | | Statement of Assets and Liabilities—April 30, 2012 (Unaudited) |
| | | | |
| | | | |
| |
Assets | | | | |
Investments | | | | |
In unaffiliated securities (including securities on loan), at value (see cost below) | | $ | 179,512,779 | |
In affiliated securities, at value (see cost below) | | | 17,552,208 | |
| | | | |
Total investments, at value (see cost below) | | | 197,064,987 | |
Foreign currency, at value (see cost below) | | | 2,063,546 | |
Receivable for investments sold | | | 4,072,981 | |
Receivable for Fund shares sold | | | 34,525 | |
Receivable for dividends | | | 903,595 | |
Receivable for securities lending income | | | 17,447 | |
Prepaid expenses and other assets | | | 44,667 | |
| | | | |
Total assets | | | 204,201,748 | |
| | | | |
| |
Liabilities | | | | |
Payable for investments purchased | | | 2,539,159 | |
Payable for Fund shares redeemed | | | 283,209 | |
Payable upon receipt of securities loaned | | | 11,587,323 | |
Advisory fee payable | | | 131,833 | |
Distribution fees payable | | | 1,064 | |
Due to other related parties | | | 56,113 | |
Accrued expenses and other liabilities | | | 134,551 | |
| | | | |
Total liabilities | | | 14,733,252 | |
| | | | |
Total net assets | | $ | 189,468,496 | |
| | | | |
| |
NET ASSETS CONSIST OF | | | | |
Paid-in capital | | $ | 328,216,473 | |
Undistributed net investment income | | | 587,778 | |
Accumulated net realized losses on investments | | | (147,101,774 | ) |
Net unrealized gains on investments | | | 7,766,019 | |
| | | | |
Total net assets | | $ | 189,468,496 | |
| | | | |
| |
COMPUTATION OF NET ASSET VALUE AND OFFERING PRICE PER SHARE1 | | | | |
Net assets – Class A | | $ | 6,571,288 | |
Shares outstanding – Class A | | | 652,141 | |
Net asset value per share – Class A | | | $10.08 | |
Maximum offering price per share – Class A2 | | | $10.69 | |
Net assets – Class C | | $ | 1,778,491 | |
Shares outstanding – Class C | | | 184,139 | |
Net asset value per share – Class C | | | $9.66 | |
Net assets – Administrator Class | | $ | 14,864,574 | |
Shares outstanding – Administrator Class | | | 1,498,045 | |
Net asset value per share – Administrator Class | | | $9.92 | |
Net assets – Institutional Class | | $ | 11,518 | |
Shares outstanding – Institutional Class | | | 1,161 | |
Net asset value per share – Institutional Class | | | $9.92 | |
Net assets – Investor Class | | $ | 166,242,625 | |
Shares outstanding – Investor Class | | | 16,721,545 | |
Net asset value per share – Investor Class | | | $9.94 | |
| |
Investments in unaffiliated securities, at cost | | $ | 171,776,133 | |
| | | | |
Investments in affiliated securities, at cost | | $ | 17,552,208 | |
| | | | |
Total investments, at cost | | $ | 189,328,341 | |
| | | | |
Securities on loan, at value | | $ | 10,993,979 | |
| | | | |
Foreign currency, at cost | | $ | 2,045,689 | |
| | | | |
| 1. | The Fund has an unlimited number of authorized shares. |
| 2. | Maximum offering price is computed as 100/94.25 of net asset value. On investments of $50,000 or more, the offering price is reduced. |
The accompanying notes are an integral part of these financial statements.
| | | | | | |
| Statement of Operations—Six Months Ended April 30, 2012 (Unaudited) | | Wells Fargo Advantage Asia Pacific Fund | | | 13 | |
| | | | |
| | | | |
| |
Investment income | | | | |
Dividends* | | $ | 2,216,567 | |
Securities lending income, net | | | 66,808 | |
Income from affiliated securities | | | 3,287 | |
| | | | |
Total investment income | | | 2,286,662 | |
| | | | |
| |
Expenses | | | | |
Advisory fee | | | 1,039,591 | |
Administration fees | | | | |
Fund level | | | 47,254 | |
Class A | | | 14,273 | |
Class C | | | 1,896 | |
Administrator Class | | | 6,515 | |
Institutional Class | | | 4 | |
Investor Class | | | 269,838 | |
Shareholder servicing fees | | | | |
Class A | | | 13,724 | |
Class C | | | 1,823 | |
Administrator Class | | | 13,186 | |
Investor Class | | | 204,092 | |
Distribution fees | | | | |
Class C | | | 5,469 | |
Custody and accounting fees | | | 64,636 | |
Professional fees | | | 20,044 | |
Registration fees | | | 38,602 | |
Shareholder report expenses | | | 32,877 | |
Trustees’ fees and expenses | | | 5,848 | |
Other fees and expenses | | | 14,462 | |
| | | | |
Total expenses | | | 1,794,134 | |
Less: Fee waivers and/or expense reimbursements | | | (247,483 | ) |
| | | | |
Net expenses | | | 1,546,651 | |
| | | | |
Net investment income | | | 740,011 | |
| | | | |
| |
REALIZED AND UNREALIZED GAINS (LOSSES) ON INVESTMENTS | | | | |
Net realized losses on investments | | | (6,216,210 | ) |
Net change in unrealized gains (losses) on investments | | | 18,752,015 | |
| | | | |
Net realized and unrealized gains (losses) on investments | | | 12,535,805 | |
| | | | |
Net increase in net assets resulting from operations | | $ | 13,275,816 | |
| | | | |
| |
* Net of foreign dividend withholding taxes of | | | $150,987 | |
The accompanying notes are an integral part of these financial statements.
| | | | |
| 14 | | Wells Fargo Advantage Asia Pacific Fund | | Statements of Changes in Net Assets |
| | | | | | | | | | | | | | | | |
| | | Six Months Ended April 30, 2012 (Unaudited) | | | Year Ended October 31, 2011 | |
| | | | |
Operations | | | | | | | | | | | | | | | | |
Net investment income | | | | | | $ | 740,011 | | | | | | | $ | 2,324,493 | |
Net realized gains (losses) on investments | | | | | | | (6,216,210 | ) | | | | | | | 31,234,439 | |
Net change in unrealized gains (losses) on investments | | | | | | | 18,752,015 | | | | | | | | (52,816,349 | ) |
| | | | | | | | | | | | | | | | |
Net increase (decrease) in net assets resulting from operations | | | | | | | 13,275,816 | | | | | | | | (19,257,417 | ) |
| | | | | | | | | | | | | | | | |
| | | | |
Distributions to shareholders from | | | | | | | | | | | | | | | | |
Net investment income | | | | | | | | | | | | | | | | |
Class A | | | | | | | 0 | | | | | | | | (179,515 | ) |
Class C | | | | | | | (4,466 | ) | | | | | | | (18,810 | ) |
Administrator Class | | | | | | | (180,458 | ) | | | | | | | (201,125 | ) |
Institutional Class | | | | | | | (165 | ) | | | | | | | (103 | ) |
Investor Class | | | | | | | (1,715,646 | ) | | | | | | | (1,337,239 | ) |
| | | | | | | | | | | | | | | | |
Total distributions to shareholders | | | | | | | (1,900,735 | ) | | | | | | | (1,736,792 | ) |
| | | | | | | | | | | | | | | | |
| | | | |
Capital share transactions | | | Shares | | | | | | | | Shares | | | | | |
Proceeds from shares sold | | | | | | | | | | | | | | | | |
Class A | | | 255,705 | | | | 2,488,581 | | | | 360,456 | | | | 3,647,059 | |
Class C | | | 70,126 | | | | 643,347 | | | | 54,567 | | | | 543,584 | |
Administrator Class | | | 406,378 | | | | 3,918,868 | | | | 2,721,080 | | | | 27,752,823 | |
Institutional Class | | | 377 | | | | 3,321 | | | | 0 | | | | 0 | |
Investor Class | | | 720,743 | | | | 6,840,699 | | | | 2,587,533 | | | | 26,262,269 | |
| | | | | | | | | | | | | | | | |
| | | | | | | 13,894,816 | | | | | | | | 58,205,735 | |
| | | | | | | | | | | | | | | | |
Reinvestment of distributions | | | | | | | | | | | | | | | | |
Class A | | | 0 | | | | 0 | | | | 17,467 | | | | 177,817 | |
Class C | | | 467 | | | | 3,886 | | | | 1,414 | | | | 14,002 | |
Administrator Class | | | 19,583 | | | | 166,851 | | | | 18,442 | | | | 187,182 | |
Institutional Class | | | 19 | | | | 165 | | | | 10 | | | | 103 | |
Investor Class | | | 181,106 | | | | 1,546,646 | | | | 113,110 | | | | 1,150,332 | |
| | | | | | | | | | | | | | | | |
| | | | | | | 1,717,548 | | | | | | | | 1,529,436 | |
| | | | | | | | | | | | | | | | |
Payment for shares redeemed | | | | | | | | | | | | | | | | |
Class A | | | (2,936,473 | ) | | | (26,139,999 | ) | | | (3,325,878 | ) | | | (34,022,979 | ) |
Class C | | | (28,228 | ) | | | (262,767 | ) | | | (65,567 | ) | | | (645,367 | ) |
Administrator Class | | | (431,253 | ) | | | (4,056,574 | ) | | | (1,237,316 | ) | | | (12,490,820 | ) |
Institutional Class | | | (376 | ) | | | (3,637 | ) | | | 0 | | | | 0 | |
Investor Class | | | (2,481,970 | ) | | | (23,193,966 | ) | | | (9,260,588 | ) | | | (92,928,842 | ) |
| | | | | | | | | | | | | | | | |
| | | | | | | (53,656,943 | ) | | | | | | | (140,088,008 | ) |
| | | | | | | | | | | | | | | | |
Net decrease in net assets resulting from capital share transactions | | | | | | | (38,044,579 | ) | | | | | | | (80,352,837 | ) |
| | | | | | | | | | | | | | | | |
Total decrease in net assets | | | | | | | (26,669,498 | ) | | | | | | | (101,347,046 | ) |
| | | | | | | | | | | | | | | | |
| | | | |
Net assets | | | | | | | | | | | | | | | | |
Beginning of period | | | | | | | 216,137,994 | | | | | | | | 317,485,040 | |
| | | | | | | | | | | | | | | | |
End of period | | | | | | $ | 189,468,496 | | | | | | | $ | 216,137,994 | |
| | | | | | | | | | | | | | | | |
Undistributed net investment income | | | | | | $ | 587,778 | | | | | | | $ | 1,748,502 | |
| | | | | | | | | | | | | | | | |
The accompanying notes are an integral part of these financial statements.
| | | | | | |
| Financial Highlights | | Wells Fargo Advantage Asia Pacific Fund | | | 15 | |
(For a share outstanding throughout each period)
| | | | | | | | | | | | | | | | | | | | | | | | | | | | |
| | | Six Months Ended
April 30, 2012 (Unaudited) | | | Year Ended October 31, | | | Year Ended September 30, | |
| Class A | | | 2011 | | | 20101 | | | 2010 | | | 2009 | | | 2008 | | | 20072 | |
Net asset value, beginning of period | | $ | 9.30 | | | $ | 10.15 | | | $ | 9.77 | | | $ | 8.82 | | | $ | 8.14 | | | $ | 15.83 | | | $ | 14.75 | |
Net investment income (loss) | | | 0.02 | 3 | | | 0.08 | 3 | | | (0.01 | )3 | | | 0.04 | 3 | | | 0.11 | 3 | | | 0.09 | 3 | | | 0.01 | |
Net realized and unrealized gains (losses) on investments | | | 0.76 | | | | (0.89 | ) | | | 0.39 | | | | 1.05 | | | | 0.59 | | | | (5.20 | ) | | | 1.07 | |
| | | | | | | | | | | | | | | | | | | | | | | | | | | | |
Total from investment operations | | | 0.78 | | | | (0.81 | ) | | | 0.38 | | | | 1.09 | | | | 0.70 | | | | (5.11 | ) | | | 1.08 | |
Distributions to shareholders from | | | | | | | | | | | | | | | | | | | | | | | | | | | | |
Net investment income | | | 0.00 | | | | (0.04 | ) | | | 0.00 | | | | (0.14 | ) | | | (0.02 | ) | | | 0.00 | | | | 0.00 | |
Net realized gains | | | 0.00 | | | | 0.00 | | | | 0.00 | | | | 0.00 | | | | 0.00 | | | | (2.58 | ) | | | 0.00 | |
| | | | | | | | | | | | | | | | | | | | | | | | | | | | |
Total distributions to shareholders | | | 0.00 | | | | (0.04 | ) | | | 0.00 | | | | (0.14 | ) | | | (0.02 | ) | | | (2.58 | ) | | | 0.00 | |
Net asset value, end of period | | $ | 10.08 | | | $ | 9.30 | | | $ | 10.15 | | | $ | 9.77 | | | $ | 8.82 | | | $ | 8.14 | | | $ | 15.83 | |
Total return4 | | | 8.39 | % | | | (7.97 | )% | | | 3.89 | % | | | 12.58 | % | | | 8.64 | % | | | (38.53 | )% | | | 7.32 | % |
Ratios to average net assets (annualized) | | | | | | | | | | | | | | | | | | | | | | | | | | | | |
Gross expenses | | | 1.84 | % | | | 1.73 | % | | | 1.90 | % | | | 1.90 | % | | | 2.03 | % | | | 1.99 | % | | | 1.91 | % |
Net expenses | | | 1.60 | % | | | 1.60 | % | | | 1.60 | % | | | 1.59 | % | | | 1.60 | % | | | 1.60 | % | | | 1.50 | % |
Net investment income (loss) | | | 0.38 | % | | | 0.83 | % | | | (0.91 | )% | | | 0.49 | % | | | 1.56 | % | | | 0.77 | % | | | 0.93 | % |
Supplemental data | | | | | | | | | | | | | | | | | | | | | | | | | | | | |
Portfolio turnover rate | | | 91 | % | | | 196 | % | | | 11 | % | | | 137 | % | | | 185 | % | | | 187 | % | | | 184 | % |
Net assets, end of period (000’s omitted) | | | $6,571 | | | | $31,000 | | | | $63,741 | | | | $62,700 | | | | $85,156 | | | | $43,946 | | | | $431 | |
| 1. | For the one month ended October 31, 2010. The Fund changed it fiscal year end from September 30 to October 31, effective October 31, 2010. |
| 2. | For the period from July 31, 2007 (commencement of class operations) to September 30, 2007 |
| 3. | Calculated based upon average shares outstanding |
| 4. | Total return calculations do not include any sales charges. Returns for periods of less than one year are not annualized. |
The accompanying notes are an integral part of these financial statements.
| | | | |
| 16 | | Wells Fargo Advantage Asia Pacific Fund | | Financial Highlights |
(For a share outstanding throughout each period)
| | | | | | | | | | | | | | | | | | | | | | | | | | | | |
| | | Six Months Ended
April 30, 2012 (Unaudited) | | | Year Ended October 31, | | | Year Ended September 30, | |
| Class C | | | 2011 | | | 20101 | | | 2010 | | | 2009 | | | 2008 | | | 20072 | |
Net asset value, beginning of period | | $ | 8.98 | | | $ | 9.96 | | | $ | 9.59 | | | $ | 8.67 | | | $ | 8.05 | | | $ | 15.81 | | | $ | 14.75 | |
Net investment income (loss) | | | 0.01 | 3 | | | 0.01 | | | | (0.01 | )3 | | | (0.01 | )3 | | | 0.05 | 3 | | | 0.04 | 3 | | | 0.00 | 4 |
Net realized and unrealized gains (losses) on investments | | | 0.70 | | | | (0.86 | ) | | | 0.38 | | | | 1.03 | | | | 0.57 | | | | (5.22 | ) | | | 1.06 | |
| | | | | | | | | | | | | | | | | | | | | | | | | | | | |
Total from investment operations | | | 0.71 | | | | (0.85 | ) | | | 0.37 | | | | 1.02 | | | | 0.62 | | | | (5.18 | ) | | | 1.06 | |
Distributions to shareholders from | | | | | | | | | | | | | | | | | | | | | | | | | | | | |
Net investment income | | | (0.03 | ) | | | (0.13 | ) | | | 0.00 | | | | (0.10 | ) | | | 0.00 | | | | 0.00 | | | | 0.00 | |
Net realized gains | | | 0.00 | | | | 0.00 | | | | 0.00 | | | | 0.00 | | | | 0.00 | | | | (2.58 | ) | | | 0.00 | |
| | | | | | | | | | | | | | | | | | | | | | | | | | | | |
Total distributions to shareholders | | | (0.03 | ) | | | (0.13 | ) | | | 0.00 | | | | (0.10 | ) | | | 0.00 | | | | (2.58 | ) | | | 0.00 | |
Net asset value, end of period | | $ | 9.66 | | | $ | 8.98 | | | $ | 9.96 | | | $ | 9.59 | | | $ | 8.67 | | | $ | 8.05 | | | $ | 15.81 | |
Total return5 | | | 7.99 | % | | | (8.67 | )% | | | 3.86 | % | | | 11.84 | % | | | 7.70 | % | | | (39.10 | )% | | | 7.19 | % |
Ratios to average net assets (annualized) | | | | | | | | | | | | | | | | | | | | | | | | | | | | |
Gross expenses | | | 2.60 | % | | | 2.48 | % | | | 2.65 | % | | | 2.65 | % | | | 2.79 | % | | | 2.71 | % | | | 2.64 | % |
Net expenses | | | 2.35 | % | | | 2.35 | % | | | 2.35 | % | | | 2.34 | % | | | 2.35 | % | | | 2.35 | % | | | 2.25 | % |
Net investment income (loss) | | | 0.31 | % | | | 0.18 | % | | | (1.66 | )% | | | (0.13 | )% | | | 0.73 | % | | | 0.36 | % | | | 0.08 | % |
Supplemental data | | | | | | | | | | | | | | | | | | | | | | | | | | | | |
Portfolio turnover rate | | | 91 | % | | | 196 | % | | | 11 | % | | | 137 | % | | | 185 | % | | | 187 | % | | | 184 | % |
Net assets, end of period (000’s omitted) | | | $1,778 | | | | $1,274 | | | | $1,507 | | | | $1,450 | | | | $1,112 | | | | $939 | | | | $44 | |
| 1. | For the one month ended October 31, 2010. The Fund changed its fiscal year end from September 30 to October 31, effective October 31, 2010. |
| 2. | For the period from July 31, 2007 (commencement of class operations) to September 30, 2007 |
| 3. | Calculated based upon average shares outstanding |
| 4. | Amount is less than $0.005. |
| 5. | Total return calculations do not include any sales charges. Returns for periods of less than one year are not annualized. |
The accompanying notes are an integral part of these financial statements.
| | | | | | |
| Financial Highlights | | Wells Fargo Advantage Asia Pacific Fund | | | 17 | |
(For a share outstanding throughout each period)
| | | | | | | | | | | | | | | | |
| | | Six Months Ended
April 30, 2012 (Unaudited) | | | Year Ended October 31, | | | Year Ended
September 30, 20102 | |
| Administrator Class | | | 2011 | | | 20101 | | |
Net asset value, beginning of period | | $ | 9.29 | | | $ | 10.15 | | | $ | 9.77 | | | $ | 8.84 | |
Net investment income (loss) | | | 0.09 | | | | 0.12 | 3 | | | (0.00 | )3 | | | 0.03 | 3 |
Net realized and unrealized gains (losses) on investments | | | 0.67 | | | | (0.89 | ) | | | 0.38 | | | | 0.90 | |
| | | | | | | | | | | | | | | | |
Total from investment operations | | | 0.76 | | | | (0.77 | ) | | | 0.38 | | | | 0.93 | |
Distributions to shareholders from | | | | | | | | | | | | | | | | |
Net investment income | | | (0.13 | ) | | | (0.09 | ) | | | 0.00 | | | | 0.00 | |
Net asset value, end of period | | $ | 9.92 | | | $ | 9.29 | | | $ | 10.15 | | | $ | 9.77 | |
Total return4 | | | 8.35 | % | | | (7.68 | )% | | | 3.89 | % | | | 10.52 | % |
Ratios to average net assets (annualized) | | | | | | | | | | | | | | | | |
Gross expenses | | | 1.64 | % | | | 1.52 | % | | | 1.74 | % | | | 1.80 | % |
Net expenses | | | 1.40 | % | | | 1.39 | % | | | 1.40 | % | | | 1.40 | % |
Net investment income (loss) | | | 1.04 | % | | | 1.14 | % | | | (0.70 | )% | | | 1.98 | % |
Supplemental data | | | | | | | | | | | | | | | | |
Portfolio turnover rate | | | 91 | % | | | 196 | % | | | 11 | % | | | 137 | % |
Net assets, end of period (000’s omitted) | | | $14,865 | | | | $13,959 | | | | $11 | | | | $11 | |
| 1. | For the one month ended October 31, 2010. The Fund changed its fiscal year end from September 30 to October 31, effective October 31, 2010. |
| 2. | For the period from July 30, 2010 (commencement of class operations) to September 30, 2010 |
| 3. | Calculated based upon average shares outstanding |
| 4. | Returns for periods of less than one year are not annualized. |
The accompanying notes are an integral part of these financial statements.
| | | | |
| 18 | | Wells Fargo Advantage Asia Pacific Fund | | Financial Highlights |
(For a share outstanding throughout each period)
| | | | | | | | | | | | | | | | |
| | | Six Months Ended
April 30, 2012 (Unaudited) | | | Year Ended October 31, | | | Year Ended
September 30, 20102 | |
| Institutional Class | | | 2011 | | | 20101 | | |
Net asset value, beginning of period | | $ | 9.30 | | | $ | 10.15 | | | $ | 9.77 | | | $ | 8.84 | |
Net investment income (loss) | | | 0.09 | | | | 0.13 | | | | (0.01 | )3 | | | 0.03 | 3 |
Net realized and unrealized gains (losses) on investments | | | 0.67 | | | | (0.89 | ) | | | 0.39 | | | | 0.90 | |
| | | | | | | | | | | | | | | | |
Total from investment operations | | | 0.76 | | | | (0.76 | ) | | | 0.38 | | | | 0.93 | |
Distributions to shareholders from | | | | | | | | | | | | | | | | |
Net investment income | | | (0.14 | ) | | | (0.09 | ) | | | 0.00 | | | | 0.00 | |
Net asset value, end of period | | $ | 9.92 | | | $ | 9.30 | | | $ | 10.15 | | | $ | 9.77 | |
Total return4 | | | 8.48 | % | | | (7.55 | )% | | | 3.89 | % | | | 10.52 | % |
Ratios to average net assets (annualized) | | | | | | | | | | | | | | | | |
Gross expenses | | | 1.39 | % | | | 1.29 | % | | | 1.47 | % | | | 1.47 | % |
Net expenses | | | 1.25 | % | | | 1.24 | % | | | 1.25 | % | | | 1.25 | % |
Net investment income (loss) | | | 1.18 | % | | | 1.30 | % | | | (0.57 | )% | | | 2.11 | % |
Supplemental data | | | | | | | | | | | | | | | | |
Portfolio turnover rate | | | 91 | % | | | 196 | % | | | 11 | % | | | 137 | % |
Net assets, end of period (000’s omitted) | | | $12 | | | | $11 | | | | $11 | | | | $11 | |
| 1. | For the one month ended October 31, 2010. The Fund changed its fiscal year end from September 30 to October 31, effective October 31, 2010. |
| 2. | For the period from July 30, 2010 (commencement of class operations) to September 30, 2010 |
| 3. | Calculated based upon average shares outstanding |
| 4. | Returns for periods of less than one year are not annualized. |
The accompanying notes are an integral part of these financial statements.
| | | | | | |
| Financial Highlights | | Wells Fargo Advantage Asia Pacific Fund | | | 19 | |
(For a share outstanding throughout each period)
| | | | | | | | | | | | | | | | | | | | | | | | | | | | |
| | | Six Months Ended
April 30, 2012 (Unaudited) | | | Year Ended October 31, | | | Year Ended September 30, | |
| Investor Class | | | 2011 | | | 20101 | | | 2010 | | | 2009 | | | 2008 | | | 2007 | |
Net asset value, beginning of period | | $ | 9.28 | | | $ | 10.14 | | | $ | 9.76 | | | $ | 8.81 | | | $ | 8.12 | | | $ | 15.82 | | | $ | 12.56 | |
Net investment income (loss) | | | 0.04 | 2 | | | 0.08 | 2 | | | (0.01 | )2 | | | 0.04 | 2 | | | 0.09 | 2 | | | 0.06 | 2 | | | 0.05 | |
Net realized and unrealized gains (losses) on investments | | | 0.72 | | | | (0.88 | ) | | | 0.39 | | | | 1.05 | | | | 0.60 | | | | (5.18 | ) | | | 4.97 | |
| | | | | | | | | | | | | | | | | | | | | | | | | | | | |
Total from investment operations | | | 0.76 | | | | (0.80 | ) | | | 0.38 | | | | 1.09 | | | | 0.69 | | | | (5.12 | ) | | | 5.02 | |
Distributions to shareholders from | | | | | | | | | | | | | | | | | | | | | | | | | | | | |
Net investment income | | | (0.10 | ) | | | (0.06 | ) | | | 0.00 | | | | (0.14 | ) | | | (0.00 | )3 | | | 0.00 | | | | (0.03 | ) |
Net realized gains | | | 0.00 | | | | 0.00 | | | | 0.00 | | | | 0.00 | | | | 0.00 | | | | (2.58 | ) | | | (1.73 | ) |
| | | | | | | | | | | | | | | | | | | | | | | | | | | | |
Total distributions to shareholders | | | (0.10 | ) | | | (0.06 | ) | | | 0.00 | | | | (0.14 | ) | | | (0.00 | )3 | | | (2.58 | ) | | | (1.76 | ) |
Net asset value, end of period | | $ | 9.94 | | | $ | 9.28 | | | $ | 10.14 | | | $ | 9.76 | | | $ | 8.81 | | | $ | 8.12 | | | $ | 15.82 | |
Total return4 | | | 8.31 | % | | | (7.97 | )% | | | 3.89 | % | | | 12.51 | % | | | 8.53 | % | | | (38.63 | )% | | | 44.31 | % |
Ratios to average net assets (annualized) | | | | | | | | | | | | | | | | | | | | | | | | | | | | |
Gross expenses | | | 1.92 | % | | | 1.80 | % | | | 1.97 | % | | | 1.99 | % | | | 2.14 | % | | | 2.01 | % | | | 1.95 | % |
Net expenses | | | 1.65 | % | | | 1.65 | % | | | 1.65 | % | | | 1.64 | % | | | 1.65 | % | | | 1.65 | % | | | 1.65 | % |
Net investment income (loss) | | | 0.79 | % | | | 0.82 | % | | | (0.96 | )% | | | 0.41 | % | | | 1.36 | % | | | 0.52 | % | | | 0.34 | % |
Supplemental data | | | | | | | | | | | | | | | | | | | | | | | | | | | | |
Portfolio turnover rate | | | 91 | % | | | 196 | % | | | 11 | % | | | 137 | % | | | 185 | % | | | 187 | % | | | 184 | % |
Net assets, end of period (000’s omitted) | | | $166,243 | | | | $169,895 | | | | $252,214 | | | | $241,892 | | | | $278,741 | | | | $326,929 | | | | $583,810 | |
| 1. | For the one month ended October 31, 2010. The Fund changed it fiscal year end from September 30 to October 31, effective October 31, 2010. |
| 2. | Calculated based upon average shares outstanding |
| 3. | Amount is less than $0.005. |
| 4. | Returns for periods of less than one year are not annualized. |
The accompanying notes are an integral part of these financial statements.
| | | | |
| 20 | | Wells Fargo Advantage Asia Pacific Fund | | Notes to Financial Statements (Unaudited) |
1. ORGANIZATION
Wells Fargo Funds Trust (the “Trust”), a Delaware statutory trust organized on March 10, 1999, is an open-end management investment company registered under the Investment Company Act of 1940, as amended (the “1940 Act”). These financial statements report on Wells Fargo Advantage Asia Pacific Fund (the “Fund”) which is a diversified series of the Trust.
2. SIGNIFICANT ACCOUNTING POLICIES
The following significant accounting policies, which are consistently followed in the preparation of the financial statements of the Fund, are in conformity with U.S. generally accepted accounting principles which require management to make estimates and assumptions that affect the reported amounts of assets and liabilities, disclosure of contingent assets and liabilities at the date of the financial statements, and the reported amounts of revenues and expenses during the reporting period. Actual results could differ from those estimates.
Securities valuation
Investments in equity securities are valued each business day as of the close of regular trading on the New York Stock Exchange, which is usually 4:00 p.m. (Eastern Time). Securities which are traded on a national or foreign securities exchange are valued at the last reported sales price, except that securities listed on The Nasdaq Stock Market, Inc. (“Nasdaq”) are valued at the Nasdaq Official Closing Price (“NOCP”), and if no NOCP is available, then at the last reported sales price. If no sales price is shown on the Nasdaq, the bid price will be used. In the absence of any sale of securities listed on the Nasdaq, and in the case of other securities (including U.S. Government obligations, but excluding debt securities maturing in 60 days or less), the price will be deemed “stale” and the valuations will be determined in accordance with the Fund’s Fair Value Procedures.
Securities denominated in foreign currencies are translated into U.S. dollars using the closing rates of exchange in effect on the day of valuation.
Many securities markets and exchanges outside the U.S. close prior to the close of the New York Stock Exchange and therefore may not fully reflect trading or events that occur after the close of the principal exchange in which the foreign securities are traded, but before the close of the New York Stock Exchange. If such trading or events are expected to materially affect the value of securities, then fair value pricing procedures approved by the Board of Trustees are applied. These procedures take into account multiple factors including movements in U.S. securities markets after foreign exchanges close. As a result of the fair value pricing procedures, these securities which are normally categorized as Level 1 in the fair value hierarchy will represent a transfer from a Level 1 to a Level 2 security and will be categorized as Level 2. Depending on market activity, such fair valuations may be frequent. Such fair value pricing may result in NAVs that are higher or lower than NAVs based on the closing price or latest quoted bid price. On April 30, 2012, fair value pricing was not used in pricing foreign securities.
Investments in open-end mutual funds and non-registered investment companies are generally valued at net asset value.
Investments which are not valued using any of the methods discussed above, are valued at their fair value, as determined by procedures established in good faith and approved by the Board of Trustees. The Board of Trustees has established a Valuation Committee comprised of the Trustees and has delegated to it the authority to take any actions regarding the valuation of portfolio securities that the Valuation Committee deems necessary in determining the fair value of portfolio securities, unless the responsibility has been delegated to the Management Valuation Team of Wells Fargo Funds Management, LLC (“Funds Management”). The Board of Trustees retains the authority to make or ratify any valuation decisions or approve any changes to the Fair Value Procedures as it deems appropriate. On a quarterly basis, the Board of Trustees considers for ratification any valuation actions taken by the Valuation Committee or the Management Valuation Team.
Valuations of fair valued prices are compared to the next actual sales price when available, or other appropriate market information to assess the continued appropriateness of the fair valuation methodology used. The securities are fair valued on a day-to-day basis, taking into consideration changes to appropriate market information and any significant changes to the input factors considered in the valuation process until there is a readily available price provided on the exchange or by an independent pricing service. Valuations received from an independent pricing service or broker quotes are periodically validated by comparisons to most recent trades and valuations provided by other independent
| | | | | | |
| Notes to Financial Statements (Unaudited) | | Wells Fargo Advantage Asia Pacific Fund | | | 21 | |
pricing services in addition to the review of prices by the adviser and/or sub-adviser. Unobservable inputs used in determining fair valuations are identified based on the type of security, taking into consideration factors utilized by market participants in valuing the investment, knowledge about the issuer and the current market environment.
Foreign currency translation
The accounting records of the Fund are maintained in U.S. dollars. Assets, including investment securities, and liabilities denominated in foreign currency are translated into U.S. dollars at the prevailing rates of exchange at the date of valuation. Purchases and sales of securities, and income and expenses are translated at the prevailing rate of exchange on the respective dates of such transactions. Reported net realized foreign exchange gains or losses arise from sales of foreign currencies, currency gains or losses realized between the trade and settlement dates on securities transactions, and the difference between the amounts of dividends, interest and foreign withholding taxes recorded and the U.S. dollar equivalent of the amounts actually paid or received. Net unrealized foreign exchange gains and losses arise from changes in the fair value of assets and liabilities other than investments in securities resulting in changes in exchange rates.
The changes in net assets arising from changes in exchange rates and the changes in net assets resulting from changes in market prices of securities are not separately presented. Such changes are recorded with net realized and unrealized gains or losses from investments. Gains and losses from certain foreign currency transactions are treated as ordinary income for U.S. federal income tax purposes.
Security loans
The Fund may lend its securities from time to time in order to earn additional income in the form of fees or interest on securities received as collateral or the investment of any cash received as collateral. The Fund continues to receive interest or dividends on the securities loaned. The Fund receives collateral in the form of cash or securities with a value at least equal to the value of the securities on loan. The value of the loaned securities is determined at the close of each business day and any additional required collateral is delivered to the Fund on the next business day. In a securities lending transaction, the net asset value of the Fund will be affected by an increase or decrease in the value of the securities loaned and by an increase or decrease in the value of the instrument in which collateral is invested. The amount of securities lending activity undertaken by the Fund fluctuates from time to time. In the event of default or bankruptcy by the borrower, the Fund may be prevented from recovering the loaned securities or gaining access to the collateral or may experience delays or costs in doing so. In addition, the investment of any cash collateral received may lose all or part of its value. The Fund has the right under the lending agreement to recover the securities from the borrower on demand.
The Fund lends its securities through an unaffiliated securities lending agent. Cash collateral received in connection with its securities lending transactions is invested in Wells Fargo Securities Lending Cash Investments, LLC (the “Cash Collateral Fund”). The Cash Collateral Fund is exempt from registration under Section 3(c)(7) of the 1940 Act and is managed by Funds Management and is sub-advised by Wells Capital Management Incorporated (“Wells Capital Management”). Funds Management receives an advisory fee starting at 0.05% and declining to 0.01% as the average daily net assets of the Cash Collateral Fund increase. All of the fees received by Funds Management are paid to Wells Capital Management for its services as sub-adviser. The Cash Collateral Fund seeks to provide a positive return compared to the daily Fed Funds Open rate by investing in high-quality, U.S. dollar-denominated short-term money market instruments. Cash Collateral Fund investments are fair valued based upon the amortized cost valuation technique. Income earned from investment in the Cash Collateral Fund is included in securities lending income on the Statement of Operations.
Security transactions and income recognition
Securities transactions are recorded on a trade date basis. Realized gains or losses are reported on the basis of identified cost of securities delivered.
Dividend income is recognized on the ex-dividend date, except for certain dividends from foreign securities, which are recorded as soon as the Fund is informed of the ex-dividend date. Dividend income from foreign securities is recorded net of foreign taxes withheld where recovery of such taxes is not assured.
Distributions to shareholders
Distributions to shareholders from net investment income and net realized gains, if any, are recorded on the ex-dividend date. Such distributions are determined in conformity with income tax regulations, which may differ from generally accepted accounting principles.
| | | | |
| 22 | | Wells Fargo Advantage Asia Pacific Fund | | Notes to Financial Statements (Unaudited) |
Federal and other taxes
The Fund intends to continue to qualify as a regulated investment company by distributing substantially all of its investment company taxable income and any net realized capital gains (after reduction for capital loss carryforwards) sufficient to relieve it from all, or substantially all, federal income taxes. Accordingly, no provision for federal income taxes was required.
The Fund’s income and federal excise tax returns and all financial records supporting those returns for the prior three fiscal years are subject to examination by the federal and Delaware revenue authorities. Management has analyzed the Fund’s tax positions taken on federal, state, and foreign tax returns for all open tax years and does not believe that there are any uncertain tax positions that require recognition of a tax liability.
Under the recently enacted Regulated Investment Company Modernization Act of 2010, the Fund is permitted to carry forward capital losses incurred in taxable years which began after December 22, 2010 for an unlimited period. However, any losses incurred are required to be utilized prior to the losses incurred in pre-enactment taxable years. As a result of this ordering rule, pre-enactment capital loss carryforwards may be more likely to expire unused. Post-enactment capital losses that are carried forward will retain their character as either short-term or long-term capital losses rather than be considered all short-term as under previous law. In addition, the Fund may elect to defer any portion of a post-October capital loss or qualified late-year ordinary loss to the first day of the following taxable year. A post-October capital loss is the greatest of the net capital loss, net short-term capital loss or net long-term capital loss for the portion of the taxable year after October 31. A qualified late-year ordinary loss is the net loss comprised of (a) net gain or loss from the sale or other disposition of capital assets for the portion of the taxable year after October 31, and (b) other ordinary income or loss for the portion of the taxable year after December 31.
As of October 31, 2011, the Fund had estimated net capital loss carry forwards, which were available to offset future net realized capital gains, in the amount of $140,041,635 with $59,224,431 expiring in 2016 and $80,817,204 expiring 2017.
Class allocations
The separate classes of shares offered by the Fund differ principally in applicable sales charges, distribution, shareholder servicing and administration fees. Shareholders of each class bear certain expenses that pertain to that particular class. All shareholders bear the common expenses of the Fund, earn income from the portfolio, and are allocated unrealized gains and losses pro rata based on the average daily net assets of each class, without distinction between share classes. Dividends are determined separately for each class based on income and expenses allocable to each class. Realized gains and losses are allocated to each class pro rata based upon the net assets of each class on the date realized. Differences in per share dividend rates generally result from the relative weightings of pro rata income and realized gain allocations and from differences in separate class expenses, including distribution, shareholder servicing and administration fees.
3. FAIR VALUATION MEASUREMENTS
Fair value measurements of investments are determined within a framework that has established a fair value hierarchy based upon the various data inputs utilized in determining the value of the Fund’s investments. The three-level hierarchy gives the highest priority to unadjusted quoted prices in active markets for identical assets or liabilities (Level 1) and the lowest priority to significant unobservable inputs (Level 3). The Fund’s investments are classified within the fair value hierarchy based on the lowest level of input that is significant to the fair value measurement. The inputs are summarized into three broad levels as follows:
| n | | Level 1 – quoted prices in active markets for identical securities |
| n | | Level 2 – other significant observable inputs (including quoted prices for similar securities, interest rates, prepayment speeds, credit risk, etc.) |
| n | | Level 3 – significant unobservable inputs (including the Fund’s own assumptions in determining the fair value of investments) |
The inputs or methodologies used for valuing securities are not necessarily an indication of the risk associated with investing in those securities.
| | | | | | |
| Notes to Financial Statements (Unaudited) | | Wells Fargo Advantage Asia Pacific Fund | | | 23 | |
As of April 30, 2012, the inputs used in valuing the Fund’s assets, which are carried at fair value, were as follows:
| | | | | | | | | | | | | | | | |
| Investments in Securities | | Quoted Prices (Level 1) | | | Significant Other
Observable Inputs (Level 2) | | | Significant Unobservable Inputs (Level 3) | | | Total | |
Equity securities | | | | | | | | | | | | | | | | |
Common stocks | | $ | 173,661,430 | | | $ | 0 | | | $ | 0 | | | $ | 173,661,430 | |
Investment companies | | | 5,145,903 | | | | 0 | | | | 0 | | | | 5,145,903 | |
Warrants | | | 0 | | | | 705,446 | | | | 0 | | | | 705,446 | |
Short-term investments | | | | | | | | | | | | | | | | |
Investment companies | | | 5,964,885 | | | | 11,587,323 | | | | 0 | | | | 17,552,208 | |
| | | $ | 184,772,218 | | | $ | 12,292,769 | | | $ | 0 | | | $ | 197,064,987 | |
Further details on the major security types listed above can be found in the Portfolio of Investments.
Transfers in and transfers out are recognized at the end of the reporting period. For the six months ended April 30, 2012, the Fund did not have any significant transfers into/out of Level 1 and Level 2.
4. TRANSACTIONS WITH AFFILIATES AND OTHER EXPENSES
Advisory fee
The Trust has entered into an advisory contract with Funds Management, an indirect wholly owned subsidiary of Wells Fargo & Company (“Wells Fargo”). The adviser is responsible for implementing investment policies and guidelines and for supervising the sub-adviser, who is responsible for day-to-day portfolio management of the Fund.
Pursuant to the contract, Funds Management is entitled to receive an annual advisory fee starting at 1.10% and declining to 0.95% as the average daily net assets of the Fund increase. For the six months ended April 30, 2012, the advisory fee was equivalent to an annual rate of 1.10% of the Fund’s average daily net assets.
Funds Management has retained the services of certain sub-advisers to provide daily portfolio management to the Fund. The fees related to sub-advisory services are borne directly by Funds Management and do not increase the overall fees paid by the Fund. Wells Capital Management, an affiliate of Funds Management, is the sub-adviser to the Fund and is entitled to receive a fee from Funds Management at an annual rate starting at 0.65% and declining to 0.45% as the average daily net assets of the Fund increase.
Administration and transfer agent fees
The Trust has entered into an administration agreement with Funds Management. Under this agreement, for providing administrative services, which includes paying fees and expenses for services provided by the transfer agent, sub-transfer agents, omnibus account servicers and record-keepers, Funds Management is entitled to receive from the Fund an annual fund level administration fee starting at 0.05% and declining to 0.03% as the average daily net assets of the Fund increase and a class level administration fee which is calculated based on the average daily net assets of each class as follows:
| | | | |
| | | Class Level Administration Fee | |
Class A, Class C | | | 0.26 | % |
Administrator Class | | | 0.10 | |
Institutional Class | | | 0.08 | |
Investor Class | | | 0.33 | |
Funds Management has contractually waived and/or reimbursed advisory and administration fees to the extent necessary to maintain certain net operating expense ratios for the Fund. Waiver of fees and/or reimbursement of expenses by Funds Management were made first from fund level expenses on a proportionate basis and then from class specific expenses. Funds Management has committed through February 28, 2013, to waive fees and/or reimburse expenses to the extent necessary to cap the Fund’s expenses at 1.60% for Class A, 2.35% for Class C, 1.40% for Administrator Class, 1.25% for Institutional Class and 1.65% for Investor Class.
| | | | |
| 24 | | Wells Fargo Advantage Asia Pacific Fund | | Notes to Financial Statements (Unaudited) |
Distribution fees
The Trust has adopted a Distribution Plan for Class C shares of the Fund pursuant to Rule 12b-1 under the 1940 Act. Distribution fees are charged to Class C shares and paid to Wells Fargo Funds Distributor, LLC, the principal underwriter, at an annual rate of 0.75% of the average daily net assets of Class C shares.
For the six months ended April 30, 2012, Wells Fargo Funds Distributor, LLC received $1,177 from the sale of Class A shares and $9,971 and $14 in contingent deferred sales charges from redemptions of Class A and Class C shares, respectively.
Shareholder servicing fees
The Trust has entered into contracts with one or more shareholder servicing agents, whereby Class A, Class C, Administrator Class and Investor Class of the Fund is charged a fee at an annual rate of 0.25% of the average daily net assets of each respective class.
A portion of these total shareholder servicing fees were paid to affiliates of Wells Fargo.
5. INVESTMENT PORTFOLIO TRANSACTIONS
Purchases and sales of investments, excluding U.S. Government obligations (if any) and short-term securities, for the six months ended April 30, 2012 were $168,532,469 and $204,659,475, respectively.
6. BANK BORROWINGS
The Trust (excluding the money market funds) and Wells Fargo Variable Trust are parties to a $150,000,000 revolving credit agreement with State Street Bank and Trust Company, whereby the Fund is permitted to use bank borrowings for temporary or emergency purposes, such as to fund shareholder redemption requests. Interest under the credit agreement is charged to the Fund based on a borrowing rate equal to the higher of the Federal Funds rate in effect on that day plus 1.25% or the overnight LIBOR rate in effect on that day plus 1.25%. In addition, an annual commitment fee equal to 0.10% of the unused balance is allocated to each participating fund. For the six months ended April 30, 2012, the Fund paid $222 in commitment fees.
During the six months ended April 30, 2012, the Fund had average borrowings outstanding of $87,394 at a rate of 1.41% and paid interest in the amount of $1,232.
7. INDEMNIFICATION
Under the Trust’s organizational documents, the officers and directors are indemnified against certain liabilities that may arise out of performance of their duties to the Trust. Additionally, in the normal course of business, the Trust may enter into contracts with service providers that contain a variety of indemnification clauses. The Trust’s maximum exposure under these arrangements is dependent on future claims that may be made against the Fund and, therefore, cannot be estimated.
8. NEW ACCOUNTING PRONOUNCEMENTS
In December 2011, the Financial Accounting Standards Board (“FASB”) issued Accounting Standard Update (“ASU”) No. 2011-11, Disclosures about Offsetting Assets and Liabilities. ASU 2011-11, which amends FASB ASC Topic 210, Balance Sheet, creates new disclosure requirements which require entities to disclose both gross and net information for derivatives and other financial instruments that are either offset in the Statement of Assets and Liabilities or subject to an enforceable master netting arrangement or similar agreement. The disclosure requirements are effective for interim and annual reporting periods beginning on or after January 1, 2013. Management is currently assessing the potential impact, in addition to expanded financial statement disclosure, that may result from adopting this ASU.
In May 2011, FASB issued ASU No. 2011-04 Amendments to Achieve Common Fair Value Measurement and Disclosure Requirements in U.S. GAAP and IFRSs. ASU No. 2011-04 amends FASB ASC Topic 820, Fair Value Measurements, to establish common requirements for measuring fair value and for disclosing information about fair value measurements in accordance with GAAP. The ASU is effective prospectively for interim and annual periods beginning after December 15, 2011. Management expects that adoption of the ASU will result in additional disclosures in the financial statements, as applicable.
| | | | | | |
| Notes to Financial Statements (Unaudited) | | Wells Fargo Advantage Asia Pacific Fund | | | 25 | |
In April 2011, FASB issued ASU No. 2011-03 Reconsideration of Effective Control for Repurchase Agreements. ASU No. 2011-03 amends FASB ASC Topic 860, Transfers and Servicing, specifically the criteria required to determine whether a repurchase agreement (repo) and similar agreements should be accounted for as sales of financial assets or secured borrowings with commitments. ASU No. 2011-03 changes the assessment of effective control by focusing on the transferor’s contractual rights and obligations and removing the criterion to assess its ability to exercise those rights or honor those obligations. This could result in changes to the way entities account for certain transactions including repurchase agreements, mortgage dollar rolls and reverse repurchase agreements. The ASU will become effective on a prospective basis for new transfers and modifications to existing transactions as of the beginning of the first interim or annual period beginning on or after December 15, 2011. Management has evaluated the impact of adopting the ASU and expects no significant changes.
| | | | |
| 26 | | Wells Fargo Advantage Asia Pacific Fund | | Other Information (Unaudited) |
PROXY VOTING INFORMATION
A description of the policies and procedures that the Fund uses to determine how to vote proxies relating to portfolio securities is available without charge, upon request, by calling 1-800-222-8222, visiting our Web site at wellsfargoadvantagefunds.com, or visiting the SEC Web site at sec.gov. Information regarding how the Fund voted proxies relating to portfolio securities during the most recent 12-month period ended June 30 is available without charge on the Fund’s Web site at wellsfargoadvantagefunds.com or by visiting the SEC Web site at sec.gov.
PORTFOLIO HOLDINGS INFORMATION
The complete portfolio holdings for the Fund are publicly available on the Fund’s Web site (wellsfargoadvantagefunds.com) on a monthly, 30-day or more delayed basis. In addition, top ten holdings information for the Fund is publicly available on the Fund’s Web site on a monthly, seven-day or more delayed basis. The Fund files its complete schedule of portfolio holdings with the SEC for the first and third quarters of each fiscal year on Form N-Q, which is available without charge by visiting the SEC Web site at sec.gov. In addition, the Fund’s Form N-Q may be reviewed and copied at the SEC’s Public Reference Room in Washington, DC, and at regional offices in New York City, at 233 Broadway, and in Chicago, at 175 West Jackson Boulevard, Suite 900. Information about the Public Reference Room may be obtained by calling 1-800-SEC-0330.
| | | | | | |
| Other Information (Unaudited) | | Wells Fargo Advantage Asia Pacific Fund | | | 27 | |
BOARD OF TRUSTEES
The following table provides basic information about the Board of Trustees (the “Trustees”) of the Trust and Officers of the Trust. This table should be read in conjunction with the Prospectus and the Statement of Additional Information1 of the Fund. Each of the Trustees and Officers listed below acts in identical capacities for the Wells Fargo Advantage family of funds, which consists of 137 funds comprising the Wells Fargo Funds Trust, Wells Fargo Variable Trust, Wells Fargo Master Trust and four closed-end funds (collectively the “Fund Complex”). All of the Trustees are also Members of the Audit and Governance Committees of each Trust in the Fund Complex. The mailing address of each Trustee and Officer is 525 Market Street, 12th Floor, San Francisco, CA 94105. Each Trustee and Officer serves an indefinite term, however, each Trustee serves such term until reaching the mandatory retirement age established by the Trustees.
Independent Trustees
| | | | | | |
Name and Year of Birth | | Position Held and Length of Service | | Principal Occupations During Past Five Years | | Other Directorships During
Past Five Years |
Peter G. Gordon
(Born 1942) | | Trustee, since 1998; Chairman, since 2005 (Lead Trustee since 2001) | | Co-Founder, Retired Chairman, President and CEO of Crystal Geyser Water Company. Trustee Emeritus, Colby College | | Asset Allocation Trust |
Isaiah Harris, Jr.
(Born 1952) | | Trustee, since 2009 | | Retired. Prior thereto, President and CEO of BellSouth Advertising and Publishing Corp. from 2005 to 2007, President and CEO of BellSouth Enterprises from 2004 to 2005 and President of BellSouth Consumer Services from 2000 to 2003. Emeritus member of the Iowa State University Foundation Board of Governors. Emeritus Member of the Advisory Board of Iowa State University School of Business. Mr. Harris is a certified public accountant. | | CIGNA Corporation; Deluxe Corporation; Asset Allocation Trust |
Judith M. Johnson
(Born 1949) | | Trustee, since 2008 | | Retired. Prior thereto, Chief Executive Officer and Chief Investment Officer of Minneapolis Employees Retirement Fund from 1996 to 2008. Ms. Johnson is an attorney, certified public accountant and a certified managerial accountant. | | Asset Allocation Trust |
Leroy Keith, Jr.
(Born 1939) | | Trustee, since 2010 | | Chairman, Bloc Global Services (development and construction). Trustee of the Evergreen Funds from 1983 to 2010. Former Managing Director, Almanac Capital Management (commodities firm), former Partner, Stonington Partners, Inc. (private equity fund), former Director, Obagi Medical Products Co. and former Director, Lincoln Educational Services. | | Trustee, Virtus Fund Complex (consisting of 40 portfolios as of 12/31/11); Asset Allocation Trust |
David F. Larcker
(Born 1950) | | Trustee, since 2009 | | James Irvin Miller Professor of Accounting at the Graduate School of Business, Stanford University, Director of Corporate Governance Research Program and Senior Faculty of The Rock Center for Corporate Governance since 2006. From 2005 to 2008, Professor of Accounting at the Graduate School of Business, Stanford University. Prior thereto, Ernst & Young Professor of Accounting at The Wharton School, University of Pennsylvania from 1985 to 2005. | | Asset Allocation Trust |
Olivia S. Mitchell
(Born 1953) | | Trustee, since 2006 | | International Foundation of Employee Benefit Plans Professor, Wharton School of the University of Pennsylvania since 1993. Director of Wharton’s Pension Research Council and Boettner Center on Pensions & Retirement Research, and Research Associate at the National Bureau of Economic Research. Previously, Cornell University Professor from 1978 to 1993. | | Asset Allocation Trust |
| | | | |
| 28 | | Wells Fargo Advantage Asia Pacific Fund | | Other Information (Unaudited) |
| | | | | | |
Name and Year of Birth | | Position Held and Length of Service | | Principal Occupations During Past Five Years | | Other Directorships During
Past Five Years |
Timothy J. Penny
(Born 1951) | | Trustee, since 1996 | | President and CEO of Southern Minnesota Initiative Foundation, a non-profit organization, since 2007 and Senior Fellow at the Humphrey Institute Policy Forum at the University of Minnesota since 1995. Member of the Board of Trustees of NorthStar Education Finance, Inc., a non-profit organization, since 2007. | | Asset Allocation Trust |
Michael S. Scofield
(Born 1943) | | Trustee, since 2010 | | Served on the Investment Company Institute’s Board of Governors and Executive Committee from 2008-2011 as well the Governing Council of the Independent Directors Council from 2006-2011 and the Independent Directors Council Executive Committee from 2008-2011. Chairman of the IDC from 2008-2010. Institutional Investor (Fund Directions) Trustee of Year in 2007. Trustee of the Evergreen Funds (and its predecessors) from 1984 to 2010. Chairman of the Evergreen Funds from 2000-2010. Former Trustee of the Mentor Funds. Retired Attorney, Law Offices of Michael S. Scofield and former Director and Chairman, Branded Media Corporation (multi-media branding company). | | Asset Allocation Trust |
Donald C. Willeke
(Born 1940) | | Trustee, since 1996 | | Principal of the law firm of Willeke & Daniels. General Counsel of the Minneapolis Employees Retirement Fund from 1984 until its consolidation into the Minnesota Public Employees Retirement Association on June 30, 2010. Director and Vice Chair of The Free Trust (non-profit corporation). Director of the American Chestnut Foundation (non-profit corporation). | | Asset Allocation Trust |
Officers
| | | | | | |
Name and Year of Birth | | Position Held and
Length of Service | | Principal Occupations During Past Five Years | | |
Karla M. Rabusch
(Born 1959) | | President, since 2003 | | Executive Vice President of Wells Fargo Bank, N.A. and President of Wells Fargo Funds Management, LLC since 2003. Senior Vice President and Chief Administrative Officer of Wells Fargo Funds Management, LLC from 2001 to 2003. | | |
C. David Messman
(Born 1960) | | Secretary, since 2000; Chief Legal Counsel, since 2003 | | Senior Vice President and Secretary of Wells Fargo Funds Management, LLC since 2001. Vice President and Managing Senior Counsel of Wells Fargo Bank, N.A. since 1996. | | |
Kasey Phillips
(Born 1970) | | Treasurer, since 2009 | | Senior Vice President of Wells Fargo Funds Management, LLC since 2009. Senior Vice President of Evergreen Investment Management Company, LLC from 2006 to 2010. Treasurer of the Evergreen Funds from 2005 to 2010. | | |
David Berardi
(Born 1975) | | Assistant Treasurer, since 2009 | | Vice President of Wells Fargo Funds Management, LLC since 2009. Vice President of Evergreen Investment Management Company, LLC from 2008 to 2010. Assistant Vice President of Evergreen Investment Services, Inc. from 2004 to 2008. Manager of Fund Reporting and Control for Evergreen Investment Management Company, LLC from 2004 to 2010. | | |
Jeremy DePalma
(Born 1974) | | Assistant Treasurer, since 2009 | | Senior Vice President of Wells Fargo Funds Management, LLC since 2009. Senior Vice President of Evergreen Investment Management Company, LLC from 2008 to 2010. Vice President, Evergreen Investment Services, Inc. from 2004 to 2007. Head of the Fund Reporting and Control Team within Fund Administration from 2005 to 2010. | | |
Debra Ann Early
(Born 1964) | | Chief Compliance Officer, since 2007 | | Chief Compliance Officer of Wells Fargo Funds Management, LLC since 2007. Chief Compliance Officer of Parnassus Investments from 2005 to 2007. Chief Financial Officer of Parnassus Investments from 2004 to 2007 and Senior Audit Manager of PricewaterhouseCoopers LLP from 1998 to 2004. | | |
| 1. | The Statement of Additional Information includes additional information about the Trustees and is available, without charge, upon request, by calling 1-800-222-8222 or by visiting the Web site at wellsfargoadvantagefunds.com. |
| | | | | | |
| Other Information (Unaudited) | | Wells Fargo Advantage Asia Pacific Fund | | | 29 | |
BOARD CONSIDERATION OF INVESTMENT ADVISORY AND SUB-ADVISORY AGREEMENTS:
Under Section 15 of the Investment Company Act of 1940 (the “1940 Act”), the Board of Trustees (the “Board”) of Wells Fargo Funds Trust (the “Trust”), all the members of which have no direct or indirect interest in the investment advisory and sub-advisory agreements and are not “interested persons” of the Trust, as defined in the 1940 Act (the “Independent Trustees”), must determine whether to approve the continuation of the Trust’s investment advisory and sub-advisory agreements. In this regard, at an in person meeting held on March 29-30, 2012 (the “Meeting”), the Board reviewed and re-approved: (i) an investment advisory agreement with Wells Fargo Funds Management, LLC (“Funds Management”) for Wells Fargo Advantage Asia Pacific Fund (the “Fund”) and (ii) an investment sub-advisory agreement with Wells Capital Management Incorporated (“Wells Capital Management”) for the Fund. The investment advisory agreement with Funds Management and the investment sub-advisory agreement with Wells Capital Management are collectively referred to as the “Advisory Agreements.”
At the Meeting, the Board considered the factors and reached the conclusions described below relating to the selection of Funds Management and Wells Capital Management and the continuation of the Advisory Agreements. Prior to the Meeting, the Trustees conferred extensively among themselves and with representatives of Funds Management about these matters. The Board also met throughout the year and received information that was useful to them in considering the continuation of the Advisory Agreements. The Independent Trustees were assisted in their evaluation of the Advisory Agreements by independent legal counsel, from whom they received separate legal advice and with whom they met separately from Funds Management.
In providing information to the Board, Funds Management and Wells Capital Management were guided by a detailed set of requests submitted by the Independent Trustees’ independent legal counsel on their behalf at the start of the Board’s annual contract renewal process earlier in 2012. In approving the Advisory Agreements, the Board did not identify any particular information or consideration that was all-important or controlling, and each Trustee likely attributed different weights to various factors.
Nature, extent and quality of services
The Board received and considered various information regarding the nature, extent and quality of services provided to the Fund by Funds Management and Wells Capital Management under the Advisory Agreements. The Board also received and considered, among other things, information about the background and experience of senior management of Funds Management, and the qualifications, backgrounds, tenures and responsibilities of the portfolio managers primarily responsible for the day-to-day portfolio management of the Fund.
The Board evaluated the ability of Funds Management and Wells Capital Management, based on their respective financial condition, resources, reputation and other attributes, to attract and retain qualified investment professionals, including research, advisory, and supervisory personnel. The Board further considered the compliance programs and compliance records of Funds Management and Wells Capital Management. In addition, the Board took into account the administrative services provided to the Fund by Funds Management and its affiliates.
The Board’s decision to approve the continuation of the Advisory Agreements was based on a comprehensive evaluation of all of the information provided to it. In considering these matters, the Board considered not only the specific information presented in connection with the Meeting, but also the knowledge gained over time through interaction with Funds Management and Wells Capital Management about various topics, including Funds Management’s oversight of service providers. The above factors, together with those referenced below, are some of the most important, but not necessarily all, factors considered by the Board in concluding that the nature, extent and quality of the investment advisory services provided to the Fund by Funds Management and Wells Capital Management supported the re-approval of the Advisory Agreements. Although the Board considered the continuation of the Advisory Agreements for the Fund as part of the larger process of considering the continuation of the advisory agreements for all of the funds in the complex, its decision to continue the Advisory Agreements for the Fund was ultimately made on a fund-by-fund basis.
Fund performance and expenses
The Board considered the performance results for the Fund over various time periods ended December 31, 2011. The Board also considered these results in comparison to the median performance of a universe of relevant funds (the “Universe”) that was determined by Lipper Inc. (“Lipper”) to be similar to the Fund, and in comparison to the Fund’s
| | | | |
| 30 | | Wells Fargo Advantage Asia Pacific Fund | | Other Information (Unaudited) |
benchmark index and to other comparative data. Lipper is an independent provider of investment company data. The Board received a description of the methodology used by Lipper to select the mutual funds in the Universe. The Board noted that the performance of the Fund was higher than or in range of the median performance of the Universe for all periods under review.
The Board also noted that the performance of the Fund was higher than or in range of its benchmark, the Lipper Pacific Region Funds Index, for the one-year and ten-year performance periods, but lower than the Lipper Pacific Region Funds Index for the three-year and five-year performance periods under review. The Board viewed favorably the Fund’s more recent performance.
The Board received and considered information regarding the Fund’s contractual advisory fee and net operating expense ratios and their various components, including actual management fees (which reflect fee waivers, if any), transfer agent, custodian and other non-management fees, Rule 12b-1 and non-Rule 12b-1 fees, service fees and fee waiver and expense reimbursement arrangements. The Board also considered these ratios in comparison to the median ratios of an expense Universe and a narrower expense group of mutual funds (each, an “Expense Group”) that was determined by Lipper to be similar to the Fund. The Board received a description of the methodology used by Lipper to select the mutual funds in the Fund’s Expense Group. The Board noted that the net operating expense ratios of the Fund were lower than the Fund’s Expense Group’s median net operating expense ratios.
Based on the above-referenced considerations and other factors, the Board concluded that the overall performance and expense structure of the Fund supported the re-approval of the Advisory Agreements for the Fund.
Investment advisory and sub-advisory fee rates
The Board reviewed and considered the contractual investment advisory fee rate that is payable by the Fund to Funds Management for investment advisory services (the “Advisory Agreement Rate”), both on a stand-alone basis and on a combined basis with the Fund’s administration fee rate. The Board took into account the separate administrative and other services covered by the administration fee rate. The Board also reviewed and considered the contractual investment sub-advisory fee rate that is payable by Funds Management to Wells Capital Management for investment sub-advisory services (the “Sub-Advisory Agreement Rate”). In addition, the Board reviewed and considered the existing fee waiver/cap arrangements applicable to the Advisory Agreement Rate and considered the Advisory Agreement Rate after taking the waivers/caps into account (the “Net Advisory Rate”).
The Board received and considered information comparing the Advisory Agreement Rate and Net Advisory Rate with those of other funds in the Fund’s Expense Group median. The Board noted that the Advisory Agreement Rate was higher than the median rates for the Fund’s Expense Group, except for the Institutional Class. The Board also noted that the Net Advisory Rate for the Fund was higher than the median rates for the Fund’s Expense Group, except for the Institutional Class and Administrator Class.
The Board also received and considered information about the nature and extent of services offered and fee rates charged by Funds Management and Wells Capital Management to other types of clients. In this regard, the Board received information about differences between the services, and the compliance, reporting, and other legal burdens and risks of providing investment advice to mutual funds and those associated with providing advice to non-mutual fund clients such as collective funds or institutional separate accounts.
The Board determined that the Advisory Agreement Rate for the Fund, both with and without an administration fee rate and before and after waivers, was reasonable in light of the Fund’s Expense Group information, the net expense ratio commitments, the services covered by the Advisory Agreements and other information provided. The Board also reviewed and considered the Sub-Advisory Agreement Rate and concluded that the Sub-Advisory Agreement Rate was reasonable in light of the services covered by the sub-advisory agreement and other information provided.
Profitability
The Board received and considered a profitability analysis of Funds Management, as well as an analysis of the profitability to the collective Wells Fargo businesses that provide services to the Fund. It considered that the information provided to it was necessarily estimated, and that the profitability information provided to it, especially on a fund-by-fund basis, did not necessarily provide a precise tool for evaluating the appropriateness of the Fund’s Advisory Agreement Rate in
| | | | | | |
| Other Information (Unaudited) | | Wells Fargo Advantage Asia Pacific Fund | | | 31 | |
isolation. It noted that the levels of profitability reported on a fund-by-fund basis varied widely, depending on, among other things, the size and type of fund. The Board concluded that the profitability reported by Funds Management was not unreasonable.
The Board did not consider separate profitability information with respect to Wells Capital Management, because, as an affiliate of Funds Management, its profitability information was subsumed in the collective Wells Fargo profitability analysis provided by Funds Management.
Economies of scale
With respect to possible economies of scale, the Board reviewed the breakpoints in the Fund’s advisory fee structure, which operate generally to reduce the effective Advisory Agreement Rate of the Fund (as a percentage of Fund assets) as the Fund grows in size. It considered that, as a fund shrinks in size, breakpoints conversely result in increasing fee levels. The Board noted that it would have on-going opportunities to review the appropriate levels of breakpoints in the future, and concluded that the breakpoints as implemented appeared to be a reasonable step toward sharing economies of scale, if any, with the Fund. However, the Board acknowledged the inherent limitations of any analysis of an investment adviser’s economies of scale and of any attempt to correlate breakpoints with such economies, stemming largely from the Board’s understanding that economies of scale are realized, if at all, by an investment adviser across a variety of products and services, not just with respect to a single fund.
The Board viewed favorably management’s proposal to lower the Advisory Agreement Rate by fifteen basis points at each breakpoint level.
Other benefits to Funds Management and Wells Capital Management
The Board received and considered information regarding potential “fall-out” or ancillary benefits received by Funds Management and its affiliates, including Wells Capital Management, as a result of their relationship with the Fund. Ancillary benefits could include, among others, benefits directly attributable to the relationship of Funds Management and Wells Capital Management with the Fund and benefits potentially derived from an increase in Funds Management’s and Wells Capital Management’s business as a result of their relationship with the Fund (such as the ability to market to shareholders other financial products offered by Funds Management and its affiliates, including Wells Capital Management).
The Board considered that Wells Fargo Funds Distributor, LLC, an affiliate of Funds Management, serves as distributor to the Fund and receives certain compensation for those services. The Board noted that various financial institutions, including affiliates of Funds Management, may receive distribution-related fees, shareholder servicing payments (including amounts derived from payments under Rule 12b-1 plans) and sub-transfer agency fees in respect of shares sold or held through them and services provided.
The Board also reviewed information about whether and to what extent soft dollar credits are sought and how any such credits are utilized and any benefits that may be realized by using an affiliated broker.
Other factors and broader review
The Board also considered the markets for distribution of the Fund’s shares, including the channels through which the Fund’s shares are offered and sold. The Board noted that the Fund is part of one of the few fund families that have both direct-to-fund and intermediary distribution channels. As discussed above, the Board reviews detailed materials received from Funds Management and Wells Capital Management annually as part of the re-approval process under Section 15 of the 1940 Act and also reviews and assesses information about the quality of the services that the Fund receives throughout the year. In this regard, the Board has reviewed reports of Funds Management at each of its quarterly meetings, which include, among other things, portfolio reviews and performance reports. In addition, the Board confers with portfolio managers at various times throughout the year.
Conclusion
After considering the above-described factors and based on its deliberations and its evaluation of the information described above, the Board unanimously approved the continuation of the Advisory Agreements for an additional one-year period.
| | | | |
| 32 | | Wells Fargo Advantage Asia Pacific Fund | | List of Abbreviations |
The following is a list of common abbreviations for terms and entities which may have appeared in this report.
| ACB | — Agricultural Credit Bank |
| ADR | — American Depository Receipt |
| ADS | — American Depository Shares |
| AGC-ICC | — Assured Guaranty Corporation - Insured Custody Certificates |
| AGM | — Assured Guaranty Municipal |
| AMBAC | — American Municipal Bond Assurance Corporation |
| AMT | — Alternative Minimum Tax |
| BAN | — Bond Anticipation Notes |
| BHAC | — Berkshire Hathaway Assurance Corporation |
| CAB | — Capital Appreciation Bond |
| CCAB | — Convertible Capital Appreciation Bond |
| CDA | — Community Development Authority |
| CDO | — Collateralized Debt Obligation |
| COP | — Certificate of Participation |
| DRIVER | — Derivative Inverse Tax-Exempt Receipts |
| DW&P | — Department of Water & Power |
| DWR | — Department of Water Resources |
| ECFA | — Educational & Cultural Facilities Authority |
| EDA | — Economic Development Authority |
| EDFA | — Economic Development Finance Authority |
| ETF | — Exchange-Traded Fund |
| FFCB | — Federal Farm Credit Bank |
| FGIC | — Financial Guaranty Insurance Corporation |
| FHA | — Federal Housing Authority |
| FHLB | — Federal Home Loan Bank |
| FHLMC | — Federal Home Loan Mortgage Corporation |
| FICO | — The Financing Corporation |
| FNMA | — Federal National Mortgage Association |
| GDR | — Global Depository Receipt |
| GNMA | — Government National Mortgage Association |
| HCFR | — Healthcare Facilities Revenue |
| HEFA | — Health & Educational Facilities Authority |
| HEFAR | — Higher Education Facilities Authority Revenue |
| HFA | — Housing Finance Authority |
| HFFA | — Health Facilities Financing Authority |
| IBC | — Insured Bond Certificate |
| IDA | — Industrial Development Authority |
| IDAG | — Industrial Development Agency |
| IDR | — Industrial Development Revenue |
| KRW | — Republic of Korea Won |
| LIBOR | — London Interbank Offered Rate |
| LLC | — Limited Liability Company |
| LLP | — Limited Liability Partnership |
| MBIA | — Municipal Bond Insurance Association |
| MFHR | — Multi-Family Housing Revenue |
| MSTR | — Municipal Securities Trust Receipts |
| MUD | — Municipal Utility District |
| NATL-RE | — National Public Finance Guarantee Corporation |
| PCFA | — Pollution Control Finance Authority |
| PCR | — Pollution Control Revenue |
| PFA | — Public Finance Authority |
| PFFA | — Public Facilities Financing Authority |
| PFOTER | — Puttable Floating Option Tax-Exempt Receipts |
| plc | — Public Limited Company |
| PUTTER | — Puttable Tax-Exempt Receipts |
| R&D | — Research & Development |
| RDA | — Redevelopment Authority |
| RDFA | — Redevelopment Finance Authority |
| REIT | — Real Estate Investment Trust |
| ROC | — Reset Option Certificates |
| SAVRS | — Select Auction Variable Rate Securities |
| SBA | — Small Business Authority |
| SFHR | — Single Family Housing Revenue |
| SFMR | — Single Family Mortgage Revenue |
| SPA | — Standby Purchase Agreement |
| SPDR | — Standard & Poor’s Depositary Receipts |
| STRIPS | — Separate Trading of Registered Interest and Principal Securities |
| TAN | — Tax Anticipation Notes |
| TIPS | — Treasury Inflation-Protected Securities |
| TRAN | — Tax Revenue Anticipation Notes |
| TCR | — Transferable Custody Receipts |
| TTFA | — Transportation Trust Fund Authority |
| TVA | — Tennessee Valley Authority |
| XLCA | — XL Capital Assurance |
This page is intentionally left blank.
This page is intentionally left blank.


FOR MORE INFORMATION
More information about Wells Fargo Advantage Funds is available free upon request. To obtain literature, please write, e-mail, visit the Fund’s Web site, or call:
Wells Fargo Advantage Funds
P.O. Box 8266
Boston, MA 02266-8266
E-mail: wfaf@wellsfargo.com
Web site: wellsfargoadvantagefunds.com
Individual investors: 1-800-222-8222
Retail investment professionals: 1-888-877-9275
Institutional investment professionals: 1-866-765-0778
This report and the financial statements contained herein are submitted for the general information of the shareholders of Wells Fargo Advantage Funds. If this report is used for promotional purposes, distribution of the report must be accompanied or preceded by a current prospectus. For a prospectus containing more complete information, including charges and expenses, call 1-800-222-8222 or visit the Fund’s Web site at wellsfargoadvantagefunds.com. Please consider the investment objectives, risks, charges, and expenses of the investment carefully before investing. This and other information about Wells Fargo Advantage Funds can be found in the current prospectus. Read the prospectus carefully before you invest or send money.
Wells Fargo Funds Management, LLC, a wholly owned subsidiary of Wells Fargo & Company, provides investment advisory and administrative services for Wells Fargo Advantage Funds. Other affiliates of Wells Fargo & Company provide subadvisory and other services for the Funds. The Funds are distributed by Wells Fargo Funds Distributor, LLC, Member FINRA/SIPC, an affiliate of Wells Fargo & Company.
NOT FDIC INSURED ¡ NO BANK GUARANTEE ¡ MAY LOSE VALUE
© 2012 Wells Fargo Funds Management, LLC. All rights reserved.
| | |
 | | 209720 06-12 SA236/SAR236 4-12 |

Wells Fargo Advantage
Diversified International Fund

Semi-Annual Report
April 30, 2012

Reduce clutter. Save trees.
Sign up for electronic delivery of prospectuses and shareholder reports at wellsfargo.com/advantagedelivery
Contents
The views expressed and any forward-looking statements are as of April 30, 2012, unless otherwise noted, and are those of the Fund managers and/or Wells Fargo Funds Management, LLC. Discussions of individual securities, or the markets generally, or any Wells Fargo Advantage Fund are not intended as individual recommendations. Future events or results may vary significantly from those expressed in any forward-looking statements; the views expressed are subject to change at any time in response to changing circumstances in the market. Wells Fargo Funds Management, LLC, disclaims any obligation to publicly update or revise any views expressed or forward-looking statements.
NOT FDIC INSURED ¡ NO BANK GUARANTEE ¡ MAY LOSE VALUE

WELLS FARGO INVESTMENT HISTORY
| | |
| |
| 1932 | | Keystone creates one of the first mutual fund families. |
| |
| 1971 | | Wells Fargo & Company introduces one of the first institutional index funds. |
| |
| 1978 | | Wells Fargo applies Markowitz and Sharpe’s research on Modern Portfolio Theory to introduce one of the industry’s first Tactical Asset Allocation (TAA) models in institutional separately managed accounts. |
| |
| 1984 | | Wells Fargo Stagecoach Funds launches its first asset allocation fund. |
| |
| 1989 | | The Tactical Asset Allocation (TAA) Model is first applied to Wells Fargo’s asset allocation mutual funds. |
| |
| 1994 | | Wells Fargo introduces the LifePath Funds, one of the first suites of target date funds (now the Wells Fargo Advantage Dow Jones Target Date FundsSM). |
| |
| 1996 | | Evergreen Investments and Keystone Funds merge. |
| |
| 1997 | | Wells Fargo launches Wells Fargo Advantage WealthBuilder PortfoliosSM, a fund-of-funds suite of products that includes the use of quantitative models to shift assets among investment styles. |
| |
| 1999 | | Norwest Advantage Funds and Stagecoach Funds are reorganized into Wells Fargo Funds after the merger of Norwest and Wells Fargo. |
| |
| 2002 | | Evergreen Retail and Evergreen Institutional companies form the umbrella asset management company, Evergreen Investments. |
| |
| 2005 | | The integration of Strong Funds with Wells Fargo Funds creates Wells Fargo Advantage Funds, resulting in one of the top 20 mutual fund companies in the United States. |
| |
| 2006 | | Wells Fargo Advantage Funds relaunches the target date product line as Wells Fargo Advantage Dow Jones Target Date Funds. |
| |
| 2010 | | The mergers and reorganizations of Evergreen and Wells Fargo Advantage mutual funds are completed, unifying the families under the brand of Wells Fargo Advantage Funds. |
Wells Fargo Advantage Funds®
Wells Fargo Advantage Funds skillfully guides institutions, financial advisors, and individuals through the investment terrain to help them reach their financial objectives. Everything we do on behalf of investors is backed by our unique combination of qualifications.
Strength
Our organization is built on the standards of integrity and service established by our parent company—Wells Fargo & Company—more than 150 years ago. And, because we’re part of a highly diversified financial enterprise, we offer the depth of resources to help investors succeed.
Expertise
Our multi-boutique model offers investors access to the independent thinking of premier investment managers that have been chosen for their time-tested strategies. While each team specializes in a specific investment strategy, collectively they provide investors a wide choice of distinct investment styles. Our dedication to investment excellence doesn’t end with our expertise in manager selection—risk management, analysis, and rigorous ongoing review seek to ensure each manager’s investment process remains consistent.
Partnership
Our collaborative approach is built around understanding the needs and goals of our clients. By adhering to core principles of sound judgment and steady guidance, we support you through every stage of the investment decision process.
Carefully consider a fund’s investment objectives, risks, charges, and expenses before investing. For a current prospectus and, if available, a summary prospectus, containing this and other information, visit wellsfargoadvantagefunds.com. Read it carefully before investing.
Wells Fargo Funds Management, LLC, a wholly owned subsidiary of Wells Fargo & Company, provides investment advisory and administrative services for Wells Fargo Advantage Funds®. Other affiliates of Wells Fargo & Company provide subadvisory and other services for the Funds. The Funds are distributed by Wells Fargo Funds Distributor, LLC, Member FINRA/SIPC, an affiliate of Wells Fargo & Company.
“Dow Jones®” and “Dow Jones Target Date IndexesSM” are service marks of Dow Jones Trademark Holdings, LLC (“Dow Jones”), have been licensed to CME Group Index Services LLC (“CME Indexes”) and have been sublicensed for use for certain purposes by Global Index Advisors, Inc, and Wells Fargo Funds Management, LLC. The Wells Fargo Advantage Dow Jones Target Date FundsSM based on the Dow Jones Target Date IndexesSM, are not sponsored, endorsed, sold or promoted by Dow Jones, CME Indexes or their respective affiliates and none of them makes any representation regarding the advisability of investing in such product(s).
NOT FDIC INSURED ¡ NO BANK GUARANTEE ¡ MAY LOSE VALUE
Not part of the semi-annual report.
Wells Fargo Advantage Funds offers more than 110 mutual funds across a wide range of asset classes, representing over $211 billion in assets under management, as of April 30, 2012.
| | | | |
| Equity Funds | | | | |
Asia Pacific Fund | | Enterprise Fund† | | Opportunity Fund† |
C&B Large Cap Value Fund | | Equity Value Fund | | Precious Metals Fund |
C&B Mid Cap Value Fund | | Global Opportunities Fund | | Premier Large Company Growth Fund |
Capital Growth Fund | | Growth Fund | | Small Cap Opportunities Fund |
Common Stock Fund | | Index Fund | | Small Cap Value Fund |
Disciplined U.S. Core Fund | | International Equity Fund | | Small Company Growth Fund |
Discovery Fund† | | International Value Fund | | Small Company Value Fund |
Diversified Equity Fund | | Intrinsic Small Cap Value Fund | | Small/Mid Cap Core Fund |
Diversified International Fund | | Intrinsic Value Fund | | Small/Mid Cap Value Fund |
Diversified Small Cap Fund | | Intrinsic World Equity Fund | | Special Mid Cap Value Fund |
Emerging Growth Fund | | Large Cap Core Fund | | Special Small Cap Value Fund |
Emerging Markets Equity Fund | | Large Cap Growth Fund | | Specialized Technology Fund |
Emerging Markets Equity Income Fund | | Large Company Value Fund | | Traditional Small Cap Growth Fund |
Emerging Markets Local Bond Fund | | Omega Growth Fund | | Utility and Telecommunications Fund |
Endeavor Select Fund† | | | | |
| Bond Funds | | | | |
Adjustable Rate Government Fund | | Inflation-Protected Bond Fund | | Short-Term Bond Fund |
California Limited-Term Tax-Free Fund | | Intermediate Tax/AMT-Free Fund | | Short-Term High Yield Bond Fund |
California Tax-Free Fund | | International Bond Fund | | Short-Term Municipal Bond Fund |
Colorado Tax-Free Fund | | Minnesota Tax-Free Fund | | Strategic Municipal Bond Fund |
Government Securities Fund | | Municipal Bond Fund | | Total Return Bond Fund |
High Income Fund | | North Carolina Tax-Free Fund | | Ultra Short-Term Income Fund |
High Yield Bond Fund | | Pennsylvania Tax-Free Fund | | Ultra Short-Term Municipal Income Fund |
Income Plus Fund | | Short Duration Government Bond Fund | | Wisconsin Tax-Free Fund |
| Asset Allocation Funds | | | | |
Absolute Return Fund | | WealthBuilder Equity Portfolio† | | Target 2020 Fund† |
Asset Allocation Fund | | WealthBuilder Growth Allocation Portfolio† | | Target 2025 Fund† |
Conservative Allocation Fund | | WealthBuilder Growth Balanced Portfolio† | | Target 2030 Fund† |
Diversified Capital Builder Fund | | WealthBuilder Moderate Balanced Portfolio† | | Target 2035 Fund† |
Diversified Income Builder Fund | | WealthBuilder Tactical Equity Portfolio† | | Target 2040 Fund† |
Growth Balanced Fund | | Target Today Fund† | | Target 2045 Fund† |
Index Asset Allocation Fund | | Target 2010 Fund† | | Target 2050 Fund† |
Moderate Balanced Fund | | Target 2015 Fund† | | Target 2055 Fund† |
WealthBuilder Conservative Allocation Portfolio† | | | | |
| Money Market Funds | | | | |
100% Treasury Money Market Fund | | Heritage Money Market Fund† | | National Tax-Free Money Market Fund |
California Municipal Money Market Fund | | Money Market Fund | | Prime Investment Money Market Fund |
Cash Investment Money Market Fund | | Municipal Cash Management Money Market Fund | | Treasury Plus Money Market Fund |
Government Money Market Fund | | Municipal Money Market Fund | | |
| Variable Trust Funds1 | | | | |
VT Discovery Fund† | | VT Intrinsic Value Fund | | VT Small Cap Growth Fund |
VT Index Asset Allocation Fund | | VT Omega Growth Fund | | VT Small Cap Value Fund |
VT International Equity Fund | | VT Opportunity Fund† | | VT Total Return Bond Fund |
An investment in a money market fund is not insured or guaranteed by the Federal Deposit Insurance Corporation or any other government agency. Although the Wells Fargo Advantage Money Market Funds seek to preserve the value of your investment at $1.00 per share, it is possible to lose money by investing in a money market fund.
| 1. | The Variable Trust Funds are generally available only through insurance company variable contracts. |
| † | In this report, the Wells Fargo Advantage Discovery FundSM, Wells Fargo Advantage Endeavor Select FundSM, Wells Fargo Advantage Enterprise FundSM, Wells Fargo Advantage Opportunity FundSM, Wells Fargo Advantage WealthBuilder Conservative Allocation PortfolioSM, Wells Fargo Advantage WealthBuilder Equity PortfolioSM, Wells Fargo Advantage WealthBuilder Growth Allocation PortfolioSM, Wells Fargo Advantage WealthBuilder Growth Balanced PortfolioSM, Wells Fargo Advantage WealthBuilder Moderate Balanced PortfolioSM, Wells Fargo Advantage WealthBuilder Tactical Equity PortfolioSM, Wells Fargo Advantage Dow Jones Target Today FundSM, Wells Fargo Advantage Dow Jones Target 2010 FundSM, Wells Fargo Advantage Dow Jones Target 2015 FundSM, Wells Fargo Advantage Dow Jones Target 2020 FundSM, Wells Fargo Advantage Dow Jones Target 2025 FundSM, Wells Fargo Advantage Dow Jones Target 2030 FundSM, Wells Fargo Advantage Dow Jones Target 2035 FundSM, Wells Fargo Advantage Dow Jones Target 2040 FundSM, Wells Fargo Advantage Dow Jones Target 2045 FundSM, Wells Fargo Advantage Dow Jones Target 2050 FundSM, Wells Fargo Advantage Dow Jones Target 2055 FundSM, Wells Fargo Advantage Heritage Money Market FundSM, Wells Fargo Advantage VT Discovery FundSM, and Wells Fargo Advantage VT Opportunity FundSM are referred to as the Discovery Fund, Endeavor Select Fund, Enterprise Fund, Opportunity Fund, WealthBuilder Conservative Allocation Portfolio, WealthBuilder Equity Portfolio, WealthBuilder Growth Allocation Portfolio, WealthBuilder Growth Balanced Portfolio, WealthBuilder Moderate Balanced Portfolio, WealthBuilder Tactical Equity Portfolio, Target Today Fund, Target 2010 Fund, Target 2015 Fund, Target 2020 Fund, Target 2025 Fund, Target 2030 Fund, Target 2035 Fund, Target 2040 Fund, Target 2045 Fund, Target 2050 Fund, Target 2055 Fund, Heritage Money Market Fund, VT Discovery Fund, and VT Opportunity Fund, respectively. |
Not part of the semi-annual report.
| | | | |
| 2 | | Wells Fargo Advantage Diversified International Fund | | Letter to Shareholders |

Karla M. Rabusch,
President
Wells Fargo Advantage Funds
The period was marked by continued concerns about the possible global economic effects of the ongoing European sovereign debt crisis that began in Greece and later spread to the larger economies of Italy and Spain.
The potential for sovereign debt default had a negative effect on emerging markets, with indexes in major countries such as Brazil and India ending the period with losses.
Dear Valued Shareholder:
We’re pleased to offer you this semi-annual report for the Wells Fargo Advantage Diversified International Fund for the six-month period that ended April 30, 2012. The period was marked by continued concerns about the possible global economic effects of the ongoing European sovereign debt crisis that began in Greece and later spread to the larger economies of Italy and Spain. Widespread support from central banks helped push developed market indexes to gains, but several emerging markets posted losses for the period.
Macroeconomic optimism seemed to fade as global growth slowed and worries rose.
Prior to and throughout the reporting period, concerns about the eurozone sovereign debt situation returned to center stage. Investors became increasingly concerned that Greece would default on its debt, a scenario that only seemed more likely as eurozone leaders began to openly discuss a “voluntary” haircut on Greek debt for private investors. Because many eurozone banks owned Greek debt and many U.S. banks had financial ties to eurozone banks, investors worried about the effects of such an event on the financial systems and on the global economy.
In October 2011, market participants turned their attention to the debt burdens of Italy—which, like the U.S., also had its credit rating downgraded by Standard & Poor’s—because even though it had a relatively modest budget deficit, it had a high amount of outstanding debt and a stagnant economy. French banks were heavily exposed to Italian debt, so Italy’s woes led to fears of a state bailout of French banks and a resulting increase in France’s expenditures.
The Greek credit crisis was seemingly addressed in March 2012, when the Greek government came to an agreement with its creditors that allowed it to write down the principal on most of its bonds in exchange for increased financial austerity. The Greek agreement, combined with unprecedented support for eurozone banks by the European Central Bank (ECB), seemed to calm investor concerns, at least temporarily, and most developed markets—both in Europe and Asia—ended the period with gains. The potential for sovereign debt default had a negative effect on emerging markets, with indexes in major countries such as Brazil and India ending the period with losses. China was a notable exception, posting a gain.
The U.S. economy reported relatively solid news.
In contrast to worrisome data from the eurozone, U.S. economic data remained moderately positive. Reported gross domestic product (GDP) growth came in at a 1.8% annualized rate in the third quarter of 2011 and then accelerated to a 3.0% annualized rate in the fourth quarter. The initial estimate for GDP growth in the first quarter of 2012 came in at a 2.2% annualized rate, further supporting the case for economic recovery. In addition, the major banks appeared to have taken steps toward repairing their balance sheets; in March, the Federal Reserve (Fed) announced that 15 of the 19 major banks had passed a “stress test” in which the Fed attempted to gauge whether the banks could survive a severe recession that included a 50% drop in the stock market and a 21% percent decline in housing prices.
Financial stocks rebounded and outperformed the broader market for the reporting period after the Fed released details of the stress test. Stocks generally
| | | | | | |
| Letter to Shareholders | | Wells Fargo Advantage Diversified International Fund | | | 3 | |
rallied across the market as investors seemed to be increasingly confident that the U.S. would not return to recession.
Central banks continued to provide stimulus.
Throughout the reporting period, the Federal Open Market Committee kept its key interest rates effectively at zero in order to support the economy and financial system. In response to extreme market volatility and signs of a weakening economy, the Fed announced its intention to keep interest rates low until at least late 2014.
Likewise, the Bank of Japan voted in late April to keep its key policy rate in a range of 0.0% to 0.1%. The bank announced that it would expand its government bond purchases by 10 trillion yen ($123.8 billion), targeting a 1.0% inflation rate in an attempt to end the country’s multi-year deflation.
As of November 1, 2011, the ECB had a key rate of 1.50%, which it had increased from 1.0% in an attempt to keep inflation in check. Soon, in response to weakness in the southern European economies, the ECB lowered its key rate to 1.25% in early November 2011 and 1.0% in December 2011. The ECB also continued to provide virtually unlimited liquidity for banks, announcing a Long-Term Refinancing Operation in December through which it provided low-cost three-year loans to lenders.
We use time-tested investment strategies, even as many variables are at work in the market.
Elevated unemployment and debt defaults continue to pressure consumers and businesses alike. In our experience, strict adherence to time-tested investment strategies has its rewards. As a whole, Wells Fargo Advantage Funds represents investments across a range of asset classes and investment styles, giving you an opportunity to create a diversified investment portfolio. While diversification may not prevent losses in a downturn, we believe it helps in managing risk.
Thank you for choosing to invest with Wells Fargo Advantage Funds. We appreciate your confidence in us and remain committed to helping you meet your financial needs. For current information about your fund investments, contact your investment professional, visit our Web site at wellsfargoadvantagefunds.com, or call us directly at 1-800-222-8222. We are available 24 hours a day, 7 days a week.
Sincerely,

Karla M. Rabusch
President
Wells Fargo Advantage Funds
| | | | |
| 4 | | Wells Fargo Advantage Diversified International Fund | | Letter to Shareholders |
Notice to Shareholders
The Board of Trustees for Wells Fargo Advantage Funds has unanimously approved the following modifications to certain net asset value (NAV) waiver privileges and commission schedules:
| | n | | Effective May 1, 2012, automatic investment plan (AIP) purchases and proceeds received from systematic withdrawals will no longer qualify for NAV repurchase privileges. | |
| | n | | Effective May 1, 2012, discretionary rights to waive the upfront commission for Class C and “jumbo” Class A share purchases will no longer be granted to broker/dealers. However, we will continue to waive the Class C shares contingent deferred sales charge for redemptions by employer-sponsored retirement plans where the dealer of record waived its commission at the time of purchase. | |
| | n | | Effective July 31, 2012, NAV purchase privileges for former Evergreen Class IS and Class R shareholders are being modified to remove the ability to purchase Class A shares at NAV unless those shares are held directly with the Fund on or after July 31, 2012. | |
Please contact your investment professional or call us directly at 1-800-222-8222 if you have any questions on this Notice to Shareholders.
| | | | | | |
| Performance Highlights (Unaudited) | | Wells Fargo Advantage Diversified International Fund | | | 5 | |
INVESTMENT OBJECTIVE
The Fund seeks long-term capital appreciation.
ADVISER
Wells Fargo Funds Management, LLC
SUB-ADVISER
Artisan Partners Limited Partnership
LSV Asset Management
Wells Capital Management Incorporated
PORTFOLIO MANAGERS
Jeffrey Everett, CFA
Josef Lakonishok
Puneet Mansharamani, CFA
Menno Vermeulen, CFA
Dale Winner, CFA
Mark L. Yockey, CFA
FUND INCEPTION
September 24, 1997
| | | | |
TEN LARGEST EQUITY HOLDINGS1 (AS OF APRIL 30, 2012) | | | |
Linde AG | | | 1.59% | |
Anheuser-Busch InBev NV | | | 1.52% | |
Canadian Pacific Railway Limited | | | 1.45% | |
Japan Tobacco Incorporated | | | 1.43% | |
China Mobile Limited | | | 1.39% | |
Nestle SA | | | 1.36% | |
Baidu.com Incorporated ADR | | | 1.26% | |
Unilever NV | | | 1.23% | |
AIA Group Limited | | | 1.22% | |
Honda Motor Company Limited | | | 1.16% | |
| | |
SECTOR DISTRIBUTION2 (AS OF APRIL 30, 2012) | | |
|
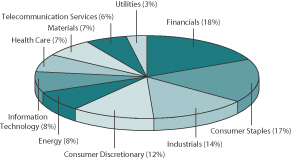 |
| 1. | The ten largest equity holdings are calculated based on the value of the securities divided by total net assets of the Fund. Holdings are subject to change and may have changed since the date specified. |
| 2. | Sector distribution is subject to change and is calculated based on the total long-term investments of the Fund. |
| | | | |
| 6 | | Wells Fargo Advantage Diversified International Fund | | Performance Highlights (Unaudited) |
AVERAGE ANNUAL TOTAL RETURN3 (%) (AS OF APRIL 30, 2012)
| | | | | | | | | | | | | | | | | | | | | | | | | | | | | | | | | | | | | | | | | | | | |
| | | | | | Including Sales Charge | | | Excluding Sales Charge | | | Expense Ratios4 | |
| | | Inception Date | | | 6 Months* | | | 1 Year | | | 5 Year | | | 10 Year | | | 6 Months* | | | 1 Year | | | 5 Year | | | 10 Year | | | Gross | | | Net5 | |
Class A (SILAX) | | | 09/24/1997 | | | | (0.10 | ) | | | (15.96 | ) | | | (6.16 | ) | | | 1.96 | | | | 5.98 | | | | (10.86 | ) | | | (5.05 | ) | | | 2.56 | | | | 1.48% | | | | 1.42% | |
Class B (SILBX)** | | | 09/24/1997 | | | | 0.71 | | | | (16.45 | ) | | | (6.24 | ) | | | 2.00 | | | | 5.71 | | | | (11.45 | ) | | | (5.73 | ) | | | 2.00 | | | | 2.23% | | | | 2.17% | |
Class C (WFECX) | | | 04/01/1998 | | | | 4.67 | | | | (12.52 | ) | | | (5.72 | ) | | | 1.80 | | | | 5.67 | | | | (11.52 | ) | | | (5.72 | ) | | | 1.80 | | | | 2.23% | | | | 2.17% | |
Administrator Class (WFIEX) | | | 11/08/1999 | | | | | | | | | | | | | | | | | | | | 6.20 | | | | (10.61 | ) | | | (4.84 | ) | | | 2.78 | | | | 1.32% | | | | 1.26% | |
Institutional Class (WFISX) | | | 08/31/2006 | | | | | | | | | | | | | | | | | | | | 6.35 | | | | (10.39 | ) | | | (4.62 | ) | | | 2.91 | | | | 1.05% | | | | 1.00% | |
Investor Class (WIEVX) | | | 07/18/2008 | | | | | | | | | | | | | | | | | | | | 6.06 | | | | (10.85 | ) | | | (5.05 | ) | | | 2.34 | | | | 1.55% | | | | 1.47% | |
MSCI EAFE® Index (Net)6 | | | | | | | | | | | | | | | | | | | | | | | 2.44 | | | | (12.82 | ) | | | (4.72 | ) | | | 5.42 | | | | | | | | | |
| * | Returns for periods of less than one year are not annualized. |
| ** | Class B shares are closed to investment, except in connectionwith the reinvestment of any distributions and permitted exchanges. |
Figures quoted represent past performance, which is no guarantee of future results and do not reflect the deduction of taxes that a shareholder may pay on fund distributions or the redemption of fund shares. Investment return and principal value of an investment will fluctuate so that an investor’s shares, when redeemed, may be worth more or less than their original cost. Performance shown without sales charges would be lower if sales charges were reflected. Current performance may be lower or higher than the performance data quoted and assumes the reinvestment of dividends and capital gains. Current month-end performance is available on the Fund’s Web site – wellsfargoadvantagefunds.com.
Index returns do not include transaction costs associated with buying and selling securities, any mutual fund fees or expenses or any taxes. It is not possible to invest directly in an index.
For Class A shares, the maximum front-end sales charge is 5.75%. For Class B shares, the maximum contingent deferred sales charge is 5.00%. For Class C shares, the maximum contingent deferred sales charge is 1.00%. Performance including sales charge assumes the sales charge for the corresponding time period. Administrator Class, Institutional Class and Investor Class shares are sold without a front-end sales charge or contingent deferred sales charge.
Stock fund values fluctuate in response to the activities of individual companies and general market and economic conditions. Foreign investments are especially volatile and can rise or fall dramatically due to differences in the political and economic conditions of the host country. These risks are generally intensified in emerging markets. The use of derivatives may reduce returns and/or increase volatility. Certain investment strategies tend to increase the total risk of an investment (relative to the broader market). This Fund is exposed to smaller-company securities risk. Consult the Fund’s prospectus for additional information on these and other risks.
| 3. | Historical performance shown for the Investor Class shares prior to their inception reflects the performance of Class A shares, adjusted to reflect the higher expenses applicable to the Investor Class shares. Historical performance shown for the Institutional Class shares prior to their inception reflects the performance of the Administrator Class shares, and includes the higher expenses applicable to the Administrator Class shares. If these expenses had not been included, returns would be higher. |
| 4. | Reflects the expense ratios as stated in the most recent prospectuses. |
| 5. | The Adviser has committed through February 28, 2013 to waive fees and/or reimburse expenses to the extent necessary to cap the Fund’s Total Annual Fund Operating Expenses After Fee Waiver, excluding certain expenses, at 1.41% for Class A, 2.16% for Class B, 2.16% for Class C, 1.25% for Administrator Class, 0.99% for Institutional Class and 1.46% for Investor Class. Without this cap, the Fund’s returns would have been lower. |
| 6. | The Morgan Stanley Capital International Europe, Australasia, and Far East (“MSCI EAFE”) Index (Net) is an unmanaged group of securities widely regarded by investors to be representations of the stock markets of Europe, Australasia, and the Far East. You cannot invest directly in an index. Source: MSCI. MSCI makes no express or implied warranties or representations and shall have no liability whatsoever with respect to any MSCI data contained herein. The MSCI data may not be further redistributed or used as a basis for other indexes or any securities or financial products. This report is not approved, reviewed, or produced by MSCI. |
| | | | | | |
| Fund Expenses (Unaudited) | | Wells Fargo Advantage Diversified International Fund | | | 7 | |
As a shareholder of the Fund, you incur two types of costs: (1) transaction costs, including sales charges (loads) on purchase payments and contingent deferred sales charges (if any) on redemptions and (2) ongoing costs, including management fees; distribution (12b-1) and/or shareholder service fees; and other Fund expenses. This example is intended to help you understand your ongoing costs (in dollars) of investing in the Fund and to compare these costs with the ongoing costs of investing in other mutual funds.
The example is based on an investment of $1,000 invested at the beginning of the six-month period and held for the entire period from November 1, 2011 to April 30, 2012.
Actual Expenses
The “Actual” line of the table below provides information about actual account values and actual expenses. You may use the information in this line, together with the amount you invested, to estimate the expenses that you paid over the period. Simply divide your account value by $1,000 (for example, an $8,600 account value divided by $1,000 = 8.6), then multiply the result by the number in the “Actual” line under the heading entitled “Expenses Paid During Period” for your applicable class of shares to estimate the expenses you paid on your account during this period.
Hypothetical Example for Comparison Purposes
The “Hypothetical” line of the table below provides information about hypothetical account values and hypothetical expenses based on the Fund’s actual expense ratio and an assumed rate of return of 5% per year before expenses, which is not the Fund’s actual return. The hypothetical account values and expenses may not be used to estimate the actual ending account balance or expenses you paid for the period. You may use this information to compare the ongoing costs of investing in the Fund and other funds. To do so, compare this 5% hypothetical example with the 5% hypothetical examples that appear in the shareholder reports of the other funds.
Please note that the expenses shown in the table are meant to highlight your ongoing costs only and do not reflect any transactional costs, such as sales charges (loads) and contingent deferred sales charges. Therefore, the “Hypothetical” line of the table is useful in comparing ongoing costs only, and will not help you determine the relative total costs of owning different funds. In addition, if these transactional costs were included, your costs would have been higher.
| | | | | | | | | | | | | | | | |
| | | Beginning
Account Value
11-01-2011 | | | Ending
Account Value
04-30-2012 | | | Expenses
Paid During
the Period1 | | | Net Annual
Expense Ratio | |
Class A | | | | | | | | | | | | | | | | |
Actual | | $ | 1,000.00 | | | $ | 1,059.78 | | | $ | 7.22 | | | | 1.41 | % |
Hypothetical (5% return before expenses) | | $ | 1,000.00 | | | $ | 1,017.85 | | | $ | 7.07 | | | | 1.41 | % |
Class B | | | | | | | | | | | | | | | | |
Actual | | $ | 1,000.00 | | | $ | 1,057.07 | | | $ | 11.05 | | | | 2.16 | % |
Hypothetical (5% return before expenses) | | $ | 1,000.00 | | | $ | 1,014.12 | | | $ | 10.82 | | | | 2.16 | % |
Class C | | | | | | | | | | | | | | | | |
Actual | | $ | 1,000.00 | | | $ | 1,056.65 | | | $ | 11.05 | | | | 2.16 | % |
Hypothetical (5% return before expenses) | | $ | 1,000.00 | | | $ | 1,014.12 | | | $ | 10.82 | | | | 2.16 | % |
Administrator Class | | | | | | | | | | | | | | | | |
Actual | | $ | 1,000.00 | | | $ | 1,061.98 | | | $ | 6.41 | | | | 1.25 | % |
Hypothetical (5% return before expenses) | | $ | 1,000.00 | | | $ | 1,018.65 | | | $ | 6.27 | | | | 1.25 | % |
Institutional Class | | | | | | | | | | | | | | | | |
Actual | | $ | 1,000.00 | | | $ | 1,063.51 | | | $ | 5.08 | | | | 0.99 | % |
Hypothetical (5% return before expenses) | | $ | 1,000.00 | | | $ | 1,019.94 | | | $ | 4.97 | | | | 0.99 | % |
Investor Class | | | | | | | | | | | | | | | | |
Actual | | $ | 1,000.00 | | | $ | 1,060.60 | | | $ | 7.48 | | | | 1.46 | % |
Hypothetical (5% return before expenses) | | $ | 1,000.00 | | | $ | 1,017.60 | | | $ | 7.32 | | | | 1.46 | % |
| 1. | Expenses paid is equal to the annualized expense ratio of each class multiplied by the average account value over the period, multiplied by the number of days in the most recent fiscal half-year divided by the number of days in the fiscal year (to reflect the one-half year period). |
| | | | |
| 8 | | Wells Fargo Advantage Diversified International Fund | | Portfolio of Investments—April 30, 2012 (Unaudited) |
| | | | | | | | | | | | |
| Security Name | | | | | | Shares | | | Value | |
| | | | | | | | | | | | |
| | | |
Common Stocks: 95.46% | | | | | | | | | | |
| | | | |
| Argentina: 0.02% | | | | | | | | | | | | |
IRSA Inversiones y Representaciones SA ADR (Financials, Real Estate Management & Development) | | | | | | | 5,087 | | | $ | 40,086 | |
| | | | | | | | | | | | |
| | | |
| Australia: 2.07% | | | | | | | | | | |
Bendigo Bank Limited (Financials, Commercial Banks) | | | | | | | 50,800 | | | | 398,571 | |
BHP Billiton Limited (Materials, Metals & Mining) | | | | | | | 14,220 | | | | 526,728 | |
BlueScope Steel Limited (Materials, Metals & Mining) † | | | | | | | 166,200 | | | | 68,403 | |
Challenger Financial Services Group Limited (Financials, Diversified Financial Services) | | | | | | | 72,600 | | | | 301,069 | |
Coca-Cola Amatil Limited (Consumer Staples, Beverages) | | | | | | | 12,109 | | | | 157,081 | |
Downer EDI Limited (Industrials, Commercial Services & Supplies) † | | | | | | | 69,200 | | | | 260,292 | |
Goodman Fielder Limited (Consumer Staples, Food Products) | | | | | | | 382,600 | | | | 261,116 | |
Grain Corporation Limited (Consumer Staples, Food Products) | | | | | | | 31,000 | | | | 298,133 | |
Metcash Limited (Consumer Staples, Food & Staples Retailing) | | | | | | | 101,700 | | | | 419,627 | |
OneSteel Limited (Materials, Metals & Mining) | | | | | | | 426,000 | | | | 579,251 | |
Perilya Limited (Industrials, Professional Services) † | | | | | | | 397,900 | | | | 161,691 | |
Telstra Corporation Limited (Telecommunication Services, Diversified Telecommunication Services) | | | | | | | 84,800 | | | | 312,785 | |
Treasury Wine Estates Limited (Consumer Staples, Beverages) | | | | | | | 43,951 | | | | 197,833 | |
| | | | |
| | | | | | | | | | | 3,942,580 | |
| | | | | | | | | | | | |
| | | |
| Austria: 0.25% | | | | | | | | | | |
OMV AG (Energy, Oil, Gas & Consumable Fuels) « | | | | | | | 8,000 | | | | 270,829 | |
Voestalpine AG (Materials, Metals & Mining) | | | | | | | 6,200 | | | | 200,701 | |
| | | | |
| | | | | | | | | | | 471,530 | |
| | | | | | | | | | | | |
| | | |
| Belgium: 1.98% | | | | | | | | | | |
Anheuser-Busch InBev NV (Consumer Staples, Beverages) « | | | | | | | 40,027 | | | | 2,884,965 | |
Delhaize Group (Consumer Staples, Food & Staples Retailing) | | | | | | | 9,000 | | | | 438,112 | |
Dexia (Financials, Commercial Banks) † | | | | | | | 11,500 | | | | 2,892 | |
KBC Groep NV (Financials, Commercial Banks) | | | | | | | 10,800 | | | | 208,864 | |
Tessenderlo Chemie NV (Materials, Chemicals) | | | | | | | 7,500 | | | | 237,571 | |
| | | | |
| | | | | | | | | | | 3,772,404 | |
| | | | | | | | | | | | |
| | | |
| Bermuda: 1.07% | | | | | | | | | | |
Cosan Limited Class A (Consumer Staples, Food Products) | | | | | | | 66,851 | | | | 925,218 | |
Jardine Matheson Holdings Limited (Industrials, Industrial Conglomerates) | | | | | | | 14,000 | | | | 695,100 | |
Ports Design Limited (Consumer Discretionary, Textiles, Apparel & Luxury Goods) (a) | | | | | | | 279,800 | | | | 411,118 | |
| | | | |
| | | | | | | | | | | 2,031,436 | |
| | | | | | | | | | | | |
| | | |
| Brazil: 0.63% | | | | | | | | | | |
Banco do Brasil SA (Financials, Commercial Banks) | | | | | | | 23,900 | | | | 295,655 | |
Cia Saneamento Basico de Sau Paulo (Utilities, Water Utilities) | | | | | | | 14,400 | | | | 565,378 | |
Cia Saneamento Minas Gerais (Utilities, Water Utilities) | | | | | | | 14,700 | | | | 342,947 | |
| | | | |
| | | | | | | | | | | 1,203,980 | |
| | | | | | | | | | | | |
| | | |
| Canada: 3.65% | | | | | | | | | | |
Canadian National Railway Company (Industrials, Road & Rail) | | | | | | | 188 | | | | 16,033 | |
Canadian Pacific Railway Limited (Industrials, Road & Rail) « | | | | | | | 35,691 | | | | 2,765,339 | |
Cenovus Energy Incorporated (Energy, Oil, Gas & Consumable Fuels) | | | | | | | 34,304 | | | | 1,243,520 | |
The accompanying notes are an integral part of these financial statements.
| | | | | | |
| Portfolio of Investments—April 30, 2012 (Unaudited) | | Wells Fargo Advantage Diversified International Fund | | | 9 | |
| | | | | | | | | | | | |
| Security Name | | | | | | Shares | | | Value | |
| | | | | | | | | | | | |
| | | | |
| Canada (continued) | | | | | | | | | | | | |
Magna International Incorporated Class A (Consumer Discretionary, Auto Components) « | | | | | | | 10,600 | | | $ | 464,518 | |
Metro Incorporated (Consumer Staples, Food & Staples Retailing) | | | | | | | 10,100 | | | | 557,220 | |
Suncor Energy Incorporated (Energy, Oil, Gas & Consumable Fuels) | | | | | | | 10,096 | | | | 333,484 | |
Valeant Pharmaceuticals International Incorporated (Health Care, Pharmaceuticals) † | | | | | | | 21,152 | | | | 1,176,686 | |
WestJet Airlines Limited (Industrials, Airlines) | | | | | | | 27,100 | | | | 385,987 | |
| | | | |
| | | | | | | | | | | 6,942,787 | |
| | | | | | | | | | | | |
| | | | |
| Cayman Islands: 0.44% | | | | | | | | | | | | |
Hengdeli Holdings Limited (Consumer Discretionary, Specialty Retail) | | | | | | | 2,109,424 | | | | 845,548 | |
| | | | | | | | | | | | |
| | | | |
| China: 3.06% | | | | | | | | | | | | |
Baidu.com Incorporated ADR (Information Technology, Internet Software & Services) †« | | | | | | | 18,031 | | | | 2,392,714 | |
China Communications (Telecommunication Services, Diversified Telecommunication Services) | | | | | | | 490,000 | | | | 251,990 | |
China Construction Bank (Financials, Commercial Banks) | | | | | | | 710,000 | | | | 552,725 | |
China Petroleum & Chemical Corporation (Energy, Oil, Gas & Consumable Fuels) | | | | | | | 532,000 | | | | 573,234 | |
China Railway Construction Corporation (Industrials, Construction & Engineering) | | | | | | | 354,500 | | | | 282,827 | |
Industrial & Commercial Bank of China Limited Class H (Financials, Commercial Banks) | | | | | | | 1,230,000 | | | | 821,200 | |
LDK Solar Company Limited ADR (Information Technology, Electronic Equipment, Instruments & Components) †« | | | 76,888 | | | | 244,504 | |
Tencent Holdings Limited (Information Technology, Internet Software & Services) | | | | | | | 22,200 | | | | 697,590 | |
| | | | |
| | | | | | | | | | | 5,816,784 | |
| | | | | | | | | | | | |
| | | | |
| Denmark: 0.79% | | | | | | | | | | | | |
A.P. Moller-Maersk AS Class B (Industrials, Marine) | | | | | | | 117 | | | | 915,149 | |
Danske Bank A/S (Financials, Commercial Banks) † | | | | | | | 12,300 | | | | 199,704 | |
H. Lundbeck A/S (Health Care, Pharmaceuticals) | | | | | | | 18,900 | | | | 378,323 | |
| | | | |
| | | | | | | | | | | 1,493,176 | |
| | | | | | | | | | | | |
| | | | |
| Finland: 0.64% | | | | | | | | | | | | |
Metso Oyj (Industrials, Machinery) | | | | | | | 20,543 | | | | 881,046 | |
TietoEnator Oyj (Information Technology, IT Services) | | | | | | | 19,000 | | | | 334,751 | |
| | | | |
| | | | | | | | | | | 1,215,797 | |
| | | | | | | | | | | | |
| | | | |
| France: 6.35% | | | | | | | | | | | | |
Air Liquide SA (Materials, Chemicals) | | | | | | | 3,501 | | | | 450,312 | |
Arkema Group (Industrials, Professional Services) | | | | | | | 910 | | | | 80,598 | |
AXA SA (Financials, Insurance) | | | | | | | 13,400 | | | | 189,792 | |
BNP Paribas SA (Financials, Commercial Banks) | | | | | | | 6,100 | | | | 245,063 | |
Credit Agricole SA (Financials, Commercial Banks) | | | | | | | 23,400 | | | | 120,274 | |
France Telecom SA (Telecommunication Services, Diversified Telecommunication Services) | | | | | | | 13,200 | | | | 180,582 | |
Groupe Danone SA (Consumer Staples, Food Products) | | | | | | | 17,609 | | | | 1,238,875 | |
LVMH Moet Hennessy Louis Vuitton SA (Consumer Discretionary, Textiles, Apparel & Luxury Goods) | | | | | | | 3,148 | | | | 521,501 | |
Pernod-Ricard SA (Consumer Staples, Beverages) | | | | | | | 14,558 | | | | 1,510,994 | |
Sanofi-Aventis SA (Health Care, Pharmaceuticals) | | | | | | | 16,400 | | | | 1,251,723 | |
Schneider Electric SA (Industrials, Electrical Equipment) | | | | | | | 21,806 | | | | 1,339,607 | |
SCOR SE (Financials, Insurance) | | | | | | | 17,000 | | | | 449,496 | |
Societe Generale (Financials, Diversified Financial Services) | | | | | | | 5,700 | | | | 134,755 | |
Technip SA (Energy, Energy Equipment & Services) | | | | | | | 2,979 | | | | 336,876 | |
Total SA (Energy, Oil, Gas & Consumable Fuels) | | | | | | | 37,608 | | | | 1,795,627 | |
Unibail-Rodamco SA (Financials, Real Estate Management & Development) | | | | | | | 6,180 | | | | 1,155,082 | |
The accompanying notes are an integral part of these financial statements.
| | | | |
| 10 | | Wells Fargo Advantage Diversified International Fund | | Portfolio of Investments—April 30, 2012 (Unaudited) |
| | | | | | | | | | | | |
| Security Name | | | | | | Shares | | | Value | |
| | | | | | | | | | | | |
| | | | |
| France (continued) | | | | | | | | | | | | |
Vivendi SA (Consumer Discretionary, Media) | | | | | | | 25,300 | | | $ | 467,683 | |
Zodiac Aerospace (Industrials, Aerospace & Defense) | | | | | | | 5,631 | | | | 619,705 | |
| | | | |
| | | | | | | | | | | 12,088,545 | |
| | | | | | | | | | | | |
| | | | |
| Germany: 10.24% | | | | | | | | | | | | |
Allianz AG (Financials, Insurance) | | | | | | | 17,435 | | | | 1,942,766 | |
BASF SE (Materials, Chemicals) « | | | | | | | 5,800 | | | | 477,461 | |
Bayer AG (Health Care, Pharmaceuticals) « | | | | | | | 19,462 | | | | 1,370,788 | |
Beiersdorf AG (Consumer Staples, Personal Products) « | | | | | | | 17,205 | | | | 1,207,036 | |
Brenntag AG (Materials, Chemicals) | | | | | | | 11,033 | | | | 1,374,273 | |
Daimler AG (Consumer Discretionary, Automobiles) | | | | | | | 25,689 | | | | 1,420,199 | |
Deutsche Bank AG (Financials, Capital Markets) | | | | | | | 8,400 | | | | 365,484 | |
E.ON AG (Utilities, Electric Utilities) « | | | | | | | 65,102 | | | | 1,474,894 | |
Hannover Rueckversicherung AG (Financials, Insurance) « | | | | | | | 6,300 | | | | 380,815 | |
Heidelberger Druckmaschinen AG (Industrials, Professional Services) †« | | | | | | | 17,000 | | | | 29,704 | |
Linde AG (Materials, Chemicals) « | | | | | | | 17,638 | | | | 3,018,822 | |
Metro AG (Consumer Staples, Food & Staples Retailing) | | | | | | | 46,422 | | | | 1,497,815 | |
Muenchener Rueckversicherungs-Gesellschaft AG (Financials, Insurance) « | | | | | | | 10,227 | | | | 1,484,385 | |
Norddeutsche Affinerie AG (Materials, Metals & Mining) | | | | | | | 4,900 | | | | 271,931 | |
RWE AG (Utilities, Multi-Utilities) | | | | | | | 7,800 | | | | 335,300 | |
SAP AG (Information Technology, Software) | | | | | | | 14,031 | | | | 930,314 | |
Siemens AG (Industrials, Industrial Conglomerates) | | | | | | | 13,254 | | | | 1,227,576 | |
Wincor Nixdorf AG (Information Technology, Computers & Peripherals) | | | | | | | 17,449 | | | | 676,518 | |
| | | | |
| | | | | | | | | | | 19,486,081 | |
| | | | | | | | | | | | |
| | | |
| Hong Kong: 8.17% | | | | | | | | | | |
AIA Group Limited (Financials, Insurance) | | | | | | | 652,800 | | | | 2,322,218 | |
Beijing Enterprises Holdings Limited (Financials, Diversified Financial Services) | | | | | | | 40,988 | | | | 229,277 | |
BOC Hong Kong Holdings Limited (Financials, Commercial Banks) | | | | | | | 173,213 | | | | 536,920 | |
Cathay Pacific Airways Limited (Industrials, Airlines) | | | | | | | 111,000 | | | | 188,275 | |
China Everbright Limited (Financials, Diversified Financial Services) | | | | | | | 554,000 | | | | 879,699 | |
China Mobile Limited (Telecommunication Services, Wireless Telecommunication Services) | | | | | | | 238,400 | | | | 2,640,985 | |
China Resources Land Limited (Financials, Real Estate Management & Development) | | | | | | | 338,600 | | | | 652,006 | |
China Resources Power Holdings Company (Utilities, Independent Power Producers & Energy Traders) | | | | | | | 644,000 | | | | 1,175,338 | |
Guangdong Investment Limited (Utilities, Water Utilities) | | | | | | | 476,000 | | | | 350,314 | |
Hang Seng Bank Limited (Financials, Commercial Banks) | | | | | | | 56,540 | | | | 776,832 | |
Henderson Land Development Company Limited (Financials, Real Estate Management & Development) | | | | | | | 96,900 | | | | 552,026 | |
Hong Kong Land Holdings Limited (Financials, Real Estate Management & Development) | | | | | | | 86,058 | | | | 534,420 | |
Johnson Electric Holdings Limited (Industrials, Electrical Equipment) | | | | | | | 367,500 | | | | 231,148 | |
Kingboard Laminates Holdings Limited (Information Technology, Electronic Equipment, Instruments & Components) | | | 306,000 | | | | 142,772 | |
Lonking Holdings Limited (Industrials, Machinery) « | | | | | | | 806,000 | | | | 292,953 | |
MGM China Holdings Limited (Consumer Discretionary, Hotels, Restaurants & Leisure) | | | | | | | 86,149 | | | | 159,670 | |
NWS Holdings Limited (Industrials, Industrial Conglomerates) | | | | | | | 54,484 | | | | 82,302 | |
Sands China Limited (Consumer Discretionary, Hotels, Restaurants & Leisure) | | | | | | | 209,428 | | | | 823,282 | |
Sino Land Company (Financials, Real Estate Management & Development) | | | | | | | 593,753 | | | | 1,025,474 | |
Sun Hung Kai Properties Limited (Financials, Real Estate Management & Development) | | | | | | | 72,823 | | | | 878,533 | |
Wynn Macau Limited (Consumer Discretionary, Hotels, Restaurants & Leisure) | | | | | | | 236,344 | | | | 758,504 | |
Yue Yuen Industrial Holdings Limited (Consumer Discretionary, Textiles, Apparel & Luxury Goods) | | | | | | | 92,000 | | | | 308,301 | |
| | | | |
| | | | | | | | | | | 15,541,249 | |
| | | | | | | | | | | | |
The accompanying notes are an integral part of these financial statements.
| | | | | | |
| Portfolio of Investments—April 30, 2012 (Unaudited) | | Wells Fargo Advantage Diversified International Fund | | | 11 | |
| | | | | | | | | | | | |
| Security Name | | | | | | Shares | | | Value | |
| | | | | | | | | | | | |
| | | |
| India: 0.56% | | | | | | | | | | |
Coal India Limited (Energy, Oil, Gas & Consumable Fuels) | | | | | | | 46,653 | | | $ | 311,920 | |
Grasim Industries GDR (Industrials, Construction & Engineering) (i) | | | | | | | 3,700 | | | | 180,338 | |
Tata Motors Limited ADR (Consumer Discretionary, Auto Components) « | | | | | | | 9,100 | | | | 270,725 | |
Tata Steel Limited GDR (Industrials, Machinery) | | | | | | | 33,800 | | | | 296,088 | |
| | | | |
| | | | | | | | | | | 1,059,071 | |
| | | | | | | | | | | | |
| | | |
| Ireland: 0.86% | | | | | | | | | | |
Accenture plc (Information Technology, IT Services) | | | | | | | 6,367 | | | | 413,537 | |
Allied Irish Banks plc (Financials, Commercial Banks) † | | | | | | | 36,500 | | | | 3,624 | |
Covidien plc (Health Care, Health Care Equipment & Supplies) | | | | | | | 22,125 | | | | 1,221,964 | |
Irish Life & Permanent Group Holdings plc (Financials, Insurance) † | | | | | | | 65,300 | | | | 3,198 | |
| | | | |
| | | | | | | | | | | 1,642,323 | |
| | | | | | | | | | | | |
| | | |
| Israel: 0.42% | | | | | | | | | | |
Bank Hapoalim Limited (Financials, Commercial Banks) | | | | | | | 80,600 | | | | 299,728 | |
Teva Pharmaceutical Industries Limited (Health Care, Pharmaceuticals) | | | | | | | 11,200 | | | | 506,934 | |
| | | | |
| | | | | | | | | | | 806,662 | |
| | | | | | | | | | | | |
| | | |
| Italy: 1.53% | | | | | | | | | | |
Enel SpA (Utilities, Multi-Utilities) | | | | | | | 139,600 | | | | 458,276 | |
ENI SpA (Energy, Oil, Gas & Consumable Fuels) | | | | | | | 68,235 | | | | 1,514,711 | |
Fiat Industrial SpA (Consumer Discretionary, Auto Components) † | | | | | | | 83,215 | | | | 944,000 | |
| | | | |
| | | | | | | | | | | 2,916,987 | |
| | | | | | | | | | | | |
| | | |
| Japan: 16.11% | | | | | | | | | | |
Adeka Corporation (Materials, Chemicals) | | | | | | | 41,200 | | | | 379,800 | |
Alpine Electronics Incorporated (Information Technology, Electronic Equipment, Instruments & Components) | | | | | | | 18,500 | | | | 244,458 | |
Asahi Glass Company Limited (Industrials, Building Products) | | | | | | | 102,000 | | | | 808,692 | |
Bridgestone Corporation (Consumer Discretionary, Auto Components) | | | | | | | 31,050 | | | | 740,860 | |
Canon Incorporated (Information Technology, Office Electronics) | | | | | | | 22,300 | | | | 1,025,063 | |
Capcom Company Limited (Information Technology, Software) | | | | | | | 36,600 | | | | 837,528 | |
Comsys Holdings Corporation (Industrials, Construction & Engineering) | | | | | | | 34,400 | | | | 348,136 | |
Edion Corporation (Consumer Discretionary, Specialty Retail) | | | | | | | 26,900 | | | | 169,136 | |
Eizo Nanao Corporation (Information Technology, Computers & Peripherals) | | | | | | | 12,800 | | | | 247,535 | |
FamilyMart Company Limited (Consumer Staples, Food & Staples Retailing) | | | | | | | 24,600 | | | | 1,096,894 | |
Fukuoka Financial Group Incorporated (Financials, Commercial Banks) | | | | | | | 77,000 | | | | 322,119 | |
Hitachi Capital Corporation (Financials, Consumer Finance) | | | | | | | 14,500 | | | | 241,364 | |
Honda Motor Company Limited (Consumer Discretionary, Automobiles) | | | | | | | 61,000 | | | | 2,212,625 | |
Itochu Corporation (Industrials, Trading Companies & Distributors) | | | | | | | 106,700 | | | | 1,210,799 | |
Japan Tobacco Incorporated (Consumer Staples, Tobacco) | | | | | | | 491 | | | | 2,727,436 | |
JX Holdings Incorporated (Energy, Energy Equipment & Services) | | | | | | | 42,300 | | | | 240,004 | |
Kao Corporation (Consumer Staples, Personal Products) | | | | | | | 59,400 | | | | 1,597,342 | |
KDDI Corporation (Telecommunication Services, Wireless Telecommunication Services) | | | | | | | 100 | | | | 657,565 | |
Kyorin Company Limited (Health Care, Pharmaceuticals) | | | | | | | 20,000 | | | | 385,271 | |
Maeda Road Construction Company Limited (Industrials, Construction & Engineering) | | | | | | | 30,000 | | | | 363,727 | |
Marubeni Corporation (Industrials, Trading Companies & Distributors) | | | | | | | 91,000 | | | | 635,997 | |
Miraca Holdings Incorporated (Health Care, Health Care Providers & Services) | | | | | | | 6,700 | | | | 264,761 | |
Mitsubishi Corporation (Industrials, Trading Companies & Distributors) | | | | | | | 9,600 | | | | 209,579 | |
Mitsubishi UFJ Financial Group Incorporated (Financials, Commercial Banks) | | | | | | | 115,800 | | | | 561,305 | |
The accompanying notes are an integral part of these financial statements.
| | | | |
| 12 | | Wells Fargo Advantage Diversified International Fund | | Portfolio of Investments—April 30, 2012 (Unaudited) |
| | | | | | | | | | | | |
| Security Name | | | | | | Shares | | | Value | |
| | | | | | | | | | | | |
| | | | |
| Japan (continued) | | | | | | | | | | | | |
Mitsui & Company Limited (Industrials, Trading Companies & Distributors) | | | | | | | 20,900 | | | $ | 328,264 | |
Mitsui Engineering & Shipbuilding Company Limited (Industrials, Machinery) | | | | | | | 121,000 | | | | 178,833 | |
Mitsui OSK Lines Limited (Industrials, Marine) | | | | | | | 281,000 | | | | 1,098,096 | |
Mizuho Financial Group Incorporated (Financials, Commercial Banks) | | | | | | | 317,800 | | | | 505,519 | |
NGK Insulators Limited (Industrials, Machinery) | | | | | | | 56,000 | | | | 704,910 | |
Nihon Kohden Corporation (Health Care, Health Care Equipment & Supplies) | | | | | | | 14,200 | | | | 416,716 | |
Nintendo Company Limited (Information Technology, Software) | | | | | | | 7,000 | | | | 955,661 | |
Nippon Electric Glass Company Limited (Information Technology, Electronic Equipment, Instruments & Components) | | | 26,000 | | | | 212,325 | |
Nippon Telegraph & Telephone Corporation (Telecommunication Services, Diversified Telecommunication Services) | | | 14,300 | | | | 649,267 | |
Nissan Motor Company Limited (Consumer Discretionary, Automobiles) | | | | | | | 98,000 | | | | 1,026,152 | |
Nissan Shatai Company Limited (Consumer Discretionary, Auto Components) | | | | | | | 14,000 | | | | 148,171 | |
Nitto Denko Corporation (Materials, Chemicals) | | | | | | | 29,403 | | | | 1,218,987 | |
NTT DoCoMo Incorporated (Telecommunication Services, Wireless Telecommunication Services) | | | | | | | 300 | | | | 511,774 | |
Rengo Company Limited (Materials, Containers & Packaging) | | | | | | | 42,000 | | | | 307,740 | |
Sankyu Incorporated (Industrials, Road & Rail) | | | | | | | 63,000 | | | | 250,927 | |
Sega Sammy Holdings Incorporated (Consumer Discretionary, Leisure Equipment & Products) | | | | | | | 16,400 | | | | 344,063 | |
Seino Holdings Company Limited (Industrials, Transportation Infrastructure) | | | | | | | 3,000 | | | | 20,854 | |
Softbank Corporation (Telecommunication Services, Wireless Telecommunication Services) | | | | | | | 20,500 | | | | 615,205 | |
Sojitz Corporation (Industrials, Trading Companies & Distributors) | | | | | | | 143,400 | | | | 242,472 | |
Sumitomo Corporation (Industrials, Trading Companies & Distributors) | | | | | | | 42,300 | | | | 603,983 | |
Sumitomo Mitsui Financial Group Incorporated (Financials, Commercial Banks) | | | | | | | 14,200 | | | | 459,579 | |
Sumitomo Mitsui Trust Holdings Incorporated (Financials, Commercial Banks) | | | | | | | 80,000 | | | | 236,473 | |
Toshiba TEC Corporation (Information Technology, Office Electronics) | | | | | | | 60,000 | | | | 243,487 | |
Toyota Motor Corporation (Consumer Discretionary, Automobiles) | | | | | | | 22,300 | | | | 923,115 | |
Tsuruha Holdings Incorporated (Consumer Staples, Food & Staples Retailing) | | | | | | | 6,000 | | | | 360,721 | |
USS Company Limited (Consumer Discretionary, Specialty Retail) | | | | | | | 5,390 | | | | 548,856 | |
| | | | |
| | | | | | | | | | | 30,640,146 | |
| | | | | | | | | | | | |
| | | | |
| Liechtenstein: 0.09% | | | | | | | | | | | | |
Verwaltungs-Und Privat-Bank AG (Financials, Capital Markets) | | | | | | | 2,000 | | | | 170,550 | |
| | | | | | | | | | | | |
| | | | |
| Netherlands: 3.59% | | | | | | | | | | | | |
Aegon NV (Financials, Insurance) † | | | | | | | 43,900 | | | | 202,747 | |
Akzo Nobel NV (Materials, Chemicals) « | | | | | | | 31,886 | | | | 1,708,771 | |
ING Groep NV (Financials, Diversified Financial Services) † | | | | | | | 48,100 | | | | 339,170 | |
Koninklijke Ahold NV (Consumer Staples, Food & Staples Retailing) | | | | | | | 46,800 | | | | 593,597 | |
Koninklijke DSM NV (Consumer Staples, Food & Staples Retailing) | | | | | | | 9,000 | | | | 516,025 | |
Koninklijke Vopak NV (Industrials, Transportation Infrastructure) | | | | | | | 10,567 | | | | 681,123 | |
Nutreco Holding NV (Consumer Staples, Food Products) | | | | | | | 3,100 | | | | 225,281 | |
Royal KPN NV (Telecommunication Services, Diversified Telecommunication Services) | | | | | | | 22,500 | | | | 201,960 | |
Unilever NV (Consumer Staples, Food Products) | | | | | | | 68,260 | | | | 2,337,504 | |
Ziggo NV (Telecommunication Services, Diversified Telecommunication Services) † | | | | | | | 722 | | | | 22,708 | |
| | | | |
| | | | | | | | | | | 6,828,886 | |
| | | | | | | | | | | | |
| | | | |
| Netherlands Antilles: 0.73% | | | | | | | | | | | | |
Schlumberger Limited (Energy, Energy Equipment & Services) | | | | | | | 18,725 | | | | 1,388,272 | |
| | | | | | | | | | | | |
| | | | |
| Nigeria: 0.09% | | | | | | | | | | | | |
Nigerian Breweries plc (Consumer Staples, Beverages) | | | | | | | 251,197 | | | | 175,766 | |
| | | | | | | | | | | | |
The accompanying notes are an integral part of these financial statements.
| | | | | | |
| Portfolio of Investments—April 30, 2012 (Unaudited) | | Wells Fargo Advantage Diversified International Fund | | | 13 | |
| | | | | | | | | | | | |
| Security Name | | | | | | Shares | | | Value | |
| | | | | | | | | | | | |
| | | | |
| Norway: 1.15% | | | | | | | | | | | | |
Atea ASA (Information Technology, IT Services) | | | | | | | 32,100 | | | $ | 342,149 | |
DnB Nor ASA (Financials, Commercial Banks) | | | | | | | 20,100 | | | | 216,701 | |
Statoil ASA (Energy, Oil, Gas & Consumable Fuels) | | | | | | | 60,852 | | | | 1,624,719 | |
| | | | |
| | | | | | | | | | | 2,183,569 | |
| | | | | | | | | | | | |
| | | | |
| Philippines: 0.35% | | | | | | | | | | | | |
Philippine Long Distance Telephone Company (Telecommunication Services, Wireless Telecommunication Services) | | | 10,740 | | | | 658,340 | |
| | | | | | | | | | | | |
| | | | |
| Portugal: 0.02% | | | | | | | | | | | | |
Banco Espirito Santo SA (Financials, Commercial Banks) (a)†« | | | | | | | 51,000 | | | | 43,206 | |
| | | | | | | | | | | | |
| | | | |
| Russia: 1.39% | | | | | | | | | | | | |
Gazprom Neft Sponsored ADR (Energy, Oil, Gas & Consumable Fuels) | | | | | | | 19,600 | | | | 483,924 | |
Lukoil ADR (Energy, Oil, Gas & Consumable Fuels) | | | | | | | 8,300 | | | | 507,115 | |
Mobile Telesystems ADR (Telecommunication Services, Wireless Telecommunication Services) | | | | | | | 34,722 | | | | 679,162 | |
Sberbank of Russia (Financials, Commercial Banks) | | | | | | | 300,609 | | | | 964,462 | |
| | | | |
| | | | | | | | | | | 2,634,663 | |
| | | | | | | | | | | | |
| | | | |
| Singapore: 0.96% | | | | | | | | | | | | |
City Developments Limited (Financials, Real Estate Management & Development) | | | | | | | 27,459 | | | | 224,997 | |
DBS Group Holdings Limited (Financials, Commercial Banks) | | | | | | | 104,000 | | | | 1,173,204 | |
Indofood Agri Resources Limited (Consumer Staples, Food Products) † | | | | | | | 375,000 | | | | 431,818 | |
| | | | |
| | | | | | | | | | | 1,830,019 | |
| | | | | | | | | | | | |
| | | | |
| South Africa: 0.48% | | | | | | | | | | | | |
Exxaro Resources Limited (Materials, Metals & Mining) | | | | | | | 16,400 | | | | 436,723 | |
Imperial Holding Limited (Consumer Discretionary, Distributors) | | | | | | | 13,400 | | | | 291,018 | |
Kumba Iron Ore Limited (Materials, Metals & Mining) | | | | | | | 2,600 | | | | 183,795 | |
| | | | |
| | | | | | | | | | | 911,536 | |
| | | | | | | | | | | | |
| | | | |
| South Korea: 2.35% | | | | | | | | | | | | |
Industrial Bank of Korea (Financials, Commercial Banks) | | | | | | | 31,700 | | | | 350,625 | |
NHN Corporation (Information Technology, Internet Software & Services) | | | | | | | 3,142 | | | | 711,737 | |
Samsung Electronics Company Limited (Information Technology, Semiconductors & Semiconductor Equipment) | | | | | | | 613 | | | | 753,961 | |
Samsung Electronics GDR (Information Technology, Semiconductors & Semiconductor Equipment) 144A | | | | | | | 1,593 | | | | 979,657 | |
SK Telecom Company Limited (Telecommunication Services, Wireless Telecommunication Services) | | | | | | | 10,827 | | | | 1,293,348 | |
Woori Finance Holdings Company Limited (Financials, Commercial Banks) | | | | | | | 35,900 | | | | 379,608 | |
| | | | |
| | | | | | | | | | | 4,468,936 | |
| | | | | | | | | | | | |
| | | | |
| Spain: 0.65% | | | | | | | | | | | | |
Banco Bilbao Vizcaya Argentaria SA (Financials, Commercial Banks) | | | | | | | 23,800 | | | | 160,860 | |
Banco Santander Central Hispano SA (Financials, Commercial Banks) | | | | | | | 70,400 | | | | 439,850 | |
Grifols SA (Health Care, Biotechnology) † | | | | | | | 18,380 | | | | 462,871 | |
Telefonica SA (Telecommunication Services, Diversified Telecommunication Services) † | | | | | | | 12,500 | | | | 182,174 | |
| | | | |
| | | | | | | | | | | 1,245,755 | |
| | | | | | | | | | | | |
| | | | |
| Sweden: 1.11% | | | | | | | | | | | | |
Boliden AB (Materials, Metals & Mining) | | | | | | | 22,100 | | | | 353,795 | |
Hennes & Mauritz AB Class B (Consumer Discretionary, Specialty Retail) | | | | | | | 18,069 | | | | 620,733 | |
The accompanying notes are an integral part of these financial statements.
| | | | |
| 14 | | Wells Fargo Advantage Diversified International Fund | | Portfolio of Investments—April 30, 2012 (Unaudited) |
| | | | | | | | | | | | |
| Security Name | | | | | | Shares | | | Value | |
| | | | | | | | | | | | |
| | | | |
| Sweden (continued) | | | | | | | | | | | | |
Saab AB (Industrials, Aerospace & Defense) | | | | | | | 20,300 | | | $ | 338,268 | |
Volvo AB Class B (Consumer Discretionary, Automobiles) | | | | | | | 56,978 | | | | 790,078 | |
| | | | |
| | | | | | | | | | | 2,102,874 | |
| | | | | | | | | | | | |
| | | | |
| Switzerland: 7.98% | | | | | | | | | | | | |
ABB Limited (Industrials, Electrical Equipment) | | | | | | | 39,399 | | | | 717,963 | |
Adecco SA (Industrials, Professional Services) † | | | | | | | 3,912 | | | | 190,503 | |
Baloise Holding AG (Financials, Insurance) | | | | | | | 5,800 | | | | 448,907 | |
Compagnie Financiere Richemont SA (Consumer Discretionary, Textiles, Apparel & Luxury Goods) | | | | | 26,835 | | | | 1,658,617 | |
Credit Suisse Group AG (Financials, Capital Markets) | | | | | | | 11,100 | | | | 265,500 | |
Georg Fischer AG (Industrials, Machinery) | | | | | | | 500 | | | | 221,589 | |
Givaudan SA (Materials, Chemicals) | | | | | | | 681 | | | | 661,005 | |
Julius Baer Group Limited (Financials, Capital Markets) | | | | | | | 26,772 | | | | 1,024,984 | |
Nestle SA (Consumer Staples, Food Products) | | | | | | | 42,080 | | | | 2,577,698 | |
Novartis AG (Health Care, Pharmaceuticals) | | | | | | | 36,766 | | | | 2,027,366 | |
Roche Holdings AG (Health Care, Pharmaceuticals) | | | | | | | 6,269 | | | | 1,145,156 | |
Swatch Group AG Class B (Consumer Discretionary, Textiles, Apparel & Luxury Goods) | | | | | | | 4,348 | | | | 2,005,258 | |
Swiss Re Limited (Financials, Insurance) | | | | | | | 6,100 | | | | 382,405 | |
Valora Holding AG (Consumer Discretionary, Specialty Retail) | | | | | | | 1,120 | | | | 234,452 | |
Zurich Financial Services AG (Financials, Insurance) | | | | | | | 6,612 | | | | 1,617,214 | |
| | | | |
| | | | | | | | | | | 15,178,617 | |
| | | | | | | | | | | | |
| | | | |
| Taiwan: 0.56% | | | | | | | | | | | | |
High Tech Computer Corporation (Information Technology, Communications Equipment) | | | | | | | 42,000 | | | | 637,006 | |
Taiwan Semiconductor Manufacturing Company Limited ADR (Information Technology, Semiconductors & Semiconductor Equipment) | | | 27,195 | | | | 423,698 | |
| | | | |
| | | | | | | | | | | 1,060,704 | |
| | | | | | | | | | | | |
| | | | |
| Thailand: 0.01% | | | | | | | | | | | | |
Bumrungrad Hospital (Health Care, Health Care Providers & Services) | | | | | | | 13,600 | | | | 26,979 | |
| | | | | | | | | | | | |
| | | | |
| United Kingdom: 14.43% | | | | | | | | | | | | |
Amlin plc (Financials, Insurance) | | | | | | | 41,300 | | | | 221,051 | |
AstraZeneca plc (Health Care, Pharmaceuticals) | | | | | | | 21,300 | | | | 933,157 | |
Aviva plc (Financials, Insurance) | | | | | | | 44,700 | | | | 223,507 | |
BAE Systems plc (Industrials, Aerospace & Defense) | | | | | | | 114,100 | | | | 546,630 | |
Barclays plc (Financials, Commercial Banks) | | | | | | | 61,200 | | | | 216,769 | |
BP plc (Energy, Oil, Gas & Consumable Fuels) | | | | | | | 285,205 | | | | 2,059,724 | |
BT Group plc (Telecommunication Services, Diversified Telecommunication Services) | | | | | | | 224,300 | | | | 767,347 | |
Capita Group plc (Industrials, Commercial Services & Supplies) | | | | | | | 89,748 | | | | 965,673 | |
Chemring Group plc (Industrials, Aerospace & Defense) | | | | | | | 145,498 | | | | 770,960 | |
Diageo plc (Consumer Staples, Beverages) | | | | | | | 14,736 | | | | 370,922 | |
Firstgroup plc (Industrials, Road & Rail) | | | | | | | 51,700 | | | | 163,445 | |
Genting Singapore plc (Consumer Staples, Hotels, Restaurants & Leisure) † | | | | | | | 425,592 | | | | 594,969 | |
GlaxoSmithKline plc (Health Care, Pharmaceuticals) | | | | | | | 16,500 | | | | 381,584 | |
Greene King plc (Consumer Discretionary, Hotels, Restaurants & Leisure) | | | | | | | 31,300 | | | | 259,317 | |
Home Retail Group (Consumer Discretionary, Internet & Catalog Retail) | | | | | | | 126,500 | | | | 218,846 | |
HSBC Holdings plc (Financials, Commercial Banks) | | | | | | | 176,268 | | | | 1,587,948 | |
Imperial Tobacco Group plc (Consumer Staples, Tobacco) | | | | | | | 46,805 | | | | 1,871,650 | |
The accompanying notes are an integral part of these financial statements.
| | | | | | |
| Portfolio of Investments—April 30, 2012 (Unaudited) | | Wells Fargo Advantage Diversified International Fund | | | 15 | |
| | | | | | | | | | | | | | |
| Security Name | | | | | | | Shares | | | Value | |
| | | | | | | | | | | | | | |
| | | | |
| United Kingdom (continued) | | | | | | | | | | | | | | |
Johnson Matthey plc (Materials, Chemicals) | | | | | | | | | 15,454 | | | $ | 580,358 | |
Kesa Electricals plc (Consumer Discretionary, Specialty Retail) | | | | | | | | | 116,100 | | | | 102,688 | |
Land Securities Group plc (Financials, REITs) | | | | | | | | | 16,703 | | | | 197,206 | |
LogicaCMG plc (Industrials, Professional Services) | | | | | | | | | 142,000 | | | | 179,522 | |
Man Group plc (Financials, Capital Markets) | | | | | | | | | 254,956 | | | | 428,250 | |
Marston’s plc (Consumer Discretionary, Hotels, Restaurants & Leisure) | | | | | | | | | 142,800 | | | | 226,072 | |
Old Mutual plc (Financials, Commercial Banks) | | | | | | | | | 153,825 | | | | 368,972 | |
Pace plc (Consumer Discretionary, Household Durables) | | | | | | | | | 190,500 | | | | 224,916 | |
Prudential plc (Financials, Insurance) | | | | | | | | | 26,295 | | | | 321,976 | |
Reckitt Benckiser Group (Consumer Staples, Household Products) | | | | | | | | | 15,920 | | | | 926,757 | |
Royal & Sun Alliance Insurance Group plc (Financials, Insurance) | | | | | | | | | 127,200 | | | | 216,754 | |
Royal Dutch Shell plc Class A (Energy, Oil, Gas & Consumable Fuels) | | | | | | | | | 8,647 | | | | 307,555 | |
Royal Dutch Shell plc Class B (Energy, Oil, Gas & Consumable Fuels) | | | | | | | | | 47,600 | | | | 1,735,422 | |
SABMiller plc (Consumer Staples, Beverages) | | | | | | | | | 34,017 | | | | 1,429,012 | |
Smiths Group plc (Industrials, Industrial Conglomerates) | | | | | | | | | 79,477 | | | | 1,380,120 | |
Standard Chartered plc (Financials, Commercial Banks) | | | | | | | | | 20,578 | | | | 502,944 | |
Tate & Lyle plc (Consumer Staples, Food Products) | | | | | | | | | 40,224 | | | | 450,755 | |
Thomas Cook Group plc (Consumer Discretionary, Hotels, Restaurants & Leisure) | | | | | | | | | 233,700 | | | | 85,336 | |
Tullett Prebon plc (Financials, Capital Markets) | | | | | | | | | 44,400 | | | | 247,515 | |
Vodafone Group plc (Telecommunication Services, Wireless Telecommunication Services) | | | | | | | | | 276,700 | | | | 765,641 | |
Vodafone Group plc ADR (Telecommunication Services, Wireless Telecommunication Services) | | | | | | | | | 32,208 | | | | 896,349 | |
WH Smith Public Limited Corporation (Consumer Discretionary, Specialty Retail) | | | | | | | | | 45,300 | | | | 387,436 | |
William Morrison Supermarkets plc (Consumer Staples, Food & Staples Retailing) | | | | | | | | | 278,778 | | | | 1,269,515 | |
Wolseley plc (Industrials, Trading Companies & Distributors) | | | | | | | | | 27,043 | | | | 1,028,298 | |
WPP plc (Consumer Discretionary, Media) | | | | | | | | | 76,559 | | | | 1,035,604 | |
| | | | |
| | | | | | | | | | | | | 27,448,472 | |
| | | | | | | | | | | | | | |
| | | | |
| United States: 0.44% | | | | | | | | | | | | | | |
Amdocs Limited (Information Technology, IT Services) † | | | | | | | | | 25,860 | | | | 827,520 | |
| | | | | | | | | | | | | | |
| | | | |
| Virgin Islands (British): 0.24% | | | | | | | | | | | | | | |
Arcos Dorados Holdings Incorporated Class A (Consumer Discretionary, Hotels, Restaurants & Leisure) « | | | | | | | | | 25,387 | | | | 453,666 | |
| | | | | | | | | | | | | | |
| | | |
Total Common Stocks (Cost $186,451,411) | | | | | | | | | | 181,595,502 | |
| | | | | | | | | | | | | | |
| | | | |
| | | Dividend Yield | | | | | | | | | |
| Preferred Stocks: 0.78% | | | | | | | | | | | | | | |
| | | | |
| Brazil: 0.30% | | | | | | | | | | | | | | |
Cia Energetica de Minas Gerais (Energy, Oil, Gas & Consumable Fuels) | | | 6.88 | % | | | | | 15,875 | | | | 314,643 | |
Companhia Vale do Rio Doce Class A (Materials, Metals & Mining) | | | 7.32 | | | | | | 12,200 | | | | 265,295 | |
| | | | |
| | | | | | | | | | | | | 579,938 | |
| | | | | | | | | | | | | | |
| | | | |
| Germany: 0.48% | | | | | | | | | | | | | | |
Henkel KGaA (Consumer Staples, Household Products) | | | 1.61 | | | | | | 12,282 | | | | 913,682 | |
| | | | | | | | | | | | | | |
| | | | |
Total Preferred Stocks (Cost $1,428,611) | | | | | | | | | | | | | 1,493,620 | |
| | | | | | | | | | | | | | |
The accompanying notes are an integral part of these financial statements.
| | | | |
| 16 | | Wells Fargo Advantage Diversified International Fund | | Portfolio of Investments—April 30, 2012 (Unaudited) |
| | | | | | | | | | | | | | |
| Security Name | | Yield | | | | | Shares | | | Value | |
| | | | | | | | | | | | | | |
| | | | |
Short-Term Investments: 12.65% | | | | | | | | | | | | | | |
| | | | |
| Investment Companies: 12.65% | | | | | | | | | | | | | | |
Wells Fargo Advantage Cash Investment Money Market Fund, Select Class (u)(l) | | | 0.11 | % | | | | | 5,082,548 | | | $ | 5,082,548 | |
Wells Fargo Securities Lending Cash Investments, LLC (v)(u)(l)(r) | | | 0.19 | | | | | | 18,974,853 | | | | 18,974,853 | |
| | | | |
Total Short-Term Investments (Cost $24,057,401) | | | | | | | | | | | | | 24,057,401 | |
| | | | | | | | | | | | | | |
| | | | | | | | |
| Total Investments in Securities | | | | | | | | |
| (Cost $211,937,423) * | | | 108.89 | % | | | 207,146,523 | |
Other Assets and Liabilities, Net | | | (8.89 | ) | | | (16,912,103 | ) |
| | | | | | | | |
| Total Net Assets | | | 100.00 | % | | $ | 190,234,420 | |
| | | | | | | | |
| † | Non-income earning security |
| « | All or a portion of this security is on loan. |
| (a) | Security is fair valued by the Management Valuation Team, and in certain instances by the Board of Trustees, in accordance with procedures approved by the Board of Trustees. |
| 144A | Security that may be resold to “qualified institutional buyers” under Rule 144A or security offered pursuant to Section 4(2) of the Securities Act of 1933, as amended. |
| (u) | Rate shown is the 7-day annualized yield at period end. |
| (l) | Investment in an affiliate |
| (v) | Security represents investment of cash collateral received from securities on loan. |
| (r) | The investment company is exempt from registration under Section 3(c)(7) of the 1940 Act. |
| * | Cost for federal income tax purposes is $216,532,057 and net unrealized appreciation (depreciation) consists of: |
| | | | |
Gross unrealized appreciation | | $ | 10,780,362 | |
Gross unrealized depreciation | | | (20,165,896 | ) |
| | | | |
Net unrealized depreciation | | $ | (9,385,534 | ) |
The accompanying notes are an integral part of these financial statements.
| | | | | | |
| Statement of Assets and Liabilities—April 30, 2012 (Unaudited) | | Wells Fargo Advantage Diversified International Fund | | | 17 | |
| | | | |
| �� | | | |
| |
Assets | | | | |
Investments | | | | |
In unaffiliated securities (including securities on loan), at value (see cost below) | | $ | 183,089,122 | |
In affiliated securities, at value (see cost below) | | | 24,057,401 | |
| | | | |
Total investments, at value (see cost below) | | | 207,146,523 | |
Foreign currency, at value (see cost below) | | | 1,536,748 | |
Receivable for investments sold | | | 248,015 | |
Receivable for Fund shares sold | | | 115,822 | |
Receivable for dividends | | | 1,266,805 | |
Receivable for securities lending income | | | 43,323 | |
Prepaid expenses and other assets | | | 63,094 | |
| | | | |
Total assets | | | 210,420,330 | |
| | | | |
| |
Liabilities | | | | |
Payable for investments purchased | | | 875,577 | |
Payable for Fund shares redeemed | | | 68,781 | |
Payable upon receipt of securities loaned | | | 18,974,853 | |
Due to custodian bank | | | 131 | |
Advisory fee payable | | | 155,464 | |
Distribution fees payable | | | 610 | |
Due to other related parties | | | 14,339 | |
Accrued expenses and other liabilities | | | 96,155 | |
| | | | |
Total liabilities | | | 20,185,910 | |
| | | | |
Total net assets | | $ | 190,234,420 | |
| | | | |
| |
NET ASSETS CONSIST OF | | | | |
Paid-in capital | | $ | 298,264,761 | |
Undistributed net investment income | | | 2,767,378 | |
Accumulated net realized losses on investments | | | (106,028,452 | ) |
Net unrealized losses on investments | | | (4,769,267 | ) |
| | | | |
Total net assets | | $ | 190,234,420 | |
| | | | |
| |
COMPUTATION OF NET ASSET VALUE AND OFFERING PRICE PER SHARE1 | | | | |
Net assets – Class A | | $ | 23,812,982 | |
Shares outstanding – Class A | | | 2,354,464 | |
Net asset value per share – Class A | | | $10.11 | |
Maximum offering price per share – Class A2 | | | $10.73 | |
Net assets – Class B | | $ | 310,582 | |
Shares outstanding – Class B | | | 31,998 | |
Net asset value per share – Class B | | | $9.71 | |
Net assets – Class C | | $ | 638,792 | |
Shares outstanding – Class C | | | 67,595 | |
Net asset value per share – Class C | | | $9.45 | |
Net assets – Administrator Class | | $ | 3,377,370 | |
Shares outstanding – Administrator Class | | | 328,619 | |
Net asset value per share – Administrator Class | | | $10.28 | |
Net assets – Institutional Class | | $ | 120,910,960 | |
Shares outstanding – Institutional Class | | | 11,984,772 | |
Net asset value per share – Institutional Class | | | $10.09 | |
Net assets – Investor Class | | $ | 41,183,734 | |
Shares outstanding – Investor Class | | | 4,086,801 | |
Net asset value per share – Investor Class | | | $10.08 | |
| |
Investments in unaffiliated securities, at cost | | $ | 187,880,022 | |
| | | | |
Investments in affiliated securities, at cost | | $ | 24,057,401 | |
| | | | |
Total investments, at cost | | $ | 211,937,423 | |
| | | | |
Securities on loan, at value | | $ | 18,145,548 | |
| | | | |
Foreign currency, at cost | | $ | 1,527,166 | |
| | | | |
| 1. | The Fund has an unlimited amount of authorized shares. |
| 2. | Maximum offering price is computed as 100/94.25 of net asset value. On investments of $50,000 or more, the offering price is reduced. |
The accompanying notes are an integral part of these financial statements.
| | | | |
| 18 | | Wells Fargo Advantage Diversified International Fund | | Statement of Operations—Six Months Ended April 30, 2012 (Unaudited) |
| | | | |
| | | | |
| |
Investment income | | | | |
Dividends* | | $ | 3,933,874 | |
Securities lending income, net | | | 113,745 | |
Income from affiliated securities | | | 4,292 | |
| | | | |
Total investment income | | | 4,051,911 | |
| | | | |
| |
Expenses | | | | |
Advisory fee | | | 1,223,370 | |
Administration fees | | | | |
Fund level | | | 71,963 | |
Class A | | | 30,283 | |
Class B | | | 536 | |
Class C | | | 818 | |
Administrator Class | | | 1,624 | |
Institutional Class | | | 88,111 | |
Investor Class | | | 65,985 | |
Shareholder servicing fees | | | | |
Class A | | | 29,118 | |
Class B | | | 516 | |
Class C | | | 787 | |
Administrator Class | | | 4,060 | |
Investor Class | | | 49,427 | |
Distribution fees | | | | |
Class B | | | 1,547 | |
Class C | | | 2,360 | |
Custody and accounting fees | | | 112,978 | |
Professional fees | | | 7,933 | |
Registration fees | | | 59,615 | |
Shareholder report expenses | | | 32,524 | |
Trustees’ fees and expenses | | | 8,793 | |
Other fees and expenses | | | 36,562 | |
| | | | |
Total expenses | | | 1,828,910 | |
Less: Fee waivers and/or expense reimbursements | | | (250,592 | ) |
| | | | |
Net expenses | | | 1,578,318 | |
| | | | |
Net investment income | | | 2,473,593 | |
| | | | |
| |
REALIZED AND UNREALIZED GAINS (LOSSES) ON INVESTMENTS | | | | |
| |
Net realized losses on investments | | | | |
Unaffiliated securities | | | (9,228,388 | ) |
Forward foreign currency contract transactions | | | (485 | ) |
| | | | |
Net realized losses on investments | | | (9,228,873 | ) |
| | | | |
| |
Net change in unrealized gains (losses) on: | | | | |
Unaffiliated securities | | | 9,922,919 | |
Forward foreign currency contract transactions | | | 200,267 | |
| | | | |
Net change in unrealized gains (losses) on investments | | | 10,123,186 | |
| | | | |
Net realized and unrealized gains (losses) on investments | | | 894,313 | |
| | | | |
Net increase in net assets resulting from operations | | $ | 3,367,906 | |
| | | | |
| |
* Net of foreign dividend withholding taxes of | | | $292,636 | |
The accompanying notes are an integral part of these financial statements.
| | | | | | |
| Statements of Changes in Net Assets | | Wells Fargo Advantage Diversified International Fund | | | 19 | |
| | | | | | | | | | | | | | | | |
| | | Six Months Ended April 30, 2012 (Unaudited) | | | Year Ended
October 31, 2011 | |
| | | | |
Operations | | | | | | | | | | | | | | | | |
Net investment income | | | | | | $ | 2,473,593 | | | | | | | $ | 9,089,872 | |
Net realized gains (losses) on investments | | | | | | | (9,228,873 | ) | | | | | | | 28,624,907 | |
Net change in unrealized gains (losses) on investments | | | | | | | 10,123,186 | | | | | | | | (61,111,147 | ) |
| | | | | | | | | | | | | | | | |
Net increase (decrease) in net assets resulting from operations | | | | | | | 3,367,906 | | | | | | | | (23,396,368 | ) |
| | | | | | | | | | | | | | | | |
| | | | |
Distributions to shareholders from | | | | | | | | | | | | | | | | |
Net investment income | | | | | | | | | | | | | | | | |
Class A | | | | | | | (338,231 | ) | | | | | | | (311,102 | ) |
Class B | | | | | | | (191 | ) | | | | | | | 0 | |
Class C | | | | | | | (4,213 | ) | | | | | | | (3,178 | ) |
Administrator Class | | | | | | | 0 | | | | | | | | (2,469,967 | ) |
Institutional Class | | | | | | | (8,142,523 | ) | | | | | | | (3,000,704 | ) |
Investor Class | | | | | | | (563,955 | ) | | | | | | | (499,616 | ) |
| | | | | | | | | | | | | | | | |
Total distributions to shareholders | | | | | | | (9,049,113 | ) | | | | | | | (6,284,567 | ) |
| | | | | | | | | | | | | | | | |
| | | | |
Capital share transactions | | | Shares | | | | | | | | Shares | | | | | |
Proceeds from shares sold | | | | | | | | | | | | | | | | |
Class A | | | 56,456 | | | | 559,945 | | | | 70,137 | | | | 749,686 | |
Class B | | | 0 | | | | 0 | | | | 578 | | | | 6,070 | |
Class C | | | 3,376 | | | | 28,781 | | | | 8,780 | | | | 88,902 | |
Administrator Class | | | 29,101 | | | | 299,321 | | | | 113,988 | | | | 1,206,133 | |
Institutional Class | | | 1,439,447 | | | | 13,460,285 | | | | 27,584,224 | | | | 295,522,173 | |
Investor Class | | | 170,666 | | | | 1,655,648 | | | | 489,574 | | | | 5,070,033 | |
| | | | | | | | | | | | | | | | |
| | | | | | | 16,003,980 | | | | | | | | 302,642,997 | |
| | | | | | | | | | | | | | | | |
Reinvestment of distributions | | | | | | | | | | | | | | | | |
Class A | | | 36,260 | | | | 321,260 | | | | 28,499 | | | | 295,248 | |
Class B | | | 19 | | | | 171 | | | | 0 | | | | 0 | |
Class C | | | 430 | | | | 3,580 | | | | 277 | | | | 2,687 | |
Administrator Class | | | 0 | | | | 0 | | | | 236,741 | | | | 2,445,535 | |
Institutional Class | | | 626,409 | | | | 5,524,925 | | | | 124,751 | | | | 1,287,429 | |
Investor Class | | | 63,062 | | | | 556,837 | | | | 47,692 | | | | 492,178 | |
| | | | | | | | | | | | | | | | |
| | | | | | | 6,406,773 | | | | | | | | 4,523,077 | |
| | | | | | | | | | | | | | | | |
Payment for shares redeemed | | | | | | | | | | | | | | | | |
Class A | | | (201,744 | ) | | | (1,957,341 | ) | | | (530,722 | ) | | | (5,493,680 | ) |
Class B | | | (20,445 | ) | | | (193,240 | ) | | | (59,479 | ) | | | (603,610 | ) |
Class C | | | (5,601 | ) | | | (50,686 | ) | | | (17,261 | ) | | | (170,775 | ) |
Administrator Class | | | (53,848 | ) | | | (527,419 | ) | | | (19,669,772 | ) | | | (214,882,239 | ) |
Institutional Class | | | (33,413,836 | ) | | | (309,270,603 | ) | | | (3,723,416 | ) | | | (37,986,222 | ) |
Investor Class | | | (339,370 | ) | | | (3,267,033 | ) | | | (1,031,552 | ) | | | (10,607,271 | ) |
| | | | | | | | | | | | | | | | |
| | | | | | | (315,266,322 | ) | | | | | | | (269,743,797 | ) |
| | | | | | | | | | | | | | | | |
Net increase (decrease) in net assets resulting from capital share transactions | | | | | | | (292,855,569 | ) | | | | | | | 37,422,277 | |
| | | | | | | | | | | | | | | | |
Total increase (decrease) in net assets | | | | | | | (298,536,776 | ) | | | | | | | 7,741,342 | |
| | | | | | | | | | | | | | | | |
| | | | |
Net assets | | | | | | | | | | | | | | | | |
Beginning of period | | | | | | | 488,771,196 | | | | | | | | 481,029,854 | |
| | | | | | | | | | | | | | | | |
End of period | | | | | | $ | 190,234,420 | | | | | | | $ | 488,771,196 | |
| | | | | | | | | | | | | | | | |
Undistributed net investment income | | | | | | $ | 2,767,378 | | | | | | | $ | 9,342,898 | |
| | | | | | | | | | | | | | | | |
The accompanying notes are an integral part of these financial statements.
| | | | |
| 20 | | Wells Fargo Advantage Diversified International Fund | | Financial Highlights |
(For a share outstanding throughout each period)
| | | | | | | | | | | | | | | | | | | | | | | | | | | | |
| | | Six Months Ended
April 30, 2012 (Unaudited) | | | Year Ended October 31, | | | Year Ended September 30, | |
| Class A | | | 2011 | | | 20101 | | | 2010 | | | 2009 | | | 2008 | | | 2007 | |
Net asset value, beginning of period | | $ | 9.69 | | | $ | 10.29 | | | $ | 9.84 | | | $ | 9.62 | | | $ | 11.68 | | | $ | 19.49 | | | $ | 15.91 | |
Net investment income | | | 0.09 | | | | 0.16 | | | | 0.00 | 2,3 | | | 0.09 | 2 | | | 0.14 | 2 | | | 0.31 | 2 | | | 0.24 | 2 |
Net realized and unrealized gains (losses) on investments | | | 0.47 | | | | (0.65 | ) | | | 0.45 | | | | 0.26 | | | | (0.69 | ) | | | (5.91 | ) | | | 3.51 | |
| | | | | | | | | | | | | | | | | | | | | | | | | | | | |
Total from investment operations | | | 0.56 | | | | (0.49 | ) | | | 0.45 | | | | 0.35 | | | | (0.55 | ) | | | (5.60 | ) | | | 3.75 | |
Distributions to shareholders from | | | | | | | | | | | | | | | | | | | | | | | | | | | | |
Net investment income | | | (0.14 | ) | | | (0.11 | ) | | | 0.00 | | | | (0.13 | ) | | | (0.23 | ) | | | (0.23 | ) | | | (0.17 | ) |
Net realized gains | | | 0.00 | | | | 0.00 | | | | 0.00 | | | | 0.00 | | | | (1.28 | ) | | | (1.98 | ) | | | 0.00 | |
| | | | | | | | | | | | | | | | | | | | | | | | | | | | |
Total distributions to shareholders | | | (0.14 | ) | | | (0.11 | ) | | | 0.00 | | | | (0.13 | ) | | | (1.51 | ) | | | (2.21 | ) | | | (0.17 | ) |
Net asset value, end of period | | $ | 10.11 | | | $ | 9.69 | | | $ | 10.29 | | | $ | 9.84 | | | $ | 9.62 | | | $ | 11.68 | | | $ | 19.49 | |
Total return4 | | | 5.98 | % | | | (4.83 | )% | | | 4.57 | % | | | 3.64 | % | | | (0.78 | )% | | | (32.12 | )% | | | 23.68 | % |
Ratios to average net assets (annualized) | | | | | | | | | | | | | | | | | | | | | | | | | | | | |
Gross expenses | | | 1.62 | % | | | 1.47 | % | | | 1.54 | % | | | 1.64 | % | | | 1.76 | % | | | 1.67 | % | | | 1.70 | % |
Net expenses | | | 1.41 | % | | | 1.41 | % | | | 1.41 | % | | | 1.38 | % | | | 1.41 | % | | | 1.48 | % | | | 1.50 | % |
Net investment income | | | 1.86 | % | | | 1.47 | % | | | 0.59 | % | | | 0.99 | % | | | 1.76 | % | | | 1.93 | % | | | 1.32 | % |
Supplemental data | | | | | | | | | | | | | | | | | | | | | | | | | | | | |
Portfolio turnover rate | | | 35 | % | | | 53 | % | | | 5 | % | | | 64 | % | | | 123 | % | | | 62 | % | | | 49 | % |
Net assets, end of period (000’s omitted) | | | $23,813 | | | | $23,862 | | | | $29,804 | | | | $28,926 | | | | $31,742 | | | | $37,819 | | | | $62,693 | |
| 1. | For the one month ended October 31, 2010. The Fund changed its fiscal year end from September 30 to October 31, effective October 31, 2010. |
| 2. | Calculated based upon average shares outstanding |
| 3. | Amount is less than $0.005. |
| 4. | Total return calculations do not include any sales charges. Returns for periods of less than one year are not annualized. |
The accompanying notes are an integral part of these financial statements.
| | | | | | |
| Financial Highlights | | Wells Fargo Advantage Diversified International Fund | | | 21 | |
(For a share outstanding throughout each period)
| | | | | | | | | | | | | | | | | | | | | | | | | | | | |
| | | Six Months Ended
April 30, 2012 (Unaudited) | | | Year Ended October 31, | | | Year Ended September 30, | |
| Class B | | | 2011 | | | 20101 | | | 2010 | | | 2009 | | | 2008 | | | 2007 | |
Net asset value, beginning of period | | $ | 9.19 | | | $ | 9.74 | | | $ | 9.32 | | | $ | 9.12 | | | $ | 11.07 | | | $ | 18.52 | | | $ | 15.13 | |
Net investment income (loss) | | | 0.04 | 2 | | | 0.06 | 2 | | | (0.00 | )2 | | | (0.05 | )2 | | | 0.07 | 2 | | | 0.16 | 2 | | | 0.07 | 2 |
Net realized and unrealized gains (losses) on investments | | | 0.48 | | | | (0.61 | ) | | | 0.42 | | | | 0.32 | | | | (0.64 | ) | | | (5.58 | ) | | | 3.36 | |
| | | | | | | | | | | | | | | | | | | | | | | | | | | | |
Total from investment operations | | | 0.52 | | | | (0.55 | ) | | | 0.42 | | | | 0.27 | | | | (0.57 | ) | | | (5.42 | ) | | | 3.43 | |
Distributions to shareholders from | | | | | | | | | | | | | | | | | | | | | | | | | | | | |
Net investment income | | | (0.00 | )3 | | | 0.00 | | | | 0.00 | | | | (0.07 | ) | | | (0.10 | ) | | | (0.05 | ) | | | (0.04 | ) |
Net realized gains | | | 0.00 | | | | 0.00 | | | | 0.00 | | | | 0.00 | | | | (1.28 | ) | | | (1.98 | ) | | | 0.00 | |
| | | | | | | | | | | | | | | | | | | | | | | | | | | | |
Total distributions to shareholders | | | (0.00 | )3 | | | 0.00 | | | | 0.00 | | | | (0.07 | ) | | | (1.38 | ) | | | (2.03 | ) | | | (0.04 | ) |
Net asset value, end of period | | $ | 9.71 | | | $ | 9.19 | | | $ | 9.74 | | | $ | 9.32 | | | $ | 9.12 | | | $ | 11.07 | | | $ | 18.52 | |
Total return4 | | | 5.71 | % | | | (5.65 | )% | | | 4.51 | % | | | 3.00 | % | | | (1.50 | )% | | | (32.61 | )% | | | 22.73 | % |
Ratios to average net assets (annualized) | | | | | | | | | | | | | | | | | | | | | | | | | | | | |
Gross expenses | | | 2.36 | % | | | 2.23 | % | | | 2.28 | % | | | 2.39 | % | | | 2.51 | % | | | 2.43 | % | | | 2.45 | % |
Net expenses | | | 2.16 | % | | | 2.16 | % | | | 2.16 | % | | | 2.13 | % | | | 2.16 | % | | | 2.23 | % | | | 2.25 | % |
Net investment income (loss) | | | 0.90 | % | | | 0.64 | % | | | (0.16 | )% | | | (0.59 | )% | | | 0.93 | % | | | 1.03 | % | | | 0.39 | % |
Supplemental data | | | | | | | | | | | | | | | | | | | | | | | | | | | | |
Portfolio turnover rate | | | 35 | % | | | 53 | % | | | 5 | % | | | 64 | % | | | 123 | % | | | 62 | % | | | 49 | % |
Net assets, end of period (000’s omitted) | | | $311 | | | | $482 | | | | $1,084 | | | | $1,046 | | | | $1,739 | | | | $3,213 | | | | $9,579 | |
| 1. | For the one month ended October 31, 2010. The Fund changed its fiscal year end from September 30 to October 31, effective October 31, 2010. |
| 2. | Calculated based upon average shares outstanding |
| 3. | Amount is less than $0.005. |
| 4. | Total return calculations do not include any sales charges. Returns for periods of less than one year are not annualized. |
The accompanying notes are an integral part of these financial statements.
| | | | |
| 22 | | Wells Fargo Advantage Diversified International Fund | | Financial Highlights |
(For a share outstanding throughout each period)
| | | | | | | | | | | | | | | | | | | | | | | | | | | | |
| | | Six Months Ended
April 30, 2012 (Unaudited) | | | Year Ended October 31, | | | Year Ended September 30, | |
| Class C | | | 2011 | | | 20101 | | | 2010 | | | 2009 | | | 2008 | | | 2007 | |
Net asset value, beginning of period | | $ | 9.01 | | | $ | 9.59 | | | $ | 9.17 | | | $ | 8.98 | | | $ | 10.98 | | | $ | 18.46 | | | $ | 15.10 | |
Net investment income (loss) | | | 0.05 | 2 | | | 0.07 | 2 | | | (0.00 | )2 | | | 0.02 | 2 | | | 0.07 | 2 | | | 0.17 | 2 | | | 0.09 | |
Net realized and unrealized gains (losses) on investments | | | 0.45 | | | | (0.61 | ) | | | 0.42 | | | | 0.25 | | | | (0.65 | ) | | | (5.56 | ) | | | 3.34 | |
| | | | | | | | | | | | | | | | | | | | | | | | | | | | |
Total from investment operations | | | 0.50 | | | | (0.54 | ) | | | 0.42 | | | | 0.27 | | | | (0.58 | ) | | | (5.39 | ) | | | 3.43 | |
Distributions to shareholders from | | | | | | | | | | | | | | | | | | | | | | | | | | | | |
Net investment income | | | (0.06 | ) | | | (0.04 | ) | | | 0.00 | | | | (0.08 | ) | | | (0.14 | ) | | | (0.11 | ) | | | (0.07 | ) |
Net realized gains | | | 0.00 | | | | 0.00 | | | | 0.00 | | | | 0.00 | | | | (1.28 | ) | | | (1.98 | ) | | | 0.00 | |
| | | | | | | | | | | | | | | | | | | | | | | | | | | | |
Total distributions to shareholders | | | (0.06 | ) | | | (0.04 | ) | | | 0.00 | | | | (0.08 | ) | | | (1.42 | ) | | | (2.09 | ) | | | (0.07 | ) |
Net asset value, end of period | | $ | 9.45 | | | $ | 9.01 | | | $ | 9.59 | | | $ | 9.17 | | | $ | 8.98 | | | $ | 10.98 | | | $ | 18.46 | |
Total return3 | | | 5.67 | % | | | (5.65 | )% | | | 4.58 | % | | | 3.07 | % | | | (1.47 | )% | | | (32.64 | )% | | | 22.76 | % |
Ratios to average net assets (annualized) | | | | | | | | | | | | | | | | | | | | | | | | | | | | |
Gross expenses | | | 2.37 | % | | | 2.22 | % | | | 2.28 | % | | | 2.39 | % | | | 2.51 | % | | | 2.42 | % | | | 2.45 | % |
Net expenses | | | 2.16 | % | | | 2.16 | % | | | 2.16 | % | | | 2.12 | % | | | 2.16 | % | | | 2.23 | % | | | 2.25 | % |
Net investment income (loss) | | | 1.13 | % | | | 0.72 | % | | | (0.16 | )% | | | 0.20 | % | | | 0.92 | % | | | 1.11 | % | | | 0.54 | % |
Supplemental data | | | | | | | | | | | | | | | | | | | | | | | | | | | | |
Portfolio turnover rate | | | 35 | % | | | 53 | % | | | 5 | % | | | 64 | % | | | 123 | % | | | 62 | % | | | 49 | % |
Net assets, end of period (000’s omitted) | | | $639 | | | | $625 | | | | $744 | | | | $718 | | | | $719 | | | | $995 | | | | $1,961 | |
| 1. | For the one month ended October 31, 2010. The Fund changed its fiscal year end from September 30 to October 31, effective October 31, 2010. |
| 2. | Calculated based upon average shares outstanding |
| 3. | Total return calculations do not include any sales charges. Returns for periods of less than one year are not annualized. |
The accompanying notes are an integral part of these financial statements.
| | | | | | |
| Financial Highlights | | Wells Fargo Advantage Diversified International Fund | | | 23 | |
(For a share outstanding throughout each period)
| | | | | | | | | | | | | | | | | | | | | | | | | | | | |
| | | Six Months Ended
April 30, 2012 (Unaudited) | | | Year Ended October 31, | | | Year Ended September 30, | |
| Administrator Class | | | 2011 | | | 20101 | | | 2010 | | | 2009 | | | 2008 | | | 2007 | |
Net asset value, beginning of period | | $ | 9.68 | | | $ | 10.28 | | | $ | 9.83 | | | $ | 9.59 | | | $ | 11.67 | | | $ | 19.48 | | | $ | 15.90 | |
Net investment income | | | 0.10 | 2 | | | 0.05 | 2 | | | 0.00 | 2,3 | | | 0.12 | 2 | | | 0.16 | 2 | | | 0.31 | 2 | | | 0.26 | 2 |
Net realized and unrealized gains (losses) on investments | | | 0.50 | | | | (0.52 | ) | | | 0.45 | | | | 0.26 | | | | (0.70 | ) | | | (5.87 | ) | | | 3.53 | |
| | | | | | | | | | | | | | | | | | | | | | | | | | | | |
Total from investment operations | | | 0.60 | | | | (0.47 | ) | | | 0.45 | | | | 0.38 | | | | (0.54 | ) | | | (5.56 | ) | | | 3.79 | |
Distributions to shareholders from | | | | | | | | | | | | | | | | | | | | | | | | | | | | |
Net investment income | | | 0.00 | | | | (0.13 | ) | | | 0.00 | | | | (0.14 | ) | | | (0.26 | ) | | | (0.27 | ) | | | (0.21 | ) |
Net realized gains | | | 0.00 | | | | 0.00 | | | | 0.00 | | | | 0.00 | | | | (1.28 | ) | | | (1.98 | ) | | | 0.00 | |
| | | | | | | | | | | | | | | | | | | | | | | | | | | | |
Total distributions to shareholders | | | 0.00 | | | | (0.13 | ) | | | 0.00 | | | | (0.14 | ) | | | (1.54 | ) | | | (2.25 | ) | | | (0.21 | ) |
Net asset value, end of period | | $ | 10.28 | | | $ | 9.68 | | | $ | 10.28 | | | $ | 9.83 | | | $ | 9.59 | | | $ | 11.67 | | | $ | 19.48 | |
Total return4 | | | 6.20 | % | | | (4.69 | )% | | | 4.58 | % | | | 3.87 | % | | | (0.66 | )% | | | (31.98 | )% | | | 24.00 | % |
Ratios to average net assets (annualized) | | | | | | | | | | | | | | | | | | | | | | | | | | | | |
Gross expenses | | | 1.46 | % | | | 1.35 | % | | | 1.38 | % | | | 1.46 | % | | | 1.58 | % | | | 1.50 | % | | | 1.52 | % |
Net expenses | | | 1.25 | % | | | 1.24 | % | | | 1.25 | % | | | 1.22 | % | | | 1.25 | % | | | 1.25 | % | | | 1.25 | % |
Net investment income | | | 2.04 | % | | | 0.44 | % | | | 0.75 | % | | | 1.31 | % | | | 2.02 | % | | | 1.92 | % | | | 1.48 | % |
Supplemental data | | | | | | | | | | | | | | | | | | | | | | | | | | | | |
Portfolio turnover rate | | | 35 | % | | | 53 | % | | | 5 | % | | | 64 | % | | | 123 | % | | | 62 | % | | | 49 | % |
Net assets, end of period (000’s omitted) | | | $3,377 | | | | $3,421 | | | | $202,247 | | | | $193,626 | | | | $261,004 | | | | $293,831 | | | | $689,808 | |
| 1. | For the one month ended October 31, 2010. The Fund changed its fiscal year end from September 30 to October 31, effective October 31, 2010. |
| 2. | Calculated based upon average shares outstanding |
| 3. | Amount is less than $0.005. |
| 4. | Returns for periods of less than one year are not annualized. |
The accompanying notes are an integral part of these financial statements.
| | | | |
| 24 | | Wells Fargo Advantage Diversified International Fund | | Financial Highlights |
(For a share outstanding throughout each period)
| | | | | | | | | | | | | | | | | | | | | | | | | | | | |
| | | Six Months Ended
April 30, 2012 (Unaudited) | | | Year Ended October 31, | | | Year Ended September 30, | |
| Institutional Class | | | 2011 | | | 20101 | | | 2010 | | | 2009 | | | 2008 | | | 2007 | |
Net asset value, beginning of period | | $ | 9.69 | | | $ | 10.29 | | | $ | 9.84 | | | $ | 9.60 | | | $ | 11.69 | | | $ | 19.50 | | | $ | 15.91 | |
Net investment income | | | 0.08 | 2 | | | 0.23 | | | | 0.00 | 2,3 | | | 0.15 | 2 | | | 0.18 | 2 | | | 0.38 | 2 | | | 0.45 | 2 |
Net realized and unrealized gains (losses) on investments | | | 0.51 | | | | (0.68 | ) | | | 0.45 | | | | 0.24 | | | | (0.70 | ) | | | (5.90 | ) | | | 3.37 | |
| | | | | | | | | | | | | | | | | | | | | | | | | | | | |
Total from investment operations | | | 0.59 | | | | (0.45 | ) | | | 0.45 | | | | 0.39 | | | | (0.52 | ) | | | (5.52 | ) | | | 3.82 | |
Distributions to shareholders from | | | | | | | | | | | | | | | | | | | | | | | | | | | | |
Net investment income | | | (0.19 | ) | | | (0.15 | ) | | | 0.00 | | | | (0.15 | ) | | | (0.29 | ) | | | (0.31 | ) | | | (0.23 | ) |
Net realized gains | | | 0.00 | | | | 0.00 | | | | 0.00 | | | | 0.00 | | | | (1.28 | ) | | | (1.98 | ) | | | 0.00 | |
| | | | | | | | | | | | | | | | | | | | | | | | | | | | |
Total distributions to shareholders | | | (0.19 | ) | | | (0.15 | ) | | | 0.00 | | | | (0.15 | ) | | | (1.57 | ) | | | (2.29 | ) | | | (0.23 | ) |
Net asset value, end of period | | $ | 10.09 | | | $ | 9.69 | | | $ | 10.29 | | | $ | 9.84 | | | $ | 9.60 | | | $ | 11.69 | | | $ | 19.50 | |
Total return4 | | | 6.35 | % | | | (4.48 | )% | | | 4.57 | % | | | 4.13 | % | | | (0.41 | )% | | | (31.79 | )% | | | 24.22 | % |
Ratios to average net assets (annualized) | | | | | | | | | | | | | | | | | | | | | | | | | | | | |
Gross expenses | | | 1.15 | % | | | 1.03 | % | | | 1.11 | % | | | 1.19 | % | | | 1.31 | % | | | 1.23 | % | | | 1.22 | % |
Net expenses | | | 0.99 | % | | | 0.99 | % | | | 0.99 | % | | | 0.96 | % | | | 0.99 | % | | | 1.04 | % | | | 1.05 | % |
Net investment income | | | 1.68 | % | | | 2.17 | % | | | 1.00 | % | | | 1.63 | % | | | 2.30 | % | | | 2.46 | % | | | 2.43 | % |
Supplemental data | | | | | | | | | | | | | | | | | | | | | | | | | | | | |
Portfolio turnover rate | | | 35 | % | | | 53 | % | | | 5 | % | | | 64 | % | | | 123 | % | | | 62 | % | | | 49 | % |
Net assets, end of period (000’s omitted) | | | $120,911 | | | | $419,925 | | | | $199,081 | | | | $194,651 | | | | $69,698 | | | | $59,620 | | | | $69,756 | |
| 1. | For the one month ended October 31, 2010. The Fund changed its fiscal year end from September 30 to October 31, effective October 31, 2010. |
| 2. | Calculated based upon average shares outstanding |
| 3. | Amount is less than $0.005. |
| 4. | Returns for periods of less than one year are not annualized. |
The accompanying notes are an integral part of these financial statements.
| | | | | | |
| Financial Highlights | | Wells Fargo Advantage Diversified International Fund | | | 25 | |
(For a share outstanding throughout each period)
| | | | | | | | | | | | | | | | | | | | | | | | |
| | | Six Months Ended
April 30, 2012 (Unaudited) | | | Year Ended October 31, | | | Year Ended September 30, | |
| Investor Class | | | 2011 | | | 20101 | | | 2010 | | | 2009 | | | 20082 | |
Net asset value, beginning of period | | $ | 9.65 | | | $ | 10.26 | | | $ | 9.81 | | | $ | 9.58 | | | $ | 11.68 | | | $ | 14.27 | |
Net investment income | | | 0.08 | | | | 0.13 | | | | 0.00 | 3 | | | 0.11 | 3 | | | 0.14 | 3 | | | 0.04 | 3 |
Net realized and unrealized gains (losses) on investments | | | 0.49 | | | | (0.63 | ) | | | 0.45 | | | | 0.24 | | | | (0.70 | ) | | | (2.63 | ) |
| | | | | | | | | | | | | | | | | | | | | | | | |
Total from investment operations | | | 0.57 | | | | (0.50 | ) | | | 0.45 | | | | 0.35 | | | | (0.56 | ) | | | (2.59 | ) |
Distributions to shareholders from | | | | | | | | | | | | | | | | | | | | | | | | |
Net investment income | | | (0.14 | ) | | | (0.11 | ) | | | 0.00 | | | | (0.12 | ) | | | (0.26 | ) | | | 0.00 | |
Net realized gains | | | 0.00 | | | | 0.00 | | | | 0.00 | | | | 0.00 | | | | (1.28 | ) | | | 0.00 | |
| | | | | | | | | | | | | | | | | | | | | | | | |
Total distributions to shareholders | | | (0.14 | ) | | | (0.11 | ) | | | 0.00 | | | | (0.12 | ) | | | (1.54 | ) | | | 0.00 | |
Net asset value, end of period | | $ | 10.08 | | | $ | 9.65 | | | $ | 10.26 | | | $ | 9.81 | | | $ | 9.58 | | | $ | 11.68 | |
Total return4 | | | 6.06 | % | | | (4.97 | )% | | | 4.59 | % | | | 3.74 | % | | | (0.82 | )% | | | (18.15 | )% |
Ratios to average net assets (annualized) | | | | | | | | | | | | | | | | | | | | | | | | |
Gross expenses | | | 1.69 | % | | | 1.54 | % | | | 1.61 | % | | | 1.73 | % | | | 1.87 | % | | | 1.85 | % |
Net expenses | | | 1.46 | % | | | 1.46 | % | | | 1.46 | % | | | 1.43 | % | | | 1.46 | % | | | 1.46 | % |
Net investment income | | | 1.82 | % | | | 1.43 | % | | | 0.54 | % | | | 1.18 | % | | | 1.75 | % | | | 1.60 | % |
Supplemental data | | | | | | | | | | | | | | | | | | | | | | | | |
Portfolio turnover rate | | | 35 | % | | | 53 | % | | | 5 | % | | | 64 | % | | | 123 | % | | | 62 | % |
Net assets, end of period (000’s omitted) | | | $41,184 | | | | $40,456 | | | | $48,070 | | | | $46,282 | | | | $47,569 | | | | $47,062 | |
| 1. | For the one month ended October 31, 2010. The Fund changed its fiscal year end from September 30 to October 31, effective October 31, 2010. |
| 2. | For the period from July 18, 2008 (commencement of class operations) to September 30, 2008 |
| 3. | Calculated based upon average shares outstanding |
| 4. | Returns for periods of less than one year are not annualized. |
The accompanying notes are an integral part of these financial statements.
| | | | |
| 26 | | Wells Fargo Advantage Diversified International Fund | | Notes to Financial Statements (Unaudited) |
1. ORGANIZATION
Wells Fargo Funds Trust (the “Trust”), a Delaware statutory trust organized on March 10, 1999, is an open-end management investment company registered under the Investment Company Act of 1940, as amended (the “1940 Act”). These financial statements report on Wells Fargo Advantage Diversified International Fund (the “Fund”) which is a diversified series of the Trust.
2. SIGNIFICANT ACCOUNTING POLICIES
The following significant accounting policies, which are consistently followed in the preparation of the financial statements of the Fund, are in conformity with U.S. generally accepted accounting principles which require management to make estimates and assumptions that affect the reported amounts of assets and liabilities, disclosure of contingent assets and liabilities at the date of the financial statements, and the reported amounts of revenues and expenses during the reporting period. Actual results could differ from those estimates.
Securities valuation
Investments in equity securities are valued each business day as of the close of regular trading on the New York Stock Exchange, which is usually 4:00 p.m. (Eastern Time). Securities which are traded on a national or foreign securities exchange are valued at the last reported sales price, except that securities listed on The Nasdaq Stock Market, Inc. (“Nasdaq”) are valued at the Nasdaq Official Closing Price (“NOCP”), and if no NOCP is available, then at the last reported sales price. If no sales price is shown on the Nasdaq, the bid price will be used. In the absence of any sale of securities listed on the Nasdaq, and in the case of other securities (including U.S. Government obligations, but excluding debt securities maturing in 60 days or less), the price will be deemed “stale” and the valuations will be determined in accordance with the Fund’s Fair Value Procedures.
Securities denominated in foreign currencies are translated into U.S. dollars using the closing rates of exchange in effect on the day of valuation.
Many securities markets and exchanges outside the U.S. close prior to the close of the New York Stock Exchange and therefore may not fully reflect trading or events that occur after the close of the principal exchange in which the foreign securities are traded, but before the close of the New York Stock Exchange. If such trading or events are expected to materially affect the value of securities, then fair value pricing procedures approved by the Board of Trustees are applied. These procedures take into account multiple factors including movements in U.S. securities markets after foreign exchanges close. As a result of the fair value pricing procedures, these securities which are normally categorized as Level 1 in the fair value hierarchy will represent a transfer from a Level 1 to a Level 2 security and will be categorized as Level 2. Depending on market activity, such fair valuations may be frequent. Such fair value pricing may result in NAVs that are higher or lower than NAVs based on the closing price or latest quoted bid price. On April 30, 2012, fair value pricing was not used in pricing foreign securities.
Investments in open-end mutual funds and non-registered investment companies are generally valued at net asset value.
Investments which are not valued using any of the methods discussed above, are valued at their fair value, as determined by procedures established in good faith and approved by the Board of Trustees. The Board of Trustees has established a Valuation Committee comprised of the Trustees and has delegated to it the authority to take any actions regarding the valuation of portfolio securities that the Valuation Committee deems necessary in determining the fair value of portfolio securities, unless the responsibility has been delegated to the Management Valuation Team of Wells Fargo Funds Management, LLC (“Funds Management”). The Board of Trustees retains the authority to make or ratify any valuation decisions or approve any changes to the Fair Value Procedures as it deems appropriate. On a quarterly basis, the Board of Trustees considers for ratification any valuation actions taken by the Valuation Committee or the Management Valuation Team.
Valuations of fair valued prices are compared to the next actual sales price when available, or other appropriate market information to assess the continued appropriateness of the fair valuation methodology used. The securities are fair valued on a day-to-day basis, taking into consideration changes to appropriate market information and any significant changes to the input factors considered in the valuation process until there is a readily available price provided on the exchange or by an independent pricing service. Valuations received from an independent pricing service or broker
| | | | | | |
| Notes to Financial Statements (Unaudited) | | Wells Fargo Advantage Diversified International Fund | | | 27 | |
quotes are periodically validated by comparisons to most recent trades and valuations provided by other independent pricing services in addition to the review of prices by the adviser and/or sub-adviser. Unobservable inputs used in determining fair valuations are identified based on the type of security, taking into consideration factors utilized by market participants in valuing the investment, knowledge about the issuer and the current market environment.
Foreign currency translation
The accounting records of the Fund are maintained in U.S. dollars. Assets, including investment securities, and liabilities denominated in foreign currency are translated into U.S. dollars at the prevailing rates of exchange at the date of valuation. Purchases and sales of securities, and income and expenses are translated at the prevailing rate of exchange on the respective dates of such transactions. Reported net realized foreign exchange gains or losses arise from sales of foreign currencies, currency gains or losses realized between the trade and settlement dates on securities transactions, and the difference between the amounts of dividends, interest and foreign withholding taxes recorded and the U.S. dollar equivalent of the amounts actually paid or received. Net unrealized foreign exchange gains and losses arise from changes in the fair value of assets and liabilities other than investments in securities resulting in changes in exchange rates.
The changes in net assets arising from changes in exchange rates and the changes in net assets resulting from changes in market prices of securities are not separately presented. Such changes are recorded with net realized and unrealized gains or losses from investments. Gains and losses from certain foreign currency transactions are treated as ordinary income for U.S. federal income tax purposes.
Forward foreign currency contracts
The Fund may be subject to foreign currency exchange rate risk in the normal course of pursuing its investment objectives. A forward foreign currency contract is an agreement between two parties to purchase or sell a specific currency for an agreed-upon price at a future date. The Fund enters into forward foreign currency contracts to facilitate transactions in foreign-denominated securities and to attempt to minimize the risk to the Fund from adverse changes in the relationship between currencies. Forward foreign currency contracts are recorded at the forward rate and marked-to-market daily. When the contracts are closed, realized gains and losses arising from such transactions are recorded as realized gains or losses on foreign currency related transactions. The Fund could be exposed to risks if the counterparties to the contracts are unable to meet the terms of their contracts or if the value of the foreign currency changes unfavorably. The Fund’s maximum risk of loss from counterparty credit risk is the unrealized gains or losses on the contracts. This risk is mitigated by having a master netting arrangement between the Fund and the counterparty.
Security loans
The Fund may lend its securities from time to time in order to earn additional income in the form of fees or interest on securities received as collateral or the investment of any cash received as collateral. The Fund continues to receive interest or dividends on the securities loaned. The Fund receives collateral in the form of cash or securities with a value at least equal to the value of the securities on loan. The value of the loaned securities is determined at the close of each business day and any additional required collateral is delivered to the Fund on the next business day. In a securities lending transaction, the net asset value of the Fund will be affected by an increase or decrease in the value of the securities loaned and by an increase or decrease in the value of the instrument in which collateral is invested. The amount of securities lending activity undertaken by the Fund fluctuates from time to time. In the event of default or bankruptcy by the borrower, the Fund may be prevented from recovering the loaned securities or gaining access to the collateral or may experience delays or costs in doing so. In addition, the investment of any cash collateral received may lose all or part of its value. The Fund has the right under the lending agreement to recover the securities from the borrower on demand.
The Fund lends its securities through an unaffiliated securities lending agent. Cash collateral received in connection with its securities lending transactions is invested in Wells Fargo Securities Lending Cash Investments, LLC (the “Cash Collateral Fund”). The Cash Collateral Fund is exempt from registration under Section 3(c)(7) of the 1940 Act and is managed by Funds Management and is sub-advised by Wells Capital Management Incorporated (“Wells Capital Management”). Funds Management receives an advisory fee starting at 0.05% and declining to 0.01% as the average daily net assets of the Cash Collateral Fund increase. All of the fees received by Funds Management are paid to Wells Capital Management for its services as sub-adviser. The Cash Collateral Fund seeks to provide a positive return compared to the daily Fed Funds Open rate by investing in high-quality, U.S. dollar-denominated short-term money market instruments. Cash Collateral
| | | | |
| 28 | | Wells Fargo Advantage Diversified International Fund | | Notes to Financial Statements (Unaudited) |
Fund investments are fair valued based upon the amortized cost valuation technique. Income earned from investment in the Cash Collateral Fund is included in securities lending income on the Statement of Operations.
Security transactions and income recognition
Securities transactions are recorded on a trade date basis. Realized gains or losses are reported on the basis of identified cost of securities delivered.
Dividend income is recognized on the ex-dividend date, except for certain dividends from foreign securities, which are recorded as soon as the Fund is informed of the ex-dividend date. Dividend income from foreign securities is recorded net of foreign taxes withheld where recovery of such taxes is not assured.
Distributions to shareholders
Distributions to shareholders from net investment income and net realized gains, if any, are recorded on the ex-dividend date. Such distributions are determined in conformity with income tax regulations, which may differ from generally accepted accounting principles.
Federal and other taxes
The Fund intends to continue to qualify as a regulated investment company by distributing substantially all of its investment company taxable income and any net realized capital gains (after reduction for capital loss carryforwards) sufficient to relieve it from all, or substantially all, federal income taxes. Accordingly, no provision for federal income taxes was required.
The Fund’s income and federal excise tax returns and all financial records supporting those returns for the prior three fiscal years are subject to examination by the federal and Delaware revenue authorities. Management has analyzed the Fund’s tax positions taken on federal, state, and foreign tax returns for all open tax years and does not believe that there are any uncertain tax positions that require recognition of a tax liability.
Under the recently enacted Regulated Investment Company Modernization Act of 2010, the Fund is permitted to carry forward capital losses incurred in taxable years which began after December 22, 2010 for an unlimited period. However, any losses incurred are required to be utilized prior to the losses incurred in pre-enactment taxable years. As a result of this ordering rule, pre-enactment capital loss carryforwards may be more likely to expire unused. Post-enactment capital losses that are carried forward will retain their character as either short-term or long-term capital losses rather than be considered all short-term as under previous law. In addition, the Fund may elect to defer any portion of a post-October capital loss or qualified late-year ordinary loss to the first day of the following taxable year. A post-October capital loss is the greatest of the net capital loss, net short-term capital loss or net long-term capital loss for the portion of the taxable year after October 31. A qualified late-year ordinary loss is the net loss comprised of (a) net gain or loss from the sale or other disposition of capital assets for the portion of the taxable year after October 31, and (b) other ordinary income or loss for the portion of the taxable year after December 31.
As of October 31, 2011, the Fund had net capital loss carryforwards, which are available to offset future net realized capital gains, in the amount of $89,306,475 expiring in 2017.
Class allocations
The separate classes of shares offered by the Fund differ principally in applicable sales charges, distribution, shareholder servicing and administration fees. Shareholders of each class bear certain expenses that pertain to that particular class. All shareholders bear the common expenses of the Fund, earn income from the portfolio, and are allocated unrealized gains and losses pro rata based on the average daily net assets of each class, without distinction between share classes. Dividends are determined separately for each class based on income and expenses allocable to each class. Realized gains and losses are allocated to each class pro rata based upon the net assets of each class on the date realized. Differences in per share dividend rates generally result from the relative weightings of pro rata income and realized gain allocations and from differences in separate class expenses, including distribution, shareholder servicing and administration fees.
3. FAIR VALUATION MEASUREMENTS
Fair value measurements of investments are determined within a framework that has established a fair value hierarchy based upon the various data inputs utilized in determining the value of the Fund’s investments. The three-level hierarchy gives the highest priority to unadjusted quoted prices in active markets for identical assets or liabilities (Level 1) and the
| | | | | | |
| Notes to Financial Statements (Unaudited) | | Wells Fargo Advantage Diversified International Fund | | | 29 | |
lowest priority to significant unobservable inputs (Level 3). The Fund’s investments are classified within the fair value hierarchy based on the lowest level of input that is significant to the fair value measurement. The inputs are summarized into three broad levels as follows:
| n | | Level 1 – quoted prices in active markets for identical securities |
| n | | Level 2 – other significant observable inputs (including quoted prices for similar securities, interest rates, prepayment speeds, credit risk, etc.) |
| n | | Level 3 – significant unobservable inputs (including the Fund’s own assumptions in determining the fair value of investments) |
The inputs or methodologies used for valuing securities are not necessarily an indication of the risk associated with investing in those securities.
As of April 30, 2012, the inputs used in valuing the Fund’s assets, which are carried at fair value, were as follows:
| | | | | | | | | | | | | | | | |
| Investments in Securities | | Quoted Prices (Level 1) | | | Significant Other
Observable Inputs (Level 2) | | | Significant Unobservable Inputs (Level 3) | | | Total | |
Equity securities | | | | | | | | | | | | | | | | |
Common stocks | | $ | 179,654,406 | | | $ | 1,941,096 | | | $ | 0 | | | $ | 181,595,502 | |
Preferred stocks | | | 1,493,620 | | | | 0 | | | | 0 | | | | 1,493,620 | |
Short-term investments | | | | | | | | | | | | | | | | |
Investment companies | | | 5,082,548 | | | | 18,974,853 | | | | 0 | | | | 24,057,401 | |
| | | $ | 186,230,574 | | | $ | 20,915,949 | | | $ | 0 | | | $ | 207,146,523 | |
Further details on the major security types listed above can be found in the Portfolio of Investments.
Transfers in and transfers out are recognized at the end of the reporting period. For the six months ended April 30, 2012, the Fund did not have any significant transfers into/out of Level 1 and Level 2.
4. TRANSACTIONS WITH AFFILIATES AND OTHER EXPENSES
Advisory fee
The Trust has entered into an advisory contract with Funds Management, an indirect wholly owned subsidiary of Wells Fargo & Company (“Wells Fargo”). The adviser is responsible for implementing investment policies and guidelines and for supervising the sub-advisers, who are responsible for day-to-day portfolio management of the Fund.
Pursuant to the contract, Funds Management is entitled to receive an annual advisory fee starting at 0.85% and declining to 0.70% as the average daily net assets of the Fund increase. For the six months ended April 30, 2012, the advisory fee was equivalent to an annual rate of 0.85% of the Fund’s average daily net assets.
Funds Management has retained the services of certain sub-advisers to provide daily portfolio management to the Fund. The fees related to sub-advisory services are borne directly by Funds Management and do not increase the overall fees paid by the Fund. Artisan Partners Limited Partnership, LSV Asset Management and Wells Capital Management, an affiliate of Funds Management, are the sub-advisers to the Fund and are each entitled to receive a fee from the adviser which is calculated based on the average daily net assets of the Fund as follows:
| | | | | | | | |
| | | Annual Sub-advisory Fee | |
| Investment sub-adviser | | starting at | | | declining to | |
Artisan Partners Limited Partnership | | | 0.80 | % | | | 0.50 | % |
LSV Asset Management | | | 0.35 | | | | 0.30 | |
Wells Capital Management | | | 0.45 | | | | 0.40 | |
Administration and transfer agent fees
The Trust has entered into an administration agreement with Funds Management. Under this agreement, for providing administrative services, which includes paying fees and expenses for services provided by the transfer agent, sub-transfer agents, omnibus account servicers and record-keepers, Funds Management is entitled to receive from the Fund an
| | | | |
| 30 | | Wells Fargo Advantage Diversified International Fund | | Notes to Financial Statements (Unaudited) |
annual fund level administration fee starting at 0.05% and declining to 0.03% as the average daily net assets of the Fund increase and a class level administration fee which is calculated based on the average daily net assets of each class as follows:
| | | | |
| | | Class Level Administration Fee | |
Class A, Class B, Class C | | | 0.26 | % |
Administrator Class | | | 0.10 | |
Institutional Class | | | 0.08 | |
Investor Class | | | 0.33 | |
Funds Management has contractually waived and/or reimbursed advisory and administration fees to the extent necessary to maintain certain net operating expense ratios for the Fund. Waiver of fees and/or reimbursement of expenses by Funds Management were made first from fund level expenses on a proportionate basis and then from class specific expenses. Funds Management has committed through February 28, 2013 to waive fees and/or reimburse expenses to the extent necessary to cap the Fund’s expenses at 1.41% for Class A, 2.16% for Class B, 2.16% for Class C, 1.25% for Administrator Class, 0.99% for Institutional Class and 1.46% for Investor Class.
Distribution fees
The Trust has adopted a Distribution Plan for Class B and Class C shares of the Fund pursuant to Rule 12b-1 under the 1940 Act. Distribution fees are charged to Class B and Class C shares and paid to Wells Fargo Funds Distributor, LLC, the principal underwriter, at an annual rate of 0.75% of the average daily net assets of Class B and Class C shares.
For the six months ended April 30, 2012, Wells Fargo Funds Distributor, LLC received $883 from the sale of Class A shares and $97 in contingent deferred sales charges from redemptions of Class B.
Shareholder servicing fees
The Trust has entered into contracts with one or more shareholder servicing agents, whereby Class A, Class B, Class C, Administrator Class and Investor Class of the Fund is charged a fee at an annual rate of 0.25% of the average daily net assets of each respective class.
A portion of these total shareholder servicing fees were paid to affiliates of Wells Fargo.
5. INVESTMENT PORTFOLIO TRANSACTIONS
Purchases and sales of investments, excluding U.S. Government obligations (if any) and short-term securities, for the six months ended April 30, 2012 were $101,806,477 and $379,417,505, respectively.
6. DERIVATIVE TRANSACTIONS
During the six months ended April 30, 2012, the Fund entered into forward foreign currency exchange contracts for economic hedging purposes.
As of April 30, 2012, the Fund did not have any open forward foreign currency contracts but had average contract amounts of $3,322,525 and $3,526,171 in forward foreign currency contracts to buy and forward foreign currency contracts to sell, respectively, during the six months ended April 30, 2012.
The fair value, realized gains or losses and change in unrealized gains or losses, if any, on derivative instruments are reflected in the appropriate financial statements.
7. BANK BORROWINGS
The Trust (excluding the money market funds) and Wells Fargo Variable Trust are parties to a $150,000,000 revolving credit agreement with State Street Bank and Trust Company, whereby the Fund is permitted to use bank borrowings for temporary or emergency purposes, such as to fund shareholder redemption requests. Interest under the credit agreement is charged to the Fund based on a borrowing rate equal to the higher of the Federal Funds rate in effect on that day plus 1.25% or the overnight LIBOR rate in effect on that day plus 1.25%. In addition, an annual commitment fee equal to 0.10% of the unused balance is allocated to each participating fund. For the six months ended April 30, 2012, the Fund paid $390 in commitment fees.
| | | | | | |
| Notes to Financial Statements (Unaudited) | | Wells Fargo Advantage Diversified International Fund | | | 31 | |
During the six months ended April 30, 2012, the Fund had average borrowings outstanding of $16,738 at a rate of 1.41% and paid interest in the amount of $236.
8. INDEMNIFICATION
Under the Trust’s organizational documents, the officers and directors are indemnified against certain liabilities that may arise out of performance of their duties to the Trust. Additionally, in the normal course of business, the Trust may enter into contracts with service providers that contain a variety of indemnification clauses. The Trust’s maximum exposure under these arrangements is dependent on future claims that may be made against the Fund and, therefore, cannot be estimated.
9. NEW ACCOUNTING PRONOUNCEMENTS
In December 2011, the Financial Accounting Standards Board (“FASB”) issued Accounting Standard Update (“ASU”) No. 2011-11, Disclosures about Offsetting Assets and Liabilities. ASU 2011-11, which amends FASB ASC Topic 210, Balance Sheet, creates new disclosure requirements which require entities to disclose both gross and net information for derivatives and other financial instruments that are either offset in the Statement of Assets and Liabilities or subject to an enforceable master netting arrangement or similar agreement. The disclosure requirements are effective for interim and annual reporting periods beginning on or after January 1, 2013. Management is currently assessing the potential impact, in addition to expanded financial statement disclosure, that may result from adopting this ASU.
In May 2011, FASB issued ASU No. 2011-04 Amendments to Achieve Common Fair Value Measurement and Disclosure Requirements in U.S. GAAP and IFRSs. ASU No. 2011-04 amends FASB ASC Topic 820, Fair Value Measurement, to establish common requirements for measuring fair value and for disclosing information about fair value measurements in accordance with GAAP. The ASU is effective prospectively for interim and annual periods beginning after December 15, 2011. Management expects that adoption of the ASU will result in additional disclosures in the financial statements, as applicable.
In April 2011, FASB issued ASU No. 2011-03 Reconsideration of Effective Control for Repurchase Agreements. ASU No. 2011-03 amends FASB ASC Topic 860, Transfers and Servicing, specifically the criteria required to determine whether a repurchase agreement (repo) and similar agreements should be accounted for as sales of financial assets or secured borrowings with commitments. ASU No. 2011-03 changes the assessment of effective control by focusing on the transferor’s contractual rights and obligations and removing the criterion to assess its ability to exercise those rights or honor those obligations. This could result in changes to the way entities account for certain transactions including repurchase agreements, mortgage dollar rolls and reverse repurchase agreements. The ASU will become effective on a prospective basis for new transfers and modifications to existing transactions as of the beginning of the first interim or annual period beginning on or after December 15, 2011. Management has evaluated the impact of adopting the ASU and expects no significant changes.
| | | | |
| 32 | | Wells Fargo Advantage Diversified International Fund | | Other Information (Unaudited) |
PROXY VOTING INFORMATION
A description of the policies and procedures that the Fund uses to determine how to vote proxies relating to portfolio securities is available without charge, upon request, by calling 1-800-222-8222, visiting our Web site at wellsfargoadvantagefunds.com, or visiting the SEC Web site at sec.gov. Information regarding how the Fund voted proxies relating to portfolio securities during the most recent 12-month period ended June 30 is available without charge on the Fund’s Web site at wellsfargoadvantagefunds.com or by visiting the SEC Web site at sec.gov.
PORTFOLIO HOLDINGS INFORMATION
The complete portfolio holdings for the Fund are publicly available on the Fund’s Web site (wellsfargoadvantagefunds.com) on a monthly, 30-day or more delayed basis. In addition, top ten holdings information for the Fund is publicly available on the Fund’s Web site on a monthly, seven-day or more delayed basis. The Fund files its complete schedule of portfolio holdings with the SEC for the first and third quarters of each fiscal year on Form N-Q, which is available without charge by visiting the SEC Web site at sec.gov. In addition, the Fund’s Form N-Q may be reviewed and copied at the SEC’s Public Reference Room in Washington, DC, and at regional offices in New York City, at 233 Broadway, and in Chicago, at 175 West Jackson Boulevard, Suite 900. Information about the Public Reference Room may be obtained by calling 1-800-SEC-0330.
| | | | | | |
| Other Information (Unaudited) | | Wells Fargo Advantage Diversified International Fund | | | 33 | |
BOARD OF TRUSTEES
The following table provides basic information about the Board of Trustees (the “Trustees”) of the Trust and Officers of the Trust. This table should be read in conjunction with the Prospectus and the Statement of Additional Information1 of the Fund. Each of the Trustees and Officers listed below acts in identical capacities for the Wells Fargo Advantage family of funds, which consists of 137 funds comprising the Wells Fargo Funds Trust, Wells Fargo Variable Trust, Wells Fargo Master Trust and four closed-end funds (collectively the “Fund Complex”). All of the Trustees are also Members of the Audit and Governance Committees of each Trust in the Fund Complex. The mailing address of each Trustee and Officer is 525 Market Street, 12th Floor, San Francisco, CA 94105. Each Trustee and Officer serves an indefinite term, however, each Trustee serves such term until reaching the mandatory retirement age established by the Trustees.
Independent Trustees
| | | | | | |
Name and Year of Birth | | Position Held and Length of Service | | Principal Occupations During Past Five Years | | Other Directorships During
Past Five Years |
Peter G. Gordon
(Born 1942) | | Trustee, since 1998; Chairman, since 2005 (Lead Trustee since 2001) | | Co-Founder, Retired Chairman, President and CEO of Crystal Geyser Water Company. Trustee Emeritus, Colby College | | Asset Allocation Trust |
Isaiah Harris, Jr.
(Born 1952) | | Trustee, since 2009 | | Retired. Prior thereto, President and CEO of BellSouth Advertising and Publishing Corp. from 2005 to 2007, President and CEO of BellSouth Enterprises from 2004 to 2005 and President of BellSouth Consumer Services from 2000 to 2003. Emeritus member of the Iowa State University Foundation Board of Governors. Emeritus Member of the Advisory Board of Iowa State University School of Business. Mr. Harris is a certified public accountant. | | CIGNA Corporation; Deluxe Corporation; Asset Allocation Trust |
Judith M. Johnson
(Born 1949) | | Trustee, since 2008 | | Retired. Prior thereto, Chief Executive Officer and Chief Investment Officer of Minneapolis Employees Retirement Fund from 1996 to 2008. Ms. Johnson is an attorney, certified public accountant and a certified managerial accountant. | | Asset Allocation Trust |
Leroy Keith, Jr.
(Born 1939) | | Trustee, since 2010 | | Chairman, Bloc Global Services (development and construction). Trustee of the Evergreen Funds from 1983 to 2010. Former Managing Director, Almanac Capital Management (commodities firm), former Partner, Stonington Partners, Inc. (private equity fund), former Director, Obagi Medical Products Co. and former Director, Lincoln Educational Services. | | Trustee, Virtus Fund Complex (consisting of 40 portfolios as of 12/31/11); Asset Allocation Trust |
David F. Larcker
(Born 1950) | | Trustee, since 2009 | | James Irvin Miller Professor of Accounting at the Graduate School of Business, Stanford University, Director of Corporate Governance Research Program and Senior Faculty of The Rock Center for Corporate Governance since 2006. From 2005 to 2008, Professor of Accounting at the Graduate School of Business, Stanford University. Prior thereto, Ernst & Young Professor of Accounting at The Wharton School, University of Pennsylvania from 1985 to 2005. | | Asset Allocation Trust |
Olivia S. Mitchell
(Born 1953) | | Trustee, since 2006 | | International Foundation of Employee Benefit Plans Professor, Wharton School of the University of Pennsylvania since 1993. Director of Wharton’s Pension Research Council and Boettner Center on Pensions & Retirement Research, and Research Associate at the National Bureau of Economic Research. Previously, Cornell University Professor from 1978 to 1993. | | Asset Allocation Trust |
| | | | |
| 34 | | Wells Fargo Advantage Diversified International Fund | | Other Information (Unaudited) |
| | | | | | |
Name and Year of Birth | | Position Held and Length of Service | | Principal Occupations During Past Five Years | | Other Directorships During
Past Five Years |
Timothy J. Penny
(Born 1951) | | Trustee, since 1996 | | President and CEO of Southern Minnesota Initiative Foundation, a non-profit organization, since 2007 and Senior Fellow at the Humphrey Institute Policy Forum at the University of Minnesota since 1995. Member of the Board of Trustees of NorthStar Education Finance, Inc., a non-profit organization, since 2007. | | Asset Allocation Trust |
Michael S. Scofield
(Born 1943) | | Trustee, since 2010 | | Served on the Investment Company Institute’s Board of Governors and Executive Committee from 2008-2011 as well the Governing Council of the Independent Directors Council from 2006-2011 and the Independent Directors Council Executive Committee from 2008-2011. Chairman of the IDC from 2008-2010. Institutional Investor (Fund Directions) Trustee of Year in 2007. Trustee of the Evergreen Funds (and its predecessors) from 1984 to 2010. Chairman of the Evergreen Funds from 2000-2010. Former Trustee of the Mentor Funds. Retired Attorney, Law Offices of Michael S. Scofield and former Director and Chairman, Branded Media Corporation (multi-media branding company). | | Asset Allocation Trust |
Donald C. Willeke
(Born 1940) | | Trustee, since 1996 | | Principal of the law firm of Willeke & Daniels. General Counsel of the Minneapolis Employees Retirement Fund from 1984 until its consolidation into the Minnesota Public Employees Retirement Association on June 30, 2010. Director and Vice Chair of The Free Trust (non-profit corporation). Director of the American Chestnut Foundation (non-profit corporation). | | Asset Allocation Trust |
Officers
| | | | | | |
Name and Year of Birth | | Position Held and
Length of Service | | Principal Occupations During Past Five Years | | |
Karla M. Rabusch
(Born 1959) | | President, since 2003 | | Executive Vice President of Wells Fargo Bank, N.A. and President of Wells Fargo Funds Management, LLC since 2003. Senior Vice President and Chief Administrative Officer of Wells Fargo Funds Management, LLC from 2001 to 2003. | | |
C. David Messman
(Born 1960) | | Secretary, since 2000; Chief Legal Counsel, since 2003 | | Senior Vice President and Secretary of Wells Fargo Funds Management, LLC since 2001. Vice President and Managing Senior Counsel of Wells Fargo Bank, N.A. since 1996. | | |
Kasey Phillips
(Born 1970) | | Treasurer, since 2009 | | Senior Vice President of Wells Fargo Funds Management, LLC since 2009. Senior Vice President of Evergreen Investment Management Company, LLC from 2006 to 2010. Treasurer of the Evergreen Funds from 2005 to 2010. | | |
David Berardi
(Born 1975) | | Assistant Treasurer, since 2009 | | Vice President of Wells Fargo Funds Management, LLC since 2009. Vice President of Evergreen Investment Management Company, LLC from 2008 to 2010. Assistant Vice President of Evergreen Investment Services, Inc. from 2004 to 2008. Manager of Fund Reporting and Control for Evergreen Investment Management Company, LLC from 2004 to 2010. | | |
Jeremy DePalma
(Born 1974) | | Assistant Treasurer, since 2009 | | Senior Vice President of Wells Fargo Funds Management, LLC since 2009. Senior Vice President of Evergreen Investment Management Company, LLC from 2008 to 2010. Vice President, Evergreen Investment Services, Inc. from 2004 to 2007. Head of the Fund Reporting and Control Team within Fund Administration from 2005 to 2010. | | |
Debra Ann Early
(Born 1964) | | Chief Compliance Officer, since 2007 | | Chief Compliance Officer of Wells Fargo Funds Management, LLC since 2007. Chief Compliance Officer of Parnassus Investments from 2005 to 2007. Chief Financial Officer of Parnassus Investments from 2004 to 2007 and Senior Audit Manager of PricewaterhouseCoopers LLP from 1998 to 2004. | | |
| 1. | The Statement of Additional Information includes additional information about the Trustees and is available, without charge, upon request, by calling 1-800-222-8222 or by visiting the Web site at wellsfargoadvantagefunds.com. |
| | | | | | |
| Other Information (Unaudited) | | Wells Fargo Advantage Diversified International Fund | | | 35 | |
BOARD CONSIDERATION OF INVESTMENT ADVISORY AND SUB-ADVISORY AGREEMENTS:
Under Section 15 of the Investment Company Act of 1940 (the “1940 Act”), the Board of Trustees (the “Board”) of Wells Fargo Funds Trust (the “Trust”), all the members of which have no direct or indirect interest in the investment advisory and sub-advisory agreements and are not “interested persons” of the Trust, as defined in the 1940 Act (the “Independent Trustees”), must determine whether to approve the continuation of the Trust’s investment advisory and sub-advisory agreements. In this regard, at an in person meeting held on March 29-30, 2012 (the “Meeting”), the Board reviewed and re-approved: (i) an investment advisory agreement with Wells Fargo Funds Management, LLC (“Funds Management”) for Wells Fargo Advantage Diversified International Fund (the “Fund”); (ii) an investment sub-advisory agreement with Wells Capital Management Incorporated (“Wells Capital Management”) for the Fund; (iii) an investment sub-advisory agreement with Artisans Partners Limited Partnership (“Artisan”) for the Fund; and (iv) an investment sub-advisory agreement with LSV Asset Management (“LSV”) for the Fund. The investment advisory agreements with Funds Management and the investment sub-advisory agreements with Wells Capital Management, Artisan, and LSV (the “Sub-Advisers”) are collectively referred to as the “Advisory Agreements.”
At the Meeting, the Board considered the factors and reached the conclusions described below relating to the selection of Funds Management and the Sub-Advisers and the continuation of the Advisory Agreements. Prior to the Meeting, the Trustees conferred extensively among themselves and with representatives of Funds Management about these matters. The Board also met throughout the year and received information that was useful to them in considering the continuation of the Advisory Agreements. The Independent Trustees were assisted in their evaluation of the Advisory Agreements by independent legal counsel, from whom they received separate legal advice and with whom they met separately from Funds Management.
In providing information to the Board, Funds Management and the Sub-Advisers were guided by a detailed set of requests submitted by the Independent Trustees’ independent legal counsel on their behalf at the start of the Board’s annual contract renewal process earlier in 2012. In approving the Advisory Agreements, the Board did not identify any particular information or consideration that was all-important or controlling, and each Trustee likely attributed different weights to various factors.
Nature, extent and quality of services
The Board received and considered various information regarding the nature, extent and quality of services provided to the Fund by Funds Management and the Sub-Advisers under the Advisory Agreements. The Board also received and considered, among other things, information about the background and experience of senior management of Funds Management, and the qualifications, backgrounds, tenures and responsibilities of the portfolio managers primarily responsible for the day-to-day portfolio management of the Fund.
The Board evaluated the ability of Funds Management and the Sub-Advisers, based on their respective financial condition, resources, reputation and other attributes, to attract and retain qualified investment professionals, including research, advisory, and supervisory personnel. The Board further considered the compliance programs and compliance records of Funds Management and the Sub-Advisers. In addition, the Board took into account the administrative services provided to the Fund by Funds Management and its affiliates.
The Board’s decision to approve the continuation of the Advisory Agreements was based on a comprehensive evaluation of all of the information provided to it. In considering these matters, the Board considered not only the specific information presented in connection with the Meeting, but also the knowledge gained over time through interaction with Funds Management and the Sub-Advisers about various topics, including Funds Management’s oversight of service providers. The above factors, together with those referenced below, are some of the most important, but not necessarily all, factors considered by the Board in concluding that the nature, extent and quality of the investment advisory services provided to the Fund by Funds Management and the Sub-Advisers supported the re-approval of the Advisory Agreements. Although the Board considered the continuation of the Advisory Agreements for the Fund as part of the larger process of considering the continuation of the advisory agreements for all of the funds in the complex, its decision to continue the Advisory Agreements for the Fund was ultimately made on a fund-by-fund basis.
| | | | |
| 36 | | Wells Fargo Advantage Diversified International Fund | | Other Information (Unaudited) |
Fund performance and expenses
The Board considered the performance results for the Fund over various time periods ended December 31, 2011. The Board also considered these results in comparison to the median performance of a universe of relevant funds (the “Universe”) that was determined by Lipper Inc. (“Lipper”) to be similar to the Fund, and in comparison to the Fund’s benchmark index and to other comparative data. Lipper is an independent provider of investment company data. The Board received a description of the methodology used by Lipper to select the mutual funds in the Universe. The Board noted that, except for the ten-year period, the performance of the Fund was higher than or in range of the median performance of the Universe for the periods under review. The Board also noted that, except for the ten-year period, the performance of the Fund was higher than or in range of its benchmark, the Lipper International Large-Cap Core Funds Index, for the periods under review.
The Board received and considered information regarding the Fund’s contractual advisory fee and net operating expense ratios and their various components, including actual management fees (which reflect fee waivers, if any), transfer agent, custodian and other non-management fees, Rule 12b-1 and non-Rule 12b-1 fees, service fees and fee waiver and expense reimbursement arrangements. The Board also considered these ratios in comparison to the median ratios of an expense Universe and a narrower expense group of mutual funds (each, an “Expense Group”) that was determined by Lipper to be similar to the Fund. The Board received a description of the methodology used by Lipper to select the mutual funds in the Fund’s Expense Group. The Board noted that the net operating expense ratios of the Fund were in range of the Fund’s Expense Group’s median net operating expense ratios.
Based on the above-referenced considerations and other factors, the Board concluded that the overall performance and expense structure of the Fund supported the re-approval of the Advisory Agreements for the Fund.
Investment advisory and sub-advisory fee rates
The Board reviewed and considered the contractual investment advisory fee rate that is payable by the Fund to Funds Management for investment advisory services (the “Advisory Agreement Rate”), both on a stand-alone basis and on a combined basis with the Fund’s administration fee rate. The Board took into account the separate administrative and other services covered by the administration fee rate. The Board also reviewed and considered the contractual investment sub-advisory fee rate that is payable by Funds Management to the Sub-Advisers for investment sub-advisory services (the “Sub-Advisory Agreement Rate”). In addition, the Board reviewed and considered the existing fee waiver/cap arrangements applicable to the Advisory Agreement Rate and considered the Advisory Agreement Rate after taking the waivers/caps into account (the “Net Advisory Rate”).
The Board received and considered information comparing the Advisory Agreement Rate and Net Advisory Rate with those of other funds in the Fund’s Expense Group median. The Board noted that the Advisory Agreement Rate and Net Advisory Rate for the Fund were higher than or in range of the median rates for the Fund’s Expense Group. The Board noted that Funds management had agreed to continue contractual fee cap arrangements for the Fund designed to lower the Fund’s expenses.
The Board also received and considered information about the nature and extent of services offered and fee rates charged by Funds Management and the Sub-Advisers to other types of clients. In this regard, the Board received information about differences between the services, and the compliance, reporting, and other legal burdens and risks of providing investment advice to mutual funds and those associated with providing advice to non-mutual fund clients such as collective funds or institutional separate accounts.
The Board determined that the Advisory Agreement Rate for the Fund, both with and without an administration fee rate and before and after waivers, was reasonable in light of the Fund’s Expense Group information, the net expense ratio commitments, the services covered by the Advisory Agreements and other information provided. The Board also reviewed and considered the Sub-Advisory Agreement Rate and concluded that the Sub-Advisory Agreement Rate was reasonable in light of the services covered by the sub-advisory agreement and other information provided.
Profitability
The Board received and considered a profitability analysis of Funds Management, as well as an analysis of the profitability to the collective Wells Fargo businesses that provide services to the Fund. It considered that the information provided to it was necessarily estimated, and that the profitability information provided to it, especially on a fund-by-fund basis, did
| | | | | | |
| Other Information (Unaudited) | | Wells Fargo Advantage Diversified International Fund | | | 37 | |
not necessarily provide a precise tool for evaluating the appropriateness of the Fund’s Advisory Agreement Rate in isolation. It noted that the levels of profitability reported on a fund-by-fund basis varied widely, depending on, among other things, the size and type of fund. The Board concluded that the profitability reported by Funds Management was not unreasonable.
The Board did not consider separate profitability information with respect to Wells Capital Management, because, as an affiliate of Funds Management, its profitability information was subsumed in the collective Wells Fargo profitability analysis provided by Funds Management.
The Board did not consider separate profitability information with respect to Artisan and LSV, which are not affiliated with Funds Management. The Board considered that the sub-advisory fees paid to Artisan and LSV had been negotiated by Funds Management on an arm’s-length basis and that its profitability from its relationship with the Fund was not a material factor in determining whether to renew the sub-advisory agreements with Artisan and LSV.
Economies of Scale
With respect to possible economies of scale, the Board reviewed the breakpoints in the Fund’s advisory fee structure, which operate generally to reduce the effective Advisory Agreement Rate of the Fund (as a percentage of Fund assets) as the Fund grows in size. It considered that, as a fund shrinks in size, breakpoints conversely result in increasing fee levels. The Board noted that it would have on-going opportunities to review the appropriate levels of breakpoints in the future, and concluded that the breakpoints as implemented appeared to be a reasonable step toward sharing economies of scale, if any, with the Fund. However, the Board acknowledged the inherent limitations of any analysis of an investment adviser’s economies of scale and of any attempt to correlate breakpoints with such economies, stemming largely from the Board’s understanding that economies of scale are realized, if at all, by an investment adviser across a variety of products and services, not just with respect to a single fund.
Other benefits to Funds Management and the Sub-Advisers
The Board received and considered information regarding potential “fall-out” or ancillary benefits received by Funds Management and its affiliates and the Sub-Advisers as a result of their relationship with the Fund. Ancillary benefits could include, among others, benefits directly attributable to the relationship of Funds Management and the Sub-Advisers with the Fund and benefits potentially derived from an increase in Funds Management’s and the Sub-Advisers’ business as a result of their relationship with the Fund (such as the ability to market to shareholders other financial products offered by Funds Management and its affiliates or the Sub-Advisers).
The Board considered that Wells Fargo Funds Distributor, LLC, an affiliate of Funds Management, serves as distributor to the Fund and receives certain compensation for those services. The Board noted that various financial institutions, including affiliates of Funds Management, may receive distribution-related fees, shareholder servicing payments (including amounts derived from payments under Rule 12b-1 plans) and sub-transfer agency fees in respect of shares sold or held through them and services provided.
The Board also reviewed information about whether and to what extent soft dollar credits are sought and how any such credits are utilized and any benefits that may be realized by using an affiliated broker.
Other factors and broader review
The Board also considered the markets for distribution of the Fund’s shares, including the channels through which the Fund’s shares are offered and sold. The Board noted that the Fund is part of one of the few fund families that have both direct-to-fund and intermediary distribution channels. As discussed above, the Board reviews detailed materials received from Funds Management and the Sub-Advisers annually as part of the re-approval process under Section 15 of the 1940 Act and also reviews and assesses information about the quality of the services that the Fund receives throughout the year. In this regard, the Board has reviewed reports of Funds Management at each of its quarterly meetings, which include, among other things, portfolio reviews and performance reports. In addition, the Board confers with portfolio managers at various times throughout the year.
Conclusion
After considering the above-described factors and based on its deliberations and its evaluation of the information described above, the Board unanimously approved the continuation of the Advisory Agreements for an additional one-year period.
| | | | |
| 38 | | Wells Fargo Advantage Diversified International Fund | | List of Abbreviations |
The following is a list of common abbreviations for terms and entities which may have appeared in this report.
| ACB | — Agricultural Credit Bank |
| ADR | — American Depository Receipt |
| ADS | — American Depository Shares |
| AGC-ICC | — Assured Guaranty Corporation - Insured Custody Certificates |
| AGM | — Assured Guaranty Municipal |
| AMBAC | — American Municipal Bond Assurance Corporation |
| AMT | — Alternative Minimum Tax |
| BAN | — Bond Anticipation Notes |
| BHAC | — Berkshire Hathaway Assurance Corporation |
| CAB | — Capital Appreciation Bond |
| CCAB | — Convertible Capital Appreciation Bond |
| CDA | — Community Development Authority |
| CDO | — Collateralized Debt Obligation |
| COP | — Certificate of Participation |
| DRIVER | — Derivative Inverse Tax-Exempt Receipts |
| DW&P | — Department of Water & Power |
| DWR | — Department of Water Resources |
| ECFA | — Educational & Cultural Facilities Authority |
| EDA | — Economic Development Authority |
| EDFA | — Economic Development Finance Authority |
| ETF | — Exchange-Traded Fund |
| FFCB | — Federal Farm Credit Bank |
| FGIC | — Financial Guaranty Insurance Corporation |
| FHA | — Federal Housing Authority |
| FHLB | — Federal Home Loan Bank |
| FHLMC | — Federal Home Loan Mortgage Corporation |
| FICO | — The Financing Corporation |
| FNMA | — Federal National Mortgage Association |
| GDR | — Global Depository Receipt |
| GNMA | — Government National Mortgage Association |
| HCFR | — Healthcare Facilities Revenue |
| HEFA | — Health & Educational Facilities Authority |
| HEFAR | — Higher Education Facilities Authority Revenue |
| HFA | — Housing Finance Authority |
| HFFA | — Health Facilities Financing Authority |
| IBC | — Insured Bond Certificate |
| IDA | — Industrial Development Authority |
| IDAG | — Industrial Development Agency |
| IDR | — Industrial Development Revenue |
| KRW | — Republic of Korea Won |
| LIBOR | — London Interbank Offered Rate |
| LLC | — Limited Liability Company |
| LLP | — Limited Liability Partnership |
| MBIA | — Municipal Bond Insurance Association |
| MFHR | — Multi-Family Housing Revenue |
| MSTR | — Municipal Securities Trust Receipts |
| MUD | — Municipal Utility District |
| NATL-RE | — National Public Finance Guarantee Corporation |
| PCFA | — Pollution Control Finance Authority |
| PCR | — Pollution Control Revenue |
| PFA | — Public Finance Authority |
| PFFA | — Public Facilities Financing Authority |
| PFOTER | — Puttable Floating Option Tax-Exempt Receipts |
| plc | — Public Limited Company |
| PUTTER | — Puttable Tax-Exempt Receipts |
| R&D | — Research & Development |
| RDA | — Redevelopment Authority |
| RDFA | — Redevelopment Finance Authority |
| REIT | — Real Estate Investment Trust |
| ROC | — Reset Option Certificates |
| SAVRS | — Select Auction Variable Rate Securities |
| SBA | — Small Business Authority |
| SFHR | — Single Family Housing Revenue |
| SFMR | — Single Family Mortgage Revenue |
| SPA | — Standby Purchase Agreement |
| SPDR | — Standard & Poor’s Depositary Receipts |
| STRIPS | — Separate Trading of Registered Interest and Principal Securities |
| TAN | — Tax Anticipation Notes |
| TIPS | — Treasury Inflation-Protected Securities |
| TRAN | — Tax Revenue Anticipation Notes |
| TCR | — Transferable Custody Receipts |
| TTFA | — Transportation Trust Fund Authority |
| TVA | — Tennessee Valley Authority |
| XLCA | — XL Capital Assurance |


FOR MORE INFORMATION
More information about Wells Fargo Advantage Funds is available free upon request. To obtain literature, please write, e-mail, visit the Fund’s Web site, or call:
Wells Fargo Advantage Funds
P.O. Box 8266
Boston, MA 02266-8266
E-mail: wfaf@wellsfargo.com
Web site: wellsfargoadvantagefunds.com
Individual investors: 1-800-222-8222
Retail investment professionals: 1-888-877-9275
Institutional investment professionals: 1-866-765-0778
This report and the financial statements contained herein are submitted for the general information of the shareholders of Wells Fargo Advantage Funds. If this report is used for promotional purposes, distribution of the report must be accompanied or preceded by a current prospectus. For a prospectus containing more complete information, including charges and expenses, call 1-800-222-8222 or visit the Fund’s Web site at wellsfargoadvantagefunds.com. Please consider the investment objectives, risks, charges, and expenses of the investment carefully before investing. This and other information about Wells Fargo Advantage Funds can be found in the current prospectus. Read the prospectus carefully before you invest or send money.
Wells Fargo Funds Management, LLC, a wholly owned subsidiary of Wells Fargo & Company, provides investment advisory and administrative services for Wells Fargo Advantage Funds. Other affiliates of Wells Fargo & Company provide subadvisory and other services for the Funds. The Funds are distributed by Wells Fargo Funds Distributor, LLC, Member FINRA/SIPC, an affiliate of Wells Fargo & Company.
NOT FDIC INSURED ¡ NO BANK GUARANTEE ¡ MAY LOSE VALUE
© 2012 Wells Fargo Funds Management, LLC. All rights reserved.
| | |
 | | 209721 06-12 SA237/SAR237 4-12 |

Wells Fargo Advantage
Emerging Markets Equity Fund

Semi-Annual Report
April 30, 2012

Reduce clutter. Save trees.
Sign up for electronic delivery of prospectuses and shareholder reports at wellsfargo.com/advantagedelivery
Contents
The views expressed and any forward-looking statements are as of April 30, 2012, unless otherwise noted, and are those of the Fund managers and/or Wells Fargo Funds Management, LLC. Discussions of individual securities, or the markets generally, or any Wells Fargo Advantage Fund are not intended as individual recommendations. Future events or results may vary significantly from those expressed in any forward-looking statements; the views expressed are subject to change at any time in response to changing circumstances in the market. Wells Fargo Funds Management, LLC, disclaims any obligation to publicly update or revise any views expressed or forward-looking statements.
NOT FDIC INSURED ¡ NO BANK GUARANTEE ¡ MAY LOSE VALUE

WELLS FARGO INVESTMENT HISTORY
| | |
| |
| 1932 | | Keystone creates one of the first mutual fund families. |
| |
| 1971 | | Wells Fargo & Company introduces one of the first institutional index funds. |
| |
| 1978 | | Wells Fargo applies Markowitz and Sharpe’s research on Modern Portfolio Theory to introduce one of the industry’s first Tactical Asset Allocation (TAA) models in institutional separately managed accounts. |
| |
| 1984 | | Wells Fargo Stagecoach Funds launches its first asset allocation fund. |
| |
| 1989 | | The Tactical Asset Allocation (TAA) Model is first applied to Wells Fargo’s asset allocation mutual funds. |
| |
| 1994 | | Wells Fargo introduces the LifePath Funds, one of the first suites of target date funds (now the Wells Fargo Advantage Dow Jones Target Date FundsSM). |
| |
| 1996 | | Evergreen Investments and Keystone Funds merge. |
| |
| 1997 | | Wells Fargo launches Wells Fargo Advantage WealthBuilder PortfoliosSM, a fund-of-funds suite of products that includes the use of quantitative models to shift assets among investment styles. |
| |
| 1999 | | Norwest Advantage Funds and Stagecoach Funds are reorganized into Wells Fargo Funds after the merger of Norwest and Wells Fargo. |
| |
| 2002 | | Evergreen Retail and Evergreen Institutional companies form the umbrella asset management company, Evergreen Investments. |
| |
| 2005 | | The integration of Strong Funds with Wells Fargo Funds creates Wells Fargo Advantage Funds, resulting in one of the top 20 mutual fund companies in the United States. |
| |
| 2006 | | Wells Fargo Advantage Funds relaunches the target date product line as Wells Fargo Advantage Dow Jones Target Date Funds. |
| |
| 2010 | | The mergers and reorganizations of Evergreen and Wells Fargo Advantage mutual funds are completed, unifying the families under the brand of Wells Fargo Advantage Funds. |
Wells Fargo Advantage Funds®
Wells Fargo Advantage Funds skillfully guides institutions, financial advisors, and individuals through the investment terrain to help them reach their financial objectives. Everything we do on behalf of investors is backed by our unique combination of qualifications.
Strength
Our organization is built on the standards of integrity and service established by our parent company—Wells Fargo & Company—more than 150 years ago. And, because we’re part of a highly diversified financial enterprise, we offer the depth of resources to help investors succeed.
Expertise
Our multi-boutique model offers investors access to the independent thinking of premier investment managers that have been chosen for their time-tested strategies. While each team specializes in a specific investment strategy, collectively they provide investors a wide choice of distinct investment styles. Our dedication to investment excellence doesn’t end with our expertise in manager selection—risk management, analysis, and rigorous ongoing review seek to ensure each manager’s investment process remains consistent.
Partnership
Our collaborative approach is built around understanding the needs and goals of our clients. By adhering to core principles of sound judgment and steady guidance, we support you through every stage of the investment decision process.
Carefully consider a fund’s investment objectives, risks, charges, and expenses before investing. For a current prospectus and, if available, a summary prospectus, containing this and other information, visit wellsfargoadvantagefunds.com. Read it carefully before investing.
Wells Fargo Funds Management, LLC, a wholly owned subsidiary of Wells Fargo & Company, provides investment advisory and administrative services for Wells Fargo Advantage Funds®. Other affiliates of Wells Fargo & Company provide subadvisory and other services for the Funds. The Funds are distributed by Wells Fargo Funds Distributor, LLC, Member FINRA/SIPC, an affiliate of Wells Fargo & Company.
“Dow Jones®” and “Dow Jones Target Date IndexesSM” are service marks of Dow Jones Trademark Holdings, LLC (“Dow Jones”), have been licensed to CME Group Index Services LLC (“CME Indexes”) and have been sublicensed for use for certain purposes by Global Index Advisors, Inc, and Wells Fargo Funds Management, LLC. The Wells Fargo Advantage Dow Jones Target Date FundsSM based on the Dow Jones Target Date IndexesSM, are not sponsored, endorsed, sold or promoted by Dow Jones, CME Indexes or their respective affiliates and none of them makes any representation regarding the advisability of investing in such product(s).
NOT FDIC INSURED ¡ NO BANK GUARANTEE ¡ MAY LOSE VALUE
Not part of the semi-annual report.
Wells Fargo Advantage Funds offers more than 110 mutual funds across a wide range of asset classes, representing over $211 billion in assets under management, as of April 30, 2012.
| | | | |
| Equity Funds | | | | |
Asia Pacific Fund | | Enterprise Fund† | | Opportunity Fund† |
C&B Large Cap Value Fund | | Equity Value Fund | | Precious Metals Fund |
C&B Mid Cap Value Fund | | Global Opportunities Fund | | Premier Large Company Growth Fund |
Capital Growth Fund | | Growth Fund | | Small Cap Opportunities Fund |
Common Stock Fund | | Index Fund | | Small Cap Value Fund |
Disciplined U.S. Core Fund | | International Equity Fund | | Small Company Growth Fund |
Discovery Fund† | | International Value Fund | | Small Company Value Fund |
Diversified Equity Fund | | Intrinsic Small Cap Value Fund | | Small/Mid Cap Core Fund |
Diversified International Fund | | Intrinsic Value Fund | | Small/Mid Cap Value Fund |
Diversified Small Cap Fund | | Intrinsic World Equity Fund | | Special Mid Cap Value Fund |
Emerging Growth Fund | | Large Cap Core Fund | | Special Small Cap Value Fund |
Emerging Markets Equity Fund | | Large Cap Growth Fund | | Specialized Technology Fund |
Emerging Markets Equity Income Fund | | Large Company Value Fund | | Traditional Small Cap Growth Fund |
Emerging Markets Local Bond Fund | | Omega Growth Fund | | Utility and Telecommunications Fund |
Endeavor Select Fund† | | | | |
| Bond Funds | | | | |
Adjustable Rate Government Fund | | Inflation-Protected Bond Fund | | Short-Term Bond Fund |
California Limited-Term Tax-Free Fund | | Intermediate Tax/AMT-Free Fund | | Short-Term High Yield Bond Fund |
California Tax-Free Fund | | International Bond Fund | | Short-Term Municipal Bond Fund |
Colorado Tax-Free Fund | | Minnesota Tax-Free Fund | | Strategic Municipal Bond Fund |
Government Securities Fund | | Municipal Bond Fund | | Total Return Bond Fund |
High Income Fund | | North Carolina Tax-Free Fund | | Ultra Short-Term Income Fund |
High Yield Bond Fund | | Pennsylvania Tax-Free Fund | | Ultra Short-Term Municipal Income Fund |
Income Plus Fund | | Short Duration Government Bond Fund | | Wisconsin Tax-Free Fund |
| Asset Allocation Funds | | | | |
Absolute Return Fund | | WealthBuilder Equity Portfolio† | | Target 2020 Fund† |
Asset Allocation Fund | | WealthBuilder Growth Allocation Portfolio† | | Target 2025 Fund† |
Conservative Allocation Fund | | WealthBuilder Growth Balanced Portfolio† | | Target 2030 Fund† |
Diversified Capital Builder Fund | | WealthBuilder Moderate Balanced Portfolio† | | Target 2035 Fund† |
Diversified Income Builder Fund | | WealthBuilder Tactical Equity Portfolio† | | Target 2040 Fund† |
Growth Balanced Fund | | Target Today Fund† | | Target 2045 Fund† |
Index Asset Allocation Fund | | Target 2010 Fund† | | Target 2050 Fund† |
Moderate Balanced Fund | | Target 2015 Fund† | | Target 2055 Fund† |
WealthBuilder Conservative Allocation Portfolio† | | | | |
| Money Market Funds | | | | |
100% Treasury Money Market Fund | | Heritage Money Market Fund† | | National Tax-Free Money Market Fund |
California Municipal Money Market Fund | | Money Market Fund | | Prime Investment Money Market Fund |
Cash Investment Money Market Fund | | Municipal Cash Management Money Market Fund | | Treasury Plus Money Market Fund |
Government Money Market Fund | | Municipal Money Market Fund | | |
| Variable Trust Funds1 | | | | |
VT Discovery Fund† | | VT Intrinsic Value Fund | | VT Small Cap Growth Fund |
VT Index Asset Allocation Fund | | VT Omega Growth Fund | | VT Small Cap Value Fund |
VT International Equity Fund | | VT Opportunity Fund† | | VT Total Return Bond Fund |
An investment in a money market fund is not insured or guaranteed by the Federal Deposit Insurance Corporation or any other government agency. Although the Wells Fargo Advantage Money Market Funds seek to preserve the value of your investment at $1.00 per share, it is possible to lose money by investing in a money market fund.
| 1. | The Variable Trust Funds are generally available only through insurance company variable contracts. |
| † | In this report, the Wells Fargo Advantage Discovery FundSM, Wells Fargo Advantage Endeavor Select FundSM, Wells Fargo Advantage Enterprise FundSM, Wells Fargo Advantage Opportunity FundSM, Wells Fargo Advantage WealthBuilder Conservative Allocation PortfolioSM, Wells Fargo Advantage WealthBuilder Equity PortfolioSM, Wells Fargo Advantage WealthBuilder Growth Allocation PortfolioSM, Wells Fargo Advantage WealthBuilder Growth Balanced PortfolioSM, Wells Fargo Advantage WealthBuilder Moderate Balanced PortfolioSM, Wells Fargo Advantage WealthBuilder Tactical Equity PortfolioSM, Wells Fargo Advantage Dow Jones Target Today FundSM, Wells Fargo Advantage Dow Jones Target 2010 FundSM, Wells Fargo Advantage Dow Jones Target 2015 FundSM, Wells Fargo Advantage Dow Jones Target 2020 FundSM, Wells Fargo Advantage Dow Jones Target 2025 FundSM, Wells Fargo Advantage Dow Jones Target 2030 FundSM, Wells Fargo Advantage Dow Jones Target 2035 FundSM, Wells Fargo Advantage Dow Jones Target 2040 FundSM, Wells Fargo Advantage Dow Jones Target 2045 FundSM, Wells Fargo Advantage Dow Jones Target 2050 FundSM, Wells Fargo Advantage Dow Jones Target 2055 FundSM, Wells Fargo Advantage Heritage Money Market FundSM, Wells Fargo Advantage VT Discovery FundSM, and Wells Fargo Advantage VT Opportunity FundSM are referred to as the Discovery Fund, Endeavor Select Fund, Enterprise Fund, Opportunity Fund, WealthBuilder Conservative Allocation Portfolio, WealthBuilder Equity Portfolio, WealthBuilder Growth Allocation Portfolio, WealthBuilder Growth Balanced Portfolio, WealthBuilder Moderate Balanced Portfolio, WealthBuilder Tactical Equity Portfolio, Target Today Fund, Target 2010 Fund, Target 2015 Fund, Target 2020 Fund, Target 2025 Fund, Target 2030 Fund, Target 2035 Fund, Target 2040 Fund, Target 2045 Fund, Target 2050 Fund, Target 2055 Fund, Heritage Money Market Fund, VT Discovery Fund, and VT Opportunity Fund, respectively. |
Not part of the semi-annual report.
| | | | |
| 2 | | Wells Fargo Advantage Emerging Markets Equity Fund | | Letter to Shareholders |

Karla M. Rabusch,
President
Wells Fargo Advantage Funds
The period was marked by continued concerns about the possible global economic effects of the ongoing European sovereign debt crisis that began in Greece and later spread to the larger economies of Italy and Spain.
The potential for sovereign debt default had a negative effect on emerging markets, with indexes in major countries such as Brazil and India ending the period with losses.
Dear Valued Shareholder:
We’re pleased to offer you this semi-annual report for the Wells Fargo Advantage Emerging Markets Equity Fund for the six-month period that ended April 30, 2012. The period was marked by continued concerns about the possible global economic effects of the ongoing European sovereign debt crisis that began in Greece and later spread to the larger economies of Italy and Spain. Widespread support from central banks helped push developed market indexes to gains, but several emerging markets posted losses for the period.
Macroeconomic optimism seemed to fade as global growth slowed and worries rose.
Prior to and throughout the reporting period, concerns about the eurozone sovereign debt situation returned to center stage. Investors became increasingly concerned that Greece would default on its debt, a scenario that only seemed more likely as eurozone leaders began to openly discuss a “voluntary” haircut on Greek debt for private investors. Because many eurozone banks owned Greek debt and many U.S. banks had financial ties to eurozone banks, investors worried about the effects of such an event on the financial systems and on the global economy.
In October 2011, market participants turned their attention to the debt burdens of Italy—which, like the U.S., also had its credit rating downgraded by Standard & Poor’s—because even though it had a relatively modest budget deficit, it had a high amount of outstanding debt and a stagnant economy. French banks were heavily exposed to Italian debt, so Italy’s woes led to fears of a state bailout of French banks and a resulting increase in France’s expenditures.
The Greek credit crisis was seemingly addressed in March 2012, when the Greek government came to an agreement with its creditors that allowed it to write down the principal on most of its bonds in exchange for increased financial austerity. The Greek agreement, combined with unprecedented support for eurozone banks by the European Central Bank (ECB), seemed to calm investor concerns, at least temporarily, and most developed markets—both in Europe and Asia—ended the period with gains. The potential for sovereign debt default had a negative effect on emerging markets, with indexes in major countries such as Brazil and India ending the period with losses. China was a notable exception, posting a gain.
The U.S. economy reported relatively solid news.
In contrast to worrisome data from the eurozone, U.S. economic data remained moderately positive. Reported gross domestic product (GDP) growth came in at a 1.8% annualized rate in the third quarter of 2011 and then accelerated to a 3.0% annualized rate in the fourth quarter. The initial estimate for GDP growth in the first quarter of 2012 came in at a 2.2% annualized rate, further supporting the case for economic recovery. In addition, the major banks appeared to have taken steps toward repairing their balance sheets; in March, the Federal Reserve (Fed) announced that 15 of the 19 major banks had passed a “stress test” in which the Fed attempted to gauge whether the banks could survive a severe recession that included a 50% drop in the stock market and a 21% percent decline in housing prices.
| | | | | | |
| Letter to Shareholders | | Wells Fargo Advantage Emerging Markets Equity Fund | | | 3 | |
Financial stocks rebounded and outperformed the broader market for the reporting period after the Fed released details of the stress test. Stocks generally rallied across the market as investors seemed to be increasingly confident that the U.S. would not return to recession.
Central banks continued to provide stimulus.
Throughout the reporting period, the Federal Open Market Committee kept its key interest rates effectively at zero in order to support the economy and financial system. In response to extreme market volatility and signs of a weakening economy, the Fed announced its intention to keep interest rates low until at least late 2014.
Likewise, the Bank of Japan voted in late April to keep its key policy rate in a range of 0.0% to 0.1%. The bank announced that it would expand its government bond purchases by 10 trillion yen ($123.8 billion), targeting a 1.0% inflation rate in an attempt to end the country’s multi-year deflation.
As of November 1, 2011, the ECB had a key rate of 1.50%, which it had increased from 1.0% in an attempt to keep inflation in check. Soon, in response to weakness in the southern European economies, the ECB lowered its key rate to 1.25% in early November 2011 and 1.0% in December 2011. The ECB also continued to provide virtually unlimited liquidity for banks, announcing a Long-Term Refinancing Operation in December through which it provided low-cost three-year loans to lenders.
We use time-tested investment strategies, even as many variables are at work in the market.
Elevated unemployment and debt defaults continue to pressure consumers and businesses alike. In our experience, strict adherence to time-tested investment strategies has its rewards. As a whole, Wells Fargo Advantage Funds represents investments across a range of asset classes and investment styles, giving you an opportunity to create a diversified investment portfolio. While diversification may not prevent losses in a downturn, we believe it helps in managing risk.
Thank you for choosing to invest with Wells Fargo Advantage Funds. We appreciate your confidence in us and remain committed to helping you meet your financial needs. For current information about your fund investments, contact your investment professional, visit our Web site at wellsfargoadvantagefunds.com, or call us directly at 1-800-222-8222. We are available 24 hours a day, 7 days a week.
Sincerely,

Karla M. Rabusch
President
Wells Fargo Advantage Funds
| | | | |
| 4 | | Wells Fargo Advantage Emerging Markets Equity Fund | | Letter to Shareholders |
Notice to Shareholders
The Board of Trustees for Wells Fargo Advantage Funds has unanimously approved the following modifications to certain net asset value (NAV) waiver privileges and commission schedules:
| | n | | Effective May 1, 2012, automatic investment plan (AIP) purchases and proceeds received from systematic withdrawals will no longer qualify for NAV repurchase privileges. | |
| | n | | Effective May 1, 2012, discretionary rights to waive the upfront commission for Class C and “jumbo” Class A share purchases will no longer be granted to broker/dealers. However, we will continue to waive the Class C shares contingent deferred sales charge for redemptions by employer-sponsored retirement plans where the dealer of record waived its commission at the time of purchase. | |
| | n | | Effective July 31, 2012, NAV purchase privileges for former Evergreen Class IS and Class R shareholders are being modified to remove the ability to purchase Class A shares at NAV unless those shares are held directly with the Fund on or after July 31, 2012. | |
Please contact your investment professional or call us directly at 1-800-222-8222 if you have any questions on this Notice to Shareholders.
| | | | | | |
| Performance Highlights (Unaudited) | | Wells Fargo Advantage Emerging Markets Equity Fund | | | 5 | |
INVESTMENT OBJECTIVE
The Fund seeks long-term capital appreciation.
ADVISER
Wells Fargo Funds Management, LLC
SUB-ADVISER
Wells Capital Management Incorporated
PORTFOLIO MANAGERS
Derrick Irwin, CFA
Yi (Jerry) Zhang, Ph.D, CFA
FUND INCEPTION
September 6, 1994
| | | | |
TEN LARGEST EQUITY HOLDINGS1 (AS OF APRIL 30, 2012) | |
Samsung Electronics Company Limited | | | 4.56% | |
China Mobile Limited ADR | | | 3.74% | |
Taiwan Semiconductor Manufacturing company Limited ADR | | | 2.55% | |
Grupo Televisa SA ADR | | | 2.52% | |
Banco Bradesco SA ADR | | | 2.39% | |
SINA Corporation | | | 2.36% | |
ICICI Bank Limited ADR | | | 1.96% | |
KT Corporation ADR | | | 1.82% | |
America Movil SAB de CV ADR | | | 1.65% | |
China Life Insurance Company Limited ADR | | | 1.63% | |
| | |
SECTOR DISTRIBUTION2 (AS OF APRIL 30, 2012) |
|
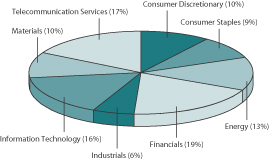 |
| 1. | The ten largest equity holdings are calculated based on the value of the securities divided by total net assets of the Fund. Holdings are subject to change and may have changed since the date specified. |
| 2. | Sector distribution is subject to change and is calculated based on the total long-term investments of the Fund. |
| | | | |
| 6 | | Wells Fargo Advantage Emerging Markets Equity Fund | | Performance Highlights (Unaudited) |
AVERAGE ANNUAL TOTAL RETURN3 (%) (AS OF APRIL 30, 2012)
| | | | | | | | | | | | | | | | | | | | | | | | | | | | | | | | | | | | | | | | | | | | |
| | | | | | Including Sales Charge | | | Excluding Sales Charge | | | Expense Ratios4 | |
| | | Inception Date | | | 6 Months* | | | 1 Year | | | 5 Year | | | 10 Year | | | 6 Months* | | | 1 Year | | | 5 Year | | | 10 Year | | | Gross | | | Net5 | |
Class A (EMGAX) | | | 09/06/1994 | | | | (4.68 | ) | | | (16.22 | ) | | | 3.88 | | | | 14.55 | | | | 1.15 | | | | (11.12 | ) | | | 5.12 | | | | 15.24 | | | | 1.70% | | | | 1.70% | |
Class B (EMGBX)** | | | 09/06/1994 | | | | (4.19 | ) | | | (16.12 | ) | | | 4.05 | | | | 14.66 | | | | 0.79 | | | | (11.77 | ) | | | 4.35 | | | | 14.66 | | | | 2.45% | | | | 2.45% | |
Class C (EMGCX) | | | 09/06/1994 | | | | (0.15 | ) | | | (12.75 | ) | | | 4.34 | | | | 14.39 | | | | 0.85 | | | | (11.75 | ) | | | 4.34 | | | | 14.39 | | | | 2.45% | | | | 2.45% | |
Administrator Class (EMGYX) | | | 09/06/1994 | | | | | | | | | | | | | | | | | | | | 1.27 | | | | (10.93 | ) | | | 5.36 | | | | 15.54 | | | | 1.54% | | | | 1.54% | |
Institutional Class (EMGNX) | | | 07/30/2010 | | | | | | | | | | | | | | | | | | | | 1.39 | | | | (10.72 | ) | | | 5.47 | | | | 15.59 | | | | 1.27% | | | | 1.27% | |
MSCI Emerging Markets Index (Net)6 | | | | | | | | | | | | | | | | | | | | | | | 3.93 | | | | (12.61 | ) | | | 3.48 | | | | 13.92 | | | | | | | | | |
| * | Returns for periods of less than one year are not annualized. |
| ** | Class B shares are closed to investment, except in connection with the reinvestment of any distributions and permitted exchanges. |
Figures quoted represent past performance, which is no guarantee of future results and do not reflect the deduction of taxes that a shareholder may pay on fund distributions or the redemption of fund shares. Investment return and principal value of an investment will fluctuate so that an investor’s shares, when redeemed, may be worth more or less than their original cost. Performance shown without sales charges would be lower if sales charges were reflected. Current performance may be lower or higher than the performance data quoted and assumes the reinvestment of dividends and capital gains. Current month-end performance is available on the Fund’s Web site – wellsfargoadvantagefunds.com.
Index returns do not include transaction costs associated with buying and selling securities, any mutual fund fees or expenses or any taxes. It is not possible to invest directly in an index.
For Class A shares, the maximum front-end sales charge is 5.75%. For Class B shares, the maximum contingent deferred sales charge is 5.00%. For Class C shares, the maximum contingent deferred sales charge is 1.00%. Performance including sales charge assumes the sales charge for the corresponding time period. Administrator Class and Institutional Class shares are sold without a front-end sales charge or contingent deferred sales charge.
Stock fund values fluctuate in response to the activities of individual companies and general market and economic conditions. Foreign investments are especially volatile and can rise or fall dramatically due to differences in the political and economic conditions of the host country. These risks are generally intensified in emerging markets. The use of derivatives may reduce returns and/or increase volatility. Certain investment strategies tend to increase the total risk of an investment (relative to the broader market). This Fund is exposed to regional risk and smaller-company securities risk. Consult the Fund’s prospectus for additional information on these and other risks.
| 3. | Historical performance shown for the Institutional Class shares prior to their inception reflects the performance of the Administrator Class shares, and includes the higher expenses applicable to the Administrator Class shares. If these expenses had not been included, returns would be higher. Historical performance shown for all classes of the Fund prior to July 19, 2010 is based on the performance of the Fund’s predecessor, Evergreen Emerging Markets Growth Fund. |
| 4. | Reflects the expense ratios as stated in the most recent prospectuses. |
| 5. | The Adviser has committed through July 18, 2013 to waive fees and/or reimburse expenses to the extent necessary to cap the Fund’s Total Annual Fund Operating Expenses After Fee Waiver, excluding certain expenses, at 1.81% for Class A, 2.56% for Class B, 2.56% for Class C, 1.60% for Administrator Class and 1.30% for Institutional Class. Without this cap, the Fund’s returns would have been lower. |
| 6. | The Morgan Stanley Capital International Emerging Markets (MSCI Emerging Markets) Index (Net) is a free float-adjusted market capitalization index designed to measure the equity market performance in the global emerging markets. The index is currently composed of 21 emerging markets country indexes. You cannot invest directly in an index. Source: MSCI. MSCI makes no express or implied warranties or representations and shall have no liability whatsoever with respect to any MSCI data contained herein. The MSCI data may not be further redistributed or used as a basis for other indexes or any securities or financial products. This report is not approved, reviewed, or produced by MSCI. |
| | | | | | |
| Fund Expenses (Unaudited) | | Wells Fargo Advantage Emerging Markets Equity Fund | | | 7 | |
As a shareholder of the Fund, you incur two types of costs: (1) transaction costs, including sales charges (loads) on purchase payments and contingent deferred sales charges (if any) on redemptions and (2) ongoing costs, including management fees; distribution (12b-1) and/or shareholder service fees; and other Fund expenses. This example is intended to help you understand your ongoing costs (in dollars) of investing in the Fund and to compare these costs with the ongoing costs of investing in other mutual funds.
The example is based on an investment of $1,000 invested at the beginning of the six-month period and held for the entire period from November 1, 2011 to April 30, 2012.
Actual Expenses
The “Actual” line of the table below provides information about actual account values and actual expenses. You may use the information in this line, together with the amount you invested, to estimate the expenses that you paid over the period. Simply divide your account value by $1,000 (for example, an $8,600 account value divided by $1,000 = 8.6), then multiply the result by the number in the “Actual” line under the heading entitled “Expenses Paid During Period” for your applicable class of shares to estimate the expenses you paid on your account during this period.
Hypothetical Example for Comparison Purposes
The “Hypothetical” line of the table below provides information about hypothetical account values and hypothetical expenses based on the Fund’s actual expense ratio and an assumed rate of return of 5% per year before expenses, which is not the Fund’s actual return. The hypothetical account values and expenses may not be used to estimate the actual ending account balance or expenses you paid for the period. You may use this information to compare the ongoing costs of investing in the Fund and other funds. To do so, compare this 5% hypothetical example with the 5% hypothetical examples that appear in the shareholder reports of the other funds.
Please note that the expenses shown in the table are meant to highlight your ongoing costs only and do not reflect any transactional costs, such as sales charges (loads) and contingent deferred sales charges. Therefore, the “Hypothetical” line of the table is useful in comparing ongoing costs only, and will not help you determine the relative total costs of owning different funds. In addition, if these transactional costs were included, your costs would have been higher.
| | | | | | | | | | | | | | | | |
| | | Beginning
Account Value
11-01-2011 | | | Ending
Account Value
04-30-2012 | | | Expenses
Paid During
the Period1 | | | Net Annual
Expense Ratio | |
Class A | | | | | | | | | | | | | | | | |
Actual | | $ | 1,000.00 | | | $ | 1,011.52 | | | $ | 8.30 | | | | 1.66 | % |
Hypothetical (5% return before expenses) | | $ | 1,000.00 | | | $ | 1,016.61 | | | $ | 8.32 | | | | 1.66 | % |
Class B | | | | | | | | | | | | | | | | |
Actual | | $ | 1,000.00 | | | $ | 1,007.90 | | | $ | 12.03 | | | | 2.41 | % |
Hypothetical (5% return before expenses) | | $ | 1,000.00 | | | $ | 1,012.88 | | | $ | 12.06 | | | | 2.41 | % |
Class C | | | | | | | | | | | | | | | | |
Actual | | $ | 1,000.00 | | | $ | 1,008.52 | | | $ | 12.04 | | | | 2.41 | % |
Hypothetical (5% return before expenses) | | $ | 1,000.00 | | | $ | 1,012.88 | | | $ | 12.06 | | | | 2.41 | % |
Administrator Class | | | | | | | | | | | | | | | | |
Actual | | $ | 1,000.00 | | | $ | 1,012.71 | | | $ | 7.26 | | | | 1.45 | % |
Hypothetical (5% return before expenses) | | $ | 1,000.00 | | | $ | 1,017.65 | | | $ | 7.27 | | | | 1.45 | % |
Institutional Class | | | | | | | | | | | | | | | | |
Actual | | $ | 1,000.00 | | | $ | 1,013.90 | | | $ | 6.21 | | | | 1.24 | % |
Hypothetical (5% return before expenses) | | $ | 1,000.00 | | | $ | 1,018.70 | | | $ | 6.22 | | | | 1.24 | % |
| 1. | Expenses paid is equal to the annualized expense ratio of each class multiplied by the average account value over the period, multiplied by the number of days in the most recent fiscal half-year divided by the number of days in the fiscal year (to reflect the one-half year period). |
| | | | |
| 8 | | Wells Fargo Advantage Emerging Markets Equity Fund | | Portfolio of Investments—April 30, 2012 (Unaudited) |
| | | | | | | | | | | | |
| Security Name | | | | | | Shares | | | Value | |
| | | | | | | | | | | | |
| | | | |
Common Stocks: 87.85% | | | | | | | | | | | | |
| | | | |
| Argentina: 0.04% | | | | | | | | | | | | |
Irsa Inversiones y Representaciones SA ADR (Financials, Real Estate Management & Development) « | | | | | | | 148,500 | | | $ | 1,170,180 | |
| | | | | | | | | | | | |
| | | | |
| Brazil: 13.60% | | | | | | | | | | | | |
All America Latina Logistica SA (Industrials, Road & Rail) | | | | | | | 6,199,770 | | | | 28,231,778 | |
B2W Companhia Global do Varejo (Consumer Discretionary, Internet & Catalog Retail) † | | | | | | | 1,954,790 | | | | 8,337,457 | |
Banco Bradesco SA ADR (Financials, Commercial Banks) « | | | | | | | 4,084,535 | | | | 65,475,096 | |
Banco do Brasil SA (Financials, Commercial Banks) | | | | | | | 3,105,000 | | | | 38,410,356 | |
BRF Brasil Foods SA ADR (Consumer Staples, Food Products) « | | | | | | | 432,930 | | | | 7,978,900 | |
Brookfield Incorporacoes SA (Financials, Real Estate Management & Development) | | | | | | | 4,603,572 | | | | 12,123,879 | |
CCR SA (Industrials, Transportation Infrastructure) | | | | | | | 1,256,400 | | | | 9,755,119 | |
CETIP SA (Financials, Capital Markets) | | | | | | | 213,100 | | | | 3,283,449 | |
Cielo SA (Information Technology, IT Services) | | | | | | | 636,480 | | | | 19,099,576 | |
Companhia De Bebidas ADR (Consumer Staples, Beverages) « | | | | | | | 409,200 | | | | 17,178,216 | |
Lojas Renner SA (Consumer Discretionary, Multiline Retail) | | | | | | | 500,800 | | | | 16,097,377 | |
MRV Engenharia e Participacoes SA (Consumer Discretionary, Household Durables) | | | | | | | 696,600 | | | | 4,052,826 | |
OGX Petroleo e Gas Participacoes SA (Energy, Oil, Gas & Consumable Fuels) † | | | | | | | 300,000 | | | | 2,082,208 | |
Petroleo Brasileiro SA ADR (Energy, Oil, Gas & Consumable Fuels) | | | | | | | 1,731,400 | | | | 40,757,156 | |
Petroleo Brasileiro SA ADR Class A (Energy, Oil, Gas & Consumable Fuels) « | | | | | | | 1,741,535 | | | | 38,592,416 | |
Redecard SA (Information Technology, IT Services) | | | | | | | 888,400 | | | | 14,960,858 | |
Sao Carlos Empreendimentos e Participacoes SA (Financials, Real Estate Management & Development) | | | | | | | 258,900 | | | | 4,311,038 | |
Tim Participacoes SA (Telecommunication Services, Wireless Telecommunication Services) | | | | | | | 2,249,763 | | | | 13,384,210 | |
Vale SA ADR (Materials, Metals & Mining) « | | | | | | | 1,314,236 | | | | 29,176,039 | |
| | | | |
| | | | | | | | | | | 373,287,954 | |
| | | | | | | | | | | | |
| | | | |
| China: 11.54% | | | | | | | | | | | | |
51job Incorporated ADR (Industrials, Commercial Services & Supplies) †« | | | | | | | 419,604 | | | | 25,478,355 | |
Bitauto Holdings Limited ADR (Information Technology, Internet Software & Services) † | | | | | | | 292,524 | | | | 1,313,433 | |
China Life Insurance Company Limited ADR (Financials, Insurance) « | | | | | | | 1,119,186 | | | | 44,722,673 | |
China Telecom Corporation Limited (Telecommunication Services, Diversified Telecommunication Services) | | | | | | | 48,828,000 | | | | 26,306,257 | |
Ctrip.com International Limited ADR (Consumer Discretionary, Specialty Retail) † | | | | | | | 511,574 | | | | 11,085,809 | |
Dalian Port Company Limited (Industrials, Transportation Infrastructure) | | | | | | | 18,732,000 | | | | 4,273,377 | |
First Tractor Company (Industrials, Machinery) | | | | | | | 7,212,000 | | | | 6,729,892 | |
Li Ning Company Limited (Consumer Discretionary, Textiles, Apparel & Luxury Goods) | | | | | | | 6,372,500 | | | | 5,864,377 | |
New Oriental Education & Technology Group Incorporated (Consumer Discretionary, Diversified Consumer Services) † | | | | | | | 1,381,672 | | | | 36,932,093 | |
NVC Lighting Holdings Limited (Consumer Discretionary, Household Durables) | | | | | | | 16,823,000 | | | | 6,114,577 | |
PetroChina Company Limited ADR (Energy, Oil, Gas & Consumable Fuels) « | | | | | | | 248,900 | | | | 37,041,298 | |
Sichuan Expressway Company (Industrials, Transportation Infrastructure) | | | | | | | 22,532,000 | | | | 9,060,834 | |
SINA Corporation (Information Technology, Internet Software & Services) †« | | | | | | | 1,104,817 | | | | 64,642,843 | |
Sinotrans Limited (Industrials, Air Freight & Logistics) | | | | | | | 32,149,000 | | | | 5,469,596 | |
Tsingtao Brewery Company Limited (Consumer Staples, Beverages) | | | | | | | 5,202,000 | | | | 31,579,489 | |
| | | | |
| | | | | | | | | | | 316,614,903 | |
| | | | | | | | | | | | |
| | | | |
| Hong Kong: 6.42% | | | | | | | | | | | | |
China Mobile Limited (Telecommunication Services, Wireless Telecommunication Services) | | | | | | | 460,000 | | | | 5,095,861 | |
China Mobile Limited ADR (Telecommunication Services, Wireless Telecommunication Services) « | | | | | | | 1,853,333 | | | | 102,563,448 | |
CNOOC Limited ADR (Energy, Oil, Gas & Consumable Fuels) « | | | | | | | 206,600 | | | | 43,726,890 | |
Johnson Electric Holdings Limited (Industrials, Electrical Equipment) | | | | | | | 15,638,500 | | | | 9,836,232 | |
The accompanying notes are an integral part of these financial statements.
| | | | | | |
| Portfolio of Investments—April 30, 2012 (Unaudited) | | Wells Fargo Advantage Emerging Markets Equity Fund | | | 9 | |
| | | | | | | | | | | | |
| Security Name | | | | | | Shares | | | Value | |
| | | | | | | | | | | | |
| | | | |
| Hong Kong (continued) | | | | | | | | | | | | |
Shangri-La Asia Limited (Consumer Discretionary, Hotels, Restaurants & Leisure) | | | | | | | 2,815,500 | | | $ | 5,980,350 | |
Texwinca Holdings Limited (Consumer Discretionary, Textiles, Apparel & Luxury Goods) | | | | | | | 7,424,000 | | | | 9,090,241 | |
| | | | |
| | | | | | | | | | | 176,293,022 | |
| | | | | | | | | | | | |
| | | | |
| India: 7.06% | | | | | | | | | | | | |
Bharti Airtel Limited (Telecommunication Services, Wireless Telecommunication Services) | | | | | | | 4,538,728 | | | | 26,741,462 | |
Hindustan Unilever Limited (Consumer Staples, Household Products) | | | | | | | 1,140,200 | | | | 9,035,057 | |
ICICI Bank Limited ADR (Financials, Commercial Banks) « | | | | | | | 1,584,295 | | | | 53,691,758 | |
Idea Cellular Limited (Telecommunication Services, Wireless Telecommunication Services) † | | | | | | | 6,640,500 | | | | 9,891,447 | |
Infosys Technologies Limited ADR (Information Technology, IT Services) « | | | | | | | 868,600 | | | | 41,128,210 | |
Oil & Natural Gas Corporation Limited (Energy, Oil, Gas & Consumable Fuels) | | | | | | | 825,600 | | | | 4,230,613 | |
Reliance Industries Limited (Energy, Oil, Gas & Consumable Fuels) 144A | | | | | | | 1,142,387 | | | | 32,238,161 | |
Reliance Industries Limited (Energy, Oil, Gas & Consumable Fuels) | | | | | | | 645,000 | | | | 9,119,345 | |
Ultra Tech Cement Limited (Materials, Construction Materials) | | | | | | | 286,000 | | | | 7,732,854 | |
| | | | |
| | | | | | | | | | | 193,808,907 | |
| | | | | | | | | | | | |
| | | | |
| Indonesia: 0.98% | | | | | | | | | | | | |
PT Astra Agro Lestari Tbk (Consumer Staples, Food Products) | | | | | | | 2,659,000 | | | | 6,191,459 | |
PT Astra International Tbk (Consumer Discretionary, Automobiles) | | | | | | | 695,500 | | | | 5,372,994 | |
PT Telekomunik Indonesia Persoro Tbk (Telecommunication Services, Diversified Telecommunication Services) « | | | | | | | 420,464 | | | | 15,225,001 | |
| | | | |
| | | | | | | | | | | 26,789,454 | |
| | | | | | | | | | | | |
| | | | |
| Israel: 0.89% | | | | | | | | | | | | |
Israel Chemicals Limited (Materials, Chemicals) | | | | | | | 1,719,600 | | | | 19,727,611 | |
Teva Pharmaceutical Industries Limited ADR (Health Care, Pharmaceuticals) | | | | | | | 100,000 | | | | 4,574,000 | |
| | | | |
| | | | | | | | | | | 24,301,611 | |
| | | | | | | | | | | | |
| | | | |
| Malaysia: 1.68% | | | | | | | | | | | | |
Genting Berhad (Consumer Discretionary, Hotels, Restaurants & Leisure) | | | | | | | 5,071,600 | | | | 17,329,922 | |
KLCC Property Holdings Berhad (Financials, Real Estate Management & Development) | | | | | | | 3,387,900 | | | | 3,795,433 | |
Resorts World Berhad (Consumer Discretionary, Hotels, Restaurants & Leisure) | | | | | | | 9,328,100 | | | | 11,837,377 | |
Sime Darby Berhad (Industrials, Industrial Conglomerates) | | | | | | | 4,088,137 | | | | 13,158,775 | |
| | | | |
| | | | | | | | | | | 46,121,507 | |
| | | | | | | | | | | | |
| | | | |
| Mexico: 6.23% | | | | | | | | | | | | |
America Movil SAB de CV ADR (Telecommunication Services, Wireless Telecommunication Services) « | | | | | | | 1,695,400 | | | | 45,182,410 | |
Cemex SA de CV (Materials, Construction Materials) †« | | | | | | | 2,361,507 | | | | 17,073,696 | |
Fibra Uno Administracion SA de CV (Financials, REITs) | | | | | | | 3,642,418 | | | | 7,270,323 | |
Fomento Economico Mexicano SA de CV ADR (Consumer Staples, Beverages) | | | | | | | 272,400 | | | | 22,135,224 | |
Grupo Financiero Banorte SA de CV (Financials, Commercial Banks) | | | | | | | 2,093,936 | | | | 10,098,385 | |
Grupo Televisa SA ADR (Consumer Discretionary, Media) | | | | | | | 3,145,000 | | | | 69,095,650 | |
Promotora Ambiental SAB de CV (Industrials, Commercial Services & Supplies) † | | | | | | | 258,800 | | | | 228,284 | |
| | | | |
| | | | | | | | | | | 171,083,972 | |
| | | | | | | | | | | | |
| | | | |
| Peru: 1.27% | | | | | | | | | | | | |
Compania de Minas Buenaventura SA ADR (Materials, Metals & Mining) « | | | | | | | 845,100 | | | | 34,877,277 | |
| | | | | | | | | | | | |
The accompanying notes are an integral part of these financial statements.
| | | | |
| 10 | | Wells Fargo Advantage Emerging Markets Equity Fund | | Portfolio of Investments—April 30, 2012 (Unaudited) |
| | | | | | | | | | | | |
| Security Name | | | | | | Shares | | | Value | |
| | | | | | | | | | | | |
| | | | |
| Philippines: 0.62% | | | | | | | | | | | | |
Ayala Corporation (Financials, Diversified Financial Services) | | | | | | | 578,124 | | | $ | 5,888,046 | |
Metropolitan Bank & Trust Company (Financials, Commercial Banks) | | | | | | | 2,808,093 | | | | 6,079,102 | |
SM Investments Corporation (Industrials, Industrial Conglomerates) | | | | | | | 298,466 | | | | 4,941,443 | |
| | | | |
| | | | | | | | | | | 16,908,591 | |
| | | | | | | | | | | | |
| | | | |
| Poland: 0.24% | | | | | | | | | | | | |
Telekomunikacja Polska SA (Telecommunication Services, Diversified Telecommunication Services) | | | | | | | 1,251,897 | | | | 6,550,693 | |
| | | | | | | | | | | | |
| | | | |
| Russia: 3.92% | | | | | | | | | | | | |
Gazprom ADR (Energy, Oil, Gas & Consumable Fuels) | | | | | | | 2,189,130 | | | | 25,262,560 | |
Lukoil Oil Company ADR (Energy, Oil, Gas & Consumable Fuels) | | | | | | | 522,549 | | | | 32,058,381 | |
Mobile Telesystems ADR (Telecommunication Services, Wireless Telecommunication Services) « | | | | | | | 1,590,000 | | | | 31,100,400 | |
Sberbank of Russia (Financials, Commercial Banks) (a) | | | | | | | 5,517,377 | | | | 17,701,732 | |
Sberbank Sponsored ADR (Financials, Commercial Banks) | | | | | | | 114,095 | | | | 1,477,530 | |
| | | | |
| | | | | | | | | | | 107,600,603 | |
| | | | | | | | | | | | |
| | | | |
| South Africa: 7.80% | | | | | | | | | | | | |
Anglo Platinum Limited (Materials, Metals & Mining) « | | | | | | | 284,832 | | | | 18,467,627 | |
AngloGold Ashanti Limited ADR (Materials, Metals & Mining) | | | | | | | 1,002,742 | | | | 34,474,270 | |
Gold Fields Limited ADR (Materials, Metals & Mining) « | | | | | | | 960,700 | | | | 12,364,209 | |
Impala Platinum Holdings Limited (Materials, Metals & Mining) | | | | | | | 1,290,758 | | | | 25,123,233 | |
MTN Group Limited (Telecommunication Services, Wireless Telecommunication Services) | | | | | | | 1,714,843 | | | | 29,978,068 | |
Pretoria Portland Cement Company Limited (Materials, Construction Materials) | | | | | | | 1,457,398 | | | | 5,808,331 | |
Sasol Limited ADR (Energy, Oil, Gas & Consumable Fuels) | | | | | | | 619,387 | | | | 29,377,525 | |
Standard Bank Group Limited (Financials, Commercial Banks) | | | | | | | 1,835,490 | | | | 27,095,458 | |
Tiger Brands Limited (Consumer Staples, Food Products) | | | | | | | 858,733 | | | | 31,484,354 | |
| | | | |
| | | | | | | | | | | 214,173,075 | |
| | | | | | | | | | | | |
| | | | |
| South Korea: 12.10% | | | | | | | | | | | | |
KB Financial Group Incorporated ADR (Financials, Commercial Banks) « | | | | | | | 593,117 | | | | 20,124,460 | |
Korea Electric Power Corporation (Utilities, Electric Utilities) † | | | | | | | 222,360 | | | | 4,269,627 | |
KT Corporation ADR (Telecommunication Services, Diversified Telecommunication Services) | | | | | | | 3,882,900 | | | | 49,895,265 | |
KT&G Corporation (Consumer Staples, Tobacco) | | | | | | | 590,491 | | | | 40,546,047 | |
Lotte Chilsung Beverage Company Limited (Consumer Staples, Beverages) | | | | | | | 7,255 | | | | 8,204,305 | |
Lotte Confectionery Company Limited (Consumer Staples, Food Products) | | | | | | | 7,227 | | | | 10,948,014 | |
Samsung Electronics Company Limited (Information Technology, Semiconductors & Semiconductor Equipment) | | | | | | | 101,836 | | | | 125,253,437 | |
Samsung Life Insurance Company Limited (Financials, Insurance) | | | | | | | 326,137 | | | | 28,858,489 | |
Shinhan Financial Group Company Limited (Financials, Commercial Banks) | | | | | | | 725,945 | | | | 25,373,147 | |
SK Telecom Company Limited (Telecommunication Services, Wireless Telecommunication Services) | | | | | | | 23,720 | | | | 2,833,492 | |
SK Telecom Company Limited ADR (Telecommunication Services, Wireless Telecommunication Services) « | | | | | | | 1,175,319 | | | | 15,890,313 | |
| | | | |
| | | | | | | | | | | 332,196,596 | |
| | | | | | | | | | | | |
| | | | |
| Taiwan: 8.42% | | | | | | | | | | | | |
104 Corporation (Industrials, Commercial Services & Supplies) | | | | | | | 1,455,000 | | | | 4,034,956 | |
Cathay Financial Holding Company Limited (Financials, Insurance) | | | | | | | 6,886,897 | | | | 7,285,726 | |
Chunghwa Telecom Limited ADR (Telecommunication Services, Diversified Telecommunication Services) « | | | | | | | 273,834 | | | | 8,483,377 | |
Far Eastern Textile Company Limited (Industrials, Industrial Conglomerates) | | | | | | | 25,342,341 | | | | 28,588,600 | |
First Financial Holding Company Limited (Financials, Commercial Banks) | | | | | | | 43,101,425 | | | | 25,823,816 | |
The accompanying notes are an integral part of these financial statements.
| | | | | | |
| Portfolio of Investments—April 30, 2012 (Unaudited) | | Wells Fargo Advantage Emerging Markets Equity Fund | | | 11 | |
| | | | | | | | | | | | | | | | |
| Security Name | | | | | | | | Shares | | | Value | |
| | | | | | | | | | | | | | | | |
| | | | |
| Taiwan (continued) | | | | | | | | | | | | | | | | |
Fuhwa Financial Holdings Company Limited (Financials, Capital Markets) † | | | | | | | | | | | 53,876,750 | | | $ | 25,823,801 | |
Mediatek Incorporated (Information Technology, Semiconductors & Semiconductor Equipment) | | | | | | | | | | | 884,881 | | | | 7,664,717 | |
Siliconware Precision Industries Company (Information Technology, Semiconductors & Semiconductor Equipment) | | | | | | | | | | | 8,050,000 | | | | 9,549,703 | |
Taiwan Semiconductor Manufacturing Company Limited (Information Technology, Semiconductors & Semiconductor Equipment) | | | | | | | | | | | 7,635,224 | | | | 22,689,883 | |
Taiwan Semiconductor Manufacturing Company Limited ADR (Information Technology, Semiconductors & Semiconductor Equipment) « | | | | | | | | | | | 4,494,952 | | | | 70,031,352 | |
United Microelectronics Corporation (Information Technology, Semiconductors & Semiconductor Equipment) | | | | | | | | | | | 40,441,092 | | | | 21,183,858 | |
| | | | |
| | | | | | | | | | | | | | | 231,159,789 | |
| | | | | | | | | | | | | | | | |
| | | | |
| Thailand: 3.15% | | | | | | | | | | | | | | | | |
Bangkok Bank PCL (Financials, Commercial Banks) | | | | 3,098,900 | | | | 19,550,784 | |
C.P. Seven Eleven PCL (Consumer Staples, Food & Staples Retailing) | | | | 4,213,200 | | | | 10,447,366 | |
PTT Exploration & Production PCL (Energy, Oil, Gas & Consumable Fuels) | | | | 2,801,100 | | | | 16,168,951 | |
PTT PCL (Energy, Oil, Gas & Consumable Fuels) | | | | 2,151,900 | | | | 24,493,171 | |
Thai Beverage PCL (Consumer Staples, Beverages) | | | | 59,094,000 | | | | 15,758,400 | |
| | | | |
| | | | | | | | | | | | | | | 86,418,672 | |
| | | | | | | | | | | | | | | | |
| | | | |
| Turkey: 1.59% | | | | | | | | | | | | | | | | |
Anadolu Efes Biracilik Ve Malt Sanayii AS (Consumer Staples, Beverages) | | | | 1,140,725 | | | | 16,075,698 | |
Turkcell Iletisim Hizmetleri AS ADR (Telecommunication Services, Wireless Telecommunication Services) †« | | | | | | | | | | | 2,229,600 | | | | 27,557,856 | |
| | | | |
| | | | | | | | | | | | | | | 43,633,554 | |
| | | | | | | | | | | | | | | | |
| | | | |
| United Kingdom: 0.30% | | | | | | | | | | | | | | | | |
African Barrick Gold Limited (Materials, Metals & Mining) | | | | | | | | | | | 1,428,500 | | | | 8,329,695 | |
| | | | | | | | | | | | | | | | |
| | | | |
Total Common Stocks (Cost $2,209,369,675) | | | | | | | | | | | | | | | 2,411,320,055 | |
| | | | | | | | | | | | | | | | |
| | | | |
| | | Interest Rate | | | Maturity Date | | | Principal | | | | |
| Convertible Debentures: 0.00% | | | | | | | | | | | | | | | | |
| | | | |
| Brazil: 0.00% | | | | | | | | | | | | | | | | |
Lupatech SA (Energy, Energy Equipment & Services) (a)(i) | | | 6.50 | % | | | 04/15/2018 | | | | $ 303,000 | | | | 119,788 | |
| | | | | | | | | | | | | | | | |
| | | | |
Total Convertible Debentures (Cost $160,691) | | | | | | | | | | | | | | | 119,788 | |
| | | | | | | | | | | | | | | | |
| | | | |
| | | Dividend Yield | | | | | | Shares | | | | |
| Preferred Stocks: 3.24% | | | | | | | | | | | | | | | | |
| | | | |
| Brazil: 3.24% | | | | | | | | | | | | | | | | |
Banco do Estado do Rio Grande do Sul SA (Financials, Commercial Banks) | | | 3.71 | | | | | | | | 1,143,000 | | | | 9,906,020 | |
Centrais Electricas Brasileiras SA (Utilities, Electric Utilities) | | | 7.15 | | | | | | | | 567,500 | | | | 6,820,777 | |
Itau Unibanco Holding SA ADR (Financials, Commercial Banks) | | | 2.75 | | | | | | | | 90,000 | | | | 1,412,100 | |
Lojas Americanas SA (Consumer Discretionary, Multiline Retail) | | | 0.44 | | | | | | | | 4,459,744 | | | | 41,926,717 | |
Vale SA ADR (Materials, Metals & Mining) « | | | 8.11 | | | | | | | | 1,340,400 | | | | 28,992,852 | |
| | | | |
Total Preferred Stocks (Cost $78,730,055) | | | | | | | | | | | | | | | 89,058,466 | |
| | | | | | | | | | | | | | | | |
The accompanying notes are an integral part of these financial statements.
| | | | |
| 12 | | Wells Fargo Advantage Emerging Markets Equity Fund | | Portfolio of Investments—April 30, 2012 (Unaudited) |
| | | | | | | | | | | | | | |
| Security Name | | Yield | | | | | Shares | | | Value | |
| | | | | | | | | | | | | | |
| | | | |
Short-Term Investments: 22.30% | | | | | | | | | | | | | | |
| | | | |
| Investment Companies: 22.30% | | | | | | | | | | | | | | |
Wells Fargo Advantage Cash Investment Money Market Fund, Select Class (l)(u) | | | 0.11 | % | | | | | 216,729,412 | | | $ | 216,729,412 | |
Wells Fargo Securities Lending Cash Investments, LLC (v)(l)(u)(r) | | | 0.19 | | | | | | 395,237,180 | | | | 395,237,180 | |
| | | | |
Total Short-Term Investments (Cost $611,966,592) | | | | | | | | | | | | | 611,966,592 | |
| | | | | | | | | | | | | | |
| | | | | | | | |
Total Investments in Securities (Cost $2,900,227,013) * | | | 113.39 | % | | | 3,112,464,901 | |
Other Assets and Liabilities, Net | | | (13.39 | ) | | | (367,604,740 | ) |
| | | | | | | | |
| Total Net Assets | | | 100.00 | % | | $ | 2,744,860,161 | |
| | | | | | | | |
| † | Non-income earning security |
| « | All or a portion of this security is on loan. |
| 144A | Security that may be resold to “qualified institutional buyers” under Rule 144A or security offered pursuant to Section 4(2) of the Securities Act of 1933, as amended. |
| (a) | Security is fair valued by the Management Valuation Team, and in certain instances by the Board of Trustees, in accordance with procedures approved by the Board of Trustees. |
| (v) | Security represents investment of cash collateral received from securities on loan. |
| (l) | Investment in an affiliate |
| (u) | Rate shown is the 7-day annualized yield at period end. |
| (r) | The investment company is exempt from registration under Section 3(c)(7) of the 1940 Act. |
| * | Cost for federal income tax purposes is $2,910,191,613 and net unrealized appreciation (depreciation) consists of: |
| | | | |
Gross unrealized appreciation | | $ | 392,454,859 | |
Gross unrealized depreciation | | | (190,181,571 | ) |
| | | | |
Net unrealized appreciation | | $ | 202,273,288 | |
The accompanying notes are an integral part of these financial statements.
| | | | | | |
| Statement of Assets and Liabilities—April 30, 2012 (Unaudited) | | Wells Fargo Advantage Emerging Markets Equity Fund | | | 13 | |
| | | | |
| | | | |
| |
Assets | | | | |
Investments | | | | |
In unaffiliated securities (including securities on loan), at value (see cost below) | | $ | 2,500,498,309 | |
In affiliated securities, at value (see cost below) | | | 611,966,592 | |
| | | | |
Total investments, at value (see cost below) | | | 3,112,464,901 | |
Foreign currency, at value (see cost below) | | | 17,692,268 | |
Receivable for investments sold | | | 197,717 | |
Receivable for Fund shares sold | | | 18,392,719 | |
Receivable for dividends and interest | | | 6,046,055 | |
Receivable for securities lending income | | | 79,681 | |
Prepaid expenses and other assets | | | 90,196 | |
| | | | |
Total assets | | | 3,154,963,537 | |
| | | | |
| |
Liabilities | | | | |
Payable for investments purchased | | | 7,901,158 | |
Payable for Fund shares redeemed | | | 3,326,513 | |
Payable upon receipt of securities loaned | | | 395,237,180 | |
Advisory fee payable | | | 2,234,251 | |
Distribution fees payable | | | 139,746 | |
Due to other related parties | | | 482,817 | |
Accrued expenses and other liabilities | | | 781,711 | |
| | | | |
Total liabilities | | | 410,103,376 | |
| | | | |
Total net assets | | $ | 2,744,860,161 | |
| | | | |
| |
NET ASSETS CONSIST OF | | | | |
Paid-in capital | | $ | 2,557,599,077 | |
Overdistributed net investment income | | | (5,654,836 | ) |
Accumulated net realized losses on investments | | | (19,112,600 | ) |
Net unrealized gains on investments | | | 212,028,520 | |
| | | | |
Total net assets | | $ | 2,744,860,161 | |
| | | | |
| |
COMPUTATION OF NET ASSET VALUE AND OFFERING PRICE PER SHARE1 | | | | |
Net assets – Class A | | $ | 968,405,638 | |
Shares outstanding – Class A | | | 46,597,944 | |
Net asset value per share – Class A | | | $20.78 | |
Maximum offering price per share – Class A2 | | | $22.05 | |
Net assets – Class B | | $ | 18,208,844 | |
Shares outstanding – Class B | | | 1,013,175 | |
Net asset value per share – Class B | | | $17.97 | |
Net assets – Class C | | $ | 202,720,947 | |
Shares outstanding – Class C | | | 11,365,733 | |
Net asset value per share – Class C | | | $17.84 | |
Net assets – Administrator Class | | $ | 626,972,480 | |
Shares outstanding – Administrator Class | | | 28,850,777 | |
Net asset value per share – Administrator Class | | | $21.73 | |
Net assets – Institutional Class | | $ | 928,552,252 | |
Shares outstanding – Institutional Class | | | 42,650,003 | |
Net asset value per share – Institutional Class | | | $21.77 | |
| |
Investments in unaffiliated securities, at cost | | $ | 2,288,260,421 | |
| | | | |
Investments in affiliated securities, at cost | | $ | 611,966,592 | |
| | | | |
Total investments, at cost | | $ | 2,900,227,013 | |
| | | | |
Securities on loan, at value | | $ | 385,786,887 | |
| | | | |
Foreign currency, at cost | | $ | 17,878,810 | |
| | | | |
| 1. | The Fund has an unlimited number of authorized shares. |
| 2. | Maximum offering price is computed as 100/94.25 of net asset value. On investments of $50,000 or more, the offering price is reduced. |
The accompanying notes are an integral part of these financial statements.
| | | | |
| 14 | | Wells Fargo Advantage Emerging Markets Equity Fund | | Statement of Operations—Six Months Ended April 30, 2012 (Unaudited) |
| | | | |
| | | | |
| |
Investment income | | | | |
Dividends* | | $ | 22,470,112 | |
Securities lending income, net | | | 325,031 | |
Interest | | | 259,068 | |
Income from affiliated securities | | | 118,551 | |
| | | | |
Total investment income | | | 23,172,762 | |
| | | | |
| |
Expenses | | | | |
Advisory fee | | | 12,479,672 | |
Administration fees | | | | |
Fund level | | | 608,107 | |
Class A | | | 1,239,064 | |
Class B | | | 25,685 | |
Class C | | | 256,877 | |
Administrator Class | | | 289,902 | |
Institutional Class | | | 272,857 | |
Shareholder servicing fees | | | | |
Class A | | | 1,191,409 | |
Class B | | | 24,465 | |
Class C | | | 246,997 | |
Administrator Class | | | 569,811 | |
Distribution fees | | | | |
Class B | | | 74,091 | |
Class C | | | 740,990 | |
Custody and accounting fees | | | 632,092 | |
Professional fees | | | 35,648 | |
Registration fees | | | 46,508 | |
Shareholder report expenses | | | 208,135 | |
Trustees’ fees and expenses | | | 5,300 | |
Other fees and expenses | | | 19,032 | |
| | | | |
Total expenses | | | 18,966,642 | |
Less: Fee waivers and/or expense reimbursements | | | (463 | ) |
| | | | |
Net expenses | | | 18,966,179 | |
| | | | |
Net investment income | | | 4,206,583 | |
| | | | |
| |
REALIZED AND UNREALIZED GAINS (LOSSES) ON INVESTMENTS | | | | |
Net realized gains on investments | | | 9,690,490 | |
Net change in unrealized gains (losses) on investments | | | 21,337,160 | |
| | | | |
Net realized and unrealized gains (losses) on investments | | | 31,027,650 | |
| | | | |
Net increase in net assets resulting from operations | | $ | 35,234,233 | |
| | | | |
| |
* Net of foreign dividend withholding taxes of | | | $1,945,336 | |
The accompanying notes are an integral part of these financial statements.
| | | | | | |
| Statements of Changes in Net Assets | | Wells Fargo Advantage Emerging Markets Equity Fund | | | 15 | |
| | | | | | | | | | | | | | | | |
| | | Six Months Ended
April 30, 2012
(Unaudited) | | | Year Ended
October 31, 2011 | |
| | | | |
Operations | | | | | | | | | | | | | | | | |
Net investment income | | | | | | $ | 4,206,583 | | | | | | | $ | 9,168,698 | |
Net realized gains on investments | | | | | | | 9,690,490 | | | | | | | | 47,415,691 | |
Net change in unrealized gains (losses) on investments | | | | | | | 21,337,160 | | | | | | | | (150,259,770 | ) |
| | | | | | | | | | | | | | | | |
Net increase (decrease) in net assets resulting from operations | | | | | | | 35,234,233 | | | | | | | | (93,675,381 | ) |
| | | | | | | | | | | | | | | | |
| | | | |
Distributions to shareholders from | | | | | | | | | | | | | | | | |
Net investment income | | | | | | | | | | | | | | | | |
Class A | | | | | | | (6,574,355 | ) | | | | | | | (69,199 | ) |
Administrator Class | | | | | | | (4,991,113 | ) | | | | | | | (281,655 | ) |
Institutional Class | | | | | | | (6,431,045 | ) | | | | | | | (437,476 | ) |
Net realized gains | | | | | | | | | | | | | | | | |
Class A | | | | | | | (10,038,509 | ) | | | | | | | 0 | |
Class B | | | | | | | (255,759 | ) | | | | | | | 0 | |
Class C | | | | | | | (2,467,330 | ) | | | | | | | 0 | |
Administrator Class | | | | | | | (5,617,738 | ) | | | | | | | 0 | |
Institutional Class | | | | | | | (5,818,637 | ) | | | | | | | 0 | |
| | | | | | | | | | | | | | | | |
Total distributions to shareholders | | | | | | | (42,194,486 | ) | | | | | | | (788,330 | ) |
| | | | | | | | | | | | | | | | |
| | | | |
Capital share transactions | | | Shares | | | | | | | | Shares | | | | | |
Proceeds from shares sold | | | | | | | | | | | | | | | | |
Class A | | | 11,070,858 | | | | 228,406,698 | | | | 21,218,740 | | | | 472,154,883 | |
Class B | | | 11,110 | | | | 197,661 | | | | 60,755 | | | | 1,181,748 | |
Class C | | | 1,368,406 | | | | 24,340,808 | | | | 3,623,202 | | | | 69,760,387 | |
Administrator Class | | | 13,060,218 | | | | 282,226,981 | | | | 20,848,230 | | | | 478,979,598 | |
Institutional Class | | | 24,254,292 | | | | 524,371,960 | | | | 18,093,522 | | | | 414,041,321 | |
| | | | | | | | | | | | | | | | |
| | | | | | | 1,059,544,108 | | | | | | | | 1,436,117,937 | |
| | | | | | | | | | | | | | | | |
Reinvestment of distributions | | | | | | | | | | | | | | | | |
Class A | | | 795,372 | | | | 15,535,892 | | | | 2,877 | | | | 63,964 | |
Class B | | | 12,679 | | | | 217,829 | | | | 0 | | | | 0 | |
Class C | | | 103,977 | | | | 1,772,806 | | | | 0 | | | | 0 | |
Administrator Class | | | 454,670 | | | | 9,252,268 | | | | 10,004 | | | | 232,301 | |
Institutional Class | | | 415,654 | | | | 8,450,500 | | | | 8,289 | | | | 192,648 | |
| | | | | | | | | | | | | | | | |
| | | | | | | 35,229,295 | | | | | | | | 488,913 | |
| | | | | | | | | | | | | | | | |
Payment for shares redeemed | | | | | | | | | | | | | | | | |
Class A | | | (9,119,548 | ) | | | (188,881,849 | ) | | | (15,278,236 | ) | | | (334,689,903 | ) |
Class B | | | (209,504 | ) | | | (3,761,636 | ) | | | (508,097 | ) | | | (9,781,425 | ) |
Class C | | | (1,308,890 | ) | | | (22,975,780 | ) | | | (2,767,168 | ) | | | (51,885,678 | ) |
Administrator Class | | | (8,824,730 | ) | | | (193,648,583 | ) | | | (7,678,746 | ) | | | (176,458,102 | ) |
Institutional Class | | | (6,683,526 | ) | | | (144,492,815 | ) | | | (2,167,541 | ) | | | (49,841,512 | ) |
| | | | | | | | | | | | | | | | |
| | | | | | | (553,760,663 | ) | | | | | | | (622,656,620 | ) |
| | | | | | | | | | | | | | | | |
Net increase in net assets resulting from capital share transactions | | | | | | | 541,012,740 | | | | | | | | 813,950,230 | |
| | | | | | | | | | | | | | | | |
Total increase in net assets | | | | | | | 534,052,487 | | | | | | | | 719,486,519 | |
| | | | | | | | | | | | | | | | |
| | | | |
Net assets | | | | | | | | | | | | | | | | |
Beginning of period | | | | | | | 2,210,807,674 | | | | | | | | 1,491,321,155 | |
| | | | | | | | | | | | | | | | |
End of period | | | | | | $ | 2,744,860,161 | | | | | | | $ | 2,210,807,674 | |
| | | | | | | | | | | | | | | | |
Undistributed (overdistributed) net investment income | | | | | | $ | (5,654,836 | ) | | | | | | $ | 8,135,094 | |
| | | | | | | | | | | | | | | | |
The accompanying notes are an integral part of these financial statements.
| | | | |
| 16 | | Wells Fargo Advantage Emerging Markets Equity Fund | | Financial Highlights |
(For a share outstanding throughout each period)
| | | | | | | | | | | | | | | | | | | | | | | | |
| | | Six Months Ended
April 30, 2012 (Unaudited) | | | Year Ended October 31, | |
| Class A | | | 2011 | | | 20101 | | | 20091 | | | 20081 | | | 20071 | |
Net asset value, beginning of period | | $ | 20.93 | | | $ | 21.65 | | | $ | 16.99 | | | $ | 12.90 | | | $ | 30.53 | | | $ | 21.97 | |
Net investment income | | | 0.02 | | | | 0.08 | | | | 0.04 | 2 | | | 0.04 | 2 | | | 0.16 | | | | 0.19 | |
Net realized and unrealized gains (losses) on investments | | | 0.19 | | | | (0.80 | ) | | | 4.63 | | | | 5.98 | | | | (14.22 | ) | | | 12.04 | |
| | | | | | | | | | | | | | | | | | | | | | | | |
Total from investment operations | | | 0.21 | | | | (0.72 | ) | | | 4.67 | | | | 6.02 | | | | (14.06 | ) | | | 12.23 | |
Distributions to shareholders from | | | | | | | | | | | | | | | | | | | | | | | | |
Net investment income | | | (0.14 | ) | | | (0.00 | )3 | | | (0.01 | ) | | | (0.12 | ) | | | (0.15 | ) | | | (0.17 | ) |
Net realized gains | | | (0.22 | ) | | | 0.00 | | | | 0.00 | | | | (1.81 | ) | | | (3.42 | ) | | | (3.50 | ) |
| | | | | | | | | | | | | | | | | | | | | | | | |
Total distributions to shareholders | | | (0.36 | ) | | | (0.00 | )3 | | | (0.01 | ) | | | (1.93 | ) | | | (3.57 | ) | | | (3.67 | ) |
Net asset value, end of period | | $ | 20.78 | | | $ | 20.93 | | | $ | 21.65 | | | $ | 16.99 | | | $ | 12.90 | | | $ | 30.53 | |
Total return4 | | | 1.15 | % | | | (3.32 | )% | | | 27.51 | % | | | 57.88 | % | | | (51.64 | )% | | | 63.88 | % |
Ratios to average net assets (annualized) | | | | | | | | | | | | | | | | | | | | | | | | |
Gross expenses | | | 1.66 | % | | | 1.68 | % | | | 1.91 | % | | | 2.04 | % | | | 1.88 | % | | | 1.90 | % |
Net expenses | | | 1.66 | % | | | 1.68 | % | | | 1.89 | % | | | 2.03 | % | | | 1.84 | % | | | 1.87 | % |
Net investment income | | | 0.18 | % | | | 0.44 | % | | | 0.27 | % | | | 0.29 | % | | | 0.69 | % | | | 0.72 | % |
Supplemental data | | | | | | | | | | | | | | | | | | | | | | | | |
Portfolio turnover rate | | | 2 | % | | | 5 | % | | | 6 | % | | | 23 | % | | | 39 | % | | | 58 | % |
Net assets, end of period (000’s omitted) | | | $968,406 | | | | $917,633 | | | | $820,716 | | | | $357,354 | | | | $128,714 | | | | $305,698 | |
| 1. | After the close of business on July 16, 2010, the Fund acquired the net assets of Evergreen Emerging Markets Growth Fund and Wells Fargo Advantage Emerging Markets Equity Fund. Evergreen Emerging Markets Growth Fund became the accounting and performance survivor in the transaction. The information for the periods prior to July 19, 2010 is that of Class A of Evergreen Emerging Markets Growth Fund. |
| 2. | Calculated based upon average shares outstanding |
| 3. | Amount is less than $0.005. |
| 4. | Total return calculations do not include any sales charges. Returns for periods of less than one year are not annualized. |
The accompanying notes are an integral part of these financial statements.
| | | | | | |
| Financial Highlights | | Wells Fargo Advantage Emerging Markets Equity Fund | | | 17 | |
(For a share outstanding throughout each period)
| | | | | | | | | | | | | | | | | | | | | | | | |
| | | Six Months Ended
April 30, 2012 (Unaudited) | | | Year Ended October 31, | |
| Class B | | | 2011 | | | 20101 | | | 20091 | | | 20081 | | | 20071 | |
Net asset value, beginning of period | | $ | 18.06 | | | $ | 18.82 | | | $ | 14.87 | | | $ | 11.51 | | | $ | 27.69 | | | $ | 20.34 | |
Net investment loss | | | (0.05 | )2 | | | (0.08 | )2 | | | (0.09 | )2 | | | (0.03 | ) | | | (0.01 | ) | | | (0.01 | )2 |
Net realized and unrealized gains (losses) on investments | | | 0.18 | | | | (0.68 | ) | | | 4.04 | | | | 5.20 | | | | (12.74 | ) | | | 11.00 | |
| | | | | | | | | | | | | | | | | | | | | | | | |
Total from investment operations | | | 0.13 | | | | (0.76 | ) | | | 3.95 | | | | 5.17 | | | | (12.75 | ) | | | 10.99 | |
Distributions to shareholders from | | | | | | | | | | | | | | | | | | | | | | | | |
Net investment income | | | 0.00 | | | | 0.00 | | | | 0.00 | | | | 0.00 | | | | (0.01 | ) | | | (0.14 | ) |
Net realized gains | | | (0.22 | ) | | | 0.00 | | | | 0.00 | | | | (1.81 | ) | | | (3.42 | ) | | | (3.50 | ) |
| | | | | | | | | | | | | | | | | | | | | | | | |
Total distributions to shareholders | | | (0.22 | ) | | | 0.00 | | | | 0.00 | | | | (1.81 | ) | | | (3.43 | ) | | | (3.64 | ) |
Net asset value, end of period | | $ | 17.97 | | | $ | 18.06 | | | $ | 18.82 | | | $ | 14.87 | | | $ | 11.51 | | | $ | 27.69 | |
Total return3 | | | 0.79 | % | | | (4.04 | )% | | | 26.56 | % | | | 56.75 | % | | | (51.99 | )% | | | 62.68 | % |
Ratios to average net assets (annualized) | | | | | | | | | | | | | | | | | | | | | | | | |
Gross expenses | | | 2.41 | % | | | 2.43 | % | | | 2.66 | % | | | 2.80 | % | | | 2.61 | % | | | 2.61 | % |
Net expenses | | | 2.41 | % | | | 2.43 | % | | | 2.64 | % | | | 2.79 | % | | | 2.59 | % | | | 2.60 | % |
Net investment loss | | | (0.61 | )% | | | (0.39 | )% | | | (0.54 | )% | | | (0.43 | )% | | | (0.08 | )% | | | (0.05 | )% |
Supplemental data | | | | | | | | | | | | | | | | | | | | | | | | |
Portfolio turnover rate | | | 2 | % | | | 5 | % | | | 6 | % | | | 23 | % | | | 39 | % | | | 58 | % |
Net assets, end of period (000’s omitted) | | | $18,209 | | | | $21,652 | | | | $30,989 | | | | $25,499 | | | | $17,949 | | | | $42,477 | |
| 1. | After the close of business on July 16, 2010, the Fund acquired the net assets of Evergreen Emerging Markets Growth Fund and Wells Fargo Advantage Emerging Markets Equity Fund. Evergreen Emerging Markets Growth Fund became the accounting and performance survivor in the transaction. The information for the periods prior to July 19, 2010 is that of Class B of Evergreen Emerging Markets Growth Fund. |
| 2. | Calculated based upon average shares outstanding |
| 3. | Total return calculations do not include any sales charges. Returns for periods of less than one year are not annualized. |
The accompanying notes are an integral part of these financial statements.
| | | | |
| 18 | | Wells Fargo Advantage Emerging Markets Equity Fund | | Financial Highlights |
(For a share outstanding throughout each period)
| | | | | | | | | | | | | | | | | | | | | | | | |
| | | Six Months Ended
April 30, 2012 (Unaudited) | | | Year Ended October 31, | |
| Class C | | | 2011 | | | 20101 | | | 20091 | | | 20081 | | | 20071 | |
Net asset value, beginning of period | | $ | 17.92 | | | $ | 18.68 | | | $ | 14.77 | | | $ | 11.44 | | | $ | 27.57 | | | $ | 20.27 | |
Net investment income (loss) | | | (0.05 | )2 | | | (0.06 | )2 | | | (0.08 | )2 | | | (0.05 | ) | | | (0.02 | ) | | | 0.00 | 2,3 |
Net realized and unrealized gains (losses) on investments | | | 0.19 | | | | (0.70 | ) | | | 3.99 | | | | 5.19 | | | | (12.66 | ) | | | 10.94 | |
| | | | | | | | | | | | | | | | | | | | | | | | |
Total from investment operations | | | 0.14 | | | | (0.76 | ) | | | 3.91 | | | | 5.14 | | | | (12.68 | ) | | | 10.94 | |
Distributions to shareholders from | | | | | | | | | | | | | | | | | | | | | | | | |
Net investment income | | | 0.00 | | | | 0.00 | | | | 0.00 | | | | 0.00 | | | | (0.03 | ) | | | (0.14 | ) |
Net realized gains | | | (0.22 | ) | | | 0.00 | | | | 0.00 | | | | (1.81 | ) | | | (3.42 | ) | | | (3.50 | ) |
| | | | | | | | | | | | | | | | | | | | | | | | |
Total distributions to shareholders | | | (0.22 | ) | | | 0.00 | | | | 0.00 | | | | (1.81 | ) | | | (3.45 | ) | | | (3.64 | ) |
Net asset value, end of period | | $ | 17.84 | | | $ | 17.92 | | | $ | 18.68 | | | $ | 14.77 | | | $ | 11.44 | | | $ | 27.57 | |
Total return4 | | | 0.85 | % | | | (4.07 | )% | | | 26.47 | % | | | 56.84 | % | | | (52.01 | )% | | | 62.64 | % |
Ratios to average net assets (annualized) | | | | | | | | | | | | | | | | | | | | | | | | |
Gross expenses | | | 2.41 | % | | | 2.43 | % | | | 2.66 | % | | | 2.79 | % | | | 2.61 | % | | | 2.60 | % |
Net expenses | | | 2.41 | % | | | 2.43 | % | | | 2.64 | % | | | 2.78 | % | | | 2.59 | % | | | 2.59 | % |
Net investment income (loss) | | | (0.56 | )% | | | (0.32 | )% | | | (0.50 | )% | | | (0.46 | )% | | | (0.07 | )% | | | 0.01 | % |
Supplemental data | | | | | | | | | | | | | | | | | | | | | | | | |
Portfolio turnover rate | | | 2 | % | | | 5 | % | | | 6 | % | | | 23 | % | | | 39 | % | | | 58 | % |
Net assets, end of period (000’s omitted) | | | $202,721 | | | | $200,796 | | | | $193,300 | | | | $121,216 | | | | $56,839 | | | | $134,342 | |
| 1. | After the close of business on July 16, 2010, the Fund acquired the net assets of Evergreen Emerging Markets Growth Fund and Wells Fargo Advantage Emerging Markets Equity Fund. Evergreen Emerging Markets Growth Fund became the accounting and performance survivor in the transaction. The information for the periods prior to July 19, 2010 is that of Class C of Evergreen Emerging Markets Growth Fund. |
| 2. | Calculated based upon average shares outstanding |
| 3. | Amount is less than $0.005. |
| 4. | Total return calculations do not include any sales charges. Returns for periods of less than one year are not annualized. |
The accompanying notes are an integral part of these financial statements.
| | | | | | |
| Financial Highlights | | Wells Fargo Advantage Emerging Markets Equity Fund | | | 19 | |
(For a share outstanding throughout each period)
| | | | | | | | | | | | | | | | | | | | | | | | |
| | | Six Months Ended
April 30, 2012 (Unaudited) | | | Year Ended October 31, | |
| Administrator Class | | | 2011 | | | 20101 | | | 20091 | | | 20081 | | | 20071 | |
Net asset value, beginning of period | | $ | 21.90 | | | $ | 22.63 | | | $ | 17.75 | | | $ | 13.42 | | | $ | 31.59 | | | $ | 22.59 | |
Net investment income | | | 0.04 | | | | 0.02 | | | | 0.09 | 2 | | | 0.08 | | | | 0.22 | | | | 0.20 | |
Net realized and unrealized gains (losses) on investments | | | 0.21 | | | | (0.73 | ) | | | 4.83 | | | | 6.25 | | | | (14.77 | ) | | | 12.48 | |
| | | | | | | | | | | | | | | | | | | | | | | | |
Total from investment operations | | | 0.25 | | | | (0.71 | ) | | | 4.92 | | | | 6.33 | | | | (14.55 | ) | | | 12.68 | |
Distributions to shareholders from | | | | | | | | | | | | | | | | | | | | | | | | |
Net investment income | | | (0.20 | ) | | | (0.02 | ) | | | (0.04 | ) | | | (0.19 | ) | | | (0.20 | ) | | | (0.18 | ) |
Net realized gains | | | (0.22 | ) | | | 0.00 | | | | 0.00 | | | | (1.81 | ) | | | (3.42 | ) | | | (3.50 | ) |
| | | | | | | | | | | | | | | | | | | | | | | | |
Total distributions to shareholders | | | (0.42 | ) | | | (0.02 | ) | | | (0.04 | ) | | | (2.00 | ) | | | (3.62 | ) | | | (3.68 | ) |
Net asset value, end of period | | $ | 21.73 | | | $ | 21.90 | | | $ | 22.63 | | | $ | 17.75 | | | $ | 13.42 | | | $ | 31.59 | |
Total return3 | | | 1.27 | % | | | (3.14 | )% | | | 27.78 | % | | | 58.34 | % | | | (51.51 | )% | | | 64.23 | % |
Ratios to average net assets (annualized) | | | | | | | | | | | | | | | | | | | | | | | | |
Gross expenses | | | 1.45 | % | | | 1.47 | % | | | 1.69 | % | | | 1.80 | % | | | 1.61 | % | | | 1.62 | % |
Net expenses | | | 1.45 | % | | | 1.47 | % | | | 1.65 | % | | | 1.79 | % | | | 1.59 | % | | | 1.61 | % |
Net investment income | | | 0.42 | % | | | 0.70 | % | | | 0.50 | % | | | 0.54 | % | | | 0.89 | % | | | 0.84 | % |
Supplemental data | | | | | | | | | | | | | | | | | | | | | | | | |
Portfolio turnover rate | | | 2 | % | | | 5 | % | | | 6 | % | | | 23 | % | | | 39 | % | | | 58 | % |
Net assets, end of period (000’s omitted) | | | $626,972 | | | | $529,083 | | | | $248,493 | | | | $178,856 | | | | $141,996 | | | | $364,958 | |
| 1. | After the close of business on July 16, 2010, the Fund acquired the net assets of Evergreen Emerging Markets Growth Fund and Wells Fargo Advantage Emerging Markets Equity Fund. Evergreen Emerging Markets Growth Fund became the accounting and performance survivor in the transaction. The information for the periods prior to July 19, 2010 is that of Class I of Evergreen Emerging Markets Growth Fund. |
| 2. | Calculated based upon average shares outstanding |
| 3. | Returns for periods of less than one year are not annualized. |
The accompanying notes are an integral part of these financial statements.
| | | | |
| 20 | | Wells Fargo Advantage Emerging Markets Equity Fund | | Financial Highlights |
(For a share outstanding throughout each period)
| | | | | | | | | | | | |
| | | Six Months Ended
April 30, 2012 (Unaudited) | | | Year Ended October 31, | |
| Institutional Class | | | 2011 | | | 20101 | |
Net asset value, beginning of period | | $ | 21.96 | | | $ | 22.66 | | | $ | 20.11 | |
Net investment income | | | 0.09 | 2 | | | 0.16 | | | | 0.00 | 2,3 |
Net realized and unrealized gains (losses) on investments | | | 0.18 | | | | (0.81 | ) | | | 2.55 | |
| | | | | | | | | | | | |
Total from investment operations | | | 0.27 | | | | (0.65 | ) | | | 2.55 | |
Distributions to shareholders from | | | | | | | | | | | | |
Net investment income | | | (0.24 | ) | | | (0.05 | ) | | | 0.00 | |
Net realized gains | | | (0.22 | ) | | | 0.00 | | | | 0.00 | |
| | | | | | | | | | | | |
Total distributions to shareholders | | | (0.46 | ) | | | (0.05 | ) | | | 0.00 | |
Net asset value, end of period | | $ | 21.77 | | | $ | 21.96 | | | $ | 22.66 | |
Total return4 | | | 1.39 | % | | | (2.89 | )% | | | 12.68 | % |
Ratios to average net assets (annualized) | | | | | | | | | | | | |
Gross expenses | | | 1.24 | % | | | 1.24 | % | | | 1.48 | % |
Net expenses | | | 1.24 | % | | | 1.23 | % | | | 1.30 | % |
Net investment income | | | 0.80 | % | | | 0.93 | % | | | 0.02 | % |
Supplemental data | | | | | | | | | | | | |
Portfolio turnover rate | | | 2 | % | | | 5 | % | | | 6 | % |
Net assets, end of period (000’s omitted) | | | $928,552 | | | | $541,644 | | | | $197,823 | |
| 1. | For the period from July 30, 2010 (commencement of class operations) to October 31, 2010. |
| 2. | Calculated based upon average shares outstanding |
| 3. | Amount is less than $0.005. |
| 4. | Returns for periods of less than one year are not annualized. |
The accompanying notes are an integral part of these financial statements.
| | | | | | |
| Notes to Financial Statements (Unaudited) | | Wells Fargo Advantage Emerging Markets Equity Fund | | | 21 | |
1. ORGANIZATION
Wells Fargo Funds Trust (the “Trust”), a Delaware statutory trust organized on March 10, 1999, is an open-end management investment company registered under the Investment Company Act of 1940, as amended (the “1940 Act”). These financial statements report on Wells Fargo Advantage Emerging Markets Equity Fund (the “Fund”) which is a diversified series of the Trust.
2. SIGNIFICANT ACCOUNTING POLICIES
The following significant accounting policies, which are consistently followed in the preparation of the financial statements of the Fund, are in conformity with U.S. generally accepted accounting principles which require management to make estimates and assumptions that affect the reported amounts of assets and liabilities, disclosure of contingent assets and liabilities at the date of the financial statements, and the reported amounts of revenues and expenses during the reporting period. Actual results could differ from those estimates.
Securities valuation
Investments in equity securities are valued each business day as of the close of regular trading on the New York Stock Exchange, which is usually 4:00 p.m. (Eastern Time). Securities which are traded on a national or foreign securities exchange are valued at the last reported sales price, except that securities listed on The Nasdaq Stock Market, Inc. (“Nasdaq”) are valued at the Nasdaq Official Closing Price (“NOCP”), and if no NOCP is available, then at the last reported sales price. If no sales price is shown on the Nasdaq, the bid price will be used. In the absence of any sale of securities listed on the Nasdaq, and in the case of other securities (including U.S. Government obligations, but excluding debt securities maturing in 60 days or less), the price will be deemed “stale” and the valuations will be determined in accordance with the Fund’s Fair Value Procedures.
Securities denominated in foreign currencies are translated into U.S. dollars using the closing rates of exchange in effect on the day of valuation.
Many securities markets and exchanges outside the U.S. close prior to the close of the New York Stock Exchange and therefore may not fully reflect trading or events that occur after the close of the principal exchange in which the foreign securities are traded, but before the close of the New York Stock Exchange. If such trading or events are expected to materially affect the value of securities, then fair value pricing procedures approved by the Board of Trustees are applied. These procedures take into account multiple factors including movements in U.S. securities markets after foreign exchanges close. As a result of the fair value pricing procedures, these securities which are normally categorized as Level 1 in the fair value hierarchy will represent a transfer from a Level 1 to a Level 2 security and will be categorized as Level 2. Depending on market activity, such fair valuations may be frequent. Such fair value pricing may result in NAVs that are higher or lower than NAVs based on the closing price or latest quoted bid price. On April 30, 2012, fair value pricing was not used in pricing foreign securities.
Fixed income securities with original maturities exceeding 60 days are valued based on evaluated prices received from an independent pricing service approved by the Board of Trustees which may utilize both transaction data and market information such as yield, prices of securities of comparable quality, coupon rate, maturity, type of issue, trading characteristics and other market data. If valuations are not available from the pricing service or values received are deemed not representative of market value, values will be obtained from a third party broker-dealer or determined based on the Fund’s Fair Value Procedures.
Debt securities of sufficient credit quality with original maturities of 60 days or less generally are valued at amortized cost which approximates fair value. The amortized cost method involves valuing a security at its cost, plus accretion of discount or minus amortization of premium over the period until maturity.
Investments in open-end mutual funds and non-registered investment companies are generally valued at net asset value.
Investments which are not valued using any of the methods discussed above, are valued at their fair value, as determined by procedures established in good faith and approved by the Board of Trustees. The Board of Trustees has established a Valuation Committee comprised of the Trustees and has delegated to it the authority to take any actions regarding the valuation of portfolio securities that the Valuation Committee deems necessary in determining the fair value of portfolio securities, unless the responsibility has been delegated to the Management Valuation Team of Wells Fargo Funds
| | | | |
| 22 | | Wells Fargo Advantage Emerging Markets Equity Fund | | Notes to Financial Statements (Unaudited) |
Management, LLC (“Funds Management”). The Board of Trustees retains the authority to make or ratify any valuation decisions or approve any changes to the Fair Value Procedures as it deems appropriate. On a quarterly basis, the Board of Trustees considers for ratification any valuation actions taken by the Valuation Committee or the Management Valuation Team.
Valuations of fair valued prices are compared to the next actual sales price when available, or other appropriate market information to assess the continued appropriateness of the fair valuation methodology used. The securities are fair valued on a day-to-day basis, taking into consideration changes to appropriate market information and any significant changes to the input factors considered in the valuation process until there is a readily available price provided on the exchange or by an independent pricing service. Valuations received from an independent pricing service or broker quotes are periodically validated by comparisons to most recent trades and valuations provided by other independent pricing services in addition to the review of prices by the adviser and/or sub-adviser. Unobservable inputs used in determining fair valuations are identified based on the type of security, taking into consideration factors utilized by market participants in valuing the investment, knowledge about the issuer and the current market environment.
Foreign currency translation
The accounting records of the Fund are maintained in U.S. dollars. Assets, including investment securities, and liabilities denominated in foreign currency are translated into U.S. dollars at the prevailing rates of exchange at the date of valuation. Purchases and sales of securities, and income and expenses are translated at the prevailing rate of exchange on the respective dates of such transactions. Reported net realized foreign exchange gains or losses arise from sales of foreign currencies, currency gains or losses realized between the trade and settlement dates on securities transactions, and the difference between the amounts of dividends, interest and foreign withholding taxes recorded and the U.S. dollar equivalent of the amounts actually paid or received. Net unrealized foreign exchange gains and losses arise from changes in the fair value of assets and liabilities other than investments in securities resulting in changes in exchange rates.
The changes in net assets arising from changes in exchange rates and the changes in net assets resulting from changes in market prices of securities are not separately presented. Such changes are recorded with net realized and unrealized gains or losses from investments. Gains and losses from certain foreign currency transactions are treated as ordinary income for U.S. federal income tax purposes.
Security loans
The Fund may lend its securities from time to time in order to earn additional income in the form of fees or interest on securities received as collateral or the investment of any cash received as collateral. The Fund continues to receive interest or dividends on the securities loaned. The Fund receives collateral in the form of cash or securities with a value at least equal to the value of the securities on loan. The value of the loaned securities is determined at the close of each business day and any additional required collateral is delivered to the Fund on the next business day. In a securities lending transaction, the net asset value of the Fund will be affected by an increase or decrease in the value of the securities loaned and by an increase or decrease in the value of the instrument in which collateral is invested. The amount of securities lending activity undertaken by the Fund fluctuates from time to time. In the event of default or bankruptcy by the borrower, the Fund may be prevented from recovering the loaned securities or gaining access to the collateral or may experience delays or costs in doing so. In addition, the investment of any cash collateral received may lose all or part of its value. The Fund has the right under the lending agreement to recover the securities from the borrower on demand.
The Fund lends its securities through an unaffiliated securities lending agent. Cash collateral received in connection with its securities lending transactions is invested in Wells Fargo Securities Lending Cash Investments, LLC (the “Cash Collateral Fund”). The Cash Collateral Fund is exempt from registration under Section 3(c)(7) of the 1940 Act and is managed by Funds Management and is sub-advised by Wells Capital Management Incorporated (“Wells Capital Management”). Funds Management receives an advisory fee starting at 0.05% and declining to 0.01% as the average daily net assets of the Cash Collateral Fund increase. All of the fees received by Funds Management are paid to Wells Capital Management for its services as sub-adviser. The Cash Collateral Fund seeks to provide a positive return compared to the daily Fed Funds Open rate by investing in high-quality, U.S. dollar-denominated short-term money market instruments. Cash Collateral Fund investments are fair valued based upon the amortized cost valuation technique. Income earned from investment in the Cash Collateral Fund is included in securities lending income on the Statement of Operations.
| | | | | | |
| Notes to Financial Statements (Unaudited) | | Wells Fargo Advantage Emerging Markets Equity Fund | | | 23 | |
Security transactions and income recognition
Securities transactions are recorded on a trade date basis. Realized gains or losses are reported on the basis of identified cost of securities delivered.
Dividend income is recognized on the ex-dividend date, except for certain dividends from foreign securities, which are recorded as soon as the Fund is informed of the ex-dividend date. Dividend income from foreign securities is recorded net of foreign taxes withheld where recovery of such taxes is not assured.
Interest income is accrued daily and bond discounts are accreted and premiums are amortized daily based on the effective interest method. To the extent debt obligations are placed on non-accrual status, any related interest income may be reduced by writing off interest receivables when the collection of all or a portion of interest has become doubtful based on consistently applied procedures. If the issuer subsequently resumes interest payments or when the collectability of interest is reasonably assured, the debt obligation is removed from non-accrual status.
Distributions to shareholders
Distributions to shareholders from net investment income and net realized gains, if any, are recorded on the ex-dividend date. Such distributions are determined in conformity with income tax regulations, which may differ from generally accepted accounting principles.
Federal and other taxes
The Fund intends to continue to qualify as a regulated investment company by distributing substantially all of its investment company taxable income and any net realized capital gains (after reduction for capital loss carryforwards) sufficient to relieve it from all, or substantially all, federal income taxes. Accordingly, no provision for federal income taxes was required.
The Fund’s income and federal excise tax returns and all financial records supporting those returns for the prior three fiscal years are subject to examination by the federal and Delaware revenue authorities. Management has analyzed the Fund’s tax positions taken on federal, state, and foreign tax returns for all open tax years and does not believe that there are any uncertain tax positions that require recognition of a tax liability.
Under the recently enacted Regulated Investment Company Modernization Act of 2010, the Fund is permitted to carry forward capital losses incurred in taxable years which began after December 22, 2010 for an unlimited period. However, any losses incurred are required to be utilized prior to the losses incurred in pre-enactment taxable years. As a result of this ordering rule, pre-enactment capital loss carryforwards may be more likely to expire unused. Post-enactment capital losses that are carried forward will retain their character as either short-term or long-term capital losses rather than be considered all short-term as under previous law. In addition, the Fund may elect to defer any portion of a post-October capital loss or qualified late-year ordinary loss to the first day of the following taxable year. A post-October capital loss is the greatest of the net capital loss, net short-term capital loss or net long-term capital loss for the portion of the taxable year after October 31. A qualified late-year ordinary loss is the net loss comprised of (a) net gain or loss from the sale or other disposition of capital assets for the portion of the taxable year after October 31, and (b) other ordinary income or loss for the portion of the taxable year after December 31.
As of October 31, 2011, the Fund had net capital loss carryforwards, which were available to offset future net realized capital gains, in the amount of $25,526,629 with $2,830,910 expiring in 2016 and $22,695,719 expiring in 2017.
Class allocations
The separate classes of shares offered by the Fund differ principally in applicable sales charges, distribution, shareholder servicing and administration fees. Shareholders of each class bear certain expenses that pertain to that particular class. All shareholders bear the common expenses of the Fund, earn income from the portfolio, and are allocated unrealized gains and losses pro rata based on the average daily net assets of each class, without distinction between share classes. Dividends are determined separately for each class based on income and expenses allocable to each class. Realized gains and losses are allocated to each class pro rata based upon the net assets of each class on the date realized. Differences in per share dividend rates generally result from the relative weightings of pro rata income and realized gain allocations and from differences in separate class expenses, including distribution, shareholder servicing and administration fees.
| | | | |
| 24 | | Wells Fargo Advantage Emerging Markets Equity Fund | | Notes to Financial Statements (Unaudited) |
3. FAIR VALUATION MEASUREMENTS
Fair value measurements of investments are determined within a framework that has established a fair value hierarchy based upon the various data inputs utilized in determining the value of the Fund’s investments. The three-level hierarchy gives the highest priority to unadjusted quoted prices in active markets for identical assets or liabilities (Level 1) and the lowest priority to significant unobservable inputs (Level 3). The Fund’s investments are classified within the fair value hierarchy based on the lowest level of input that is significant to the fair value measurement. The inputs are summarized into three broad levels as follows:
| n | | Level 1 – quoted prices in active markets for identical securities |
| n | | Level 2 – other significant observable inputs (including quoted prices for similar securities, interest rates, prepayment speeds, credit risk, etc.) |
| n | | Level 3 – significant unobservable inputs (including the Fund’s own assumptions in determining the fair value of investments) |
The inputs or methodologies used for valuing securities are not necessarily an indication of the risk associated with investing in those securities.
As of April 30, 2012, the inputs used in valuing the Fund’s assets, which are carried at fair value, were as follows:
| | | | | | | | | | | | | | | | |
| Investments in Securities | | Quoted Prices (Level 1) | | | Significant Other
Observable Inputs (Level 2) | | | Significant Unobservable Inputs (Level 3) | | | Total | |
Equity securities | | | | | | | | | | | | | | | | |
Common stocks | | $ | 2,393,618,323 | | | $ | 17,701,732 | | | $ | 0 | | | $ | 2,411,320,055 | |
Preferred stocks | | | 89,058,466 | | | | 0 | | | | 0 | | | | 89,058,466 | |
Convertible debentures | | | 0 | | | | 0 | | | | 119,788 | | | | 119,788 | |
Short-term investments | | | | | | | | | | | | | | | | |
Investment companies | | | 216,729,412 | | | | 395,237,180 | | | | 0 | | | | 611,966,592 | |
| | | $ | 2,699,406,201 | | | $ | 412,938,912 | | | $ | 119,788 | | | $ | 3,112,464,901 | |
Further details on the major security types listed above can be found in the Portfolio of Investments.
Transfers in and transfers out are recognized at the end of the reporting period. For the six months ended April 30, 2012, the Fund did not have any significant transfers into/out of Level 1 and Level 2.
4. TRANSACTIONS WITH AFFILIATES AND OTHER EXPENSES
Advisory fee
The Trust has entered into an advisory contract with Funds Management, an indirect wholly owned subsidiary of Wells Fargo & Company (“Wells Fargo”). The adviser is responsible for implementing investment policies and guidelines and for supervising the sub-adviser, who is responsible for day-to-day portfolio management of the Fund.
Pursuant to the contract, Funds Management is entitled to receive an annual advisory fee starting at 1.10% and declining to 0.95% as the average daily net assets of the Fund increase. For the six months ended April 30, 2012, the advisory fee was equivalent to an annual rate of 1.03% of the Fund’s average daily net assets.
Funds Management has retained the services of certain sub-advisers to provide daily portfolio management to the Fund. The fees related to sub-advisory services are borne directly by Funds Management and do not increase the overall fees paid by the Fund. Wells Capital Management, an affiliate of Funds Management, is the sub-adviser to the Fund and is entitled to receive a fee from Funds Management at an annual rate starting at 0.65% and declining to 0.45% as the average daily net assets of the Fund increase.
Administration and transfer agent fees
The Trust has entered into an administration agreement with Funds Management. Under this agreement, for providing administrative services, which includes paying fees and expenses for services provided by the transfer agent, sub-transfer agents, omnibus account servicers and record-keepers, Funds Management is entitled to receive from the Fund an
| | | | | | |
| Notes to Financial Statements (Unaudited) | | Wells Fargo Advantage Emerging Markets Equity Fund | | | 25 | |
annual fund level administration fee starting at 0.05% and declining to 0.03% as the average daily net assets of the Fund increase and a class level administration fee which is calculated based on the average daily net assets of each class as follows:
| | | | |
| | | Class Level Administration Fee | |
Class A, Class B, Class C | | | 0.26 | % |
Administrator Class | | | 0.10 | |
Institutional Class | | | 0.08 | |
Funds Management has contractually waived and/or reimbursed advisory and administration fees to the extent necessary to maintain certain net operating expense ratios for the Fund. Waiver of fees and/or reimbursement of expenses by Funds Management were made first from fund level expenses on a proportionate basis and then from class specific expenses. Funds Management has committed through July 18, 2013 to waive fees and/or reimburse expenses to the extent necessary to cap the Fund’s expenses at 1.81% for Class A, 2.56% for Class B, 2.56% for Class C, 1.60% for Administrator Class and 1.30% for Institutional Class.
Distribution fees
The Trust has adopted a Distribution Plan for Class B and Class C shares of the Fund pursuant to Rule 12b-1 under the 1940 Act. Distribution fees are charged to Class B and Class C shares and paid to Wells Fargo Funds Distributor, LLC, the principal underwriter, at an annual rate of 0.75% of the average daily net assets of Class B and Class C shares.
For the six months ended April 30, 2012, Wells Fargo Funds Distributor, LLC received $63,630 from the sale of Class A shares and $18,830, $13,644 and $8,911 in contingent deferred sales charges from redemptions of Class A, Class B and Class C shares, respectively.
Shareholder servicing fees
The Trust has entered into contracts with one or more shareholder servicing agents, whereby Class A, Class B, Class C and Administrator Class is charged a fee at an annual rate of 0.25% of the average daily net assets of each respective class.
A portion of these total shareholder servicing fees were paid to affiliates of Wells Fargo.
5. INVESTMENT PORTFOLIO TRANSACTIONS
Purchases and sales of investments, excluding U.S. Government obligations (if any) and short-term securities, for the six months ended April 30, 2012 were $561,189,519 and $55,315,234, respectively.
6. BANK BORROWINGS
The Trust (excluding the money market funds) and Wells Fargo Variable Trust are parties to a $150,000,000 revolving credit agreement with State Street Bank and Trust Company, whereby the Fund is permitted to use bank borrowings for temporary or emergency purposes, such as to fund shareholder redemption requests. Interest under the credit agreement is charged to the Fund based on a borrowing rate equal to the higher of the Federal Funds rate in effect on that day plus 1.25% or the overnight LIBOR rate in effect on that day plus 1.25%. In addition, an annual commitment fee equal to 0.10% of the unused balance is allocated to each participating fund. For the six months ended April 30, 2012, the Fund paid $2,740 in commitment fees.
For the six months ended April 30, 2012, there were no borrowings by the Fund under the agreement.
7. INDEMNIFICATION
Under the Trust’s organizational documents, the officers and directors are indemnified against certain liabilities that may arise out of performance of their duties to the Trust. Additionally, in the normal course of business, the Trust may enter into contracts with service providers that contain a variety of indemnification clauses. The Trust’s maximum exposure under these arrangements is dependent on future claims that may be made against the Fund and, therefore, cannot be estimated.
| | | | |
| 26 | | Wells Fargo Advantage Emerging Markets Equity Fund | | Notes to Financial Statements (Unaudited) |
8. NEW ACCOUNTING PRONOUNCEMENTS
In December 2011, the Financial Accounting Standards Board (“FASB”) issued Accounting Standard Update (“ASU”) No. 2011-11, Disclosures about Offsetting Assets and Liabilities. ASU 2011-11, which amends FASB ASC Topic 210, Balance Sheet, creates new disclosure requirements which require entities to disclose both gross and net information for derivatives and other financial instruments that are either offset in the Statement of Assets and Liabilities or subject to an enforceable master netting arrangement or similar agreement. The disclosure requirements are effective for interim and annual reporting periods beginning on or after January 1, 2013. Management is currently assessing the potential impact, in addition to expanded financial statement disclosure, that may result from adopting this ASU.
In May 2011, FASB issued ASU No. 2011-04 Amendments to Achieve Common Fair Value Measurement and Disclosure Requirements in U.S. GAAP and IFRSs. ASU No. 2011-04 amends FASB ASC Topic 820, Fair Value Measurements to establish common requirements for measuring fair value and for disclosing information about fair value measurements in accordance with GAAP. The ASU is effective prospectively for interim and annual periods beginning after December 15, 2011. Management expects that adoption of the ASU will result in additional disclosures in the financial statements, as applicable.
In April 2011, FASB issued ASU No. 2011-03 Reconsideration of Effective Control for Repurchase Agreements. ASU No. 2011-03 amends FASB ASC Topic 860, Transfers and Servicing, specifically the criteria required to determine whether a repurchase agreement (repo) and similar agreements should be accounted for as sales of financial assets or secured borrowings with commitments. ASU No. 2011-03 changes the assessment of effective control by focusing on the transferor’s contractual rights and obligations and removing the criterion to assess its ability to exercise those rights or honor those obligations. This could result in changes to the way entities account for certain transactions including repurchase agreements, mortgage dollar rolls and reverse repurchase agreements. The ASU will become effective on a prospective basis for new transfers and modifications to existing transactions as of the beginning of the first interim or annual period beginning on or after December 15, 2011. Management has evaluated the impact of adopting the ASU and expects no significant changes.
| | | | | | |
| Other Information (Unaudited) | | Wells Fargo Advantage Emerging Markets Equity Fund | | | 27 | |
PROXY VOTING INFORMATION
A description of the policies and procedures that the Fund uses to determine how to vote proxies relating to portfolio securities is available without charge, upon request, by calling 1-800-222-8222, visiting our Web site at wellsfargoadvantagefunds.com, or visiting the SEC Web site at sec.gov. Information regarding how the Fund voted proxies relating to portfolio securities during the most recent 12-month period ended June 30 is available without charge on the Fund’s Web site at wellsfargoadvantagefunds.com or by visiting the SEC Web site at sec.gov.
PORTFOLIO HOLDINGS INFORMATION
The complete portfolio holdings for the Fund are publicly available on the Fund’s Web site (wellsfargoadvantagefunds.com) on a monthly, 30-day or more delayed basis. In addition, top ten holdings information for the Fund is publicly available on the Fund’s Web site on a monthly, seven-day or more delayed basis. The Fund files its complete schedule of portfolio holdings with the SEC for the first and third quarters of each fiscal year on Form N-Q, which is available without charge by visiting the SEC Web site at sec.gov. In addition, the Fund’s Form N-Q may be reviewed and copied at the SEC’s Public Reference Room in Washington, DC, and at regional offices in New York City, at 233 Broadway, and in Chicago, at 175 West Jackson Boulevard, Suite 900. Information about the Public Reference Room may be obtained by calling 1-800-SEC-0330.
| | | | |
| 28 | | Wells Fargo Advantage Emerging Markets Equity Fund | | Other Information (Unaudited) |
BOARD OF TRUSTEES
The following table provides basic information about the Board of Trustees (the “Trustees”) of the Trust and Officers of the Trust. This table should be read in conjunction with the Prospectus and the Statement of Additional Information1 of the Fund. Each of the Trustees and Officers listed below acts in identical capacities for the Wells Fargo Advantage family of funds, which consists of 137 funds comprising the Wells Fargo Funds Trust, Wells Fargo Variable Trust, Wells Fargo Master Trust and four closed-end funds (collectively the “Fund Complex”). All of the Trustees are also Members of the Audit and Governance Committees of each Trust in the Fund Complex. The mailing address of each Trustee and Officer is 525 Market Street, 12th Floor, San Francisco, CA 94105. Each Trustee and Officer serves an indefinite term, however, each Trustee serves such term until reaching the mandatory retirement age established by the Trustees.
Independent Trustees
| | | | | | |
Name and Year of Birth | | Position Held and Length of Service | | Principal Occupations During Past Five Years | | Other Directorships During
Past Five Years |
Peter G. Gordon
(Born 1942) | | Trustee, since 1998; Chairman, since 2005 (Lead Trustee since 2001) | | Co-Founder, Retired Chairman, President and CEO of Crystal Geyser Water Company. Trustee Emeritus, Colby College | | Asset Allocation Trust |
Isaiah Harris, Jr.
(Born 1952) | | Trustee, since 2009 | | Retired. Prior thereto, President and CEO of BellSouth Advertising and Publishing Corp. from 2005 to 2007, President and CEO of BellSouth Enterprises from 2004 to 2005 and President of BellSouth Consumer Services from 2000 to 2003. Emeritus member of the Iowa State University Foundation Board of Governors. Emeritus Member of the Advisory Board of Iowa State University School of Business. Mr. Harris is a certified public accountant. | | CIGNA Corporation; Deluxe Corporation; Asset Allocation Trust |
Judith M. Johnson
(Born 1949) | | Trustee, since 2008 | | Retired. Prior thereto, Chief Executive Officer and Chief Investment Officer of Minneapolis Employees Retirement Fund from 1996 to 2008. Ms. Johnson is an attorney, certified public accountant and a certified managerial accountant. | | Asset Allocation Trust |
Leroy Keith, Jr.
(Born 1939) | | Trustee, since 2010 | | Chairman, Bloc Global Services (development and construction). Trustee of the Evergreen Funds from 1983 to 2010. Former Managing Director, Almanac Capital Management (commodities firm), former Partner, Stonington Partners, Inc. (private equity fund), former Director, Obagi Medical Products Co. and former Director, Lincoln Educational Services. | | Trustee, Virtus Fund Complex (consisting of 40 portfolios as of 12/31/11); Asset Allocation Trust |
David F. Larcker
(Born 1950) | | Trustee, since 2009 | | James Irvin Miller Professor of Accounting at the Graduate School of Business, Stanford University, Director of Corporate Governance Research Program and Senior Faculty of The Rock Center for Corporate Governance since 2006. From 2005 to 2008, Professor of Accounting at the Graduate School of Business, Stanford University. Prior thereto, Ernst & Young Professor of Accounting at The Wharton School, University of Pennsylvania from 1985 to 2005. | | Asset Allocation Trust |
Olivia S. Mitchell
(Born 1953) | | Trustee, since 2006 | | International Foundation of Employee Benefit Plans Professor, Wharton School of the University of Pennsylvania since 1993. Director of Wharton’s Pension Research Council and Boettner Center on Pensions & Retirement Research, and Research Associate at the National Bureau of Economic Research. Previously, Cornell University Professor from 1978 to 1993. | | Asset Allocation Trust |
| | | | | | |
| Other Information (Unaudited) | | Wells Fargo Advantage Emerging Markets Equity Fund | | | 29 | |
| | | | | | |
Name and Year of Birth | | Position Held and Length of Service | | Principal Occupations During Past Five Years | | Other Directorships During
Past Five Years |
Timothy J. Penny
(Born 1951) | | Trustee, since 1996 | | President and CEO of Southern Minnesota Initiative Foundation, a non-profit organization, since 2007 and Senior Fellow at the Humphrey Institute Policy Forum at the University of Minnesota since 1995. Member of the Board of Trustees of NorthStar Education Finance, Inc., a non-profit organization, since 2007. | | Asset Allocation Trust |
Michael S. Scofield
(Born 1943) | | Trustee, since 2010 | | Served on the Investment Company Institute’s Board of Governors and Executive Committee from 2008-2011 as well the Governing Council of the Independent Directors Council from 2006-2011 and the Independent Directors Council Executive Committee from 2008-2011. Chairman of the IDC from 2008-2010. Institutional Investor (Fund Directions) Trustee of Year in 2007. Trustee of the Evergreen Funds (and its predecessors) from 1984 to 2010. Chairman of the Evergreen Funds from 2000-2010. Former Trustee of the Mentor Funds. Retired Attorney, Law Offices of Michael S. Scofield and former Director and Chairman, Branded Media Corporation (multi-media branding company). | | Asset Allocation Trust |
Donald C. Willeke
(Born 1940) | | Trustee, since 1996 | | Principal of the law firm of Willeke & Daniels. General Counsel of the Minneapolis Employees Retirement Fund from 1984 until its consolidation into the Minnesota Public Employees Retirement Association on June 30, 2010. Director and Vice Chair of The Free Trust (non-profit corporation). Director of the American Chestnut Foundation (non-profit corporation). | | Asset Allocation Trust |
Officers
| | | | | | |
Name and Year of Birth | | Position Held and
Length of Service | | Principal Occupations During Past Five Years | | |
Karla M. Rabusch
(Born 1959) | | President, since 2003 | | Executive Vice President of Wells Fargo Bank, N.A. and President of Wells Fargo Funds Management, LLC since 2003. Senior Vice President and Chief Administrative Officer of Wells Fargo Funds Management, LLC from 2001 to 2003. | | |
C. David Messman
(Born 1960) | | Secretary, since 2000; Chief Legal Counsel, since 2003 | | Senior Vice President and Secretary of Wells Fargo Funds Management, LLC since 2001. Vice President and Managing Senior Counsel of Wells Fargo Bank, N.A. since 1996. | | |
Kasey Phillips
(Born 1970) | | Treasurer, since 2009 | | Senior Vice President of Wells Fargo Funds Management, LLC since 2009. Senior Vice President of Evergreen Investment Management Company, LLC from 2006 to 2010. Treasurer of the Evergreen Funds from 2005 to 2010. | | |
David Berardi
(Born 1975) | | Assistant Treasurer, since 2009 | | Vice President of Wells Fargo Funds Management, LLC since 2009. Vice President of Evergreen Investment Management Company, LLC from 2008 to 2010. Assistant Vice President of Evergreen Investment Services, Inc. from 2004 to 2008. Manager of Fund Reporting and Control for Evergreen Investment Management Company, LLC from 2004 to 2010. | | |
Jeremy DePalma
(Born 1974) | | Assistant Treasurer, since 2009 | | Senior Vice President of Wells Fargo Funds Management, LLC since 2009. Senior Vice President of Evergreen Investment Management Company, LLC from 2008 to 2010. Vice President, Evergreen Investment Services, Inc. from 2004 to 2007. Head of the Fund Reporting and Control Team within Fund Administration from 2005 to 2010. | | |
Debra Ann Early
(Born 1964) | | Chief Compliance Officer, since 2007 | | Chief Compliance Officer of Wells Fargo Funds Management, LLC since 2007. Chief Compliance Officer of Parnassus Investments from 2005 to 2007. Chief Financial Officer of Parnassus Investments from 2004 to 2007 and Senior Audit Manager of PricewaterhouseCoopers LLP from 1998 to 2004. | | |
| 1. | The Statement of Additional Information includes additional information about the Trustees and is available, without charge, upon request, by calling 1-800-222-8222 or by visiting the Web site at wellsfargoadvantagefunds.com. |
| | | | |
| 30 | | Wells Fargo Advantage Emerging Markets Equity Fund | | Other Information (Unaudited) |
BOARD CONSIDERATION OF INVESTMENT ADVISORY AND SUB-ADVISORY AGREEMENTS:
Under Section 15 of the Investment Company Act of 1940 (the “1940 Act”), the Board of Trustees (the “Board”) of Wells Fargo Funds Trust (the “Trust”), all the members of which have no direct or indirect interest in the investment advisory and sub-advisory agreements and are not “interested persons” of the Trust, as defined in the 1940 Act (the “Independent Trustees”), must determine whether to approve the continuation of the Trust’s investment advisory and sub-advisory agreements. In this regard, at an in person meeting held on March 29-30, 2012 (the “Meeting”), the Board reviewed and re-approved: (i) an investment advisory agreement with Wells Fargo Funds Management, LLC (“Funds Management”) for Wells Fargo Advantage Emerging Markets Equity Fund (the “Fund”) and (ii) an investment sub-advisory agreement with Wells Capital Management Incorporated (“Wells Capital Management”) for the Fund. The investment advisory agreement with Funds Management and the investment sub-advisory agreement with Wells Capital Management are collectively referred to as the “Advisory Agreements.”
At the Meeting, the Board considered the factors and reached the conclusions described below relating to the selection of Funds Management and Wells Capital Management and the continuation of the Advisory Agreements. Prior to the Meeting, the Trustees conferred extensively among themselves and with representatives of Funds Management about these matters. The Board also met throughout the year and received information that was useful to them in considering the continuation of the Advisory Agreements. The Independent Trustees were assisted in their evaluation of the Advisory Agreements by independent legal counsel, from whom they received separate legal advice and with whom they met separately from Funds Management.
In providing information to the Board, Funds Management and Wells Capital Management were guided by a detailed set of requests submitted by the Independent Trustees’ independent legal counsel on their behalf at the start of the Board’s annual contract renewal process earlier in 2012. In approving the Advisory Agreements, the Board did not identify any particular information or consideration that was all-important or controlling, and each Trustee likely attributed different weights to various factors.
Nature, extent and quality of services
The Board received and considered various information regarding the nature, extent and quality of services provided to the Fund by Funds Management and Wells Capital Management under the Advisory Agreements. The Board also received and considered, among other things, information about the background and experience of senior management of Funds Management, and the qualifications, backgrounds, tenures and responsibilities of the portfolio managers primarily responsible for the day-to-day portfolio management of the Fund.
The Board evaluated the ability of Funds Management and Wells Capital Management, based on their respective financial condition, resources, reputation and other attributes, to attract and retain qualified investment professionals, including research, advisory, and supervisory personnel. The Board further considered the compliance programs and compliance records of Funds Management and Wells Capital Management. In addition, the Board took into account the administrative services provided to the Fund by Funds Management and its affiliates.
The Board’s decision to approve the continuation of the Advisory Agreements was based on a comprehensive evaluation of all of the information provided to it. In considering these matters, the Board considered not only the specific information presented in connection with the Meeting, but also the knowledge gained over time through interaction with Funds Management and Wells Capital Management about various topics, including Funds Management’s oversight of service providers. The above factors, together with those referenced below, are some of the most important, but not necessarily all, factors considered by the Board in concluding that the nature, extent and quality of the investment advisory services provided to the Fund by Funds Management and Wells Capital Management supported the re-approval of the Advisory Agreements. Although the Board considered the continuation of the Advisory Agreements for the Fund as part of the larger process of considering the continuation of the advisory agreements for all of the funds in the complex, its decision to continue the Advisory Agreements for the Fund was ultimately made on a fund-by-fund basis.
Fund performance and expenses
The Board considered the performance results for the Fund over various time periods ended December 31, 2011. The Board also considered these results in comparison to the median performance of a universe of relevant funds (the “Universe”) that was determined by Lipper Inc. (“Lipper”) to be similar to the Fund, and in comparison to the Fund’s
| | | | | | |
| Other Information (Unaudited) | | Wells Fargo Advantage Emerging Markets Equity Fund | | | 31 | |
benchmark index and to other comparative data. Lipper is an independent provider of investment company data. The Board received a description of the methodology used by Lipper to select the mutual funds in the Universe. The Board noted that the performance of the Fund was higher than the median performance of the Universe for all periods under review. The Board also noted that the performance of the Fund was higher than its benchmark, the Lipper Emerging Markets Funds Index, for the periods under review.
The Board received and considered information regarding the Fund’s contractual advisory fee and net operating expense ratios and their various components, including actual management fees (which reflect fee waivers, if any), transfer agent, custodian and other non-management fees, Rule 12b-1 and non-Rule 12b-1 fees, service fees and fee waiver and expense reimbursement arrangements. The Board also considered these ratios in comparison to the median ratios of an expense Universe and a narrower expense group of mutual funds (each, an “Expense Group”) that was determined by Lipper to be similar to the Fund. The Board received a description of the methodology used by Lipper to select the mutual funds in the Fund’s Expense Group. The Board noted that the net operating expense ratios of the Fund were lower than, equal to or in range of the Fund’s Expense Group’s median net operating expense ratios.
Based on the above-referenced considerations and other factors, the Board concluded that the overall performance and expense structure of the Fund supported the re-approval of the Advisory Agreements for the Fund.
Investment advisory and sub-advisory fee rates
The Board reviewed and considered the contractual investment advisory fee rate that is payable by the Fund to Funds Management for investment advisory services (the “Advisory Agreement Rate”), both on a stand-alone basis and on a combined basis with the Fund’s administration fee rate. The Board took into account the separate administrative and other services covered by the administration fee rate. The Board also reviewed and considered the contractual investment sub-advisory fee rate that is payable by Funds Management to Wells Capital Management for investment sub-advisory services (the “Sub-Advisory Agreement Rate”). In addition, the Board reviewed and considered the existing fee waiver/cap arrangements applicable to the Advisory Agreement Rate and considered the Advisory Agreement Rate after taking the waivers/caps into account (the “Net Advisory Rate”).
The Board received and considered information comparing the Advisory Agreement Rate and Net Advisory Rate with those of other funds in the Fund’s Expense Group median. The Board noted that the Advisory Agreement Rate and Net Advisory Rate for Fund were in range of the median rates for the Fund’s Expense Group, except for Class A. The Board noted that Funds Management proposed to extend contractual fee cap arrangements for the Fund designed to lower the fund’s expenses until February 28, 2014.
The Board also received and considered information about the nature and extent of services offered and fee rates charged by Funds Management and Wells Capital Management to other types of clients. In this regard, the Board received information about differences between the services, and the compliance, reporting, and other legal burdens and risks of providing investment advice to mutual funds and those associated with providing advice to non-mutual fund clients such as collective funds or institutional separate accounts.
The Board determined that the Advisory Agreement Rate for the Fund, both with and without an administration fee rate and before and after waivers, was reasonable in light of the Fund’s Expense Group information, the net expense ratio commitments, the services covered by the Advisory Agreements and other information provided. The Board also reviewed and considered the Sub-Advisory Agreement Rate and concluded that the Sub-Advisory Agreement Rate was reasonable in light of the services covered by the sub-advisory agreement and other information provided.
Profitability
The Board received and considered a profitability analysis of Funds Management, as well as an analysis of the profitability to the collective Wells Fargo businesses that provide services to the Fund. It considered that the information provided to it was necessarily estimated, and that the profitability information provided to it, especially on a fund-by-fund basis, did not necessarily provide a precise tool for evaluating the appropriateness of the Fund’s Advisory Agreement Rate in isolation. It noted that the levels of profitability reported on a fund-by-fund basis varied widely, depending on, among other things, the size and type of fund. The Board concluded that the profitability reported by Funds Management was not unreasonable.
| | | | |
| 32 | | Wells Fargo Advantage Emerging Markets Equity Fund | | Other Information (Unaudited) |
The Board did not consider separate profitability information with respect to Wells Capital Management, because, as an affiliate of Funds Management, its profitability information was subsumed in the collective Wells Fargo profitability analysis provided by Funds Management.
Economies of scale
With respect to possible economies of scale, the Board reviewed the breakpoints in the Fund’s advisory fee structure, which operate generally to reduce the effective Advisory Agreement Rate of the Fund (as a percentage of Fund assets) as the Fund grows in size. It considered that, as a fund shrinks in size, breakpoints conversely result in increasing fee levels. The Board noted that it would have on-going opportunities to review the appropriate levels of breakpoints in the future, and concluded that the breakpoints as implemented appeared to be a reasonable step toward sharing economies of scale, if any, with the Fund. However, the Board acknowledged the inherent limitations of any analysis of an investment adviser’s economies of scale and of any attempt to correlate breakpoints with such economies, stemming largely from the Board’s understanding that economies of scale are realized, if at all, by an investment adviser across a variety of products and services, not just with respect to a single fund.
Other benefits to funds Management and Wells Capital Management
The Board received and considered information regarding potential “fall-out” or ancillary benefits received by Funds Management and its affiliates, including Wells Capital Management, as a result of their relationship with the Fund. Ancillary benefits could include, among others, benefits directly attributable to the relationship of Funds Management and Wells Capital Management with the Fund and benefits potentially derived from an increase in Funds Management’s and Wells Capital Management’s business as a result of their relationship with the Fund (such as the ability to market to shareholders other financial products offered by Funds Management and its affiliates, including Wells Capital Management).
The Board considered that Wells Fargo Funds Distributor, LLC, an affiliate of Funds Management, serves as distributor to the Fund and receives certain compensation for those services. The Board noted that various financial institutions, including affiliates of Funds Management, may receive distribution-related fees, shareholder servicing payments (including amounts derived from payments under Rule 12b-1 plans) and sub-transfer agency fees in respect of shares sold or held through them and services provided.
The Board also reviewed information about whether and to what extent soft dollar credits are sought and how any such credits are utilized and any benefits that may be realized by using an affiliated broker.
Other factors and broader review
The Board also considered the markets for distribution of the Fund’s shares, including the channels through which the Fund’s shares are offered and sold. The Board noted that the Fund is part of one of the few fund families that have both direct-to-fund and intermediary distribution channels. As discussed above, the Board reviews detailed materials received from Funds Management and Wells Capital Management annually as part of the re-approval process under Section 15 of the 1940 Act and also reviews and assesses information about the quality of the services that the Fund receives throughout the year. In this regard, the Board has reviewed reports of Funds Management at each of its quarterly meetings, which include, among other things, portfolio reviews and performance reports. In addition, the Board confers with portfolio managers at various times throughout the year.
Conclusion
After considering the above-described factors and based on its deliberations and its evaluation of the information described above, the Board unanimously approved the continuation of the Advisory Agreements for an additional one-year period.
| | | | | | |
| List of Abbreviations | | Wells Fargo Advantage Emerging Markets Equity Fund | | | 33 | |
The following is a list of common abbreviations for terms and entities which may have appeared in this report.
| ACB | — Agricultural Credit Bank |
| ADR | — American Depository Receipt |
| ADS | — American Depository Shares |
| AGC-ICC | — Assured Guaranty Corporation - Insured Custody Certificates |
| AGM | — Assured Guaranty Municipal |
| AMBAC | — American Municipal Bond Assurance Corporation |
| AMT | — Alternative Minimum Tax |
| BAN | — Bond Anticipation Notes |
| BHAC | — Berkshire Hathaway Assurance Corporation |
| CAB | — Capital Appreciation Bond |
| CCAB | — Convertible Capital Appreciation Bond |
| CDA | — Community Development Authority |
| CDO | — Collateralized Debt Obligation |
| COP | — Certificate of Participation |
| DRIVER | — Derivative Inverse Tax-Exempt Receipts |
| DW&P | — Department of Water & Power |
| DWR | — Department of Water Resources |
| ECFA | — Educational & Cultural Facilities Authority |
| EDA | — Economic Development Authority |
| EDFA | — Economic Development Finance Authority |
| ETF | — Exchange-Traded Fund |
| FFCB | — Federal Farm Credit Bank |
| FGIC | — Financial Guaranty Insurance Corporation |
| FHA | — Federal Housing Authority |
| FHLB | — Federal Home Loan Bank |
| FHLMC | — Federal Home Loan Mortgage Corporation |
| FICO | — The Financing Corporation |
| FNMA | — Federal National Mortgage Association |
| GDR | — Global Depository Receipt |
| GNMA | — Government National Mortgage Association |
| HCFR | — Healthcare Facilities Revenue |
| HEFA | — Health & Educational Facilities Authority |
| HEFAR | — Higher Education Facilities Authority Revenue |
| HFA | — Housing Finance Authority |
| HFFA | — Health Facilities Financing Authority |
| IBC | — Insured Bond Certificate |
| IDA | — Industrial Development Authority |
| IDAG | — Industrial Development Agency |
| IDR | — Industrial Development Revenue |
| KRW | — Republic of Korea Won |
| LIBOR | — London Interbank Offered Rate |
| LLC | — Limited Liability Company |
| LLP | — Limited Liability Partnership |
| MBIA | — Municipal Bond Insurance Association |
| MFHR | — Multi-Family Housing Revenue |
| MSTR | — Municipal Securities Trust Receipts |
| MUD | — Municipal Utility District |
| NATL-RE | — National Public Finance Guarantee Corporation |
| PCFA | — Pollution Control Finance Authority |
| PCR | — Pollution Control Revenue |
| PFA | — Public Finance Authority |
| PFFA | — Public Facilities Financing Authority |
| PFOTER | — Puttable Floating Option Tax-Exempt Receipts |
| plc | — Public Limited Company |
| PUTTER | — Puttable Tax-Exempt Receipts |
| R&D | — Research & Development |
| RDA | — Redevelopment Authority |
| RDFA | — Redevelopment Finance Authority |
| REIT | — Real Estate Investment Trust |
| ROC | — Reset Option Certificates |
| SAVRS | — Select Auction Variable Rate Securities |
| SBA | — Small Business Authority |
| SFHR | — Single Family Housing Revenue |
| SFMR | — Single Family Mortgage Revenue |
| SPA | — Standby Purchase Agreement |
| SPDR | — Standard & Poor’s Depositary Receipts |
| STRIPS | — Separate Trading of Registered Interest and Principal Securities |
| TAN | — Tax Anticipation Notes |
| TIPS | — Treasury Inflation-Protected Securities |
| TRAN | — Tax Revenue Anticipation Notes |
| TCR | — Transferable Custody Receipts |
| TTFA | — Transportation Trust Fund Authority |
| TVA | — Tennessee Valley Authority |
| XLCA | — XL Capital Assurance |
This page is intentionally left blank.


FOR MORE INFORMATION
More information about Wells Fargo Advantage Funds is available free upon request. To obtain literature, please write, e-mail, visit the Fund’s Web site, or call:
Wells Fargo Advantage Funds
P.O. Box 8266
Boston, MA 02266-8266
E-mail: wfaf@wellsfargo.com
Web site: wellsfargoadvantagefunds.com
Individual investors: 1-800-222-8222
Retail investment professionals: 1-888-877-9275
Institutional investment professionals: 1-866-765-0778
This report and the financial statements contained herein are submitted for the general information of the shareholders of Wells Fargo Advantage Funds. If this report is used for promotional purposes, distribution of the report must be accompanied or preceded by a current prospectus. For a prospectus containing more complete information, including charges and expenses, call 1-800-222-8222 or visit the Fund’s Web site at wellsfargoadvantagefunds.com. Please consider the investment objectives, risks, charges, and expenses of the investment carefully before investing. This and other information about Wells Fargo Advantage Funds can be found in the current prospectus. Read the prospectus carefully before you invest or send money.
Wells Fargo Funds Management, LLC, a wholly owned subsidiary of Wells Fargo & Company, provides investment advisory and administrative services for Wells Fargo Advantage Funds. Other affiliates of Wells Fargo & Company provide subadvisory and other services for the Funds. The Funds are distributed by Wells Fargo Funds Distributor, LLC, Member FINRA/SIPC, an affiliate of Wells Fargo & Company.
NOT FDIC INSURED ¡ NO BANK GUARANTEE ¡ MAY LOSE VALUE
© 2012 Wells Fargo Funds Management, LLC. All rights reserved.
| | |
 | | 209722 06-12 SA238/SAR238 4-12 |

Wells Fargo Advantage Global Opportunities Fund

Semi-Annual Report
April 30, 2012

Reduce clutter. Save trees.
Sign up for electronic delivery of prospectuses and shareholder reports at wellsfargo.com/advantagedelivery
Contents
The views expressed and any forward-looking statements are as of April 30, 2012, unless otherwise noted, and are those of the Fund managers and/or Wells Fargo Funds Management, LLC. Discussions of individual securities, or the markets generally, or any Wells Fargo Advantage Fund are not intended as individual recommendations. Future events or results may vary significantly from those expressed in any forward-looking statements; the views expressed are subject to change at any time in response to changing circumstances in the market. Wells Fargo Funds Management, LLC, disclaims any obligation to publicly update or revise any views expressed or forward-looking statements.
NOT FDIC INSURED ¡ NO BANK GUARANTEE ¡ MAY LOSE VALUE

WELLS FARGO INVESTMENT HISTORY
| | |
| |
| 1932 | | Keystone creates one of the first mutual fund families. |
| |
| 1971 | | Wells Fargo & Company introduces one of the first institutional index funds. |
| |
| 1978 | | Wells Fargo applies Markowitz and Sharpe’s research on Modern Portfolio Theory to introduce one of the industry’s first Tactical Asset Allocation (TAA) models in institutional separately managed accounts. |
| |
| 1984 | | Wells Fargo Stagecoach Funds launches its first asset allocation fund. |
| |
| 1989 | | The Tactical Asset Allocation (TAA) Model is first applied to Wells Fargo’s asset allocation mutual funds. |
| |
| 1994 | | Wells Fargo introduces the LifePath Funds, one of the first suites of target date funds (now the Wells Fargo Advantage Dow Jones Target Date FundsSM). |
| |
| 1996 | | Evergreen Investments and Keystone Funds merge. |
| |
| 1997 | | Wells Fargo launches Wells Fargo Advantage WealthBuilder PortfoliosSM, a fund-of-funds suite of products that includes the use of quantitative models to shift assets among investment styles. |
| |
| 1999 | | Norwest Advantage Funds and Stagecoach Funds are reorganized into Wells Fargo Funds after the merger of Norwest and Wells Fargo. |
| |
| 2002 | | Evergreen Retail and Evergreen Institutional companies form the umbrella asset management company, Evergreen Investments. |
| |
| 2005 | | The integration of Strong Funds with Wells Fargo Funds creates Wells Fargo Advantage Funds, resulting in one of the top 20 mutual fund companies in the United States. |
| |
| 2006 | | Wells Fargo Advantage Funds relaunches the target date product line as Wells Fargo Advantage Dow Jones Target Date Funds. |
| |
| 2010 | | The mergers and reorganizations of Evergreen and Wells Fargo Advantage mutual funds are completed, unifying the families under the brand of Wells Fargo Advantage Funds. |
Wells Fargo Advantage Funds®
Wells Fargo Advantage Funds skillfully guides institutions, financial advisors, and individuals through the investment terrain to help them reach their financial objectives. Everything we do on behalf of investors is backed by our unique combination of qualifications.
Strength
Our organization is built on the standards of integrity and service established by our parent company—Wells Fargo & Company—more than 150 years ago. And, because we’re part of a highly diversified financial enterprise, we offer the depth of resources to help investors succeed.
Expertise
Our multi-boutique model offers investors access to the independent thinking of premier investment managers that have been chosen for their time-tested strategies. While each team specializes in a specific investment strategy, collectively they provide investors a wide choice of distinct investment styles. Our dedication to investment excellence doesn’t end with our expertise in manager selection—risk management, analysis, and rigorous ongoing review seek to ensure each manager’s investment process remains consistent.
Partnership
Our collaborative approach is built around understanding the needs and goals of our clients. By adhering to core principles of sound judgment and steady guidance, we support you through every stage of the investment decision process.
Carefully consider a fund’s investment objectives, risks, charges, and expenses before investing. For a current prospectus and, if available, a summary prospectus, containing this and other information, visit wellsfargoadvantagefunds.com. Read it carefully before investing.
Wells Fargo Funds Management, LLC, a wholly owned subsidiary of Wells Fargo & Company, provides investment advisory and administrative services for Wells Fargo Advantage Funds®. Other affiliates of Wells Fargo & Company provide subadvisory and other services for the Funds. The Funds are distributed by Wells Fargo Funds Distributor, LLC, Member FINRA/SIPC, an affiliate of Wells Fargo & Company.
“Dow Jones®” and “Dow Jones Target Date IndexesSM” are service marks of Dow Jones Trademark Holdings, LLC (“Dow Jones”), have been licensed to CME Group Index Services LLC (“CME Indexes”) and have been sublicensed for use for certain purposes by Global Index Advisors, Inc, and Wells Fargo Funds Management, LLC. The Wells Fargo Advantage Dow Jones Target Date FundsSM based on the Dow Jones Target Date IndexesSM, are not sponsored, endorsed, sold or promoted by Dow Jones, CME Indexes or their respective affiliates and none of them makes any representation regarding the advisability of investing in such product(s).
NOT FDIC INSURED ¡ NO BANK GUARANTEE ¡ MAY LOSE VALUE
Not part of the semi-annual report.
Wells Fargo Advantage Funds offers more than 110 mutual funds across a wide range of asset classes, representing over $211 billion in assets under management, as of April 30, 2012.
| | | | |
| Equity Funds | | | | |
Asia Pacific Fund | | Enterprise Fund† | | Opportunity Fund† |
C&B Large Cap Value Fund | | Equity Value Fund | | Precious Metals Fund |
C&B Mid Cap Value Fund | | Global Opportunities Fund | | Premier Large Company Growth Fund |
Capital Growth Fund | | Growth Fund | | Small Cap Opportunities Fund |
Common Stock Fund | | Index Fund | | Small Cap Value Fund |
Disciplined U.S. Core Fund | | International Equity Fund | | Small Company Growth Fund |
Discovery Fund† | | International Value Fund | | Small Company Value Fund |
Diversified Equity Fund | | Intrinsic Small Cap Value Fund | | Small/Mid Cap Core Fund |
Diversified International Fund | | Intrinsic Value Fund | | Small/Mid Cap Value Fund |
Diversified Small Cap Fund | | Intrinsic World Equity Fund | | Special Mid Cap Value Fund |
Emerging Growth Fund | | Large Cap Core Fund | | Special Small Cap Value Fund |
Emerging Markets Equity Fund | | Large Cap Growth Fund | | Specialized Technology Fund |
Emerging Markets Equity Income Fund | | Large Company Value Fund | | Traditional Small Cap Growth Fund |
Emerging Markets Local Bond Fund | | Omega Growth Fund | | Utility and Telecommunications Fund |
Endeavor Select Fund† | | | | |
| Bond Funds | | | | |
Adjustable Rate Government Fund | | Inflation-Protected Bond Fund | | Short-Term Bond Fund |
California Limited-Term Tax-Free Fund | | Intermediate Tax/AMT-Free Fund | | Short-Term High Yield Bond Fund |
California Tax-Free Fund | | International Bond Fund | | Short-Term Municipal Bond Fund |
Colorado Tax-Free Fund | | Minnesota Tax-Free Fund | | Strategic Municipal Bond Fund |
Government Securities Fund | | Municipal Bond Fund | | Total Return Bond Fund |
High Income Fund | | North Carolina Tax-Free Fund | | Ultra Short-Term Income Fund |
High Yield Bond Fund | | Pennsylvania Tax-Free Fund | | Ultra Short-Term Municipal Income Fund |
Income Plus Fund | | Short Duration Government Bond Fund | | Wisconsin Tax-Free Fund |
| Asset Allocation Funds | | | | |
Absolute Return Fund | | WealthBuilder Equity Portfolio† | | Target 2020 Fund† |
Asset Allocation Fund | | WealthBuilder Growth Allocation Portfolio† | | Target 2025 Fund† |
Conservative Allocation Fund | | WealthBuilder Growth Balanced Portfolio† | | Target 2030 Fund† |
Diversified Capital Builder Fund | | WealthBuilder Moderate Balanced Portfolio† | | Target 2035 Fund† |
Diversified Income Builder Fund | | WealthBuilder Tactical Equity Portfolio† | | Target 2040 Fund† |
Growth Balanced Fund | | Target Today Fund† | | Target 2045 Fund† |
Index Asset Allocation Fund | | Target 2010 Fund† | | Target 2050 Fund† |
Moderate Balanced Fund | | Target 2015 Fund† | | Target 2055 Fund† |
WealthBuilder Conservative Allocation Portfolio† | | | | |
| Money Market Funds | | | | |
100% Treasury Money Market Fund | | Heritage Money Market Fund† | | National Tax-Free Money Market Fund |
California Municipal Money Market Fund | | Money Market Fund | | Prime Investment Money Market Fund |
Cash Investment Money Market Fund | | Municipal Cash Management Money Market Fund | | Treasury Plus Money Market Fund |
Government Money Market Fund | | Municipal Money Market Fund | | |
| Variable Trust Funds1 | | | | |
VT Discovery Fund† | | VT Intrinsic Value Fund | | VT Small Cap Growth Fund |
VT Index Asset Allocation Fund | | VT Omega Growth Fund | | VT Small Cap Value Fund |
VT International Equity Fund | | VT Opportunity Fund† | | VT Total Return Bond Fund |
An investment in a money market fund is not insured or guaranteed by the Federal Deposit Insurance Corporation or any other government agency. Although the Wells Fargo Advantage Money Market Funds seek to preserve the value of your investment at $1.00 per share, it is possible to lose money by investing in a money market fund.
| 1. | The Variable Trust Funds are generally available only through insurance company variable contracts. |
| † | In this report, the Wells Fargo Advantage Discovery FundSM, Wells Fargo Advantage Endeavor Select FundSM, Wells Fargo Advantage Enterprise FundSM, Wells Fargo Advantage Opportunity FundSM, Wells Fargo Advantage WealthBuilder Conservative Allocation PortfolioSM, Wells Fargo Advantage WealthBuilder Equity PortfolioSM, Wells Fargo Advantage WealthBuilder Growth Allocation PortfolioSM, Wells Fargo Advantage WealthBuilder Growth Balanced PortfolioSM, Wells Fargo Advantage WealthBuilder Moderate Balanced PortfolioSM, Wells Fargo Advantage WealthBuilder Tactical Equity PortfolioSM, Wells Fargo Advantage Dow Jones Target Today FundSM, Wells Fargo Advantage Dow Jones Target 2010 FundSM, Wells Fargo Advantage Dow Jones Target 2015 FundSM, Wells Fargo Advantage Dow Jones Target 2020 FundSM, Wells Fargo Advantage Dow Jones Target 2025 FundSM, Wells Fargo Advantage Dow Jones Target 2030 FundSM, Wells Fargo Advantage Dow Jones Target 2035 FundSM, Wells Fargo Advantage Dow Jones Target 2040 FundSM, Wells Fargo Advantage Dow Jones Target 2045 FundSM, Wells Fargo Advantage Dow Jones Target 2050 FundSM, Wells Fargo Advantage Dow Jones Target 2055 FundSM, Wells Fargo Advantage Heritage Money Market FundSM, Wells Fargo Advantage VT Discovery FundSM, and Wells Fargo Advantage VT Opportunity FundSM are referred to as the Discovery Fund, Endeavor Select Fund, Enterprise Fund, Opportunity Fund, WealthBuilder Conservative Allocation Portfolio, WealthBuilder Equity Portfolio, WealthBuilder Growth Allocation Portfolio, WealthBuilder Growth Balanced Portfolio, WealthBuilder Moderate Balanced Portfolio, WealthBuilder Tactical Equity Portfolio, Target Today Fund, Target 2010 Fund, Target 2015 Fund, Target 2020 Fund, Target 2025 Fund, Target 2030 Fund, Target 2035 Fund, Target 2040 Fund, Target 2045 Fund, Target 2050 Fund, Target 2055 Fund, Heritage Money Market Fund, VT Discovery Fund, and VT Opportunity Fund, respectively. |
Not part of the semi-annual report.
| | | | |
| 2 | | Wells Fargo Advantage Global Opportunities Fund | | Letter to Shareholders |

Karla M. Rabusch,
President
Wells Fargo Advantage Funds
The period was marked by continued concerns about the possible global economic effects of the ongoing European sovereign debt crisis that began in Greece and later spread to the larger economies of Italy and Spain.
The potential for sovereign debt default had a negative effect on emerging markets, with indexes in major countries such as Brazil and India ending the period with losses.
Dear Valued Shareholder:
We’re pleased to offer you this semi-annual report for the Wells Fargo Advantage Global Opportunities Fund for the six-month period that ended April 30, 2012. The period was marked by continued concerns about the possible global economic effects of the ongoing European sovereign debt crisis that began in Greece and later spread to the larger economies of Italy and Spain. Widespread support from central banks helped push developed market indexes to gains, but several emerging markets posted losses for the period.
Macroeconomic optimism seemed to fade as global growth slowed and worries rose.
Prior to and throughout the reporting period, concerns about the eurozone sovereign debt situation returned to center stage. Investors became increasingly concerned that Greece would default on its debt, a scenario that only seemed more likely as eurozone leaders began to openly discuss a “voluntary” haircut on Greek debt for private investors. Because many eurozone banks owned Greek debt and many U.S. banks had financial ties to eurozone banks, investors worried about the effects of such an event on the financial systems and on the global economy.
In October 2011, market participants turned their attention to the debt burdens of Italy—which, like the U.S., also had its credit rating downgraded by Standard & Poor’s—because even though it had a relatively modest budget deficit, it had a high amount of outstanding debt and a stagnant economy. French banks were heavily exposed to Italian debt, so Italy’s woes led to fears of a state bailout of French banks and a resulting increase in France’s expenditures.
The Greek credit crisis was seemingly addressed in March 2012, when the Greek government came to an agreement with its creditors that allowed it to write down the principal on most of its bonds in exchange for increased financial austerity. The Greek agreement, combined with unprecedented support for eurozone banks by the European Central Bank (ECB), seemed to calm investor concerns, at least temporarily, and most developed markets—both in Europe and Asia—ended the period with gains. The potential for sovereign debt default had a negative effect on emerging markets, with indexes in major countries such as Brazil and India ending the period with losses. China was a notable exception, posting a gain.
The U.S. economy reported relatively solid news.
In contrast to worrisome data from the eurozone, U.S. economic data remained moderately positive. Reported gross domestic product (GDP) growth came in at a 1.8% annualized rate in the third quarter of 2011 and then accelerated to a 3.0% annualized rate in the fourth quarter. The initial estimate for GDP growth in the first quarter of 2012 came in at a 2.2% annualized rate, further supporting the case for economic recovery. In addition, the major banks appeared to have taken steps toward repairing their balance sheets; in March, the Federal Reserve (Fed) announced that 15 of the 19 major banks had passed a “stress test” in which the Fed attempted to gauge whether the banks could survive a severe recession that included a 50% drop in the stock market and a 21% percent decline in housing prices.
Financial stocks rebounded and outperformed the broader market for the reporting period after the Fed released details of the stress test. Stocks generally
| | | | | | |
| Letter to Shareholders | | Wells Fargo Advantage Global Opportunities Fund | | | 3 | |
rallied across the market as investors seemed to be increasingly confident that the U.S. would not return to recession.
Central banks continued to provide stimulus.
Throughout the reporting period, the Federal Open Market Committee kept its key interest rates effectively at zero in order to support the economy and financial system. In response to extreme market volatility and signs of a weakening economy, the Fed announced its intention to keep interest rates low until at least late 2014.
Likewise, the Bank of Japan voted in late April to keep its key policy rate in a range of 0.0% to 0.1%. The bank announced that it would expand its government bond purchases by 10 trillion yen ($123.8 billion), targeting a 1.0% inflation rate in an attempt to end the country’s multi-year deflation.
As of November 1, 2011, the ECB had a key rate of 1.50%, which it had increased from 1.0% in an attempt to keep inflation in check. Soon, in response to weakness in the southern European economies, the ECB lowered its key rate to 1.25% in early November 2011 and 1.0% in December 2011. The ECB also continued to provide virtually unlimited liquidity for banks, announcing a Long-Term Refinancing Operation in December through which it provided low-cost three-year loans to lenders.
We use time-tested investment strategies, even as many variables are at work in the market.
Elevated unemployment and debt defaults continue to pressure consumers and businesses alike. In our experience, strict adherence to time-tested investment strategies has its rewards. As a whole, Wells Fargo Advantage Funds represents investments across a range of asset classes and investment styles, giving you an opportunity to create a diversified investment portfolio. While diversification may not prevent losses in a downturn, we believe it helps in managing risk.
Thank you for choosing to invest with Wells Fargo Advantage Funds. We appreciate your confidence in us and remain committed to helping you meet your financial needs. For current information about your fund investments, contact your investment professional, visit our Web site at wellsfargoadvantagefunds.com, or call us directly at 1-800-222-8222.We are available 24 hours a day, 7 days a week.
Sincerely,

Karla M. Rabusch
President
Wells Fargo Advantage Funds
| | | | |
| 4 | | Wells Fargo Advantage Global Opportunities Fund | | Performance Highlights (Unaudited) |
INVESTMENT OBJECTIVE
The Fund seeks long-term capital appreciation.
ADVISER
Wells Fargo Funds Management, LLC
SUB-ADVISER
Wells Capital Management Incorporated
PORTFOLIO MANAGERS
Oleg Makhorine2
James M. Tringas, CFA
FUND INCEPTION
March 16, 1988
| | | | |
TEN LARGEST EQUITY HOLDINGS1 (AS OF APRIL 30, 2012) | | | |
Isuzu Motors Limited | | | 1.75% | |
Lancashire Holdings Limited | | | 1.50% | |
Acergy SA | | | 1.48% | |
Ashtead Group plc | | | 1.44% | |
Bovis Homes Group plc | | | 1.36% | |
Telenet Group Holding NV | | | 1.30% | |
Arch Capital Group Limited | | | 1.29% | |
Nutreco Holding NV | | | 1.27% | |
Royal Gold Incorporated | | | 1.27% | |
Teleperformance SA | | | 1.27% | |
| | |
SECTOR DISTRIBUTION3 (AS OF APRIL 30, 2012) | | |
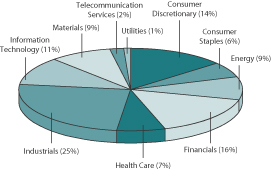 |
| 1. | The ten largest equity holdings are calculated based on the value of the securities divided by total net assets of the Fund. Holdings are subject to change and may have changed since the date specified. |
| 2. | Effective June 15, 2012, Oleg Makhorine became co-portfolio manager of the Fund. |
| 3. | Sector distribution is subject to change and is calculated based on the total long-term investments of the Fund. |
| | | | | | |
| Performance Highlights (Unaudited) | | Wells Fargo Advantage Global Opportunities Fund | | | 5 | |
AVERAGE ANNUAL TOTAL RETURN4 (%) (AS OF APRIL 30, 2012)
| | | | | | | | | | | | | | | | | | | | | | | | | | | | | | | | | | | | | | | | | | | | |
| | | | | | Including Sales Charge | | | Excluding Sales Charge | | | Expense Ratios5 | |
| | | Inception Date | | | 6 Months* | | | 1 Year | | | 5 Year | | | 10 Year | | | 6 Months* | | | 1 Year | | | 5 Year | | | 10 Year | | | Gross | | | Net6 | |
Class A (EKGAX) | | | 03/16/1988 | | | | 2.65 | | | | (18.41 | ) | | | (1.45 | ) | | | 8.65 | | | | 8.92 | | | | (13.43 | ) | | | (0.28 | ) | | | 9.29 | | | | 1.56% | | | | 1.56% | |
Class B (EKGBX)** | | | 02/01/1993 | | | | 3.52 | | | | (18.35 | ) | | | (1.40 | ) | | | 8.73 | | | | 8.52 | | | | (14.05 | ) | | | (1.02 | ) | | | 8.73 | | | | 2.31% | | | | 2.31% | |
Class C (EKGCX) | | | 02/01/1993 | | | | 7.51 | | | | (15.07 | ) | | | (1.02 | ) | | | 8.49 | | | | 8.51 | | | | (14.07 | ) | | | (1.02 | ) | | | 8.49 | | | | 2.31% | | | | 2.31% | |
Administrator Class (EKGYX) | | | 01/13/1997 | | | | | | | | | | | | | | | | | | | | 9.02 | | | | (13.29 | ) | | | (0.05 | ) | | | 9.57 | | | | 1.40% | | | | 1.40% | |
Institutional Class (EKGIX) | | | 07/30/2010 | | | | | | | | | | | | | | | | | | | | 9.15 | | | | (13.05 | ) | | | 0.05 | | | | 9.62 | | | | 1.13% | | | | 1.13% | |
S&P Developed SmallCap Index7 | | | | | | | | | | | | | | | | | | | | | | | 8.17 | | | | (7.40 | ) | | | (0.63 | ) | | | 8.52 | | | | | | | | | |
| * | Returns for periods of less than one year are not annualized. |
| ** | Class B shares are closed to investment, except in connection with the reinvestment of any distributions and permitted exchanges. |
Figures quoted represent past performance, which is no guarantee of future results and do not reflect the deduction of taxes that a shareholder may pay on fund distributions or the redemption of fund shares. Investment return and principal value of an investment will fluctuate so that an investor’s shares, when redeemed, may be worth more or less than their original cost. Performance shown without sales charges would be lower if sales charges were reflected. Current performance may be lower or higher than the performance data quoted and assumes the reinvestment of dividends and capital gains. Current month-end performance is available on the Fund’s Web site – wellsfargoadvantagefunds.com.
Index returns do not include transaction costs associated with buying and selling securities, any mutual fund fees or expenses or any taxes. It is not possible to invest directly in an index.
For Class A shares, the maximum front-end sales charge is 5.75%. For Class B shares, the maximum contingent deferred sales charge is 5.00%. For Class C shares, the maximum contingent deferred sales charge is 1.00%. Performance including sales charge assumes the sales charge for the corresponding time period. Administrator Class and Institutional Class shares are sold without a front-end sales charge or contingent deferred sales charge.
Stock fund values fluctuate in response to the activities of individual companies and general market and economic conditions. Foreign investments are especially volatile and can rise or fall dramatically due to differences in the political and economic conditions of the host country. These risks are generally intensified in emerging markets. The use of derivatives may reduce returns and/or increase volatility. Certain investment strategies tend to increase the total risk of an investment (relative to the broader market). This Fund is exposed to country concentration risk, regional risk and smaller-company securities risk. Consult the Fund’s prospectus for additional information on these and other risks.
| 4. | Historical performance shown for the Institutional Class shares prior to their inception reflects the performance of the Administrator Class shares, and includes the higher expenses applicable to the Administrator Class shares. If these expenses had not been included, returns would be higher. Historical performance shown for all classes of the Fund prior to July 19, 2010 is based on the performance of the Fund’s predecessor, Evergreen Global Opportunities Fund. |
| 5. | Reflects the expense ratios as stated in the most recent prospectuses. |
| 6. | The Adviser has committed through July 18, 2013 to waive fees and/or reimburse expenses to the extent necessary to cap the Fund’s Total Annual Fund Operating Expenses After Fee Waiver, excluding certain expenses, at 1.55% for Class A, 2.30% for Class B, 2.30% for Class C, 1.40% for Administrator Class and 1.15% for Institutional Class. Without this cap, the Fund’s returns would have been lower. |
| 7. | The S&P Developed SmallCap Index is a float-adjusted market capitalization index designed to measure the equity market performance of small capitalization companies located in developed markets. The index is comprised of companies within the bottom 15% of the cumulative market capitalization in developed markets. The index covers all publicly listed equities with float-adjusted market values of U.S. $100 million or more and annual dollar value traded of at least U.S. $50 million in all included countries. You cannot invest directly in an index. |
| | | | |
| 6 | | Wells Fargo Advantage Global Opportunities Fund | | Fund Expenses (Unaudited) |
As a shareholder of the Fund, you incur two types of costs: (1) transaction costs, including sales charges (loads) on purchase payments and contingent deferred sales charges (if any) on redemptions and (2) ongoing costs, including management fees; distribution (12b-1) and/or shareholder service fees; and other Fund expenses. This example is intended to help you understand your ongoing costs (in dollars) of investing in the Fund and to compare these costs with the ongoing costs of investing in other mutual funds.
The example is based on an investment of $1,000 invested at the beginning of the six-month period and held for the entire period from November 1, 2011 to April 30, 2012.
Actual Expenses
The “Actual” line of the table below provides information about actual account values and actual expenses. You may use the information in this line, together with the amount you invested, to estimate the expenses that you paid over the period. Simply divide your account value by $1,000 (for example, an $8,600 account value divided by $1,000 = 8.6), then multiply the result by the number in the “Actual” line under the heading entitled “Expenses Paid During Period” for your applicable class of shares to estimate the expenses you paid on your account during this period.
Hypothetical Example for Comparison Purposes
The “Hypothetical” line of the table below provides information about hypothetical account values and hypothetical expenses based on the Fund’s actual expense ratio and an assumed rate of return of 5% per year before expenses, which is not the Fund’s actual return. The hypothetical account values and expenses may not be used to estimate the actual ending account balance or expenses you paid for the period. You may use this information to compare the ongoing costs of investing in the Fund and other funds. To do so, compare this 5% hypothetical example with the 5% hypothetical examples that appear in the shareholder reports of the other funds.
Please note that the expenses shown in the table are meant to highlight your ongoing costs only and do not reflect any transactional costs, such as sales charges (loads) and contingent deferred sales charges. Therefore, the “Hypothetical” line of the table is useful in comparing ongoing costs only, and will not help you determine the relative total costs of owning different funds. In addition, if these transactional costs were included, your costs would have been higher.
| | | | | | | | | | | | | | | | |
| | | Beginning
Account Value
11-01-2011 | | | Ending
Account Value
04-30-2012 | | | Expenses
Paid During
the Period1 | | | Net Annual
Expense Ratio | |
Class A | | | | | | | | | | | | | | | | |
Actual | | $ | 1,000.00 | | | $ | 1,089.15 | | | $ | 8.00 | | | | 1.54 | % |
Hypothetical (5% return before expenses) | | $ | 1,000.00 | | | $ | 1,017.21 | | | $ | 7.72 | | | | 1.54 | % |
Class B | | | | | | | | | | | | | | | | |
Actual | | $ | 1,000.00 | | | $ | 1,085.19 | | | $ | 11.87 | | | | 2.29 | % |
Hypothetical (5% return before expenses) | | $ | 1,000.00 | | | $ | 1,013.48 | | | $ | 11.46 | | | | 2.29 | % |
Class C | | | | | | | | | | | | | | | | |
Actual | | $ | 1,000.00 | | | $ | 1,085.14 | | | $ | 11.87 | | | | 2.29 | % |
Hypothetical (5% return before expenses) | | $ | 1,000.00 | | | $ | 1,013.48 | | | $ | 11.46 | | | | 2.29 | % |
Administrator Class | | | | | | | | | | | | | | | | |
Actual | | $ | 1,000.00 | | | $ | 1,090.19 | | | $ | 7.12 | | | | 1.37 | % |
Hypothetical (5% return before expenses) | | $ | 1,000.00 | | | $ | 1,018.05 | | | $ | 6.87 | | | | 1.37 | % |
Institutional Class | | | | | | | | | | | | | | | | |
Actual | | $ | 1,000.00 | | | $ | 1,091.49 | | | $ | 5.77 | | | | 1.11 | % |
Hypothetical (5% return before expenses) | | $ | 1,000.00 | | | $ | 1,019.34 | | | $ | 5.57 | | | | 1.11 | % |
| 1. | Expenses paid is equal to the annualized expense ratio of each class multiplied by the average account value over the period, multiplied by the number of days in the most recent fiscal half-year divided by the number of days in the fiscal year (to reflect the one-half year period). |
| | | | | | |
| Portfolio of Investments—April 30, 2012 (Unaudited) | | Wells Fargo Advantage Global Opportunities Fund | | | 7 | |
| | | | | | | | | | | | |
| Security Name | | | | | | Shares | | | Value | |
| | | | | | | | | | | | |
| | | |
Common Stocks: 93.44% | | | | | | | | | | |
| | | |
| Argentina: 0.56% | | | | | | | | | | |
IRSA Inversiones y Representaciones SA ADR (Financials, Real Estate Management & Development) | | | | | | | 204,529 | | | $ | 1,611,689 | |
| | | | | | | | | | | | |
| | | |
| Australia: 0.54% | | | | | | | | | | |
CGA Mining Limited (Materials, Metals & Mining) † | | | | | | | 706,274 | | | | 1,537,166 | |
| | | | | | | | | | | | |
| | | |
| Austria: 0.30% | | | | | | | | | | |
RHI AG (Materials, Construction Materials) « | | | | | | | 32,179 | | | | 847,222 | |
| | | | | | | | | | | | |
| | | |
| Belgium: 1.30% | | | | | | | | | | |
Telenet Group Holding NV (Telecommunication Services, Diversified Telecommunication Services) | | | | | | | 87,216 | | | | 3,741,088 | |
| | | | | | | | | | | | |
| | | |
| Bermuda: 6.73% | | | | | | | | | | |
Arch Capital Group Limited (Financials, Insurance) † | | | | | | | 94,000 | | | | 3,692,320 | |
Catlin Group Limited (Financials, Insurance) | | | | | | | 467,338 | | | | 3,200,628 | |
Hiscox Limited (Financials, Insurance) | | | | | | | 505,888 | | | | 3,270,886 | |
Hoegh LNG Holdings Limited (Industrials, Marine) † | | | | | | | 219,378 | | | | 1,767,153 | |
Lancashire Holdings Limited (Financials, Insurance) | | | | | | | 329,009 | | | | 4,298,286 | |
Validus Holdings Limited (Financials, Insurance) | | | | | | | 94,839 | | | | 3,082,268 | |
| | | | |
| | | | | | | | | | | 19,311,541 | |
| | | | | | | | | | | | |
| | | |
| Canada: 5.95% | | | | | | | | | | |
Agrium Incorporated (Materials, Chemicals) | | | | | | | 23,043 | | | | 2,025,480 | |
Alamos Gold Incorporated (Materials, Metals & Mining) | | | | | | | 188,714 | | | | 3,453,914 | |
Aurizon Mines Limited (Materials, Metals & Mining) † | | | | | | | 242,437 | | | | 1,310,537 | |
IAMGOLD Corporation (Materials, Metals & Mining) | | | | | | | 80,000 | | | | 992,000 | |
Inmet Mining Corporation (Materials, Metals & Mining) | | | | | | | 36,583 | | | | 2,012,371 | |
MBAC Fertilizer Corporation (Materials, Chemicals) † | | | | | | | 254,687 | | | | 757,989 | |
Mercator Minerals Limited (Materials, Metals & Mining) † | | | | | | | 664,522 | | | | 800,507 | |
Parex Resources Incorporated (Energy, Oil, Gas & Consumable Fuels) † | | | | | | | 288,016 | | | | 1,577,331 | |
Surge Energy Incorporated (Energy, Oil, Gas & Consumable Fuels) † | | | | | | | 180,555 | | | | 1,610,254 | |
Ultra Petroleum Corporation (Energy, Oil, Gas & Consumable Fuels) † | | | | | | | 127,700 | | | | 2,523,352 | |
| | | | |
| | | | | | | | | | | 17,063,735 | |
| | | | | | | | | | | | |
| | | |
| China: 3.05% | | | | | | | | | | |
51job Incorporated ADR (Industrials, Commercial Services & Supplies) †« | | | | | | | 52,505 | | | | 3,188,104 | |
Kingdee International Software Group Company Limited (Information Technology, Software) « | | | | | | | 3,102,000 | | | | 691,674 | |
SINA Corporation (Information Technology, Internet Software & Services) †« | | | | | | | 28,811 | | | | 1,685,732 | |
Sinotrans Limited (Industrials, Air Freight & Logistics) | | | | | | | 4,026,000 | | | | 684,954 | |
VanceInfo Technologies Incorporated (Information Technology, Software) †« | | | | | | | 191,891 | | | | 2,484,988 | |
| | | | |
| | | | | | | | | | | 8,735,452 | |
| | | | | | | | | | | | |
| | | |
| Finland: 0.26% | | | | | | | | | | |
Outotec Oyj (Industrials, Construction & Engineering) | | | | | | | 13,739 | | | | 738,365 | |
| | | | | | | | | | | | |
| | | |
| France: 5.74% | | | | | | | | | | |
Alten Limited (Information Technology, IT Services) | | | | | | | 30,376 | | | | 881,777 | |
Atos Origin SA (Information Technology, IT Services) | | | | | | | 34,107 | | | | 2,196,649 | |
Establissements Maurel et Prom (Energy, Oil, Gas & Consumable Fuels) | | | | | | | 55,857 | | | | 929,400 | |
The accompanying notes are an integral part of these financial statements.
| | | | |
| 8 | | Wells Fargo Advantage Global Opportunities Fund | | Portfolio of Investments—April 30, 2012 (Unaudited) |
| | | | | | | | | | | | |
| Security Name | | | | | | Shares | | | Value | |
| | | | | | | | | | | | |
| | | |
| France (continued) | | | | | | | | | | |
Eurofins Scientific (Health Care, Life Sciences Tools & Services) | | | | | | | 20,118 | | | $ | 2,377,012 | |
Laurent Perrier Group (Consumer Staples, Beverages) | | | | | | | 14,413 | | | | 1,454,544 | |
Mersen (Industrials, Electrical Equipment) | | | | | | | 43,515 | | | | 1,441,173 | |
Scor SE (Financials, Insurance) | | | | | | | 134,633 | | | | 3,559,820 | |
Teleperformance SA (Industrials, Commercial Services & Supplies) | | | | | | | 135,018 | | | | 3,629,872 | |
| | | | |
| | | | | | | | | | | 16,470,247 | |
| | | | | | | | | | | | |
| | | |
| Germany: 1.38% | | | | | | | | | | |
Amadeus Fire AG (Industrials, Commercial Services & Supplies) | | | | | | | 37,784 | | | | 1,889,555 | |
Hochtief AG (Industrials, Construction & Engineering) | | | | | | | 29,141 | | | | 1,708,440 | |
Kloeckner & Company SE (Industrials, Trading Companies & Distributors) | | | | | | | 26,876 | | | | 364,652 | |
| | | | |
| | | | | | | | | | | 3,962,647 | |
| | | | | | | | | | | | |
| | | |
| Hong Kong: 1.03% | | | | | | | | | | |
China High Precision Automation Group (Industrials, Machinery) (a)(i) | | | | | | | 3,896,000 | | | | 692,966 | |
Emperor Watch & Jewellery Limited (Consumer Discretionary, Specialty Retail) | | | | | | | 5,690,000 | | | | 806,713 | |
Shangri-La Asia Limited (Consumer Discretionary, Hotels, Restaurants & Leisure) | | | | | | | 187,900 | | | | 399,115 | |
Techtronic Industries Company Limited (Consumer Discretionary, Household Durables) | | | | | | | 875,000 | | | | 1,056,724 | |
| | | | |
| | | | | | | | | | | 2,955,518 | |
| | | | | | | | | | | | |
| | | |
| Ireland: 0.38% | | | | | | | | | | |
CPL Resources plc (Industrials, Commercial Services & Supplies) | | | | | | | 269,587 | | | | 1,084,831 | |
| | | | | | | | | | | | |
| | | |
| Israel: 0.65% | | | | | | | | | | |
Bezeq the Israeli Telecom CP (Telecommunication Services, Diversified Telecommunication Services) | | | | | | | 1,118,590 | | | | 1,871,869 | |
| | | | | | | | | | | | |
| | | |
| Italy: 1.26% | | | | | | | | | | |
Davide Campari Milano SpA (Consumer Staples, Beverages) | | | | | | | 271,597 | | | | 1,919,800 | |
Tod’s SpA (Consumer Discretionary, Textiles, Apparel & Luxury Goods) | | | | | | | 14,638 | | | | 1,685,740 | |
| | | | |
| | | | | | | | | | | 3,605,540 | |
| | | | | | | | | | | | |
| | | |
| Japan: 4.15% | | | | | | | | | | |
Amada Company Limited (Industrials, Machinery) | | | | | | | 133,000 | | | | 909,544 | |
Isuzu Motors Limited (Consumer Discretionary, Automobiles) | | | | | | | 874,000 | | | | 5,024,624 | |
JFE Holdings Incorporated (Materials, Metals & Mining) | | | | | | | 57,100 | | | | 1,080,638 | |
Makita Corporation (Industrials, Machinery) | | | | | | | 17,900 | | | | 692,773 | |
Sumitomo Heavy Industries Limited (Industrials, Machinery) | | | | | | | 273,000 | | | | 1,415,606 | |
TDK Corporation (Information Technology, Electronic Equipment, Instruments & Components) | | | | | | | 27,300 | | | | 1,442,961 | |
Toshiba Machine Company Limited (Industrials, Machinery) | | | | | | | 245,263 | | | | 1,342,434 | |
| | | | |
| | | | | | | | | | | 11,908,580 | |
| | | | | | | | | | | | |
| | | |
| Luxembourg: 1.48% | | | | | | | | | | |
Acergy SA (Energy, Energy Equipment & Services) † | | | | | | | 163,976 | | | | 4,249,144 | |
| | | | | | | | | | | | |
| | | |
| Netherlands: 2.65% | | | | | | | | | | |
Nielsen Holdings NV (Industrials, Professional Services) † | | | | | | | 63,842 | | | | 1,865,463 | |
Nutreco Holding NV (Consumer Staples, Food Products) | | | | | | | 50,205 | | | | 3,648,455 | |
USG People NV (Industrials, Commercial Services & Supplies) | | | | | | | 219,260 | | | | 2,071,114 | |
| | | | |
| | | | | | | | | | | 7,585,032 | |
| | | | | | | | | | | | |
The accompanying notes are an integral part of these financial statements.
| | | | | | |
| Portfolio of Investments—April 30, 2012 (Unaudited) | | Wells Fargo Advantage Global Opportunities Fund | | | 9 | |
| | | | | | | | | | | | |
| Security Name | | | | | | Shares | | | Value | |
| | | | | | | | | | | | |
| | | |
| Norway: 1.10% | | | | | | | | | | |
Ocean Rig UDW Incorporated (Energy, Energy Equipment & Services) † | | | | | | | 77,272 | | | $ | 1,346,851 | |
TGS Nopec Geophysical Company ASA (Energy, Energy Equipment & Services) | | | | | | | 62,617 | | | | 1,809,705 | |
| | | | |
| | | | | | | | | | | 3,156,556 | |
| | | | | | | | | | | | |
| | | |
| Russia: 0.67% | | | | | | | | | | |
Sollers OJSC (Consumer Discretionary, Automobiles) †(a) | | | | | | | 115,644 | | | | 1,919,263 | |
| | | | | | | | | | | | |
| | | |
| Sweden: 0.39% | | | | | | | | | | |
Meda AB Class A (Health Care, Pharmaceuticals) | | | | | | | 113,409 | | | | 1,121,216 | |
| | | | | | | | | | | | |
| | | |
| Switzerland: 2.37% | | | | | | | | | | |
Barry Callebaut AG (Consumer Staples, Food Products) | | | | | | | 2,805 | | | | 2,699,463 | |
Julius Baer Group Limited (Financials, Capital Markets) | | | | | | | 59,354 | | | | 2,272,408 | |
Wolseley plc (Industrials, Trading Companies & Distributors) | | | | | | | 48,252 | | | | 1,834,760 | |
| | | | |
| | | | | | | | | | | 6,806,631 | |
| | | | | | | | | | | | |
| | | |
| Taiwan: 0.70% | | | | | | | | | | |
104 Corporation (Industrials, Commercial Services & Supplies) | | | | | | | 304,000 | | | | 843,042 | |
Catcher Technology Company Limited (Information Technology, Computers & Peripherals) | | | | | | | 181,000 | | | | 1,158,807 | |
| | | | |
| | | | | | | | | | | 2,001,849 | |
| | | | | | | | | | | | |
| | | |
| United Kingdom: 14.61% | | | | | | | | | | |
Aberdeen Asset Management plc (Financials, Capital Markets) | | | | | | | 339,744 | | | | 1,563,135 | |
Afren plc (Energy, Oil, Gas & Consumable Fuels) † | | | | | | | 566,950 | | | | 1,237,539 | |
Ashmore Group plc (Financials, Capital Markets) | | | | | | | 130,472 | | | | 810,129 | |
Ashtead Group plc (Industrials, Trading Companies & Distributors) | | | | | | | 1,020,367 | | | | 4,115,044 | |
Babcock International Group plc (Industrials, Commercial Services & Supplies) | | | | | | | 145,985 | | | | 1,968,797 | |
Bovis Homes Group plc (Consumer Discretionary, Household Durables) | | | | | | | 520,813 | | | | 3,908,331 | |
Britvic plc (Consumer Staples, Beverages) | | | | | | | 372,162 | | | | 2,308,418 | |
Capita Group plc (Industrials, Commercial Services & Supplies) | | | | | | | 156,342 | | | | 1,682,213 | |
Debenhams plc (Consumer Discretionary, Multiline Retail) | | | | | | | 1,497,758 | | | | 2,007,767 | |
Hays plc (Industrials, Commercial Services & Supplies) | | | | | | | 2,170,030 | | | | 3,144,915 | |
InterContinental Hotels Group plc (Consumer Discretionary, Hotels, Restaurants & Leisure) | | | | | | | 82,801 | | | | 1,971,321 | |
Mitie Group plc (Industrials, Commercial Services & Supplies) | | | | | | | 585,817 | | | | 2,773,257 | |
N. Brown Group plc (Consumer Discretionary, Internet & Catalog Retail) | | | | | | | 286,871 | | | | 1,067,070 | |
Perform Group plc (Consumer Discretionary, Media) † | | | | | | | 188,599 | | | | 933,536 | |
Persimmon plc (Consumer Discretionary, Household Durables) | | | | | | | 268,800 | | | | 2,741,740 | |
Savills plc (Financials, Real Estate Management & Development) | | | | | | | 386,750 | | | | 2,244,500 | |
SIG plc (Industrials, Trading Companies & Distributors) | | | | | | | 531,821 | | | | 908,836 | |
Taylor Woodrow plc (Consumer Discretionary, Household Durables) | | | | | | | 4,320,494 | | | | 3,523,394 | |
Travis Perkins plc (Industrials, Trading Companies & Distributors) | | | | | | | 175,862 | | | | 2,996,767 | |
| | | | |
| | | | | | | | | | | 41,906,709 | |
| | | | | | | | | | | | |
| | | |
| United States: 36.19% | | | | | | | | | | |
A. Schulman Incorporated (Materials, Chemicals) | | | | | | | 71,911 | | | | 1,769,730 | |
ACI Worldwide Incorporated (Information Technology, Software) † | | | | | | | 67,600 | | | | 2,694,536 | |
Allegheny Technologies Incorporated (Materials, Metals & Mining) | | | | | | | 58,400 | | | | 2,507,696 | |
Allete Incorporated (Utilities, Electric Utilities) « | | | | | | | 80,300 | | | | 3,309,163 | |
ATMI Incorporated (Information Technology, Semiconductors & Semiconductor Equipment) †« | | | | | | | 126,500 | | | | 2,657,765 | |
Avery Dennison Corporation (Industrials, Commercial Services & Supplies) | | | | | | | 74,600 | | | | 2,385,708 | |
Bill Barrett Corporation (Energy, Oil, Gas & Consumable Fuels) † | | | | | | | 96,500 | | | | 2,314,070 | |
The accompanying notes are an integral part of these financial statements.
| | | | |
| 10 | | Wells Fargo Advantage Global Opportunities Fund | | Portfolio of Investments—April 30, 2012 (Unaudited) |
| | | | | | | | | | | | | | |
| Security Name | | | | | | | Shares | | | Value | |
| | | | | | | | | | | | | | |
| | | |
| United States (continued) | | | | | | | | | | | | |
Broadridge Financial Solutions Incorporated (Information Technology, IT Services) | | | | | | | | | 106,036 | | | $ | 2,461,096 | |
Brown & Brown Incorporated (Financials, Insurance) | | | | | | | | | 131,200 | | | | 3,538,464 | |
CareFusion Corporation (Health Care, Health Care Equipment & Supplies) † | | | | | | | | | 110,100 | | | | 2,852,691 | |
Cimarex Energy Company (Energy, Oil, Gas & Consumable Fuels) | | | | | | | | | 37,800 | | | | 2,612,358 | |
Comstock Resources Incorporated (Energy, Oil, Gas & Consumable Fuels) †« | | | | | | | | | 168,535 | | | | 2,961,160 | |
EMCOR Group Incorporated (Industrials, Construction & Engineering) | | | | | | | | | 84,300 | | | | 2,471,676 | |
Fidelity National Financial Incorporated (Financials, Insurance) | | | | | | | | | 139,400 | | | | 2,686,238 | |
First Citizens Bancshares Incorporated Class A (Financials, Commercial Banks) | | | | | | | | | 16,327 | | | | 2,829,469 | |
First Niagara Financial Group Incorporated (Financials, Thrifts & Mortgage Finance) | | | | | | | | | 327,000 | | | | 2,923,380 | |
Gardner Denver Incorporated (Industrials, Machinery) | | | | | | | | | 28,400 | | | | 1,849,976 | |
GEO Group Incorporated (Industrials, Commercial Services & Supplies) †« | | | | | | | | | 92,200 | | | | 1,909,462 | |
Global Payments Incorporated (Information Technology, IT Services) | | | | | | | | | 59,000 | | | | 2,739,370 | |
GrafTech International Limited (Industrials, Electrical Equipment) † | | | | | | | | | 138,000 | | | | 1,620,120 | |
Guess Incorporated (Consumer Discretionary, Specialty Retail) « | | | | | | | | | 117,200 | | | | 3,431,616 | |
Haemonetics Corporation (Health Care, Health Care Equipment & Supplies) † | | | | | | | | | 47,300 | | | | 3,385,261 | |
Heidrick & Struggles International Incorporated (Industrials, Commercial Services & Supplies) | | | | | | | | | 84,787 | | | | 1,653,347 | |
IAC/InterActiveCorp (Information Technology, Internet Software & Services) | | | | | | | | | 59,400 | | | | 2,860,110 | |
Imation Corporation (Information Technology, Computers & Peripherals) † | | | | | | | | | 243,702 | | | | 1,413,472 | |
JDA Software Group Incorporated (Information Technology, Software) † | | | | | | | | | 48,300 | | | | 1,394,904 | |
Lear Corporation (Consumer Discretionary, Auto Components) | | | | | | | | | 75,500 | | | | 3,133,250 | |
Macquarie Infrastucture Company LLC (Industrials, Transportation Infrastructure) | | | | | | | | | 82,867 | | | | 2,862,226 | |
Manpower Incorporated (Industrials, Commercial Services & Supplies) | | | | | | | | | 34,000 | | | | 1,448,400 | |
Mohawk Industries Incorporated (Consumer Discretionary, Household Durables) † | | | | | | | | | 37,400 | | | | 2,506,548 | |
Mueller Industries Incorporated (Industrials, Machinery) | | | | | | | | | 21,600 | | | | 987,336 | |
Omnicare Incorporated (Health Care, Health Care Providers & Services) « | | | | | | | | | 68,100 | | | | 2,372,604 | |
Patterson Companies Incorporated (Health Care, Health Care Providers & Services) | | | | | | | | | 84,400 | | | | 2,877,196 | |
Quanex Building Products Corporation (Industrials, Building Products) | | | | | | | | | 91,624 | | | | 1,688,630 | |
Regal-Beloit Corporation (Industrials, Electrical Equipment) | | | | | | | | | 37,600 | | | | 2,543,264 | |
Riverbed Technology Incorporated (Information Technology, Communications Equipment)†« | | | | | | | | | 58,500 | | | | 1,154,205 | |
Royal Gold Incorporated (Materials, Metals & Mining) | | | | | | | | | 58,800 | | | | 3,643,248 | |
Salix Pharmaceuticals Limited (Health Care, Pharmaceuticals) † | | | | | | | | | 61,600 | | | | 3,043,040 | |
Silgan Holdings Incorporated (Materials, Containers & Packaging) | | | | | | | | | 55,000 | | | | 2,412,844 | |
TreeHouse Foods Incorporated (Consumer Staples, Food Products) †« | | | | | | | | | 53,300 | | | | 3,065,283 | |
Vishay Intertechnology Incorporated (Information Technology, Electronic Equipment, Instruments & Components) †« | | | | | | | | | 208,600 | | | | 2,340,492 | |
W.R. Berkley Corporation (Financials, Insurance) « | | | | | | | | | 65,300 | | | | 2,459,198 | |
| | | | |
| | | | | | | | | | | | | 103,770,602 | |
| | | | | | | | | | | | | | |
| | | |
Total Common Stocks (Cost $237,962,926) | | | | | | | | | | | 267,962,492 | |
| | | | | | | | | | | | | | |
| | | | |
| | | | | Yield | | | | | | | |
| Short-Term Investments: 14.92% | | | | | | | | | | | | | | |
| | | |
| Investment Companies: 14.92% | | | | | | | | | | | | |
Wells Fargo Advantage Cash Investment Money Market Fund, Select Class (l)(u) | | | | | 0.11 | % | | | 22,616,332 | | | | 22,616,332 | |
Wells Fargo Securities Lending Cash Investments, LLC (l)(u)(r)(v) | | | | | 0.19 | | | | 20,170,354 | | | | 20,170,354 | |
| | | |
Total Short-Term Investments (Cost $42,786,686) | | | | | | | | | | | 42,786,686 | |
| | | | | | | | | | | | | | |
| | | | | | | | |
| Total Investments in Securities | | | | | | | | |
| (Cost $280,749,612) * | | | 108.36 | % | | | 310,749,178 | |
Other Assets and Liabilities, Net | | | (8.36 | ) | | | (23,986,536 | ) |
| | | | | | | | |
Total Net Assets | | | 100.00 | % | | $ | 286,762,642 | |
| | | | | | | | |
The accompanying notes are an integral part of these financial statements.
| | | | | | |
| Portfolio of Investments—April 30, 2012 (Unaudited) | | Wells Fargo Advantage Global Opportunities Fund | | | 11 | |
| † | Non-income earning security |
| « | All or a portion of this security is on loan. |
| (a) | Security is fair valued by the Management Valuation Team, and in certain instances by the Board of Trustees, in accordance with procedures approved by the Board of Trustees. |
| (l) | Investment in an affiliate |
| (u) | Rate shown is the 7-day annualized yield at period end. |
| (r) | The investment company is exempt from registration under Section 3(c)(7) of the 1940 Act. |
| (v) | Security represents investment of cash collateral received from securities on loan. |
| * | Cost for federal income tax purposes is $283,629,107 and net unrealized appreciation (depreciation) consists of: |
| | | | |
Gross unrealized appreciation | | $ | 37,923,309 | |
Gross unrealized depreciation | | | (10,803,238 | ) |
| | | | |
Net unrealized appreciation | | $ | 27,120,071 | |
The accompanying notes are an integral part of these financial statements.
| | | | |
| 12 | | Wells Fargo Advantage Global Opportunities Fund | | Statement of Assets and Liabilities—April 30, 2012 (Unaudited) |
| | | | |
| | | | |
| |
Assets | | | | |
Investments | | | | |
In unaffiliated securities (including securities on loan), at value (see cost below) | | $ | 267,962,492 | |
In affiliated securities, at value (see cost below) | | | 42,786,686 | |
| | | | |
Total investments, at value (see cost below) | | | 310,749,178 | |
Foreign currency, at value (see cost below) | | | 1,958,933 | |
Receivable for investments sold | | | 692,133 | |
Receivable for Fund shares sold | | | 204,644 | |
Receivable for dividends | | | 456,122 | |
Receivable for securities lending income | | | 7,420 | |
Prepaid expenses and other assets | | | 59,855 | |
| | | | |
Total assets | | | 314,128,285 | |
| | | | |
| |
Liabilities | | | | |
Payable for investments purchased | | | 3,190,818 | |
Payable for Fund shares redeemed | | | 3,508,165 | |
Payable upon receipt of securities loaned | | | 20,170,354 | |
Advisory fee payable | | | 222,043 | |
Distribution fees payable | | | 43,087 | |
Due to other related parties | | | 69,345 | |
Accrued expenses and other liabilities | | | 161,831 | |
| | | | |
Total liabilities | | | 27,365,643 | |
| | | | |
Total net assets | | $ | 286,762,642 | |
| | | | |
| |
NET ASSETS CONSIST OF | | | | |
Paid-in capital | | $ | 296,700,461 | |
Undistributed net investment income | | | 259,678 | |
Accumulated net realized losses on investments | | | (40,253,964 | ) |
Net unrealized gains on investments | | | 30,056,467 | |
| | | | |
Total net assets | | $ | 286,762,642 | |
| | | | |
| |
COMPUTATION OF NET ASSET VALUE AND OFFERING PRICE PER SHARE1 | | | | |
Net assets – Class A | | $ | 168,813,825 | |
Shares outstanding – Class A | | | 5,150,245 | |
Net asset value per share – Class A | | | $32.78 | |
Maximum offering price per share – Class A2 | | | $34.78 | |
Net assets – Class B | | $ | 24,265,907 | |
Shares outstanding – Class B | | | 920,357 | |
Net asset value per share – Class B | | | $26.37 | |
Net assets – Class C | | $ | 42,588,043 | |
Shares outstanding – Class C | | | 1,606,646 | |
Net asset value per share – Class C | | | $26.51 | |
Net assets – Administrator Class | | $ | 48,830,174 | |
Shares outstanding – Administrator Class | | | 1,445,841 | |
Net asset value per share – Administrator Class | | | $33.77 | |
Net assets – Institutional Class | | $ | 2,264,693 | |
Shares outstanding – Institutional Class | | | 67,065 | |
Net asset value per share – Institutional Class | | | $33.77 | |
| |
Investments in unaffiliated securities, at cost | | $ | 237,962,926 | |
| | | | |
Investments in affiliated securities, at cost | | $ | 42,786,686 | |
| | | | |
Total investments, at cost | | $ | 280,749,612 | |
| | | | |
Securities on loan, at value | | $ | 19,598,806 | |
| | | | |
Foreign currency, at cost | | $ | 1,910,089 | |
| | | | |
| 1. | The Fund has an unlimited number of authorized shares. |
| 2. | Maximum offering price is computed as 100/94.25 of net asset value. On investments of $50,000 or more, the offering price is reduced. |
The accompanying notes are an integral part of these financial statements.
| | | | | | |
| Statement of Operations—Six Months Ended April 30, 2012 (Unaudited) | | Wells Fargo Advantage Global Opportunities Fund | | | 13 | |
| | | | |
| | | | |
| |
Investment income | | | | |
Dividends* | | $ | 2,432,249 | |
Securities lending income, net | | | 62,325 | |
Income from affiliated securities | | | 6,841 | |
| | | | |
Total investment income | | | 2,501,415 | |
| | | | |
| |
Expenses | | | | |
Advisory fee | | | 1,283,649 | |
Administration fees | | | | |
Fund level | | | 71,314 | |
Class A | | | 218,342 | |
Class B | | | 32,039 | |
Class C | | | 55,732 | |
Administrator Class | | | 24,028 | |
Institutional Class | | | 691 | |
Shareholder servicing fees | | | | |
Class A | | | 209,943 | |
Class B | | | 30,555 | |
Class C | | | 53,589 | |
Administrator Class | | | 57,283 | |
Distribution fees | | | | |
Class B | | | 92,419 | |
Class C | | | 160,766 | |
Custody and accounting fees | | | 23,881 | |
Professional fees | | | 21,844 | |
Registration fees | | | 45,455 | |
Shareholder report expenses | | | 17,387 | |
Trustees’ fees and expenses | | | 31 | |
Other fees and expenses | | | 6,547 | |
| | | | |
Total expenses | | | 2,405,495 | |
Less: Fee waivers and/or expense reimbursements | | | (17 | ) |
| | | | |
Net expenses | | | 2,405,478 | |
| | | | |
Net investment income | | | 95,937 | |
| | | | |
| |
REALIZED AND UNREALIZED GAINS (LOSSES) ON INVESTMENTS | | | | |
| |
Net realized gains (losses) on: | | | | |
Unaffiliated securities | | | 5,596,962 | |
Forward foreign currency contract transactions | | | (230 | ) |
| | | | |
Net realized gains on investments | | | 5,596,732 | |
| | | | |
| |
Net change in unrealized gains (losses) on: | | | | |
Unaffiliated securities | | | 18,199,559 | |
Forward foreign currency contract transactions | | | 164,994 | |
| | | | |
Net change in unrealized gains (losses) on investments | | | 18,364,553 | |
| | | | |
Net realized and unrealized gains (losses) on investments | | | 23,961,285 | |
| | | | |
Net increase in net assets resulting from operations | | $ | 24,057,222 | |
| | | | |
| |
* Net of foreign dividend withholding taxes of | | | $54,845 | |
The accompanying notes are an integral part of these financial statements.
| | | | |
| 14 | | Wells Fargo Advantage Global Opportunities Fund | | Statements of Changes in Net Assets |
| | | | | | | | | | | | | | | | |
| | | Six Months Ended
April 30, 2012
(Unaudited) | | | Year Ended
October 31, 2011 | |
| | | | |
Operations | | | | | | | | | | | | | | | | |
Net investment income | | | | | | $ | 95,937 | | | | | | | $ | 686,164 | |
Net realized gains on investments | | | | | | | 5,596,732 | | | | | | | | 39,808,272 | |
Net change in unrealized gains (losses) on investments | | | | | | | 18,364,553 | | | | | | | | (58,713,856 | ) |
| | | | |
Net increase (decrease) in net assets resulting from operations | | | | | | | 24,057,222 | | | | | | | | (18,219,420 | ) |
| | | | |
| | | | |
Distributions to shareholders from | | | | | | | | | | | | | | | | |
Net investment income | | | | | | | | | | | | | | | | |
Class A | | | | | | | (223,301 | ) | | | | | | | 0 | |
Administrator Class | | | | | | | (175,333 | ) | | | | | | | (68,005 | ) |
Institutional Class | | | | | | | (10,282 | ) | | | | | | | (26 | ) |
| | | | |
Total distributions to shareholders | | | | | | | (408,916 | ) | | | | | | | (68,031 | ) |
| | | | |
| | | | |
Capital share transactions | | | Shares | | | | | | | | Shares | | | | | |
Proceeds from shares sold | | | | | | | | | | | | | | | | |
Class A | | | 287,106 | | | | 8,856,397 | | | | 1,375,395 | | | | 47,370,715 | |
Class B | | | 3,053 | | | | 74,549 | | | | 26,624 | | | | 748,906 | |
Class C | | | 37,979 | | | | 943,975 | | | | 252,057 | | | | 7,135,138 | |
Administrator Class | | | 199,504 | | | | 6,447,153 | | | | 878,550 | | | | 30,834,391 | |
Institutional Class | | | 21,944 | | | | 719,149 | | | | 54,746 | | | | 1,972,439 | |
| | | | |
| | | | | | | 17,041,223 | | | | | | | | 88,061,589 | |
| | | | |
Reinvestment of distributions | | | | | | | | | | | | | | | | |
Class A | | | 7,230 | | | | 198,333 | | | | 0 | | | | 0 | |
Administrator Class | | | 5,762 | | | | 162,732 | | | | 1,774 | | | | 62,456 | |
Institutional Class | | | 365 | | | | 10,282 | | | | 1 | | | | 26 | |
| | | | |
| | | | | | | 371,347 | | | | | | | | 62,482 | |
| | | | |
Payment for shares redeemed | | | | | | | | | | | | | | | | |
Class A | | | (948,718 | ) | | | (29,258,050 | ) | | | (2,237,821 | ) | | | (74,815,502 | ) |
Class B | | | (177,391 | ) | | | (4,390,360 | ) | | | (388,603 | ) | | | (10,609,456 | ) |
Class C | | | (279,039 | ) | | | (6,971,265 | ) | | | (433,868 | ) | | | (11,865,654 | ) |
Administrator Class | | | (362,386 | ) | | | (11,603,243 | ) | | | (677,735 | ) | | | (23,736,764 | ) |
Institutional Class | | | (2,908 | ) | | | (91,352 | ) | | | (7,435 | ) | | | (257,087 | ) |
| | | | |
| | | | | | | (52,314,270 | ) | | | | | | | (121,284,463 | ) |
| | | | |
Net decrease in net assets resulting from capital share transactions | | | | | | | (34,901,700 | ) | | | | | | | (33,160,392 | ) |
| | | | |
Total decrease in net assets | | | | | | | (11,253,394 | ) | | | | | | | (51,447,843 | ) |
| | | | |
| | | | |
Net assets | | | | | | | | | | | | | | | | |
Beginning of period | | | | | | | 298,016,036 | | | | | | | | 349,463,879 | |
| | | | |
End of period | | | | | | $ | 286,762,642 | | | | | | | $ | 298,016,036 | |
| | | | |
Undistributed net investment income | | | | | | $ | 259,678 | | | | | | | $ | 572,657 | |
| | | | |
The accompanying notes are an integral part of these financial statements.
| | | | | | |
| Financial Highlights | | Wells Fargo Advantage Global Opportunities Fund | | | 15 | |
(For a share outstanding throughout each period)
| | | | | | | | | | | | | | | | | | | | | | | | |
| | | Six Months Ended
April 30, 2012 (Unaudited) | | | Year Ended October 31, | |
| Class A | | | 2011 | | | 20101 | | | 20091 | | | 20081 | | | 20071 | |
Net asset value, beginning of period | | $ | 30.14 | | | $ | 31.91 | | | $ | 24.96 | | | $ | 21.20 | | | $ | 40.22 | | | $ | 32.61 | |
Net investment income (loss) | | | 0.03 | 2 | | | 0.12 | 2 | | | 0.07 | 2 | | | 0.10 | 2 | | | 0.04 | 2 | | | (0.03 | )2 |
Net realized and unrealized gains (losses) on investments | | | 2.65 | | | | (1.89 | ) | | | 6.99 | | | | 3.74 | | | | (16.97 | ) | | | 10.16 | |
| | | | | | | | | | | | | | | | | | | | | | | | |
Total from investment operations | | | 2.68 | | | | (1.77 | ) | | | 7.06 | | | | 3.84 | | | | (16.93 | ) | | | 10.13 | |
Distributions to shareholders from | | | | | | | | | | | | | | | | | | | | | | | | |
Net investment income | | | (0.04 | ) | | | 0.00 | | | | (0.11 | ) | | | (0.08 | ) | | | 0.00 | | | | (0.04 | ) |
Net realized gains | | | 0.00 | | | | 0.00 | | | | 0.00 | | | | 0.00 | | | | (2.09 | ) | | | (2.48 | ) |
| | | | | | | | | | | | | | | | | | | | | | | | |
Total distributions to shareholders | | | (0.04 | ) | | | 0.00 | | | | (0.11 | ) | | | (0.08 | ) | | | (2.09 | ) | | | (2.52 | ) |
Net asset value, end of period | | $ | 32.78 | | | $ | 30.14 | | | $ | 31.91 | | | $ | 24.96 | | | $ | 21.20 | | | $ | 40.22 | |
Total return3 | | | 8.92 | % | | | (5.55 | )% | | | 28.41 | % | | | 18.22 | % | | | (44.14 | )% | | | 33.21 | % |
Ratios to average net assets (annualized) | | | | | | | | | | | | | | | | | | | | | | | | |
Gross expenses | | | 1.54 | % | | | 1.55 | % | | | 1.66 | % | | | 1.72 | % | | | 1.54 | % | | | 1.55 | % |
Net expenses | | | 1.54 | % | | | 1.53 | % | | | 1.63 | % | | | 1.72 | % | | | 1.52 | % | | | 1.53 | % |
Net investment income (loss) | | | 0.21 | % | | | 0.34 | % | | | 0.25 | % | | | 0.45 | % | | | 0.13 | % | | | (0.08 | )% |
Supplemental data | | | | | | | | | | | | | | | | | | | | | | | | |
Portfolio turnover rate | | | 32 | % | | | 76 | % | | | 104 | % | | | 170 | % | | | 161 | % | | | 71 | % |
Net assets, end of period (000’s omitted) | | | $168,814 | | | | $174,937 | | | | $212,729 | | | | $197,721 | | | | $214,883 | | | | $474,252 | |
| 1. | After the close of business on July 16, 2010, the Fund acquired the net assets of Evergreen Global Opportunities Fund which became the accounting and performance survivor in the transaction. The information for the periods prior to July 19, 2010 is that of Class A of Evergreen Global Opportunities Fund. |
| 2. | Calculated based upon average shares outstanding |
| 3. | Total return calculations do not include any sales charges. Returns for periods of less than one year are not annualized. |
The accompanying notes are an integral part of these financial statements.
| | | | |
| 16 | | Wells Fargo Advantage Global Opportunities Fund | | Financial Highlights |
(For a share outstanding throughout each period)
| | | | | | | | | | | | | | | | | | | | | | | | |
| | | Six Months Ended
April 30, 2012 (Unaudited) | | | Year Ended October 31, | |
| Class B | | | 2011 | | | 20101 | | | 20091 | | | 20081 | | | 20071 | |
Net asset value, beginning of period | | $ | 24.30 | | | $ | 25.92 | | | $ | 20.33 | | | $ | 17.34 | | | $ | 33.54 | | | $ | 27.73 | |
Net investment loss | | | (0.06 | )2 | | | (0.12 | )2 | | | (0.11 | )2 | | | (0.05 | )2 | | | (0.16 | )2 | | | (0.24 | ) |
Net realized and unrealized gains (losses) on investments | | | 2.13 | | | | (1.50 | ) | | | 5.70 | | | | 3.04 | | | | (13.95 | ) | | | 8.53 | |
| | | | | | | | | | | | | | | | | | | | | | | | |
Total from investment operations | | | 2.07 | | | | (1.62 | ) | | | 5.59 | | | | 2.99 | | | | (14.11 | ) | | | 8.29 | |
Distributions to shareholders from | | | | | | | | | | | | | | | | | | | | | | | | |
Net realized gains | | | 0.00 | | | | 0.00 | | | | 0.00 | | | | 0.00 | | | | (2.09 | ) | | | (2.48 | ) |
Net asset value, end of period | | $ | 26.37 | | | $ | 24.30 | | | $ | 25.92 | | | $ | 20.33 | | | $ | 17.34 | | | $ | 33.54 | |
Total return3 | | | 8.52 | % | | | (6.25 | )% | | | 27.43 | % | | | 17.30 | % | | | (44.54 | )% | | | 32.28 | % |
Ratios to average net assets (annualized) | | | | | | | | | | | | | | | | | | | | | | | | |
Gross expenses | | | 2.29 | % | | | 2.30 | % | | | 2.41 | % | | | 2.47 | % | | | 2.27 | % | | | 2.25 | % |
Net expenses | | | 2.29 | % | | | 2.28 | % | | | 2.38 | % | | | 2.47 | % | | | 2.27 | % | | | 2.25 | % |
Net investment loss | | | (0.53 | )% | | | (0.43 | )% | | | (0.49 | )% | | | (0.30 | )% | | | (0.62 | )% | | | (0.82 | )% |
Supplemental data | | | | | | | | | | | | | | | | | | | | | | | | |
Portfolio turnover rate | | | 32 | % | | | 76 | % | | | 104 | % | | | 170 | % | | | 161 | % | | | 71 | % |
Net assets, end of period (000’s omitted) | | | $24,266 | | | | $26,598 | | | | $37,752 | | | | $34,934 | | | | $39,980 | | | | $87,408 | |
| 1. | After the close of business on July 16, 2010, the Fund acquired the net assets of Evergreen Global Opportunities Fund which became the accounting and performance survivor in the transaction. The information for the periods prior to July 19, 2010 is that of Class B of Evergreen Global Opportunities Fund. |
| 2. | Calculated based upon average shares outstanding |
| 3. | Total return calculations do not include any sales charges. Returns for periods of less than one year are not annualized. |
The accompanying notes are an integral part of these financial statements.
| | | | | | |
| Financial Highlights | | Wells Fargo Advantage Global Opportunities Fund | | | 17 | |
(For a share outstanding throughout each period)
| | | | | | | | | | | | | | | | | | | | | | | | |
| | | Six Months Ended
April 30, 2012 (Unaudited) | | | Year Ended October 31, | |
| Class C | | | 2011 | | | 20101 | | | 20091 | | | 20081 | | | 20071 | |
Net asset value, beginning of period | | $ | 24.43 | | | $ | 26.05 | | | $ | 20.44 | | | $ | 17.44 | | | $ | 33.72 | | | $ | 27.86 | |
Net investment loss | | | (0.07 | )2 | | | (0.11 | )2 | | | (0.11 | )2 | | | (0.05 | )2 | | | (0.16 | )2 | | | (0.24 | )2 |
Net realized and unrealized gains (losses) on investments | | | 2.15 | | | | (1.51 | ) | | | 5.72 | | | | 3.05 | | | | (14.03 | ) | | | 8.58 | |
| | | | | | | | | | | | | | | | | | | | | | | | |
Total from investment operations | | | 2.08 | | | | (1.62 | ) | | | 5.61 | | | | 3.00 | | | | (14.19 | ) | | | 8.34 | |
Distributions to shareholders from | | | | | | | | | | | | | | | | | | | | | | | | |
Net realized gains | | | 0.00 | | | | 0.00 | | | | 0.00 | | | | 0.00 | | | | (2.09 | ) | | | (2.48 | ) |
Net asset value, end of period | | $ | 26.51 | | | $ | 24.43 | | | $ | 26.05 | | | $ | 20.44 | | | $ | 17.44 | | | $ | 33.72 | |
Total return3 | | | 8.51 | % | | | (6.25 | )% | | | 27.43 | % | | | 17.33 | % | | | (44.56 | )% | | | 32.28 | % |
Ratios to average net assets (annualized) | | | | | | | | | | | | | | | | | | | | | | | | |
Gross expenses | | | 2.29 | % | | | 2.30 | % | | | 2.41 | % | | | 2.47 | % | | | 2.27 | % | | | 2.25 | % |
Net expenses | | | 2.29 | % | | | 2.28 | % | | | 2.38 | % | | | 2.47 | % | | | 2.27 | % | | | 2.25 | % |
Net investment loss | | | (0.53 | )% | | | (0.41 | )% | | | (0.50 | )% | | | (0.30 | )% | | | (0.61 | )% | | | (0.81 | )% |
Supplemental data | | | | | | | | | | | | | | | | | | | | | | | | |
Portfolio turnover rate | | | 32 | % | | | 76 | % | | | 104 | % | | | 170 | % | | | 161 | % | | | 71 | % |
Net assets, end of period (000’s omitted) | | | $42,588 | | | | $45,135 | | | | $52,866 | | | | $50,218 | | | | $59,382 | | | | $124,831 | |
| 1. | After the close of business on July 16, 2010, the Fund acquired the net assets of Evergreen Global Opportunities Fund which became the accounting and performance survivor in the transaction. The information for the periods prior to July 19, 2010 is that of Class C of Evergreen Global Opportunities Fund. |
| 2. | Calculated based upon average shares outstanding |
| 3. | Total return calculations do not include any sales charges. Returns for periods of less than one year are not annualized. |
The accompanying notes are an integral part of these financial statements.
| | | | |
| 18 | | Wells Fargo Advantage Global Opportunities Fund | | Financial Highlights |
(For a share outstanding throughout each period)
| | | | | | | | | | | | | | | | | | | | | | | | |
| | | Six Months Ended
April 30, 2012
(Unaudited) | | | Year Ended October 31, | |
| Administrator Class | | | 2011 | | | 20101 | | | 20091 | | | 20081 | | | 20071 | |
Net asset value, beginning of period | | $ | 31.10 | | | $ | 32.92 | | | $ | 25.73 | | | $ | 21.91 | | | $ | 41.42 | | | $ | 33.46 | |
Net investment income | | | 0.06 | 2 | | | 0.15 | | | | 0.14 | 2 | | | 0.16 | | | | 0.15 | 2 | | | 0.07 | 2 |
Net realized and unrealized gains (losses) on investments | | | 2.72 | | | | (1.93 | ) | | | 7.23 | | | | 3.85 | | | | (17.57 | ) | | | 10.49 | |
| | | | | | | | | | | | | | | | | | | | | | | | |
Total from investment operations | | | 2.78 | | | | (1.78 | ) | | | 7.37 | | | | 4.01 | | | | (17.42 | ) | | | 10.56 | |
Distributions to shareholders from | | | | | | | | | | | | | | | | | | | | | | | | |
Net investment income | | | (0.11 | ) | | | (0.04 | ) | | | (0.18 | ) | | | (0.19 | ) | | | 0.00 | | | | (0.12 | ) |
Net realized gains | | | 0.00 | | | | 0.00 | | | | 0.00 | | | | 0.00 | | | | (2.09 | ) | | | (2.48 | ) |
| | | | | | | | | | | | | | | | | | | | | | | | |
Total distributions to shareholders | | | (0.11 | ) | | | (0.04 | ) | | | (0.18 | ) | | | (0.19 | ) | | | (2.09 | ) | | | (2.60 | ) |
Net asset value, end of period | | $ | 33.77 | | | $ | 31.10 | | | $ | 32.92 | | | $ | 25.73 | | | $ | 21.91 | | | $ | 41.42 | |
Total return3 | | | 9.02 | % | | | (5.39 | )% | | | 28.77 | % | | | 18.45 | % | | | (43.98 | )% | | | 33.57 | % |
Ratios to average net assets (annualized) | | | | | | | | | | | | | | | | | | | | | | | | |
Gross expenses | | | 1.37 | % | | | 1.37 | % | | | 1.43 | % | | | 1.47 | % | | | 1.28 | % | | | 1.25 | % |
Net expenses | | | 1.37 | % | | | 1.36 | % | | | 1.40 | % | | | 1.47 | % | | | 1.28 | % | | | 1.25 | % |
Net investment income | | | 0.38 | % | | | 0.53 | % | | | 0.49 | % | | | 0.69 | % | | | 0.46 | % | | | 0.20 | % |
Supplemental data | | | | | | | | | | | | | | | | | | | | | | | | |
Portfolio turnover rate | | | 32 | % | | | 76 | % | | | 104 | % | | | 170 | % | | | 161 | % | | | 71 | % |
Net assets, end of period (000’s omitted) | | | $48,830 | | | | $49,860 | | | | $46,106 | | | | $38,977 | | | | $36,027 | | | | $43,378 | |
| 1. | After the close of business on July 16, 2010, the Fund acquired the net assets of Evergreen Global Opportunities Fund which became the accounting and performance survivor in the transaction. The information for the periods prior to July 19, 2010 is that of Class I of Evergreen Global Opportunities Fund. |
| 2. | Calculated based upon average shares outstanding |
| 3. | Returns for periods of less than one year are not annualized. |
The accompanying notes are an integral part of these financial statements.
| | | | | | |
| Financial Highlights | | Wells Fargo Advantage Global Opportunities Fund | | | 19 | |
(For a share outstanding throughout each period)
| | | | | | | | | | | | |
| | | Six Months Ended
April 30, 2012
(Unaudited) | | | Year Ended October 31, | |
| Institutional Class | | | 2011 | | | 20101 | |
Net asset value, beginning of period | | $ | 31.18 | | | $ | 32.94 | | | $ | 28.37 | |
Net investment income | | | 0.09 | | | | 0.25 | | | | 0.04 | 2 |
Net realized and unrealized gains (losses) on investments | | | 2.72 | | | | (1.94 | ) | | | 4.53 | |
| | | | | | | | | | | | |
Total from investment operations | | | 2.81 | | | | (1.69 | ) | | | 4.57 | |
Distributions to shareholders from | | | | | | | | | | | | |
Net investment income | | | (0.22 | ) | | | (0.07 | ) | | | 0.00 | |
Net asset value, end of period | | $ | 33.77 | | | $ | 31.18 | | | $ | 32.94 | |
Total return3 | | | 9.15 | % | | | (5.15 | )% | | | 16.11 | % |
Ratios to average net assets (annualized) | | | | | | | | | | | | |
Gross expenses | | | 1.11 | % | | | 1.08 | % | | | 1.22 | % |
Net expenses | | | 1.11 | % | | | 1.08 | % | | | 1.15 | % |
Net investment income | | | 0.60 | % | | | 1.18 | % | | | 0.53 | % |
Supplemental data | | | | | | | | | | | | |
Portfolio turnover rate | | | 32 | % | | | 76 | % | | | 104 | % |
Net assets, end of period (000’s omitted) | | | $2,265 | | | | $1,486 | | | | $12 | |
| 1. | For the period from July 30, 2010 (commencement of class operations) to October 31, 2010. |
| 2. | Calculated based upon average shares outstanding |
| 3. | Returns for periods of less than one year are not annualized. |
The accompanying notes are an integral part of these financial statements.
| | | | |
| 20 | | Wells Fargo Advantage Global Opportunities Fund | | Notes to Financial Statements |
1. ORGANIZATION
Wells Fargo Funds Trust (the “Trust”), a Delaware statutory trust organized on March 10, 1999, is an open-end management investment company registered under the Investment Company Act of 1940, as amended (the “1940 Act”). These financial statements report on Wells Fargo Advantage Global Opportunities Fund (the “Fund”) which is a diversified series of the Trust.
2. SIGNIFICANT ACCOUNTING POLICIES
The following significant accounting policies, which are consistently followed in the preparation of the financial statements of the Fund, are in conformity with U.S. generally accepted accounting principles which require management to make estimates and assumptions that affect the reported amounts of assets and liabilities, disclosure of contingent assets and liabilities at the date of the financial statements, and the reported amounts of revenues and expenses during the reporting period. Actual results could differ from those estimates.
Securities valuation
Investments in equity securities are valued each business day as of the close of regular trading on the New York Stock Exchange, which is usually 4:00 p.m. (Eastern Time). Securities which are traded on a national or foreign securities exchange are valued at the last reported sales price, except that securities listed on The Nasdaq Stock Market, Inc. (“Nasdaq”) are valued at the Nasdaq Official Closing Price (“NOCP”), and if no NOCP is available, then at the last reported sales price. If no sales price is shown on the Nasdaq, the bid price will be used. In the absence of any sale of securities listed on the Nasdaq, and in the case of other securities (including U.S. Government obligations, but excluding debt securities maturing in 60 days or less), the price will be deemed “stale” and the valuations will be determined in accordance with the Fund’s Fair Value Procedures.
Securities denominated in foreign currencies are translated into U.S. dollars using the closing rates of exchange in effect on the day of valuation.
Many securities markets and exchanges outside the U.S. close prior to the close of the New York Stock Exchange and therefore may not fully reflect trading or events that occur after the close of the principal exchange in which the foreign securities are traded, but before the close of the New York Stock Exchange. If such trading or events are expected to materially affect the value of securities, then fair value pricing procedures approved by the Board of Trustees are applied. These procedures take into account multiple factors including movements in U.S. securities markets after foreign exchanges close. As a result of the fair value pricing procedures, these securities which are normally categorized as Level 1 in the fair value hierarchy will represent a transfer from a Level 1 to a Level 2 security and will be categorized as Level 2. Depending on market activity, such fair valuations may be frequent. Such fair value pricing may result in NAVs that are higher or lower than NAVs based on the closing price or latest quoted bid price. On April 30, 2012, fair value pricing was not used in pricing foreign securities.
Investments in open-end mutual funds and non-registered investment companies are generally valued at net asset value.
Investments which are not valued using any of the methods discussed above, are valued at their fair value, as determined by procedures established in good faith and approved by the Board of Trustees. The Board of Trustees has established a Valuation Committee comprised of the Trustees and has delegated to it the authority to take any actions regarding the valuation of portfolio securities that the Valuation Committee deems necessary to determining the fair value of portfolio securities, unless the responsibility has been delegated to the Management Valuation Team of Wells Fargo Funds Management, LLC (“Funds Management”). The Board of Trustees retains the authority to make or ratify any valuation decisions or approve any changes to the Fair Value Procedures as it deems appropriate. On a quarterly basis, the Board of Trustees considers for ratification any valuation actions taken by the Valuation Committee or the Management Valuation Team.
Valuations of fair valued prices are compared to the next actual sales price when available, or other appropriate market information to assess the continued appropriateness of the fair valuation methodology used. The securities are fair valued on a day-to-day basis, taking into consideration changes to appropriate market information and any significant changes to the input factors considered in the valuation process until there is a readily available price provided on the exchange or by an independent pricing service. Valuations received from an independent pricing service or broker quotes are periodically validated by comparisons to most recent trades and valuations provided by other independent
| | | | | | |
| Notes to Financial Statements | | Wells Fargo Advantage Global Opportunities Fund | | | 21 | |
pricing services in addition to the review of prices by the adviser and/or sub-adviser. Unobservable inputs used in determining fair valuations are identified based on the type of security, taking into consideration factors utilized by market participants in valuing the investment, knowledge about the issuer and the current market environment.
Foreign currency translation
The accounting records of the Fund are maintained in U.S. dollars. Assets, including investment securities, and liabilities denominated in foreign currency are translated into U.S. dollars at the prevailing rates of exchange at the date of valuation. Purchases and sales of securities, and income and expenses are translated at the prevailing rate of exchange on the respective dates of such transactions. Reported net realized foreign exchange gains or losses arise from sales of foreign currencies, currency gains or losses realized between the trade and settlement dates on securities transactions, and the difference between the amounts of dividends, interest and foreign withholding taxes recorded and the U.S. dollar equivalent of the amounts actually paid or received. Net unrealized foreign exchange gains and losses arise from changes in the fair value of assets and liabilities other than investments in securities resulting in changes in exchange rates.
The changes in net assets arising from changes in exchange rates and the changes in net assets resulting from changes in market prices of securities are not separately presented. Such changes are recorded with net realized and unrealized gains or losses from investments. Gains and losses from certain foreign currency transactions are treated as ordinary income for U.S. federal income tax purposes.
Forward foreign currency contracts
The Fund may be subject to foreign currency exchange rate risk in the normal course of pursuing its investment objectives. A forward foreign currency contract is an agreement between two parties to purchase or sell a specific currency for an agreed-upon price at a future date. The Fund enters into forward foreign currency contracts to facilitate transactions in foreign-denominated securities and to attempt to minimize the risk to the Fund from adverse changes in the relationship between currencies. Forward foreign currency contracts are recorded at the forward rate and marked-to-market daily. When the contracts are closed, realized gains and losses arising from such transactions are recorded as realized gains or losses on foreign currency related transactions. The Fund could be exposed to risks if the counterparties to the contracts are unable to meet the terms of their contracts or if the value of the foreign currency changes unfavorably. The Fund’s maximum risk of loss from counterparty credit risk is the unrealized gains or losses on the contracts. This risk is mitigated by having a master netting arrangement between the Fund and the counterparty.
Security loans
The Fund may lend its securities from time to time in order to earn additional income in the form of fees or interest on securities received as collateral or the investment of any cash received as collateral. The Fund continues to receive interest or dividends on the securities loaned. The Fund receives collateral in the form of cash or securities with a value at least equal to the value of the securities on loan. The value of the loaned securities is determined at the close of each business day and any additional required collateral is delivered to the Fund on the next business day. In a securities lending transaction, the net asset value of the Fund will be affected by an increase or decrease in the value of the securities loaned and by an increase or decrease in the value of the instrument in which collateral is invested. The amount of securities lending activity undertaken by the Fund fluctuates from time to time. In the event of default or bankruptcy by the borrower, the Fund may be prevented from recovering the loaned securities or gaining access to the collateral or may experience delays or costs in doing so. In addition, the investment of any cash collateral received may lose all or part of its value. The Fund has the right under the lending agreement to recover the securities from the borrower on demand.
The Fund lends its securities through an unaffiliated securities lending agent. Cash collateral received in connection with its securities lending transactions is invested in Wells Fargo Securities Lending Cash Investments, LLC (the “Cash Collateral Fund”). The Cash Collateral Fund is exempt from registration under Section 3(c)(7) of the 1940 Act and is managed by Funds Management and is sub-advised by Wells Capital Management Incorporated (“Wells Capital Management”). Funds Management receives an advisory fee starting at 0.05% and declining to 0.01% as the average daily net assets of the Cash Collateral Fund increase. All of the fees received by Funds Management are paid to Wells Capital Management for its services as sub-adviser. The Cash Collateral Fund seeks to provide a positive return compared to the daily Fed Funds Open rate by investing in high-quality, U.S. dollar-denominated short-term money market instruments. Cash Collateral Fund investments are fair valued based upon the amortized cost valuation technique. Income earned from investment in the Cash Collateral Fund is included in securities lending income on the Statement of Operations.
| | | | |
| 22 | | Wells Fargo Advantage Global Opportunities Fund | | Notes to Financial Statements |
Security transactions and income recognition
Securities transactions are recorded on a trade date basis. Realized gains or losses are reported on the basis of identified cost of securities delivered.
Dividend income is recognized on the ex-dividend date, except for certain dividends from foreign securities, which are recorded as soon as the Fund is informed of the ex-dividend date. Dividend income from foreign securities is recorded net of foreign taxes withheld where recovery of such taxes is not assured.
Distributions to shareholders
Distributions to shareholders from net investment income and net realized gains, if any, are recorded on the ex-dividend date. Such distributions are determined in conformity with income tax regulations, which may differ from generally accepted accounting principles.
Federal and other taxes
The Fund intends to continue to qualify as a regulated investment company by distributing substantially all of its investment company taxable income and any net realized capital gains (after reduction for capital loss carryforwards) sufficient to relieve it from all, or substantially all, federal income taxes. Accordingly, no provision for federal income taxes was required.
The Fund’s income and federal excise tax returns and all financial records supporting those returns for the prior three fiscal years are subject to examination by the federal and Delaware revenue authorities. Management has analyzed the Fund’s tax positions taken on federal, state, and foreign tax returns for all open tax years and does not believe that there are any uncertain tax positions that require recognition of a tax liability.
Under the recently enacted Regulated Investment Company Modernization Act of 2010, the Fund is permitted to carry forward capital losses incurred in taxable years which began after December 22, 2010 for an unlimited period. However, any losses incurred are required to be utilized prior to the losses incurred in pre-enactment taxable years. As a result of this ordering rule, pre-enactment capital loss carryforwards may be more likely to expire unused. Post-enactment capital losses that are carried forward will retain their character as either short-term or long-term capital losses rather than be considered all short-term as under previous law. In addition, the Fund may elect to defer any portion of a post-October capital loss or qualified late-year ordinary loss to the first day of the following taxable year. A post-October capital loss is the greatest of the net capital loss, net short-term capital loss or net long-term capital loss for the portion of the taxable year after October 31. A qualified late-year ordinary loss is the net loss comprised of (a) net gain or loss from the sale or other disposition of capital assets for the portion of the taxable year after October 31, and (b) other ordinary income or loss for the portion of the taxable year after December 31.
As of October 31, 2011, the Fund had net capital loss carryforwards, which were available to offset future net realized capital gains, in the amount of $42,867,755 expiring in 2017.
Class allocations
The separate classes of shares offered by the Fund differ principally in applicable sales charges, distribution, shareholder servicing and administration fees. Shareholders of each class bear certain expenses that pertain to that particular class. All shareholders bear the common expenses of the Fund, earn income from the portfolio, and are allocated unrealized gains and losses pro rata based on the average daily net assets of each class, without distinction between share classes. Dividends are determined separately for each class based on income and expenses allocable to each class. Realized gains and losses are allocated to each class pro rata based upon the net assets of each class on the date realized. Differences in per share dividend rates generally result from the relative weightings of pro rata income and realized gain allocations and from differences in separate class expenses, including distribution, shareholder servicing and administration fees.
3. FAIR VALUATION MEASUREMENTS
Fair value measurements of investments are determined within a framework that has established a fair value hierarchy based upon the various data inputs utilized in determining the value of the Fund’s investments. The three-level hierarchy gives the highest priority to unadjusted quoted prices in active markets for identical assets or liabilities (Level 1) and the lowest priority to significant unobservable inputs (Level 3). The Fund’s investments are classified within the fair value
| | | | | | |
| Notes to Financial Statements | | Wells Fargo Advantage Global Opportunities Fund | | | 23 | |
hierarchy based on the lowest level of input that is significant to the fair value measurement. The inputs are summarized into three broad levels as follows:
| n | | Level 1 – quoted prices in active markets for identical securities |
| n | | Level 2 – other significant observable inputs (including quoted prices for similar securities, interest rates, prepayment speeds, credit risk, etc.) |
| n | | Level 3 – significant unobservable inputs (including the Fund’s own assumptions in determining the fair value of investments) |
The inputs or methodologies used for valuing securities are not necessarily an indication of the risk associated with investing in those securities.
As of April 30, 2012, the inputs used in valuing the Fund’s assets, which are carried at fair value, were as follows:
| | | | | | | | | | | | | | | | |
| Investments in Securities | | Quoted Prices (Level 1) | | | Significant Other
Observable Inputs (Level 2) | | | Significant Unobservable Inputs (Level 3) | | | Total | |
Equity securities | | | | | | | | | | | | | | | | |
Common stocks | | $ | 265,350,263 | | | $ | 1,919,263 | | | $ | 692,966 | | | $ | 267,962,492 | |
Short-term investments | | | | | | | | | | | | | | | | |
Investment companies | | | 22,616,332 | | | | 20,170,354 | | | | 0 | | | | 42,786,686 | |
| | | $ | 287,966,595 | | | $ | 22,089,617 | | | $ | 692,966 | | | $ | 310,749,178 | |
Further details on the major security types listed above can be found in the Portfolio of Investments.
Transfers in and transfers out are recognized at the end of the reporting period. For the six months ended April 30, 2012, the Fund did not have any significant transfers into/out of Level 1 and Level 2.
4. TRANSACTIONS WITH AFFILIATES AND OTHER EXPENSES
Advisory fee
The Trust has entered into an advisory contract with Funds Management, an indirect wholly owned subsidiary of Wells Fargo & Company (“Wells Fargo”). The adviser is responsible for implementing investment policies and guidelines and for supervising the sub-adviser, who is responsible for day-to-day portfolio management of the Fund.
Pursuant to the contract, Funds Management is entitled to receive an annual advisory fee starting at 0.90% and declining to 0.80% as the average daily net assets of the Fund increase. For the six months ended April 30, 2012, the advisory fee was equivalent to an annual rate of 0.90% of the Fund’s average daily net assets.
Funds Management has retained the services of certain sub-advisers to provide daily portfolio management to the Fund. The fees related to sub-advisory services are borne directly by Funds Management and do not increase the overall fees paid by the Fund. Wells Capital Management, an affiliate of Funds Management, is the sub-adviser to the Fund and is entitled to receive a fee from Funds Management at an annual rate starting at 0.55% and declining to 0.40% as the average daily net assets of the Fund increase.
Administration and transfer agent fees
The Trust has entered into an administration agreement with Funds Management. Under this agreement, for providing administrative services, which includes paying fees and expenses for services provided by the transfer agent, sub-transfer agents, omnibus account servicers and record-keepers, Funds Management is entitled to receive from the Fund an annual fund level administration fee starting at 0.05% and declining to 0.03% as the average daily net assets of the Fund increase and a class level administration fee which is calculated based on the average daily net assets of each class as follows:
| | | | |
| | | Class Level Administration Fee | |
Class A, Class B, Class C | | | 0.26 | % |
Administrator Class | | | 0.10 | |
Institutional Class | | | 0.08 | |
| | | | |
| 24 | | Wells Fargo Advantage Global Opportunities Fund | | Notes to Financial Statements |
Funds Management has contractually waived and/or reimbursed advisory and administration fees to the extent necessary to maintain certain net operating expense ratios for the Fund. Waiver of fees and/or reimbursement of expenses by Funds Management were made first from fund level expenses on a proportionate basis and then from class specific expenses. Funds Management has committed through July 18, 2013 to waive fees and/or reimburse expenses to the extent necessary to cap the Fund’s expenses at 1.55% for Class A, 2.30% for Class B, 2.30% for Class C, 1.40% for Administrator Class and 1.15% for Institutional Class.
Distribution fees
The Trust has adopted a Distribution Plan for Class B and Class C shares of the Fund pursuant to Rule 12b-1 under the 1940 Act. Distribution fees are charged to Class B and Class C shares and paid to Wells Fargo Funds Distributor, LLC, the principal underwriter, at an annual rate of 0.75% of the average daily net assets of Class B and Class C shares.
For the six months ended April 30, 2012, Wells Fargo Funds Distributor, LLC received $3,892 from the sale of Class A shares and $10, $20,084 and $572 in contingent deferred sales charges from redemptions of Class A, Class B and Class C shares, respectively.
Shareholder servicing fees
The Trust has entered into contracts with one or more shareholder servicing agents, whereby Class A, Class B, Class C and Administrator Class of the Fund is charged a fee at an annual rate of 0.25% of the average daily net assets of each respective class.
A portion of these total shareholder servicing fees were paid to affiliates of Wells Fargo.
5. INVESTMENT PORTFOLIO TRANSACTIONS
Purchases and sales of investments, excluding U.S. Government obligations (if any) and short-term securities, for the six months ended April 30, 2012 were $123,694,634 and $171,203,714, respectively.
6. DERIVATIVE TRANSACTIONS
During the six months ended April 30, 2012, the Fund entered into forward foreign currency exchange contracts for economic hedging purposes.
As of April 30, 2012, the Fund did not have any open forward foreign currency contracts but had average contract amounts of $4,068,024 and $4,656,984 in forward foreign currency contracts to buy and forward foreign currency contracts to sell, respectively, during the six months ended April 30, 2012.
The fair value, realized gains or losses and change in unrealized gains or losses, if any, on derivative instruments are reflected in the appropriate financial statements.
7. BANK BORROWINGS
The Trust (excluding the money market funds) and Wells Fargo Variable Trust are parties to a $150,000,000 revolving credit agreement with State Street Bank and Trust Company, whereby the Fund is permitted to use bank borrowings for temporary or emergency purposes, such as to fund shareholder redemption requests. Interest under the credit agreement is charged to the Fund based on a borrowing rate equal to the higher of the Federal Funds rate in effect on that day plus 1.25% or the overnight LIBOR rate in effect on that day plus 1.25%. In addition, an annual commitment fee equal to 0.10% of the unused balance is allocated to each participating fund. For the six months ended April 30, 2012, the Fund paid $334 in commitment fees.
For the six months ended April 30, 2012, there were no borrowings by the Fund under the agreement.
8. INDEMNIFICATION
Under the Trust’s organizational documents, the officers and directors are indemnified against certain liabilities that may arise out of performance of their duties to the Trust. Additionally, in the normal course of business, the Trust may enter into contracts with service providers that contain a variety of indemnification clauses. The Trust’s maximum exposure under these arrangements is dependent on future claims that may be made against the Fund and, therefore, cannot be estimated.
| | | | | | |
| Notes to Financial Statements | | Wells Fargo Advantage Global Opportunities Fund | | | 25 | |
9. NEW ACCOUNTING PRONOUNCEMENTS
In December 2011, the Financial Accounting Standards Board (“FASB”) issued Accounting Standard Update (“ASU”) No. 2011-11, Disclosures about Offsetting Assets and Liabilities. ASU 2011-11, which amends FASB ASC Topic 210, Balance Sheet, creates new disclosure requirements which require entities to disclose both gross and net information for derivatives and other financial instruments that are either offset in the Statement of Assets and Liabilities or subject to an enforceable master netting arrangement or similar agreement. The disclosure requirements are effective for interim and annual reporting periods beginning on or after January 1, 2013. Management is currently assessing the potential impact, in addition to expanded financial statement disclosure, that may result from adopting this ASU.
In May 2011, FASB issued ASU No. 2011-04 Amendments to Achieve Common Fair Value Measurement and Disclosure Requirements in U.S. GAAP and IFRS. ASU No. 2011-04 amends FASB ASC Topic 820, Fair Value Measurements, to establish common requirements for measuring fair value and for disclosing information about fair value measurements in accordance with GAAP. The ASU is effective prospectively for interim and annual periods beginning after December 15, 2011. Management expects that adoption of the ASU will result in additional disclosures in the financial statements, as applicable.
In April 2011, FASB issued ASU No. 2011-03 Reconsideration of Effective Control for Repurchase Agreements. ASU No. 2011-03 amends FASB ASC Topic 860, Transfers and Servicing, specifically the criteria required to determine whether a repurchase agreement (repo) and similar agreements should be accounted for as sales of financial assets or secured borrowings with commitments. ASU No. 2011-03 changes the assessment of effective control by focusing on the transferor’s contractual rights and obligations and removing the criterion to assess its ability to exercise those rights or honor those obligations. This could result in changes to the way entities account for certain transactions including repurchase agreements, mortgage dollar rolls and reverse repurchase agreements. The ASU will become effective on a prospective basis for new transfers and modifications to existing transactions as of the beginning of the first interim or annual period beginning on or after December 15, 2011. Management has evaluated the impact of adopting the ASU and expects no significant changes.
| | | | |
| 26 | | Wells Fargo Advantage Global Opportunities Fund | | Other Information (Unaudited) |
PROXY VOTING INFORMATION
A description of the policies and procedures that the Fund uses to determine how to vote proxies relating to portfolio securities is available without charge, upon request, by calling 1-800-222-8222, visiting our Web site at wellsfargoadvantagefunds.com, or visiting the SEC Web site at sec.gov. Information regarding how the Fund voted proxies relating to portfolio securities during the most recent 12-month period ended June 30 is available without charge on the Fund’s Web site at wellsfargoadvantagefunds.com or by visiting the SEC Web site at sec.gov.
PORTFOLIO HOLDINGS INFORMATION
The complete portfolio holdings for the Fund are publicly available on the Fund’s Web site (wellsfargoadvantagefunds.com) on a monthly, 30-day or more delayed basis. In addition, top ten holdings information for the Fund is publicly available on the Fund’s Web site on a monthly, seven-day or more delayed basis. The Fund files its complete schedule of portfolio holdings with the SEC for the first and third quarters of each fiscal year on Form N-Q, which is available without charge by visiting the SEC Web site at sec.gov. In addition, the Fund’s Form N-Q may be reviewed and copied at the SEC’s Public Reference Room in Washington, DC, and at regional offices in New York City, at 233 Broadway, and in Chicago, at 175 West Jackson Boulevard, Suite 900. Information about the Public Reference Room may be obtained by calling 1-800-SEC-0330.
| | | | | | |
| Other Information (Unaudited) | | Wells Fargo Advantage Global Opportunities Fund | | | 27 | |
BOARD OF TRUSTEES
The following table provides basic information about the Board of Trustees (the “Trustees”) of the Trust and Officers of the Trust. This table should be read in conjunction with the Prospectus and the Statement of Additional Information1 of the Fund. Each of the Trustees and Officers listed below acts in identical capacities for the Wells Fargo Advantage family of funds, which consists of 137 funds comprising the Wells Fargo Funds Trust, Wells Fargo Variable Trust, Wells Fargo Master Trust and four closed-end funds (collectively the “Fund Complex”). All of the Trustees are also Members of the Audit and Governance Committees of each Trust in the Fund Complex. The mailing address of each Trustee and Officer is 525 Market Street, 12th Floor, San Francisco, CA 94105. Each Trustee and Officer serves an indefinite term, however, each Trustee serves such term until reaching the mandatory retirement age established by the Trustees.
Independent Trustees
| | | | | | |
Name and Year of Birth | | Position Held and Length of Service | | Principal Occupations During Past Five Years | | Other Directorships During
Past Five Years |
Peter G. Gordon
(Born 1942) | | Trustee, since 1998; Chairman, since 2005 (Lead Trustee since 2001) | | Co-Founder, Retired Chairman, President and CEO of Crystal Geyser Water Company. Trustee Emeritus, Colby College | | Asset Allocation Trust |
Isaiah Harris, Jr.
(Born 1952) | | Trustee, since 2009 | | Retired. Prior thereto, President and CEO of BellSouth Advertising and Publishing Corp. from 2005 to 2007, President and CEO of BellSouth Enterprises from 2004 to 2005 and President of BellSouth Consumer Services from 2000 to 2003. Emeritus member of the Iowa State University Foundation Board of Governors. Emeritus Member of the Advisory Board of Iowa State University School of Business. Mr. Harris is a certified public accountant. | | CIGNA Corporation; Deluxe Corporation; Asset Allocation Trust |
Judith M. Johnson
(Born 1949) | | Trustee, since 2008 | | Retired. Prior thereto, Chief Executive Officer and Chief Investment Officer of Minneapolis Employees Retirement Fund from 1996 to 2008. Ms. Johnson is an attorney, certified public accountant and a certified managerial accountant. | | Asset Allocation Trust |
Leroy Keith, Jr.
(Born 1939) | | Trustee, since 2010 | | Chairman, Bloc Global Services (development and construction). Trustee of the Evergreen Funds from 1983 to 2010. Former Managing Director, Almanac Capital Management (commodities firm), former Partner, Stonington Partners, Inc. (private equity fund), former Director, Obagi Medical Products Co. and former Director, Lincoln Educational Services. | | Trustee, Virtus Fund Complex (consisting of 40 portfolios as of 12/31/11); Asset Allocation Trust |
David F. Larcker
(Born 1950) | | Trustee, since 2009 | | James Irvin Miller Professor of Accounting at the Graduate School of Business, Stanford University, Director of Corporate Governance Research Program and Senior Faculty of The Rock Center for Corporate Governance since 2006. From 2005 to 2008, Professor of Accounting at the Graduate School of Business, Stanford University. Prior thereto, Ernst & Young Professor of Accounting at The Wharton School, University of Pennsylvania from 1985 to 2005. | | Asset Allocation Trust |
Olivia S. Mitchell
(Born 1953) | | Trustee, since 2006 | | International Foundation of Employee Benefit Plans Professor, Wharton School of the University of Pennsylvania since 1993. Director of Wharton’s Pension Research Council and Boettner Center on Pensions & Retirement Research, and Research Associate at the National Bureau of Economic Research. Previously, Cornell University Professor from 1978 to 1993. | | Asset Allocation Trust |
| | | | |
| 28 | | Wells Fargo Advantage Global Opportunities Fund | | Other Information (Unaudited) |
| | | | | | |
Name and Year of Birth | | Position Held and Length of Service | | Principal Occupations During Past Five Years | | Other Directorships During
Past Five Years |
Timothy J. Penny
(Born 1951) | | Trustee, since 1996 | | President and CEO of Southern Minnesota Initiative Foundation, a non-profit organization, since 2007 and Senior Fellow at the Humphrey Institute Policy Forum at the University of Minnesota since 1995. Member of the Board of Trustees of NorthStar Education Finance, Inc., a non-profit organization, since 2007. | | Asset Allocation Trust |
Michael S. Scofield
(Born 1943) | | Trustee, since 2010 | | Served on the Investment Company Institute’s Board of Governors and Executive Committee from 2008-2011 as well the Governing Council of the Independent Directors Council from 2006-2011 and the Independent Directors Council Executive Committee from 2008-2011. Chairman of the IDC from 2008-2010. Institutional Investor (Fund Directions) Trustee of Year in 2007. Trustee of the Evergreen Funds (and its predecessors) from 1984 to 2010. Chairman of the Evergreen Funds from 2000-2010. Former Trustee of the Mentor Funds. Retired Attorney, Law Offices of Michael S. Scofield and former Director and Chairman, Branded Media Corporation (multi-media branding company). | | Asset Allocation Trust |
Donald C. Willeke
(Born 1940) | | Trustee, since 1996 | | Principal of the law firm of Willeke & Daniels. General Counsel of the Minneapolis Employees Retirement Fund from 1984 until its consolidation into the Minnesota Public Employees Retirement Association on June 30, 2010. Director and Vice Chair of The Free Trust (non-profit corporation). Director of the American Chestnut Foundation (non-profit corporation). | | Asset Allocation Trust |
Officers
| | | | | | |
Name and Year of Birth | | Position Held and
Length of Service | | Principal Occupations During Past Five Years | | |
Karla M. Rabusch
(Born 1959) | | President, since 2003 | | Executive Vice President of Wells Fargo Bank, N.A. and President of Wells Fargo Funds Management, LLC since 2003. Senior Vice President and Chief Administrative Officer of Wells Fargo Funds Management, LLC from 2001 to 2003. | | |
C. David Messman
(Born 1960) | | Secretary, since 2000; Chief Legal Counsel, since 2003 | | Senior Vice President and Secretary of Wells Fargo Funds Management, LLC since 2001. Vice President and Managing Senior Counsel of Wells Fargo Bank, N.A. since 1996. | | |
Kasey Phillips
(Born 1970) | | Treasurer, since 2009 | | Senior Vice President of Wells Fargo Funds Management, LLC since 2009. Senior Vice President of Evergreen Investment Management Company, LLC from 2006 to 2010. Treasurer of the Evergreen Funds from 2005 to 2010. | | |
David Berardi
(Born 1975) | | Assistant Treasurer, since 2009 | | Vice President of Wells Fargo Funds Management, LLC since 2009. Vice President of Evergreen Investment Management Company, LLC from 2008 to 2010. Assistant Vice President of Evergreen Investment Services, Inc. from 2004 to 2008. Manager of Fund Reporting and Control for Evergreen Investment Management Company, LLC from 2004 to 2010. | | |
Jeremy DePalma
(Born 1974) | | Assistant Treasurer, since 2009 | | Senior Vice President of Wells Fargo Funds Management, LLC since 2009. Senior Vice President of Evergreen Investment Management Company, LLC from 2008 to 2010. Vice President, Evergreen Investment Services, Inc. from 2004 to 2007. Head of the Fund Reporting and Control Team within Fund Administration from 2005 to 2010. | | |
Debra Ann Early
(Born 1964) | | Chief Compliance Officer, since 2007 | | Chief Compliance Officer of Wells Fargo Funds Management, LLC since 2007. Chief Compliance Officer of Parnassus Investments from 2005 to 2007. Chief Financial Officer of Parnassus Investments from 2004 to 2007 and Senior Audit Manager of PricewaterhouseCoopers LLP from 1998 to 2004. | | |
| 1. | The Statement of Additional Information includes additional information about the Trustees and is available, without charge, upon request, by calling 1-800-222-8222 or by visiting the Web site at wellsfargoadvantagefunds.com. |
| | | | | | |
| Other Information (Unaudited) | | Wells Fargo Advantage Global Opportunities Fund | | | 29 | |
BOARD CONSIDERATION OF INVESTMENT ADVISORY AND SUB-ADVISORY AGREEMENTS:
Under Section 15 of the Investment Company Act of 1940 (the “1940 Act”), the Board of Trustees (the “Board”) of Wells Fargo Funds Trust (the “Trust”), all the members of which have no direct or indirect interest in the investment advisory and sub-advisory agreements and are not “interested persons” of the Trust, as defined in the 1940 Act (the “Independent Trustees”), must determine whether to approve the continuation of the Trust’s investment advisory and sub-advisory agreements. In this regard, at an in person meeting held on March 29-30, 2012 (the “Meeting”), the Board reviewed and re-approved: (i) an investment advisory agreement with Wells Fargo Funds Management, LLC (“Funds Management”) for Wells Fargo Advantage Global Opportunities Fund (the “Fund”) and (ii) an investment sub-advisory agreement with Wells Capital Management Incorporated (“Wells Capital Management”) for the Fund. The investment advisory agreement with Funds Management and the investment sub-advisory agreement with Wells Capital Management are collectively referred to as the “Advisory Agreements.”
At the Meeting, the Board considered the factors and reached the conclusions described below relating to the selection of Funds Management and Wells Capital Management and the continuation of the Advisory Agreements. Prior to the Meeting, the Trustees conferred extensively among themselves and with representatives of Funds Management about these matters. The Board also met throughout the year and received information that was useful to them in considering the continuation of the Advisory Agreements. The Independent Trustees were assisted in their evaluation of the Advisory Agreements by independent legal counsel, from whom they received separate legal advice and with whom they met separately from Funds Management.
In providing information to the Board, Funds Management and Wells Capital Management were guided by a detailed set of requests submitted by the Independent Trustees’ independent legal counsel on their behalf at the start of the Board’s annual contract renewal process earlier in 2012. In approving the Advisory Agreements, the Board did not identify any particular information or consideration that was all-important or controlling, and each Trustee likely attributed different weights to various factors.
Nature, extent and quality of services
The Board received and considered various information regarding the nature, extent and quality of services provided to the Fund by Funds Management and Wells Capital Management under the Advisory Agreements. The Board also received and considered, among other things, information about the background and experience of senior management of Funds Management, and the qualifications, backgrounds, tenures and responsibilities of the portfolio managers primarily responsible for the day-to-day portfolio management of the Fund.
The Board evaluated the ability of Funds Management and Wells Capital Management, based on their respective financial condition, resources, reputation and other attributes, to attract and retain qualified investment professionals, including research, advisory, and supervisory personnel. The Board further considered the compliance programs and compliance records of Funds Management and Wells Capital Management. In addition, the Board took into account the administrative services provided to the Fund by Funds Management and its affiliates.
The Board’s decision to approve the continuation of the Advisory Agreements was based on a comprehensive evaluation of all of the information provided to it. In considering these matters, the Board considered not only the specific information presented in connection with the Meeting, but also the knowledge gained over time through interaction with Funds Management and Wells Capital Management about various topics, including Funds Management’s oversight of service providers. The above factors, together with those referenced below, are some of the most important, but not necessarily all, factors considered by the Board in concluding that the nature, extent and quality of the investment advisory services provided to the Fund by Funds Management and Wells Capital Management supported the re-approval of the Advisory Agreements. Although the Board considered the continuation of the Advisory Agreements for the Fund as part of the larger process of considering the continuation of the advisory agreements for all of the funds in the complex, its decision to continue the Advisory Agreements for the Fund was ultimately made on a fund-by-fund basis.
Fund performance and expenses
The Board considered the performance results for the Fund over various time periods ended December 31, 2011. The Board also considered these results in comparison to the median performance of a universe of relevant funds (the “Universe”) that was determined by Lipper Inc. (“Lipper”) to be similar to the Fund, and in comparison to the Fund’s benchmark index and to other comparative data. Lipper is an independent provider of investment company data. The
| | | | |
| 30 | | Wells Fargo Advantage Global Opportunities Fund | | Other Information (Unaudited) |
Board received a description of the methodology used by Lipper to select the mutual funds in the Universe. The Board noted that the performance of the Fund for the one-year and three-year periods was lower than the median performance of the Universe. The Board also noted that the performance of the Fund for the five-year and ten-year periods was in range of or higher than the median performance of the Universe.
The Board also noted that the performance of the Fund for the most recent periods was lower than its benchmark, the Lipper Global Small-Mid Cap Funds Index (the “Index”), for the periods under review. The Board noted that the performance of the Fund for the longer-term periods was in range of or higher than the Index.
The Board noted that the Fund’s more recent performance results warranted further discussion. As part of its further review, the Board received an analysis of, and discussed factors contributing to, the underperformance of the Fund relative to the Universe. The Board received a report that noted certain investments made in the first half of 2009 and the second and third quarters of 2011 adversely affected the Fund’s performance. In addition, the Board noted that the domestic investments had underperformed the domestic portion of the benchmark over the past three years. The Board was satisfied that Funds Management was appropriately monitoring the Fund’s investment performance.
The Board received and considered information regarding the Fund’s contractual advisory fee and net operating expense ratios and their various components, including actual management fees (which reflect fee waivers, if any), transfer agent, custodian and other non-management fees, Rule 12b-1 and non-Rule 12b-1 fees, service fees and fee waiver and expense reimbursement arrangements. The Board also considered these ratios in comparison to the median ratios of an expense Universe and a narrower expense group of mutual funds (each, an “Expense Group”) that was determined by Lipper to be similar to the Fund. The Board received a description of the methodology used by Lipper to select the mutual funds in the Fund’s Expense Group. The Board noted that the net operating expense ratios of the Fund were in range of the Fund’s Expense Group’s median net operating expense ratios.
Based on the above-referenced considerations and other factors, the Board concluded that the overall performance and expense structure of the Fund supported the re-approval of the Advisory Agreements for the Fund.
Investment advisory and sub-advisory fee rates
The Board reviewed and considered the contractual investment advisory fee rate that is payable by the Fund to Funds Management for investment advisory services (the “Advisory Agreement Rate”), both on a stand-alone basis and on a combined basis with the Fund’s administration fee rate. The Board took into account the separate administrative and other services covered by the administration fee rate. The Board also reviewed and considered the contractual investment sub-advisory fee rate that is payable by Funds Management to Wells Capital Management for investment sub-advisory services (the “Sub-Advisory Agreement Rate”). In addition, the Board reviewed and considered the existing fee waiver/cap arrangements applicable to the Advisory Agreement Rate and considered the Advisory Agreement Rate after taking the waivers/caps into account (the “Net Advisory Rate”).
The Board received and considered information comparing the Advisory Agreement Rate and Net Advisory Rate with those of other funds in the Fund’s Expense Group median. The Board noted that the Advisory Agreement Rate for the Fund was in range of the median rate for the Fund’s Expense Group, except for the A class. The Board also noted that the Net Advisory Rate for the Fund was higher than the median rate for the Fund’s Expense Group. The Board noted that Funds Management proposed to extend contractual fee cap arrangements for the Fund designed to lower the fund’s expenses until February 28, 2014.
The Board also received and considered information about the nature and extent of services offered and fee rates charged by Funds Management and Wells Capital Management to other types of clients. In this regard, the Board received information about differences between the services, and the compliance, reporting, and other legal burdens and risks of providing investment advice to mutual funds and those associated with providing advice to non-mutual fund clients such as collective funds or institutional separate accounts.
The Board determined that the Advisory Agreement Rate for the Fund, both with and without an administration fee rate and before and after waivers, was reasonable in light of the Fund’s Expense Group information, the net expense ratio commitments, the services covered by the Advisory Agreements and other information provided. The Board also reviewed and considered the Sub-Advisory Agreement Rate and concluded that the Sub-Advisory Agreement Rate was reasonable in light of the services covered by the sub-advisory agreement and other information provided.
| | | | | | |
| Other Information (Unaudited) | | Wells Fargo Advantage Global Opportunities Fund | | | 31 | |
Profitability
The Board received and considered a profitability analysis of Funds Management, as well as an analysis of the profitability to the collective Wells Fargo businesses that provide services to the Fund. It considered that the information provided to it was necessarily estimated, and that the profitability information provided to it, especially on a fund-by-fund basis, did not necessarily provide a precise tool for evaluating the appropriateness of the Fund’s Advisory Agreement Rate in isolation. It noted that the levels of profitability reported on a fund-by-fund basis varied widely, depending on, among other things, the size and type of fund. The Board concluded that the profitability reported by Funds Management was not unreasonable.
The Board did not consider separate profitability information with respect to Wells Capital Management, because, as an affiliate of Funds Management, its profitability information was subsumed in the collective Wells Fargo profitability analysis provided by Funds Management.
Economies of scale
With respect to possible economies of scale, the Board reviewed the breakpoints in the Fund’s advisory fee structure, which operate generally to reduce the effective Advisory Agreement Rate of the Fund (as a percentage of Fund assets) as the Fund grows in size. It considered that, as a fund shrinks in size, breakpoints conversely result in increasing fee levels. The Board noted that it would have on-going opportunities to review the appropriate levels of breakpoints in the future, and concluded that the breakpoints as implemented appeared to be a reasonable step toward sharing economies of scale, if any, with the Fund. However, the Board acknowledged the inherent limitations of any analysis of an investment adviser’s economies of scale and of any attempt to correlate breakpoints with such economies, stemming largely from the Board’s understanding that economies of scale are realized, if at all, by an investment adviser across a variety of products and services, not just with respect to a single fund.
Other benefits to Funds Management and Wells Capital Management
The Board received and considered information regarding potential “fall-out” or ancillary benefits received by Funds Management and its affiliates, including Wells Capital Management, as a result of their relationship with the Fund. Ancillary benefits could include, among others, benefits directly attributable to the relationship of Funds Management and Wells Capital Management with the Fund and benefits potentially derived from an increase in Funds Management’s and Wells Capital Management’s business as a result of their relationship with the Fund (such as the ability to market to shareholders other financial products offered by Funds Management and its affiliates, including Wells Capital Management).
The Board considered that Wells Fargo Funds Distributor, LLC, an affiliate of Funds Management, serves as distributor to the Fund and receives certain compensation for those services. The Board noted that various financial institutions, including affiliates of Funds Management, may receive distribution-related fees, shareholder servicing payments (including amounts derived from payments under Rule 12b-1 plans) and sub-transfer agency fees in respect of shares sold or held through them and services provided.
The Board also reviewed information about whether and to what extent soft dollar credits are sought and how any such credits are utilized and any benefits that may be realized by using an affiliated broker.
Other factors and broader review
The Board also considered the markets for distribution of the Fund’s shares, including the channels through which the Fund’s shares are offered and sold. The Board noted that the Fund is part of one of the few fund families that have both direct-to-fund and intermediary distribution channels. As discussed above, the Board reviews detailed materials received from Funds Management and Wells Capital Management annually as part of the re-approval process under Section 15 of the 1940 Act and also reviews and assesses information about the quality of the services that the Fund receives throughout the year. In this regard, the Board has reviewed reports of Funds Management at each of its quarterly meetings, which include, among other things, portfolio reviews and performance reports. In addition, the Board confers with portfolio managers at various times throughout the year.
Conclusion
After considering the above-described factors and based on its deliberations and its evaluation of the information described above, the Board unanimously approved the continuation of the Advisory Agreements for an additional one-year period.
| | | | |
| 32 | | Wells Fargo Advantage Global Opportunities Fund | | List of Abbreviations |
The following is a list of common abbreviations for terms and entities which may have appeared in this report.
| ACB | — Agricultural Credit Bank |
| ADR | — American Depository Receipt |
| ADS | — American Depository Shares |
| AGC-ICC | — Assured Guaranty Corporation - Insured Custody Certificates |
| AGM | — Assured Guaranty Municipal |
| AMBAC | — American Municipal Bond Assurance Corporation |
| AMT | — Alternative Minimum Tax |
| BAN | — Bond Anticipation Notes |
| BHAC | — Berkshire Hathaway Assurance Corporation |
| CAB | — Capital Appreciation Bond |
| CCAB | — Convertible Capital Appreciation Bond |
| CDA | — Community Development Authority |
| CDO | — Collateralized Debt Obligation |
| COP | — Certificate of Participation |
| DRIVER | — Derivative Inverse Tax-Exempt Receipts |
| DW&P | — Department of Water & Power |
| DWR | — Department of Water Resources |
| ECFA | — Educational & Cultural Facilities Authority |
| EDA | — Economic Development Authority |
| EDFA | — Economic Development Finance Authority |
| ETF | — Exchange-Traded Fund |
| FFCB | — Federal Farm Credit Bank |
| FGIC | — Financial Guaranty Insurance Corporation |
| FHA | — Federal Housing Authority |
| FHLB | — Federal Home Loan Bank |
| FHLMC | — Federal Home Loan Mortgage Corporation |
| FICO | — The Financing Corporation |
| FNMA | — Federal National Mortgage Association |
| GDR | — Global Depository Receipt |
| GNMA | — Government National Mortgage Association |
| HCFR | — Healthcare Facilities Revenue |
| HEFA | — Health & Educational Facilities Authority |
| HEFAR | — Higher Education Facilities Authority Revenue |
| HFA | — Housing Finance Authority |
| HFFA | — Health Facilities Financing Authority |
| IBC | — Insured Bond Certificate |
| IDA | — Industrial Development Authority |
| IDAG | — Industrial Development Agency |
| IDR | — Industrial Development Revenue |
| KRW | — Republic of Korea Won |
| LIBOR | — London Interbank Offered Rate |
| LLC | — Limited Liability Company |
| LLP | — Limited Liability Partnership |
| MBIA | — Municipal Bond Insurance Association |
| MFHR | — Multi-Family Housing Revenue |
| MSTR | — Municipal Securities Trust Receipts |
| MUD | — Municipal Utility District |
| NATL-RE | — National Public Finance Guarantee Corporation |
| PCFA | — Pollution Control Finance Authority |
| PCR | — Pollution Control Revenue |
| PFA | — Public Finance Authority |
| PFFA | — Public Facilities Financing Authority |
| PFOTER | — Puttable Floating Option Tax-Exempt Receipts |
| plc | — Public Limited Company |
| PUTTER | — Puttable Tax-Exempt Receipts |
| R&D | — Research & Development |
| RDA | — Redevelopment Authority |
| RDFA | — Redevelopment Finance Authority |
| REIT | — Real Estate Investment Trust |
| ROC | — Reset Option Certificates |
| SAVRS | — Select Auction Variable Rate Securities |
| SBA | — Small Business Authority |
| SFHR | — Single Family Housing Revenue |
| SFMR | — Single Family Mortgage Revenue |
| SPA | — Standby Purchase Agreement |
| SPDR | — Standard & Poor’s Depositary Receipts |
| STRIPS | — Separate Trading of Registered Interest and Principal Securities |
| TAN | — Tax Anticipation Notes |
| TIPS | — Treasury Inflation-Protected Securities |
| TRAN | — Tax Revenue Anticipation Notes |
| TCR | — Transferable Custody Receipts |
| TTFA | — Transportation Trust Fund Authority |
| TVA | — Tennessee Valley Authority |
| XLCA | — XL Capital Assurance |
This page is intentionally left blank.
This page is intentionally left blank.


FOR MORE INFORMATION
More information about Wells Fargo Advantage Funds is available free upon request. To obtain literature, please write, e-mail, visit the Fund’s Web site, or call:
Wells Fargo Advantage Funds
P.O. Box 8266
Boston, MA 02266-8266
E-mail: wfaf@wellsfargo.com
Web site: wellsfargoadvantagefunds.com
Individual investors: 1-800-222-8222
Retail investment professionals: 1-888-877-9275
Institutional investment professionals: 1-866-765-0778
This report and the financial statements contained herein are submitted for the general information of the shareholders of Wells Fargo Advantage Funds. If this report is used for promotional purposes, distribution of the report must be accompanied or preceded by a current prospectus. For a prospectus containing more complete information, including charges and expenses, call 1-800-222-8222 or visit the Fund’s Web site at wellsfargoadvantagefunds.com. Please consider the investment objectives, risks, charges, and expenses of the investment carefully before investing. This and other information about Wells Fargo Advantage Funds can be found in the current prospectus. Read the prospectus carefully before you invest or send money.
Wells Fargo Funds Management, LLC, a wholly owned subsidiary of Wells Fargo & Company, provides investment advisory and administrative services for Wells Fargo Advantage Funds. Other affiliates of Wells Fargo & Company provide subadvisory and other services for the Funds. The Funds are distributed by Wells Fargo Funds Distributor, LLC, Member FINRA/SIPC, an affiliate of Wells Fargo & Company.
NOT FDIC INSURED ¡ NO BANK GUARANTEE ¡ MAY LOSE VALUE
© 2012 Wells Fargo Funds Management, LLC. All rights reserved.
| | |
 | | 209723 06-12 SA239/SAR239 4-12 |

Wells Fargo Advantage
International Equity Fund

Semi-Annual Report
April 30, 2012

Reduce clutter. Save trees.
Sign up for electronic delivery of prospectuses and shareholder reports at wellsfargo.com/advantagedelivery
Contents
The views expressed and any forward-looking statements are as of April 30, 2012, unless otherwise noted, and are those of the Fund managers and/or Wells Fargo Funds Management, LLC. Discussions of individual securities, or the markets generally, or any Wells Fargo Advantage Fund are not intended as individual recommendations. Future events or results may vary significantly from those expressed in any forward-looking statements; the views expressed are subject to change at any time in response to changing circumstances in the market. Wells Fargo Funds Management, LLC, disclaims any obligation to publicly update or revise any views expressed or forward-looking statements.
NOT FDIC INSURED ¡ NO BANK GUARANTEE ¡ MAY LOSE VALUE

WELLS FARGO INVESTMENT HISTORY
| | |
| |
| 1932 | | Keystone creates one of the first mutual fund families. |
| |
| 1971 | | Wells Fargo & Company introduces one of the first institutional index funds. |
| |
| 1978 | | Wells Fargo applies Markowitz and Sharpe’s research on Modern Portfolio Theory to introduce one of the industry’s first Tactical Asset Allocation (TAA) models in institutional separately managed accounts. |
| |
| 1984 | | Wells Fargo Stagecoach Funds launches its first asset allocation fund. |
| |
| 1989 | | The Tactical Asset Allocation (TAA) Model is first applied to Wells Fargo’s asset allocation mutual funds. |
| |
| 1994 | | Wells Fargo introduces the LifePath Funds, one of the first suites of target date funds (now the Wells Fargo Advantage Dow Jones Target Date FundsSM). |
| |
| 1996 | | Evergreen Investments and Keystone Funds merge. |
| |
| 1997 | | Wells Fargo launches Wells Fargo Advantage WealthBuilder PortfoliosSM, a fund-of-funds suite of products that includes the use of quantitative models to shift assets among investment styles. |
| |
| 1999 | | Norwest Advantage Funds and Stagecoach Funds are reorganized into Wells Fargo Funds after the merger of Norwest and Wells Fargo. |
| |
| 2002 | | Evergreen Retail and Evergreen Institutional companies form the umbrella asset management company, Evergreen Investments. |
| |
| 2005 | | The integration of Strong Funds with Wells Fargo Funds creates Wells Fargo Advantage Funds, resulting in one of the top 20 mutual fund companies in the United States. |
| |
| 2006 | | Wells Fargo Advantage Funds relaunches the target date product line as Wells Fargo Advantage Dow Jones Target Date Funds. |
| |
| 2010 | | The mergers and reorganizations of Evergreen and Wells Fargo Advantage mutual funds are completed, unifying the families under the brand of Wells Fargo Advantage Funds. |
Wells Fargo Advantage Funds®
Wells Fargo Advantage Funds skillfully guides institutions, financial advisors, and individuals through the investment terrain to help them reach their financial objectives. Everything we do on behalf of investors is backed by our unique combination of qualifications.
Strength
Our organization is built on the standards of integrity and service established by our parent company—Wells Fargo & Company—more than 150 years ago. And, because we’re part of a highly diversified financial enterprise, we offer the depth of resources to help investors succeed.
Expertise
Our multi-boutique model offers investors access to the independent thinking of premier investment managers that have been chosen for their time-tested strategies. While each team specializes in a specific investment strategy, collectively they provide investors a wide choice of distinct investment styles. Our dedication to investment excellence doesn’t end with our expertise in manager selection—risk management, analysis, and rigorous ongoing review seek to ensure each manager’s investment process remains consistent.
Partnership
Our collaborative approach is built around understanding the needs and goals of our clients. By adhering to core principles of sound judgment and steady guidance, we support you through every stage of the investment decision process.
Carefully consider a fund’s investment objectives, risks, charges, and expenses before investing. For a current prospectus and, if available, a summary prospectus, containing this and other information, visit wellsfargoadvantagefunds.com. Read it carefully before investing.
Wells Fargo Funds Management, LLC, a wholly owned subsidiary of Wells Fargo & Company, provides investment advisory and administrative services for Wells Fargo Advantage Funds®. Other affiliates of Wells Fargo & Company provide subadvisory and other services for the Funds. The Funds are distributed by Wells Fargo Funds Distributor, LLC, Member FINRA/SIPC, an affiliate of Wells Fargo & Company.
“Dow Jones®” and “Dow Jones Target Date IndexesSM” are service marks of Dow Jones Trademark Holdings, LLC (“Dow Jones”), have been licensed to CME Group Index Services LLC (“CME Indexes”) and have been sublicensed for use for certain purposes by Global Index Advisors, Inc, and Wells Fargo Funds Management, LLC. The Wells Fargo Advantage Dow Jones Target Date FundsSM based on the Dow Jones Target Date IndexesSM, are not sponsored, endorsed, sold or promoted by Dow Jones, CME Indexes or their respective affiliates and none of them makes any representation regarding the advisability of investing in such product(s).
NOT FDIC INSURED ¡ NO BANK GUARANTEE ¡ MAY LOSE VALUE
Not part of the semi-annual report.
Wells Fargo Advantage Funds offers more than 110 mutual funds across a wide range of asset classes, representing over $211 billion in assets under management, as of April 30, 2012.
| | | | |
| Equity Funds | | | | |
Asia Pacific Fund | | Enterprise Fund† | | Opportunity Fund† |
C&B Large Cap Value Fund | | Equity Value Fund | | Precious Metals Fund |
C&B Mid Cap Value Fund | | Global Opportunities Fund | | Premier Large Company Growth Fund |
Capital Growth Fund | | Growth Fund | | Small Cap Opportunities Fund |
Common Stock Fund | | Index Fund | | Small Cap Value Fund |
Disciplined U.S. Core Fund | | International Equity Fund | | Small Company Growth Fund |
Discovery Fund† | | International Value Fund | | Small Company Value Fund |
Diversified Equity Fund | | Intrinsic Small Cap Value Fund | | Small/Mid Cap Core Fund |
Diversified International Fund | | Intrinsic Value Fund | | Small/Mid Cap Value Fund |
Diversified Small Cap Fund | | Intrinsic World Equity Fund | | Special Mid Cap Value Fund |
Emerging Growth Fund | | Large Cap Core Fund | | Special Small Cap Value Fund |
Emerging Markets Equity Fund | | Large Cap Growth Fund | | Specialized Technology Fund |
Emerging Markets Equity Income Fund | | Large Company Value Fund | | Traditional Small Cap Growth Fund |
Emerging Markets Local Bond Fund | | Omega Growth Fund | | Utility and Telecommunications Fund |
Endeavor Select Fund† | | | | |
| Bond Funds | | | | |
Adjustable Rate Government Fund | | Inflation-Protected Bond Fund | | Short-Term Bond Fund |
California Limited-Term Tax-Free Fund | | Intermediate Tax/AMT-Free Fund | | Short-Term High Yield Bond Fund |
California Tax-Free Fund | | International Bond Fund | | Short-Term Municipal Bond Fund |
Colorado Tax-Free Fund | | Minnesota Tax-Free Fund | | Strategic Municipal Bond Fund |
Government Securities Fund | | Municipal Bond Fund | | Total Return Bond Fund |
High Income Fund | | North Carolina Tax-Free Fund | | Ultra Short-Term Income Fund |
High Yield Bond Fund | | Pennsylvania Tax-Free Fund | | Ultra Short-Term Municipal Income Fund |
Income Plus Fund | | Short Duration Government Bond Fund | | Wisconsin Tax-Free Fund |
| Asset Allocation Funds | | | | |
Absolute Return Fund | | WealthBuilder Equity Portfolio† | | Target 2020 Fund† |
Asset Allocation Fund | | WealthBuilder Growth Allocation Portfolio† | | Target 2025 Fund† |
Conservative Allocation Fund | | WealthBuilder Growth Balanced Portfolio† | | Target 2030 Fund† |
Diversified Capital Builder Fund | | WealthBuilder Moderate Balanced Portfolio† | | Target 2035 Fund† |
Diversified Income Builder Fund | | WealthBuilder Tactical Equity Portfolio† | | Target 2040 Fund† |
Growth Balanced Fund | | Target Today Fund† | | Target 2045 Fund† |
Index Asset Allocation Fund | | Target 2010 Fund† | | Target 2050 Fund† |
Moderate Balanced Fund | | Target 2015 Fund† | | Target 2055 Fund† |
WealthBuilder Conservative Allocation Portfolio† | | | | |
| Money Market Funds | | | | |
100% Treasury Money Market Fund | | Heritage Money Market Fund† | | National Tax-Free Money Market Fund |
California Municipal Money Market Fund | | Money Market Fund | | Prime Investment Money Market Fund |
Cash Investment Money Market Fund | | Municipal Cash Management Money Market Fund | | Treasury Plus Money Market Fund |
Government Money Market Fund | | Municipal Money Market Fund | | |
| Variable Trust Funds1 | | | | |
VT Discovery Fund† | | VT Intrinsic Value Fund | | VT Small Cap Growth Fund |
VT Index Asset Allocation Fund | | VT Omega Growth Fund | | VT Small Cap Value Fund |
VT International Equity Fund | | VT Opportunity Fund† | | VT Total Return Bond Fund |
An investment in a money market fund is not insured or guaranteed by the Federal Deposit Insurance Corporation or any other government agency. Although the Wells Fargo Advantage Money Market Funds seek to preserve the value of your investment at $1.00 per share, it is possible to lose money by investing in a money market fund.
| 1. | The Variable Trust Funds are generally available only through insurance company variable contracts. |
| † | In this report, the Wells Fargo Advantage Discovery FundSM, Wells Fargo Advantage Endeavor Select FundSM, Wells Fargo Advantage Enterprise FundSM, Wells Fargo Advantage Opportunity FundSM, Wells Fargo Advantage WealthBuilder Conservative Allocation PortfolioSM, Wells Fargo Advantage WealthBuilder Equity PortfolioSM, Wells Fargo Advantage WealthBuilder Growth Allocation PortfolioSM, Wells Fargo Advantage WealthBuilder Growth Balanced PortfolioSM, Wells Fargo Advantage WealthBuilder Moderate Balanced PortfolioSM, Wells Fargo Advantage WealthBuilder Tactical Equity PortfolioSM, Wells Fargo Advantage Dow Jones Target Today FundSM, Wells Fargo Advantage Dow Jones Target 2010 FundSM, Wells Fargo Advantage Dow Jones Target 2015 FundSM, Wells Fargo Advantage Dow Jones Target 2020 FundSM, Wells Fargo Advantage Dow Jones Target 2025 FundSM, Wells Fargo Advantage Dow Jones Target 2030 FundSM, Wells Fargo Advantage Dow Jones Target 2035 FundSM, Wells Fargo Advantage Dow Jones Target 2040 FundSM, Wells Fargo Advantage Dow Jones Target 2045 FundSM, Wells Fargo Advantage Dow Jones Target 2050 FundSM, Wells Fargo Advantage Dow Jones Target 2055 FundSM, Wells Fargo Advantage Heritage Money Market FundSM, Wells Fargo Advantage VT Discovery FundSM, and Wells Fargo Advantage VT Opportunity FundSM are referred to as the Discovery Fund, Endeavor Select Fund, Enterprise Fund, Opportunity Fund, WealthBuilder Conservative Allocation Portfolio, WealthBuilder Equity Portfolio, WealthBuilder Growth Allocation Portfolio, WealthBuilder Growth Balanced Portfolio, WealthBuilder Moderate Balanced Portfolio, WealthBuilder Tactical Equity Portfolio, Target Today Fund, Target 2010 Fund, Target 2015 Fund, Target 2020 Fund, Target 2025 Fund, Target 2030 Fund, Target 2035 Fund, Target 2040 Fund, Target 2045 Fund, Target 2050 Fund, Target 2055 Fund, Heritage Money Market Fund, VT Discovery Fund, and VT Opportunity Fund, respectively. |
Not part of the semi-annual report.
| | | | |
| 2 | | Wells Fargo Advantage International Equity Fund | | Letter to Shareholders |

Karla M. Rabusch,
President
Wells Fargo Advantage Funds
The period was marked by continued concerns about the possible global economic effects of the ongoing European sovereign debt crisis that began in Greece and later spread to the larger economies of Italy and Spain.
The potential for sovereign debt default had a negative effect on emerging markets, with indexes in major countries such as Brazil and India ending the period with losses.
Dear Valued Shareholder:
We’re pleased to offer you this semi-annual report for the Wells Fargo Advantage International Equity Fund for the six-month period that ended April 30, 2012. The period was marked by continued concerns about the possible global economic effects of the ongoing European sovereign debt crisis that began in Greece and later spread to the larger economies of Italy and Spain. Widespread support from central banks helped push developed market indexes to gains, but several emerging markets posted losses for the period.
Macroeconomic optimism seemed to fade as global growth slowed and worries rose.
Prior to and throughout the reporting period, concerns about the eurozone sovereign debt situation returned to center stage. Investors became increasingly concerned that Greece would default on its debt, a scenario that only seemed more likely as eurozone leaders began to openly discuss a “voluntary” haircut on Greek debt for private investors. Because many eurozone banks owned Greek debt and many U.S. banks had financial ties to eurozone banks, investors worried about the effects of such an event on the financial systems and on the global economy.
In October 2011, market participants turned their attention to the debt burdens of Italy—which, like the U.S., also had its credit rating downgraded by Standard & Poor’s—because even though it had a relatively modest budget deficit, it had a high amount of outstanding debt and a stagnant economy. French banks were heavily exposed to Italian debt, so Italy’s woes led to fears of a state bailout of French banks and a resulting increase in France’s expenditures.
The Greek credit crisis was seemingly addressed in March 2012, when the Greek government came to an agreement with its creditors that allowed it to write down the principal on most of its bonds in exchange for increased financial austerity. The Greek agreement, combined with unprecedented support for eurozone banks by the European Central Bank (ECB), seemed to calm investor concerns, at least temporarily, and most developed markets—both in Europe and Asia—ended the period with gains. The potential for sovereign debt default had a negative effect on emerging markets, with indexes in major countries such as Brazil and India ending the period with losses. China was a notable exception, posting a gain.
The U.S. economy reported relatively solid news.
In contrast to worrisome data from the eurozone, U.S. economic data remained moderately positive. Reported gross domestic product (GDP) growth came in at a 1.8% annualized rate in the third quarter of 2011 and then accelerated to a 3.0% annualized rate in the fourth quarter. The initial estimate for GDP growth in the first quarter of 2012 came in at a 2.2% annualized rate, further supporting the case for economic recovery. In addition, the major banks appeared to have taken steps toward repairing their balance sheets; in March, the Federal Reserve (Fed) announced that 15 of the 19 major banks had passed a “stress test” in which the Fed attempted to gauge whether the banks could survive a severe recession that included a 50% drop in the stock market and a 21% percent decline in housing prices.
| | | | | | |
| Letter to Shareholders | | Wells Fargo Advantage International Equity Fund | | | 3 | |
Financial stocks rebounded and outperformed the broader market for the reporting period after the Fed released details of the stress test. Stocks generally rallied across the market as investors seemed to be increasingly confident that the U.S. would not return to recession.
Central banks continued to provide stimulus.
Throughout the reporting period, the Federal Open Market Committee kept its key interest rates effectively at zero in order to support the economy and financial system. In response to extreme market volatility and signs of a weakening economy, the Fed announced its intention to keep interest rates low until at least late 2014.
Likewise, the Bank of Japan voted in late April to keep its key policy rate in a range of 0.0% to 0.1%. The bank announced that it would expand its government bond purchases by 10 trillion yen ($123.8 billion), targeting a 1.0% inflation rate in an attempt to end the country’s multi-year deflation.
As of November 1, 2011, the ECB had a key rate of 1.50%, which it had increased from 1.0% in an attempt to keep inflation in check. Soon, in response to weakness in the southern European economies, the ECB lowered its key rate to 1.25% in early November 2011 and 1.0% in December 2011. The ECB also continued to provide virtually unlimited liquidity for banks, announcing a Long-Term Refinancing Operation in December through which it provided low-cost three-year loans to lenders.
We use time-tested investment strategies, even as many variables are at work in the market.
Elevated unemployment and debt defaults continue to pressure consumers and businesses alike. In our experience, strict adherence to time-tested investment strategies has its rewards. As a whole, Wells Fargo Advantage Funds represents investments across a range of asset classes and investment styles, giving you an opportunity to create a diversified investment portfolio. While diversification may not prevent losses in a downturn, we believe it helps in managing risk.
Thank you for choosing to invest with Wells Fargo Advantage Funds. We appreciate your confidence in us and remain committed to helping you meet your financial needs. For current information about your fund investments, contact your investment professional, visit our Web site at wellsfargoadvantagefunds.com, or call us directly at 1-800-222-8222. We are available 24 hours a day, 7 days a week.
Sincerely,

Karla M. Rabusch
President
Wells Fargo Advantage Funds
| | | | |
| 4 | | Wells Fargo Advantage International Equity Fund | | Letter to Shareholders |
Notice to Shareholders
The Board of Trustees for Wells Fargo Advantage Funds has unanimously approved the following modifications to certain net asset value (NAV) waiver privileges and commission schedules:
| | n | | Effective May 1, 2012, automatic investment plan (AIP) purchases and proceeds received from systematic withdrawals will no longer qualify for NAV repurchase privileges. | |
| | n | | Effective May 1, 2012, discretionary rights to waive the upfront commission for Class C and “jumbo” Class A share purchases will no longer be granted to broker/dealers. However, we will continue to waive the Class C shares contingent deferred sales charge for redemptions by employer-sponsored retirement plans where the dealer of record waived its commission at the time of purchase. | |
| | n | | Effective July 31, 2012, NAV purchase privileges for former Evergreen Class IS and Class R shareholders are being modified to remove the ability to purchase Class A shares at NAV unless those shares are held directly with the Fund on or after July 31, 2012. | |
Please contact your investment professional or call us directly at 1-800-222-8222 if you have any questions on this Notice to Shareholders.
| | | | | | |
| Performance Highlights (Unaudited) | | Wells Fargo Advantage International Equity Fund | | | 5 | |
INVESTMENT OBJECTIVE
The Fund seeks long-term capital appreciation.
ADVISER
Wells Fargo Funds Management, LLC
SUB-ADVISER
Wells Capital Management Incorporated
PORTFOLIO MANAGERS
Jeffrey Everett, CFA
Dale A. Winner, CFA
FUND INCEPTION
September 6, 1979
| | | | |
TEN LARGEST EQUITY HOLDINGS1 (AS OF APRIL 30, 2012) | |
Smiths Group plc | | | 2.29% | |
China Mobile Limited | | | 2.22% | |
BP plc | | | 2.19% | |
Statoil ASA | | | 2.14% | |
William Morrison Supermarkets plc | | | 2.11% | |
Bayer AG | | | 2.06% | |
Cenovus Energy Incorporated | | | 2.06% | |
Novartis AG | | | 2.05% | |
E.ON AG | | | 2.04% | |
Siemens AG | | | 2.04% | |
| | |
SECTOR DISTRIBUTION2 (AS OF APRIL 30, 2012) | | |
|
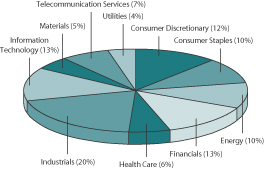 |
| 1. | The ten largest equity holdings are calculated based on the value of the securities divided by total net assets of the Fund. Holdings are subject to change and may have changed since the date specified. |
| 2. | Sector distribution is subject to change and is calculated based on the total long-term investments of the Fund. |
| | | | |
| 6 | | Wells Fargo Advantage International Equity Fund | | Performance Highlights (Unaudited) |
AVERAGE ANNUAL TOTAL RETURN3 (%) (AS OF APRIL 30, 2012)
| | | | | | | | | | | | | | | | | | | | | | | | | | | | | | | | | | | | | | | | | | | | |
| | | | | | Including Sales Charge | | | Excluding Sales Charge | | | Expense Ratios4 | |
| | | Inception Date | | | 6 Months* | | | 1 Year | | | 5 Year | | | 10 Year | | | 6 Months* | | | 1 Year | | | 5 Year | | | 10 Year | | | Gross | | | Net5 | |
Class A (WFEAX) | | | 01/20/1998 | | | | (3.05 | ) | | | (20.14 | ) | | | (6.17 | ) | | | 3.65 | | | | 2.87 | | | | (15.25 | ) | | | (5.05 | ) | | | 4.26 | | | | 1.47% | | | | 1.10% | |
Class B (WFEBX)** | | | 09/06/1979 | | | | (2.62 | ) | | | (20.13 | ) | | | (6.10 | ) | | | 3.74 | | | | 2.38 | | | | (15.97 | ) | | | (5.78 | ) | | | 3.74 | | | | 2.22% | | | | 1.85% | |
Class C (WFEFX) | | | 03/06/1998 | | | | 1.45 | | | | (16.95 | ) | | | (5.77 | ) | | | 3.49 | | | | 2.45 | | | | (15.95 | ) | | | (5.77 | ) | | | 3.49 | | | | 2.22% | | | | 1.85% | |
Class R (WFERX) | | | 10/10/2003 | | | | | | | | | | | | | | | | | | | | 2.73 | | | | (15.49 | ) | | | (5.31 | ) | | | 4.00 | | | | 1.72% | | | | 1.35% | |
Administrator Class (WFEDX) | | | 07/16/2010 | | | | | | | | | | | | | | | | | | | | 2.84 | | | | (15.30 | ) | | | (4.92 | ) | | | 4.49 | | | | 1.31% | | | | 1.10% | |
Institutional Class (WFENX) | | | 03/09/1998 | | | | | | | | | | | | | | | | | | | | 2.99 | | | | (15.00 | ) | | | (4.82 | ) | | | 4.54 | | | | 1.04% | | | | 0.85% | |
MSCI EAFE® Free Index (Net)6 | | | | | | | | | | | | | | | | | | | | | | | 2.73 | | | | (12.90 | ) | | | (2.75 | ) | | | 7.05 | | | | | | | | | |
| * | Returns for periods of less than one year are not annualized. |
| ** | Class B shares are closed to investment, except in connection with the reinvestment of any distributions and permitted exchanges. |
Figures quoted represent past performance, which is no guarantee of future results and do not reflect the deduction of taxes that a shareholder may pay on fund distributions or the redemption of fund shares. Investment return and principal value of an investment will fluctuate so that an investor’s shares, when redeemed, may be worth more or less than their original cost. Performance shown without sales charges would be lower if sales charges were reflected. Current performance may be lower or higher than the performance data quoted and assumes the reinvestment of dividends and capital gains. Current month-end performance is available on the Fund’s Web site – wellsfargoadvantagefunds.com.
Index returns do not include transaction costs associated with buying and selling securities, any mutual fund fees or expenses or any taxes. It is not possible to invest directly in an index.
For Class A shares, the maximum front-end sales charge is 5.75%. For Class B shares, the maximum contingent deferred sales charge is 5.00%. For Class C shares, the maximum contingent deferred sales charge is 1.00%. Performance including sales charge assumes the sales charge for the corresponding time period. Class R, Administrator Class and Institutional Class shares are sold without a front-end sales charge or contingent deferred sales charge.
Stock fund values fluctuate in response to the activities of individual companies and general market and economic conditions. Foreign investments are especially volatile and can rise or fall dramatically due to differences in the political and economic conditions of the host country. These risks are generally intensified in emerging markets. The use of derivatives may reduce returns and/or increase volatility. Certain investment strategies tend to increase the total risk of an investment (relative to the broader market). This Fund is exposed to smaller-company securities risk. Consult the Fund’s prospectus for additional information on these and other risks.
| 3. | Historical performance shown for the Administrator Class shares prior to their inception reflects the performance of the Institutional Class shares, adjusted to reflect the higher expenses applicable to the Administrator Class shares. Historical performance shown for Class R shares prior to their inception reflects the performance of Class A shares, adjusted to reflect the higher expenses applicable to Class R shares. Historical performance shown for all classes of the Fund prior to July 19, 2010 is based on the performance of the Fund’s predecessor, Evergreen International Equity Fund. |
| 4. | Reflects the expense ratios as stated in the most recent prospectuses. |
| 5. | The Adviser has committed through July 18, 2013 to waive fees and/or reimburse expenses to the extent necessary to cap the Fund’s Total Annual Fund Operating Expenses After Fee Waiver, excluding certain expenses, at 1.09% for Class A, 1.84% for Class B, 1.84% for Class C, 1.34% for Class R, 1.09% for Administrator Class and 0.84% for Institutional Class. Without this cap, the Fund’s returns would have been lower. |
| 6. | The Morgan Stanley Capital International Europe, Australasia, and Far East Free (“MSCI EAFE Free”) Index (Net) is an unmanaged group of securities widely regarded by investors to be representative of the stock markets of Europe, Australasia, and the Far East. MSCI Free Indexes are constructed to reflect investment opportunities for global investors to account for local market restrictions on stock ownership by international investors. You cannot invest directly in an index. Source: MSCI. MSCI makes no express or implied warranties or representations and shall have no liability whatsoever with respect to any MSCI data contained herein. The MSCI data may not be further redistributed or used as a basis for other indexes or any securities or financial products. This report is not approved, reviewed, or produced by MSCI. |
| | | | | | |
| Fund Expenses (Unaudited) | | Wells Fargo Advantage International Equity Fund | | | 7 | |
As a shareholder of the Fund, you incur two types of costs: (1) transaction costs, including sales charges (loads) on purchase payments and contingent deferred sales charges (if any) on redemptions and (2) ongoing costs, including management fees; distribution (12b-1) and/or shareholder service fees; and other Fund expenses. This example is intended to help you understand your ongoing costs (in dollars) of investing in the Fund and to compare these costs with the ongoing costs of investing in other mutual funds.
The example is based on an investment of $1,000 invested at the beginning of the six-month period and held for the entire period from November 1, 2011 to April 30, 2012.
Actual Expenses
The “Actual” line of the table below provides information about actual account values and actual expenses. You may use the information in this line, together with the amount you invested, to estimate the expenses that you paid over the period. Simply divide your account value by $1,000 (for example, an $8,600 account value divided by $1,000 = 8.6), then multiply the result by the number in the “Actual” line under the heading entitled “Expenses Paid During Period” for your applicable class of shares to estimate the expenses you paid on your account during this period.
Hypothetical Example for Comparison Purposes
The “Hypothetical” line of the table below provides information about hypothetical account values and hypothetical expenses based on the Fund’s actual expense ratio and an assumed rate of return of 5% per year before expenses, which is not the Fund’s actual return. The hypothetical account values and expenses may not be used to estimate the actual ending account balance or expenses you paid for the period. You may use this information to compare the ongoing costs of investing in the Fund and other funds. To do so, compare this 5% hypothetical example with the 5% hypothetical examples that appear in the shareholder reports of the other funds.
Please note that the expenses shown in the table are meant to highlight your ongoing costs only and do not reflect any transactional costs, such as sales charges (loads) and contingent deferred sales charges. Therefore, the “Hypothetical” line of the table is useful in comparing ongoing costs only, and will not help you determine the relative total costs of owning different funds. In addition, if these transactional costs were included, your costs would have been higher.
| | | | | | | | | | | | | | | | |
| | | Beginning
Account Value
11-01-2011 | | | Ending
Account Value
04-30-2012 | | | Expenses
Paid During
the Period1 | | | Net Annual
Expense Ratio | |
Class A | | | | | | | | | | | | | | | | |
Actual | | $ | 1,000.00 | | | $ | 1,028.72 | | | $ | 5.50 | | | | 1.09 | % |
Hypothetical (5% return before expenses) | | $ | 1,000.00 | | | $ | 1,019.44 | | | $ | 5.47 | | | | 1.09 | % |
Class B | | | | | | | | | | | | | | | | |
Actual | | $ | 1,000.00 | | | $ | 1,023.78 | | | $ | 9.26 | | | | 1.84 | % |
Hypothetical (5% return before expenses) | | $ | 1,000.00 | | | $ | 1,015.71 | | | $ | 9.22 | | | | 1.84 | % |
Class C | | | | | | | | | | | | | | | | |
Actual | | $ | 1,000.00 | | | $ | 1,024.53 | | | $ | 9.26 | | | | 1.84 | % |
Hypothetical (5% return before expenses) | | $ | 1,000.00 | | | $ | 1,015.71 | | | $ | 9.22 | | | | 1.84 | % |
Class R | | | | | | | | | | | | | | | | |
Actual | | $ | 1,000.00 | | | $ | 1,027.28 | | | $ | 6.75 | | | | 1.34 | % |
Hypothetical (5% return before expenses) | | $ | 1,000.00 | | | $ | 1,018.20 | | | $ | 6.72 | | | | 1.34 | % |
Administrator Class | | | | | | | | | | | | | | | | |
Actual | | $ | 1,000.00 | | | $ | 1,028.37 | | | $ | 5.50 | | | | 1.09 | % |
Hypothetical (5% return before expenses) | | $ | 1,000.00 | | | $ | 1,019.44 | | | $ | 5.47 | | | | 1.09 | % |
Institutional Class | | | | | | | | | | | | | | | | |
Actual | | $ | 1,000.00 | | | $ | 1,029.87 | | | $ | 4.24 | | | | 0.84 | % |
Hypothetical (5% return before expenses) | | $ | 1,000.00 | | | $ | 1,020.69 | | | $ | 4.22 | | | | 0.84 | % |
| 1. | Expenses paid is equal to the annualized expense ratio of each class multiplied by the average account value over the period, multiplied by the number of days in the most recent fiscal half-year divided by the number of days in the fiscal year (to reflect the one-half year period). |
| | | | |
| 8 | | Wells Fargo Advantage International Equity Fund | | Portfolio of Investments—April 30, 2012 (Unaudited) |
| | | | | | | | | | | | |
| Security Name | | | | | | Shares | | | Value | |
| | | | | | | | | | | | |
| | | | |
Common Stocks: 97.44% | | | | | | | | | | | | |
| | | | |
| Argentina: 0.07% | | | | | | | | | | | | |
IRSA Inversiones y Representaciones SA ADR (Financials, Real Estate Management & Development) | | | | | | | 30,223 | | | $ | 238,157 | |
| | | | | | | | | | | | |
| | | | |
| Australia: 0.87% | | | | | | | | | | | | |
BHP Billiton Limited (Materials, Metals & Mining) | | | | | | | 84,805 | | | | 3,141,289 | |
| | | | | | | | | | | | |
| | | | |
| Bermuda: 3.38% | | | | | | | | | | | | |
Cosan Limited Class A (Consumer Staples, Food Products) | | | | | | | 398,670 | | | | 5,517,593 | |
Jardine Matheson Holdings Limited (Industrials, Industrial Conglomerates) | | | | | | | 84,000 | | | | 4,170,600 | |
Ports Design Limited (Consumer Discretionary, Textiles, Apparel & Luxury Goods) (i)(a) | | | | | | | 1,667,959 | | | | 2,450,779 | |
| | | | |
| | | | | | | | | | | 12,138,972 | |
| | | | | | | | | | | | |
| | | | |
| Canada: 4.57% | | | | | | | | | | | | |
Cenovus Energy Incorporated (Energy, Oil, Gas & Consumable Fuels) | | | | | | | 204,573 | | | | 7,415,771 | |
Suncor Energy Incorporated (Energy, Oil, Gas & Consumable Fuels) | | | | | | | 59,908 | | | | 1,978,841 | |
Valeant Pharmaceuticals International Incorporated (Health Care, Pharmaceuticals) † | | | | | | | 126,138 | | | | 7,017,057 | |
| | | | |
| | | | | | | | | | | 16,411,669 | |
| | | | | | | | | | | | |
| | | | |
| Cayman Islands: 1.40% | | | | | | | | | | | | |
Hengdeli Holdings Limited (Consumer Discretionary, Specialty Retail) | | | | | | | 12,573,522 | | | | 5,040,007 | |
| | | | | | | | | | | | |
| | | | |
| China: 1.77% | | | | | | | | | | | | |
Industrial & Commercial Bank of China Class H (Financials, Commercial Banks) | | | | | | | 7,334,000 | | | | 4,896,486 | |
LDK Solar Company Limited ADR (Information Technology, Electronic Equipment, Instruments & Components) †« | | | | | | | 458,526 | | | | 1,458,113 | |
| | | | |
| | | | | | | | | | | 6,354,599 | |
| | | | | | | | | | | | |
| | | | |
| Denmark: 1.52% | | | | | | | | | | | | |
A.P. Moller-Maersk AS Class B (Industrials, Marine) | | | | | | | 698 | | | | 5,459,606 | |
| | | | | | | | | | | | |
| | | | |
| Finland: 1.46% | | | | | | | | | | | | |
Metso Corporation (Industrials, Machinery) | | | | | | | 122,507 | | | | 5,254,067 | |
| | | | | | | | | | | | |
| | | | |
| France: 1.61% | | | | | | | | | | | | |
Total SA (Energy, Oil, Gas & Consumable Fuels) | | | | | | | 121,110 | | | | 5,782,502 | |
| | | | | | | | | | | | |
| | | | |
| Germany: 12.16% | | | | | | | | | | | | |
Allianz AG (Financials, Insurance) | | | | | | | 47,215 | | | | 5,261,125 | |
Bayer AG (Health Care, Pharmaceuticals) « | | | | | | | 105,325 | | | | 7,418,471 | |
E.ON AG (Utilities, Electric Utilities) « | | | | | | | 324,425 | | | | 7,349,891 | |
Metro AG (Consumer Staples, Food & Staples Retailing) | | | | | | | 208,858 | | | | 6,738,844 | |
SAP AG (Information Technology, Software) | | | | | | | 83,673 | | | | 5,547,867 | |
Siemens AG (Industrials, Industrial Conglomerates) | | | | | | | 79,044 | | | | 7,321,001 | |
Wincor Nixdorf AG (Information Technology, Computers & Peripherals) | | | | | | | 105,391 | | | | 4,086,134 | |
| | | | |
| | | | | | | | | | | 43,723,333 | |
| | | | | | | | | | | | |
| | | | |
| Hong Kong: 5.63% | | | | | | | | | | | | |
China Everbright Limited (Financials, Diversified Financial Services) | | | | | | | 3,300,000 | | | | 5,240,087 | |
China Mobile Limited (Telecommunication Services, Wireless Telecommunication Services) | | | | | | | 720,500 | | | | 7,981,669 | |
The accompanying notes are an integral part of these financial statements.
| | | | | | |
| Portfolio of Investments—April 30, 2012 (Unaudited) | | Wells Fargo Advantage International Equity Fund | | | 9 | |
| | | | | | | | | | | | |
| Security Name | | | | | | Shares | | | Value | |
| | | | | | | | | | | | |
| | | | |
| Hong Kong (continued) | | | | | | | | | | | | |
China Resources Power Holdings Company (Utilities, Independent Power Producers & Energy Traders) | | | | | | | 3,840,000 | | | $ | 7,008,230 | |
| | | | |
| | | | | | | | | | | 20,229,986 | |
| | | | | | | | | | | | |
| | | | |
| Italy: 1.59% | | | | | | | | | | | | |
ENI SpA (Energy, Oil, Gas & Consumable Fuels) | | | | | | | 257,236 | | | | 5,710,242 | |
| | | | | | | | | | | | |
| | | | |
| Japan: 18.09% | | | | | | | | | | | | |
Asahi Glass Company Limited (Industrials, Building Products) | | | | | | | 605,000 | | | | 4,796,656 | |
Canon Incorporated (Information Technology, Office Electronics) | | | | | | | 132,700 | | | | 6,099,812 | |
Capcom Company Limited (Information Technology, Software) | | | | | | | 217,800 | | | | 4,983,975 | |
FamilyMart Company Limited (Consumer Staples, Food & Staples Retailing) | | | | | | | 146,500 | | | | 6,532,315 | |
Itochu Corporation (Industrials, Trading Companies & Distributors) | | | | | | | 433,000 | | | | 4,913,552 | |
Mitsubishi UFJ Financial Group Incorporated (Financials, Commercial Banks) | | | | | | | 685,200 | | | | 3,321,298 | |
Mitsui OSK Lines Limited (Industrials, Marine) | | | | | | | 1,676,000 | | | | 6,549,499 | |
Nintendo Company Limited (Information Technology, Software) | | | | | | | 41,900 | | | | 5,720,316 | |
Nissan Motor Company Limited (Consumer Discretionary, Automobiles) | | | | | | | 581,900 | | | | 6,093,041 | |
Nitto Denko Corporation (Materials, Chemicals) | | | | | | | 175,192 | | | | 7,263,095 | |
Toyota Motor Corporation (Consumer Discretionary, Automobiles) | | | | | | | 132,700 | | | | 5,493,155 | |
USS Company Limited (Consumer Discretionary, Specialty Retail) | | | | | | | 31,900 | | | | 3,248,334 | |
| | | | |
| | | | | | | | | | | 65,015,048 | |
| | | | | | | | | | | | |
| | | | |
| Netherlands: 1.84% | | | | | | | | | | | | |
Akzo Nobel NV (Materials, Chemicals) « | | | | | | | 123,554 | | | | 6,621,260 | |
| | | | | | | | | | | | |
| | | | |
| Norway: 2.14% | | | | | | | | | | | | |
Statoil ASA (Energy, Oil, Gas & Consumable Fuels) | | | | | | | 288,344 | | | | 7,698,645 | |
| | | | | | | | | | | | |
| | | | |
| Philippines: 1.09% | | | | | | | | | | | | |
Philippine Long Distance Telephone Company (Telecommunication Services, Wireless
Telecommunication Services) | | | | | | | 64,055 | | | | 3,926,441 | |
| | | | | | | | | | | | |
| | | | |
| Russia: 2.73% | | | | | | | | | | | | |
Mobile Telesystems ADR (Telecommunication Services, Wireless Telecommunication Services) | | | | | | | 207,064 | | | | 4,050,172 | |
Sberbank of Russia (Financials, Commercial Banks) | | | | | | | 1,792,688 | | | | 5,751,588 | |
| | | | |
| | | | | | | | | | | 9,801,760 | |
| | | | | | | | | | | | |
| | | | |
| Singapore: 2.66% | | | | | | | | | | | | |
DBS Group Holdings Limited (Financials, Commercial Banks) | | | | | | | 619,000 | | | | 6,982,820 | |
Indofood Agri Resources Limited (Consumer Staples, Food Products) † | | | | | | | 2,235,198 | | | | 2,573,864 | |
| | | | |
| | | | | | | | | | | 9,556,684 | |
| | | | | | | | | | | | |
| | | | |
| South Korea: 2.99% | | | | | | | | | | | | |
Samsung Electronics GDR (Information Technology, Semiconductors & Semiconductor Equipment) 144A | | | | | | | 9,499 | | | | 5,841,659 | |
SK Telecom Company Limited (Telecommunication Services, Wireless Telecommunication Services) | | | | | | | 41,098 | | | | 4,909,395 | |
| | | | |
| | | | | | | | | | | 10,751,054 | |
| | | | | | | | | | | | |
| | | | |
| Sweden: 2.34% | | | | | | | | | | | | |
Hennes & Mauritz AB Class B (Consumer Discretionary, Specialty Retail) | | | | | | | 107,750 | | | | 3,701,587 | |
The accompanying notes are an integral part of these financial statements.
| | | | |
| 10 | | Wells Fargo Advantage International Equity Fund | | Portfolio of Investments—April 30, 2012 (Unaudited) |
| | | | | | | | | | | | | | |
| Security Name | | | | | | | Shares | | | Value | |
| | | | | | | | | | | | | | |
| | | | | | | | | | | | | | |
| | | | |
| Sweden (continued) | | | | | | | | | | | | | | |
Volvo AB Class B (Consumer Discretionary, Automobiles) | | | | | | | | | 339,791 | | | $ | 4,711,666 | |
| | | | |
| | | | | | | | | | | | | 8,413,253 | |
| | | | | | | | | | | | | | |
| | | | |
| Switzerland: 9.54% | | | | | | | | | | | | | | |
ABB Limited (Industrials, Electrical Equipment) | | | | | | | | | 234,956 | | | | 4,281,576 | |
Compagnie Financiere Richemont SA (Consumer Discretionary, Textiles, Apparel & Luxury Goods) | | | | | | | | | 87,235 | | | | 5,391,818 | |
Julius Baer Group Limited (Financials, Capital Markets) | | | | | | | | | 159,659 | | | | 6,112,654 | |
Novartis AG (Health Care, Pharmaceuticals) | | | | | | | | | 133,382 | | | | 7,355,004 | |
Swatch Group AG Class B (Consumer Discretionary, Textiles, Apparel & Luxury Goods) | | | | | | | | | 11,804 | | | | 5,443,898 | |
Zurich Financial Services AG (Financials, Insurance) | | | | | | | | | 23,328 | | | | 5,705,741 | |
| | | | |
| | | | | | | | | | | | | 34,290,691 | |
| | | | | | | | | | | | | | |
| | | | |
| Taiwan: 1.75% | | | | | | | | | | | | | | |
High Tech Computer Corporation (Information Technology, Communications Equipment) | | | | | | | | | 248,000 | | | | 3,761,371 | |
Taiwan Semiconductor Manufacturing Company Limited ADR (Information Technology, Semiconductors & Semiconductor Equipment) | | | | | | | | | 162,178 | | | | 2,526,733 | |
| | | | |
| | | | | | | | | | | | | 6,288,104 | |
| | | | | | | | | | | | | | |
| | | | |
| Thailand: 0.05% | | | | | | | | | | | | | | |
Bumrungrad Hospital Public Company Limited (Health Care, Health Care Providers & Services) | | | | | | | | | 91,700 | | | | 181,909 | |
| | | | | | | | | | | | | | |
| | | | |
| United Kingdom: 14.82% | | | | | | | | | | | | | | |
BP plc (Energy, Oil, Gas & Consumable Fuels) | | | | | | | | | 1,087,862 | | | | 7,856,435 | |
Capita Group plc (Industrials, Commercial Services & Supplies) | | | | | | | | | 535,215 | | | | 5,758,820 | |
Chemring Group plc (Industrials, Aerospace & Defense) | | | | | | | | | 874,399 | | | | 4,633,237 | |
Man Group plc (Financials, Capital Markets) | | | | | | | | | 1,520,436 | | | | 2,553,878 | |
Reckitt Benckiser Group (Consumer Staples, Household Products) | | | | | | | | | 89,121 | | | | 5,188,038 | |
Smiths Group plc (Industrials, Industrial Conglomerates) | | | | | | | | | 473,962 | | | | 8,230,363 | |
Vodafone Group plc ADR (Telecommunication Services, Wireless Telecommunication Services) « | | | | | | | | | 192,071 | | | | 5,345,336 | |
William Morrison Supermarkets plc (Consumer Staples, Food & Staples Retailing) | | | | | | | | | 1,662,501 | | | | 7,570,791 | |
Wolseley plc (Industrials, Trading Companies & Distributors) | | | | | | | | | 161,270 | | | | 6,132,218 | |
| | | | |
| | | | | | | | | | | | | 53,269,116 | |
| | | | | | | | | | | | | | |
| | | | |
| United States: 1.37% | | | | | | | | | | | | | | |
Amdocs Limited (Information Technology, IT Services) † | | | | | | | | | 154,216 | | | | 4,934,912 | |
| | | | | | | | | | | | | | |
| | | |
Total Common Stocks (Cost $350,393,928) | | | | | | | | | | 350,233,306 | |
| | | | | | | | | | | | | | |
| Short-Term Investments: 9.50% | | | | | | | | | | | | | | |
| | | | |
| | | Yield | | | | | | | | | |
| | | | |
| Investment Companies: 9.50% | | | | | | | | | | | | | | |
Wells Fargo Advantage Cash Investment Money Market Fund, Select Class (l)(u) | | | 0.11 | % | | | | | 5,713,174 | | | | 5,713,174 | |
Wells Fargo Securities Lending Cash Investments, LLC (l)(u)(v)(r) | | | 0.19 | | | | | | 28,423,420 | | | | 28,423,420 | |
| | | | |
Total Short-Term Investments (Cost $34,136,594) | | | | | | | | | | | | | 34,136,594 | |
| | | | | | | | | | | | | | |
| | | | | | | | |
| Total Investments in Securities | | | | | | | | |
| (Cost $384,530,522)* | | | 106.94 | % | | | 384,369,900 | |
Other Assets and Liabilities, Net | | | (6.94 | ) | | | (24,941,302 | ) |
| | | | | | | | |
| Total Net Assets | | | 100.00 | % | | $ | 359,428,598 | |
| | | | | | | | |
The accompanying notes are an integral part of these financial statements.
| | | | | | |
| Portfolio of Investments—April 30, 2012 (Unaudited) | | Wells Fargo Advantage International Equity Fund | | | 11 | |
| † | Non-income earning security |
| « | All or a portion of this security is on loan. |
| (a) | Security is fair valued by the Management Valuation Team, and in certain instances by the Board of Trustees, in accordance with procedures approved by the Board of Trustees. |
| 144A | Security that may be resold to “qualified institutional buyers” under Rule 144A or security offered pursuant to Section 4(2) of the Securities Act of 1933, as amended. |
| (l) | Investment in an affiliate. |
| (u) | Rate shown is the 7-day annualized yield at period end. |
| (v) | Security represents investment of cash collateral received from securities on loan. |
| (r) | The investment company is exempt from registration under Section 3(c)(7) of the 1940 Act. |
| * | Cost for federal income tax purposes is $397,948,043 and net unrealized appreciation (depreciation) consists of: |
| | | | |
Gross unrealized appreciation | | $ | 6,233,110 | |
Gross unrealized depreciation | | | (19,811,253 | ) |
| | | | |
Net unrealized depreciation | | $ | (13,578,143 | ) |
The accompanying notes are an integral part of these financial statements.
| | | | |
| 12 | | Wells Fargo Advantage International Equity Fund | | Statement of Assets and Liabilities—April 30, 2012 (Unaudited) |
| | | | |
| | | | |
| |
Assets | | | | |
Investments | | | | |
In unaffiliated securities (including securities on loan), at value (see cost below) | | $ | 350,233,306 | |
In affiliated securities, at value (see cost below) | | | 34,136,594 | |
| | | | |
Total investments, at value (see cost below) | | | 384,369,900 | |
Foreign currency, at value (see cost below) | | | 2,290,821 | |
Receivable for Fund shares sold | | | 176,920 | |
Receivable for dividends | | | 2,443,640 | |
Receivable for securities lending income | | | 106,058 | |
Prepaid expenses and other assets | | | 62,348 | |
| | | | |
Total assets | | | 389,449,687 | |
| | | | |
| |
Liabilities | | | | |
Payable for investments purchased | | | 703,451 | |
Payable for Fund shares redeemed | | | 419,881 | |
Payable upon receipt of securities loaned | | | 28,423,420 | |
Advisory fee payable | | | 151,928 | |
Distribution fees payable | | | 19,658 | |
Due to other related parties | | | 65,931 | |
Accrued expenses and other liabilities | | | 236,820 | |
| | | | |
Total liabilities | | | 30,021,089 | |
| | | | |
Total net assets | | $ | 359,428,598 | |
| | | | |
| |
NET ASSETS CONSIST OF | | | | |
Paid-in capital | | $ | 404,128,030 | |
Undistributed net investment income | | | 3,125,428 | |
Accumulated net realized losses on investments | | | (47,786,005 | ) |
Net unrealized losses on investments | | | (38,855 | ) |
| | | | |
Total net assets | | $ | 359,428,598 | |
| | | | |
| |
COMPUTATION OF NET ASSET VALUE AND OFFERING PRICE PER SHARE1 | | | | |
Net assets – Class A | | $ | 148,940,115 | |
Shares outstanding – Class A | | | 15,094,463 | |
Net asset value per share – Class A | | | $9.87 | |
Maximum offering price per share – Class A2 | | | $10.47 | |
Net assets – Class B | | $ | 10,323,638 | |
Shares outstanding – Class B | | | 1,075,065 | |
Net asset value per share – Class B | | | $9.60 | |
Net assets – Class C | | $ | 20,304,311 | |
Shares outstanding – Class C | | | 2,090,719 | |
Net asset value per share – Class C | | | $9.71 | |
Net assets – Class R | | $ | 2,435,304 | |
Shares outstanding – Class R | | | 247,021 | |
Net asset value per share – Class R | | | $9.86 | |
Net assets – Administrator Class | | $ | 3,799,914 | |
Shares outstanding – Administrator Class | | | 391,187 | |
Net asset value per share – Administrator Class | | | $9.71 | |
Net assets – Institutional Class | | $ | 173,625,316 | |
Shares outstanding – Institutional Class | | | 17,635,223 | |
Net asset value per share – Institutional Class | | | $9.85 | |
| |
Investments in unaffiliated securities, at cost | | $ | 350,393,928 | |
| | | | |
Investments in affiliated securities, at cost | | $ | 34,136,594 | |
| | | | |
Total investments, at cost | | $ | 384,530,522 | |
| | | | |
Securities on loan, at value | | $ | 27,140,862 | |
| | | | |
Foreign currency, at cost | | $ | 2,273,194 | |
| | | | |
| 1. | The Fund has an unlimited number of authorized shares. |
| 2. | Maximum offering price is computed as 100/94.25 of net asset value. On investments of $50,000 or more, the offering price is reduced. |
The accompanying notes are an integral part of these financial statements.
| | | | | | |
| Statement of Operations—Six Months Ended April 30, 2012 (Unaudited) | | Wells Fargo Advantage International Equity Fund | | | 13 | |
| | | | |
| | | | |
| |
Investment income | | | | |
Dividends* | | $ | 5,781,516 | |
Securities lending income, net | | | 268,298 | |
Income from affiliated securities | | | 6,076 | |
| | | | |
Total investment income | | | 6,055,890 | |
| | | | |
| |
Expenses | | | | |
Advisory fee | | | 1,647,162 | |
Administration fees | | | | |
Fund level | | | 96,892 | |
Class A | | | 199,699 | |
Class B | | | 14,903 | |
Class C | | | 27,419 | |
Class R | | | 3,684 | |
Administrator Class | | | 1,664 | |
Institutional Class | | | 78,094 | |
Shareholder servicing fees | | | | |
Class A | | | 192,018 | |
Class B | | | 14,330 | |
Class C | | | 26,364 | |
Class R | | | 3,542 | |
Administrator Class | | | 3,662 | |
Distribution fees | | | | |
Class B | | | 42,990 | |
Class C | | | 79,094 | |
Class R | | | 3,542 | |
Custody and accounting fees | | | 66,142 | |
Professional fees | | | 29,298 | |
Registration fees | | | 40,919 | |
Shareholder report expenses | | | 49,764 | |
Trustees’ fees and expenses | | | 6,192 | |
Other fees and expenses | | | 11,320 | |
| | | | |
Total expenses | | | 2,638,694 | |
Less: Fee waivers and/or expense reimbursements | | | (644,871 | ) |
| | | | |
Net expenses | | | 1,993,823 | |
| | | | |
Net investment income | | | 4,062,067 | |
| | | | |
| |
REALIZED AND UNREALIZED GAINS (LOSSES) ON INVESTMENTS | | | | |
| |
Net realized gains (losses) on: | | | | |
Unaffiliated securities | | | 72,338,968 | |
Futures transactions | | | (344,570 | ) |
Forward foreign currency contract transactions | | | (3,376 | ) |
| | | | |
Net realized gains on investments | | | 71,991,022 | |
| | | | |
| |
Net change in unrealized gains (losses) on: | | | | |
Unaffiliated securities | | | (66,612,675 | ) |
Futures transactions | | | 40,820 | |
Forward foreign currency contract transactions | | | 578,821 | |
| | | | |
Net change in unrealized gains (losses) on investments | | | (65,993,034 | ) |
| | | | |
Net realized and unrealized gains (losses) on investments | | | 5,997,988 | |
| | | | |
Net increase in net assets resulting from operations | | $ | 10,060,055 | |
| | | | |
| |
* Net of foreign dividend withholding taxes of | | | $476,872 | |
The accompanying notes are an integral part of these financial statements.
| | | | |
| 14 | | Wells Fargo Advantage International Equity Fund | | Statements of Changes in Net Assets |
| | | | | | | | | | | | | | | | |
| | | Six Months Ended
April 30, 2012
(Unaudited) | | | Year Ended
October 31, 2011 | |
| | | | |
Operations | | | | | | | | | | | | | | | | |
Net investment income | | | | | | $ | 4,062,067 | | | | | | | $ | 9,092,712 | |
Net realized gains on investments | | | | | | | 71,991,022 | | | | | | | | 66,390,703 | |
Net change in unrealized gains (losses) on investments | | | | | | | (65,993,034 | ) | | | | | | | (97,009,099 | ) |
| | | | | | | | | | | | | | | | |
Net increase (decrease) in net assets resulting from operations | | | | | | | 10,060,055 | | | | | | | | (21,525,684 | ) |
| | | | | | | | | | | | | | | | |
| | | | |
Distributions to shareholders from | | | | | | | | | | | | | | | | |
Net investment income | | | | | | | | | | | | | | | | |
Class A | | | | | | | (3,362,916 | ) | | | | | | | (107,552 | ) |
Class B | | | | | | | (122,321 | ) | | | | | | | 0 | |
Class C | | | | | | | (235,205 | ) | | | | | | | 0 | |
Class R | | | | | | | (54,384 | ) | | | | | | | 0 | |
Administrator Class | | | | | | | (72,248 | ) | | | | | | | (11,170 | ) |
Institutional Class | | | | | | | (5,313,952 | ) | | | | | | | (1,065,381 | ) |
| | | | | | | | | | | | | | | | |
Total distributions to shareholders | | | | | | | (9,161,026 | ) | | | | | | | (1,184,103 | ) |
| | | | | | | | | | | | | | | | |
| | | | |
Capital share transactions | | | Shares | | | | | | | | Shares | | | | | |
Proceeds from shares sold | | | | | | | | | | | | | | | | |
Class A | | | 748,671 | | | | 7,196,836 | | | | 1,573,590 | | | | 16,893,853 | |
Class B | | | 1,565 | | | | 13,632 | | | | 8,677 | | | | 90,644 | |
Class C | | | 52,206 | | | | 505,063 | | | | 59,818 | | | | 621,132 | |
Class R | | | 32,571 | | | | 311,359 | | | | 68,130 | | | | 714,220 | |
Administrator Class | | | 80,744 | | | | 780,040 | | | | 447,725 | | | | 4,726,026 | |
Institutional Class | | | 655,460 | | | | 6,391,345 | | | | 2,103,883 | | | | 22,748,643 | |
| | | | | | | | | | | | | | | | |
| | | | | | | 15,198,275 | | | | | | | | 45,794,518 | |
| | | | | | | | | | | | | | | | |
Reinvestment of distributions | | | | | | | | | | | | | | | | |
Class A | | | 337,645 | | | | 2,998,289 | | | | 8,673 | | | | 93,847 | |
Class B | | | 12,825 | | | | 111,195 | | | | 0 | | | | 0 | |
Class C | | | 22,553 | | | | 197,786 | | | | 0 | | | | 0 | |
Class R | | | 3,603 | | | | 31,998 | | | | 0 | | | | 0 | |
Administrator Class | | | 5,501 | | | | 48,081 | | | | 691 | | | | 7,364 | |
Institutional Class | | | 173,700 | | | | 1,538,983 | | | | 28,689 | | | | 309,843 | |
| | | | | | | | | | | | | | | | |
| | | | | | | 4,926,332 | | | | | | | | 411,054 | |
| | | | | | | | | | | | | | | | |
Payment for shares redeemed | | | | | | | | | | | | | | | | |
Class A | | | (2,586,016 | ) | | | (25,050,941 | ) | | | (5,746,363 | ) | | | (61,855,027 | ) |
Class B | | | (297,934 | ) | | | (2,832,420 | ) | | | (671,748 | ) | | | (7,020,162 | ) |
Class C | | | (338,109 | ) | | | (3,214,881 | ) | | | (678,696 | ) | | | (7,119,999 | ) |
Class R | | | (100,728 | ) | | | (998,448 | ) | | | (147,597 | ) | | | (1,541,327 | ) |
Administrator Class | | | (50,299 | ) | | | (485,340 | ) | | | (101,802 | ) | | | (1,087,381 | ) |
Institutional Class | | | (6,308,404 | ) | | | (61,062,751 | ) | | | (14,840,638 | ) | | | (157,161,241 | ) |
| | | | | | | | | | | | | | | | |
| | | | | | | (93,644,781 | ) | | | | | | | (235,785,137 | ) |
| | | | | | | | | | | | | | | | |
Net decrease in net assets resulting from capital share
transactions | | | | | | | (73,520,174 | ) | | | | | | | (189,579,565 | ) |
| | | | | | | | | | | | | | | | |
Total decrease in net assets | | | | | | | (72,621,145 | ) | | | | | | | (212,289,352 | ) |
| | | | | | | | | | | | | | | | |
| | | | |
Net assets | | | | | | | | | | | | | | | | |
Beginning of period | | | | | | | 432,049,743 | | | | | | | | 644,339,095 | |
| | | | | | | | | | | | | | | | |
End of period | | | | | | $ | 359,428,598 | | | | | | | $ | 432,049,743 | |
| | | | | | | | | | | | | | | | |
Undistributed net investment income | | | | | | $ | 3,125,428 | | | | | | | $ | 8,224,387 | |
| | | | | | | | | | | | | | | | |
The accompanying notes are an integral part of these financial statements.
| | | | | | |
| Financial Highlights | | Wells Fargo Advantage International Equity Fund | | | 15 | |
(For a share outstanding throughout each period)
| | | | | | | | | | | | | | | | | | | | | | | | |
| Class A | | Six Months Ended
April 30, 2012 (Unaudited) | | | Year Ended October 31, | |
| | | 2011 | | | 20101 | | | 20091 | | | 20081 | | | 20071 | |
Net asset value, beginning of period | | $ | 9.82 | | | $ | 10.41 | | | $ | 9.14 | | | $ | 8.54 | | | $ | 17.72 | | | $ | 15.51 | |
Net investment income | | | 0.10 | | | | 0.17 | | | | 0.09 | 2 | | | 0.17 | | | | 0.31 | 2 | | | 0.24 | |
Net realized and unrealized gains (losses) on investments | | | 0.16 | | | | (0.75 | ) | | | 1.42 | | | | 0.69 | | | | (7.50 | ) | | | 3.79 | |
| | | | | | | | | | | | | | | | | | | | | | | | |
Total from investment operations | | | 0.26 | | | | (0.58 | ) | | | 1.51 | | | | 0.86 | | | | (7.19 | ) | | | 4.03 | |
Distributions to shareholders from | | | | | | | | | | | | | | | | | | | | | | | | |
Net investment income | | | (0.21 | ) | | | (0.01 | ) | | | (0.24 | ) | | | (0.26 | ) | | | (0.36 | ) | | | (0.43 | ) |
Net realized gains | | | 0.00 | | | | 0.00 | | | | 0.00 | | | | 0.00 | | | | (1.63 | ) | | | (1.39 | ) |
| | | | | | | | | | | | | | | | | | | | | | | | |
Total distributions to shareholders | | | (0.21 | ) | | | (0.01 | ) | | | (0.24 | ) | | | (0.26 | ) | | | (1.99 | ) | | | (1.82 | ) |
Net asset value, end of period | | $ | 9.87 | | | $ | 9.82 | | | $ | 10.41 | | | $ | 9.14 | | | $ | 8.54 | | | $ | 17.72 | |
Total return3 | | | 2.87 | % | | | (5.62 | )% | | | 16.90 | % | | | 10.55 | % | | | (45.46 | )% | | | 28.72 | % |
Ratios to average net assets (annualized) | | | | | | | | | | | | | | | | | | | | | | | | |
Gross expenses | | | 1.52 | % | | | 1.46 | % | | | 1.19 | % | | | 1.08 | % | | | 0.97 | % | | | 0.97 | % |
Net expenses | | | 1.09 | % | | | 1.09 | % | | | 1.07 | % | | | 1.08 | % | | | 0.95 | % | | | 0.95 | % |
Net investment income | | | 2.07 | % | | | 1.55 | % | | | 0.91 | % | | | 2.16 | % | | | 2.30 | % | | | 1.71 | % |
Supplemental data | | | | | | | | | | | | | | | | | | | | | | | | |
Portfolio turnover rate | | | 88 | % | | | 44 | % | | | 42 | % | | | 203 | % | | | 111 | % | | | 42 | % |
Net assets, end of period (000’s omitted) | | | $148,940 | | | | $162,954 | | | | $216,096 | | | | $255,075 | | | | $298,809 | | | | $768,386 | |
| 1. | After the close of business on July 16, 2010, the Fund acquired the net assets of Evergreen International Equity Fund which became the accounting and performance survivor in the transaction. The information for the periods prior to July 19, 2010 is that of Class A of Evergreen International Equity Fund. |
| 2. | Calculated based upon average shares outstanding |
| 3. | Total return calculations do not include any sales charges. Returns for periods of less than one year are not annualized. |
The accompanying notes are an integral part of these financial statements.
| | | | |
| 16 | | Wells Fargo Advantage International Equity Fund | | Financial Highlights |
(For a share outstanding throughout each period)
| | | | | | | | | | | | | | | | | | | | | | | | |
| | | Six Months Ended
April 30, 2012 (Unaudited) | | | Year Ended October 31, | |
| Class B | | | 2011 | | | 20101 | | | 20091 | | | 20081 | | | 20071 | |
Net asset value, beginning of period | | $ | 9.48 | | | $ | 10.12 | | | $ | 8.81 | | | $ | 8.18 | | | $ | 17.02 | | | $ | 14.95 | |
Net investment income | | | 0.06 | 2 | | | 0.08 | 2 | | | 0.01 | 2 | | | 0.11 | 2 | | | 0.21 | 2 | | | 0.15 | 2 |
Net realized and unrealized gains (losses) on investments | | | 0.16 | | | | (0.72 | ) | | | 1.41 | | | | 0.66 | | | | (7.20 | ) | | | 3.62 | |
| | | | | | | | | | | | | | | | | | | | | | | | |
Total from investment operations | | | 0.22 | | | | (0.64 | ) | | | 1.42 | | | | 0.77 | | | | (6.99 | ) | | | 3.77 | |
Distributions to shareholders from | | | | | | | | | | | | | | | | | | | | | | | | |
Net investment income | | | (0.10 | ) | | | 0.00 | | | | (0.11 | ) | | | (0.14 | ) | | | (0.23 | ) | | | (0.32 | ) |
Net realized gains | | | 0.00 | | | | 0.00 | | | | 0.00 | | | | 0.00 | | | | (1.62 | ) | | | (1.38 | ) |
| | | | | | | | | | | | | | | | | | | | | | | | |
Total distributions to shareholders | | | (0.10 | ) | | | 0.00 | | | | (0.11 | ) | | | (0.14 | ) | | | (1.85 | ) | | | (1.70 | ) |
Net asset value, end of period | | $ | 9.60 | | | $ | 9.48 | | | $ | 10.12 | | | $ | 8.81 | | | $ | 8.18 | | | $ | 17.02 | |
Total return3 | | | 2.38 | % | | | (6.32 | )% | | | 16.15 | % | | | 9.64 | % | | | (45.86 | )% | | | 27.77 | % |
Ratios to average net assets (annualized) | | | | | | | | | | | | | | | | | | | | | | | | |
Gross expenses | | | 2.26 | % | | | 2.21 | % | | | 1.94 | % | | | 1.83 | % | | | 1.70 | % | | | 1.67 | % |
Net expenses | | | 1.84 | % | | | 1.84 | % | | | 1.82 | % | | | 1.83 | % | | | 1.70 | % | | | 1.67 | % |
Net investment income | | | 1.26 | % | | | 0.77 | % | | | 0.15 | % | | | 1.45 | % | | | 1.59 | % | | | 0.98 | % |
Supplemental data | | | | | | | | | | | | | | | | | | | | | | | | |
Portfolio turnover rate | | | 88 | % | | | 44 | % | | | 42 | % | | | 203 | % | | | 111 | % | | | 42 | % |
Net assets, end of period (000’s omitted) | | | $10,324 | | | | $12,873 | | | | $20,450 | | | | $22,300 | | | | $29,756 | | | | $70,187 | |
| 1. | After the close of business on July 16, 2010, the Fund acquired the net assets of Evergreen International Equity Fund which became the accounting and performance survivor in the transaction. The information for the periods prior to July 19, 2010 is that of Class B of Evergreen International Equity Fund. |
| 2. | Calculated based upon average shares outstanding |
| 3. | Total return calculations do not include any sales charges. Returns for periods of less than one year are not annualized. |
The accompanying notes are an integral part of these financial statements.
| | | | | | |
| Financial Highlights | | Wells Fargo Advantage International Equity Fund | | | 17 | |
(For a share outstanding throughout each period)
| | | | | | | | | | | | | | | | | | | | | | | | |
| | | Six Months Ended
April 30, 2012 (Unaudited) | | | Year Ended October 31, | |
| Class C | | | 2011 | | | 20101 | | | 20091 | | | 20081 | | | 20071 | |
Net asset value, beginning of period | | $ | 9.59 | | | $ | 10.24 | | | $ | 8.93 | | | $ | 8.27 | | | $ | 17.22 | | | $ | 15.14 | |
Net investment income | | | 0.05 | | | | 0.06 | | | | 0.01 | 2 | | | 0.07 | 2 | | | 0.21 | 2 | | | 0.15 | 2 |
Net realized and unrealized gains (losses) on investments | | | 0.17 | | | | (0.71 | ) | | | 1.41 | | | | 0.72 | | | | (7.27 | ) | | | 3.67 | |
| | | | | | | | | | | | | | | | | | | | | | | | |
Total from investment operations | | | 0.22 | | | | (0.65 | ) | | | 1.42 | | | | 0.79 | | | | (7.06 | ) | | | 3.82 | |
Distributions to shareholders from | | | | | | | | | | | | | | | | | | | | | | | | |
Net investment income | | | (0.10 | ) | | | 0.00 | | | | (0.11 | ) | | | (0.13 | ) | | | (0.25 | ) | | | (0.34 | ) |
Net realized gains | | | 0.00 | | | | 0.00 | | | | 0.00 | | | | 0.00 | | | | (1.64 | ) | | | (1.40 | ) |
| | | | | | | | | | | | | | | | | | | | | | | | |
Total distributions to shareholders | | | (0.10 | ) | | | 0.00 | | | | (0.11 | ) | | | (0.13 | ) | | | (1.89 | ) | | | (1.74 | ) |
Net asset value, end of period | | $ | 9.71 | | | $ | 9.59 | | | $ | 10.24 | | | $ | 8.93 | | | $ | 8.27 | | | $ | 17.22 | |
Total return3 | | | 2.45 | % | | | (6.35 | )% | | | 16.13 | % | | | 9.62 | % | | | (45.85 | )% | | | 27.76 | % |
Ratios to average net assets (annualized) | | | | | | | | | | | | | | | | | | | | | | | | |
Gross expenses | | | 2.27 | % | | | 2.21 | % | | | 1.94 | % | | | 1.83 | % | | | 1.70 | % | | | 1.67 | % |
Net expenses | | | 1.84 | % | | | 1.84 | % | | | 1.82 | % | | | 1.83 | % | | | 1.70 | % | | | 1.67 | % |
Net investment income | | | 1.33 | % | | | 0.79 | % | | | 0.16 | % | | | 1.39 | % | | | 1.61 | % | | | 0.98 | % |
Supplemental data | | | | | | | | | | | | | | | | | | | | | | | | |
Portfolio turnover rate | | | 88 | % | | | 44 | % | | | 42 | % | | | 203 | % | | | 111 | % | | | 42 | % |
Net assets, end of period (000’s omitted) | | | $20,304 | | | | $22,578 | | | | $30,439 | | | | $36,718 | | | | $47,114 | | | | $117,643 | |
| 1. | After the close of business on July 16, 2010, the Fund acquired the net assets of Evergreen International Equity Fund which became the accounting and performance survivor in the transaction. The information for the periods prior to July 19, 2010 is that of Class C of Evergreen International Equity Fund. |
| 2. | Calculated based upon average shares outstanding |
| 3. | Total return calculations do not include any sales charges. Returns for periods of less than one year are not annualized. |
The accompanying notes are an integral part of these financial statements.
| | | | |
| 18 | | Wells Fargo Advantage International Equity Fund | | Financial Highlights |
(For a share outstanding throughout each period)
| | | | | | | | | | | | | | | | | | | | | | | | |
| | | Six Months Ended
April 30, 2012 (Unaudited) | | | Year Ended October 31, | |
| Class R | | | 2011 | | | 20101 | | | 20091 | | | 20081 | | | 20071 | |
Net asset value, beginning of period | | $ | 9.79 | | | $ | 10.40 | | | $ | 9.13 | | | $ | 8.51 | | | $ | 17.70 | | | $ | 15.55 | |
Net investment income | | | 0.08 | 2 | | | 0.14 | 2 | | | 0.06 | 2 | | | 0.14 | | | | 0.27 | 2 | | | 0.21 | |
Net realized and unrealized gains (losses) on investments | | | 0.17 | | | | (0.75 | ) | | | 1.42 | | | | 0.71 | | | | (7.46 | ) | | | 3.77 | |
| | | | | | | | | | | | | | | | | | | | | | | | |
Total from investment operations | | | 0.25 | | | | (0.61 | ) | | | 1.48 | | | | 0.85 | | | | (7.19 | ) | | | 3.98 | |
Distributions to shareholders from | | | | | | | | | | | | | | | | | | | | | | | | |
Net investment income | | | (0.18 | ) | | | 0.00 | | | | (0.21 | ) | | | (0.23 | ) | | | (0.35 | ) | | | (0.42 | ) |
Net realized gains | | | 0.00 | | | | 0.00 | | | | 0.00 | | | | 0.00 | | | | (1.65 | ) | | | (1.41 | ) |
| | | | | | | | | | | | | | | | | | | | | | | | |
Total distributions to shareholders | | | (0.18 | ) | | | 0.00 | | | | (0.21 | ) | | | (0.23 | ) | | | (2.00 | ) | | | (1.83 | ) |
Net asset value, end of period | | $ | 9.86 | | | $ | 9.79 | | | $ | 10.40 | | | $ | 9.13 | | | $ | 8.51 | | | $ | 17.70 | |
Total return3 | | | 2.73 | % | | | (5.87 | )% | | | 16.58 | % | | | 10.13 | % | | | (45.52 | )% | | | 28.40 | % |
Ratios to average net assets (annualized) | | | | | | | | | | | | | | | | | | | | | | | | |
Gross expenses | | | 1.77 | % | | | 1.71 | % | | | 1.45 | % | | | 1.33 | % | | | 1.20 | % | | | 1.16 | % |
Net expenses | | | 1.34 | % | | | 1.34 | % | | | 1.33 | % | | | 1.33 | % | | | 1.20 | % | | | 1.16 | % |
Net investment income | | | 1.71 | % | | | 1.31 | % | | | 0.66 | % | | | 1.79 | % | | | 2.03 | % | | | 1.49 | % |
Supplemental data | | | | | | | | | | | | | | | | | | | | | | | | |
Portfolio turnover rate | | | 88 | % | | | 44 | % | | | 42 | % | | | 203 | % | | | 111 | % | | | 42 | % |
Net assets, end of period (000’s omitted) | | | $2,435 | | | | $3,050 | | | | $4,066 | | | | $3,811 | | | | $3,603 | | | | $9,107 | |
| 1. | After the close of business on July 16, 2010, the Fund acquired the net assets of Evergreen International Equity Fund which became the accounting and performance survivor in the transaction. The information for the periods prior to July 19, 2010 is that of Class R of Evergreen International Equity Fund. |
| 2. | Calculated based upon average shares outstanding |
| 3. | Returns for periods of less than one year are not annualized. |
The accompanying notes are an integral part of these financial statements.
| | | | | | |
| Financial Highlights | | Wells Fargo Advantage International Equity Fund | | | 19 | |
(For a share outstanding throughout each period)
| | | | | | | | | | | | |
| | | Six Months Ended
April 30, 2012 (Unaudited) | | | Year Ended October 31, | |
| Administrator Class | | | 2011 | | | 20101 | |
Net asset value, beginning of period | | $ | 9.67 | | | $ | 10.28 | | | $ | 8.82 | |
Net investment income | | | 0.11 | | | | 0.16 | | | | 0.01 | |
Net realized and unrealized gains (losses) on investments | | | 0.14 | | | | (0.74 | ) | | | 1.45 | |
| | | | | | | | | | | | |
Total from investment operations | | | 0.25 | | | | (0.58 | ) | | | 1.46 | |
Distributions to shareholders from | | | | | | | | | | | | |
Net investment income | | | (0.21 | ) | | | (0.03 | ) | | | 0.00 | |
Net asset value, end of period | | $ | 9.71 | | | $ | 9.67 | | | $ | 10.28 | |
Total return2 | | | 2.84 | % | | | (5.68 | )% | | | 16.55 | % |
Ratios to average net assets (annualized) | | | | | | | | | | | | |
Gross expenses | | | 1.33 | % | | | 1.25 | % | | | 1.36 | % |
Net expenses | | | 1.09 | % | | | 1.09 | % | | | 1.09 | % |
Net investment income | | | 2.14 | % | | | 1.58 | % | | | 0.32 | % |
Supplemental data | | | | | | | | | | | | |
Portfolio turnover rate | | | 88 | % | | | 44 | % | | | 42 | % |
Net assets, end of period (000’s omitted) | | | $3,800 | | | | $3,436 | | | | $89 | |
| 1. | For the period from July 16, 2010 (commencement of class operations) to October 31, 2010. |
| 2. | Returns for periods of less than one year are not annualized. |
The accompanying notes are an integral part of these financial statements.
| | | | |
| 20 | | Wells Fargo Advantage International Equity Fund | | Financial Highlights |
(For a share outstanding throughout each period)
| | | | | | | | | | | | | | | | | | | | | | | | |
| | | Six Months Ended
April 30, 2012 (Unaudited) | | | Year Ended October 31, | |
| Institutional Class | | | 2011 | | | 20101 | | | 20091 | | | 20081 | | | 20071 | |
Net asset value, beginning of period | | $ | 9.83 | | | $ | 10.42 | | | $ | 9.17 | | | $ | 8.59 | | | $ | 17.82 | | | $ | 15.57 | |
Net investment income | | | 0.11 | 2 | | | 0.19 | 2 | | | 0.11 | 2 | | | 0.21 | | | | 0.32 | 2 | | | 0.32 | |
Net realized and unrealized gains (losses) on investments | | | 0.16 | | | | (0.75 | ) | | | 1.43 | | | | 0.67 | | | | (7.52 | ) | | | 3.78 | |
| | | | | | | | | | | | | | | | | | | | | | | | |
Total from investment operations | | | 0.27 | | | | (0.56 | ) | | | 1.54 | | | | 0.88 | | | | (7.20 | ) | | | 4.10 | |
Distributions to shareholders from | | | | | | | | | | | | | | | | | | | | | | | | |
Net investment income | | | (0.25 | ) | | | (0.03 | ) | | | (0.29 | ) | | | (0.30 | ) | | | (0.41 | ) | | | (0.47 | ) |
Net realized gains | | | 0.00 | | | | 0.00 | | | | 0.00 | | | | 0.00 | | | | (1.62 | ) | | | (1.38 | ) |
| | | | | | | | | | | | | | | | | | | | | | | | |
Total distributions to shareholders | | | (0.25 | ) | | | (0.03 | ) | | | (0.29 | ) | | | (0.30 | ) | | | (2.03 | ) | | | (1.85 | ) |
Net asset value, end of period | | $ | 9.85 | | | $ | 9.83 | | | $ | 10.42 | | | $ | 9.17 | | | $ | 8.59 | | | $ | 17.82 | |
Total return3 | | | 2.99 | % | | | (5.38 | )% | | | 17.17 | % | | | 10.73 | % | | | (45.26 | )% | | | 29.09 | % |
Ratios to average net assets (annualized) | | | | | | | | | | | | | | | | | | | | | | | | |
Gross expenses | | | 1.08 | % | | | 1.03 | % | | | 0.87 | % | | | 0.83 | % | | | 0.69 | % | | | 0.67 | % |
Net expenses | | | 0.84 | % | | | 0.84 | % | | | 0.82 | % | | | 0.83 | % | | | 0.69 | % | | | 0.67 | % |
Net investment income | | | 2.25 | % | | | 1.78 | % | | | 1.15 | % | | | 2.39 | % | | | 2.34 | % | | | 1.99 | % |
Supplemental data | | | | | | | | | | | | | | | | | | | | | | | | |
Portfolio turnover rate | | | 88 | % | | | 44 | % | | | 42 | % | | | 203 | % | | | 111 | % | | | 42 | % |
Net assets, end of period (000’s omitted) | | | $173,625 | | | | $227,158 | | | | $373,200 | | | | $671,417 | | | | $795,416 | | | | $2,519,261 | |
| 1. | After the close of business on July 16, 2010, the Fund acquired the net assets of Evergreen International Equity Fund which became the accounting and performance survivor in the transaction. The information for the periods prior to July 19, 2010 is that of Class I of Evergreen International Equity Fund. |
| 2. | Calculated based upon average shares outstanding |
| 3. | Returns for periods of less than one year are not annualized. |
The accompanying notes are an integral part of these financial statements.
| | | | | | |
| Notes to Financial Statements (Unaudited) | | Wells Fargo Advantage International Equity Fund | | | 21 | |
1. ORGANIZATION
Wells Fargo Funds Trust (the “Trust”), a Delaware statutory trust organized on March 10, 1999, is an open-end management investment company registered under the Investment Company Act of 1940, as amended (the “1940 Act”). These financial statements report on Wells Fargo Advantage International Equity Fund (the “Fund”) which is a diversified series of the Trust.
2. SIGNIFICANT ACCOUNTING POLICIES
The following significant accounting policies, which are consistently followed in the preparation of the financial statements of the Fund, are in conformity with U.S. generally accepted accounting principles which require management to make estimates and assumptions that affect the reported amounts of assets and liabilities, disclosure of contingent assets and liabilities at the date of the financial statements, and the reported amounts of revenues and expenses during the reporting period. Actual results could differ from those estimates.
Securities valuation
Investments in equity securities are valued each business day as of the close of regular trading on the New York Stock Exchange, which is usually 4:00 p.m. (Eastern Time). Securities which are traded on a national or foreign securities exchange are valued at the last reported sales price, except that securities listed on The Nasdaq Stock Market, Inc. (“Nasdaq”) are valued at the Nasdaq Official Closing Price (“NOCP”), and if no NOCP is available, then at the last reported sales price. If no sales price is shown on the Nasdaq, the bid price will be used. In the absence of any sale of securities listed on the Nasdaq, and in the case of other securities (including U.S. Government obligations, but excluding debt securities maturing in 60 days or less), the price will be deemed “stale” and the valuations will be determined in accordance with the Fund’s Fair Value Procedures.
Securities denominated in foreign currencies are translated into U.S. dollars using the closing rates of exchange in effect on the day of valuation.
Many securities markets and exchanges outside the U.S. close prior to the close of the New York Stock Exchange and therefore may not fully reflect trading or events that occur after the close of the principal exchange in which the foreign securities are traded, but before the close of the New York Stock Exchange. If such trading or events are expected to materially affect the value of securities, then fair value pricing procedures approved by the Board of Trustees are applied. These procedures take into account multiple factors including movements in U.S. securities markets after foreign exchanges close. As a result of the fair value pricing procedures, these securities which are normally categorized as Level 1 in the fair value hierarchy will represent a transfer from a Level 1 to a Level 2 security and will be categorized as Level 2. Depending on market activity, such fair valuations may be frequent. Such fair value pricing may result in NAVs that are higher or lower than NAVs based on the closing price or latest quoted bid price. On April 30, 2012, fair value pricing was not used in pricing foreign securities.
Investments in open-end mutual funds and non-registered investment companies are generally valued at net asset value.
Investments which are not valued using any of the methods discussed above, are valued at their fair value, as determined by procedures established in good faith and approved by the Board of Trustees. The Board of Trustees has established a Valuation Committee comprised of the Trustees and has delegated to it the authority to take any actions regarding the valuation of portfolio securities that the Valuation Committee deems necessary in determining the fair value of portfolio securities, unless the responsibility has been delegated to the Management Valuation Team of Wells Fargo Funds Management, LLC (“Funds Management”). The Board of Trustees retains the authority to make or ratify any valuation decisions or approve any changes to the Fair Value Procedures as it deems appropriate. On a quarterly basis, the Board of Trustees considers for ratification any valuation actions taken by the Valuation Committee or the Management Valuation Team.
Valuations of fair valued prices are compared to the next actual sales price when available, or other appropriate market information to assess the continued appropriateness of the fair valuation methodology used. The securities are fair valued on a day-to-day basis, taking into consideration changes to appropriate market information and any significant changes to the input factors considered in the valuation process until there is a readily available price provided on the exchange or by an independent pricing service. Valuations received from an independent pricing service or broker quotes are periodically validated by comparisons to most recent trades and valuations provided by other independent
| | | | |
| 22 | | Wells Fargo Advantage International Equity Fund | | Notes to Financial Statements (Unaudited) |
pricing services in addition to the review of prices by the adviser and/or sub-adviser. Unobservable inputs used in determining fair valuations are identified based on the type of security, taking into consideration factors utilized by market participants in valuing the investment, knowledge about the issuer and the current market environment.
Foreign currency translation
The accounting records of the Fund are maintained in U.S. dollars. Assets, including investment securities, and liabilities denominated in foreign currency are translated into U.S. dollars at the prevailing rates of exchange at the date of valuation. Purchases and sales of securities, and income and expenses are translated at the prevailing rate of exchange on the respective dates of such transactions. Reported net realized foreign exchange gains or losses arise from sales of foreign currencies, currency gains or losses realized between the trade and settlement dates on securities transactions, and the difference between the amounts of dividends, interest and foreign withholding taxes recorded and the U.S. dollar equivalent of the amounts actually paid or received. Net unrealized foreign exchange gains and losses arise from changes in the fair value of assets and liabilities other than investments in securities resulting in changes in exchange rates.
The changes in net assets arising from changes in exchange rates and the changes in net assets resulting from changes in market prices of securities are not separately presented. Such changes are recorded with net realized and unrealized gains or losses from investments. Gains and losses from certain foreign currency transactions are treated as ordinary income for U.S. federal income tax purposes.
Forward foreign currency contracts
The Fund may be subject to foreign currency exchange rate risk in the normal course of pursuing its investment objectives. A forward foreign currency contract is an agreement between two parties to purchase or sell a specific currency for an agreed-upon price at a future date. The Fund enters into forward foreign currency contracts to facilitate transactions in foreign-denominated securities and to attempt to minimize the risk to the Fund from adverse changes in the relationship between currencies. Forward foreign currency contracts are recorded at the forward rate and marked-to-market daily. When the contracts are closed, realized gains and losses arising from such transactions are recorded as realized gains or losses on foreign currency related transactions. The Fund could be exposed to risks if the counterparties to the contracts are unable to meet the terms of their contracts or if the value of the foreign currency changes unfavorably. The Fund’s maximum risk of loss from counterparty credit risk is the unrealized gains or losses on the contracts. This risk is mitigated by having a master netting arrangement between the Fund and the counterparty.
Security loans
The Fund may lend its securities from time to time in order to earn additional income in the form of fees or interest on securities received as collateral or the investment of any cash received as collateral. The Fund continues to receive interest or dividends on the securities loaned. The Fund receives collateral in the form of cash or securities with a value at least equal to the value of the securities on loan. The value of the loaned securities is determined at the close of each business day and any additional required collateral is delivered to the Fund on the next business day. In a securities lending transaction, the net asset value of the Fund will be affected by an increase or decrease in the value of the securities loaned and by an increase or decrease in the value of the instrument in which collateral is invested. The amount of securities lending activity undertaken by the Fund fluctuates from time to time. In the event of default or bankruptcy by the borrower, the Fund may be prevented from recovering the loaned securities or gaining access to the collateral or may experience delays or costs in doing so. In addition, the investment of any cash collateral received may lose all or part of its value. The Fund has the right under the lending agreement to recover the securities from the borrower on demand.
The Fund lends its securities through an unaffiliated securities lending agent. Cash collateral received in connection with its securities lending transactions is invested in Wells Fargo Securities Lending Cash Investments, LLC (the “Cash Collateral Fund”). The Cash Collateral Fund is exempt from registration under Section 3(c)(7) of the 1940 Act and is managed by Funds Management and is sub-advised by Wells Capital Management Incorporated (“Wells Capital Management”). Funds Management receives an advisory fee starting at 0.05% and declining to 0.01% as the average daily net assets of the Cash Collateral Fund increase. All of the fees received by Funds Management are paid to Wells Capital Management for its services as sub-adviser. The Cash Collateral Fund seeks to provide a positive return compared to the daily Fed Funds Open rate by investing in high-quality, U.S. dollar-denominated short-term money market instruments. Cash Collateral Fund investments are fair valued based upon the amortized cost valuation technique. Income earned from investment in the Cash Collateral Fund is included in securities lending income on the Statement of Operations.
| | | | | | |
| Notes to Financial Statements (Unaudited) | | Wells Fargo Advantage International Equity Fund | | | 23 | |
Futures contracts
The Fund may be subject to equity price risk in the normal course of pursuing its investment objectives. The Fund may buy and sell futures contracts in order to gain exposure to, or protect against changes in, security values and interest rates. The primary risks associated with the use of futures contracts are the imperfect correlation between changes in market values of securities held by the Fund and the prices of futures contracts, and the possibility of an illiquid market.
Futures contracts are valued based upon their quoted daily settlement prices when available. The aggregate principal amounts of the contracts are not recorded in the financial statements. Fluctuations in the value of the contracts are recorded in the Statement of Assets and Liabilities as an asset or liability and in the Statement of Operations as unrealized gains or losses until the contracts are closed, at which point they are recorded as net realized gains or losses on futures contracts. With futures contracts, there is minimal counterparty risk to the Fund since futures are exchange traded and the exchange’s clearinghouse, as counterparty to all exchange traded futures, guarantees the futures against default.
Security transactions and income recognition
Securities transactions are recorded on a trade date basis. Realized gains or losses are reported on the basis of identified cost of securities delivered.
Dividend income is recognized on the ex-dividend date, except for certain dividends from foreign securities, which are recorded as soon as the Fund is informed of the ex-dividend date. Dividend income from foreign securities is recorded net of foreign taxes withheld where recovery of such taxes is not assured.
Distributions to shareholders
Distributions to shareholders from net investment income and net realized gains, if any, are recorded on the ex-dividend date. Such distributions are determined in conformity with income tax regulations, which may differ from generally accepted accounting principles.
Federal and other taxes
The Fund intends to continue to qualify as a regulated investment company by distributing substantially all of its investment company taxable income and any net realized capital gains (after reduction for capital loss carryforwards) sufficient to relieve it from all, or substantially all, federal income taxes. Accordingly, no provision for federal income taxes was required.
The Fund’s income and federal excise tax returns and all financial records supporting those returns for the prior three fiscal years are subject to examination by the federal and Delaware revenue authorities. Management has analyzed the Fund’s tax positions taken on federal, state, and foreign tax returns for all open tax years and does not believe that there are any uncertain tax positions that require recognition of a tax liability.
Under the recently enacted Regulated Investment Company Modernization Act of 2010, the Fund is permitted to carry forward capital losses incurred in taxable years which began after December 22, 2010 for an unlimited period. However, any losses incurred are required to be utilized prior to the losses incurred in pre-enactment taxable years. As a result of this ordering rule, pre-enactment capital loss carryforwards may be more likely to expire unused. Post-enactment capital losses that are carried forward will retain their character as either short-term or long-term capital losses rather than be considered all short-term as under previous law. In addition, the Fund may elect to defer any portion of a post-October capital loss or qualified late-year ordinary loss to the first day of the following taxable year. A post-October capital loss is the greatest of the net capital loss, net short-term capital loss or net long-term capital loss for the portion of the taxable year after October 31. A qualified late-year ordinary loss is the net loss comprised of (a) net gain or loss from the sale or other disposition of capital assets for the portion of the taxable year after October 31, and (b) other ordinary income or loss for the portion of the taxable year after December 31.
As of October 31, 2011, the Fund had net capital loss carryforwards, which were available to offset future net realized capital gains, in the amount of $108,020,920 expiring in 2016.
Class allocations
The separate classes of shares offered by the Fund differ principally in applicable sales charges, distribution, shareholder servicing and administration fees. Shareholders of each class bear certain expenses that pertain to that particular class. All shareholders bear the common expenses of the Fund, earn income from the portfolio, and are allocated unrealized gains
| | | | |
| 24 | | Wells Fargo Advantage International Equity Fund | | Notes to Financial Statements (Unaudited) |
and losses pro rata based on the average daily net assets of each class, without distinction between share classes. Dividends are determined separately for each class based on income and expenses allocable to each class. Realized gains and losses are allocated to each class pro rata based upon the net assets of each class on the date realized. Differences in per share dividend rates generally result from the relative weightings of pro rata income and realized gain allocations and from differences in separate class expenses, including distribution, shareholder servicing and administration fees.
3. FAIR VALUATION MEASUREMENTS
Fair value measurements of investments are determined within a framework that has established a fair value hierarchy based upon the various data inputs utilized in determining the value of the Fund’s investments. The three-level hierarchy gives the highest priority to unadjusted quoted prices in active markets for identical assets or liabilities (Level 1) and the lowest priority to significant unobservable inputs (Level 3). The Fund’s investments are classified within the fair value hierarchy based on the lowest level of input that is significant to the fair value measurement. The inputs are summarized into three broad levels as follows:
| n | | Level 1 – quoted prices in active markets for identical securities |
| n | | Level 2 – other significant observable inputs (including quoted prices for similar securities, interest rates, prepayment speeds, credit risk, etc.) |
| n | | Level 3 – significant unobservable inputs (including the Fund’s own assumptions in determining the fair value of investments) |
The inputs or methodologies used for valuing securities are not necessarily an indication of the risk associated with investing in those securities.
As of April 30, 2012, the inputs used in valuing the Fund’s assets, which are carried at fair value, were as follows:
| | | | | | | | | | | | | | | | |
| Investments in Securities | | Quoted Prices (Level 1) | | | Significant Other
Observable Inputs (Level 2) | | | Significant Unobservable Inputs (Level 3) | | | Total | |
Equity securities | | | | | | | | | | | | | | | | |
Common stocks | | $ | 341,940,868 | | | $ | 8,292,438 | | | $ | 0 | | | $ | 350,233,306 | |
Short-term investments | | | | | | | | | | | | | | | | |
Investment companies | | | 5,713,174 | | | | 28,423,420 | | | | 0 | | | | 34,136,594 | |
| | | $ | 347,654,042 | | | $ | 36,715,858 | | | $ | 0 | | | $ | 384,369,900 | |
Further details on the major security types listed above can be found in the Portfolio of Investments.
Transfers in and transfers out are recognized at the end of the reporting period. For the six months ended April 30, 2012, the Fund did not have any significant transfers into/out of Level 1 and Level 2.
4. TRANSACTIONS WITH AFFILIATES AND OTHER EXPENSES
Advisory fee
The Trust has entered into an advisory contract with Funds Management, an indirect wholly owned subsidiary of Wells Fargo & Company (“Wells Fargo”). The adviser is responsible for implementing investment policies and guidelines and for supervising the sub-adviser, who is responsible for day-to-day portfolio management of the Fund.
Pursuant to the contract, Funds Management is entitled to receive an annual advisory fee starting at 0.85% and declining to 0.70% as the average daily net assets of the Fund increase. For the six months ended April 30, 2012, the advisory fee was equivalent to an annual rate of 0.85% of the Fund’s average daily net assets.
Funds Management has retained the services of certain sub-advisers to provide daily portfolio management to the Fund. The fees related to sub-advisory services are borne directly by Funds Management and do not increase the overall fees paid by the Fund. Wells Capital Management Incorporated (“Wells Capital Management”), an affiliate of Funds Management, is the sub-adviser to the Fund and is entitled to receive a fee from Funds Management at an annual rate starting at 0.45% and declining to 0.40% as the average daily net assets of the Fund increase.
| | | | | | |
| Notes to Financial Statements (Unaudited) | | Wells Fargo Advantage International Equity Fund | | | 25 | |
Administration and transfer agent fees
The Trust has entered into an administration agreement with Funds Management. Under this agreement, for providing administrative services, which includes paying fees and expenses for services provided by the transfer agent, sub-transfer agents, omnibus account servicers and record-keepers, Funds Management is entitled to receive from the Fund an annual fund level administration fee starting at 0.05% and declining to 0.03% as the average daily net assets of the Fund increase and a class level administration fee which is calculated based on the average daily net assets of each class as follows:
| | | | |
| | | Class Level Administration Fee | |
Class A, Class B, Class C, Class R | | | 0.26 | % |
Administrator Class | | | 0.10 | |
Institutional Class | | | 0.08 | |
Funds Management has contractually waived and/or reimbursed advisory and administration fees to the extent necessary to maintain certain net operating expense ratios for the Fund. Waiver of fees and/or reimbursement of expenses by Funds Management were made first from fund level expenses on a proportionate basis and then from class specific expenses. Funds Management has committed through July 18, 2013 to waive fees and/or reimburse expenses to the extent necessary to cap the Fund’s expenses at 1.09% for Class A, 1.84% for Class B, 1.84% for Class C, 1.34% for Class R, 1.09% for Administrator Class and 0.84% for Institutional Class.
Distribution fees
The Trust has adopted a Distribution Plan for Class B, Class C and Class R shares of the Fund pursuant to Rule 12b-1 under the 1940 Act. Distribution fees are charged to Class B, Class C and Class R shares and paid to Wells Fargo Funds Distributor, LLC, the principal underwriter, at an annual rate of 0.75% of the average daily net assets of Class B and Class C shares and 0.25% of the average daily net assets for Class R shares.
For the six months ended April 30, 2012, Wells Fargo Funds Distributor, LLC received $1,545 from the sale of Class A shares and $6,788 and $1,136 in contingent deferred sales charges from redemptions of Class B and Class C shares, respectively.
Shareholder servicing fees
The Trust has entered into contracts with one or more shareholder servicing agents, whereby Class A, Class B, Class C, Class R and Administrator Class of the Fund is charged a fee at an annual rate of 0.25% of the average daily net assets of each respective class.
A portion of these total shareholder servicing fees were paid to affiliates of Wells Fargo.
5. INVESTMENT PORTFOLIO TRANSACTIONS
Purchases and sales of investments, excluding U.S. Government obligations (if any) and short-term securities, for the six months ended April 30, 2012 were $329,059,954 and $408,260,715, respectively.
6. DERIVATIVE TRANSACTIONS
During the six months ended April 30, 2012, the Fund used uninvested cash to enter into futures contracts to gain market exposure.
As of April 30, 2012, the Fund did not have any open futures contracts but had an average notional amount of $1,071,986 in futures contracts during the six months ended April 30, 2012.
During the six months ended April 30, 2012, the Fund entered into forward foreign currency exchange contracts for economic hedging purposes.
As of April 30, 2012, the Fund did not have any open forward foreign currency contracts but had average contract amounts of $9,919,019 and $10,948,174 in forward foreign currency contracts to buy and forward foreign currency contracts to sell, respectively, during the six months ended April 30, 2012.
The fair value, realized gains or losses and change in unrealized gains or losses, if any, on derivative instruments are reflected in the appropriate financial statements.
| | | | |
| 26 | | Wells Fargo Advantage International Equity Fund | | Notes to Financial Statements (Unaudited) |
7. BANK BORROWINGS
The Trust (excluding the money market funds) and Wells Fargo Variable Trust are parties to a $150,000,000 revolving credit agreement with State Street Bank and Trust Company, whereby the Fund is permitted to use bank borrowings for temporary or emergency purposes, such as to fund shareholder redemption requests. Interest under the credit agreement is charged to the Fund based on a borrowing rate equal to the higher of the Federal Funds rate in effect on that day plus 1.25% or the overnight LIBOR rate in effect on that day plus 1.25%. In addition, an annual commitment fee equal to 0.10% of the unused balance is allocated to each participating fund. For the six months ended April 30, 2012, the Fund paid $466 in commitment fees.
For the six months ended April 30, 2012, there were no borrowings by the Fund under the agreement.
8. INDEMNIFICATION
Under the Trust’s organizational documents, the officers and directors are indemnified against certain liabilities that may arise out of performance of their duties to the Trust. Additionally, in the normal course of business, the Trust may enter into contracts with service providers that contain a variety of indemnification clauses. The Trust’s maximum exposure under these arrangements is dependent on future claims that may be made against the Fund and, therefore, cannot be estimated.
9. NEW ACCOUNTING PRONOUNCEMENTS
In December 2011, the Financial Accounting Standards Board (“FASB”) issued Accounting Standard Update (“ASU”) No. 2011-11, Disclosures about Offsetting Assets and Liabilities. ASU 2011-11, which amends FASB ASC Topic 210, Balance Sheet, creates new disclosure requirements which require entities to disclose both gross and net information for derivatives and other financial instruments that are either offset in the Statement of Assets and Liabilities or subject to an enforceable master netting arrangement or similar agreement. The disclosure requirements are effective for interim and annual reporting periods beginning on or after January 1, 2013. Management is currently assessing the potential impact, in addition to expanded financial statement disclosure, that may result from adopting this ASU.
In May 2011, FASB issued ASU No. 2011-04 Amendments to Achieve Common Fair Value Measurement and Disclosure Requirements in U.S. GAAP and IFRSs. ASU No. 2011-04 amends FASB ASC Topic 820, Fair Value Measurements, to establish common requirements for measuring fair value and for disclosing information about fair value measurements in accordance with GAAP. The ASU is effective prospectively for interim and annual periods beginning after December 15, 2011. Management expects that adoption of the ASU will result in additional disclosures in the financial statements, as applicable.
In April 2011, FASB issued ASU No. 2011-03 Reconsideration of Effective Control for Repurchase Agreements. ASU No. 2011-03 amends FASB ASC Topic 860, Transfers and Servicing, specifically the criteria required to determine whether a repurchase agreement (repo) and similar agreements should be accounted for as sales of financial assets or secured borrowings with commitments. ASU No. 2011-03 changes the assessment of effective control by focusing on the transferor’s contractual rights and obligations and removing the criterion to assess its ability to exercise those rights or honor those obligations. This could result in changes to the way entities account for certain transactions including repurchase agreements, mortgage dollar rolls and reverse repurchase agreements. The ASU will become effective on a prospective basis for new transfers and modifications to existing transactions as of the beginning of the first interim or annual period beginning on or after December 15, 2011. Management has evaluated the impact of adopting the ASU and expects no significant changes.
| | | | | | |
| Other Information (Unaudited) | | Wells Fargo Advantage International Equity Fund | | | 27 | |
PROXY VOTING INFORMATION
A description of the policies and procedures that the Fund uses to determine how to vote proxies relating to portfolio securities is available without charge, upon request, by calling 1-800-222-8222, visiting our Web site at wellsfargoadvantagefunds.com, or visiting the SEC Web site at sec.gov. Information regarding how the Fund voted proxies relating to portfolio securities during the most recent 12-month period ended June 30 is available without charge on the Fund’s Web site at wellsfargoadvantagefunds.com or by visiting the SEC Web site at sec.gov.
PORTFOLIO HOLDINGS INFORMATION
The complete portfolio holdings for the Fund are publicly available on the Fund’s Web site (wellsfargoadvantagefunds.com) on a monthly, 30-day or more delayed basis. In addition, top ten holdings information for the Fund is publicly available on the Fund’s Web site on a monthly, seven-day or more delayed basis. The Fund files its complete schedule of portfolio holdings with the SEC for the first and third quarters of each fiscal year on Form N-Q, which is available without charge by visiting the SEC Web site at sec.gov. In addition, the Fund’s Form N-Q may be reviewed and copied at the SEC’s Public Reference Room in Washington, DC, and at regional offices in New York City, at 233 Broadway, and in Chicago, at 175 West Jackson Boulevard, Suite 900. Information about the Public Reference Room may be obtained by calling 1-800-SEC-0330.
| | | | |
| 28 | | Wells Fargo Advantage International Equity Fund | | Other Information (Unaudited) |
BOARD OF TRUSTEES
The following table provides basic information about the Board of Trustees (the “Trustees”) of the Trust and Officers of the Trust. This table should be read in conjunction with the Prospectus and the Statement of Additional Information1 of the Fund. Each of the Trustees and Officers listed below acts in identical capacities for the Wells Fargo Advantage family of funds, which consists of 137 funds comprising the Wells Fargo Funds Trust, Wells Fargo Variable Trust, Wells Fargo Master Trust and four closed-end funds (collectively the “Fund Complex”). All of the Trustees are also Members of the Audit and Governance Committees of each Trust in the Fund Complex. The mailing address of each Trustee and Officer is 525 Market Street, 12th Floor, San Francisco, CA 94105. Each Trustee and Officer serves an indefinite term, however, each Trustee serves such term until reaching the mandatory retirement age established by the Trustees.
Independent Trustees
| | | | | | |
Name and Year of Birth | | Position Held and Length of Service | | Principal Occupations During Past Five Years | | Other Directorships During
Past Five Years |
Peter G. Gordon
(Born 1942) | | Trustee, since 1998; Chairman, since 2005 (Lead Trustee since 2001) | | Co-Founder, Retired Chairman, President and CEO of Crystal Geyser Water Company. Trustee Emeritus, Colby College | | Asset Allocation Trust |
Isaiah Harris, Jr.
(Born 1952) | | Trustee, since 2009 | | Retired. Prior thereto, President and CEO of BellSouth Advertising and Publishing Corp. from 2005 to 2007, President and CEO of BellSouth Enterprises from 2004 to 2005 and President of BellSouth Consumer Services from 2000 to 2003. Emeritus member of the Iowa State University Foundation Board of Governors. Emeritus Member of the Advisory Board of Iowa State University School of Business. Mr. Harris is a certified public accountant. | | CIGNA Corporation; Deluxe Corporation; Asset Allocation Trust |
Judith M. Johnson
(Born 1949) | | Trustee, since 2008 | | Retired. Prior thereto, Chief Executive Officer and Chief Investment Officer of Minneapolis Employees Retirement Fund from 1996 to 2008. Ms. Johnson is an attorney, certified public accountant and a certified managerial accountant. | | Asset Allocation Trust |
Leroy Keith, Jr.
(Born 1939) | | Trustee, since 2010 | | Chairman, Bloc Global Services (development and construction). Trustee of the Evergreen Funds from 1983 to 2010. Former Managing Director, Almanac Capital Management (commodities firm), former Partner, Stonington Partners, Inc. (private equity fund), former Director, Obagi Medical Products Co. and former Director, Lincoln Educational Services. | | Trustee, Virtus Fund Complex (consisting of 40 portfolios as of 12/31/11); Asset Allocation Trust |
David F. Larcker
(Born 1950) | | Trustee, since 2009 | | James Irvin Miller Professor of Accounting at the Graduate School of Business, Stanford University, Director of Corporate Governance Research Program and Senior Faculty of The Rock Center for Corporate Governance since 2006. From 2005 to 2008, Professor of Accounting at the Graduate School of Business, Stanford University. Prior thereto, Ernst & Young Professor of Accounting at The Wharton School, University of Pennsylvania from 1985 to 2005. | | Asset Allocation Trust |
Olivia S. Mitchell
(Born 1953) | | Trustee, since 2006 | | International Foundation of Employee Benefit Plans Professor, Wharton School of the University of Pennsylvania since 1993. Director of Wharton’s Pension Research Council and Boettner Center on Pensions & Retirement Research, and Research Associate at the National Bureau of Economic Research. Previously, Cornell University Professor from 1978 to 1993. | | Asset Allocation Trust |
| | | | | | |
| Other Information (Unaudited) | | Wells Fargo Advantage International Equity Fund | | | 29 | |
| | | | | | |
Name and Year of Birth | | Position Held and Length of Service | | Principal Occupations During Past Five Years | | Other Directorships During
Past Five Years |
Timothy J. Penny
(Born 1951) | | Trustee, since 1996 | | President and CEO of Southern Minnesota Initiative Foundation, a non-profit organization, since 2007 and Senior Fellow at the Humphrey Institute Policy Forum at the University of Minnesota since 1995. Member of the Board of Trustees of NorthStar Education Finance, Inc., a non-profit organization, since 2007. | | Asset Allocation Trust |
Michael S. Scofield
(Born 1943) | | Trustee, since 2010 | | Served on the Investment Company Institute’s Board of Governors and Executive Committee from 2008-2011 as well the Governing Council of the Independent Directors Council from 2006-2011 and the Independent Directors Council Executive Committee from 2008-2011. Chairman of the IDC from 2008-2010. Institutional Investor (Fund Directions) Trustee of Year in 2007. Trustee of the Evergreen Funds (and its predecessors) from 1984 to 2010. Chairman of the Evergreen Funds from 2000-2010. Former Trustee of the Mentor Funds. Retired Attorney, Law Offices of Michael S. Scofield and former Director and Chairman, Branded Media Corporation (multi-media branding company). | | Asset Allocation Trust |
Donald C. Willeke
(Born 1940) | | Trustee, since 1996 | | Principal of the law firm of Willeke & Daniels. General Counsel of the Minneapolis Employees Retirement Fund from 1984 until its consolidation into the Minnesota Public Employees Retirement Association on June 30, 2010. Director and Vice Chair of The Free Trust (non-profit corporation). Director of the American Chestnut Foundation (non-profit corporation). | | Asset Allocation Trust |
Officers
| | | | | | |
Name and Year of Birth | | Position Held and
Length of Service | | Principal Occupations During Past Five Years | | |
Karla M. Rabusch
(Born 1959) | | President, since 2003 | | Executive Vice President of Wells Fargo Bank, N.A. and President of Wells Fargo Funds Management, LLC since 2003. Senior Vice President and Chief Administrative Officer of Wells Fargo Funds Management, LLC from 2001 to 2003. | | |
C. David Messman
(Born 1960) | | Secretary, since 2000; Chief Legal Counsel, since 2003 | | Senior Vice President and Secretary of Wells Fargo Funds Management, LLC since 2001. Vice President and Managing Senior Counsel of Wells Fargo Bank, N.A. since 1996. | | |
Kasey Phillips
(Born 1970) | | Treasurer, since 2009 | | Senior Vice President of Wells Fargo Funds Management, LLC since 2009. Senior Vice President of Evergreen Investment Management Company, LLC from 2006 to 2010. Treasurer of the Evergreen Funds from 2005 to 2010. | | |
David Berardi
(Born 1975) | | Assistant Treasurer, since 2009 | | Vice President of Wells Fargo Funds Management, LLC since 2009. Vice President of Evergreen Investment Management Company, LLC from 2008 to 2010. Assistant Vice President of Evergreen Investment Services, Inc. from 2004 to 2008. Manager of Fund Reporting and Control for Evergreen Investment Management Company, LLC from 2004 to 2010. | | |
Jeremy DePalma
(Born 1974) | | Assistant Treasurer, since 2009 | | Senior Vice President of Wells Fargo Funds Management, LLC since 2009. Senior Vice President of Evergreen Investment Management Company, LLC from 2008 to 2010. Vice President, Evergreen Investment Services, Inc. from 2004 to 2007. Head of the Fund Reporting and Control Team within Fund Administration from 2005 to 2010. | | |
Debra Ann Early
(Born 1964) | | Chief Compliance Officer, since 2007 | | Chief Compliance Officer of Wells Fargo Funds Management, LLC since 2007. Chief Compliance Officer of Parnassus Investments from 2005 to 2007. Chief Financial Officer of Parnassus Investments from 2004 to 2007 and Senior Audit Manager of PricewaterhouseCoopers LLP from 1998 to 2004. | | |
| 1. | The Statement of Additional Information includes additional information about the Trustees and is available, without charge, upon request, by calling 1-800-222-8222 or by visiting the Web site at wellsfargoadvantagefunds.com. |
| | | | |
| 30 | | Wells Fargo Advantage International Equity Fund | | Other Information (Unaudited) |
BOARD CONSIDERATION OF INVESTMENT ADVISORY AND SUB-ADVISORY AGREEMENTS:
Under Section 15 of the Investment Company Act of 1940 (the “1940 Act”), the Board of Trustees (the “Board”) of Wells Fargo Funds Trust (the “Trust”), all the members of which have no direct or indirect interest in the investment advisory and sub-advisory agreements and are not “interested persons” of the Trust, as defined in the 1940 Act (the “Independent Trustees”), must determine whether to approve the continuation of the Trust’s investment advisory and sub-advisory agreements. In this regard, at an in person meeting held on March 29-30, 2012 (the “Meeting”), the Board reviewed and re-approved: (i) an investment advisory agreement with Wells Fargo Funds Management, LLC (“Funds Management”) for Wells Fargo Advantage International Equity Fund (the “Fund”) and (ii) an investment sub-advisory agreement with Wells Capital Management Incorporated (“Wells Capital Management”) for the Fund. The investment advisory agreement with Funds Management and the investment sub-advisory agreement with Wells Capital Management are collectively referred to as the “Advisory Agreements.”
At the Meeting, the Board considered the factors and reached the conclusions described below relating to the selection of Funds Management and Wells Capital Management and the continuation of the Advisory Agreements. Prior to the Meeting, the Trustees conferred extensively among themselves and with representatives of Funds Management about these matters. The Board also met throughout the year and received information that was useful to them in considering the continuation of the Advisory Agreements. The Independent Trustees were assisted in their evaluation of the Advisory Agreements by independent legal counsel, from whom they received separate legal advice and with whom they met separately from Funds Management.
In providing information to the Board, Funds Management and Wells Capital Management were guided by a detailed set of requests submitted by the Independent Trustees’ independent legal counsel on their behalf at the start of the Board’s annual contract renewal process earlier in 2012. In approving the Advisory Agreements, the Board did not identify any particular information or consideration that was all-important or controlling, and each Trustee likely attributed different weights to various factors.
Nature, extent and quality of services
The Board received and considered various information regarding the nature, extent and quality of services provided to the Fund by Funds Management and Wells Capital Management under the Advisory Agreements. The Board also received and considered, among other things, information about the background and experience of senior management of Funds Management, and the qualifications, backgrounds, tenures and responsibilities of the portfolio managers primarily responsible for the day-to-day portfolio management of the Fund.
The Board evaluated the ability of Funds Management and Wells Capital Management, based on their respective financial condition, resources, reputation and other attributes, to attract and retain qualified investment professionals, including research, advisory, and supervisory personnel. The Board further considered the compliance programs and compliance records of Funds Management and Wells Capital Management. In addition, the Board took into account the administrative services provided to the Fund by Funds Management and its affiliates.
The Board’s decision to approve the continuation of the Advisory Agreements was based on a comprehensive evaluation of all of the information provided to it. In considering these matters, the Board considered not only the specific information presented in connection with the Meeting, but also the knowledge gained over time through interaction with Funds Management and Wells Capital Management about various topics, including Funds Management’s oversight of service providers. The above factors, together with those referenced below, are some of the most important, but not necessarily all, factors considered by the Board in concluding that the nature, extent and quality of the investment advisory services provided to the Fund by Funds Management and Wells Capital Management supported the re-approval of the Advisory Agreements. Although the Board considered the continuation of the Advisory Agreements for the Fund as part of the larger process of considering the continuation of the advisory agreements for all of the funds in the complex, its decision to continue the Advisory Agreements for the Fund was ultimately made on a fund-by-fund basis.
Fund performance and expenses
The Board considered the performance results for the Fund over various time periods ended December 31, 2011. The Board also considered these results in comparison to the median performance of a universe of relevant funds (the “Universe”) that was determined by Lipper Inc. (“Lipper”) to be similar to the Fund, and in comparison to the Fund’s
| | | | | | |
| Other Information (Unaudited) | | Wells Fargo Advantage International Equity Fund | | | 31 | |
benchmark index and to other comparative data. Lipper is an independent provider of investment company data. The Board received a description of the methodology used by Lipper to select the mutual funds in the Universe. The Board noted that the more recent performance of the Fund was lower than the median performance of the Universe for all periods under review. The Board further noted that the longer-term performance was in range of the median performance of the Universe. The Board also noted that the more recent performance of the Fund was lower than its benchmark, the Lipper International Large-Cap Core Funds Index, for the periods under review. The Board further noted that the longer-term performance was in range of the median performance of its benchmark, the Lipper International Large-Cap Core Funds Index.
The Board noted that the Fund’s more recent performance results warranted further discussion. As part of its further review, the Board received an analysis of, and discussed factors contributing to, the underperformance of the Fund relative to the Universe. Funds Management discussed plans to recommend changes designed to improve the Fund’s performance. The Board was satisfied that Funds Management was taking appropriate actions with respect to the Fund’s investment performance.
The Board received and considered information regarding the Fund’s contractual advisory fee and net operating expense ratios and their various components, including actual management fees (which reflect fee waivers, if any), transfer agent, custodian and other non-management fees, Rule 12b-1 and non-Rule 12b-1 fees, service fees and fee waiver and expense reimbursement arrangements. The Board also considered these ratios in comparison to the median ratios of an expense Universe and a narrower expense group of mutual funds (each, an “Expense Group”) that was determined by Lipper to be similar to the Fund. The Board received a description of the methodology used by Lipper to select the mutual funds in the Fund’s Expense Group. The Board noted that the net operating expense ratios of the Fund were lower than or in range of the Fund’s Expense Group’s median net operating expense ratios.
Based on the above-referenced considerations and other factors, the Board concluded that the overall performance and expense structure of the Fund supported the re-approval of the Advisory Agreements for the Fund.
Investment advisory and sub-advisory fee rates
The Board reviewed and considered the contractual investment advisory fee rate that is payable by the Fund to Funds Management for investment advisory services (the “Advisory Agreement Rate”), both on a stand-alone basis and on a combined basis with the Fund’s administration fee rate. The Board took into account the separate administrative and other services covered by the administration fee rate. The Board also reviewed and considered the contractual investment sub-advisory fee rate that is payable by Funds Management to Wells Capital Management for investment sub-advisory services (the “Sub-Advisory Agreement Rate”). In addition, the Board reviewed and considered the existing fee waiver/cap arrangements applicable to the Advisory Agreement Rate and considered the Advisory Agreement Rate after taking the waivers/caps into account (the “Net Advisory Rate”).
The Board received and considered information comparing the Advisory Agreement Rate and Net Advisory Rate with those of other funds in the Fund’s Expense Group median. The Board noted that while the Advisory Agreement Rate for the Fund was higher than the median rates for the Fund’s Expense Group, the Net Advisory Rate for the Fund was in range of the median rates for the Fund’s Expense Group. The Board noted that Funds Management proposed to extend contractual fee cap arrangements for the Fund designed to lower the fund’s expenses until February 28, 2014.
The Board also received and considered information about the nature and extent of services offered and fee rates charged by Funds Management and Wells Capital Management to other types of clients. In this regard, the Board received information about differences between the services, and the compliance, reporting, and other legal burdens and risks of providing investment advice to mutual funds and those associated with providing advice to non-mutual fund clients such as collective funds or institutional separate accounts.
The Board determined that the Advisory Agreement Rate for the Fund, both with and without an administration fee rate and before and after waivers, was reasonable in light of the Fund’s Expense Group information, the net expense ratio commitments, the services covered by the Advisory Agreements and other information provided. The Board also reviewed and considered the Sub-Advisory Agreement Rate and concluded that the Sub-Advisory Agreement Rate was reasonable in light of the services covered by the sub-advisory agreement and other information provided.
| | | | |
| 32 | | Wells Fargo Advantage International Equity Fund | | Other Information (Unaudited) |
Profitability
The Board received and considered a profitability analysis of Funds Management, as well as an analysis of the profitability to the collective Wells Fargo businesses that provide services to the Fund. It considered that the information provided to it was necessarily estimated, and that the profitability information provided to it, especially on a fund-by-fund basis, did not necessarily provide a precise tool for evaluating the appropriateness of the Fund’s Advisory Agreement Rate in isolation. It noted that the levels of profitability reported on a fund-by-fund basis varied widely, depending on, among other things, the size and type of fund. The Board concluded that the profitability reported by Funds Management was not unreasonable.
The Board did not consider separate profitability information with respect to Wells Capital Management, because, as an affiliate of Funds Management, its profitability information was subsumed in the collective Wells Fargo profitability analysis provided by Funds Management.
Economies of scale
With respect to possible economies of scale, the Board reviewed the breakpoints in the Fund’s advisory fee structure, which operate generally to reduce the effective Advisory Agreement Rate of the Fund (as a percentage of Fund assets) as the Fund grows in size. It considered that, as a fund shrinks in size, breakpoints conversely result in increasing fee levels. The Board noted that it would have on-going opportunities to review the appropriate levels of breakpoints in the future, and concluded that the breakpoints as implemented appeared to be a reasonable step toward sharing economies of scale, if any, with the Fund. However, the Board acknowledged the inherent limitations of any analysis of an investment adviser’s economies of scale and of any attempt to correlate breakpoints with such economies, stemming largely from the Board’s understanding that economies of scale are realized, if at all, by an investment adviser across a variety of products and services, not just with respect to a single fund.
Other benefits to Funds Management and Wells Capital Management
The Board received and considered information regarding potential “fall-out” or ancillary benefits received by Funds Management and its affiliates, including Wells Capital Management, as a result of their relationship with the Fund. Ancillary benefits could include, among others, benefits directly attributable to the relationship of Funds Management and Wells Capital Management with the Fund and benefits potentially derived from an increase in Funds Management’s and Wells Capital Management’s business as a result of their relationship with the Fund (such as the ability to market to shareholders other financial products offered by Funds Management and its affiliates, including Wells Capital Management).
The Board considered that Wells Fargo Funds Distributor, LLC, an affiliate of Funds Management, serves as distributor to the Fund and receives certain compensation for those services. The Board noted that various financial institutions, including affiliates of Funds Management, may receive distribution-related fees, shareholder servicing payments (including amounts derived from payments under Rule 12b-1 plans) and sub-transfer agency fees in respect of shares sold or held through them and services provided.
The Board also reviewed information about whether and to what extent soft dollar credits are sought and how any such credits are utilized and any benefits that may be realized by using an affiliated broker.
Other factors and broader review
The Board also considered the markets for distribution of the Fund’s shares, including the channels through which the Fund’s shares are offered and sold. The Board noted that the Fund is part of one of the few fund families that have both direct-to-fund and intermediary distribution channels. As discussed above, the Board reviews detailed materials received from Funds Management and Wells Capital Management annually as part of the re-approval process under Section 15 of the 1940 Act and also reviews and assesses information about the quality of the services that the Fund receives throughout the year. In this regard, the Board has reviewed reports of Funds Management at each of its quarterly meetings, which include, among other things, portfolio reviews and performance reports. In addition, the Board confers with portfolio managers at various times throughout the year.
Conclusion
After considering the above-described factors and based on its deliberations and its evaluation of the information described above, the Board unanimously approved the continuation of the Advisory Agreements for an additional one-year period.
| | | | | | |
| List of Abbreviations | | Wells Fargo Advantage International Equity Fund | | | 33 | |
The following is a list of common abbreviations for terms and entities which may have appeared in this report.
| ACB | — Agricultural Credit Bank |
| ADR | — American Depository Receipt |
| ADS | — American Depository Shares |
| AGC-ICC | — Assured Guaranty Corporation - Insured Custody Certificates |
| AGM | — Assured Guaranty Municipal |
| AMBAC | — American Municipal Bond Assurance Corporation |
| AMT | — Alternative Minimum Tax |
| BAN | — Bond Anticipation Notes |
| BHAC | — Berkshire Hathaway Assurance Corporation |
| CAB | — Capital Appreciation Bond |
| CCAB | — Convertible Capital Appreciation Bond |
| CDA | — Community Development Authority |
| CDO | — Collateralized Debt Obligation |
| COP | — Certificate of Participation |
| DRIVER | — Derivative Inverse Tax-Exempt Receipts |
| DW&P | — Department of Water & Power |
| DWR | — Department of Water Resources |
| ECFA | — Educational & Cultural Facilities Authority |
| EDA | — Economic Development Authority |
| EDFA | — Economic Development Finance Authority |
| ETF | — Exchange-Traded Fund |
| FFCB | — Federal Farm Credit Bank |
| FGIC | — Financial Guaranty Insurance Corporation |
| FHA | — Federal Housing Authority |
| FHLB | — Federal Home Loan Bank |
| FHLMC | — Federal Home Loan Mortgage Corporation |
| FICO | — The Financing Corporation |
| FNMA | — Federal National Mortgage Association |
| GDR | — Global Depository Receipt |
| GNMA | — Government National Mortgage Association |
| HCFR | — Healthcare Facilities Revenue |
| HEFA | — Health & Educational Facilities Authority |
| HEFAR | — Higher Education Facilities Authority Revenue |
| HFA | — Housing Finance Authority |
| HFFA | — Health Facilities Financing Authority |
| IBC | — Insured Bond Certificate |
| IDA | — Industrial Development Authority |
| IDAG | — Industrial Development Agency |
| IDR | — Industrial Development Revenue |
| KRW | — Republic of Korea Won |
| LIBOR | — London Interbank Offered Rate |
| LLC | — Limited Liability Company |
| LLP | — Limited Liability Partnership |
| MBIA | — Municipal Bond Insurance Association |
| MFHR | — Multi-Family Housing Revenue |
| MSTR | — Municipal Securities Trust Receipts |
| MUD | — Municipal Utility District |
| NATL-RE | — National Public Finance Guarantee Corporation |
| PCFA | — Pollution Control Finance Authority |
| PCR | — Pollution Control Revenue |
| PFA | — Public Finance Authority |
| PFFA | — Public Facilities Financing Authority |
| PFOTER | — Puttable Floating Option Tax-Exempt Receipts |
| plc | — Public Limited Company |
| PUTTER | — Puttable Tax-Exempt Receipts |
| R&D | — Research & Development |
| RDA | — Redevelopment Authority |
| RDFA | — Redevelopment Finance Authority |
| REIT | — Real Estate Investment Trust |
| ROC | — Reset Option Certificates |
| SAVRS | — Select Auction Variable Rate Securities |
| SBA | — Small Business Authority |
| SFHR | — Single Family Housing Revenue |
| SFMR | — Single Family Mortgage Revenue |
| SPA | — Standby Purchase Agreement |
| SPDR | — Standard & Poor’s Depositary Receipts |
| STRIPS | — Separate Trading of Registered Interest and Principal Securities |
| TAN | — Tax Anticipation Notes |
| TIPS | — Treasury Inflation-Protected Securities |
| TRAN | — Tax Revenue Anticipation Notes |
| TCR | — Transferable Custody Receipts |
| TTFA | — Transportation Trust Fund Authority |
| TVA | — Tennessee Valley Authority |
| XLCA | — XL Capital Assurance |
This page is intentionally left blank.


FOR MORE INFORMATION
More information about Wells Fargo Advantage Funds is available free upon request. To obtain literature, please write, e-mail, visit the Fund’s Web site, or call:
Wells Fargo Advantage Funds
P.O. Box 8266
Boston, MA 02266-8266
E-mail: wfaf@wellsfargo.com
Web site: wellsfargoadvantagefunds.com
Individual investors: 1-800-222-8222
Retail investment professionals: 1-888-877-9275
Institutional investment professionals: 1-866-765-0778
This report and the financial statements contained herein are submitted for the general information of the shareholders of Wells Fargo Advantage Funds. If this report is used for promotional purposes, distribution of the report must be accompanied or preceded by a current prospectus. For a prospectus containing more complete information, including charges and expenses, call 1-800-222-8222 or visit the Fund’s Web site at wellsfargoadvantagefunds.com. Please consider the investment objectives, risks, charges, and expenses of the investment carefully before investing. This and other information about Wells Fargo Advantage Funds can be found in the current prospectus. Read the prospectus carefully before you invest or send money.
Wells Fargo Funds Management, LLC, a wholly owned subsidiary of Wells Fargo & Company, provides investment advisory and administrative services for Wells Fargo Advantage Funds. Other affiliates of Wells Fargo & Company provide subadvisory and other services for the Funds. The Funds are distributed by Wells Fargo Funds Distributor, LLC, Member FINRA/SIPC, an affiliate of Wells Fargo & Company.
NOT FDIC INSURED ¡ NO BANK GUARANTEE ¡ MAY LOSE VALUE
© 2012 Wells Fargo Funds Management, LLC. All rights reserved.
| | |
 | | 209724 06-12 SA240/SAR240 4-12 |

Wells Fargo Advantage Intrinsic World Equity Fund

Semi-Annual Report
April 30, 2012

Reduce clutter. Save trees.
Sign up for electronic delivery of prospectuses and shareholder reports at wellsfargo.com/advantagedelivery
Contents
The views expressed and any forward-looking statements are as of April 30, 2012, unless otherwise noted, and are those of the Fund managers and/or Wells Fargo Funds Management, LLC. Discussions of individual securities, or the markets generally, or any Wells Fargo Advantage Fund are not intended as individual recommendations. Future events or results may vary significantly from those expressed in any forward-looking statements; the views expressed are subject to change at any time in response to changing circumstances in the market. Wells Fargo Funds Management, LLC, disclaims any obligation to publicly update or revise any views expressed or forward-looking statements.
NOT FDIC INSURED ¡ NO BANK GUARANTEE ¡ MAY LOSE VALUE

WELLS FARGO INVESTMENT HISTORY
| | |
| |
| 1932 | | Keystone creates one of the first mutual fund families. |
| |
| 1971 | | Wells Fargo & Company introduces one of the first institutional index funds. |
| |
| 1978 | | Wells Fargo applies Markowitz and Sharpe’s research on Modern Portfolio Theory to introduce one of the industry’s first Tactical Asset Allocation (TAA) models in institutional separately managed accounts. |
| |
| 1984 | | Wells Fargo Stagecoach Funds launches its first asset allocation fund. |
| |
| 1989 | | The Tactical Asset Allocation (TAA) Model is first applied to Wells Fargo’s asset allocation mutual funds. |
| |
| 1994 | | Wells Fargo introduces the LifePath Funds, one of the first suites of target date funds (now the Wells Fargo Advantage Dow Jones Target Date FundsSM). |
| |
| 1996 | | Evergreen Investments and Keystone Funds merge. |
| |
| 1997 | | Wells Fargo launches Wells Fargo Advantage WealthBuilder PortfoliosSM, a fund-of-funds suite of products that includes the use of quantitative models to shift assets among investment styles. |
| |
| 1999 | | Norwest Advantage Funds and Stagecoach Funds are reorganized into Wells Fargo Funds after the merger of Norwest and Wells Fargo. |
| |
| 2002 | | Evergreen Retail and Evergreen Institutional companies form the umbrella asset management company, Evergreen Investments. |
| |
| 2005 | | The integration of Strong Funds with Wells Fargo Funds creates Wells Fargo Advantage Funds, resulting in one of the top 20 mutual fund companies in the United States. |
| |
| 2006 | | Wells Fargo Advantage Funds relaunches the target date product line as Wells Fargo Advantage Dow Jones Target Date Funds. |
| |
| 2010 | | The mergers and reorganizations of Evergreen and Wells Fargo Advantage mutual funds are completed, unifying the families under the brand of Wells Fargo Advantage Funds. |
Wells Fargo Advantage Funds®
Wells Fargo Advantage Funds skillfully guides institutions, financial advisors, and individuals through the investment terrain to help them reach their financial objectives. Everything we do on behalf of investors is backed by our unique combination of qualifications.
Strength
Our organization is built on the standards of integrity and service established by our parent company—Wells Fargo & Company—more than 150 years ago. And, because we’re part of a highly diversified financial enterprise, we offer the depth of resources to help investors succeed.
Expertise
Our multi-boutique model offers investors access to the independent thinking of premier investment managers that have been chosen for their time-tested strategies. While each team specializes in a specific investment strategy, collectively they provide investors a wide choice of distinct investment styles. Our dedication to investment excellence doesn’t end with our expertise in manager selection—risk management, analysis, and rigorous ongoing review seek to ensure each manager’s investment process remains consistent.
Partnership
Our collaborative approach is built around understanding the needs and goals of our clients. By adhering to core principles of sound judgment and steady guidance, we support you through every stage of the investment decision process.
Carefully consider a fund’s investment objectives, risks, charges, and expenses before investing. For a current prospectus and, if available, a summary prospectus, containing this and other information, visit wellsfargoadvantagefunds.com. Read it carefully before investing.
Wells Fargo Funds Management, LLC, a wholly owned subsidiary of Wells Fargo & Company, provides investment advisory and administrative services for Wells Fargo Advantage Funds®. Other affiliates of Wells Fargo & Company provide subadvisory and other services for the Funds. The Funds are distributed by Wells Fargo Funds Distributor, LLC, Member FINRA/SIPC, an affiliate of Wells Fargo & Company.
“Dow Jones®” and “Dow Jones Target Date IndexesSM” are service marks of Dow Jones Trademark Holdings, LLC (“Dow Jones”), have been licensed to CME Group Index Services LLC (“CME Indexes”) and have been sublicensed for use for certain purposes by Global Index Advisors, Inc, and Wells Fargo Funds Management, LLC. The Wells Fargo Advantage Dow Jones Target Date FundsSM based on the Dow Jones Target Date IndexesSM, are not sponsored, endorsed, sold or promoted by Dow Jones, CME Indexes or their respective affiliates and none of them makes any representation regarding the advisability of investing in such product(s).
NOT FDIC INSURED ¡ NO BANK GUARANTEE ¡ MAY LOSE VALUE
Not part of the semi-annual report.
Wells Fargo Advantage Funds offers more than 110 mutual funds across a wide range of asset classes, representing over $211 billion in assets under management, as of April 30, 2012.
| | | | |
| Equity Funds | | | | |
Asia Pacific Fund | | Enterprise Fund† | | Opportunity Fund† |
C&B Large Cap Value Fund | | Equity Value Fund | | Precious Metals Fund |
C&B Mid Cap Value Fund | | Global Opportunities Fund | | Premier Large Company Growth Fund |
Capital Growth Fund | | Growth Fund | | Small Cap Opportunities Fund |
Common Stock Fund | | Index Fund | | Small Cap Value Fund |
Disciplined U.S. Core Fund | | International Equity Fund | | Small Company Growth Fund |
Discovery Fund† | | International Value Fund | | Small Company Value Fund |
Diversified Equity Fund | | Intrinsic Small Cap Value Fund | | Small/Mid Cap Core Fund |
Diversified International Fund | | Intrinsic Value Fund | | Small/Mid Cap Value Fund |
Diversified Small Cap Fund | | Intrinsic World Equity Fund | | Special Mid Cap Value Fund |
Emerging Growth Fund | | Large Cap Core Fund | | Special Small Cap Value Fund |
Emerging Markets Equity Fund | | Large Cap Growth Fund | | Specialized Technology Fund |
Emerging Markets Equity Income Fund | | Large Company Value Fund | | Traditional Small Cap Growth Fund |
Emerging Markets Local Bond Fund | | Omega Growth Fund | | Utility and Telecommunications Fund |
Endeavor Select Fund† | | | | |
| Bond Funds | | | | |
Adjustable Rate Government Fund | | Inflation-Protected Bond Fund | | Short-Term Bond Fund |
California Limited-Term Tax-Free Fund | | Intermediate Tax/AMT-Free Fund | | Short-Term High Yield Bond Fund |
California Tax-Free Fund | | International Bond Fund | | Short-Term Municipal Bond Fund |
Colorado Tax-Free Fund | | Minnesota Tax-Free Fund | | Strategic Municipal Bond Fund |
Government Securities Fund | | Municipal Bond Fund | | Total Return Bond Fund |
High Income Fund | | North Carolina Tax-Free Fund | | Ultra Short-Term Income Fund |
High Yield Bond Fund | | Pennsylvania Tax-Free Fund | | Ultra Short-Term Municipal Income Fund |
Income Plus Fund | | Short Duration Government Bond Fund | | Wisconsin Tax-Free Fund |
| Asset Allocation Funds | | | | |
Absolute Return Fund | | WealthBuilder Equity Portfolio† | | Target 2020 Fund† |
Asset Allocation Fund | | WealthBuilder Growth Allocation Portfolio† | | Target 2025 Fund† |
Conservative Allocation Fund | | WealthBuilder Growth Balanced Portfolio† | | Target 2030 Fund† |
Diversified Capital Builder Fund | | WealthBuilder Moderate Balanced Portfolio† | | Target 2035 Fund† |
Diversified Income Builder Fund | | WealthBuilder Tactical Equity Portfolio† | | Target 2040 Fund† |
Growth Balanced Fund | | Target Today Fund† | | Target 2045 Fund† |
Index Asset Allocation Fund | | Target 2010 Fund† | | Target 2050 Fund† |
Moderate Balanced Fund | | Target 2015 Fund† | | Target 2055 Fund† |
WealthBuilder Conservative Allocation Portfolio† | | | | |
| Money Market Funds | | | | |
100% Treasury Money Market Fund | | Heritage Money Market Fund† | | National Tax-Free Money Market Fund |
California Municipal Money Market Fund | | Money Market Fund | | Prime Investment Money Market Fund |
Cash Investment Money Market Fund | | Municipal Cash Management Money Market Fund | | Treasury Plus Money Market Fund |
Government Money Market Fund | | Municipal Money Market Fund | | |
| Variable Trust Funds1 | | | | |
VT Discovery Fund† | | VT Intrinsic Value Fund | | VT Small Cap Growth Fund |
VT Index Asset Allocation Fund | | VT Omega Growth Fund | | VT Small Cap Value Fund |
VT International Equity Fund | | VT Opportunity Fund† | | VT Total Return Bond Fund |
An investment in a money market fund is not insured or guaranteed by the Federal Deposit Insurance Corporation or any other government agency. Although the Wells Fargo Advantage Money Market Funds seek to preserve the value of your investment at $1.00 per share, it is possible to lose money by investing in a money market fund.
| 1. | The Variable Trust Funds are generally available only through insurance company variable contracts. |
| † | In this report, the Wells Fargo Advantage Discovery FundSM, Wells Fargo Advantage Endeavor Select FundSM, Wells Fargo Advantage Enterprise FundSM, Wells Fargo Advantage Opportunity FundSM, Wells Fargo Advantage WealthBuilder Conservative Allocation PortfolioSM, Wells Fargo Advantage WealthBuilder Equity PortfolioSM, Wells Fargo Advantage WealthBuilder Growth Allocation PortfolioSM, Wells Fargo Advantage WealthBuilder Growth Balanced PortfolioSM, Wells Fargo Advantage WealthBuilder Moderate Balanced PortfolioSM, Wells Fargo Advantage WealthBuilder Tactical Equity PortfolioSM, Wells Fargo Advantage Dow Jones Target Today FundSM, Wells Fargo Advantage Dow Jones Target 2010 FundSM, Wells Fargo Advantage Dow Jones Target 2015 FundSM, Wells Fargo Advantage Dow Jones Target 2020 FundSM, Wells Fargo Advantage Dow Jones Target 2025 FundSM, Wells Fargo Advantage Dow Jones Target 2030 FundSM, Wells Fargo Advantage Dow Jones Target 2035 FundSM, Wells Fargo Advantage Dow Jones Target 2040 FundSM, Wells Fargo Advantage Dow Jones Target 2045 FundSM, Wells Fargo Advantage Dow Jones Target 2050 FundSM, Wells Fargo Advantage Dow Jones Target 2055 FundSM, Wells Fargo Advantage Heritage Money Market FundSM, Wells Fargo Advantage VT Discovery FundSM, and Wells Fargo Advantage VT Opportunity FundSM are referred to as the Discovery Fund, Endeavor Select Fund, Enterprise Fund, Opportunity Fund, WealthBuilder Conservative Allocation Portfolio, WealthBuilder Equity Portfolio, WealthBuilder Growth Allocation Portfolio, WealthBuilder Growth Balanced Portfolio, WealthBuilder Moderate Balanced Portfolio, WealthBuilder Tactical Equity Portfolio, Target Today Fund, Target 2010 Fund, Target 2015 Fund, Target 2020 Fund, Target 2025 Fund, Target 2030 Fund, Target 2035 Fund, Target 2040 Fund, Target 2045 Fund, Target 2050 Fund, Target 2055 Fund, Heritage Money Market Fund, VT Discovery Fund, and VT Opportunity Fund, respectively. |
Not part of the semi-annual report.
| | | | |
| 2 | | Wells Fargo Advantage Intrinsic World Equity Fund | | Letter to Shareholders |

Karla M. Rabusch,
President
Wells Fargo Advantage Funds
The period was marked by continued concerns about the possible global economic effects of the ongoing European sovereign debt crisis that began in Greece and later spread to the larger economies of Italy and Spain.
The potential for sovereign debt default had a negative effect on emerging markets, with indexes in major countries such as Brazil and India ending the period with losses.
Dear Valued Shareholder:
We’re pleased to offer you this semi-annual report for the Wells Fargo Advantage Intrinsic World Equity Fund for the six-month period that ended April 30, 2012. The period was marked by continued concerns about the possible global economic effects of the ongoing European sovereign debt crisis that began in Greece and later spread to the larger economies of Italy and Spain. Widespread support from central banks helped push developed market indexes to gains, but several emerging markets posted losses for the period.
Macroeconomic optimism seemed to fade as global growth slowed and worries rose.
Prior to and throughout the reporting period, concerns about the eurozone sovereign debt situation returned to center stage. Investors became increasingly concerned that Greece would default on its debt, a scenario that only seemed more likely as eurozone leaders began to openly discuss a “voluntary” haircut on Greek debt for private investors. Because many eurozone banks owned Greek debt and many U.S. banks had financial ties to eurozone banks, investors worried about the effects of such an event on the financial systems and on the global economy.
In October 2011, market participants turned their attention to the debt burdens of Italy—which, like the U.S., also had its credit rating downgraded by Standard & Poor’s—because even though it had a relatively modest budget deficit, it had a high amount of outstanding debt and a stagnant economy. French banks were heavily exposed to Italian debt, so Italy’s woes led to fears of a state bailout of French banks and a resulting increase in France’s expenditures.
The Greek credit crisis was seemingly addressed in March 2012, when the Greek government came to an agreement with its creditors that allowed it to write down the principal on most of its bonds in exchange for increased financial austerity. The Greek agreement, combined with unprecedented support for eurozone banks by the European Central Bank (ECB), seemed to calm investor concerns, at least temporarily, and most developed markets—both in Europe and Asia—ended the period with gains. The potential for sovereign debt default had a negative effect on emerging markets, with indexes in major countries such as Brazil and India ending the period with losses. China was a notable exception, posting a gain.
The U.S. economy reported relatively solid news.
In contrast to worrisome data from the eurozone, U.S. economic data remained moderately positive. Reported gross domestic product (GDP) growth came in at a 1.8% annualized rate in the third quarter of 2011 and then accelerated to a 3.0% annualized rate in the fourth quarter. The initial estimate for GDP growth in the first quarter of 2012 came in at a 2.2% annualized rate, further supporting the case for economic recovery. In addition, the major banks appeared to have taken steps toward repairing their balance sheets; in March, the Federal Reserve (Fed) announced that 15 of the 19 major banks had passed a “stress test” in which the Fed attempted to gauge whether the banks could survive a severe recession that included a 50% drop in the stock market and a 21% percent decline in housing prices.
| | | | | | |
| Letter to Shareholders | | Wells Fargo Advantage Intrinsic World Equity Fund | | | 3 | |
Financial stocks rebounded and outperformed the broader market for the reporting period after the Fed released details of the stress test. Stocks generally rallied across the market as investors seemed to be increasingly confident that the U.S. would not return to recession.
Central banks continued to provide stimulus.
Throughout the reporting period, the Federal Open Market Committee kept its key interest rates effectively at zero in order to support the economy and financial system. In response to extreme market volatility and signs of a weakening economy, the Fed announced its intention to keep interest rates low until at least late 2014.
Likewise, the Bank of Japan voted in late April to keep its key policy rate in a range of 0.0% to 0.1%. The bank announced that it would expand its government bond purchases by 10 trillion yen ($123.8 billion), targeting a 1.0% inflation rate in an attempt to end the country’s multi-year deflation.
As of November 1, 2011, the ECB had a key rate of 1.50%, which it had increased from 1.0% in an attempt to keep inflation in check. Soon, in response to weakness in the southern European economies, the ECB lowered its key rate to 1.25% in early November 2011 and 1.0% in December 2011. The ECB also continued to provide virtually unlimited liquidity for banks, announcing a Long-Term Refinancing Operation in December through which it provided low-cost three-year loans to lenders.
We use time-tested investment strategies, even as many variables are at work in the market.
Elevated unemployment and debt defaults continue to pressure consumers and businesses alike. In our experience, strict adherence to time-tested investment strategies has its rewards. As a whole, Wells Fargo Advantage Funds represents investments across a range of asset classes and investment styles, giving you an opportunity to create a diversified investment portfolio. While diversification may not prevent losses in a downturn, we believe it helps in managing risk.
Thank you for choosing to invest with Wells Fargo Advantage Funds. We appreciate your confidence in us and remain committed to helping you meet your financial needs. For current information about your fund investments, contact your investment professional, visit our Web site at wellsfargoadvantagefunds.com, or call us directly at 1-800-222-8222. We are available 24 hours a day, 7 days a week.
Sincerely,

Karla M. Rabusch
President
Wells Fargo Advantage Funds
| | | | |
| 4 | | Wells Fargo Advantage Intrinsic World Equity Fund | | Letter to Shareholders |
Notice to Shareholders
The Board of Trustees for Wells Fargo Advantage Funds has unanimously approved the following modifications to certain net asset value (NAV) waiver privileges and commission schedules:
| | n | | Effective May 1, 2012, automatic investment plan (AIP) purchases and proceeds received from systematic withdrawals will no longer qualify for NAV repurchase privileges. | |
| | n | | Effective May 1, 2012, discretionary rights to waive the upfront commission for Class C and “jumbo” Class A share purchases will no longer be granted to broker/dealers. However, we will continue to waive the Class C shares contingent deferred sales charge for redemptions by employer-sponsored retirement plans where the dealer of record waived its commission at the time of purchase. | |
| | n | | Effective July 31, 2012, NAV purchase privileges for former Evergreen Class IS and Class R shareholders are being modified to remove the ability to purchase Class A shares at NAV unless those shares are held directly with the Fund on or after July 31, 2012. | |
Please contact your investment professional or call us directly at 1-800-222-8222 if you have any questions on this Notice to Shareholders.
| | | | | | |
| Performance Highlights (Unaudited) | | Wells Fargo Advantage Intrinsic World Equity Fund | | | 5 | |
INVESTMENT OBJECTIVE
The Fund seeks long-term capital appreciation.
ADVISER
Wells Fargo Funds Management, LLC
SUB-ADVISER
Metropolitan West Capital Management, LLC
PORTFOLIO MANAGERS
Gary Lisenbee
Jean-Baptiste Nadal, CFA
Jeffrey Peck
FUND INCEPTION
April 30, 1996
| | | | |
TEN LARGEST EQUITY HOLDINGS1
(AS OF APRIL 30, 2012) | |
Enersis SA ADR | | | 3.28% | |
eBay Incorporarted | | | 3.24% | |
Apple Incorporated | | | 3.20% | |
Samsung Electronics Company Limited | | | 3.10% | |
The Home Depot Incorporated | | | 2.96% | |
Oracle Corporation | | | 2.91% | |
EMC Corporation | | | 2.74% | |
Unilever NV | | | 2.52% | |
Franklin Resources Incorporated | | | 2.50% | |
JPMorgan Chase & Company | | | 2.45% | |
| | |
SECTOR DISTRIBUTION2
(AS OF APRIL 30, 2012) |
|
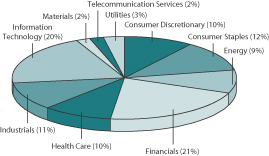 |
| 1. | The ten largest equity holdings are calculated based on the value of the securities divided by total net assets of the Fund. Holdings are subject to change and may have changed since the date specified. |
| 2. | Sector distribution is subject to change and is calculated based on the total long-term investments of the Fund. |
| | | | |
| 6 | | Wells Fargo Advantage Intrinsic World Equity Fund | | Performance Highlights (Unaudited) |
AVERAGE ANNUAL TOTAL RETURN3 (%) (AS OF APRIL 30, 2012)
| | | | | | | | | | | | | | | | | | | | | | | | | | | | | | | | | | | | | | | | | | | | |
| | | | | | Including Sales Charge | | | Excluding Sales Charge | | | Expense Ratios4 | |
| | | Inception Date | | | 6 Months* | | | 1 Year | | | 5 Year | | | 10 Year | | | 6 Months* | | | 1 Year | | | 5 Year | | | 10 Year | | | Gross | | | Net5 | |
Class A (EWEAX) | | | 04/30/1996 | | | | 8.64 | | | | (1.18 | ) | | | (0.52 | ) | | | 5.67 | | | | 15.27 | | | | 4.83 | | | | 0.67 | | | | 6.30 | | | | 1.51% | | | | 1.41% | |
Class C (EWECX) | | | 05/18/2007 | | | | 13.85 | | | | 3.07 | | | | (0.07 | ) | | | 5.51 | | | | 14.85 | | | | 4.07 | | | | (0.07 | ) | | | 5.51 | | | | 2.26% | | | | 2.16% | |
Administrator Class (EWEIX) | | | 05/18/2007 | | | | | | | | | | | | | | | | | | | | 15.34 | | | | 5.05 | | | | 0.89 | | | | 6.42 | | | | 1.35% | | | | 1.16% | |
Institutional Class (EWENX) | | | 07/30/2010 | | | | | | | | | | | | | | | | | | | | 15.50 | | | | 5.27 | | | | 0.96 | | | | 6.45 | | | | 1.08% | | | | 0.96% | |
MSCI World Index (Net)6 | | | | | | | | | | | | | | | | | | | | | | | 7.54 | | | | (4.63 | ) | | | (1.78 | ) | | | 4.96 | | | | | | | | | |
| * | Returns for periods of less than one year are not annualized. |
Figures quoted represent past performance, which is no guarantee of future results and do not reflect the deduction of taxes that a shareholder may pay on fund distributions or the redemption of fund shares. Investment return and principal value of an investment will fluctuate so that an investor’s shares, when redeemed, may be worth more or less than their original cost. Performance shown without sales charges would be lower if sales charges were reflected. Current performance may be lower or higher than the performance data quoted and assumes the reinvestment of dividends and capital gains. Current month-end performance is available on the Fund’s Web site – wellsfargoadvantagefunds.com.
Index returns do not include transaction costs associated with buying and selling securities, any mutual fund fees or expenses or any taxes. It is not possible to invest directly in an index.
For Class A shares, the maximum front-end sales charge is 5.75%. For Class C shares, the maximum contingent deferred sales charge is 1.00%. Performance including sales charge assumes the sales charge for the corresponding time period. Administrator Class and Institutional Class shares are sold without a front-end sales charge or contingent deferred sales charge.
Stock fund values fluctuate in response to the activities of individual companies and general market and economic conditions. Foreign investments are especially volatile and can rise or fall dramatically due to differences in the political and economic conditions of the host country. These risks are generally intensified in emerging markets. The use of derivatives may reduce returns and/or increase volatility. Certain investment strategies tend to increase the total risk of an investment (relative to the broader market). This Fund is exposed to smaller-company securities risk. Consult the Fund’s prospectus for additional information on these and other risks.
| 3. | Historical performance shown for Class C shares prior to their inception reflects the performance of Class A shares, adjusted to reflect the higher expenses applicable to Class C shares. Historical performance shown for the Institutional Class shares prior to their inception reflects the performance of the Administrator Class shares, and includes the higher expenses applicable to the Administrator Class shares. If these expenses had not been included, returns would be higher. Historical performance shown for the Administrator Class shares prior to their inception reflects the performance of Class A shares, and includes the higher expenses applicable to Class A shares. If these expenses had not been included, returns would be higher. Historical performance shown for all classes of the Fund prior to July 19, 2010 is based on the performance of the Fund’s predecessor, Evergreen Intrinsic World Equity Fund. |
| 4. | Reflects the expense ratios as stated in the most recent prospectuses. |
| 5. | The Adviser has committed through July 18, 2013 to waive fees and/or reimburse expenses to the extent necessary to cap the Fund’s Total Annual Fund Operating Expenses After Fee Waiver, excluding certain expenses, at 1.40% for Class A, 2.15% for Class C, 1.15% for Administrator Class and 0.95% for Institutional Class. Without this cap, the Fund’s returns would have been lower. |
| 6. | The Morgan Stanley Capital International World Index (Net) (the “MSCI World Index (Net)”) is a free float adjusted market capitalization weighted index that is designed to measure the equity market performance of developed markets. You cannot invest directly in an index. Source: MSCI. MSCI makes no express or implied warranties or representations and shall have no liability whatsoever with respect to any MSCI data contained herein. The MSCI data may not be further redistributed or used as a basis for other indexes or any securities or financial products. This report is not approved, reviewed, or produced by MSCI. |
| | | | | | |
| Fund Expenses (Unaudited) | | Wells Fargo Advantage Intrinsic World Equity Fund | | | 7 | |
As a shareholder of the Fund, you incur two types of costs: (1) transaction costs, including sales charges (loads) on purchase payments and contingent deferred sales charges (if any) on redemptions and (2) ongoing costs, including management fees; distribution (12b-1) and/or shareholder service fees; and other Fund expenses. This example is intended to help you understand your ongoing costs (in dollars) of investing in the Fund and to compare these costs with the ongoing costs of investing in other mutual funds.
The example is based on an investment of $1,000 invested at the beginning of the six-month period and held for the entire period from November 1, 2011 to April 30, 2012.
Actual Expenses
The “Actual” line of the table below provides information about actual account values and actual expenses. You may use the information in this line, together with the amount you invested, to estimate the expenses that you paid over the period. Simply divide your account value by $1,000 (for example, an $8,600 account value divided by $1,000 = 8.6), then multiply the result by the number in the “Actual” line under the heading entitled “Expenses Paid During Period” for your applicable class of shares to estimate the expenses you paid on your account during this period.
Hypothetical Example for Comparison Purposes
The “Hypothetical” line of the table below provides information about hypothetical account values and hypothetical expenses based on the Fund’s actual expense ratio and an assumed rate of return of 5% per year before expenses, which is not the Fund’s actual return. The hypothetical account values and expenses may not be used to estimate the actual ending account balance or expenses you paid for the period. You may use this information to compare the ongoing costs of investing in the Fund and other funds. To do so, compare this 5% hypothetical example with the 5% hypothetical examples that appear in the shareholder reports of the other funds.
Please note that the expenses shown in the table are meant to highlight your ongoing costs only and do not reflect any transactional costs, such as sales charges (loads) and contingent deferred sales charges. Therefore, the “Hypothetical” line of the table is useful in comparing ongoing costs only, and will not help you determine the relative total costs of owning different funds. In addition, if these transactional costs were included, your costs would have been higher.
| | | | | | | | | | | | | | | | |
| | | Beginning
Account Value
11-01-2011 | | | Ending
Account Value
04-30-2012 | | | Expenses
Paid During
the Period1 | | | Net Annual
Expense Ratio | |
Class A | | | | | | | | | | | | | | | | |
Actual | | $ | 1,000.00 | | | $ | 1,152.75 | | | $ | 7.49 | | | | 1.40 | % |
Hypothetical (5% return before expenses) | | $ | 1,000.00 | | | $ | 1,017.90 | | | $ | 7.02 | | | | 1.40 | % |
Class C | | | | | | | | | | | | | | | | |
Actual | | $ | 1,000.00 | | | $ | 1,148.54 | | | $ | 11.49 | | | | 2.15 | % |
Hypothetical (5% return before expenses) | | $ | 1,000.00 | | | $ | 1,014.17 | | | $ | 10.77 | | | | 2.15 | % |
Administrator Class | | | | | | | | | | | | | | | | |
Actual | | $ | 1,000.00 | | | $ | 1,153.44 | | | $ | 6.16 | | | | 1.15 | % |
Hypothetical (5% return before expenses) | | $ | 1,000.00 | | | $ | 1,019.14 | | | $ | 5.77 | | | | 1.15 | % |
Institutional Class | | | | | | | | | | | | | | | | |
Actual | | $ | 1,000.00 | | | $ | 1,155.01 | | | $ | 5.09 | | | | 0.95 | % |
Hypothetical (5% return before expenses) | | $ | 1,000.00 | | | $ | 1,020.14 | | | $ | 4.77 | | | | 0.95 | % |
| 1. | Expenses paid is equal to the annualized expense ratio of each class multiplied by the average account value over the period, multiplied by the number of days in the most recent fiscal half-year divided by the number of days in the fiscal year (to reflect the one-half year period). |
| | | | |
| 8 | | Wells Fargo Advantage Intrinsic World Equity Fund | | Portfolio of Investments—April 30, 2012 (Unaudited) |
| | | | | | | | | | | | |
| Security Name | | | | | | Shares | | | Value | |
| | | | | | | | | | | | |
| | | | |
Common Stocks: 96.93% | | | | | | | | | | | | |
| | | | |
| Chile: 3.28% | | | | | | | | | | | | |
Enersis SA ADR (Utilities, Electric Utilities) | | | | | | | 260,100 | | | $ | 5,272,227 | |
| | | | | | | | | | | | |
| | | | |
| France: 5.83% | | | | | | | | | | | | |
L’Oreal SA (Consumer Staples, Household Products) (a) | | | | | | | 28,000 | | | | 3,368,711 | |
Total SA (Energy, Oil, Gas & Consumable Fuels) | | | | | | | 51,880 | | | | 2,477,056 | |
Total SA ADR (Energy, Oil, Gas & Consumable Fuels) « | | | | | | | 18,300 | | | | 880,413 | |
Vivendi SA (Consumer Discretionary, Media) | | | | | | | 143,000 | | | | 2,643,423 | |
| | | | |
| | | | | | | | | | | 9,369,603 | |
| | | | | | | | | | | | |
| | | | |
| Germany: 2.33% | | | | | | | | | | | | |
Adidas-Salomon AG (Consumer Discretionary, Textiles, Apparel & Luxury Goods) | | | | | | | 45,000 | | | | 3,752,690 | |
| | | | | | | | | | | | |
| | | | |
| Israel: 2.36% | | | | | | | | | | | | |
Teva Pharmaceutical Industries Limited ADR (Health Care, Pharmaceuticals) | | | | | | | 83,000 | | | | 3,796,420 | |
| | | | | | | | | | | | |
| | | | |
| Japan: 10.42% | | | | | | | | | | | | |
77 Bank Limited (Financials, Commercial Banks) | | | | | | | 439,000 | | | | 1,759,519 | |
Aeon Company Limited (Consumer Staples, Food & Staples Retailing) « | | | | | | | 196,000 | | | | 2,562,926 | |
Kao Corporation (Consumer Staples, Personal Products) | | | | | | | 95,800 | | | | 2,576,185 | |
Kao Corporation ADR (Consumer Staples, Personal Products) † | | | | | | | 15,500 | | | | 416,789 | |
Komatsu Limited (Industrials, Machinery) | | | | | | | 123,000 | | | | 3,566,445 | |
Komatsu Limited ADR (Industrials, Machinery) † | | | | | | | 33,500 | | | | 971,289 | |
ORIX Corporation (Financials, Consumer Finance) | | | | | | | 14,900 | | | | 1,433,267 | |
ORIX Corporation ADR (Financials, Consumer Finance) Ǡ | | | | | | | 21,000 | | | | 1,001,490 | |
TOTO Limited (Industrials, Building Products) | | | | | | | 333,000 | | | | 2,469,138 | |
| | | | |
| | | | | | | | | | | 16,757,048 | |
| | | | | | | | | | | | |
| | | | |
| Netherlands: 4.79% | | | | | | | | | | | | |
European Aeronautic Defence & Space Company (Industrials, Aerospace & Defense) | | | | | | | 92,695 | | | | 3,659,539 | |
Unilever NV (Consumer Staples, Food Products) | | | | | | | 118,000 | | | | 4,053,300 | |
| | | | |
| | | | | | | | | | | 7,712,839 | |
| | | | | | | | | | | | |
| | | | |
| Netherlands Antilles: 2.30% | | | | | | | | | | | | |
Schlumberger Limited (Energy, Energy Equipment & Services) | | | | | | | 50,000 | | | | 3,707,000 | |
| | | | | | | | | | | | |
| | | | |
| Singapore: 2.26% | | | | | | | | | | | | |
DBS Group Holdings Limited (Financials, Commercial Banks) | | | | | | | 322,301 | | | | 3,635,816 | |
| | | | | | | | | | | | |
| | | | |
| South Korea: 3.10% | | | | | | | | | | | | |
Samsung Electronics Company Limited (Information Technology, Semiconductors & Semiconductor Equipment) | | | | | | | 4,050 | | | | 4,981,307 | |
| | | | | | | | | | | | |
| | | | |
| Spain: 1.03% | | | | | | | | | | | | |
Banco Santander Central Hispano SA ADR (Financials, Commercial Banks) | | | | | | | 261,000 | | | | 1,652,130 | |
| | | | | | | | | | | | |
| | | | |
| Switzerland: 3.55% | | | | | | | | | | | | |
Novartis AG ADR (Health Care, Pharmaceuticals) « | | | | | | | 51,300 | | | | 2,830,221 | |
Transocean Limited (Energy, Energy Equipment & Services) | | | | | | | 57,000 | | | | 2,872,230 | |
| | | | |
| | | | | | | | | | | 5,702,451 | |
| | | | | | | | | | | | |
The accompanying notes are an integral part of these financial statements.
| | | | | | |
| Portfolio of Investments—April 30, 2012 (Unaudited) | | Wells Fargo Advantage Intrinsic World Equity Fund | | | 9 | |
| | | | | | | | | | | | | | |
| Security Name | | | | | | | Shares | | | Value | |
| | | | | | | | | | | | | | |
| | | | |
| Taiwan: 1.70% | | | | | | | | | | | | | | |
Cathay Financial Holding Company Limited (Financials, Insurance) | | | | | | | | | 1,088,000 | | | $ | 1,151,007 | |
China Trust Financial Holding Company Limited (Financials, Commercial Banks) | | | | | | | | | 2,483,577 | | | | 1,585,796 | |
| | | | |
| | | | | | | | | | | | | 2,736,803 | |
| | | | | | | | | | | | | | |
| | | | |
| United Kingdom: 7.71% | | | | | | | | | | | | | | |
Diageo plc (Consumer Staples, Beverages) | | | | | | | | | 93,000 | | | | 2,340,919 | |
Royal Dutch Shell plc Class A (Energy, Oil, Gas & Consumable Fuels) | | | | | | | | | 82,879 | | | | 2,947,826 | |
Standard Chartered plc (Financials, Commercial Banks) | | | | | | | | | 133,701 | | | | 3,267,769 | |
Vodafone Group plc (Telecommunication Services, Wireless Telecommunication Services) | | | | | | | | | 1,390,000 | | | | 3,846,191 | |
| | | | |
| | | | | | | | | | | | | 12,402,705 | |
| | | | | | | | | | | | | | |
| | | | |
| United States: 46.27% | | | | | | | | | | | | | | |
Abbott Laboratories (Health Care, Pharmaceuticals) | | | | | | | | | 57,600 | | | | 3,574,656 | |
Apple Incorporated (Information Technology, Computers & Peripherals) † | | | | | | | | | 8,800 | | | | 5,141,312 | |
Baxter International Incorporated (Health Care, Health Care Equipment & Supplies) | | | | | | | | | 62,500 | | | | 3,463,125 | |
Charles Schwab Corporation (Financials, Capital Markets) | | | | | | | | | 237,000 | | | | 3,389,100 | |
Dow Chemical Company (Materials, Chemicals) | | | | | | | | | 94,873 | | | | 3,214,297 | |
eBay Incorporated (Information Technology, Internet Software & Services) † | | | | | | | | | 127,000 | | | | 5,213,350 | |
Eli Lilly & Company (Health Care, Pharmaceuticals) | | | | | | | | | 52,800 | | | | 2,185,392 | |
EMC Corporation (Information Technology, Computers & Peripherals) † | | | | | | | | | 156,465 | | | | 4,413,878 | |
Franklin Resources Incorporated (Financials, Capital Markets) | | | | | | | | | 32,000 | | | | 4,016,320 | |
Hess Corporation (Energy, Oil, Gas & Consumable Fuels) | | | | | | | | | 29,000 | | | | 1,512,060 | |
JPMorgan Chase & Company (Financials, Diversified Financial Services) | | | | | | | | | 91,500 | | | | 3,932,670 | |
Northrop Grumman Corporation (Industrials, Aerospace & Defense) | | | | | | | | | 49,550 | | | | 3,135,524 | |
NVR Incorporated (Consumer Discretionary, Household Durables) † | | | | | | | | | 4,550 | | | | 3,566,927 | |
Oracle Corporation (Information Technology, Software) | | | | | | | | | 159,000 | | | | 4,673,010 | |
PepsiCo Incorporated (Consumer Staples, Beverages) « | | | | | | | | | 51,000 | | | | 3,366,000 | |
QUALCOMM Incorporated (Information Technology, Communications Equipment) | | | | | | | | | 48,500 | | | | 3,096,240 | |
SPX Corporation (Industrials, Machinery) | | | | | | | | | 43,500 | | | | 3,339,930 | |
SunTrust Banks Incorporated (Financials, Commercial Banks) | | | | | | | | | 67,000 | | | | 1,626,760 | |
Texas Instruments Incorporated (Information Technology, Semiconductors & Semiconductor Equipment) | | | | | | | | | 109,500 | | | | 3,497,430 | |
The Home Depot Incorporated (Consumer Discretionary, Specialty Retail) | | | | | | | | | 92,000 | | | | 4,764,680 | |
Visa Incorporated Class A (Information Technology, IT Services) « | | | | | | | | | 26,767 | | | | 3,291,807 | |
| | | | |
| | | | | | | | | | | | | 74,414,468 | |
| | | | | | | | | | | | | | |
| | | | |
Total Common Stocks (Cost $133,155,309) | | | | | | | | | | | | | 155,893,507 | |
| | | | | | | | | | | | | | |
| | | | |
| | | | | Yield | | | | | | | |
| Short-Term Investments: 6.22% | | | | | | | | | | | | | | |
| | | | |
| Investment Companies: 6.22% | | | | | | | | | | | | | | |
Wells Fargo Advantage Cash Investment Money Market Fund, Select Class (l)(u) | | | | | 0.11 | % | | | 3,286,345 | | | | 3,286,345 | |
Wells Fargo Securities Lending Cash Investments, LLC (r)(l)(u)(v) | | | | | 0.19 | | | | 6,717,815 | | | | 6,717,815 | |
| | | | |
Total Short-Term Investments (Cost $10,004,160) | | | | | | | | | | | | | 10,004,160 | |
| | | | | | | | | | | | | | |
| | | | | | | | |
| Total Investments in Securities | | | | | | | | |
| (Cost $143,159,469) * | | | 103.15 | % | | | 165,897,667 | |
Other Assets and Liabilities, Net | | | (3.15 | ) | | | (5,060,973 | ) |
| | | | | | | | |
| Total Net Assets | | | 100.00 | % | | $ | 160,836,694 | |
| | | | | | | | |
The accompanying notes are an integral part of these financial statements.
| | | | |
| 10 | | Wells Fargo Advantage Intrinsic World Equity Fund | | Portfolio of Investments—April 30, 2012 (Unaudited) |
| (a) | Security is fair valued by the Management Valuation Team, and in certain instances by the Board of Trustees, in accordance with procedures approved by the Board of Trustees. |
| « | All or a portion of this security is on loan. |
| † | Non-income earning security. |
| (r) | The investment company is exempt from registration under Section 3(c)(7) of the 1940 Act. |
| (l) | Investment in an affiliate. |
| (u) | Rate shown is the 7-day annualized yield at period end. |
| (v) | Security represents investment of cash collateral received from securities on loan. |
| * | Cost for federal income tax purposes is $143,590,721 and net unrealized appreciation (depreciation) consists of: |
| | | | |
Gross unrealized appreciation | | $ | 30,051,064 | |
Gross unrealized depreciation | | | (7,744,118 | ) |
| | | | |
Net unrealized appreciation | | $ | 22,306,946 | |
The accompanying notes are an integral part of these financial statements.
| | | | | | |
| Statement of Assets and Liabilities—April 30, 2012 (Unaudited) | | Wells Fargo Advantage Intrinsic World Equity Fund | | | 11 | |
| | | | |
| | | | |
| |
Assets | | | | |
Investments | | | | |
In unaffiliated securities (including securities on loan), at value (see cost below) | | $ | 155,893,507 | |
In affiliated securities, at value (see cost below) | | | 10,004,160 | |
| | | | |
Total investments, at value (see cost below) | | | 165,897,667 | |
Foreign currency, at value (see cost below) | | | 1,743 | |
Receivable for investments sold | | | 1,618,359 | |
Receivable for Fund shares sold | | | 46,108 | |
Receivable for dividends | | | 444,724 | |
Receivable for securities lending income | | | 1,050 | |
Prepaid expenses and other assets | | | 58,123 | |
| | | | |
Total assets | | | 168,067,774 | |
| | | | |
| |
Liabilities | | | | |
Payable for Fund shares redeemed | | | 283,635 | |
Payable upon receipt of securities loaned | | | 6,717,815 | |
Advisory fee payable | | | 94,743 | |
Distribution fees payable | | | 4,921 | |
Due to other related parties | | | 41,808 | |
Accrued expenses and other liabilities | | | 88,158 | |
| | | | |
Total liabilities | | | 7,231,080 | |
| | | | |
Total net assets | | $ | 160,836,694 | |
| | | | |
| |
NET ASSETS CONSIST OF | | | | |
Paid-in capital | | $ | 159,747,837 | |
Undistributed net investment income | | | 355,034 | |
Accumulated net realized losses on investments | | | (22,029,743 | ) |
Net unrealized gains on investments | | | 22,763,566 | |
| | | | |
Total net assets | | $ | 160,836,694 | |
| | | | |
| |
COMPUTATION OF NET ASSET VALUE AND OFFERING PRICE PER SHARE1 | | | | |
Net assets – Class A | | $ | 151,120,928 | |
Shares outstanding – Class A | | | 8,494,576 | |
Net asset value per share – Class A | | | $17.79 | |
Maximum offering price per share – Class A2 | | | $18.88 | |
Net assets – Class C | | $ | 7,792,175 | |
Shares outstanding – Class C | | | 450,794 | |
Net asset value per share – Class C | | | $17.29 | |
Net assets – Administrator Class | | $ | 1,897,675 | |
Shares outstanding – Administrator Class | | | 107,129 | |
Net asset value per share – Administrator Class | | | $17.71 | |
Net assets – Institutional Class | | $ | 25,916 | |
Shares outstanding – Institutional Class | | | 1,461 | |
Net asset value per share – Institutional Class | | | $17.74 | |
| |
Investments in unaffiliated securities, at cost | | $ | 133,155,309 | |
| | | | |
Investments in affiliated securities, at cost | | $ | 10,004,160 | |
| | | | |
Total investments, at cost | | $ | 143,159,469 | |
| | | | |
Securities on loan, at value | | $ | 6,533,299 | |
| | | | |
Foreign currency, at cost | | $ | 1,711 | |
| | | | |
| 1. | The Fund has an unlimited number of authorized shares. |
| 2. | Maximum offering price is computed as 100/94.25 of net asset value. On investments of $50,000 or more, the offering price is reduced. |
The accompanying notes are an integral part of these financial statements.
| | | | |
| 12 | | Wells Fargo Advantage Intrinsic World Equity Fund | | Statement of Operations—Six Months Ended April 30, 2012 (Unaudited) |
| | | | |
| | | | |
| |
Investment income | | | | |
Dividends* | | $ | 1,600,257 | |
Securities lending income, net | | | 20,845 | |
Income from affiliated securities | | | 3,419 | |
| | | | |
Total investment income | | | 1,624,521 | |
| | | | |
| |
Expenses | | | | |
Advisory fee | | | 607,062 | |
Administration fees | | | | |
Fund level | | | 37,941 | |
Class A | | | 185,257 | |
Class C | | | 9,307 | |
Administrator Class | | | 920 | |
Institutional Class | | | 105 | |
Shareholder servicing fees | | | | |
Class A | | | 178,131 | |
Class C | | | 8,949 | |
Administrator Class | | | 2,051 | |
Distribution fees | | | | |
Class C | | | 26,847 | |
Custody and accounting fees | | | 31,711 | |
Professional fees | | | 21,762 | |
Registration fees | | | 19,815 | |
Shareholder report expenses | | | 22,714 | |
Trustees’ fees and expenses | | | 2,351 | |
Other fees and expenses | | | 2,520 | |
| | | | |
Total expenses | | | 1,157,443 | |
Less: Fee waivers and/or expense reimbursements | | | (71,126 | ) |
| | | | |
Net expenses | | | 1,086,317 | |
| | | | |
Net investment income | | | 538,204 | |
| | | | |
| |
REALIZED AND UNREALIZED GAINS (LOSSES) ON INVESTMENTS | | | | |
Net realized losses on investments | | | (944,668 | ) |
Net change in unrealized gains (losses) on investments | | | 17,825,086 | |
| | | | |
Net realized and unrealized gains (losses) on investments | | | 16,880,418 | |
| | | | |
Net increase in net assets resulting from operations | | $ | 17,418,622 | |
| | | | |
| |
* Net of foreign dividend withholding taxes of | | | $79,472 | |
The accompanying notes are an integral part of these financial statements.
| | | | | | |
| Statements of Changes in Net Assets | | Wells Fargo Advantage Intrinsic World Equity Fund | | | 13 | |
| | | | | | | | | | | | | | | | |
| | | Six Months Ended
April 30, 2012
(Unaudited) | | | Year Ended
October 31, 2011 | |
| | | | |
Operations | | | | | | | | | | | | | | | | |
Net investment income | | | | | | $ | 538,204 | | | | | | | $ | 850,957 | |
Net realized gains (losses) on investments | | | | | | | (944,668 | ) | | | | | | | 1,179,491 | |
Net change in unrealized gains (losses) on investments | | | | | | | 17,825,086 | | | | | | | | 5,097,487 | |
| | | | | | | | | | | | | | | | |
Net increase in net assets resulting from operations | | | | | | | 17,418,622 | | | | | | | | 7,127,935 | |
| | | | | | | | | | | | | | | | |
| | | | |
Distributions to shareholders from | | | | | | | | | | | | | | | | |
Net investment income | | | | | | | | | | | | | | | | |
Class A | | | | | | | (981,690 | ) | | | | | | | (725,936 | ) |
Class C | | | | | | | (39,737 | ) | | | | | | | (373 | ) |
Administrator Class | | | | | | | (19,766 | ) | | | | | | | (2,809 | ) |
Institutional Class | | | | | | | (6,171 | ) | | | | | | | (111 | ) |
| | | | | | | | | | | | | | | | |
Total distributions to shareholders | | | | | | | (1,047,364 | ) | | | | | | | (729,229 | ) |
| | | | | | | | | | | | | | | | |
| | | | |
Capital share transactions | | | Shares | | | | | | | | Shares | | | | | |
Proceeds from shares sold | | | | | | | | | | | | | | | | |
Class A | | | 157,620 | | | | 2,702,542 | | | | 84,447 | | | | 1,376,131 | |
Class C | | | 28,148 | | | | 435,159 | | | | 251 | | | | 3,657 | |
Administrator Class | | | 10,663 | | | | 184,652 | | | | 21,884 | | | | 343,780 | |
Institutional Class | | | 36 | | | | 550 | | | | 1,726 | | | | 26,558 | |
| | | | | | | | | | | | | | | | |
| | | | | | | 3,322,903 | | | | | | | | 1,750,126 | |
| | | | | | | | | | | | | | | | |
Reinvestment of distributions | | | | | | | | | | | | | | | | |
Class A | | | 63,734 | | | | 936,881 | | | | 45,264 | | | | 697,063 | |
Class C | | | 2,512 | | | | 36,002 | | | | 19 | | | | 292 | |
Administrator Class | | | 1,170 | | | | 17,126 | | | | 178 | | | | 2,730 | |
Institutional Class | | | 422 | | | | 6,171 | | | | 7 | | | | 111 | |
| | | | | | | | | | | | | | | | |
| | | | | | | 996,180 | | | | | | | | 700,196 | |
| | | | | | | | | | | | | | | | |
Payment for shares redeemed | | | | | | | | | | | | | | | | |
Class A | | | (669,238 | ) | | | (11,037,561 | ) | | | (1,156,847 | ) | | | (18,340,419 | ) |
Class C | | | (29,792 | ) | | | (463,214 | ) | | | (34,297 | ) | | | (506,243 | ) |
Administrator Class | | | (32,669 | ) | | | (535,232 | ) | | | (12,502 | ) | | | (188,511 | ) |
Institutional Class | | | (35,885 | ) | | | (586,026 | ) | | | (1,541 | ) | | | (22,290 | ) |
| | | | | | | | | | | | | | | | |
| | | | | | | (12,622,033 | ) | | | | | | | (19,057,463 | ) |
| | | | | | | | | | | | | | | | |
Net asset value of shares issued in acquisition | | | | | | | | | | | | | | | | |
Class A | | | 0 | | | | 0 | | | | 3,298,824 | | | | 48,918,412 | |
Class C | | | 0 | | | | 0 | | | | 443,920 | | | | 6,421,012 | |
Administrator Class | | | 0 | | | | 0 | | | | 108,840 | | | | 1,609,604 | |
Institutional Class | | | 0 | | | | 0 | | | | 35,971 | | | | 532,474 | |
| | | | | | | | | | | | | | | | |
| | | | | | | 0 | | | | | | | | 57,481,502 | |
| | | | | | | | | | | | | | | | |
Net increase (decrease) in net assets resulting from capital share transactions | | | | | | | (8,302,950 | ) | | | | | | | 40,874,361 | |
| | | | | | | | | | | | | | | | |
Net increase from regulatory settlement | | | | | | | 4,292,515 | | | | | | | | 0 | |
| | | | | | | | | | | | | | | | |
Total increase in net assets | | | | | | | 12,360,823 | | | | | | | | 47,273,067 | |
| | | | | | | | | | | | | | | | |
| | | | |
Net assets | | | | | | | | | | | | | | | | |
Beginning of period | | | | | | | 148,475,871 | | | | | | | | 101,202,804 | |
| | | | | | | | | | | | | | | | |
End of period | | | | | | $ | 160,836,694 | | | | | | | $ | 148,475,871 | |
| | | | | | | | | | | | | | | | |
Undistributed net investment income | | | | | | $ | 355,034 | | | | | | | $ | 864,194 | |
| | | | | | | | | | | | | | | | |
The accompanying notes are an integral part of these financial statements.
| | | | |
| 14 | | Wells Fargo Advantage Intrinsic World Equity Fund | | Financial Highlights |
(For a share outstanding throughout each period)
| | | | | | | | | | | | | | | | | | | | | | | | | | | | |
| | | Six Months Ended
April 30, 2012 (Unaudited) | | | Year Ended October 31, | | | Year Ended
December 31, 20063 | |
| Class A | | | 2011 | | | 20101 | | | 20091 | | | 20081 | | | 20072,3 | | |
Net asset value, beginning of period | | $ | 15.55 | | | $ | 15.06 | | | $ | 13.27 | | | $ | 13.76 | | | $ | 24.23 | | | $ | 26.61 | | | $ | 23.65 | |
Net investment income | | | 0.07 | | | | 0.12 | 4 | | | 0.12 | | | | 0.09 | 4 | | | 0.29 | | | | 0.17 | 4 | | | 0.17 | 4 |
Net realized and unrealized gains (losses) on investments | | | 1.83 | | | | 0.48 | | | | 1.78 | | | | 1.89 | | | | (9.55 | ) | | | 2.29 | | | | 3.62 | |
| | | | | | | | | | | | | | | | | | | | | | | | | | | | |
Total from investment operations | | | 1.90 | | | | 0.60 | | | | 1.90 | | | | 1.98 | | | | (9.26 | ) | | | 2.46 | | | | 3.79 | |
Distributions to shareholders from | | | | | | | | | | | | | | | | | | | | | | | | | | | | |
Net investment income | | | (0.11 | ) | | | (0.11 | ) | | | (0.11 | ) | | | (0.24 | ) | | | (0.13 | ) | | | 0.00 | | | | (0.16 | ) |
Net realized gains | | | 0.00 | | | | 0.00 | | | | 0.00 | | | | (2.23 | ) | | | (1.08 | ) | | | (4.84 | ) | | | (0.67 | ) |
| | | | | | | | | | | | | | | | | | | | | | | | | | | | |
Total distributions to shareholders | | | (0.11 | ) | | | (0.11 | ) | | | (0.11 | ) | | | (2.47 | ) | | | (1.21 | ) | | | (4.84 | ) | | | (0.83 | ) |
Regulatory settlement proceeds | | | 0.45 | | | | 0.00 | | | | 0.00 | | | | 0.00 | | | | 0.00 | | | | 0.00 | | | | 0.00 | |
Net asset value, end of period | | $ | 17.79 | | | $ | 15.55 | | | $ | 15.06 | | | $ | 13.27 | | | $ | 13.76 | | | $ | 24.23 | | | $ | 26.61 | |
Total return5 | | | 15.27 | %6 | | | 4.00 | % | | | 14.43 | % | | | 20.29 | % | | | (40.11 | )% | | | 10.42 | % | | | 16.02 | % |
Ratios to average net assets (annualized) | | | | | | | | | | | | | | | | | | | | | | | | | | | | |
Gross expenses | | | 1.49 | % | | | 1.50 | % | | | 1.53 | % | | | 1.57 | % | | | 1.36 | % | | | 1.24 | % | | | 1.29 | % |
Net expenses | | | 1.40 | % | | | 1.40 | % | | | 1.46 | % | | | 1.57 | % | | | 1.36 | % | | | 1.24 | % | | | 1.29 | % |
Net investment income | | | 0.74 | % | | | 0.79 | % | | | 0.75 | % | | | 0.77 | % | | | 1.04 | % | | | 0.78 | % | | | 0.66 | % |
Supplemental data | | | | | | | | | | | | | | | | | | | | | | | | | | | | |
Portfolio turnover rate | | | 19 | % | | | 12 | % | | | 11 | % | | | 16 | % | | | 44 | % | | | 66 | % | | | 21 | % |
Net assets, end of period (000’s omitted) | | | $151,121 | | | | $139,100 | | | | $100,460 | | | | $103,995 | | | | $107,210 | | | | $279,146 | | | | $457,035 | |
| 1. | After the close of business on July 16, 2010, the Fund acquired the net assets of Evergreen Intrinsic World Equity Fund which became the accounting and performance survivor in the transaction. The information for the periods prior to July 19, 2010 is that of Class A of Evergreen Intrinsic World Equity Fund. |
| 2. | For the ten months ended October 31, 2007. The Fund changed its fiscal year end from December 31 to October 31, effective October 31, 2007. |
| 3. | After the close of business on May 18, 2007, the Fund’s predecessor, Evergreen Intrinsic World Equity Fund, acquired the net assets of Atlas Global Growth Fund (“Atlas Fund”). Atlas Fund was the accounting and performance survivor in the transaction. The information for the periods prior to May 21, 2007 is that of Atlas Fund. |
| 4. | Calculated based upon average shares outstanding |
| 5. | Total return calculations do not include any sales charges. Returns for periods of less than one year are not annualized. |
| 6. | During the six months ended April 30, 3012, the Fund received a regulatory settlement from an unaffiliated third party which had an impact of 2.98% on the total return. |
The accompanying notes are an integral part of these financial statements.
| | | | | | |
| Financial Highlights | | Wells Fargo Advantage Intrinsic World Equity Fund | | | 15 | |
(For a share outstanding throughout each period)
| | | | | | | | | | | | | | | | | | | | | | | | |
| | | Six Months Ended
April 30, 2012 (Unaudited) | | | Year Ended October 31, | |
| Class C | | | 2011 | | | 20101 | | | 20091 | | | 20081 | | | 20071,2 | |
Net asset value, beginning of period | | $ | 15.15 | | | $ | 14.68 | | | $ | 12.96 | | | $ | 13.58 | | | $ | 24.14 | | | $ | 28.59 | |
Net investment income (loss) | | | (0.00 | )3 | | | (0.01 | )4 | | | 0.07 | | | | (0.03 | )4 | | | (0.03 | )4 | | | (0.10 | )4 |
Net realized and unrealized gains (losses) on investments | | | 1.79 | | | | 0.49 | | | | 1.69 | | | | 1.87 | | | | (9.28 | ) | | | 0.49 | |
| | | | | | | | | | | | | | | | | | | | | | | | |
Total from investment operations | | | 1.79 | | | | 0.48 | | | | 1.76 | | | | 1.84 | | | | (9.31 | ) | | | 0.39 | |
Distributions to shareholders from | | | | | | | | | | | | | | | | | | | | | | | | |
Net investment income | | | (0.09 | ) | | | (0.01 | ) | | | (0.04 | ) | | | (0.23 | ) | | | (0.17 | ) | | | 0.00 | |
Net realized gains | | | 0.00 | | | | 0.00 | | | | 0.00 | | | | (2.23 | ) | | | (1.08 | ) | | | (4.84 | ) |
| | | | | | | | | | | | | | | | | | | | | | | | |
Total distributions to shareholders | | | (0.09 | ) | | | (0.01 | ) | | | (0.04 | ) | | | (2.46 | ) | | | (1.25 | ) | | | (4.84 | ) |
Regulatory settlement proceeds | | | 0.44 | | | | 0.00 | | | | 0.00 | | | | 0.00 | | | | 0.00 | | | | 0.00 | |
Net asset value, end of period | | $ | 17.29 | | | $ | 15.15 | | | $ | 14.68 | | | $ | 12.96 | | | $ | 13.58 | | | $ | 24.14 | |
Total return5 | | | 14.85 | %6 | | | 3.27 | % | | | 13.58 | % | | | 19.35 | % | | | (40.55 | )% | | | 2.44 | % |
Ratios to average net assets (annualized) | | | | | | | | | | | | | | | | | | | | | | | | |
Gross expenses | | | 2.24 | % | | | 2.20 | % | | | 2.28 | % | | | 2.33 | % | | | 2.21 | % | | | 2.05 | % |
Net expenses | | | 2.15 | % | | | 2.15 | % | | | 2.21 | % | | | 2.33 | % | | | 2.21 | % | | | 2.05 | % |
Net investment income (loss) | | | (0.02 | )% | | | (0.05 | )% | | | 0.04 | % | | | (0.28 | )% | | | (0.19 | )% | | | (0.92 | )% |
Supplemental data | | | | | | | | | | | | | | | | | | | | | | | | |
Portfolio turnover rate | | | 19 | % | | | 12 | % | | | 11 | % | | | 16 | % | | | 44 | % | | | 66 | % |
Net assets, end of period (000’s omitted) | | | $7,792 | | | | $6,817 | | | | $588 | | | | $427 | | | | $154 | | | | $14 | |
| 1. | After the close of business on July 16, 2010, the Fund acquired the net assets of Evergreen Intrinsic World Equity Fund which became the accounting and performance survivor in the transaction. The information for the periods prior to July 19, 2010 is that of Class C of Evergreen Intrinsic World Equity Fund. |
| 2. | For the period from May 18, 2007 (commencement of class operations) to October 31, 2007. |
| 3. | Amount shown is less than 0.005 |
| 4. | Calculated based upon average shares outstanding |
| 5. | Total return calculations do not include any sales charges. Returns for periods of less than one year are not annualized. |
| 6. | During the six months ended April 30, 3012, the Fund received a regulatory settlement from an unaffiliated third party which had an impact of 2.92% on the total return. |
The accompanying notes are an integral part of these financial statements.
| | | | |
| 16 | | Wells Fargo Advantage Intrinsic World Equity Fund | | Financial Highlights |
(For a share outstanding throughout each period)
| | | | | | | | | | | | | | | | | | | | | | | | |
| | | Six Months Ended
April 30, 2012 (Unaudited) | | | Year Ended October 31, | |
| Administrator Class | | | 2011 | | | 20101 | | | 20091 | | | 20081 | | | 20071,2 | |
Net asset value, beginning of period | | $ | 15.52 | | | $ | 15.02 | | | $ | 13.23 | | | $ | 13.76 | | | $ | 24.26 | | | $ | 28.59 | |
Net investment income | | | 0.08 | 3 | | | 0.15 | 3 | | | 0.15 | 3 | | | 0.15 | 3 | | | 0.38 | 3 | | | 0.01 | |
Net realized and unrealized gains (losses) on investments | | | 1.82 | | | | 0.49 | | | | 1.78 | | | | 1.85 | | | | (9.60 | ) | | | 0.50 | |
| | | | | | | | | | | | | | | | | | | | | | | | |
Total from investment operations | | | 1.90 | | | | 0.64 | | | | 1.93 | | | | 2.00 | | | | (9.22 | ) | | | 0.51 | |
Distributions to shareholders from | | | | | | | | | | | | | | | | | | | | | | | | |
Net investment income | | | (0.16 | ) | | | (0.14 | ) | | | (0.14 | ) | | | (0.30 | ) | | | (0.20 | ) | | | 0.00 | |
Net realized gains | | | 0.00 | | | | 0.00 | | | | 0.00 | | | | (2.23 | ) | | | (1.08 | ) | | | (4.84 | ) |
| | | | | | | | | | | | | | | | | | | | | | | | |
Total distributions to shareholders | | | (0.16 | ) | | | (0.14 | ) | | | (0.14 | ) | | | (2.53 | ) | | | (1.28 | ) | | | (4.84 | ) |
Regulatory settlement proceeds | | | 0.45 | | | | 0.00 | | | | 0.00 | | | | 0.00 | | | | 0.00 | | | | 0.00 | |
Net asset value, end of period | | $ | 17.71 | | | $ | 15.52 | | | $ | 15.02 | | | $ | 13.23 | | | $ | 13.76 | | | $ | 24.26 | |
Total return4 | | | 15.34 | %5 | | | 4.27 | % | | | 14.72 | % | | | 20.60 | % | | | (40.01 | )% | | | 2.89 | % |
Ratios to average net assets (annualized) | | | | | | | | | | | | | | | | | | | | | | | | |
Gross expenses | | | 1.31 | % | | | 1.30 | % | | | 1.29 | % | | | 1.31 | % | | | 1.01 | % | | | 1.05 | % |
Net expenses | | | 1.15 | % | | | 1.15 | % | | | 1.21 | % | | | 1.31 | % | | | 1.01 | % | | | 1.05 | % |
Net investment income | | | 0.97 | % | | | 0.99 | % | | | 1.06 | % | | | 1.33 | % | | | 1.70 | % | | | 0.12 | % |
Supplemental data | | | | | | | | | | | | | | | | | | | | | | | | |
Portfolio turnover rate | | | 19 | % | | | 12 | % | | | 11 | % | | | 16 | % | | | 44 | % | | | 66 | % |
Net assets, end of period (000’s omitted) | | | $1,898 | | | | $1,986 | | | | $144 | | | | $161 | | | | $1,567 | | | | $71,656 | |
| 1. | After the close of business on July 16, 2010, the Fund acquired the net assets of Evergreen Intrinsic World Equity Fund which became the accounting and performance survivor in the transaction. The information for the periods prior to July 19, 2010 is that of Class I of Evergreen Intrinsic World Equity Fund. |
| 2. | For the period from May 18, 2007 (commencement of class operations) to October 31, 2007. |
| 3. | Calculated based upon average shares outstanding |
| 4. | Returns for periods of less than one year are not annualized. |
| 5. | During the six months ended April 30, 3012, the Fund received a regulatory settlement from an unaffiliated third party which had an impact of 2.93% on the total return. |
The accompanying notes are an integral part of these financial statements.
| | | | | | |
| Financial Highlights | | Wells Fargo Advantage Intrinsic World Equity Fund | | | 17 | |
(For a share outstanding throughout each period)
| | | | | | | | | | | | |
| | | Six Months Ended
April 30, 2012 (Unaudited) | | | Year Ended
October 31, | |
| Institutional Class | | | 2011 | | | 20101 | |
Net asset value, beginning of period | | $ | 15.54 | | | $ | 15.02 | | | $ | 13.80 | |
Net investment income | | | 0.09 | 2 | | | 0.16 | | | | 0.03 | 2 |
Net realized and unrealized gains (losses) on investments | | | 1.83 | | | | 0.51 | | | | 1.19 | |
| | | | | | | | | | | | |
Total from investment operations | | | 1.92 | | | | 0.67 | | | | 1.22 | |
Distributions to shareholders from | | | | | | | | | | | | |
Net investment income | | | (0.17 | ) | | | (0.15 | ) | | | 0.00 | |
Regulatory settlement proceeds | | | 0.45 | | | | 0.00 | | | | 0.00 | |
Net asset value, end of period | | $ | 17.74 | | | $ | 15.54 | | | $ | 15.02 | |
Total return3 | | | 15.50 | %4 | | | 4.50 | % | | | 8.84 | % |
Ratios to average net assets (annualized) | | | | | | | | | | | | |
Gross expenses | | | 1.07 | % | | | 1.00 | % | | | 1.23 | % |
Net expenses | | | 0.95 | % | | | 0.95 | % | | | 0.95 | % |
Net investment income | | | 1.12 | % | | | 1.12 | % | | | 0.91 | % |
Supplemental data | | | | | | | | | | | | |
Portfolio turnover rate | | | 19 | % | | | 12 | % | | | 11 | % |
Net assets, end of period (000’s omitted) | | | $26 | | | | $573 | | | | $11 | |
| 1. | For the period from July 30, 2010 (commencement of class operations) to October 31, 2010. |
| 2. | Calculated based upon average shares outstanding |
| 3. | Returns for periods of less than one year are not annualized. |
| 4. | During the six months ended April 30, 3012, the Fund received a regulatory settlement from an unaffiliated third party which had an impact of 2.93% on the total return. |
The accompanying notes are an integral part of these financial statements.
| | | | |
| 18 | | Wells Fargo Advantage Intrinsic World Equity Fund | | Notes to Financial Statements (Unaudited) |
1. ORGANIZATION
Wells Fargo Funds Trust (the “Trust”), a Delaware statutory trust organized on March 10, 1999, is an open-end management investment company registered under the Investment Company Act of 1940, as amended (the “1940 Act”). These financial statements report on Wells Fargo Advantage Intrinsic World Equity Fund (the “Fund”) which is a diversified series of the Trust.
2. SIGNIFICANT ACCOUNTING POLICIES
The following significant accounting policies, which are consistently followed in the preparation of the financial statements of the Fund, are in conformity with U.S. generally accepted accounting principles which require management to make estimates and assumptions that affect the reported amounts of assets and liabilities, disclosure of contingent assets and liabilities at the date of the financial statements, and the reported amounts of revenues and expenses during the reporting period. Actual results could differ from those estimates.
Securities valuation
Investments in equity securities are valued each business day as of the close of regular trading on the New York Stock Exchange, which is usually 4:00 p.m. (Eastern Time). Securities which are traded on a national or foreign securities exchange are valued at the last reported sales price, except that securities listed on The Nasdaq Stock Market, Inc. (“Nasdaq”) are valued at the Nasdaq Official Closing Price (“NOCP”), and if no NOCP is available, then at the last reported sales price. If no sales price is shown on the Nasdaq, the bid price will be used. In the absence of any sale of securities listed on the Nasdaq, and in the case of other securities (including U.S. Government obligations, but excluding debt securities maturing in 60 days or less), the price will be deemed “stale” and the valuations will be determined in accordance with the Fund’s Fair Value Procedures.
Securities denominated in foreign currencies are translated into U.S. dollars using the closing rates of exchange in effect on the day of valuation.
Many securities markets and exchanges outside the U.S. close prior to the close of the New York Stock Exchange and therefore may not fully reflect trading or events that occur after the close of the principal exchange in which the foreign securities are traded, but before the close of the New York Stock Exchange. If such trading or events are expected to materially affect the value of securities, then fair value pricing procedures approved by the Board of Trustees are applied. These procedures take into account multiple factors including movements in U.S. securities markets after foreign exchanges close. As a result of the fair value pricing procedures, these securities which are normally categorized as Level 1 in the fair value hierarchy will represent a transfer from a Level 1 to a Level 2 security and will be categorized as Level 2. Depending on market activity, such fair valuations may be frequent. Such fair value pricing may result in NAVs that are higher or lower than NAVs based on the closing price or latest quoted bid price. On April 30, 2012, fair value pricing was not used in pricing foreign securities.
Investments in open-end mutual funds and non-registered investment companies are generally valued at net asset value.
Investments which are not valued using any of the methods discussed above, are valued at their fair value, as determined by procedures established in good faith and approved by the Board of Trustees. The Board of Trustees has established a Valuation Committee comprised of the Trustees and has delegated to it the authority to take any actions regarding the valuation of portfolio securities that the Valuation Committee deems necessary in determining the fair value of portfolio securities, unless the responsibility has been delegated to the Management Valuation Team of Wells Fargo Funds Management, LLC (“Funds Management”). The Board of Trustees retains the authority to make or ratify any valuation decisions or approve any changes to the Fair Value Procedures as it deems appropriate. On a quarterly basis, the Board of Trustees considers for ratification any valuation actions taken by the Valuation Committee or the Management Valuation Team.
Valuations of fair valued prices are compared to the next actual sales price when available, or other appropriate market information to assess the continued appropriateness of the fair valuation methodology used. The securities are fair valued on a day-to-day basis, taking into consideration changes to appropriate market information and any significant changes to the input factors considered in the valuation process until there is a readily available price provided on the exchange or by an independent pricing service. Valuations received from an independent pricing service or broker quotes are periodically validated by comparisons to most recent trades and valuations provided by other independent
| | | | | | |
| Notes to Financial Statements (Unaudited) | | Wells Fargo Advantage Intrinsic World Equity Fund | | | 19 | |
pricing services in addition to the review of prices by the adviser and/or sub-adviser. Unobservable inputs used in determining fair valuations are identified based on the type of security, taking into consideration factors utilized by market participants in valuing the investment, knowledge about the issuer and the current market environment.
Foreign currency translation
The accounting records of the Fund are maintained in U.S. dollars. Assets, including investment securities, and liabilities denominated in foreign currency are translated into U.S. dollars at the prevailing rates of exchange at the date of valuation. Purchases and sales of securities, and income and expenses are translated at the prevailing rate of exchange on the respective dates of such transactions. Reported net realized foreign exchange gains or losses arise from sales of foreign currencies, currency gains or losses realized between the trade and settlement dates on securities transactions, and the difference between the amounts of dividends, interest and foreign withholding taxes recorded and the U.S. dollar equivalent of the amounts actually paid or received. Net unrealized foreign exchange gains and losses arise from changes in the fair value of assets and liabilities other than investments in securities resulting in changes in exchange rates.
The changes in net assets arising from changes in exchange rates and the changes in net assets resulting from changes in market prices of securities are not separately presented. Such changes are recorded with net realized and unrealized gains or losses from investments. Gains and losses from certain foreign currency transactions are treated as ordinary income for U.S. federal income tax purposes.
Security loans
The Fund may lend its securities from time to time in order to earn additional income in the form of fees or interest on securities received as collateral or the investment of any cash received as collateral. The Fund continues to receive interest or dividends on the securities loaned. The Fund receives collateral in the form of cash or securities with a value at least equal to the value of the securities on loan. The value of the loaned securities is determined at the close of each business day and any additional required collateral is delivered to the Fund on the next business day. In a securities lending transaction, the net asset value of the Fund will be affected by an increase or decrease in the value of the securities loaned and by an increase or decrease in the value of the instrument in which collateral is invested. The amount of securities lending activity undertaken by the Fund fluctuates from time to time. In the event of default or bankruptcy by the borrower, the Fund may be prevented from recovering the loaned securities or gaining access to the collateral or may experience delays or costs in doing so. In addition, the investment of any cash collateral received may lose all or part of its value. The Fund has the right under the lending agreement to recover the securities from the borrower on demand.
The Fund lends its securities through an unaffiliated securities lending agent. Cash collateral received in connection with its securities lending transactions is invested in Wells Fargo Securities Lending Cash Investments, LLC (the “Cash Collateral Fund”). The Cash Collateral Fund is exempt from registration under Section 3(c)(7) of the 1940 Act and is managed by Funds Management and is sub-advised by Wells Capital Management Incorporated (“Wells Capital Management”). Funds Management receives an advisory fee starting at 0.05% and declining to 0.01% as the average daily net assets of the Cash Collateral Fund increase. All of the fees received by Funds Management are paid to Wells Capital Management for its services as sub-adviser. The Cash Collateral Fund seeks to provide a positive return compared to the daily Fed Funds Open rate by investing in high-quality, U.S. dollar-denominated short-term money market instruments. Cash Collateral Fund investments are fair valued based upon the amortized cost valuation technique. Income earned from investment in the Cash Collateral Fund is included in securities lending income on the Statement of Operations.
Security transactions and income recognition
Securities transactions are recorded on a trade date basis. Realized gains or losses are reported on the basis of identified cost of securities delivered.
Dividend income is recognized on the ex-dividend date, except for certain dividends from foreign securities, which are recorded as soon as the Fund is informed of the ex-dividend date. Dividend income from foreign securities is recorded net of foreign taxes withheld where recovery of such taxes is not assured.
Distributions to shareholders
Distributions to shareholders from net investment income and net realized gains, if any, are recorded on the ex-dividend date. Such distributions are determined in conformity with income tax regulations, which may differ from generally accepted accounting principles.
| | | | |
| 20 | | Wells Fargo Advantage Intrinsic World Equity Fund | | Notes to Financial Statements (Unaudited) |
Federal and other taxes
The Fund intends to continue to qualify as a regulated investment company by distributing substantially all of its investment company taxable income and any net realized capital gains (after reduction for capital loss carryforwards) sufficient to relieve it from all, or substantially all, federal income taxes. Accordingly, no provision for federal income taxes was required.
The Fund’s income and federal excise tax returns and all financial records supporting those returns for the prior three fiscal years are subject to examination by the federal and Delaware revenue authorities. Management has analyzed the Fund’s tax positions taken on federal, state, and foreign tax returns for all open tax years and does not believe that there are any uncertain tax positions that require recognition of a tax liability.
Under the recently enacted Regulated Investment Company Modernization Act of 2010, the Fund is permitted to carry forward capital losses incurred in taxable years which began after December 22, 2010 for an unlimited period. However, any losses incurred are required to be utilized prior to the losses incurred in pre-enactment taxable years. As a result of this ordering rule, pre-enactment capital loss carryforwards may be more likely to expire unused. Post-enactment capital losses that are carried forward will retain their character as either short-term or long-term capital losses rather than be considered all short-term as under previous law. In addition, the Fund may elect to defer any portion of a post-October capital loss or qualified late-year ordinary loss to the first day of the following taxable year. A post-October capital loss is the greatest of the net capital loss, net short-term capital loss or net long-term capital loss for the portion of the taxable year after October 31. A qualified late-year ordinary loss is the net loss comprised of (a) net gain or loss from the sale or other disposition of capital assets for the portion of the taxable year after October 31, and (b) other ordinary income or loss for the portion of the taxable year after December 31.
As of October 31, 2011, the Fund had net capital loss carryforwards, which were available to offset future net realized capital gains, in the amount of $20,899,478 with $6,606,078 expiring in 2016, $13,020,395 expiring in 2017 and $1,273,005 expiring in 2018.
Class allocations
The separate classes of shares offered by the Fund differ principally in applicable sales charges, distribution, shareholder servicing and administration fees. Shareholders of each class bear certain expenses that pertain to that particular class. All shareholders bear the common expenses of the Fund, earn income from the portfolio, and are allocated unrealized gains and losses pro rata based on the average daily net assets of each class, without distinction between share classes. Dividends are determined separately for each class based on income and expenses allocable to each class. Realized gains and losses are allocated to each class pro rata based upon the net assets of each class on the date realized. Differences in per share dividend rates generally result from the relative weightings of pro rata income and realized gain allocations and from differences in separate class expenses, including distribution, shareholder servicing and administration fees.
3. FAIR VALUATION MEASUREMENTS
Fair value measurements of investments are determined within a framework that has established a fair value hierarchy based upon the various data inputs utilized in determining the value of the Fund’s investments. The three-level hierarchy gives the highest priority to unadjusted quoted prices in active markets for identical assets or liabilities (Level 1) and the lowest priority to significant unobservable inputs (Level 3). The Fund’s investments are classified within the fair value hierarchy based on the lowest level of input that is significant to the fair value measurement. The inputs are summarized into three broad levels as follows:
| n | | Level 1 – quoted prices in active markets for identical securities |
| n | | Level 2 – other significant observable inputs (including quoted prices for similar securities, interest rates, prepayment speeds, credit risk, etc.) |
| n | | Level 3 – significant unobservable inputs (including the Fund’s own assumptions in determining the fair value of investments) |
The inputs or methodologies used for valuing securities are not necessarily an indication of the risk associated with investing in those securities.
| | | | | | |
| Notes to Financial Statements (Unaudited) | | Wells Fargo Advantage Intrinsic World Equity Fund | | | 21 | |
As of April 30, 2012, the inputs used in valuing the Fund’s assets, which are carried at fair value, were as follows:
| | | | | | | | | | | | | | | | |
| Investments in Securities | | Quoted Prices (Level 1) | | | Significant Other
Observable Inputs (Level 2) | | | Significant Unobservable Inputs (Level 3) | | | Total | |
Equity securities | | | | | | | | | | | | | | | | |
Common stocks | | $ | 151,136,718 | | | $ | 4,756,789 | | | $ | 0 | | | $ | 155,893,507 | |
Short-term investments | | | | | | | | | | | | | | | | |
Investment companies | | | 3,286,345 | | | | 6,717,815 | | | | 0 | | | | 10,004,160 | |
| | | $ | 154,423,063 | | | $ | 11,474,604 | | | $ | 0 | | | $ | 165,897,667 | |
Further details on the major security types listed above can be found in the Portfolio of Investments.
Transfers in and transfers out are recognized at the end of the reporting period. For the six months ended April 30, 2012, the Fund did not have any significant transfers into/out of Level 1 and Level 2.
4. TRANSACTIONS WITH AFFILIATES AND OTHER EXPENSES
Advisory fee
The Trust has entered into an advisory contract with Funds Management, an indirect wholly owned subsidiary of Wells Fargo & Company (“Wells Fargo”). The adviser is responsible for implementing investment policies and guidelines and for supervising the sub-adviser, who is responsible for day-to-day portfolio management of the Fund.
Pursuant to the contract, Funds Management is entitled to receive an annual advisory fee starting at 0.80% and declining to 0.65% as the average daily net assets of the Fund increase. For the six months ended April 30, 2012, the advisory fee was equivalent to an annual rate of 0.80% of the Fund’s average daily net assets.
Funds Management has retained the services of certain sub-advisers to provide daily portfolio management to the Fund. The fees related to sub-advisory services are borne directly by Funds Management and do not increase the overall fees paid by the Fund. Metropolitan West Capital Management, LLC, an affiliate of Funds Management, is the sub-adviser to the Fund and is entitled to receive a fee from Funds Management at an annual rate starting at 0.35% and declining to 0.20% as the average daily net assets of the Fund increase.
Administration and transfer agent fees
The Trust has entered into an administration agreement with Funds Management. Under this agreement, for providing administrative services, which includes paying fees and expenses for services provided by the transfer agent, sub-transfer agents, omnibus account servicers and record-keepers, Funds Management is entitled to receive from the Fund an annual fund level administration fee starting at 0.05% and declining to 0.03% as the average daily net assets of the Fund increase and a class level administration fee which is calculated based on the average daily net assets of each class as follows:
| | | | |
| | | Class Level Administration Fee | |
Class A, Class C | | | 0.26 | % |
Administrator Class | | | 0.10 | |
Institutional Class | | | 0.08 | |
Funds Management has contractually waived and/or reimbursed advisory and administration fees to the extent necessary to maintain certain net operating expense ratios for the Fund. Waiver of fees and/or reimbursement of expenses by Funds Management were made first from fund level expenses on a proportionate basis and then from class specific expenses. Funds Management has committed through July 18, 2013 to waive fees and/or reimburse expenses to the extent necessary to cap the Fund’s expenses at 1.40% for Class A, 2.15% for Class C, 1.15% for Administrator Class and 0.95% for Institutional Class.
| | | | |
| 22 | | Wells Fargo Advantage Intrinsic World Equity Fund | | Notes to Financial Statements (Unaudited) |
Distribution fees
The Trust has adopted a Distribution Plan for Class C shares of the Fund pursuant to Rule 12b-1 under the 1940 Act. Distribution fees are charged to Class C shares and paid to Wells Fargo Funds Distributor, LLC, the principal underwriter, at an annual rate of 0.75% of the average daily net assets of Class C shares.
For the six months ended April 30, 2012, Wells Fargo Funds Distributor, LLC received $3,521 from the sale of Class A shares and $24 in contingent deferred sales charges from redemptions of Class C shares.
Shareholder servicing fees
The Trust has entered into contracts with one or more shareholder servicing agents, whereby Class A, Class C and Administrator Class of the Fund is charged a fee at an annual rate of 0.25% of the average daily net assets of each respective class.
A portion of these total shareholder servicing fees were paid to affiliates of Wells Fargo.
5. INVESTMENT PORTFOLIO TRANSACTIONS
Purchases and sales of investments, excluding U.S. Government obligations (if any) and short-term securities, for the six months ended April 30, 2012 were $28,123,337 and $27,867,757, respectively.
6. ACQUISITION
After the close of business on August 26, 2011, the Fund acquired the net assets of Wells Fargo Disciplined Global Equity Fund. The purpose of the transaction was to combine two funds with similar investment objectives and strategies. Shareholders holding Class A, Class C, Administrator Class and Institutional Class shares of Wells Fargo Advantage Disciplined Global Equity Fund received Class A, Class C, Administrator Class and Institutional Class shares, respectively, of the Fund in the reorganization. The acquisition was accomplished by a tax-free exchange of all of the shares of Wells Fargo Advantage Disciplined Global Equity Fund for 3,887,555 shares of the Fund valued at $57,481,502 at an exchange ratio of 0.82, 0.78, 0.85, and 0.85 for Class A, Class C, Administrator Class and Institutional Class shares, respectively. The investment portfolio of Wells Fargo Advantage Disciplined Global Equity Fund with a fair value of $57,387,480, identified cost of $55,845,635 and unrealized gains of $1,541,845 at August 26, 2011 were the principal assets acquired by the Fund. The aggregate net assets of Wells Fargo Advantage Disciplined Global Equity Fund and the Fund immediately prior to the acquisition were $57,481,502 and $87,382,768, respectively. The aggregate net assets of the Fund immediately after the acquisition were $144,864,270. For financial reporting purposes, assets received and shares issued by the Fund were recorded at fair value; however, the cost basis of the investments received from Wells Fargo Advantage Disciplined Global Equity Fund was carried forward to align ongoing reporting of the Fund’s realized and unrealized gains and losses with amounts distributable to shareholders for tax purposes.
Assuming the acquisition had been completed November 1, 2010, the beginning of the annual reporting period for the Fund, the pro forma results of operations for the year ended October 31, 2011 would have been:
| | | | |
Net investment income | | $ | 1,670,163 | |
Net realized and unrealized gains on investments | | $ | 1,943,474 | |
Net increase in net assets resulting from operations | | $ | 3,613,637 | |
7. REGULATORY SETTLEMENT PROCEEDS
During the six months ended April 30, 2012, the Fund received proceeds from an unaffiliated third party in a regulatory settlement with the SEC involving marketing timing of mutual funds. The proceeds received are reflected as an increase to paid-in capital in the accompanying financial statements.
8. BANK BORROWINGS
The Trust (excluding the money market funds) and Wells Fargo Variable Trust are parties to a $150,000,000 revolving credit agreement with State Street Bank and Trust Company, whereby the Fund is permitted to use bank borrowings for temporary or emergency purposes, such as to fund shareholder redemption requests. Interest under the credit agreement is charged to the Fund based on a borrowing rate equal to the higher of the Federal Funds rate in effect on
| | | | | | |
| Notes to Financial Statements (Unaudited) | | Wells Fargo Advantage Intrinsic World Equity Fund | | | 23 | |
that day plus 1.25% or the overnight LIBOR rate in effect on that day plus 1.25%. In addition, an annual commitment fee equal to 0.10% of the unused balance is allocated to each participating fund. For the six months ended April 30, 2012, the Fund paid $175 in commitment fees.
For the six months ended April 30, 2012, there were no borrowings by the Fund under the agreement.
9. INDEMNIFICATION
Under the Trust’s organizational documents, the officers and directors are indemnified against certain liabilities that may arise out of performance of their duties to the Trust. Additionally, in the normal course of business, the Trust may enter into contracts with service providers that contain a variety of indemnification clauses. The Trust’s maximum exposure under these arrangements is dependent on future claims that may be made against the Fund and, therefore, cannot be estimated.
10. NEW ACCOUNTING PRONOUNCEMENTS
In December 2011, the Financial Accounting Standards Board (“FASB”) issued Accounting Standard Update (“ASU”) No. 2011-11, Disclosures about Offsetting Assets and Liabilities. ASU 2011-11, which amends FASB ASC Topic 210, Balance Sheet, creates new disclosure requirements which require entities to disclose both gross and net information for derivatives and other financial instruments that are either offset in the Statement of Assets and Liabilities or subject to an enforceable master netting arrangement or similar agreement. The disclosure requirements are effective for interim and annual reporting periods beginning on or after January 1, 2013. Management is currently assessing the potential impact, in addition to expanded financial statement disclosure, that may result from adopting this ASU.
In May 2011, FASB issued ASU No. 2011-04 Amendments to Achieve Common Fair Value Measurement and Disclosure Requirements in U.S. GAAP and IFRSs. ASU No. 2011-04 amends FASB ASC Topic 820, Fair Value Measurements establish common requirements for measuring fair value and for disclosing information about fair value measurements in accordance with GAAP. The ASU is effective prospectively for interim and annual periods beginning after December 15, 2011. Management expects that adoption of the ASU will result in additional disclosures in the financial statements, as applicable.
In April 2011, FASB issued ASU No. 2011-03 Reconsideration of Effective Control for Repurchase Agreements. ASU No. 2011-03 amends FASB ASC Topic 860, Transfers and Servicing, specifically the criteria required to determine whether a repurchase agreement (repo) and similar agreements should be accounted for as sales of financial assets or secured borrowings with commitments. ASU No. 2011-03 changes the assessment of effective control by focusing on the transferor’s contractual rights and obligations and removing the criterion to assess its ability to exercise those rights or honor those obligations. This could result in changes to the way entities account for certain transactions including repurchase agreements, mortgage dollar rolls and reverse repurchase agreements. The ASU will become effective on a prospective basis for new transfers and modifications to existing transactions as of the beginning of the first interim or annual period beginning on or after December 15, 2011. Management has evaluated the impact of adopting the ASU and expects no significant changes.
| | | | |
| 24 | | Wells Fargo Advantage Intrinsic World Equity Fund | | Other Information (Unaudited) |
PROXY VOTING INFORMATION
A description of the policies and procedures that the Fund uses to determine how to vote proxies relating to portfolio securities is available without charge, upon request, by calling 1-800-222-8222, visiting our Web site at wellsfargoadvantagefunds.com, or visiting the SEC Web site at sec.gov. Information regarding how the Fund voted proxies relating to portfolio securities during the most recent 12-month period ended June 30 is available without charge on the Fund’s Web site at wellsfargoadvantagefunds.com or by visiting the SEC Web site at sec.gov.
PORTFOLIO HOLDINGS INFORMATION
The complete portfolio holdings for the Fund are publicly available on the Fund’s Web site (wellsfargoadvantagefunds.com) on a monthly, 30-day or more delayed basis. In addition, top ten holdings information for the Fund is publicly available on the Fund’s Web site on a monthly, seven-day or more delayed basis. The Fund files its complete schedule of portfolio holdings with the SEC for the first and third quarters of each fiscal year on Form N-Q, which is available without charge by visiting the SEC Web site at sec.gov. In addition, the Fund’s Form N-Q may be reviewed and copied at the SEC’s Public Reference Room in Washington, DC, and at regional offices in New York City, at 233 Broadway, and in Chicago, at 175 West Jackson Boulevard, Suite 900. Information about the Public Reference Room may be obtained by calling 1-800-SEC-0330.
| | | | | | |
| Other Information (Unaudited) | | Wells Fargo Advantage Intrinsic World Equity Fund | | | 25 | |
BOARD OF TRUSTEES
The following table provides basic information about the Board of Trustees (the “Trustees”) of the Trust and Officers of the Trust. This table should be read in conjunction with the Prospectus and the Statement of Additional Information1 of the Fund. Each of the Trustees and Officers listed below acts in identical capacities for the Wells Fargo Advantage family of funds, which consists of 137 funds comprising the Wells Fargo Funds Trust, Wells Fargo Variable Trust, Wells Fargo Master Trust and four closed-end funds (collectively the “Fund Complex”). All of the Trustees are also Members of the Audit and Governance Committees of each Trust in the Fund Complex. The mailing address of each Trustee and Officer is 525 Market Street, 12th Floor, San Francisco, CA 94105. Each Trustee and Officer serves an indefinite term, however, each Trustee serves such term until reaching the mandatory retirement age established by the Trustees.
Independent Trustees
| | | | | | |
Name and Year of Birth | | Position Held and Length of Service | | Principal Occupations During Past Five Years | | Other Directorships During
Past Five Years |
Peter G. Gordon
(Born 1942) | | Trustee, since 1998; Chairman, since 2005 (Lead Trustee since 2001) | | Co-Founder, Retired Chairman, President and CEO of Crystal Geyser Water Company. Trustee Emeritus, Colby College | | Asset Allocation Trust |
Isaiah Harris, Jr.
(Born 1952) | | Trustee, since 2009 | | Retired. Prior thereto, President and CEO of BellSouth Advertising and Publishing Corp. from 2005 to 2007, President and CEO of BellSouth Enterprises from 2004 to 2005 and President of BellSouth Consumer Services from 2000 to 2003. Emeritus member of the Iowa State University Foundation Board of Governors. Emeritus Member of the Advisory Board of Iowa State University School of Business. Mr. Harris is a certified public accountant. | | CIGNA Corporation; Deluxe Corporation; Asset Allocation Trust |
Judith M. Johnson
(Born 1949) | | Trustee, since 2008 | | Retired. Prior thereto, Chief Executive Officer and Chief Investment Officer of Minneapolis Employees Retirement Fund from 1996 to 2008. Ms. Johnson is an attorney, certified public accountant and a certified managerial accountant. | | Asset Allocation Trust |
Leroy Keith, Jr.
(Born 1939) | | Trustee, since 2010 | | Chairman, Bloc Global Services (development and construction). Trustee of the Evergreen Funds from 1983 to 2010. Former Managing Director, Almanac Capital Management (commodities firm), former Partner, Stonington Partners, Inc. (private equity fund), former Director, Obagi Medical Products Co. and former Director, Lincoln Educational Services. | | Trustee, Virtus Fund Complex (consisting of 40 portfolios as of 12/31/11); Asset Allocation Trust |
David F. Larcker
(Born 1950) | | Trustee, since 2009 | | James Irvin Miller Professor of Accounting at the Graduate School of Business, Stanford University, Director of Corporate Governance Research Program and Senior Faculty of The Rock Center for Corporate Governance since 2006. From 2005 to 2008, Professor of Accounting at the Graduate School of Business, Stanford University. Prior thereto, Ernst & Young Professor of Accounting at The Wharton School, University of Pennsylvania from 1985 to 2005. | | Asset Allocation Trust |
Olivia S. Mitchell
(Born 1953) | | Trustee, since 2006 | | International Foundation of Employee Benefit Plans Professor, Wharton School of the University of Pennsylvania since 1993. Director of Wharton’s Pension Research Council and Boettner Center on Pensions & Retirement Research, and Research Associate at the National Bureau of Economic Research. Previously, Cornell University Professor from 1978 to 1993. | | Asset Allocation Trust |
| | | | |
| 26 | | Wells Fargo Advantage Intrinsic World Equity Fund | | Other Information (Unaudited) |
| | | | | | |
Name and Year of Birth | | Position Held and Length of Service | | Principal Occupations During Past Five Years | | Other Directorships During
Past Five Years |
Timothy J. Penny
(Born 1951) | | Trustee, since 1996 | | President and CEO of Southern Minnesota Initiative Foundation, a non-profit organization, since 2007 and Senior Fellow at the Humphrey Institute Policy Forum at the University of Minnesota since 1995. Member of the Board of Trustees of NorthStar Education Finance, Inc., a non-profit organization, since 2007. | | Asset Allocation Trust |
Michael S. Scofield
(Born 1943) | | Trustee, since 2010 | | Served on the Investment Company Institute’s Board of Governors and Executive Committee from 2008-2011 as well the Governing Council of the Independent Directors Council from 2006-2011 and the Independent Directors Council Executive Committee from 2008-2011. Chairman of the IDC from 2008-2010. Institutional Investor (Fund Directions) Trustee of Year in 2007. Trustee of the Evergreen Funds (and its predecessors) from 1984 to 2010. Chairman of the Evergreen Funds from 2000-2010. Former Trustee of the Mentor Funds. Retired Attorney, Law Offices of Michael S. Scofield and former Director and Chairman, Branded Media Corporation (multi-media branding company). | | Asset Allocation Trust |
Donald C. Willeke
(Born 1940) | | Trustee, since 1996 | | Principal of the law firm of Willeke & Daniels. General Counsel of the Minneapolis Employees Retirement Fund from 1984 until its consolidation into the Minnesota Public Employees Retirement Association on June 30, 2010. Director and Vice Chair of The Free Trust (non-profit corporation). Director of the American Chestnut Foundation (non-profit corporation). | | Asset Allocation Trust |
Officers
| | | | | | |
Name and Year of Birth | | Position Held and
Length of Service | | Principal Occupations During Past Five Years | | |
Karla M. Rabusch
(Born 1959) | | President, since 2003 | | Executive Vice President of Wells Fargo Bank, N.A. and President of Wells Fargo Funds Management, LLC since 2003. Senior Vice President and Chief Administrative Officer of Wells Fargo Funds Management, LLC from 2001 to 2003. | | |
C. David Messman
(Born 1960) | | Secretary, since 2000; Chief Legal Counsel, since 2003 | | Senior Vice President and Secretary of Wells Fargo Funds Management, LLC since 2001. Vice President and Managing Senior Counsel of Wells Fargo Bank, N.A. since 1996. | | |
Kasey Phillips
(Born 1970) | | Treasurer, since 2009 | | Senior Vice President of Wells Fargo Funds Management, LLC since 2009. Senior Vice President of Evergreen Investment Management Company, LLC from 2006 to 2010. Treasurer of the Evergreen Funds from 2005 to 2010. | | |
David Berardi
(Born 1975) | | Assistant Treasurer, since 2009 | | Vice President of Wells Fargo Funds Management, LLC since 2009. Vice President of Evergreen Investment Management Company, LLC from 2008 to 2010. Assistant Vice President of Evergreen Investment Services, Inc. from 2004 to 2008. Manager of Fund Reporting and Control for Evergreen Investment Management Company, LLC from 2004 to 2010. | | |
Jeremy DePalma
(Born 1974) | | Assistant Treasurer, since 2009 | | Senior Vice President of Wells Fargo Funds Management, LLC since 2009. Senior Vice President of Evergreen Investment Management Company, LLC from 2008 to 2010. Vice President, Evergreen Investment Services, Inc. from 2004 to 2007. Head of the Fund Reporting and Control Team within Fund Administration from 2005 to 2010. | | |
Debra Ann Early
(Born 1964) | | Chief Compliance Officer, since 2007 | | Chief Compliance Officer of Wells Fargo Funds Management, LLC since 2007. Chief Compliance Officer of Parnassus Investments from 2005 to 2007. Chief Financial Officer of Parnassus Investments from 2004 to 2007 and Senior Audit Manager of PricewaterhouseCoopers LLP from 1998 to 2004. | | |
| 1. | The Statement of Additional Information includes additional information about the Trustees and is available, without charge, upon request, by calling 1-800-222-8222 or by visiting the Web site at wellsfargoadvantagefunds.com. |
| | | | | | |
| Other Information (Unaudited) | | Wells Fargo Advantage Intrinsic World Equity Fund | | | 27 | |
BOARD CONSIDERATION OF INVESTMENT ADVISORY AND SUB-ADVISORY AGREEMENTS:
Under Section 15 of the Investment Company Act of 1940 (the “1940 Act”), the Board of Trustees (the “Board”) of Wells Fargo Funds Trust (the “Trust”), all the members of which have no direct or indirect interest in the investment advisory and sub-advisory agreements and are not “interested persons” of the Trust, as defined in the 1940 Act (the “Independent Trustees”), must determine whether to approve the continuation of the Trust’s investment advisory and sub-advisory agreements. In this regard, at an in person meeting held on March 29-30, 2012 (the “Meeting”), the Board reviewed and re-approved: (i) an investment advisory agreement with Wells Fargo Funds Management, LLC (“Funds Management”) for Wells Fargo Advantage Intrinsic World Equity Fund (the “Fund”) and (ii) an investment sub-advisory agreement with Metropolitan West Capital Management, LLC (“MetWest”) for the Fund. The investment advisory agreement with Funds Management and the investment sub-advisory agreement with MetWest are collectively referred to as the “Advisory Agreements.”
At the Meeting, the Board considered the factors and reached the conclusions described below relating to the selection of Funds Management and MetWest and the continuation of the Advisory Agreements. Prior to the Meeting, the Trustees conferred extensively among themselves and with representatives of Funds Management about these matters. The Board also met throughout the year and received information that was useful to them in considering the continuation of the Advisory Agreements. The Independent Trustees were assisted in their evaluation of the Advisory Agreements by independent legal counsel, from whom they received separate legal advice and with whom they met separately from Funds Management.
In providing information to the Board, Funds Management was guided by a detailed set of requests submitted by the Independent Trustees’ independent legal counsel on their behalf at the start of the Board’s annual contract renewal process earlier in 2012. In approving the Advisory Agreements, the Board did not identify any particular information or consideration that was all-important or controlling, and each Trustee likely attributed different weights to various factors.
Nature, extent and quality of services
The Board received and considered various information regarding the nature, extent and quality of services provided to the Fund by Funds Management and MetWest under the Advisory Agreements. The Board also received and considered, among other things, information about the background and experience of senior management of Funds Management, and the qualifications, backgrounds, tenures and responsibilities of the portfolio managers primarily responsible for the day-to-day portfolio management of the Fund.
The Board evaluated the ability of Funds Management and MetWest, based on their respective financial condition, resources, reputation and other attributes, to attract and retain qualified investment professionals, including research, advisory, and supervisory personnel. The Board further considered the compliance programs and compliance records of Funds Management and MetWest. In addition, the Board took into account the administrative services provided to the Fund by Funds Management and its affiliates.
The Board’s decision to approve the continuation of the Advisory Agreements was based on a comprehensive evaluation of all of the information provided to it. In considering these matters, the Board considered not only the specific information presented in connection with the Meeting, but also the knowledge gained over time through interaction with Funds Management and MetWest about various topics, including Funds Management’s oversight of service providers. The above factors, together with those referenced below, are some of the most important, but not necessarily all, factors considered by the Board in concluding that the nature, extent and quality of the investment advisory services provided to the Fund by Funds Management and MetWest supported the re-approval of the Advisory Agreements. Although the Board considered the continuation of the Advisory Agreements for the Fund as part of the larger process of considering the continuation of the advisory agreements for all of the funds in the complex, its decision to continue the Advisory Agreements for the Fund was ultimately made on a fund-by-fund basis.
Fund performance and expenses
The Board considered the performance results for the Fund over various time periods ended December 31, 2011. The Board also considered these results in comparison to the median performance of a universe of relevant funds (the “Universe”) that was determined by Lipper Inc. (“Lipper”) to be similar to the Fund, and in comparison to the Fund’s benchmark index and to other comparative data. Lipper is an independent provider of investment company data. The
| | | | |
| 28 | | Wells Fargo Advantage Intrinsic World Equity Fund | | Other Information (Unaudited) |
Board received a description of the methodology used by Lipper to select the mutual funds in the Universe. The Board noted that the performance of the Fund was higher than or in range of the median performance of the Universe for all periods under review. The Board also noted that the performance of the Fund was higher than or in range of its benchmark, the Lipper Global Large-Cap Core Funds Index, for the periods under review.
As part of its review, the Board received a report that noted that the Fund underwent changes to its portfolio management team in 2011, although Funds Management does not anticipate any changes to the investment process for the Fund. The Board was satisfied that Funds Management was appropriately monitoring the Fund’s investment performance.
The Board received and considered information regarding the Fund’s contractual advisory fee and net operating expense ratios and their various components, including actual management fees (which reflect fee waivers, if any), transfer agent, custodian and other non-management fees, Rule 12b-1 and non-Rule 12b-1 fees, service fees and fee waiver and expense reimbursement arrangements. The Board also considered these ratios in comparison to the median ratios of an expense Universe and a narrower expense group of mutual funds (each, an “Expense Group”) that was determined by Lipper to be similar to the Fund. The Board received a description of the methodology used by Lipper to select the mutual funds in the Fund’s Expense Group. The Board noted that the net operating expense ratios of the Fund were lower than or in range of the Fund’s Expense Group’s median net operating expense ratios.
Based on the above-referenced considerations and other factors, the Board concluded that the overall performance and expense structure of the Fund supported the re-approval of the Advisory Agreements for the Fund.
Investment advisory and sub-advisory fee rates
The Board reviewed and considered the contractual investment advisory fee rate that is payable by the Fund to Funds Management for investment advisory services (the “Advisory Agreement Rate”), both on a stand-alone basis and on a combined basis with the Fund’s administration fee rate. The Board took into account the separate administrative and other services covered by the administration fee rate. The Board also reviewed and considered the contractual investment sub-advisory fee rate that is payable by Funds Management to MetWest for investment sub-advisory services (the “Sub-Advisory Agreement Rate”). In addition, the Board reviewed and considered the existing fee waiver/cap arrangements applicable to the Advisory Agreement Rate and considered the Advisory Agreement Rate after taking the waivers/caps into account (the “Net Advisory Rate”).
The Board received and considered information comparing the Advisory Agreement Rate and Net Advisory Rate with those of other funds in the Fund’s Expense Group median. The Board noted that the Advisory Agreement Rate for the Fund was in range of the median rate for its Expense Group, except for the Class A. The Board also noted that the Net Advisory Rate for the Fund was in range of the median rate for its Expense Group, except for Class A and Institutional Class. The Board noted that Funds Management proposed to extend contractual fee cap arrangements for the Fund designed to lower the fund’s expenses until February 28, 2014.
The Board also received and considered information about the portion of the total management fee that was retained by Funds Management after payment of the fee to MetWest for sub-advisory services. The Board also considered this amount in comparison to the median amount paid by a sub-advised expense Universe that was determined by Lipper to be similar to the Fund.
The Board also received and considered information about the nature and extent of services offered and fee rates charged by Funds Management and MetWest to other types of clients. In this regard, the Board received information about differences between the services, and the compliance, reporting, and other legal burdens and risks of providing investment advice to mutual funds and those associated with providing advice to non-mutual fund clients such as collective funds or institutional separate accounts.
The Board determined that the Advisory Agreement Rate for the Fund, both with and without an administration fee rate and before and after waivers, was reasonable in light of the Fund’s Expense Group information, the net expense ratio commitments, the services covered by the Advisory Agreements and other information provided. The Board also reviewed and considered the Sub-Advisory Agreement Rate and concluded that the Sub-Advisory Agreement Rate was reasonable in light of the services covered by the sub-advisory agreement, the sub-advised expense information provided by Lipper, and other information provided.
| | | | | | |
| Other Information (Unaudited) | | Wells Fargo Advantage Intrinsic World Equity Fund | | | 29 | |
Profitability
The Board received and considered a profitability analysis of Funds Management, as well as an analysis of the profitability to the collective Wells Fargo businesses that provide services to the Fund. It considered that the information provided to it was necessarily estimated, and that the profitability information provided to it, especially on a fund-by-fund basis, did not necessarily provide a precise tool for evaluating the appropriateness of the Fund’s Advisory Agreement Rate in isolation. It noted that the levels of profitability reported on a fund-by-fund basis varied widely, depending on, among other things, the size and type of fund. The Board concluded that the profitability reported by Funds Management was not unreasonable.
The Board did not consider separate profitability information with respect to MetWest, because, as an affiliate of Funds Management, its profitability information was subsumed in the collective Wells Fargo profitability analysis provided by Funds Management.
Economies of scale
With respect to possible economies of scale, the Board reviewed the breakpoints in the Fund’s advisory fee structure, which operate generally to reduce the effective Advisory Agreement Rate of the Fund (as a percentage of Fund assets) as the Fund grows in size. It considered that, as a fund shrinks in size, breakpoints conversely result in increasing fee levels. The Board noted that it would have on-going opportunities to review the appropriate levels of breakpoints in the future, and concluded that the breakpoints as implemented appeared to be a reasonable step toward sharing economies of scale, if any, with the Fund. However, the Board acknowledged the inherent limitations of any analysis of an investment adviser’s economies of scale and of any attempt to correlate breakpoints with such economies, stemming largely from the Board’s understanding that economies of scale are realized, if at all, by an investment adviser across a variety of products and services, not just with respect to a single fund.
Other benefits to Funds Management and MetWest
The Board received and considered information regarding potential “fall-out” or ancillary benefits received by Funds Management and its affiliates and MetWest as a result of their relationship with the Fund. Ancillary benefits could include, among others, benefits directly attributable to the relationship of Funds Management and MetWest with the Fund and benefits potentially derived from an increase in Funds Management’s and MetWest’s business as a result of their relationship with the Fund (such as the ability to market to shareholders other financial products offered by Funds Management and its affiliates or MetWest).
The Board considered that Wells Fargo Funds Distributor, LLC, an affiliate of Funds Management, serves as distributor to the Fund and receives certain compensation for those services. The Board noted that various financial institutions, including affiliates of Funds Management, may receive distribution-related fees, shareholder servicing payments (including amounts derived from payments under Rule 12b-1 plans) and sub-transfer agency fees in respect of shares sold or held through them and services provided.
The Board also reviewed information about whether and to what extent soft dollar credits are sought and how any such credits are utilized and any benefits that may be realized by using an affiliated broker.
Other factors and broader review
The Board also considered the markets for distribution of the Fund’s shares, including the channels through which the Fund’s shares are offered and sold. The Board noted that the Fund is part of one of the few fund families that have both direct-to-fund and intermediary distribution channels. As discussed above, the Board reviews detailed materials received from Funds Management and MetWest annually as part of the re-approval process under Section 15 of the 1940 Act and also reviews and assesses information about the quality of the services that the Fund receives throughout the year. In this regard, the Board has reviewed reports of Funds Management at each of its quarterly meetings, which include, among other things, portfolio reviews and performance reports. In addition, the Board confers with portfolio managers at various times throughout the year.
Conclusion
After considering the above-described factors and based on its deliberations and its evaluation of the information described above, the Board unanimously approved the continuation of the Advisory Agreements for an additional one-year period.
| | | | |
| 30 | | Wells Fargo Advantage Intrinsic World Equity Fund | | List of Abbreviations |
The following is a list of common abbreviations for terms and entities which may have appeared in this report.
| ACB | — Agricultural Credit Bank |
| ADR | — American Depository Receipt |
| ADS | — American Depository Shares |
| AGC-ICC | — Assured Guaranty Corporation - Insured Custody Certificates |
| AGM | — Assured Guaranty Municipal |
| AMBAC | — American Municipal Bond Assurance Corporation |
| AMT | — Alternative Minimum Tax |
| BAN | — Bond Anticipation Notes |
| BHAC | — Berkshire Hathaway Assurance Corporation |
| CAB | — Capital Appreciation Bond |
| CCAB | — Convertible Capital Appreciation Bond |
| CDA | — Community Development Authority |
| CDO | — Collateralized Debt Obligation |
| COP | — Certificate of Participation |
| DRIVER | — Derivative Inverse Tax-Exempt Receipts |
| DW&P | — Department of Water & Power |
| DWR | — Department of Water Resources |
| ECFA | — Educational & Cultural Facilities Authority |
| EDA | — Economic Development Authority |
| EDFA | — Economic Development Finance Authority |
| ETF | — Exchange-Traded Fund |
| FFCB | — Federal Farm Credit Bank |
| FGIC | — Financial Guaranty Insurance Corporation |
| FHA | — Federal Housing Authority |
| FHLB | — Federal Home Loan Bank |
| FHLMC | — Federal Home Loan Mortgage Corporation |
| FICO | — The Financing Corporation |
| FNMA | — Federal National Mortgage Association |
| GDR | — Global Depository Receipt |
| GNMA | — Government National Mortgage Association |
| HCFR | — Healthcare Facilities Revenue |
| HEFA | — Health & Educational Facilities Authority |
| HEFAR | — Higher Education Facilities Authority Revenue |
| HFA | — Housing Finance Authority |
| HFFA | — Health Facilities Financing Authority |
| IBC | — Insured Bond Certificate |
| IDA | — Industrial Development Authority |
| IDAG | — Industrial Development Agency |
| IDR | — Industrial Development Revenue |
| KRW | — Republic of Korea Won |
| LIBOR | — London Interbank Offered Rate |
| LLC | — Limited Liability Company |
| LLP | — Limited Liability Partnership |
| MBIA | — Municipal Bond Insurance Association |
| MFHR | — Multi-Family Housing Revenue |
| MSTR | — Municipal Securities Trust Receipts |
| MUD | — Municipal Utility District |
| NATL-RE | — National Public Finance Guarantee Corporation |
| PCFA | — Pollution Control Finance Authority |
| PCR | — Pollution Control Revenue |
| PFA | — Public Finance Authority |
| PFFA | — Public Facilities Financing Authority |
| PFOTER | — Puttable Floating Option Tax-Exempt Receipts |
| plc | — Public Limited Company |
| PUTTER | — Puttable Tax-Exempt Receipts |
| R&D | — Research & Development |
| RDA | — Redevelopment Authority |
| RDFA | — Redevelopment Finance Authority |
| REIT | — Real Estate Investment Trust |
| ROC | — Reset Option Certificates |
| SAVRS | — Select Auction Variable Rate Securities |
| SBA | — Small Business Authority |
| SFHR | — Single Family Housing Revenue |
| SFMR | — Single Family Mortgage Revenue |
| SPA | — Standby Purchase Agreement |
| SPDR | — Standard & Poor’s Depositary Receipts |
| STRIPS | — Separate Trading of Registered Interest and Principal Securities |
| TAN | — Tax Anticipation Notes |
| TIPS | — Treasury Inflation-Protected Securities |
| TRAN | — Tax Revenue Anticipation Notes |
| TCR | — Transferable Custody Receipts |
| TTFA | — Transportation Trust Fund Authority |
| TVA | — Tennessee Valley Authority |
| XLCA | — XL Capital Assurance |


FOR MORE INFORMATION
More information about Wells Fargo Advantage Funds is available free upon request. To obtain literature, please write, e-mail, visit the Fund’s Web site, or call:
Wells Fargo Advantage Funds
P.O. Box 8266
Boston, MA 02266-8266
E-mail: wfaf@wellsfargo.com
Web site: wellsfargoadvantagefunds.com
Individual investors: 1-800-222-8222
Retail investment professionals: 1-888-877-9275
Institutional investment professionals: 1-866-765-0778
This report and the financial statements contained herein are submitted for the general information of the shareholders of Wells Fargo Advantage Funds. If this report is used for promotional purposes, distribution of the report must be accompanied or preceded by a current prospectus. For a prospectus containing more complete information, including charges and expenses, call 1-800-222-8222 or visit the Fund’s Web site at wellsfargoadvantagefunds.com. Please consider the investment objectives, risks, charges, and expenses of the investment carefully before investing. This and other information about Wells Fargo Advantage Funds can be found in the current prospectus. Read the prospectus carefully before you invest or send money.
Wells Fargo Funds Management, LLC, a wholly owned subsidiary of Wells Fargo & Company, provides investment advisory and administrative services for Wells Fargo Advantage Funds. Other affiliates of Wells Fargo & Company provide subadvisory and other services for the Funds. The Funds are distributed by Wells Fargo Funds Distributor, LLC, Member FINRA/SIPC, an affiliate of Wells Fargo & Company.
NOT FDIC INSURED ¡ NO BANK GUARANTEE ¡ MAY LOSE VALUE
© 2012 Wells Fargo Funds Management, LLC. All rights reserved.
| | |
 | | 209725 06-12 SA241/SAR241 4-12 |

Wells Fargo Advantage
Intrinsic Small Cap Value Fund

Semi-Annual Report
April 30, 2012

Reduce clutter. Save trees.
Sign up for electronic delivery of prospectuses and shareholder reports at wellsfargo.com/advantagedelivery
Contents
The views expressed and any forward-looking statements are as of April 30, 2012, unless otherwise noted, and are those of the Fund managers and/or Wells Fargo Funds Management, LLC. Discussions of individual securities, or the markets generally, or any Wells Fargo Advantage Fund are not intended as individual recommendations. Future events or results may vary significantly from those expressed in any forward-looking statements; the views expressed are subject to change at any time in response to changing circumstances in the market. Wells Fargo Funds Management, LLC, disclaims any obligation to publicly update or revise any views expressed or forward-looking statements.
NOT FDIC INSURED ¡ NO BANK GUARANTEE ¡ MAY LOSE VALUE

WELLS FARGO INVESTMENT HISTORY
| | |
| |
| 1932 | | Keystone creates one of the first mutual fund families. |
| |
| 1971 | | Wells Fargo & Company introduces one of the first institutional index funds. |
| |
| 1978 | | Wells Fargo applies Markowitz and Sharpe’s research on Modern Portfolio Theory to introduce one of the industry’s first Tactical Asset Allocation (TAA) models in institutional separately managed accounts. |
| |
| 1984 | | Wells Fargo Stagecoach Funds launches its first asset allocation fund. |
| |
| 1989 | | The Tactical Asset Allocation (TAA) Model is first applied to Wells Fargo’s asset allocation mutual funds. |
| |
| 1994 | | Wells Fargo introduces the LifePath Funds, one of the first suites of target date funds (now the Wells Fargo Advantage Dow Jones Target Date FundsSM). |
| |
| 1996 | | Evergreen Investments and Keystone Funds merge. |
| |
| 1997 | | Wells Fargo launches Wells Fargo Advantage WealthBuilder PortfoliosSM, a fund-of-funds suite of products that includes the use of quantitative models to shift assets among investment styles. |
| |
| 1999 | | Norwest Advantage Funds and Stagecoach Funds are reorganized into Wells Fargo Funds after the merger of Norwest and Wells Fargo. |
| |
| 2002 | | Evergreen Retail and Evergreen Institutional companies form the umbrella asset management company, Evergreen Investments. |
| |
| 2005 | | The integration of Strong Funds with Wells Fargo Funds creates Wells Fargo Advantage Funds, resulting in one of the top 20 mutual fund companies in the United States. |
| |
| 2006 | | Wells Fargo Advantage Funds relaunches the target date product line as Wells Fargo Advantage Dow Jones Target Date Funds. |
| |
| 2010 | | The mergers and reorganizations of Evergreen and Wells Fargo Advantage mutual funds are completed, unifying the families under the brand of Wells Fargo Advantage Funds. |
Wells Fargo Advantage Funds®
Wells Fargo Advantage Funds skillfully guides institutions, financial advisors, and individuals through the investment terrain to help them reach their financial objectives. Everything we do on behalf of investors is backed by our unique combination of qualifications.
Strength
Our organization is built on the standards of integrity and service established by our parent company—Wells Fargo & Company—more than 150 years ago. And, because we’re part of a highly diversified financial enterprise, we offer the depth of resources to help investors succeed.
Expertise
Our multi-boutique model offers investors access to the independent thinking of premier investment managers that have been chosen for their time-tested strategies. While each team specializes in a specific investment strategy, collectively they provide investors a wide choice of distinct investment styles. Our dedication to investment excellence doesn’t end with our expertise in manager selection—risk management, analysis, and rigorous ongoing review seek to ensure each manager’s investment process remains consistent.
Partnership
Our collaborative approach is built around understanding the needs and goals of our clients. By adhering to core principles of sound judgment and steady guidance, we support you through every stage of the investment decision process.
Carefully consider a fund’s investment objectives, risks, charges, and expenses before investing. For a current prospectus and, if available, a summary prospectus, containing this and other information, visit wellsfargoadvantagefunds.com. Read it carefully before investing.
Wells Fargo Funds Management, LLC, a wholly owned subsidiary of Wells Fargo & Company, provides investment advisory and administrative services for Wells Fargo Advantage Funds®. Other affiliates of Wells Fargo & Company provide subadvisory and other services for the Funds. The Funds are distributed by Wells Fargo Funds Distributor, LLC, Member FINRA/SIPC, an affiliate of Wells Fargo & Company.
“Dow Jones®” and “Dow Jones Target Date IndexesSM” are service marks of Dow Jones Trademark Holdings, LLC (“Dow Jones”), have been licensed to CME Group Index Services LLC (“CME Indexes”) and have been sublicensed for use for certain purposes by Global Index Advisors, Inc, and Wells Fargo Funds Management, LLC. The Wells Fargo Advantage Dow Jones Target Date FundsSM based on the Dow Jones Target Date IndexesSM, are not sponsored, endorsed, sold or promoted by Dow Jones, CME Indexes or their respective affiliates and none of them makes any representation regarding the advisability of investing in such product(s).
NOT FDIC INSURED ¡ NO BANK GUARANTEE ¡ MAY LOSE VALUE
Not part of the semi-annual report.
Wells Fargo Advantage Funds offers more than 110 mutual funds across a wide range of asset classes, representing over $211 billion in assets under management, as of April 30, 2012.
| | | | |
| Equity Funds | | | | |
Asia Pacific Fund | | Enterprise Fund† | | Opportunity Fund† |
C&B Large Cap Value Fund | | Equity Value Fund | | Precious Metals Fund |
C&B Mid Cap Value Fund | | Global Opportunities Fund | | Premier Large Company Growth Fund |
Capital Growth Fund | | Growth Fund | | Small Cap Opportunities Fund |
Common Stock Fund | | Index Fund | | Small Cap Value Fund |
Disciplined U.S. Core Fund | | International Equity Fund | | Small Company Growth Fund |
Discovery Fund† | | International Value Fund | | Small Company Value Fund |
Diversified Equity Fund | | Intrinsic Small Cap Value Fund | | Small/Mid Cap Core Fund |
Diversified International Fund | | Intrinsic Value Fund | | Small/Mid Cap Value Fund |
Diversified Small Cap Fund | | Intrinsic World Equity Fund | | Special Mid Cap Value Fund |
Emerging Growth Fund | | Large Cap Core Fund | | Special Small Cap Value Fund |
Emerging Markets Equity Fund | | Large Cap Growth Fund | | Specialized Technology Fund |
Emerging Markets Equity Income Fund | | Large Company Value Fund | | Traditional Small Cap Growth Fund |
Emerging Markets Local Bond Fund | | Omega Growth Fund | | Utility and Telecommunications Fund |
Endeavor Select Fund† | | | | |
| Bond Funds | | | | |
Adjustable Rate Government Fund | | Inflation-Protected Bond Fund | | Short-Term Bond Fund |
California Limited-Term Tax-Free Fund | | Intermediate Tax/AMT-Free Fund | | Short-Term High Yield Bond Fund |
California Tax-Free Fund | | International Bond Fund | | Short-Term Municipal Bond Fund |
Colorado Tax-Free Fund | | Minnesota Tax-Free Fund | | Strategic Municipal Bond Fund |
Government Securities Fund | | Municipal Bond Fund | | Total Return Bond Fund |
High Income Fund | | North Carolina Tax-Free Fund | | Ultra Short-Term Income Fund |
High Yield Bond Fund | | Pennsylvania Tax-Free Fund | | Ultra Short-Term Municipal Income Fund |
Income Plus Fund | | Short Duration Government Bond Fund | | Wisconsin Tax-Free Fund |
| Asset Allocation Funds | | | | |
Absolute Return Fund | | WealthBuilder Equity Portfolio† | | Target 2020 Fund† |
Asset Allocation Fund | | WealthBuilder Growth Allocation Portfolio† | | Target 2025 Fund† |
Conservative Allocation Fund | | WealthBuilder Growth Balanced Portfolio† | | Target 2030 Fund† |
Diversified Capital Builder Fund | | WealthBuilder Moderate Balanced Portfolio† | | Target 2035 Fund† |
Diversified Income Builder Fund | | WealthBuilder Tactical Equity Portfolio† | | Target 2040 Fund† |
Growth Balanced Fund | | Target Today Fund† | | Target 2045 Fund† |
Index Asset Allocation Fund | | Target 2010 Fund† | | Target 2050 Fund† |
Moderate Balanced Fund | | Target 2015 Fund† | | Target 2055 Fund† |
WealthBuilder Conservative Allocation Portfolio† | | | | |
| Money Market Funds | | | | |
100% Treasury Money Market Fund | | Heritage Money Market Fund† | | National Tax-Free Money Market Fund |
California Municipal Money Market Fund | | Money Market Fund | | Prime Investment Money Market Fund |
Cash Investment Money Market Fund | | Municipal Cash Management Money Market Fund | | Treasury Plus Money Market Fund |
Government Money Market Fund | | Municipal Money Market Fund | | |
| Variable Trust Funds1 | | | | |
VT Discovery Fund† | | VT Intrinsic Value Fund | | VT Small Cap Growth Fund |
VT Index Asset Allocation Fund | | VT Omega Growth Fund | | VT Small Cap Value Fund |
VT International Equity Fund | | VT Opportunity Fund† | | VT Total Return Bond Fund |
An investment in a money market fund is not insured or guaranteed by the Federal Deposit Insurance Corporation or any other government agency. Although the Wells Fargo Advantage Money Market Funds seek to preserve the value of your investment at $1.00 per share, it is possible to lose money by investing in a money market fund.
| 1. | The Variable Trust Funds are generally available only through insurance company variable contracts. |
| † | In this report, the Wells Fargo Advantage Discovery FundSM, Wells Fargo Advantage Endeavor Select FundSM, Wells Fargo Advantage Enterprise FundSM, Wells Fargo Advantage Opportunity FundSM, Wells Fargo Advantage WealthBuilder Conservative Allocation PortfolioSM, Wells Fargo Advantage WealthBuilder Equity PortfolioSM, Wells Fargo Advantage WealthBuilder Growth Allocation PortfolioSM, Wells Fargo Advantage WealthBuilder Growth Balanced PortfolioSM, Wells Fargo Advantage WealthBuilder Moderate Balanced PortfolioSM, Wells Fargo Advantage WealthBuilder Tactical Equity PortfolioSM, Wells Fargo Advantage Dow Jones Target Today FundSM, Wells Fargo Advantage Dow Jones Target 2010 FundSM, Wells Fargo Advantage Dow Jones Target 2015 FundSM, Wells Fargo Advantage Dow Jones Target 2020 FundSM, Wells Fargo Advantage Dow Jones Target 2025 FundSM, Wells Fargo Advantage Dow Jones Target 2030 FundSM, Wells Fargo Advantage Dow Jones Target 2035 FundSM, Wells Fargo Advantage Dow Jones Target 2040 FundSM, Wells Fargo Advantage Dow Jones Target 2045 FundSM, Wells Fargo Advantage Dow Jones Target 2050 FundSM, Wells Fargo Advantage Dow Jones Target 2055 FundSM, Wells Fargo Advantage Heritage Money Market FundSM, Wells Fargo Advantage VT Discovery FundSM, and Wells Fargo Advantage VT Opportunity FundSM are referred to as the Discovery Fund, Endeavor Select Fund, Enterprise Fund, Opportunity Fund, WealthBuilder Conservative Allocation Portfolio, WealthBuilder Equity Portfolio, WealthBuilder Growth Allocation Portfolio, WealthBuilder Growth Balanced Portfolio, WealthBuilder Moderate Balanced Portfolio, WealthBuilder Tactical Equity Portfolio, Target Today Fund, Target 2010 Fund, Target 2015 Fund, Target 2020 Fund, Target 2025 Fund, Target 2030 Fund, Target 2035 Fund, Target 2040 Fund, Target 2045 Fund, Target 2050 Fund, Target 2055 Fund, Heritage Money Market Fund, VT Discovery Fund, and VT Opportunity Fund, respectively. |
Not part of the semi-annual report.
| | | | |
| 2 | | Wells Fargo Advantage Intrinsic Small Cap Value Fund | | Letter to Shareholders |

Karla M. Rabusch,
President
Wells Fargo Advantage Funds
The period was marked by continued concerns about the possible global economic effects of the ongoing European sovereign debt crisis that began in Greece and later spread to the larger economies of Italy and Spain.
In contrast to worrisome data from the eurozone, U.S. economic data remained moderately positive.
Dear Valued Shareholder:
We’re pleased to offer you this semi-annual report for the Wells Fargo Advantage Intrinsic Small Cap Value Fund for the six-month period that ended April 30, 2012. The period was marked by continued concerns about the possible global economic effects of the ongoing European sovereign debt crisis that began in Greece and later spread to the larger economies of Italy and Spain. However, relatively positive U.S. economic data resulted in most U.S. stock indexes posting gains for the period, with large-cap stocks modestly outperforming small-cap stocks.
Macroeconomic optimism seemed to fade as global growth slowed and worries rose.
Prior to and throughout the reporting period, concerns about the eurozone sovereign debt situation returned to center stage. Investors became increasingly concerned that Greece would default on its debt, a scenario that only seemed more likely as eurozone leaders began to openly discuss a “voluntary” haircut on Greek debt for private investors. Because many eurozone banks owned Greek debt and many U.S. banks had financial ties to eurozone banks, investors worried about the effects of such an event on the financial systems and on the global economy.
In October 2011, market participants turned their attention to the debt burdens of Italy—which, like the U.S., also had its credit rating downgraded by Standard & Poor’s—because even though it had a relatively modest budget deficit, it had a high amount of outstanding debt and a stagnant economy. French banks were heavily exposed to Italian debt, so Italy’s woes led to fears of a state bailout of French banks and a resulting increase in France’s expenditures.
The Greek credit crisis was seemingly addressed in March 2012, when the Greek government came to an agreement with its creditors that allowed it to write down the principal on most of its bonds in exchange for increased financial austerity. The Greek agreement, combined with unprecedented support for eurozone banks by the European Central Bank (ECB), seemed to calm investor concerns, at least temporarily, and most developed European markets ended the period with gains.
The U.S. economy reported relatively solid news.
In contrast to worrisome data from the eurozone, U.S. economic data remained moderately positive. Reported gross domestic product (GDP) growth came in at a 1.8% annualized rate in the third quarter of 2011 and then accelerated to a 3.0% annualized rate in the fourth quarter. The initial estimate for GDP growth in the first quarter of 2012 came in at a 2.2% annualized rate, further supporting the case for economic recovery. In addition, the major banks appeared to have taken steps toward repairing their balance sheets; in March, the Federal Reserve (Fed) announced that 15 of the 19 major banks had passed a “stress test” in which the Fed attempted to gauge whether the banks could survive a severe recession that included a 50% drop in the stock market and a 21% percent decline in housing prices.
Financial stocks rebounded and outperformed the broader market for the reporting period after the Fed released details of the stress test. Stocks generally rallied across the market as investors seemed to be increasingly confident that the U.S. would not return to recession.
| | | | | | |
| Letter to Shareholders | | Wells Fargo Advantage Intrinsic Small Cap Value Fund | | | 3 | |
Central banks continued to provide stimulus.
Throughout the reporting period, the Federal Open Market Committee kept its key interest rates effectively at zero in order to support the economy and financial system. In response to extreme market volatility and signs of a weakening economy, the Fed announced its intention to keep interest rates low until at least late 2014.
As of November 1, 2011, the ECB had a key rate of 1.50%, which it had increased from 1.0% in an attempt to keep inflation in check. Soon, in response to weakness in the southern European economies, the ECB lowered its key rate to 1.25% in early November 2011 and 1.0% in December 2011. The ECB also continued to provide virtually unlimited liquidity for banks, announcing a Long-Term Refinancing Operation in December through which it provided low-cost three-year loans to lenders.
We use time-tested investment strategies, even as many variables are at work in the market.
Elevated unemployment and debt defaults continue to pressure consumers and businesses alike. In our experience, strict adherence to time-tested investment strategies has its rewards. As a whole, Wells Fargo Advantage Funds represents investments across a range of asset classes and investment styles, giving you an opportunity to create a diversified investment portfolio. While diversification may not prevent losses in a downturn, we believe it helps in managing risk.
Thank you for choosing to invest with Wells Fargo Advantage Funds. We appreciate your confidence in us and remain committed to helping you meet your financial needs. For current information about your fund investments, contact your investment professional, visit our Web site at wellsfargoadvantagefunds.com, or call us directly at 1-800-222-8222. We are available 24 hours a day, 7 days a week.
Sincerely,

Karla M. Rabusch
President
Wells Fargo Advantage Funds
| | | | |
| 4 | | Wells Fargo Advantage Intrinsic Small Cap Value Fund | | Letter to Shareholders |
Notice to Shareholders
The Board of Trustees for Wells Fargo Advantage Funds has unanimously approved the following modifications to certain net asset value (NAV) waiver privileges and commission schedules:
| | n | | Effective May 1, 2012, automatic investment plan (AIP) purchases and proceeds received from systematic withdrawals will no longer qualify for NAV repurchase privileges. | |
| | n | | Effective May 1, 2012, discretionary rights to waive the upfront commission for Class C and “jumbo” Class A share purchases will no longer be granted to broker/dealers. However, we will continue to waive the Class C shares contingent deferred sales charge for redemptions by employer-sponsored retirement plans where the dealer of record waived its commission at the time of purchase. | |
| | n | | Effective July 31, 2012, NAV purchase privileges for former Evergreen Class IS and Class R shareholders are being modified to remove the ability to purchase Class A shares at NAV unless those shares are held directly with the Fund on or after July 31, 2012. | |
Please contact your investment professional or call us directly at 1-800-222-8222 if you have any questions on this Notice to Shareholders.
| | | | | | |
| Performance Highlights (Unaudited) | | Wells Fargo Advantage Intrinsic Small Cap Value Fund | | | 5 | |
INVESTMENT OBJECTIVE
The Fund seeks long-term capital appreciation.
ADVISER
Wells Fargo Funds Management, LLC
SUB-ADVISER
Metropolitan West Capital Management, LLC
PORTFOLIO MANAGERS
Alex Alvarez, CFA
Samir Sikka
FUND INCEPTION
March 28, 2002
| | | | |
TEN LARGEST EQUITY HOLDINGS1
(AS OF APRIL 30, 2012) | | | |
Kar Auction Services Incorporated | | | 3.03% | |
Cathay General Bancorporation | | | 2.73% | |
Charles River Laboratories International Incorporated | | | 2.68% | |
Zions Bancorporation | | | 2.62% | |
Jabil Circuit Incorporated | | | 2.55% | |
Aeropostale Incorporated | | | 2.49% | |
Electronics For Imaging Incorporated | | | 2.30% | |
E*TRADE Financial Corporation | | | 2.29% | |
Jones Group Incorporated | | | 2.24% | |
IDEX Corporation | | | 2.24% | |
| | |
SECTOR DISTRIBUTION2
(AS OF APRIL 30, 2012) | | |
|
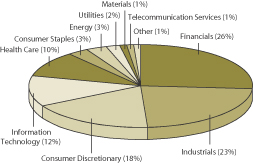 |
| 1. | The ten largest equity holdings are calculated based on the value of the securities divided by total net assets of the Fund. Holdings are subject to change and may have changed since the date specified. |
| 2. | Sector distribution is subject to change and is calculated based on the total long-term investments of the Fund. |
| | | | |
| 6 | | Wells Fargo Advantage Intrinsic Small Cap Value Fund | | Performance Highlights (Unaudited) |
AVERAGE ANNUAL TOTAL RETURN3 (%) (AS OF APRIL 30, 2012)
| | | | | | | | | | | | | | | | | | | | | | | | | | | | | | | | | | | | | | | | | | | | |
| | | | | | Including Sales Charge | | | Excluding Sales Charge | | | Expense Ratios4 | |
| | | Inception Date | | | 6 Months* | | | 1 Year | | | 5 Year | | | 10 Year | | | 6 Months* | | | 1 Year | | | 5 Year | | | 10 Year | | | Gross | | | Net5 | |
Class A (WFSMX) | | | 03/31/2008 | | | | 5.76 | | | | (11.00 | ) | | | (2.53 | ) | | | 7.27 | | | | 12.23 | | | | (5.57 | ) | | | (1.37 | ) | | | 7.91 | | | | 1.45% | | | | 1.45% | |
Class C (WSCDX) | | | 03/31/2008 | | | | 10.76 | | | | (7.35 | ) | | | (2.10 | ) | | | 7.25 | | | | 11.76 | | | | (6.35 | ) | | | (2.10 | ) | | | 7.25 | | | | 2.20% | | | | 2.20% | |
Administrator Class (WFSDX) | | | 04/08/2005 | | | | | | | | | | | | | | | | | | | | 12.39 | | | | (5.34 | ) | | | (1.13 | ) | | | 8.14 | | | | 1.29% | | | | 1.21% | |
Institutional Class (WFSSX) | | | 04/08/2005 | | | | | | | | | | | | | | | | | | | | 12.43 | | | | (5.18 | ) | | | (0.92 | ) | | | 8.28 | | | | 1.02% | | | | 1.01% | |
Investor Class (SCOVX) | | | 03/28/2002 | | | | | | | | | | | | | | | | | | | | 12.12 | | | | (5.67 | ) | | | (1.42 | ) | | | 7.88 | | | | 1.52% | | | | 1.50% | |
Russell 2000® Value Index6 | | | | | | | | | | | | | | | | | | | | | | | 11.47 | | | | (4.06 | ) | | | (0.49 | ) | | | 6.07 | | | | | | | | | |
| * | Returns for periods of less than one year are not annualized. |
Figures quoted represent past performance, which is no guarantee of future results and do not reflect the deduction of taxes that a shareholder may pay on fund distributions or the redemption of fund shares. Investment return and principal value of an investment will fluctuate so that an investor’s shares, when redeemed, may be worth more or less than their original cost. Performance shown without sales charges would be lower if sales charges were reflected. Current performance may be lower or higher than the performance data quoted and assumes the reinvestment of dividends and capital gains. Current month-end performance is available on the Fund’s Web site – wellsfargoadvantagefunds.com.
Index returns do not include transaction costs associated with buying and selling securities, any mutual fund fees or expenses or any taxes. It is not possible to invest directly in an index.
For Class A shares, the maximum front-end sales charge is 5.75%. For Class C shares, the maximum contingent deferred sales charge is 1.00%. Performance including sales charge assumes the sales charge for the corresponding time period. Administrator Class, Institutional Class and Investor Class shares are sold without a front-end sales charge or contingent deferred sales charge.
Stock fund values fluctuate in response to the activities of individual companies and general market and economic conditions. Smaller-company stocks tend to be more volatile and less liquid than those of larger companies. Certain investment strategies tend to increase the total risk of an investment (relative to the broader market). Consult the Fund’s prospectus for additional information on these and other risks.
| 3. | Prior to June 1, 2010, the Fund was named Wells Fargo Advantage Small Cap Disciplined Fund. Metropolitan West Capital Management, LLC replaced Wells Capital Management as a sub-adviser for the Fund effective June 1, 2010. Accordingly, performance figures shown prior to June 1, 2010 do not reflect the principal investment strategies or performance of Metropolitan West Capital Management, LLC. Historical performance shown for Class A, the Administrator Class and the Institutional Class shares prior to their inception reflects the performance of the Investor Class shares, and includes the higher expenses applicable to the Investor Class shares. If these expenses had not been included, returns would be higher. Historical performance shown for Class C shares prior to their inception reflects the performance of the Investor Class shares, adjusted to reflect the higher expenses applicable to Class C shares. |
| 4. | Reflects the expense ratios as stated in the most recent prospectuses. |
| 5. | The Adviser has committed through February 28, 2013 to waive fees and/or reimburse expenses to the extent necessary to cap the Fund’s Total Annual Fund Operating Expenses After Fee Waiver, excluding certain expenses, at 1.45% for Class A, 2.20% for Class C, 1.20% for Administrator Class, 1.00% for Institutional Class and 1.49% for Investor Class. Without this cap, the Fund’s returns would have been lower. |
| 6. | The Russell 2000® Value Index measures the performance of those Russell 2000 companies with lower price-to-book ratios and lower forecasted growth values. You cannot invest directly in an index. |
| | | | | | |
| Fund Expenses (Unaudited) | | Wells Fargo Advantage Intrinsic Small Cap Value Fund | | | 7 | |
As a shareholder of the Fund, you incur two types of costs: (1) transaction costs, including sales charges (loads) on purchase payments and contingent deferred sales charges (if any) on redemptions and (2) ongoing costs, including management fees; distribution (12b-1) and/or shareholder service fees; and other Fund expenses. This example is intended to help you understand your ongoing costs (in dollars) of investing in the Fund and to compare these costs with the ongoing costs of investing in other mutual funds.
The example is based on an investment of $1,000 invested at the beginning of the six-month period and held for the entire period from November 1, 2011 to April 30, 2012.
Actual Expenses
The “Actual” line of the table below provides information about actual account values and actual expenses. You may use the information in this line, together with the amount you invested, to estimate the expenses that you paid over the period. Simply divide your account value by $1,000 (for example, an $8,600 account value divided by $1,000 = 8.6), then multiply the result by the number in the “Actual” line under the heading entitled “Expenses Paid During Period” for your applicable class of shares to estimate the expenses you paid on your account during this period.
Hypothetical Example for Comparison Purposes
The “Hypothetical” line of the table below provides information about hypothetical account values and hypothetical expenses based on the Fund’s actual expense ratio and an assumed rate of return of 5% per year before expenses, which is not the Fund’s actual return. The hypothetical account values and expenses may not be used to estimate the actual ending account balance or expenses you paid for the period. You may use this information to compare the ongoing costs of investing in the Fund and other funds. To do so, compare this 5% hypothetical example with the 5% hypothetical examples that appear in the shareholder reports of the other funds.
Please note that the expenses shown in the table are meant to highlight your ongoing costs only and do not reflect any transactional costs, such as sales charges (loads) and contingent deferred sales charges. Therefore, the “Hypothetical” line of the table is useful in comparing ongoing costs only, and will not help you determine the relative total costs of owning different funds. In addition, if these transactional costs were included, your costs would have been higher.
| | | | | | | | | | | | | | | | |
| | | Beginning
Account Value
11-01-2011 | | | Ending
Account Value
04-30-2012 | | | Expenses
Paid During
the Period1 | | | Net Annual
Expense Ratio | |
Class A | | | | | | | | | | | | | | | | |
Actual | | $ | 1,000.00 | | | $ | 1,122.33 | | | $ | 7.65 | | | | 1.45 | % |
Hypothetical (5% return before expenses) | | $ | 1,000.00 | | | $ | 1,017.65 | | | $ | 7.27 | | �� | | 1.45 | % |
Class C | | | | | | | | | | | | | | | | |
Actual | | $ | 1,000.00 | | | $ | 1,117.65 | | | $ | 11.58 | | | | 2.20 | % |
Hypothetical (5% return before expenses) | | $ | 1,000.00 | | | $ | 1,013.92 | | | $ | 11.02 | | | | 2.20 | % |
Administrator Class | | | | | | | | | | | | | | | | |
Actual | | $ | 1,000.00 | | | $ | 1,123.94 | | | $ | 6.34 | | | | 1.20 | % |
Hypothetical (5% return before expenses) | | $ | 1,000.00 | | | $ | 1,018.90 | | | $ | 6.02 | | | | 1.20 | % |
Institutional Class | | | | | | | | | | | | | | | | |
Actual | | $ | 1,000.00 | | | $ | 1,124.30 | | | $ | 5.28 | | | | 1.00 | % |
Hypothetical (5% return before expenses) | | $ | 1,000.00 | | | $ | 1,019.89 | | | $ | 5.02 | | | | 1.00 | % |
Investor Class | | | | | | | | | | | | | | | | |
Actual | | $ | 1,000.00 | | | $ | 1,121.23 | | | $ | 7.86 | | | | 1.49 | % |
Hypothetical (5% return before expenses) | | $ | 1,000.00 | | | $ | 1,017.45 | | | $ | 7.47 | | | | 1.49 | % |
| 1. | Expenses paid is equal to the annualized expense ratio of each class multiplied by the average account value over the period, multiplied by the number of days in the most recent fiscal half-year divided by the number of days in the fiscal year (to reflect the one-half year period). |
| | | | |
| 8 | | Wells Fargo Advantage Intrinsic Small Cap Value Fund | | Portfolio of Investments—April 30, 2012 (Unaudited) |
| | | | | | | | | | | | |
| Security Name | | | | | | Shares | | | Value | |
| | | | | | | | | | | | |
| | | | |
Common Stocks: 92.31% | | | | | | | | | | | | |
| | | | |
Consumer Discretionary: 17.15% | | | | | | | | | | | | |
| | | | |
| Automobiles: 1.65% | | | | | | | | | | | | |
Thor Industries Incorporated « | | | | | | | 51,000 | | | $ | 1,725,330 | |
| | | | | | | | | | | | |
| | | | |
| Hotels, Restaurants & Leisure : 2.95% | | | | | | | | | | | | |
P.F. Chang’s China Bistro Incorporated « | | | | | | | 56,500 | | | | 2,242,485 | |
Six Flags Entertainment Corporation | | | | | | | 17,500 | | | | 838,425 | |
| | | | |
| | | | | | | | | | | 3,080,910 | |
| | | | | | | | | | | | |
| | | | |
| Household Durables: 0.70% | | | | | | | | | | | | |
Ethan Allen Interiors Incorporated « | | | | | | | 31,500 | | | | 730,800 | |
| | | | | | | | | | | | |
| | | | |
| Specialty Retail: 8.47% | | | | | | | | | | | | |
Aeropostale Incorporated † | | | | | | | 117,500 | | | | 2,606,150 | |
Ascena Retail Group Incorporated † | | | | | | | 83,000 | | | | 1,699,840 | |
Group 1 Automotive Incorporated « | | | | | | | 22,500 | | | | 1,302,300 | |
JoS. A. Bank Clothiers Incorporated Ǡ | | | | | | | 29,500 | | | | 1,402,725 | |
OfficeMax Incorporated Ǡ | | | | | | | 398,000 | | | | 1,850,700 | |
| | | | |
| | | | | | | | | | | 8,861,715 | |
| | | | | | | | | | | | |
| | | | |
| Textiles, Apparel & Luxury Goods: 3.38% | | | | | | | | | | | | |
Carter Incorporated Ǡ | | | | | | | 22,000 | | | | 1,194,600 | |
Jones Group Incorporated | | | | | | | 208,500 | | | | 2,339,370 | |
| | | | |
| | | | | | | | | | | 3,533,970 | |
| | | | | | | | | | | | |
| | | | |
Consumer Staples: 2.96% | | | | | | | | | | | | |
| | | | |
| Food Products: 2.96% | | | | | | | | | | | | |
J & J Snack Foods Corporation « | | | | | | | 21,000 | | | | 1,177,260 | |
Post Holdings Incorporated † | | | | | | | 11,875 | | | | 353,281 | |
Ralcorp Holdings Incorporated | | | | | | | 21,500 | | | | 1,565,415 | |
| | | | |
| | | | | | | | | | | 3,095,956 | |
| | | | | | | | | | | | |
| | | | |
Energy: 2.51% | | | | | | | | | | | | |
| | | | |
| Energy Equipment & Services: 2.51% | | | | | | | | | | | | |
Dril-Quip Incorporated Ǡ | | | | | | | 14,000 | | | | 943,460 | |
Oceaneering International Incorporated | | | | | | | 15,500 | | | | 800,265 | |
Tetra Technologies Incorporated Ǡ | | | | | | | 101,000 | | | | 879,710 | |
| | | | |
| | | | | | | | | | | 2,623,435 | |
| | | | | | | | | | | | |
| | | | |
Financials: 24.65% | | | | | | | | | | | | |
| | | | |
| Capital Markets: 6.62% | | | | | | | | | | | | |
E*TRADE Financial Corporation † | | | | | | | 225,000 | | | | 2,391,750 | |
Eaton Vance Corporation « | | | | | | | 71,500 | | | | 1,880,450 | |
Janus Capital Group Incorporated « | | | | | | | 126,000 | | | | 955,080 | |
Stifel Financial Corporation Ǡ | | | | | | | 46,500 | | | | 1,693,530 | |
| | | | |
| | | | | | | | | | | 6,920,810 | |
| | | | | | | | | | | | |
The accompanying notes are an integral part of these financial statements.
| | | | | | |
| Portfolio of Investments—April 30, 2012 (Unaudited) | | Wells Fargo Advantage Intrinsic Small Cap Value Fund | | | 9 | |
| | | | | | | | | | | | |
| Security Name | | | | | | Shares | | | Value | |
| | | | | | | | | | | | |
| | | | |
| Commercial Banks: 12.63% | | | | | | | | | | | | |
Associated Banc-Corp « | | | | | | | 158,500 | | | $ | 2,112,805 | |
Cathay General Bancorp « | | | | | | | 165,500 | | | | 2,849,910 | |
CVB Financial Corporation | | | | | | | 164,500 | | | | 1,903,265 | |
Glacier Bancorp Incorporated « | | | | | | | 124,000 | | | | 1,847,600 | |
Hancock Holding Company « | | | | | | | 54,500 | | | | 1,753,810 | |
Zions Bancorporation « | | | | | | | 134,500 | | | | 2,742,455 | |
| | | | |
| | | | | | | | | | | 13,209,845 | |
| | | | | | | | | | | | |
| | | | |
| Insurance: 3.22% | | | | | | | | | | | | |
Horace Mann Educators Corporation | | | | | | | 92,500 | | | | 1,623,375 | |
Stancorp Financial Group Incorporated « | | | | | | | 45,500 | | | | 1,746,290 | |
| | | | |
| | | | | | | | | | | 3,369,665 | |
| | | | | | | | | | | | |
| | | | |
| Real Estate Management & Development: 2.18% | | | | | | | | | | | | |
Jones Lang LaSalle Incorporated | | | | | | | 28,500 | | | | 2,278,290 | |
| | | | | | | | | | | | |
| | | | |
Health Care: 9.55% | | | | | | | | | | | | |
| | | | |
| Health Care Equipment & Supplies: 2.22% | | | | | | | | | | | | |
Steris Corporation | | | | | | | 74,000 | | | | 2,324,340 | |
| | | | | | | | | | | | |
| | | | |
| Health Care Providers & Services: 1.51% | | | | | | | | | | | | |
AMN Healthcare Services Incorporated † | | | | | | | 234,600 | | | | 1,574,166 | |
| | | | | | | | | | | | |
| | | | |
| Life Sciences Tools & Services: 5.82% | | | | | | | | | | | | |
Bio-Rad Laboratories Incorporated † | | | | | | | 15,000 | | | | 1,619,850 | |
Charles River Laboratories International Incorporated † | | | | | | | 79,000 | | | | 2,806,870 | |
Covance Incorporated Ǡ | | | | | | | 35,500 | | | | 1,659,980 | |
| | | | |
| | | | | | | | | | | 6,086,700 | |
| | | | | | | | | | | | |
| | | | |
Industrials: 21.28% | | | | | | | | | | | | |
| | | | |
| Air Freight & Logistics: 0.68% | | | | | | | | | | | | |
Forward Air Corporation « | | | | | | | 21,000 | | | | 709,380 | |
| | | | | | | | | | | | |
| | | | |
| Commercial Services & Supplies: 7.89% | | | | | | | | | | | | |
Kar Auction Services Incorporated † | | | | | | | 187,500 | | | | 3,450,000 | |
Resources Connection Incorporated « | | | | | | | 145,500 | | | | 1,888,590 | |
Schawk Incorporated « | | | | | | | 78,500 | | | | 1,057,395 | |
School Specialty Incorporated † | | | | | | | 132,000 | | | | 431,640 | |
United Stationers Incorporated « | | | | | | | 50,000 | | | | 1,418,000 | |
| | | | |
| | | | | | | | | | | 8,245,625 | |
| | | | | | | | | | | | |
| | | | |
| Construction & Engineering: 2.89% | | | | | | | | | | | | |
Emcor Group Incorporated | | | | | | | 52,500 | | | | 1,539,300 | |
Pike Electric Corporation † | | | | | | | 181,000 | | | | 1,487,820 | |
| | | | |
| | | | | | | | | | | 3,027,120 | |
| | | | | | | | | | | | |
The accompanying notes are an integral part of these financial statements.
| | | | |
| 10 | | Wells Fargo Advantage Intrinsic Small Cap Value Fund | | Portfolio of Investments—April 30, 2012 (Unaudited) |
| | | | | | | | | | | | |
| Security Name | | | | | | Shares | | | Value | |
| | | | | | | | | | | | |
| | | | |
| Machinery: 6.65% | | | | | | | | | | | | |
IDEX Corporation | | | | | | | 54,000 | | | $ | 2,338,740 | |
Trinity Industries Incorporated | | | | | | | 60,000 | | | | 1,776,000 | |
Wabtec Corporation | | | | | | | 22,500 | | | | 1,750,050 | |
Watts Water Technologies Incorporated « | | | | | | | 29,500 | | | | 1,086,190 | |
| | | | |
| | | | | | | | | | | 6,950,980 | |
| | | | | | | | | | | | |
| | | | |
| Professional Services: 1.35% | | | | | | | | | | | | |
Korn/Ferry International Ǡ | | | | | | | 87,500 | | | | 1,413,125 | |
| | | | | | | | | | | | |
| | | | |
| Road & Rail: 1.82% | | | | | | | | | | | | |
Landstar System Incorporated | | | | | | | 35,500 | | | | 1,901,735 | |
| | | | | | | | | | | | |
| | | | |
Information Technology: 10.70% | | | | | | | | | | | | |
| | | | |
| Communications Equipment: 1.01% | | | | | | | | | | | | |
Plantronics Incorporated | | | | | | | 27,500 | | | | 1,053,800 | |
| | | | | | | | | | | | |
| | | | |
| Computers & Peripherals: 4.05% | | | | | | | | | | | | |
Avid Technology Incorporated Ǡ | | | | | | | 211,500 | | | | 1,837,935 | |
Electronics For Imaging Incorporated † | | | | | | | 134,500 | | | | 2,400,825 | |
| | | | |
| | | | | | | | | | | 4,238,760 | |
| | | | | | | | | | | | |
| | | | |
| Electronic Equipment, Instruments & Components: 2.54% | | | | | | | | | | | | |
Jabil Circuit Incorporated « | | | | | | | 113,500 | | | | 2,661,575 | |
| | | | | | | | | | | | |
| | | | |
| Internet Software & Services: 2.46% | | | | | | | | | | | | |
DealerTrack Holdings Incorporated Ǡ | | | | | | | 36,500 | | | | 1,088,795 | |
WebMD Health Corporation † | | | | | | | 65,000 | | | | 1,478,750 | |
| | | | |
| | | | | | | | | | | 2,567,545 | |
| | | | | | | | | | | | |
| | | | |
| Semiconductors & Semiconductor Equipment: 0.64% | | | | | | | | | | | | |
ATMI Incorporated Ǡ | | | | | | | 32,000 | | | | 672,320 | |
| | | | | | | | | | | | |
| | | | |
Materials: 1.25% | | | | | | | | | | | | |
| | | | |
| Construction Materials: 1.25% | | | | | | | | | | | | |
Texas Industries Incorporated « | | | | | | | 39,000 | | | | 1,310,790 | |
| | | | | | | | | | | | |
| | | | |
Telecommunication Services: 0.68% | | | | | | | | | | | | |
| | | | |
| Diversified Telecommunication Services: 0.68% | | | | | | | | | | | | |
General Communication Incorporated Class A Ǡ | | | | | | | 93,000 | | | | 706,800 | |
| | | | | | | | | | | | |
| | | | |
Utilities: 1.58% | | | | | | | | | | | | |
| | | | |
| Electric Utilities: 1.58% | | | | | | | | | | | | |
Westar Energy Incorporated | | | | | | | 57,500 | | | | 1,649,675 | |
| | | | | | | | | | | | |
| | | | |
Total Common Stocks (Cost $85,384,420) | | | | | | | | | | | 96,525,162 | |
| | | | | | | | | | | | |
The accompanying notes are an integral part of these financial statements.
| | | | | | |
| Portfolio of Investments—April 30, 2012 (Unaudited) | | Wells Fargo Advantage Intrinsic Small Cap Value Fund | | | 11 | |
| | | | | | | | | | | | | | |
| Security Name | | | | | | | Principal | | | Value | |
| | | | | | | | | | | | | | |
| | | | |
| Other: 0.57% | | | | | | | | | | | | | | |
Gryphon Funding Limited, Pass-Through Entity (a)(i)(v) | | | | | | | | $ | 802,451 | | | $ | 224,664 | |
VFNC Corporation, Pass-Through Entity, 0.24% (i)(v)(a)±144A | | | | | | | | | 881,280 | | | | 370,138 | |
| | | | |
Total Other (Cost $221,354) | | | | | | | | | | | | | 594,802 | |
| | | | | | | | | | | | | | |
| | | | |
| | | Yield | | | | | Shares | | | | |
| Short-Term Investments: 40.25% | | | | | | | | | | | | | | |
| | | | |
| Investment Companies: 40.25% | | | | | | | | | | | | | | |
Wells Fargo Advantage Cash Investment Money Market Fund, Select Class (l)(u) | | | 0.11 | % | | | | | 7,799,407 | | | | 7,799,407 | |
Wells Fargo Securities Lending Cash Investments, LLC (v)(l)(u)(r) | | | 0.19 | | | | | | 34,296,791 | | | | 34,296,791 | |
| | | | |
Total Short-Term Investments (Cost $42,096,198) | | | | | | | | | | | | | 42,096,198 | |
| | | | | | | | | | | | | | |
| | | | | | | | |
| Total Investments in Securities | | | | | | | | |
| (Cost $127,701,972) * | | | 133.13 | % | | | 139,216,162 | |
Other Assets and Liabilities, Net | | | (33.13 | ) | | | (34,646,442 | ) |
| | | | | | | | |
| Total Net Assets | | | 100.00 | % | | $ | 104,569,720 | |
| | | | | | | | |
| « | All or a portion of this security is on loan. |
| † | Non-income earning security |
| (v) | Security represents investment of cash collateral received from securities on loan. |
| (a) | Security is fair valued by the Management Valuation Team, and in certain instances by the Board of Trustees, in accordance with procedures approved by the Board of Trustees. |
| ± | Variable rate investment |
| 144A | Security that may be resold to “qualified institutional buyers” under Rule 144A or security offered pursuant to Section 4(2) of the Securities Act of 1933, as amended. |
| (l) | Investment in an affiliate |
| (u) | Rate shown is the 7-day annualized yield at period end. |
| (r) | The investment company is exempt from registration under Section 3(c)(7) of the 1940 Act. |
| * | Cost for federal income tax purposes is $130,148,739 and net unrealized appreciation (depreciation) consists of: |
| | | | |
Gross unrealized appreciation | | $ | 15,008,280 | |
Gross unrealized depreciation | | | (5,940,857 | ) |
| | | | |
Net unrealized appreciation | | $ | 9,067,423 | |
The accompanying notes are an integral part of these financial statements.
| | | | |
| 12 | | Wells Fargo Advantage Intrinsic Small Cap Value Fund | | Statement of Assets and Liabilities—April 30, 2012 (Unaudited) |
| | | | |
| | | | |
| |
Assets | | | | |
Investments | | | | |
In unaffiliated securities (including securities on loan), at value (see cost below) | | $ | 97,119,964 | |
In affiliated securities, at value (see cost below) | | | 42,096,198 | |
| | | | |
Total investments, at value (see cost below) | | | 139,216,162 | |
Receivable for Fund shares sold | | | 59,392 | |
Receivable for dividends | | | 14,294 | |
Receivable for securities lending income | | | 4,021 | |
Prepaid expenses and other assets | | | 124,677 | |
| | | | |
Total assets | | | 139,418,546 | |
| | | | |
| |
Liabilities | | | | |
Payable for Fund shares redeemed | | | 97,660 | |
Payable upon receipt of securities loaned | | | 34,518,145 | |
Advisory fee payable | | | 66,745 | |
Distribution fees payable | | | 67 | |
Due to other related parties | | | 13,193 | |
Accrued expenses and other liabilities | | | 153,016 | |
| | | | |
Total liabilities | | | 34,848,826 | |
| | | | |
Total net assets | | $ | 104,569,720 | |
| | | | |
| |
NET ASSETS CONSIST OF | | | | |
Paid-in capital | | $ | 181,840,375 | |
Undistributed net investment loss | | | (111,522 | ) |
Accumulated net realized losses on investments | | | (88,673,323 | ) |
Net unrealized gains on investments | | | 11,514,190 | |
| | | | |
Total net assets | | $ | 104,569,720 | |
| | | | |
| |
COMPUTATION OF NET ASSET VALUE AND OFFERING PRICE PER SHARE1 | | | | |
Net assets – Class A | | $ | 338,346 | |
Shares outstanding – Class A | | | 21,446 | |
Net asset value per share – Class A | | | $15.78 | |
Maximum offering price per share – Class A2 | | | $16.74 | |
Net assets – Class C | | $ | 108,062 | |
Shares outstanding – Class C | | | 7,108 | |
Net asset value per share – Class C | | | $15.20 | |
Net assets – Administrator Class | | $ | 7,897,026 | |
Shares outstanding – Administrator Class | | | 494,951 | |
Net asset value per share – Administrator Class | | | $15.96 | |
Net assets – Institutional Class | | $ | 44,782,367 | |
Shares outstanding – Institutional Class | | | 2,781,718 | |
Net asset value per share – Institutional Class | | | $16.10 | |
Net assets – Investor Class | | $ | 51,443,919 | |
Shares outstanding – Investor Class | | | 3,290,315 | |
Net asset value per share – Investor Class | | | $15.63 | |
| |
Investments in unaffiliated securities, at cost | | $ | 85,605,774 | |
| | | | |
Investments in affiliated securities, at cost | | $ | 42,096,198 | |
| | | | |
Total investments, at cost | | $ | 127,701,972 | |
| | | | |
Securities on loan, at value | | $ | 33,668,833 | |
| | | | |
| 1. | The Fund has an unlimited number of authorized shares. |
| 2. | Maximum offering price is computed as 100/94.25 of net asset value. On investments of $50,000 or more, the offering price is reduced. |
The accompanying notes are an integral part of these financial statements.
| | | | | | |
| Statement of Operations—Six Months Ended April 30, 2012 (Unaudited) | | Wells Fargo Advantage Intrinsic Small Cap Value Fund | | | 13 | |
| | | | |
| | | | |
| |
Investment income | | | | |
Dividends | | $ | 509,197 | |
Securities lending income, net | | | 25,816 | |
Income from affiliated securities | | | 2,866 | |
| | | | |
Total investment income | | | 537,879 | |
| | | | |
| |
Expenses | | | | |
Advisory fee | | | 411,990 | |
Administration fees | | | | |
Fund level | | | 25,749 | |
Class A | | | 365 | |
Class C | | | 140 | |
Administrator Class | | | 4,503 | |
Institutional Class | | | 17,175 | |
Investor Class | | | 83,599 | |
Shareholder servicing fees | | | | |
Class A | | | 351 | |
Class C | | | 134 | |
Administrator Class | | | 10,822 | |
Investor Class | | | 63,333 | |
Distribution fees | | | | |
Class C | | | 403 | |
Custody and accounting fees | | | 17,691 | |
Professional fees | | | 21,400 | |
Registration fees | | | 4,166 | |
Shareholder report expenses | | | 180 | |
Trustees’ fees and expenses | | | 7,733 | |
Other fees and expenses | | | 2,872 | |
| | | | |
Total expenses | | | 672,606 | |
Less: Fee waivers and/or expense reimbursements | | | (23,205 | ) |
| | | | |
Net expenses | | | 649,401 | |
| | | | |
Net investment loss | | | (111,522 | ) |
| | | | |
| |
REALIZED AND UNREALIZED GAINS (LOSSES) ON INVESTMENTS | | | | |
Net realized gains on investments | | | 2,788,253 | |
Net change in unrealized gains (losses) on investments | | | 9,323,943 | |
| | | | |
Net realized and unrealized gains (losses) on investments | | | 12,112,196 | |
| | | | |
Net increase in net assets resulting from operations | | $ | 12,000,674 | |
| | | | |
The accompanying notes are an integral part of these financial statements.
| | | | |
| 14 | | Wells Fargo Advantage Intrinsic Small Cap Value Fund | | Statement of Changes in Net Assets |
| | | | | | | | | | | | | | | | |
| | | Six Months Ended
April 30, 2012
(Unaudited) | | | Year Ended
October 31, 2011 | |
| | | | |
Operations | | | | | | | | | | | | | | | | |
Net investment loss | | | | | | $ | (111,522 | ) | | | | | | $ | (339,298 | ) |
Net realized gains on investments | | | | | | | 2,788,253 | | | | | | | | 14,690,507 | |
Net change in unrealized gains (losses) on investments | | | | | | | 9,323,943 | | | | | | | | (6,023,641 | ) |
| | | | | | | | | | | | | | | | |
Net increase in net assets resulting from operations | | | | | | | 12,000,674 | | | | | | | | 8,327,568 | |
| | | | | | | | | | | | | | | | |
| | | | |
Capital share transactions | | | Shares | | | | | | | | Shares | | | | | |
Proceeds from shares sold | | | | | | | | | | | | | | | | |
Class A | | | 11,816 | | | | 176,075 | | | | 4,615 | | | | 68,500 | |
Class C | | | 0 | | | | 0 | | | | 3,209 | | | | 48,259 | |
Administrator Class | | | 19,274 | | | | 297,091 | | | | 1,038,648 | | | | 15,271,750 | |
Institutional Class | | | 182,612 | | | | 2,768,553 | | | | 334,425 | | | | 5,008,327 | |
Investor Class | | | 137,050 | | | | 2,107,547 | | | | 199,982 | | | | 2,988,445 | |
| | | | | | | | | | | | | | | | |
| | | | | | | 5,349,266 | | | | | | | | 23,385,281 | |
| | | | | | | | | | | | | | | | |
Payment for shares redeemed | | | | | | | | | | | | | | | | |
Class A | | | (3,816 | ) | | | (56,667 | ) | | | (16,785 | ) | | | (251,136 | ) |
Class C | | | (813 | ) | | | (11,783 | ) | | | (5,828 | ) | | | (87,101 | ) |
Administrator Class | | | (208,874 | ) | | | (3,205,930 | ) | | | (769,230 | ) | | | (11,517,890 | ) |
Institutional Class | | | (325,037 | ) | | | (4,914,372 | ) | | | (2,568,025 | ) | | | (40,433,520 | ) |
Investor Class | | | (572,539 | ) | | | (8,399,029 | ) | | | (2,252,129 | ) | | | (33,218,405 | ) |
| | | | | | | | | | | | | | | | |
| | | | | | | (16,587,781 | ) | | | | | | | (85,508,052 | ) |
| | | | | | | | | | | | | | | | |
Net decrease in net assets resulting from capital share transactions | | | | | | | (11,238,515 | ) | | | | | | | (62,122,771 | ) |
| | | | | | | | | | | | | | | | |
Total increase (decrease) in net assets | | | | | | | 762,159 | | | | | | | | (53,795,203 | ) |
| | | | | | | | | | | | | | | | |
| | | | |
Net assets | | | | | | | | | | | | | | | | |
Beginning of period | | | | | | | 103,807,561 | | | | | | | | 157,602,764 | |
| | | | | | | | | | | | | | | | |
End of period | | | | | | $ | 104,569,720 | | | | | | | $ | 103,807,561 | |
| | | | | | | | | | | | | | | | |
Undistributed net investment income (loss) | | | | | | $ | (111,522 | ) | | | | | | $ | 0 | |
| | | | | | | | | | | | | | | | |
The accompanying notes are an integral part of these financial statements.
| | | | | | |
| Financial Highlights | | Wells Fargo Advantage Intrinsic Small Cap Value Fund | | | 15 | |
(For a share outstanding throughout each period)
| | | | | | | | | | | | | | | | | | | | |
| | | Six Months Ended
April 30, 2012 (Unaudited) | | | Year Ended October 31, | |
| Class A | | | 2011 | | | 2010 | | | 2009 | | | 20081 | |
Net asset value, beginning of period | | $ | 14.06 | | | $ | 13.81 | | | $ | 11.52 | | | $ | 11.08 | | | $ | 13.72 | |
Net investment income (loss) | | | (0.04 | ) | | | (0.06 | )2 | | | (0.06 | ) | | | (0.02 | )2 | | | 0.00 | 2,3 |
Net realized and unrealized gains (losses) on investments | | | 1.76 | | | | 0.31 | | | | 2.35 | | | | 0.47 | | | | (2.64 | ) |
| | | | | | | | | | | | | | | | | | | | |
Total from investment operations | | | 1.72 | | | | 0.25 | | | | 2.29 | | | | 0.45 | | | | (2.64 | ) |
Distributions to shareholders from | | | | | | | | | | | | | | | | | | | | |
Tax basis return of capital | | | 0.00 | | | | 0.00 | | | | 0.00 | | | | (0.01 | ) | | | 0.00 | |
Net asset value, end of period | | $ | 15.78 | | | $ | 14.06 | | | $ | 13.81 | | | $ | 11.52 | | | $ | 11.08 | |
Total return4 | | | 12.23 | % | | | 1.81 | % | | | 19.88 | % | | | 4.09 | % | | | (19.24 | )% |
Ratios to average net assets (annualized) | | | | | | | | | | | | | | | | | | | | |
Gross expenses | | | 1.47 | % | | | 1.44 | % | | | 1.54 | % | | | 1.57 | % | | | 1.55 | % |
Net expenses | | | 1.45 | % | | | 1.42 | % | | | 1.45 | % | | | 1.45 | % | | | 1.45 | % |
Net investment income (loss) | | | (0.43 | )% | | | (0.41 | )% | | | (0.49 | )% | | | (0.17 | )% | | | 0.01 | % |
Supplemental data | | | | | | | | | | | | | | | | | | | | |
Portfolio turnover rate | | | 12 | % | | | 54 | % | | | 147 | % | | | 64 | % | | | 77 | % |
Net assets, end of period (000’s omitted) | | | $338 | | | | $189 | | | | $354 | | | | $290 | | | | $29 | |
| 1. | For the period from March 31, 2008 (commencement of class operations) to October 31, 2008. |
| 2. | Calculated based upon average shares outstanding |
| 3. | Amount is less than $0.005. |
| 4. | Total return calculations do not include any sales charges. Returns for periods of less than one year are not annualized. |
The accompanying notes are an integral part of these financial statements.
| | | | |
| 16 | | Wells Fargo Advantage Intrinsic Small Cap Value Fund | | Financial Highlights |
(For a share outstanding throughout each period)
| | | | | | | | | | | | | | | | | | | | |
| | | Six Months Ended
April 30, 2012 (Unaudited) | | | Year Ended October 31, | |
| Class C | | | 2011 | | | 2010 | | | 2009 | | | 20081 | |
Net asset value, beginning of period | | $ | 13.60 | | | $ | 13.45 | | | $ | 11.31 | | | $ | 10.95 | | | $ | 13.61 | |
Net investment loss | | | (0.12 | ) | | | (0.17 | )2 | | | (0.18 | ) | | | (0.09 | )2 | | | (0.06 | )2 |
Net realized and unrealized gains (losses) on investments | | | 1.72 | | | | 0.32 | | | | 2.32 | | | | 0.45 | | | | (2.60 | ) |
| | | | | | | | | | | | | | | | | | | | |
Total from investment operations | | | 1.60 | | | | 0.15 | | | | 2.14 | | | | 0.36 | | | | (2.66 | ) |
Net asset value, end of period | | $ | 15.20 | | | $ | 13.60 | | | $ | 13.45 | | | $ | 11.31 | | | $ | 10.95 | |
Total return3 | | | 11.76 | % | | | 1.12 | % | | | 18.92 | % | | | 3.29 | % | | | (19.54 | )% |
Ratios to average net assets (annualized) | | | | | | | | | | | | | | | | | | | | |
Gross expenses | | | 2.21 | % | | | 2.19 | % | | | 2.30 | % | | | 2.31 | % | | | 2.33 | % |
Net expenses | | | 2.20 | % | | | 2.17 | % | | | 2.20 | % | | | 2.20 | % | | | 2.20 | % |
Net investment loss | | | (1.15 | )% | | | (1.19 | )% | | | (1.24 | )% | | | (0.90 | )% | | | (0.76 | )% |
Supplemental data | | | | | | | | | | | | | | | | | | | | |
Portfolio turnover rate | | | 12 | % | | | 54 | % | | | 147 | % | | | 64 | % | | | 77 | % |
Net assets, end of period (000’s omitted) | | | $108 | | | | $108 | | | | $142 | | | | $132 | | | | $26 | |
| 1. | For the period from March 31, 2008 (commencement of class operations) to October 31, 2008. |
| 2. | Calculated based upon average shares outstanding |
| 3. | Total return calculations do not include any sales charges. Returns for periods of less than one year are not annualized. |
The accompanying notes are an integral part of these financial statements.
| | | | | | |
| Financial Highlights | | Wells Fargo Advantage Intrinsic Small Cap Value Fund | | | 17 | |
(For a share outstanding throughout each period)
| | | | | | | | | | | | | | | | | | | | | | | | |
| | | Six Months Ended
April 30, 2012 (Unaudited) | | | Year Ended October 31, | |
| Administrator Class | | | 2011 | | | 2010 | | | 2009 | | | 2008 | | | 2007 | |
Net asset value, beginning of period | | $ | 14.20 | | | $ | 13.91 | | | $ | 11.58 | | | $ | 11.10 | | | $ | 18.10 | | | $ | 18.11 | |
Net investment income (loss) | | | 0.01 | | | | (0.05 | )1 | | | (0.02 | ) | | | 0.02 | 1 | | | 0.06 | 1 | | | 0.11 | 1 |
Net realized and unrealized gains (losses) on investments | | | 1.75 | | | | 0.34 | | | | 2.35 | | | | 0.46 | | | | (5.70 | ) | | | 0.75 | |
| | | | | | | | | | | | | | | | | | | | | | | | |
Total from investment operations | | | 1.76 | | | | 0.29 | | | | 2.33 | | | | 0.48 | | | | (5.64 | ) | | | 0.86 | |
Distributions to shareholders from | | | | | | | | | | | | | | | | | | | | | | | | |
Net investment income | | | 0.00 | | | | 0.00 | | | | 0.00 | | | | 0.00 | | | | (0.22 | ) | | | 0.00 | |
Net realized gains | | | 0.00 | | | | 0.00 | | | | 0.00 | | | | 0.00 | | | | (1.14 | ) | | | (0.87 | ) |
| | | | | | | | | | | | | | | | | | | | | | | | |
Total distributions to shareholders | | | 0.00 | | | | 0.00 | | | | 0.00 | | | | 0.00 | | | | (1.36 | ) | | | (0.87 | ) |
Net asset value, end of period | | $ | 15.96 | | | $ | 14.20 | | | $ | 13.91 | | | $ | 11.58 | | | $ | 11.10 | | | $ | 18.10 | |
Total return2 | | | 12.39 | % | | | 2.08 | % | | | 20.12 | % | | | 4.32 | % | | | (33.26 | )% | | | 4.84 | % |
Ratios to average net assets (annualized) | | | | | | | | | | | | | | | | | | | | | | | | |
Gross expenses | | | 1.29 | % | | | 1.22 | % | | | 1.37 | % | | | 1.38 | % | | | 1.38 | % | | | 1.39 | % |
Net expenses | | | 1.20 | % | | | 1.19 | % | | | 1.20 | % | | | 1.20 | % | | | 1.20 | % | | | 1.20 | % |
Net investment income (loss) | | | (0.15 | )% | | | (0.30 | )% | | | (0.23 | )% | | | 0.18 | % | | | 0.41 | % | | | 0.58 | % |
Supplemental data | | | | | | | | | | | | | | | | | | | | | | | | |
Portfolio turnover rate | | | 12 | % | | | 54 | % | | | 147 | % | | | 64 | % | | | 77 | % | | | 97 | % |
Net assets, end of period (000’s omitted) | | | $7,897 | | | | $9,722 | | | | $5,774 | | | | $5,730 | | | | $6,447 | | | | $12,548 | |
| 1. | Calculated based upon average shares outstanding |
| 2. | Returns for periods of less than one year are not annualized. |
The accompanying notes are an integral part of these financial statements.
| | | | |
| 18 | | Wells Fargo Advantage Intrinsic Small Cap Value Fund | | Financial Highlights |
(For a share outstanding throughout each period)
| | | | | | | | | | | | | | | | | | | | | | | | |
| | | Six Months Ended
April 30, 2012 (Unaudited) | | | Year Ended October 31, | |
| Institutional Class | | | 2011 | | | 2010 | | | 2009 | | | 2008 | | | 2007 | |
Net asset value, beginning of period | | $ | 14.32 | | | $ | 14.00 | | | $ | 11.63 | | | $ | 11.15 | | | $ | 18.19 | | | $ | 18.16 | |
Net investment income | | | 0.03 | | | | 0.00 | 1,2 | | | 0.00 | 1,2 | | | 0.04 | 1 | | | 0.09 | 1 | | | 0.15 | 1 |
Net realized and unrealized gains (losses) on investments | | | 1.75 | | | | 0.32 | | | | 2.37 | | | | 0.47 | | | | (5.73 | ) | | | 0.75 | |
| | | | | | | | | | | | | | | | | | | | | | | | |
Total from investment operations | | | 1.78 | | | | 0.32 | | | | 2.37 | | | | 0.51 | | | | (5.64 | ) | | | 0.90 | |
Distributions to shareholders from | | | | | | | | | | | | | | | | | | | | | | | | |
Net investment income | | | 0.00 | | | | 0.00 | | | | 0.00 | | | | 0.00 | | | | (0.26 | ) | | | 0.00 | |
Net realized gains | | | 0.00 | | | | 0.00 | | | | 0.00 | | | | 0.00 | | | | (1.14 | ) | | | (0.87 | ) |
Tax basis return of capital | | | 0.00 | | | | 0.00 | | | | 0.00 | | | | (0.03 | ) | | | 0.00 | | | | 0.00 | |
| | | | | | | | | | | | | | | | | | | | | | | | |
Total distributions to shareholders | | | 0.00 | | | | 0.00 | | | | 0.00 | | | | (0.03 | ) | | | (1.40 | ) | | | (0.87 | ) |
Net asset value, end of period | | $ | 16.10 | | | $ | 14.32 | | | $ | 14.00 | | | $ | 11.63 | | | $ | 11.15 | | | $ | 18.19 | |
Total return3 | | | 12.43 | % | | | 2.29 | % | | | 20.38 | % | | | 4.61 | % | | | (33.17 | )% | | | 5.05 | % |
Ratios to average net assets (annualized) | | | | | | | | | | | | | | | | | | | | | | | | |
Gross expenses | | | 1.04 | % | | | 1.01 | % | | | 1.10 | % | | | 1.11 | % | | | 1.11 | % | | | 1.12 | % |
Net expenses | | | 1.00 | % | | | 0.98 | % | | | 1.00 | % | | | 1.00 | % | | | 1.00 | % | | | 1.00 | % |
Net investment income (loss) | | | 0.04 | % | | | 0.02 | % | | | (0.03 | )% | | | 0.36 | % | | | 0.60 | % | | | 0.84 | % |
Supplemental data | | | | | | | | | | | | | | | | | | | | | | | | |
Portfolio turnover rate | | | 12 | % | | | 54 | % | | | 147 | % | | | 64 | % | | | 77 | % | | | 97 | % |
Net assets, end of period (000’s omitted) | | | $44,782 | | | | $41,861 | | | | $72,200 | | | | $65,014 | | | | $64,444 | | | | $114,345 | |
| 1. | Calculated based upon average shares outstanding |
| 2. | Amount is less than $0.005. |
| 3. | Returns for periods of less than one year are not annualized. |
The accompanying notes are an integral part of these financial statements.
| | | | | | |
| Financial Highlights | | Wells Fargo Advantage Intrinsic Small Cap Value Fund | | | 19 | |
(For a share outstanding throughout each period)
| | | | | | | | | | | | | | | | | | | | | | | | |
| | | Six Months Ended
April 30, 2012 (Unaudited) | | | Year Ended October 31, | |
| Investor Class | | | 2011 | | | 2010 | | | 2009 | | | 2008 | | | 2007 | |
Net asset value, beginning of period | | $ | 13.94 | | | $ | 13.70 | | | $ | 11.43 | | | $ | 10.99 | | | $ | 17.92 | | | $ | 18.00 | |
Net investment income (loss) | | | (0.03 | )1 | | | (0.07 | )1 | | | (0.06 | )1 | | | (0.01 | )1 | | | 0.02 | 1 | | | 0.05 | 1 |
Net realized and unrealized gains (losses) on investments | | | 1.72 | | | | 0.31 | | | | 2.33 | | | | 0.45 | | | | (5.65 | ) | | | 0.74 | |
| | | | | | | | | | | | | | | | | | | | | | | | |
Total from investment operations | | | 1.69 | | | | 0.24 | | | | 2.27 | | | | 0.44 | | | | (5.63 | ) | | | 0.79 | |
Distributions to shareholders from | | | | | | | | | | | | | | | | | | | | | | | | |
Net investment income | | | 0.00 | | | | 0.00 | | | | 0.00 | | | | 0.00 | | | | (0.16 | ) | | | 0.00 | |
Net realized gains | | | 0.00 | | | | 0.00 | | | | 0.00 | | | | 0.00 | | | | (1.14 | ) | | | (0.87 | ) |
| | | | | | | | | | | | | | | | | | | | | | | | |
Total distributions to shareholders | | | 0.00 | | | | 0.00 | | | | 0.00 | | | | 0.00 | | | | (1.30 | ) | | | (0.87 | ) |
Net asset value, end of period | | $ | 15.63 | | | $ | 13.94 | | | $ | 13.70 | | | $ | 11.43 | | | $ | 10.99 | | | $ | 17.92 | |
Total return2 | | | 12.12 | % | | | 1.75 | % | | | 19.86 | % | | | 4.00 | % | | | (33.46 | )% | | | 4.46 | % |
Ratios to average net assets (annualized) | | | | | | | | | | | | | | | | | | | | | | | | |
Gross expenses | | | 1.53 | % | | | 1.50 | % | | | 1.63 | % | | | 1.67 | % | | | 1.70 | % | | | 1.74 | % |
Net expenses | | | 1.49 | % | | | 1.48 | % | | | 1.49 | % | | | 1.49 | % | | | 1.49 | % | | | 1.53 | % |
Net investment income (loss) | | | (0.45 | )% | | | (0.48 | )% | | | (0.47 | )% | | | (0.12 | )% | | | 0.11 | % | | | 0.26 | % |
Supplemental data | | | | | | | | | | | | | | | | | | | | | | | | |
Portfolio turnover rate | | | 12 | % | | | 54 | % | | | 147 | % | | | 64 | % | | | 77 | % | | | 97 | % |
Net assets, end of period (000’s omitted) | | | $51,444 | | | | $51,927 | | | | $79,132 | | | | $180,060 | | | | $213,243 | | | | $384,047 | |
| 1. | Calculated based upon average shares outstanding |
| 2. | Returns for periods of less than one year are not annualized. |
The accompanying notes are an integral part of these financial statements.
| | | | |
| 20 | | Wells Fargo Advantage Intrinsic Small Cap Value Fund | | Notes to Financial Statements (Unaudited) |
1. ORGANIZATION
Wells Fargo Funds Trust (the “Trust”), a Delaware statutory trust organized on March 10, 1999, is an open-end management investment company registered under the Investment Company Act of 1940, as amended (the “1940 Act”). These financial statements report on Wells Fargo Advantage Intrinsic Small Cap Value Fund (the “Fund”) which is a diversified series of the Trust.
2. SIGNIFICANT ACCOUNTING POLICIES
The following significant accounting policies, which are consistently followed in the preparation of the financial statements of the Fund, are in conformity with U.S. generally accepted accounting principles which require management to make estimates and assumptions that affect the reported amounts of assets and liabilities, disclosure of contingent assets and liabilities at the date of the financial statements, and the reported amounts of revenues and expenses during the reporting period. Actual results could differ from those estimates.
Securities valuation
Investments in equity securities are valued each business day as of the close of regular trading on the New York Stock Exchange, which is usually 4:00 p.m. (Eastern Time). Securities which are traded on a national or foreign securities exchange are valued at the last reported sales price, except that securities listed on The Nasdaq Stock Market, Inc. (“Nasdaq”) are valued at the Nasdaq Official Closing Price (“NOCP”), and if no NOCP is available, then at the last reported sales price. If no sales price is shown on the Nasdaq, the bid price will be used. In the absence of any sale of securities listed on the Nasdaq, and in the case of other securities (including U.S. Government obligations, but excluding debt securities maturing in 60 days or less), the price will be deemed “stale” and the valuations will be determined in accordance with the Fund’s Fair Value Procedures.
Investments in open-end mutual funds and non-registered investment companies are generally valued at net asset value.
Investments which are not valued using any of the methods discussed above, are valued at their fair value, as determined by procedures established in good faith and approved by the Board of Trustees. The Board of Trustees has established a Valuation Committee comprised of the Trustees and has delegated to it the authority to take any actions regarding the valuation of portfolio securities that the Valuation Committee deems necessary in determining the fair value of portfolio securities, unless the responsibility has been delegated to the Management Valuation Team of Wells Fargo Funds Management, LLC (“Funds Management”). The Board of Trustees retains the authority to make or ratify any valuation decisions or approve any changes to the Fair Value Procedures as it deems appropriate. On a quarterly basis, the Board of Trustees considers for ratification any valuation actions taken by the Valuation Committee or the Management Valuation Team.
Valuations of fair valued prices are compared to the next actual sales price when available, or other appropriate market information to assess the continued appropriateness of the fair valuation methodology used. The securities are fair valued on a day-to-day basis, taking into consideration changes to appropriate market information and any significant changes to the input factors considered in the valuation process until there is a readily available price provided on the exchange or by an independent pricing service. Valuations received from an independent pricing service or broker quotes are periodically validated by comparisons to most recent trades and valuations provided by other independent pricing services in addition to the review of prices by the adviser and/or sub-adviser. Unobservable inputs used in determining fair valuations are identified based on the type of security, taking into consideration factors utilized by market participants in valuing the investment, knowledge about the issuer and the current market environment.
Security loans
The Fund may lend its securities from time to time in order to earn additional income in the form of fees or interest on securities received as collateral or the investment of any cash received as collateral. The Fund continues to receive interest or dividends on the securities loaned. The Fund receives collateral in the form of cash or securities with a value at least equal to the value of the securities on loan. The value of the loaned securities is determined at the close of each business day and any additional required collateral is delivered to the Fund on the next business day. In a securities lending transaction, the net asset value of the Fund will be affected by an increase or decrease in the value of the securities loaned and by an increase or decrease in the value of the instrument in which collateral is invested. The amount of securities lending activity undertaken by the Fund fluctuates from time to time. In the event of default or bankruptcy by the borrower, the Fund may be prevented from recovering the loaned securities or gaining access to the collateral or
| | | | | | |
| Notes to Financial Statements (Unaudited) | | Wells Fargo Advantage Intrinsic Small Cap Value Fund | | | 21 | |
may experience delays or costs in doing so. In addition, the investment of any cash collateral received may lose all or part of its value. The Fund has the right under the lending agreement to recover the securities from the borrower on demand.
The Fund lends its securities through an unaffiliated securities lending agent. Cash collateral received in connection with its securities lending transactions is invested in Wells Fargo Securities Lending Cash Investments, LLC (the “Cash Collateral Fund”). The Cash Collateral Fund is exempt from registration under Section 3(c)(7) of the 1940 Act and is managed by Funds Management and is sub-advised by Wells Capital Management Incorporated (“Wells Capital Management”). Funds Management receives an advisory fee starting at 0.05% and declining to 0.01% as the average daily net assets of the Cash Collateral Fund increase. All of the fees received by Funds Management are paid to Wells Capital Management for its services as sub-adviser. The Cash Collateral Fund seeks to provide a positive return compared to the daily Fed Funds Open rate by investing in high-quality, U.S. dollar-denominated short-term money market instruments. Cash Collateral Fund investments are fair valued based upon the amortized cost valuation technique. Income earned from investment in the Cash Collateral Fund is included in securities lending income on the Statement of Operations.
For Wells Fargo Advantage Funds that participated in securities lending activity prior to February 13, 2009, certain structured investment vehicles purchased in a joint account by the former securities lending agent defaulted or were impaired. Certain of the Wells Fargo Advantage Funds still hold ownership interest in these structured investment vehicles, which have since been restructured as pass-through securities. If the Fund holds an ownership interest in such pass-through securities, information regarding this ownership interest can be found in the Portfolio of Investments under the category “Other”.
Security transactions and income recognition
Securities transactions are recorded on a trade date basis. Realized gains or losses are reported on the basis of identified cost of securities delivered.
Dividend income is recognized on the ex-dividend date.
Distributions to shareholders
Distributions to shareholders from net investment income and net realized gains, if any, are recorded on the ex-dividend date. Such distributions are determined in conformity with income tax regulations, which may differ from generally accepted accounting principles.
Federal and other taxes
The Fund intends to continue to qualify as a regulated investment company by distributing substantially all of its investment company taxable income and any net realized capital gains (after reduction for capital loss carryforwards) sufficient to relieve it from all, or substantially all, federal income taxes. Accordingly, no provision for federal income taxes was required.
The Fund’s income and federal excise tax returns and all financial records supporting those returns for the prior three fiscal years are subject to examination by the federal and Delaware revenue authorities. Management has analyzed the Fund’s tax positions taken on federal, state, and foreign tax returns for all open tax years and does not believe that there are any uncertain tax positions that require recognition of a tax liability.
Under the recently enacted Regulated Investment Company Modernization Act of 2010, the Fund is permitted to carry forward capital losses incurred in taxable years which began after December 22, 2010 for an unlimited period. However, any losses incurred are required to be utilized prior to the losses incurred in pre-enactment taxable years. As a result of this ordering rule, pre-enactment capital loss carryforwards may be more likely to expire unused. Post-enactment capital losses that are carried forward will retain their character as either short-term or long-term capital losses rather than be considered all short-term as under previous law. In addition, the Fund may elect to defer any portion of a post-October capital loss or qualified late-year ordinary loss to the first day of the following taxable year. A post-October capital loss is the greatest of the net capital loss, net short-term capital loss or net long-term capital loss for the portion of the taxable year after October 31. A qualified late-year ordinary loss is the net loss comprised of (a) net gain or loss from the sale or other disposition of capital assets for the portion of the taxable year after October 31, and (b) other ordinary income or loss for the portion of the taxable year after December 31.
| | | | |
| 22 | | Wells Fargo Advantage Intrinsic Small Cap Value Fund | | Notes to Financial Statements (Unaudited) |
As of October 31, 2011, the Fund had net capital loss carryforwards, which were available to offset future net realized capital gains, in the amount of $88,308,471, with $712,239 expiring in 2016, $79,906,522 expiring in 2017 and $7,689,710 expiring in 2018.
Class allocations
The separate classes of shares offered by the Fund differ principally in applicable sales charges, distribution, shareholder servicing and administration fees. Shareholders of each class bear certain expenses that pertain to that particular class. All shareholders bear the common expenses of the Fund, earn income from the portfolio, and are allocated unrealized gains and losses pro rata based on the average daily net assets of each class, without distinction between share classes. Dividends are determined separately for each class based on income and expenses allocable to each class. Realized gains and losses are allocated to each class pro rata based upon the net assets of each class on the date realized. Differences in per share dividend rates generally result from the relative weightings of pro rata income and realized gain allocations and from differences in separate class expenses, including distribution, shareholder servicing and administration fees.
3. FAIR VALUATION MEASUREMENTS
Fair value measurements of investments are determined within a framework that has established a fair value hierarchy based upon the various data inputs utilized in determining the value of the Fund’s investments. The three-level hierarchy gives the highest priority to unadjusted quoted prices in active markets for identical assets or liabilities (Level 1) and the lowest priority to significant unobservable inputs (Level 3). The Fund’s investments are classified within the fair value hierarchy based on the lowest level of input that is significant to the fair value measurement. The inputs are summarized into three broad levels as follows:
| n | | Level 1 – quoted prices in active markets for identical securities |
| n | | Level 2 – other significant observable inputs (including quoted prices for similar securities, interest rates, prepayment speeds, credit risk, etc.) |
| n | | Level 3 – significant unobservable inputs (including the Fund’s own assumptions in determining the fair value of investments) |
The inputs or methodologies used for valuing securities are not necessarily an indication of the risk associated with investing in those securities.
As of April 30, 2012, the inputs used in valuing the Fund’s assets, which are carried at fair value, were as follows:
| | | | | | | | | | | | | | | | |
| Investments in Securities | | Quoted Prices (Level 1) | | | Significant Other
Observable Inputs (Level 2) | | | Significant Unobservable Inputs (Level 3) | | | Total | |
Equity securities | | | | | | | | | | | | | | | | |
Common stocks | | $ | 96,525,162 | | | $ | 0 | | | $ | 0 | | | $ | 96,525,162 | |
Other | | | 0 | | | | 0 | | | | 594,802 | | | | 594,802 | |
Short-term investments | | | | | | | | | | | | | | | | |
Investment companies | | | 7,799,407 | | | | 34,296,791 | | | | 0 | | | | 42,096,198 | |
| | | $ | 104,324,569 | | | $ | 34,296,791 | | | $ | 594,802 | | | $ | 139,216,162 | |
Further details on the major security types listed above can be found in the Portfolio of Investments.
Transfers in and transfers out are recognized at the end of the reporting period. For the six months ended April 30, 2012, the Fund did not have any significant transfers into/out of Level 1 and Level 2.
4. TRANSACTIONS WITH AFFILIATES AND OTHER EXPENSES
Advisory fee
The Trust has entered into an advisory contract with Funds Management, an indirect wholly owned subsidiary of Wells Fargo & Company (“Wells Fargo”). The adviser is responsible for implementing investment policies and guidelines and for supervising the sub-adviser, who is responsible for day-to-day portfolio management of the Fund.
| | | | | | |
| Notes to Financial Statements (Unaudited) | | Wells Fargo Advantage Intrinsic Small Cap Value Fund | | | 23 | |
Pursuant to the contract, Funds Management is entitled to receive an annual advisory fee starting at 0.80% and declining to 0.70% as the average daily net assets of the Fund increase. For the six months ended April 30, 2012, the advisory fee was equivalent to an annual rate of 0.80% of the Fund’s average daily net assets.
Funds Management has retained the services of certain sub-advisers to provide daily portfolio management to the Fund. The fees related to sub-advisory services are borne directly by Funds Management and do not increase the overall fees paid by the Fund. Metropolitan West Capital Management LLC, an affiliate of Funds Management, is the sub-adviser to the Fund and is entitled to receive a fee from Funds Management at an annual rate starting at 0.55% and declining to 0.40% as the average daily net assets of the Fund increase.
Administration and transfer agent fees
The Trust has entered into an administration agreement with Funds Management. Under this agreement, for providing administrative services, which includes paying fees and expenses for services provided by the transfer agent, sub-transfer agents, omnibus account servicers and record-keepers, Funds Management is entitled to receive from the Fund an annual fund level administration fee starting at 0.05% and declining to 0.03% as the average daily net assets of the Fund increase and a class level administration fee which is calculated based on the average daily net assets of each class as follows:
| | | | |
| | | Class Level Administration Fee | |
Class A, Class C | | | 0.26 | % |
Administrator Class | | | 0.10 | |
Institutional Class | | | 0.08 | |
Investor Class | | | 0.33 | |
Funds Management has contractually waived and/or reimbursed advisory and administration fees to the extent necessary to maintain certain net operating expense ratios for the Fund. Waiver of fees and/or reimbursement of expenses by Funds Management were made first from fund level expenses on a proportionate basis and then from class specific expenses. Funds Management has committed through February 28, 2013 to waive fees and/or reimburse expenses to the extent necessary to cap the Fund’s expenses at 1.45% for Class A, 2.20% for Class C, 1.20% for Administrator Class, 1.00% for Institutional Class and 1.49% for Investor Class.
Distribution fees
The Trust has adopted a Distribution Plan for Class C shares of the Fund pursuant to Rule 12b-1 under the 1940 Act. Distribution fees are charged to Class C shares and paid to Wells Fargo Funds Distributor, LLC, the principal underwriter, at an annual rate of 0.75% of the average daily net assets of Class C shares.
For the six months ended April 30, 2012, Wells Fargo Funds Distributor, LLC received $591 from the sale of Class A shares.
Shareholder servicing fees
The Trust has entered into contracts with one or more shareholder servicing agents, whereby Class A, Class C, Administrator Class and Investor Class of the Fund is charged a fee at an annual rate of 0.25% of the average daily net assets of each respective class.
A portion of these total shareholder servicing fees were paid to affiliates of Wells Fargo.
5. INVESTMENT PORTFOLIO TRANSACTIONS
Purchases and sales of investments, excluding U.S. Government obligations (if any) and short-term securities, for the six months ended April 30, 2012 were $11,612,689 and $29,597,456, respectively.
6. BANK BORROWINGS
The Trust (excluding the money market funds) and Wells Fargo Variable Trust are parties to a $150,000,000 revolving credit agreement with State Street Bank and Trust Company, whereby the Fund is permitted to use bank borrowings for temporary or emergency purposes, such as to fund shareholder redemption requests. Interest under the credit agreement is charged to the Fund based on a borrowing rate equal to the higher of the Federal Funds rate in effect on
| | | | |
| 24 | | Wells Fargo Advantage Intrinsic Small Cap Value Fund | | Notes to Financial Statements (Unaudited) |
that day plus 1.25% or the overnight LIBOR rate in effect on that day plus 1.25%. In addition, an annual commitment fee equal to 0.10% of the unused balance is allocated to each participating fund. For the six months ended April 30, 2012, the Fund paid $120 in commitment fees.
For the six months ended April 30, 2012, there were no borrowings by the Fund under the agreement.
7. INDEMNIFICATION
Under the Trust’s organizational documents, the officers and directors are indemnified against certain liabilities that may arise out of performance of their duties to the Trust. Additionally, in the normal course of business, the Trust may enter into contracts with service providers that contain a variety of indemnification clauses. The Trust’s maximum exposure under these arrangements is dependent on future claims that may be made against the Fund and, therefore, cannot be estimated.
8. NEW ACCOUNTING PRONOUNCEMENTS
In December 2011, the Financial Accounting Standards Board (“FASB”) issued Accounting Standard Update (“ASU”) No. 2011-11, Disclosures about Offsetting Assets and Liabilities. ASU 2011-11, which amends FASB ASC Topic 210, Balance Sheet, creates new disclosure requirements which require entities to disclose both gross and net information for derivatives and other financial instruments that are either offset in the Statement of Assets and Liabilities or subject to an enforceable master netting arrangement or similar agreement. The disclosure requirements are effective for interim and annual reporting periods beginning on or after January 1, 2013. Management is currently assessing the potential impact, in addition to expanded financial statement disclosure, that may result from adopting this ASU.
In May 2011, FASB issued ASU No. 2011-04 Amendments to Achieve Common Fair Value Measurement and Disclosure Requirements in U.S. GAAP and IFRSs. ASU No. 2011-04 amends FASB ASC Topic 820, Fair Value Measurements, to establish common requirements for measuring fair value and for disclosing information about fair value measurements in accordance with GAAP. The ASU is effective prospectively for interim and annual periods beginning after December 15, 2011. Management expects that adoption of the ASU will result in additional disclosures in the financial statements, as applicable.
In April 2011, FASB issued ASU No. 2011-03 Reconsideration of Effective Control for Repurchase Agreements. ASU No. 2011-03 amends FASB ASC Topic 860, Transfers and Servicing, specifically the criteria required to determine whether a repurchase agreement (repo) and similar agreements should be accounted for as sales of financial assets or secured borrowings with commitments. ASU No. 2011-03 changes the assessment of effective control by focusing on the transferor’s contractual rights and obligations and removing the criterion to assess its ability to exercise those rights or honor those obligations. This could result in changes to the way entities account for certain transactions including repurchase agreements, mortgage dollar rolls and reverse repurchase agreements. The ASU will become effective on a prospective basis for new transfers and modifications to existing transactions as of the beginning of the first interim or annual period beginning on or after December 15, 2011. Management has evaluated the impact of adopting the ASU and expects no significant changes.
| | | | | | |
| Other Information (Unaudited) | | Wells Fargo Advantage Intrinsic Small Cap Value Fund | | | 25 | |
PROXY VOTING INFORMATION
A description of the policies and procedures that the Fund uses to determine how to vote proxies relating to portfolio securities is available without charge, upon request, by calling 1-800-222-8222, visiting our Web site at wellsfargoadvantagefunds.com, or visiting the SEC Web site at sec.gov. Information regarding how the Fund voted proxies relating to portfolio securities during the most recent 12-month period ended June 30 is available without charge on the Fund’s Web site at wellsfargoadvantagefunds.com or by visiting the SEC Web site at sec.gov.
PORTFOLIO HOLDINGS INFORMATION
The complete portfolio holdings for the Fund are publicly available on the Fund’s Web site (wellsfargoadvantagefunds.com) on a monthly, 30-day or more delayed basis. In addition, top ten holdings information for the Fund is publicly available on the Fund’s Web site on a monthly, seven-day or more delayed basis. The Fund files its complete schedule of portfolio holdings with the SEC for the first and third quarters of each fiscal year on Form N-Q, which is available without charge by visiting the SEC Web site at sec.gov. In addition, the Fund’s Form N-Q may be reviewed and copied at the SEC’s Public Reference Room in Washington, DC, and at regional offices in New York City, at 233 Broadway, and in Chicago, at 175 West Jackson Boulevard, Suite 900. Information about the Public Reference Room may be obtained by calling 1-800-SEC-0330.
| | | | |
| 26 | | Wells Fargo Advantage Intrinsic Small Cap Value Fund | | Other Information (Unaudited) |
BOARD OF TRUSTEES
The following table provides basic information about the Board of Trustees (the “Trustees”) of the Trust and Officers of the Trust. This table should be read in conjunction with the Prospectus and the Statement of Additional Information1 of the Fund. Each of the Trustees and Officers listed below acts in identical capacities for the Wells Fargo Advantage family of funds, which consists of 137 funds comprising the Wells Fargo Funds Trust, Wells Fargo Variable Trust, Wells Fargo Master Trust and four closed-end funds (collectively the “Fund Complex”). All of the Trustees are also Members of the Audit and Governance Committees of each Trust in the Fund Complex. The mailing address of each Trustee and Officer is 525 Market Street, 12th Floor, San Francisco, CA 94105. Each Trustee and Officer serves an indefinite term, however, each Trustee serves such term until reaching the mandatory retirement age established by the Trustees.
Independent Trustees
| | | | | | |
Name and Year of Birth | | Position Held and Length of Service | | Principal Occupations During Past Five Years | | Other Directorships During
Past Five Years |
Peter G. Gordon
(Born 1942) | | Trustee, since 1998; Chairman, since 2005 (Lead Trustee since 2001) | | Co-Founder, Retired Chairman, President and CEO of Crystal Geyser Water Company. Trustee Emeritus, Colby College | | Asset Allocation Trust |
Isaiah Harris, Jr.
(Born 1952) | | Trustee, since 2009 | | Retired. Prior thereto, President and CEO of BellSouth Advertising and Publishing Corp. from 2005 to 2007, President and CEO of BellSouth Enterprises from 2004 to 2005 and President of BellSouth Consumer Services from 2000 to 2003. Emeritus member of the Iowa State University Foundation Board of Governors. Emeritus Member of the Advisory Board of Iowa State University School of Business. Mr. Harris is a certified public accountant. | | CIGNA Corporation; Deluxe Corporation; Asset Allocation Trust |
Judith M. Johnson
(Born 1949) | | Trustee, since 2008 | | Retired. Prior thereto, Chief Executive Officer and Chief Investment Officer of Minneapolis Employees Retirement Fund from 1996 to 2008. Ms. Johnson is an attorney, certified public accountant and a certified managerial accountant. | | Asset Allocation Trust |
Leroy Keith, Jr.
(Born 1939) | | Trustee, since 2010 | | Chairman, Bloc Global Services (development and construction). Trustee of the Evergreen Funds from 1983 to 2010. Former Managing Director, Almanac Capital Management (commodities firm), former Partner, Stonington Partners, Inc. (private equity fund), former Director, Obagi Medical Products Co. and former Director, Lincoln Educational Services. | | Trustee, Virtus Fund Complex (consisting of 40 portfolios as of 12/31/11); Asset Allocation Trust |
David F. Larcker
(Born 1950) | | Trustee, since 2009 | | James Irvin Miller Professor of Accounting at the Graduate School of Business, Stanford University, Director of Corporate Governance Research Program and Senior Faculty of The Rock Center for Corporate Governance since 2006. From 2005 to 2008, Professor of Accounting at the Graduate School of Business, Stanford University. Prior thereto, Ernst & Young Professor of Accounting at The Wharton School, University of Pennsylvania from 1985 to 2005. | | Asset Allocation Trust |
Olivia S. Mitchell
(Born 1953) | | Trustee, since 2006 | | International Foundation of Employee Benefit Plans Professor, Wharton School of the University of Pennsylvania since 1993. Director of Wharton’s Pension Research Council and Boettner Center on Pensions & Retirement Research, and Research Associate at the National Bureau of Economic Research. Previously, Cornell University Professor from 1978 to 1993. | | Asset Allocation Trust |
| | | | | | |
| Other Information (Unaudited) | | Wells Fargo Advantage Intrinsic Small Cap Value Fund | | | 27 | |
| | | | | | |
Name and Year of Birth | | Position Held and Length of Service | | Principal Occupations During Past Five Years | | Other Directorships During
Past Five Years |
Timothy J. Penny
(Born 1951) | | Trustee, since 1996 | | President and CEO of Southern Minnesota Initiative Foundation, a non-profit organization, since 2007 and Senior Fellow at the Humphrey Institute Policy Forum at the University of Minnesota since 1995. Member of the Board of Trustees of NorthStar Education Finance, Inc., a non-profit organization, since 2007. | | Asset Allocation Trust |
Michael S. Scofield
(Born 1943) | | Trustee, since 2010 | | Served on the Investment Company Institute’s Board of Governors and Executive Committee from 2008-2011 as well the Governing Council of the Independent Directors Council from 2006-2011 and the Independent Directors Council Executive Committee from 2008-2011. Chairman of the IDC from 2008-2010. Institutional Investor (Fund Directions) Trustee of Year in 2007. Trustee of the Evergreen Funds (and its predecessors) from 1984 to 2010. Chairman of the Evergreen Funds from 2000-2010. Former Trustee of the Mentor Funds. Retired Attorney, Law Offices of Michael S. Scofield and former Director and Chairman, Branded Media Corporation (multi-media branding company). | | Asset Allocation Trust |
Donald C. Willeke
(Born 1940) | | Trustee, since 1996 | | Principal of the law firm of Willeke & Daniels. General Counsel of the Minneapolis Employees Retirement Fund from 1984 until its consolidation into the Minnesota Public Employees Retirement Association on June 30, 2010. Director and Vice Chair of The Free Trust (non-profit corporation). Director of the American Chestnut Foundation (non-profit corporation). | | Asset Allocation Trust |
Officers
| | | | | | |
Name and Year of Birth | | Position Held and
Length of Service | | Principal Occupations During Past Five Years | | |
Karla M. Rabusch
(Born 1959) | | President, since 2003 | | Executive Vice President of Wells Fargo Bank, N.A. and President of Wells Fargo Funds Management, LLC since 2003. Senior Vice President and Chief Administrative Officer of Wells Fargo Funds Management, LLC from 2001 to 2003. | | |
C. David Messman
(Born 1960) | | Secretary, since 2000; Chief Legal Counsel, since 2003 | | Senior Vice President and Secretary of Wells Fargo Funds Management, LLC since 2001. Vice President and Managing Senior Counsel of Wells Fargo Bank, N.A. since 1996. | | |
Kasey Phillips
(Born 1970) | | Treasurer, since 2009 | | Senior Vice President of Wells Fargo Funds Management, LLC since 2009. Senior Vice President of Evergreen Investment Management Company, LLC from 2006 to 2010. Treasurer of the Evergreen Funds from 2005 to 2010. | | |
David Berardi
(Born 1975) | | Assistant Treasurer, since 2009 | | Vice President of Wells Fargo Funds Management, LLC since 2009. Vice President of Evergreen Investment Management Company, LLC from 2008 to 2010. Assistant Vice President of Evergreen Investment Services, Inc. from 2004 to 2008. Manager of Fund Reporting and Control for Evergreen Investment Management Company, LLC from 2004 to 2010. | | |
Jeremy DePalma
(Born 1974) | | Assistant Treasurer, since 2009 | | Senior Vice President of Wells Fargo Funds Management, LLC since 2009. Senior Vice President of Evergreen Investment Management Company, LLC from 2008 to 2010. Vice President, Evergreen Investment Services, Inc. from 2004 to 2007. Head of the Fund Reporting and Control Team within Fund Administration from 2005 to 2010. | | |
Debra Ann Early
(Born 1964) | | Chief Compliance Officer, since 2007 | | Chief Compliance Officer of Wells Fargo Funds Management, LLC since 2007. Chief Compliance Officer of Parnassus Investments from 2005 to 2007. Chief Financial Officer of Parnassus Investments from 2004 to 2007 and Senior Audit Manager of PricewaterhouseCoopers LLP from 1998 to 2004. | | |
| 1. | The Statement of Additional Information includes additional information about the Trustees and is available, without charge, upon request, by calling 1-800-222-8222 or by visiting the Web site at wellsfargoadvantagefunds.com. |
| | | | |
| 28 | | Wells Fargo Advantage Intrinsic Small Cap Value Fund | | Other Information (Unaudited) |
BOARD CONSIDERATION OF INVESTMENT ADVISORY AND SUB-ADVISORY AGREEMENTS:
Under Section 15 of the Investment Company Act of 1940 (the “1940 Act”), the Board of Trustees (the “Board”) of Wells Fargo Funds Trust (the “Trust”), all the members of which have no direct or indirect interest in the investment advisory and sub-advisory agreements and are not “interested persons” of the Trust, as defined in the 1940 Act (the “Independent Trustees”), must determine whether to approve the continuation of the Trust’s investment advisory and sub-advisory agreements. In this regard, at an in person meeting held on March 29-30, 2012 (the “Meeting”), the Board reviewed and re-approved: (i) an investment advisory agreement with Wells Fargo Funds Management, LLC (“Funds Management”) for Wells Fargo Advantage Intrinsic Small Cap Value Fund (the “Fund”) and (ii) an investment sub-advisory agreement with Metropolitan West Capital Management, LLC (“MetWest”) for the Fund. The investment advisory agreement with Funds Management and the investment sub-advisory agreement with MetWest are collectively referred to as the “Advisory Agreements.”
At the Meeting, the Board considered the factors and reached the conclusions described below relating to the selection of Funds Management and MetWest and the continuation of the Advisory Agreements. Prior to the Meeting, the Trustees conferred extensively among themselves and with representatives of Funds Management about these matters. The Board also met throughout the year and received information that was useful to them in considering the continuation of the Advisory Agreements. The Independent Trustees were assisted in their evaluation of the Advisory Agreements by independent legal counsel, from whom they received separate legal advice and with whom they met separately from Funds Management.
In providing information to the Board, Funds Management and MetWest were guided by a detailed set of requests submitted by the Independent Trustees’ independent legal counsel on their behalf at the start of the Board’s annual contract renewal process earlier in 2012. In approving the Advisory Agreements, the Board did not identify any particular information or consideration that was all-important or controlling, and each Trustee likely attributed different weights to various factors.
Nature, extent and quality of services
The Board received and considered various information regarding the nature, extent and quality of services provided to the Fund by Funds Management and MetWest under the Advisory Agreements. The Board also received and considered, among other things, information about the background and experience of senior management of Funds Management, and the qualifications, backgrounds, tenures and responsibilities of the portfolio managers primarily responsible for the day-to-day portfolio management of the Fund.
The Board evaluated the ability of Funds Management and MetWest, based on their respective financial condition, resources, reputation and other attributes, to attract and retain qualified investment professionals, including research, advisory, and supervisory personnel. The Board further considered the compliance programs and compliance records of Funds Management and MetWest. In addition, the Board took into account the administrative services provided to the Fund by Funds Management and its affiliates.
The Board’s decision to approve the continuation of the Advisory Agreements was based on a comprehensive evaluation of all of the information provided to it. In considering these matters, the Board considered not only the specific information presented in connection with the Meeting, but also the knowledge gained over time through interaction with Funds Management and MetWest about various topics, including Funds Management’s oversight of service providers. The above factors, together with those referenced below, are some of the most important, but not necessarily all, factors considered by the Board in concluding that the nature, extent and quality of the investment advisory services provided to the Fund by Funds Management and MetWest supported the re-approval of the Advisory Agreements. Although the Board considered the continuation of the Advisory Agreements for the Fund as part of the larger process of considering the continuation of the advisory agreements for all of the funds in the complex, its decision to continue the Advisory Agreements for the Fund was ultimately made on a fund-by-fund basis.
Fund performance and expenses
The Board considered the performance results for the Fund over various time periods ended December 31, 2011. The Board also considered these results in comparison to the median performance of a universe of relevant funds (the “Universe”) that was determined by Lipper Inc. (“Lipper”) to be similar to the Fund, and in comparison to the Fund’s benchmark index and to other comparative data. Lipper is an independent provider of investment company data. The
| | | | | | |
| Other Information (Unaudited) | | Wells Fargo Advantage Intrinsic Small Cap Value Fund | | | 29 | |
Board received a description of the methodology used by Lipper to select the mutual funds in the Universe. The Board noted that the performance of the Fund was lower than the median performance of the Universe for all periods under review. The Board also noted that the performance of the Fund was lower than its benchmark, the Lipper Small-Cap Value Funds Index, for the periods under review.
The Board noted that the Fund’s performance results warranted further discussion. As part of its further review, the Board received an analysis of, and discussed factors contributing to, the underperformance of the Fund relative to the Universe. The Board received a report that noted that the Fund recently underwent a portfolio management change and since the new portfolio manager took over, the Fund outperformed the Russell 2000 Value Index in four out of six quarters. The Board was satisfied that Funds Management was taking appropriate actions with respect to the Fund’s investment performance.
The Board received and considered information regarding the Fund’s contractual advisory fee and net operating expense ratios and their various components, including actual management fees (which reflect fee waivers, if any), transfer agent, custodian and other non-management fees, Rule 12b-1 and non-Rule 12b-1 fees, service fees and fee waiver and expense reimbursement arrangements. The Board also considered these ratios in comparison to the median ratios of an expense Universe and a narrower expense group of mutual funds (each, an “Expense Group”) that was determined by Lipper to be similar to the Fund. The Board received a description of the methodology used by Lipper to select the mutual funds in the Fund’s Expense Group. The Board noted that the net operating expense ratios of the Fund were lower than or in range of the Fund’s Expense Group’s median net operating expense ratios.
Based on the above-referenced considerations and other factors, the Board concluded that the overall performance and expense structure of the Fund supported the re-approval of the Advisory Agreements for the Fund.
Investment advisory and sub-advisory fee rates
The Board reviewed and considered the contractual investment advisory fee rate that is payable by the Fund to Funds Management for investment advisory services (the “Advisory Agreement Rate”), both on a stand-alone basis and on a combined basis with the Fund’s administration fee rate. The Board took into account the separate administrative and other services covered by the administration fee rate. The Board also reviewed and considered the contractual investment sub-advisory fee rate that is payable by Funds Management to MetWest for investment sub-advisory services (the “Sub-Advisory Agreement Rate”). In addition, the Board reviewed and considered the existing fee waiver/cap arrangements applicable to the Advisory Agreement Rate and considered the Advisory Agreement Rate after taking the waivers/caps into account (the “Net Advisory Rate”).
The Board received and considered information comparing the Advisory Agreement Rate and Net Advisory Rate with those of other funds in the Fund’s Expense Group median. The Board noted that the Advisory Agreement Rate and Net Advisory Rate for the Fund were higher than the median rate for the Fund’s Expense Group, except for Class A and Investor Class. The Board noted that Funds Management had agreed to continue contractual fee cap arrangements for the Fund designed to lower the Fund’s expenses.
The Board also received and considered information about the nature and extent of services offered and fee rates charged by Funds Management and MetWest to other types of clients. In this regard, the Board received information about differences between the services, and the compliance, reporting, and other legal burdens and risks of providing investment advice to mutual funds and those associated with providing advice to non-mutual fund clients such as collective funds or institutional separate accounts.
The Board determined that the Advisory Agreement Rate for the Fund, both with and without an administration fee rate and before and after waivers, was reasonable in light of the Fund’s Expense Group information, the net expense ratio commitments, the services covered by the Advisory Agreements and other information provided. The Board also reviewed and considered the Sub-Advisory Agreement Rate and concluded that the Sub-Advisory Agreement Rate was reasonable in light of the services covered by the sub-advisory agreement and other information provided.
Profitability
The Board received and considered a profitability analysis of Funds Management, as well as an analysis of the profitability to the collective Wells Fargo businesses that provide services to the Fund. It considered that the information provided to it was necessarily estimated, and that the profitability information provided to it, especially on a fund-by-fund basis, did not necessarily provide a precise tool for evaluating the appropriateness of the Fund’s Advisory Agreement Rate in
| | | | |
| 30 | | Wells Fargo Advantage Intrinsic Small Cap Value Fund | | Other Information (Unaudited) |
isolation. It noted that the levels of profitability reported on a fund-by-fund basis varied widely, depending on, among other things, the size and type of fund. The Board concluded that the profitability reported by Funds Management was not unreasonable.
The Board did not consider separate profitability information with respect to MetWest, because, as an affiliate of Funds Management, its profitability information was subsumed in the collective Wells Fargo profitability analysis provided by Funds Management.
Economies of scale
With respect to possible economies of scale, the Board reviewed the breakpoints in the Fund’s advisory fee structure, which operate generally to reduce the effective Advisory Agreement Rate of the Fund (as a percentage of Fund assets) as the Fund grows in size. It considered that, as a fund shrinks in size, breakpoints conversely result in increasing fee levels. The Board noted that it would have on-going opportunities to review the appropriate levels of breakpoints in the future, and concluded that the breakpoints as implemented appeared to be a reasonable step toward sharing economies of scale, if any, with the Fund. However, the Board acknowledged the inherent limitations of any analysis of an investment adviser’s economies of scale and of any attempt to correlate breakpoints with such economies, stemming largely from the Board’s understanding that economies of scale are realized, if at all, by an investment adviser across a variety of products and services, not just with respect to a single fund.
Other benefits to Funds Management and MetWest
The Board received and considered information regarding potential “fall-out” or ancillary benefits received by Funds Management and its affiliates and MetWest as a result of their relationship with the Fund. Ancillary benefits could include, among others, benefits directly attributable to the relationship of Funds Management and MetWest with the Fund and benefits potentially derived from an increase in Funds Management’s and MetWest’s business as a result of their relationship with the Fund (such as the ability to market to shareholders other financial products offered by Funds Management and its affiliates or MetWest).
The Board considered that Wells Fargo Funds Distributor, LLC, an affiliate of Funds Management, serves as distributor to the Fund and receives certain compensation for those services. The Board noted that various financial institutions, including affiliates of Funds Management, may receive distribution-related fees, shareholder servicing payments (including amounts derived from payments under Rule 12b-1 plans) and sub-transfer agency fees in respect of shares sold or held through them and services provided.
The Board also reviewed information about whether and to what extent soft dollar credits are sought and how any such credits are utilized and any benefits that may be realized by using an affiliated broker.
Other factors and broader review
The Board also considered the markets for distribution of the Fund’s shares, including the channels through which the Fund’s shares are offered and sold. The Board noted that the Fund is part of one of the few fund families that have both direct-to-fund and intermediary distribution channels. As discussed above, the Board reviews detailed materials received from Funds Management and MetWest annually as part of the re-approval process under Section 15 of the 1940 Act and also reviews and assesses information about the quality of the services that the Fund receives throughout the year. In this regard, the Board has reviewed reports of Funds Management at each of its quarterly meetings, which include, among other things, portfolio reviews and performance reports. In addition, the Board confers with portfolio managers at various times throughout the year.
Conclusion
After considering the above-described factors and based on its deliberations and its evaluation of the information described above, the Board unanimously approved the continuation of the Advisory Agreements for an additional one-year period.
| | | | | | |
| List of Abbreviations | | Wells Fargo Advantage Intrinsic Small Cap Value Fund | | | 31 | |
The following is a list of common abbreviations for terms and entities which may have appeared in this report.
| ACB | — Agricultural Credit Bank |
| ADR | — American Depository Receipt |
| ADS | — American Depository Shares |
| AGC-ICC | — Assured Guaranty Corporation - Insured Custody Certificates |
| AGM | — Assured Guaranty Municipal |
| AMBAC | — American Municipal Bond Assurance Corporation |
| AMT | — Alternative Minimum Tax |
| BAN | — Bond Anticipation Notes |
| BHAC | — Berkshire Hathaway Assurance Corporation |
| CAB | — Capital Appreciation Bond |
| CCAB | — Convertible Capital Appreciation Bond |
| CDA | — Community Development Authority |
| CDO | — Collateralized Debt Obligation |
| COP | — Certificate of Participation |
| DRIVER | — Derivative Inverse Tax-Exempt Receipts |
| DW&P | — Department of Water & Power |
| DWR | — Department of Water Resources |
| ECFA | — Educational & Cultural Facilities Authority |
| EDA | — Economic Development Authority |
| EDFA | — Economic Development Finance Authority |
| ETF | — Exchange-Traded Fund |
| FFCB | — Federal Farm Credit Bank |
| FGIC | — Financial Guaranty Insurance Corporation |
| FHA | — Federal Housing Authority |
| FHLB | — Federal Home Loan Bank |
| FHLMC | — Federal Home Loan Mortgage Corporation |
| FICO | — The Financing Corporation |
| FNMA | — Federal National Mortgage Association |
| GDR | — Global Depository Receipt |
| GNMA | — Government National Mortgage Association |
| HCFR | — Healthcare Facilities Revenue |
| HEFA | — Health & Educational Facilities Authority |
| HEFAR | — Higher Education Facilities Authority Revenue |
| HFA | — Housing Finance Authority |
| HFFA | — Health Facilities Financing Authority |
| IBC | — Insured Bond Certificate |
| IDA | — Industrial Development Authority |
| IDAG | — Industrial Development Agency |
| IDR | — Industrial Development Revenue |
| KRW | — Republic of Korea Won |
| LIBOR | — London Interbank Offered Rate |
| LLC | — Limited Liability Company |
| LLP | — Limited Liability Partnership |
| MBIA | — Municipal Bond Insurance Association |
| MFHR | — Multi-Family Housing Revenue |
| MSTR | — Municipal Securities Trust Receipts |
| MUD | — Municipal Utility District |
| NATL-RE | — National Public Finance Guarantee Corporation |
| PCFA | — Pollution Control Finance Authority |
| PCR | — Pollution Control Revenue |
| PFA | — Public Finance Authority |
| PFFA | — Public Facilities Financing Authority |
| PFOTER | — Puttable Floating Option Tax-Exempt Receipts |
| plc | — Public Limited Company |
| PUTTER | — Puttable Tax-Exempt Receipts |
| R&D | — Research & Development |
| RDA | — Redevelopment Authority |
| RDFA | — Redevelopment Finance Authority |
| REIT | — Real Estate Investment Trust |
| ROC | — Reset Option Certificates |
| SAVRS | — Select Auction Variable Rate Securities |
| SBA | — Small Business Authority |
| SFHR | — Single Family Housing Revenue |
| SFMR | — Single Family Mortgage Revenue |
| SPA | — Standby Purchase Agreement |
| SPDR | — Standard & Poor’s Depositary Receipts |
| STRIPS | — Separate Trading of Registered Interest and Principal Securities |
| TAN | — Tax Anticipation Notes |
| TIPS | — Treasury Inflation-Protected Securities |
| TRAN | — Tax Revenue Anticipation Notes |
| TCR | — Transferable Custody Receipts |
| TTFA | — Transportation Trust Fund Authority |
| TVA | — Tennessee Valley Authority |
| XLCA | — XL Capital Assurance |
This page is intentionally left blank.
This page is intentionally left blank.
This page is intentionally left blank.


FOR MORE INFORMATION
More information about Wells Fargo Advantage Funds is available free upon request. To obtain literature, please write, e-mail, visit the Fund’s Web site, or call:
Wells Fargo Advantage Funds
P.O. Box 8266
Boston, MA 02266-8266
E-mail: wfaf@wellsfargo.com
Web site: wellsfargoadvantagefunds.com
Individual investors: 1-800-222-8222
Retail investment professionals: 1-888-877-9275
Institutional investment professionals: 1-866-765-0778
This report and the financial statements contained herein are submitted for the general information of the shareholders of Wells Fargo Advantage Funds. If this report is used for promotional purposes, distribution of the report must be accompanied or preceded by a current prospectus. For a prospectus containing more complete information, including charges and expenses, call 1-800-222-8222 or visit the Fund’s Web site at wellsfargoadvantagefunds.com. Please consider the investment objectives, risks, charges, and expenses of the investment carefully before investing. This and other information about Wells Fargo Advantage Funds can be found in the current prospectus. Read the prospectus carefully before you invest or send money.
Wells Fargo Funds Management, LLC, a wholly owned subsidiary of Wells Fargo & Company, provides investment advisory and administrative services for Wells Fargo Advantage Funds. Other affiliates of Wells Fargo & Company provide subadvisory and other services for the Funds. The Funds are distributed by Wells Fargo Funds Distributor, LLC, Member FINRA/SIPC, an affiliate of Wells Fargo & Company.
NOT FDIC INSURED ¡ NO BANK GUARANTEE ¡ MAY LOSE VALUE
© 2012 Wells Fargo Funds Management, LLC. All rights reserved.
| | |
 | | 209726 06-12 SA242/SAR242 4-12 |

Wells Fargo Advantage
Small Cap Opportunities Fund

Semi-Annual Report
April 30, 2012

Reduce clutter. Save trees.
Sign up for electronic delivery of prospectuses and shareholder reports at wellsfargo.com/advantagedelivery
Contents
The views expressed and any forward-looking statements are as of April 30, 2012, unless otherwise noted, and are those of the Fund managers and/or Wells Fargo Funds Management, LLC. Discussions of individual securities, or the markets generally, or any Wells Fargo Advantage Fund are not intended as individual recommendations. Future events or results may vary significantly from those expressed in any forward-looking statements; the views expressed are subject to change at any time in response to changing circumstances in the market. Wells Fargo Funds Management, LLC, disclaims any obligation to publicly update or revise any views expressed or forward-looking statements.
NOT FDIC INSURED ¡ NO BANK GUARANTEE ¡ MAY LOSE VALUE

WELLS FARGO INVESTMENT HISTORY
| | |
| |
| 1932 | | Keystone creates one of the first mutual fund families. |
| |
| 1971 | | Wells Fargo & Company introduces one of the first institutional index funds. |
| |
| 1978 | | Wells Fargo applies Markowitz and Sharpe’s research on Modern Portfolio Theory to introduce one of the industry’s first Tactical Asset Allocation (TAA) models in institutional separately managed accounts. |
| |
| 1984 | | Wells Fargo Stagecoach Funds launches its first asset allocation fund. |
| |
| 1989 | | The Tactical Asset Allocation (TAA) Model is first applied to Wells Fargo’s asset allocation mutual funds. |
| |
| 1994 | | Wells Fargo introduces the LifePath Funds, one of the first suites of target date funds (now the Wells Fargo Advantage Dow Jones Target Date FundsSM). |
| |
| 1996 | | Evergreen Investments and Keystone Funds merge. |
| |
| 1997 | | Wells Fargo launches Wells Fargo Advantage WealthBuilder PortfoliosSM, a fund-of-funds suite of products that includes the use of quantitative models to shift assets among investment styles. |
| |
| 1999 | | Norwest Advantage Funds and Stagecoach Funds are reorganized into Wells Fargo Funds after the merger of Norwest and Wells Fargo. |
| |
| 2002 | | Evergreen Retail and Evergreen Institutional companies form the umbrella asset management company, Evergreen Investments. |
| |
| 2005 | | The integration of Strong Funds with Wells Fargo Funds creates Wells Fargo Advantage Funds, resulting in one of the top 20 mutual fund companies in the United States. |
| |
| 2006 | | Wells Fargo Advantage Funds relaunches the target date product line as Wells Fargo Advantage Dow Jones Target Date Funds. |
| |
| 2010 | | The mergers and reorganizations of Evergreen and Wells Fargo Advantage mutual funds are completed, unifying the families under the brand of Wells Fargo Advantage Funds. |
Wells Fargo Advantage Funds®
Wells Fargo Advantage Funds skillfully guides institutions, financial advisors, and individuals through the investment terrain to help them reach their financial objectives. Everything we do on behalf of investors is backed by our unique combination of qualifications.
Strength
Our organization is built on the standards of integrity and service established by our parent company—Wells Fargo & Company—more than 150 years ago. And, because we’re part of a highly diversified financial enterprise, we offer the depth of resources to help investors succeed.
Expertise
Our multi-boutique model offers investors access to the independent thinking of premier investment managers that have been chosen for their time-tested strategies. While each team specializes in a specific investment strategy, collectively they provide investors a wide choice of distinct investment styles. Our dedication to investment excellence doesn’t end with our expertise in manager selection—risk management, analysis, and rigorous ongoing review seek to ensure each manager’s investment process remains consistent.
Partnership
Our collaborative approach is built around understanding the needs and goals of our clients. By adhering to core principles of sound judgment and steady guidance, we support you through every stage of the investment decision process.
Carefully consider a fund’s investment objectives, risks, charges, and expenses before investing. For a current prospectus and, if available, a summary prospectus, containing this and other information, visit wellsfargoadvantagefunds.com. Read it carefully before investing.
Wells Fargo Funds Management, LLC, a wholly owned subsidiary of Wells Fargo & Company, provides investment advisory and administrative services for Wells Fargo Advantage Funds®. Other affiliates of Wells Fargo & Company provide subadvisory and other services for the Funds. The Funds are distributed by Wells Fargo Funds Distributor, LLC, Member FINRA/SIPC, an affiliate of Wells Fargo & Company.
“Dow Jones®” and “Dow Jones Target Date IndexesSM” are service marks of Dow Jones Trademark Holdings, LLC (“Dow Jones”), have been licensed to CME Group Index Services LLC (“CME Indexes”) and have been sublicensed for use for certain purposes by Global Index Advisors, Inc, and Wells Fargo Funds Management, LLC. The Wells Fargo Advantage Dow Jones Target Date FundsSM based on the Dow Jones Target Date IndexesSM, are not sponsored, endorsed, sold or promoted by Dow Jones, CME Indexes or their respective affiliates and none of them makes any representation regarding the advisability of investing in such product(s).
NOT FDIC INSURED ¡ NO BANK GUARANTEE ¡ MAY LOSE VALUE
Not part of the semi-annual report.
Wells Fargo Advantage Funds offers more than 110 mutual funds across a wide range of asset classes, representing over $211 billion in assets under management, as of April 30, 2012.
| | | | |
| Equity Funds | | | | |
Asia Pacific Fund | | Enterprise Fund† | | Precious Metals Fund |
C&B Large Cap Value Fund | | Equity Value Fund | | Premier Large Company Growth Fund |
C&B Mid Cap Value Fund | | Global Opportunities Fund | | Small Cap Opportunities Fund |
Capital Growth Fund | | Growth Fund | | Small Cap Value Fund |
Common Stock Fund | | Index Fund | | Small Company Growth Fund |
Disciplined U.S. Core Fund | | International Equity Fund | | Small Company Value Fund |
Discovery Fund† | | International Value Fund | | Small/Mid Cap Core Fund |
Diversified Equity Fund | | Intrinsic Small Cap Value Fund | | Small/Mid Cap Value Fund |
Diversified International Fund | | Intrinsic Value Fund | | Special Mid Cap Value Fund |
Diversified Small Cap Fund | | Intrinsic World Equity Fund | | Special Small Cap Value Fund |
Emerging Growth Fund | | Large Cap Core Fund | | Specialized Technology Fund |
Emerging Markets Equity Fund | | Large Cap Growth Fund | | Traditional Small Cap Growth Fund |
Emerging Markets Equity Income Fund | | Large Company Value Fund | | Utility and Telecommunications Fund |
Emerging Markets Local Bond Fund | | Omega Growth Fund | | |
Endeavor Select Fund† | | Opportunity Fund† | | |
| Bond Funds | | | | |
Adjustable Rate Government Fund | | Inflation-Protected Bond Fund | | Short-Term Bond Fund |
California Limited-Term Tax-Free Fund | | Intermediate Tax/AMT-Free Fund | | Short-Term High Yield Bond Fund |
California Tax-Free Fund | | International Bond Fund | | Short-Term Municipal Bond Fund |
Colorado Tax-Free Fund | | Minnesota Tax-Free Fund | | Strategic Municipal Bond Fund |
Government Securities Fund | | Municipal Bond Fund | | Total Return Bond Fund |
High Income Fund | | North Carolina Tax-Free Fund | | Ultra Short-Term Income Fund |
High Yield Bond Fund | | Pennsylvania Tax-Free Fund | | Ultra Short-Term Municipal Income Fund |
Income Plus Fund | | Short Duration Government Bond Fund | | Wisconsin Tax-Free Fund |
| Asset Allocation Funds | | | | |
Absolute Return Fund | | WealthBuilder Equity Portfolio† | | Target 2020 Fund† |
Asset Allocation Fund | | WealthBuilder Growth Allocation Portfolio† | | Target 2025 Fund† |
Conservative Allocation Fund | | WealthBuilder Growth Balanced Portfolio† | | Target 2030 Fund† |
Diversified Capital Builder Fund | | WealthBuilder Moderate Balanced Portfolio† | | Target 2035 Fund† |
Diversified Income Builder Fund | | WealthBuilder Tactical Equity Portfolio† | | Target 2040 Fund† |
Growth Balanced Fund | | Target Today Fund† | | Target 2045 Fund† |
Index Asset Allocation Fund | | Target 2010 Fund† | | Target 2050 Fund† |
Moderate Balanced Fund | | Target 2015 Fund† | | Target 2055 Fund† |
WealthBuilder Conservative Allocation Portfolio† | | | | |
| Money Market Funds | | | | |
100% Treasury Money Market Fund | | Heritage Money Market Fund† | | National Tax-Free Money Market Fund |
California Municipal Money Market Fund | | Money Market Fund | | Prime Investment Money Market Fund |
Cash Investment Money Market Fund | | Municipal Cash Management Money Market Fund | | Treasury Plus Money Market Fund |
Government Money Market Fund | | Municipal Money Market Fund | | |
| Variable Trust Funds1 | | | | |
VT Discovery Fund† | | VT Intrinsic Value Fund | | VT Small Cap Growth Fund |
VT Index Asset Allocation Fund | | VT Omega Growth Fund | | VT Small Cap Value Fund |
VT International Equity Fund | | VT Opportunity Fund† | | VT Total Return Bond Fund |
An investment in a money market fund is not insured or guaranteed by the Federal Deposit Insurance Corporation or any other government agency. Although the Wells Fargo Advantage Money Market Funds seek to preserve the value of your investment at $1.00 per share, it is possible to lose money by investing in a money market fund.
| 1. | The Variable Trust Funds are generally available only through insurance company variable contracts. |
| † | In this report, the Wells Fargo Advantage Discovery FundSM, Wells Fargo Advantage Endeavor Select FundSM, Wells Fargo Advantage Enterprise FundSM, Wells Fargo Advantage Opportunity FundSM, Wells Fargo Advantage WealthBuilder Conservative Allocation PortfolioSM, Wells Fargo Advantage WealthBuilder Equity PortfolioSM, Wells Fargo Advantage WealthBuilder Growth Allocation PortfolioSM, Wells Fargo Advantage WealthBuilder Growth Balanced PortfolioSM, Wells Fargo Advantage WealthBuilder Moderate Balanced PortfolioSM, Wells Fargo Advantage WealthBuilder Tactical Equity PortfolioSM, Wells Fargo Advantage Dow Jones Target Today FundSM, Wells Fargo Advantage Dow Jones Target 2010 FundSM, Wells Fargo Advantage Dow Jones Target 2015 FundSM, Wells Fargo Advantage Dow Jones Target 2020 FundSM, Wells Fargo Advantage Dow Jones Target 2025 FundSM, Wells Fargo Advantage Dow Jones Target 2030 FundSM, Wells Fargo Advantage Dow Jones Target 2035 FundSM, Wells Fargo Advantage Dow Jones Target 2040 FundSM, Wells Fargo Advantage Dow Jones Target 2045 FundSM, Wells Fargo Advantage Dow Jones Target 2050 FundSM, Wells Fargo Advantage Dow Jones Target 2055 FundSM, Wells Fargo Advantage Heritage Money Market FundSM, Wells Fargo Advantage VT Discovery FundSM, and Wells Fargo Advantage VT Opportunity FundSM are referred to as the Discovery Fund, Endeavor Select Fund, Enterprise Fund, Opportunity Fund, WealthBuilder Conservative Allocation Portfolio, WealthBuilder Equity Portfolio, WealthBuilder Growth Allocation Portfolio, WealthBuilder Growth Balanced Portfolio, WealthBuilder Moderate Balanced Portfolio, WealthBuilder Tactical Equity Portfolio, Target Today Fund, Target 2010 Fund, Target 2015 Fund, Target 2020 Fund, Target 2025 Fund, Target 2030 Fund, Target 2035 Fund, Target 2040 Fund, Target 2045 Fund, Target 2050 Fund, Target 2055 Fund, Heritage Money Market Fund, VT Discovery Fund, and VT Opportunity Fund, respectively. |
Not part of the semi-annual report.
| | | | |
| 2 | | Wells Fargo Advantage Small Cap Opportunities Fund | | Letter to Shareholders |

Karla M. Rabusch,
President
Wells Fargo Advantage Funds
The period was marked by continued concerns about the possible global economic effects of the ongoing European sovereign debt crisis that began in Greece and later spread to the larger economies of Italy and Spain.
In contrast to worrisome data from the eurozone, U.S. economic data remained moderately positive.
Dear Valued Shareholder:
We’re pleased to offer you this semi-annual report for the Wells Fargo Advantage Small Cap Opportunities Fund for the six-month period that ended April 30, 2012. The period was marked by continued concerns about the possible global economic effects of the ongoing European sovereign debt crisis that began in Greece and later spread to the larger economies of Italy and Spain. However, relatively positive U.S. economic data resulted in most U.S. stock indexes posting gains for the period, with large-cap stocks modestly outperforming small-cap stocks.
Macroeconomic optimism seemed to fade as global growth slowed and worries rose.
Prior to and throughout the reporting period, concerns about the eurozone sovereign debt situation returned to center stage. Investors became increasingly concerned that Greece would default on its debt, a scenario that only seemed more likely as eurozone leaders began to openly discuss a “voluntary” haircut on Greek debt for private investors. Because many eurozone banks owned Greek debt and many U.S. banks had financial ties to eurozone banks, investors worried about the effects of such an event on the financial systems and on the global economy.
In October 2011, market participants turned their attention to the debt burdens of Italy—which, like the U.S., also had its credit rating downgraded by Standard & Poor’s—because even though it had a relatively modest budget deficit, it had a high amount of outstanding debt and a stagnant economy. French banks were heavily exposed to Italian debt, so Italy’s woes led to fears of a state bailout of French banks and a resulting increase in France’s expenditures.
The Greek credit crisis was seemingly addressed in March 2012, when the Greek government came to an agreement with its creditors that allowed it to write down the principal on most of its bonds in exchange for increased financial austerity. The Greek agreement, combined with unprecedented support for eurozone banks by the European Central Bank (ECB), seemed to calm investor concerns, at least temporarily, and most developed European markets ended the period with gains.
The U.S. economy reported relatively solid news.
In contrast to worrisome data from the eurozone, U.S. economic data remained moderately positive. Reported gross domestic product (GDP) growth came in at a 1.8% annualized rate in the third quarter of 2011 and then accelerated to a 3.0% annualized rate in the fourth quarter. The initial estimate for GDP growth in the first quarter of 2012 came in at a 2.2% annualized rate, further supporting the case for economic recovery. In addition, the major banks appeared to have taken steps toward repairing their balance sheets; in March, the Federal Reserve (Fed) announced that 15 of the 19 major banks had passed a “stress test” in which the Fed attempted to gauge whether the banks could survive a severe recession that included a 50% drop in the stock market and a 21% percent decline in housing prices.
Financial stocks rebounded and outperformed the broader market for the reporting period after the Fed released details of the stress test. Stocks generally rallied across the market as investors seemed to be increasingly confident that the U.S. would not return to recession.
Central banks continued to provide stimulus.
Throughout the reporting period, the Federal Open Market Committee kept its key interest rates effectively at zero in order to support the economy and financial system. In response to extreme market volatility and signs of a weakening economy, the Fed announced its intention to keep interest rates low until at least late 2014.
| | | | | | |
| Letter to Shareholders | | Wells Fargo Advantage Small Cap Opportunities Fund | | | 3 | |
As of November 1, 2011, the ECB had a key rate of 1.50%, which it had increased from 1.0% in an attempt to keep inflation in check. Soon, in response to weakness in the southern European economies, the ECB lowered its key rate to 1.25% in early November 2011 and 1.0% in December 2011. The ECB also continued to provide virtually unlimited liquidity for banks, announcing a Long-Term Refinancing Operation in December through which it provided low-cost three-year loans to lenders.
We use time-tested investment strategies, even as many variables are at work in the market.
Elevated unemployment and debt defaults continue to pressure consumers and businesses alike. In our experience, strict adherence to time-tested investment strategies has its rewards. As a whole, Wells Fargo Advantage Funds represents investments across a range of asset classes and investment styles, giving you an opportunity to create a diversified investment portfolio. While diversification may not prevent losses in a downturn, we believe it helps in managing risk.
Thank you for choosing to invest with Wells Fargo Advantage Funds. We appreciate your confidence in us and remain committed to helping you meet your financial needs. For current information about your fund investments, contact your investment professional, visit our Web site at wellsfargoadvantagefunds.com, or call us directly at 1-800-222-8222. We are available 24 hours a day, 7 days a week.
Sincerely,

Karla M. Rabusch
President
Wells Fargo Advantage Funds
Notice to Shareholders
The Board of Trustees for Wells Fargo Advantage Funds has unanimously approved the following modifications to certain net asset value (NAV) waiver privileges and commission schedules:
| | n | | Effective May 1, 2012, automatic investment plan (AIP) purchases and proceeds received from systematic withdrawals will no longer qualify for NAV repurchase privileges. | |
| | n | | Effective May 1, 2012, discretionary rights to waive the upfront commission for Class C and “jumbo” Class A share purchases will no longer be granted to broker/dealers. However, we will continue to waive the Class C shares contingent deferred sales charge for redemptions by employer-sponsored retirement plans where the dealer of record waived its commission at the time of purchase. | |
| | n | | Effective July 31, 2012, NAV purchase privileges for former Evergreen Class IS and Class R shareholders are being modified to remove the ability to purchase Class A shares at NAV unless those shares are held directly with the Fund on or after July 31, 2012. | |
Please contact your investment professional or call us directly at 1-800-222-8222 if you have any questions on this Notice to Shareholders.
| | | | |
| 4 | | Wells Fargo Advantage Small Cap Opportunities Fund | | Performance Highlights (Unaudited) |
INVESTMENT OBJECTIVE
The Fund seeks long-term capital appreciation.
ADVISER
Wells Fargo Funds Management, LLC
SUB-ADVISER
Schroder Investment Management North America Inc.
PORTFOLIO MANAGER
Jenny B. Jones
FUND INCEPTION
August 1, 1993
| | | | |
TEN LARGEST EQUITY HOLDINGS1 (AS OF APRIL 30, 2012) | |
Northwestern Corporation | | | 1.41% | |
Brown & Brown Incorporated | | | 1.37% | |
Waste Connections Incorporated | | | 1.35% | |
Alterra Capital Holdings Limited | | | 1.28% | |
Cleco Corporation | | | 1.25% | |
AboveNet Incorporated | | | 1.18% | |
IDACORP Incorporated | | | 1.16% | |
Enpro Industries Incorporated | | | 1.14% | |
Innophos Holdings Incorporated | | | 1.14% | |
Rent-A-Center Incorporated | | | 1.12% | |
| | |
SECTOR DISTRIBUTION2 (AS OF APRIL 30, 2012) | | |
|
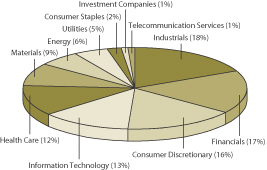 |
| 1. | The ten largest equity holdings are calculated based on the value of the securities divided by total net assets of the Fund. Holdings are subject to change and may have changed since the date specified. |
| 2. | Sector distribution is subject to change and is calculated based on the total long-term investments of the Fund. |
| | | | | | |
| Performance Highlights (Unaudited) | | Wells Fargo Advantage Small Cap Opportunities Fund | | | 5 | |
AVERAGE ANNUAL TOTAL RETURN (%) (AS OF APRIL 30, 2012)
| | | | | | | | | | | | | | | | | | | | | | | | | | | | |
| | | | | | | | | Expense Ratios3 | |
| | | Inception Date | | | 6 Months* | | | 1 Year | | | 5 Year | | | 10 Year | | | Gross | | | Net4 | |
Administrator Class (NVSOX) | | | 08/01/1993 | | | | 9.45 | | | | (4.46 | ) | | | 3.32 | | | | 8.42 | | | | 1.25% | | | | 1.23% | |
Russell 2000® Index5 | | | | | | | 11.02 | | | | (4.25 | ) | | | 1.45 | | | | 6.19 | | | | | | | | | |
| * | Returns for periods of less than one year are not annualized. |
Figures quoted represent past performance, which is no guarantee of future results and do not reflect the deduction of taxes that a shareholder may pay on fund distributions or the redemption of fund shares. Investment return and principal value of an investment will fluctuate so that an investor’s shares, when redeemed, may be worth more or less than their original cost. Current performance may be lower or higher than the performance data quoted and assumes the reinvestment of dividends and capital gains. Current month-end performance is available on the Fund’s Web site–wellsfargoadvantagefunds.com.
Index returns do not include transaction costs associated with buying and selling securities, any mutual fund fees or expenses or any taxes. It is not possible to invest directly in an index.
Administrator Class shares are sold without a front-end sales charge or contingent deferred sales charge.
Stock fund values fluctuate in response to the activities of individual companies and general market and economic conditions. Smaller-company stocks tend to be more volatile and less liquid than those of larger companies. The use of derivatives may reduce returns and/or increase volatility. Consult the Fund’s prospectus for additional information on these and other risks.
| 3. | Reflects the expense ratios as stated in the most recent prospectuses. |
| 4. | The Adviser has committed through February 28, 2013 to waive fees and/or reimburse expenses to the extent necessary to cap the Fund’s Total Annual Fund Operating Expenses After Fee Waiver, excluding certain expenses, at 1.20% for Administrator Class. Without this cap, the Fund’s returns would have been lower. |
| 5. | The Russell 2000® Index measures the performance of the 2,000 smallest companies in the Russell 3000® Index, which represents approximately 8% of the total market capitalization of the Russell 3000 Index. You cannot invest directly in an index. |
| | | | |
| 6 | | Wells Fargo Advantage Small Cap Opportunities Fund | | Fund Expenses (Unaudited) |
As a shareholder of the Fund, you incur ongoing costs, including management fees; shareholder service fees; and other Fund expenses. This example is intended to help you understand your ongoing costs (in dollars) of investing in the Fund and to compare these costs with the ongoing costs of investing in other mutual funds.
The example is based on an investment of $1,000 invested at the beginning of the six-month period and held for the entire period from November 1, 2011 to April 30, 2012.
Actual Expenses
The “Actual” line of the table below provides information about actual account values and actual expenses. You may use the information in this line, together with the amount you invested, to estimate the expenses that you paid over the period. Simply divide your account value by $1,000 (for example, an $8,600 account value divided by $1,000 = 8.6), then multiply the result by the number in the “Actual” line under the heading entitled “Expenses Paid During Period” for your applicable class of shares to estimate the expenses you paid on your account during this period.
Hypothetical Example for Comparison Purposes
The “Hypothetical” line of the table below provides information about hypothetical account values and hypothetical expenses based on the Fund’s actual expense ratio and an assumed rate of return of 5% per year before expenses, which is not the Fund’s actual return. The hypothetical account values and expenses may not be used to estimate the actual ending account balance or expenses you paid for the period. You may use this information to compare the ongoing costs of investing in the Fund and other funds. To do so, compare this 5% hypothetical example with the 5% hypothetical examples that appear in the shareholder reports of the other funds.
Please note that the expenses shown in the table are meant to highlight your ongoing costs. Therefore, the “Hypothetical” line of the table is useful in comparing ongoing costs only, and will not help you determine the relative total costs of owning different funds.
| | | | | | | | | | | | | | | | |
| | | Beginning
Account Value
11-01-2011 | | | Ending
Account Value
04-30-2012 | | | Expenses
Paid During
the Period1 | | | Net Annual
Expense Ratio | |
Administrator Class | | | | | | | | | | | | | | | | |
Actual | | $ | 1,000.00 | | | $ | 1,094.48 | | | $ | 6.25 | | | | 1.20 | % |
Hypothetical (5% return before expenses) | | $ | 1,000.00 | | | $ | 1,018.90 | | | $ | 6.02 | | | | 1.20 | % |
| 1. | Expenses paid is equal to the annualized expense ratio of each class multiplied by the average account value over the period, multiplied by the number of days in the most recent fiscal half-year divided by the number of days in the fiscal year (to reflect the one-half year period). |
| | | | | | |
| Portfolio of Investments—April 30, 2012 (Unaudited) | | Wells Fargo Advantage Small Cap Opportunities Fund | | | 7 | |
| | | | | | | | | | | | |
| Security Name | | | | | | Shares | | | Value | |
| | | | | | | | | | | | |
| | | |
Common Stocks: 87.85% | | | | | | | | | | |
| | | | |
Consumer Discretionary: 14.31% | | | | | | | | | | | | |
| | | |
| Distributors: 0.42% | | | | | | | | | | |
LKQ Corporation † | | | | | | | 85,200 | | | $ | 2,849,940 | |
| | | | | | | | | | | | |
| | | |
| Diversified Consumer Services: 0.23% | | | | | | | | | | |
DeVry Incorporated | | | | | | | 47,900 | | | | 1,539,985 | |
| | | | | | | | | | | | |
| | | |
| Hotels, Restaurants & Leisure: 4.93% | | | | | | | | | | |
Bally Technologies Incorporated † | | | | | | | 148,500 | | | | 7,209,675 | |
CEC Entertainment Incorporated | | | | | | | 170,200 | | | | 6,505,044 | |
Domino’s Pizza Incorporated « | | | | | | | 167,900 | | | | 6,348,299 | |
Home Inns & Hotels Management ADR †« | | | | | | | 65,800 | | | | 1,563,408 | |
Pinnacle Entertainment Incorporated †« | | | | | | | 147,000 | | | | 1,631,700 | |
Six Flags Entertainment Corporation | | | | | | | 117,900 | | | | 5,648,589 | |
The Wendy’s Company | | | | | | | 871,000 | | | | 4,241,770 | |
| | | | |
| | | | | | | | | | | 33,148,485 | |
| | | | | | | | | | | | |
| | | |
| Household Durables: 0.64% | | | | | | | | | | |
Harman International Industries Incorporated | | | | | | | 86,800 | | | | 4,303,544 | |
| | | | | | | | | | | | |
| | | |
| Media: 0.93% | | | | | | | | | | |
Clear Channel Outdoor Holdings Incorporated | | | | | | | 233,600 | | | | 1,768,352 | |
Lamar Advertising Company Class A †« | | | | | | | 81,000 | | | | 2,577,420 | |
Madison Square Garden Incorporated Class A † | | | | | | | 53,800 | | | | 1,935,186 | |
| | | | |
| | | | | | | | | | | 6,280,958 | |
| | | | | | | | | | | | |
| | | |
| Multiline Retail: 0.78% | | | | | | | | | | |
Big Lots Incorporated † | | | | | | | 144,000 | | | | 5,276,160 | |
| | | | | | | | | | | | |
| | | |
| Specialty Retail: 6.03% | | | | | | | | | | |
Asbury Automotive Group Incorporated † | | | | | | | 144,200 | | | | 4,026,064 | |
Chico’s FAS Incorporated | | | | | | | 295,100 | | | | 4,532,736 | |
Children’s Place Retail Stores Incorporated †« | | | | | | | 100,900 | | | | 4,639,382 | |
Citi Trends Incorporated †« | | | | | | | 130,300 | | | | 1,451,542 | |
Collective Brands Incorporated † | | | | | | | 113,900 | | | | 2,365,703 | |
Express Incorporated † | | | | | | | 77,400 | | | | 1,828,188 | |
Finish Line Incorporated Class A | | | | | | | 281,300 | | | | 6,261,738 | |
Group 1 Automotive Incorporated | | | | | | | 84,500 | | | | 4,890,860 | |
Men’s Wearhouse Incorporated | | | | | | | 80,600 | | | | 2,985,424 | |
Rent-A-Center Incorporated | | | | | | | 221,000 | | | | 7,560,410 | |
| | | | |
| | | | | | | | | | | 40,542,047 | |
| | | | | | | | | | | | |
| | | | |
| Textiles, Apparel & Luxury Goods: 0.35% | | | | | | | | | | | | |
Wolverine World Wide Incorporated | | | | | | | 55,400 | | | | 2,324,030 | |
| | | | | | | | | | | | |
| | | | |
Consumer Staples: 1.16% | | | | | | | | | | | | |
| | | | |
| Food & Staples Retailing: 0.88% | | | | | | | | | | | | |
Casey’s General Stores Incorporated | | | | | | | 49,800 | | | | 2,806,230 | |
Harris Teeter Supermarkets Incorporated | | | | | | | 78,600 | | | | 2,984,442 | |
Nash Finch Company | | | | | | | 5,600 | | | | 140,560 | |
| | | | |
| | | | | | | | | | | 5,931,232 | |
| | | | | | | | | | | | |
The accompanying notes are an integral part of these financial statements.
| | | | |
| 8 | | Wells Fargo Advantage Small Cap Opportunities Fund | | Portfolio of Investments—April 30, 2012 (Unaudited) |
| | | | | | | | | | | | |
| Security Name | | | | | | Shares | | | Value | |
| | | | | | | | | | | | |
| | | | |
| Personal Products: 0.28% | | | | | | | | | | | | |
Elizabeth Arden Incorporated † | | | | | | | 47,200 | | | $ | 1,839,856 | |
| | | | | | | | | | | | |
| | | | |
Energy: 4.93% | | | | | | | | | | | | |
| | | | |
| Energy Equipment & Services: 1.51% | | | | | | | | | | | | |
Helix Energy Solutions Group Incorporated †« | | | | | | | 185,600 | | | | 3,788,096 | |
Oil States International Incorporated † | | | | | | | 79,500 | | | | 6,326,610 | |
| | | | |
| | | | | | | | | | | 10,114,706 | |
| | | | | | | | | | | | |
| | | | |
| Oil, Gas & Consumable Fuels: 3.42% | | | | | | | | | | | | |
Carrizo Oil & Gas Incorporated †« | | | | | | | 138,600 | | | | 3,886,344 | |
Petroleum Development Corporation †« | | | | | | | 54,900 | | | | 1,888,011 | |
PetroQuest Energy Incorporated †« | | | | | | | 587,400 | | | | 3,547,896 | |
SM Energy Company | | | | | | | 67,700 | | | | 4,475,647 | |
Swift Energy Company †« | | | | | | | 248,800 | | | | 7,526,200 | |
Tsakos Energy Navigation Limited | | | | | | | 264,600 | | | | 1,680,210 | |
| | | | |
| | | | | | | | | | | 23,004,308 | |
| | | | | | | | | | | | |
| | | | |
Financials: 15.32% | | | | | | | | | | | | |
| | | | |
| Capital Markets: 0.79% | | | | | | | | | | | | |
Apollo Global Management LLC | | | | | | | 143,900 | | | | 1,847,676 | |
Lazard Limited | | | | | | | 125,800 | | | | 3,460,758 | |
| | | | |
| | | | | | | | | | | 5,308,434 | |
| | | | | | | | | | | | |
| | | | |
| Commercial Banks: 3.87% | | | | | | | | | | | | |
Bank of Hawaii Corporation | | | | | | | 45,200 | | | | 2,209,828 | |
Bryn Mawr Bank Corporation | | | | | | | 4,900 | | | | 105,301 | |
CVB Financial Corporation | | | | | | | 120,310 | | | | 1,391,987 | |
FirstMerit Corporation | | | | | | | 222,000 | | | | 3,729,600 | |
Lakeland Financial Corporation | | | | | | | 89,700 | | | | 2,335,788 | |
MB Financial Incorporated « | | | | | | | 146,600 | | | | 3,030,222 | |
Old National Bancorp « | | | | | | | 258,400 | | | | 3,312,688 | |
Simmons First National Corporation « | | | | | | | 114,400 | | | | 2,784,496 | |
SVB Financial Group †« | | | | | | | 50,500 | | | | 3,236,545 | |
Westamerica Bancorporation « | | | | | | | 84,800 | | | | 3,889,776 | |
| | | | |
| | | | | | | | | | | 26,026,231 | |
| | | | | | | | | | | | |
| | | | |
| Consumer Finance: 0.57% | | | | | | | | | | | | |
Cash America International Incorporated « | | | | | | | 82,600 | | | | 3,861,550 | |
| | | | | | | | | | | | |
| | | | |
| Diversified Financial Services: 0.59% | | | | | | | | | | | | |
Compass Diversified Holdings « | | | | | | | 270,600 | | | | 3,972,408 | |
| | | | | | | | | | | | |
| | | | |
| Insurance: 5.49% | | | | | | | | | | | | |
Alterra Capital Holdings Limited « | | | | | | | 360,466 | | | | 8,625,951 | |
Brown & Brown Incorporated | | | | | | | 340,400 | | | | 9,180,588 | |
Delphi Financial Group Incorporated Class A | | | | | | | 152,800 | | | | 6,940,176 | |
Infinity Property & Casualty Corporation | | | | | | | 40,600 | | | | 2,168,446 | |
Primerica Incorporated | | | | | | | 127,200 | | | | 3,336,456 | |
Reinsurance Group of America Incorporated | | | | | | | 115,200 | | | | 6,697,728 | |
| | | | |
| | | | | | | | | | | 36,949,345 | |
| | | | | | | | | | | | |
The accompanying notes are an integral part of these financial statements.
| | | | | | |
| Portfolio of Investments—April 30, 2012 (Unaudited) | | Wells Fargo Advantage Small Cap Opportunities Fund | | | 9 | |
| | | | | | | | | | | | |
| Security Name | | | | | | Shares | | | Value | |
| | | | | | | | | | | | |
| | | | |
| Real Estate Management & Development: 0.33% | | | | | | | | | | | | |
Altisource Portfolio Solutions SA † | | | | | | | 37,100 | | | $ | 2,219,693 | |
| | | | | | | | | | | | |
| | | | |
| REITs: 3.09% | | | | | | | | | | | | |
Colonial Properties Trust « | | | | | | | 294,300 | | | | 6,583,491 | |
Equity Lifestyle Properties Incorporated | | | | | | | 55,777 | | | | 3,901,043 | |
Health Care REIT Incorporated | | | | | | | 12,508 | | | | 708,703 | |
LaSalle Hotel Properties | | | | | | | 162,120 | | | | 4,767,949 | |
MFA Mortgage Investments Incorporated | | | | | | | 468,400 | | | | 3,456,792 | |
Redwood Trust Incorporated | | | | | | | 114,229 | | | | 1,334,195 | |
| | | | |
| | | | | | | | | | | 20,752,173 | |
| | | | | | | | | | | | |
| | | | |
| Thrifts & Mortgage Finance: 0.59% | | | | | | | | | | | | |
Ocwen Financial Corporation † | | | | | | | 263,800 | | | | 3,933,258 | |
| | | | | | | | | | | | |
| | | | |
Health Care: 10.19% | | | | | | | | | | | | |
| | | | |
| Biotechnology: 0.84% | | | | | | | | | | | | |
Cepheid Incorporated †« | | | | | | | 63,800 | | | | 2,450,558 | |
Lexicon Genetics Incorporated †« | | | | | | | 938,400 | | | | 1,520,208 | |
Onyx Pharmaceuticals Incorporated † | | | | | | | 36,600 | | | | 1,665,666 | |
| | | | |
| | | | | | | | | | | 5,636,432 | |
| | | | | | | | | | | | |
| | | | |
| Health Care Equipment & Supplies: 4.10% | | | | | | | | | | | | |
Cooper Companies Incorporated | | | | | | | 83,100 | | | | 7,326,927 | |
Haemonetics Corporation †« | | | | | | | 98,400 | | | | 7,042,488 | |
Masimo Corporation †« | | | | | | | 214,100 | | | | 4,738,033 | |
Sirona Dental Systems Incorporated † | | | | | | | 95,900 | | | | 4,843,909 | |
Volcano Corporation † | | | | | | | 71,700 | | | | 1,946,655 | |
West Pharmaceutical Services Incorporated « | | | | | | | 37,100 | | | | 1,665,790 | |
| | | | |
| | | | | | | | | | | 27,563,802 | |
| | | | | | | | | | | | |
| | | | |
| Health Care Providers & Services: 2.37% | | | | | | | | | | | | |
Brookdale Senior Living Incorporated † | | | | | | | 224,800 | | | | 4,273,448 | |
Centene Corporation † | | | | | | | 49,500 | | | | 1,959,705 | |
HealthSouth Rehabilitation Corporation †« | | | | | | | 196,800 | | | | 4,406,352 | |
HMS Holdings Corporation † | | | | | | | 49,900 | | | | 1,200,594 | |
Lifepoint Hospitals Incorporated †« | | | | | | | 86,900 | | | | 3,390,838 | |
Myriad Genetics Incorporated † | | | | | | | 28,000 | | | | 728,280 | |
| | | | |
| | | | | | | | | | | 15,959,217 | |
| | | | | | | | | | | | |
| | | | |
| Health Care Technology: 0.26% | | | | | | | | | | | | |
Medassets Incorporated † | | | | | | | 129,400 | | | | 1,631,734 | |
Vocera Communications Incorporated † | | | | | | | 4,000 | | | | 88,600 | |
| | | | |
| | | | | | | | | | | 1,720,334 | |
| | | | | | | | | | | | |
| | | | |
| Life Sciences Tools & Services: 1.55% | | | | | | | | | | | | |
Fluidigm Corporation †« | | | | | | | 91,700 | | | | 1,431,437 | |
Parexel International Corporation † | | | | | | | 269,400 | | | | 7,257,636 | |
TECHNE Corporation | | | | | | | 26,300 | | | | 1,760,522 | |
| | | | |
| | | | | | | | | | | 10,449,595 | |
| | | | | | | | | | | | |
The accompanying notes are an integral part of these financial statements.
| | | | |
| 10 | | Wells Fargo Advantage Small Cap Opportunities Fund | | Portfolio of Investments—April 30, 2012 (Unaudited) |
| | | | | | | | | | | | |
| Security Name | | | | | | Shares | | | Value | |
| | | | | | | | | | | | |
| | | | |
| Pharmaceuticals: 1.07% | | | | | | | | | | | | |
Medicis Pharmaceutical Corporation Class A « | | | | | | | 89,400 | | | $ | 3,439,218 | |
Salix Pharmaceuticals Limited † | | | | | | | 75,400 | | | | 3,724,760 | |
| | | | |
| | | | | | | | | | | 7,163,978 | |
| | | | | | | | | | | | |
| | | | |
Industrials: 15.58% | | | | | | | | | | | | |
| | | | |
| Airlines: 0.67% | | | | | | | | | | | | |
Spirit Airlines Incorporated †« | | | | | | | 189,000 | | | | 4,539,780 | |
| | | | | | | | | | | | |
| | | | |
| Commercial Services & Supplies: 6.01% | | | | | | | | | | | | |
ABM Industries Incorporated | | | | | | | 141,500 | | | | 3,294,120 | |
FTI Consulting Incorporated †« | | | | | | | 128,600 | | | | 4,673,324 | |
Healthcare Services Group « | | | | | | | 135,100 | | | | 2,866,822 | |
Progressive Waste Solutions Limited | | | | | | | 187,700 | | | | 4,065,582 | |
Standard Parking Corporation † | | | | | | | 298,061 | | | | 5,681,043 | |
Stantec Incorporated | | | | | | | 133,494 | | | | 4,360,836 | |
Steelcase Incorporated | | | | | | | 302,800 | | | | 2,616,192 | |
Towers Watson & Company | | | | | | | 57,600 | | | | 3,767,040 | |
Waste Connections Incorporated | | | | | | | 281,725 | | | | 9,079,997 | |
| | | | |
| | | | | | | | | | | 40,404,956 | |
| | | | | | | | | | | | |
| | | | |
| Construction & Engineering: 1.47% | | | | | | | | | | | | |
Dycom Industries Incorporated † | | | | | | | 160,700 | | | | 3,758,773 | |
MYR Group Incorporated † | | | | | | | 272,300 | | | | 4,552,856 | |
Orion Marine Group Incorporated † | | | | | | | 228,300 | | | | 1,579,836 | |
| | | | |
| | | | | | | | | | | 9,891,465 | |
| | | | | | | | | | | | |
| | | | |
| Electrical Equipment: 2.72% | | | | | | | | | | | | |
AZZ Incorporated | | | | | | | 11,400 | | | | 589,494 | |
EnerSys † | | | | | | | 197,100 | | | | 6,888,645 | |
GrafTech International Limited † | | | | | | | 480,400 | | | | 5,639,896 | |
Regal-Beloit Corporation | | | | | | | 27,700 | | | | 1,873,628 | |
Thermon Group Holdings Incorporated † | | | | | | | 149,000 | | | | 3,310,780 | |
| | | | |
| | | | | | | | | | | 18,302,443 | |
| | | | | | | | | | | | |
| | | | |
| Machinery: 2.06% | | | | | | | | | | | | |
Edgen Group Incorporated † | | | | | | | 161,600 | | | | 1,454,400 | |
Enpro Industries Incorporated †« | | | | | | | 185,600 | | | | 7,685,696 | |
IDEX Corporation | | | | | | | 108,300 | | | | 4,690,473 | |
| | | | |
| | | | | | | | | | | 13,830,569 | |
| | | | | | | | | | | | |
| | | | |
| Road & Rail: 0.75% | | | | | | | | | | | | |
Genesee & Wyoming Incorporated † | | | | | | | 50,700 | | | | 2,733,237 | |
Swift Transportation Company † | | | | | | | 221,500 | | | | 2,323,535 | |
| | | | |
| | | | | | | | | | | 5,056,772 | |
| | | | | | | | | | | | |
| | | | |
| Trading Companies & Distributors: 1.90% | | | | | | | | | | | | |
Applied Industrial Technologies Incorporated | | | | | | | 183,300 | | | | 7,203,690 | |
MRC Global Incorporated †« | | | | | | | 283,500 | | | | 5,556,600 | |
| | | | |
| | | | | | | | | | | 12,760,290 | |
| | | | | | | | | | | | |
The accompanying notes are an integral part of these financial statements.
| | | | | | |
| Portfolio of Investments—April 30, 2012 (Unaudited) | | Wells Fargo Advantage Small Cap Opportunities Fund | | | 11 | |
| | | | | | | | | | | | |
| Security Name | | | | | | Shares | | | Value | |
| | | | | | | | | | | | |
| | | | |
Information Technology: 12.44% | | | | | | | | | | | | |
| | | | |
| Communications Equipment: 0.09% | | | | | | | | | | | | |
EXFO Incorporated † | | | | | | | 85,145 | | | $ | 607,084 | |
| | | | | | | | | | | | |
| | | | |
| Computers & Peripherals: 0.57% | | | | | | | | | | | | |
QLogic Corporation † | | | | | | | 221,600 | | | | 3,822,600 | |
| | | | | | | | | | | | |
| | | | |
| Electronic Equipment, Instruments & Components: 1.19% | | | | | | | | | | | | |
Electro Rent Corporation | | | | | | | 97,300 | | | | 1,515,934 | |
M/A-COM Technology Solutions Holdings Incorporated † | | | | | | | 67,300 | | | | 1,334,559 | |
Rofin-Sinar Technologies Incorporated † | | | | | | | 52,000 | | | | 1,310,400 | |
ScanSource Incorporated †« | | | | | | | 117,400 | | | | 3,869,504 | |
| | | | |
| | | | | | | | | | | 8,030,397 | |
| | | | | | | | | | | | |
| | | | |
| Internet Software & Services 1.14% | | | | | | | | | | | | |
Allegiant Travel Company †« | | | | | | | 37,900 | | | | 2,227,004 | |
ComScore Incorporated †« | | | | | | | 65,700 | | | | 1,308,744 | |
Hawaiian Holdings Incorporated † | | | | | | | 507,000 | | | | 2,869,620 | |
Monster Worldwide Incorporated †« | | | | | | | 147,300 | | | | 1,271,199 | |
| | | | |
| | | | | | | | | | | 7,676,567 | |
| | | | | | | | | | | | |
| | | | |
| IT Services: 1.95% | | | | | | | | | | | | |
Forrester Research Incorporated « | | | | | | | 73,300 | | | | 2,598,485 | |
Gartner Incorporated † | | | | | | | 9,100 | | | | 398,580 | |
Genpact Limited † | | | | | | | 155,300 | | | | 2,590,404 | |
Sapient Corporation | | | | | | | 427,500 | | | | 5,117,175 | |
TNS Incorporated † | | | | | | | 118,145 | | | | 2,410,158 | |
| | | | |
| | | | | | | | | | | 13,114,802 | |
| | | | | | | | | | | | |
| | | | |
| Office Electronics: 0.40% | | | | | | | | | | | | |
Zebra Technologies Corporation † | | | | | | | 68,800 | | | | 2,668,752 | |
| | | | | | | | | | | | |
| | | | |
| Semiconductors & Semiconductor Equipment: 3.71% | | | | | | | | | | | | |
Anadigics Incorporated †« | | | | | | | 1,239,900 | | | | 2,740,179 | |
Atmel Corporation † | | | | | | | 554,700 | | | | 4,920,189 | |
Fairchild Semiconductor International Incorporated † | | | | | | | 171,300 | | | | 2,427,321 | |
Hittite Microwave Corporation † | | | | | | | 59,900 | | | | 3,207,046 | |
Integrated Device Technology Incorporated † | | | | | | | 546,300 | | | | 3,698,451 | |
Monolithic Power Systems Incorporated † | | | | | | | 76,500 | | | | 1,585,080 | |
Nanometrics Incorporated † | | | | | | | 138,700 | | | | 2,151,237 | |
Standard Microsystems Corporation † | | | | | | | 160,700 | | | | 4,255,336 | |
| | | | |
| | | | | | | | | | | 24,984,839 | |
| | | | | | | | | | | | |
| | | | |
| Software: 3.39% | | | | | | | | | | | | |
Ariba Incorporated † | | | | | | | 49,500 | | | | 1,890,900 | |
Cadence Design Systems Incorporated † | | | | | | | 374,800 | | | | 4,373,916 | |
Kenexa Corporation † | | | | | | | 182,000 | | | | 5,945,940 | |
Netscout Systems Incorporated † | | | | | | | 110,900 | | | | 2,294,521 | |
Parametric Technology Corporation † | | | | | | | 288,700 | | | | 6,230,146 | |
Websense Incorporated † | | | | | | | 98,500 | | | | 2,042,890 | |
| | | | |
| | | | | | | | | | | 22,778,313 | |
| | | | | | | | | | | | |
The accompanying notes are an integral part of these financial statements.
| | | | |
| 12 | | Wells Fargo Advantage Small Cap Opportunities Fund | | Portfolio of Investments—April 30, 2012 (Unaudited) |
| | | | | | | | | | | | |
| Security Name | | | | | | Shares | | | Value | |
| | | | | | | | | | | | |
| | | | |
Materials: 8.11% | | | | | | | | | | | | |
| | | | |
| Chemicals: 3.00% | | | | | | | | | | | | |
Cabot Corporation | | | | | | | 165,000 | | | $ | 7,116,450 | |
Innophos Holdings Incorporated « | | | | | | | 155,600 | | | | 7,650,852 | |
Minerals Technologies Incorporated | | | | | | | 53,600 | | | | 3,596,560 | |
Quaker Chemical Corporation « | | | | | | | 42,000 | | | | 1,822,800 | |
| | | | |
| | | | | | | | | | | 20,186,662 | |
| | | | | | | | | | | | |
| | | | |
| Containers & Packaging: 2.47% | | | | | | | | | | | | |
Packaging Corporation of America | | | | | | | 220,500 | | | | 6,436,395 | |
Silgan Holdings Incorporated | | | | | | | 155,900 | | | | 6,839,333 | |
Sonoco Products Company | | | | | | | 100,900 | | | | 3,342,817 | |
| | | | |
| | | | | | | | | | | 16,618,545 | |
| | | | | | | | | | | | |
| | | | |
| Metals & Mining: 2.20% | | | | | | | | | | | | |
Kaiser Aluminum Corporation « | | | | | | | 114,800 | | | | 6,035,036 | |
Pretium Resources Incorporated † | | | | | | | 232,601 | | | | 3,930,957 | |
Suncoke Energy Incorporated † | | | | | | | 200,700 | | | | 3,054,654 | |
Timmins Gold Corporation † | | | | | | | 710,500 | | | | 1,740,558 | |
| | | | |
| | | | | | | | | | | 14,761,205 | |
| | | | | | | | | | | | |
| | | | |
| Paper & Forest Products: 0.44% | | | | | | | | | | | | |
Kapstone Paper & Packaging Corporation † | | | | | | | 164,600 | | | | 2,972,676 | |
| | | | | | | | | | | | |
| | | | |
Telecommunication Services: 1.18% | | | | | | | | | | | | |
| | | | |
| Diversified Telecommunication Services: 1.18% | | | | | | | | | | | | |
AboveNet Incorporated †« | | | | | | | 95,700 | | | | 7,959,369 | |
| | | | | | | | | | | | |
| | | | |
Utilities: 4.63% | | | | | | | | | | | | |
| | | | |
| Electric Utilities: 3.22% | | | | | | | | | | | | |
Cleco Corporation | | | | | | | 206,300 | | | | 8,417,040 | |
IDACORP Incorporated | | | | | | | 192,200 | | | | 7,830,227 | |
UniSource Energy Corporation | | | | | | | 148,500 | | | | 5,405,400 | |
| | | | |
| | | | | | | | | | | 21,652,667 | |
| | | | | | | | | | | | |
| | | | |
| Multi-Utilities: 1.41% | | | | | | | | | | | | |
Northwestern Corporation | | | | | | | 267,181 | | | | 9,490,269 | |
| | | | | | | | | | | | |
| | | | |
Total Common Stocks (Cost $494,749,150) | | | | | | | | | | | 590,782,723 | |
| | | | | | | | | | | | |
| | | | |
| Investment Companies: 0.99% | | | | | | | | | | | | |
iShares Russell 2000 Index Fund « | | | | | | | 81,700 | | | | 6,652,831 | |
| | | | | | | | | | | | |
| | | | |
Total Investment Companies (Cost $6,772,971) | | | | | | | | | | | 6,652,831 | |
| | | | | | | | | | | | |
The accompanying notes are an integral part of these financial statements.
| | | | | | |
| Portfolio of Investments—April 30, 2012 (Unaudited) | | Wells Fargo Advantage Small Cap Opportunities Fund | | | 13 | |
| | | | | | | | | | | | | | |
| Security Name | | | | | | | Principal | | | Value | |
| | | | | | | | | | | | | | |
| | | | |
| Other: 0.27% | | | | | | | | | | | | | | |
Gryphon Funding Limited, Pass-Through Entity (v)(i)(a) | | | | | | | | $ | 2,406,870 | | | $ | 673,924 | |
VFNC Corporation, Pass-Through Entity, 0.24% (v)(i)(a)144A± | | | | | | | | | 2,643,310 | | | | 1,110,125 | |
| | | | |
Total Other (Cost $663,929) | | | | | | | | | | | | | 1,784,049 | |
| | | | | | | | | | | | | | |
| | | | |
Short-Term Investments: 22.00% | | | | | | | | | | | | | | |
| | | | |
| | | Yield | | | | | Shares | | | | |
| Investment Companies: 22.00% | | | | | | | | | | | | | | |
Wells Fargo Advantage Cash Investment Money Market Fund, Select Class (l)(u) | | | 0.11 | % | | | | | 78,180,184 | | | | 78,180,184 | |
Wells Fargo Securities Lending Cash Investments, LLC (l)(u)(r)(v) | | | 0.19 | | | | | | 69,799,215 | | | | 69,799,215 | |
| | | | |
Total Short-Term Investments (Cost $147,979,399) | | | | | | | | | | | | | 147,979,399 | |
| | | | | | | | | | | | | | |
| | | | | | | | |
| Total Investments in Securities | | | | | | | | |
| (Cost $650,165,449)* | | | 111.11 | % | | | 747,199,002 | |
Other Assets and Liabilities, Net | | | (11.11 | ) | | | (74,688,644 | ) |
| | | | | | | | |
Total Net Assets | | | 100.00 | % | | $ | 672,510,358 | |
| | | | | | | | |
| † | Non-income earning security |
| « | All or a portion of this security is on loan. |
| (v) | Security represents investment of cash collateral received from securities on loan. |
| (a) | Security is fair valued by the Management Valuation Team, and in certain instances by the Board of Trustees, in accordance with procedures approved by the Board of Trustees. |
| 144A | Security that may be resold to “qualified institutional buyers” under Rule 144A or security offered pursuant to Section 4(2) of the Securities Act of 1933, as amended. |
| ± | Variable rate investment |
| (l) | Investment in an affiliate |
| (u) | Rate shown is the 7-day annualized yield at period end. |
| (r) | The investment company is exempt from registration under Section 3(c)(7) of the 1940 Act. |
| * | Cost for federal income tax purposes is $656,765,368 and net unrealized appreciation (depreciation) consists of: |
| | | | |
Gross unrealized appreciation | | $ | 100,718,160 | |
Gross unrealized depreciation | | | (10,284,526 | ) |
| | | | |
Net unrealized appreciation | | $ | 90,433,634 | |
The accompanying notes are an integral part of these financial statements.
| | | | |
| 14 | | Wells Fargo Advantage Small Cap Opportunities Fund | | Statement of Assets and Liabilities—April 30, 2012 (Unaudited) |
| | | | |
| | | | |
| |
Assets | | | | |
Investments | | | | |
In unaffiliated securities (including securities on loan), at value (see cost below) | | $ | 599,219,603 | |
In affiliated securities, at value (see cost below) | | | 147,979,399 | |
| | | | |
Total investments, at value (see cost below) | | | 747,199,002 | |
Receivable for investments sold | | | 7,677,937 | |
Receivable for Fund shares sold | | | 477,947 | |
Receivable for dividends | | | 126,311 | |
Receivable for securities lending income | | | 11,681 | |
Prepaid expenses and other assets | | | 30,306 | |
| | | | |
Total assets | | | 755,523,184 | |
| | | | |
| |
Liabilities | | | | |
Payable for investments purchased | | | 9,068,946 | |
Payable for Fund shares redeemed | | | 2,711,648 | |
Payable upon receipt of securities loaned | | | 70,463,144 | |
Advisory fee payable | | | 473,282 | |
Due to other related parties | | | 80,144 | |
Accrued expenses and other liabilities | | | 215,662 | |
| | | | |
Total liabilities | | | 83,012,826 | |
| | | | |
Total net assets | | $ | 672,510,358 | |
| | | | |
| |
NET ASSETS CONSIST OF | | | | |
Paid-in capital | | $ | 545,523,794 | |
Undistributed net investment income | | | 472,221 | |
Accumulated net realized gains on investments | | | 29,480,790 | |
Net unrealized gains on investments | | | 97,033,553 | |
| | | | |
Total net assets | | $ | 672,510,358 | |
| | | | |
| |
COMPUTATION OF NET ASSET VALUE PER SHARE1 | | | | |
Net assets – Administrator Class | | $ | 672,510,358 | |
Shares outstanding – Administrator Class | | | 19,639,598 | |
Net asset value per share – Administrator Class | | | $34.24 | |
| |
| | | | |
Investments in unaffiliated securities, at cost | | $ | 502,186,050 | |
| | | | |
Investments in affiliated securities, at cost | | $ | 147,979,399 | |
| | | | |
Total investments, at cost | | $ | 650,165,449 | |
| | | | |
Securities on loan, at value | | $ | 68,793,789 | |
| | | | |
| 1. | The Fund has an unlimited number of authorized shares. |
The accompanying notes are an integral part of these financial statements.
| | | | | | |
| Statement of Operations—Six Months Ended April 30, 2012 (Unaudited) | | Wells Fargo Advantage Small Cap Opportunities Fund | | | 15 | |
| | | | |
| | | | |
| |
Investment income | | | | |
Dividends* | | $ | 4,269,574 | |
Securities lending income, net | | | 107,027 | |
Income from affiliated securities | | | 33,593 | |
| | | | |
Total investment income | | | 4,410,194 | |
| | | | |
| |
Expenses | | | | |
Advisory fee | | | 2,605,432 | |
Administration fees | | | | |
Fund level | | | 164,082 | |
Administrator Class | | | 328,165 | |
Shareholder servicing fees | | | | |
Administrator Class | | | 820,411 | |
Custody and accounting fees | | | 31,214 | |
Professional fees | | | 9,809 | |
Registration fees | | | 13,191 | |
Shareholder report expenses | | | 2,009 | |
Trustees’ fees and expenses | | | 7,215 | |
Other fees and expenses | | | 4,415 | |
| | | | |
Total expenses | | | 3,985,943 | |
Less: Fee waivers and/or expense reimbursements | | | (47,970 | ) |
| | | | |
Net expenses | | | 3,937,973 | |
| | | | |
Net investment income | | | 472,221 | |
| | | | |
| |
REALIZED AND UNREALIZED GAINS (LOSSES) ON INVESTMENTS | | | | |
Net realized gains on investments | | | 37,530,771 | |
Net change in unrealized gains (losses) on investments | | | 21,018,288 | |
| | | | |
Net realized and unrealized gains (losses) on investments | | | 58,549,059 | |
| | | | |
Net increase in net assets resulting from operations | | $ | 59,021,280 | |
| | | | |
| |
* Net of foreign dividend withholding taxes of | | | $10,970 | |
The accompanying notes are an integral part of these financial statements.
| | | | |
| 16 | | Wells Fargo Advantage Small Cap Opportunities Fund | | Statements of Changes in Net Assets |
| | | | | | | | | | | | | | | | |
| | | Six Months Ended April 30, 2012 (Unaudited) | | | Year Ended October 31, 2011 | |
| | | | |
Operations | | | | | | | | | | | | | | | | |
Net investment income | | | | | | $ | 472,221 | | | | | | | $ | 31,971 | |
Net realized gains on investments | | | | | | | 37,530,771 | | | | | | | | 55,659,944 | |
Net change in unrealized gains (losses) on investments | | | | | | | 21,018,288 | | | | | | | | (27,474,227 | ) |
| | | | | | | | | | | | | | | | |
Net increase in net assets resulting from operations | | | | | | | 59,021,280 | | | | | | | | 28,217,688 | |
| | | | | | | | | | | | | | | | |
| | | | |
Distributions to shareholders from | | | | | | | | | | | | | | | | |
Net realized gains – Administrator Class | | | | | | | (24,479,270 | ) | | | | | | | 0 | |
| | | | | | | | | | | | | | | | |
| | | | |
Capital share transactions | | | Shares | | | | | | | | Shares | | | | | |
Proceeds from shares sold – Administrator Class | | | 1,301,908 | | | | 43,291,726 | | | | 3,074,513 | | | | 104,376,442 | |
Reinvestment of distributions – Administrator Class | | | 765,523 | | | | 24,182,866 | | | | 0 | | | | 0 | |
Payment for shares redeemed – Administrator Class | | | (2,633,193 | ) | | | (86,226,082 | ) | | | (5,463,686 | ) | | | (183,832,035 | ) |
| | | | | | | | | | | | | | | | |
Net decrease in net assets resulting from capital share transactions | | | | | | | (18,751,490 | ) | | | | | | | (79,455,593 | ) |
| | | | | | | | | | | | | | | | |
Total increase (decrease) in net assets | | | | | | | 15,790,520 | | | | | | | | (51,237,905 | ) |
| | | | | | | | | | | | | | | | |
| | | | |
Net assets | | | | | | | | | | | | | | | | |
Beginning of period | | | | | | | 656,719,838 | | | | | | | | 707,957,743 | |
| | | | | | | | | | | | | | | | |
End of period | | | | | | $ | 672,510,358 | | | | | | | $ | 656,719,838 | |
| | | | | | | | | | | | | | | | |
Undistributed net investment income | | | | | | $ | 472,221 | | | | | | | $ | 0 | |
| | | | | | | | | | | | | | | | |
The accompanying notes are an integral part of these financial statements.
| | | | | | |
| Financial Highlights | | Wells Fargo Advantage Small Cap Opportunities Fund | | | 17 | |
(For a share outstanding throughout each period)
| | | | | | | | | | | | | | | | | | | | | | | | |
| | | Six Months Ended
April 30, 2012 (Unaudited) | | | Year Ended October 31, | |
| Administrator Class | | | 2011 | | | 2010 | | | 2009 | | | 2008 | | | 2007 | |
Net asset value, beginning of period | | $ | 32.50 | | | $ | 31.33 | | | $ | 25.88 | | | $ | 23.47 | | | $ | 39.68 | | | $ | 38.56 | |
Net investment income (loss) | | | 0.02 | | | | 0.00 | 1 | | | (0.06 | ) | | | (0.02 | ) | | | 0.01 | | | | 0.11 | |
Net realized and unrealized gains (losses) on investments | | | 2.95 | | | | 1.17 | | | | 5.51 | | | | 3.38 | | | | (11.23 | ) | | | 6.99 | |
| | | | | | | | | | | | | | | | | | | | | | | | |
Total from investment operations | | | 2.97 | | | | 1.17 | | | | 5.45 | | | | 3.36 | | | | (11.22 | ) | | | 7.10 | |
Distributions to shareholders from | | | | | | | | | | | | | | | | | | | | | | | | |
Net investment income | | | 0.00 | | | | 0.00 | | | | 0.00 | | | | 0.00 | | | | (0.10 | ) | | | 0.00 | |
Net realized gains | | | (1.23 | ) | | | 0.00 | | | | 0.00 | | | | (0.93 | ) | | | (4.89 | ) | | | (5.98 | ) |
Tax basis return of capital | | | 0.00 | | | | 0.00 | | | | 0.00 | | | | (0.02 | ) | | | 0.00 | | | | 0.00 | |
| | | | | | | | | | | | | | | | | | | | | | | | |
Total distributions to shareholders | | | (1.23 | ) | | | 0.00 | | | | 0.00 | | | | (0.95 | ) | | | (4.99 | ) | | | (5.98 | ) |
Net asset value, end of period | | $ | 34.24 | | | $ | 32.50 | | | $ | 31.33 | | | $ | 25.88 | | | $ | 23.47 | | | $ | 39.68 | |
Total return² | | | 9.45 | % | | | 3.73 | % | | | 21.06 | % | | | 15.44 | % | | | (31.65 | )% | | | 20.94 | % |
Ratios to average net assets (annualized) | | | | | | | | | | | | | | | | | | | | | | | | |
Gross expenses | | | 1.21 | % | | | 1.22 | % | | | 1.25 | % | | | 1.31 | % | | | 1.28 | % | | | 1.33 | % |
Net expenses | | | 1.20 | % | | | 1.20 | % | | | 1.20 | % | | | 1.20 | % | | | 1.20 | % | | | 1.20 | % |
Net investment income (loss) | | | 0.14 | % | | | 0.00 | %1 | | | (0.20 | )% | | | (0.07 | )% | | | 0.08 | % | | | 0.29 | % |
Supplemental data | | | | | | | | | | | | | | | | | | | | | | | | |
Portfolio turnover rate | | | 39 | % | | | 100 | % | | | 66 | % | | | 68 | % | | | 72 | % | | | 65 | % |
Net assets, end of period (000’s omitted) | | | $672,510 | | | | $656,720 | | | | $707,958 | | | | $612,110 | | | | $541,369 | | | | $910,162 | |
| 1. | Amount is less than 0.005 of the value indicated. |
| 2. | Returns for periods of less than one year are not annualized. |
The accompanying notes are an integral part of these financial statements.
| | | | |
| 18 | | Wells Fargo Advantage Small Cap Opportunities Fund | | Notes to Financial Statements (Unaudited) |
1. ORGANIZATION
Wells Fargo Funds Trust (the “Trust”), a Delaware statutory trust organized on March 10, 1999, is an open-end management investment company registered under the Investment Company Act of 1940, as amended (the “1940 Act”). These financial statements report on Wells Fargo Advantage Small Cap Opportunities Fund (the “Fund”) which is a diversified series of the Trust.
2. SIGNIFICANT ACCOUNTING POLICIES
The following significant accounting policies, which are consistently followed in the preparation of the financial statements of the Fund, are in conformity with U.S. generally accepted accounting principles which require management to make estimates and assumptions that affect the reported amounts of assets and liabilities, disclosure of contingent assets and liabilities at the date of the financial statements, and the reported amounts of revenues and expenses during the reporting period. Actual results could differ from those estimates.
Securities valuation
Investments in equity securities are valued each business day as of the close of regular trading on the New York Stock Exchange, which is usually 4:00 p.m. (Eastern Time). Securities which are traded on a national or foreign securities exchange are valued at the last reported sales price, except that securities listed on The Nasdaq Stock Market, Inc. (“Nasdaq”) are valued at the Nasdaq Official Closing Price (“NOCP”), and if no NOCP is available, then at the last reported sales price. If no sales price is shown on the Nasdaq, the bid price will be used. In the absence of any sale of securities listed on the Nasdaq, and in the case of other securities (including U.S. Government obligations, but excluding debt securities maturing in 60 days or less), the price will be deemed “stale” and the valuations will be determined in accordance with the Fund’s Fair Value Procedures.
Securities denominated in foreign currencies are translated into U.S. dollars using the closing rates of exchange in effect on the day of valuation.
Many securities markets and exchanges outside the U.S. close prior to the close of the New York Stock Exchange and therefore may not fully reflect trading or events that occur after the close of the principal exchange in which the foreign securities are traded, but before the close of the New York Stock Exchange. If such trading or events are expected to materially affect the value of securities, then fair value pricing procedures approved by the Board of Trustees are applied. These procedures take into account multiple factors including movements in U.S. securities markets after foreign exchanges close. As a result of the fair value pricing procedures, these securities which are normally categorized as Level 1 in the fair value hierarchy will represent a transfer from a Level 1 to a Level 2 security and will be categorized as Level 2. Depending on market activity, such fair valuations may be frequent. Such fair value pricing may result in NAVs that are higher or lower than NAVs based on the closing price or latest quoted bid price. On April 30, 2012, fair value pricing was not used in pricing foreign securities.
Investments in open-end mutual funds and non-registered investment companies are generally valued at net asset value.
Investments which are not valued using any of the methods discussed above, are valued at their fair value, as determined by procedures established in good faith and approved by the Board of Trustees. The Board of Trustees has established a Valuation Committee comprised of the Trustees and has delegated to it the authority to take any actions regarding the valuation of portfolio securities that the Valuation Committee deems necessary in determining the fair value of portfolio securities, unless the responsibility has been delegated to the Management Valuation Team of Wells Fargo Funds Management, LLC (“Funds Management”). The Board of Trustees retains the authority to make or ratify any valuation decisions or approve any changes to the Fair Value Procedures as it deems appropriate. On a quarterly basis, the Board of Trustees considers for ratification any valuation actions taken by the Valuation Committee or the Management Valuation Team.
Valuations of fair valued prices are compared to the next actual sales price when available, or other appropriate market information to assess the continued appropriateness of the fair valuation methodology used. The securities are fair valued on a day-to-day basis, taking into consideration changes to appropriate market information and any significant changes to the input factors considered in the valuation process until there is a readily available price provided on the exchange or by an independent pricing service. Valuations received from an independent pricing service or broker quotes are periodically validated by comparisons to most recent trades and valuations provided by other independent
| | | | | | |
| Notes to Financial Statements (Unaudited) | | Wells Fargo Advantage Small Cap Opportunities Fund | | | 19 | |
pricing services in addition to the review of prices by the adviser and/or sub-adviser. Unobservable inputs used in determining fair valuations are identified based on the type of security, taking into consideration factors utilized by market participants in valuing the investment, knowledge about the issuer and the current market environment.
Foreign currency translation
The accounting records of the Fund are maintained in U.S. dollars. Assets, including investment securities, and liabilities denominated in foreign currency are translated into U.S. dollars at the prevailing rates of exchange at the date of valuation. Purchases and sales of securities, and income and expenses are translated at the prevailing rate of exchange on the respective dates of such transactions. Reported net realized foreign exchange gains or losses arise from sales of foreign currencies, currency gains or losses realized between the trade and settlement dates on securities transactions, and the difference between the amounts of dividends, interest and foreign withholding taxes recorded and the U.S. dollar equivalent of the amounts actually paid or received. Net unrealized foreign exchange gains and losses arise from changes in the fair value of assets and liabilities other than investments in securities resulting in changes in exchange rates.
The changes in net assets arising from changes in exchange rates and the changes in net assets resulting from changes in market prices of securities are not separately presented. Such changes are recorded with net realized and unrealized gains or losses from investments. Gains and losses from certain foreign currency transactions are treated as ordinary income for U.S. federal income tax purposes.
Security loans
The Fund may lend its securities from time to time in order to earn additional income in the form of fees or interest on securities received as collateral or the investment of any cash received as collateral. The Fund continues to receive interest or dividends on the securities loaned. The Fund receives collateral in the form of cash or securities with a value at least equal to the value of the securities on loan. The value of the loaned securities is determined at the close of each business day and any additional required collateral is delivered to the Fund on the next business day. In a securities lending transaction, the net asset value of the Fund will be affected by an increase or decrease in the value of the securities loaned and by an increase or decrease in the value of the instrument in which collateral is invested. The amount of securities lending activity undertaken by the Fund fluctuates from time to time. In the event of default or bankruptcy by the borrower, the Fund may be prevented from recovering the loaned securities or gaining access to the collateral or may experience delays or costs in doing so. In addition, the investment of any cash collateral received may lose all or part of its value. The Fund has the right under the lending agreement to recover the securities from the borrower on demand.
The Fund lends its securities through an unaffiliated securities lending agent. Cash collateral received in connection with its securities lending transactions is invested in Wells Fargo Securities Lending Cash Investments, LLC (the “Cash Collateral Fund”). The Cash Collateral Fund is exempt from registration under Section 3(c)(7) of the 1940 Act and is managed by Funds Management and is sub-advised by Wells Capital Management Incorporated (“Wells Capital Management”). Funds Management receives an advisory fee starting at 0.05% and declining to 0.01% as the average daily net assets of the Cash Collateral Fund increase. All of the fees received by Funds Management are paid to Wells Capital Management for its services as sub-adviser. The Cash Collateral Fund seeks to provide a positive return compared to the daily Fed Funds Open rate by investing in high-quality, U.S. dollar-denominated short-term money market instruments. Cash Collateral Fund investments are fair valued based upon the amortized cost valuation technique. Income earned from investment in the Cash Collateral Fund is included in securities lending income on the Statement of Operations.
For Wells Fargo Advantage Funds that participated in securities lending activity prior to February 13, 2009, certain structured investment vehicles purchased in a joint account by the former securities lending agent defaulted or were impaired. Certain of the Wells Fargo Advantage Funds still hold ownership interest in these structured investment vehicles, which have since been restructured as pass-through securities. If the Fund holds an ownership interest in such pass-through securities, information regarding this ownership interest can be found in the Portfolio of Investments under the category “Other”.
Security transactions and income recognition
Securities transactions are recorded on a trade date basis. Realized gains or losses are reported on the basis of identified cost of securities delivered.
| | | | |
| 20 | | Wells Fargo Advantage Small Cap Opportunities Fund | | Notes to Financial Statements (Unaudited) |
Dividend income is recognized on the ex-dividend date, except for certain dividends from foreign securities, which are recorded as soon as the Fund is informed of the ex-dividend date. Dividend income from foreign securities is recorded net of foreign taxes withheld where recovery of such taxes is not assured.
Distributions to shareholders
Distributions to shareholders from net investment income and net realized gains, if any, are recorded on the ex-dividend date. Such distributions are determined in conformity with income tax regulations, which may differ from generally accepted accounting principles.
Federal and other taxes
The Fund intends to continue to qualify as a regulated investment company by distributing substantially all of its investment company taxable income and any net realized capital gains (after reduction for capital loss carryforwards) sufficient to relieve it from all, or substantially all, federal income taxes. Accordingly, no provision for federal income taxes was required.
The Fund’s income and federal excise tax returns and all financial records supporting those returns for the prior three fiscal years are subject to examination by the federal and Delaware revenue authorities. Management has analyzed the Fund’s tax positions taken on federal, state, and foreign tax returns for all open tax years and does not believe that there are any uncertain tax positions that require recognition of a tax liability.
Under the recently enacted Regulated Investment Company Modernization Act of 2010, the Fund is permitted to carry forward capital losses incurred in taxable years which began after December 22, 2010 for an unlimited period. However, any losses incurred are required to be utilized prior to the losses incurred in pre-enactment taxable years. As a result of this ordering rule, pre-enactment capital loss carryforwards may be more likely to expire unused. Post-enactment capital losses that are carried forward will retain their character as either short-term or long-term capital losses rather than be considered all short-term as under previous law. In addition, the Fund may elect to defer any portion of a post-October capital loss or qualified late-year ordinary loss to the first day of the following taxable year. A post-October capital loss is the greatest of the net capital loss, net short-term capital loss or net long-term capital loss for the portion of the taxable year after October 31. A qualified late-year ordinary loss is the net loss comprised of (a) net gain or loss from the sale or other disposition of capital assets for the portion of the taxable year after October 31, and (b) other ordinary income or loss for the portion of the taxable year after December 31.
3. FAIR VALUATION MEASUREMENTS
Fair value measurements of investments are determined within a framework that has established a fair value hierarchy based upon the various data inputs utilized in determining the value of the Fund’s investments. The three-level hierarchy gives the highest priority to unadjusted quoted prices in active markets for identical assets or liabilities (Level 1) and the lowest priority to significant unobservable inputs (Level 3). The Fund’s investments are classified within the fair value hierarchy based on the lowest level of input that is significant to the fair value measurement. The inputs are summarized into three broad levels as follows:
| n | | Level 1 – quoted prices in active markets for identical securities |
| n | | Level 2 – other significant observable inputs (including quoted prices for similar securities, interest rates, prepayment speeds, credit risk, etc.) |
| n | | Level 3 – significant unobservable inputs (including the Fund’s own assumptions in determining the fair value of investments) |
The inputs or methodologies used for valuing securities are not necessarily an indication of the risk associated with investing in those securities.
| | | | | | |
| Notes to Financial Statements (Unaudited) | | Wells Fargo Advantage Small Cap Opportunities Fund | | | 21 | |
As of April 30, 2012, the inputs used in valuing the Fund’s assets, which are carried at fair value, were as follows:
| | | | | | | | | | | | | | | | |
| Investments in Securities | | Quoted Prices (Level 1) | | | Significant Other
Observable Inputs (Level 2) | | | Significant Unobservable Inputs (Level 3) | | | Total | |
Equity securities | | | | | | | | | | | | | | | | |
Common stocks | | $ | 590,782,723 | | | $ | 0 | | | $ | 0 | | | $ | 590,782,723 | |
Investment companies | | | 6,652,831 | | | | 0 | | | | 0 | | | | 6,652,831 | |
Other | | | 0 | | | | 0 | | | | 1,784,049 | | | | 1,784,049 | |
Short-term investments | | | | | | | | | | | | | | | | |
Investment companies | | | 78,180,184 | | | | 69,799,215 | | | | 0 | | | | 147,979,399 | |
| | | $ | 675,615,738 | | | $ | 69,799,215 | | | $ | 1,784,049 | | | $ | 747,199,002 | |
Further details on the major security types listed above can be found in the Portfolio of Investments.
Transfers in and transfers out are recognized at the end of the reporting period. For the six months ended April 30, 2012, the Fund did not have any significant transfers into/out of Level 1 and Level 2.
4. TRANSACTIONS WITH AFFILIATES AND OTHER EXPENSES
Advisory fee
The Trust has entered into an advisory contract with Funds Management, an indirect wholly owned subsidiary of Wells Fargo & Company (“Wells Fargo”). The adviser is responsible for implementing investment policies and guidelines and for supervising the sub-adviser, who is responsible for day-to-day portfolio management of the Fund.
Pursuant to the contract, Funds Management is entitled to receive an annual advisory fee starting at 0.80% and declining to 0.70% as the average daily net assets of the Fund increase. For the six months ended April 30, 2012, the advisory fee was equivalent to an annual rate of 0.79% of the Fund’s average daily net assets.
Funds Management has retained the services of certain sub-advisers to provide daily portfolio management to the Fund. The fees related to sub-advisory services are borne directly by Funds Management and do not increase the overall fees paid by the Fund. Schroder Investment Management North America Inc. is the sub-adviser to the Fund and is entitled to receive a fee from Funds Management at an annual rate starting at 0.50% and declining to 0.45% as the average daily net assets of the Fund increase.
Administration and transfer agent fees
The Trust has entered into an administration agreement with Funds Management. Under this agreement, for providing administrative services, which includes paying fees and expenses for services provided by the transfer agent, sub-transfer agents, omnibus account servicers and record-keepers, Funds Management is entitled to receive from the Fund an annual fund level administration fee starting at 0.05% and declining to 0.03% as the average daily net assets of the Fund increase and for Administrator Class shares, a class level administration fee of 0.10% of its average daily net assets.
Funds Management has contractually waived and/or reimbursed advisory and administration fees to the extent necessary to maintain certain net operating expense ratios for the Fund. Waiver of fees and/or reimbursement of expenses by Funds Management were made first from fund level expenses on a proportionate basis and then from class specific expenses. Funds Management has committed through February 28, 2013 to waive fees and/or reimburse expenses to the extent necessary to cap the Fund’s expenses at 1.20% for Administrator Class.
Shareholder servicing fees
The Trust has entered into contracts with one or more shareholder servicing agents, whereby Administrator Class of the Fund is charged a fee at an annual rate of 0.25% of its average daily net assets.
A portion of these total shareholder servicing fees were paid to affiliates of Wells Fargo.
5. INVESTMENT PORTFOLIO TRANSACTIONS
Purchases and sales of investments, excluding U.S. Government obligations (if any) and short-term securities, for the six months ended April 30, 2012 were $229,650,284 and $262,795,028, respectively.
| | | | |
| 22 | | Wells Fargo Advantage Small Cap Opportunities Fund | | Notes to Financial Statements (Unaudited) |
6. BANK BORROWINGS
The Trust (excluding the money market funds) and Wells Fargo Variable Trust are parties to a $150,000,000 revolving credit agreement with State Street Bank and Trust Company, whereby the Fund is permitted to use bank borrowings for temporary or emergency purposes, such as to fund shareholder redemption requests. Interest under the credit agreement is charged to the Fund based on a borrowing rate equal to the higher of the Federal Funds rate in effect on that day plus 1.25% or the overnight LIBOR rate in effect on that day plus 1.25%. In addition, an annual commitment fee equal to 0.10% of the unused balance is allocated to each participating fund. For the six months ended April 30, 2012, the Fund paid $766 in commitment fees.
For the six months ended April 30, 2012, there were no borrowings by the Fund under the agreement.
7. INDEMNIFICATION
Under the Trust’s organizational documents, the officers and directors are indemnified against certain liabilities that may arise out of performance of their duties to the Trust. Additionally, in the normal course of business, the Trust may enter into contracts with service providers that contain a variety of indemnification clauses. The Trust’s maximum exposure under these arrangements is dependent on future claims that may be made against the Fund and, therefore, cannot be estimated.
8. NEW ACCOUNTING PRONOUNCEMENTS
In December 2011, the Financial Accounting Standards Board (“FASB”) issued Accounting Standard Update (“ASU”) No. 2011-11, Disclosures about Offsetting Assets and Liabilities. ASU 2011-11, which amends FASB ASC Topic 210, Balance Sheet, creates new disclosure requirements which require entities to disclose both gross and net information for derivatives and other financial instruments that are either offset in the Statement of Assets and Liabilities or subject to an enforceable master netting arrangement or similar agreement. The disclosure requirements are effective for interim and annual reporting periods beginning on or after January 1, 2013. Management is currently assessing the potential impact, in addition to expanded financial statement disclosure, that may result from adopting this ASU.
In May 2011, FASB issued ASU No. 2011-04 Amendments to Achieve Common Fair Value Measurement and Disclosure Requirements in U.S. GAAP and IFRSs. ASU No. 2011-04 amends FASB ASC Topic 820, Fair Value Measurements, to establish common requirements for measuring fair value and for disclosing information about fair value measurements in accordance with GAAP. The ASU is effective prospectively for interim and annual periods beginning after December 15, 2011. Management expects that adoption of the ASU will result in additional disclosures in the financial statements, as applicable.
In April 2011, FASB issued ASU No. 2011-03 Reconsideration of Effective Control for Repurchase Agreements. ASU No. 2011-03 amends FASB ASC Topic 860, Transfers and Servicing, specifically the criteria required to determine whether a repurchase agreement (repo) and similar agreements should be accounted for as sales of financial assets or secured borrowings with commitments. ASU No. 2011-03 changes the assessment of effective control by focusing on the transferor’s contractual rights and obligations and removing the criterion to assess its ability to exercise those rights or honor those obligations. This could result in changes to the way entities account for certain transactions including repurchase agreements, mortgage dollar rolls and reverse repurchase agreements. The ASU will become effective on a prospective basis for new transfers and modifications to existing transactions as of the beginning of the first interim or annual period beginning on or after December 15, 2011. Management has evaluated the impact of adopting the ASU and expects no significant changes.
| | | | | | |
| Other Information (Unaudited) | | Wells Fargo Advantage Small Cap Opportunities Fund | | | 23 | |
PROXY VOTING INFORMATION
A description of the policies and procedures that the Fund uses to determine how to vote proxies relating to portfolio securities is available without charge, upon request, by calling 1-800-222-8222, visiting our Web site at wellsfargoadvantagefunds.com, or visiting the SEC Web site at sec.gov. Information regarding how the Fund voted proxies relating to portfolio securities during the most recent 12-month period ended June 30 is available without charge on the Fund’s Web site at wellsfargoadvantagefunds.com or by visiting the SEC Web site at sec.gov.
PORTFOLIO HOLDINGS INFORMATION
The complete portfolio holdings for the Fund are publicly available on the Fund’s Web site (wellsfargoadvantagefunds.com) on a monthly, 30-day or more delayed basis. In addition, top ten holdings information for the Fund is publicly available on the Fund’s Web site on a monthly, seven-day or more delayed basis. The Fund files its complete schedule of portfolio holdings with the SEC for the first and third quarters of each fiscal year on Form N-Q, which is available without charge by visiting the SEC Web site at sec.gov. In addition, the Fund’s Form N-Q may be reviewed and copied at the SEC’s Public Reference Room in Washington, DC, and at regional offices in New York City, at 233 Broadway, and in Chicago, at 175 West Jackson Boulevard, Suite 900. Information about the Public Reference Room may be obtained by calling 1-800-SEC-0330.
| | | | |
| 24 | | Wells Fargo Advantage Small Cap Opportunities Fund | | Other Information (Unaudited) |
BOARD OF TRUSTEES
The following table provides basic information about the Board of Trustees (the “Trustees”) of the Trust and Officers of the Trust. This table should be read in conjunction with the Prospectus and the Statement of Additional Information1 of the Fund. Each of the Trustees and Officers listed below acts in identical capacities for the Wells Fargo Advantage family of funds, which consists of 137 funds comprising the Wells Fargo Funds Trust, Wells Fargo Variable Trust, Wells Fargo Master Trust and four closed-end funds (collectively the “Fund Complex”). All of the Trustees are also Members of the Audit and Governance Committees of each Trust in the Fund Complex. The mailing address of each Trustee and Officer is 525 Market Street, 12th Floor, San Francisco, CA 94105. Each Trustee and Officer serves an indefinite term, however, each Trustee serves such term until reaching the mandatory retirement age established by the Trustees.
Independent Trustees
| | | | | | |
Name and Year of Birth | | Position Held and Length of Service | | Principal Occupations During Past Five Years | | Other Directorships During
Past Five Years |
Peter G. Gordon
(Born 1942) | | Trustee, since 1998; Chairman, since 2005 (Lead Trustee since 2001) | | Co-Founder, Retired Chairman, President and CEO of Crystal Geyser Water Company. Trustee Emeritus, Colby College | | Asset Allocation Trust |
Isaiah Harris, Jr.
(Born 1952) | | Trustee, since 2009 | | Retired. Prior thereto, President and CEO of BellSouth Advertising and Publishing Corp. from 2005 to 2007, President and CEO of BellSouth Enterprises from 2004 to 2005 and President of BellSouth Consumer Services from 2000 to 2003. Emeritus member of the Iowa State University Foundation Board of Governors. Emeritus Member of the Advisory Board of Iowa State University School of Business. Mr. Harris is a certified public accountant. | | CIGNA Corporation; Deluxe Corporation; Asset Allocation Trust |
Judith M. Johnson
(Born 1949) | | Trustee, since 2008 | | Retired. Prior thereto, Chief Executive Officer and Chief Investment Officer of Minneapolis Employees Retirement Fund from 1996 to 2008. Ms. Johnson is an attorney, certified public accountant and a certified managerial accountant. | | Asset Allocation Trust |
Leroy Keith, Jr.
(Born 1939) | | Trustee, since 2010 | | Chairman, Bloc Global Services (development and construction). Trustee of the Evergreen Funds from 1983 to 2010. Former Managing Director, Almanac Capital Management (commodities firm), former Partner, Stonington Partners, Inc. (private equity fund), former Director, Obagi Medical Products Co. and former Director, Lincoln Educational Services. | | Trustee, Virtus Fund Complex (consisting of 40 portfolios as of 12/31/11); Asset Allocation Trust |
David F. Larcker
(Born 1950) | | Trustee, since 2009 | | James Irvin Miller Professor of Accounting at the Graduate School of Business, Stanford University, Director of Corporate Governance Research Program and Senior Faculty of The Rock Center for Corporate Governance since 2006. From 2005 to 2008, Professor of Accounting at the Graduate School of Business, Stanford University. Prior thereto, Ernst & Young Professor of Accounting at The Wharton School, University of Pennsylvania from 1985 to 2005. | | Asset Allocation Trust |
Olivia S. Mitchell
(Born 1953) | | Trustee, since 2006 | | International Foundation of Employee Benefit Plans Professor, Wharton School of the University of Pennsylvania since 1993. Director of Wharton’s Pension Research Council and Boettner Center on Pensions & Retirement Research, and Research Associate at the National Bureau of Economic Research. Previously, Cornell University Professor from 1978 to 1993. | | Asset Allocation Trust |
| | | | | | |
| Other Information (Unaudited) | | Wells Fargo Advantage Small Cap Opportunities Fund | | | 25 | |
| | | | | | |
Name and Year of Birth | | Position Held and Length of Service | | Principal Occupations During Past Five Years | | Other Directorships During
Past Five Years |
Timothy J. Penny
(Born 1951) | | Trustee, since 1996 | | President and CEO of Southern Minnesota Initiative Foundation, a non-profit organization, since 2007 and Senior Fellow at the Humphrey Institute Policy Forum at the University of Minnesota since 1995. Member of the Board of Trustees of NorthStar Education Finance, Inc., a non-profit organization, since 2007. | | Asset Allocation Trust |
Michael S. Scofield
(Born 1943) | | Trustee, since 2010 | | Served on the Investment Company Institute’s Board of Governors and Executive Committee from 2008-2011 as well the Governing Council of the Independent Directors Council from 2006-2011 and the Independent Directors Council Executive Committee from 2008-2011. Chairman of the IDC from 2008-2010. Institutional Investor (Fund Directions) Trustee of Year in 2007. Trustee of the Evergreen Funds (and its predecessors) from 1984 to 2010. Chairman of the Evergreen Funds from 2000-2010. Former Trustee of the Mentor Funds. Retired Attorney, Law Offices of Michael S. Scofield and former Director and Chairman, Branded Media Corporation (multi-media branding company). | | Asset Allocation Trust |
Donald C. Willeke
(Born 1940) | | Trustee, since 1996 | | Principal of the law firm of Willeke & Daniels. General Counsel of the Minneapolis Employees Retirement Fund from 1984 until its consolidation into the Minnesota Public Employees Retirement Association on June 30, 2010. Director and Vice Chair of The Free Trust (non-profit corporation). Director of the American Chestnut Foundation (non-profit corporation). | | Asset Allocation Trust |
Officers
| | | | | | |
Name and Year of Birth | | Position Held and
Length of Service | | Principal Occupations During Past Five Years | | |
Karla M. Rabusch
(Born 1959) | | President, since 2003 | | Executive Vice President of Wells Fargo Bank, N.A. and President of Wells Fargo Funds Management, LLC since 2003. Senior Vice President and Chief Administrative Officer of Wells Fargo Funds Management, LLC from 2001 to 2003. | | |
C. David Messman
(Born 1960) | | Secretary, since 2000; Chief Legal Counsel, since 2003 | | Senior Vice President and Secretary of Wells Fargo Funds Management, LLC since 2001. Vice President and Managing Senior Counsel of Wells Fargo Bank, N.A. since 1996. | | |
Kasey Phillips
(Born 1970) | | Treasurer, since 2009 | | Senior Vice President of Wells Fargo Funds Management, LLC since 2009. Senior Vice President of Evergreen Investment Management Company, LLC from 2006 to 2010. Treasurer of the Evergreen Funds from 2005 to 2010. | | |
David Berardi
(Born 1975) | | Assistant Treasurer, since 2009 | | Vice President of Wells Fargo Funds Management, LLC since 2009. Vice President of Evergreen Investment Management Company, LLC from 2008 to 2010. Assistant Vice President of Evergreen Investment Services, Inc. from 2004 to 2008. Manager of Fund Reporting and Control for Evergreen Investment Management Company, LLC from 2004 to 2010. | | |
Jeremy DePalma
(Born 1974) | | Assistant Treasurer, since 2009 | | Senior Vice President of Wells Fargo Funds Management, LLC since 2009. Senior Vice President of Evergreen Investment Management Company, LLC from 2008 to 2010. Vice President, Evergreen Investment Services, Inc. from 2004 to 2007. Head of the Fund Reporting and Control Team within Fund Administration from 2005 to 2010. | | |
Debra Ann Early
(Born 1964) | | Chief Compliance Officer, since 2007 | | Chief Compliance Officer of Wells Fargo Funds Management, LLC since 2007. Chief Compliance Officer of Parnassus Investments from 2005 to 2007. Chief Financial Officer of Parnassus Investments from 2004 to 2007 and Senior Audit Manager of PricewaterhouseCoopers LLP from 1998 to 2004. | | |
| 1. | The Statement of Additional Information includes additional information about the Trustees and is available, without charge, upon request, by calling 1-800-222-8222 or by visiting the Web site at wellsfargoadvantagefunds.com. |
| | | | |
| 26 | | Wells Fargo Advantage Small Cap Opportunities Fund | | Other Information (Unaudited) |
BOARD CONSIDERATION OF INVESTMENT ADVISORY AND SUB-ADVISORY AGREEMENTS:
Under Section 15 of the Investment Company Act of 1940 (the “1940 Act”), the Board of Trustees (the “Board”) of Wells Fargo Funds Trust (the “Trust”), all the members of which have no direct or indirect interest in the investment advisory and sub-advisory agreements and are not “interested persons” of the Trust, as defined in the 1940 Act (the “Independent Trustees”), must determine whether to approve the continuation of the Trust’s investment advisory and sub-advisory agreements. In this regard, at an in person meeting held on March 29-30, 2012 (the “Meeting”), the Board reviewed and re-approved: (i) an investment advisory agreement with Wells Fargo Funds Management, LLC (“Funds Management”) for Wells Fargo Advantage Small Cap Opportunities Fund (the “Fund”) and (ii) an investment sub-advisory agreement with Schroder Investment Management North America Inc. (“Schroder”) for the Fund. The investment advisory agreement with Funds Management and the investment sub-advisory agreement with Schroder are collectively referred to as the “Advisory Agreements.”
At the Meeting, the Board considered the factors and reached the conclusions described below relating to the selection of Funds Management and Schroder and the continuation of the Advisory Agreements. Prior to the Meeting, the Trustees conferred extensively among themselves and with representatives of Funds Management about these matters. The Board also met throughout the year and received information that was useful to them in considering the continuation of the Advisory Agreements. The Independent Trustees were assisted in their evaluation of the Advisory Agreements by independent legal counsel, from whom they received separate legal advice and with whom they met separately from Funds Management.
In providing information to the Board, Funds Management was guided by a detailed set of requests submitted by the Independent Trustees’ independent legal counsel on their behalf at the start of the Board’s annual contract renewal process earlier in 2012. In approving the Advisory Agreements, the Board did not identify any particular information or consideration that was all-important or controlling, and each Trustee likely attributed different weights to various factors.
Nature, extent and quality of services
The Board received and considered various information regarding the nature, extent and quality of services provided to the Fund by Funds Management and Schroder under the Advisory Agreements. The Board also received and considered, among other things, information about the background and experience of senior management of Funds Management, and the qualifications, backgrounds, tenures and responsibilities of the portfolio managers primarily responsible for the day-to-day portfolio management of the Fund.
The Board evaluated the ability of Funds Management and Schroder, based on their respective financial condition, resources, reputation and other attributes, to attract and retain qualified investment professionals, including research, advisory, and supervisory personnel. The Board further considered the compliance programs and compliance records of Funds Management and Schroder. In addition, the Board took into account the administrative services provided to the Fund by Funds Management and its affiliates.
The Board’s decision to approve the continuation of the Advisory Agreements was based on a comprehensive evaluation of all of the information provided to it. In considering these matters, the Board considered not only the specific information presented in connection with the Meeting, but also the knowledge gained over time through interaction with Funds Management and Schroder about various topics, including Funds Management’s oversight of service providers. The above factors, together with those referenced below, are some of the most important, but not necessarily all, factors considered by the Board in concluding that the nature, extent and quality of the investment advisory services provided to the Fund by Funds Management and Schroder supported the re-approval of the Advisory Agreements. Although the Board considered the continuation of the Advisory Agreements for the Fund as part of the larger process of considering the continuation of the advisory agreements for all of the funds in the complex, its decision to continue the Advisory Agreements for the Fund was ultimately made on a fund-by-fund basis.
Fund performance and expenses
The Board considered the performance results for the Fund over various time periods ended December 31, 2011. The Board also considered these results in comparison to the median performance of a universe of relevant funds (the “Universe”) that was determined by Lipper Inc. (“Lipper”) to be similar to the Fund, and in comparison to the Fund’s benchmark index and to other comparative data. Lipper is an independent provider of investment company data. The Board received a description of the methodology used by Lipper to select the mutual funds in the Universe. The Board
| | | | | | |
| Other Information (Unaudited) | | Wells Fargo Advantage Small Cap Opportunities Fund | | | 27 | |
noted that while the performance of the Fund was lower than the median performance of the Universe for the more recent periods, the performance of the Fund was higher than the median performance of the Universe for the longer-term periods under review. The Board also noted that while the performance of the Fund was lower than the performance of its benchmark, the Lipper Small-Cap Core Funds Index, for the more recent periods under review, the performance of the Fund was higher than the Lipper Small-Cap Core Funds Index for the longer-term periods.
The Board also noted that the Fund’s more recent performance results warranted further discussion. As part of its further review, the Board received an analysis of, and discussed factors contributing to, the underperformance of the Fund relative to the Universe. Funds Management affirmed its confidence in the investment team and process due to the team’s demonstrated ability to achieve outperformance over the long-term. The Board was satisfied that Funds Management was appropriately monitoring the Fund’s investment performance.
The Board received and considered information regarding the Fund’s contractual advisory fee and net operating expense ratio and its various components, including actual management fees (which reflect fee waivers, if any), transfer agent, custodian and other non-management fees, Rule 12b-1 and non-Rule 12b-1 fees, service fees and fee waiver and expense reimbursement arrangements. The Board also considered the ratio in comparison to the median ratio of an expense Universe and a narrower expense group of mutual funds (each, an “Expense Group”) that was determined by Lipper to be similar to the Fund. The Board received a description of the methodology used by Lipper to select the mutual funds in the Fund’s Expense Group. The Board noted that the net operating expense ratio of the Fund was in range of the Fund’s Expense Group’s median net operating expense ratio.
Based on the above-referenced considerations and other factors, the Board concluded that the overall performance and expense structure of the Fund supported the re-approval of the Advisory Agreements for the Fund.
Investment advisory and sub-advisory fee rates
The Board reviewed and considered the contractual investment advisory fee rate that is payable by the Fund to Funds Management for investment advisory services (the “Advisory Agreement Rate”), both on a stand-alone basis and on a combined basis with the Fund’s administration fee rate. The Board took into account the separate administrative and other services covered by the administration fee rate. The Board also reviewed and considered the contractual investment sub-advisory fee rate that is payable by Funds Management to Schroder for investment sub-advisory services (the “Sub-Advisory Agreement Rate”). In addition, the Board reviewed and considered the existing fee waiver/cap arrangements applicable to the Advisory Agreement Rate and considered the Advisory Agreement Rate after taking the waivers/caps into account (the “Net Advisory Rate”).
The Board received and considered information comparing the Advisory Agreement Rate and Net Advisory Rate with those of other funds in the Fund’s Expense Group median. The Board noted that the Advisory Agreement Rate and Net Advisory Rate for the Fund were higher than the median rates for the Fund’s Expense Group. The Board noted that the Net Advisory Rate for the Fund’s Expense Group did not include transfer-agent expenses. When adjusted to account for transfer-agent expenses, the Board noted that the Net Advisory Rate for the Fund was in range of the median rate for the Fund’s Expense Group.
The Board also received and considered information about the portion of the total management fee that was retained by Funds Management after payment of the fee to Schroder for sub-advisory services. The Board also considered this amount in comparison to the median amount paid by a sub-advised expense Universe that was determined by Lipper to be similar to the Fund.
The Board also received and considered information about the nature and extent of services offered and fee rates charged by Funds Management and Schroder to other types of clients. In this regard, the Board received information about differences between the services, and the compliance, reporting, and other legal burdens and risks of providing investment advice to mutual funds and those associated with providing advice to non-mutual fund clients such as collective funds or institutional separate accounts.
The Board determined that the Advisory Agreement Rate for the Fund, both with and without an administration fee rate and before and after waivers, was reasonable in light of the Fund’s Expense Group information, the net expense ratio commitments, the services covered by the Advisory Agreements and other information provided. The Board also reviewed and considered the Sub-Advisory Agreement Rate and concluded that the Sub-Advisory Agreement Rate was
| | | | |
| 28 | | Wells Fargo Advantage Small Cap Opportunities Fund | | Other Information (Unaudited) |
reasonable in light of the services covered by the sub-advisory agreement, the sub-advised expense information provided by Lipper, and other information provided.
Profitability
The Board received and considered a profitability analysis of Funds Management, as well as an analysis of the profitability to the collective Wells Fargo businesses that provide services to the Fund. It considered that the information provided to it was necessarily estimated, and that the profitability information provided to it, especially on a fund-by-fund basis, did not necessarily provide a precise tool for evaluating the appropriateness of the Fund’s Advisory Agreement Rate in isolation. It noted that the levels of profitability reported on a fund-by-fund basis varied widely, depending on, among other things, the size and type of fund. The Board concluded that the profitability reported by Funds Management was not unreasonable.
The Board did not consider separate profitability information with respect to Schroder, which is not affiliated with Funds Management. The Board considered that the sub-advisory fees paid to Schroder had been negotiated by Funds Management on an arm’s-length basis and that Schroder’s profitability from its relationship with the Fund was not a material factor in determining whether to renew the sub-advisory agreement.
Economies of scale
With respect to possible economies of scale, the Board reviewed the breakpoints in the Fund’s advisory fee structure, which operate generally to reduce the effective Advisory Agreement Rate of the Fund (as a percentage of Fund assets) as the Fund grows in size. It considered that, as a fund shrinks in size, breakpoints conversely result in increasing fee levels. The Board noted that it would have on-going opportunities to review the appropriate levels of breakpoints in the future, and concluded that the breakpoints as implemented appeared to be a reasonable step toward sharing economies of scale, if any, with the Fund. However, the Board acknowledged the inherent limitations of any analysis of an investment adviser’s economies of scale and of any attempt to correlate breakpoints with such economies, stemming largely from the Board’s understanding that economies of scale are realized, if at all, by an investment adviser across a variety of products and services, not just with respect to a single fund.
Other benefits to Funds Management and Schroder
The Board received and considered information regarding potential “fall-out” or ancillary benefits received by Funds Management and its affiliates and Schroder as a result of their relationship with the Fund. Ancillary benefits could include, among others, benefits directly attributable to the relationship of Funds Management and Schroder with the Fund and benefits potentially derived from an increase in Funds Management’s and Schroder’ business as a result of their relationship with the Fund (such as the ability to market to shareholders other financial products offered by Funds Management and its affiliates or Schroder).
The Board considered that Wells Fargo Funds Distributor, LLC, an affiliate of Funds Management, serves as distributor to the Fund and receives certain compensation for those services. The Board noted that various financial institutions, including affiliates of Funds Management, may receive distribution-related fees, shareholder servicing payments (including amounts derived from payments under Rule 12b-1 plans) and sub-transfer agency fees in respect of shares sold or held through them and services provided.
The Board also reviewed information about whether and to what extent soft dollar credits are sought and how any such credits are utilized and any benefits that may be realized by using an affiliated broker.
Other factors and broader review
The Board also considered the markets for distribution of the Fund’s shares, including the channels through which the Fund’s shares are offered and sold. The Board noted that the Fund is part of one of the few fund families that have both direct-to-fund and intermediary distribution channels. As discussed above, the Board reviews detailed materials received from Funds Management and Schroder annually as part of the re-approval process under Section 15 of the 1940 Act and also reviews and assesses information about the quality of the services that the Fund receives throughout the year. In this regard, the Board has reviewed reports of Funds Management at each of its quarterly meetings, which include, among other things, portfolio reviews and performance reports. In addition, the Board confers with portfolio managers at various times throughout the year.
| | | | | | |
| Other Information (Unaudited) | | Wells Fargo Advantage Small Cap Opportunities Fund | | | 29 | |
Conclusion
After considering the above-described factors and based on its deliberations and its evaluation of the information described above, the Board unanimously approved the continuation of the Advisory Agreements for an additional one-year period.
| | | | |
| 30 | | Wells Fargo Advantage Small Cap Opportunities Fund | | List of Abbreviations |
The following is a list of common abbreviations for terms and entities which may have appeared in this report.
| ACB | — Agricultural Credit Bank |
| ADR | — American Depository Receipt |
| ADS | — American Depository Shares |
| AGC-ICC | — Assured Guaranty Corporation - Insured Custody Certificates |
| AGM | — Assured Guaranty Municipal |
| AMBAC | — American Municipal Bond Assurance Corporation |
| AMT | — Alternative Minimum Tax |
| BAN | — Bond Anticipation Notes |
| BHAC | — Berkshire Hathaway Assurance Corporation |
| CAB | — Capital Appreciation Bond |
| CCAB | — Convertible Capital Appreciation Bond |
| CDA | — Community Development Authority |
| CDO | — Collateralized Debt Obligation |
| COP | — Certificate of Participation |
| DRIVER | — Derivative Inverse Tax-Exempt Receipts |
| DW&P | — Department of Water & Power |
| DWR | — Department of Water Resources |
| ECFA | — Educational & Cultural Facilities Authority |
| EDA | — Economic Development Authority |
| EDFA | — Economic Development Finance Authority |
| ETF | — Exchange-Traded Fund |
| FFCB | — Federal Farm Credit Bank |
| FGIC | — Financial Guaranty Insurance Corporation |
| FHA | — Federal Housing Authority |
| FHLB | — Federal Home Loan Bank |
| FHLMC | — Federal Home Loan Mortgage Corporation |
| FICO | — The Financing Corporation |
| FNMA | — Federal National Mortgage Association |
| GDR | — Global Depository Receipt |
| GNMA | — Government National Mortgage Association |
| HCFR | — Healthcare Facilities Revenue |
| HEFA | — Health & Educational Facilities Authority |
| HEFAR | — Higher Education Facilities Authority Revenue |
| HFA | — Housing Finance Authority |
| HFFA | — Health Facilities Financing Authority |
| IBC | — Insured Bond Certificate |
| IDA | — Industrial Development Authority |
| IDAG | — Industrial Development Agency |
| IDR | — Industrial Development Revenue |
| KRW | — Republic of Korea Won |
| LIBOR | — London Interbank Offered Rate |
| LLC | — Limited Liability Company |
| LLP | — Limited Liability Partnership |
| MBIA | — Municipal Bond Insurance Association |
| MFHR | — Multi-Family Housing Revenue |
| MSTR | — Municipal Securities Trust Receipts |
| MUD | — Municipal Utility District |
| NATL-RE | — National Public Finance Guarantee Corporation |
| PCFA | — Pollution Control Finance Authority |
| PCR | — Pollution Control Revenue |
| PFA | — Public Finance Authority |
| PFFA | — Public Facilities Financing Authority |
| PFOTER | — Puttable Floating Option Tax-Exempt Receipts |
| plc | — Public Limited Company |
| PUTTER | — Puttable Tax-Exempt Receipts |
| R&D | — Research & Development |
| RDA | — Redevelopment Authority |
| RDFA | — Redevelopment Finance Authority |
| REIT | — Real Estate Investment Trust |
| ROC | — Reset Option Certificates |
| SAVRS | — Select Auction Variable Rate Securities |
| SBA | — Small Business Authority |
| SFHR | — Single Family Housing Revenue |
| SFMR | — Single Family Mortgage Revenue |
| SPA | — Standby Purchase Agreement |
| SPDR | — Standard & Poor’s Depositary Receipts |
| STRIPS | — Separate Trading of Registered Interest and Principal Securities |
| TAN | — Tax Anticipation Notes |
| TIPS | — Treasury Inflation-Protected Securities |
| TRAN | — Tax Revenue Anticipation Notes |
| TCR | — Transferable Custody Receipts |
| TTFA | — Transportation Trust Fund Authority |
| TVA | — Tennessee Valley Authority |
| XLCA | — XL Capital Assurance |


FOR MORE INFORMATION
More information about Wells Fargo Advantage Funds is available free upon request. To obtain literature, please write, e-mail, visit the Fund’s Web site, or call:
Wells Fargo Advantage Funds
P.O. Box 8266
Boston, MA 02266-8266
E-mail: wfaf@wellsfargo.com
Web site: wellsfargoadvantagefunds.com
Individual investors: 1-800-222-8222
Retail investment professionals: 1-888-877-9275
Institutional investment professionals: 1-866-765-0778
This report and the financial statements contained herein are submitted for the general information of the shareholders of Wells Fargo Advantage Funds. If this report is used for promotional purposes, distribution of the report must be accompanied or preceded by a current prospectus. For a prospectus containing more complete information, including charges and expenses, call 1-800-222-8222 or visit the Fund’s Web site at wellsfargoadvantagefunds.com. Please consider the investment objectives, risks, charges, and expenses of the investment carefully before investing. This and other information about Wells Fargo Advantage Funds can be found in the current prospectus. Read the prospectus carefully before you invest or send money.
Wells Fargo Funds Management, LLC, a wholly owned subsidiary of Wells Fargo & Company, provides investment advisory and administrative services for Wells Fargo Advantage Funds. Other affiliates of Wells Fargo & Company provide subadvisory and other services for the Funds. The Funds are distributed by Wells Fargo Funds Distributor, LLC, Member FINRA/SIPC, an affiliate of Wells Fargo & Company.
NOT FDIC INSURED ¡ NO BANK GUARANTEE ¡ MAY LOSE VALUE
© 2012 Wells Fargo Funds Management, LLC. All rights reserved.
| | |
 | | 209727 06-12 SA243/SAR243 4-12 |

Wells Fargo Advantage Small Cap Value Fund

Semi-Annual Report
April 30, 2012

Reduce clutter. Save trees.
Sign up for electronic delivery of prospectuses and shareholder reports at wellsfargo.com/advantagedelivery
Contents
The views expressed and any forward-looking statements are as of April 30, 2012, unless otherwise noted, and are those of the Fund managers and/or Wells Fargo Funds Management, LLC. Discussions of individual securities, or the markets generally, or any Wells Fargo Advantage Fund are not intended as individual recommendations. Future events or results may vary significantly from those expressed in any forward-looking statements; the views expressed are subject to change at any time in response to changing circumstances in the market. Wells Fargo Funds Management, LLC, disclaims any obligation to publicly update or revise any views expressed or forward-looking statements.
NOT FDIC INSURED ¡ NO BANK GUARANTEE ¡ MAY LOSE VALUE

WELLS FARGO INVESTMENT HISTORY
| | |
| |
| 1932 | | Keystone creates one of the first mutual fund families. |
| |
| 1971 | | Wells Fargo & Company introduces one of the first institutional index funds. |
| |
| 1978 | | Wells Fargo applies Markowitz and Sharpe’s research on Modern Portfolio Theory to introduce one of the industry’s first Tactical Asset Allocation (TAA) models in institutional separately managed accounts. |
| |
| 1984 | | Wells Fargo Stagecoach Funds launches its first asset allocation fund. |
| |
| 1989 | | The Tactical Asset Allocation (TAA) Model is first applied to Wells Fargo’s asset allocation mutual funds. |
| |
| 1994 | | Wells Fargo introduces the LifePath Funds, one of the first suites of target date funds (now the Wells Fargo Advantage Dow Jones Target Date FundsSM). |
| |
| 1996 | | Evergreen Investments and Keystone Funds merge. |
| |
| 1997 | | Wells Fargo launches Wells Fargo Advantage WealthBuilder PortfoliosSM, a fund-of-funds suite of products that includes the use of quantitative models to shift assets among investment styles. |
| |
| 1999 | | Norwest Advantage Funds and Stagecoach Funds are reorganized into Wells Fargo Funds after the merger of Norwest and Wells Fargo. |
| |
| 2002 | | Evergreen Retail and Evergreen Institutional companies form the umbrella asset management company, Evergreen Investments. |
| |
| 2005 | | The integration of Strong Funds with Wells Fargo Funds creates Wells Fargo Advantage Funds, resulting in one of the top 20 mutual fund companies in the United States. |
| |
| 2006 | | Wells Fargo Advantage Funds relaunches the target date product line as Wells Fargo Advantage Dow Jones Target Date Funds. |
| |
| 2010 | | The mergers and reorganizations of Evergreen and Wells Fargo Advantage mutual funds are completed, unifying the families under the brand of Wells Fargo Advantage Funds. |
Wells Fargo Advantage Funds®
Wells Fargo Advantage Funds skillfully guides institutions, financial advisors, and individuals through the investment terrain to help them reach their financial objectives. Everything we do on behalf of investors is backed by our unique combination of qualifications.
Strength
Our organization is built on the standards of integrity and service established by our parent company—Wells Fargo & Company—more than 150 years ago. And, because we’re part of a highly diversified financial enterprise, we offer the depth of resources to help investors succeed.
Expertise
Our multi-boutique model offers investors access to the independent thinking of premier investment managers that have been chosen for their time-tested strategies. While each team specializes in a specific investment strategy, collectively they provide investors a wide choice of distinct investment styles. Our dedication to investment excellence doesn’t end with our expertise in manager selection—risk management, analysis, and rigorous ongoing review seek to ensure each manager’s investment process remains consistent.
Partnership
Our collaborative approach is built around understanding the needs and goals of our clients. By adhering to core principles of sound judgment and steady guidance, we support you through every stage of the investment decision process.
Carefully consider a fund’s investment objectives, risks, charges, and expenses before investing. For a current prospectus and, if available, a summary prospectus, containing this and other information, visit wellsfargoadvantagefunds.com. Read it carefully before investing.
Wells Fargo Funds Management, LLC, a wholly owned subsidiary of Wells Fargo & Company, provides investment advisory and administrative services for Wells Fargo Advantage Funds®. Other affiliates of Wells Fargo & Company provide subadvisory and other services for the Funds. The Funds are distributed by Wells Fargo Funds Distributor, LLC, Member FINRA/SIPC, an affiliate of Wells Fargo & Company.
“Dow Jones®” and “Dow Jones Target Date IndexesSM” are service marks of Dow Jones Trademark Holdings, LLC (“Dow Jones”), have been licensed to CME Group Index Services LLC (“CME Indexes”) and have been sublicensed for use for certain purposes by Global Index Advisors, Inc, and Wells Fargo Funds Management, LLC. The Wells Fargo Advantage Dow Jones Target Date FundsSM based on the Dow Jones Target Date IndexesSM, are not sponsored, endorsed, sold or promoted by Dow Jones, CME Indexes or their respective affiliates and none of them makes any representation regarding the advisability of investing in such product(s).
NOT FDIC INSURED ¡ NO BANK GUARANTEE ¡ MAY LOSE VALUE
Not part of the semi-annual report.
Wells Fargo Advantage Funds offers more than 110 mutual funds across a wide range of asset classes, representing over $211 billion in assets under management, as of April 30, 2012.
| | | | |
| Equity Funds | | | | |
Asia Pacific Fund | | Enterprise Fund† | | Precious Metals Fund |
C&B Large Cap Value Fund | | Equity Value Fund | | Premier Large Company Growth Fund |
C&B Mid Cap Value Fund | | Global Opportunities Fund | | Small Cap Opportunities Fund |
Capital Growth Fund | | Growth Fund | | Small Cap Value Fund |
Common Stock Fund | | Index Fund | | Small Company Growth Fund |
Disciplined U.S. Core Fund | | International Equity Fund | | Small Company Value Fund |
Discovery Fund† | | International Value Fund | | Small/Mid Cap Core Fund |
Diversified Equity Fund | | Intrinsic Small Cap Value Fund | | Small/Mid Cap Value Fund |
Diversified International Fund | | Intrinsic Value Fund | | Special Mid Cap Value Fund |
Diversified Small Cap Fund | | Intrinsic World Equity Fund | | Special Small Cap Value Fund |
Emerging Growth Fund | | Large Cap Core Fund | | Specialized Technology Fund |
Emerging Markets Equity Fund | | Large Cap Growth Fund | | Traditional Small Cap Growth Fund |
Emerging Markets Equity Income Fund | | Large Company Value Fund | | Utility and Telecommunications Fund |
Emerging Markets Local Bond Fund | | Omega Growth Fund | | |
Endeavor Select Fund† | | Opportunity Fund† | | |
| Bond Funds | | | | |
Adjustable Rate Government Fund | | Inflation-Protected Bond Fund | | Short-Term Bond Fund |
California Limited-Term Tax-Free Fund | | Intermediate Tax/AMT-Free Fund | | Short-Term High Yield Bond Fund |
California Tax-Free Fund | | International Bond Fund | | Short-Term Municipal Bond Fund |
Colorado Tax-Free Fund | | Minnesota Tax-Free Fund | | Strategic Municipal Bond Fund |
Government Securities Fund | | Municipal Bond Fund | | Total Return Bond Fund |
High Income Fund | | North Carolina Tax-Free Fund | | Ultra Short-Term Income Fund |
High Yield Bond Fund | | Pennsylvania Tax-Free Fund | | Ultra Short-Term Municipal Income Fund |
Income Plus Fund | | Short Duration Government Bond Fund | | Wisconsin Tax-Free Fund |
| Asset Allocation Funds | | | | |
Absolute Return Fund | | WealthBuilder Equity Portfolio† | | Target 2020 Fund† |
Asset Allocation Fund | | WealthBuilder Growth Allocation Portfolio† | | Target 2025 Fund† |
Conservative Allocation Fund | | WealthBuilder Growth Balanced Portfolio† | | Target 2030 Fund† |
Diversified Capital Builder Fund | | WealthBuilder Moderate Balanced Portfolio† | | Target 2035 Fund† |
Diversified Income Builder Fund | | WealthBuilder Tactical Equity Portfolio† | | Target 2040 Fund† |
Growth Balanced Fund | | Target Today Fund† | | Target 2045 Fund† |
Index Asset Allocation Fund | | Target 2010 Fund† | | Target 2050 Fund† |
Moderate Balanced Fund | | Target 2015 Fund† | | Target 2055 Fund† |
WealthBuilder Conservative Allocation Portfolio† | | | | |
| Money Market Funds | | | | |
100% Treasury Money Market Fund | | Heritage Money Market Fund† | | National Tax-Free Money Market Fund |
California Municipal Money Market Fund | | Money Market Fund | | Prime Investment Money Market Fund |
Cash Investment Money Market Fund | | Municipal Cash Management Money Market Fund | | Treasury Plus Money Market Fund |
Government Money Market Fund | | Municipal Money Market Fund | | |
| Variable Trust Funds1 | | | | |
VT Discovery Fund† | | VT Intrinsic Value Fund | | VT Small Cap Growth Fund |
VT Index Asset Allocation Fund | | VT Omega Growth Fund | | VT Small Cap Value Fund |
VT International Equity Fund | | VT Opportunity Fund† | | VT Total Return Bond Fund |
An investment in a money market fund is not insured or guaranteed by the Federal Deposit Insurance Corporation or any other government agency. Although the Wells Fargo Advantage Money Market Funds seek to preserve the value of your investment at $1.00 per share, it is possible to lose money by investing in a money market fund.
| 1. | The Variable Trust Funds are generally available only through insurance company variable contracts. |
| † | In this report, the Wells Fargo Advantage Discovery FundSM, Wells Fargo Advantage Endeavor Select FundSM, Wells Fargo Advantage Enterprise FundSM, Wells Fargo Advantage Opportunity FundSM, Wells Fargo Advantage WealthBuilder Conservative Allocation PortfolioSM, Wells Fargo Advantage WealthBuilder Equity PortfolioSM, Wells Fargo Advantage WealthBuilder Growth Allocation PortfolioSM, Wells Fargo Advantage WealthBuilder Growth Balanced PortfolioSM, Wells Fargo Advantage WealthBuilder Moderate Balanced PortfolioSM, Wells Fargo Advantage WealthBuilder Tactical Equity PortfolioSM, Wells Fargo Advantage Dow Jones Target Today FundSM, Wells Fargo Advantage Dow Jones Target 2010 FundSM, Wells Fargo Advantage Dow Jones Target 2015 FundSM, Wells Fargo Advantage Dow Jones Target 2020 FundSM, Wells Fargo Advantage Dow Jones Target 2025 FundSM, Wells Fargo Advantage Dow Jones Target 2030 FundSM, Wells Fargo Advantage Dow Jones Target 2035 FundSM, Wells Fargo Advantage Dow Jones Target 2040 FundSM, Wells Fargo Advantage Dow Jones Target 2045 FundSM, Wells Fargo Advantage Dow Jones Target 2050 FundSM, Wells Fargo Advantage Dow Jones Target 2055 FundSM, Wells Fargo Advantage Heritage Money Market FundSM, Wells Fargo Advantage VT Discovery FundSM, and Wells Fargo Advantage VT Opportunity FundSM are referred to as the Discovery Fund, Endeavor Select Fund, Enterprise Fund, Opportunity Fund, WealthBuilder Conservative Allocation Portfolio, WealthBuilder Equity Portfolio, WealthBuilder Growth Allocation Portfolio, WealthBuilder Growth Balanced Portfolio, WealthBuilder Moderate Balanced Portfolio, WealthBuilder Tactical Equity Portfolio, Target Today Fund, Target 2010 Fund, Target 2015 Fund, Target 2020 Fund, Target 2025 Fund, Target 2030 Fund, Target 2035 Fund, Target 2040 Fund, Target 2045 Fund, Target 2050 Fund, Target 2055 Fund, Heritage Money Market Fund, VT Discovery Fund, and VT Opportunity Fund, respectively. |
Not part of the semi-annual report.
| | | | |
| 2 | | Wells Fargo Advantage Small Cap Value Fund | | Letter to Shareholders |

Karla M. Rabusch,
President
Wells Fargo Advantage Funds
The period was marked by continued concerns about the possible global economic effects of the ongoing European sovereign debt crisis that began in Greece and later spread to the larger economies of Italy and Spain.
In contrast to worrisome data from the eurozone, U.S. economic data remained moderately positive.
Dear Valued Shareholder:
We’re pleased to offer you this semi-annual report for the Wells Fargo Advantage Small Cap Value Fund for the six-month period that ended April 30, 2012. The period was marked by continued concerns about the possible global economic effects of the ongoing European sovereign debt crisis that began in Greece and later spread to the larger economies of Italy and Spain. However, relatively positive U.S. economic data resulted in most U.S. stock indexes posting gains for the period, with large-cap stocks modestly outperforming small-cap stocks.
Macroeconomic optimism seemed to fade as global growth slowed and worries rose.
Prior to and throughout the reporting period, concerns about the eurozone sovereign debt situation returned to center stage. Investors became increasingly concerned that Greece would default on its debt, a scenario that only seemed more likely as eurozone leaders began to openly discuss a “voluntary” haircut on Greek debt for private investors. Because many eurozone banks owned Greek debt and many U.S. banks had financial ties to eurozone banks, investors worried about the effects of such an event on the financial systems and on the global economy.
In October 2011, market participants turned their attention to the debt burdens of Italy—which, like the U.S., also had its credit rating downgraded by Standard & Poor’s—because even though it had a relatively modest budget deficit, it had a high amount of outstanding debt and a stagnant economy. French banks were heavily exposed to Italian debt, so Italy’s woes led to fears of a state bailout of French banks and a resulting increase in France’s expenditures.
The Greek credit crisis was seemingly addressed in March 2012, when the Greek government came to an agreement with its creditors that allowed it to write down the principal on most of its bonds in exchange for increased financial austerity. The Greek agreement, combined with unprecedented support for eurozone banks by the European Central Bank (ECB), seemed to calm investor concerns, at least temporarily, and most developed European markets ended the period with gains.
The U.S. economy reported relatively solid news.
In contrast to worrisome data from the eurozone, U.S. economic data remained moderately positive. Reported gross domestic product (GDP) growth came in at a 1.8% annualized rate in the third quarter of 2011 and then accelerated to a 3.0% annualized rate in the fourth quarter. The initial estimate for GDP growth in the first quarter of 2012 came in at a 2.2% annualized rate, further supporting the case for economic recovery. In addition, the major banks appeared to have taken steps toward repairing their balance sheets; in March, the Federal Reserve (Fed) announced that 15 of the 19 major banks had passed a “stress test” in which the Fed attempted to gauge whether the banks could survive a severe recession that included a 50% drop in the stock market and a 21% percent decline in housing prices.
Financial stocks rebounded and outperformed the broader market for the reporting period after the Fed released details of the stress test. Stocks generally rallied across the market as investors seemed to be increasingly confident that the U.S. would not return to recession.
| | | | | | |
| Letter to Shareholders | | Wells Fargo Advantage Small Cap Value Fund | | | 3 | |
Central banks continued to provide stimulus.
Throughout the reporting period, the Federal Open Market Committee kept its key interest rates effectively at zero in order to support the economy and financial system. In response to extreme market volatility and signs of a weakening economy, the Fed announced its intention to keep interest rates low until at least late 2014.
As of November 1, 2011, the ECB had a key rate of 1.50%, which it had increased from 1.0% in an attempt to keep inflation in check. Soon, in response to weakness in the southern European economies, the ECB lowered its key rate to 1.25% in early November 2011 and 1.0% in December 2011. The ECB also continued to provide virtually unlimited liquidity for banks, announcing a Long-Term Refinancing Operation in December through which it provided low-cost three-year loans to lenders.
We use time-tested investment strategies, even as many variables are at work in the market.
Elevated unemployment and debt defaults continue to pressure consumers and businesses alike. In our experience, strict adherence to time-tested investment strategies has its rewards. As a whole, Wells Fargo Advantage Funds represents investments across a range of asset classes and investment styles, giving you an opportunity to create a diversified investment portfolio. While diversification may not prevent losses in a downturn, we believe it helps in managing risk.
Thank you for choosing to invest with Wells Fargo Advantage Funds. We appreciate your confidence in us and remain committed to helping you meet your financial needs. For current information about your fund investments, contact your investment professional, visit our Web site at wellsfargoadvantagefunds.com, or call us directly at 1-800-222-8222. We are available 24 hours a day, 7 days a week.
Sincerely,

Karla M. Rabusch
President
Wells Fargo Advantage Funds
| | | | |
| 4 | | Wells Fargo Advantage Small Cap Value Fund | | Letter to Shareholders |
Notice to Shareholders
The Board of Trustees for Wells Fargo Advantage Funds has unanimously approved the following modifications to certain net asset value (NAV) waiver privileges and commission schedules:
| | n | | Effective May 1, 2012, automatic investment plan (AIP) purchases and proceeds received from systematic withdrawals will no longer qualify for NAV repurchase privileges. | |
| | n | | Effective May 1, 2012, discretionary rights to waive the upfront commission for Class C and “jumbo” Class A share purchases will no longer be granted to broker/dealers. However, we will continue to waive the Class C shares contingent deferred sales charge for redemptions by employer-sponsored retirement plans where the dealer of record waived its commission at the time of purchase. | |
| | n | | Effective July 31, 2012, NAV purchase privileges for former Evergreen Class IS and Class R shareholders are being modified to remove the ability to purchase Class A shares at NAV unless those shares are held directly with the Fund on or after July 31, 2012. | |
Please contact your investment professional or call us directly at 1-800-222-8222 if you have any questions on this Notice to Shareholders.
| | | | | | |
| Performance Highlights (Unaudited) | | Wells Fargo Advantage Small Cap Value Fund | | | 5 | |
INVESTMENT OBJECTIVE
The Fund seeks long-term capital appreciation.
ADVISER
Wells Fargo Funds Management, LLC
SUB-ADVISER
Wells Capital Management Incorporated
PORTFOLIO MANAGERS
Erik C. Astheimer
I. Charles Rinaldi
Michael Schneider, CFA
FUND INCEPTION
December 31, 1997
| | | | |
TEN LARGEST EQUITY HOLDINGS1
(AS OF APRIL 30, 2012) | |
InterOil Corporation | | | 7.84% | |
Randgold Resources Limited ADR | | | 6.25% | |
Chimera Investment Corporation | | | 3.18% | |
Range Resources Corporation | | | 2.97% | |
Chicago Bridge & Iron Company NV | | | 2.68% | |
United Continental Holdings Incorporated | | | 2.27% | |
Orasure Technologies Incorporated | | | 1.90% | |
Trilogy Energy Corporation | | | 1.81% | |
McMoRan Exploration Company | | | 1.66% | |
Argo Group International Holdings Limited | | | 1.62% | |
| | |
SECTOR DISTRIBUTION2
(AS OF APRIL 30, 2012) | | |
|
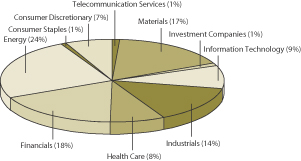 |
| 1. | The ten largest equity holdings are calculated based on the value of the securities divided by total net assets of the Fund. Holdings are subject to change and may have changed since the date specified. |
| 2. | Sector distribution is subject to change and is calculated based on the total long-term investments of the Fund. |
| | | | |
| 6 | | Wells Fargo Advantage Small Cap Value Fund | | Performance Highlights (Unaudited) |
AVERAGE ANNUAL TOTAL RETURN3 (%) (AS OF APRIL 30, 2012)
| | | | | | | | | | | | | | | | | | | | | | | | | | | | | | | | | | | | | | | | | | | | |
| | | | | | Including Sales Charge | | | Excluding Sales Charge | | | Expense Ratios4 | |
| | | Inception Date | | | 6 Months* | | | 1 Year | | | 5 Year | | | 10 Year | | | 6 Months* | | | 1 Year | | | 5 Year | | | 10 Year | | | Gross | | | Net5 | |
Class A (SMVAX) | | | 11/30/2000 | | | | 1.08 | | | | (11.67 | ) | | | 1.27 | | | | 8.13 | | | | 7.24 | | | | (6.30 | ) | | | 2.47 | | | | 8.77 | | | | 1.34% | | | | 1.32% | |
Class B (SMVBX)** | | | 11/30/2000 | | | | 1.80 | | | | (12.01 | ) | | | 1.32 | | | | 8.19 | | | | 6.80 | | | | (7.01 | ) | | | 1.70 | | | | 8.19 | | | | 2.09% | | | | 2.07% | |
Class C (SMVCX) | | | 11/30/2000 | | | | 5.82 | | | | (8.00 | ) | | | 1.71 | | | | 7.96 | | | | 6.82 | | | | (7.00 | ) | | | 1.71 | | | | 7.96 | | | | 2.09% | | | | 2.07% | |
Administrator Class (SMVDX) | | | 07/30/2010 | | | | | | | | | | | | | | | | | | | | 7.32 | | | | (6.09 | ) | | | 2.73 | | | | 8.89 | | | | 1.18% | | | | 1.12% | |
Institutional Class (WFSVX) | | | 07/31/2007 | | | | | | | | | | | | | | | | | | | | 7.44 | | | | (5.92 | ) | | | 2.92 | | | | 9.08 | | | | 0.91% | | | | 0.91% | |
Investor Class (SSMVX) | | | 12/31/1997 | | | | | | | | | | | | | | | | | | | | 7.18 | | | | (6.35 | ) | | | 2.50 | | | | 8.86 | | | | 1.41% | | | | 1.35% | |
Russell 2000® Value Index6 | | | | | | | | | | | | | | | | | | | | | | | 11.47 | | | | (4.06 | ) | | | (0.49 | ) | | | 6.07 | | | | | | | | | |
| * | Returns for periods of less than one year are not annualized. |
| ** | Class B shares are closed to investment, except in connection with the reinvestment of any distributions and permitted exchanges. |
Figures quoted represent past performance, which is no guarantee of future results and do not reflect the deduction of taxes that a shareholder may pay on fund distributions or the redemption of fund shares. Investment return and principal value of an investment will fluctuate so that an investor’s shares, when redeemed, may be worth more or less than their original cost. Performance shown without sales charges would be lower if sales charges were reflected. Current performance may be lower or higher than the performance data quoted and assumes the reinvestment of dividends and capital gains. Current month-end performance is available on the Fund’s Web site – wellsfargoadvantagefunds.com.
Index returns do not include transaction costs associated with buying and selling securities, any mutual fund fees or expenses or any taxes. It is not possible to invest directly in an index.
For Class A shares, the maximum front-end sales charge is 5.75%. For Class B shares, the maximum contingent deferred sales charge is 5.00%. For Class C shares, the maximum contingent deferred sales charge is 1.00%. Performance including sales charge assumes the sales charge for the corresponding time period. Administrator Class, Institutional Class and Investor Class shares are sold without a front-end sales charge or contingent deferred sales charge.
Stock fund values fluctuate in response to the activities of individual companies and general market and economic conditions. Smaller-company stocks tend to be more volatile and less liquid than those of larger companies. The use of derivatives may reduce returns and/or increase volatility. Certain investment strategies tend to increase the total risk of an investment (relative to the broader market). This Fund is exposed to foreign investment risk. Consult the Fund’s prospectus for additional information on these and other risks.
| 3. | Historical performance shown for the Administrator Class shares prior to their inception reflects the performance of the Institutional Class shares, adjusted to reflect the higher expenses applicable to the Administrator Class shares. Historical performance shown for the Institutional Class shares prior to their inception reflects the performance of the Investor Class shares, and includes the higher expenses applicable to the Investor Class shares. If these expenses had not been included, returns would be higher. Effective June 20, 2008, Class Z was renamed Investor Class and modified to assume the features and attributes of the Investor Class. |
| 4. | Reflects the expense ratios as stated in the most recent prospectuses. |
| 5. | The Adviser has committed through February 28, 2013 to waive fees and/or reimburse expenses to the extent necessary to cap the Fund’s Total Annual Fund Operating Expenses After Fee Waiver, excluding certain expenses, at 1.30% for Class A, 2.05% for Class B, 2.05% for Class C, 1.10% for Administrator Class, 0.90% for Institutional Class and 1.33% for Investor Class. Without this cap, the Fund’s returns would have been lower. |
| 6. | The Russell 2000® Value Index measures the performance of those Russell 2000 companies with lower price-to-book ratios and lower forecasted growth values. You cannot invest directly in an index. |
| | | | | | |
| Fund Expenses (Unaudited) | | Wells Fargo Advantage Small Cap Value Fund | | | 7 | |
As a shareholder of the Fund, you incur two types of costs: (1) transaction costs, including sales charges (loads) on purchase payments and contingent deferred sales charges (if any) on redemptions and (2) ongoing costs, including management fees; distribution (12b-1) and/or shareholder service fees; and other Fund expenses. This example is intended to help you understand your ongoing costs (in dollars) of investing in the Fund and to compare these costs with the ongoing costs of investing in other mutual funds.
The example is based on an investment of $1,000 invested at the beginning of the six-month period and held for the entire period from November 1, 2011 to April 30, 2012.
Actual Expenses
The “Actual” line of the table below provides information about actual account values and actual expenses. You may use the information in this line, together with the amount you invested, to estimate the expenses that you paid over the period. Simply divide your account value by $1,000 (for example, an $8,600 account value divided by $1,000 = 8.6), then multiply the result by the number in the “Actual” line under the heading entitled “Expenses Paid During Period” for your applicable class of shares to estimate the expenses you paid on your account during this period.
Hypothetical Example for Comparison Purposes
The “Hypothetical” line of the table below provides information about hypothetical account values and hypothetical expenses based on the Fund’s actual expense ratio and an assumed rate of return of 5% per year before expenses, which is not the Fund’s actual return. The hypothetical account values and expenses may not be used to estimate the actual ending account balance or expenses you paid for the period. You may use this information to compare the ongoing costs of investing in the Fund and other funds. To do so, compare this 5% hypothetical example with the 5% hypothetical examples that appear in the shareholder reports of the other funds.
Please note that the expenses shown in the table are meant to highlight your ongoing costs only and do not reflect any transactional costs, such as sales charges (loads) and contingent deferred sales charges. Therefore, the “Hypothetical” line of the table is useful in comparing ongoing costs only, and will not help you determine the relative total costs of owning different funds. In addition, if these transactional costs were included, your costs would have been higher.
| | | | | | | | | | | | | | | | |
| | | Beginning
Account Value
11-01-2011 | | | Ending
Account Value
04-30-2012 | | | Expenses
Paid During
the Period¹ | | | Net Annual
Expense Ratio | |
Class A | | | | | | | | | | | | | | | | |
Actual | | $ | 1,000.00 | | | $ | 1,072.40 | | | $ | 6.70 | | | | 1.30 | % |
Hypothetical (5% return before expenses) | | $ | 1,000.00 | | | $ | 1,018.40 | | | $ | 6.52 | | | | 1.30 | % |
Class B | | | | | | | | | | | | | | | | |
Actual | | $ | 1,000.00 | | | $ | 1,068.04 | | | $ | 10.54 | | | | 2.05 | % |
Hypothetical (5% return before expenses) | | $ | 1,000.00 | | | $ | 1,014.67 | | | $ | 10.27 | | | | 2.05 | % |
Class C | | | | | | | | | | | | | | | | |
Actual | | $ | 1,000.00 | | | $ | 1,068.24 | | | $ | 10.54 | | | | 2.05 | % |
Hypothetical (5% return before expenses) | | $ | 1,000.00 | | | $ | 1,014.67 | | | $ | 10.27 | | | | 2.05 | % |
Administrator Class | | | | | | | | | | | | | | | | |
Actual | | $ | 1,000.00 | | | $ | 1,073.16 | | | $ | 5.67 | | | | 1.10 | % |
Hypothetical (5% return before expenses) | | $ | 1,000.00 | | | $ | 1,019.39 | | | $ | 5.52 | | | | 1.10 | % |
Institutional Class | | | | | | | | | | | | | | | | |
Actual | | $ | 1,000.00 | | | $ | 1,074.39 | | | $ | 4.64 | | | | 0.90 | % |
Hypothetical (5% return before expenses) | | $ | 1,000.00 | | | $ | 1,020.39 | | | $ | 4.52 | | | | 0.90 | % |
Investor Class | | | | | | | | | | | | | | | | |
Actual | | $ | 1,000.00 | | | $ | 1,071.83 | | | $ | 6.85 | | | | 1.33 | % |
Hypothetical (5% return before expenses) | | $ | 1,000.00 | | | $ | 1,018.25 | | | $ | 6.67 | | | | 1.33 | % |
| 1. | Expenses paid is equal to the annualized expense ratio of each class multiplied by the average account value over the period, multiplied by the number of days in the most recent fiscal half-year divided by the number of days in the fiscal year (to reflect the one-half year period). |
| | | | |
| 8 | | Wells Fargo Advantage Small Cap Value Fund | | Portfolio of Investments—April 30, 2012 (Unaudited) |
| | | | | | | | | | | | |
| Security Name | | | | | | Shares | | | Value | |
| | | | | | | | | | | | |
| | | | |
Common Stocks: 93.79% | | | | | | | | | | | | |
| | | | |
Consumer Discretionary: 6.46% | | | | | | | | | | | | |
| | | | |
| Automobiles: 0.07% | | | | | | | | | | | | |
Winnebago Industries Incorporated † | | | | | | | 260,800 | | | $ | 2,542,801 | |
| | | | | | | | | | | | |
| | | | |
| Diversified Consumer Services: 0.64% | | | | | | | | | | | | |
Cambium Learning Group Incorporated † | | | | | | | 1,344,600 | | | | 3,052,242 | |
Corinthian Colleges Incorporated †** | | | | | | | 5,160,200 | | | | 19,815,170 | |
Voyager Expanded Learning Incorporated †(a)(i) | | | | | | | 1,649,100 | | | | 0 | |
| | | | |
| | | | | | | | | | | 22,867,412 | |
| | | | | | | | | | | | |
| | | | |
| Hotels, Restaurants & Leisure: 1.84% | | | | | | | | | | | | |
Denny’s Corporation † | | | | | | | 3,235,932 | | | | 13,396,758 | |
Scientific Games Corporation Class A † | | | | | | | 2,291,800 | | | | 23,284,688 | |
The Wendy’s Company | | | | | | | 6,088,000 | | | | 29,648,560 | |
| | | | |
| | | | | | | | | | | 66,330,006 | |
| | | | | | | | | | | | |
| | | | |
| Household Durables: 0.90% | | | | | | | | | | | | |
Cavco Industries Incorporated †** | | | | | | | 474,000 | | | | 24,458,400 | |
KB Home Incorporated | | | | | | | 363,600 | | | | 3,156,048 | |
Skyline Corporation ** | | | | | | | 859,100 | | | | 4,716,459 | |
| | | | |
| | | | | | | | | | | 32,330,907 | |
| | | | | | | | | | | | |
| | | | |
| Internet & Catalog Retail: 0.08% | | | | | | | | | | | | |
dELiA*s Incorporated †** | | | | | | | 1,892,000 | | | | 2,913,680 | |
| | | | | | | | | | | | |
| | | | |
| Media: 0.53% | | | | | | | | | | | | |
Discovery Communications Incorporated † | | | | | | | 382,000 | | | | 18,981,580 | |
| | | | | | | | | | | | |
| | | | |
| Multiline Retail: 0.22% | | | | | | | | | | | | |
Saks Incorporated † | | | | | | | 726,600 | | | | 7,963,536 | |
| | | | | | | | | | | | |
| | | | |
| Specialty Retail: 2.18% | | | | | | | | | | | | |
Collective Brands Incorporated † | | | | | | | 1,747,200 | | | | 36,289,344 | |
GameStop Corporation Class A | | | | | | | 595,500 | | | | 13,553,580 | |
rue21 Incorporated † | | | | | | | 339,300 | | | | 10,297,755 | |
Talbots Incorporated † | | | | | | | 2,468,600 | | | | 7,307,056 | |
Vitamin Shoppe Incorporated † | | | | | | | 238,600 | | | | 11,230,902 | |
| | | | |
| | | | | | | | | | | 78,678,637 | |
| | | | | | | | | | | | |
| | | | |
Consumer Staples: 0.72% | | | | | | | | | | | | |
| | | | |
| Personal Products: 0.72% | | | | | | | | | | | | |
Prestige Brands Holdings Incorporated † | | | | | | | 1,523,900 | | | | 25,891,061 | |
| | | | | | | | | | | | |
| | | | |
Energy: 22.93% | | | | | | | | | | | | |
| | | | |
| Energy Equipment & Services: 7.33% | | | | | | | | | | | | |
Ensco International plc ADR | | | | | | | 167,700 | | | | 9,164,805 | |
Helix Energy Solutions Group Incorporated † | | | | | | | 1,186,300 | | | | 24,212,383 | |
Helmerich & Payne Incorporated | | | | | | | 640,800 | | | | 32,930,712 | |
The accompanying notes are an integral part of these financial statements.
| | | | | | |
| Portfolio of Investments—April 30, 2012 (Unaudited) | | Wells Fargo Advantage Small Cap Value Fund | | | 9 | |
| | | | | | | | | | | | |
| Security Name | | | | | | Shares | | | Value | |
| | | | | | | | | | | | |
| | | | |
| Energy Equipment & Services (continued) | | | | | | | | | | | | |
ION Geophysical Corporation † | | | | | | | 6,601,300 | | | $ | 41,126,099 | |
Key Energy Services Incorporated † | | | | | | | 2,170,100 | | | | 27,473,466 | |
Newpark Resources Incorporated †** | | | | | | | 7,193,200 | | | | 45,748,752 | |
Oceaneering International Incorporated # | | | | | | | 590,500 | | | | 30,487,515 | |
Parker Drilling Company † | | | | | | | 2,248,200 | | | | 11,623,194 | |
PHI Incorporated (non-voting) †** | | | | | | | 799,800 | | | | 21,298,674 | |
PHI Incorporated (voting) †** | | | | | | | 145,792 | | | | 3,583,567 | |
Vantage Drilling Company † | | | | | | | 3,565,300 | | | | 5,633,174 | |
Willbros Group Incorporated † | | | | | | | 2,029,700 | | | | 10,960,380 | |
| | | | |
| | | | | | | | | | | 264,242,721 | |
| | | | | | | | | | | | |
| | | | |
| Oil, Gas & Consumable Fuels: 15.60% | | | | | | | | | | | | |
Forest Oil Corporation † | | | | | | | 959,800 | | | | 12,784,536 | |
InterOil Corporation †**# | | | | | | | 4,677,500 | | | | 282,708,100 | |
Lone Pine Resources Incorporated † | | | | | | | 585,100 | | | | 3,487,196 | |
McMoRan Exploration Company †# | | | | | | | 6,799,300 | | | | 59,833,840 | |
Newfield Exploration Company † | | | | | | | 282,900 | | | | 10,156,110 | |
PetroQuest Energy Incorporated † | | | | | | | 361,800 | | | | 2,185,272 | |
Pioneer Natural Resources Company | | | | | | | 100,600 | | | | 11,651,492 | |
Plains Exploration & Product Company † | | | | | | | 177,500 | | | | 7,250,875 | |
Range Resources Corporation | | | | | | | 1,604,400 | | | | 106,949,304 | |
Trilogy Energy Corporation | | | | | | | 2,357,100 | | | | 65,188,006 | |
| | | | |
| | | | | | | | | | | 562,194,731 | |
| | | | | | | | | | | | |
| | | | |
Financials: 17.06% | | | | | | | | | | | | |
| | | | |
| Commercial Banks: 2.78% | | | | | | | | | | | | |
Ameris Bancorp † | | | | | | | 375,597 | | | | 4,657,403 | |
Associated Banc-Corporation | | | | | | | 473,600 | | | | 6,313,088 | |
Bancorp Incorporated † | | | | | | | 1,331,000 | | | | 13,669,370 | |
BBCN Bancorp Incorporated † | | | | | | | 909,301 | | | | 9,984,125 | |
Centerstate Banks Incorporated | | | | | | | 1,205,000 | | | | 9,688,200 | |
City National Corporation | | | | | | | 318,300 | | | | 16,952,658 | |
First Horizon National Corporation | | | | | | | 1,080,100 | | | | 9,915,318 | |
IBERIABANK Corporation | | | | | | | 353,800 | | | | 18,068,566 | |
Park Sterling Corporation † | | | | | | | 973,800 | | | | 4,586,598 | |
Sandy Spring Bancorp Incorporated | | | | | | | 213,900 | | | | 3,852,339 | |
Western Liberty Bancorp †** | | | | | | | 818,800 | | | | 2,415,460 | |
| | | | |
| | | | | | | | | | | 100,103,125 | |
| | | | | | | | | | | | |
| | | | |
| Diversified Financial Services: 0.35% | | | | | | | | | | | | |
NBH Holdings Corporation †(a)144A | | | | | | | 753,000 | | | | 12,801,000 | |
| | | | | | | | | | | | |
| | | | |
| Insurance: 2.85% | | | | | | | | | | | | |
Argo Group International Holdings Limited ** | | | | | | | 2,027,100 | | | | 58,502,106 | |
Hilltop Holdings Incorporated † | | | | | | | 1,844,900 | | | | 14,630,057 | |
Mercury General Corporation | | | | | | | 412,100 | | | | 18,622,799 | |
OneBeacon Insurance Group Limited | | | | | | | 766,100 | | | | 10,901,603 | |
| | | | |
| | | | | | | | | | | 102,656,565 | |
| | | | | | | | | | | | |
The accompanying notes are an integral part of these financial statements.
| | | | |
| 10 | | Wells Fargo Advantage Small Cap Value Fund | | Portfolio of Investments—April 30, 2012 (Unaudited) |
| | | | | | | | | | | | |
| Security Name | | | | | | Shares | | | Value | |
| | | | | | | | | | | | |
| | | | |
| REITs: 10.61% | | | | | | | | | | | | |
Anworth Mortgage Asset Corporation | | | | | | | 2,401,300 | | | $ | 16,184,762 | |
Capstead Mortgage Corporation | | | | | | | 3,253,400 | | | | 44,669,182 | |
Chimera Investment Corporation | | | | | | | 39,593,000 | | | | 114,423,770 | |
Crexus Investment Corporation ** | | | | | | | 4,197,400 | | | | 44,030,726 | |
Hatteras Financial Corporation | | | | | | | 872,500 | | | | 25,415,925 | |
Invesco Mortgage Capital Incorporated | | | | | | | 2,694,000 | | | | 47,522,160 | |
MFA Mortgage Investments Incorporated | | | | | | | 4,838,400 | | | | 35,707,392 | |
Redwood Trust Incorporated | | | | | | | 1,990,200 | | | | 23,245,536 | |
Sun Communities Incorporated | | | | | | | 709,600 | | | | 31,045,000 | |
| | | | |
| | | | | | | | | | | 382,244,453 | |
| | | | | | | | | | | | |
| | | | |
| Thrifts & Mortgage Finance: 0.47% | | | | | | | | | | | | |
First Niagara Financial Group Incorporated | | | | | | | 1,448,200 | | | | 12,946,908 | |
Northwest Bancshares Incorporated | | | | | | | 337,900 | | | | 4,162,928 | |
| | | | |
| | | | | | | | | | | 17,109,836 | |
| | | | | | | | | | | | |
| | | | |
Health Care: 7.50% | | | | | | | | | | | | |
| | | | |
| Health Care Equipment & Supplies: 3.76% | | | | | | | | | | | | |
Hill-Rom Holdings Incorporated | | | | | | | 258,300 | | | | 8,381,835 | |
Hologic Incorporated † | | | | | | | 772,800 | | | | 14,775,936 | |
Invacare Corporation | | | | | | | 276,100 | | | | 4,376,185 | |
Orasure Technologies Incorporated †** | | | | | | | 5,972,700 | | | | 68,506,869 | |
Symmetry Medical Incorporated † | | | | | | | 1,238,500 | | | | 8,805,735 | |
Thoratec Corporation † | | | | | | | 453,000 | | | | 15,768,930 | |
Varian Medical Systems Incorporated † | | | | | | | 232,100 | | | | 14,719,782 | |
| | | | |
| | | | | | | | | | | 135,335,272 | |
| | | | | | | | | | | | |
| | | | |
| Health Care Providers & Services: 1.87% | | | | | | | | | | | | |
Amedisys Incorporated † | | | | | | | 1,229,700 | | | | 18,113,481 | |
Community Health Systems Incorporated †# | | | | | | | 524,600 | | | | 12,768,764 | |
Cross Country Healthcare Incorporated †** | | | | | | | 2,143,800 | | | | 9,882,918 | |
Gentiva Health Services Incorporated †** | | | | | | | 2,365,500 | | | | 19,586,340 | |
Healthways Incorporated † | | | | | | | 1,055,700 | | | | 7,041,519 | |
| | | | |
| | | | | | | | | | | 67,393,022 | |
| | | | | | | | | | | | |
| | | | |
| Health Care Technology: 0.61% | | | | | | | | | | | | |
Allscripts Healthcare Solutions Incorporated † | | | | | | | 1,066,400 | | | | 11,815,712 | |
Medidata Solutions Incorporated † | | | | | | | 395,200 | | | | 10,239,632 | |
| | | | |
| | | | | | | | | | | 22,055,344 | |
| | | | | | | | | | | | |
| | | | |
| Life Sciences Tools & Services: 1.26% | | | | | | | | | | | | |
Accelrys Incorporated † | | | | | | | 1,770,200 | | | | 14,568,746 | |
Nordion Incorporated | | | | | | | 1,453,600 | | | | 13,300,440 | |
Parexel International Corporation † | | | | | | | 654,600 | | | | 17,634,924 | |
| | | | |
| | | | | | | | | | | 45,504,110 | |
| | | | | | | | | | | | |
The accompanying notes are an integral part of these financial statements.
| | | | | | |
| Portfolio of Investments—April 30, 2012 (Unaudited) | | Wells Fargo Advantage Small Cap Value Fund | | | 11 | |
| | | | | | | | | | | | |
| Security Name | | | | | | Shares | | | Value | |
| | | | | | | | | | | | |
| | | | |
Industrials: 13.62% | | | | | | | | | | | | |
| | | | |
| Airlines: 5.02% | | | | | | | | | | | | |
Alaska Air Group Incorporated †# | | | | | | | 1,090,700 | | | $ | 36,865,660 | |
Delta Air Lines Incorporated † | | | | | | | 4,972,500 | | | | 54,498,600 | |
Lan Airlines SA ADR | | | | | | | 271,500 | | | | 7,653,585 | |
United Continental Holdings Incorporated † | | | | | | | 3,730,100 | | | | 81,763,792 | |
| | | | |
| | | | | | | | | | | 180,781,637 | |
| | | | | | | | | | | | |
| | | | |
| Commercial Services & Supplies: 4.45% | | | | | | | | | | | | |
ABM Industries Incorporated | | | | | | | 1,909,700 | | | | 44,457,816 | |
ACCO Brands Corporation † | | | | | | | 1,329,655 | | | | 14,027,860 | |
GEO Group Incorporated † | | | | | | | 2,815,200 | | | | 58,302,792 | |
Healthcare Services Group | | | | | | | 911,600 | | | | 19,344,152 | |
Hill International Incorporated †** | | | | | | | 2,602,800 | | | | 9,265,968 | |
Kforce Incorporated † | | | | | | | 549,400 | | | | 7,949,818 | |
Verisk Analytics Incorporated Class A † | | | | | | | 146,300 | | | | 7,161,385 | |
| | | | |
| | | | | | | | | | | 160,509,791 | |
| | | | | | | | | | | | |
| | | | |
| Construction & Engineering: 3.04% | | | | | | | | | | | | |
Chicago Bridge & Iron Company NV | | | | | | | 2,175,500 | | | | 96,635,710 | |
Primoris Services Corporation | | | | | | | 904,600 | | | | 13,044,332 | |
| | | | |
| | | | | | | | | | | 109,680,042 | |
| | | | | | | | | | | | |
| | | | |
| Electrical Equipment: 0.71% | | | | | | | | | | | | |
GrafTech International Limited † | | | | | | | 1,966,800 | | | | 23,090,232 | |
Polypore International Incorporated †# | | | | | | | 67,200 | | | | 2,509,920 | |
| | | | |
| | | | | | | | | | | 25,600,152 | |
| | | | | | | | | | | | |
| | | | |
| Road & Rail: 0.13% | | | | | | | | | | | | |
Covenant Transport Incorporated Class A †** | | | | | | | 1,402,400 | | | | 4,641,944 | |
| | | | | | | | | | | | |
| | | | |
| Trading Companies & Distributors: 0.27% | | | | | | | | | | | | |
Applied Industrial Technologies Incorporated | | | | | | | 245,000 | | | | 9,628,500 | |
| | | | | | | | | | | | |
| | | | |
Information Technology: 8.46% | | | | | | | | | | | | |
| | | | |
| Communications Equipment: 1.34% | | | | | | | | | | | | |
Acme Packet Incorporated † | | | | | | | 311,200 | | | | 8,735,384 | |
Brocade Communications Systems Incorporated † | | | | | | | 3,900,200 | | | | 21,607,108 | |
Harmonic Incorporated † | | | | | | | 2,993,800 | | | | 14,130,736 | |
MRV Communications Incorporated | | | | | | | 3,634,000 | | | | 3,779,360 | |
| | | | |
| | | | | | | | | | | 48,252,588 | |
| | | | | | | | | | | | |
| | | | |
| Computers & Peripherals: 2.16% | | | | | | | | | | | | |
Cray Incorporated †** | | | | | | | 3,803,000 | | | | 42,403,450 | |
Intermec Incorporated †** | | | | | | | 3,525,100 | | | | 18,753,532 | |
Quantum Corporation † | | | | | | | 7,113,100 | | | | 16,929,178 | |
| | | | |
| | | | | | | | | | | 78,086,160 | |
| | | | | | | | | | | | |
The accompanying notes are an integral part of these financial statements.
| | | | |
| 12 | | Wells Fargo Advantage Small Cap Value Fund | | Portfolio of Investments—April 30, 2012 (Unaudited) |
| | | | | | | | | | | | |
| Security Name | | | | | | Shares | | | Value | |
| | | | | | | | | | | | |
| | | | |
| Electronic Equipment, Instruments & Components: 4.33% | | | | | | | | | | | | |
Checkpoint Systems Incorporated † | | | | | | | 1,017,900 | | | $ | 11,156,184 | |
Cognex Corporation | | | | | | | 727,700 | | | | 29,289,925 | |
Coherent Incorporated † | | | | | | | 902,900 | | | | 47,492,540 | |
OSI Systems Incorporated † | | | | | | | 755,440 | | | | 50,508,718 | |
Power One Incorporated † | | | | | | | 4,097,100 | | | | 17,535,588 | |
| | | | |
| | | | | | | | | | | 155,982,955 | |
| | | | | | | | | | | | |
| | | | |
| Internet Software & Services: 0.40% | | | | | | | | | | | | |
Monster Worldwide Incorporated † | | | | | | | 1,659,900 | | | | 14,324,937 | |
| | | | | | | | | | | | |
| | | | |
| Office Electronics: 0.23% | | | | | | | | | | | | |
Zebra Technologies Corporation † | | | | | | | 212,600 | | | | 8,246,754 | |
| | | | | | | | | | | | |
| | | | |
Materials: 16.01% | | | | | | | | | | | | |
| | | | |
| Chemicals: 0.44% | | | | | | | | | | | | |
Calgon Carbon Corporation † | | | | | | | 1,149,000 | | | | 15,902,160 | |
| | | | | | | | | | | | |
| | | | |
| Containers & Packaging: 0.98% | | | | | | | | | | | | |
Intertape Polymer Group Incorporated †** | | | | | | | 6,535,124 | | | | 35,351,753 | |
| | | | | | | | | | | | |
| | | | |
| Metals & Mining: 14.18% | | | | | | | | | | | | |
Agnico-Eagle Mines Limited | | | | | | | 1,421,000 | | | | 56,726,320 | |
Carpenter Technology Corporation # | | | | | | | 869,400 | | | | 48,390,804 | |
Eldorado Gold Corporation | | | | | | | 1,429,600 | | | | 20,271,728 | |
Great Basin Gold Limited † | | | | | | | 6,851,500 | | | | 4,827,567 | |
Harry Winston Diamond Corporation † | | | | | | | 488,500 | | | | 6,966,010 | |
Petaquilla Minerals Limited † | | | | | | | 2,075,700 | | | | 894,627 | |
Randgold Resources Limited ADR | | | | | | | 2,526,458 | | | | 225,233,731 | |
Royal Gold Incorporated | | | | | | | 739,900 | | | | 45,844,204 | |
Sandstorm Gold Limited †(i) | | | | | | | 12,419,548 | | | | 22,630,143 | |
Silver Standard Resources Incorporated † | | | | | | | 1,627,900 | | | | 23,474,318 | |
Steel Dynamics Incorporated | | | | | | | 2,301,700 | | | | 29,392,709 | |
United States Steel Corporation | | | | | | | 539,100 | | | | 15,272,703 | |
Webco Industries Incorporated †**(a)(i) | | | | | | | 89,600 | | | | 11,200,000 | |
| | | | |
| | | | | | | | | | | 511,124,864 | |
| | | | | | | | | | | | |
| | | | |
| Paper & Forest Products: 0.41% | | | | | | | | | | | | |
Wausau Paper Corporation | | | | | | | 1,611,000 | | | | 14,595,660 | |
| | | | | | | | | | | | |
| | | | |
Telecommunication Services: 1.03% | | | | | | | | | | | | |
| | | | |
| Diversified Telecommunication Services: 1.03% | | | | | | | | | | | | |
Cincinnati Bell Incorporated † | | | | | | | 9,747,200 | | | | 37,039,360 | |
| | | | | | | | | | | | |
| | | | |
Total Common Stocks (Cost $2,689,095,944) | | | | | | | | | | | 3,379,889,056 | |
| | | | | | | | | | | | |
| | | | |
Investment Companies: 1.06% | | | | | | | | | | | | |
Market Vectors Gold Miners ETF | | | | | | | 674,300 | | | | 31,280,777 | |
SPDR S&P Regional Banking ETF | | | | | | | 240,200 | | | | 6,742,414 | |
| | | | |
Total Investment Companies (Cost $28,155,462) | | | | | | | | | | | 38,023,191 | |
| | | | | | | | | | | | |
The accompanying notes are an integral part of these financial statements.
| | | | | | |
| Portfolio of Investments—April 30, 2012 (Unaudited) | | Wells Fargo Advantage Small Cap Value Fund | | | 13 | |
| | | | | | | | | | | | | | | | |
| Security Name | | | | | Expiration Date | | | Shares | | | Value | |
| | | | | | | | | | | | | | | | |
| | | | |
Warrants: 0.01% | | | | | | | | | | | | | | | | |
| | | | |
Materials: 0.01% | | | | | | | | | | | | | | | | |
| | | | |
| Metals & Mining: 0.01% | | | | | | | | | | | | | | | | |
Sandstorm Gold Limited †(i) | | | | | | | 10/19/2015 | | | | 470,263 | | | $ | 442,724 | |
| | | | | | | | | | | | | | | | |
| | | | |
Total Warrants (Cost $0) | | | | | | | | | | | | | | | 442,724 | |
| | | | | | | | | | | | | | | | |
| | | | |
| | | Yield | | | | | | | | | | |
| Short-Term Investments: 4.88% | | | | | | | | | | | | | | | | |
| | | | |
| Investment Companies: 4.88% | | | | | | | | | | | | | | | | |
Wells Fargo Advantage Cash Investment Money Market Fund, Select Class (l)(u) | | | 0.11 | % | | | | | | | 175,959,968 | | | | 175,959,968 | |
| | | | | | | | | | | | | | | | |
| | | | |
Total Short-Term Investments (Cost $175,959,968) | | | | | | | | | | | | | | | 175,959,968 | |
| | | | | | | | | | | | | | | | |
| | | | | | | | |
| Total Investments in Securities | | | | | | | | |
| (Cost $2,893,211,374)* | | | 99.74 | % | | | 3,594,314,939 | |
Other Assets and Liabilities, Net | | | 0.26 | | | | 9,476,070 | |
| | | | | | | | |
| Total Net Assets | | | 100.00 | % | | $ | 3,603,791,009 | |
| | | | | | | | |
| † | Non-income earning security |
| ** | Represents an affiliate of the Fund under Section 2(a)(2) and 2(a)(3) of the Investment Company Act of 1940, as the Fund holds 5% or more of the issuer’s outstanding voting shares. |
| (l) | Investment in an affiliate. |
| (a) | Security is fair valued by the Management Valuation Team, and in certain instances by the Board of Trustees, in accordance with procedures approved by the Board of Trustees. |
| # | All or a portion of this security is segregated as collateral for investments in derivative instruments. |
| 144A | Security that may be resold to “qualified institutional buyers” under Rule 144A or security offered pursuant to Section 4(2) of the Securities Act of 1933, as amended. |
| (u) | Rate shown is the 7-day annualized yield at period end. |
| * | Cost for federal income tax purposes is $2,945,263,793 and net unrealized appreciation (depreciation) consists of: |
| | | | |
Gross unrealized appreciation | | $ | 1,042,857,176 | |
Gross unrealized depreciation | | | (393,806,030 | ) |
| | | | |
Net unrealized appreciation | | $ | 649,051,146 | |
The accompanying notes are an integral part of these financial statements.
| | | | |
| 14 | | Wells Fargo Advantage Small Cap Value Fund | | Statement of Assets and Liabilities—April 30, 2012 (Unaudited) |
| | | | |
| | | | |
| |
Assets | | | | |
Investments | | | | |
In unaffiliated securities, at value (see cost below) | | $ | 2,688,571,105 | |
In affiliated securities, at value (see cost below) | | | 905,743,834 | |
| | | | |
Total investments, at value (see cost below) | | | 3,594,314,939 | |
Foreign currency, at value (see cost below) | | | 481,581 | |
Receivable for investments sold | | | 34,856,133 | |
Receivable for Fund shares sold | | | 3,237,297 | |
Receivable for dividends | | | 794,127 | |
Prepaid expenses and other assets | | | 118,349 | |
| | | | |
Total assets | | | 3,633,802,426 | |
| | | | |
| |
Liabilities | | | | |
Payable for investments purchased | | | 6,348,975 | |
Payable for Fund shares redeemed | | | 19,265,840 | |
Written options, at value | | | 838,030 | |
Advisory fee payable | | | 2,049,621 | |
Distribution fees payable | | | 62,929 | |
Due to other related parties | | | 732,217 | |
Accrued expenses and other liabilities | | | 713,805 | |
| | | | |
Total liabilities | | | 30,011,417 | |
| | | | |
Total net assets | | $ | 3,603,791,009 | |
| | | | |
| |
NET ASSETS CONSIST OF | | | | |
Paid-in capital | | $ | 2,848,732,109 | |
Undistributed net investment income | | | 18,341,444 | |
Accumulated net realized gains on investments | | | 35,669,945 | |
Net unrealized gains on investments | | | 701,047,511 | |
| | | | |
Total net assets | | $ | 3,603,791,009 | |
| | | | |
| |
COMPUTATION OF NET ASSET VALUE AND OFFERING PRICE PER SHARE1 | | | | |
Net assets – Class A | | $ | 608,284,608 | |
Shares outstanding – Class A | | | 19,367,578 | |
Net asset value per share – Class A | | | $31.41 | |
Maximum offering price per share – Class A2 | | | $33.33 | |
Net assets – Class B | | $ | 2,293,665 | |
Shares outstanding – Class B | | | 80,407 | |
Net asset value per share – Class B | | | $28.53 | |
Net assets – Class C | | $ | 101,776,272 | |
Shares outstanding – Class C | | | 3,558,860 | |
Net asset value per share – Class C | | | $28.60 | |
Net assets – Administrator Class | | $ | 463,375,683 | |
Shares outstanding – Administrator Class | | | 14,512,715 | |
Net asset value per share – Administrator Class | | | $31.93 | |
Net assets – Institutional Class | | $ | 1,086,604,833 | |
Shares outstanding – Institutional Class | | | 33,952,919 | |
Net asset value per share – Institutional Class | | | $32.00 | |
Net assets – Investor Class | | $ | 1,341,455,948 | |
Shares outstanding – Investor Class | | | 41,992,203 | |
Net asset value per share – Investor Class | | | $31.95 | |
| |
Investments in unaffiliated securities, at cost | | $ | 2,014,076,983 | |
| | | | |
Investments in affiliated securities, at cost | | $ | 879,134,391 | |
| | | | |
Total investments, at cost | | $ | 2,893,211,374 | |
| | | | |
Foreign currency, at cost | | $ | 481,381 | |
| | | | |
Premiums received on written options | | $ | 782,051 | |
| | | | |
| 1. | The Fund has an unlimited number of authorized shares. |
| 2. | Maximum offering price is computed as 100/94.25 of net asset value. On investments of $50,000 or more, the offering price is reduced. |
The accompanying notes are an integral part of these financial statements.
| | | | | | |
| Statement of Operations—Six Months Ended April 30, 2012 (Unaudited) | | Wells Fargo Advantage Small Cap Value Fund | | | 15 | |
| | | | |
| | | | |
| |
Investment income | | | | |
Dividends* | | $ | 34,414,548 | |
Income from affiliated securities | | | 3,167,996 | |
Interest | | | 247 | |
| | | | |
Total investment income | | | 37,582,791 | |
| | | | |
| |
Expenses | | | | |
Advisory fee | | | 13,597,421 | |
Administration fees | | | | |
Fund level | | | 913,526 | |
Class A | | | 788,624 | |
Class B | | | 3,679 | |
Class C | | | 131,784 | |
Administrator Class | | | 218,973 | |
Institutional Class | | | 438,110 | |
Investor Class | | | 2,326,577 | |
Shareholder servicing fees | | | | |
Class A | | | 758,292 | |
Class B | | | 3,537 | |
Class C | | | 126,716 | |
Administrator Class | | | 539,193 | |
Investor Class | | | 1,757,456 | |
Distribution fees | | | | |
Class B | | | 10,611 | |
Class C | | | 380,148 | |
Custody and accounting fees | | | 123,647 | |
Professional fees | | | 5,572 | |
Registration fees | | | 44,991 | |
Shareholder report expenses | | | 301,187 | |
Trustees’ fees and expenses | | | 7,153 | |
Other fees and expenses | | | 22,350 | |
| | | | |
Total expenses | | | 22,499,547 | |
Less: Fee waivers and/or expense reimbursements | | | (770,438 | ) |
| | | | |
Net expenses | | | 21,729,109 | |
| | | | |
Net investment income | | | 15,853,682 | |
| | | | |
| |
REALIZED AND UNREALIZED GAINS (LOSSES) ON INVESTMENTS | | | | |
| |
Net realized gains (losses) on: | | | | |
Unaffiliated securities | | | 96,968,754 | |
Affiliated securities | | | (11,443,058 | ) |
Written options | | | 5,460,218 | |
| | | | |
Net realized gains on investments | | | 90,985,914 | |
| | | | |
| |
Net change in unrealized gains (losses) on: | | | | |
Unaffiliated securities | | | (19,723,791 | ) |
Affiliated securities | | | 172,058,291 | |
Written options | | | (565,441 | ) |
| | | | |
Net change in unrealized gains (losses) on investments | | | 151,769,059 | |
| | | | |
Net realized and unrealized gains (losses) on investments | | | 242,754,973 | |
| | | | |
Net increase in net assets resulting from operations | | $ | 258,608,655 | |
| | | | |
| |
* Net of foreign dividend withholding taxes of | | | $273,640 | |
The accompanying notes are an integral part of these financial statements.
| | | | |
| 16 | | Wells Fargo Advantage Small Cap Value Fund | | Statements of Changes in Net Assets |
| | | | | | | | | | | | | | | | |
| | | Six Months Ended April 30, 2012 (Unaudited) | | | Year Ended October 31, 2011 | |
| | | | |
Operations | | | | | | | | | | | | | | | | |
Net investment income | | | | | | $ | 15,853,682 | | | | | | | $ | 25,043,399 | |
Net realized gains on investments | | | | | | | 90,985,914 | | | | | | | | 283,458,784 | |
Net change in unrealized gains (losses) on investments | | | | | | | 151,769,059 | | | | | | | | (285,641,719 | ) |
| | | | | | | | | | | | | | | | |
Net increase in net assets resulting from operations | | | | | | | 258,608,655 | | | | | | | | 22,860,464 | |
| | | | | | | | | | | | | | | | |
| | | | |
Distributions to shareholders from | | | | | | | | | | | | | | | | |
Net investment income | | | | | | | | | | | | | | | | |
Class A | | | | | | | (2,385,351 | ) | | | | | | | (4,396,556 | ) |
Class C | | | | | | | 0 | | | | | | | | (83,480 | ) |
Administrator Class | | | | | | | (3,013,023 | ) | | | | | | | (531,686 | ) |
Institutional Class | | | | | | | (9,038,092 | ) | | | | | | | (13,357,649 | ) |
Investor Class | | | | | | | (4,239,217 | ) | | | | | | | (11,250,575 | ) |
Net realized gains | | | | | | | | | | | | | | | | |
Class A | | | | | | | (3,005,579 | ) | | | | | | | 0 | |
Class B | | | | | | | (16,445 | ) | | | | | | | 0 | |
Class C | | | | | | | (554,099 | ) | | | | | | | 0 | |
Administrator Class | | | | | | | (2,132,516 | ) | | | | | | | 0 | |
Institutional Class | | | | | | | (5,234,087 | ) | | | | | | | 0 | |
Investor Class | | | | | | | (7,077,075 | ) | | | | | | | 0 | |
| | | | | | | | | | | | | | | | |
Total distributions to shareholders | | | | | | | (36,695,484 | ) | | | | | | | (29,619,946 | ) |
| | | | | | | | | | | | | | | | |
| | | | |
Capital share transactions | | | Shares | | | | | | | | Shares | | | | | |
Proceeds from shares sold | | | | | | | | | | | | | | | | |
Class A | | | 1,928,546 | | | | 60,120,963 | | | | 6,031,389 | | | | 189,722,518 | |
Class B | | | 1,478 | | | | 42,609 | | | | 13,202 | | | | 382,401 | |
Class C | | | 198,104 | | | | 5,608,998 | | | | 754,421 | | | | 21,856,158 | |
Administrator Class | | | 3,829,132 | | | | 119,425,448 | | | | 16,211,924 | | | | 524,406,670 | |
Institutional Class | | | 4,364,752 | | | | 138,478,188 | | | | 15,357,371 | | | | 489,770,336 | |
Investor Class | | | 2,891,829 | | | | 91,131,439 | | | | 8,243,936 | | | | 263,453,483 | |
| | | | | | | | | | | | | | | | |
| | | | | | | 414,807,645 | | | | | | | | 1,489,591,566 | |
| | | | | | | | | | | | | | | | |
Reinvestment of distributions | | | | | | | | | | | | | | | | |
Class A | | | 169,315 | | | | 4,974,950 | | | | 135,471 | | | | 4,274,123 | |
Class B | | | 538 | | | | 14,784 | | | | 0 | | | | 0 | |
Class C | | | 17,425 | | | | 480,227 | | | | 2,516 | | | | 72,756 | |
Administrator Class | | | 36,715 | | | | 1,086,412 | | | | 13,805 | | | | 442,990 | |
Institutional Class | | | 468,480 | | | | 13,849,753 | | | | 403,997 | | | | 12,976,398 | |
Investor Class | | | 373,334 | | | | 11,203,611 | | | | 345,521 | | | | 11,080,846 | |
| | | | | | | | | | | | | | | | |
| | | | | | | 31,609,737 | | | | | | | | 28,847,113 | |
| | | | | | | | | | | | | | | | |
Payment for shares redeemed | | | | | | | | | | | | | | | | |
Class A | | | (2,916,231 | ) | | | (89,644,910 | ) | | | (7,704,835 | ) | | | (238,688,260 | ) |
Class B | | | (67,893 | ) | | | (1,903,314 | ) | | | (1,215,166 | ) | | | (34,908,725 | ) |
Class C | | | (372,699 | ) | | | (10,450,302 | ) | | | (644,161 | ) | | | (18,099,250 | ) |
Administrator Class | | | (2,311,595 | ) | | | (72,655,251 | ) | | | (3,558,857 | ) | | | (109,400,083 | ) |
Institutional Class | | | (6,434,575 | ) | | | (201,219,833 | ) | | | (22,385,193 | ) | | | (723,539,192 | ) |
Investor Class | | | (9,491,240 | ) | | | (302,003,383 | ) | | | (25,609,396 | ) | | | (809,831,832 | ) |
| | | | | | | | | | | | | | | | |
| | | | | | | (677,876,993 | ) | | | | | | | (1,934,467,342 | ) |
| | | | | | | | | | | | | | | | |
Net decrease in net assets resulting from capital share transactions | | | | | | | (231,459,611 | ) | | | | | | | (416,028,663 | ) |
| | | | | | | | | | | | | | | | |
Total decrease in net assets | | | | | | | (9,546,440 | ) | | | | | | | (422,788,145 | ) |
| | | | | | | | | | | | | | | | |
| | | | |
Net assets | | | | | | | | | | | | | | | | |
Beginning of period | | | | | | | 3,613,337,449 | | | | | | | | 4,036,125,594 | |
| | | | | | | | | | | | | | | | |
End of period | | | | | | $ | 3,603,791,009 | | | | | | | $ | 3,613,337,449 | |
| | | | | | | | | | | | | | | | |
Undistributed net investment income | | | | | | $ | 18,341,444 | | | | | | | $ | 21,163,445 | |
| | | | | | | | | | | | | | | | |
The accompanying notes are an integral part of these financial statements.
| | | | | | |
| Financial Highlights | | Wells Fargo Advantage Small Cap Value Fund | | | 17 | |
(For a share outstanding throughout each period)
| | | | | | | | | | | | | | | | | | | | | | | | |
| | | Six Months Ended
April 30, 2012 (Unaudited) | | | Year Ended October 31, | |
| Class A | | | 2011 | | | 2010 | | | 2009 | | | 2008 | | | 2007 | |
Net asset value, beginning of period | | $ | 29.56 | | | $ | 29.71 | | | $ | 23.32 | | | $ | 18.22 | | | $ | 36.28 | | | $ | 32.63 | |
Net investment income (loss) | | | 0.12 | | | | 0.16 | | | | 0.22 | 1 | | | 0.15 | 1 | | | (0.02 | )1 | | | (0.15 | )1 |
Net realized and unrealized gains (losses) on investments | | | 2.00 | | | | (0.11 | ) | | | 6.29 | | | | 4.95 | | | | (13.25 | ) | | | 6.76 | |
| | | | | | | | | | | | | | | | | | | | | | | | |
Total from investment operations | | | 2.12 | | | | 0.05 | | | | 6.51 | | | | 5.10 | | | | (13.27 | ) | | | 6.61 | |
Distributions to shareholders from | | | | | | | | | | | | | | | | | | | | | | | | |
Net investment income | | | (0.12 | ) | | | (0.20 | ) | | | (0.12 | ) | | | 0.00 | | | | (0.01 | ) | | | 0.00 | |
Net realized gains | | | (0.15 | ) | | | 0.00 | | | | 0.00 | | | | 0.00 | | | | (4.78 | ) | | | (2.96 | ) |
| | | | | | | | | | | | | | | | | | | | | | | | |
Total distributions to shareholders | | | (0.27 | ) | | | (0.20 | ) | | | (0.12 | ) | | | 0.00 | | | | (4.79 | ) | | | (2.96 | ) |
Net asset value, end of period | | $ | 31.41 | | | $ | 29.56 | | | $ | 29.71 | | | $ | 23.32 | | | $ | 18.22 | | | $ | 36.28 | |
Total return2 | | | 7.24 | % | | | 0.11 | % | | | 28.01 | % | | | 27.99 | % | | | (41.27 | )% | | | 21.87 | % |
Ratios to average net assets (annualized) | | | | | | | | | | | | | | | | | | | | | | | | |
Gross expenses | | | 1.33 | % | | | 1.32 | % | | | 1.38 | % | | | 1.44 | % | | | 1.44 | % | | | 1.44 | % |
Net expenses | | | 1.30 | % | | | 1.30 | % | | | 1.37 | % | | | 1.44 | % | | | 1.44 | % | | | 1.44 | % |
Net investment income (loss) | | | 0.76 | % | | | 0.50 | % | | | 0.79 | % | | | 0.79 | % | | | (0.08 | )% | | | (0.45 | )% |
Supplemental data | | | | | | | | | | | | | | | | | | | | | | | | |
Portfolio turnover rate | | | 8 | % | | | 17 | % | | | 21 | % | | | 27 | % | | | 27 | % | | | 48 | % |
Net assets, end of period (000’s omitted) | | | $608,285 | | | | $596,741 | | | | $645,371 | | | | $438,744 | | | | $382,412 | | | | $715,334 | |
| 1. | Calculated based upon average shares outstanding |
| 2. | Total return calculations do not include any sales charges. Returns for periods of less than one year are not annualized. |
The accompanying notes are an integral part of these financial statements.
| | | | |
| 18 | | Wells Fargo Advantage Small Cap Value Fund | | Financial Highlights |
(For a share outstanding throughout each period)
| | | | | | | | | | | | | | | | | | | | | | | | |
| | | Six Months Ended
April 30, 2012 (Unaudited) | | | Year Ended October 31, | |
| Class B | | | 2011 | | | 2010 | | | 2009 | | | 2008 | | | 2007 | |
Net asset value, beginning of period | | $ | 26.85 | | | $ | 27.02 | | | $ | 21.28 | | | $ | 16.75 | | | $ | 33.98 | | | $ | 30.96 | |
Net investment income (loss) | | | 0.00 | 1,2 | | | (0.16 | )1 | | | 0.00 | 1,2 | | | 0.01 | 1 | | | (0.22 | )1 | | | (0.38 | )1 |
Net realized and unrealized gains (losses) on investments | | | 1.83 | | | | (0.01 | ) | | | 5.74 | | | | 4.52 | | | | (12.23 | ) | | | 6.36 | |
| | | | | | | | | | | | | | | | | | | | | | | | |
Total from investment operations | | | 1.83 | | | | (0.17 | ) | | | 5.74 | | | | 4.53 | | | | (12.45 | ) | | | 5.98 | |
Distributions to shareholders from | | | | | | | | | | | | | | | | | | | | | | | | |
Net investment income | | | 0.00 | | | | 0.00 | | | | 0.00 | | | | 0.00 | | | | 0.00 | | | | 0.00 | |
Net realized gains | | | (0.15 | ) | | | 0.00 | | | | 0.00 | | | | 0.00 | | | | (4.78 | ) | | | (2.96 | ) |
| | | | | | | | | | | | | | | | | | | | | | | | |
Total distributions to shareholders | | | (0.15 | ) | | | 0.00 | | | | 0.00 | | | | 0.00 | | | | (4.78 | ) | | | (2.96 | ) |
Net asset value, end of period | | $ | 28.53 | | | $ | 26.85 | | | $ | 27.02 | | | $ | 21.28 | | | $ | 16.75 | | | $ | 33.98 | |
Total return3 | | | 6.80 | % | | | (0.63 | )% | | | 26.97 | % | | | 27.04 | % | | | (41.68 | )% | | | 20.94 | % |
Ratios to average net assets (annualized) | | | | | | | | | | | | | | | | | | | | | | | | |
Gross expenses | | | 2.08 | % | | | 2.06 | % | | | 2.13 | % | | | 2.19 | % | | | 2.19 | % | | | 2.19 | % |
Net expenses | | | 2.05 | % | | | 2.04 | % | | | 2.13 | % | | | 2.19 | % | | | 2.19 | % | | | 2.19 | % |
Net investment income (loss) | | | 0.02 | % | | | (0.57 | )% | | | 0.00 | %2 | | | 0.03 | % | | | (0.87 | )% | | | (1.20 | )% |
Supplemental data | | | | | | | | | | | | | | | | | | | | | | | | |
Portfolio turnover rate | | | 8 | % | | | 17 | % | | | 21 | % | | | 27 | % | | | 27 | % | | | 48 | % |
Net assets, end of period (000’s omitted) | | | $2,294 | | | | $3,928 | | | | $36,436 | | | | $46,175 | | | | $53,515 | | | | $123,492 | |
| 1. | Calculated based upon average shares outstanding |
| 2. | Amount is less than 0.005 of the value indicated. |
| 3. | Total return calculations do not include any sales charges. Returns for periods of less than one year are not annualized. |
The accompanying notes are an integral part of these financial statements.
| | | | | | |
| Financial Highlights | | Wells Fargo Advantage Small Cap Value Fund | | | 19 | |
(For a share outstanding throughout each period)
| | | | | | | | | | | | | | | | | | | | | | | | |
| | | Six Months Ended
April 30, 2012 (Unaudited) | | | Year Ended October 31, | |
| Class C | | | 2011 | | | 2010 | | | 2009 | | | 2008 | | | 2007 | |
Net asset value, beginning of period | | $ | 26.92 | | | $ | 27.11 | | | $ | 21.34 | | | $ | 16.80 | | | $ | 34.07 | | | $ | 31.03 | |
Net investment income (loss) | | | 0.00 | 1,2 | | | (0.07 | )1 | | | 0.01 | 1 | | | 0.01 | 1 | | | (0.22 | )1 | | | (0.38 | )1 |
Net realized and unrealized gains (losses) on investments | | | 1.83 | | | | (0.10 | ) | | | 5.76 | | | | 4.53 | | | | (12.27 | ) | | | 6.38 | |
| | | | | | | | | | | | | | | | | | | | | | | | |
Total from investment operations | | | 1.83 | | | | (0.17 | ) | | | 5.77 | | | | 4.54 | | | | (12.49 | ) | | | 6.00 | |
Distributions to shareholders from | | | | | | | | | | | | | | | | | | | | | | | | |
Net investment income | | | 0.00 | | | | (0.02 | ) | | | 0.00 | | | | 0.00 | | | | 0.00 | | | | 0.00 | |
Net realized gains | | | (0.15 | ) | | | 0.00 | | | | 0.00 | | | | 0.00 | | | | (4.78 | ) | | | (2.96 | ) |
| | | | | | | | | | | | | | | | | | | | | | | | |
Total distributions to shareholders | | | (0.15 | ) | | | (0.02 | ) | | | 0.00 | | | | 0.00 | | | | (4.78 | ) | | | (2.96 | ) |
Net asset value, end of period | | $ | 28.60 | | | $ | 26.92 | | | $ | 27.11 | | | $ | 21.34 | | | $ | 16.80 | | | $ | 34.07 | |
Total return3 | | | 6.82 | % | | | (0.62 | )% | | | 27.04 | % | | | 27.02 | % | | | (41.69 | )% | | | 20.96 | % |
Ratios to average net assets (annualized) | | | | | | | | | | | | | | | | | | | | | | | | |
Gross expenses | | | 2.08 | % | | | 2.07 | % | | | 2.13 | % | | | 2.19 | % | | | 2.19 | % | | | 2.19 | % |
Net expenses | | | 2.05 | % | | | 2.05 | % | | | 2.12 | % | | | 2.19 | % | | | 2.19 | % | | | 2.19 | % |
Net investment income (loss) | | | 0.01 | % | | | (0.24 | )% | | | 0.04 | % | | | 0.03 | % | | | (0.85 | )% | | | (1.20 | )% |
Supplemental data | | | | | | | | | | | | | | | | | | | | | | | | |
Portfolio turnover rate | | | 8 | % | | | 17 | % | | | 21 | % | | | 27 | % | | | 27 | % | | | 48 | % |
Net assets, end of period (000’s omitted) | | | $101,776 | | | | $100,032 | | | | $97,675 | | | | $70,558 | | | | $69,952 | | | | $146,997 | |
| 1. | Calculated based upon average shares outstanding |
| 2. | Amount is less than $0.005 |
| 3. | Total return calculations do not include any sales charges. Returns for periods of less than one year are not annualized. |
The accompanying notes are an integral part of these financial statements.
| | | | |
| 20 | | Wells Fargo Advantage Small Cap Value Fund | | Financial Highlights |
(For a share outstanding throughout each period)
| | | | | | | | | | | | |
| | | Six Months Ended
April 30, 2012 (Unaudited) | | | Year Ended October 31, | |
| Administrator Class | | | 2011 | | | 20101 | |
Net asset value, beginning of period | | $ | 30.12 | | | $ | 30.32 | | | $ | 28.12 | |
Net investment income | | | 0.14 | | | | 0.29 | 2 | | | 0.05 | 2 |
Net realized and unrealized gains (losses) on investments | | | 2.03 | | | | (0.17 | ) | | | 2.15 | |
| | | | | | | | | | | | |
Total from investment operations | | | 2.17 | | | | 0.12 | | | | 2.20 | |
Distributions to shareholders from | | | | | | | | | | | | |
Net investment income | | | (0.21 | ) | | | (0.32 | ) | | | 0.00 | |
Net realized gains | | | (0.15 | ) | | | 0.00 | | | | 0.00 | |
| | | | | | | | | | | | |
Total distributions to shareholders | | | (0.36 | ) | | | (0.32 | ) | | | 0.00 | |
Net asset value, end of period | | $ | 31.93 | | | $ | 30.12 | | | $ | 30.32 | |
Total return3 | | | 7.32 | % | | | 0.32 | % | | | 7.82 | % |
Ratios to average net assets (annualized) | | | | | | | | | | | | |
Gross expenses | | | 1.17 | % | | | 1.15 | % | | | 1.28 | % |
Net expenses | | | 1.10 | % | | | 1.10 | % | | | 1.10 | % |
Net investment income | | | 0.94 | % | | | 0.91 | % | | | 0.79 | % |
Supplemental data | | | | | | | | | | | | |
Portfolio turnover rate | | | 8 | % | | | 17 | % | | | 21 | % |
Net assets, end of period (000’s omitted) | | | $463,376 | | | | $390,266 | | | | $8,841 | |
| 1. | For the period from July 30, 2010 (commencement of class operations) to October 31, 2010. |
| 2. | Calculated based upon average shares outstanding |
| 3. | Returns for periods of less than one year are not annualized. |
The accompanying notes are an integral part of these financial statements.
| | | | | | |
| Financial Highlights | | Wells Fargo Advantage Small Cap Value Fund | | | 21 | |
(For a share outstanding throughout each period)
| | | | | | | | | | | | | | | | | | | | | | | | |
| | | Six Months Ended
April 30, 2012 (Unaudited) | | | Year Ended October 31, | |
| Institutional Class | | | 2011 | | | 2010 | | | 2009 | | | 2008 | | | 20071 | |
Net asset value, beginning of period | | $ | 30.21 | | | $ | 30.33 | | | $ | 23.80 | | | $ | 18.50 | | | $ | 36.77 | | | $ | 34.30 | |
Net investment income | | | 0.20 | | | | 0.31 | | | | 0.34 | 2 | | | 0.25 | 2 | | | 0.13 | 2 | | | 0.01 | 2 |
Net realized and unrealized gains (losses) on investments | | | 2.00 | | | | (0.12 | ) | | | 6.42 | | | | 5.05 | | | | (13.45 | ) | | | 2.46 | |
| | | | | | | | | | | | | | | | | | | | | | | | |
Total from investment operations | | | 2.20 | | | | 0.19 | | | | 6.76 | | | | 5.30 | | | | (13.32 | ) | | | 2.47 | |
Distributions to shareholders from | | | | | | | | | | | | | | | | | | | | | | | | |
Net investment income | | | (0.26 | ) | | | (0.31 | ) | | | (0.23 | ) | | | 0.00 | | | | (0.17 | ) | | | 0.00 | |
Net realized gains | | | (0.15 | ) | | | 0.00 | | | | 0.00 | | | | 0.00 | | | | (4.78 | ) | | | 0.00 | |
| | | | | | | | | | | | | | | | | | | | | | | | |
Total distributions to shareholders | | | (0.41 | ) | | | (0.31 | ) | | | (0.23 | ) | | | 0.00 | | | | (4.95 | ) | | | 0.00 | |
Net asset value, end of period | | $ | 32.00 | | | $ | 30.21 | | | $ | 30.33 | | | $ | 23.80 | | | $ | 18.50 | | | $ | 36.77 | |
Total return3 | | | 7.44 | % | | | 0.52 | % | | | 28.53 | % | | | 28.65 | % | | | (40.96 | )% | | | 7.20 | % |
Ratios to average net assets (annualized) | | | | | | | | | | | | | | | | | | | | | | | | |
Gross expenses | | | 0.90 | % | | | 0.89 | % | | | 0.94 | % | | | 1.00 | % | | | 0.99 | % | | | 0.97 | % |
Net expenses | | | 0.90 | % | | | 0.89 | % | | | 0.93 | % | | | 0.95 | % | | | 0.95 | % | | | 0.94 | % |
Net investment income | | | 1.16 | % | | | 0.97 | % | | | 1.23 | % | | | 1.24 | % | | | 0.49 | % | | | 0.13 | % |
Supplemental data | | | | | | | | | | | | | | | | | | | | | | | | |
Portfolio turnover rate | | | 8 | % | | | 17 | % | | | 21 | % | | | 27 | % | | | 27 | % | | | 48 | % |
Net assets, end of period (000’s omitted) | | | $1,086,605 | | | | $1,073,943 | | | | $1,279,201 | | | | $843,753 | | | | $340,878 | | | | $8,707 | |
| 1. | For the period from July 31, 2007 (commencement of class operations) to October 31, 2007. |
| 2. | Calculated based upon average shares outstanding |
| 3. | Returns for periods of less than one year are not annualized. |
The accompanying notes are an integral part of these financial statements.
| | | | |
| 22 | | Wells Fargo Advantage Small Cap Value Fund | | Financial Highlights |
(For a share outstanding throughout each period)
| | | | | | | | | | | | | | | | | | | | | | | | |
| | | Six Months Ended
April 30, 2012 (Unaudited) | | | Year Ended October 31, | |
| Investor Class | | | 2011 | | | 2010 | | | 2009 | | | 20081 | | | 20071 | |
Net asset value, beginning of period | | $ | 30.04 | | | $ | 30.18 | | | $ | 23.70 | | | $ | 18.50 | | | $ | 36.73 | | | $ | 32.98 | |
Net investment income (loss) | | | 0.11 | 2 | | | 0.14 | 2 | | | 0.22 | 2 | | | 0.17 | 2 | | | (0.01 | )2 | | | (0.13 | )2 |
Net realized and unrealized gains (losses) on investments | | | 2.04 | | | | (0.10 | ) | | | 6.39 | | | | 5.03 | | | | (13.43 | ) | | | 6.84 | |
| | | | | | | | | | | | | | | | | | | | | | | | |
Total from investment operations | | | 2.15 | | | | 0.04 | | | | 6.61 | | | | 5.20 | | | | (13.44 | ) | | | 6.71 | |
Distributions to shareholders from | | | | | | | | | | | | | | | | | | | | | | | | |
Net investment income | | | (0.09 | ) | | | (0.18 | ) | | | (0.13 | ) | | | 0.00 | | | | (0.01 | ) | | | 0.00 | |
Net realized gains | | | (0.15 | ) | | | 0.00 | | | | 0.00 | | | | 0.00 | | | | (4.78 | ) | | | (2.96 | ) |
| | | | | | | | | | | | | | | | | | | | | | | | |
Total distributions to shareholders | | | (0.24 | ) | | | (0.18 | ) | | | (0.13 | ) | | | 0.00 | | | | (4.79 | ) | | | (2.96 | ) |
Net asset value, end of period | | $ | 31.95 | | | $ | 30.04 | | | $ | 30.18 | | | $ | 23.70 | | | $ | 18.50 | | | $ | 36.73 | |
Total return3 | | | 7.18 | % | | | 0.09 | % | | | 27.99 | % | | | 28.11 | % | | | (41.20 | )% | | | 21.95 | % |
Ratios to average net assets (annualized) | | | | | | | | | | | | | | | | | | | | | | | | |
Gross expenses | | | 1.40 | % | | | 1.39 | % | | | 1.47 | % | | | 1.55 | % | | | 1.57 | % | | | 1.61 | % |
Net expenses | | | 1.33 | % | | | 1.33 | % | | | 1.35 | % | | | 1.36 | % | | | 1.36 | % | | | 1.36 | % |
Net investment income (loss) | | | 0.72 | % | | | 0.45 | % | | | 0.80 | % | | | 0.88 | % | | | (0.02 | )% | | | (0.37 | )% |
Supplemental data | | | | | | | | | | | | | | | | | | | | | | | | |
Portfolio turnover rate | | | 8 | % | | | 17 | % | | | 21 | % | | | 27 | % | | | 27 | % | | | 48 | % |
Net assets, end of period (000’s omitted) | | | $1,341,456 | | | | $1,448,429 | | | | $1,968,601 | | | | $1,523,637 | | | | $1,461,833 | | | | $3,183,124 | |
| 1. | Effective June 20, 2008, Class Z was renamed Investor Class. |
| 2. | Calculated based upon average shares outstanding |
| 3. | Returns for periods of less than one year are not annualized. |
The accompanying notes are an integral part of these financial statements.
| | | | | | |
| Notes to Financial Statements (Unaudited) | | Wells Fargo Advantage Small Cap Value Fund | | | 23 | |
1. ORGANIZATION
Wells Fargo Funds Trust (the “Trust”), a Delaware statutory trust organized on March 10, 1999, is an open-end management investment company registered under the Investment Company Act of 1940, as amended (the “1940 Act”). These financial statements report on Wells Fargo Advantage Small Cap Value Fund (the “Fund”) which is a diversified series of the Trust.
2. SIGNIFICANT ACCOUNTING POLICIES
The following significant accounting policies, which are consistently followed in the preparation of the financial statements of the Fund, are in conformity with U.S. generally accepted accounting principles which require management to make estimates and assumptions that affect the reported amounts of assets and liabilities, disclosure of contingent assets and liabilities at the date of the financial statements, and the reported amounts of revenues and expenses during the reporting period. Actual results could differ from those estimates.
Securities valuation
Investments in equity securities are valued each business day as of the close of regular trading on the New York Stock Exchange, which is usually 4:00 p.m. (Eastern Time). Securities which are traded on a national or foreign securities exchange are valued at the last reported sales price, except that securities listed on The Nasdaq Stock Market, Inc. (“Nasdaq”) are valued at the Nasdaq Official Closing Price (“NOCP”), and if no NOCP is available, then at the last reported sales price. If no sales price is shown on the Nasdaq, the bid price will be used. In the absence of any sale of securities listed on the Nasdaq, and in the case of other securities (including U.S. Government obligations, but excluding debt securities maturing in 60 days or less), the price will be deemed “stale” and the valuations will be determined in accordance with the Fund’s Fair Value Procedures.
Securities denominated in foreign currencies are translated into U.S. dollars using the closing rates of exchange in effect on the day of valuation.
Many securities markets and exchanges outside the U.S. close prior to the close of the New York Stock Exchange and therefore may not fully reflect trading or events that occur after the close of the principal exchange in which the foreign securities are traded, but before the close of the New York Stock Exchange. If such trading or events are expected to materially affect the value of securities, then fair value pricing procedures approved by the Board of Trustees are applied. These procedures take into account multiple factors including movements in U.S. securities markets after foreign exchanges close. As a result of the fair value pricing procedures, these securities which are normally categorized as Level 1 in the fair value hierarchy will represent a transfer from a Level 1 to a Level 2 security and will be categorized as Level 2. Depending on market activity, such fair valuations may be frequent. Such fair value pricing may result in NAVs that are higher or lower than NAVs based on the closing price or latest quoted bid price. On April 30, 2012, fair value pricing was not used in pricing foreign securities.
Investments in open-end mutual funds and non-registered investment companies are generally valued at net asset value.
Investments which are not valued using any of the methods discussed above, are valued at their fair value, as determined by procedures established in good faith and approved by the Board of Trustees. The Board of Trustees has established a Valuation Committee comprised of the Trustees and has delegated to it the authority to take any actions regarding the valuation of portfolio securities that the Valuation Committee deems necessary in determining the fair value of portfolio securities, unless the responsibility has been delegated to the Management Valuation Team of Wells Fargo Funds Management, LLC (“Funds Management”). The Board of Trustees retains the authority to make or ratify any valuation decisions or approve any changes to the Fair Value Procedures as it deems appropriate. On a quarterly basis, the Board of Trustees considers for ratification any valuation actions taken by the Valuation Committee or the Management Valuation Team.
Valuations of fair valued prices are compared to the next actual sales price when available, or other appropriate market information to assess the continued appropriateness of the fair valuation methodology used. The securities are fair valued on a day-to-day basis, taking into consideration changes to appropriate market information and any significant changes to the input factors considered in the valuation process until there is a readily available price provided on the exchange or by an independent pricing service. Valuations received from an independent pricing service or broker quotes are periodically validated by comparisons to most recent trades and valuations provided by other independent pricing services in addition to the review of prices by the adviser and/or sub-adviser. Unobservable inputs used in determining fair valuations are identified based on the type of security, taking into consideration factors utilized by market participants in valuing the investment, knowledge about the issuer and the current market environment.
| | | | |
| 24 | | Wells Fargo Advantage Small Cap Value Fund | | Notes to Financial Statements (Unaudited) |
Foreign currency translation
The accounting records of the Fund are maintained in U.S. dollars. Assets, including investment securities, and liabilities denominated in foreign currency are translated into U.S. dollars at the prevailing rates of exchange at the date of valuation. Purchases and sales of securities, and income and expenses are translated at the prevailing rate of exchange on the respective dates of such transactions. Reported net realized foreign exchange gains or losses arise from sales of foreign currencies, currency gains or losses realized between the trade and settlement dates on securities transactions, and the difference between the amounts of dividends, interest and foreign withholding taxes recorded and the U.S. dollar equivalent of the amounts actually paid or received. Net unrealized foreign exchange gains and losses arise from changes in the fair value of assets and liabilities other than investments in securities resulting in changes in exchange rates.
The changes in net assets arising from changes in exchange rates and the changes in net assets resulting from changes in market prices of securities are not separately presented. Such changes are recorded with net realized and unrealized gains or losses from investments. Gains and losses from certain foreign currency transactions are treated as ordinary income for U.S. federal income tax purposes.
Options
The Fund may be subject to equity price risk in the normal course of pursuing its investment objectives. The Fund may write covered call options or secured put options. When the Fund writes an option, an amount equal to the premium received is recorded as a liability and is subsequently adjusted to the current market value of the written option. Premiums received from written options, which expire unexercised, are recognized as realized gains from investments on the expiration date. The difference between the premium received and the amount paid on effecting a closing purchase transaction, including brokerage commissions, is treated as a realized gain or loss. If a call option is exercised, the premium is added to the proceeds from the sale of the underlying security in calculating the realized gain or loss on the sale. If a put option is exercised, the premium reduces the cost of the security purchased. The Fund, as a writer of an option, bears the market risk of an unfavorable change in the price of the security underlying the written option.
The Fund may also purchase call or put options. The premium is included in the Statement of Assets and Liabilities as an investment which is subsequently adjusted to the current market value of the option. Premiums paid for purchased options which expire are recognized as realized losses from investments on the expiration date. Premiums paid for purchased options which are exercised or closed are added to the amount paid or offset against the proceeds on the underlying security to determine the realized gain or loss. The risk of loss associated with purchased options is limited to the premium paid.
Options traded on an exchange are regulated and terms of the options are standardized. Options traded over the counter expose the Fund to counterparty risk in the event the counterparty does not perform. This risk is mitigated by having a master netting arrangement between the Fund and the counterparty and by having the counterparty post collateral to cover the Fund’s exposure to the counterparty.
Security transactions and income recognition
Securities transactions are recorded on a trade date basis. Realized gains or losses are reported on the basis of identified cost of securities delivered.
Dividend income is recognized on the ex-dividend date, except for certain dividends from foreign securities, which are recorded as soon as the Fund is informed of the ex-dividend date. Dividend income from foreign securities is recorded net of foreign taxes withheld where recovery of such taxes is not assured.
Distributions to shareholders
Distributions to shareholders from net investment income and net realized gains, if any, are recorded on the ex-dividend date. Such distributions are determined in conformity with income tax regulations, which may differ from generally accepted accounting principles.
Federal and other taxes
The Fund intends to continue to qualify as a regulated investment company by distributing substantially all of its investment company taxable income and any net realized capital gains (after reduction for capital loss carryforwards) sufficient to relieve it from all, or substantially all, federal income taxes. Accordingly, no provision for federal income taxes was required.
| | | | | | |
| Notes to Financial Statements (Unaudited) | | Wells Fargo Advantage Small Cap Value Fund | | | 25 | |
The Fund’s income and federal excise tax returns and all financial records supporting those returns for the prior three fiscal years are subject to examination by the federal and Delaware revenue authorities. Management has analyzed the Fund’s tax positions taken on federal, state, and foreign tax returns for all open tax years and does not believe that there are any uncertain tax positions that require recognition of a tax liability.
Under the recently enacted Regulated Investment Company Modernization Act of 2010, the Fund is permitted to carry forward capital losses incurred in taxable years which began after December 22, 2010 for an unlimited period. However, any losses incurred are required to be utilized prior to the losses incurred in pre-enactment taxable years. As a result of this ordering rule, pre-enactment capital loss carryforwards may be more likely to expire unused. Post-enactment capital losses that are carried forward will retain their character as either short-term or long-term capital losses rather than be considered all short-term as under previous law. In addition, the Fund may elect to defer any portion of a post-October capital loss or qualified late-year ordinary loss to the first day of the following taxable year. A post-October capital loss is the greatest of the net capital loss, net short-term capital loss or net long-term capital loss for the portion of the taxable year after October 31. A qualified late-year ordinary loss is the net loss comprised of (a) net gain or loss from the sale or other disposition of capital assets for the portion of the taxable year after October 31, and (b) other ordinary income or loss for the portion of the taxable year after December 31.
Class allocations
The separate classes of shares offered by the Fund differ principally in applicable sales charges, distribution, shareholder servicing and administration fees. Shareholders of each class bear certain expenses that pertain to that particular class. All shareholders bear the common expenses of the Fund, earn income from the portfolio, and are allocated unrealized gains and losses pro rata based on the average daily net assets of each class, without distinction between share classes. Dividends are determined separately for each class based on income and expenses allocable to each class. Realized gains and losses are allocated to each class pro rata based upon the net assets of each class on the date realized. Differences in per share dividend rates generally result from the relative weightings of pro rata income and realized gain allocations and from differences in separate class expenses, including distribution, shareholder servicing and administration fees.
3. FAIR VALUATION MEASUREMENTS
Fair value measurements of investments are determined within a framework that has established a fair value hierarchy based upon the various data inputs utilized in determining the value of the Fund’s investments. The three-level hierarchy gives the highest priority to unadjusted quoted prices in active markets for identical assets or liabilities (Level 1) and the lowest priority to significant unobservable inputs (Level 3). The Fund’s investments are classified within the fair value hierarchy based on the lowest level of input that is significant to the fair value measurement. The inputs are summarized into three broad levels as follows:
| n | | Level 1 – quoted prices in active markets for identical securities |
| n | | Level 2 – other significant observable inputs (including quoted prices for similar securities, interest rates, prepayment speeds, credit risk, etc.) |
| n | | Level 3 – significant unobservable inputs (including the Fund’s own assumptions in determining the fair value of investments) |
The inputs or methodologies used for valuing securities are not necessarily an indication of the risk associated with investing in those securities.
| | | | |
| 26 | | Wells Fargo Advantage Small Cap Value Fund | | Notes to Financial Statements (Unaudited) |
As of April 30, 2012, the inputs used in valuing the Fund’s assets, which are carried at fair value, were as follows:
| | | | | | | | | | | | | | | | |
| Investments in Securities | | Quoted Prices (Level 1) | | | Significant Other
Observable Inputs (Level 2) | | | Significant Unobservable Inputs (Level 3) | | | Total | |
Equity securities | | | | | | | | | | | | | | | | |
Common stocks | | $ | 3,355,888,056 | | | $ | 11,200,000 | | | $ | 12,801,000 | | | $ | 3,379,889,056 | |
Investment companies | | | 38,023,191 | | | | 0 | | | | 0 | | | | 38,023,191 | |
Warrants | | | 0 | | | | 442,724 | | | | 0 | | | | 442,724 | |
Short-term investments | | | | | | | | | | | | | | | | |
Investment companies | | | 175,959,968 | | | | 0 | | | | 0 | | | | 175,959,968 | |
| | | $ | 3,569,871,215 | | | $ | 11,642,724 | | | $ | 12,801,000 | | | $ | 3,594,314,939 | |
Further details on the major security types listed above can be found in the Portfolio of Investments.
As of April 30, 2012, the inputs used in valuing the Fund’s other financial instruments, which are carried at fair value, were as follows:
| | | | | | | | | | | | | | | | |
| Other Financial Instruments | | Quoted Prices (Level 1) | | | Significant Other
Observable Inputs (Level 2) | | | Significant Unobservable Inputs (Level 3) | | | Total | |
Written options | | $ | 0 | | | $ | (838,030 | ) | | $ | 0 | | | $ | (838,030 | ) |
Transfers in and transfers out are recognized at the end of the reporting period. For the six months ended April 30, 2012, the Fund did not have any significant transfers into/out of Level 1 and Level 2.
4. TRANSACTIONS WITH AFFILIATES AND OTHER EXPENSES
Advisory fee
The Trust has entered into an advisory contract with Funds Management, an indirect wholly owned subsidiary of Wells Fargo & Company (“Wells Fargo”). The adviser is responsible for implementing investment policies and guidelines and for supervising the sub-adviser, who is responsible for day-to-day portfolio management of the Fund.
Pursuant to the contract, Funds Management is entitled to receive an annual advisory fee starting at 0.80% and declining to 0.70% as the average daily net assets of the Fund increase. For the six months ended April 30, 2012, the advisory fee was equivalent to an annual rate of 0.74% of the Fund’s average daily net assets.
Funds Management has retained the services of certain sub-advisers to provide daily portfolio management to the Fund. The fees related to sub-advisory services are borne directly by Funds Management and do not increase the overall fees paid by the Fund. Wells Capital Management Incorporated (“Wells Capital Management”), an affiliate of Funds Management, is the sub-adviser to the Fund and is entitled to receive a fee from Funds Management at an annual rate starting at 0.55% and declining to 0.40% as the average daily net assets of the Fund increase.
Administration and transfer agent fees
The Trust has entered into an administration agreement with Funds Management. Under this agreement, for providing administrative services, which includes paying fees and expenses for services provided by the transfer agent, sub-transfer agents, omnibus account servicers and record-keepers, Funds Management is entitled to receive from the Fund an annual fund level administration fee starting at 0.05% and declining to 0.03% as the average daily net assets of the Fund increase and a class level administration fee which is calculated based on the average daily net assets of each class as follows:
| | | | |
| | | Class Level Administration Fee | |
Class A, Class B, Class C | | | 0.26 | % |
Administrator Class | | | 0.10 | |
Institutional Class | | | 0.08 | |
Investor Class | | | 0.33 | |
| | | | | | |
| Notes to Financial Statements (Unaudited) | | Wells Fargo Advantage Small Cap Value Fund | | | 27 | |
Funds Management has contractually waived and/or reimbursed advisory and administration fees to the extent necessary to maintain certain net operating expense ratios for the Fund. Waiver of fees and/or reimbursement of expenses by Funds Management were made first from fund level expenses on a proportionate basis and then from class specific expenses. Funds Management has committed through February 28, 2013 to waive fees and/or reimburse expenses to the extent necessary to cap the Fund’s expenses at 1.30% for Class A, 2.05% for Class B, 2.05% for Class C, 1.10% for Administrator Class, 0.90% for Institutional Class and 1.33% for Investor Class.
Distribution fees
The Trust has adopted a Distribution Plan for Class B and Class C shares of the Fund pursuant to Rule 12b-1 under the 1940 Act. Distribution fees are charged to Class B, Class C shares and paid to Wells Fargo Funds Distributor, LLC, the principal underwriter, at an annual rate of 0.75% of the average daily net assets of Class B and Class C shares.
For the six months ended April 30, 2012, Wells Fargo Funds Distributor, LLC received $13,557 from the sale of Class A shares and $2,695, $442 and $1,291 in contingent deferred sales charges from redemptions of Class A, Class B and Class C shares, respectively.
Shareholder servicing fees
The Trust has entered into contracts with one or more shareholder servicing agents, whereby Class A, Class B, Class C, Administrator Class and Investor Class of the Fund is charged a fee at an annual rate of 0.25% of the average daily net assets of each respective class.
A portion of these total shareholder servicing fees were paid to affiliates of Wells Fargo.
5. INVESTMENT PORTFOLIO TRANSACTIONS
Purchases and sales of investments, excluding U.S. Government obligations (if any) and short-term securities, for the six months ended April 30, 2012 were $272,490,099 and $598,064,173, respectively.
6. INVESTMENTS IN AFFILIATES
An affiliate company is a company in which the Fund has ownership of at least 5% of the outstanding voting shares. A summary of the transactions with affiliates for the six months ended April 30, 2012 was as follows:
| | | | | | | | | | | | | | | | | | | | | | | | | | | | |
| | | Shares, Beginning
of Period | | | Shares
Purchased | | | Shares Sold | | | Shares, End
of Period | | | Value, End of
Period | | | Income from
Affiliated
Securities | | | Realized
Gains
(Losses) | |
Argo Group International Holdings Limited | | | 1,907,100 | | | | 125,900 | | | | 5,900 | | | | 2,027,100 | | | $ | 58,502,106 | | | $ | 470,004 | | | $ | (110,305 | ) |
Cavco Industries Incorporated | | | 390,000 | | | | 94,433 | | | | 10,433 | | | | 474,000 | | | | 24,458,400 | | | | 0 | | | | 80,840 | |
Corinthian Colleges Incorporated | | | 5,293,600 | | | | 868,400 | | | | 1,001,800 | | | | 5,160,200 | | | | 19,815,170 | | | | 0 | | | | (333,924 | ) |
Covenant Transport Incorporated Class A | | | 1,374,000 | | | | 28,400 | | | | 0 | | | | 1,402,400 | | | | 4,641,944 | | | | 0 | | | | 0 | |
Cray Incorporated | | | 4,114,100 | | | | 48,900 | | | | 360,000 | | | | 3,803,000 | | | | 42,403,450 | | | | 0 | | | | (2,147,512 | ) |
Crexus Investment Corporation | | | 4,253,200 | | | | 0 | | | | 55,800 | | | | 4,197,400 | | | | 44,030,726 | | | | 2,629,420 | | | | (265,310 | ) |
Cross Country Healthcare Incorporated | | | 2,091,800 | | | | 52,000 | | | | 0 | | | | 2,143,800 | | | | 9,882,918 | | | | 0 | | | | 0 | |
dELiA*s Incorporated | | | 1,870,800 | | | | 34,000 | | | | 12,800 | | | | 1,892,000 | | | | 2,913,680 | | | | 0 | | | | (5,390 | ) |
Gentiva Health Services Incorporated | | | 1,745,200 | | | | 620,300 | | | | 0 | | | | 2,365,500 | | | | 19,586,340 | | | | 0 | | | | 0 | |
Hill International Incorporated | | | 2,522,700 | | | | 94,916 | | | | 14,816 | | | | 2,602,800 | | | | 9,265,968 | | | | 0 | | | | (18,747 | ) |
Intermec Incorporated | | | 3,381,300 | | | | 169,900 | | | | 26,100 | | | | 3,525,100 | | | | 18,753,532 | | | | 0 | | | | (484,602 | ) |
InterOil Corporation | | | 4,785,900 | | | | 178,100 | | | | 286,500 | | | | 4,677,500 | | | | 282,708,100 | | | | 0 | | | | (2,196,456 | ) |
Intertape Polymer Group Incorporated | | | 7,540,224 | | | | 0 | | | | 1,005,100 | | | | 6,535,124 | | | | 35,351,753 | | | | 0 | | | | (5,985,042 | ) |
Newpark Resources Incorporated | | | 7,303,600 | | | | 74,600 | | | | 185,000 | | | | 7,193,200 | | | | 45,748,752 | | | | 0 | | | | 206,222 | |
Orasure Technologies Incorporated | | | 5,712,000 | | | | 287,000 | | | | 26,300 | | | | 5,972,700 | | | | 68,506,869 | | | | 0 | | | | (25,564 | ) |
PHI Incorporated (non-voting) | | | 825,600 | | | | 0 | | | | 25,800 | | | | 799,800 | | | | 21,298,674 | | | | 0 | | | | (157,268 | ) |
PHI Incorporated (voting) | | | 128,192 | | | | 17,600 | | | | 0 | | | | 145,792 | | | | 3,583,567 | | | | 0 | | | | 0 | |
Skyline Corporation | | | 683,800 | | | | 175,300 | | | | 0 | | | | 859,100 | | | | 4,716,459 | | | | 0 | | | | 0 | |
Webco Industries Incorporated | | | 89,457 | | | | 143 | | | | 0 | | | | 89,600 | | | | 11,200,000 | | | | 0 | | | | 0 | |
Western Liberty Bancorp | | | 818,800 | | | | 0 | | | | 0 | | | | 818,800 | | | | 2,415,460 | | | | 0 | | | | 0 | |
| | | | | | | | | | | | | | | | | | | $ | 729,783,868 | | | $ | 3,099,424 | | | $ | (11,443,058 | ) |
| | | | |
| 28 | | Wells Fargo Advantage Small Cap Value Fund | | Notes to Financial Statements (Unaudited) |
7. DERIVATIVE TRANSACTIONS
During the six months ended April 30, 2012, the Fund entered into written options for economic hedging purposes.
During the six months ended April 30, 2012, the Fund had written call option activities as follows:
| | | | | | | | |
| | | Number of
Contracts | | | Premiums
Received | |
Options outstanding at October 31, 2011 | | | 3,600 | | | $ | 1,417,710 | |
Options written | | | 35,344 | | | | 8,681,231 | |
Options expired | | | (2,559 | ) | | | (672,796 | ) |
Options terminated in closing purchase transactions | | | (32,234 | ) | | | (8,547,593 | ) |
Options exercised | | | (502 | ) | | | (96,501 | ) |
Options outstanding at April 30, 2012 | | | 3,649 | | | $ | 782,051 | |
| | | | | | | | | | | | | | |
| Expiration Date | | Issuer Name | | Number of
Contracts | | | Strike Price | | | Value | |
| May 2012 | | Carpenter Technology Corporation | | | 200 | | | $ | 55.00 | | | $ | (39,000 | ) |
| May 2012 | | Carpenter Technology Corporation | | | 199 | | | | 50.00 | | | | (113,430 | ) |
| May 2012 | | Community Health Systems Incorporated | | | 100 | | | | 22.00 | | | | (25,000 | ) |
| May 2012 | | InterOil Corporation | | | 200 | | | | 70.00 | | | | (16,000 | ) |
| May 2012 | | McMoRan Exploration Company | | | 100 | | | | 9.00 | | | | (4,300 | ) |
| May 2012 | | Oceaneering International Incorporated | | | 200 | | | | 55.00 | | | | (2,000 | ) |
| May 2012 | | Polypore International Incorporated | | | 100 | | | | 40.00 | | | | (12,500 | ) |
| May 2012 | | Polypore International Incorporated | | | 400 | | | | 35.00 | | | | (144,000 | ) |
| June 2012 | | Carpenter Technology Corporation | | | 300 | | | | 55.00 | | | | (82,500 | ) |
| June 2012 | | InterOil Corporation | | | 100 | | | | 80.00 | | | | (17,200 | ) |
| June 2012 | | InterOil Corporation | | | 200 | | | | 77.50 | | | | (42,000 | ) |
| June 2012 | | InterOil Corporation | | | 400 | | | | 75.00 | | | | (97,600 | ) |
| June 2012 | | InterOil Corporation | | | 100 | | | | 72.50 | | | | (28,000 | ) |
| June 2012 | | InterOil Corporation | | | 100 | | | | 70.00 | | | | (33,000 | ) |
| June 2012 | | InterOil Corporation | | | 100 | | | | 67.50 | | | | (37,500 | ) |
| July 2012 | | Alaska Air Group Incorporated | | | 300 | | | | 37.50 | | | | (19,500 | ) |
| July 2012 | | Oceaneering International Incorporated | | | 200 | | | | 55.00 | | | | (23,000 | ) |
| September 2012 | | Carpenter Technology Corporation | | | 350 | | | | 60.00 | | | | (101,500 | ) |
The Fund had outstanding written options with total premiums received that averaged $1,265,652 during the six months ended April 30, 2012.
The fair value, realized gains or losses and change in unrealized gains or losses, if any, on derivative instruments are reflected in the appropriate financial statements.
8. BANK BORROWINGS
The Trust (excluding the money market funds) and Wells Fargo Variable Trust are parties to a $150,000,000 revolving credit agreement with State Street Bank and Trust Company, whereby the Fund is permitted to use bank borrowings for temporary or emergency purposes, such as to fund shareholder redemption requests. Interest under the credit agreement is charged to the Fund based on a borrowing rate equal to the higher of the Federal Funds rate in effect on that day plus 1.25% or the overnight LIBOR rate in effect on that day plus 1.25%. In addition, an annual commitment fee equal to 0.10% of the unused balance is allocated to each participating fund. For the six months ended April 30, 2012, the Fund paid $4,302 in commitment fees.
For the six months ended April 30, 2012, there were no borrowings by the Fund under the agreement.
| | | | | | |
| Notes to Financial Statements (Unaudited) | | Wells Fargo Advantage Small Cap Value Fund | | | 29 | |
9. INDEMNIFICATION
Under the Trust’s organizational documents, the officers and directors are indemnified against certain liabilities that may arise out of performance of their duties to the Trust. Additionally, in the normal course of business, the Trust may enter into contracts with service providers that contain a variety of indemnification clauses. The Trust’s maximum exposure under these arrangements is dependent on future claims that may be made against the Fund and, therefore, cannot be estimated.
10. NEW ACCOUNTING PRONOUNCEMENTS
In December 2011, the Financial Accounting Standards Board (“FASB”) issued Accounting Standard Update (“ASU”) No. 2011-11, Disclosures about Offsetting Assets and Liabilities. ASU 2011-11, which amends FASB ASC Topic 210, Balance Sheet, creates new disclosure requirements which require entities to disclose both gross and net information for derivatives and other financial instruments that are either offset in the Statement of Assets and Liabilities or subject to an enforceable master netting arrangement or similar agreement. The disclosure requirements are effective for interim and annual reporting periods beginning on or after January 1, 2013. Management is currently assessing the potential impact, in addition to expanded financial statement disclosure, that may result from adopting this ASU.
In May 2011, FASB issued ASU No. 2011-04 Amendments to Achieve Common Fair Value Measurement and Disclosure Requirements in U.S. GAAP and IFRSs. ASU No. 2011-04 amends FASB ASC Topic 820, Fair Value Measurements, to establish common requirements for measuring fair value and for disclosing information about fair value measurements in accordance with GAAP. The ASU is effective prospectively for interim and annual periods beginning after December 15, 2011. Management expects that adoption of the ASU will result in additional disclosures in the financial statements, as applicable.
In April 2011, FASB issued ASU No. 2011-03 Reconsideration of Effective Control for Repurchase Agreements. ASU No. 2011-03 amends FASB ASC Topic 860, Transfers and Servicing, specifically the criteria required to determine whether a repurchase agreement (repo) and similar agreements should be accounted for as sales of financial assets or secured borrowings with commitments. ASU No. 2011-03 changes the assessment of effective control by focusing on the transferor’s contractual rights and obligations and removing the criterion to assess its ability to exercise those rights or honor those obligations. This could result in changes to the way entities account for certain transactions including repurchase agreements, mortgage dollar rolls and reverse repurchase agreements. The ASU will become effective on a prospective basis for new transfers and modifications to existing transactions as of the beginning of the first interim or annual period beginning on or after December 15, 2011. Management has evaluated the impact of adopting the ASU and expects no significant changes.
| | | | |
| 30 | | Wells Fargo Advantage Small Cap Value Fund | | Other Information (Unaudited) |
PROXY VOTING INFORMATION
A description of the policies and procedures that the Fund uses to determine how to vote proxies relating to portfolio securities is available without charge, upon request, by calling 1-800-222-8222, visiting our Web site at wellsfargoadvantagefunds.com, or visiting the SEC Web site at sec.gov. Information regarding how the Fund voted proxies relating to portfolio securities during the most recent 12-month period ended June 30 is available without charge on the Fund’s Web site at wellsfargoadvantagefunds.com or by visiting the SEC Web site at sec.gov.
PORTFOLIO HOLDINGS INFORMATION
The complete portfolio holdings for the Fund are publicly available on the Fund’s Web site (wellsfargoadvantagefunds.com) on a monthly, 30-day or more delayed basis. In addition, top ten holdings information for the Fund is publicly available on the Fund’s Web site on a monthly, seven-day or more delayed basis. The Fund files its complete schedule of portfolio holdings with the SEC for the first and third quarters of each fiscal year on Form N-Q, which is available without charge by visiting the SEC Web site at sec.gov. In addition, the Fund’s Form N-Q may be reviewed and copied at the SEC’s Public Reference Room in Washington, DC, and at regional offices in New York City, at 233 Broadway, and in Chicago, at 175 West Jackson Boulevard, Suite 900. Information about the Public Reference Room may be obtained by calling 1-800-SEC-0330.
| | | | | | |
| Other Information (Unaudited) | | Wells Fargo Advantage Small Cap Value Fund | | | 31 | |
BOARD OF TRUSTEES
The following table provides basic information about the Board of Trustees (the “Trustees”) of the Trust and Officers of the Trust. This table should be read in conjunction with the Prospectus and the Statement of Additional Information1 of the Fund. Each of the Trustees and Officers listed below acts in identical capacities for the Wells Fargo Advantage family of funds, which consists of 137 funds comprising the Wells Fargo Funds Trust, Wells Fargo Variable Trust, Wells Fargo Master Trust and four closed-end funds (collectively the “Fund Complex”). All of the Trustees are also Members of the Audit and Governance Committees of each Trust in the Fund Complex. The mailing address of each Trustee and Officer is 525 Market Street, 12th Floor, San Francisco, CA 94105. Each Trustee and Officer serves an indefinite term, however, each Trustee serves such term until reaching the mandatory retirement age established by the Trustees.
Independent Trustees
| | | | | | |
Name and Year of Birth | | Position Held and Length of Service | | Principal Occupations During Past Five Years | | Other Directorships During
Past Five Years |
Peter G. Gordon
(Born 1942) | | Trustee, since 1998; Chairman, since 2005 (Lead Trustee since 2001) | | Co-Founder, Retired Chairman, President and CEO of Crystal Geyser Water Company. Trustee Emeritus, Colby College | | Asset Allocation Trust |
Isaiah Harris, Jr.
(Born 1952) | | Trustee, since 2009 | | Retired. Prior thereto, President and CEO of BellSouth Advertising and Publishing Corp. from 2005 to 2007, President and CEO of BellSouth Enterprises from 2004 to 2005 and President of BellSouth Consumer Services from 2000 to 2003. Emeritus member of the Iowa State University Foundation Board of Governors. Emeritus Member of the Advisory Board of Iowa State University School of Business. Mr. Harris is a certified public accountant. | | CIGNA Corporation; Deluxe Corporation; Asset Allocation Trust |
Judith M. Johnson
(Born 1949) | | Trustee, since 2008 | | Retired. Prior thereto, Chief Executive Officer and Chief Investment Officer of Minneapolis Employees Retirement Fund from 1996 to 2008. Ms. Johnson is an attorney, certified public accountant and a certified managerial accountant. | | Asset Allocation Trust |
Leroy Keith, Jr.
(Born 1939) | | Trustee, since 2010 | | Chairman, Bloc Global Services (development and construction). Trustee of the Evergreen Funds from 1983 to 2010. Former Managing Director, Almanac Capital Management (commodities firm), former Partner, Stonington Partners, Inc. (private equity fund), former Director, Obagi Medical Products Co. and former Director, Lincoln Educational Services. | | Trustee, Virtus Fund Complex (consisting of 40 portfolios as of 12/31/11); Asset Allocation Trust |
David F. Larcker
(Born 1950) | | Trustee, since 2009 | | James Irvin Miller Professor of Accounting at the Graduate School of Business, Stanford University, Director of Corporate Governance Research Program and Senior Faculty of The Rock Center for Corporate Governance since 2006. From 2005 to 2008, Professor of Accounting at the Graduate School of Business, Stanford University. Prior thereto, Ernst & Young Professor of Accounting at The Wharton School, University of Pennsylvania from 1985 to 2005. | | Asset Allocation Trust |
Olivia S. Mitchell
(Born 1953) | | Trustee, since 2006 | | International Foundation of Employee Benefit Plans Professor, Wharton School of the University of Pennsylvania since 1993. Director of Wharton’s Pension Research Council and Boettner Center on Pensions & Retirement Research, and Research Associate at the National Bureau of Economic Research. Previously, Cornell University Professor from 1978 to 1993. | | Asset Allocation Trust |
| | | | |
| 32 | | Wells Fargo Advantage Small Cap Value Fund | | Other Information (Unaudited) |
| | | | | | |
Name and Year of Birth | | Position Held and Length of Service | | Principal Occupations During Past Five Years | | Other Directorships During
Past Five Years |
Timothy J. Penny
(Born 1951) | | Trustee, since 1996 | | President and CEO of Southern Minnesota Initiative Foundation, a non-profit organization, since 2007 and Senior Fellow at the Humphrey Institute Policy Forum at the University of Minnesota since 1995. Member of the Board of Trustees of NorthStar Education Finance, Inc., a non-profit organization, since 2007. | | Asset Allocation Trust |
Michael S. Scofield
(Born 1943) | | Trustee, since 2010 | | Served on the Investment Company Institute’s Board of Governors and Executive Committee from 2008-2011 as well the Governing Council of the Independent Directors Council from 2006-2011 and the Independent Directors Council Executive Committee from 2008-2011. Chairman of the IDC from 2008-2010. Institutional Investor (Fund Directions) Trustee of Year in 2007. Trustee of the Evergreen Funds (and its predecessors) from 1984 to 2010. Chairman of the Evergreen Funds from 2000-2010. Former Trustee of the Mentor Funds. Retired Attorney, Law Offices of Michael S. Scofield and former Director and Chairman, Branded Media Corporation (multi-media branding company). | | Asset Allocation Trust |
Donald C. Willeke
(Born 1940) | | Trustee, since 1996 | | Principal of the law firm of Willeke & Daniels. General Counsel of the Minneapolis Employees Retirement Fund from 1984 until its consolidation into the Minnesota Public Employees Retirement Association on June 30, 2010. Director and Vice Chair of The Free Trust (non-profit corporation). Director of the American Chestnut Foundation (non-profit corporation). | | Asset Allocation Trust |
Officers
| | | | | | |
Name and Year of Birth | | Position Held and
Length of Service | | Principal Occupations During Past Five Years | | |
Karla M. Rabusch
(Born 1959) | | President, since 2003 | | Executive Vice President of Wells Fargo Bank, N.A. and President of Wells Fargo Funds Management, LLC since 2003. Senior Vice President and Chief Administrative Officer of Wells Fargo Funds Management, LLC from 2001 to 2003. | | |
C. David Messman
(Born 1960) | | Secretary, since 2000; Chief Legal Counsel, since 2003 | | Senior Vice President and Secretary of Wells Fargo Funds Management, LLC since 2001. Vice President and Managing Senior Counsel of Wells Fargo Bank, N.A. since 1996. | | |
Kasey Phillips
(Born 1970) | | Treasurer, since 2009 | | Senior Vice President of Wells Fargo Funds Management, LLC since 2009. Senior Vice President of Evergreen Investment Management Company, LLC from 2006 to 2010. Treasurer of the Evergreen Funds from 2005 to 2010. | | |
David Berardi
(Born 1975) | | Assistant Treasurer, since 2009 | | Vice President of Wells Fargo Funds Management, LLC since 2009. Vice President of Evergreen Investment Management Company, LLC from 2008 to 2010. Assistant Vice President of Evergreen Investment Services, Inc. from 2004 to 2008. Manager of Fund Reporting and Control for Evergreen Investment Management Company, LLC from 2004 to 2010. | | |
Jeremy DePalma
(Born 1974) | | Assistant Treasurer, since 2009 | | Senior Vice President of Wells Fargo Funds Management, LLC since 2009. Senior Vice President of Evergreen Investment Management Company, LLC from 2008 to 2010. Vice President, Evergreen Investment Services, Inc. from 2004 to 2007. Head of the Fund Reporting and Control Team within Fund Administration from 2005 to 2010. | | |
Debra Ann Early
(Born 1964) | | Chief Compliance Officer, since 2007 | | Chief Compliance Officer of Wells Fargo Funds Management, LLC since 2007. Chief Compliance Officer of Parnassus Investments from 2005 to 2007. Chief Financial Officer of Parnassus Investments from 2004 to 2007 and Senior Audit Manager of PricewaterhouseCoopers LLP from 1998 to 2004. | | |
| 1. | The Statement of Additional Information includes additional information about the Trustees and is available, without charge, upon request, by calling 1-800-222-8222 or by visiting the Web site at wellsfargoadvantagefunds.com. |
| | | | | | |
| Other Information (Unaudited) | | Wells Fargo Advantage Small Cap Value Fund | | | 33 | |
BOARD CONSIDERATION OF INVESTMENT ADVISORY AND SUB-ADVISORY AGREEMENTS:
Under Section 15 of the Investment Company Act of 1940 (the “1940 Act”), the Board of Trustees (the “Board”) of Wells Fargo Funds Trust (the “Trust”), all the members of which have no direct or indirect interest in the investment advisory and sub-advisory agreements and are not “interested persons” of the Trust, as defined in the 1940 Act (the “Independent Trustees”), must determine whether to approve the continuation of the Trust’s investment advisory and sub-advisory agreements. In this regard, at an in person meeting held on March 29-30, 2012 (the “Meeting”), the Board reviewed and re-approved: (i) an investment advisory agreement with Wells Fargo Funds Management, LLC (“Funds Management”) for Wells Fargo Advantage Small Cap Value Fund (the “Fund”) and (ii) an investment sub-advisory agreement with Wells Capital Management Incorporated (“Wells Capital Management”) for the Fund. The investment advisory agreement with Funds Management and the investment sub-advisory agreement with Wells Capital Management are collectively referred to as the “Advisory Agreements.”
At the Meeting, the Board considered the factors and reached the conclusions described below relating to the selection of Funds Management and Wells Capital Management and the continuation of the Advisory Agreements. Prior to the Meeting, the Trustees conferred extensively among themselves and with representatives of Funds Management about these matters. The Board also met throughout the year and received information that was useful to them in considering the continuation of the Advisory Agreements. The Independent Trustees were assisted in their evaluation of the Advisory Agreements by independent legal counsel, from whom they received separate legal advice and with whom they met separately from Funds Management.
In providing information to the Board, Funds Management and Wells Capital Management were guided by a detailed set of requests submitted by the Independent Trustees’ independent legal counsel on their behalf at the start of the Board’s annual contract renewal process earlier in 2012. In approving the Advisory Agreements, the Board did not identify any particular information or consideration that was all-important or controlling, and each Trustee likely attributed different weights to various factors.
Nature, extent and quality of services
The Board received and considered various information regarding the nature, extent and quality of services provided to the Fund by Funds Management and Wells Capital Management under the Advisory Agreements. The Board also received and considered, among other things, information about the background and experience of senior management of Funds Management, and the qualifications, backgrounds, tenures and responsibilities of the portfolio managers primarily responsible for the day-to-day portfolio management of the Fund.
The Board evaluated the ability of Funds Management and Wells Capital Management, based on their respective financial condition, resources, reputation and other attributes, to attract and retain qualified investment professionals, including research, advisory, and supervisory personnel. The Board further considered the compliance programs and compliance records of Funds Management and Wells Capital Management. In addition, the Board took into account the administrative services provided to the Fund by Funds Management and its affiliates.
The Board’s decision to approve the continuation of the Advisory Agreements was based on a comprehensive evaluation of all of the information provided to it. In considering these matters, the Board considered not only the specific information presented in connection with the Meeting, but also the knowledge gained over time through interaction with Funds Management and Wells Capital Management about various topics, including Funds Management’s oversight of service providers. The above factors, together with those referenced below, are some of the most important, but not necessarily all, factors considered by the Board in concluding that the nature, extent and quality of the investment advisory services provided to the Fund by Funds Management and Wells Capital Management supported the re-approval of the Advisory Agreements. Although the Board considered the continuation of the Advisory Agreements for the Fund as part of the larger process of considering the continuation of the advisory agreements for all of the funds in the complex, its decision to continue the Advisory Agreements for the Fund was ultimately made on a fund-by-fund basis.
Fund performance and expenses
The Board considered the performance results for the Fund over various time periods ended December 31, 2011. The Board also considered these results in comparison to the median performance of a universe of relevant funds (the “Universe”) that was determined by Lipper Inc. (“Lipper”) to be similar to the Fund, and in comparison to the Fund’s
| | | | |
| 34 | | Wells Fargo Advantage Small Cap Value Fund | | Other Information (Unaudited) |
benchmark index and to other comparative data. Lipper is an independent provider of investment company data. The Board received a description of the methodology used by Lipper to select the mutual funds in the Universe. The Board noted that, except for the one-year performance results, the performance of the Fund was higher than the median performance of the Universe for all periods under review. The Board also noted that, except for the one-year performance results, the performance of the Fund was higher than its benchmark, the Lipper Mid-Cap Core Funds Index, for the periods under review.
The Board also noted that the Fund’s more recent performance results warranted further discussion. As part of its further review, the Board received an analysis of, and discussed factors contributing to, the underperformance of the Fund relative to the Universe. The Board received a report that noted Lipper changed the fund category in August 2011 from the Small Cap Core category to Mid Cap Core. The Board also noted that the Fund’s small cap exposure was the highest among its Universe and significantly higher than the median. The Board was satisfied that Funds Management was appropriately monitoring the Fund’s investment performance.
The Board received and considered information regarding the Fund’s contractual advisory fee and net operating expense ratios and their various components, including actual management fees (which reflect fee waivers, if any), transfer agent, custodian and other non-management fees, Rule 12b-1 and non-Rule 12b-1 fees, service fees and fee waiver and expense reimbursement arrangements. The Board also considered these ratios in comparison to the median ratios of an expense Universe and a narrower expense group of mutual funds (each, an “Expense Group”) that was determined by Lipper to be similar to the Fund. The Board received a description of the methodology used by Lipper to select the mutual funds in the Fund’s Expense Group. The Board noted that the net operating expense ratios of the Fund were lower than or in range of the Fund’s Expense Group’s median net operating expense ratios, except for the Investor Class. The Board noted that the operating expense ratio cap for the Investor Class and Class A were reduced in 2010, and the operating expense ratio cap for the Institutional Class was reduced last year. The Board noted that the net operating expense ratio caps for the Investor Class and Class A were reduced in 2010, and the net operating expense ratio cap for the Institutional Class was reduced last year. The Board accepted a recommendation that the current contractual expense caps be maintained.
Based on the above-referenced considerations and other factors, the Board concluded that the overall performance and expense structure of the Fund supported the re-approval of the Advisory Agreements for the Fund.
Investment advisory and sub-advisory fee rates
The Board reviewed and considered the contractual investment advisory fee rate that is payable by the Fund to Funds Management for investment advisory services (the “Advisory Agreement Rate”), both on a stand-alone basis and on a combined basis with the Fund’s administration fee rate. The Board took into account the separate administrative and other services covered by the administration fee rate. The Board also reviewed and considered the contractual investment sub-advisory fee rate that is payable by Funds Management to Wells Capital Management for investment sub-advisory services (the “Sub-Advisory Agreement Rate”). In addition, the Board reviewed and considered the existing fee waiver/cap arrangements applicable to the Advisory Agreement Rate and considered the Advisory Agreement Rate after taking the waivers/caps into account (the “Net Advisory Rate”).
The Board received and considered information comparing the Advisory Agreement Rate and Net Advisory Rate with those of other funds in the Fund’s Expense Group median. The Board noted that while the Advisory Agreement Rate for the Fund was higher than the median rates for the Fund’s Expense Group, the Net Advisory Rate for the Fund was in range of the median rates for the Fund’s Expense Group, except for the Investor Class and Class A. The Board further noted that the Net Advisory Rate for the Fund’s Expense Group did not include transfer-agent expenses. When adjusted to account for transfer-agent expenses, the Board noted that the Net Advisory Rate for the Fund was in range of the median rates for the Fund’s Expense Group.
The Board also received and considered information about the nature and extent of services offered and fee rates charged by Funds Management and Wells Capital Management to other types of clients. In this regard, the Board received information about differences between the services, and the compliance, reporting, and other legal burdens and risks of providing investment advice to mutual funds and those associated with providing advice to non-mutual fund clients such as collective funds or institutional separate accounts.
The Board determined that the Advisory Agreement Rate for the Fund, both with and without an administration fee rate and before and after waivers, was reasonable in light of the Fund’s Expense Group information, the net expense ratio
| | | | | | |
| Other Information (Unaudited) | | Wells Fargo Advantage Small Cap Value Fund | | | 35 | |
commitments, the services covered by the Advisory Agreements and other information provided. The Board also reviewed and considered the Sub-Advisory Agreement Rate and concluded that the Sub-Advisory Agreement Rate was reasonable in light of the services covered by the sub-advisory agreement and other information provided.
Profitability
The Board received and considered a profitability analysis of Funds Management, as well as an analysis of the profitability to the collective Wells Fargo businesses that provide services to the Fund. It considered that the information provided to it was necessarily estimated, and that the profitability information provided to it, especially on a fund-by-fund basis, did not necessarily provide a precise tool for evaluating the appropriateness of the Fund’s Advisory Agreement Rate in isolation. It noted that the levels of profitability reported on a fund-by-fund basis varied widely, depending on, among other things, the size and type of fund. The Board concluded that the profitability reported by Funds Management was not unreasonable.
The Board did not consider separate profitability information with respect to Wells Capital Management, because, as an affiliate of Funds Management, its profitability information was subsumed in the collective Wells Fargo profitability analysis provided by Funds Management.
Economies of scale
With respect to possible economies of scale, the Board reviewed the breakpoints in the Fund’s advisory fee structure, which operate generally to reduce the effective Advisory Agreement Rate of the Fund (as a percentage of Fund assets) as the Fund grows in size. It considered that, as a fund shrinks in size, breakpoints conversely result in increasing fee levels. The Board noted that it would have on-going opportunities to review the appropriate levels of breakpoints in the future, and concluded that the breakpoints as implemented appeared to be a reasonable step toward sharing economies of scale, if any, with the Fund. However, the Board acknowledged the inherent limitations of any analysis of an investment adviser’s economies of scale and of any attempt to correlate breakpoints with such economies, stemming largely from the Board’s understanding that economies of scale are realized, if at all, by an investment adviser across a variety of products and services, not just with respect to a single fund.
Other benefits to Funds Management and Wells Capital Management
The Board received and considered information regarding potential “fall-out” or ancillary benefits received by Funds Management and its affiliates, including Wells Capital Management, as a result of their relationship with the Fund. Ancillary benefits could include, among others, benefits directly attributable to the relationship of Funds Management and Wells Capital Management with the Fund and benefits potentially derived from an increase in Funds Management’s and Wells Capital Management’s business as a result of their relationship with the Fund (such as the ability to market to shareholders other financial products offered by Funds Management and its affiliates, including Wells Capital Management).
The Board considered that Wells Fargo Funds Distributor, LLC, an affiliate of Funds Management, serves as distributor to the Fund and receives certain compensation for those services. The Board noted that various financial institutions, including affiliates of Funds Management, may receive distribution-related fees, shareholder servicing payments (including amounts derived from payments under Rule 12b-1 plans) and sub-transfer agency fees in respect of shares sold or held through them and services provided.
The Board also reviewed information about whether and to what extent soft dollar credits are sought and how any such credits are utilized and any benefits that may be realized by using an affiliated broker.
Other factors and broader review
The Board also considered the markets for distribution of the Fund’s shares, including the channels through which the Fund’s shares are offered and sold. The Board noted that the Fund is part of one of the few fund families that have both direct-to-fund and intermediary distribution channels. As discussed above, the Board reviews detailed materials received from Funds Management and Wells Capital Management annually as part of the re-approval process under Section 15 of the 1940 Act and also reviews and assesses information about the quality of the services that the Fund receives throughout the year. In this regard, the Board has reviewed reports of Funds Management at each of its quarterly meetings, which include, among other things, portfolio reviews and performance reports. In addition, the Board confers with portfolio managers at various times throughout the year.
| | | | |
| 36 | | Wells Fargo Advantage Small Cap Value Fund | | Other Information (Unaudited) |
Conclusion
After considering the above-described factors and based on its deliberations and its evaluation of the information described above, the Board unanimously approved the continuation of the Advisory Agreements for an additional one-year period.
| | | | | | |
| List of Abbreviations | | Wells Fargo Advantage Small Cap Value Fund | | | 37 | |
The following is a list of common abbreviations for terms and entities which may have appeared in this report.
| ACB | — Agricultural Credit Bank |
| ADR | — American Depository Receipt |
| ADS | — American Depository Shares |
| AGC-ICC | — Assured Guaranty Corporation - Insured Custody Certificates |
| AGM | — Assured Guaranty Municipal |
| AMBAC | — American Municipal Bond Assurance Corporation |
| AMT | — Alternative Minimum Tax |
| BAN | — Bond Anticipation Notes |
| BHAC | — Berkshire Hathaway Assurance Corporation |
| CAB | — Capital Appreciation Bond |
| CCAB | — Convertible Capital Appreciation Bond |
| CDA | — Community Development Authority |
| CDO | — Collateralized Debt Obligation |
| COP | — Certificate of Participation |
| DRIVER | — Derivative Inverse Tax-Exempt Receipts |
| DW&P | — Department of Water & Power |
| DWR | — Department of Water Resources |
| ECFA | — Educational & Cultural Facilities Authority |
| EDA | — Economic Development Authority |
| EDFA | — Economic Development Finance Authority |
| ETF | — Exchange-Traded Fund |
| FFCB | — Federal Farm Credit Bank |
| FGIC | — Financial Guaranty Insurance Corporation |
| FHA | — Federal Housing Authority |
| FHLB | — Federal Home Loan Bank |
| FHLMC | — Federal Home Loan Mortgage Corporation |
| FICO | — The Financing Corporation |
| FNMA | — Federal National Mortgage Association |
| GDR | — Global Depository Receipt |
| GNMA | — Government National Mortgage Association |
| HCFR | — Healthcare Facilities Revenue |
| HEFA | — Health & Educational Facilities Authority |
| HEFAR | — Higher Education Facilities Authority Revenue |
| HFA | — Housing Finance Authority |
| HFFA | — Health Facilities Financing Authority |
| IBC | — Insured Bond Certificate |
| IDA | — Industrial Development Authority |
| IDAG | — Industrial Development Agency |
| IDR | — Industrial Development Revenue |
| KRW | — Republic of Korea Won |
| LIBOR | — London Interbank Offered Rate |
| LLC | — Limited Liability Company |
| LLP | — Limited Liability Partnership |
| MBIA | — Municipal Bond Insurance Association |
| MFHR | — Multi-Family Housing Revenue |
| MSTR | — Municipal Securities Trust Receipts |
| MUD | — Municipal Utility District |
| NATL-RE | — National Public Finance Guarantee Corporation |
| PCFA | — Pollution Control Finance Authority |
| PCR | — Pollution Control Revenue |
| PFA | — Public Finance Authority |
| PFFA | — Public Facilities Financing Authority |
| PFOTER | — Puttable Floating Option Tax-Exempt Receipts |
| plc | — Public Limited Company |
| PUTTER | — Puttable Tax-Exempt Receipts |
| R&D | — Research & Development |
| RDA | — Redevelopment Authority |
| RDFA | — Redevelopment Finance Authority |
| REIT | — Real Estate Investment Trust |
| ROC | — Reset Option Certificates |
| SAVRS | — Select Auction Variable Rate Securities |
| SBA | — Small Business Authority |
| SFHR | — Single Family Housing Revenue |
| SFMR | — Single Family Mortgage Revenue |
| SPA | — Standby Purchase Agreement |
| SPDR | — Standard & Poor’s Depositary Receipts |
| STRIPS | — Separate Trading of Registered Interest and Principal Securities |
| TAN | — Tax Anticipation Notes |
| TIPS | — Treasury Inflation-Protected Securities |
| TRAN | — Tax Revenue Anticipation Notes |
| TCR | — Transferable Custody Receipts |
| TTFA | — Transportation Trust Fund Authority |
| TVA | — Tennessee Valley Authority |
| XLCA | — XL Capital Assurance |
This page is intentionally left blank.


FOR MORE INFORMATION
More information about Wells Fargo Advantage Funds is available free upon request. To obtain literature, please write, e-mail, visit the Fund’s Web site, or call:
Wells Fargo Advantage Funds
P.O. Box 8266
Boston, MA 02266-8266
E-mail: wfaf@wellsfargo.com
Web site: wellsfargoadvantagefunds.com
Individual investors: 1-800-222-8222
Retail investment professionals: 1-888-877-9275
Institutional investment professionals: 1-866-765-0778
This report and the financial statements contained herein are submitted for the general information of the shareholders of Wells Fargo Advantage Funds. If this report is used for promotional purposes, distribution of the report must be accompanied or preceded by a current prospectus. For a prospectus containing more complete information, including charges and expenses, call 1-800-222-8222 or visit the Fund’s Web site at wellsfargoadvantagefunds.com. Please consider the investment objectives, risks, charges, and expenses of the investment carefully before investing. This and other information about Wells Fargo Advantage Funds can be found in the current prospectus. Read the prospectus carefully before you invest or send money.
Wells Fargo Funds Management, LLC, a wholly owned subsidiary of Wells Fargo & Company, provides investment advisory and administrative services for Wells Fargo Advantage Funds. Other affiliates of Wells Fargo & Company provide subadvisory and other services for the Funds. The Funds are distributed by Wells Fargo Funds Distributor, LLC, Member FINRA/SIPC, an affiliate of Wells Fargo & Company.
NOT FDIC INSURED ¡ NO BANK GUARANTEE ¡ MAY LOSE VALUE
© 2012 Wells Fargo Funds Management, LLC. All rights reserved.
| | |
 | | 209728 06-12 SA244/SAR244 4-12 |

Wells Fargo Advantage Small/Mid Cap Value Fund

Semi-Annual Report
April 30, 2012

Reduce clutter. Save trees.
Sign up for electronic delivery of prospectuses and shareholder reports at wellsfargo.com/advantagedelivery
Contents
The views expressed and any forward-looking statements are as of April 30, 2012, unless otherwise noted, and are those of the Fund managers and/or Wells Fargo Funds Management, LLC. Discussions of individual securities, or the markets generally, or any Wells Fargo Advantage Fund are not intended as individual recommendations. Future events or results may vary significantly from those expressed in any forward-looking statements; the views expressed are subject to change at any time in response to changing circumstances in the market. Wells Fargo Funds Management, LLC, disclaims any obligation to publicly update or revise any views expressed or forward-looking statements.
NOT FDIC INSURED ¡ NO BANK GUARANTEE ¡ MAY LOSE VALUE

WELLS FARGO INVESTMENT HISTORY
| | |
| |
| 1932 | | Keystone creates one of the first mutual fund families. |
| |
| 1971 | | Wells Fargo & Company introduces one of the first institutional index funds. |
| |
| 1978 | | Wells Fargo applies Markowitz and Sharpe’s research on Modern Portfolio Theory to introduce one of the industry’s first Tactical Asset Allocation (TAA) models in institutional separately managed accounts. |
| |
| 1984 | | Wells Fargo Stagecoach Funds launches its first asset allocation fund. |
| |
| 1989 | | The Tactical Asset Allocation (TAA) Model is first applied to Wells Fargo’s asset allocation mutual funds. |
| |
| 1994 | | Wells Fargo introduces the LifePath Funds, one of the first suites of target date funds (now the Wells Fargo Advantage Dow Jones Target Date FundsSM). |
| |
| 1996 | | Evergreen Investments and Keystone Funds merge. |
| |
| 1997 | | Wells Fargo launches Wells Fargo Advantage WealthBuilder PortfoliosSM, a fund-of-funds suite of products that includes the use of quantitative models to shift assets among investment styles. |
| |
| 1999 | | Norwest Advantage Funds and Stagecoach Funds are reorganized into Wells Fargo Funds after the merger of Norwest and Wells Fargo. |
| |
| 2002 | | Evergreen Retail and Evergreen Institutional companies form the umbrella asset management company, Evergreen Investments. |
| |
| 2005 | | The integration of Strong Funds with Wells Fargo Funds creates Wells Fargo Advantage Funds, resulting in one of the top 20 mutual fund companies in the United States. |
| |
| 2006 | | Wells Fargo Advantage Funds relaunches the target date product line as Wells Fargo Advantage Dow Jones Target Date Funds. |
| |
| 2010 | | The mergers and reorganizations of Evergreen and Wells Fargo Advantage mutual funds are completed, unifying the families under the brand of Wells Fargo Advantage Funds. |
Wells Fargo Advantage Funds®
Wells Fargo Advantage Funds skillfully guides institutions, financial advisors, and individuals through the investment terrain to help them reach their financial objectives. Everything we do on behalf of investors is backed by our unique combination of qualifications.
Strength
Our organization is built on the standards of integrity and service established by our parent company—Wells Fargo & Company—more than 150 years ago. And, because we’re part of a highly diversified financial enterprise, we offer the depth of resources to help investors succeed.
Expertise
Our multi-boutique model offers investors access to the independent thinking of premier investment managers that have been chosen for their time-tested strategies. While each team specializes in a specific investment strategy, collectively they provide investors a wide choice of distinct investment styles. Our dedication to investment excellence doesn’t end with our expertise in manager selection—risk management, analysis, and rigorous ongoing review seek to ensure each manager’s investment process remains consistent.
Partnership
Our collaborative approach is built around understanding the needs and goals of our clients. By adhering to core principles of sound judgment and steady guidance, we support you through every stage of the investment decision process.
Carefully consider a fund’s investment objectives, risks, charges, and expenses before investing. For a current prospectus and, if available, a summary prospectus, containing this and other information, visit wellsfargoadvantagefunds.com. Read it carefully before investing.
Wells Fargo Funds Management, LLC, a wholly owned subsidiary of Wells Fargo & Company, provides investment advisory and administrative services for Wells Fargo Advantage Funds®. Other affiliates of Wells Fargo & Company provide subadvisory and other services for the Funds. The Funds are distributed by Wells Fargo Funds Distributor, LLC, Member FINRA/SIPC, an affiliate of Wells Fargo & Company.
“Dow Jones®” and “Dow Jones Target Date IndexesSM” are service marks of Dow Jones Trademark Holdings, LLC (“Dow Jones”), have been licensed to CME Group Index Services LLC (“CME Indexes”) and have been sublicensed for use for certain purposes by Global Index Advisors, Inc, and Wells Fargo Funds Management, LLC. The Wells Fargo Advantage Dow Jones Target Date FundsSM based on the Dow Jones Target Date IndexesSM, are not sponsored, endorsed, sold or promoted by Dow Jones, CME Indexes or their respective affiliates and none of them makes any representation regarding the advisability of investing in such product(s).
NOT FDIC INSURED ¡ NO BANK GUARANTEE ¡ MAY LOSE VALUE
Not part of the semi-annual report.
Wells Fargo Advantage Funds offers more than 110 mutual funds across a wide range of asset classes, representing over $211 billion in assets under management, as of April 30, 2012.
| | | | |
| Equity Funds | | | | |
Asia Pacific Fund | | Enterprise Fund† | | Opportunity Fund† |
C&B Large Cap Value Fund | | Equity Value Fund | | Precious Metals Fund |
C&B Mid Cap Value Fund | | Global Opportunities Fund | | Premier Large Company Growth Fund |
Capital Growth Fund | | Growth Fund | | Small Cap Opportunities Fund |
Common Stock Fund | | Index Fund | | Small Cap Value Fund |
Disciplined U.S. Core Fund | | International Equity Fund | | Small Company Growth Fund |
Discovery Fund† | | International Value Fund | | Small Company Value Fund |
Diversified Equity Fund | | Intrinsic Small Cap Value Fund | | Small/Mid Cap Core Fund |
Diversified International Fund | | Intrinsic Value Fund | | Small/Mid Cap Value Fund |
Diversified Small Cap Fund | | Intrinsic World Equity Fund | | Special Mid Cap Value Fund |
Emerging Growth Fund | | Large Cap Core Fund | | Special Small Cap Value Fund |
Emerging Markets Equity Fund | | Large Cap Growth Fund | | Specialized Technology Fund |
Emerging Markets Equity Income Fund | | Large Company Value Fund | | Traditional Small Cap Growth Fund |
Emerging Markets Local Bond Fund | | Omega Growth Fund | | Utility and Telecommunications Fund |
Endeavor Select Fund† | | | | |
| Bond Funds | | | | |
Adjustable Rate Government Fund | | Inflation-Protected Bond Fund | | Short-Term Bond Fund |
California Limited-Term Tax-Free Fund | | Intermediate Tax/AMT-Free Fund | | Short-Term High Yield Bond Fund |
California Tax-Free Fund | | International Bond Fund | | Short-Term Municipal Bond Fund |
Colorado Tax-Free Fund | | Minnesota Tax-Free Fund | | Strategic Municipal Bond Fund |
Government Securities Fund | | Municipal Bond Fund | | Total Return Bond Fund |
High Income Fund | | North Carolina Tax-Free Fund | | Ultra Short-Term Income Fund |
High Yield Bond Fund | | Pennsylvania Tax-Free Fund | | Ultra Short-Term Municipal Income Fund |
Income Plus Fund | | Short Duration Government Bond Fund | | Wisconsin Tax-Free Fund |
| Asset Allocation Funds | | | | |
Absolute Return Fund | | WealthBuilder Equity Portfolio† | | Target 2020 Fund† |
Asset Allocation Fund | | WealthBuilder Growth Allocation Portfolio† | | Target 2025 Fund† |
Conservative Allocation Fund | | WealthBuilder Growth Balanced Portfolio† | | Target 2030 Fund† |
Diversified Capital Builder Fund | | WealthBuilder Moderate Balanced Portfolio† | | Target 2035 Fund† |
Diversified Income Builder Fund | | WealthBuilder Tactical Equity Portfolio† | | Target 2040 Fund† |
Growth Balanced Fund | | Target Today Fund† | | Target 2045 Fund† |
Index Asset Allocation Fund | | Target 2010 Fund† | | Target 2050 Fund† |
Moderate Balanced Fund | | Target 2015 Fund† | | Target 2055 Fund† |
WealthBuilder Conservative Allocation Portfolio† | | | | |
| Money Market Funds | | | | |
100% Treasury Money Market Fund | | Heritage Money Market Fund† | | National Tax-Free Money Market Fund |
California Municipal Money Market Fund | | Money Market Fund | | Prime Investment Money Market Fund |
Cash Investment Money Market Fund | | Municipal Cash Management Money Market Fund | | Treasury Plus Money Market Fund |
Government Money Market Fund | | Municipal Money Market Fund | | |
| Variable Trust Funds1 | | | | |
VT Discovery Fund† | | VT Intrinsic Value Fund | | VT Small Cap Growth Fund |
VT Index Asset Allocation Fund | | VT Omega Growth Fund | | VT Small Cap Value Fund |
VT International Equity Fund | | VT Opportunity Fund† | | VT Total Return Bond Fund |
An investment in a money market fund is not insured or guaranteed by the Federal Deposit Insurance Corporation or any other government agency. Although the Wells Fargo Advantage Money Market Funds seek to preserve the value of your investment at $1.00 per share, it is possible to lose money by investing in a money market fund.
| 1. | The Variable Trust Funds are generally available only through insurance company variable contracts. |
| † | In this report, the Wells Fargo Advantage Discovery FundSM, Wells Fargo Advantage Endeavor Select FundSM, Wells Fargo Advantage Enterprise FundSM, Wells Fargo Advantage Opportunity FundSM, Wells Fargo Advantage WealthBuilder Conservative Allocation PortfolioSM, Wells Fargo Advantage WealthBuilder Equity PortfolioSM, Wells Fargo Advantage WealthBuilder Growth Allocation PortfolioSM, Wells Fargo Advantage WealthBuilder Growth Balanced PortfolioSM, Wells Fargo Advantage WealthBuilder Moderate Balanced PortfolioSM, Wells Fargo Advantage WealthBuilder Tactical Equity PortfolioSM, Wells Fargo Advantage Dow Jones Target Today FundSM, Wells Fargo Advantage Dow Jones Target 2010 FundSM, Wells Fargo Advantage Dow Jones Target 2015 FundSM, Wells Fargo Advantage Dow Jones Target 2020 FundSM, Wells Fargo Advantage Dow Jones Target 2025 FundSM, Wells Fargo Advantage Dow Jones Target 2030 FundSM, Wells Fargo Advantage Dow Jones Target 2035 FundSM, Wells Fargo Advantage Dow Jones Target 2040 FundSM, Wells Fargo Advantage Dow Jones Target 2045 FundSM, Wells Fargo Advantage Dow Jones Target 2050 FundSM, Wells Fargo Advantage Dow Jones Target 2055 FundSM, Wells Fargo Advantage Heritage Money Market FundSM, Wells Fargo Advantage VT Discovery FundSM, and Wells Fargo Advantage VT Opportunity FundSM are referred to as the Discovery Fund, Endeavor Select Fund, Enterprise Fund, Opportunity Fund, WealthBuilder Conservative Allocation Portfolio, WealthBuilder Equity Portfolio, WealthBuilder Growth Allocation Portfolio, WealthBuilder Growth Balanced Portfolio, WealthBuilder Moderate Balanced Portfolio, WealthBuilder Tactical Equity Portfolio, Target Today Fund, Target 2010 Fund, Target 2015 Fund, Target 2020 Fund, Target 2025 Fund, Target 2030 Fund, Target 2035 Fund, Target 2040 Fund, Target 2045 Fund, Target 2050 Fund, Target 2055 Fund, Heritage Money Market Fund, VT Discovery Fund, and VT Opportunity Fund, respectively. |
Not part of the semi-annual report.
| | | | |
| 2 | | Wells Fargo Advantage Small/Mid Cap Value Fund | | Letter to Shareholders |

Karla M. Rabusch,
President
Wells Fargo Advantage Funds
The period was marked by continued concerns about the possible global economic effects of the ongoing European sovereign debt crisis that began in Greece and later spread to the larger economies of Italy and Spain.
In contrast to worrisome data from the eurozone, U.S. economic data remained moderately positive.
Dear Valued Shareholder:
We’re pleased to offer you this semi-annual report for the Wells Fargo Advantage Small/Mid Cap Value Fund for the six-month period that ended April 30, 2012. The period was marked by continued concerns about the possible global economic effects of the ongoing European sovereign debt crisis that began in Greece and later spread to the larger economies of Italy and Spain. However, relatively positive U.S. economic data resulted in most U.S. stock indexes posting gains for the period, with large-cap stocks modestly outperforming small-cap stocks.
Macroeconomic optimism seemed to fade as global growth slowed and worries rose.
Prior to and throughout the reporting period, concerns about the eurozone sovereign debt situation returned to center stage. Investors became increasingly concerned that Greece would default on its debt, a scenario that only seemed more likely as eurozone leaders began to openly discuss a “voluntary” haircut on Greek debt for private investors. Because many eurozone banks owned Greek debt and many U.S. banks had financial ties to eurozone banks, investors worried about the effects of such an event on the financial systems and on the global economy.
In October 2011, market participants turned their attention to the debt burdens of Italy—which, like the U.S., also had its credit rating downgraded by Standard & Poor’s—because even though it had a relatively modest budget deficit, it had a high amount of outstanding debt and a stagnant economy. French banks were heavily exposed to Italian debt, so Italy’s woes led to fears of a state bailout of French banks and a resulting increase in France’s expenditures.
The Greek credit crisis was seemingly addressed in March 2012, when the Greek government came to an agreement with its creditors that allowed it to write down the principal on most of its bonds in exchange for increased financial austerity. The Greek agreement, combined with unprecedented support for eurozone banks by the European Central Bank (ECB), seemed to calm investor concerns, at least temporarily, and most developed European markets ended the period with gains.
The U.S. economy reported relatively solid news.
In contrast to worrisome data from the eurozone, U.S. economic data remained moderately positive. Reported gross domestic product (GDP) growth came in at a 1.8% annualized rate in the third quarter of 2011 and then accelerated to a 3.0% annualized rate in the fourth quarter. The initial estimate for GDP growth in the first quarter of 2012 came in at a 2.2% annualized rate, further supporting the case for economic recovery. In addition, the major banks appeared to have taken steps toward repairing their balance sheets; in March, the Federal Reserve (Fed) announced that 15 of the 19 major banks had passed a “stress test” in which the Fed attempted to gauge whether the banks could survive a severe recession that included a 50% drop in the stock market and a 21% percent decline in housing prices.
Financial stocks rebounded and outperformed the broader market for the reporting period after the Fed released details of the stress test. Stocks generally rallied across the market as investors seemed to be increasingly confident that the U.S. would not return to recession.
| | | | | | |
| Letter to Shareholders | | Wells Fargo Advantage Small/Mid Cap Value Fund | | | 3 | |
Central banks continued to provide stimulus.
Throughout the reporting period, the Federal Open Market Committee kept its key interest rates effectively at zero in order to support the economy and financial system. In response to extreme market volatility and signs of a weakening economy, the Fed announced its intention to keep interest rates low until at least late 2014.
As of November 1, 2011, the ECB had a key rate of 1.50%, which it had increased from 1.0% in an attempt to keep inflation in check. Soon, in response to weakness in the southern European economies, the ECB lowered its key rate to 1.25% in early November 2011 and 1.0% in December 2011. The ECB also continued to provide virtually unlimited liquidity for banks, announcing a Long-Term Refinancing Operation in December through which it provided low-cost three-year loans to lenders.
We use time-tested investment strategies, even as many variables are at work in the market.
Elevated unemployment and debt defaults continue to pressure consumers and businesses alike. In our experience, strict adherence to time-tested investment strategies has its rewards. As a whole, Wells Fargo Advantage Funds represents investments across a range of asset classes and investment styles, giving you an opportunity to create a diversified investment portfolio. While diversification may not prevent losses in a downturn, we believe it helps in managing risk.
Thank you for choosing to invest with Wells Fargo Advantage Funds. We appreciate your confidence in us and remain committed to helping you meet your financial needs. For current information about your fund investments, contact your investment professional, visit our Web site at wellsfargoadvantagefunds.com, or call us directly at 1-800-222-8222. We are available 24 hours a day, 7 days a week.
Sincerely,

Karla M. Rabusch
President
Wells Fargo Advantage Funds
| | | | |
| 4 | | Wells Fargo Advantage Small/Mid Cap Value Fund | | Letter to Shareholders |
Notice to Shareholders
The Board of Trustees for Wells Fargo Advantage Funds has unanimously approved the following modifications to certain net asset value (NAV) waiver privileges and commission schedules:
| | n | | Effective May 1, 2012, automatic investment plan (AIP) purchases and proceeds received from systematic withdrawals will no longer qualify for NAV repurchase privileges. | |
| | n | | Effective May 1, 2012, discretionary rights to waive the upfront commission for Class C and “jumbo” Class A share purchases will no longer be granted to broker/dealers. However, we will continue to waive the Class C shares contingent deferred sales charge for redemptions by employer-sponsored retirement plans where the dealer of record waived its commission at the time of purchase. | |
| | n | | Effective July 31, 2012, NAV purchase privileges for former Evergreen Class IS and Class R shareholders are being modified to remove the ability to purchase Class A shares at NAV unless those shares are held directly with the Fund on or after July 31, 2012. | |
Please contact your investment professional or call us directly at 1-800-222-8222 if you have any questions on this Notice to Shareholders.
| | | | | | |
| Performance Highlights (Unaudited) | | Wells Fargo Advantage Small/Mid Cap Value Fund | | | 5 | |
INVESTMENT OBJECTIVE
The Fund seeks long-term capital appreciation.
ADVISER
Wells Fargo Funds Management, LLC
SUB-ADVISER
Wells Capital Management Incorporated
PORTFOLIO MANAGERS
Erik C. Astheimer
I. Charles Rinaldi
Michael Schneider, CFA
FUND INCEPTION
March 28, 2002
| | | | |
TEN LARGEST EQUITY HOLDINGS1
(AS OF APRIL 30, 2012) | | | |
InterOil Corporation | | | 6.28% | |
Randgold Resources Limited ADR | | | 5.90% | |
Chimera Investment Corporation | | | 2.91% | |
Orasure Technologies Incorporated | | | 2.30% | |
Sandstorm Gold Limited | | | 2.25% | |
Range Resources Corporation | | | 2.06% | |
Trilogy Energy Corporation | | | 1.79% | |
GEO Group Incorporated | | | 1.67% | |
Argo Group International Holdings Limited | | | 1.66% | |
McMoRan Exploration Company | | | 1.62% | |
| | |
SECTOR DISTRIBUTION2
(AS OF APRIL 30, 2012) | | |
|
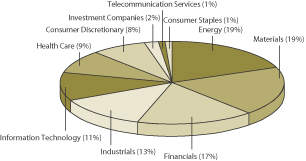 |
| 1. | The ten largest equity holdings are calculated based on the value of the securities divided by total net assets of the Fund. Holdings are subject to change and may have changed since the date specified. |
| 2. | Sector distribution is subject to change and is calculated based on the total long-term investments of the Fund. |
| | | | |
| 6 | | Wells Fargo Advantage Small/Mid Cap Value Fund | | Performance Highlights (Unaudited) |
AVERAGE ANNUAL TOTAL RETURN3 (%) (AS OF APRIL 30, 2012)
| | | | | | | | | | | | | | | | | | | | | | | | | | | | | | | | | | | | | | | | | | | | |
| | | | | | Including Sales Charge | | | Excluding Sales Charge | | | Expense Ratios4 | |
| | | Inception Date | | | 6 Months* | | | 1 Year | | | 5 Year | | | 10 Year | | | 6 Months* | | | 1 Year | | | 5 Year | | | 10 Year | | | Gross | | | Net5 | |
Class A (WFVAX) | | | 07/31/2007 | | | | (0.24 | ) | | | (12.29 | ) | | | (1.06 | ) | | | 6.38 | | | | 5.84 | | | | (6.96 | ) | | | 0.11 | | | | 7.01 | | | | 1.41% | | | �� | 1.41% | |
Class C (WFCVX) | | | 07/31/2007 | | | | 4.50 | | | | (8.62 | ) | | | (0.61 | ) | | | 6.43 | | | | 5.50 | | | | (7.62 | ) | | | (0.61 | ) | | | 6.43 | | | | 2.16% | | | | 2.16% | |
Administrator Class (WWMDX) | | | 04/08/2005 | | | | | | | | | | | | | | | | | | | | 5.92 | | | | (6.73 | ) | | | 0.37 | | | | 7.24 | | | | 1.25% | | | | 1.16% | |
Institutional Class (WWMSX) | | | 08/31/2006 | | | | | | | | | | | | | | | | | | | | 6.07 | | | | (6.54 | ) | | | 0.56 | | | | 7.36 | | | | 0.98% | | | | 0.96% | |
Investor Class (SMMVX) | | | 03/28/2002 | | | | | | | | | | | | | | | | | | | | 5.77 | | | | (7.03 | ) | | | 0.02 | | | | 6.97 | | | | 1.48% | | | | 1.48% | |
Russell 2500TM Value Index6 | | | | | | | | | | | | | | | | | | | | | | | 12.32 | | | | (2.78 | ) | | | 0.46 | | | | 7.21 | | | | | | | | | |
| * | Returns for periods of less than one year are not annualized. |
Figures quoted represent past performance, which is no guarantee of future results and do not reflect the deduction of taxes that a shareholder may pay on fund distributions or the redemption of fund shares. Investment return and principal value of an investment will fluctuate so that an investor’s shares, when redeemed, may be worth more or less than their original cost. Performance shown without sales charges would be lower if sales charges were reflected. Current performance may be lower or higher than the performance data quoted and assumes the reinvestment of dividends and capital gains. Current month-end performance is available on the Fund’s Web site – wellsfargoadvantagefunds.com.
Index returns do not include transaction costs associated with buying and selling securities, any mutual fund fees or expenses or any taxes. It is not possible to invest directly in an index.
For Class A shares, the maximum front-end sales charge is 5.75%. For Class C shares, the maximum contingent deferred sales charge is 1.00%. Performance including sales charge assumes the sales charge for the corresponding time period. Administrator Class, Institutional Class and Investor Class shares are sold without a front-end sales charge or contingent deferred sales charge.
Stock fund values fluctuate in response to the activities of individual companies and general market and economic conditions. Smaller-company stocks tend to be more volatile and less liquid than those of larger companies. The use of derivatives may reduce returns and/or increase volatility. Certain investment strategies tend to increase the total risk of an investment (relative to the broader market). This Fund is exposed to foreign investment risk. Consult the Fund’s prospectus for additional information on these and other risks.
| 3. | Historical performance shown for Class A and the Administrator Class shares prior to their inception reflects the performance of the Investor Class shares, and includes the higher expenses applicable to the Investor Class shares. If these expenses had not been included, returns would be higher. Historical performance shown for Class C shares prior to their inception reflects the performance of the Investor Class shares, adjusted to reflect the higher expenses applicable to Class C shares. Historical performance shown for the Institutional Class shares prior to their inception reflects the performance of the Administrator Class shares, and includes the higher expenses applicable to the Administrator Class shares. If these expenses had not been included, returns would be higher. |
| 4. | Reflects the expense ratios as stated in the most recent prospectuses. |
| 5. | The Adviser has committed through February 28, 2013 to waive fees and/or reimburse expenses to the extent necessary to cap the Fund’s Total Annual Fund Operating Expenses After Fee Waiver, excluding certain expenses, at 1.40% for Class A, 2.15% for Class C, 1.15% for Administrator Class, 0.95% for Institutional Class and 1.47% for Investor Class. Without this cap, the Fund’s returns would have been lower. |
| 6. | The Russell 2500TM Value Index measures the performance of those Russell 2500TM companies with lower price-to-book ratios and lower forecasted growth values. You cannot invest directly in an index. |
| | | | | | |
| Fund Expenses (Unaudited) | | Wells Fargo Advantage Small/Mid Cap Value Fund | | | 7 | |
As a shareholder of the Fund, you incur two types of costs: (1) transaction costs, including sales charges (loads) on purchase payments and contingent deferred sales charges (if any) on redemptions and (2) ongoing costs, including management fees; distribution (12b-1) and/or shareholder service fees; and other Fund expenses. This example is intended to help you understand your ongoing costs (in dollars) of investing in the Fund and to compare these costs with the ongoing costs of investing in other mutual funds.
The example is based on an investment of $1,000 invested at the beginning of the six-month period and held for the entire period from November 1, 2011 to April 30, 2012.
Actual Expenses
The “Actual” line of the table below provides information about actual account values and actual expenses. You may use the information in this line, together with the amount you invested, to estimate the expenses that you paid over the period. Simply divide your account value by $1,000 (for example, an $8,600 account value divided by $1,000 = 8.6), then multiply the result by the number in the “Actual” line under the heading entitled “Expenses Paid During Period” for your applicable class of shares to estimate the expenses you paid on your account during this period.
Hypothetical Example for Comparison Purposes
The “Hypothetical” line of the table below provides information about hypothetical account values and hypothetical expenses based on the Fund’s actual expense ratio and an assumed rate of return of 5% per year before expenses, which is not the Fund’s actual return. The hypothetical account values and expenses may not be used to estimate the actual ending account balance or expenses you paid for the period. You may use this information to compare the ongoing costs of investing in the Fund and other funds. To do so, compare this 5% hypothetical example with the 5% hypothetical examples that appear in the shareholder reports of the other funds.
Please note that the expenses shown in the table are meant to highlight your ongoing costs only and do not reflect any transactional costs, such as sales charges (loads) and contingent deferred sales charges. Therefore, the “Hypothetical” line of the table is useful in comparing ongoing costs only, and will not help you determine the relative total costs of owning different funds. In addition, if these transactional costs were included, your costs would have been higher.
| | | | | | | | | | | | | | | | |
| | | Beginning
Account Value
11-01-2011 | | | Ending
Account Value
04-30-2012 | | | Expenses
Paid During
the Period1 | | | Net Annual
Expense Ratio | |
Class A | | | | | | | | | | | | | | | | |
Actual | | $ | 1,000.00 | | | $ | 1,058.40 | | | $ | 7.11 | | | | 1.39 | % |
Hypothetical (5% return before expenses) | | $ | 1,000.00 | | | $ | 1,017.95 | | | $ | 6.97 | | | | 1.39 | % |
Class C | | | | | | | | | | | | | | | | |
Actual | | $ | 1,000.00 | | | $ | 1,055.01 | | | $ | 10.93 | | | | 2.14 | % |
Hypothetical (5% return before expenses) | | $ | 1,000.00 | | | $ | 1,014.22 | | | $ | 10.72 | | | | 2.14 | % |
Administrator Class | | | | | | | | | | | | | | | | |
Actual | | $ | 1,000.00 | | | $ | 1,059.19 | | | $ | 5.89 | | | | 1.15 | % |
Hypothetical (5% return before expenses) | | $ | 1,000.00 | | | $ | 1,019.14 | | | $ | 5.77 | | | | 1.15 | % |
Institutional Class | | | | | | | | | | | | | | | | |
Actual | | $ | 1,000.00 | | | $ | 1,060.72 | | | $ | 4.87 | | | | 0.95 | % |
Hypothetical (5% return before expenses) | | $ | 1,000.00 | | | $ | 1,020.14 | | | $ | 4.77 | | | | 0.95 | % |
Investor Class | | | | | | | | | | | | | | | | |
Actual | | $ | 1,000.00 | | | $ | 1,057.75 | | | $ | 7.47 | | | | 1.46 | % |
Hypothetical (5% return before expenses) | | $ | 1,000.00 | | | $ | 1,017.60 | | | $ | 7.32 | | | | 1.46 | % |
| 1. | Expenses paid is equal to the annualized expense ratio of each class multiplied by the average account value over the period, multiplied by the number of days in the most recent fiscal half-year divided by the number of days in the fiscal year (to reflect the one-half year period). |
| | | | |
| 8 | | Wells Fargo Advantage Small/Mid Cap Value Fund | | Portfolio of Investments—April 30, 2012 (Unaudited) |
| | | | | | | | | | | | |
| Security Name | | | | | | Shares | | | Value | |
| | | | | | | | | | | | |
| | | | |
Common Stocks: 96.44% | | | | | | | | | | | | |
| | | | |
Consumer Discretionary: 7.53% | | | | | | | | | | | | |
| | | | |
| Auto Components: 1.22% | | | | | | | | | | | | |
Gentex Corporation | | | | | | | 129,700 | | | $ | 2,849,509 | |
| | | | | | | | | | | | |
| | | | |
| Automobiles: 0.03% | | | | | | | | | | | | |
Winnebago Industries Incorporated † | | | | | | | 7,300 | | | | 71,175 | |
| | | | | | | | | | | | |
| | | | |
| Hotels, Restaurants & Leisure: 1.22% | | | | | | | | | | | | |
Century Casinos Incorporated † | | | | | | | 835,800 | | | | 2,465,610 | |
Empire Resorts Incorporated † | | | | | | | 174,600 | | | | 392,850 | |
| | | | |
| | | | | | | | | | | 2,858,460 | |
| | | | | | | | | | | | |
| | | | |
| Household Durables: 1.48% | | | | | | | | | | | | |
Cavco Industries Incorporated † | | | | | | | 67,154 | | | | 3,465,146 | |
| | | | | | | | | | | | |
| | | | |
| Leisure Equipment & Products: 0.77% | | | | | | | | | | | | |
Black Diamond Incorporated † | | | | | | | 181,200 | | | | 1,799,316 | |
| | | | | | | | | | | | |
| | | | |
| Media: 2.32% | | | | | | | | | | | | |
Entravision Communications Corporation Class A † | | | | | | | 657,100 | | | | 1,031,647 | |
Interpublic Group of Companies Incorporated | | | | | | | 157,000 | | | | 1,854,170 | |
Outdoor Channel Holdings Incorporated | | | | | | | 185,100 | | | | 1,369,740 | |
Regal Entertainment Group Class A | | | | | | | 39,900 | | | | 543,039 | |
Scripps Networks Interactive Incorporated | | | | | | | 12,800 | | | | 642,816 | |
| | | | |
| | | | | | | | | | | 5,441,412 | |
| | | | | | | | | | | | |
| | | | |
| Specialty Retail: 0.49% | | | | | | | | | | | | |
Bakers Footwear Group Incorporated †** | | | | | | | 514,480 | | | | 421,874 | |
Vitamin Shoppe Incorporated † | | | | | | | 15,285 | | | | 719,465 | |
| | | | |
| | | | | | | | | | | 1,141,339 | |
| | | | | | | | | | | | |
| | | | |
Consumer Staples: 0.54% | | | | | | | | | | | | |
| | | | |
| Household Products: 0.54% | | | | | | | | | | | | |
WD-40 Company | | | | | | | 28,000 | | | | 1,262,240 | |
| | | | | | | | | | | | |
| | | | |
Energy: 19.01% | | | | | | | | | | | | |
| | | | |
| Energy Equipment & Services: 3.53% | | | | | | | | | | | | |
Helix Energy Solutions Group Incorporated † | | | | | | | 128,850 | | | | 2,629,829 | |
Helmerich & Payne Incorporated | | | | | | | 12,595 | | | | 647,257 | |
Key Energy Services Incorporated † | | | | | | | 75,280 | | | | 953,045 | |
Newpark Resources Incorporated † | | | | | | | 443,376 | | | | 2,819,871 | |
Willbros Group Incorporated † | | | | | | | 227,719 | | | | 1,229,683 | |
| | | | |
| | | | | | | | | | | 8,279,685 | |
| | | | | | | | | | | | |
| | | | |
| Oil, Gas & Consumable Fuels: 15.48% | | | | | | | | | | | | |
Cabot Oil & Gas Corporation | | | | | | | 36,200 | | | | 1,272,068 | |
Canadian Natural Resources Limited | | | | | | | 78,400 | | | | 2,724,400 | |
Energy XXI (Bermuda) Limited † | | | | | | | 9,200 | | | | 346,656 | |
EQT Corporation | | | | | | | 12,600 | | | | 627,732 | |
The accompanying notes are an integral part of these financial statements.
| | | | | | |
| Portfolio of Investments—April 30, 2012 (Unaudited) | | Wells Fargo Advantage Small/Mid Cap Value Fund | | | 9 | |
| | | | | | | | | | | | |
| Security Name | | | | | | Shares | | | Value | |
| | | | | | | | | | | | |
| | | | |
| Oil, Gas & Consumable Fuels (continued) | | | | | | | | | | | | |
Gulfport Energy Corporation † | | | | | | | 27,100 | | | $ | 710,291 | |
InterOil Corporation † | | | | | | | 243,500 | | | | 14,717,140 | |
James River Coal Company † | | | | | | | 176,000 | | | | 872,960 | |
McMoRan Exploration Company † | | | | | | | 431,735 | | | | 3,799,268 | |
Penn West Petroleum Limited | | | | | | | 24,135 | | | | 413,674 | |
Pioneer Natural Resources Company | | | | | | | 6,000 | | | | 694,920 | |
Range Resources Corporation | | | | | | | 72,500 | | | | 4,832,850 | |
Triangle Petroleum Corporation † | | | | | | | 163,078 | | | | 1,061,638 | |
Trilogy Energy Corporation | | | | | | | 151,200 | | | | 4,181,590 | |
| | | | |
| | | | | | | | | | | 36,255,187 | |
| | | | | | | | | | | | |
| | | | |
Financials: 17.37% | | | | | | | | | | | | |
| | | | |
| Capital Markets: 0.57% | | | | | | | | | | | | |
Artio Global Investors Incorporated | | | | | | | 366,300 | | | | 1,326,006 | |
| | | | | | | | | | | | |
| | | | |
| Commercial Banks: 4.47% | | | | | | | | | | | | |
1st United Bancorp Incorporated † | | | | | | | 178,100 | | | | 1,079,286 | |
American River Bankshares † | | | | | | | 153,400 | | | | 1,116,752 | |
Bancorp Incorporated † | | | | | | | 66,412 | | | | 682,051 | |
BBCN Bancorp Incorporated † | | | | | | | 29,606 | | | | 325,074 | |
IBERIABANK Corporation | | | | | | | 20,398 | | | | 1,041,726 | |
Midsouth Bancorp Incorporated | | | | | | | 56,500 | | | | 796,650 | |
Pacific Premier Bancorp Incorporated † | | | | | | | 261,900 | | | | 2,037,582 | |
Sierra Bancorp | | | | | | | 139,800 | | | | 1,280,568 | |
Sterling Bancorp | | | | | | | 76,500 | | | | 727,515 | |
Univest Corporation of Pennsylvania | | | | | | | 30,400 | | | | 489,440 | |
Washington Banking Company | | | | | | | 51,000 | | | | 710,940 | |
Western Liberty Bancorp † | | | | | | | 63,972 | | | | 188,717 | |
| | | | |
| | | | | | | | | | | 10,476,301 | |
| | | | | | | | | | | | |
| | | | |
| Insurance: 2.86% | | | | | | | | | | | | |
Argo Group International Holdings Limited | | | | | | | 135,100 | | | | 3,898,986 | |
First Acceptance Corporation † | | | | | | | 668,600 | | | | 1,029,644 | |
Hilltop Holdings Incorporated † | | | | | | | 119,186 | | | | 945,145 | |
Mercury General Corporation | | | | | | | 18,525 | | | | 837,145 | |
| | | | |
| | | | | | | | | | | 6,710,920 | |
| | | | | | | | | | | | |
| | | | |
| Real Estate Management & Development: 0.55% | | | | | | | | | | | | |
Kennedy Wilson Holdings Incorporated | | | | | | | 91,650 | | | | 1,288,599 | |
| | | | | | | | | | | | |
| | | | |
| REITs: 8.41% | | | | | | | | | | | | |
Capstead Mortgage Corporation | | | | | | | 140,425 | | | | 1,928,035 | |
Chimera Investment Corporation | | | | | | | 2,355,300 | | | | 6,806,817 | |
Hatteras Financial Corporation | | | | | | | 52,524 | | | | 1,530,024 | |
MFA Mortgage Investments Incorporated | | | | | | | 125,920 | | | | 929,290 | |
Origen Financial Incorporated | | | | | | | 786,190 | | | | 1,139,976 | |
Redwood Trust Incorporated | | | | | | | 143,241 | | | | 1,673,055 | |
Sun Communities Incorporated | | | | | | | 45,234 | | | | 1,978,987 | |
UMH Properties Incorporated | | | | | | | 314,300 | | | | 3,705,597 | |
| | | | |
| | | | | | | | | | | 19,691,781 | |
| | | | | | | | | | | | |
The accompanying notes are an integral part of these financial statements.
| | | | |
| 10 | | Wells Fargo Advantage Small/Mid Cap Value Fund | | Portfolio of Investments—April 30, 2012 (Unaudited) |
| | | | | | | | | | | | |
| Security Name | | | | | | Shares | | | Value | |
| | | | | | | | | | | | |
| | | | |
| Thrifts & Mortgage Finance: 0.51% | | | | | | | | | | | | |
First Niagara Financial Group Incorporated | | | | | | | 104,800 | | | $ | 936,912 | |
Northwest Bancshares Incorporated | | | | | | | 20,800 | | | | 256,256 | |
| | | | |
| | | | | | | | | | | 1,193,168 | |
| | | | | | | | | | | | |
| | | | |
Health Care: 8.97% | | | | | | | | | | | | |
| | | | |
| Biotechnology: 0.92% | | | | | | | | | | | | |
Discovery Laboratories Incorporated † | | | | | | | 696,900 | | | | 2,146,452 | |
| | | | | | | | | | | | |
| | | | |
| Health Care Equipment & Supplies: 4.44% | | | | | | | | | | | | |
Allied Healthcare Products Incorporated † | | | | | | | 395,400 | | | | 1,253,418 | |
EnteroMedics Incorporated † | | | | | | | 490,100 | | | | 1,445,795 | |
Haemonetics Corporation † | | | | | | | 13,077 | | | | 935,921 | |
Orasure Technologies Incorporated † | | | | | | | 468,790 | | | | 5,377,021 | |
Stryker Corporation | | | | | | | 15,890 | | | | 867,117 | |
Wright Medical Group Incorporated † | | | | | | | 28,600 | | | | 532,818 | |
| | | | |
| | | | | | | | | | | 10,412,090 | |
| | | | | | | | | | | | |
| | | | |
| Health Care Providers & Services: 0.81% | | | | | | | | | | | | |
Cross Country Healthcare Incorporated † | | | | | | | 161,200 | | | | 743,132 | |
Ensign Group Incorporated | | | | | | | 43,400 | | | | 1,159,214 | |
| | | | |
| | | | | | | | | | | 1,902,346 | |
| | | | | | | | | | | | |
| | | | |
| Health Care Technology: 2.34% | | | | | | | | | | | | |
Computer Programs & Systems Incorporated | | | | | | | 40,450 | | | | 2,410,415 | |
Merge Healthcare Incorporated † | | | | | | | 317,535 | | | | 1,365,401 | |
Omnicell Incorporated † | | | | | | | 119,700 | | | | 1,708,119 | |
| | | | |
| | | | | | | | | | | 5,483,935 | |
| | | | | | | | | | | | |
| | | | |
| Life Sciences Tools & Services: 0.46% | | | | | | | | | | | | |
Accelrys Incorporated † | | | | | | | 130,260 | | | | 1,072,040 | |
| | | | | | | | | | | | |
| | | | |
Industrials: 13.29% | | | | | | | | | | | | |
| | | | |
| Aerospace & Defense: 0.88% | | | | | | | | | | | | |
Orbital Sciences Corporation † | | | | | | | 163,370 | | | | 2,051,927 | |
| | | | | | | | | | | | |
| | | | |
| Airlines: 0.63% | | | | | | | | | | | | |
JetBlue Airways Corporation † | | | | | | | 313,000 | | | | 1,486,750 | |
| | | | | | | | | | | | |
| | | | |
| Building Products: 1.24% | | | | | | | | | | | | |
Patrick Industries Incorporated † | | | | | | | 225,150 | | | | 2,913,441 | |
| | | | | | | | | | | | |
| | | | |
| Commercial Services & Supplies: 6.37% | | | | | | | | | | | | |
ABM Industries Incorporated | | | | | | | 122,198 | | | | 2,844,769 | |
ACCO Brands Corporation † | | | | | | | 85,441 | | | | 901,403 | |
Avery Dennison Corporation | | | | | | | 93,500 | | | | 2,990,130 | |
Cintas Corporation | | | | | | | 26,550 | | | | 1,039,963 | |
GEO Group Incorporated † | | | | | | | 188,462 | | | | 3,903,048 | |
Healthcare Services Group | | | | | | | 57,323 | | | | 1,216,394 | |
Standard Parking Corporation † | | | | | | | 81,000 | | | | 1,543,860 | |
Verisk Analytics Incorporated Class A † | | | | | | | 9,725 | | | | 476,039 | |
| | | | |
| | | | | | | | | | | 14,915,606 | |
| | | | | | | | | | | | |
The accompanying notes are an integral part of these financial statements.
| | | | | | |
| Portfolio of Investments—April 30, 2012 (Unaudited) | | Wells Fargo Advantage Small/Mid Cap Value Fund | | | 11 | |
| | | | | | | | | | | | |
| Security Name | | | | | | Shares | | | Value | |
| | | | | | | | | | | | |
| | | | |
| Construction & Engineering: 2.01% | | | | | | | | | | | | |
Integrated Electrical Services Incorporated † | | | | | | | 269,500 | | | $ | 1,191,190 | |
Primoris Services Corporation | | | | | | | 243,350 | | | | 3,509,107 | |
| | | | |
| | | | | | | | | | | 4,700,297 | |
| | | | | | | | | | | | |
| | | | |
| Machinery: 1.19% | | | | | | | | | | | | |
Actuant Corporation Class A | | | | | | | 64,600 | | | | 1,761,642 | |
Kennametal Incorporated | | | | | | | 24,000 | | | | 1,013,520 | |
| | | | |
| | | | | | | | | | | 2,775,162 | |
| | | | | | | | | | | | |
| | | | |
| Professional Services: 0.97% | | | | | | | | | | | | |
Hill International Incorporated † | | | | | | | 640,378 | | | | 2,279,746 | |
| | | | | | | | | | | | |
| | | | |
Information Technology: 10.69% | | | | | | | | | | | | |
| | | | |
| Communications Equipment: 2.22% | | | | | | | | | | | | |
Brocade Communications Systems Incorporated † | | | | | | | 212,500 | | | | 1,177,250 | |
MRV Communications Incorporated | | | | | | | 231,450 | | | | 240,708 | |
Sandvine Corporation † | | | | | | | 2,075,045 | | | | 3,771,394 | |
| | | | |
| | | | | | | | | | | 5,189,352 | |
| | | | | | | | | | | | |
| | | | |
| Computers & Peripherals: 1.87% | | | | | | | | | | | | |
Cray Incorporated † | | | | | | | 244,024 | | | | 2,720,868 | |
Intermec Incorporated † | | | | | | | 309,992 | | | | 1,649,157 | |
| | | | |
| | | | | | | | | | | 4,370,025 | |
| | | | | | | | | | | | |
| | | | |
| Electronic Equipment, Instruments & Components: 1.36% | | | | | | | | | | | | |
Evans & Sutherland Computer Corporation †** | | | | | | | 603,990 | | | | 181,197 | |
GSI Group Incorporated † | | | | | | | 156,417 | | | | 1,887,953 | |
Power One Incorporated † | | | | | | | 260,325 | | | | 1,114,191 | |
| | | | |
| | | | | | | | | | | 3,183,341 | |
| | | | | | | | | | | | |
| | | | |
| IT Services: 2.08% | | | | | | | | | | | | |
Official Payments Holdings Incorporated † | | | | | | | 667,200 | | | | 3,169,200 | |
Western Union Company | | | | | | | 92,570 | | | | 1,701,436 | |
| | | | |
| | | | | | | | | | | 4,870,636 | |
| | | | | | | | | | | | |
| | | | |
| Semiconductors & Semiconductor Equipment: 2.93% | | | | | | | | | | | | |
Advanced Micro Devices Incorporated † | | | | | | | 175,300 | | | | 1,290,208 | |
FormFactor Incorporated † | | | | | | | 330,600 | | | | 1,851,360 | |
MEMC Electronic Materials Incorporated † | | | | | | | 257,100 | | | | 922,989 | |
Micron Technology Incorporated † | | | | | | | 425,600 | | | | 2,804,704 | |
| | | | |
| | | | | | | | | | | 6,869,261 | |
| | | | | | | | | | | | |
| | | | |
| Software: 0.23% | | | | | | | | | | | | |
Henry Jack & Associates Incorporated | | | | | | | 16,200 | | | | 550,152 | |
| | | | | | | | | | | | |
| | | | |
Materials: 18.07% | | | | | | | | | | | | |
| | | | |
| Containers & Packaging: 0.97% | | | | | | | | | | | | |
Intertape Polymer Group Incorporated † | | | | | | | 419,630 | | | | 2,269,988 | |
| | | | | | | | | | | | |
The accompanying notes are an integral part of these financial statements.
| | | | |
| 12 | | Wells Fargo Advantage Small/Mid Cap Value Fund | | Portfolio of Investments—April 30, 2012 (Unaudited) |
| | | | | | | | | | | | | | |
| Security Name | | | | | | | Shares | | | Value | |
| | | | | | | | | | | | | | |
| | | | |
| Metals & Mining: 17.10% | | | | | | | | | | | | | | |
Agnico-Eagle Mines Limited | | | | | | | | | 64,800 | | | $ | 2,586,816 | |
Endeavour Mining Corporation † | | | | | | | | | 515,244 | | | | 1,058,810 | |
Goldcorp Incorporated | | | | | | | | | 42,600 | | | | 1,629,876 | |
Goldgroup Mining Incorporated † | | | | | | | | | 323,900 | | | | 229,519 | |
Goldgroup Mining Incorporated - Legend Shares † | | | | | | | | | 1,041,000 | | | | 737,663 | |
Lucara Diamond Corporation † | | | | | | | | | 1,140,200 | | | | 1,208,612 | |
Minera Andes Acquisition Corporation † | | | | | | | | | 766,695 | | | | 2,742,468 | |
Newmont Mining Corporation | | | | | | | | | 55,300 | | | | 2,635,045 | |
Petaquilla Minerals Limited † | | | | | | | | | 455,500 | | | | 196,321 | |
Randgold Resources Limited ADR | | | | | | | | | 155,100 | | | | 13,827,165 | |
Rockwell Diamonds Incorporated †(a) | | | | | | | | | 283,000 | | | | 137,546 | |
Rockwell Diamonds Incorporated - Canada Exchange † | | | | | | | | | 186,750 | | | | 90,743 | |
Rockwell Diamonds Incorporated - Legend Shares †(i) | | | | | | | | | 1,172,000 | | | | 569,479 | |
Royal Gold Incorporated | | | | | | | | | 48,325 | | | | 2,994,217 | |
San Gold Corporation † | | | | | | | | | 529,020 | | | | 751,208 | |
Sandstorm Gold Limited † | | | | | | | | | 2,890,100 | | | | 5,266,164 | |
Sandstorm Metals & Energy Limited † | | | | | | | | | 525,433 | | | | 202,120 | |
Silver Standard Resources Incorporated † | | | | | | | | | 132,368 | | | | 1,908,747 | |
United States Steel Corporation | | | | | | | | | 45,485 | | | | 1,288,590 | |
| | | | |
| | | | | | | | | | | | | 40,061,109 | |
| | | | | | | | | | | | | | |
| | | | |
Telecommunication Services: 0.97% | | | | | | | | | | | | | | |
| | | | |
| Diversified Telecommunication Services: 0.97% | | | | | | | | | | | | | | |
Cincinnati Bell Incorporated † | | | | | | | | | 598,465 | | | | 2,274,167 | |
| | | | | | | | | | | | | | |
| | | | |
Total Common Stocks (Cost $186,374,144) | | | | | | | | | | | | | 225,888,067 | |
| | | | | | | | | | | | | | |
| | | | |
| Investment Companies: 1.78% | | | | | | | | | | | | | | |
Market Vectors Junior Gold Miners ETF | | | | | | | | | 162,502 | | | | 3,786,297 | |
SPDR S&P Regional Banking ETF | | | | | | | | | 13,802 | | | | 387,422 | |
| | | | |
Total Investment Companies (Cost $4,720,341) | | | | | | | | | | | | | 4,173,719 | |
| | | | | | | | | | | | | | |
| | | | | Expiration Date | | | | | | | |
| Warrants: 0.67% | | | | | | | | | | | | | | |
| | | | |
Health Care: 0.18% | | | | | | | | | | | | | | |
| | | | |
| Health Care Equipment & Supplies: 0.18% | | | | | | | | | | | | | | |
EnteroMedics Incorporated †(a)(i) | | | | | 05/14/2016 | | | | 270,908 | | | | 407,771 | |
EnteroMedics Incorporated †(a)(i) | | | | | 09/28/2016 | | | | 13,680 | | | | 23,003 | |
| | | | |
| | | | | | | | | | | | | 430,774 | |
| | | | | | | | | | | | | | |
| | | | |
Materials: 0.49% | | | | | | | | | | | | | | |
| | | | |
| Metals & Mining: 0.49% | | | | | | | | | | | | | | |
Sandstorm Gold Limited † | | | | | 04/23/2014 | | | | 904,067 | | | | 1,134,831 | |
| | | | | | | | | | | | | | |
| | | | |
Total Warrants (Cost $15,993) | | | | | | | | | | | | | 1,565,605 | |
| | | | | | | | | | | | | | |
The accompanying notes are an integral part of these financial statements.
| | | | | | |
| Portfolio of Investments—April 30, 2012 (Unaudited) | | Wells Fargo Advantage Small/Mid Cap Value Fund | | | 13 | |
| | | | | | | | | | | | | | |
| Security Name | | Yield | | | | | Shares | | | Value | |
| | | | | | | | | | | | | | |
| | | | |
Short-Term Investments: 0.66% | | | | | | | | | | | | | | |
| | | | |
| Investment Companies: 0.66% | | | | | | | | | | | | | | |
Wells Fargo Advantage Cash Investment Money Market Fund, Select Class (l)(u) | | | 0.11 | % | | | | | 1,537,499 | | | $ | 1,537,499 | |
| | | | | | | | | | | | | | |
| | | | |
Total Short-Term Investments (Cost $1,537,499) | | | | | | | | | | | | | 1,537,499 | |
| | | | | | | | | | | | | | |
| | | | | | | | |
| Total Investments in Securities | | | | | | | | |
| (Cost $192,647,977)* | | | 99.55 | % | | | 233,164,890 | |
Other Assets and Liabilities, Net | | | 0.45 | | | | 1,065,090 | |
| | | | | | | | |
| Total Net Assets | | | 100.00 | % | | $ | 234,229,980 | |
| | | | | | | | |
| † | Non-income earning security |
| ** | Represents an affiliate of the Fund under section 2(a)(2) and 2(a)(3) of the Investment Company Act of 1940, as the Fund holds 5% or more of the issuer’s outstanding voting shares. |
| (a) | Security is fair valued by the Management Valuation Team, and in certain instances by the Board of Trustees, in accordance with procedures approved by the Board of Trustees. |
| 144A | Security that may be resold to “qualified institutional buyers” under Rule 144A or security offered pursuant to Section 4(2) of the Securities Act of 1933, as amended. |
| (l) | Investment in an affiliate |
| (u) | Rate shown is the 7-day annualized yield at period end. |
| * | Cost for federal income tax purposes is $201,122,063 and net unrealized appreciation (depreciation) consists of: |
| | | | |
Gross unrealized appreciation | | $ | 57,872,027 | |
Gross unrealized depreciation | | | (25,829,200 | ) |
| | | | |
Net unrealized appreciation | | $ | 32,042,827 | |
The accompanying notes are an integral part of these financial statements.
| | | | |
| 14 | | Wells Fargo Advantage Small/Mid Cap Value Fund | | Statement of Assets and Liabilities—April 30, 2012 (Unaudited) |
| | | | |
| | | | |
| |
Assets | | | | |
Investments | | | | |
In unaffiliated securities, at value (see cost below) | | $ | 231,024,320 | |
In affiliated securities, at value (see cost below) | | | 2,140,570 | |
| | | | |
Total investments, at value (see cost below) | | | 233,164,890 | |
Receivable for investments sold | | | 1,785,490 | |
Receivable for Fund shares sold | | | 1,650,680 | |
Receivable for dividends | | | 30,965 | |
Prepaid expenses and other assets | | | 45,233 | |
| | | | |
Total assets | | | 236,677,258 | |
| | | | |
| |
Liabilities | | | | |
Payable for investments purchased | | | 1,575,668 | |
Payable for Fund shares redeemed | | | 619,200 | |
Advisory fee payable | | | 135,145 | |
Distribution fees payable | | | 7,337 | |
Due to other related parties | | | 45,623 | |
Accrued expenses and other liabilities | | | 64,305 | |
| | | | |
Total liabilities | | | 2,447,278 | |
| | | | |
Total net assets | | $ | 234,229,980 | |
| | | | |
| |
NET ASSETS CONSIST OF | | | | |
Paid-in capital | | $ | 214,170,955 | |
Undistributed net investment income | | | 67,912 | |
Accumulated net realized losses on investments | | | (20,525,782 | ) |
Net unrealized gains on investments | | | 40,516,895 | |
| | | | |
Total net assets | | $ | 234,229,980 | |
| | | | |
| |
COMPUTATION OF NET ASSET VALUE AND OFFERING PRICE PER SHARE1 | | | | |
Net assets – Class A | | $ | 29,214,476 | |
Shares outstanding – Class A | | | 1,896,689 | |
Net asset value per share – Class A | | | $15.40 | |
Maximum offering price per share – Class A2 | | | $16.34 | |
Net assets – Class C | | $ | 12,108,492 | |
Shares outstanding – Class C | | | 799,414 | |
Net asset value per share – Class C | | | $15.15 | |
Net assets – Administrator Class | | $ | 68,809,458 | |
Shares outstanding – Administrator Class | | | 4,393,491 | |
Net asset value per share – Administrator Class | | | $15.66 | |
Net assets – Institutional Class | | $ | 46,307,294 | |
Shares outstanding – Institutional Class | | | 2,945,014 | |
Net asset value per share – Institutional Class | | | $15.72 | |
Net assets – Investor Class | | $ | 77,790,260 | |
Shares outstanding – Investor Class | | | 5,030,537 | |
Net asset value per share – Investor Class | | | $15.46 | |
| |
Investments in unaffiliated securities, at cost | | $ | 189,482,703 | |
| | | | |
Investments in affiliated securities, at cost | | $ | 3,165,274 | |
| | | | |
Total investments, at cost | | $ | 192,647,977 | |
| | | | |
| 1. | The Fund has an unlimited number of authorized shares. |
| 2. | Maximum offering price is computed as 100/94.25 of net asset value. On investments of $50,000 or more, the offering price is reduced. |
The accompanying notes are an integral part of these financial statements.
| | | | | | |
| Statement of Operations—Six Months Ended April 30, 2012 (Unaudited) | | Wells Fargo Advantage Small/Mid Cap Value Fund | | | 15 | |
| | | | |
| | | | |
| |
Investment income | | | | |
Dividends * | | | 2,265,630 | |
Income from affiliated securities | | | 987 | |
| | | | |
Total investment income | | | 2,266,617 | |
| | | | |
| |
Expenses | | | | |
Advisory fee | | | 865,656 | |
Administration fees | | | | |
Fund level | | | 57,710 | |
Class A | | | 41,718 | |
Class C | | | 16,022 | |
Administrator Class | | | 37,408 | |
Institutional Class | | | 13,308 | |
Investor Class | | | 129,260 | |
Shareholder servicing fees | | | | |
Class A | | | 40,114 | |
Class C | | | 15,406 | |
Administrator Class | | | 89,834 | |
Investor Class | | | 97,924 | |
Distribution fees | | | | |
Class C | | | 46,218 | |
Custody and accounting fees | | | 13,188 | |
Professional fees | | | 14,685 | |
Registration fees | | | 38,089 | |
Shareholder report expenses | | | 21,484 | |
Trustees’ fees and expenses | | | 7,879 | |
Other fees and expenses | | | 3,971 | |
| | | | |
Total expenses | | | 1,549,874 | |
Less: Fee waivers and/or expense reimbursements | | | (32,192 | ) |
| | | | |
Net expenses | | | 1,517,682 | |
| | | | |
Net investment income | | | 748,935 | |
| | | | |
| |
REALIZED AND UNREALIZED GAINS (LOSSES) ON INVESTMENTS | | | | |
| |
Net realized gains (losses) on: | | | | |
Unaffiliated securities | | | 8,264,094 | |
Affiliated securities | | | (39,073 | ) |
| | | | |
Net realized gains on investments | | | 8,225,021 | |
| | | | |
| |
Net change in unrealized gains (losses) on: | | | | |
Unaffiliated securities | | | 4,248,144 | |
Affiliated securities | | | 24,418 | |
| | | | |
Net change in unrealized gains (losses) on investments | | | 4,272,562 | |
| | | | |
Net realized and unrealized gains (losses) on investments | | | 12,497,583 | |
| | | | |
Net increase in net assets resulting from operations | | $ | 13,246,518 | |
| | | | |
| |
* Net of foreign dividend withholding taxes of | | | $13,464 | |
The accompanying notes are an integral part of these financial statements.
| | | | |
| 16 | | Wells Fargo Advantage Small/Mid Cap Value Fund | | Statements of Changes in Net Assets |
| | | | | | | | | | | | | | | | |
| | | Six Months Ended April 30, 2012
(Unaudited) | | | Year Ended October 31, 2011 | |
| | | | |
Operations | | | | | | | | | | | | | | | | |
Net investment income | | | | | | $ | 748,935 | | | | | | | $ | 1,083,995 | |
Net realized gains on investments | | | | | | | 8,225,021 | | | | | | | | 6,445,501 | |
Net change in unrealized gains (losses) on investments | | | | | | | 4,272,562 | | | | | | | | (88,589 | ) |
| | | | | | | | | | | | | | | | |
Net increase in net assets resulting from operations | | | | | | | 13,246,518 | | | | | | | | 7,440,907 | |
| | | | | | | | | | | | | | | | |
| | | | |
Distributions to shareholders from | | | | | | | | | | | | | | | | |
Net investment income | | | | | | | | | | | | | | | | |
Class A | | | | | | | (126,291 | ) | | | | | | | (383,440 | ) |
Class C | | | | | | | 0 | | | | | | | | (26,770 | ) |
Administrator Class | | | | | | | (547,916 | ) | | | | | | | (831,378 | ) |
Institutional Class | | | | | | | (281,177 | ) | | | | | | | (245,567 | ) |
Investor Class | | | | | | | (266,567 | ) | | | | | | | (705,992 | ) |
| | | | | | | | | | | | | | | | |
Total distributions to shareholders | | | | | | | (1,221,951 | ) | | | | | | | (2,193,147 | ) |
| | | | | | | | | | | | | | | | |
| | | | |
Capital share transactions | | | Shares | | | | | | | | Shares | | | | | |
Proceeds from shares sold | | | | | | | | | | | | | | | | |
Class A | | | 93,032 | | | | 1,410,947 | | | | 538,881 | | | | 8,328,557 | |
Class C | | | 43,319 | | | | 642,399 | | | | 95,987 | | | | 1,443,775 | |
Administrator Class | | | 764,983 | | | | 11,701,846 | | | | 1,193,490 | | | | 18,492,298 | |
Institutional Class | | | 1,186,709 | | | | 18,958,066 | | | | 890,323 | | | | 13,911,049 | |
Investor Class | | | 201,528 | | | | 3,085,156 | | | | 429,780 | | | | 6,630,133 | |
| | | | | | | | | | | | | | | | |
| | | | | | | 35,798,414 | | | | | | | | 48,805,812 | |
| | | | | | | | | | | | | | | | |
Reinvestment of distributions | | | | | | | | | | | | | | | | |
Class A | | | 9,119 | | | | 124,744 | | | | 24,476 | | | | 374,730 | |
Class C | | | 0 | | | | 0 | | | | 1,059 | | | | 16,044 | |
Administrator Class | | | 34,536 | | | | 479,706 | | | | 46,488 | | | | 723,817 | |
Institutional Class | | | 9,441 | | | | 131,603 | | | | 2,541 | | | | 39,719 | |
Investor Class | | | 18,909 | | | | 259,615 | | | | 44,502 | | | | 684,436 | |
| | | | | | | | | | | | | | | | |
| | | | | | | 995,668 | | | | | | | | 1,838,746 | |
| | | | | | | | | | | | | | | | |
Payment for shares redeemed | | | | | | | | | | | | | | | | |
Class A | | | (576,245 | ) | | | (8,607,563 | ) | | | (1,086,978 | ) | | | (16,626,907 | ) |
Class C | | | (93,570 | ) | | | (1,396,603 | ) | | | (125,087 | ) | | | (1,851,817 | ) |
Administrator Class | | | (1,553,531 | ) | | | (24,446,994 | ) | | | (971,391 | ) | | | (14,929,043 | ) |
Institutional Class | | | (246,928 | ) | | | (3,828,913 | ) | | | (192,223 | ) | | | (2,951,644 | ) |
Investor Class | | | (582,387 | ) | | | (8,802,261 | ) | | | (1,997,095 | ) | | | (30,585,085 | ) |
| | | | | | | | | | | | | | | | |
| | | | | | | (47,082,334 | ) | | | | | | | (66,944,496 | ) |
| | | | | | | | | | | | | | | | |
Net decrease in net assets resulting from capital share transactions | | | | | | | (10,288,252 | ) | | | | | | | (16,299,938 | ) |
| | | | | | | | | | | | | | | | |
Total increase (decrease) in net assets | | | | | | | 1,736,315 | | | | | | | | (11,052,178 | ) |
| | | | | | | | | | | | | | | | |
| | | | |
Net assets | | | | | | | | | | | | | | | | |
Beginning of period | | | | | | | 232,493,665 | | | | | | | | 243,545,843 | |
| | | | | | | | | | | | | | | | |
End of period | | | | | | $ | 234,229,980 | | | | | | | $ | 232,493,665 | |
| | | | | | | | | | | | | | | | |
Undistributed net investment income | | | | | | $ | 67,912 | | | | | | | $ | 540,928 | |
| | | | | | | | | | | | | | | | |
The accompanying notes are an integral part of these financial statements.
| | | | | | |
| Financial Highlights | | Wells Fargo Advantage Small/Mid Cap Value Fund | | | 17 | |
(For a share outstanding throughout each period)
| | | | | | | | | | | | | | | | | | | | | | | | |
| | | Six Months Ended
April 30, 2012 (Unaudited) | | | Year Ended October 31, | |
| Class A | | | 2011 | | | 2010 | | | 2009 | | | 2008 | | | 20071 | |
Net asset value, beginning of period | | $ | 14.61 | | | $ | 14.33 | | | $ | 11.78 | | | $ | 8.78 | | | $ | 18.19 | | | $ | 17.09 | |
Net investment income (loss) | | | 0.05 | | | | 0.06 | | | | 0.08 | | | | 0.11 | 2 | | | 0.11 | 2 | | | (0.02 | )2 |
Net realized and unrealized gains (losses) on investments | | | 0.80 | | | | 0.35 | | | | 2.56 | | | | 2.89 | | | | (7.84 | ) | | | 1.12 | |
| | | | | | | | | | | | | | | | | | | | | | | | |
Total from investment operations | | | 0.85 | | | | 0.41 | | | | 2.64 | | | | 3.00 | | | | (7.73 | ) | | | 1.10 | |
Distributions to shareholders from | | | | | | | | | | | | | | | | | | | | | | | | |
Net investment income | | | (0.06 | ) | | | (0.13 | ) | | | (0.09 | ) | | | 0.00 | | | | (0.09 | ) | | | 0.00 | |
Net realized gains | | | 0.00 | | | | 0.00 | | | | 0.00 | | | | 0.00 | | | | (1.59 | ) | | | 0.00 | |
| | | | | | | | | | | | | | | | | | | | | | | | |
Total distributions to shareholders | | | (0.06 | ) | | | (0.13 | ) | | | (0.09 | ) | | | 0.00 | | | | (1.68 | ) | | | 0.00 | |
Net asset value, end of period | | $ | 15.40 | | | $ | 14.61 | | | $ | 14.33 | | | $ | 11.78 | | | $ | 8.78 | | | $ | 18.19 | |
Total return3 | | | 5.84 | % | | | 2.76 | % | | | 22.63 | % | | | 34.17 | % | | | (46.09 | )% | | | 6.44 | % |
Ratios to average net assets (annualized) | | | | | | | | | | | | | | | | | | | | | | | | |
Gross expenses | | | 1.39 | % | | | 1.40 | % | | | 1.47 | % | | | 1.57 | % | | | 1.55 | % | | | 1.50 | % |
Net expenses | | | 1.39 | % | | | 1.40 | % | | | 1.40 | % | | | 1.40 | % | | | 1.40 | % | | | 1.27 | % |
Net investment income (loss) | | | 0.60 | % | | | 0.37 | % | | | 0.77 | % | | | 1.12 | % | | | 0.83 | % | | | (0.50 | )% |
Supplemental data | | | | | | | | | | | | | | | | | | | | | | | | |
Portfolio turnover rate | | | 20 | % | | | 34 | % | | | 41 | % | | | 35 | % | | | 43 | % | | | 89 | % |
Net assets, end of period (000’s omitted) | | | $29,214 | | | | $34,642 | | | | $41,491 | | | | $27,370 | | | | $12,859 | | | | $444 | |
| 1. | For the period from July 31, 2007 (commencement of class operations), to October 31, 2007. |
| 2. | Calculated based upon average shares outstanding |
| 3. | Total return calculations do not include any sales charges. Returns for periods of less than one year are not annualized. |
The accompanying notes are an integral part of these financial statements.
| | | | |
| 18 | | Wells Fargo Advantage Small/Mid Cap Value Fund | | Financial Highlights |
(For a share outstanding throughout each period)
| | | | | | | | | | | | | | | | | | | | | | | | |
| | | Six Months Ended
April 30, 2012 (Unaudited) | | | Year Ended October 31, | |
| Class C | | | 2011 | | | 2010 | | | 2009 | | | 2008 | | | 20071 | |
Net asset value, beginning of period | | $ | 14.36 | | | $ | 14.10 | | | $ | 11.62 | | | $ | 8.72 | | | $ | 18.15 | | | $ | 17.09 | |
Net investment income (loss) | | | (0.02 | ) | | | (0.06 | ) | | | 0.00 | 2 | | | 0.04 | 3 | | | 0.02 | 3 | | | (0.06 | )3 |
Net realized and unrealized gains (losses) on investments | | | 0.81 | | | | 0.35 | | | | 2.51 | | | | 2.86 | | | | (7.81 | ) | | | 1.12 | |
| | | | | | | | | | | | | | | | | | | | | | | | |
Total from investment operations | | | 0.79 | | | | 0.29 | | | | 2.51 | | | | 2.90 | | | | (7.79 | ) | | | 1.06 | |
Distributions to shareholders from | | | | | | | | | | | | | | | | | | | | | | | | |
Net investment income | | | 0.00 | | | | (0.03 | ) | | | (0.03 | ) | | | 0.00 | | | | (0.05 | ) | | | 0.00 | |
Net realized gains | | | 0.00 | | | | 0.00 | | | | 0.00 | | | | 0.00 | | | | (1.59 | ) | | | 0.00 | |
| | | | | | | | | | | | | | | | | | | | | | | | |
Total distributions to shareholders | | | 0.00 | | | | (0.03 | ) | | | (0.03 | ) | | | 0.00 | | | | (1.64 | ) | | | 0.00 | |
Net asset value, end of period | | $ | 15.15 | | | $ | 14.36 | | | $ | 14.10 | | | $ | 11.62 | | | $ | 8.72 | | | $ | 18.15 | |
Total return4 | | | 5.50 | % | | | 2.05 | % | | | 21.62 | % | | | 33.26 | % | | | (46.46 | )% | | | 6.20 | % |
Ratios to average net assets (annualized) | | | | | | | | | | | | | | | | | | | | | | | | |
Gross expenses | | | 2.15 | % | | | 2.15 | % | | | 2.22 | % | | | 2.26 | % | | | 2.30 | % | | | 2.27 | % |
Net expenses | | | 2.14 | % | | | 2.15 | % | | | 2.15 | % | | | 2.11 | % | | | 2.15 | % | | | 2.10 | % |
Net investment income (loss) | | | (0.18 | )% | | | (0.38 | )% | | | 0.00 | % | | | 0.40 | % | | | 0.16 | % | | | (1.32 | )% |
Supplemental data | | | | | | | | | | | | | | | | | | | | | | | | |
Portfolio turnover rate | | | 20 | % | | | 34 | % | | | 41 | % | | | 35 | % | | | 43 | % | | | 89 | % |
Net assets, end of period (000’s omitted) | | | $12,108 | | | | $12,204 | | | | $12,379 | | | | $9,052 | | | | $4,700 | | | | $45 | |
| 1. | For the period from July 31, 2007 (commencement of class operations) to October 31, 2007. |
| 2. | Amount is less than $0.005. |
| 3. | Calculated based upon average shares outstanding |
| 4. | Total return calculations do not include any sales charges. Returns for periods of less than one year are not annualized. |
The accompanying notes are an integral part of these financial statements.
| | | | | | |
| Financial Highlights | | Wells Fargo Advantage Small/Mid Cap Value Fund | | | 19 | |
(For a share outstanding throughout each period)
| | | | | | | | | | | | | | | | | | | | | | | | |
| | | Six Months Ended
April 30, 2012 (Unaudited) | | | Year Ended October 31, | |
| Administrator Class | | | 2011 | | | 2010 | | | 2009 | | | 2008 | | | 2007 | |
Net asset value, beginning of period | | $ | 14.89 | | | $ | 14.60 | | | $ | 11.99 | | | $ | 8.92 | | | $ | 18.37 | | | $ | 16.45 | |
Net investment income (loss) | | | 0.07 | | | | 0.09 | | | | 0.13 | | | | 0.13 | 1 | | | 0.12 | 1 | | | (0.05 | )1 |
Net realized and unrealized gains (losses) on investments | | | 0.81 | | | | 0.36 | | | | 2.59 | | | | 2.94 | | | | (7.91 | ) | | | 2.20 | |
| | | | | | | | | | | | | | | | | | | | | | | | |
Total from investment operations | | | 0.88 | | | | 0.45 | | | | 2.72 | | | | 3.07 | | | | (7.79 | ) | | | 2.15 | |
Distributions to shareholders from | | | | | | | | | | | | | | | | | | | | | | | | |
Net investment income | | | (0.11 | ) | | | (0.16 | ) | | | (0.11 | ) | | | 0.00 | | | | (0.07 | ) | | | 0.00 | |
Net realized gains | | | 0.00 | | | | 0.00 | | | | 0.00 | | | | 0.00 | | | | (1.59 | ) | | | (0.23 | ) |
| | | | | | | | | | | | | | | | | | | | | | | | |
Total distributions to shareholders | | | (0.11 | ) | | | (0.16 | ) | | | (0.11 | ) | | | 0.00 | | | | (1.66 | ) | | | (0.23 | ) |
Net asset value, end of period | | $ | 15.66 | | | $ | 14.89 | | | $ | 14.60 | | | $ | 11.99 | | | $ | 8.92 | | | $ | 18.37 | |
Total return2 | | | 5.92 | % | | | 3.13 | % | | | 22.82 | % | | | 34.42 | % | | | (45.89 | )% | | | 13.24 | % |
Ratios to average net assets (annualized) | | | | | | | | | | | | | | | | | | | | | | | | |
Gross expenses | | | 1.23 | % | | | 1.24 | % | | | 1.29 | % | | | 1.39 | % | | | 1.43 | % | | | 1.37 | % |
Net expenses | | | 1.15 | % | | | 1.15 | % | | | 1.15 | % | | | 1.15 | % | | | 1.15 | % | | | 1.15 | % |
Net investment income (loss) | | | 0.80 | % | | | 0.61 | % | | | 1.00 | % | | | 1.34 | % | | | 0.86 | % | | | (0.30 | )% |
Supplemental data | | | | | | | | | | | | | | | | | | | | | | | | |
Portfolio turnover rate | | | 20 | % | | | 34 | % | | | 41 | % | | | 35 | % | | | 43 | % | | | 89 | % |
Net assets, end of period (000’s omitted) | | | $68,809 | | | | $76,668 | | | | $71,246 | | | | $55,463 | | | | $35,489 | | | | $41,988 | |
| 1. | Calculated based upon average shares outstanding |
| 2. | Returns for periods of less than one year are not annualized. |
The accompanying notes are an integral part of these financial statements.
| | | | |
| 20 | | Wells Fargo Advantage Small/Mid Cap Value Fund | | Financial Highlights |
(For a share outstanding throughout each period)
| | | | | | | | | | | | | | | | | | | | | | | | |
| | | Six Months Ended
April 30, 2012 (Unaudited) | | | Year Ended October 31, | |
| Institutional Class | | | 2011 | | | 2010 | | | 2009 | | | 2008 | | | 2007 | |
Net asset value, beginning of period | | $ | 14.97 | | | $ | 14.67 | | | $ | 12.04 | | | $ | 8.93 | | | $ | 18.40 | | | $ | 16.45 | |
Net investment income (loss) | | | 0.07 | | | | 0.11 | | | | 0.17 | 1 | | | 0.15 | 1 | | | 0.15 | 1 | | | (0.03 | )1 |
Net realized and unrealized gains (losses) on investments | | | 0.82 | | | | 0.38 | | | | 2.59 | | | | 2.96 | | | | (7.93 | ) | | | 2.21 | |
| | | | | | | | | | | | | | | | | | | | | | | | |
Total from investment operations | | | 0.89 | | | | 0.49 | | | | 2.76 | | | | 3.11 | | | | (7.78 | ) | | | 2.18 | |
Distributions to shareholders from | | | | | | | | | | | | | | | | | | | | | | | | |
Net investment income | | | (0.14 | ) | | | (0.19 | ) | | | (0.13 | ) | | | 0.00 | | | | (0.10 | ) | | | 0.00 | |
Net realized gains | | | 0.00 | | | | 0.00 | | | | 0.00 | | | | 0.00 | | | | (1.59 | ) | | | (0.23 | ) |
| | | | | | | | | | | | | | | | | | | | | | | | |
Total distributions to shareholders | | | (0.14 | ) | | | (0.19 | ) | | | (0.13 | ) | | | 0.00 | | | | (1.69 | ) | | | (0.23 | ) |
Net asset value, end of period | | $ | 15.72 | | | $ | 14.97 | | | $ | 14.67 | | | $ | 12.04 | | | $ | 8.93 | | | $ | 18.40 | |
Total return2 | | | 6.07 | % | | | 3.28 | % | | | 23.08 | % | | | 34.83 | % | | | (45.83 | )% | | | 13.42 | % |
Ratios to average net assets (annualized) | | | | | | | | | | | | | | | | | | | | | | | | |
Gross expenses | | | 0.97 | % | | | 0.97 | % | | | 1.02 | % | | | 1.12 | % | | | 1.16 | % | | | 1.10 | % |
Net expenses | | | 0.95 | % | | | 0.95 | % | | | 0.95 | % | | | 0.95 | % | | | 0.95 | % | | | 0.94 | % |
Net investment income (loss) | | | 1.01 | % | | | 0.79 | % | | | 1.22 | % | | | 1.58 | % | | | 1.07 | % | | | (0.18 | )% |
Supplemental data | | | | | | | | | | | | | | | | | | | | | | | | |
Portfolio turnover rate | | | 20 | % | | | 34 | % | | | 41 | % | | | 35 | % | | | 43 | % | | | 89 | % |
Net assets, end of period (000’s omitted) | | | $46,307 | | | | $29,881 | | | | $19,005 | | | | $9,895 | | | | $6,679 | | | | $2,902 | |
| 1. | Calculated based upon average shares outstanding |
| 2. | Returns for periods of less than one year are not annualized. |
The accompanying notes are an integral part of these financial statements.
| | | | | | |
| Financial Highlights | | Wells Fargo Advantage Small/Mid Cap Value Fund | | | 21 | |
(For a share outstanding throughout each period)
| | | | | | | | | | | | | | | | | | | | | | | | |
| | | Six Months Ended
April 30, 2012 (Unaudited) | | | Year Ended October 31, | |
| Investor Class | | | 2011 | | | 2010 | | | 2009 | | | 2008 | | | 2007 | |
Net asset value, beginning of period | | $ | 14.67 | | | $ | 14.38 | | | $ | 11.81 | | | $ | 8.81 | | | $ | 18.18 | | | $ | 16.34 | |
Net investment income (loss) | | | 0.03 | | | | 0.05 | 1 | | | 0.09 | | | | 0.10 | 1 | | | 0.06 | 1 | | | (0.12 | )1 |
Net realized and unrealized gains (losses) on investments | | | 0.81 | | | | 0.35 | | | | 2.56 | | | | 2.90 | | | | (7.82 | ) | | | 2.19 | |
| | | | | | | | | | | | | | | | | | | | | | | | |
Total from investment operations | | | 0.84 | | | | 0.40 | | | | 2.65 | | | | 3.00 | | | | (7.76 | ) | | | 2.07 | |
Distributions to shareholders from | | | | | | | | | | | | | | | | | | | | | | | | |
Net investment income | | | (0.05 | ) | | | (0.11 | ) | | | (0.08 | ) | | | 0.00 | | | | (0.02 | ) | | | 0.00 | |
Net realized gains | | | 0.00 | | | | 0.00 | | | | 0.00 | | | | 0.00 | | | | (1.59 | ) | | | (0.23 | ) |
| | | | | | | | | | | | | | | | | | | | | | | | |
Total distributions to shareholders | | | (0.05 | ) | | | (0.11 | ) | | | (0.08 | ) | | | 0.00 | | | | (1.61 | ) | | | (0.23 | ) |
Net asset value, end of period | | $ | 15.46 | | | $ | 14.67 | | | $ | 14.38 | | | $ | 11.81 | | | $ | 8.81 | | | $ | 18.18 | |
Total return2 | | | 5.77 | % | | | 2.73 | % | | | 22.49 | % | | | 34.05 | % | | | (46.14 | )% | | | 12.83 | % |
Ratios to average net assets (annualized) | | | | | | | | | | | | | | | | | | | | | | | | |
Gross expenses | | | 1.47 | % | | | 1.47 | % | | | 1.56 | % | | | 1.67 | % | | | 1.69 | % | | | 1.73 | % |
Net expenses | | | 1.46 | % | | | 1.47 | % | | | 1.48 | % | | | 1.49 | % | | | 1.49 | % | | | 1.52 | % |
Net investment income (loss) | | | 0.50 | % | | | 0.30 | % | | | 0.67 | % | | | 1.02 | % | | | 0.44 | % | | | (0.68 | )% |
Supplemental data | | | | | | | | | | | | | | | | | | | | | | | | |
Portfolio turnover rate | | | 20 | % | | | 34 | % | | | 41 | % | | | 35 | % | | | 43 | % | | | 89 | % |
Net assets, end of period (000’s omitted) | | | $77,790 | | | | $79,099 | | | | $99,424 | | | | $94,728 | | | | $75,324 | | | | $169,624 | |
| 1. | Calculated based upon average shares outstanding |
| 2. | Returns for periods of less than one year are not annualized. |
The accompanying notes are an integral part of these financial statements.
| | | | |
| 22 | | Wells Fargo Advantage Small/Mid Cap Value Fund | | Notes to Financial Statements (Unaudited) |
1. ORGANIZATION
Wells Fargo Funds Trust (the “Trust”), a Delaware statutory trust organized on March 10, 1999, is an open-end management investment company registered under the Investment Company Act of 1940, as amended (the “1940 Act”). These financial statements report on Wells Fargo Advantage Small/Mid Cap Value Fund (the “Fund”) which is a diversified series of the Trust.
2. SIGNIFICANT ACCOUNTING POLICIES
The following significant accounting policies, which are consistently followed in the preparation of the financial statements of the Fund, are in conformity with U.S. generally accepted accounting principles which require management to make estimates and assumptions that affect the reported amounts of assets and liabilities, disclosure of contingent assets and liabilities at the date of the financial statements, and the reported amounts of revenues and expenses during the reporting period. Actual results could differ from those estimates.
Securities valuation
Investments in equity securities are valued each business day as of the close of regular trading on the New York Stock Exchange, which is usually 4:00 p.m. (Eastern Time). Securities which are traded on a national or foreign securities exchange are valued at the last reported sales price, except that securities listed on The Nasdaq Stock Market, Inc. (“Nasdaq”) are valued at the Nasdaq Official Closing Price (“NOCP”), and if no NOCP is available, then at the last reported sales price. If no sales price is shown on the Nasdaq, the bid price will be used. In the absence of any sale of securities listed on the Nasdaq, and in the case of other securities (including U.S. Government obligations, but excluding debt securities maturing in 60 days or less), the price will be deemed “stale” and the valuations will be determined in accordance with the Fund’s Fair Value Procedures.
Securities denominated in foreign currencies are translated into U.S. dollars using the closing rates of exchange in effect on the day of valuation.
Many securities markets and exchanges outside the U.S. close prior to the close of the New York Stock Exchange and therefore may not fully reflect trading or events that occur after the close of the principal exchange in which the foreign securities are traded, but before the close of the New York Stock Exchange. If such trading or events are expected to materially affect the value of securities, then fair value pricing procedures approved by the Board of Trustees are applied. These procedures take into account multiple factors including movements in U.S. securities markets after foreign exchanges close. As a result of the fair value pricing procedures, these securities which are normally categorized as Level 1 in the fair value hierarchy will represent a transfer from a Level 1 to a Level 2 security and will be categorized as Level 2. Depending on market activity, such fair valuations may be frequent. Such fair value pricing may result in NAVs that are higher or lower than NAVs based on the closing price or latest quoted bid price. On April 30, 2012, fair value pricing was not used in pricing foreign securities.
Investments in open-end mutual funds and non-registered investment companies are generally valued at net asset value.
Investments which are not valued using any of the methods discussed above, are valued at their fair value, as determined by procedures established in good faith and approved by the Board of Trustees. The Board of Trustees has established a Valuation Committee comprised of the Trustees and has delegated to it the authority to take any actions regarding the valuation of portfolio securities that the Valuation Committee deems necessary in determining the fair value of portfolio securities, unless the responsibility has been delegated to the Management Valuation Team of Wells Fargo Funds Management, LLC (“Funds Management”). The Board of Trustees retains the authority to make or ratify any valuation decisions or approve any changes to the Fair Value Procedures as it deems appropriate. On a quarterly basis, the Board of Trustees considers for ratification any valuation actions taken by the Valuation Committee or the Management Valuation Team.
Valuations of fair valued prices are compared to the next actual sales price when available, or other appropriate market information to assess the continued appropriateness of the fair valuation methodology used. The securities are fair valued on a day-to-day basis, taking into consideration changes to appropriate market information and any significant changes to the input factors considered in the valuation process until there is a readily available price provided on the exchange or by an independent pricing service. Valuations received from an independent pricing service or broker quotes are periodically validated by comparisons to most recent trades and valuations provided by other independent
| | | | | | |
| Notes to Financial Statements (Unaudited) | | Wells Fargo Advantage Small/Mid Cap Value Fund | | | 23 | |
pricing services in addition to the review of prices by the adviser and/or sub-adviser. Unobservable inputs used in determining fair valuations are identified based on the type of security, taking into consideration factors utilized by market participants in valuing the investment, knowledge about the issuer and the current market environment.
Foreign currency translation
The accounting records of the Fund are maintained in U.S. dollars. Assets, including investment securities, and liabilities denominated in foreign currency are translated into U.S. dollars at the prevailing rates of exchange at the date of valuation. Purchases and sales of securities, and income and expenses are translated at the prevailing rate of exchange on the respective dates of such transactions. Reported net realized foreign exchange gains or losses arise from sales of foreign currencies, currency gains or losses realized between the trade and settlement dates on securities transactions, and the difference between the amounts of dividends, interest and foreign withholding taxes recorded and the U.S. dollar equivalent of the amounts actually paid or received. Net unrealized foreign exchange gains and losses arise from changes in the fair value of assets and liabilities other than investments in securities resulting in changes in exchange rates.
The changes in net assets arising from changes in exchange rates and the changes in net assets resulting from changes in market prices of securities are not separately presented. Such changes are recorded with net realized and unrealized gains or losses from investments. Gains and losses from certain foreign currency transactions are treated as ordinary income for U.S. federal income tax purposes.
Options
The Fund may be subject to equity price in the normal course of pursuing its investment objectives. The Fund may write covered call options or secured put options. When the Fund writes an option, an amount equal to the premium received is recorded as a liability and is subsequently adjusted to the current market value of the written option. Premiums received from written options, which expire unexercised, are recognized as realized gains from investments on the expiration date. The difference between the premium received and the amount paid on effecting a closing purchase transaction, including brokerage commissions, is treated as a realized gain or loss. If a call option is exercised, the premium is added to the proceeds from the sale of the underlying security in calculating the realized gain or loss on the sale. If a put option is exercised, the premium reduces the cost of the security purchased. The Fund, as a writer of an option, bears the market risk of an unfavorable change in the price of the security underlying the written option.
The Fund may also purchase call or put options. The premium is included in the Statement of Assets and Liabilities as an investment which is subsequently adjusted to the current market value of the option. Premiums paid for purchased options which expire are recognized as realized losses from investments on the expiration date. Premiums paid for purchased options which are exercised or closed are added to the amount paid or offset against the proceeds on the underlying security to determine the realized gain or loss. The risk of loss associated with purchased options is limited to the premium paid.
Options traded on an exchange are regulated and terms of the options are standardized. Options traded over the counter expose the Fund to counterparty risk in the event the counterparty does not perform. This risk is mitigated by having a master netting arrangement between the Fund and the counterparty and by having the counterparty post collateral to cover the Fund’s exposure to the counterparty.
Security transactions and income recognition
Securities transactions are recorded on a trade date basis. Realized gains or losses are reported on the basis of identified cost of securities delivered.
Dividend income is recognized on the ex-dividend date, except for certain dividends from foreign securities, which are recorded as soon as the Fund is informed of the ex-dividend date. Dividend income from foreign securities is recorded net of foreign taxes withheld where recovery of such taxes is not assured.
Distributions to shareholders
Distributions to shareholders from net investment income and net realized gains, if any, are recorded on the ex-dividend date. Such distributions are determined in conformity with income tax regulations, which may differ from generally accepted accounting principles.
| | | | |
| 24 | | Wells Fargo Advantage Small/Mid Cap Value Fund | | Notes to Financial Statements (Unaudited) |
Federal and other taxes
The Fund intends to continue to qualify as a regulated investment company by distributing substantially all of its investment company taxable income and any net realized capital gains (after reduction for capital loss carryforwards) sufficient to relieve it from all, or substantially all, federal income taxes. Accordingly, no provision for federal income taxes was required.
The Fund’s income and federal excise tax returns and all financial records supporting those returns for the prior three fiscal years are subject to examination by the federal and Delaware revenue authorities. Management has analyzed the Fund’s tax positions taken on federal, state, and foreign tax returns for all open tax years and does not believe that there are any uncertain tax positions that require recognition of a tax liability.
Under the recently enacted Regulated Investment Company Modernization Act of 2010, the Fund is permitted to carry forward capital losses incurred in taxable years which began after December 22, 2010 for an unlimited period. However, any losses incurred are required to be utilized prior to the losses incurred in pre-enactment taxable years. As a result of this ordering rule, pre-enactment capital loss carryforwards may be more likely to expire unused. Post-enactment capital losses that are carried forward will retain their character as either short-term or long-term capital losses rather than be considered all short-term as under previous law. In addition, the Fund may elect to defer any portion of a post-October capital loss or qualified late-year ordinary loss to the first day of the following taxable year. A post-October capital loss is the greatest of the net capital loss, net short-term capital loss or net long-term capital loss for the portion of the taxable year after October 31. A qualified late-year ordinary loss is the net loss comprised of (a) net gain or loss from the sale or other disposition of capital assets for the portion of the taxable year after October 31, and (b) other ordinary income or loss for the portion of the taxable year after December 31.
As of October 31, 2011, the Fund had net capital loss carryforwards, which were available to offset future net realized capital gains, in the amount of $19,609,801 expiring in 2017.
Class allocations
The separate classes of shares offered by the Fund differ principally in applicable sales charges, distribution, shareholder servicing and administration fees. Shareholders of each class bear certain expenses that pertain to that particular class. All shareholders bear the common expenses of the Fund, earn income from the portfolio, and are allocated unrealized gains and losses pro rata based on the average daily net assets of each class, without distinction between share classes. Dividends are determined separately for each class based on income and expenses allocable to each class. Realized gains and losses are allocated to each class pro rata based upon the net assets of each class on the date realized. Differences in per share dividend rates generally result from the relative weightings of pro rata income and realized gain allocations and from differences in separate class expenses, including distribution, shareholder servicing and administration fees.
3. FAIR VALUATION MEASUREMENTS
Fair value measurements of investments are determined within a framework that has established a fair value hierarchy based upon the various data inputs utilized in determining the value of the Fund’s investments. The three-level hierarchy gives the highest priority to unadjusted quoted prices in active markets for identical assets or liabilities (Level 1) and the lowest priority to significant unobservable inputs (Level 3). The Fund’s investments are classified within the fair value hierarchy based on the lowest level of input that is significant to the fair value measurement. The inputs are summarized into three broad levels as follows:
| n | | Level 1 – quoted prices in active markets for identical securities |
| n | | Level 2 – other significant observable inputs (including quoted prices for similar securities, interest rates, prepayment speeds, credit risk, etc.) |
| n | | Level 3 – significant unobservable inputs (including the Fund’s own assumptions in determining the fair value of investments) |
The inputs or methodologies used for valuing securities are not necessarily an indication of the risk associated with investing in those securities.
| | | | | | |
| Notes to Financial Statements (Unaudited) | | Wells Fargo Advantage Small/Mid Cap Value Fund | | | 25 | |
As of April 30, 2012, the inputs used in valuing the Fund’s assets, which are carried at fair value, were as follows:
| | | | | | | | | | | | | | | | |
| Investments in Securities | | Quoted Prices
(Level 1) | | | Significant Other
Observable Inputs
(Level 2) | | | Significant
Unobservable Inputs
(Level 3) | | | Total | |
| | | | |
Equity securities | | | | | | | | | | | | | | | | |
Common stocks | | $ | 225,750,521 | | | $ | 137,546 | | | $ | 0 | | | $ | 225,888,067 | |
Investment companies | | | 4,173,719 | | | | 0 | | | | 0 | | | | 4,173,719 | |
Warrants | | | 0 | | | | 1,565,605 | | | | 0 | | | | 1,565,605 | |
| | | | |
Short-term investments | | | | | | | | | | | | | | | | |
Investment companies | | | 1,537,499 | | | | 0 | | | | 0 | | | | 1,537,499 | |
| | | $ | 231,461,739 | | | $ | 1,703,151 | | | $ | 0 | | | $ | 233,164,890 | |
Further details on the major security types listed above can be found in the Portfolio of Investments.
Transfers in and transfers out are recognized at the end of the reporting period. For the six months ended April 30, 2012, the Fund did not have any significant transfers into/out of Level 1 and Level 2.
4. TRANSACTIONS WITH AFFILIATES AND OTHER EXPENSES
Advisory fee
The Trust has entered into an advisory contract with Funds Management, an indirect wholly owned subsidiary of Wells Fargo & Company (“Wells Fargo”). The adviser is responsible for implementing investment policies and guidelines and for supervising the sub-adviser, who is responsible for day-to-day portfolio management of the Fund.
Pursuant to the contract, Funds Management is entitled to receive an annual advisory fee starting at 0.75% and declining to 0.60% as the average daily net assets of the Fund increase. For the six months ended April 30, 2012, the advisory fee was equivalent to an annual rate of 0.75% of the Fund’s average daily net assets.
Funds Management has retained the services of certain sub-advisers to provide daily portfolio management to the Fund. The fees related to sub-advisory services are borne directly by Funds Management and do not increase the overall fees paid by the Fund. Wells Capital Management Incorporated (“Wells Capital Management”), an affiliate of Funds Management, is the sub-adviser to the Fund and is entitled to receive a fee from Funds Management at an annual rate starting at 0.45% and declining to 0.35% as the average daily net assets of the Fund increase.
Administration and transfer agent fees
The Trust has entered into an administration agreement with Funds Management. Under this agreement, for providing administrative services, which includes paying fees and expenses for services provided by the transfer agent, sub-transfer agents, omnibus account servicers and record-keepers, Funds Management is entitled to receive from the Fund an annual fund level administration fee starting at 0.05% and declining to 0.03% as the average daily net assets of the Fund increase and a class level administration fee which is calculated based on the average daily net assets of each class as follows:
| | | | |
| | | Class Level
Administration Fee | |
Class A, Class C | | | 0.26 | % |
Administrator Class | | | 0.10 | |
Institutional Class | | | 0.08 | |
Investor Class | | | 0.33 | |
Funds Management has contractually waived and/or reimbursed advisory and administration fees to the extent necessary to maintain certain net operating expense ratios for the Fund. Waiver of fees and/or reimbursement of expenses by Funds Management were made first from fund level expenses on a proportionate basis and then from class specific expenses. Funds Management has committed through February 28, 2013 to waive fees and/or reimburse expenses to the extent necessary to cap the Fund’s expenses at 1.40% for Class A, 2.15% for Class C, 1.15% for Administrator Class, 0.95% for Institutional Class and 1.47% for Investor Class.
| | | | |
| 26 | | Wells Fargo Advantage Small/Mid Cap Value Fund | | Notes to Financial Statements (Unaudited) |
Distribution fees
The Trust has adopted a Distribution Plan for Class C shares of the Fund pursuant to Rule 12b-1 under the 1940 Act. Distribution fees are charged to Class C shares and paid to Wells Fargo Funds Distributor, LLC, the principal underwriter, at an annual rate of 0.75% of the average daily net assets of Class C shares.
For the six months ended April 30, 2012, Wells Fargo Funds Distributor, LLC received $1,866 from the sale of Class A shares and $118 in contingent deferred sales charges from redemptions of Class C shares.
Shareholder servicing fees
The Trust has entered into contracts with one or more shareholder servicing agents, whereby Class A, Class C, Administrator Class and Investor Class of the Fund is charged a fee at an annual rate of 0.25% of the average daily net assets of each respective class.
A portion of these total shareholder servicing fees were paid to affiliates of Wells Fargo.
5. INVESTMENT PORTFOLIO TRANSACTIONS
Purchases and sales of investments, excluding U.S. Government obligations (if any) and short-term securities, for the six months ended April 30, 2012, were $45,153,828 and $52,979,330, respectively.
6. INVESTMENTS IN AFFILIATES
An affiliated investment is a company in which the Fund has ownership of at least 5% of the outstanding voting shares. A summary of the transactions with affiliates for the six months ended April 30, 2012 was as follows:
| | | | | | | | | | | | | | | | | | | | | | | | | | | | |
| | | Shares, Beginning
of Period | | | Shares Purchased | | | Shares Sold | | | Shares, End of
Period | | | Value, End of
Period | | | Income from
Affiliated Securities | | | Realized
Gains (Losses) | |
Bakers Footwear Group Incorporated | | | 509,735 | | | | 4,745 | | | | 0 | | | | 514,480 | | | $ | 421,874 | | | $ | 0 | | | $ | 0 | |
Evans & Sutherland Computer Corporation | | | 588,690 | | | | 23,500 | | | | 8,200 | | | | 603,990 | | | | 181,197 | | | | 0 | | | | (39,073 | ) |
7. BANK BORROWINGS
The Trust (excluding the money market funds) and Wells Fargo Variable Trust are parties to a $150,000,000 revolving credit agreement with State Street Bank and Trust Company, whereby the Fund is permitted to use bank borrowings for temporary or emergency purposes, such as to fund shareholder redemption requests. Interest under the credit agreement is charged to the Fund based on a borrowing rate equal to the higher of the Federal Funds rate in effect on that day plus 1.25% or the overnight LIBOR rate in effect on that day plus 1.25%. In addition, an annual commitment fee equal to 0.10% of the unused balance is allocated to each participating fund. For the six months ended April 30, 2012, the Fund paid $217 in commitment fees.
For the six months ended April 30, 2012, there were no borrowings by the Fund under the agreement.
8. INDEMNIFICATION
Under the Trust’s organizational documents, the officers and directors are indemnified against certain liabilities that may arise out of performance of their duties to the Trust. Additionally, in the normal course of business, the Trust may enter into contracts with service providers that contain a variety of indemnification clauses. The Trust’s maximum exposure under these arrangements is dependent on future claims that may be made against the Fund and, therefore, cannot be estimated.
9. NEW ACCOUNTING PRONOUNCEMENTS
In December 2011, the Financial Accounting Standards Board (“FASB”) issued Accounting Standard Update (“ASU”) No. 2011-11, Disclosures about Offsetting Assets and Liabilities. ASU 2011-11, which amends FASB ASC Topic 210, Balance Sheet, creates new disclosure requirements which require entities to disclose both gross and net information for derivatives and other financial instruments that are either offset in the Statement of Assets and Liabilities or subject to an enforceable master netting arrangement or similar agreement. The disclosure requirements are effective for interim and annual reporting periods beginning on or after January 1, 2013. Management is currently assessing the potential impact, in addition to expanded financial statement disclosure, that may result from adopting this ASU.
| | | | | | |
| Notes to Financial Statements (Unaudited) | | Wells Fargo Advantage Small/Mid Cap Value Fund | | | 27 | |
In May 2011, FASB issued ASU No. 2011-04 Amendments to Achieve Common Fair Value Measurement and Disclosure Requirements in U.S. GAAP and IFRSs. ASU No. 2011-04 amends FASB ASC Topic 820, Fair Value Measurements, to establish common requirements for measuring fair value and for disclosing information about fair value measurements in accordance with GAAP. The ASU is effective prospectively for interim and annual periods beginning after December 15, 2011. Management expects that adoption of the ASU will result in additional disclosures in the financial statements, as applicable.
In April 2011, FASB issued ASU No. 2011-03 Reconsideration of Effective Control for Repurchase Agreements. ASU No. 2011-03 amends FASB ASC Topic 860, Transfers and Servicing, specifically the criteria required to determine whether a repurchase agreement (repo) and similar agreements should be accounted for as sales of financial assets or secured borrowings with commitments. ASU No. 2011-03 changes the assessment of effective control by focusing on the transferor’s contractual rights and obligations and removing the criterion to assess its ability to exercise those rights or honor those obligations. This could result in changes to the way entities account for certain transactions including repurchase agreements, mortgage dollar rolls and reverse repurchase agreements. The ASU will become effective on a prospective basis for new transfers and modifications to existing transactions as of the beginning of the first interim or annual period beginning on or after December 15, 2011. Management has evaluated the impact of adopting the ASU and expects no significant changes.
| | | | |
| 28 | | Wells Fargo Advantage Small/Mid Cap Value Fund | | Other Information (Unaudited) |
PROXY VOTING INFORMATION
A description of the policies and procedures that the Fund uses to determine how to vote proxies relating to portfolio securities is available without charge, upon request, by calling 1-800-222-8222, visiting our Web site at wellsfargoadvantagefunds.com, or visiting the SEC Web site at sec.gov. Information regarding how the Fund voted proxies relating to portfolio securities during the most recent 12-month period ended June 30 is available without charge on the Fund’s Web site at wellsfargoadvantagefunds.com or by visiting the SEC Web site at sec.gov.
PORTFOLIO HOLDINGS INFORMATION
The complete portfolio holdings for the Fund are publicly available on the Fund’s Web site (wellsfargoadvantagefunds.com) on a monthly, 30-day or more delayed basis. In addition, top ten holdings information for the Fund is publicly available on the Fund’s Web site on a monthly, seven-day or more delayed basis. The Fund files its complete schedule of portfolio holdings with the SEC for the first and third quarters of each fiscal year on Form N-Q, which is available without charge by visiting the SEC Web site at sec.gov. In addition, the Fund’s Form N-Q may be reviewed and copied at the SEC’s Public Reference Room in Washington, DC, and at regional offices in New York City, at 233 Broadway, and in Chicago, at 175 West Jackson Boulevard, Suite 900. Information about the Public Reference Room may be obtained by calling 1-800-SEC-0330.
| | | | | | |
| Other Information (Unaudited) | | Wells Fargo Advantage Small/Mid Cap Value Fund | | | 29 | |
BOARD OF TRUSTEES
The following table provides basic information about the Board of Trustees (the “Trustees”) of the Trust and Officers of the Trust. This table should be read in conjunction with the Prospectus and the Statement of Additional Information1 of the Fund. Each of the Trustees and Officers listed below acts in identical capacities for the Wells Fargo Advantage family of funds, which consists of 137 funds comprising the Wells Fargo Funds Trust, Wells Fargo Variable Trust, Wells Fargo Master Trust and four closed-end funds (collectively the “Fund Complex”). All of the Trustees are also Members of the Audit and Governance Committees of each Trust in the Fund Complex. The mailing address of each Trustee and Officer is 525 Market Street, 12th Floor, San Francisco, CA 94105. Each Trustee and Officer serves an indefinite term, however, each Trustee serves such term until reaching the mandatory retirement age established by the Trustees.
Independent Trustees
| | | | | | |
Name and Year of Birth | | Position Held and Length of Service | | Principal Occupations During Past Five Years | | Other Directorships During
Past Five Years |
Peter G. Gordon
(Born 1942) | | Trustee, since 1998; Chairman, since 2005 (Lead Trustee since 2001) | | Co-Founder, Retired Chairman, President and CEO of Crystal Geyser Water Company. Trustee Emeritus, Colby College | | Asset Allocation Trust |
Isaiah Harris, Jr.
(Born 1952) | | Trustee, since 2009 | | Retired. Prior thereto, President and CEO of BellSouth Advertising and Publishing Corp. from 2005 to 2007, President and CEO of BellSouth Enterprises from 2004 to 2005 and President of BellSouth Consumer Services from 2000 to 2003. Emeritus member of the Iowa State University Foundation Board of Governors. Emeritus Member of the Advisory Board of Iowa State University School of Business. Mr. Harris is a certified public accountant. | | CIGNA Corporation; Deluxe Corporation; Asset Allocation Trust |
Judith M. Johnson
(Born 1949) | | Trustee, since 2008 | | Retired. Prior thereto, Chief Executive Officer and Chief Investment Officer of Minneapolis Employees Retirement Fund from 1996 to 2008. Ms. Johnson is an attorney, certified public accountant and a certified managerial accountant. | | Asset Allocation Trust |
Leroy Keith, Jr.
(Born 1939) | | Trustee, since 2010 | | Chairman, Bloc Global Services (development and construction). Trustee of the Evergreen Funds from 1983 to 2010. Former Managing Director, Almanac Capital Management (commodities firm), former Partner, Stonington Partners, Inc. (private equity fund), former Director, Obagi Medical Products Co. and former Director, Lincoln Educational Services. | | Trustee, Virtus Fund Complex (consisting of 40 portfolios as of 12/31/11); Asset Allocation Trust |
David F. Larcker
(Born 1950) | | Trustee, since 2009 | | James Irvin Miller Professor of Accounting at the Graduate School of Business, Stanford University, Director of Corporate Governance Research Program and Senior Faculty of The Rock Center for Corporate Governance since 2006. From 2005 to 2008, Professor of Accounting at the Graduate School of Business, Stanford University. Prior thereto, Ernst & Young Professor of Accounting at The Wharton School, University of Pennsylvania from 1985 to 2005. | | Asset Allocation Trust |
Olivia S. Mitchell
(Born 1953) | | Trustee, since 2006 | | International Foundation of Employee Benefit Plans Professor, Wharton School of the University of Pennsylvania since 1993. Director of Wharton’s Pension Research Council and Boettner Center on Pensions & Retirement Research, and Research Associate at the National Bureau of Economic Research. Previously, Cornell University Professor from 1978 to 1993. | | Asset Allocation Trust |
| | | | |
| 30 | | Wells Fargo Advantage Small/Mid Cap Value Fund | | Other Information (Unaudited) |
| | | | | | |
Name and Year of Birth | | Position Held and Length of Service | | Principal Occupations During Past Five Years | | Other Directorships During
Past Five Years |
Timothy J. Penny
(Born 1951) | | Trustee, since 1996 | | President and CEO of Southern Minnesota Initiative Foundation, a non-profit organization, since 2007 and Senior Fellow at the Humphrey Institute Policy Forum at the University of Minnesota since 1995. Member of the Board of Trustees of NorthStar Education Finance, Inc., a non-profit organization, since 2007. | | Asset Allocation Trust |
Michael S. Scofield
(Born 1943) | | Trustee, since 2010 | | Served on the Investment Company Institute’s Board of Governors and Executive Committee from 2008-2011 as well the Governing Council of the Independent Directors Council from 2006-2011 and the Independent Directors Council Executive Committee from 2008-2011. Chairman of the IDC from 2008-2010. Institutional Investor (Fund Directions) Trustee of Year in 2007. Trustee of the Evergreen Funds (and its predecessors) from 1984 to 2010. Chairman of the Evergreen Funds from 2000-2010. Former Trustee of the Mentor Funds. Retired Attorney, Law Offices of Michael S. Scofield and former Director and Chairman, Branded Media Corporation (multi-media branding company). | | Asset Allocation Trust |
Donald C. Willeke
(Born 1940) | | Trustee, since 1996 | | Principal of the law firm of Willeke & Daniels. General Counsel of the Minneapolis Employees Retirement Fund from 1984 until its consolidation into the Minnesota Public Employees Retirement Association on June 30, 2010. Director and Vice Chair of The Free Trust (non-profit corporation). Director of the American Chestnut Foundation (non-profit corporation). | | Asset Allocation Trust |
Officers
| | | | | | |
Name and Year of Birth | | Position Held and
Length of Service | | Principal Occupations During Past Five Years | | |
Karla M. Rabusch
(Born 1959) | | President, since 2003 | | Executive Vice President of Wells Fargo Bank, N.A. and President of Wells Fargo Funds Management, LLC since 2003. Senior Vice President and Chief Administrative Officer of Wells Fargo Funds Management, LLC from 2001 to 2003. | | |
C. David Messman
(Born 1960) | | Secretary, since 2000; Chief Legal Counsel, since 2003 | | Senior Vice President and Secretary of Wells Fargo Funds Management, LLC since 2001. Vice President and Managing Senior Counsel of Wells Fargo Bank, N.A. since 1996. | | |
Kasey Phillips
(Born 1970) | | Treasurer, since 2009 | | Senior Vice President of Wells Fargo Funds Management, LLC since 2009. Senior Vice President of Evergreen Investment Management Company, LLC from 2006 to 2010. Treasurer of the Evergreen Funds from 2005 to 2010. | | |
David Berardi
(Born 1975) | | Assistant Treasurer, since 2009 | | Vice President of Wells Fargo Funds Management, LLC since 2009. Vice President of Evergreen Investment Management Company, LLC from 2008 to 2010. Assistant Vice President of Evergreen Investment Services, Inc. from 2004 to 2008. Manager of Fund Reporting and Control for Evergreen Investment Management Company, LLC from 2004 to 2010. | | |
Jeremy DePalma
(Born 1974) | | Assistant Treasurer, since 2009 | | Senior Vice President of Wells Fargo Funds Management, LLC since 2009. Senior Vice President of Evergreen Investment Management Company, LLC from 2008 to 2010. Vice President, Evergreen Investment Services, Inc. from 2004 to 2007. Head of the Fund Reporting and Control Team within Fund Administration from 2005 to 2010. | | |
Debra Ann Early
(Born 1964) | | Chief Compliance Officer, since 2007 | | Chief Compliance Officer of Wells Fargo Funds Management, LLC since 2007. Chief Compliance Officer of Parnassus Investments from 2005 to 2007. Chief Financial Officer of Parnassus Investments from 2004 to 2007 and Senior Audit Manager of PricewaterhouseCoopers LLP from 1998 to 2004. | | |
| 1. | The Statement of Additional Information includes additional information about the Trustees and is available, without charge, upon request, by calling 1-800-222-8222 or by visiting the Web site at wellsfargoadvantagefunds.com. |
| | | | | | |
| Other Information (Unaudited) | | Wells Fargo Advantage Small/Mid Cap Value Fund | | | 31 | |
BOARD CONSIDERATION OF INVESTMENT ADVISORY AND SUB-ADVISORY AGREEMENTS:
Under Section 15 of the Investment Company Act of 1940 (the “1940 Act”), the Board of Trustees (the “Board”) of Wells Fargo Funds Trust (the “Trust”), all the members of which have no direct or indirect interest in the investment advisory and sub-advisory agreements and are not “interested persons” of the Trust, as defined in the 1940 Act (the “Independent Trustees”), must determine whether to approve the continuation of the Trust’s investment advisory and sub-advisory agreements. In this regard, at an in person meeting held on March 29-30, 2012 (the “Meeting”), the Board reviewed and re-approved: (i) an investment advisory agreement with Wells Fargo Funds Management, LLC (“Funds Management”) for Wells Fargo Advantage Small/Mid Cap Value Fund (the “Fund”) and (ii) an investment sub-advisory agreement with Wells Capital Management Incorporated (“Wells Capital Management”) for the Fund. The investment advisory agreement with Funds Management and the investment sub-advisory agreement with Wells Capital Management are collectively referred to as the “Advisory Agreements.”
At the Meeting, the Board considered the factors and reached the conclusions described below relating to the selection of Funds Management and Wells Capital Management and the continuation of the Advisory Agreements. Prior to the Meeting, the Trustees conferred extensively among themselves and with representatives of Funds Management about these matters. The Board also met throughout the year and received information that was useful to them in considering the continuation of the Advisory Agreements. The Independent Trustees were assisted in their evaluation of the Advisory Agreements by independent legal counsel, from whom they received separate legal advice and with whom they met separately from Funds Management.
In providing information to the Board, Funds Management and Wells Capital Management were guided by a detailed set of requests submitted by the Independent Trustees’ independent legal counsel on their behalf at the start of the Board’s annual contract renewal process earlier in 2012. In approving the Advisory Agreements, the Board did not identify any particular information or consideration that was all-important or controlling, and each Trustee likely attributed different weights to various factors.
Nature, extent and quality of services
The Board received and considered various information regarding the nature, extent and quality of services provided to the Fund by Funds Management and Wells Capital Management under the Advisory Agreements. The Board also received and considered, among other things, information about the background and experience of senior management of Funds Management, and the qualifications, backgrounds, tenures and responsibilities of the portfolio managers primarily responsible for the day-to-day portfolio management of the Fund.
The Board evaluated the ability of Funds Management and Wells Capital Management, based on their respective financial condition, resources, reputation and other attributes, to attract and retain qualified investment professionals, including research, advisory, and supervisory personnel. The Board further considered the compliance programs and compliance records of Funds Management and Wells Capital Management. In addition, the Board took into account the administrative services provided to the Fund by Funds Management and its affiliates.
The Board’s decision to approve the continuation of the Advisory Agreements was based on a comprehensive evaluation of all of the information provided to it. In considering these matters, the Board considered not only the specific information presented in connection with the Meeting, but also the knowledge gained over time through interaction with Funds Management and Wells Capital Management about various topics, including Funds Management’s oversight of service providers. The above factors, together with those referenced below, are some of the most important, but not necessarily all, factors considered by the Board in concluding that the nature, extent and quality of the investment advisory services provided to the Fund by Funds Management and Wells Capital Management supported the re-approval of the Advisory Agreements. Although the Board considered the continuation of the Advisory Agreements for the Fund as part of the larger process of considering the continuation of the advisory agreements for all of the funds in the complex, its decision to continue the Advisory Agreements for the Fund was ultimately made on a fund-by-fund basis.
Fund performance and expenses
The Board considered the performance results for the Fund over various time periods ended December 31, 2011. The Board also considered these results in comparison to the median performance of a universe of relevant funds (the “Universe”) that was determined by Lipper Inc. (“Lipper”) to be similar to the Fund, and in comparison to the Fund’s
| | | | |
| 32 | | Wells Fargo Advantage Small/Mid Cap Value Fund | | Other Information (Unaudited) |
benchmark index and to other comparative data. Lipper is an independent provider of investment company data. The Board received a description of the methodology used by Lipper to select the mutual funds in the Universe. The Board noted that the performance of the Fund was lower than the median performance of the Universe for all periods under review except for the three-year period, in which the Fund’s performance was higher than the median performance of the Universe. The Board also noted that the performance of the Fund was lower than its benchmark, the Lipper Small Cap Core Funds Index, for the periods under review except for the three-year period, in which the Fund’s performance was higher than the Lipper Small Cap Core Funds Index.
The Board also noted that the Fund’s performance results warranted further discussion. As part of its further review, the Board received an analysis of, and discussed factors contributing to, the underperformance of the Fund relative to the Universe. The Board received a report that noted that stock selection in the information technology and financial sectors was largely responsible for the Fund’s underperformance in the most recent one-year period. The Board was satisfied that Funds Management was appropriately monitoring the Fund’s investment performance.
The Board received and considered information regarding the Fund’s contractual advisory fee and net operating expense ratios and their various components, including actual management fees (which reflect fee waivers, if any), transfer agent, custodian and other non-management fees, Rule 12b-1 and non-Rule 12b-1 fees, service fees and fee waiver and expense reimbursement arrangements. The Board also considered these ratios in comparison to the median ratios of an expense Universe and a narrower expense group of mutual funds (each, an “Expense Group”) that was determined by Lipper to be similar to the Fund. The Board received a description of the methodology used by Lipper to select the mutual funds in the Fund’s Expense Group. The Board noted that the net operating expense ratios of the Fund were lower than or in range of the Fund’s Expense Group’s median net operating expense ratios.
Based on the above-referenced considerations and other factors, the Board concluded that the overall performance and expense structure of the Fund supported the re-approval of the Advisory Agreements for the Fund.
Investment advisory and sub-advisory fee rates
The Board reviewed and considered the contractual investment advisory fee rate that is payable by the Fund to Funds Management for investment advisory services (the “Advisory Agreement Rate”), both on a stand-alone basis and on a combined basis with the Fund’s administration fee rate. The Board took into account the separate administrative and other services covered by the administration fee rate. The Board also reviewed and considered the contractual investment sub-advisory fee rate that is payable by Funds Management to Wells Capital Management for investment sub-advisory services (the “Sub-Advisory Agreement Rate”). In addition, the Board reviewed and considered the existing fee waiver/cap arrangements applicable to the Advisory Agreement Rate and considered the Advisory Agreement Rate after taking the waivers/caps into account (the “Net Advisory Rate”).
The Board received and considered information comparing the Advisory Agreement Rate and Net Advisory Rate with those of other funds in the Fund’s Expense Group median. The Board noted that the Advisory Agreement Rate and Net Advisory Rate for the Fund were in range of the median rates for the Fund’s Expense Group, except for the Investor Class and Class A. The Board further noted that Funds Management had agreed to continue and, with respect to the Investor Class, reduce contractual fee cap arrangements for the Fund designed to lower the Fund’s expenses.
The Board also received and considered information about the nature and extent of services offered and fee rates charged by Funds Management and Wells Capital Management to other types of clients. In this regard, the Board received information about differences between the services, and the compliance, reporting, and other legal burdens and risks of providing investment advice to mutual funds and those associated with providing advice to non-mutual fund clients such as collective funds or institutional separate accounts.
The Board determined that the Advisory Agreement Rate for the Fund, both with and without an administration fee rate and before and after waivers, was reasonable in light of the Fund’s Expense Group information, the net expense ratio commitments, the services covered by the Advisory Agreements and other information provided. The Board also reviewed and considered the Sub-Advisory Agreement Rate and concluded that the Sub-Advisory Agreement Rate was reasonable in light of the services covered by the sub-advisory agreement and other information provided.
| | | | | | |
| Other Information (Unaudited) | | Wells Fargo Advantage Small/Mid Cap Value Fund | | | 33 | |
Profitability
The Board received and considered a profitability analysis of Funds Management, as well as an analysis of the profitability to the collective Wells Fargo businesses that provide services to the Fund. It considered that the information provided to it was necessarily estimated, and that the profitability information provided to it, especially on a fund-by-fund basis, did not necessarily provide a precise tool for evaluating the appropriateness of the Fund’s Advisory Agreement Rate in isolation. It noted that the levels of profitability reported on a fund-by-fund basis varied widely, depending on, among other things, the size and type of fund. The Board concluded that the profitability reported by Funds Management was not unreasonable.
The Board did not consider separate profitability information with respect to Wells Capital Management, because, as an affiliate of Funds Management, its profitability information was subsumed in the collective Wells Fargo profitability analysis provided by Funds Management.
Economies of scale
With respect to possible economies of scale, the Board reviewed the breakpoints in the Fund’s advisory fee structure, which operate generally to reduce the effective Advisory Agreement Rate of the Fund (as a percentage of Fund assets) as the Fund grows in size. It considered that, as a fund shrinks in size, breakpoints conversely result in increasing fee levels. The Board noted that it would have on-going opportunities to review the appropriate levels of breakpoints in the future, and concluded that the breakpoints as implemented appeared to be a reasonable step toward sharing economies of scale, if any, with the Fund. However, the Board acknowledged the inherent limitations of any analysis of an investment adviser’s economies of scale and of any attempt to correlate breakpoints with such economies, stemming largely from the Board’s understanding that economies of scale are realized, if at all, by an investment adviser across a variety of products and services, not just with respect to a single fund.
Other benefits to Funds Management and Wells Capital Management
The Board received and considered information regarding potential “fall-out” or ancillary benefits received by Funds Management and its affiliates, including Wells Capital Management, as a result of their relationship with the Fund. Ancillary benefits could include, among others, benefits directly attributable to the relationship of Funds Management and Wells Capital Management with the Fund and benefits potentially derived from an increase in Funds Management’s and Wells Capital Management’s business as a result of their relationship with the Fund (such as the ability to market to shareholders other financial products offered by Funds Management and its affiliates, including Wells Capital Management).
The Board considered that Wells Fargo Funds Distributor, LLC, an affiliate of Funds Management, serves as distributor to the Fund and receives certain compensation for those services. The Board noted that various financial institutions, including affiliates of Funds Management, may receive distribution-related fees, shareholder servicing payments (including amounts derived from payments under Rule 12b-1 plans) and sub-transfer agency fees in respect of shares sold or held through them and services provided.
The Board also reviewed information about whether and to what extent soft dollar credits are sought and how any such credits are utilized and any benefits that may be realized by using an affiliated broker.
Other factors and broader review
The Board also considered the markets for distribution of the Fund’s shares, including the channels through which the Fund’s shares are offered and sold. The Board noted that the Fund is part of one of the few fund families that have both direct-to-fund and intermediary distribution channels. As discussed above, the Board reviews detailed materials received from Funds Management and Wells Capital Management annually as part of the re-approval process under Section 15 of the 1940 Act and also reviews and assesses information about the quality of the services that the Fund receives throughout the year. In this regard, the Board has reviewed reports of Funds Management at each of its quarterly meetings, which include, among other things, portfolio reviews and performance reports. In addition, the Board confers with portfolio managers at various times throughout the year.
Conclusion
After considering the above-described factors and based on its deliberations and its evaluation of the information described above, the Board unanimously approved the continuation of the Advisory Agreements for an additional one-year period.
| | | | |
| 34 | | Wells Fargo Advantage Small/Mid Cap Value Fund | | List of Abbreviations |
The following is a list of common abbreviations for terms and entities which may have appeared in this report.
| ACB | — Agricultural Credit Bank |
| ADR | — American Depository Receipt |
| ADS | — American Depository Shares |
| AGC-ICC | — Assured Guaranty Corporation - Insured Custody Certificates |
| AGM | — Assured Guaranty Municipal |
| AMBAC | — American Municipal Bond Assurance Corporation |
| AMT | — Alternative Minimum Tax |
| BAN | — Bond Anticipation Notes |
| BHAC | — Berkshire Hathaway Assurance Corporation |
| CAB | — Capital Appreciation Bond |
| CCAB | — Convertible Capital Appreciation Bond |
| CDA | — Community Development Authority |
| CDO | — Collateralized Debt Obligation |
| COP | — Certificate of Participation |
| DRIVER | — Derivative Inverse Tax-Exempt Receipts |
| DW&P | — Department of Water & Power |
| DWR | — Department of Water Resources |
| ECFA | — Educational & Cultural Facilities Authority |
| EDA | — Economic Development Authority |
| EDFA | — Economic Development Finance Authority |
| ETF | — Exchange-Traded Fund |
| FFCB | — Federal Farm Credit Bank |
| FGIC | — Financial Guaranty Insurance Corporation |
| FHA | — Federal Housing Authority |
| FHLB | — Federal Home Loan Bank |
| FHLMC | — Federal Home Loan Mortgage Corporation |
| FICO | — The Financing Corporation |
| FNMA | — Federal National Mortgage Association |
| GDR | — Global Depository Receipt |
| GNMA | — Government National Mortgage Association |
| HCFR | — Healthcare Facilities Revenue |
| HEFA | — Health & Educational Facilities Authority |
| HEFAR | — Higher Education Facilities Authority Revenue |
| HFA | — Housing Finance Authority |
| HFFA | — Health Facilities Financing Authority |
| IBC | — Insured Bond Certificate |
| IDA | — Industrial Development Authority |
| IDAG | — Industrial Development Agency |
| IDR | — Industrial Development Revenue |
| KRW | — Republic of Korea Won |
| LIBOR | — London Interbank Offered Rate |
| LLC | — Limited Liability Company |
| LLP | — Limited Liability Partnership |
| MBIA | — Municipal Bond Insurance Association |
| MFHR | — Multi-Family Housing Revenue |
| MSTR | — Municipal Securities Trust Receipts |
| MUD | — Municipal Utility District |
| NATL-RE | — National Public Finance Guarantee Corporation |
| PCFA | — Pollution Control Finance Authority |
| PCR | — Pollution Control Revenue |
| PFA | — Public Finance Authority |
| PFFA | — Public Facilities Financing Authority |
| PFOTER | — Puttable Floating Option Tax-Exempt Receipts |
| plc | — Public Limited Company |
| PUTTER | — Puttable Tax-Exempt Receipts |
| R&D | — Research & Development |
| RDA | — Redevelopment Authority |
| RDFA | — Redevelopment Finance Authority |
| REIT | — Real Estate Investment Trust |
| ROC | — Reset Option Certificates |
| SAVRS | — Select Auction Variable Rate Securities |
| SBA | — Small Business Authority |
| SFHR | — Single Family Housing Revenue |
| SFMR | — Single Family Mortgage Revenue |
| SPA | — Standby Purchase Agreement |
| SPDR | — Standard & Poor’s Depositary Receipts |
| STRIPS | — Separate Trading of Registered Interest and Principal Securities |
| TAN | — Tax Anticipation Notes |
| TIPS | — Treasury Inflation-Protected Securities |
| TRAN | — Tax Revenue Anticipation Notes |
| TCR | — Transferable Custody Receipts |
| TTFA | — Transportation Trust Fund Authority |
| TVA | — Tennessee Valley Authority |
| XLCA | — XL Capital Assurance |


FOR MORE INFORMATION
More information about Wells Fargo Advantage Funds is available free upon request. To obtain literature, please write, e-mail, visit the Fund’s Web site, or call:
Wells Fargo Advantage Funds
P.O. Box 8266
Boston, MA 02266-8266
E-mail: wfaf@wellsfargo.com
Web site: wellsfargoadvantagefunds.com
Individual investors: 1-800-222-8222
Retail investment professionals: 1-888-877-9275
Institutional investment professionals: 1-866-765-0778
This report and the financial statements contained herein are submitted for the general information of the shareholders of Wells Fargo Advantage Funds. If this report is used for promotional purposes, distribution of the report must be accompanied or preceded by a current prospectus. For a prospectus containing more complete information, including charges and expenses, call 1-800-222-8222 or visit the Fund’s Web site at wellsfargoadvantagefunds.com. Please consider the investment objectives, risks, charges, and expenses of the investment carefully before investing. This and other information about Wells Fargo Advantage Funds can be found in the current prospectus. Read the prospectus carefully before you invest or send money.
Wells Fargo Funds Management, LLC, a wholly owned subsidiary of Wells Fargo & Company, provides investment advisory and administrative services for Wells Fargo Advantage Funds. Other affiliates of Wells Fargo & Company provide subadvisory and other services for the Funds. The Funds are distributed by Wells Fargo Funds Distributor, LLC, Member FINRA/SIPC, an affiliate of Wells Fargo & Company.
NOT FDIC INSURED ¡ NO BANK GUARANTEE ¡ MAY LOSE VALUE
© 2012 Wells Fargo Funds Management, LLC. All rights reserved.
| | |
 | | 209729 06-12 SA245/SAR245 4-12 |

Wells Fargo Advantage Special Small Cap Value Fund

Semi-Annual Report
April 30, 2012

Reduce clutter. Save trees.
Sign up for electronic delivery of prospectuses and shareholder reports at wellsfargo.com/advantagedelivery
Contents
The views expressed and any forward-looking statements are as of April 30, 2012, unless otherwise noted, and are those of the Fund managers and/or Wells Fargo Funds Management, LLC. Discussions of individual securities, or the markets generally, or any Wells Fargo Advantage Fund are not intended as individual recommendations. Future events or results may vary significantly from those expressed in any forward-looking statements; the views expressed are subject to change at any time in response to changing circumstances in the market. Wells Fargo Funds Management, LLC, disclaims any obligation to publicly update or revise any views expressed or forward-looking statements.
NOT FDIC INSURED ¡ NO BANK GUARANTEE ¡ MAY LOSE VALUE

WELLS FARGO INVESTMENT HISTORY
| | |
| |
| 1932 | | Keystone creates one of the first mutual fund families. |
| |
| 1971 | | Wells Fargo & Company introduces one of the first institutional index funds. |
| |
| 1978 | | Wells Fargo applies Markowitz and Sharpe’s research on Modern Portfolio Theory to introduce one of the industry’s first Tactical Asset Allocation (TAA) models in institutional separately managed accounts. |
| |
| 1984 | | Wells Fargo Stagecoach Funds launches its first asset allocation fund. |
| |
| 1989 | | The Tactical Asset Allocation (TAA) Model is first applied to Wells Fargo’s asset allocation mutual funds. |
| |
| 1994 | | Wells Fargo introduces the LifePath Funds, one of the first suites of target date funds (now the Wells Fargo Advantage Dow Jones Target Date FundsSM). |
| |
| 1996 | | Evergreen Investments and Keystone Funds merge. |
| |
| 1997 | | Wells Fargo launches Wells Fargo Advantage WealthBuilder PortfoliosSM, a fund-of-funds suite of products that includes the use of quantitative models to shift assets among investment styles. |
| |
| 1999 | | Norwest Advantage Funds and Stagecoach Funds are reorganized into Wells Fargo Funds after the merger of Norwest and Wells Fargo. |
| |
| 2002 | | Evergreen Retail and Evergreen Institutional companies form the umbrella asset management company, Evergreen Investments. |
| |
| 2005 | | The integration of Strong Funds with Wells Fargo Funds creates Wells Fargo Advantage Funds, resulting in one of the top 20 mutual fund companies in the United States. |
| |
| 2006 | | Wells Fargo Advantage Funds relaunches the target date product line as Wells Fargo Advantage Dow Jones Target Date Funds. |
| |
| 2010 | | The mergers and reorganizations of Evergreen and Wells Fargo Advantage mutual funds are completed, unifying the families under the brand of Wells Fargo Advantage Funds. |
Wells Fargo Advantage Funds®
Wells Fargo Advantage Funds skillfully guides institutions, financial advisors, and individuals through the investment terrain to help them reach their financial objectives. Everything we do on behalf of investors is backed by our unique combination of qualifications.
Strength
Our organization is built on the standards of integrity and service established by our parent company—Wells Fargo & Company—more than 150 years ago. And, because we’re part of a highly diversified financial enterprise, we offer the depth of resources to help investors succeed.
Expertise
Our multi-boutique model offers investors access to the independent thinking of premier investment managers that have been chosen for their time-tested strategies. While each team specializes in a specific investment strategy, collectively they provide investors a wide choice of distinct investment styles. Our dedication to investment excellence doesn’t end with our expertise in manager selection—risk management, analysis, and rigorous ongoing review seek to ensure each manager’s investment process remains consistent.
Partnership
Our collaborative approach is built around understanding the needs and goals of our clients. By adhering to core principles of sound judgment and steady guidance, we support you through every stage of the investment decision process.
Carefully consider a fund’s investment objectives, risks, charges, and expenses before investing. For a current prospectus and, if available, a summary prospectus, containing this and other information, visit wellsfargoadvantagefunds.com. Read it carefully before investing.
Wells Fargo Funds Management, LLC, a wholly owned subsidiary of Wells Fargo & Company, provides investment advisory and administrative services for Wells Fargo Advantage Funds®. Other affiliates of Wells Fargo & Company provide subadvisory and other services for the Funds. The Funds are distributed by Wells Fargo Funds Distributor, LLC, Member FINRA/SIPC, an affiliate of Wells Fargo & Company.
“Dow Jones®” and “Dow Jones Target Date IndexesSM” are service marks of Dow Jones Trademark Holdings, LLC (“Dow Jones”), have been licensed to CME Group Index Services LLC (“CME Indexes”) and have been sublicensed for use for certain purposes by Global Index Advisors, Inc, and Wells Fargo Funds Management, LLC. The Wells Fargo Advantage Dow Jones Target Date FundsSM based on the Dow Jones Target Date IndexesSM, are not sponsored, endorsed, sold or promoted by Dow Jones, CME Indexes or their respective affiliates and none of them makes any representation regarding the advisability of investing in such product(s).
NOT FDIC INSURED ¡ NO BANK GUARANTEE ¡ MAY LOSE VALUE
Not part of the semi-annual report.
Wells Fargo Advantage Funds offers more than 110 mutual funds across a wide range of asset classes, representing over $211 billion in assets under management, as of April 30, 2012.
| | | | |
| Equity Funds | | | | |
Asia Pacific Fund | | Enterprise Fund† | | Precious Metals Fund |
C&B Large Cap Value Fund | | Equity Value Fund | | Premier Large Company Growth Fund |
C&B Mid Cap Value Fund | | Global Opportunities Fund | | Small Cap Opportunities Fund |
Capital Growth Fund | | Growth Fund | | Small Cap Value Fund |
Common Stock Fund | | Index Fund | | Small Company Growth Fund |
Disciplined U.S. Core Fund | | International Equity Fund | | Small Company Value Fund |
Discovery Fund† | | International Value Fund | | Small/Mid Cap Core Fund |
Diversified Equity Fund | | Intrinsic Small Cap Value Fund | | Small/Mid Cap Value Fund |
Diversified International Fund | | Intrinsic Value Fund | | Special Mid Cap Value Fund |
Diversified Small Cap Fund | | Intrinsic World Equity Fund | | Special Small Cap Value Fund |
Emerging Growth Fund | | Large Cap Core Fund | | Specialized Technology Fund |
Emerging Markets Equity Fund | | Large Cap Growth Fund | | Traditional Small Cap Growth Fund |
Emerging Markets Equity Income Fund | | Large Company Value Fund | | Utility and Telecommunications Fund |
Emerging Markets Local Bond Fund | | Omega Growth Fund | | |
Endeavor Select Fund† | | Opportunity Fund† | | |
| Bond Funds | | | | |
Adjustable Rate Government Fund | | Inflation-Protected Bond Fund | | Short-Term Bond Fund |
California Limited-Term Tax-Free Fund | | Intermediate Tax/AMT-Free Fund | | Short-Term High Yield Bond Fund |
California Tax-Free Fund | | International Bond Fund | | Short-Term Municipal Bond Fund |
Colorado Tax-Free Fund | | Minnesota Tax-Free Fund | | Strategic Municipal Bond Fund |
Government Securities Fund | | Municipal Bond Fund | | Total Return Bond Fund |
High Income Fund | | North Carolina Tax-Free Fund | | Ultra Short-Term Income Fund |
High Yield Bond Fund | | Pennsylvania Tax-Free Fund | | Ultra Short-Term Municipal Income Fund |
Income Plus Fund | | Short Duration Government Bond Fund | | Wisconsin Tax-Free Fund |
| Asset Allocation Funds | | | | |
Absolute Return Fund | | WealthBuilder Equity Portfolio† | | Target 2020 Fund† |
Asset Allocation Fund | | WealthBuilder Growth Allocation Portfolio† | | Target 2025 Fund† |
Conservative Allocation Fund | | WealthBuilder Growth Balanced Portfolio† | | Target 2030 Fund† |
Diversified Capital Builder Fund | | WealthBuilder Moderate Balanced Portfolio† | | Target 2035 Fund† |
Diversified Income Builder Fund | | WealthBuilder Tactical Equity Portfolio† | | Target 2040 Fund† |
Growth Balanced Fund | | Target Today Fund† | | Target 2045 Fund† |
Index Asset Allocation Fund | | Target 2010 Fund† | | Target 2050 Fund† |
Moderate Balanced Fund | | Target 2015 Fund† | | Target 2055 Fund† |
WealthBuilder Conservative Allocation Portfolio† | | | | |
| Money Market Funds | | | | |
100% Treasury Money Market Fund | | Heritage Money Market Fund† | | National Tax-Free Money Market Fund |
California Municipal Money Market Fund | | Money Market Fund | | Prime Investment Money Market Fund |
Cash Investment Money Market Fund | | Municipal Cash Management Money Market Fund | | Treasury Plus Money Market Fund |
Government Money Market Fund | | Municipal Money Market Fund | | |
| Variable Trust Funds1 | | | | |
VT Discovery Fund† | | VT Intrinsic Value Fund | | VT Small Cap Growth Fund |
VT Index Asset Allocation Fund | | VT Omega Growth Fund | | VT Small Cap Value Fund |
VT International Equity Fund | | VT Opportunity Fund† | | VT Total Return Bond Fund |
An investment in a money market fund is not insured or guaranteed by the Federal Deposit Insurance Corporation or any other government agency. Although the Wells Fargo Advantage Money Market Funds seek to preserve the value of your investment at $1.00 per share, it is possible to lose money by investing in a money market fund.
| 1. | The Variable Trust Funds are generally available only through insurance company variable contracts. |
| † | In this report, the Wells Fargo Advantage Discovery FundSM, Wells Fargo Advantage Endeavor Select FundSM, Wells Fargo Advantage Enterprise FundSM, Wells Fargo Advantage Opportunity FundSM, Wells Fargo Advantage WealthBuilder Conservative Allocation PortfolioSM, Wells Fargo Advantage WealthBuilder Equity PortfolioSM, Wells Fargo Advantage WealthBuilder Growth Allocation PortfolioSM, Wells Fargo Advantage WealthBuilder Growth Balanced PortfolioSM, Wells Fargo Advantage WealthBuilder Moderate Balanced PortfolioSM, Wells Fargo Advantage WealthBuilder Tactical Equity PortfolioSM, Wells Fargo Advantage Dow Jones Target Today FundSM, Wells Fargo Advantage Dow Jones Target 2010 FundSM, Wells Fargo Advantage Dow Jones Target 2015 FundSM, Wells Fargo Advantage Dow Jones Target 2020 FundSM, Wells Fargo Advantage Dow Jones Target 2025 FundSM, Wells Fargo Advantage Dow Jones Target 2030 FundSM, Wells Fargo Advantage Dow Jones Target 2035 FundSM, Wells Fargo Advantage Dow Jones Target 2040 FundSM, Wells Fargo Advantage Dow Jones Target 2045 FundSM, Wells Fargo Advantage Dow Jones Target 2050 FundSM, Wells Fargo Advantage Dow Jones Target 2055 FundSM, Wells Fargo Advantage Heritage Money Market FundSM, Wells Fargo Advantage VT Discovery FundSM, and Wells Fargo Advantage VT Opportunity FundSM are referred to as the Discovery Fund, Endeavor Select Fund, Enterprise Fund, Opportunity Fund, WealthBuilder Conservative Allocation Portfolio, WealthBuilder Equity Portfolio, WealthBuilder Growth Allocation Portfolio, WealthBuilder Growth Balanced Portfolio, WealthBuilder Moderate Balanced Portfolio, WealthBuilder Tactical Equity Portfolio, Target Today Fund, Target 2010 Fund, Target 2015 Fund, Target 2020 Fund, Target 2025 Fund, Target 2030 Fund, Target 2035 Fund, Target 2040 Fund, Target 2045 Fund, Target 2050 Fund, Target 2055 Fund, Heritage Money Market Fund, VT Discovery Fund, and VT Opportunity Fund, respectively. |
Not part of the semi-annual report.
| | | | |
| 2 | | Wells Fargo Advantage Special Small Cap Value Fund | | Letter to Shareholders |

Karla M. Rabusch,
President
Wells Fargo Advantage Funds
The period was marked by continued concerns about the possible global economic effects of the ongoing European sovereign debt crisis that began in Greece and later spread to the larger economies of Italy and Spain.
In contrast to worrisome data from the eurozone, U.S. economic data remained moderately positive.
Dear Valued Shareholder:
We’re pleased to offer you this semi-annual report for the Wells Fargo Advantage Special Small Cap Value Fund for the six-month period that ended April 30, 2012. The period was marked by continued concerns about the possible global economic effects of the ongoing European sovereign debt crisis that began in Greece and later spread to the larger economies of Italy and Spain. However, relatively positive U.S. economic data resulted in most U.S. stock indexes posting gains for the period, with large-cap stocks modestly outperforming small-cap stocks.
Macroeconomic optimism seemed to fade as global growth slowed and worries rose.
Prior to and throughout the reporting period, concerns about the eurozone sovereign debt situation returned to center stage. Investors became increasingly concerned that Greece would default on its debt, a scenario that only seemed more likely as eurozone leaders began to openly discuss a “voluntary” haircut on Greek debt for private investors. Because many eurozone banks owned Greek debt and many U.S. banks had financial ties to eurozone banks, investors worried about the effects of such an event on the financial systems and on the global economy.
In October 2011, market participants turned their attention to the debt burdens of Italy—which, like the U.S., also had its credit rating downgraded by Standard & Poor’s—because even though it had a relatively modest budget deficit, it had a high amount of outstanding debt and a stagnant economy. French banks were heavily exposed to Italian debt, so Italy’s woes led to fears of a state bailout of French banks and a resulting increase in France’s expenditures.
The Greek credit crisis was seemingly addressed in March 2012, when the Greek government came to an agreement with its creditors that allowed it to write down the principal on most of its bonds in exchange for increased financial austerity. The Greek agreement, combined with unprecedented support for eurozone banks by the European Central Bank (ECB), seemed to calm investor concerns, at least temporarily, and most developed European markets ended the period with gains.
The U.S. economy reported relatively solid news.
In contrast to worrisome data from the eurozone, U.S. economic data remained moderately positive. Reported gross domestic product (GDP) growth came in at a 1.8% annualized rate in the third quarter of 2011 and then accelerated to a 3.0% annualized rate in the fourth quarter. The initial estimate for GDP growth in the first quarter of 2012 came in at a 2.2% annualized rate, further supporting the case for economic recovery. In addition, the major banks appeared to have taken steps toward repairing their balance sheets; in March, the Federal Reserve (Fed) announced that 15 of the 19 major banks had passed a “stress test” in which the Fed attempted to gauge whether the banks could survive a severe recession that included a 50% drop in the stock market and a 21% percent decline in housing prices.
Financial stocks rebounded and outperformed the broader market for the reporting period after the Fed released details of the stress test. Stocks generally rallied across the market as investors seemed to be increasingly confident that the U.S. would not return to recession.
| | | | | | |
| Letter to Shareholders | | Wells Fargo Advantage Special Small Cap Value Fund | | | 3 | |
Central banks continued to provide stimulus.
Throughout the reporting period, the Federal Open Market Committee kept its key interest rates effectively at zero in order to support the economy and financial system. In response to extreme market volatility and signs of a weakening economy, the Fed announced its intention to keep interest rates low until at least late 2014.
As of November 1, 2011, the ECB had a key rate of 1.50%, which it had increased from 1.0% in an attempt to keep inflation in check. Soon, in response to weakness in the southern European economies, the ECB lowered its key rate to 1.25% in early November 2011 and 1.0% in December 2011. The ECB also continued to provide virtually unlimited liquidity for banks, announcing a Long-Term Refinancing Operation in December through which it provided low-cost three-year loans to lenders.
We use time-tested investment strategies, even as many variables are at work in the market.
Elevated unemployment and debt defaults continue to pressure consumers and businesses alike. In our experience, strict adherence to time-tested investment strategies has its rewards. As a whole, Wells Fargo Advantage Funds represents investments across a range of asset classes and investment styles, giving you an opportunity to create a diversified investment portfolio. While diversification may not prevent losses in a downturn, we believe it helps in managing risk.
Thank you for choosing to invest with Wells Fargo Advantage Funds. We appreciate your confidence in us and remain committed to helping you meet your financial needs. For current information about your fund investments, contact your investment professional, visit our Web site at wellsfargoadvantagefunds.com, or call us directly at 1-800-222-8222. We are available 24 hours a day, 7 days a week.
Sincerely,

Karla M. Rabusch
President
Wells Fargo Advantage Funds
| | | | |
| 4 | | Wells Fargo Advantage Special Small Cap Value Fund | | Letter to Shareholders |
Notice to Shareholders
The Board of Trustees for Wells Fargo Advantage Funds has unanimously approved the following modifications to certain net asset value (NAV) waiver privileges and commission schedules:
| | n | | Effective May 1, 2012, automatic investment plan (AIP) purchases and proceeds received from systematic withdrawals will no longer qualify for NAV repurchase privileges. | |
| | n | | Effective May 1, 2012, discretionary rights to waive the upfront commission for Class C and “jumbo” Class A share purchases will no longer be granted to broker/dealers. However, we will continue to waive the Class C shares contingent deferred sales charge for redemptions by employer-sponsored retirement plans where the dealer of record waived its commission at the time of purchase. | |
| | n | | Effective July 31, 2012, NAV purchase privileges for former Evergreen Class IS and Class R shareholders are being modified to remove the ability to purchase Class A shares at NAV unless those shares are held directly with the Fund on or after July 31, 2012. | |
Please contact your investment professional or call us directly at 1-800-222-8222 if you have any questions on this Notice to Shareholders.
| | | | | | |
| Performance Highlights (Unaudited) | | Wells Fargo Advantage Special Small Cap Value Fund | | | 5 | |
INVESTMENT OBJECTIVE
The Fund seeks long-term capital appreciation.
ADVISER
Wells Fargo Funds Management, LLC
SUB-ADVISER
Wells Capital Management Incorporated
PORTFOLIO MANAGERS
Robert Rifkin, CFA
James M. Tringas, CFA, CPA
FUND INCEPTION
May 7, 1993
| | | | |
TEN LARGEST EQUITY HOLDINGS1
(AS OF APRIL 30, 2012) | | | |
First Citizens BancShares Incorporated | | | 4.06% | |
Kadant Incorporated | | | 3.24% | |
UMB Financial Corporation | | | 2.41% | |
ALLETE Incorporated | | | 2.33% | |
Quanex Building Products Corporation | | | 2.04% | |
Imation Corporation | | | 2.00% | |
Blyth Incorporated | | | 1.94% | |
EarthLink Incorporated | | | 1.77% | |
ACI Worldwide Incorporated | | | 1.72% | |
ATMI Incorporated | | | 1.70% | |
| | |
SECTOR DISTRIBUTION2
(AS OF APRIL 30, 2012) | | |
|
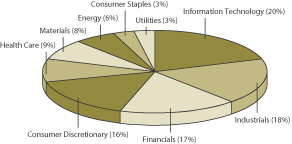 |
| 1. | The ten largest equity holdings are calculated based on the value of the securities divided by total net assets of the Fund. Holdings are subject to change and may have changed since the date specified. |
| 2. | Sector distribution is subject to change and is calculated based on the total long-term investments of the Fund. |
| | | | |
| 6 | | Wells Fargo Advantage Special Small Cap Value Fund | | Performance Highlights (Unaudited) |
AVERAGE ANNUAL TOTAL RETURN3 (%) (AS OF APRIL 30, 2012)
| | | | | | | | | | | | | | | | | | | | | | | | | | | | | | | | | | | | | | | | | | | | |
| | | | | | Including Sales Charge | | | Excluding Sales Charge | | | Expense Ratios4 | |
| | | Inception Date | | | 6 Months* | | | 1 Year | | | 5 Year | | | 10 Year | | | 6 Months* | | | 1 Year | | | 5 Year | | | 10 Year | | | Gross | | | Net5 | |
Class A (ESPAX) | | | 05/07/1993 | | | | 6.34 | | | | (4.94 | ) | | | (0.27 | ) | | | 6.38 | | | | 12.83 | | | | 0.85 | | | | 0.92 | | | | 7.01 | | | | 1.39% | | | | 1.35% | |
Class B (ESPBX)** | | | 03/26/1999 | | | | 7.39 | | | | (4.91 | ) | | | (0.16 | ) | | | 6.46 | | | | 12.39 | | | | 0.09 | | | | 0.17 | | | | 6.46 | | | | 2.14% | | | | 2.10% | |
Class C (ESPCX) | | | 12/12/2000 | | | | 11.40 | | | | (0.91 | ) | | | 0.17 | | | | 6.22 | | | | 12.40 | | | | 0.09 | | | | 0.17 | | | | 6.22 | | | | 2.14% | | | | 2.10% | |
Administrator Class (ESPIX) | | | 07/23/1996 | | | | | | | | | | | | | | | | | | | | 12.92 | | | | 1.10 | | | | 1.18 | | | | 7.29 | | | | 1.23% | | | | 1.10% | |
Institutional Class (ESPNX) | | | 07/30/2010 | | | | | | | | | | | | | | | | | | | | 13.04 | | | | 1.27 | | | | 1.23 | | | | 7.31 | | | | 0.96% | | | | 0.95% | |
Russell 2000® Value Index6 | | | | | | | | | | | | | | | | | | | | | | | 11.47 | | | | (4.06 | ) | | | (0.49 | ) | | | 6.07 | | | | | | | | | |
| * | Returns for periods of less than one year are not annualized. |
| ** | Class B shares are closed to investment, except in connection with the reinvestment of any distributions and permitted exchanges. |
Figures quoted represent past performance, which is no guarantee of future results and do not reflect the deduction of taxes that a shareholder may pay on fund distributions or the redemption of fund shares. Investment return and principal value of an investment will fluctuate so that an investor’s shares, when redeemed, may be worth more or less than their original cost. Performance shown without sales charges would be lower if sales charges were reflected. Current performance may be lower or higher than the performance data quoted and assumes the reinvestment of dividends and capital gains. Current month-end performance is available on the Fund’s Web site – wellsfargoadvantagefunds.com.
Index returns do not include transaction costs associated with buying and selling securities, any mutual fund fees or expenses or any taxes. It is not possible to invest directly in an index.
For Class A shares, the maximum front-end sales charge is 5.75%. For Class B shares, the maximum contingent deferred sales charge is 5.00%. For Class C shares, the maximum contingent deferred sales charge is 1.00%. Performance including sales charge assumes the sales charge for the corresponding time period. Administrator Class and Institutional Class shares are sold without a front-end sales charge or contingent deferred sales charge.
Stock fund values fluctuate in response to the activities of individual companies and general market and economic conditions. Smaller-company stocks tend to be more volatile and less liquid than those of larger companies. Consult the Fund’s prospectus for additional information on these and other risks.
| 3. | Historical performance shown for the Institutional Class shares prior to their inception, reflects the performance of the Administrator Class shares, and includes the higher expenses applicable to the Administrator Class shares. If these expenses had not been included, returns would be higher. Historical performance shown for all classes of the Fund prior to July 19, 2010 is based on the performance of the Fund’s predecessor, Evergreen Special Values Fund. |
| 4. | Reflects the expense ratios as stated in the most recent prospectuses. |
| 5. | The Adviser has committed through July 18, 2013 to waive fees and/or reimburse expenses to the extent necessary to cap the Fund’s Total Annual Fund Operating Expenses After Fee Waiver, excluding certain expenses, at 1.34% for Class A, 2.09% for Class B, 2.09% for Class C, 1.09% for Administrator Class and 0.94% for Institutional Class. Without this cap, the Fund’s returns would have been lower. |
| 6. | The Russell 2000® Value Index measures the performance of those Russell 2000 companies with lower price-to-book ratios and lower forecasted growth values. You cannot invest directly in an index. |
| | | | | | |
| Fund Expenses (Unaudited) | | Wells Fargo Advantage Special Small Cap Value Fund | | | 7 | |
As a shareholder of the Fund, you incur two types of costs: (1) transaction costs, including sales charges (loads) on purchase payments and contingent deferred sales charges (if any) on redemptions and (2) ongoing costs, including management fees; distribution (12b-1) and/or shareholder service fees; and other Fund expenses. This example is intended to help you understand your ongoing costs (in dollars) of investing in the Fund and to compare these costs with the ongoing costs of investing in other mutual funds.
The example is based on an investment of $1,000 invested at the beginning of the six-month period and held for the entire period from November 1, 2011 to April 30, 2012.
Actual Expenses
The “Actual” line of the table below provides information about actual account values and actual expenses. You may use the information in this line, together with the amount you invested, to estimate the expenses that you paid over the period. Simply divide your account value by $1,000 (for example, an $8,600 account value divided by $1,000 = 8.6), then multiply the result by the number in the “Actual” line under the heading entitled “Expenses Paid During Period” for your applicable class of shares to estimate the expenses you paid on your account during this period.
Hypothetical Example for Comparison Purposes
The “Hypothetical” line of the table below provides information about hypothetical account values and hypothetical expenses based on the Fund’s actual expense ratio and an assumed rate of return of 5% per year before expenses, which is not the Fund’s actual return. The hypothetical account values and expenses may not be used to estimate the actual ending account balance or expenses you paid for the period. You may use this information to compare the ongoing costs of investing in the Fund and other funds. To do so, compare this 5% hypothetical example with the 5% hypothetical examples that appear in the shareholder reports of the other funds.
Please note that the expenses shown in the table are meant to highlight your ongoing costs only and do not reflect any transactional costs, such as sales charges (loads) and contingent deferred sales charges. Therefore, the “Hypothetical” line of the table is useful in comparing ongoing costs only, and will not help you determine the relative total costs of owning different funds. In addition, if these transactional costs were included, your costs would have been higher.
| | | | | | | | | | | | | | | | |
| | | Beginning
Account Value
11-01-2011 | | | Ending
Account Value
04-30-2012 | | | Expenses
Paid During
the Period1 | | | Net Annual
Expense Ratio | |
Class A | | | | | | | | | | | | | | | | |
Actual | | $ | 1,000.00 | | | $ | 1,128.28 | | | $ | 7.09 | | | | 1.34 | % |
Hypothetical (5% return before expenses) | | $ | 1,000.00 | | | $ | 1,018.20 | | | $ | 6.72 | | | | 1.34 | % |
Class B | | | | | | | | | | | | | | | | |
Actual | | $ | 1,000.00 | | | $ | 1,123.93 | | | $ | 11.04 | | | | 2.09 | % |
Hypothetical (5% return before expenses) | | $ | 1,000.00 | | | $ | 1,014.47 | | | $ | 10.47 | | | | 2.09 | % |
Class C | | | | | | | | | | | | | | | | |
Actual | | $ | 1,000.00 | | | $ | 1,124.00 | | | $ | 11.04 | | | | 2.09 | % |
Hypothetical (5% return before expenses) | | $ | 1,000.00 | | | $ | 1,014.47 | | | $ | 10.47 | | | | 2.09 | % |
Administrator Class | | | | | | | | | | | | | | | | |
Actual | | $ | 1,000.00 | | | $ | 1,129.18 | | | $ | 5.77 | | | | 1.09 | % |
Hypothetical (5% return before expenses) | | $ | 1,000.00 | | | $ | 1,019.44 | | | $ | 5.47 | | | | 1.09 | % |
Institutional Class | | | | | | | | | | | | | | | | |
Actual | | $ | 1,000.00 | | | $ | 1,130.41 | | | $ | 4.98 | | | | 0.94 | % |
Hypothetical (5% return before expenses) | | $ | 1,000.00 | | | $ | 1,020.19 | | | $ | 4.72 | | | | 0.94 | % |
| 1. | Expenses paid is equal to the annualized expense ratio of each class multiplied by the average account value over the period, multiplied by the number of days in the most recent fiscal half-year divided by the number of days in the fiscal year (to reflect the one-half year period). |
| | | | |
| 8 | | Wells Fargo Advantage Special Small Cap Value Fund | | Portfolio of Investments—April 30, 2012 (Unaudited) |
| | | | | | | | | | | | |
| Security Name | | | | | | Shares | | | Value | |
| | | | | | | | | | | | |
| | | | |
Common Stocks: 92.41% | | | | | | | | | | | | |
| | | | |
Consumer Discretionary: 14.89% | | | | | | | | | | | | |
| | | | |
| Auto Components: 1.12% | | | | | | | | | | | | |
Lear Corporation | | | | | | | 54,400 | | | $ | 2,257,600 | |
Modine Manufacturing Company † | | | | | | | 820,125 | | | | 6,478,984 | |
| | | | |
| | | | | | | | | | | 8,736,584 | |
| | | | | | | | | | | | |
| | | | |
| Automobiles: 0.47% | | | | | | | | | | | | |
Thor Industries Incorporated « | | | | | | | 108,100 | | | | 3,657,023 | |
| | | | | | | | | | | | |
| | | | |
| Diversified Consumer Services: 4.07% | | | | | | | | | | | | |
Hillenbrand Incorporated | | | | | | | 437,302 | | | | 9,157,104 | |
Matthews International Corporation Class A « | | | | | | | 400,247 | | | | 12,007,410 | |
Steel Excel Incorporated † | | | | | | | 373,659 | | | | 10,462,452 | |
| | | | |
| | | | | | | | | | | 31,626,966 | |
| | | | | | | | | | | | |
| | | | |
| Hotels, Restaurants & Leisure: 1.70% | | | | | | | | | | | | |
Denny’s Corporation †« | | | | | | | 2,696,844 | | | | 11,164,934 | |
Ruby Tuesday Incorporated †« | | | | | | | 301,700 | | | | 2,051,560 | |
| | | | |
| | | | | | | | | | | 13,216,494 | |
| | | | | | | | | | | | |
| | | | |
| Household Durables: 3.93% | | | | | | | | | | | | |
Blyth Incorporated | | | | | | | 171,760 | | | | 15,109,727 | |
Cavco Industries Incorporated † | | | | | | | 112,867 | | | | 5,823,937 | |
Dixie Group Incorporated †** | | | | | | | 704,877 | | | | 2,734,923 | |
Furniture Brands International Incorporated †« | | | | | | | 535,362 | | | | 845,872 | |
La-Z-Boy Incorporated †« | | | | | | | 399,412 | | | | 6,019,139 | |
| | | | |
| | | | | | | | | | | 30,533,598 | |
| | | | | | | | | | | | |
| | | | |
| Media: 0.68% | | | | | | | | | | | | |
AH Belo Corporation ** | | | | | | | 1,149,060 | | | | 5,067,355 | |
Dex One Corporation †« | | | | | | | 243,493 | | | | 235,701 | |
| | | | |
| | | | | | | | | | | 5,303,056 | |
| | | | | | | | | | | | |
| | | | |
| Specialty Retail: 0.19% | | | | | | | | | | | | |
Christopher & Banks Corporation | | | | | | | 808,045 | | | | 1,511,044 | |
| | | | | | | | | | | | |
| | | | |
| Textiles, Apparel & Luxury Goods: 2.73% | | | | | | | | | | | | |
Delta Apparel Incorporated † | | | | | | | 277,939 | | | | 3,977,307 | |
Iconix Brand Group Incorporated †« | | | | | | | 125,400 | | | | 1,923,636 | |
Kenneth Cole Productions Incorporated Class A †** | | | | | | | 521,568 | | | | 8,308,578 | |
Maidenform Brands Incorporated †« | | | | | | | 188,400 | | | | 4,301,172 | |
Skechers USA Incorporated Class A †« | | | | | | | 145,900 | | | | 2,723,953 | |
| | | | |
| | | | | | | | | | | 21,234,646 | |
| | | | | | | | | | | | |
| | | | |
Consumer Staples: 2.93% | | | | | | | | | | | | |
| | | | |
| Food Products: 0.35% | | | | | | | | | | | | |
Seneca Foods Corporation Class A †« | | | | | | | 117,297 | | | | 2,731,847 | |
| | | | | | | | | | | | |
The accompanying notes are an integral part of these financial statements.
| | | | | | |
| Portfolio of Investments—April 30, 2012 (Unaudited) | | Wells Fargo Advantage Special Small Cap Value Fund | | | 9 | |
| | | | | | | | | | | | |
| Security Name | | | | | | Shares | | | Value | |
| | | | | | | | | | | | |
| | | | |
| Household Products: 2.40% | | | | | | | | | | | | |
Central Garden & Pet Company † | | | | | | | 186,192 | | | $ | 1,969,911 | |
Central Garden & Pet Company Class A † | | | | | | | 166,502 | | | | 1,779,906 | |
Spectrum Brands Holdings Incorporated † | | | | | | | 170,049 | | | | 5,868,391 | |
WD-40 Company « | | | | | | | 200,736 | | | | 9,049,179 | |
| | | | |
| | | | | | | | | | | 18,667,387 | |
| | | | | | | | | | | | |
| | | | |
| Personal Products: 0.18% | | | | | | | | | | | | |
Medifast Incorporated †« | | | | | | | 73,200 | | | | 1,406,904 | |
| | | | | | | | | | | | |
| | | | |
Energy: 5.60% | | | | | | | | | | | | |
| | | | |
| Energy Equipment & Services: 0.89% | | | | | | | | | | | | |
Atwood Oceanics Incorporated † | | | | | | | 66,900 | | | | 2,965,677 | |
Cal Dive International Incorporated †« | | | | | | | 328,317 | | | | 1,270,587 | |
Carbo Ceramics Incorporated « | | | | | | | 31,900 | | | | 2,682,471 | |
| | | | |
| | | | | | | | | | | 6,918,735 | |
| | | | | | | | | | | | |
| | | | |
| Oil, Gas & Consumable Fuels: 4.71% | | | | | | | | | | | | |
Bill Barrett Corporation †« | | | | | | | 470,300 | | | | 11,277,794 | |
Biofuel Energy Corporation †« | | | | | | | 1,203,464 | | | | 557,083 | |
Comstock Resources Incorporated †« | | | | | | | 728,663 | | | | 12,802,609 | |
Stone Energy Corporation † | | | | | | | 80,761 | | | | 2,265,346 | |
Swift Energy Company †« | | | | | | | 266,547 | | | | 8,063,047 | |
Ultra Petroleum Corporation † | | | | | | | 83,300 | | | | 1,646,008 | |
| | | | |
| | | | | | | | | | | 36,611,887 | |
| | | | | | | | | | | | |
| | | | |
Financials: 15.90% | | | | | | | | | | | | |
| | | | |
| Capital Markets: 2.74% | | | | | | | | | | | | |
CIFC Corporation †« | | | | | | | 253,585 | | | | 1,516,438 | |
Investment Technology Group Incorporated †« | | | | | | | 667,651 | | | | 6,810,040 | |
Knight Capital Group Incorporated Class A †« | | | | | | | 478,900 | | | | 6,292,746 | |
Westwood Holdings Group Incorporated | | | | | | | 181,712 | | | | 6,683,367 | |
| | | | |
| | | | | | | | | | | 21,302,591 | |
| | | | | | | | | | | | |
| | | | |
| Commercial Banks: 7.17% | | | | | | | | | | | | |
First Citizens BancShares Incorporated | | | | | | | 182,156 | | | | 31,567,635 | |
First Niagara Financial Group Incorporated | | | | | | | 612,850 | | | | 5,478,879 | |
UMB Financial Corporation « | | | | | | | 389,861 | | | | 18,732,821 | |
| | | | |
| | | | | | | | | | | 55,779,335 | |
| | | | | | | | | | | | |
| | | | |
| Consumer Finance: 0.12% | | | | | | | | | | | | |
Regional Management Corporation †« | | | | | | | 52,915 | | | | 894,793 | |
| | | | | | | | | | | | |
| | | | |
| Insurance: 5.39% | | | | | | | | | | | | |
Brown & Brown Incorporated | | | | | | | 276,300 | | | | 7,451,811 | |
Endurance Specialty Holdings Limited | | | | | | | 255,400 | | | | 10,261,972 | |
Fortegra Financial Corporation † | | | | | | | 294,330 | | | | 2,442,939 | |
Platinum Underwriters Holdings Limited « | | | | | | | 150,700 | | | | 5,518,634 | |
Stewart Information Services Corporation | | | | | | | 682,874 | | | | 10,051,905 | |
Validus Holdings Limited | | | | | | | 190,761 | | | | 6,199,733 | |
| | | | |
| | | | | | | | | | | 41,926,994 | |
| | | | | | | | | | | | |
The accompanying notes are an integral part of these financial statements.
| | | | |
| 10 | | Wells Fargo Advantage Special Small Cap Value Fund | | Portfolio of Investments—April 30, 2012 (Unaudited) |
| | | | | | | | | | | | |
| Security Name | | | | | | Shares | | | Value | |
| | | | | | | | | | | | |
| | | | |
| Thrifts & Mortgage Finance: 0.48% | | | | | | | | | | | | |
Provident New York Bancorp | | | | | | | 444,416 | | | $ | 3,750,871 | |
| | | | | | | | | | | | |
| | | | |
Health Care: 8.74% | | | | | | | | | | | | |
| | | | |
| Biotechnology: 0.28% | | | | | | | | | | | | |
Myriad Genetics Incorporated † | | | | | | | 85,300 | | | | 2,218,653 | |
| | | | | | | | | | | | |
| | | | |
| Health Care Equipment & Supplies: 4.53% | | | | | | | | | | | | |
Align Technology Incorporated † | | | | | | | 49,700 | | | | 1,575,987 | |
ArthroCare Corporation † | | | | | | | 112,800 | | | | 2,815,488 | |
Haemonetics Corporation †« | | | | | | | 114,200 | | | | 8,173,294 | |
Hill-Rom Holdings Incorporated | | | | | | | 203,200 | | | | 6,593,840 | |
ICU Medical Incorporated †« | | | | | | | 103,303 | | | | 5,422,374 | |
Steris Corporation « | | | | | | | 127,000 | | | | 3,989,070 | |
West Pharmaceutical Services Incorporated « | | | | | | | 147,800 | | | | 6,636,220 | |
| | | | |
| | | | | | | | | | | 35,206,273 | |
| | | | | | | | | | | | |
| | | | |
| Health Care Providers & Services: 1.30% | | | | | | | | | | | | |
AMN Healthcare Services Incorporated † | | | | | | | 58,601 | | | | 393,213 | |
Hanger Orthopedic Group Incorporated †« | | | | | | | 94,000 | | | | 2,213,700 | |
Owens & Minor Incorporated « | | | | | | | 95,000 | | | | 2,777,800 | |
Patterson Companies Incorporated | | | | | | | 138,800 | | | | 4,731,692 | |
| | | | |
| | | | | | | | | | | 10,116,405 | |
| | | | | | | | | | | | |
| | | | |
| Health Care Technology: 0.38% | | | | | | | | | | | | |
Omnicell Incorporated † | | | | | | | 210,200 | | | | 2,999,554 | |
| | | | | | | | | | | | |
| | | | |
| Life Sciences Tools & Services: 1.28% | | | | | | | | | | | | |
Bio-Rad Laboratories Incorporated † | | | | | | | 49,900 | | | | 5,388,701 | |
Cambrex Corporation †« | | | | | | | 704,948 | | | | 4,568,063 | |
| | | | |
| | | | | | | | | | | 9,956,764 | |
| | | | | | | | | | | | |
| | | | |
| Pharmaceuticals: 0.97% | | | | | | | | | | | | |
Impax Laboratories Incorporated † | | | | | | | 144,400 | | | | 3,556,572 | |
Lannett Company Incorporated †« | | | | | | | 516,085 | | | | 2,033,375 | |
Salix Pharmaceuticals Limited † | | | | | | | 39,200 | | | | 1,936,480 | |
| | | | |
| | | | | | | | | | | 7,526,427 | |
| | | | | | | | | | | | |
| | | | |
Industrials: 16.29% | | | | | | | | | | | | |
| | | | |
| Aerospace & Defense: 0.18% | | | | | | | | | | | | |
Ceradyne Incorporated | | | | | | | 55,900 | | | | 1,415,388 | |
| | | | | | | | | | | | |
| | | | |
| Air Freight & Logistics: 0.71% | | | | | | | | | | | | |
Forward Air Corporation « | | | | | | | 162,700 | | | | 5,496,006 | |
| | | | | | | | | | | | |
| | | | |
| Building Products: 3.56% | | | | | | | | | | | | |
Quanex Building Products Corporation | | | | | | | 859,042 | | | | 15,832,144 | |
Simpson Manufacturing Company Incorporated « | | | | | | | 381,400 | | | | 11,834,842 | |
| | | | |
| | | | | | | | | | | 27,666,986 | |
| | | | | | | | | | | | |
The accompanying notes are an integral part of these financial statements.
| | | | | | |
| Portfolio of Investments—April 30, 2012 (Unaudited) | | Wells Fargo Advantage Special Small Cap Value Fund | | | 11 | |
| | | | | | | | | | | | |
| Security Name | | | | | | Shares | | | Value | |
| | | | | | | | | | | | |
| | | | |
| Commercial Services & Supplies: 3.21% | | | | | | | | | | | | |
ACCO Brands Corporation † | | | | | | | 140,063 | | | $ | 1,477,665 | |
Courier Corporation | | | | | | | 428,199 | | | | 4,397,604 | |
FTI Consulting Incorporated † | | | | | | | 86,600 | | | | 3,147,044 | |
Quad Graphics Incorporated « | | | | | | | 66,800 | | | | 897,792 | |
Sykes Enterprises Incorporated † | | | | | | | 370,900 | | | | 5,878,765 | |
Viad Corporation « | | | | | | | 507,944 | | | | 9,183,628 | |
| | | | |
| | | | | | | | | | | 24,982,498 | |
| | | | | | | | | | | | |
| | | | |
| Electrical Equipment: 1.75% | | | | | | | | | | | | |
EnerSys Incorporated †« | | | | | | | 45,400 | | | | 1,586,730 | |
Franklin Electric Company Incorporated « | | | | | | | 174,491 | | | | 8,750,724 | |
Polypore International Incorporated †« | | | | | | | 87,400 | | | | 3,264,390 | |
| | | | |
| | | | | | | | | | | 13,601,844 | |
| | | | | | | | | | | | |
| | | | |
| Machinery: 4.70% | | | | | | | | | | | | |
Commercial Vehicle Group Incorporated † | | | | | | | 367,770 | | | | 3,913,073 | |
Douglas Dynamics Incorporated | | | | | | | 288,648 | | | | 4,078,596 | |
John Bean Technologies Corporation | | | | | | | 210,100 | | | | 3,359,499 | |
Kadant Incorporated †** | | | | | | | 973,429 | | | | 25,182,608 | |
| | | | |
| | | | | | | | | | | 36,533,776 | |
| | | | | | | | | | | | |
| | | | |
| Professional Services: 1.64% | | | | | | | | | | | | |
Heidrick & Struggles International Incorporated | | | | | | | 456,600 | | | | 8,903,700 | |
Korn/Ferry International †« | | | | | | | 238,400 | | | | 3,850,160 | |
| | | | |
| | | | | | | | | | | 12,753,860 | |
| | | | | | | | | | | | |
| | | | |
| Road & Rail: 0.54% | | | | | | | | | | | | |
Arkansas Best Corporation | | | | | | | 275,128 | | | | 4,220,464 | |
| | | | | | | | | | | | |
| | | | |
Information Technology: 18.62% | | | | | | | | | | | | |
| | | | |
| Communications Equipment: 1.17% | | | | | | | | | | | | |
Aviat Networks Incorporated † | | | | | | | 674,847 | | | | 1,720,860 | |
Black Box Corporation | | | | | | | 183,300 | | | | 4,144,413 | |
Ixia Corporation †« | | | | | | | 259,700 | | | | 3,272,220 | |
| | | | |
| | | | | | | | | | | 9,137,493 | |
| | | | | | | | | | | | |
| | | | |
| Computers & Peripherals: 2.41% | | | | | | | | | | | | |
Imation Corporation †** | | | | | | | 2,684,821 | | | | 15,571,962 | |
Quantum Corporation †« | | | | | | | 1,334,345 | | | | 3,175,741 | |
| | | | |
| | | | | | | | | | | 18,747,703 | |
| | | | | | | | | | | | |
| | | | |
| Electronic Equipment, Instruments & Components: 4.39% | | | | | | | | | | | | |
AVX Corporation | | | | | | | 824,548 | | | | 10,471,760 | |
Benchmark Electronics Incorporated † | | | | | | | 107,527 | | | | 1,707,529 | |
Celestica Incorporated † | | | | | | | 233,200 | | | | 2,089,472 | |
Orbotech Limited † | | | | | | | 852,088 | | | | 9,304,801 | |
Pulse Electronics Corporation « | | | | | | | 1,198,438 | | | | 2,456,798 | |
Vishay Intertechnology Incorporated †« | | | | | | | 723,200 | | | | 8,114,304 | |
| | | | |
| | | | | | | | | | | 34,144,664 | |
| | | | | | | | | | | | |
The accompanying notes are an integral part of these financial statements.
| | | | |
| 12 | | Wells Fargo Advantage Special Small Cap Value Fund | | Portfolio of Investments—April 30, 2012 (Unaudited) |
| | | | | | | | | | | | |
| Security Name | | | | | | Shares | | | Value | |
| | | | | | | | | | | | |
| | | | |
| Internet Software & Services: 1.97% | | | | | | | | | | | | |
Ancestry.com Incorporated † | | | | | | | 56,900 | | | $ | 1,519,230 | |
EarthLink Incorporated | | | | | | | 1,698,000 | | | | 13,787,760 | |
| | | | |
| | | | | | | | | | | 15,306,990 | |
| | | | | | | | | | | | |
| | | | |
| IT Services: 0.79% | | | | | | | | | | | | |
Global Payments Incorporated | | | | | | | 76,000 | | | | 3,528,680 | |
TNS Incorporated † | | | | | | | 127,974 | | | | 2,610,670 | |
| | | | |
| | | | | | | | | | | 6,139,350 | |
| | | | | | | | | | | | |
| | | | |
| Semiconductors & Semiconductor Equipment: 4.87% | | | | | | | | | | | | |
Advanced Energy Industries Incorporated † | | | | | | | 172,000 | | | | 2,053,680 | |
ATMI Incorporated † | | | | | | | 630,145 | | | | 13,239,346 | |
DSP Group Incorporated † | | | | | | | 804,564 | | | | 5,261,849 | |
Exar Corporation † | | | | | | | 647,616 | | | | 5,129,119 | |
Lattice Semiconductor Corporation † | | | | | | | 1,073,881 | | | | 5,863,390 | |
MEMC Electronic Materials Incorporated †« | | | | | | | 601,800 | | | | 2,160,462 | |
Standard Microsystems Corporation † | | | | | | | 155,966 | | | | 4,129,980 | |
| | | | |
| | | | | | | | | | | 37,837,826 | |
| | | | | | | | | | | | |
| | | | |
| Software: 3.02% | | | | | | | | | | | | |
ACI Worldwide Incorporated † | | | | | | | 335,832 | | | | 13,386,264 | |
JDA Software Group Incorporated †« | | | | | | | 151,900 | | | | 4,386,872 | |
Netscout Systems Incorporated † | | | | | | | 109,000 | | | | 2,255,210 | |
Progress Software Corporation †« | | | | | | | 149,100 | | | | 3,450,174 | |
| | | | |
| | | | | | | | | | | 23,478,520 | |
| | | | | | | | | | | | |
| | | | |
Materials: 7.11% | | | | | | | | | | | | |
| | | | |
| Chemicals: 1.32% | | | | | | | | | | | | |
A. Schulman Incorporated | | | | | | | 363,405 | | | | 8,943,397 | |
American Pacific Corporation † | | | | | | | 168,333 | | | | 1,316,364 | |
| | | | |
| | | | | | | | | | | 10,259,761 | |
| | | | | | | | | | | | |
| | | | |
| Containers & Packaging: 0.13% | | | | | | | | | | | | |
Plastec Technologies Limited †«(a)(i) | | | | | | | 173,600 | | | | 963,480 | |
| | | | | | | | | | | | |
| | | | |
| Metals & Mining: 1.64% | | | | | | | | | | | | |
Aurizon Mines Limited † | | | | | | | 835,260 | | | | 4,518,757 | |
Royal Gold Incorporated | | | | | | | 133,098 | | | | 8,246,752 | |
| | | | |
| | | | | | | | | | | 12,765,509 | |
| | | | | | | | | | | | |
| | | | |
| Paper & Forest Products: 4.02% | | | | | | | | | | | | |
Clearwater Paper Corporation † | | | | | | | 183,594 | | | | 6,053,094 | |
Glatfelter Corporation « | | | | | | | 239,280 | | | | 3,727,982 | |
Neenah Paper Incorporated | | | | | | | 410,468 | | | | 11,722,966 | |
Schweitzer Manduit International Incorporated | | | | | | | 98,812 | | | | 6,701,430 | |
Wausau Paper Corporation « | | | | | | | 340,100 | | | | 3,081,306 | |
| | | | |
| | | | | | | | | | | 31,286,778 | |
| | | | | | | | | | | | |
The accompanying notes are an integral part of these financial statements.
| | | | | | |
| Portfolio of Investments—April 30, 2012 (Unaudited) | | Wells Fargo Advantage Special Small Cap Value Fund | | | 13 | |
| | | | | | | | | | | | | | | | |
| Security Name | | | | | | | | Shares | | | Value | |
| | | | | | | | | | | | | | | | |
| | | | |
Utilities: 2.33% | | | | | | | | | | | | | | | | |
| | | | |
| Electric Utilities: 2.33% | | | | | | | | | | | | | | | | |
ALLETE Incorporated | | | | | | | | | | | 440,252 | | | $ | 18,142,785 | |
| | | | | | | | | | | | | | | | |
| | | | |
Total Common Stocks (Cost $728,176,921) | | | | | | | | | | | | | | | 718,716,512 | |
| | | | | | | | | | | | | | | | |
| | | | |
| | | | | | Expiration Date | | | | | | | |
| Warrants: 0.00% | | | | | | | | | | | | | | | | |
| | | | |
Materials: 0.00% | | | | | | | | | | | | | | | | |
| | | | |
| Containers & Packaging: 0.00% | | | | | | | | | | | | | | | | |
Plastec Technologies Limited †(a)(i) | | | | | | | 11/14/2018 | | | | 145,800 | | | | 17,496 | |
| | | | | | | | | | | | | | | | |
| | | | |
Total Warrants (Cost $0) | | | | | | | | | | | | | | | 17,496 | |
| | | | | | | | | | | | | | | | |
| | | | |
| | | | | | | | | Principal | | | | |
| | | | |
Other: 0.31% | | | | | | | | | | | | | | | | |
Gryphon Funding Limited, Pass-Through Entity (a)(i) | | | | | | | | | | $ | 8,595,811 | | | | 2,406,827 | |
| | | | | | | | | | | | | | | | |
| | | | |
Total Other (Cost $3,681,033) | | | | | | | | | | | | | | | 2,406,827 | |
| | | | | | | | | | | | | | | | |
| | | | |
| | | Yield | | | | | | Shares | | | | |
| Short-Term Investments: 17.62% | | | | | | | | | | | | | | | | |
| | | | |
| Investment Companies: 17.62% | | | | | | | | | | | | | | | | |
Wells Fargo Advantage Cash Investment Money Market Fund, Select Class (l)(u) | | | 0.11 | % | | | | | | | 46,967,272 | | | | 46,967,272 | |
Wells Fargo Securities Lending Cash Investments, LLC (l)(u)(r)(v) | | | 0.19 | | | | | | | | 90,027,688 | | | | 90,027,688 | |
| | | | | | | | | | | | | | | | |
| | | | |
Total Short-Term Investments (Cost $136,994,960) | | | | | | | | | | | | | | | 136,994,960 | |
| | | | | | | | | | | | | | | | |
| | | | | | | | |
| Total Investments in Securities | | | | | | | | |
| (Cost $868,852,914)* | | | 110.34 | % | | | 858,135,795 | |
Other Assets and Liabilities, Net | | | (10.34 | ) | | | (80,427,098 | ) |
| | | | | | | | |
| Total Net Assets | | | 100.00 | % | | $ | 777,708,697 | |
| | | | | | | | |
| † | Non-income earning security |
| « | All or a portion of this security is on loan. |
| ** | Represents an affiliate of the Fund under Section 2(a)(2) and 2(a)(3) of the Investment Company Act of 1940, as Fund holds 5% or more of the issuer’s outstanding voting shares. |
| (l) | Investment in an affiliate |
| (a) | Security is fair valued by the Management Valuation Team, and in certain instances by the Board of Trustees, in accordance with procedures approved by the Board of Trustees. |
| (u) | Rate shown is the 7-day annualized yield at period end. |
| (r) | The investment company is exempt from registration under Section 3(c)(7) of the 1940 Act. |
| (v) | Security represents investment of cash collateral received from securities on loan. |
| * | Cost for federal income tax purposes is $885,149,763 and net unrealized appreciation (depreciation) consists of: |
| | | | |
Gross unrealized appreciation | | $ | 111,841,696 | |
Gross unrealized depreciation | | | (138,855,664 | ) |
| | | | |
Net unrealized depreciation | | $ | (27,013,968 | ) |
The accompanying notes are an integral part of these financial statements.
| | | | |
| 14 | | Wells Fargo Advantage Special Small Cap Value Fund | | Statement of Assets and Liabilities—April 30, 2012 (Unaudited) |
| | | | |
| | | | |
| |
Assets | | | | |
Investments | | | | |
In unaffiliated securities (including securities on loan), at value (see cost below) | | $ | 664,275,409 | |
In affiliated securities, at value (see cost below) | | | 193,860,386 | |
| | | | |
Total investments, at value (see cost below) | | | 858,135,795 | |
Receivable for investments sold | | | 10,813,631 | |
Receivable for Fund shares sold | | | 2,020,073 | |
Receivable for dividends and interest | | | 177,095 | |
Receivable for securities lending income | | | 30,791 | |
Prepaid expenses and other assets | | | 87,458 | |
| | | | |
Total assets | | | 871,264,843 | |
| | | | |
| |
Liabilities | | | | |
Payable for investments purchased | | | 1,754,883 | |
Payable for Fund shares redeemed | | | 699,712 | |
Payable upon receipt of securities loaned | | | 90,027,688 | |
Advisory fee payable | | | 480,843 | |
Distribution fees payable | | | 34,106 | |
Due to other related parties | | | 160,644 | |
Accrued expenses and other liabilities | | | 398,270 | |
| | | | |
Total liabilities | | | 93,556,146 | |
| | | | |
Total net assets | | $ | 777,708,697 | |
| | | | |
| |
NET ASSETS CONSIST OF | | | | |
Paid-in capital | | $ | 854,281,953 | |
Undistributed net investment loss | | | (956,426 | ) |
Accumulated net realized losses on investments | | | (64,899,711 | ) |
Net unrealized losses on investments | | | (10,717,119 | ) |
| | | | |
Total net assets | | $ | 777,708,697 | |
| | | | |
| |
COMPUTATION OF NET ASSET VALUE AND OFFERING PRICE PER SHARE1 | | | | |
Net assets – Class A | | $ | 405,021,823 | |
Shares outstanding – Class A | | | 17,121,460 | |
Net asset value per share – Class A | | | $23.66 | |
Maximum offering price per share – Class A2 | | | $25.10 | |
Net assets – Class B | | $ | 15,355,321 | |
Shares outstanding – Class B | | | 688,244 | |
Net asset value per share – Class B | | | $22.31 | |
Net assets – Class C | | $ | 37,226,547 | |
Shares outstanding – Class C | | | 1,662,632 | |
Net asset value per share – Class C | | | $22.39 | |
Net assets – Administrator Class | | $ | 259,195,232 | |
Shares outstanding – Administrator Class | | | 10,822,049 | |
Net asset value per share – Administrator Class | | | $23.95 | |
Net assets – Institutional Class | | $ | 60,909,774 | |
Shares outstanding – Institutional Class | | | 2,536,852 | |
Net asset value per share – Institutional Class | | | $24.01 | |
| |
Investments in unaffiliated securities, at cost | | $ | 622,225,900 | |
| | | | |
Investments in affiliated securities, at cost | | $ | 246,627,014 | |
| | | | |
Total investments, at cost | | $ | 868,852,914 | |
| | | | |
Securities on loan, at value | | $ | 87,357,517 | |
| | | | |
| 1. | The Fund has an unlimited number of authorized shares. |
| 2. | Maximum offering price is computed as 100/94.25 of net asset value. On investments of $50,000 or more, the offering price is reduced. |
The accompanying notes are an integral part of these financial statements.
| | | | | | |
| Statement of Operations—Six Months Ended April 30, 2012 (Unaudited) | | Wells Fargo Advantage Special Small Cap Value Fund | | | 15 | |
| | | | |
| | | | |
| |
Investment income | | | | |
Dividends | | $ | 4,088,809 | |
Income from affiliated securities | | | 144,345 | |
Securities lending income, net | | | 105,307 | |
Interest | | | 20,194 | |
| | | | |
Total investment income | | | 4,358,655 | |
| | | | |
| |
Expenses | | | | |
Advisory fee | | | 3,007,629 | |
Administration fees | | | | |
Fund level | | | 190,030 | |
Class A | | | 515,291 | |
Class B | | | 24,452 | |
Class C | | | 46,203 | |
Administrator Class | | | 128,740 | |
Institutional Class | | | 20,765 | |
Shareholder servicing fees | | | | |
Class A | | | 495,472 | |
Class B | | | 23,512 | |
Class C | | | 44,426 | |
Administrator Class | | | 321,850 | |
Distribution fees | | | | |
Class B | | | 70,535 | |
Class C | | | 133,278 | |
Custody and accounting fees | | | 29,828 | |
Professional fees | | | 9,830 | |
Registration fees | | | 4,381 | |
Shareholder report expenses | | | 14,327 | |
Trustees’ fees and expenses | | | 6,022 | |
Other fees and expenses | | | 13,145 | |
| | | | |
Total expenses | | | 5,099,716 | |
Less: Fee waivers and/or expense reimbursements | | | (228,852 | ) |
| | | | |
Net expenses | | | 4,870,864 | |
| | | | |
Net investment loss | | | (512,209 | ) |
| | | | |
| |
REALIZED AND UNREALIZED GAINS (LOSSES) ON INVESTMENTS | | | | |
| |
Net realized gains (losses) on: | | | | |
Unaffiliated securities | | | 25,628,853 | |
Affiliated securities | | | (2,384,832 | ) |
| | | | |
Net realized gains on investments | | | 23,244,021 | |
| | | | |
| |
Net change in unrealized gains (losses) on: | | | | |
Unaffiliated securities | | | 45,059,925 | |
Affiliated securities | | | 23,951,123 | |
| | | | |
Net change in unrealized gains (losses) on investments | | | 69,011,048 | |
| | | | |
Net realized and unrealized gains (losses) on investments | | | 92,255,069 | |
| | | | |
Net increase in net assets resulting from operations | | $ | 91,742,860 | |
| | | | |
The accompanying notes are an integral part of these financial statements.
| | | | |
| 16 | | Wells Fargo Advantage Special Small Cap Value Fund | | Statements of Changes in Net Assets |
| | | | | | | | | | | | | | | | |
| | | Six Months Ended
April 30, 2012
(Unaudited) | | | Year Ended
October 31, 2011 | |
| | | | |
Operations | | | | | | | | | | | | | | | | |
Net investment loss | | | | | | $ | (512,209 | ) | | | | | | $ | (888,304 | ) |
Net realized gains on investments | | | | | | | 23,244,021 | | | | | | | | 72,400,422 | |
Net change in unrealized gains (losses) on investments | | | | | | | 69,011,048 | | | | | | | | (13,246,194 | ) |
| | | | | | | | | | | | | | | | |
Net increase in net assets resulting from operations | | | | | | | 91,742,860 | | | | | | | | 58,265,924 | |
| | | | | | | | | | | | | | | | |
| | | | |
Capital share transactions | | | Shares | | | | | | | | Shares | | | | | |
Proceeds from shares sold | | | | | | | | | | | | | | | | |
Class A | | | 1,323,966 | | | | 29,793,457 | | | | 2,491,122 | | | | 53,417,324 | |
Class B | | | 11,431 | | | | 255,657 | | | | 6,084 | | | | 126,147 | |
Class C | | | 107,717 | | | | 2,316,763 | | | | 89,582 | | | | 1,863,376 | |
Administrator Class | | | 644,656 | | | | 14,697,362 | | | | 1,967,015 | | | | 42,154,527 | |
Institutional Class | | | 1,451,735 | | | | 31,479,598 | | | | 1,299,817 | | | | 27,596,502 | |
| | | | | | | | | | | | | | | | |
| | | | | | | 78,542,837 | | | | | | | | 125,157,876 | |
| | | | | | | | | | | | | | | | |
Payment for shares redeemed | | | | | | | | | | | | | | | | |
Class A | | | (2,692,264 | ) | | | (60,163,213 | ) | | | (8,117,034 | ) | | | (173,620,347 | ) |
Class B | | | (433,949 | ) | | | (9,240,402 | ) | | | (852,090 | ) | | | (17,395,017 | ) |
Class C | | | (165,146 | ) | | | (3,502,779 | ) | | | (526,844 | ) | | | (10,616,983 | ) |
Administrator Class | | | (2,719,585 | ) | | | (60,022,791 | ) | | | (5,896,156 | ) | | | (126,963,950 | ) |
Institutional Class | | | (196,187 | ) | | | (4,464,529 | ) | | | (174,116 | ) | | | (3,733,072 | ) |
| | | | | | | | | | | | | | | | |
| | | | | | | (137,393,714 | ) | | | | | | | (332,329,369 | ) |
| | | | | | | | | | | | | | | | |
Net decrease in net assets resulting from capital share transactions | | | | | | | (58,850,877 | ) | | | | | | | (207,171,493 | ) |
| | | | | | | | | | | | | | | | |
Total increase (decrease) in net assets | | | | | | | 32,891,983 | | | | | | | | (148,905,569 | ) |
| | | | | | | | | | | | | | | | |
| | | | |
Net assets | | | | | | | | | | | | | | | | |
Beginning of period | | | | | | | 744,816,714 | | | | | | | | 893,722,283 | |
| | | | | | | | | | | | | | | | |
End of period | | | | | | $ | 777,708,697 | | | | | | | $ | 744,816,714 | |
| | | | | | | | | | | | | | | | |
Undistributed net investment loss | | | | | | $ | (956,426 | ) | | | | | | $ | (444,217 | ) |
| | | | | | | | | | | | | | | | |
The accompanying notes are an integral part of these financial statements.
| | | | | | |
| Financial Highlights | | Wells Fargo Advantage Special Small Cap Value Fund | | | 17 | |
(For a share outstanding throughout each period)
| | | | | | | | | | | | | | | | | | | | | | | | | | | | |
| | | Six Months Ended
April 30, 2012 (Unaudited) | | | Year Ended October 31 | | | Year Ended July 31, | |
| Class A | | | 2011 | | | 20101 | | | 20102 | | | 20092 | | | 20082 | | | 20072 | |
Net asset value, beginning of period | | $ | 20.97 | | | $ | 19.78 | | | $ | 18.50 | | | $ | 15.51 | | | $ | 18.78 | | | $ | 27.25 | | | $ | 28.55 | |
Net investment income (loss) | | | (0.03 | ) | | | (0.05 | ) | | | (0.01 | ) | | | (0.02 | ) | | | 0.11 | | | | 0.15 | | | | 0.30 | |
Net realized and unrealized gains (losses) on investments | | | 2.72 | | | | 1.24 | | | | 1.29 | | | | 3.07 | | | | (3.19 | ) | | | (3.83 | ) | | | 3.43 | |
| | | | | | | | | | | | | | | | | | | | | | | | | | | | |
Total from investment operations | | | 2.69 | | | | 1.19 | | | | 1.28 | | | | 3.05 | | | | (3.08 | ) | | | (3.68 | ) | | | 3.73 | |
Distributions to shareholders from | | | | | | | | | | | | | | | | | | | | | | | | | | | | |
Net investment income | | | 0.00 | | | | 0.00 | | | | 0.00 | | | | (0.01 | ) | | | (0.19 | ) | | | (0.27 | ) | | | (0.10 | ) |
Net realized gains | | | 0.00 | | | | 0.00 | | | | 0.00 | | | | 0.00 | | | | (0.00 | )4 | | | (4.52 | ) | | | (4.93 | ) |
Tax basis return of capital | | | 0.00 | | | | 0.00 | | | | 0.00 | | | | (0.05 | )3 | | | 0.00 | | | | 0.00 | | | | 0.00 | |
| | | | | | | | | | | | | | | | | | | | | | | | | | | | |
Total distributions to shareholders | | | 0.00 | | | | 0.00 | | | | 0.00 | | | | (0.06 | ) | | | (0.19 | ) | | | (4.79 | ) | | | (5.03 | ) |
Net asset value, end of period | | $ | 23.66 | | | $ | 20.97 | | | $ | 19.78 | | | $ | 18.50 | | | $ | 15.51 | | | $ | 18.78 | | | $ | 27.25 | |
Total return5 | | | 12.83 | % | | | 6.02 | % | | | 6.92 | % | | | 19.72 | % | | | (16.17 | )% | | | (15.22 | )% | | | 13.30 | % |
Ratios to average net assets (annualized) | | | | | | | | | | | | | | | | | | | | | | | | | | | | |
Gross expenses | | | 1.37 | % | | | 1.37 | % | | | 1.46 | % | | | 1.43 | % | | | 1.43 | % | | | 1.36 | % | | | 1.32 | % |
Net expenses | | | 1.34 | % | | | 1.34 | % | | | 1.34 | % | | | 1.39 | % | | | 1.33 | % | | | 1.31 | % | | | 1.31 | % |
Net investment income (loss) | | | (0.19 | )% | | | (0.14 | )% | | | (0.19 | )% | | | (0.07 | )% | | | 0.69 | % | | | 0.73 | % | | | 1.07 | % |
Supplemental data | | | | | | | | | | | | | | | | | | | | | | | | | | | | |
Portfolio turnover rate | | | 32 | % | | | 54 | % | | | 7 | % | | | 45 | % | | | 43 | % | | | 48 | % | | | 45 | % |
Net assets, end of period (000’s omitted) | | | $405,022 | | | | $387,767 | | | | $477,079 | | | | $472,903 | | | | $442,973 | | | | $598,656 | | | | $959,305 | |
| 1. | For the three months ended October 31, 2010. The Fund changed its fiscal year end from July 31 to October 31, effective October 31, 2010. |
| 2. | After the close of business on July 16, 2010, the Fund acquired the net assets of Evergreen Special Values Fund and Evergreen Small Cap Value Fund. Evergreen Special Values Fund became the accounting and performance survivor in the transaction. The information for the periods prior to July 19, 2010 is that of Class A of Evergreen Special Values Fund. |
| 3. | Calculated based upon average shares outstanding |
| 4. | Amount is less than $0.005. |
| 5. | Total return calculations do not include any sales charges. Returns for periods of less than one year are not annualized. |
The accompanying notes are an integral part of these financial statements.
| | | | |
| 18 | | Wells Fargo Advantage Special Small Cap Value Fund | | Financial Highlights |
(For a share outstanding throughout each period)
| | | | | | | | | | | | | | | | | | | | | | | | | | | | |
| Class B | | Six Months Ended
April 30, 2012 (Unaudited) | | | Year Ended October 31, | | | Year Ended July 31, | |
| | | 2011 | | | 20101 | | | 20102 | | | 20092 | | | 20082 | | | 20072 | |
Net asset value, beginning of period | | $ | 19.85 | | | $ | 18.87 | | | $ | 17.68 | | | $ | 14.88 | | | $ | 17.92 | | | $ | 26.17 | | | $ | 27.69 | |
Net investment income (loss) | | | (0.10 | )3 | | | (0.18 | )3 | | | (0.08 | ) | | | (0.14 | )3 | | | 0.00 | 3,4 | | | (0.00 | )3 | | | 0.08 | |
Net realized and unrealized gains (losses) on
investments | | | 2.56 | | | | 1.16 | | | | 1.27 | | | | 2.94 | | | | (3.02 | ) | | | (3.67 | ) | | | 3.33 | |
| | | | | | | | | | | | | | | | | | | | | | | | | | | | |
Total from investment operations | | | 2.46 | | | | 0.98 | | | | 1.19 | | | | 2.80 | | | | (3.02 | ) | | | (3.67 | ) | | | 3.41 | |
Distributions to shareholders from | | | | | | | | | | | | | | | | | | | | | | | | | | | | |
Net investment income | | | 0.00 | | | | 0.00 | | | | 0.00 | | | | 0.00 | | | | (0.02 | ) | | | (0.06 | ) | | | 0.00 | |
Net realized gains | | | 0.00 | | | | 0.00 | | | | 0.00 | | | | 0.00 | | | | (0.00 | )4 | | | (4.52 | ) | | | (4.93 | ) |
| | | | | | | | | | | | | | | | | | | | | | | | | | | | |
Total distributions to shareholders | | | 0.00 | | | | 0.00 | | | | 0.00 | | | | 0.00 | | | | (0.02 | ) | | | (4.58 | ) | | | (4.93 | ) |
Net asset value, end of period | | $ | 22.31 | | | $ | 19.85 | | | $ | 18.87 | | | $ | 17.68 | | | $ | 14.88 | | | $ | 17.92 | | | $ | 26.17 | |
Total return5 | | | 12.39 | % | | | 5.19 | % | | | 6.73 | % | | | 18.82 | % | | | (16.83 | )% | | | (15.80 | )% | | | 12.46 | % |
Ratios to average net assets (annualized) | | | | | | | | | | | | | | | | | | | | | | | | | | | | |
Gross expenses | | | 2.12 | % | | | 2.13 | % | | | 2.21 | % | | | 2.18 | % | | | 2.17 | % | | | 2.11 | % | | | 2.07 | % |
Net expenses | | | 2.09 | % | | | 2.09 | % | | | 2.09 | % | | | 2.15 | % | | | 2.07 | % | | | 2.06 | % | | | 2.06 | % |
Net investment income (loss) | | | (0.91 | )% | | | (0.88 | )% | | | (0.93 | )% | | | (0.82 | )% | | | 0.01 | % | | | (0.02 | )% | | | 0.30 | % |
Supplemental data | | | | | | | | | | | | | | | | | | | | | | | | | | | | |
Portfolio turnover rate | | | 32 | % | | | 54 | % | | | 7 | % | | | 45 | % | | | 43 | % | | | 48 | % | | | 45 | % |
Net assets, end of period (000’s omitted) | | | $15,355 | | | | $22,053 | | | | $36,922 | | | | $36,654 | | | | $41,008 | | | | $91,409 | | | | $163,723 | |
| 1. | For the three months ended October 31, 2010. The Fund changed its fiscal year end from July 31 to October 31, effective October 31, 2010. |
| 2. | After the close of business on July 16, 2010, the Fund acquired the net assets of Evergreen Special Values Fund and Evergreen Small Cap Value Fund. Evergreen Special Values Fund became the accounting and performance survivor in the transaction. The information for the periods prior to July 19, 2010 is that of Class B of Evergreen Special Values Fund. |
| 3. | Calculated based upon average shares outstanding |
| 4. | Amount is less than $0.005. |
| 5. | Total return calculations do not include any sales charges. Returns for periods of less than one year are not annualized. |
The accompanying notes are an integral part of these financial statements.
| | | | | | |
| Financial Highlights | | Wells Fargo Advantage Special Small Cap Value Fund | | | 19 | |
(For a share outstanding throughout each period)
| | | | | | | | | | | | | | | | | | | | | | | | | | | | |
| Class C | | Six Months Ended
April 30, 2012 (Unaudited) | | | Year Ended October 31, | | | Year Ended July 31, | |
| | | 2011 | | | 20101 | | | 20102 | | | 20092 | | | 20082 | | | 20072 | |
Net asset value, beginning of period | | $ | 19.92 | | | $ | 18.94 | | | $ | 17.74 | | | $ | 14.93 | | | $ | 17.98 | | | $ | 26.24 | | | $ | 27.75 | |
Net investment income (loss) | | | (0.10 | )3 | | | (0.18 | )3 | | | (0.07 | ) | | | (0.18 | ) | | | (0.00 | )3 | | | (0.00 | )3 | | | 0.09 | |
Net realized and unrealized gains (losses) on
investments | | | 2.57 | | | | 1.16 | | | | 1.27 | | | | 2.99 | | | | (3.03 | ) | | | (3.69 | ) | | | 3.33 | |
| | | | | | | | | | | | | | | | | | | | | | | | | | | | |
Total from investment operations | | | 2.47 | | | | 0.98 | | | | 1.20 | | | | 2.81 | | | | (3.03 | ) | | | (3.69 | ) | | | 3.42 | |
Distributions to shareholders from | | | | | | | | | | | | | | | | | | | | | | | | | | | | |
Net investment income | | | 0.00 | | | | 0.00 | | | | 0.00 | | | | 0.00 | | | | (0.02 | ) | | | (0.05 | ) | | | 0.00 | |
Net realized gains | | | 0.00 | | | | 0.00 | | | | 0.00 | | | | 0.00 | | | | (0.00 | )4 | | | (4.52 | ) | | | (4.93 | ) |
| | | | | | | | | | | | | | | | | | | | | | | | | | | | |
Total distributions to shareholders | | | 0.00 | | | | 0.00 | | | | 0.00 | | | | 0.00 | | | | (0.02 | ) | | | (4.57 | ) | | | (4.93 | ) |
Net asset value, end of period | | $ | 22.39 | | | $ | 19.92 | | | $ | 18.94 | | | $ | 17.74 | | | $ | 14.93 | | | $ | 17.98 | | | $ | 26.24 | |
Total return5 | | | 12.40 | % | | | 5.17 | % | | | 6.76 | % | | | 18.82 | % | | | (16.79 | )% | | | (15.86 | )% | | | 12.48 | % |
Ratios to average net assets (annualized) | | | | | | | | | | | | | | | | | | | | | | | | | | | | |
Gross expenses | | | 2.12 | % | | | 2.13 | % | | | 2.21 | % | | | 2.18 | % | | | 2.17 | % | | | 2.11 | % | | | 2.07 | % |
Net expenses | | | 2.09 | % | | | 2.09 | % | | | 2.09 | % | | | 2.12 | % | | | 2.07 | % | | | 2.06 | % | | | 2.06 | % |
Net investment income (loss) | | | (0.95 | )% | | | (0.89 | )% | | | (0.93 | )% | | | (0.80 | )% | | | (0.03 | )% | | | (0.02 | )% | | | 0.31 | % |
Supplemental data | | | | | | | | | | | | | | | | | | | | | | | | | | | | |
Portfolio turnover rate | | | 32 | % | | | 54 | % | | | 7 | % | | | 45 | % | | | 43 | % | | | 48 | % | | | 45 | % |
Net assets, end of period (000’s omitted) | | | $37,227 | | | | $34,270 | | | | $40,850 | | | | $40,968 | | | | $38,744 | | | | $61,307 | | | | $131,213 | |
| 1. | For the three months ended October 31, 2010. The Fund changed its fiscal year end from July 31 to October 31, effective October 31, 2010. |
| 2. | After the close of business on July 16, 2010, the Fund acquired the net assets of Evergreen Special Values Fund and Evergreen Small Cap Value Fund. Evergreen Special Values Fund became the accounting and performance survivor in the transaction. The information for the periods prior to July 19, 2010 is that of Class C of Evergreen Special Values Fund. |
| 3. | Calculated based upon average shares outstanding |
| 4. | Amount is less than $0.005. |
| 5. | Total return calculations do not include any sales charges. Returns for periods of less than one year are not annualized. |
The accompanying notes are an integral part of these financial statements.
| | | | |
| 20 | | Wells Fargo Advantage Special Small Cap Value Fund | | Financial Highlights |
(For a share outstanding throughout each period)
| | | | | | | | | | | | | | | | | | | | | | | | | | | | |
| Administrator Class | | Six Months Ended
April 30, 2012 (Unaudited) | | | Year Ended October 31, | | | Year Ended July 31 | |
| | | 2011 | | | 20101 | | | 20102 | | | 20092 | | | 20082 | | | 20072 | |
Net asset value, beginning of period | | $ | 21.21 | | | $ | 19.96 | | | $ | 18.65 | | | $ | 15.63 | | | $ | 18.95 | | | $ | 27.46 | | | $ | 28.73 | |
Net investment income | | | 0.01 | 3 | | | 0.02 | 3 | | | 0.01 | | | | 0.04 | 3 | | | 0.16 | | | | 0.21 | | | | 0.37 | |
Net realized and unrealized gains (losses) on investments | | | 2.73 | | | | 1.23 | | | | 1.30 | | | | 3.04 | | | | (3.23 | ) | | | (3.87 | ) | | | 3.47 | |
| | | | | | | | | | | | | | | | | | | | | | | | | | | | |
Total from investment operations | | | 2.74 | | | | 1.25 | | | | 1.31 | | | | 3.08 | | | | (3.07 | ) | | | (3.66 | ) | | | 3.84 | |
Distributions to shareholders from | | | | | | | | | | | | | | | | | | | | | | | | | | | | |
Net investment income | | | 0.00 | | | | 0.00 | | | | 0.00 | | | | (0.01 | ) | | | (0.25 | ) | | | (0.33 | ) | | | (0.18 | ) |
Net realized gains | | | 0.00 | | | | 0.00 | | | | 0.00 | | | | 0.00 | | | | (0.00 | )4 | | | (4.52 | ) | | | (4.93 | ) |
Tax basis return of capital | | | 0.00 | | | | 0.00 | | | | 0.00 | | | | (0.05 | )3 | | | 0.00 | | | | 0.00 | | | | 0.00 | |
| | | | | | | | | | | | | | | | | | | | | | | | | | | | |
Total distributions to shareholders | | | 0.00 | | | | 0.00 | | | | 0.00 | | | | (0.06 | ) | | | (0.25 | ) | | | (4.85 | ) | | | (5.11 | ) |
Net asset value, end of period | | $ | 23.95 | | | $ | 21.21 | | | $ | 19.96 | | | $ | 18.65 | | | $ | 15.63 | | | $ | 18.95 | | | $ | 27.46 | |
Total return5 | | | 12.92 | % | | | 6.26 | % | | | 7.02 | % | | | 20.02 | % | | | (15.96 | )% | | | (15.00 | )% | | | 13.62 | % |
Ratios to average net assets (annualized) | | | | | | | | | | | | | | | | | | | | | | | | | | | | |
Gross expenses | | | 1.21 | % | | | 1.22 | % | | | 1.30 | % | | | 1.17 | % | | | 1.18 | % | | | 1.11 | % | | | 1.07 | % |
Net expenses | | | 1.09 | % | | | 1.09 | % | | | 1.09 | % | | | 1.13 | % | | | 1.08 | % | | | 1.06 | % | | | 1.06 | % |
Net investment income | | | 0.07 | % | | | 0.12 | % | | | 0.05 | % | | | 0.21 | % | | | 0.95 | % | | | 0.98 | % | | | 1.32 | % |
Supplemental data | | | | | | | | | | | | | | | | | | | | | | | | | | | | |
Portfolio turnover rate | | | 32 | % | | | 54 | % | | | 7 | % | | | 45 | % | | | 43 | % | | | 48 | % | | | 45 | % |
Net assets, end of period (000’s omitted) | | | $259,195 | | | | $273,510 | | | | $335,766 | | | | $320,814 | | | | $525,865 | | | | $722,786 | | | | $1,067,452 | |
| 1. | For the three months ended October 31, 2010. The Fund changed its fiscal year end from July 31 to October 31, effective October 31, 2010. |
| 2. | After the close of business on July 16, 2010, the Fund acquired the net assets of Evergreen Special Values Fund and Evergreen Small Cap Value Fund. Evergreen Special Values Fund became the accounting and performance survivor in the transaction. The information for the periods prior to July 19, 2010 is that of Class I of Evergreen Special Values Fund. |
| 3. | Calculated based upon average shares outstanding |
| 4. | Amount is less than $0.005. |
| 5. | Returns for periods of less than one year are not annualized. |
The accompanying notes are an integral part of these financial statements.
| | | | | | |
| Financial Highlights | | Wells Fargo Advantage Special Small Cap Value Fund | | | 21 | |
(For a share outstanding throughout each period)
| | | | | | | | | | | | | | | | |
| Institutional Class | | Six Months Ended
April 30, 2012 (Unaudited) | | | Year End October 31, | | | Year Ended July 31, 20102 | |
| | | 2011 | | | 20101 | | |
Net asset value, beginning of period | | | $21.24 | | | | $19.96 | | | | $18.66 | | | | $18.66 | |
Net Investment income (loss) | | | 0.01 | 3 | | | 0.04 | | | | (0.02 | )3 | | | 0.00 | 3,4 |
Net realized and unrealized gains (losses) on investments | | | 2.76 | | | | 1.24 | | | | 1.32 | | | | 0.00 | 4 |
| | | | | | | | | | | | | | | | |
Total from investment operations | | | 2.77 | | | | 1.28 | | | | 1.30 | | | | 0.00 | 4 |
Net asset value, end of period | | | $24.01 | | | | $21.24 | | | | $19.96 | | | | $18.66 | |
Total return5 | | | 13.04 | % | | | 6.41 | % | | | 7.02 | % | | | 0.00 | % |
Ratios to average net assets (annualized) | | | | | | | | | | | | | | | | |
Gross expenses | | | 0.94 | % | | | 0.94 | % | | | 1.10 | % | | | 0.00 | %4 |
Net expenses | | | 0.94 | % | | | 0.93 | % | | | 0.94 | % | | | 0.00 | %4 |
Net investment income (loss) | | | 0.12 | % | | | 0.19 | % | | | (0.38 | )% | | | 0.00 | %4 |
Supplemental data | | | | | | | | | | | | | | | | |
Portfolio turnover rate | | | 32 | % | | | 54 | % | | | 7 | % | | | 45 | % |
Net assets, end of period (000’s omitted) | | $ | 60,910 | | | $ | 27,217 | | | $ | 3,106 | | | $ | 10 | |
| 1. | For the three months ended October 31, 2010. The Fund changed its fiscal year end from July 31 to October 31, effective October 31, 2010. |
| 2. | For the period from July 30, 2010 (commencement of class operation) to July 31, 2010. |
| 3. | Calculated based upon average shares outstanding |
| 4. | Amount is less than 0.005 of the value indicated. |
| 5. | Returns for periods of less than one year are not annualized. |
The accompanying notes are an integral part of these financial statements.
| | | | |
| 22 | | Wells Fargo Advantage Special Small Cap Value Fund | | Notes to Financial Statements (Unaudited) |
1. ORGANIZATION
Wells Fargo Funds Trust (the “Trust”), a Delaware statutory trust organized on March 10, 1999, is an open-end management investment company registered under the Investment Company Act of 1940, as amended (the “1940 Act”). These financial statements report on Wells Fargo Advantage Special Small Cap Value Fund (the “Fund”) which is a diversified series of the Trust.
2. SIGNIFICANT ACCOUNTING POLICIES
The following significant accounting policies, which are consistently followed in the preparation of the financial statements of the Fund, are in conformity with U.S. generally accepted accounting principles which require management to make estimates and assumptions that affect the reported amounts of assets and liabilities, disclosure of contingent assets and liabilities at the date of the financial statements, and the reported amounts of revenues and expenses during the reporting period. Actual results could differ from those estimates.
Securities valuation
Investments in equity securities are valued each business day as of the close of regular trading on the New York Stock Exchange, which is usually 4:00 p.m. (Eastern Time). Securities which are traded on a national or foreign securities exchange are valued at the last reported sales price, except that securities listed on The Nasdaq Stock Market, Inc. (“Nasdaq”) are valued at the Nasdaq Official Closing Price (“NOCP”), and if no NOCP is available, then at the last reported sales price. If no sales price is shown on the Nasdaq, the bid price will be used. In the absence of any sale of securities listed on the Nasdaq, and in the case of other securities (including U.S. Government obligations, but excluding debt securities maturing in 60 days or less), the price will be deemed “stale” and the valuations will be determined in accordance with the Fund’s Fair Value Procedures.
Investments in open-end mutual funds and non-registered investment companies are generally valued at net asset value.
Investments which are not valued using any of the methods discussed above, are valued at their fair value, as determined by procedures established in good faith and approved by the Board of Trustees. The Board of Trustees has established a Valuation Committee comprised of the Trustees and has delegated to it the authority to take any actions regarding the valuation of portfolio securities that the Valuation Committee deems necessary in determining the fair value of portfolio securities, unless the responsibility has been delegated to the Management Valuation Team of Wells Fargo Funds Management, LLC (“Funds Management”). The Board of Trustees retains the authority to make or ratify any valuation decisions or approve any changes to the Fair Value Procedures as it deems appropriate. On a quarterly basis, the Board of Trustees considers for ratification any valuation actions taken by the Valuation Committee or the Management Valuation Team.
Valuations of fair valued prices are compared to the next actual sales price when available, or other appropriate market information to assess the continued appropriateness of the fair valuation methodology used. The securities are fair valued on a day-to-day basis, taking into consideration changes to appropriate market information and any significant changes to the input factors considered in the valuation process until there is a readily available price provided on the exchange or by an independent pricing service. Valuations received from an independent pricing service or broker quotes are periodically validated by comparisons to most recent trades and valuations provided by other independent pricing services in addition to the review of prices by the adviser and/or sub-adviser. Unobservable inputs used in determining fair valuations are identified based on the type of security, taking into consideration factors utilized by market participants in valuing the investment, knowledge about the issuer and the current market environment.
Security loans
The Fund may lend its securities from time to time in order to earn additional income in the form of fees or interest on securities received as collateral or the investment of any cash received as collateral. The Fund continues to receive interest or dividends on the securities loaned. The Fund receives collateral in the form of cash or securities with a value at least equal to the value of the securities on loan. The value of the loaned securities is determined at the close of each business day and any additional required collateral is delivered to the Fund on the next business day. In a securities lending transaction, the net asset value of the Fund will be affected by an increase or decrease in the value of the securities loaned and by an increase or decrease in the value of the instrument in which collateral is invested. The amount of securities lending activity undertaken by the Fund fluctuates from time to time. In the event of default or bankruptcy
| | | | | | |
| Notes to Financial Statements (Unaudited) | | Wells Fargo Advantage Special Small Cap Value Fund | | | 23 | |
by the borrower, the Fund may be prevented from recovering the loaned securities or gaining access to the collateral or may experience delays or costs in doing so. In addition, the investment of any cash collateral received may lose all or part of its value. The Fund has the right under the lending agreement to recover the securities from the borrower on demand.
The Fund lends its securities through an unaffiliated securities lending agent. Cash collateral received in connection with its securities lending transactions is invested in Wells Fargo Securities Lending Cash Investments, LLC (the “Cash Collateral Fund”). The Cash Collateral Fund is exempt from registration under Section 3(c)(7) of the 1940 Act and is managed by Funds Management and is sub-advised by Wells Capital Management Incorporated (“Wells Capital Management”). Funds Management receives an advisory fee starting at 0.05% and declining to 0.01% as the average daily net assets of the Cash Collateral Fund increase. All of the fees received by Funds Management are paid to Wells Capital Management for its services as sub-adviser. The Cash Collateral Fund seeks to provide a positive return compared to the daily Fed Funds Open rate by investing in high-quality, U.S. dollar-denominated short-term money market instruments. Cash Collateral Fund investments are fair valued based upon the amortized cost valuation technique. Income earned from investment in the Cash Collateral Fund is included in securities lending income on the Statement of Operations.
Security transactions and income recognition
Securities transactions are recorded on a trade date basis. Realized gains or losses are reported on the basis of identified cost of securities delivered.
Interest income is accrued daily and bond discounts are accreted and premiums are amortized daily based on the effective interest method. To the extent debt obligations are placed on non-accrual status, any related interest income may be reduced by writing off interest receivables when the collection of all or a portion of interest has become doubtful based on consistently applied procedures. If the issuer subsequently resumes interest payments or when the collectability of interest is reasonably assured, the debt obligation is removed from non-accrual status.
Dividend income is recognized on the ex-dividend date.
Distributions to shareholders
Distributions to shareholders from net investment income and net realized gains, if any, are recorded on the ex-dividend date. Such distributions are determined in conformity with income tax regulations, which may differ from generally accepted accounting principles.
Federal and other taxes
The Fund intends to continue to qualify as a regulated investment company by distributing substantially all of its investment company taxable income and any net realized capital gains (after reduction for capital loss carryforwards) sufficient to relieve it from all, or substantially all, federal income taxes. Accordingly, no provision for federal income taxes was required.
The Fund’s income and federal excise tax returns and all financial records supporting those returns for the prior three fiscal years are subject to examination by the federal and Delaware revenue authorities. Management has analyzed the Fund’s tax positions taken on federal, state, and foreign tax returns for all open tax years and does not believe that there are any uncertain tax positions that require recognition of a tax liability.
Under the recently enacted Regulated Investment Company Modernization Act of 2010, the Fund is permitted to carry forward capital losses incurred in taxable years which began after December 22, 2010 for an unlimited period. However, any losses incurred are required to be utilized prior to the losses incurred in pre-enactment taxable years. As a result of this ordering rule, pre-enactment capital loss carryforwards may be more likely to expire unused. Post-enactment capital losses that are carried forward will retain their character as either short-term or long-term capital losses rather than be considered all short-term as under previous law. In addition, the Fund may elect to defer any portion of a post-October capital loss or qualified late-year ordinary loss to the first day of the following taxable year. A post-October capital loss is the greatest of the net capital loss, net short-term capital loss or net long-term capital loss for the portion of the taxable year after October 31. A qualified late-year ordinary loss is the net loss comprised of (a) net gain or loss from the sale or other disposition of capital assets for the portion of the taxable year after October 31, and (b) other ordinary income or loss for the portion of the taxable year after December 31.
| | | | |
| 24 | | Wells Fargo Advantage Special Small Cap Value Fund | | Notes to Financial Statements (Unaudited) |
As of October 31, 2011, the Fund had net capital loss carryforwards, which were available to offset future net realized capital gains, in the amount of $68,254,151 with $67,892,019 expiring in 2017 and $362,132 expiring in 2018.
Class allocations
The separate classes of shares offered by the Fund differ principally in applicable sales charges, distribution, shareholder servicing and administration fees. Shareholders of each class bear certain expenses that pertain to that particular class. All shareholders bear the common expenses of the Fund, earn income from the portfolio, and are allocated unrealized gains and losses pro rata based on the average daily net assets of each class, without distinction between share classes. Dividends are determined separately for each class based on income and expenses allocable to each class. Realized gains and losses are allocated to each class pro rata based upon the net assets of each class on the date realized. Differences in per share dividend rates generally result from the relative weightings of pro rata income and realized gain allocations and from differences in separate class expenses, including distribution, shareholder servicing and administration fees.
3. FAIR VALUATION MEASUREMENTS
Fair value measurements of investments are determined within a framework that has established a fair value hierarchy based upon the various data inputs utilized in determining the value of the Fund’s investments. The three-level hierarchy gives the highest priority to unadjusted quoted prices in active markets for identical assets or liabilities (Level 1) and the lowest priority to significant unobservable inputs (Level 3). The Fund’s investments are classified within the fair value hierarchy based on the lowest level of input that is significant to the fair value measurement. The inputs are summarized into three broad levels as follows:
| n | | Level 1 – quoted prices in active markets for identical securities |
| n | | Level 2 – other significant observable inputs (including quoted prices for similar securities, interest rates, prepayment speeds, credit risk, etc.) |
| n | | Level 3 – significant unobservable inputs (including the Fund’s own assumptions in determining the fair value of investments) |
The inputs or methodologies used for valuing securities are not necessarily an indication of the risk associated with investing in those securities.
As of April 30, 2012, the inputs used in valuing the Fund’s assets, which are carried at fair value, were as follows:
| | | | | | | | | | | | | | | | |
| Investments in Securities | | Quoted Prices (Level 1) | | | Significant Other
Observable Inputs (Level 2) | | | Significant Unobservable Inputs (Level 3) | | | Total | |
Equity securities | | | | | | | | | | | | | | | | |
Common stocks | | $ | 717,753,032 | | | $ | 0 | | | $ | 963,480 | | | $ | 718,716,512 | |
Warrants | | | 0 | | | | 17,496 | | | | 0 | | | | 17,496 | |
Other | | | 0 | | | | 0 | | | | 2,406,827 | | | | 2,406,827 | |
Short-term investments | | | | | | | | | | | | | | | | |
Investment companies | | | 46,967,272 | | | | 90,027,688 | | | | 0 | | | | 136,994,960 | |
| | | $ | 764,720,304 | | | $ | 90,045,184 | | | $ | 3,370,307 | | | $ | 858,135,795 | |
Further details on the major security types listed above can be found in the Portfolio of Investments.
Transfers in and transfers out are recognized at the end of the reporting period. For the six months ended April 30, 2012, the Fund did not have any significant transfers into/out of Level 1 and Level 2.
4. TRANSACTIONS WITH AFFILIATES AND OTHER EXPENSES
Advisory fee
The Trust has entered into an advisory contract with Funds Management, an indirect wholly owned subsidiary of Wells Fargo & Company (“Wells Fargo”). The adviser is responsible for implementing investment policies and guidelines and for supervising the sub-adviser, is responsible for day-to-day portfolio management of the Fund.
| | | | | | |
| Notes to Financial Statements (Unaudited) | | Wells Fargo Advantage Special Small Cap Value Fund | | | 25 | |
Pursuant to the contract, Funds Management is entitled to receive an annual advisory fee starting at 0.80% and declining to 0.70% as the average daily net assets of the Fund increase. For the six months ended April 30, 2012, the advisory fee was equivalent to an annual rate of 0.79% of the Fund’s average daily net assets.
Funds Management has retained the services of certain sub-advisers to provide daily portfolio management to the Fund. The fees related to sub-advisory services are borne directly by Funds Management and do not increase the overall fees paid by the Fund. Wells Capital Management, an affiliate of Funds Management, is the sub-adviser to the Fund and is entitled to receive a fee from Funds Management at an annual rate starting at 0.55% and declining to 0.40% as the average daily net assets of the Fund increase.
Administration and transfer agent fees
The Trust has entered into an administration agreement with Funds Management. Under this agreement, for providing administrative services, which includes paying fees and expenses for services provided by the transfer agent, sub-transfer agents, omnibus account servicers and record-keepers, Funds Management is entitled to receive from the Fund an annual fund level administration fee starting at 0.05% and declining to 0.03% as the average daily net assets of the Fund increase and a class level administration fee which is calculated based on the average daily net assets of each class as follows:
| | | | |
| | | Class Level Administration Fee | |
Class A, Class B, Class C | | | 0.26 | % |
Administrator Class | | | 0.10 | |
Institutional Class | | | 0.08 | |
Funds Management has contractually waived and/or reimbursed advisory and administration fees to the extent necessary to maintain certain net operating expense ratios for the Fund. Waiver of fees and/or reimbursement of expenses by Funds Management were made first from fund level expenses on a proportionate basis and then from class specific expenses. Funds Management has committed through July 18, 2013, to waive fees and/or reimburse expenses to the extent necessary to cap the Fund’s expenses at 1.34% for Class A, 2.09% for Class B, 2.09% for Class C, 1.09% for Administrator Class and 0.94% for Institutional Class.
Distribution fees
The Trust has adopted a Distribution Plan for Class B and Class C shares of the Fund pursuant to Rule 12b-1 under the 1940 Act. Distribution fees are charged to Class B and Class C shares and paid to Wells Fargo Funds Distributor, LLC, the principal underwriter, at an annual rate of 0.75% of the average daily net assets of Class B and Class C shares.
For the six months ended April 30, 2012, Wells Fargo Funds Distributor, LLC received $2,336 from the sale of Class A shares and $50, $4,608 and $56 in contingent deferred sales charges from redemptions of Class A, Class B and Class C shares, respectively.
Shareholder servicing fees
The Trust has entered into contracts with one or more shareholder servicing agents, whereby Class A, Class B, Class C and Administrator Class of the Fund is charged a fee at an annual rate of 0.25% of the average daily net assets of each respective class.
A portion of these total shareholder servicing fees were paid to affiliates of Wells Fargo.
5. INVESTMENT PORTFOLIO TRANSACTIONS
Purchases and sales of investments, excluding U.S. Government obligations (if any) and short-term securities, for the six months ended April 30, 2012 were $226,222,244 and $288,685,010, respectively.
| | | | |
| 26 | | Wells Fargo Advantage Special Small Cap Value Fund | | Notes to Financial Statements (Unaudited) |
6. INVESTMENTS IN AFFILIATES
An affiliated investment is a company in which the Fund has ownership of at least 5% of the outstanding voting shares. A summary of the transactions with affiliates for the six months ended April 30, 2012 was as follows:
| | | | | | | | | | | | | | | | | | | | | | | | | | | | |
| | | Shares, Beginning
of Period | | | Shares
Purchased | | | Shares
Sold | | | Shares, End
of Period | | | Value, End of
Period | | | Income from
Affiliated Securities | | | Realized
Gains (Losses) | |
AH Bello Corporation | | | 995,660 | | | | 153,400 | | | | 0 | | | | 1,149,060 | | | $ | 5,067,355 | | | $ | 120,469 | | | $ | 0 | |
Dixie Group Incorporated | | | 701,577 | | | | 3,300 | | | | 0 | | | | 704,877 | | | | 2,734,923 | | | | 0 | | | | 0 | |
Imation Corporation | | | 2,277,121 | | | | 407,700 | | | | 0 | | | | 2,684,821 | | | | 15,571,962 | | | | 0 | | | | 0 | |
Kadant Incorporated | | | 957,029 | | | | 17,000 | | | | 600 | | | | 973,429 | | | | 25,182,608 | | | | 0 | | | | 2,344 | |
Kenneth Cole Productions Incorporated Class A | | | 689,768 | | | | 89,700 | | | | 257,900 | | | | 521,568 | | | | 8,308,578 | | | | 0 | | | | (2,387,176 | ) |
| | | | | | | | | | | | | | | | | | | $ | 56,865,426 | | | $ | 120,469 | | | $ | (2,384,832 | ) |
7. BANK BORROWINGS
The Trust (excluding the money market funds) and Wells Fargo Variable Trust are parties to a $150,000,000 revolving credit agreement with State Street Bank and Trust Company, whereby the Fund is permitted to use bank borrowings for temporary or emergency purposes, such as to fund shareholder redemption requests. Interest under the credit agreement is charged to the Fund based on a borrowing rate equal to the higher of the Federal Funds rate in effect on that day plus 1.25% or the overnight LIBOR rate in effect on that day plus 1.25%. In addition, an annual commitment fee equal to 0.10% of the unused balance is allocated to each participating fund. For the six months ended April 30, 2012, the Fund paid $711 in commitment fees.
For the six months ended April 30, 2012, there were no borrowings by the Fund under the agreement.
8. INDEMNIFICATION
Under the Trust’s organizational documents, the officers and directors are indemnified against certain liabilities that may arise out of performance of their duties to the Trust. Additionally, in the normal course of business, the Trust may enter into contracts with service providers that contain a variety of indemnification clauses. The Trust’s maximum exposure under these arrangements is dependent on future claims that may be made against the Fund and, therefore, cannot be estimated.
9. NEW ACCOUNTING PRONOUNCEMENTS
In December 2011, the Financial Accounting Standards Board (“FASB”) issued Accounting Standard Update (“ASU”) No. 2011-11, Disclosures about Offsetting Assets and Liabilities. ASU 2011-11, which amends FASB ASC Topic 210, Balance Sheet, creates new disclosure requirements which require entities to disclose both gross and net information for derivatives and other financial instruments that are either offset in the Statement of Assets and Liabilities or subject to an enforceable master netting arrangement or similar agreement. The disclosure requirements are effective for interim and annual reporting periods beginning on or after January 1, 2013. Management is currently assessing the potential impact, in addition to expanded financial statement disclosure, that may result from adopting this ASU.
In May 2011, FASB issued ASU No. 2011-04 Amendments to Achieve Common Fair Value Measurement and Disclosure Requirements in U.S. GAAP and IFRSs. ASU No. 2011-04 amends FASB ASC Topic 820, Fair Value Measurements, to establish common requirements for measuring fair value and for disclosing information about fair value measurements in accordance with GAAP. The ASU is effective prospectively for interim and annual periods beginning after December 15, 2011. Management expects that adoption of the ASU will result in additional disclosures in the financial statements, as applicable.
In April 2011, FASB issued ASU No. 2011-03 Reconsideration of Effective Control for Repurchase Agreements. ASU No. 2011-03 amends FASB ASC Topic 860, Transfers and Servicing, specifically the criteria required to determine whether a repurchase agreement (repo) and similar agreements should be accounted for as sales of financial assets or secured borrowings with commitments. ASU No. 2011-03 changes the assessment of effective control by focusing on the transferor’s contractual rights and obligations and removing the criterion to assess its ability to exercise those rights or honor those obligations. This could result in changes to the way entities account for certain transactions including
| | | | | | |
| Notes to Financial Statements (Unaudited) | | Wells Fargo Advantage Special Small Cap Value Fund | | | 27 | |
repurchase agreements, mortgage dollar rolls and reverse repurchase agreements. The ASU will become effective on a prospective basis for new transfers and modifications to existing transactions as of the beginning of the first interim or annual period beginning on or after December 15, 2011. Management has evaluated the impact of adopting the ASU and expects no significant changes.
| | | | |
| 28 | | Wells Fargo Advantage Special Small Cap Value Fund | | Other Information (Unaudited) |
PROXY VOTING INFORMATION
A description of the policies and procedures that the Fund uses to determine how to vote proxies relating to portfolio securities is available without charge, upon request, by calling 1-800-222-8222, visiting our Web site at wellsfargoadvantagefunds.com, or visiting the SEC Web site at sec.gov. Information regarding how the Fund voted proxies relating to portfolio securities during the most recent 12-month period ended June 30 is available without charge on the Fund’s Web site at wellsfargoadvantagefunds.com or by visiting the SEC Web site at sec.gov.
PORTFOLIO HOLDINGS INFORMATION
The complete portfolio holdings for the Fund are publicly available on the Fund’s Web site (wellsfargoadvantagefunds.com) on a monthly, 30-day or more delayed basis. In addition, top ten holdings information for the Fund is publicly available on the Fund’s Web site on a monthly, seven-day or more delayed basis. The Fund files its complete schedule of portfolio holdings with the SEC for the first and third quarters of each fiscal year on Form N-Q, which is available without charge by visiting the SEC Web site at sec.gov. In addition, the Fund’s Form N-Q may be reviewed and copied at the SEC’s Public Reference Room in Washington, DC, and at regional offices in New York City, at 233 Broadway, and in Chicago, at 175 West Jackson Boulevard, Suite 900. Information about the Public Reference Room may be obtained by calling 1-800-SEC-0330.
| | | | | | |
| Other Information (Unaudited) | | Wells Fargo Advantage Special Small Cap Value Fund | | | 29 | |
BOARD OF TRUSTEES
The following table provides basic information about the Board of Trustees (the “Trustees”) of the Trust and Officers of the Trust. This table should be read in conjunction with the Prospectus and the Statement of Additional Information1 of the Fund. Each of the Trustees and Officers listed below acts in identical capacities for the Wells Fargo Advantage family of funds, which consists of 137 funds comprising the Wells Fargo Funds Trust, Wells Fargo Variable Trust, Wells Fargo Master Trust and four closed-end funds (collectively the “Fund Complex”). All of the Trustees are also Members of the Audit and Governance Committees of each Trust in the Fund Complex. The mailing address of each Trustee and Officer is 525 Market Street, 12th Floor, San Francisco, CA 94105. Each Trustee and Officer serves an indefinite term, however, each Trustee serves such term until reaching the mandatory retirement age established by the Trustees.
Independent Trustees
| | | | | | |
Name and Year of Birth | | Position Held and Length of Service | | Principal Occupations During Past Five Years | | Other Directorships During
Past Five Years |
Peter G. Gordon
(Born 1942) | | Trustee, since 1998; Chairman, since 2005 (Lead Trustee since 2001) | | Co-Founder, Retired Chairman, President and CEO of Crystal Geyser Water Company. Trustee Emeritus, Colby College | | Asset Allocation Trust |
Isaiah Harris, Jr.
(Born 1952) | | Trustee, since 2009 | | Retired. Prior thereto, President and CEO of BellSouth Advertising and Publishing Corp. from 2005 to 2007, President and CEO of BellSouth Enterprises from 2004 to 2005 and President of BellSouth Consumer Services from 2000 to 2003. Emeritus member of the Iowa State University Foundation Board of Governors. Emeritus Member of the Advisory Board of Iowa State University School of Business. Mr. Harris is a certified public accountant. | | CIGNA Corporation; Deluxe Corporation; Asset Allocation Trust |
Judith M. Johnson
(Born 1949) | | Trustee, since 2008 | | Retired. Prior thereto, Chief Executive Officer and Chief Investment Officer of Minneapolis Employees Retirement Fund from 1996 to 2008. Ms. Johnson is an attorney, certified public accountant and a certified managerial accountant. | | Asset Allocation Trust |
Leroy Keith, Jr.
(Born 1939) | | Trustee, since 2010 | | Chairman, Bloc Global Services (development and construction). Trustee of the Evergreen Funds from 1983 to 2010. Former Managing Director, Almanac Capital Management (commodities firm), former Partner, Stonington Partners, Inc. (private equity fund), former Director, Obagi Medical Products Co. and former Director, Lincoln Educational Services. | | Trustee, Virtus Fund Complex (consisting of 40 portfolios as of 12/31/11); Asset Allocation Trust |
David F. Larcker
(Born 1950) | | Trustee, since 2009 | | James Irvin Miller Professor of Accounting at the Graduate School of Business, Stanford University, Director of Corporate Governance Research Program and Senior Faculty of The Rock Center for Corporate Governance since 2006. From 2005 to 2008, Professor of Accounting at the Graduate School of Business, Stanford University. Prior thereto, Ernst & Young Professor of Accounting at The Wharton School, University of Pennsylvania from 1985 to 2005. | | Asset Allocation Trust |
Olivia S. Mitchell
(Born 1953) | | Trustee, since 2006 | | International Foundation of Employee Benefit Plans Professor, Wharton School of the University of Pennsylvania since 1993. Director of Wharton’s Pension Research Council and Boettner Center on Pensions & Retirement Research, and Research Associate at the National Bureau of Economic Research. Previously, Cornell University Professor from 1978 to 1993. | | Asset Allocation Trust |
| | | | |
| 30 | | Wells Fargo Advantage Special Small Cap Value Fund | | Other Information (Unaudited) |
| | | | | | |
Name and Year of Birth | | Position Held and Length of Service | | Principal Occupations During Past Five Years | | Other Directorships During
Past Five Years |
Timothy J. Penny
(Born 1951) | | Trustee, since 1996 | | President and CEO of Southern Minnesota Initiative Foundation, a non-profit organization, since 2007 and Senior Fellow at the Humphrey Institute Policy Forum at the University of Minnesota since 1995. Member of the Board of Trustees of NorthStar Education Finance, Inc., a non-profit organization, since 2007. | | Asset Allocation Trust |
Michael S. Scofield
(Born 1943) | | Trustee, since 2010 | | Served on the Investment Company Institute’s Board of Governors and Executive Committee from 2008-2011 as well the Governing Council of the Independent Directors Council from 2006-2011 and the Independent Directors Council Executive Committee from 2008-2011. Chairman of the IDC from 2008-2010. Institutional Investor (Fund Directions) Trustee of Year in 2007. Trustee of the Evergreen Funds (and its predecessors) from 1984 to 2010. Chairman of the Evergreen Funds from 2000-2010. Former Trustee of the Mentor Funds. Retired Attorney, Law Offices of Michael S. Scofield and former Director and Chairman, Branded Media Corporation (multi-media branding company). | | Asset Allocation Trust |
Donald C. Willeke
(Born 1940) | | Trustee, since 1996 | | Principal of the law firm of Willeke & Daniels. General Counsel of the Minneapolis Employees Retirement Fund from 1984 until its consolidation into the Minnesota Public Employees Retirement Association on June 30, 2010. Director and Vice Chair of The Free Trust (non-profit corporation). Director of the American Chestnut Foundation (non-profit corporation). | | Asset Allocation Trust |
Officers
| | | | | | |
Name and Year of Birth | | Position Held and
Length of Service | | Principal Occupations During Past Five Years | | |
Karla M. Rabusch
(Born 1959) | | President, since 2003 | | Executive Vice President of Wells Fargo Bank, N.A. and President of Wells Fargo Funds Management, LLC since 2003. Senior Vice President and Chief Administrative Officer of Wells Fargo Funds Management, LLC from 2001 to 2003. | | |
C. David Messman
(Born 1960) | | Secretary, since 2000; Chief Legal Counsel, since 2003 | | Senior Vice President and Secretary of Wells Fargo Funds Management, LLC since 2001. Vice President and Managing Senior Counsel of Wells Fargo Bank, N.A. since 1996. | | |
Kasey Phillips
(Born 1970) | | Treasurer, since 2009 | | Senior Vice President of Wells Fargo Funds Management, LLC since 2009. Senior Vice President of Evergreen Investment Management Company, LLC from 2006 to 2010. Treasurer of the Evergreen Funds from 2005 to 2010. | | |
David Berardi
(Born 1975) | | Assistant Treasurer, since 2009 | | Vice President of Wells Fargo Funds Management, LLC since 2009. Vice President of Evergreen Investment Management Company, LLC from 2008 to 2010. Assistant Vice President of Evergreen Investment Services, Inc. from 2004 to 2008. Manager of Fund Reporting and Control for Evergreen Investment Management Company, LLC from 2004 to 2010. | | |
Jeremy DePalma
(Born 1974) | | Assistant Treasurer, since 2009 | | Senior Vice President of Wells Fargo Funds Management, LLC since 2009. Senior Vice President of Evergreen Investment Management Company, LLC from 2008 to 2010. Vice President, Evergreen Investment Services, Inc. from 2004 to 2007. Head of the Fund Reporting and Control Team within Fund Administration from 2005 to 2010. | | |
Debra Ann Early
(Born 1964) | | Chief Compliance Officer, since 2007 | | Chief Compliance Officer of Wells Fargo Funds Management, LLC since 2007. Chief Compliance Officer of Parnassus Investments from 2005 to 2007. Chief Financial Officer of Parnassus Investments from 2004 to 2007 and Senior Audit Manager of PricewaterhouseCoopers LLP from 1998 to 2004. | | |
| 1. | The Statement of Additional Information includes additional information about the Trustees and is available, without charge, upon request, by calling 1-800-222-8222 or by visiting the Web site at wellsfargoadvantagefunds.com. |
| | | | | | |
| Other Information (Unaudited) | | Wells Fargo Advantage Special Small Cap Value Fund | | | 31 | |
BOARD CONSIDERATION OF INVESTMENT ADVISORY AND SUB-ADVISORY AGREEMENTS:
Under Section 15 of the Investment Company Act of 1940 (the “1940 Act”), the Board of Trustees (the “Board”) of Wells Fargo Funds Trust (the “Trust”), all the members of which have no direct or indirect interest in the investment advisory and sub-advisory agreements and are not “interested persons” of the Trust, as defined in the 1940 Act (the “Independent Trustees”), must determine whether to approve the continuation of the Trust’s investment advisory and sub-advisory agreements. In this regard, at an in person meeting held on March 29-30, 2012 (the “Meeting”), the Board reviewed and re-approved: (i) an investment advisory agreement with Wells Fargo Funds Management, LLC (“Funds Management”) for Wells Fargo Advantage Special Small Cap Value Fund (the “Fund”) and (ii) an investment sub-advisory agreement with Wells Capital Management Incorporated (“Wells Capital Management”) for the Fund. The investment advisory agreement with Funds Management and the investment sub-advisory agreement with Wells Capital Management are collectively referred to as the “Advisory Agreements.”
At the Meeting, the Board considered the factors and reached the conclusions described below relating to the selection of Funds Management and Wells Capital Management and the continuation of the Advisory Agreements. Prior to the Meeting, the Trustees conferred extensively among themselves and with representatives of Funds Management about these matters. The Board also met throughout the year and received information that was useful to them in considering the continuation of the Advisory Agreements. The Independent Trustees were assisted in their evaluation of the Advisory Agreements by independent legal counsel, from whom they received separate legal advice and with whom they met separately from Funds Management.
In providing information to the Board, Funds Management and Wells Capital Management were guided by a detailed set of requests submitted by the Independent Trustees’ independent legal counsel on their behalf at the start of the Board’s annual contract renewal process earlier in 2012. In approving the Advisory Agreements, the Board did not identify any particular information or consideration that was all-important or controlling, and each Trustee likely attributed different weights to various factors.
Nature, extent and quality of services
The Board received and considered various information regarding the nature, extent and quality of services provided to the Fund by Funds Management and Wells Capital Management under the Advisory Agreements. The Board also received and considered, among other things, information about the background and experience of senior management of Funds Management, and the qualifications, backgrounds, tenures and responsibilities of the portfolio managers primarily responsible for the day-to-day portfolio management of the Fund.
The Board evaluated the ability of Funds Management and Wells Capital Management, based on their respective financial condition, resources, reputation and other attributes, to attract and retain qualified investment professionals, including research, advisory, and supervisory personnel. The Board further considered the compliance programs and compliance records of Funds Management and Wells Capital Management. In addition, the Board took into account the administrative services provided to the Fund by Funds Management and its affiliates.
The Board’s decision to approve the continuation of the Advisory Agreements was based on a comprehensive evaluation of all of the information provided to it. In considering these matters, the Board considered not only the specific information presented in connection with the Meeting, but also the knowledge gained over time through interaction with Funds Management and Wells Capital Management about various topics, including Funds Management’s oversight of service providers. The above factors, together with those referenced below, are some of the most important, but not necessarily all, factors considered by the Board in concluding that the nature, extent and quality of the investment advisory services provided to the Fund by Funds Management and Wells Capital Management supported the re-approval of the Advisory Agreements. Although the Board considered the continuation of the Advisory Agreements for the Fund as part of the larger process of considering the continuation of the advisory agreements for all of the funds in the complex, its decision to continue the Advisory Agreements for the Fund was ultimately made on a fund-by-fund basis.
Fund performance and expenses
The Board considered the performance results for the Fund over various time periods ended December 31, 2011. The Board also considered these results in comparison to the median performance of a universe of relevant funds (the “Universe”) that was determined by Lipper Inc. (“Lipper”) to be similar to the Fund, and in comparison to the Fund’s
| | | | |
| 32 | | Wells Fargo Advantage Special Small Cap Value Fund | | Other Information (Unaudited) |
benchmark index and to other comparative data. Lipper is an independent provider of investment company data. The Board received a description of the methodology used by Lipper to select the mutual funds in the Universe. The Board noted that the performance of the Fund was higher than or in range of the median performance of the Universe for all periods under review. The Board also noted that the performance of the Fund was higher than or in range of its benchmark, the Lipper Small-Cap Value Funds Index, for the periods under review.
The Board received and considered information regarding the Fund’s contractual advisory fee and net operating expense ratios and their various components, including actual management fees (which reflect fee waivers, if any), transfer agent, custodian and other non-management fees, Rule 12b-1 and non-Rule 12b-1 fees, service fees and fee waiver and expense reimbursement arrangements. The Board also considered these ratios in comparison to the median ratios of an expense Universe and a narrower expense group of mutual funds (each, an “Expense Group”) that was determined by Lipper to be similar to the Fund. The Board received a description of the methodology used by Lipper to select the mutual funds in the Fund’s Expense Group. The Board noted that the net operating expense ratios of the Fund were in range of the Fund’s Expense Group’s median net operating expense ratios.
Based on the above-referenced considerations and other factors, the Board concluded that the overall performance and expense structure of the Fund supported the re-approval of the Advisory Agreements for the Fund.
Investment advisory and sub-advisory fee rates
The Board reviewed and considered the contractual investment advisory fee rate that is payable by the Fund to Funds Management for investment advisory services (the “Advisory Agreement Rate”), both on a stand-alone basis and on a combined basis with the Fund’s administration fee rate. The Board took into account the separate administrative and other services covered by the administration fee rate. The Board also reviewed and considered the contractual investment sub-advisory fee rate that is payable by Funds Management to Wells Capital Management for investment sub-advisory services (the “Sub-Advisory Agreement Rate”). In addition, the Board reviewed and considered the existing fee waiver/cap arrangements applicable to the Advisory Agreement Rate and considered the Advisory Agreement Rate after taking the waivers/caps into account (the “Net Advisory Rate”).
The Board received and considered information comparing the Advisory Agreement Rate and Net Advisory Rate with those of other funds in the Fund’s Expense Group median. The Board noted that the Advisory Agreement Rate for the Fund was higher than the median rates for the Fund’s Expense Group. The Board also noted that the Net Advisory Rate for the Fund was higher than the median rate for the Fund’s Expense Group, except for the Administrator Class. The Board noted that Funds Management proposed to extend contractual fee cap arrangements for the Fund designed to lower the fund’s expenses until February 28, 2014.
The Board also received and considered information about the nature and extent of services offered and fee rates charged by Funds Management and Wells Capital Management to other types of clients. In this regard, the Board received information about differences between the services, and the compliance, reporting, and other legal burdens and risks of providing investment advice to mutual funds and those associated with providing advice to non-mutual fund clients such as collective funds or institutional separate accounts.
The Board determined that the Advisory Agreement Rate for the Fund, both with and without an administration fee rate and before and after waivers, was reasonable in light of the Fund’s Expense Group information, the net expense ratio commitments, the services covered by the Advisory Agreements and other information provided. The Board also reviewed and considered the Sub-Advisory Agreement Rate and concluded that the Sub-Advisory Agreement Rate was reasonable in light of the services covered by the sub-advisory agreement and other information provided.
Profitability
The Board received and considered a profitability analysis of Funds Management, as well as an analysis of the profitability to the collective Wells Fargo businesses that provide services to the Fund. It considered that the information provided to it was necessarily estimated, and that the profitability information provided to it, especially on a fund-by-fund basis, did not necessarily provide a precise tool for evaluating the appropriateness of the Fund’s Advisory Agreement Rate in isolation. It noted that the levels of profitability reported on a fund-by-fund basis varied widely, depending on, among other things, the size and type of fund. The Board concluded that the profitability reported by Funds Management was not unreasonable.
| | | | | | |
| Other Information (Unaudited) | | Wells Fargo Advantage Special Small Cap Value Fund | | | 33 | |
The Board did not consider separate profitability information with respect to Wells Capital Management, because, as an affiliate of Funds Management, its profitability information was subsumed in the collective Wells Fargo profitability analysis provided by Funds Management.
Economies of scale
With respect to possible economies of scale, the Board reviewed the breakpoints in the Fund’s advisory fee structure, which operate generally to reduce the effective Advisory Agreement Rate of the Fund (as a percentage of Fund assets) as the Fund grows in size. It considered that, as a fund shrinks in size, breakpoints conversely result in increasing fee levels. The Board noted that it would have on-going opportunities to review the appropriate levels of breakpoints in the future, and concluded that the breakpoints as implemented appeared to be a reasonable step toward sharing economies of scale, if any, with the Fund. However, the Board acknowledged the inherent limitations of any analysis of an investment adviser’s economies of scale and of any attempt to correlate breakpoints with such economies, stemming largely from the Board’s understanding that economies of scale are realized, if at all, by an investment adviser across a variety of products and services, not just with respect to a single fund.
Other benefits to Funds Management and Wells Capital Management
The Board received and considered information regarding potential “fall-out” or ancillary benefits received by Funds Management and its affiliates, including Wells Capital Management, as a result of their relationship with the Fund. Ancillary benefits could include, among others, benefits directly attributable to the relationship of Funds Management and Wells Capital Management with the Fund and benefits potentially derived from an increase in Funds Management’s and Wells Capital Management’s business as a result of their relationship with the Fund (such as the ability to market to shareholders other financial products offered by Funds Management and its affiliates, including Wells Capital Management).
The Board considered that Wells Fargo Funds Distributor, LLC, an affiliate of Funds Management, serves as distributor to the Fund and receives certain compensation for those services. The Board noted that various financial institutions, including affiliates of Funds Management, may receive distribution-related fees, shareholder servicing payments (including amounts derived from payments under Rule 12b-1 plans) and sub-transfer agency fees in respect of shares sold or held through them and services provided.
The Board also reviewed information about whether and to what extent soft dollar credits are sought and how any such credits are utilized and any benefits that may be realized by using an affiliated broker.
Other factors and broader review
The Board also considered the markets for distribution of the Fund’s shares, including the channels through which the Fund’s shares are offered and sold. The Board noted that the Fund is part of one of the few fund families that have both direct-to-fund and intermediary distribution channels. As discussed above, the Board reviews detailed materials received from Funds Management and Wells Capital Management annually as part of the re-approval process under Section 15 of the 1940 Act and also reviews and assesses information about the quality of the services that the Fund receives throughout the year. In this regard, the Board has reviewed reports of Funds Management at each of its quarterly meetings, which include, among other things, portfolio reviews and performance reports. In addition, the Board confers with portfolio managers at various times throughout the year.
Conclusion
After considering the above-described factors and based on its deliberations and its evaluation of the information described above, the Board unanimously approved the continuation of the Advisory Agreements for an additional one-year period.
| | | | |
| 34 | | Wells Fargo Advantage Special Small Cap Value Fund | | List of Abbreviations |
The following is a list of common abbreviations for terms and entities which may have appeared in this report.
| ACB | — Agricultural Credit Bank |
| ADR | — American Depository Receipt |
| ADS | — American Depository Shares |
| AGC-ICC | — Assured Guaranty Corporation - Insured Custody Certificates |
| AGM | — Assured Guaranty Municipal |
| AMBAC | — American Municipal Bond Assurance Corporation |
| AMT | — Alternative Minimum Tax |
| BAN | — Bond Anticipation Notes |
| BHAC | — Berkshire Hathaway Assurance Corporation |
| CAB | — Capital Appreciation Bond |
| CCAB | — Convertible Capital Appreciation Bond |
| CDA | — Community Development Authority |
| CDO | — Collateralized Debt Obligation |
| COP | — Certificate of Participation |
| DRIVER | — Derivative Inverse Tax-Exempt Receipts |
| DW&P | — Department of Water & Power |
| DWR | — Department of Water Resources |
| ECFA | — Educational & Cultural Facilities Authority |
| EDA | — Economic Development Authority |
| EDFA | — Economic Development Finance Authority |
| ETF | — Exchange-Traded Fund |
| FFCB | — Federal Farm Credit Bank |
| FGIC | — Financial Guaranty Insurance Corporation |
| FHA | — Federal Housing Authority |
| FHLB | — Federal Home Loan Bank |
| FHLMC | — Federal Home Loan Mortgage Corporation |
| FICO | — The Financing Corporation |
| FNMA | — Federal National Mortgage Association |
| GDR | — Global Depository Receipt |
| GNMA | — Government National Mortgage Association |
| HCFR | — Healthcare Facilities Revenue |
| HEFA | — Health & Educational Facilities Authority |
| HEFAR | — Higher Education Facilities Authority Revenue |
| HFA | — Housing Finance Authority |
| HFFA | — Health Facilities Financing Authority |
| IBC | — Insured Bond Certificate |
| IDA | — Industrial Development Authority |
| IDAG | — Industrial Development Agency |
| IDR | — Industrial Development Revenue |
| KRW | — Republic of Korea Won |
| LIBOR | — London Interbank Offered Rate |
| LLC | — Limited Liability Company |
| LLP | — Limited Liability Partnership |
| MBIA | — Municipal Bond Insurance Association |
| MFHR | — Multi-Family Housing Revenue |
| MSTR | — Municipal Securities Trust Receipts |
| MUD | — Municipal Utility District |
| NATL-RE | — National Public Finance Guarantee Corporation |
| PCFA | — Pollution Control Finance Authority |
| PCR | — Pollution Control Revenue |
| PFA | — Public Finance Authority |
| PFFA | — Public Facilities Financing Authority |
| PFOTER | — Puttable Floating Option Tax-Exempt Receipts |
| plc | — Public Limited Company |
| PUTTER | — Puttable Tax-Exempt Receipts |
| R&D | — Research & Development |
| RDA | — Redevelopment Authority |
| RDFA | — Redevelopment Finance Authority |
| REIT | — Real Estate Investment Trust |
| ROC | — Reset Option Certificates |
| SAVRS | — Select Auction Variable Rate Securities |
| SBA | — Small Business Authority |
| SFHR | — Single Family Housing Revenue |
| SFMR | — Single Family Mortgage Revenue |
| SPA | — Standby Purchase Agreement |
| SPDR | — Standard & Poor’s Depositary Receipts |
| STRIPS | — Separate Trading of Registered Interest and Principal Securities |
| TAN | — Tax Anticipation Notes |
| TIPS | — Treasury Inflation-Protected Securities |
| TRAN | — Tax Revenue Anticipation Notes |
| TCR | — Transferable Custody Receipts |
| TTFA | — Transportation Trust Fund Authority |
| TVA | — Tennessee Valley Authority |
| XLCA | — XL Capital Assurance |


FOR MORE INFORMATION
More information about Wells Fargo Advantage Funds is available free upon request. To obtain literature, please write, e-mail, visit the Fund’s Web site, or call:
Wells Fargo Advantage Funds
P.O. Box 8266
Boston, MA 02266-8266
E-mail: wfaf@wellsfargo.com
Web site: wellsfargoadvantagefunds.com
Individual investors: 1-800-222-8222
Retail investment professionals: 1-888-877-9275
Institutional investment professionals: 1-866-765-0778
This report and the financial statements contained herein are submitted for the general information of the shareholders of Wells Fargo Advantage Funds. If this report is used for promotional purposes, distribution of the report must be accompanied or preceded by a current prospectus. For a prospectus containing more complete information, including charges and expenses, call 1-800-222-8222 or visit the Fund’s Web site at wellsfargoadvantagefunds.com. Please consider the investment objectives, risks, charges, and expenses of the investment carefully before investing. This and other information about Wells Fargo Advantage Funds can be found in the current prospectus. Read the prospectus carefully before you invest or send money.
Wells Fargo Funds Management, LLC, a wholly owned subsidiary of Wells Fargo & Company, provides investment advisory and administrative services for Wells Fargo Advantage Funds. Other affiliates of Wells Fargo & Company provide subadvisory and other services for the Funds. The Funds are distributed by Wells Fargo Funds Distributor, LLC, Member FINRA/SIPC, an affiliate of Wells Fargo & Company.
NOT FDIC INSURED ¡ NO BANK GUARANTEE ¡ MAY LOSE VALUE
© 2012 Wells Fargo Funds Management, LLC. All rights reserved.
| | |
 | | 209730 06 -12 SA246/SAR246 4-12 |

Wells Fargo Advantage
Traditional Small Cap Growth Fund

Semi-Annual Report
April 30, 2012

Reduce clutter. Save trees.
Sign up for electronic delivery of prospectuses and shareholder reports at wellsfargo.com/advantagedelivery
Contents
The views expressed and any forward-looking statements are as of April 30, 2012, unless otherwise noted, and are those of the Fund managers and/or Wells Fargo Funds Management, LLC. Discussions of individual securities, or the markets generally, or any Wells Fargo Advantage Fund are not intended as individual recommendations. Future events or results may vary significantly from those expressed in any forward-looking statements; the views expressed are subject to change at any time in response to changing circumstances in the market. Wells Fargo Funds Management, LLC, disclaims any obligation to publicly update or revise any views expressed or forward-looking statements.
NOT FDIC INSURED ¡ NO BANK GUARANTEE ¡ MAY LOSE VALUE

WELLS FARGO INVESTMENT HISTORY
| | |
| |
| 1932 | | Keystone creates one of the first mutual fund families. |
| |
| 1971 | | Wells Fargo & Company introduces one of the first institutional index funds. |
| |
| 1978 | | Wells Fargo applies Markowitz and Sharpe’s research on Modern Portfolio Theory to introduce one of the industry’s first Tactical Asset Allocation (TAA) models in institutional separately managed accounts. |
| |
| 1984 | | Wells Fargo Stagecoach Funds launches its first asset allocation fund. |
| |
| 1989 | | The Tactical Asset Allocation (TAA) Model is first applied to Wells Fargo’s asset allocation mutual funds. |
| |
| 1994 | | Wells Fargo introduces the LifePath Funds, one of the first suites of target date funds (now the Wells Fargo Advantage Dow Jones Target Date FundsSM). |
| |
| 1996 | | Evergreen Investments and Keystone Funds merge. |
| |
| 1997 | | Wells Fargo launches Wells Fargo Advantage WealthBuilder PortfoliosSM, a fund-of-funds suite of products that includes the use of quantitative models to shift assets among investment styles. |
| |
| 1999 | | Norwest Advantage Funds and Stagecoach Funds are reorganized into Wells Fargo Funds after the merger of Norwest and Wells Fargo. |
| |
| 2002 | | Evergreen Retail and Evergreen Institutional companies form the umbrella asset management company, Evergreen Investments. |
| |
| 2005 | | The integration of Strong Funds with Wells Fargo Funds creates Wells Fargo Advantage Funds, resulting in one of the top 20 mutual fund companies in the United States. |
| |
| 2006 | | Wells Fargo Advantage Funds relaunches the target date product line as Wells Fargo Advantage Dow Jones Target Date Funds. |
| |
| 2010 | | The mergers and reorganizations of Evergreen and Wells Fargo Advantage mutual funds are completed, unifying the families under the brand of Wells Fargo Advantage Funds. |
Wells Fargo Advantage Funds®
Wells Fargo Advantage Funds skillfully guides institutions, financial advisors, and individuals through the investment terrain to help them reach their financial objectives. Everything we do on behalf of investors is backed by our unique combination of qualifications.
Strength
Our organization is built on the standards of integrity and service established by our parent company—Wells Fargo & Company—more than 150 years ago. And, because we’re part of a highly diversified financial enterprise, we offer the depth of resources to help investors succeed.
Expertise
Our multi-boutique model offers investors access to the independent thinking of premier investment managers that have been chosen for their time-tested strategies. While each team specializes in a specific investment strategy, collectively they provide investors a wide choice of distinct investment styles. Our dedication to investment excellence doesn’t end with our expertise in manager selection—risk management, analysis, and rigorous ongoing review seek to ensure each manager’s investment process remains consistent.
Partnership
Our collaborative approach is built around understanding the needs and goals of our clients. By adhering to core principles of sound judgment and steady guidance, we support you through every stage of the investment decision process.
Carefully consider a fund’s investment objectives, risks, charges, and expenses before investing. For a current prospectus and, if available, a summary prospectus, containing this and other information, visit wellsfargoadvantagefunds.com. Read it carefully before investing.
Wells Fargo Funds Management, LLC, a wholly owned subsidiary of Wells Fargo & Company, provides investment advisory and administrative services for Wells Fargo Advantage Funds®. Other affiliates of Wells Fargo & Company provide subadvisory and other services for the Funds. The Funds are distributed by Wells Fargo Funds Distributor, LLC, Member FINRA/SIPC, an affiliate of Wells Fargo & Company.
“Dow Jones®” and “Dow Jones Target Date IndexesSM” are service marks of Dow Jones Trademark Holdings, LLC (“Dow Jones”), have been licensed to CME Group Index Services LLC (“CME Indexes”) and have been sublicensed for use for certain purposes by Global Index Advisors, Inc, and Wells Fargo Funds Management, LLC. The Wells Fargo Advantage Dow Jones Target Date FundsSM based on the Dow Jones Target Date IndexesSM, are not sponsored, endorsed, sold or promoted by Dow Jones, CME Indexes or their respective affiliates and none of them makes any representation regarding the advisability of investing in such product(s).
NOT FDIC INSURED ¡ NO BANK GUARANTEE ¡ MAY LOSE VALUE
Not part of the semi-annual report.
Wells Fargo Advantage Funds offers more than 110 mutual funds across a wide range of asset classes, representing over $211 billion in assets under management, as of April 30, 2012.
| | | | |
| Equity Funds | | | | |
Asia Pacific Fund | | Enterprise Fund† | | Precious Metals Fund |
C&B Large Cap Value Fund | | Equity Value Fund | | Premier Large Company Growth Fund |
C&B Mid Cap Value Fund | | Global Opportunities Fund | | Small Cap Opportunities Fund |
Capital Growth Fund | | Growth Fund | | Small Cap Value Fund |
Common Stock Fund | | Index Fund | | Small Company Growth Fund |
Disciplined U.S. Core Fund | | International Equity Fund | | Small Company Value Fund |
Discovery Fund† | | International Value Fund | | Small/Mid Cap Core Fund |
Diversified Equity Fund | | Intrinsic Small Cap Value Fund | | Small/Mid Cap Value Fund |
Diversified International Fund | | Intrinsic Value Fund | | Special Mid Cap Value Fund |
Diversified Small Cap Fund | | Intrinsic World Equity Fund | | Special Small Cap Value Fund |
Emerging Growth Fund | | Large Cap Core Fund | | Specialized Technology Fund |
Emerging Markets Equity Fund | | Large Cap Growth Fund | | Traditional Small Cap Growth Fund |
Emerging Markets Equity Income Fund | | Large Company Value Fund | | Utility and Telecommunications Fund |
Emerging Markets Local Bond Fund | | Omega Growth Fund | | |
Endeavor Select Fund† | | Opportunity Fund† | | |
| Bond Funds | | | | |
Adjustable Rate Government Fund | | Inflation-Protected Bond Fund | | Short-Term Bond Fund |
California Limited-Term Tax-Free Fund | | Intermediate Tax/AMT-Free Fund | | Short-Term High Yield Bond Fund |
California Tax-Free Fund | | International Bond Fund | | Short-Term Municipal Bond Fund |
Colorado Tax-Free Fund | | Minnesota Tax-Free Fund | | Strategic Municipal Bond Fund |
Government Securities Fund | | Municipal Bond Fund | | Total Return Bond Fund |
High Income Fund | | North Carolina Tax-Free Fund | | Ultra Short-Term Income Fund |
High Yield Bond Fund | | Pennsylvania Tax-Free Fund | | Ultra Short-Term Municipal Income Fund |
Income Plus Fund | | Short Duration Government Bond Fund | | Wisconsin Tax-Free Fund |
| Asset Allocation Funds | | | | |
Absolute Return Fund | | WealthBuilder Equity Portfolio† | | Target 2020 Fund† |
Asset Allocation Fund | | WealthBuilder Growth Allocation Portfolio† | | Target 2025 Fund† |
Conservative Allocation Fund | | WealthBuilder Growth Balanced Portfolio† | | Target 2030 Fund† |
Diversified Capital Builder Fund | | WealthBuilder Moderate Balanced Portfolio† | | Target 2035 Fund† |
Diversified Income Builder Fund | | WealthBuilder Tactical Equity Portfolio† | | Target 2040 Fund† |
Growth Balanced Fund | | Target Today Fund† | | Target 2045 Fund† |
Index Asset Allocation Fund | | Target 2010 Fund† | | Target 2050 Fund† |
Moderate Balanced Fund | | Target 2015 Fund† | | Target 2055 Fund† |
WealthBuilder Conservative Allocation Portfolio† | | | | |
| Money Market Funds | | | | |
100% Treasury Money Market Fund | | Heritage Money Market Fund† | | National Tax-Free Money Market Fund |
California Municipal Money Market Fund | | Money Market Fund | | Prime Investment Money Market Fund |
Cash Investment Money Market Fund | | Municipal Cash Management Money Market Fund | | Treasury Plus Money Market Fund |
Government Money Market Fund | | Municipal Money Market Fund | | |
| Variable Trust Funds1 | | | | |
VT Discovery Fund† | | VT Intrinsic Value Fund | | VT Small Cap Growth Fund |
VT Index Asset Allocation Fund | | VT Omega Growth Fund | | VT Small Cap Value Fund |
VT International Equity Fund | | VT Opportunity Fund† | | VT Total Return Bond Fund |
An investment in a money market fund is not insured or guaranteed by the Federal Deposit Insurance Corporation or any other government agency. Although the Wells Fargo Advantage Money Market Funds seek to preserve the value of your investment at $1.00 per share, it is possible to lose money by investing in a money market fund.
| 1. | The Variable Trust Funds are generally available only through insurance company variable contracts. |
| † | In this report, the Wells Fargo Advantage Discovery FundSM, Wells Fargo Advantage Endeavor Select FundSM, Wells Fargo Advantage Enterprise FundSM, Wells Fargo Advantage Opportunity FundSM, Wells Fargo Advantage WealthBuilder Conservative Allocation PortfolioSM, Wells Fargo Advantage WealthBuilder Equity PortfolioSM, Wells Fargo Advantage WealthBuilder Growth Allocation PortfolioSM, Wells Fargo Advantage WealthBuilder Growth Balanced PortfolioSM, Wells Fargo Advantage WealthBuilder Moderate Balanced PortfolioSM, Wells Fargo Advantage WealthBuilder Tactical Equity PortfolioSM, Wells Fargo Advantage Dow Jones Target Today FundSM, Wells Fargo Advantage Dow Jones Target 2010 FundSM, Wells Fargo Advantage Dow Jones Target 2015 FundSM, Wells Fargo Advantage Dow Jones Target 2020 FundSM, Wells Fargo Advantage Dow Jones Target 2025 FundSM, Wells Fargo Advantage Dow Jones Target 2030 FundSM, Wells Fargo Advantage Dow Jones Target 2035 FundSM, Wells Fargo Advantage Dow Jones Target 2040 FundSM, Wells Fargo Advantage Dow Jones Target 2045 FundSM, Wells Fargo Advantage Dow Jones Target 2050 FundSM, Wells Fargo Advantage Dow Jones Target 2055 FundSM, Wells Fargo Advantage Heritage Money Market FundSM, Wells Fargo Advantage VT Discovery FundSM, and Wells Fargo Advantage VT Opportunity FundSM are referred to as the Discovery Fund, Endeavor Select Fund, Enterprise Fund, Opportunity Fund, WealthBuilder Conservative Allocation Portfolio, WealthBuilder Equity Portfolio, WealthBuilder Growth Allocation Portfolio, WealthBuilder Growth Balanced Portfolio, WealthBuilder Moderate Balanced Portfolio, WealthBuilder Tactical Equity Portfolio, Target Today Fund, Target 2010 Fund, Target 2015 Fund, Target 2020 Fund, Target 2025 Fund, Target 2030 Fund, Target 2035 Fund, Target 2040 Fund, Target 2045 Fund, Target 2050 Fund, Target 2055 Fund, Heritage Money Market Fund, VT Discovery Fund, and VT Opportunity Fund, respectively. |
Not part of the semi-annual report.
| | | | |
| 2 | | Wells Fargo Advantage Traditional Small Cap Growth Fund | | Letter to Shareholders |

Karla M. Rabusch,
President
Wells Fargo Advantage Funds
The period was marked by continued concerns about the possible global economic effects of the ongoing European sovereign debt crisis that began in Greece and later spread to the larger economies of Italy and Spain.
In contrast to worrisome data from the eurozone, U.S. economic data remained moderately positive.
Dear Valued Shareholder:
We’re pleased to offer you this semi-annual report for the Wells Fargo Advantage Traditional Small Cap Growth Fund for the six-month period that ended April 30, 2012. The period was marked by continued concerns about the possible global economic effects of the ongoing European sovereign debt crisis that began in Greece and later spread to the larger economies of Italy and Spain. However, relatively positive U.S. economic data resulted in most U.S. stock indexes posting gains for the period, with large-cap stocks modestly outperforming small-cap stocks.
Macroeconomic optimism seemed to fade as global growth slowed and worries rose.
Prior to and throughout the reporting period, concerns about the eurozone sovereign debt situation returned to center stage. Investors became increasingly concerned that Greece would default on its debt, a scenario that only seemed more likely as eurozone leaders began to openly discuss a “voluntary” haircut on Greek debt for private investors. Because many eurozone banks owned Greek debt and many U.S. banks had financial ties to eurozone banks, investors worried about the effects of such an event on the financial systems and on the global economy.
In October 2011, market participants turned their attention to the debt burdens of Italy—which, like the U.S., also had its credit rating downgraded by Standard & Poor’s—because even though it had a relatively modest budget deficit, it had a high amount of outstanding debt and a stagnant economy. French banks were heavily exposed to Italian debt, so Italy’s woes led to fears of a state bailout of French banks and a resulting increase in France’s expenditures.
The Greek credit crisis was seemingly addressed in March 2012, when the Greek government came to an agreement with its creditors that allowed it to write down the principal on most of its bonds in exchange for increased financial austerity. The Greek agreement, combined with unprecedented support for eurozone banks by the European Central Bank (ECB), seemed to calm investor concerns, at least temporarily, and most developed European markets ended the period with gains.
The U.S. economy reported relatively solid news.
In contrast to worrisome data from the eurozone, U.S. economic data remained moderately positive. Reported gross domestic product (GDP) growth came in at a 1.8% annualized rate in the third quarter of 2011 and then accelerated to a 3.0% annualized rate in the fourth quarter. The initial estimate for GDP growth in the first quarter of 2012 came in at a 2.2% annualized rate, further supporting the case for economic recovery. In addition, the major banks appeared to have taken steps toward repairing their balance sheets; in March, the Federal Reserve (Fed) announced that 15 of the 19 major banks had passed a “stress test” in which the Fed attempted to gauge whether the banks could survive a severe recession that included a 50% drop in the stock market and a 21% percent decline in housing prices.
Financial stocks rebounded and outperformed the broader market for the reporting period after the Fed released details of the stress test. Stocks generally rallied across the market as investors seemed to be increasingly confident that the U.S. would not return to recession.
| | | | | | |
| Letter to Shareholders | | Wells Fargo Advantage Traditional Small Cap Growth Fund | | | 3 | |
Central banks continued to provide stimulus.
Throughout the reporting period, the Federal Open Market Committee kept its key interest rates effectively at zero in order to support the economy and financial system. In response to extreme market volatility and signs of a weakening economy, the Fed announced its intention to keep interest rates low until at least late 2014.
As of November 1, 2011, the ECB had a key rate of 1.50%, which it had increased from 1.0% in an attempt to keep inflation in check. Soon, in response to weakness in the southern European economies, the ECB lowered its key rate to 1.25% in early November 2011 and 1.0% in December 2011. The ECB also continued to provide virtually unlimited liquidity for banks, announcing a Long-Term Refinancing Operation in December through which it provided low-cost three-year loans to lenders.
We use time-tested investment strategies, even as many variables are at work in the market.
Elevated unemployment and debt defaults continue to pressure consumers and businesses alike. In our experience, strict adherence to time-tested investment strategies has its rewards. As a whole, Wells Fargo Advantage Funds represents investments across a range of asset classes and investment styles, giving you an opportunity to create a diversified investment portfolio. While diversification may not prevent losses in a downturn, we believe it helps in managing risk.
Thank you for choosing to invest with Wells Fargo Advantage Funds. We appreciate your confidence in us and remain committed to helping you meet your financial needs. For current information about your fund investments, contact your investment professional, visit our Web site at wellsfargoadvantagefunds.com, or call us directly at 1-800-222-8222. We are available 24 hours a day, 7 days a week.
Sincerely,

Karla M. Rabusch
President
Wells Fargo Advantage Funds
| | | | |
| 4 | | Wells Fargo Advantage Traditional Small Cap Growth Fund | | Letter to Shareholders |
Notice to Shareholders
The Board of Trustees for Wells Fargo Advantage Funds has unanimously approved the following modifications to certain net asset value (NAV) waiver privileges and commission schedules:
| | n | | Effective May 1, 2012, automatic investment plan (AIP) purchases and proceeds received from systematic withdrawals will no longer qualify for NAV repurchase privileges. | |
| | n | | Effective May 1, 2012, discretionary rights to waive the upfront commission for Class C and “jumbo” Class A share purchases will no longer be granted to broker/dealers. However, we will continue to waive the Class C shares contingent deferred sales charge for redemptions by employer-sponsored retirement plans where the dealer of record waived its commission at the time of purchase. | |
| | n | | Effective July 31, 2012, NAV purchase privileges for former Evergreen Class IS and Class R shareholders are being modified to remove the ability to purchase Class A shares at NAV unless those shares are held directly with the Fund on or after July 31, 2012. | |
Please contact your investment professional or call us directly at 1-800-222-8222 if you have any questions on this Notice to Shareholders.
| | | | | | |
| Performance Highlights (Unaudited) | | Wells Fargo Advantage Traditional Small Cap Growth Fund | | | 5 | |
INVESTMENT OBJECTIVE
The Fund seeks long-term capital appreciation.
ADVISER
Wells Fargo Funds Management, LLC
SUB-ADVISER
Wells Capital Management Incorporated
PORTFOLIO MANAGERS
Paul Carder, CFA
Jeffrey S. Drummond, CFA
Linda Freeman, CFA
Jeffrey Harrison, CFA
FUND INCEPTION
April 15, 1985
| | | | |
TEN LARGEST EQUITY HOLDINGS1 (AS OF APRIL 30, 2012) | |
Concur Technologies Incorporated | | | 2.93% | |
SXC Health Solutions Corporation | | | 2.77% | |
Equinix Incorporated | | | 2.40% | |
Financial Engines Incorporated | | | 2.24% | |
Ploypore International Incorporated | | | 2.23% | |
Shutterfly Incorporated | | | 2.11% | �� |
Cavium Incorporated | | | 2.08% | |
InnerWorkings Incorporated | | | 1.98% | |
Ultimate Software Group Incorporated | | | 1.91% | |
EnerSys Company | | | 1.74% | |
| | |
SECTOR DISTRIBUTION2 (AS OF APRIL 30, 2012) | | |
|
 |
| 1. | The ten largest equity holdings are calculated based on the value of the securities divided by total net assets of the Fund. Holdings are subject to change and may have changed since the date specified. |
| 2. | Sector distribution is subject to change and is calculated based on the total long-term investments of the Fund. |
| | | | |
| 6 | | Wells Fargo Advantage Traditional Small Cap Growth Fund | | Performance Highlights (Unaudited) |
AVERAGE ANNUAL TOTAL RETURN3 (%) (AS OF APRIL 30, 2012)
| | | | | | | | | | | | | | | | | | | | | | | | | | | | | | | | | | | | | | | | | | | | |
| | | | | | Including Sales Charge | | | Excluding Sales Charge | | | Expense Ratios4 | |
| | | Inception Date | | | 6 Months* | | | 1 Year | | | 5 Year | | | 10 Year | | | 6 Months* | | | 1 Year | | | 5 Year | | | 10 Year | | | Gross | | | Net5 | |
Class A (EGWAX) | | | 06/05/1995 | | | | 7.08 | | | | (10.96 | ) | | | 2.00 | | | | 5.22 | | | | 13.59 | | | | (5.54 | ) | | | 3.21 | | | | 5.84 | | | | 1.43% | | | | 1.33% | |
Class C (EGWCX) | | | 07/30/2010 | | | | 12.18 | | | | (7.23 | ) | | | 2.44 | | | | 5.06 | | | | 13.18 | | | | (6.23 | ) | | | 2.44 | | | | 5.06 | | | | 2.18% | | | | 2.08% | |
Administrator Class (EGWDX) | | | 07/30/2010 | | | | | | | | | | | | | | | | | | | | 13.70 | | | | (5.34 | ) | | | 3.29 | | | | 5.92 | | | | 1.27% | | | | 1.20% | |
Institutional Class (EGRYX) | | | 11/19/1997 | | | | | | | | | | | | | | | | | | | | 13.78 | | | | (5.17 | ) | | | 3.51 | | | | 6.15 | | | | 1.00% | | | | 0.98% | |
Russell 2000® Growth Index6 | | | | | | | | | | | | | | | | | | | | | | | 10.58 | | | | (4.42 | ) | | | 3.27 | | | | 6.06 | | | | | | | | | |
| * | Returns for periods of less than one year are not annualized. |
Figures quoted represent past performance, which is no guarantee of future results and do not reflect the deduction of taxes that a shareholder may pay on fund distributions or the redemption of fund shares. Investment return and principal value of an investment will fluctuate so that an investor’s shares, when redeemed, may be worth more or less than their original cost. Performance shown without sales charges would be lower if sales charges were reflected. Current performance may be lower or higher than the performance data quoted and assumes the reinvestment of dividends and capital gains. Current month-end performance is available on the Fund’s Web site – wellsfargoadvantagefunds.com.
Index returns do not include transaction costs associated with buying and selling securities, any mutual fund fees or expenses or any taxes. It is not possible to invest directly in an index.
For Class A shares, the maximum front-end sales charge is 5.75%. For Class C shares, the maximum contingent deferred sales charge is 1.00%. Performance including sales charge assumes the sales charge for the corresponding time period. Administrator Class and Institutional Class shares are sold without a front-end sales charge or contingent deferred sales charge.
Stock fund values fluctuate in response to the activities of individual companies and general market and economic conditions. Smaller-company stocks tend to be more volatile and less liquid than those of larger companies. Consult the Fund’s prospectus for additional information on these and other risks.
| 3. | Historical performance shown for Class C shares prior to their inception reflects the performance of Class A shares, adjusted to reflect the higher expenses applicable to Class C shares. Historical performance shown for the Administrator Class shares prior to their inception reflects the performance of the Institutional Class shares, adjusted to reflect the higher expenses applicable to the Administrator Class shares. Historical performance shown for all classes of the Fund prior to July 19, 2010 is based on the performance of the Fund’s predecessor, Evergreen Growth Fund. |
| 4. | Reflects the expense ratios as stated in the most recent prospectuses. |
| 5. | The Adviser has committed through July 18, 2013 to waive fees and/or reimburse expenses to the extent necessary to cap the Fund’s Total Annual Fund Operating Expenses After Fee Waiver, excluding certain expenses, at the amounts shown above. Without this cap, the Fund’s returns would have been lower. |
| 6. | The Russell 2000® Growth Index measures the performance of those Russell 2000 companies with higher price-to-book ratios and higher forecasted growth values. You cannot invest directly in an index. |
| | | | | | |
| Fund Expenses (Unaudited) | | Wells Fargo Advantage Traditional Small Cap Growth Fund | | | 7 | |
As a shareholder of the Fund, you incur two types of costs: (1) transaction costs, including sales charges (loads) on purchase payments and contingent deferred sales charges (if any) on redemptions and (2) ongoing costs, including management fees; distribution (12b-1) and/or shareholder service fees; and other Fund expenses. This example is intended to help you understand your ongoing costs (in dollars) of investing in the Fund and to compare these costs with the ongoing costs of investing in other mutual funds.
The example is based on an investment of $1,000 invested at the beginning of the six-month period and held for the entire period from November 1, 2011 to April 30, 2012.
Actual Expenses
The “Actual” line of the table below provides information about actual account values and actual expenses. You may use the information in this line, together with the amount you invested, to estimate the expenses that you paid over the period. Simply divide your account value by $1,000 (for example, an $8,600 account value divided by $1,000 = 8.6), then multiply the result by the number in the “Actual” line under the heading entitled “Expenses Paid During Period” for your applicable class of shares to estimate the expenses you paid on your account during this period.
Hypothetical Example for Comparison Purposes
The “Hypothetical” line of the table below provides information about hypothetical account values and hypothetical expenses based on the Fund’s actual expense ratio and an assumed rate of return of 5% per year before expenses, which is not the Fund’s actual return. The hypothetical account values and expenses may not be used to estimate the actual ending account balance or expenses you paid for the period. You may use this information to compare the ongoing costs of investing in the Fund and other funds. To do so, compare this 5% hypothetical example with the 5% hypothetical examples that appear in the shareholder reports of the other funds.
Please note that the expenses shown in the table are meant to highlight your ongoing costs only and do not reflect any transactional costs, such as sales charges (loads) and contingent deferred sales charges. Therefore, the “Hypothetical” line of the table is useful in comparing ongoing costs only, and will not help you determine the relative total costs of owning different funds. In addition, if these transactional costs were included, your costs would have been higher.
| | | | | | | | | | | | | | | | |
| | | Beginning
Account Value
11-01-2011 | | | Ending
Account Value
04-30-2012 | | | Expenses
Paid During
the Period1 | | | Net Annual
Expense Ratio | |
Class A | | | | | | | | | | | | | | | | |
Actual | | $ | 1,000.00 | | | $ | 1,135.86 | | | $ | 7.06 | | | | 1.33 | % |
Hypothetical (5% return before expenses) | | $ | 1,000.00 | | | $ | 1,018.25 | | | $ | 6.67 | | | | 1.33 | % |
Class C | | | | | | | | | | | | | | | | |
Actual | | $ | 1,000.00 | | | $ | 1,131.84 | | | $ | 11.02 | | | | 2.08 | % |
Hypothetical (5% return before expenses) | | $ | 1,000.00 | | | $ | 1,014.52 | | | $ | 10.42 | | | | 2.08 | % |
Administrator Class | | | | | | | | | | | | | | | | |
Actual | | $ | 1,000.00 | | | $ | 1,136.99 | | | $ | 6.22 | | | | 1.17 | % |
Hypothetical (5% return before expenses) | | $ | 1,000.00 | | | $ | 1,019.05 | | | $ | 5.87 | | | | 1.17 | % |
Institutional Class | | | | | | | | | | | | | | | | |
Actual | | $ | 1,000.00 | | | $ | 1,137.80 | | | $ | 5.21 | | | | 0.98 | % |
Hypothetical (5% return before expenses) | | $ | 1,000.00 | | | $ | 1,019.99 | | | $ | 4.92 | | | | 0.98 | % |
| 1. | Expenses paid is equal to the annualized expense ratio of each class multiplied by the average account value over the period, multiplied by the number of days in the most recent fiscal half-year divided by the number of days in the fiscal year (to reflect the one-half year period). |
| | | | |
| 8 | | Wells Fargo Advantage Traditional Small Cap Growth Fund | | Portfolio of Investments—April 30, 2012 (Unaudited) |
| | | | | | | | | | | | |
| Security Name | | | | | | Shares | | | Value | |
| | | | | | | | | | | | |
| | | | |
Common Stocks: 97.67% | | | | | | | | | | | | |
| | | | |
Consumer Discretionary: 15.44% | | | | | | | | | | | | |
| | | | |
| Auto Components: 1.07% | | | | | | | | | | | | |
Dana Holding Corporation | | | | | | | 147,100 | | | $ | 2,150,602 | |
| | | | | | | | | | | | |
| | | | |
| Diversified Consumer Services: 1.57% | | | | | | | | | | | | |
K12 Incorporated Ǡ | | | | | | | 34,100 | | | | 869,550 | |
Sotheby’s Holdings Incorporated | | | | | | | 58,200 | | | | 2,288,424 | |
| | | | |
| | | | | | | | | | | 3,157,974 | |
| | | | | | | | | | | | |
| | | | |
| Hotels, Restaurants & Leisure: 2.24% | | | | | | | | | | | | |
Gaylord Entertainment Company Ǡ | | | | | | | 46,700 | | | | 1,470,116 | |
Shuffle Master Incorporated † | | | | | | | 172,600 | | | | 3,049,842 | |
| | | | |
| | | | | | | | | | | 4,519,958 | |
| | | | | | | | | | | | |
| | | | |
| Household Durables: 0.88% | | | | | | | | | | | | |
Sodastream International Limited Ǡ | | | | | | | 51,800 | | | | 1,779,330 | |
| | | | | | | | | | | | |
| | | | |
| Internet & Catalog Retail: 2.11% | | | | | | | | | | | | |
Shutterfly Incorporated † | | | | | | | 136,500 | | | | 4,247,880 | |
| | | | | | | | | | | | |
| | | | |
| Leisure Equipment & Products: 1.06% | | | | | | | | | | | | |
LeapFrog Enterprises Incorporated † | | | | | | | 229,929 | | | | 2,147,537 | |
| | | | | | | | | | | | |
| | | | |
| Specialty Retail: 4.72% | | | | | | | | | | | | |
Group 1 Automotive Incorporated | | | | | | | 29,500 | | | | 1,707,460 | |
Ulta Salon Cosmetics & Fragrance Incorporated | | | | | | | 26,100 | | | | 2,301,498 | |
Vitamin Shoppe Incorporated † | | | | | | | 71,438 | | | | 3,362,587 | |
Zumiez Incorporated Ǡ | | | | | | | 58,300 | | | | 2,137,278 | |
| | | | |
| | | | | | | | | | | 9,508,823 | |
| | | | | | | | | | | | |
| | | | |
| Textiles, Apparel & Luxury Goods: 1.79% | | | | | | | | | | | | |
Oxford Industries Incorporated | | | | | | | 34,300 | | | | 1,646,057 | |
Vera Bradley Incorporated Ǡ | | | | | | | 75,200 | | | | 1,953,696 | |
| | | | |
| | | | | | | | | | | 3,599,753 | |
| | | | | | | | | | | | |
| | | | |
Consumer Staples: 0.94% | | | | | | | | | | | | |
| | | | |
| Personal Products: 0.94% | | | | | | | | | | | | |
Elizabeth Arden Incorporated † | | | | | | | 48,700 | | | | 1,898,326 | |
| | | | | | | | | | | | |
| | | | |
Energy: 5.83% | | | | | | | | | | | | |
| | | | |
| Energy Equipment & Services: 3.39% | | | | | | | | | | | | |
ION Geophysical Corporation Ǡ | | | | | | | 310,200 | | | | 1,932,546 | |
Key Energy Services Incorporated Ǡ | | | | | | | 149,700 | | | | 1,895,202 | |
Lufkin Industries Incorporated « | | | | | | | 38,900 | | | | 2,989,076 | |
| | | | |
| | | | | | | | | | | 6,816,824 | |
| | | | | | | | | | | | |
The accompanying notes are an integral part of these financial statements.
| | | | | | |
| Portfolio of Investments—April 30, 2012 (Unaudited) | | Wells Fargo Advantage Traditional Small Cap Growth Fund | | | 9 | |
| | | | | | | | | | | | |
| Security Name | | | | | | Shares | | | Value | |
| | | | | | | | | | | | |
| | | | |
| Oil, Gas & Consumable Fuels: 2.44% | | | | | | | | | | | | |
Berry Petroleum Company Class A « | | | | | | | 62,200 | | | $ | 2,833,210 | |
Energy XXI Bermuda Limited † | | | | | | | 55,400 | | | | 2,087,472 | |
| | | | |
| | | | | | | | | | | 4,920,682 | |
| | | | | | | | | | | | |
| | | | |
Financials: 6.03% | | | | | | | | | | | | |
| | | | |
| Capital Markets: 3.61% | | | | | | | | | | | | |
Financial Engines Incorporated Ǡ | | | | | | | 197,900 | | | | 4,520,036 | |
Stifel Financial Corporation Ǡ | | | | | | | 75,300 | | | | 2,742,426 | |
| | | | |
| | | | | | | | | | | 7,262,462 | |
| | | | | | | | | | | | |
| | | | |
| Diversified Financial Services: 2.42% | | | | | | | | | | | | |
MarketAxess Holdings Incorporated | | | | | | | 81,600 | | | | 2,799,696 | |
Portfolio Recovery Associates Incorporated † | | | | | | | 30,155 | | | | 2,075,267 | |
| | | | |
| | | | | | | | | | | 4,874,963 | |
| | | | | | | | | | | | |
| | | | |
Health Care: 17.54% | | | | | | | | | | | | |
| | | | |
| Biotechnology: 6.36% | | | | | | | | | | | | |
Ariad Pharmaceuticals Incorporated Ǡ | | | | | | | 123,400 | | | | 2,011,420 | |
Cepheid Incorporated Ǡ | | | | | | | 72,800 | | | | 2,796,248 | |
Cubist Pharmaceuticals Incorporated † | | | | | | | 66,800 | | | | 2,824,304 | |
Exact Sciences Corporation Ǡ | | | | | | | 257,600 | | | | 2,774,352 | |
Incyte Corporation Ǡ | | | | | | | 105,900 | | | | 2,401,812 | |
| | | | |
| | | | | | | | | | | 12,808,136 | |
| | | | | | | | | | | | |
| | | | |
| Health Care Equipment & Supplies: 6.28% | | | | | | | | | | | | |
DexCom Incorporated † | | | | | | | 303,737 | | | | 2,973,585 | |
NxStage Medical Incorporated † | | | | | | | 156,000 | | | | 2,652,000 | |
STAAR Surgical Company † | | | | | | | 111,100 | | | | 1,218,767 | |
Tornier NV † | | | | | | | 113,700 | | | | 2,699,238 | |
Volcano Corporation Ǡ | | | | | | | 114,077 | | | | 3,097,191 | |
| | | | |
| | | | | | | | | | | 12,640,781 | |
| | | | | | | | | | | | |
| | | | |
| Health Care Providers & Services: 0.57% | | | | | | | | | | | | |
HMS Holdings Corporation Ǡ | | | | | | | 36,900 | | | | 887,814 | |
IPC The Hospitalist Company † | | | | | | | 7,000 | | | | 269,029 | |
| | | | |
| | | | | | | | | | | 1,156,843 | |
| | | | | | | | | | | | |
| | | | |
| Health Care Technology: 4.33% | | | | | | | | | | | | |
Athena Health Incorporated Ǡ | | | | | | | 22,700 | | | | 1,644,615 | |
SXC Health Solutions Corporation † | | | | | | | 61,700 | | | | 5,588,786 | |
Vocera Communications Incorporated † | | | | | | | 67,242 | | | | 1,489,410 | |
| | | | |
| | | | | | | | | | | 8,722,811 | |
| | | | | | | | | | | | |
The accompanying notes are an integral part of these financial statements.
| | | | |
| 10 | | Wells Fargo Advantage Traditional Small Cap Growth Fund | | Portfolio of Investments—April 30, 2012 (Unaudited) |
| | | | | | | | | | | | |
| Security Name | | | | | | Shares | | | Value | |
| | | | | | | | | | | | |
| | | | |
Industrials: 17.43% | | | | | | | | | | | | |
| | | | |
| Aerospace & Defense: 2.90% | | | | | | | | | | | | |
Hexcel Corporation Ǡ | | | | | | | 115,943 | | | $ | 3,174,519 | |
KEYW Holding Corporation Ǡ | | | | | | | 284,198 | | | | 2,671,461 | |
| | | | |
| | | | | | | | | | | 5,845,980 | |
| | | | | | | | | | | | |
| | | | |
| Air Freight & Logistics: 1.99% | | | | | | | | | | | | |
Atlas Air Worldwide Holdings Incorporated † | | | | | | | 47,600 | | | | 2,191,980 | |
Forward Air Corporation | | | | | | | 53,561 | | | | 1,809,291 | |
| | | | |
| | | | | | | | | | | 4,001,271 | |
| | | | | | | | | | | | |
| | | | |
| Commercial Services & Supplies: 1.97% | | | | | | | | | | | | |
InnerWorkings Incorporated Ǡ | | | | | | | 345,849 | | | | 3,980,722 | |
| | | | | | | | | | | | |
| | | | |
| Electrical Equipment: 3.97% | | | | | | | | | | | | |
EnerSys Company Ǡ | | | | | | | 100,300 | | | | 3,505,485 | |
Polypore International Incorporated Ǡ | | | | | | | 120,137 | | | | 4,487,117 | |
| | | | |
| | | | | | | | | | | 7,992,602 | |
| | | | | | | | | | | | |
| | | | |
| Machinery: 4.93% | | | | | | | | | | | | |
Barnes Group Incorporated « | | | | | | | 128,400 | | | | 3,389,760 | |
RBC Bearings Incorporated Ǡ | | | | | | | 71,547 | | | | 3,354,123 | |
Titan International Incorporated « | | | | | | | 110,352 | | | | 3,188,069 | |
| | | | |
| | | | | | | | | | | 9,931,952 | |
| | | | | | | | | | | | |
| | | | |
| Professional Services: 0.04% | | | | | | | | | | | | |
Sequenom Incorporated † | | | | | | | 14,561 | | | | 74,552 | |
| | | | | | | | | | | | |
| | | | |
| Trading Companies & Distributors: 1.63% | | | | | | | | | | | | |
MSC Industrial Direct Company | | | | | | | 44,700 | | | | 3,294,837 | |
| | | | | | | | | | | | |
| | | | |
Information Technology: 29.83% | | | | | | | | | | | | |
| | | | |
| Communications Equipment: 1.22% | | | | | | | | | | | | |
Acme Packet Incorporated Ǡ | | | | | | | 44,400 | | | | 1,246,308 | |
Procera Networks Incorporated † | | | | | | | 58,071 | | | | 1,205,554 | |
| | | | |
| | | | | | | | | | | 2,451,862 | |
| | | | | | | | | | | | |
| | | | |
| Electronic Equipment, Instruments & Components: 0.67% | | | | | | | | | | | | |
Ciena Corporation † | | | | | | | 91,600 | | | | 1,357,512 | |
| | | | | | | | | | | | |
| | | | |
| Internet Software & Services: 13.98% | | | | | | | | | | | | |
Angie’s List Incorporated «† | | | | | | | 119,034 | | | | 1,660,524 | |
Brightcove Incorporated † | | | | | | | 49,928 | | | | 936,150 | |
Callidus Software Incorporated Ǡ | | | | | | | 139,100 | | | | 1,101,672 | |
Cogent Communications Group Incorporated † | | | | | | | 125,600 | | | | 2,352,488 | |
ComScore Incorporated Ǡ | | | | | | | 102,922 | | | | 2,050,206 | |
Equinix Incorporated Ǡ | | | | | | | 29,454 | | | | 4,836,347 | |
LivePerson Incorporated † | | | | | | | 156,142 | | | | 2,479,535 | |
LogMeIn Incorporated Ǡ | | | | | | | 88,100 | | | | 3,172,481 | |
The accompanying notes are an integral part of these financial statements.
| | | | | | |
| Portfolio of Investments—April 30, 2012 (Unaudited) | | Wells Fargo Advantage Traditional Small Cap Growth Fund | | | 11 | |
`
| | | | | | | | | | | | | | |
| Security Name | | | | | | | Shares | | | Value | |
| | | | | | | | | | | | | | |
| | | | |
| Internet Software & Services (continued) | | | | | | | | | | | | | | |
Rackspace Hosting Incorporated † | | | | | | | | | 25,700 | | | $ | 1,492,913 | |
SPS Commerce Incorporated † | | | | | | | | | 65,809 | | | | 1,830,806 | |
Support.com Incorporated † | | | | | | | | | 711,493 | | | | 2,582,720 | |
Vocus Incorporated Ǡ | | | | | | | | | 155,808 | | | | 2,014,597 | |
Zillow Incorporated † | | | | | | | | | 47,300 | | | | 1,649,351 | |
| | | | |
| | | | | | | | | | | | | 28,159,790 | |
| | | | | | | | | | | | | | |
| | | | |
| Semiconductors & Semiconductor Equipment: 6.96% | | | | | | | | | | | | | | |
Cavium Incorporated † | | | | | | | | | 143,100 | | | | 4,187,106 | |
Mellanox Technologies † | | | | | | | | | 31,784 | | | | 1,862,225 | |
Power Integrations Incorporated | | | | | | | | | 51,800 | | | | 1,962,184 | |
Silicon Image Incorporated † | | | | | | | | | 484,900 | | | | 2,909,400 | |
Volterra Semiconductor Corporation Ǡ | | | | | | | | | 94,600 | | | | 3,111,394 | |
| | | | |
| | | | | | | | | | | | | 14,032,309 | |
| | | | | | | | | | | | | | |
| | | | |
| Software: 7.00% | | | | | | | | | | | | | | |
Concur Technologies Incorporated Ǡ | | | | | | | | | 104,278 | | | | 5,897,964 | |
Qlik Technologies Incorporated † | | | | | | | | | 52,600 | | | | 1,515,406 | |
Sourcefire Incorporated Ǡ | | | | | | | | | 55,700 | | | | 2,840,143 | |
Ultimate Software Group Incorporated † | | | | | | | | | 49,874 | | | | 3,848,278 | |
| | | | |
| | | | | | | | | | | | | 14,101,791 | |
| | | | | | | | | | | | | | |
| | | | |
Materials: 4.63% | | | | | | | | | | | | | | |
| | | | |
| Chemicals: 3.16% | | | | | | | | | | | | | | |
Intrepid Potash Incorporated Ǡ | | | | | | | | | 140,838 | | | | 3,499,824 | |
Rockwood Holdings Incorporated † | | | | | | | | | 51,752 | | | | 2,863,956 | |
| | | | |
| | | | | | | | | | | | | 6,363,780 | |
| | | | | | | | | | | | | | |
| | | | |
| Metals & Mining: 1.47% | | | | | | | | | | | | | | |
Materion Corporation † | | | | | | | | | 119,797 | | | | 2,960,184 | |
| | | | | | | | | | | | | | |
| | | | |
Total Common Stocks (Cost $157,655,366) | | | | | | | | | | | | | 196,762,829 | |
| | | | | | | | | | | | | | |
| | | | |
| | | | | Yield | | | | | | | |
| Short-Term Investments: 31.75% | | | | | | | | | | | | | | |
| | | | |
| Investment Companies: 31.75% | | | | | | | | | | | | | | |
Wells Fargo Advantage Cash Investment Money Market Fund, Select Class (l)(u) | | | | | 0.11 | % | | | 3,884,133 | | | | 3,884,133 | |
Wells Fargo Securities Lending Cash Investments, LLC (l)(u)(r)(v) | | | | | 0.19 | | | | 60,077,028 | | | | 60,077,028 | |
| | | | |
Total Short-Term Investments (Cost $63,961,161) | | | | | | | | | | | | | 63,961,161 | |
| | | | | | | | | | | | | | |
| | | | | | | | |
| Total Investments in Securities | | | | | | | | |
| (Cost $221,616,527) * | | | 129.42 | % | | | 260,723,990 | |
Other Assets and Liabilities, Net | | | (29.42 | ) | | | (59,264,148 | ) |
| | | | | | | | |
| Total Net Assets | | | 100.00 | % | | $ | 201,459,842 | |
| | | | | | | | |
The accompanying notes are an integral part of these financial statements.
| | | | |
| 12 | | Wells Fargo Advantage Traditional Small Cap Growth Fund | | Portfolio of Investments—April 30, 2012 (Unaudited) |
| « | All or a portion of this security is on loan. |
| † | Non-income earning security |
| (l) | Investment in an affiliate |
| (u) | Rate shown is the 7-day annualized yield at period end. |
| (r) | The investment company is exempt from registration under Section 3(c)(7) of the 1940 Act. |
| (v) | Security represents investment of cash collateral received from securities on loan. |
| * | Cost for federal income tax purposes is $224,301,451 and net unrealized appreciation (depreciation) consists of: |
| | | | |
Gross unrealized appreciation | | $ | 42,088,824 | |
Gross unrealized depreciation | | | (5,666,285 | ) |
| | | | |
Net unrealized appreciation | | $ | 36,422,539 | |
The accompanying notes are an integral part of these financial statements.
| | | | | | |
| Statement of Assets and Liabilities—April 30, 2012 (Unaudited) | | Wells Fargo Advantage Traditional Small Cap Growth Fund | | | 13 | |
| | | | |
| | | | |
| |
Assets | | | | |
Investments | | | | |
In unaffiliated securities (including securities on loan), at value (see cost below) | | $ | 196,762,829 | |
In affiliated securities, at value (see cost below) | | | 63,961,161 | |
| | | | |
Total investments, at value (see cost below) | | | 260,723,990 | |
Receivable for investments sold | | | 3,496,513 | |
Receivable for Fund shares sold | | | 75,560 | |
Receivable for dividends | | | 37,291 | |
Receivable for securities lending income | | | 71,470 | |
Prepaid expenses and other assets | | | 72,391 | |
| | | | |
Total assets | | | 264,477,215 | |
| | | | |
| |
Liabilities | | | | |
Payable for investments purchased | | | 2,297,607 | |
Payable for Fund shares redeemed | | | 353,997 | |
Payable upon receipt of securities loaned | | | 60,077,028 | |
Advisory fee payable | | | 115,066 | |
Distribution fees payable | | | 234 | |
Due to other related parties | | | 42,099 | |
Accrued expenses and other liabilities | | | 131,342 | |
| | | | |
Total liabilities | | | 63,017,373 | |
| | | | |
Total net assets | | $ | 201,459,842 | |
| | | | |
| |
NET ASSETS CONSIST OF | | | | |
Paid-in capital | | $ | 169,610,636 | |
Undistributed net investment loss | | | (674,300 | ) |
Accumulated net realized losses on investments | | | (6,583,957 | ) |
Net unrealized gains on investments | | | 39,107,463 | |
| | | | |
Total net assets | | $ | 201,459,842 | |
| | | | |
| |
COMPUTATION OF NET ASSET VALUE AND OFFERING PRICE PER SHARE1 | | | | |
Net assets – Class A | | $ | 130,468,618 | |
Shares outstanding – Class A | | | 7,503,627 | |
Net asset value per share – Class A | | | $17.39 | |
Maximum offering price per share – Class A2 | | | $18.45 | |
Net assets – Class C | | $ | 151,362 | |
Shares outstanding – Class C | | | 8,818 | |
Net asset value per share – Class C | | | $17.17 | |
Net assets – Administrator Class | | $ | 3,407,905 | |
Shares outstanding – Administrator Class | | | 186,720 | |
Net asset value per share – Administrator Class | | | $18.25 | |
Net assets – Institutional Class | | $ | 67,431,957 | |
Shares outstanding – Institutional Class | | | 3,680,600 | |
Net asset value per share – Institutional Class | | | $18.32 | |
| |
Investments in unaffiliated securities, at cost | | $ | 157,655,366 | |
| | | | |
Investments in affiliated securities, at cost | | $ | 63,961,161 | |
| | | | |
Total investments, at cost | | $ | 221,616,527 | |
| | | | |
Securities on loan, at value | | $ | 58,581,070 | |
| | | | |
| 1. | The Fund has an unlimited amount of authorized shares. |
| 2. | Maximum offering price is computed as 100/94.25 of net asset value. On investments of $50,000 or more, the offering price is reduced. |
The accompanying notes are an integral part of these financial statements.
| | | | |
| 14 | | Wells Fargo Advantage Traditional Small Cap Growth Fund | | Statement of Operations—Six Months Ended April 30, 2012 (Unaudited) |
| | | | |
| | | | |
| |
Investment income | | | | |
Securities lending income, net | | $ | 343,299 | |
Dividends | | | 197,531 | |
Income from affiliated securities | | | 1,146 | |
| | | | |
Total investment income | | | 541,976 | |
| | | | |
| |
Expenses | | | | |
Advisory fee | | | 794,047 | |
Administration fees | | | | |
Fund level | | | 49,628 | |
Class A | | | 163,233 | |
Class C | | | 155 | |
Administrator Class | | | 1,649 | |
Institutional Class | | | 27,812 | |
Shareholder servicing fees | | | | |
Class A | | | 156,955 | |
Class C | | | 149 | |
Administrator Class | | | 3,068 | |
Distribution fees | | | | |
Class C | | | 448 | |
Custody and accounting fees | | | 16,350 | |
Professional fees | | | 19,219 | |
Registration fees | | | 39,583 | |
Shareholder report expenses | | | 31,340 | |
Trustees’ fees and expenses | | | 6,091 | |
Other fees and expenses | | | 11,028 | |
| | | | |
Total expenses | | | 1,320,755 | |
Less: Fee waivers and/or expense reimbursements | | | (124,531 | ) |
| | | | |
Net expenses | | | 1,196,224 | |
| | | | |
Net investment loss | | | (654,248 | ) |
| | | | |
| |
REALIZED AND UNREALIZED GAINS (LOSSES) ON INVESTMENTS | | | | |
Net realized gains on investments | | | 14,600,920 | |
Net change in unrealized gains (losses) on investments | | | 11,409,300 | |
| | | | |
Net realized and unrealized gains (losses) on investments | | | 26,010,220 | |
| | | | |
Net increase in net assets resulting from operations | | $ | 25,355,972 | |
| | | | |
The accompanying notes are an integral part of these financial statements.
| | | | | | |
| Statements of Changes in Net Assets | | Wells Fargo Advantage Traditional Small Cap Growth Fund | | | 15 | |
| | | | | | | | | | | | | | | | |
| | | Six Months Ended
April 30, 2012
(Unaudited) | | | Year Ended
October 31, 2011 | |
| | | | |
Operations | | | | | | | | | | | | | | | | |
Net investment loss | | | | | | $ | (654,248 | ) | | | | | | $ | (1,987,386 | ) |
Net realized gains on investments | | | | | | | 14,600,920 | | | | | | | | 56,092,835 | |
Net change in unrealized gains (losses) on investments | | | | | | | 11,409,300 | | | | | | | | (34,488,100 | ) |
| | | | | | | | | | | | | | | | |
Net increase in net assets resulting from operations | | | | | | | 25,355,972 | | | | | | | | 19,617,349 | |
| | | | | | | | | | | | | | | | |
| | | | |
Capital share transactions | | | Shares | | | | | | | | Shares | | | | | |
Proceeds from shares sold | | | | | | | | | | | | | | | | |
Class A | | | 116,845 | | | | 1,896,199 | | | | 449,173 | | | | 7,360,081 | |
Class C | | | 2,713 | | | | 44,382 | | | | 3,392 | | | | 56,017 | |
Administrator Class | | | 10,811 | | | | 188,169 | | | | 259,289 | | | | 4,086,595 | |
Institutional Class | | | 197,076 | | | | 3,415,288 | | | | 525,626 | | | | 9,145,194 | |
| | | | | | | | | | | | | | | | |
| | | | | | | 5,544,038 | | | | | | | | 20,647,887 | |
| | | | | | | | | | | | | | | | |
Payment for shares redeemed | | | | | | | | | | | | | | | | |
Class A | | | (649,333 | ) | | | (10,517,559 | ) | | | (1,936,997 | ) | | | (31,195,829 | ) |
Class C | | | (1,478 | ) | | | (23,628 | ) | | | (2,715 | ) | | | (44,254 | ) |
Administrator Class | | | (36,582 | ) | | | (603,195 | ) | | | (47,523 | ) | | | (821,679 | ) |
Institutional Class | | | (954,545 | ) | | | (16,379,903 | ) | | | (3,116,766 | ) | | | (52,035,775 | ) |
| | | | | | | | | | | | | | | | |
| | | | | | | (27,524,285 | ) | | | | | | | (84,097,537 | ) |
| | | | | | | | | | | | | | | | |
Net decrease in net assets resulting from capital share
transactions | | | | | | | (21,980,247 | ) | | | | | | | (63,449,650 | ) |
| | | | | | | | | | | | | | | | |
Total increase (decrease) in net assets | | | | | | | 3,375,725 | | | | | | | | (43,832,301 | ) |
| | | | | | | | | | | | | | | | |
| | | | |
Net assets | | | | | | | | | | | | | | | | |
Beginning of period | | | | | | | 198,084,117 | | | | | | | | 241,916,418 | |
| | | | | | | | | | | | | | | | |
End of period | | | | | | $ | 201,459,842 | | | | | | | $ | 198,084,117 | |
| | | | | | | | | | | | | | | | |
Undistributed net investment loss | | | | | | $ | (674,300 | ) | | | | | | $ | (20,052 | ) |
| | | | | | | | | | | | | | | | |
The accompanying notes are an integral part of these financial statements.
| | | | |
| 16 | | Wells Fargo Advantage Traditional Small Cap Growth Fund | | Financial Highlights |
(For a share outstanding throughout each period)
| | | | | | | | | | | | | | | | | | | | | | | | | | | | |
| | | Six Months Ended
April 30, 2012 (Unaudited) | | | Year Ended October 31, | | | Year Ended September 30, | |
| Class A | | | 2011 | | | 20101 | | | 20102 | | | 20092 | | | 20082 | | | 20072 | |
Net asset value, beginning of period | | $ | 15.31 | | | $ | 14.31 | | | $ | 13.77 | | | $ | 12.24 | | | $ | 12.20 | | | $ | 18.70 | | | $ | 17.35 | |
Net investment loss | | | (0.06 | )3 | | | (0.16 | )3 | | | (0.02 | )3 | | | (0.12 | )3 | | | (0.04 | )3 | | | (0.03 | )3 | | | (0.12 | )3 |
Net realized and unrealized gains (losses) on investments | | | 2.14 | | | | 1.16 | | | | 0.56 | | | | 1.65 | | | | 0.10 | | | | (3.61 | ) | | | 3.63 | |
| | | | | | | | | | | | | | | | | | | | | | | | | | | | |
Total from investment operations | | | 2.08 | | | | 1.00 | | | | 0.54 | | | | 1.53 | | | | 0.06 | | | | (3.64 | ) | | | 3.51 | |
Distributions to shareholders from | | | | | | | | | | | | | | | | | | | | | | | | | | | | |
Net realized gains | | | 0.00 | | | | 0.00 | | | | 0.00 | | | | 0.00 | | | | (0.02 | ) | | | (2.84 | ) | | | (2.16 | ) |
Tax basis return of capital | | | 0.00 | | | | 0.00 | | | | 0.00 | | | | 0.00 | | | | 0.00 | | | | (0.02 | ) | | | 0.00 | |
| | | | | | | | | | | | | | | | | | | | | | | | | | | | |
Total distributions to shareholders | | | 0.00 | | | | 0.00 | | | | 0.00 | | | | 0.00 | | | | (0.02 | ) | | | (2.86 | ) | | | (2.16 | ) |
Net asset value, end of period | | $ | 17.39 | | | $ | 15.31 | | | $ | 14.31 | | | $ | 13.77 | | | $ | 12.24 | | | $ | 12.20 | | | $ | 18.70 | |
Total return4 | | | 13.59 | % | | | 6.99 | % | | | 3.92 | % | | | 12.50 | % | | | 0.53 | % | | | (22.75 | )% | | | 21.93 | % |
Ratios to average net assets (annualized) | | | | | | | | | | | | | | | | | | | | | | | | | | | | |
Gross expenses | | | 1.48 | % | | | 1.43 | % | | | 1.47 | % | | | 1.39 | % | | | 1.33 | % | | | 1.27 | % | | | 1.26 | % |
Net expenses | | | 1.33 | % | | | 1.33 | % | | | 1.33 | % | | | 1.33 | % | | | 1.33 | % | | | 1.25 | % | | | 1.25 | % |
Net investment loss | | | (0.78 | )% | | | (0.96 | )% | | | (0.64 | )% | | | (0.92 | )% | | | (0.45 | )% | | | (0.24 | )% | | | (0.68 | )% |
Supplemental data | | | | | | | | | | | | | | | | | | | | | | | | | | | | |
Portfolio turnover rate | | | 33 | % | | | 123 | % | | | 9 | % | | | 80 | % | | | 118 | % | | | 113 | % | | | 98 | % |
Net assets, end of period (000’s omitted) | | | $130,469 | | | | $123,063 | | | | $136,332 | | | | $133,166 | | | | $48,067 | | | | $56,067 | | | | $90,563 | |
| 1. | For the one month ended October 31, 2010. The Fund changed its fiscal year end from September 30 to October 31, effective October 31, 2010. |
| 2. | After the close of business on July 16, 2010, the Fund acquired the net assets of Evergreen Growth Fund which became the accounting and performance survivor in the transaction. The information for the periods prior to July 19, 2010 is that of Class A of Evergreen Growth Fund. |
| 3. | Calculated based upon average shares outstanding |
| 4. | Total return calculations do not include any sales charges. Returns for periods of less than one year are not annualized. |
The accompanying notes are an integral part of these financial statements.
| | | | | | |
| Financial Highlights | | Wells Fargo Advantage Traditional Small Cap Growth Fund | | | 17 | |
(For a share outstanding throughout each period)
| | | | | | | | | | | | | | | | |
| | | Six Months Ended
April 30, 2012 (Unaudited) | | | Year Ended October 31, | | | Year Ended
September 30, 20102 | |
| Class C | | | 2011 | | | 20101 | | |
Net asset value, beginning of period | | $ | 15.18 | | | $ | 14.29 | | | $ | 13.66 | | | $ | 13.18 | |
Net investment loss | | | (0.10 | ) | | | (0.27 | )3 | | | (0.02 | )3 | | | (0.04 | )3 |
Net realized and unrealized gains (losses) on investments | | | 2.09 | | | | 1.16 | | | | 0.65 | | | | 0.52 | |
| | | | | | | | | | | | | | | | |
Total from investment operations | | | 1.99 | | | | 0.89 | | | | 0.63 | | | | 0.48 | |
Net asset value, end of period | | $ | 17.17 | | | $ | 15.18 | | | $ | 14.29 | | | $ | 13.66 | |
Total return4 | | | 13.18 | % | | | 6.16 | % | | | 3.93 | % | | | 4.32 | % |
Ratios to average net assets (annualized) | | | | | | | | | | | | | | | | |
Gross expenses | | | 2.23 | % | | | 2.18 | % | | | 2.25 | % | | | 2.19 | % |
Net expenses | | | 2.08 | % | | | 2.08 | % | | | 2.08 | % | | | 2.08 | % |
Net investment loss | | | (1.54 | )% | | | (1.72 | )% | | | (1.31 | )% | | | (1.67 | )% |
Supplemental data | | | | | | | | | | | | | | | | |
Portfolio turnover rate | | | 33 | % | | | 123 | % | | | 9 | % | | | 80 | % |
Net assets, end of period (000’s omitted) | | | $151 | | | | $115 | | | | $99 | | | | $10 | |
| 1. | For the one month ended October 31, 2010. The Fund changed its fiscal year end from September 30 to October 31, effective October 31, 2010. |
| 2. | For the period from July 30, 2010 (commencement of class operations) to September 30, 2010 |
| 3. | Calculated based upon average shares outstanding |
| 4. | Total return calculations do not include any sales charges. Returns for periods of less than one year are not annualized. |
The accompanying notes are an integral part of these financial statements.
| | | | |
| 18 | | Wells Fargo Advantage Traditional Small Cap Growth Fund | | Financial Highlights |
(For a share outstanding throughout each period)
| | | | | | | | | | | | | | | | |
| | | Six Months Ended
April 30, 2012 (Unaudited) | | | Year Ended October 31, | | | Year Ended
September 30, 20102 | |
| Administrator Class | | | 2011 | | | 20101 | | |
Net asset value, beginning of period | | $ | 16.06 | | | $ | 14.99 | | | $ | 14.43 | | | $ | 13.80 | |
Net investment loss | | | (0.05 | )3 | | | (0.14 | )3 | | | (0.01 | )3 | | | (0.02 | )3 |
Net realized and unrealized gains (losses) on investments | | | 2.24 | | | | 1.21 | | | | 0.57 | | | | 0.65 | |
| | | | | | | | | | | | | | | | |
Total from investment operations | | | 2.19 | | | | 1.07 | | | | 0.56 | | | | 0.63 | |
Net asset value, end of period | | $ | 18.25 | | | $ | 16.06 | | | $ | 14.99 | | | $ | 14.43 | |
Total return4 | | | 13.70 | % | | | 7.14 | % | | | 3.95 | % | | | 4.49 | % |
Ratios to average net assets (annualized) | | | | | | | | | | | | | | | | |
Gross expenses | | | 1.26 | % | | | 1.23 | % | | | 1.31 | % | | | 1.37 | % |
Net expenses | | | 1.17 | % | | | 1.19 | % | | | 1.20 | % | | | 1.20 | % |
Net investment loss | | | (0.63 | )% | | | (0.83 | )% | | | (0.55 | )% | | | (0.77 | )% |
Supplemental data | | | | | | | | | | | | | | | | |
Portfolio turnover rate | | | 33 | % | | | 123 | % | | | 9 | % | | | 80 | % |
Net assets, end of period (000’s omitted) | | | $3,408 | | | | $3,413 | | | | $11 | | | | $10 | |
| 1. | For the one month ended October 31, 2010. The Fund changed its fiscal year end from September 30 to October 31, effective October 31, 2010. |
| 2. | For the period from July 30, 2010 (commencement of class operations) to September 30, 2010 |
| 3. | Calculated based upon average shares outstanding |
| 4. | Returns for periods of less than one year are not annualized. |
The accompanying notes are an integral part of these financial statements.
| | | | | | |
| Financial Highlights | | Wells Fargo Advantage Traditional Small Cap Growth Fund | | | 19 | |
(For a share outstanding throughout each period)
| | | | | | | | | | | | | | | | | | | | | | | | | | | | |
| | | Six Months Ended
April 30, 2012 (Unaudited) | | | Year Ended October 31, | | | Year Ended September 30, | |
| Institutional Class | | | 2011 | | | 20101 | | | 20102 | | | 20092 | | | 20082 | | | 20072 | |
Net asset value, beginning of period | | $ | 16.11 | | | $ | 15.01 | | | $ | 14.43 | | | $ | 12.79 | | | $ | 12.75 | | | $ | 19.37 | | | $ | 17.86 | |
Net investment income (loss) | | | (0.04 | )3 | | | (0.10 | ) | | | (0.00 | )3 | | | (0.10 | )3 | | | (0.02 | )3 | | | 0.01 | | | | (0.07 | )3 |
Net realized and unrealized gains (losses) on investments | | | 2.25 | | | | 1.20 | | | | 0.58 | | | | 1.74 | | | | 0.10 | | | | (3.77 | ) | | | 3.74 | |
| | | | | | | | | | | | | | | | | | | | | | | | | | | | |
Total from investment operations | | | 2.21 | | | | 1.10 | | | | 0.58 | | | | 1.64 | | | | 0.08 | | | | (3.76 | ) | | | 3.67 | |
Distributions to shareholders from | | | | | | | | | | | | | | | | | | | | | | | | | | | | |
Net investment income | | | 0.00 | | | | 0.00 | | | | 0.00 | | | | (0.00 | )4 | | | (0.02 | ) | | | 0.00 | | | | 0.00 | |
Net realized gains | | | 0.00 | | | | 0.00 | | | | 0.00 | | | | 0.00 | | | | (0.02 | ) | | | (2.84 | ) | | | (2.16 | ) |
Tax basis return of capital | | | 0.00 | | | | 0.00 | | | | 0.00 | | | | 0.00 | | | | 0.00 | | | | (0.02 | ) | | | 0.00 | |
| | | | | | | | | | | | | | | | | | | | | | | | | | | | |
Total distributions to shareholders | | | 0.00 | | | | 0.00 | | | | 0.00 | | | | (0.00 | )4 | | | (0.04 | ) | | | (2.86 | ) | | | (2.16 | ) |
Net asset value, end of period | | $ | 18.32 | | | $ | 16.11 | | | $ | 15.01 | | | $ | 14.43 | | | $ | 12.79 | | | $ | 12.75 | | | $ | 19.37 | |
Total return5 | | | 13.78 | % | | | 7.33 | % | | | 4.02 | % | | | 12.87 | % | | | 0.74 | % | | | (22.56 | )% | | | 22.23 | % |
Ratios to average net assets (annualized) | | | | | | | | | | | | | | | | | | | | | | | | | | | | |
Gross expenses | | | 1.05 | % | | | 1.00 | % | | | 1.04 | % | | | 1.06 | % | | | 1.08 | % | | | 0.99 | % | | | 0.96 | % |
Net expenses | | | 0.98 | % | | | 0.98 | % | | | 0.98 | % | | | 1.05 | % | | | 1.08 | % | | | 0.99 | % | | | 0.96 | % |
Net investment income (loss) | | | (0.44 | )% | | | (0.61 | )% | | | (0.29 | )% | | | (0.78 | )% | | | (0.20 | )% | | | 0.02 | % | | | (0.39 | )% |
Supplemental data | | | | | | | | | | | | | | | | | | | | | | | | | | | | |
Portfolio turnover rate | | | 33 | % | | | 123 | % | | | 9 | % | | | 80 | % | | | 118 | % | | | 113 | % | | | 98 | % |
Net assets, end of period (000’s omitted) | | | $67,432 | | | | $71,493 | | | | $105,475 | | | | $102,499 | | | | $344,313 | | | | $395,954 | | | | $621,896 | |
| 1. | For the one month ended October 31, 2010. The Fund changed its fiscal year end from September 30 to October 31, effective October 31, 2010. |
| 2. | After the close of business on July 16, 2010, the Fund acquired the net assets of Evergreen Growth Fund which became the accounting and performance survivor in the transaction. The information for the periods prior to July 19, 2010 is that of Class I of Evergreen Growth Fund. |
| 3. | Calculated based upon average shares outstanding |
| 4. | Amount is less than $0.005. |
| 5. | Returns for periods of less than one year are not annualized. |
The accompanying notes are an integral part of these financial statements.
| | | | |
| 20 | | Wells Fargo Advantage Traditional Small Cap Growth Fund | | Notes to Financial Statements (Unaudited) |
1. ORGANIZATION
Wells Fargo Funds Trust (the “Trust”), a Delaware statutory trust organized on March 10, 1999, is an open-end management investment company registered under the Investment Company Act of 1940, as amended (the “1940 Act”). These financial statements report on Wells Fargo Advantage Traditional Small Cap Growth Fund (the “Fund”) which is a diversified series of the Trust.
2. SIGNIFICANT ACCOUNTING POLICIES
The following significant accounting policies, which are consistently followed in the preparation of the financial statements of the Fund, are in conformity with U.S. generally accepted accounting principles which require management to make estimates and assumptions that affect the reported amounts of assets and liabilities, disclosure of contingent assets and liabilities at the date of the financial statements, and the reported amounts of revenues and expenses during the reporting period. Actual results could differ from those estimates.
Securities valuation
Investments in equity securities are valued each business day as of the close of regular trading on the New York Stock Exchange, which is usually 4:00 p.m. (Eastern Time). Securities which are traded on a national or foreign securities exchange are valued at the last reported sales price, except that securities listed on The Nasdaq Stock Market, Inc. (“Nasdaq”) are valued at the Nasdaq Official Closing Price (“NOCP”), and if no NOCP is available, then at the last reported sales price. If no sales price is shown on the Nasdaq, the bid price will be used. In the absence of any sale of securities listed on the Nasdaq, and in the case of other securities (including U.S. Government obligations, but excluding debt securities maturing in 60 days or less), the price will be deemed “stale” and the valuations will be determined in accordance with the Fund’s Fair Value Procedures.
Investments in open-end mutual funds and non-registered investment companies are generally valued at net asset value.
Investments which are not valued using any of the methods discussed above, are valued at their fair value, as determined by procedures established in good faith and approved by the Board of Trustees. The Board of Trustees has established a Valuation Committee comprised of the Trustees and has delegated to it the authority to take any actions regarding the valuation of portfolio securities that the Valuation Committee deems necessary in determining the fair value of portfolio securities, unless the responsibility has been delegated to the Management Valuation Team of Wells Fargo Funds Management, LLC (“Funds Management”). The Board of Trustees retains the authority to make or ratify any valuation decisions or approve any changes to the Fair Value Procedures as it deems appropriate. On a quarterly basis, the Board of Trustees considers for ratification any valuation actions taken by the Valuation Committee or the Management Valuation Team.
Valuations of fair valued prices are compared to the next actual sales price when available, or other appropriate market information to assess the continued appropriateness of the fair valuation methodology used. The securities are fair valued on a day-to-day basis, taking into consideration changes to appropriate market information and any significant changes to the input factors considered in the valuation process until there is a readily available price provided on the exchange or by an independent pricing service. Valuations received from an independent pricing service or broker quotes are periodically validated by comparisons to most recent trades and valuations provided by other independent pricing services in addition to the review of prices by the adviser and/or sub-adviser. Unobservable inputs used in determining fair valuations are identified based on the type of security, taking into consideration factors utilized by market participants in valuing the investment, knowledge about the issuer and the current market environment.
Security loans
The Fund may lend its securities from time to time in order to earn additional income in the form of fees or interest on securities received as collateral or the investment of any cash received as collateral. The Fund continues to receive interest or dividends on the securities loaned. The Fund receives collateral in the form of cash or securities with a value at least equal to the value of the securities on loan. The value of the loaned securities is determined at the close of each business day and any additional required collateral is delivered to the Fund on the next business day. In a securities lending transaction, the net asset value of the Fund will be affected by an increase or decrease in the value of the securities loaned and by an increase or decrease in the value of the instrument in which collateral is invested. The amount of securities lending activity undertaken by the Fund fluctuates from time to time. In the event of default or bankruptcy
| | | | | | |
| Notes to Financial Statements (Unaudited) | | Wells Fargo Advantage Traditional Small Cap Growth Fund | | | 21 | |
by the borrower, the Fund may be prevented from recovering the loaned securities or gaining access to the collateral or may experience delays or costs in doing so. In addition, the investment of any cash collateral received may lose all or part of its value. The Fund has the right under the lending agreement to recover the securities from the borrower on demand.
The Fund lends its securities through an unaffiliated securities lending agent. Cash collateral received in connection with its securities lending transactions is invested in Wells Fargo Securities Lending Cash Investments, LLC (the “Cash Collateral Fund”). The Cash Collateral Fund is exempt from registration under Section 3(c)(7) of the 1940 Act and is managed by Funds Management and is sub-advised by Wells Capital Management Incorporated (“Wells Capital Management”). Funds Management receives an advisory fee starting at 0.05% and declining to 0.01% as the average daily net assets of the Cash Collateral Fund increase. All of the fees received by Funds Management are paid to Wells Capital Management for its services as sub-adviser. The Cash Collateral Fund seeks to provide a positive return compared to the daily Fed Funds Open rate by investing in high-quality, U.S. dollar-denominated short-term money market instruments. Cash Collateral Fund investments are fair valued based upon the amortized cost valuation technique. Income earned from investment in the Cash Collateral Fund is included in securities lending income on the Statement of Operations.
Security transactions and income recognition
Securities transactions are recorded on a trade date basis. Realized gains or losses are reported on the basis of identified cost of securities delivered.
Dividend income is recognized on the ex-dividend date.
Distributions to shareholders
Distributions to shareholders from net investment income and net realized gains, if any, are recorded on the ex-dividend date. Such distributions are determined in conformity with income tax regulations, which may differ from generally accepted accounting principles.
Federal and other taxes
The Fund intends to continue to qualify as a regulated investment company by distributing substantially all of its investment company taxable income and any net realized capital gains (after reduction for capital loss carryforwards) sufficient to relieve it from all, or substantially all, federal income taxes. Accordingly, no provision for federal income taxes was required.
The Fund’s income and federal excise tax returns and all financial records supporting those returns for the prior three fiscal years are subject to examination by the federal and Delaware revenue authorities. Management has analyzed the Fund’s tax positions taken on federal, state, and foreign tax returns for all open tax years and does not believe that there are any uncertain tax positions that require recognition of a tax liability.
Under the recently enacted Regulated Investment Company Modernization Act of 2010, the Fund is permitted to carry forward capital losses incurred in taxable years which began after December 22, 2010 for an unlimited period. However, any losses incurred are required to be utilized prior to the losses incurred in pre-enactment taxable years. As a result of this ordering rule, pre-enactment capital loss carryforwards may be more likely to expire unused. Post-enactment capital losses that are carried forward will retain their character as either short-term or long-term capital losses rather than be considered all short-term as under previous law. In addition, the Fund may elect to defer any portion of a post-October capital loss or qualified late-year ordinary loss to the first day of the following taxable year. A post-October capital loss is the greatest of the net capital loss, net short-term capital loss or net long-term capital loss for the portion of the taxable year after October 31. A qualified late-year ordinary loss is the net loss comprised of (a) net gain or loss from the sale or other disposition of capital assets for the portion of the taxable year after October 31, and (b) other ordinary income or loss for the portion of the taxable year after December 31.
As of October 31, 2011, the Fund had net capital loss carryforwards, which were available to offset future net realized capital gains, in the amount of $17,428,003 expiring in 2016.
Class allocations
The separate classes of shares offered by the Fund differ principally in distribution, shareholder servicing and administration fees. Shareholders of each class bear certain expenses that pertain to that particular class. All shareholders bear the common expenses of the Fund, earn income from the portfolio, and are allocated unrealized gains and losses
| | | | |
| 22 | | Wells Fargo Advantage Traditional Small Cap Growth Fund | | Notes to Financial Statements (Unaudited) |
pro rata based on the average daily net assets of each class, without distinction between share classes. Dividends are determined separately for each class based on income and expenses allocable to each class. Realized gains and losses are allocated to each class pro rata based upon the net assets of each class on the date realized. Differences in per share dividend rates generally result from the relative weightings of pro rata income and realized gain allocations and from differences in separate class expenses, including distribution, shareholder servicing and administration fees.
3. FAIR VALUATION MEASUREMENTS
Fair value measurements of investments are determined within a framework that has established a fair value hierarchy based upon the various data inputs utilized in determining the value of the Fund’s investments. The three-level hierarchy gives the highest priority to unadjusted quoted prices in active markets for identical assets or liabilities (Level 1) and the lowest priority to significant unobservable inputs (Level 3). The Fund’s investments are classified within the fair value hierarchy based on the lowest level of input that is significant to the fair value measurement. The inputs are summarized into three broad levels as follows:
| n | | Level 1 – quoted prices in active markets for identical securities |
| n | | Level 2 – other significant observable inputs (including quoted prices for similar securities, interest rates, prepayment speeds, credit risk, etc.) |
| n | | Level 3 – significant unobservable inputs (including the Fund’s own assumptions in determining the fair value of investments) |
The inputs or methodologies used for valuing securities are not necessarily an indication of the risk associated with investing in those securities.
As of April 30, 2012, the inputs used in valuing the Fund’s assets, which are carried at fair value, were as follows:
| | | | | | | | | | | | | | | | |
| Investments in Securities | | Quoted Prices (Level 1) | | | Significant Other
Observable Inputs (Level 2) | | | Significant Unobservable Inputs (Level 3) | | | Total | |
Equity securities | | | | | | | | | | | | | | | | |
Common stocks | | $ | 196,762,829 | | | $ | 0 | | | $ | 0 | | | $ | 196,762,829 | |
Short-term investments | | | | | | | | | | | | | | | | |
Investment companies | | | 3,884,133 | | | | 60,077,028 | | | | 0 | | | | 63,961,161 | |
| | | $ | 200,646,962 | | | $ | 60,077,028 | | | $ | 0 | | | $ | 260,723,990 | |
Further details on the major security types listed above can be found in the Portfolio of Investments.
Transfers in and transfers out are recognized at the end of the reporting period. For the six months ended April 30, 2012, the Fund did not have any significant transfers into/out of Level 1 and Level 2.
4. TRANSACTIONS WITH AFFILIATES AND OTHER EXPENSES
Advisory fee
The Trust has entered into an advisory contract with Funds Management, an indirect wholly owned subsidiary of Wells Fargo & Company (“Wells Fargo”). The adviser is responsible for implementing investment policies and guidelines and for supervising the sub-adviser, who is responsible for day-to-day portfolio management of the Fund.
Pursuant to the contract, Funds Management is entitled to receive an annual advisory fee starting at 0.80% and declining to 0.70% as the average daily net assets of the Fund increase. For the six months ended April 30, 2012, the advisory fee was equivalent to an annual rate of 0.80% of the Fund’s average daily net assets.
Funds Management has retained the services of certain sub-advisers to provide daily portfolio management to the Fund. The fees related to sub-advisory services are borne directly by Funds Management and do not increase the overall fees paid by the Fund. Wells Capital Management, an affiliate of Funds Management, is the sub-adviser to the Fund and is entitled to receive a fee from Funds Management at an annual rate starting at 0.55% and declining to 0.40% as the average daily net assets of the Fund increase.
| | | | | | |
| Notes to Financial Statements (Unaudited) | | Wells Fargo Advantage Traditional Small Cap Growth Fund | | | 23 | |
Administration and transfer agent fees
The Trust has entered into an administration agreement with Funds Management. Under this agreement, for providing administrative services, which includes paying fees and expenses for services provided by the transfer agent, sub-transfer agents, omnibus account servicers and record-keepers, Funds Management is entitled to receive from the Fund an annual fund level administration fee starting at 0.05% and declining to 0.03% as the average daily net assets of the Fund increase and a class level administration fee which is calculated based on the average daily net assets of each class as follows:
| | | | |
| | | Class Level Administration Fee | |
Class A, Class C | | | 0.26 | % |
Administrator Class | | | 0.10 | |
Institutional Class | | | 0.08 | |
Funds Management has contractually waived and/or reimbursed advisory and administration fees to the extent necessary to maintain certain net operating expense ratios for the Fund. Waiver of fees and/or reimbursement of expenses by Funds Management were made first from fund level expenses on a proportionate basis and then from class specific expenses. Funds Management has committed through July 18, 2013 to waive fees and/or reimburse expenses to the extent necessary to cap the Fund’s expenses at 1.33% for Class A, 2.08% for Class C, 1.20% for Administrator Class and 0.98% for Institutional Class.
Distribution fees
The Trust has adopted a Distribution Plan for Class C shares of the Fund pursuant to Rule 12b-1 under the 1940 Act. Distribution fees are charged to Class C shares and paid to Wells Fargo Funds Distributor, LLC, the principal underwriter, at an annual rate of 0.75% of the average daily net assets of Class C shares.
For the six months ended April 30, 2012, Wells Fargo Funds Distributor, LLC received $1,659 from the sale of Class A shares.
Shareholder servicing fees
The Trust has entered into contracts with one or more shareholder servicing agents, whereby Class A, Class C and Administrator Class of the Fund is charged a fee at an annual rate of 0.25% of the average daily net assets of each respective class.
A portion of these total shareholder servicing fees were paid to affiliates of Wells Fargo.
5. INVESTMENT PORTFOLIO TRANSACTIONS
Purchases and sales of investments, excluding U.S. Government obligations (if any) and short-term securities, for the six months ended April 30, 2012 were $65,897,631 and $91,874,624, respectively.
6. BANK BORROWINGS
The Trust (excluding the money market funds) and Wells Fargo Variable Trust are parties to a $150,000,000 revolving credit agreement with State Street Bank and Trust Company, whereby the Fund is permitted to use bank borrowings for temporary or emergency purposes, such as to fund shareholder redemption requests. Interest under the credit agreement is charged to the Fund based on a borrowing rate equal to the higher of the Federal Funds rate in effect on that day plus 1.25% or the overnight LIBOR rate in effect on that day plus 1.25%. In addition, an annual commitment fee equal to 0.10% of the unused balance is allocated to each participating fund. For the six months ended April 30, 2012, the Fund paid $184 in commitment fees.
For the six months ended April 30, 2012, there were no borrowings by the Fund under the agreement.
7. INDEMNIFICATION
Under the Trust’s organizational documents, the officers and directors are indemnified against certain liabilities that may arise out of performance of their duties to the Trust. Additionally, in the normal course of business, the Trust may enter into contracts with service providers that contain a variety of indemnification clauses. The Trust’s maximum exposure under these arrangements is dependent on future claims that may be made against the Fund and, therefore, cannot be estimated.
| | | | |
| 24 | | Wells Fargo Advantage Traditional Small Cap Growth Fund | | Notes to Financial Statements (Unaudited) |
8. NEW ACCOUNTING PRONOUNCEMENTS
In December 2011, the Financial Accounting Standards Board (“FASB”) issued Accounting Standard Update (“ASU”) No. 2011-11, Disclosures about Offsetting Assets and Liabilities. ASU 2011-11, which amends FASB ASC Topic 210, Balance Sheet, creates new disclosure requirements which require entities to disclose both gross and net information for derivatives and other financial instruments that are either offset in the Statement of Assets and Liabilities or subject to an enforceable master netting arrangement or similar agreement. The disclosure requirements are effective for interim and annual reporting periods beginning on or after January 1, 2013. Management is currently assessing the potential impact, in addition to expanded financial statement disclosure, that may result from adopting this ASU.
In May 2011, FASB issued ASU No. 2011-04 Amendments to Achieve Common Fair Value Measurement and Disclosure Requirements in U.S. GAAP and IFRSs. ASU No. 2011-04 amends FASB ASC Topic 820, Fair Value Measurements, to establish common requirements for measuring fair value and for disclosing information about fair value measurements in accordance with GAAP. The ASU is effective prospectively for interim and annual periods beginning after December 15, 2011. Management expects that adoption of the ASU will result in additional disclosures in the financial statements, as applicable.
In April 2011, FASB issued ASU No. 2011-03 Reconsideration of Effective Control for Repurchase Agreements. ASU No. 2011-03 amends FASB ASC Topic 860, Transfers and Servicing, specifically the criteria required to determine whether a repurchase agreement (repo) and similar agreements should be accounted for as sales of financial assets or secured borrowings with commitments. ASU No. 2011-03 changes the assessment of effective control by focusing on the transferor’s contractual rights and obligations and removing the criterion to assess its ability to exercise those rights or honor those obligations. This could result in changes to the way entities account for certain transactions including repurchase agreements, mortgage dollar rolls and reverse repurchase agreements. The ASU will become effective on a prospective basis for new transfers and modifications to existing transactions as of the beginning of the first interim or annual period beginning on or after December 15, 2011. Management has evaluated the impact of adopting the ASU and expects no significant changes.
| | | | | | |
| Other Information (Unaudited) | | Wells Fargo Advantage Traditional Small Cap Growth Fund | | | 25 | |
PROXY VOTING INFORMATION
A description of the policies and procedures that the Fund uses to determine how to vote proxies relating to portfolio securities is available without charge, upon request, by calling 1-800-222-8222, visiting our Web site at wellsfargoadvantagefunds.com, or visiting the SEC Web site at sec.gov. Information regarding how the Fund voted proxies relating to portfolio securities during the most recent 12-month period ended June 30 is available without charge on the Fund’s Web site at wellsfargoadvantagefunds.com or by visiting the SEC Web site at sec.gov.
PORTFOLIO HOLDINGS INFORMATION
The complete portfolio holdings for the Fund are publicly available on the Fund’s Web site (wellsfargoadvantagefunds.com) on a monthly, 30-day or more delayed basis. In addition, top ten holdings information for the Fund is publicly available on the Fund’s Web site on a monthly, seven-day or more delayed basis. The Fund files its complete schedule of portfolio holdings with the SEC for the first and third quarters of each fiscal year on Form N-Q, which is available without charge by visiting the SEC Web site at sec.gov. In addition, the Fund’s Form N-Q may be reviewed and copied at the SEC’s Public Reference Room in Washington, DC, and at regional offices in New York City, at 233 Broadway, and in Chicago, at 175 West Jackson Boulevard, Suite 900. Information about the Public Reference Room may be obtained by calling 1-800-SEC-0330.
| | | | |
| 26 | | Wells Fargo Advantage Traditional Small Cap Growth Fund | | Other Information (Unaudited) |
BOARD OF TRUSTEES
The following table provides basic information about the Board of Trustees (the “Trustees”) of the Trust and Officers of the Trust. This table should be read in conjunction with the Prospectus and the Statement of Additional Information1 of the Fund. Each of the Trustees and Officers listed below acts in identical capacities for the Wells Fargo Advantage family of funds, which consists of 137 funds comprising the Wells Fargo Funds Trust, Wells Fargo Variable Trust, Wells Fargo Master Trust and four closed-end funds (collectively the “Fund Complex”). All of the Trustees are also Members of the Audit and Governance Committees of each Trust in the Fund Complex. The mailing address of each Trustee and Officer is 525 Market Street, 12th Floor, San Francisco, CA 94105. Each Trustee and Officer serves an indefinite term, however, each Trustee serves such term until reaching the mandatory retirement age established by the Trustees.
Independent Trustees
| | | | | | |
Name and Year of Birth | | Position Held and Length of Service | | Principal Occupations During Past Five Years | | Other Directorships During
Past Five Years |
Peter G. Gordon
(Born 1942) | | Trustee, since 1998; Chairman, since 2005 (Lead Trustee since 2001) | | Co-Founder, Retired Chairman, President and CEO of Crystal Geyser Water Company. Trustee Emeritus, Colby College | | Asset Allocation Trust |
Isaiah Harris, Jr.
(Born 1952) | | Trustee, since 2009 | | Retired. Prior thereto, President and CEO of BellSouth Advertising and Publishing Corp. from 2005 to 2007, President and CEO of BellSouth Enterprises from 2004 to 2005 and President of BellSouth Consumer Services from 2000 to 2003. Emeritus member of the Iowa State University Foundation Board of Governors. Emeritus Member of the Advisory Board of Iowa State University School of Business. Mr. Harris is a certified public accountant. | | CIGNA Corporation; Deluxe Corporation; Asset Allocation Trust |
Judith M. Johnson
(Born 1949) | | Trustee, since 2008 | | Retired. Prior thereto, Chief Executive Officer and Chief Investment Officer of Minneapolis Employees Retirement Fund from 1996 to 2008. Ms. Johnson is an attorney, certified public accountant and a certified managerial accountant. | | Asset Allocation Trust |
Leroy Keith, Jr.
(Born 1939) | | Trustee, since 2010 | | Chairman, Bloc Global Services (development and construction). Trustee of the Evergreen Funds from 1983 to 2010. Former Managing Director, Almanac Capital Management (commodities firm), former Partner, Stonington Partners, Inc. (private equity fund), former Director, Obagi Medical Products Co. and former Director, Lincoln Educational Services. | | Trustee, Virtus Fund Complex (consisting of 40 portfolios as of 12/31/11); Asset Allocation Trust |
David F. Larcker
(Born 1950) | | Trustee, since 2009 | | James Irvin Miller Professor of Accounting at the Graduate School of Business, Stanford University, Director of Corporate Governance Research Program and Senior Faculty of The Rock Center for Corporate Governance since 2006. From 2005 to 2008, Professor of Accounting at the Graduate School of Business, Stanford University. Prior thereto, Ernst & Young Professor of Accounting at The Wharton School, University of Pennsylvania from 1985 to 2005. | | Asset Allocation Trust |
Olivia S. Mitchell
(Born 1953) | | Trustee, since 2006 | | International Foundation of Employee Benefit Plans Professor, Wharton School of the University of Pennsylvania since 1993. Director of Wharton’s Pension Research Council and Boettner Center on Pensions & Retirement Research, and Research Associate at the National Bureau of Economic Research. Previously, Cornell University Professor from 1978 to 1993. | | Asset Allocation Trust |
| | | | | | |
| Other Information (Unaudited) | | Wells Fargo Advantage Traditional Small Cap Growth Fund | | | 27 | |
| | | | | | |
Name and Year of Birth | | Position Held and Length of Service | | Principal Occupations During Past Five Years | | Other Directorships During
Past Five Years |
Timothy J. Penny
(Born 1951) | | Trustee, since 1996 | | President and CEO of Southern Minnesota Initiative Foundation, a non-profit organization, since 2007 and Senior Fellow at the Humphrey Institute Policy Forum at the University of Minnesota since 1995. Member of the Board of Trustees of NorthStar Education Finance, Inc., a non-profit organization, since 2007. | | Asset Allocation Trust |
Michael S. Scofield
(Born 1943) | | Trustee, since 2010 | | Served on the Investment Company Institute’s Board of Governors and Executive Committee from 2008-2011 as well the Governing Council of the Independent Directors Council from 2006-2011 and the Independent Directors Council Executive Committee from 2008-2011. Chairman of the IDC from 2008-2010. Institutional Investor (Fund Directions) Trustee of Year in 2007. Trustee of the Evergreen Funds (and its predecessors) from 1984 to 2010. Chairman of the Evergreen Funds from 2000-2010. Former Trustee of the Mentor Funds. Retired Attorney, Law Offices of Michael S. Scofield and former Director and Chairman, Branded Media Corporation (multi-media branding company). | | Asset Allocation Trust |
Donald C. Willeke
(Born 1940) | | Trustee, since 1996 | | Principal of the law firm of Willeke & Daniels. General Counsel of the Minneapolis Employees Retirement Fund from 1984 until its consolidation into the Minnesota Public Employees Retirement Association on June 30, 2010. Director and Vice Chair of The Free Trust (non-profit corporation). Director of the American Chestnut Foundation (non-profit corporation). | | Asset Allocation Trust |
Officers
| | | | | | |
Name and Year of Birth | | Position Held and
Length of Service | | Principal Occupations During Past Five Years | | |
Karla M. Rabusch
(Born 1959) | | President, since 2003 | | Executive Vice President of Wells Fargo Bank, N.A. and President of Wells Fargo Funds Management, LLC since 2003. Senior Vice President and Chief Administrative Officer of Wells Fargo Funds Management, LLC from 2001 to 2003. | | |
C. David Messman
(Born 1960) | | Secretary, since 2000; Chief Legal Counsel, since 2003 | | Senior Vice President and Secretary of Wells Fargo Funds Management, LLC since 2001. Vice President and Managing Senior Counsel of Wells Fargo Bank, N.A. since 1996. | | |
Kasey Phillips
(Born 1970) | | Treasurer, since 2009 | | Senior Vice President of Wells Fargo Funds Management, LLC since 2009. Senior Vice President of Evergreen Investment Management Company, LLC from 2006 to 2010. Treasurer of the Evergreen Funds from 2005 to 2010. | | |
David Berardi
(Born 1975) | | Assistant Treasurer, since 2009 | | Vice President of Wells Fargo Funds Management, LLC since 2009. Vice President of Evergreen Investment Management Company, LLC from 2008 to 2010. Assistant Vice President of Evergreen Investment Services, Inc. from 2004 to 2008. Manager of Fund Reporting and Control for Evergreen Investment Management Company, LLC from 2004 to 2010. | | |
Jeremy DePalma
(Born 1974) | | Assistant Treasurer, since 2009 | | Senior Vice President of Wells Fargo Funds Management, LLC since 2009. Senior Vice President of Evergreen Investment Management Company, LLC from 2008 to 2010. Vice President, Evergreen Investment Services, Inc. from 2004 to 2007. Head of the Fund Reporting and Control Team within Fund Administration from 2005 to 2010. | | |
Debra Ann Early
(Born 1964) | | Chief Compliance Officer, since 2007 | | Chief Compliance Officer of Wells Fargo Funds Management, LLC since 2007. Chief Compliance Officer of Parnassus Investments from 2005 to 2007. Chief Financial Officer of Parnassus Investments from 2004 to 2007 and Senior Audit Manager of PricewaterhouseCoopers LLP from 1998 to 2004. | | |
| 1. | The Statement of Additional Information includes additional information about the Trustees and is available, without charge, upon request, by calling 1-800-222-8222 or by visiting the Web site at wellsfargoadvantagefunds.com. |
| | | | |
| 28 | | Wells Fargo Advantage Traditional Small Cap Growth Fund | | Other Information (Unaudited) |
BOARD CONSIDERATION OF INVESTMENT ADVISORY AND SUB-ADVISORY AGREEMENTS:
Under Section 15 of the Investment Company Act of 1940 (the “1940 Act”), the Board of Trustees (the “Board”) of Wells Fargo Funds Trust (the “Trust”), all the members of which have no direct or indirect interest in the investment advisory and sub-advisory agreements and are not “interested persons” of the Trust, as defined in the 1940 Act (the “Independent Trustees”), must determine whether to approve the continuation of the Trust’s investment advisory and sub-advisory agreements. In this regard, at an in person meeting held on March 29-30, 2012 (the “Meeting”), the Board reviewed and re-approved: (i) an investment advisory agreement with Wells Fargo Funds Management, LLC (“Funds Management”) for Wells Fargo Advantage Traditional Small Cap Growth Fund (the “Fund”) and (ii) an investment sub-advisory agreement with Wells Capital Management Incorporated (“Wells Capital Management”) for the Fund. The investment advisory agreement with Funds Management and the investment sub-advisory agreement with Wells Capital Management are collectively referred to as the “Advisory Agreements.”
At the Meeting, the Board considered the factors and reached the conclusions described below relating to the selection of Funds Management and Wells Capital Management and the continuation of the Advisory Agreements. Prior to the Meeting, the Trustees conferred extensively among themselves and with representatives of Funds Management about these matters. The Board also met throughout the year and received information that was useful to them in considering the continuation of the Advisory Agreements. The Independent Trustees were assisted in their evaluation of the Advisory Agreements by independent legal counsel, from whom they received separate legal advice and with whom they met separately from Funds Management.
In providing information to the Board, Funds Management and Wells Capital Management were guided by a detailed set of requests submitted by the Independent Trustees’ independent legal counsel on their behalf at the start of the Board’s annual contract renewal process earlier in 2012. In approving the Advisory Agreements, the Board did not identify any particular information or consideration that was all-important or controlling, and each Trustee likely attributed different weights to various factors.
Nature, extent and quality of services
The Board received and considered various information regarding the nature, extent and quality of services provided to the Fund by Funds Management and Wells Capital Management under the Advisory Agreements. The Board also received and considered, among other things, information about the background and experience of senior management of Funds Management, and the qualifications, backgrounds, tenures and responsibilities of the portfolio managers primarily responsible for the day-to-day portfolio management of the Fund.
The Board evaluated the ability of Funds Management and Wells Capital Management, based on their respective financial condition, resources, reputation and other attributes, to attract and retain qualified investment professionals, including research, advisory, and supervisory personnel. The Board further considered the compliance programs and compliance records of Funds Management and Wells Capital Management. In addition, the Board took into account the administrative services provided to the Fund by Funds Management and its affiliates.
The Board’s decision to approve the continuation of the Advisory Agreements was based on a comprehensive evaluation of all of the information provided to it. In considering these matters, the Board considered not only the specific information presented in connection with the Meeting, but also the knowledge gained over time through interaction with Funds Management and Wells Capital Management about various topics, including Funds Management’s oversight of service providers. The above factors, together with those referenced below, are some of the most important, but not necessarily all, factors considered by the Board in concluding that the nature, extent and quality of the investment advisory services provided to the Fund by Funds Management and Wells Capital Management supported the re-approval of the Advisory Agreements. Although the Board considered the continuation of the Advisory Agreements for the Fund as part of the larger process of considering the continuation of the advisory agreements for all of the funds in the complex, its decision to continue the Advisory Agreements for the Fund was ultimately made on a fund-by-fund basis.
Fund performance and expenses
The Board considered the performance results for the Fund over various time periods ended December 31, 2011. The Board also considered these results in comparison to the median performance of a universe of relevant funds (the “Universe”) that was determined by Lipper Inc. (“Lipper”) to be similar to the Fund, and in comparison to the Fund’s
| | | | | | |
| Other Information (Unaudited) | | Wells Fargo Advantage Traditional Small Cap Growth Fund | | | 29 | |
benchmark index and to other comparative data. Lipper is an independent provider of investment company data. The Board received a description of the methodology used by Lipper to select the mutual funds in the Universe. The Board noted that, except for the one-year period, the performance of the Fund was in range of the median performance of the Universe for all periods under review. The Board also noted that, except for the one-year period, the performance of the Fund was in range of its benchmark, the Lipper Small-Cap Growth Funds Index, for the periods under review.
The Board received and considered information regarding the Fund’s contractual advisory fee and net operating expense ratios and their various components, including actual management fees (which reflect fee waivers, if any), transfer agent, custodian and other non-management fees, Rule 12b-1 and non-Rule 12b-1 fees, service fees and fee waiver and expense reimbursement arrangements. The Board also considered these ratios in comparison to the median ratios of an expense Universe and a narrower expense group of mutual funds (each, an “Expense Group”) that was determined by Lipper to be similar to the Fund. The Board received a description of the methodology used by Lipper to select the mutual funds in the Fund’s Expense Group. The Board noted that the net operating expense ratios of the Fund were in range of, equal to, or lower than the Fund’s Expense Group’s median net operating expense ratios.
Based on the above-referenced considerations and other factors, the Board concluded that the overall performance and expense structure of the Fund supported the re-approval of the Advisory Agreements for the Fund.
Investment advisory and sub-advisory fee rates
The Board reviewed and considered the contractual investment advisory fee rate that is payable by the Fund to Funds Management for investment advisory services (the “Advisory Agreement Rate”), both on a stand-alone basis and on a combined basis with the Fund’s administration fee rate. The Board took into account the separate administrative and other services covered by the administration fee rate. The Board also reviewed and considered the contractual investment sub-advisory fee rate that is payable by Funds Management to Wells Capital Management for investment sub-advisory services (the “Sub-Advisory Agreement Rate”). In addition, the Board reviewed and considered the existing fee waiver/cap arrangements applicable to the Advisory Agreement Rate and considered the Advisory Agreement Rate after taking the waivers/caps into account (the “Net Advisory Rate”).
The Board received and considered information comparing the Advisory Agreement Rate and Net Advisory Rate with those of other funds in the Fund’s Expense Group median. The Board noted that, except for Class A, the Advisory Agreement Rate and Net Advisory Rate for the Fund were in range of the median rates for the Fund’s Expense Group.
The Board also received and considered information about the nature and extent of services offered and fee rates charged by Funds Management and Wells Capital Management to other types of clients. In this regard, the Board received information about differences between the services, and the compliance, reporting, and other legal burdens and risks of providing investment advice to mutual funds and those associated with providing advice to non-mutual fund clients such as collective funds or institutional separate accounts.
The Board determined that the Advisory Agreement Rate for the Fund, both with and without an administration fee rate and before and after waivers, was reasonable in light of the Fund’s Expense Group information, the net expense ratio commitments, the services covered by the Advisory Agreements and other information provided. The Board also reviewed and considered the Sub-Advisory Agreement Rate and concluded that the Sub-Advisory Agreement Rate was reasonable in light of the services covered by the sub-advisory agreement and other information provided.
Profitability
The Board received and considered a profitability analysis of Funds Management, as well as an analysis of the profitability to the collective Wells Fargo businesses that provide services to the Fund. It considered that the information provided to it was necessarily estimated, and that the profitability information provided to it, especially on a fund-by-fund basis, did not necessarily provide a precise tool for evaluating the appropriateness of the Fund’s Advisory Agreement Rate in isolation. It noted that the levels of profitability reported on a fund-by-fund basis varied widely, depending on, among other things, the size and type of fund. The Board concluded that the profitability reported by Funds Management was not unreasonable.
The Board did not consider separate profitability information with respect to Wells Capital Management, because, as an affiliate of Funds Management, its profitability information was subsumed in the collective Wells Fargo profitability analysis provided by Funds Management.
| | | | |
| 30 | | Wells Fargo Advantage Traditional Small Cap Growth Fund | | Other Information (Unaudited) |
Economies of scale
With respect to possible economies of scale, the Board reviewed the breakpoints in the Fund’s advisory fee structure, which operate generally to reduce the effective Advisory Agreement Rate of the Fund (as a percentage of Fund assets) as the Fund grows in size. It considered that, as a fund shrinks in size, breakpoints conversely result in increasing fee levels. The Board noted that it would have on-going opportunities to review the appropriate levels of breakpoints in the future, and concluded that the breakpoints as implemented appeared to be a reasonable step toward sharing economies of scale, if any, with the Fund. However, the Board acknowledged the inherent limitations of any analysis of an investment adviser’s economies of scale and of any attempt to correlate breakpoints with such economies, stemming largely from the Board’s understanding that economies of scale are realized, if at all, by an investment adviser across a variety of products and services, not just with respect to a single fund.
Other benefits to Funds Management and Wells Capital Management
The Board received and considered information regarding potential “fall-out” or ancillary benefits received by Funds Management and its affiliates, including Wells Capital Management, as a result of their relationship with the Fund. Ancillary benefits could include, among others, benefits directly attributable to the relationship of Funds Management and Wells Capital Management with the Fund and benefits potentially derived from an increase in Funds Management’s and Wells Capital Management’s business as a result of their relationship with the Fund (such as the ability to market to shareholders other financial products offered by Funds Management and its affiliates, including Wells Capital Management).
The Board considered that Wells Fargo Funds Distributor, LLC, an affiliate of Funds Management, serves as distributor to the Fund and receives certain compensation for those services. The Board noted that various financial institutions, including affiliates of Funds Management, may receive distribution-related fees, shareholder servicing payments (including amounts derived from payments under Rule 12b-1 plans) and sub-transfer agency fees in respect of shares sold or held through them and services provided.
The Board also reviewed information about whether and to what extent soft dollar credits are sought and how any such credits are utilized and any benefits that may be realized by using an affiliated broker.
Other factors and broader review
The Board also considered the markets for distribution of the Fund’s shares, including the channels through which the Fund’s shares are offered and sold. The Board noted that the Fund is part of one of the few fund families that have both direct-to-fund and intermediary distribution channels. As discussed above, the Board reviews detailed materials received from Funds Management and Wells Capital Management annually as part of the re-approval process under Section 15 of the 1940 Act and also reviews and assesses information about the quality of the services that the Fund receives throughout the year. In this regard, the Board has reviewed reports of Funds Management at each of its quarterly meetings, which include, among other things, portfolio reviews and performance reports. In addition, the Board confers with portfolio managers at various times throughout the year.
Conclusion
After considering the above-described factors and based on its deliberations and its evaluation of the information described above, the Board unanimously approved the continuation of the Advisory Agreements for an additional one-year period.
| | | | | | |
| List of Abbreviations | | Wells Fargo Advantage Traditional Small Cap Growth Fund | | | 31 | |
The following is a list of common abbreviations for terms and entities which may have appeared in this report.
| ACB | — Agricultural Credit Bank |
| ADR | — American Depository Receipt |
| ADS | — American Depository Shares |
| AGC-ICC | — Assured Guaranty Corporation - Insured Custody Certificates |
| AGM | — Assured Guaranty Municipal |
| AMBAC | — American Municipal Bond Assurance Corporation |
| AMT | — Alternative Minimum Tax |
| BAN | — Bond Anticipation Notes |
| BHAC | — Berkshire Hathaway Assurance Corporation |
| CAB | — Capital Appreciation Bond |
| CCAB | — Convertible Capital Appreciation Bond |
| CDA | — Community Development Authority |
| CDO | — Collateralized Debt Obligation |
| COP | — Certificate of Participation |
| DRIVER | — Derivative Inverse Tax-Exempt Receipts |
| DW&P | — Department of Water & Power |
| DWR | — Department of Water Resources |
| ECFA | — Educational & Cultural Facilities Authority |
| EDA | — Economic Development Authority |
| EDFA | — Economic Development Finance Authority |
| ETF | — Exchange-Traded Fund |
| FFCB | — Federal Farm Credit Bank |
| FGIC | — Financial Guaranty Insurance Corporation |
| FHA | — Federal Housing Authority |
| FHLB | — Federal Home Loan Bank |
| FHLMC | — Federal Home Loan Mortgage Corporation |
| FICO | — The Financing Corporation |
| FNMA | — Federal National Mortgage Association |
| GDR | — Global Depository Receipt |
| GNMA | — Government National Mortgage Association |
| HCFR | — Healthcare Facilities Revenue |
| HEFA | — Health & Educational Facilities Authority |
| HEFAR | — Higher Education Facilities Authority Revenue |
| HFA | — Housing Finance Authority |
| HFFA | — Health Facilities Financing Authority |
| IBC | — Insured Bond Certificate |
| IDA | — Industrial Development Authority |
| IDAG | — Industrial Development Agency |
| IDR | — Industrial Development Revenue |
| KRW | — Republic of Korea Won |
| LIBOR | — London Interbank Offered Rate |
| LLC | — Limited Liability Company |
| LLP | — Limited Liability Partnership |
| MBIA | — Municipal Bond Insurance Association |
| MFHR | — Multi-Family Housing Revenue |
| MSTR | — Municipal Securities Trust Receipts |
| MUD | — Municipal Utility District |
| NATL-RE | — National Public Finance Guarantee Corporation |
| PCFA | — Pollution Control Finance Authority |
| PCR | — Pollution Control Revenue |
| PFA | — Public Finance Authority |
| PFFA | — Public Facilities Financing Authority |
| PFOTER | — Puttable Floating Option Tax-Exempt Receipts |
| plc | — Public Limited Company |
| PUTTER | — Puttable Tax-Exempt Receipts |
| R&D | — Research & Development |
| RDA | — Redevelopment Authority |
| RDFA | — Redevelopment Finance Authority |
| REIT | — Real Estate Investment Trust |
| ROC | — Reset Option Certificates |
| SAVRS | — Select Auction Variable Rate Securities |
| SBA | — Small Business Authority |
| SFHR | — Single Family Housing Revenue |
| SFMR | — Single Family Mortgage Revenue |
| SPA | — Standby Purchase Agreement |
| SPDR | — Standard & Poor’s Depositary Receipts |
| STRIPS | — Separate Trading of Registered Interest and Principal Securities |
| TAN | — Tax Anticipation Notes |
| TIPS | — Treasury Inflation-Protected Securities |
| TRAN | — Tax Revenue Anticipation Notes |
| TCR | — Transferable Custody Receipts |
| TTFA | — Transportation Trust Fund Authority |
| TVA | — Tennessee Valley Authority |
| XLCA | — XL Capital Assurance |
This page is intentionally left blank.
This page is intentionally left blank.
This page is intentionally left blank.


FOR MORE INFORMATION
More information about Wells Fargo Advantage Funds is available free upon request. To obtain literature, please write, e-mail, visit the Fund’s Web site, or call:
Wells Fargo Advantage Funds
P.O. Box 8266
Boston, MA 02266-8266
E-mail: wfaf@wellsfargo.com
Web site: wellsfargoadvantagefunds.com
Individual investors: 1-800-222-8222
Retail investment professionals: 1-888-877-9275
Institutional investment professionals: 1-866-765-0778
This report and the financial statements contained herein are submitted for the general information of the shareholders of Wells Fargo Advantage Funds. If this report is used for promotional purposes, distribution of the report must be accompanied or preceded by a current prospectus. For a prospectus containing more complete information, including charges and expenses, call 1-800-222-8222 or visit the Fund’s Web site at wellsfargoadvantagefunds.com. Please consider the investment objectives, risks, charges, and expenses of the investment carefully before investing. This and other information about Wells Fargo Advantage Funds can be found in the current prospectus. Read the prospectus carefully before you invest or send money.
Wells Fargo Funds Management, LLC, a wholly owned subsidiary of Wells Fargo & Company, provides investment advisory and administrative services for Wells Fargo Advantage Funds. Other affiliates of Wells Fargo & Company provide subadvisory and other services for the Funds. The Funds are distributed by Wells Fargo Funds Distributor, LLC, Member FINRA/SIPC, an affiliate of Wells Fargo & Company.
NOT FDIC INSURED ¡ NO BANK GUARANTEE ¡ MAY LOSE VALUE
© 2012 Wells Fargo Funds Management, LLC. All rights reserved.
| | |
 | | 209731 06-12 SA247/SAR247 4-12 |
ITEM 2. CODE OF ETHICS
Not required in this filing
ITEM 3. AUDIT COMMITTEE FINANCIAL EXPERT
Not required in this filing.
ITEM 4. PRINCIPAL ACCOUNTANT FEES AND SERVICES
Not required in this filing.
ITEM 5. AUDIT COMMITTEE OF LISTED REGISTRANTS
Not required in this filing.
ITEM 6. SCHEDULE OF INVESTMENTS
The Schedule of Investments is included as part of the report to shareholders filed under Item 1 of this Form.
ITEM 7. DISCLOSURE OF PROXY VOTING POLICIES AND PROCEDURES FOR CLOSED-END MANAGEMENT INVESTMENT COMPANIES
Not applicable.
ITEM 8. PORTFOLIO MANAGERS OF CLOSED-END MANAGEMENT INVESTMENT COMPANIES
Not applicable.
ITEM 9. PURCHASES OF EQUITY SECURITIES BY CLOSED-END MANAGEMENT INVESTMENT COMPANY AND AFFILIATED PURCHASES
Not applicable.
ITEM 10. SUBMISSION OF MATTERS TO A VOTE OF SECURITY HOLDERS
The Governance Committee (the “Committee”) of the Board of Trustees of the registrant (the “Trust”) has adopted procedures by which a shareholder of any series of the Trust may submit properly a nominee recommendation for the Committee’s consideration.
The shareholder must submit any such recommendation (a “Shareholder Recommendation”) in writing to the Trust, to the attention of the Trust’s Secretary, at the address of the principal executive offices of the Trust.
The Shareholder Recommendation must be delivered to, or mailed and received at, the principal executive offices of the Trust not less than forty-five (45) calendar days nor more than seventy-five (75) calendar days prior to the date of the Committee meeting at which the nominee would be considered.
The Shareholder Recommendation must include: (i) a statement in writing setting forth (A) the name, age, date of birth, business address, residence address and nationality of the person recommended by the shareholder (the “candidate”); (B) the series (and, if applicable, class) and number of all shares of the Trust owned of record or beneficially by the candidate, as reported to such shareholder by the candidate; (C) any other information regarding the candidate called for with respect to director nominees by paragraphs (a), (d), (e) and (f) of Item 401 of Regulation S-K or paragraph (b) of Item 22 of Rule 14a-101 (Schedule 14A) under the Securities Exchange Act of 1934, as amended (the “Exchange Act”), adopted by the Securities and Exchange Commission (or the corresponding provisions of any regulation or rule subsequently adopted by the Securities and Exchange Commission or any successor agency applicable to the Trust); (D) any other information regarding the candidate that would be required to be disclosed if the candidate were a nominee in a proxy statement or other filing required to be made in connection with solicitation of proxies for election of directors pursuant to Section 14 of the Exchange Act and the rules and regulations promulgated thereunder; and (E) whether the recommending shareholder believes that the candidate is or will be an “interested person” of the Trust (as defined in the Investment Company Act of 1940, as amended) and, if not an “interested person,” information regarding the candidate that will be sufficient for the Trust to make such determination; (ii) the written and signed consent of the candidate to be named as a nominee and to serve as a Trustee if elected; (iii) the recommending shareholder’s name as it appears on the Trust’s books; (iv) the series (and, if applicable, class) and number of all shares of the Trust owned beneficially and of record by the recommending shareholder; and (v) a description of all arrangements or understandings between the recommending shareholder and the candidate and any other person or persons (including their names) pursuant to which the recommendation is being made by the recommending shareholder. In addition, the Committee may require the candidate to interview in person and furnish such other information as it may reasonably require or deem necessary to determine the eligibility of such candidate to serve as a Trustee of the Trust.
ITEM 11. CONTROLS AND PROCEDURES
(a) The President and Treasurer have concluded that the Wells Fargo Funds Trust (the “Trust”) disclosure controls and procedures (as defined in Rule 30a-3(c) under the Investment Company Act of 1940) provide reasonable assurances that material information relating to the Trust is made known to them by the appropriate persons, based on their evaluation of these controls and procedures as of a date within 90 days of the filing of this report.
(b) There were no significant changes in the Trust’s internal controls over financial reporting (as defined in Rule 30a-3(d) under the Investment Company Act of 1940) that occurred during the second quarter of the period covered by this report that materially affected, or is reasonably likely to materially affect, the registrant’s internal control over financial reporting.
ITEM 12. EXHIBITS
(a)(1) Not required in this filing.
(a)(2) Certification pursuant to Rule 30a-2(a) under the Investment Company Act of 1940 (17 CFR 270.30a-2(a)) is filed and attached hereto as Exhibit 99.CERT.
(a)(3) Not applicable.
(b) Certification pursuant to Rule 30a-2(b) under the Investment Company Act of 1940 (17 CFR 270.30a-2(b)) is filed and attached hereto as Exhibit 99.906CERT.
SIGNATURES
Pursuant to the requirements of the Securities Exchange Act of 1934 and the Investment Company Act of 1940, the registrant has duly caused this report to be signed on its behalf by the undersigned, thereunto duly authorized.
| | |
Wells Fargo Funds Trust |
| |
By: | | /s/ Karla M. Rabusch |
| | Karla M. Rabusch |
| | President |
| |
Date: | | June 25, 2012 |
Pursuant to the requirements of the Securities Exchange Act of 1934 and the Investment Company Act of 1940, this report has been signed below by the following persons on behalf of the registrant and in the capacities and on the date indicated.
| | |
By: | | /s/ Karla M. Rabusch |
| | Karla M. Rabusch |
| | President |
| |
Date: | | June 25, 2012 |
| |
By: | | /s/ Kasey L. Phillips |
| | Kasey L. Phillips |
| | Treasurer |
| |
Date: | | June 25, 2012 |