
UNITED STATES
SECURITIES AND EXCHANGE COMMISSION
Washington, D.C. 20549
FORM N-CSRS
CERTIFIED SHAREHOLDER REPORT OF REGISTERED
MANAGEMENT INVESTMENT COMPANIES
Investment Company Act file number: 811-09253
(Exact name of registrant as specified in charter)
|
| 525 Market St., San Francisco, CA 94105 |
(Address of principal executive offices) (Zip code)
C. David Messman
Wells Fargo Funds Management, LLC
525 Market St., San Francisco, CA 94105
(Name and address of agent for service)
Registrant’s telephone number, including area code: 800-222-8222
Date of fiscal year end: January 31, 2012
Date of reporting period: July 31, 2012
| ITEM 1. | REPORT TO SHAREHOLDERS |

Wells Fargo Advantage
100% Treasury Money Market Fund

Semi-Annual Report
July 31, 2012

Reduce clutter. Save trees.
Sign up for electronic delivery of prospectuses and shareholder reports at wellsfargo.com/advantagedelivery
Contents
The views expressed and any forward-looking statements are as of July 31, 2012, unless otherwise noted, and are those of the Fund managers and/or Wells Fargo Funds Management, LLC. Discussions of individual securities, or the markets generally, or any Wells Fargo Advantage Fund are not intended as individual recommendations. Future events or results may vary significantly from those expressed in any forward-looking statements; the views expressed are subject to change at any time in response to changing circumstances in the market. Wells Fargo Funds Management, LLC, disclaims any obligation to publicly update or revise any views expressed or forward-looking statements.
NOT FDIC INSURED ¡ NO BANK GUARANTEE ¡ MAY LOSE VALUE

WELLS FARGO INVESTMENT HISTORY
| | |
| |
| 1932 | | Keystone creates one of the first mutual fund families. |
| |
| 1971 | | Wells Fargo & Company introduces one of the first institutional index funds. |
| |
| 1978 | | Wells Fargo applies Markowitz and Sharpe’s research on Modern Portfolio Theory to introduce one of the industry’s first Tactical Asset Allocation (TAA) models in institutional separately managed accounts. |
| |
| 1984 | | Wells Fargo Stagecoach Funds launches its first asset allocation fund. |
| |
| 1989 | | The Tactical Asset Allocation (TAA) Model is first applied to Wells Fargo’s asset allocation mutual funds. |
| |
| 1994 | | Wells Fargo introduces the LifePath Funds, one of the first suites of target date funds (now the Wells Fargo Advantage Dow Jones Target Date FundsSM). |
| |
| 1996 | | Evergreen Investments and Keystone Funds merge. |
| |
| 1997 | | Wells Fargo launches Wells Fargo Advantage WealthBuilder PortfoliosSM, a fund-of-funds suite of products that includes the use of quantitative models to shift assets among investment styles. |
| |
| 1999 | | Norwest Advantage Funds and Stagecoach Funds are reorganized into Wells Fargo Funds after the merger of Norwest and Wells Fargo. |
| |
| 2002 | | Evergreen Retail and Evergreen Institutional companies form the umbrella asset management company, Evergreen Investments. |
| |
| 2005 | | The integration of Strong Funds with Wells Fargo Funds creates Wells Fargo Advantage Funds, resulting in one of the top 20 mutual fund companies in the United States. |
| |
| 2006 | | Wells Fargo Advantage Funds relaunches the target date product line as Wells Fargo Advantage Dow Jones Target Date Funds. |
| |
| 2010 | | The mergers and reorganizations of Evergreen and Wells Fargo Advantage mutual funds are completed, unifying the families under the brand of Wells Fargo Advantage Funds. |
Wells Fargo Advantage Funds®
Wells Fargo Advantage Funds skillfully guides institutions, financial advisors, and individuals through the investment terrain to help them reach their financial objectives. Everything we do on behalf of investors is backed by our unique combination of qualifications.
Strength
Our organization is built on the standards of integrity and service established by our parent company—Wells Fargo & Company—more than 150 years ago. And, because we’re part of a highly diversified financial enterprise, we offer the depth of resources to help investors succeed.
Expertise
Our multi-boutique model offers investors access to the independent thinking of premier investment managers that have been chosen for their time-tested strategies. While each team specializes in a specific investment strategy, collectively they provide investors a wide choice of distinct investment styles. Our dedication to investment excellence doesn’t end with our expertise in manager selection—risk management, analysis, and rigorous ongoing review seek to ensure each manager’s investment process remains consistent.
Partnership
Our collaborative approach is built around understanding the needs and goals of our clients. By adhering to core principles of sound judgment and steady guidance, we support you through every stage of the investment decision process.
Carefully consider a fund’s investment objectives, risks, charges, and expenses before investing. For a current prospectus and, if available, a summary prospectus, containing this and other information, visit wellsfargoadvantagefunds.com. Read it carefully before investing.
Wells Fargo Funds Management, LLC, a wholly owned subsidiary of Wells Fargo & Company, provides investment advisory and administrative services for Wells Fargo Advantage Funds®. Other affiliates of Wells Fargo & Company provide subadvisory and other services for the Funds. The Funds are distributed by Wells Fargo Funds Distributor, LLC, Member FINRA/SIPC, an affiliate of Wells Fargo & Company.
“Dow Jones®” and “Dow Jones Target Date IndexesSM” are service marks of Dow Jones Trademark Holdings, LLC (“Dow Jones”), have been licensed to CME Group Index Services LLC (“CME Indexes”) and have been sublicensed for use for certain purposes by Global Index Advisors, Inc, and Wells Fargo Funds Management, LLC. The Wells Fargo Advantage Dow Jones Target Date FundsSM based on the Dow Jones Target Date IndexesSM, are not sponsored, endorsed, sold or promoted by Dow Jones, CME Indexes or their respective affiliates and none of them makes any representation regarding the advisability of investing in such product(s).
NOT FDIC INSURED ¡ NO BANK GUARANTEE ¡ MAY LOSE VALUE
Not part of the semi-annual report.
Wells Fargo Advantage Funds offers more than 110 mutual funds across a wide range of asset classes, representing over $209 billion in assets under management, as of July 31, 2012.
| | | | |
| Equity Funds | | | | |
Asia Pacific Fund | | Enterprise Fund† | | Opportunity Fund† |
C&B Large Cap Value Fund | | Equity Value Fund | | Precious Metals Fund |
C&B Mid Cap Value Fund | | Global Opportunities Fund | | Premier Large Company Growth Fund |
Capital Growth Fund | | Growth Fund | | Small Cap Opportunities Fund |
Common Stock Fund | | Index Fund | | Small Cap Value Fund |
Disciplined U.S. Core Fund | | International Equity Fund | | Small Company Growth Fund |
Discovery Fund† | | International Value Fund | | Small Company Value Fund |
Diversified Equity Fund | | Intrinsic Small Cap Value Fund | | Small/Mid Cap Core Fund |
Diversified International Fund | | Intrinsic Value Fund | | Small/Mid Cap Value Fund |
Diversified Small Cap Fund | | Intrinsic World Equity Fund | | Special Mid Cap Value Fund |
Emerging Growth Fund | | Large Cap Core Fund | | Special Small Cap Value Fund |
Emerging Markets Equity Fund | | Large Cap Growth Fund | | Specialized Technology Fund |
Emerging Markets Equity Income Fund | | Large Company Value Fund | | Traditional Small Cap Growth Fund |
Endeavor Select Fund† | | Omega Growth Fund | | Utility and Telecommunications Fund |
| Bond Funds | | | | |
Adjustable Rate Government Fund | | Inflation-Protected Bond Fund | | Short-Term Bond Fund |
California Limited-Term Tax-Free Fund | | Intermediate Tax/AMT-Free Fund | | Short-Term High Yield Bond Fund |
California Tax-Free Fund | | International Bond Fund | | Short-Term Municipal Bond Fund |
Colorado Tax-Free Fund | | Minnesota Tax-Free Fund | | Strategic Municipal Bond Fund |
Emerging Markets Local Bond Fund | | Municipal Bond Fund | | Total Return Bond Fund |
Government Securities Fund | | North Carolina Tax-Free Fund | | Ultra Short-Term Income Fund |
High Income Fund | | Pennsylvania Tax-Free Fund | | Ultra Short-Term Municipal Income Fund |
High Yield Bond Fund | | Short Duration Government Bond Fund | | Wisconsin Tax-Free Fund |
Income Plus Fund | | | | |
| Asset Allocation Funds | | | | |
Absolute Return Fund | | WealthBuilder Equity Portfolio† | | Target 2020 Fund† |
Asset Allocation Fund | | WealthBuilder Growth Allocation Portfolio† | | Target 2025 Fund† |
Conservative Allocation Fund | | WealthBuilder Growth Balanced Portfolio† | | Target 2030 Fund† |
Diversified Capital Builder Fund | | WealthBuilder Moderate Balanced Portfolio† | | Target 2035 Fund† |
Diversified Income Builder Fund | | WealthBuilder Tactical Equity Portfolio† | | Target 2040 Fund† |
Growth Balanced Fund | | Target Today Fund† | | Target 2045 Fund† |
Index Asset Allocation Fund | | Target 2010 Fund† | | Target 2050 Fund† |
Moderate Balanced Fund | | Target 2015 Fund† | | Target 2055 Fund† |
WealthBuilder Conservative Allocation Portfolio† | | | | |
| Money Market Funds | | | | |
100% Treasury Money Market Fund | | Heritage Money Market Fund† | | National Tax-Free Money Market Fund |
California Municipal Money Market Fund | | Money Market Fund | | Prime Investment Money Market Fund |
Cash Investment Money Market Fund | | Municipal Cash Management Money Market Fund | | Treasury Plus Money Market Fund |
Government Money Market Fund | | Municipal Money Market Fund | | |
| Variable Trust Funds1 | | | | |
VT Discovery Fund† | | VT Intrinsic Value Fund | | VT Small Cap Growth Fund |
VT Index Asset Allocation Fund | | VT Omega Growth Fund | | VT Small Cap Value Fund |
VT International Equity Fund | | VT Opportunity Fund† | | VT Total Return Bond Fund |
An investment in a money market fund is not insured or guaranteed by the Federal Deposit Insurance Corporation or any other government agency. Although the Wells Fargo Advantage Money Market Funds seek to preserve the value of your investment at $1.00 per share, it is possible to lose money by investing in a money market fund.
| 1. | The Variable Trust Funds are generally available only through insurance company variable contracts. |
| † | In this report, the Wells Fargo Advantage Discovery FundSM, Wells Fargo Advantage Endeavor Select FundSM, Wells Fargo Advantage Enterprise FundSM, Wells Fargo Advantage Opportunity FundSM, Wells Fargo Advantage WealthBuilder Conservative Allocation PortfolioSM, Wells Fargo Advantage WealthBuilder Equity PortfolioSM, Wells Fargo Advantage WealthBuilder Growth Allocation PortfolioSM, Wells Fargo Advantage WealthBuilder Growth Balanced PortfolioSM, Wells Fargo Advantage WealthBuilder Moderate Balanced PortfolioSM, Wells Fargo Advantage WealthBuilder Tactical Equity PortfolioSM, Wells Fargo Advantage Dow Jones Target Today FundSM, Wells Fargo Advantage Dow Jones Target 2010 FundSM, Wells Fargo Advantage Dow Jones Target 2015 FundSM, Wells Fargo Advantage Dow Jones Target 2020 FundSM, Wells Fargo Advantage Dow Jones Target 2025 FundSM, Wells Fargo Advantage Dow Jones Target 2030 FundSM, Wells Fargo Advantage Dow Jones Target 2035 FundSM, Wells Fargo Advantage Dow Jones Target 2040 FundSM, Wells Fargo Advantage Dow Jones Target 2045 FundSM, Wells Fargo Advantage Dow Jones Target 2050 FundSM, Wells Fargo Advantage Dow Jones Target 2055 FundSM, Wells Fargo Advantage Heritage Money Market FundSM, Wells Fargo Advantage VT Discovery FundSM, and Wells Fargo Advantage VT Opportunity FundSM are referred to as the Discovery Fund, Endeavor Select Fund, Enterprise Fund, Opportunity Fund, WealthBuilder Conservative Allocation Portfolio, WealthBuilder Equity Portfolio, WealthBuilder Growth Allocation Portfolio, WealthBuilder Growth Balanced Portfolio, WealthBuilder Moderate Balanced Portfolio, WealthBuilder Tactical Equity Portfolio, Target Today Fund, Target 2010 Fund, Target 2015 Fund, Target 2020 Fund, Target 2025 Fund, Target 2030 Fund, Target 2035 Fund, Target 2040 Fund, Target 2045 Fund, Target 2050 Fund, Target 2055 Fund, Heritage Money Market Fund, VT Discovery Fund, and VT Opportunity Fund, respectively. |
Not part of the semi-annual report.
| | | | |
| 2 | | Wells Fargo Advantage 100% Treasury Money Market Fund | | Letter to Shareholders (Unaudited) |

Karla M. Rabusch,
President
Wells Fargo Advantage Funds
Not only has the Fed been successful in engineering low interest rates, but investors have rushed to buy U.S. Treasury securities as a safe-haven asset in the midst of uncertainty surrounding the European debt crisis. As a result, interest rates reached record lows.
Dear Valued Shareholder:
We’re pleased to offer you this semi-annual report for the Wells Fargo Advantage 100% Treasury Money Market Fund for the six-month period that ended July 31, 2012.
The economy grew, but the recovery has been modest.
The U.S. is three years into a modest economic recovery, with second-quarter real gross domestic product (GDP) increasing 1.5% on an annualized basis. Several factors, however, held back growth despite the Federal Reserve’s (Fed) accommodative monetary policy. In Europe, much uncertainty remained about the outcome of the eurozone debt crisis and whether policymakers will be able to resolve it without any countries defaulting or leaving the euro. In addition, Europe has again entered a recession. In Asia, China’s economy slowed. Here at home, a potential “fiscal cliff”—automatic tax increases alongside automatic budget cuts stemming from a legislative compromise in Congress—added uncertainty and, if unaddressed, could negatively affect GDP beginning in 2013.
In an effort to further bolster the economy, especially the labor market, the Fed has indicated its commitment to maintaining a highly accommodative monetary policy. It has indicated its belief that economic conditions warrant an extremely low federal funds target rate—a short-term bank lending rate—near 0%, at least through late 2014. The Fed also continued its “Operation Twist,” which involves buying U.S. Treasury securities with maturities of greater than six years and selling U.S. Treasury securities with maturities of less than three years, in an effort to keep longer-term interest rates low.
A demand for relative safe-haven securities led to ultra-low interest rates.
Not only has the Fed been successful in engineering low interest rates, but investors have rushed to buy U.S. Treasury securities as a relative safe-haven asset in the midst of uncertainty surrounding the European debt crisis. As a result, interest rates reached record lows. Ten-year U.S. Treasury yields ranged between 2.38% and 1.38% over the past six months. Three-month U.S. Treasury bills had an average yield of 10 basis points (bps; 100 bps is 1.00%) over the past six months. Rates on seven-day commercial paper, a common investment type for prime money market funds, were 12 bps on July 31, 2012.
Lack of supply kept a lid on yields, and regulatory uncertainty remained.
Continued demand for a limited supply of money market-eligible securities also contributed to low yields. We estimate that the amount outstanding of short-term, money market fund-eligible securities (excluding U.S. Treasury securities) has declined by $3 trillion, or more than a 30% decrease, since 2008. Reasons for this decrease in supply include issuers opting to lock in rates on long-term rather than short-term debt, less need for financing as many companies have plentiful cash given record profits, and credit downgrades that have resulted in fewer firms with top credit ratings.
The Chairman of the Securities and Exchange Commission (SEC) indicated in late August that the SEC has determined at this time not to propose certain amendments to the rules governing money market funds. However, the Financial Stability Oversight Council or other financial regulators could still take steps to
| | | | | | |
| Letter to Shareholders (Unaudited) | | Wells Fargo Advantage 100% Treasury Money Market Fund | | | 3 | |
impose additional regulations on money market funds. As we gain clarity in the coming months regarding any potential changes to regulation of money market funds, we will provide further communications to our clients about these changes.
Amid the current challenges of investing—low yields, an unresolved eurozone crisis, limited supply, and regulatory uncertainty—has been the opportunity to provide our clients an important investment option for meeting their short-term cash needs. Our focus on preservation of capital and liquidity is not a marketing phrase but rather the basis of our investment philosophy as we manage money market funds in an uncertain world. We are proud of our comprehensive lineup of prime, government, and tax-exempt money market funds.
Thank you for choosing to invest with Wells Fargo Advantage Funds. We appreciate your confidence in us and remain committed to helping you meet your financial needs. For current information about your fund investments, contact your investment professional, visit our Web site at wellsfargoadvantagefunds.com, or call us directly at 1-800-222-8222. We are available 24 hours a day, 7 days a week.
Sincerely,

Karla M. Rabusch
President
Wells Fargo Advantage Funds
Amid the current challenges of investing—low yields, an unresolved eurozone crisis, limited supply, and regulatory uncertainty—has been the opportunity to provide our clients an important investment option for meeting their short-term cash needs.
| | | | |
| 4 | | Wells Fargo Advantage 100% Treasury Money Market Fund | | Performance Highlights (Unaudited) |
INVESTMENT OBJECTIVE
The Fund seeks current income exempt from most state and local individual income taxes, while preserving capital and liquidity.
ADVISER
Wells Fargo Funds Management, LLC
SUB-ADVISER
Wells Capital Management Incorporated
PORTFOLIO MANAGERS
David D. Sylvester
Laurie White
FUND INCEPTION
December 3, 1990
| | |
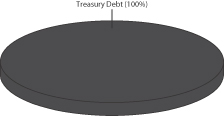
PORTFOLIO COMPOSITION1
(AS OF JULY 31, 2012) | | |
|
|
| | |
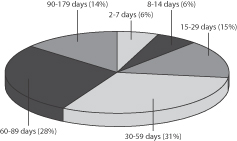
EFFECTIVE MATURITY DISTRIBUTION2
(AS OF JULY 31, 2012) |
|
|
| | |
WEIGHTED AVERAGE MATURITY3
(AS OF JULY 31, 2012) | | |
53 Days | | |
| | |
WEIGHTED AVERAGE FINAL MATURITY4 (AS OF JULY 31, 2012) |
53 Days | | |
| 1. | Portfolio composition is subject to change and is calculated based on the total investments of the Fund. |
| 2. | Effective maturity distribution is subject to change and is calculated based on the total investments of the Fund. |
| 3. | Weighted Average Maturity (WAM): WAM is an average of the effective maturities of all securities held in the portfolio, weighted by each security’s percentage of total investments. The maturity of a portfolio security is the period remaining until the date on which the principal amount is unconditionally required to be paid, or in the case of a security called for redemption, the date on which the redemption payment is unconditionally required to be made. WAM calculations allow for the maturities of certain securities with demand features or periodic interest rate resets to be shortened. WAM is a way to measure a fund’s sensitivity to potential interest rate changes. |
| 4. | Weighted Average Final Maturity (WAFM): WAFM is an average of the final maturities of all securities held in the portfolio, weighted by their percentage of total investments. The maturity of a portfolio security is the period remaining until the date on which the principal amount is unconditionally required to be paid, or in the case of a security called for redemption, the date on which the redemption payment is unconditionally required to be made. In contrast to WAM, the calculation of WAFM allows for the maturities of certain securities with demand features to be shortened, but not the periodic interest rate resets. WAFM is a way to measure a fund’s potential sensitivity to credit spread changes. |
| | | | | | |
| Performance Highlights (Unaudited) | | Wells Fargo Advantage 100% Treasury Money Market Fund | | | 5 | |
AVERAGE ANNUAL TOTAL RETURN5 (%) (AS OF JULY 31, 2012)
| | | | | | | | | | | | | | | | | | | | | | | | | | | | |
| | | | | | | | | Expense Ratios6 | |
| | | Inception Date | | | 6 Months* | | | 1 Year | | | 5 Year | | | 10 Year | | | Gross | | | Net7 | |
Class A (WFTXX) | | | 11/08/1999 | | | | 0.00 | | | | 0.01 | | | | 0.55 | | | | 1.32 | | | | 0.78% | | | | 0.65% | |
Administrator Class (WTRXX) | | | 06/30/2010 | | | | 0.00 | | | | 0.01 | | | | 0.59 | | | | 1.42 | | | | 0.51% | | | | 0.30% | |
Service Class (NWTXX) | | | 12/03/1990 | | | | 0.00 | | | | 0.01 | | | | 0.59 | | | | 1.42 | | | | 0.68% | | | | 0.50% | |
Sweep Class | | | 06/30/2010 | | | | 0.00 | | | | 0.01 | | | | 0.59 | | | | 1.42 | | | | 1.13% | | | | 1.00% | |
| * | Returns for periods of less than one year are not annualized. |
| | | | | | | | | | | | | | | | |
FUND YIELD SUMMARY7
(AS OF JULY 31, 2012) | | Class A | | | Administrator Class | | | Service Class | | | Sweep Class | |
7-Day Current Yield | | | 0.00% | | | | 0.00% | | | | 0.00% | | | | 0.00% | |
7-Day Compound Yield | | | 0.00% | | | | 0.00% | | | | 0.00% | | | | 0.00% | |
30-Day Simple Yield | | | 0.00% | | | | 0.00% | | | | 0.00% | | | | 0.00% | |
30-Day Compound Yield | | | 0.00% | | | | 0.00% | | | | 0.00% | | | | 0.00% | |
Figures quoted represent past performance, which is no guarantee of future results and do not reflect the deduction of taxes that a shareholder may pay on fund distributions or the redemption of fund shares. Investment returns will fluctuate. The Fund’s yield figures more closely reflect the current earnings of the Fund than the total return figures. Current performance may be lower or higher than the performance data quoted and assumes the reinvestment of dividends and capital gains. Current month-end performance is available at the Fund’s
Web site – wellsfargoadvantagefunds.com.
Each class is sold without a front-end sales charge or contingent deferred sales charge. Other fees and expenses apply to an investment in the Fund and are described in the Fund’s current prospectuses.
An investment in a money market fund is not insured or guaranteed by the Federal Deposit Insurance Corporation or any other government agency. Although the Fund seeks to preserve the value of your investment at $1.00 per share, it is possible to lose money by investing in a money market fund. The U.S. Government guarantee applies to certain of the underlying securities held by the Fund and not to shares of the Fund itself.
| 5. | Historical performance shown for the Administrator Class shares prior to their inception reflects the performance of the Service Class shares, and includes the higher expenses applicable to the Service Class shares. If these expenses had not been included, returns would be higher. Historical performance shown for the Sweep Class shares prior to their inception reflects the performance of the Service Class shares, and has not been adjusted to reflect the higher expenses applicable to the Sweep Class shares. If these expenses had been adjusted, returns would be lower. |
| 6. | Reflects the expense ratios as stated in the most recent prospectuses. |
| 7. | The Adviser has committed through July 11, 2013 to waive fees and/or reimburse expenses to the extent necessary to cap the Fund’s Total Annual Fund Operating Expenses After Fee Waiver, excluding certain expenses, at the amounts shown above. Brokerage commissions, stamp duty fees, interest, taxes, acquired fund fees and expenses and extraordinary expenses are excluded from the cap. Without this cap, the Fund’s returns would have been lower. Without waived fees and/or reimbursed expenses, the Fund’s 7-day current yield would have been (0.69)%, (0.42)%, (0.59)% and (1.04)% for Class A, Administrator Class, Service Class and Sweep Class, respectively. |
| | | | |
| 6 | | Wells Fargo Advantage 100% Treasury Money Market Fund | | Fund Expenses (Unaudited) |
As a shareholder of the Fund, you incur ongoing costs, including management fees, distribution (12b-1) and/or shareholder service fees, and other Fund expenses. This example is intended to help you understand your ongoing costs (in dollars) of investing in the Fund and to compare these costs with the ongoing costs of investing in other mutual funds.
The example is based on an investment of $1,000 invested at the beginning of the six-month period and held for the entire period from February 1, 2012 to July 31, 2012.
Actual Expenses
The “Actual” line of the table below provides information about actual account values and actual expenses. You may use the information in this line, together with the amount you invested, to estimate the expenses that you paid over the period. Simply divide your account value by $1,000 (for example, an $8,600 account value divided by $1,000 = 8.6), then multiply the result by the number in the “Actual” line under the heading entitled “Expenses Paid During Period” for your applicable class of shares to estimate the expenses you paid on your account during this period.
Hypothetical Example for Comparison Purposes
The “Hypothetical” line of the table below provides information about hypothetical account values and hypothetical expenses based on the Fund’s actual expense ratio and an assumed rate of return of 5% per year before expenses, which is not the Fund’s actual return. The hypothetical account values and expenses may not be used to estimate the actual ending account balance or expenses you paid for the period. You may use this information to compare the ongoing costs of investing in the Fund and other funds. To do so, compare this 5% hypothetical example with the 5% hypothetical examples that appear in the shareholder reports of the other funds.
Please note that the expenses shown in the table are meant to highlight your ongoing costs only. Therefore, the “Hypothetical” line of the table is useful in comparing ongoing costs only, and will not help you determine the relative total costs of owning different funds.
| | | | | | | | | | | | | | | | |
| | | Beginning
Account Value
02-01-2012 | | | Ending
Account Value
07-31-2012 | | | Expenses Paid During the Period1 | | | Net Annual
Expense Ratio | |
Class A | | | | | | | | | | | | | | | | |
Actual | | $ | 1,000.00 | | | $ | 1,000.00 | | | $ | 0.40 | | | | 0.08 | % |
Hypothetical (5% return before expenses) | | $ | 1,000.00 | | | $ | 1,024.47 | | | $ | 0.40 | | | | 0.08 | % |
Administrator Class | | | | | | | | | | | | | | | | |
Actual | | $ | 1,000.00 | | | $ | 1,000.00 | | | $ | 0.40 | | | | 0.08 | % |
Hypothetical (5% return before expenses) | | $ | 1,000.00 | | | $ | 1,024.47 | | | $ | 0.40 | | | | 0.08 | % |
Service Class | | | | | | | | | | | | | | | | |
Actual | | $ | 1,000.00 | | | $ | 1,000.00 | | | $ | 0.40 | | | | 0.08 | % |
Hypothetical (5% return before expenses) | | $ | 1,000.00 | | | $ | 1,024.47 | | | $ | 0.40 | | | | 0.08 | % |
Sweep Class | | | | | | | | | | | | | | | | |
Actual | | $ | 1,000.00 | | | $ | 1,000.00 | | | $ | 0.40 | | | | 0.08 | % |
Hypothetical (5% return before expenses) | | $ | 1,000.00 | | | $ | 1,024.47 | | | $ | 0.40 | | | | 0.08 | % |
| 1. | Expenses paid is equal to the annualized expense ratio of each class multiplied by the average account value over the period, multiplied by the number of days in the most recent fiscal half-year divided by the number of days in the fiscal year (to reflect the one-half year period). |
| | | | | | |
Portfolio of Investments—July 31, 2012 (Unaudited) | | Wells Fargo Advantage 100% Treasury Money Market Fund | | | 7 | |
| | | | | | | | | | | | | | | | |
| Security Name | | Interest Rate | | | Maturity Date | | | Principal | | | Value | |
| | | | | | | | | | | | | | | | |
| | | | |
Treasury Debt : 107.47% | | | | | | | | | | | | | | | | |
U.S. Treasury Bill (z) | | | 0.05 | % | | | 08/02/2012 | | | $ | 556,740,000 | | | $ | 556,738,575 | |
U.S. Treasury Bill (z) | | | 0.07 | | | | 08/23/2012 | | | | 725,770,000 | | | | 725,735,457 | |
U.S. Treasury Bill (z) | | | 0.08 | | | | 09/06/2012 | | | | 449,470,000 | | | | 449,435,940 | |
U.S. Treasury Bill (z) | | | 0.08 | | | | 08/09/2012 | | | | 615,000,000 | | | | 614,988,222 | |
U.S. Treasury Bill (z) | | | 0.09 | | | | 08/30/2012 | | | | 500,000,000 | | | | 499,965,112 | |
U.S. Treasury Bill (z) | | | 0.09 | | | | 09/13/2012 | | | | 582,750,000 | | | | 582,685,361 | |
U.S. Treasury Bill (z) | | | 0.09 | | | | 10/11/2012 | | | | 590,000,000 | | | | 589,888,224 | |
U.S. Treasury Bill (z) | | | 0.09 | | | | 09/27/2012 | | | | 600,000,000 | | | | 599,913,946 | |
U.S. Treasury Bill (z) | | | 0.09 | | | | 10/25/2012 | | | | 650,000,000 | | | | 649,857,583 | |
U.S. Treasury Bill (z) | | | 0.10 | | | | 10/18/2012 | | | | 653,540,000 | | | | 653,410,166 | |
U.S. Treasury Bill (z) | | | 0.10 | | | | 08/16/2012 | | | | 649,180,000 | | | | 649,153,627 | |
U.S. Treasury Bill (z) | | | 0.10 | | | | 09/20/2012 | | | | 700,000,000 | | | | 699,905,208 | |
U.S. Treasury Bill (z) | | | 0.10 | | | | 10/04/2012 | | | | 700,000,000 | | | | 699,872,911 | |
U.S. Treasury Bill (z) | | | 0.11 | | | | 11/01/2012 | | | | 700,000,000 | | | | 699,810,108 | |
U.S. Treasury Note | | | 0.50 | | | | 11/30/2012 | | | | 173,000,000 | | | | 173,191,947 | |
U.S. Treasury Note | | | 0.38 | | | | 08/31/2012 | | | | 140,000,000 | | | | 140,028,667 | |
U.S. Treasury Note | | | 0.38 | | | | 09/30/2012 | | | | 40,000,000 | | | | 40,015,278 | |
U.S. Treasury Note | | | 0.38 | | | | 10/31/2012 | | | | 40,000,000 | | | | 40,022,079 | |
U.S. Treasury Note | | | 1.13 | | | | 12/15/2012 | | | | 120,000,000 | | | | 120,424,617 | |
U.S. Treasury Note | | | 1.38 | | | | 09/15/2012 | | | | 165,000,000 | | | | 165,246,791 | |
U.S. Treasury Note | | | 1.38 | | | | 10/15/2012 | | | | 25,000,000 | | | | 25,061,268 | |
U.S. Treasury Note | | | 1.38 | | | | 11/15/2012 | | | | 245,000,000 | | | | 245,865,288 | |
U.S. Treasury Note | | | 1.38 | | | | 01/15/2013 | | | | 65,000,000 | | | | 65,352,077 | |
U.S. Treasury Note | | | 1.75 | | | | 08/15/2012 | | | | 135,000,000 | | | | 135,084,655 | |
U.S. Treasury Note | | | 3.38 | | | | 11/30/2012 | | | | 26,000,000 | | | | 26,276,849 | |
U.S. Treasury Note | | | 3.88 | | | | 10/31/2012 | | | | 25,000,000 | | | | 25,231,540 | |
U.S. Treasury Note | | | 4.13 | | | | 08/31/2012 | | | | 9,500,000 | | | | 9,530,768 | |
U.S. Treasury Note | | | 4.25 | | | | 09/30/2012 | | | | 160,000,000 | | | | 161,077,187 | |
| | | | | | | | | | | | | | | | |
| | | | |
Total Treasury Debt (Cost $10,043,769,451) | | | | | | | | | | | | | | | 10,043,769,451 | |
| | | | | | | | | | | | | | | | |
| | | | | | | | |
| Total Investments in Securities | | | | | | | | |
| (Cost $10,043,769,451) * | | | 107.47 | % | | | 10,043,769,451 | |
Other Assets and Liabilities, Net | | | (7.47 | ) | | | (698,234,834 | ) |
| | | | | | | | |
| Total Net Assets | | | 100.00 | % | | $ | 9,345,534,617 | |
| | | | | | | | |
| (z) | Zero coupon security. Rate represents yield to maturity at time of purchase. |
| * | Cost for federal income tax purposes is substantially the same as for financial reporting purposes. |
The accompanying notes are an integral part of these financial statements.
| | | | |
| 8 | | Wells Fargo Advantage 100% Treasury Money Market Fund | | Statement of Assets and Liabilities—July 31, 2012 (Unaudited) |
| | | | |
| | | | |
| |
Assets | | | | |
Investments in unaffiliated securities, at amortized cost | | | $10,043,769,451 | |
Cash | | | 8,955 | |
Receivable for Fund shares sold | | | 1,450,093 | |
Receivable for interest | | | 6,275,517 | |
Receivable from adviser | | | 2,644,072 | |
Prepaid expenses and other assets | | | 84,626 | |
| | | | |
Total assets | | | 10,054,232,714 | |
| | | | |
| |
Liabilities | | | | |
Payable for investments purchased | | | 699,810,108 | |
Payable for Fund shares redeemed | | | 5,306,365 | |
Distribution fees payable | | | 128,054 | |
Due to other related parties | | | 1,388,473 | |
Accrued expenses and other liabilities | | | 2,065,097 | |
| | | | |
Total liabilities | | | 708,698,097 | |
| | | | |
Total net assets | | | $9,345,534,617 | |
| | | | |
| |
NET ASSETS CONSIST OF | | | | |
Paid-in capital | | | $9,345,431,739 | |
Overdistributed net investment income | | | (5,010 | ) |
Accumulated net realized gains on investments | | | 107,888 | |
| | | | |
Total net assets | | | $9,345,534,617 | |
| | | | �� |
| |
COMPUTATION OF NET ASSET VALUE PER SHARE1 | | | | |
Net assets – Class A | | | $237,101,585 | |
Shares outstanding – Class A | | | 237,087,323 | |
Net asset value per share – Class A | | | $1.00 | |
Net assets – Administrator Class | | | $1,620,668,888 | |
Shares outstanding – Administrator Class | | | 1,620,662,142 | |
Net asset value per share – Administrator Class | | | $1.00 | |
Net assets – Service Class | | | $7,059,176,546 | |
Shares outstanding – Service Class | | | 7,058,582,593 | |
Net asset value per share – Service Class | | | $1.00 | |
Net assets – Sweep Class | | | $428,587,598 | |
Shares outstanding – Sweep Class | | | 428,588,386 | |
Net asset value per share – Sweep Class | | | $1.00 | |
| 1. | The Fund has an unlimited number of authorized shares. |
The accompanying notes are an integral part of these financial statements.
| | | | | | |
| Statement of Operations—Six Months Ended July 31, 2012 (Unaudited) | | Wells Fargo Advantage 100% Treasury Money Market Fund | | | 9 | |
| | | | |
| | | | |
| |
Investment income | | | | |
Interest | | $ | 3,790,138 | |
| | | | |
| |
Expenses | | | | |
Advisory fee | | | 12,963,050 | |
Administration fees | | | | |
Fund level | | | 2,193,691 | |
Class A | | | 250,576 | |
Administrator Class | | | 869,381 | |
Service Class | | | 4,455,081 | |
Sweep Class | | | 420,402 | |
Shareholder servicing fees | | | | |
Class A | | | 240,616 | |
Administrator Class | | | 849,401 | |
Service Class | | | 9,165,703 | |
Sweep Class | | | 477,730 | |
Distribution fees | | | | |
Sweep Class | | | 668,822 | |
Custody and accounting fees | | | 227,800 | |
Professional fees | | | 22,730 | |
Registration fees | | | 50,931 | |
Shareholder report expenses | | | 20,652 | |
Trustees’ fees and expenses | | | 3,449 | |
Other fees and expenses | | | 93,738 | |
| | | | |
Total expenses | | | 32,973,753 | |
Less: Fee waivers and/or expense reimbursements | | | (29,183,615 | ) |
| | | | |
Net expenses | | | 3,790,138 | |
| | | | |
Net investment income | | | 0 | |
| | | | |
Net realized gains on investments | | | 108,357 | |
| | | | |
Net increase in net assets resulting from operations | | $ | 108,357 | |
| | | | |
The accompanying notes are an integral part of these financial statements.
| | | | |
| 10 | | Wells Fargo Advantage 100% Treasury Money Market Fund | | Statement of Changes in Net Assets |
| | | | | | | | | | | | | | | | |
| | | Six Months Ended July 31, 2012 (Unaudited) | | | Year Ended January 31, 2012 | |
| | | | |
Operations | | | | | | | | | | | | | | | | |
Net investment income | | | | | | $ | 0 | | | | | | | $ | 949,549 | |
Net realized gains on investments | | | | | | | 108,357 | | | | | | | | 633,449 | |
| | | | | | | | | | | | | | | | |
Net increase in net assets resulting from operations | | | | | | | 108,357 | | | | | | | | 1,582,998 | |
| | | | | | | | | | | | | | | | |
| | | | |
Distributions to shareholders from | | | | | | | | | | | | | | | | |
Net investment income | | | | | | | | | | | | | | | | |
Class A | | | | | | | 0 | | | | | | | | (19,382 | ) |
Administrator Class | | | | | | | 0 | | | | | | | | (117,917 | ) |
Service Class | | | | | | | 0 | | | | | | | | (793,445 | ) |
Sweep Class | | | | | | | 0 | | | | | | | | (18,805 | ) |
Net realized gains | | | | | | | | | | | | | | | | |
Class A | | | | | | | 0 | | | | | | | | (14,373 | ) |
Administrator Class | | | | | | | 0 | | | | | | | | (105,018 | ) |
Service Class | | | | | | | 0 | | | | | | | | (503,314 | ) |
Sweep Class | | | | | | | 0 | | | | | | | | (17,440 | ) |
| | | | | | | | | | | | | | | | |
Total distributions to shareholders | | | | | | | 0 | | | | | | | | (1,589,694 | ) |
| | | | | | | | | | | | | | | | |
| | | | |
| | | Shares | | | | | | Shares | | | | |
| Capital share transactions | | | | | | | | | | | | | | | | |
Proceeds from shares sold | | | | | | | | | | | | | | | | |
Class A | | | 95,379,995 | | | | 95,379,995 | | | | 273,877,092 | | | | 273,877,092 | |
Administrator Class | | | 1,650,237,809 | | | | 1,650,237,809 | | | | 3,919,579,326 | | | | 3,919,579,326 | |
Service Class | | | 14,460,372,648 | | | | 14,460,372,648 | | | | 34,746,578,862 | | | | 34,746,578,862 | |
Sweep Class | | | 1,868,450,983 | | | | 1,868,450,983 | | | | 2,446,887,644 | | | | 2,446,887,644 | |
| | | | | | | | | | | | | | | | |
| | | | | | | 18,074,441,435 | | | | | | | | 41,386,922,924 | |
| | | | | | | | | | | | | | | | |
Reinvestment of distributions | | | | | | | | | | | | | | | | |
Class A | | | 0 | | | | 0 | | | | 31,066 | | | | 31,066 | |
Administrator Class | | | 0 | | | | 0 | | | | 112,703 | | | | 112,703 | |
Service Class | | | 0 | | | | 0 | | | | 529,017 | | | | 529,017 | |
Sweep Class | | | 0 | | | | 0 | | | | 36,245 | | | | 36,245 | |
| | | | | | | | | | | | | | | | |
| | | | | | | 0 | | | | | | | | 709,031 | |
| | | | | | | | | | | | | | | | |
Payment for shares redeemed | | | | | | | | | | | | | | | | |
Class A | | | (88,863,017 | ) | | | (88,863,017 | ) | | | (268,823,265 | ) | | | (268,823,265 | ) |
Administrator Class | | | (1,666,358,038 | ) | | | (1,666,358,038 | ) | | | (2,945,750,306 | ) | | | (2,945,750,306 | ) |
Service Class | | | (15,904,017,325 | ) | | | (15,904,017,325 | ) | | | (34,679,588,361 | ) | | | (34,679,588,361 | ) |
Sweep Class | | | (1,749,139,046 | ) | | | (1,749,139,046 | ) | | | (2,250,291,605 | ) | | | (2,250,291,605 | ) |
| | | | | | | | | | | | | | | | |
| | | | | | | (19,408,377,426 | ) | | | | | | | (40,144,453,537 | ) |
| | | | | | | | | | | | | | | | |
Net increase (decrease) in net assets resulting from capital
share transactions | | | | | | | (1,333,935,991 | ) | | | | | | | 1,243,178,418 | |
| | | | | | | | | | | | | | | | |
Total increase (decrease) in net assets | | | | | | | (1,333,827,634 | ) | | | | | | | 1,243,171,722 | |
| | | | | | | | | | | | | | | | |
| | | | |
Net assets | | | | | | | | | | | | | | | | |
Beginning of period | | | | | | | 10,679,362,251 | | | | | | | | 9,436,190,529 | |
| | | | | | | | | | | | | | | | |
End of period | | | | | | $ | 9,345,534,617 | | | | | | | $ | 10,679,362,251 | |
| | | | | | | | | | | | | | | | |
Overdistributed net investment income | | | | | | $ | (5,010 | ) | | | | | | $ | (5,010 | ) |
| | | | | | | | | | | | | | | | |
The accompanying notes are an integral part of these financial Statements.
| | | | | | |
| Financial Highlights | | Wells Fargo Advantage 100% Treasury Money Market Fund | | | 11 | |
(For a share outstanding throughout each period)
| | | | | | | | | | | | | | | | | | | | | | | | | | | | |
| | | Six Months Ended July 31, 2012 (Unaudited) | | | Year Ended
January 31, | | | Year Ended February 28, | |
Class A | | | 2012 | | | 20111 | | | 2010 | | | 2009 | | | 20082 | | | 2007 | |
Net asset value, beginning of period | | | $1.00 | | | | $1.00 | | | | $1.00 | | | | $1.00 | | | | $1.00 | | | | $1.00 | | | | $1.00 | |
Net investment income | | | 0.00 | | | | 0.00 | 3 | | | 0.00 | 3 | | | 0.00 | 3 | | | 0.01 | | | | 0.04 | | | | 0.04 | |
Net realized gains on investments | | | 0.00 | 3 | | | 0.00 | 3 | | | 0.00 | 3 | | | 0.00 | 3 | | | 0.00 | | | | 0.00 | | | | 0.00 | |
| | | | | | | | | | | | | | | | | | | | | | | | | | | | |
Total from investment operations | | | 0.00 | 3 | | | 0.00 | 3 | | | 0.00 | 3 | | | 0.00 | 3 | | | 0.01 | | | | 0.04 | | | | 0.04 | |
Distributions to shareholders from | | | | | | | | | | | | | | | | | | | | | | | | | | | | |
Net investment income | | | 0.00 | | | | (0.00 | )3 | | | (0.00 | )3 | | | (0.00 | )3 | | | (0.01 | ) | | | (0.04 | ) | | | (0.04 | ) |
Net realized gains | | | 0.00 | | | | (0.00 | )3 | | | (0.00 | )3 | | | (0.00 | )3 | | | 0.00 | | | | 0.00 | | | | 0.00 | |
| | | | | | | | | | | | | | | | | | | | | | | | | | | | |
Total distributions to shareholders | | | 0.00 | | | | (0.00 | )3 | | | (0.00 | )3 | | | (0.00 | )3 | | | (0.01 | ) | | | (0.04 | ) | | | (0.04 | ) |
Net asset value, end of period | | | $1.00 | | | | $1.00 | | | | $1.00 | | | | $1.00 | | | | $1.00 | | | | $1.00 | | | | $1.00 | |
Total return4 | | | 0.00 | % | | | 0.02 | % | | | 0.01 | % | | | 0.03 | % | | | 0.74 | % | | | 3.81 | % | | | 4.29 | % |
Ratios to average net assets (annualized) | | | | | | | | | | | | | | | | | | | | | | | | | | | | |
Gross expenses | | | 0.75 | % | | | 0.69 | % | | | 0.75 | % | | | 0.80 | % | | | 0.83 | % | | | 0.83 | % | | | 0.84 | % |
Net expenses | | | 0.08 | % | | | 0.05 | % | | | 0.14 | % | | | 0.18 | % | | | 0.58 | % | | | 0.65 | % | | | 0.65 | % |
Net investment income | | | 0.00 | % | | | 0.01 | % | | | 0.01 | % | | | 0.01 | % | | | 0.68 | % | | | 3.75 | % | | | 4.23 | % |
Supplemental data | | | | | | | | | | | | | | | | | | | | | | | | | | | | |
Net assets, end of period (000’s omitted) | | | $237,102 | | | | $230,582 | | | | $225,499 | | | | $272,399 | | | | $306,451 | | | | $298,220 | | | | $256,430 | |
| 1. | For the eleven months ended January 31, 2011. The Fund changed its fiscal year end from February 28 to January 31, effective January 31, 2011. |
| 3. | Amount is less than $0.005. |
| 4. | Returns for periods of less than one year are not annualized. |
The accompanying notes are an integral part of these financial statements.
| | | | |
| 12 | | Wells Fargo Advantage 100% Treasury Money Market Fund | | Financial Highlights |
(For a share outstanding throughout each period)
| | | | | | | | | | | | |
| | | Six Months Ended July 31, 2012 (Unaudited) | | | Year Ended January 31, | |
Administrator Class | | | 2012 | | | 20111 | |
Net asset value, beginning of period | | | $1.00 | | | | $1.00 | | | | $1.00 | |
Net investment income | | | 0.00 | | | | 0.00 | 2 | | | 0.00 | 2 |
Net realized gains on investments | | | 0.00 | 2 | | | 0.00 | 2 | | | 0.00 | 2 |
| | | | | | | | | | | | |
Total from investment operations | | | 0.00 | 2 | | | 0.00 | 2 | | | 0.00 | 2 |
Distributions to shareholders from | | | | | | | | | | | | |
Net investment income | | | 0.00 | | | | (0.00 | )2 | | | (0.00 | )2 |
Net realized gains | | | 0.00 | | | | (0.00 | )2 | | | (0.00 | )2 |
| | | | | | | | | | | | |
Total distributions to shareholders | | | 0.00 | | | | (0.00 | )2 | | | (0.00 | )2 |
Net asset value, end of period | | | $1.00 | | | | $1.00 | | | | $1.00 | |
Total return3 | | | 0.00 | % | | | 0.02 | % | | | 0.01 | % |
Ratios to average net assets (annualized) | | | | | | | | | | | | |
Gross expenses | | | 0.52 | % | | | 0.51 | % | | | 0.52 | % |
Net expenses | | | 0.08 | % | | | 0.04 | % | | | 0.14 | % |
Net investment income | | | 0.00 | % | | | 0.01 | % | | | 0.01 | % |
Supplemental data | | | | | | | | | | | | |
Net assets, end of period (000’s omitted) | | | $1,620,669 | | | | $1,636,769 | | | | $662,873 | |
| 1. | For the period from June 30, 2010 (commencement of class operations) to January 31, 2011 |
| 2. | Amount is less than $0.005. |
| 3. | Returns for periods of less than one year are not annualized. |
The accompanying notes are an integral part of these financial statements.
| | | | | | |
| Financial Highlights | | Wells Fargo Advantage 100% Treasury Money Market Fund | | | 13 | |
(For a share outstanding throughout each period)
| | | | | | | | | | | | | | | | | | | | | | | | | | | | |
| | | Six Months Ended July 31, 2012 (Unaudited) | | | Year Ended January 31, | | | Year Ended February 28, | |
Service Class | | | 2012 | | | 20111 | | | 2010 | | | 2009 | | | 20082 | | | 2007 | |
Net asset value, beginning of period | | | $1.00 | | | | $1.00 | | | | $1.00 | | | | $1.00 | | | | $1.00 | | | | $1.00 | | | | $1.00 | |
Net investment income | | | 0.00 | | | | 0.00 | 3 | | | 0.00 | 3 | | | 0.00 | 3 | | | 0.01 | | | | 0.04 | | | | 0.04 | |
Net realized gains on investments | | | 0.00 | 3 | | | 0.00 | 3 | | | 0.00 | 3 | | | 0.00 | 3 | | | 0.00 | | | | 0.00 | | | | 0.00 | |
| | | | | | | | | | | | | | | | | | | | | | | | | | | | |
Total from investment operations | | | 0.00 | 3 | | | 0.00 | 3 | | | 0.00 | 3 | | | 0.00 | 3 | | | 0.01 | | | | 0.04 | | | | 0.04 | |
Distributions to shareholders from | | | | | | | | | | | | | | | | | | | | | | | | | | | | |
Net investment income | | | 0.00 | | | | (0.00 | )3 | | | (0.00 | )3 | | | (0.00 | )3 | | | (0.01 | ) | | | (0.04 | ) | | | (0.04 | ) |
Net realized gains | | | 0.00 | | | | (0.00 | )3 | | | (0.00 | )3 | | | (0.00 | )3 | | | (0.00 | )3 | | | 0.00 | | | | 0.00 | |
| | | | | | | | | | | | | | | | | | | | | | | | | | | | |
Total distributions to shareholders | | | 0.00 | | | | (0.00 | )3 | | | (0.00 | )3 | | | (0.00 | )3 | | | (0.01 | ) | | | (0.04 | ) | | | (0.04 | ) |
Net asset value, end of period | | | $1.00 | | | | $1.00 | | | | $1.00 | | | | $1.00 | | | | $1.00 | | | | $1.00 | | | | $1.00 | |
Total return4 | | | 0.00 | % | | | 0.02 | % | | | 0.01 | % | | | 0.03 | % | | | 0.86 | % | | | 3.97 | % | | | 4.44 | % |
Ratios to average net assets (annualized) | | | | | | | | | | | | | | | | | | | | | | | | | | | | |
Gross expenses | | | 0.69 | % | | | 0.68 | % | | | 0.70 | % | | | 0.73 | % | | | 0.73 | % | | | 0.73 | % | | | 0.74 | % |
Net expenses | | | 0.08 | % | | | 0.05 | % | | | 0.14 | % | | | 0.17 | % | | | 0.46 | % | | | 0.50 | % | | | 0.50 | % |
Net investment income | | | 0.00 | % | | | 0.01 | % | | | 0.01 | % | | | 0.01 | % | | | 0.74 | % | | | 3.85 | % | | | 4.36 | % |
Supplemental data | | | | | | | | | | | | | | | | | | | | | | | | | | | | |
Net assets, end of period (000’s omitted) | | | $7,059,177 | | | | $8,502,741 | | | | $8,435,170 | | | | $8,161,612 | | | | $7,641,351 | | | | $6,039,209 | | | | $4,049,964 | |
| 1. | For the eleven months ended January 31, 2011. The Fund changed its fiscal year end from February 28 to January 31, effective January 31, 2011. |
| 3. | Amount is less than $0.005. |
| 4. | Returns for periods of less than one year are not annualized. |
The accompanying notes are an integral part of these financial statements.
| | | | |
| 14 | | Wells Fargo Advantage 100% Treasury Money Market Fund | | Financial Highlights |
(For a share outstanding throughout each period)
| | | | | | | | | | | | |
| | | Six Months Ended July 31, 2012 (Unaudited) | | | Year Ended January 31, | |
Sweep Class | | | 2012 | | | 20111 | |
Net asset value, beginning of period | | | $1.00 | | | | $1.00 | | | | $1.00 | |
Net investment income | | | 0.00 | | | | 0.00 | 2 | | | 0.00 | 2 |
Net realized on investments | | | 0.00 | 2 | | | 0.00 | 2 | | | 0.00 | 2 |
| | | | | | | | | | | | |
Total from investment operations | | | 0.00 | 2 | | | 0.00 | 2 | | | 0.00 | 2 |
Distributions to shareholders from | | | | | | | | | | | | |
Net investment income | | | 0.00 | | | | (0.00 | )2 | | | (0.00 | )2 |
Net realized gains | | | 0.00 | | | | (0.00 | )2 | | | (0.00 | )2 |
| | | | | | | | | | | | |
Total distributions to shareholders | | | 0.00 | | | | (0.00 | )2 | | | (0.00 | )2 |
Net asset value, end of period | | | $1.00 | | | | $1.00 | | | | $1.00 | |
Total return3 | | | 0.00 | % | | | 0.02 | % | | | 0.01 | % |
Ratios to average net assets (annualized) | | | | | | | | | | | | |
Gross expenses | | | 1.14 | % | | | 1.14 | % | | | 1.14 | % |
Net expenses | | | 0.08 | % | | | 0.04 | % | | | 0.14 | % |
Net investment income | | | 0.00 | % | | | 0.01 | % | | | 0.01 | % |
Supplemental data | | | | | | | | | | | | |
Net assets, end of period (000’s omitted) | | | $428,588 | | | | $309,270 | | | | $112,648 | |
| 1. | For the period from June 30, 2010 (commencement of class operations) to January 31, 2011. |
| 2. | Amount is less than $0.005. |
| 3. | Returns for periods of less than one year are not annualized. |
The accompanying notes are an integral part of these financial statements.
| | | | | | |
| Notes to Financial Statements (Unaudited) | | Wells Fargo Advantage 100% Treasury Money Market Fund | | | 15 | |
1. ORGANIZATION
Wells Fargo Funds Trust (the “Trust”), a Delaware statutory trust organized on March 10, 1999, is an open-end management investment company registered under the Investment Company Act of 1940, as amended (the “1940 Act”). These financial statements report on Wells Fargo Advantage 100% Treasury Money Market Fund (the “Fund”) which is a diversified series of the Trust.
2. SIGNIFICANT ACCOUNTING POLICIES
The following significant accounting policies, which are consistently followed in the preparation of the financial statements of the Fund, are in conformity with U.S. generally accepted accounting principles which require management to make estimates and assumptions that affect the reported amounts of assets and liabilities, disclosure of contingent assets and liabilities at the date of the financial statements, and the reported amounts of revenues and expenses during the reporting period. Actual results could differ from those estimates.
Securities valuation
As permitted under Rule 2a-7 of the 1940 Act, portfolio securities are valued at amortized cost, which approximates fair value. The amortized cost method involves valuing a security at its cost, plus accretion of discount or minus amortization of premium over the period until maturity.
Investments which are not valued using the method discussed above are valued at their fair value, as determined by procedures established in good faith and approved by the Board of Trustees. The Board of Trustees has established a Valuation Committee comprised of the Trustees and has delegated to it the authority to take any actions regarding the valuation of portfolio securities that the Valuation Committee deems necessary to determining the fair value of portfolio securities, unless the responsibility has been delegated to the Management Valuation Team of Wells Fargo Funds Management, LLC (“Funds Management”). The Board of Trustees retains the authority to make or ratify any valuation decisions or approve any changes to the Valuation Procedures as it deems appropriate. On a quarterly basis, the Board of Trustees considers for ratification any valuation actions taken by the Valuation Committee or the Management Valuation Team.
Valuations of fair valued prices are compared to the next actual sales price when available, or other appropriate market information to assess the continued appropriateness of the fair valuation methodology used. The securities are fair valued on a day-to-day basis, taking into consideration changes to appropriate market information and any significant changes to the input factors considered in the valuation process until there is a readily available price provided on the exchange or by an independent pricing service. Valuations received from an independent pricing service or broker quotes are periodically validated by comparisons to most recent trades and valuations provided by other independent pricing services in addition to the review of prices by the adviser and/or sub-adviser. Unobservable inputs used in determining fair valuations are identified based on the type of security, taking into consideration factors utilized by market participants in valuing the investment, knowledge about the issuer and the current market environment.
Security transactions and income recognition
Securities transactions are recorded on a trade date basis. Realized gains or losses are reported on the basis of identified cost of securities delivered.
Interest income is accrued daily and bond discounts are accreted and premiums are amortized daily based on the effective interest method. To the extent debt obligations are placed on non-accrual status, any related interest income may be reduced by writing off interest receivables when the collection of all or a portion of interest has become doubtful based on consistently applied procedures. If the issuer subsequently resumes interest payments or when the collectability of interest is reasonably assured, the debt obligation is removed from non-accrual status.
Distributions to shareholders
Distributions to shareholders from net investment income are accrued daily and paid monthly. Distributions from net realized gains, if any, are recorded on the ex-dividend date. Such distributions are determined in conformity with income tax regulations, which may differ from generally accepted accounting principles.
| | | | |
| 16 | | Wells Fargo Advantage 100% Treasury Money Market Fund | | Notes to Financial Statements (Unaudited) |
Federal and other taxes
The Fund intends to continue to qualify as a regulated investment company by distributing substantially all of its investment company taxable income and any net realized capital gains (after reduction for capital loss carryforwards) sufficient to relieve it from all, or substantially all, federal income taxes. Accordingly, no provision for federal income taxes was required.
The Fund’s income and federal excise tax returns and all financial records supporting those returns for the prior three fiscal years are subject to examination by the federal and Delaware revenue authorities. Management has analyzed the Fund’s tax positions taken on federal, state, and foreign tax returns for all open tax years and does not believe that there are any uncertain tax positions that require recognition of a tax liability.
As of January 31, 2012, the Fund had $469 of current year deferred post-October capital losses, which would be treated as realized for tax purposes on the first day of the succeeding year.
Class allocations
The separate classes of shares offered by the Fund differ principally in distribution, shareholder servicing and administration fees. Shareholders of each class bear certain expenses that pertain to that particular class. All shareholders bear the common expenses of the Fund, earn income from the portfolio, and are allocated any unrealized gains and losses pro rata based on the average daily net assets of each class, without distinction between share classes. Dividends are determined separately for each class based on income and expenses allocable to each class. Realized gains and losses are allocated to each class pro rata based upon the net assets of each class on the date realized. Differences in per share dividend rates generally result from the relative weightings of pro rata income and realized gain allocations and from differences in separate class expenses, including distribution, shareholder servicing and administration fees.
3. FAIR VALUATION MEASUREMENTS
Fair value measurements of investments are determined within a framework that has established a fair value hierarchy based upon the various data inputs utilized in determining the value of the Fund’s investments. The three-level hierarchy gives the highest priority to unadjusted quoted prices in active markets for identical assets or liabilities (Level 1) and the lowest priority to significant unobservable inputs (Level 3). The Fund’s investments are classified within the fair value hierarchy based on the lowest level of input that is significant to the fair value measurement. The inputs are summarized into three broad levels as follows:
| n | | Level 1 – quoted prices in active markets for identical securities |
| n | | Level 2 – other significant observable inputs (including quoted prices for similar securities, interest rates, prepayment speeds, credit risk, etc.) |
| n | | Level 3 – significant unobservable inputs (including the Fund’s own assumptions in determining the fair value of investments) |
The inputs or methodologies used for valuing securities are not necessarily an indication of the risk associated with investing in those securities.
At July 31, 2012, all of the Fund’s investments in securities carried at fair value were designated as Level 2 since the primary inputs include credit quality of the issuer and short-term interest rates which are observable.
Further details on the major security types can be found in the Portfolio of Investments.
Transfers in and transfers out are recognized at the end of the reporting period. For the six months ended July 31, 2012, the Fund did not have any transfers into/out of Level 1 and Level 2.
4. TRANSACTIONS WITH AFFILIATES AND OTHER EXPENSES
Advisory fee
The Trust has entered into an advisory contract with Funds Management, an indirect wholly owned subsidiary of Wells Fargo & Company (“Wells Fargo”). The adviser is responsible for implementing investment policies and guidelines and for supervising the sub-adviser, who is responsible for day-to-day portfolio management of the Fund.
| | | | | | |
| Notes to Financial Statements (Unaudited) | | Wells Fargo Advantage 100% Treasury Money Market Fund | | | 17 | |
Pursuant to the contract, Funds Management is entitled to receive an annual advisory fee starting at 0.30% and declining to 0.20% as the average daily net assets of the Fund increase. For the six months ended July 31, 2012, the advisory fee was equivalent to an annual rate of 0.27% of the Fund’s average daily net assets.
Funds Management has retained the services of a sub-adviser to provide daily portfolio management to the Fund. The fee for sub-advisory services is borne by Funds Management. Wells Capital Management Incorporated, an affiliate of Funds Management, is the sub-adviser to the Fund and is entitled to receive a fee from Funds Management at an annual rate starting at 0.05% and declining to 0.01% as the average daily net assets of the Fund increase.
Administration and transfer agent fees
The Trust has entered into an administration agreement with Funds Management. Under this agreement, for providing administrative services, which includes paying fees and expenses for services provided by the transfer agent, sub-transfer agents, omnibus account servicers and record-keepers, Funds Management is entitled to receive from the Fund an annual fund level administration fee starting at 0.05% and declining to 0.03% as the average daily net assets of the Fund increase and a class level administration fee which is calculated based on the average daily net assets of each class as follows:
| | | | |
| | | Class Level Administration Fee | |
Class A, Sweep Class | | | 0.22 | % |
Administrator Class | | | 0.10 | |
Service Class | | | 0.12 | |
Funds Management has contractually waived and/or reimbursed advisory and administration fees to the extent necessary to maintain certain net operating expense ratios for the Fund. Waiver of fees and/or reimbursement of expenses by Funds Management were made first from fund level expenses on a proportionate basis and then from class specific expenses. Funds Management has committed through July 11, 2013 to waive fees and/or reimburse expenses to the extent necessary to cap the Fund’s expenses at 0.65% for Class A, 0.30% for Administrator Class, 0.50% for Service Class and 1.00% for Sweep Class.
Distribution fees
The Trust has adopted a Distribution Plan for Sweep Class shares of the Fund pursuant to Rule 12b-1 under the 1940 Act. Distribution fees are charged to Sweep Class shares and paid to Wells Fargo Funds Distributor, LLC, the principal underwriter, at an annual rate of 0.35% of its average daily net assets.
Shareholder servicing fees
The Trust has entered into contracts with one or more shareholder servicing agents, whereby Class A, Service Class and Sweep Class of the Fund is charged a fee at an annual rate of 0.25% of the respective average daily net assets of each class. Administrator Class is charged a fee at an annual rate of 0.10% of its average daily net assets.
A portion of these total shareholder servicing fees were paid to affiliates of Wells Fargo.
5. INDEMNIFICATION
Under the Trust’s organizational documents, the officers and directors are indemnified against certain liabilities that may arise out of performance of their duties to the Trust. Additionally, in the normal course of business, the Trust may enter into contracts with service providers that contain a variety of indemnification clauses. The Trust’s maximum exposure under these arrangements is dependent on future claims that may be made against the Fund and, therefore, cannot be estimated.
6. NEW ACCOUNTING PRONOUNCEMENT
In December 2011, the Financial Accounting Standards Board (“FASB”) issued Accounting Standard Update (“ASU”) No. 2011-11, Disclosures about Offsetting Assets and Liabilities. ASU 2011-11, which amends FASB ASC Topic 210, Balance Sheet, creates new disclosure requirements which require entities to disclose both gross and net information for derivatives and other financial instruments that are either offset in the Statement of Assets and Liabilities or subject to an enforceable master netting arrangement or similar agreement. The disclosure requirements are effective for interim and annual reporting periods beginning on or after January 1, 2013. Management is currently assessing the potential impact, in addition to expanded financial statement disclosure, that may result from adopting this ASU.
| | | | |
| 18 | | Wells Fargo Advantage 100% Treasury Money Market Fund | | Other Information (Unaudited) |
PROXY VOTING INFORMATION
A description of the policies and procedures that the Fund uses to determine how to vote proxies relating to portfolio securities is available without charge, upon request, by calling 1-800-222-8222, visiting our Web site at wellsfargoadvantagefunds.com, or visiting the SEC Web site at sec.gov. Information regarding how the Fund voted proxies relating to portfolio securities during the most recent 12-month period ended June 30 is available without charge on the Fund’s Web site at wellsfargoadvantagefunds.com or by visiting the SEC Web site at sec.gov.
PORTFOLIO HOLDINGS INFORMATION
The complete portfolio holdings for each Fund are publicly available on the Funds’ Web site (wellsfargoadvantagefunds.com) on a monthly, seven-day delayed basis. The Fund files its complete schedule of portfolio holdings with the SEC for the first and third quarters of each fiscal year on Form N-Q, which is available without charge by visiting the SEC Web site at sec.gov. In addition, each Fund’s Form N-Q may be reviewed and copied at the SEC’s Public Reference Room in Washington, DC, and at regional offices in New York City, at 233 Broadway, and in Chicago, at 175 West Jackson Boulevard, Suite 900. Information about the Public Reference Room may be obtained by calling 1-800-SEC-0330.
| | | | | | |
| Other Information (Unaudited) | | Wells Fargo Advantage 100% Treasury Money Market Fund | | | 19 | |
BOARD OF TRUSTEES AND OFFICERS
Each of the Trustees and Officers listed in the table below acts in identical capacities for the Wells Fargo Advantage family of funds, which consists of 138 funds comprising the Wells Fargo Funds Trust, Wells Fargo Variable Trust, Wells Fargo Master Trust and four closed-end funds (collectively the “Fund Complex”). This table should be read in conjunction with the Prospectus and the Statement of Additional Information1. All of the Trustees are also Members of the Audit and Governance Committees of each Trust in the Fund Complex. The mailing address of each Trustee and Officer is 525 Market Street, 12th Floor, San Francisco, CA 94105. Each Trustee and Officer serves an indefinite term, however, each Trustee serves such term until reaching the mandatory retirement age established by the Trustees.
Independent Trustees
| | | | | | |
Name and Year of Birth | | Position Held and Length of Service* | | Principal Occupations During Past Five Years | | Other Directorships During
Past Five Years |
Peter G. Gordon
(Born 1942) | | Trustee, since 1998, Chairman, since 2005 | | Co-Founder, Retired Chairman, President and CEO of Crystal Geyser Water Company. Trustee Emeritus, Colby College | | Asset Allocation Trust |
Isaiah Harris, Jr.
(Born 1952) | | Trustee, since 2009 | | Retired. Prior thereto, President and CEO of BellSouth Advertising and Publishing Corp. from 2005 to 2007, President and CEO of BellSouth Enterprises from 2004 to 2005 and President of BellSouth Consumer Services from 2000 to 2003. Emeritus member of the Iowa State University Foundation Board of Governors. Emeritus Member of the Advisory Board of Iowa State University School of Business. Mr. Harris is a certified public accountant. | | CIGNA Corporation; Deluxe Corporation; Asset Allocation Trust |
Judith M. Johnson
(Born 1949) | | Trustee, since 2008 Audit Committee Chairman, since 2008 | | Retired. Prior thereto, Chief Executive Officer and Chief Investment Officer of Minneapolis Employees Retirement Fund from 1996 to 2008. Ms. Johnson is an attorney, certified public accountant and a certified managerial accountant. | | Asset Allocation Trust |
Leroy Keith, Jr.
(Born 1939) | | Trustee, since 2010 | | Chairman, Bloc Global Services (development and construction). Trustee of the Evergreen Funds from 1983 to 2010. Former Managing Director, Almanac Capital Management (commodities firm), former Partner, Stonington Partners, Inc. (private equity fund), former Director, Obagi Medical Products Co. and former Director, Lincoln Educational Services. | | Trustee, Virtus Fund Complex (consisting of 40 portfolios as of 12/31/11); Asset Allocation Trust |
David F. Larcker
(Born 1950) | | Trustee, since 2009 | | James Irvin Miller Professor of Accounting at the Graduate School of Business, Stanford University, Director of Corporate Governance Research Program and Senior Faculty of The Rock Center for Corporate Governance since 2006. From 2005 to 2008, Professor of Accounting at the Graduate School of Business, Stanford University. Prior thereto, Ernst & Young Professor of Accounting at The Wharton School, University of Pennsylvania from 1985 to 2005. | | Asset Allocation Trust |
Olivia S. Mitchell
(Born 1953) | | Trustee, since 2006 | | International Foundation of Employee Benefit Plans Professor, Wharton School of the University of Pennsylvania since 1993. Director of Wharton’s Pension Research Council and Boettner Center on Pensions & Retirement Research, and Research Associate at the National Bureau of Economic Research. Previously, Cornell University Professor from 1978 to 1993. | | Asset Allocation Trust |
Timothy J. Penny
(Born 1951) | | Trustee, since 1996 | | President and CEO of Southern Minnesota Initiative Foundation, a non-profit organization, since 2007 and Senior Fellow at the Humphrey Institute Policy Forum at the University of Minnesota since 1995. Member of the Board of Trustees of NorthStar Education Finance, Inc., a non-profit organization, since 2007. | | Asset Allocation Trust |
| | | | |
| 20 | | Wells Fargo Advantage 100% Treasury Money Market Fund | | Other Information (Unaudited) |
| | | | | | |
Name and Year of Birth | | Position Held and Length of Service* | | Principal Occupations During Past Five Years | | Other Directorships During
Past Five Years |
Michael S. Scofield
(Born 1943) | | Trustee, since 2010 | | Served on the Investment Company Institute’s Board of Governors and Executive Committee from 2008-2011 as well the Governing Council of the Independent Directors Council from 2006-2011 and the Independent Directors Council Executive Committee from 2008-2011. Chairman of the IDC from 2008-2010. Institutional Investor (Fund Directions) Trustee of Year in 2007. Trustee of the Evergreen Funds (and its predecessors) from 1984 to 2010. Chairman of the Evergreen Funds from 2000-2010. Former Trustee of the Mentor Funds. Retired Attorney, Law Offices of Michael S. Scofield and former Director and Chairman, Branded Media Corporation (multi-media branding company). | | Asset Allocation Trust |
Donald C. Willeke
(Born 1940) | | Trustee, since 1996 | | Principal of the law firm of Willeke & Daniels. General Counsel of the Minneapolis Employees Retirement Fund from 1984 until its consolidation into the Minnesota Public Employees Retirement Association on June 30, 2010. Director and Vice Chair of The Free Trust (non-profit corporation). Director of the American Chestnut Foundation (non-profit corporation). | | Asset Allocation Trust |
| * | Length of service dates reflect the Trustee’s commencement of service with the Trust’s predecessor entities, where applicable. |
Officers
| | | | | | |
Name and Year of Birth | | Position Held and
Length of Service | | Principal Occupations During Past Five Years | | |
Karla M. Rabusch
(Born 1959) | | President, since 2003 | | Executive Vice President of Wells Fargo Bank, N.A. and President of Wells Fargo Funds Management, LLC since 2003. Senior Vice President and Chief Administrative Officer of Wells Fargo Funds Management, LLC from 2001 to 2003. | | |
C. David Messman
(Born 1960) | | Secretary, since 2000; Chief Legal Officer,
since 2003 | | Senior Vice President and Secretary of Wells Fargo Funds Management, LLC since 2001. Vice President and Managing Senior Counsel of Wells Fargo Bank, N.A. since 1996. | | |
Nancy Wiser (Born 1967) | | Treasurer, since 2012 | | Executive Vice President of Wells Fargo Funds Management, LLC since 2011. Chief Operating Officer and Chief Compliance Officer at LightBox Capital Management LLC, from 2008 to 2011. Owned and operated a consulting business providing services to various hedge funds including acting as Chief Operating Officer and Chief Compliance Officer for a hedge fund from 2007 to 2008. Chief Operating Officer and Chief Compliance Officer of GMN Capital LLC from 2006 to 2007. | | |
David Berardi
(Born 1975) | | Assistant Treasurer,
since 2009 | | Vice President of Wells Fargo Funds Management, LLC since 2009. Vice President of Evergreen Investment Management Company, LLC from 2008 to 2010. Assistant Vice President of Evergreen Investment Services, Inc. from 2004 to 2008. Manager of Fund Reporting and Control for Evergreen Investment Management Company, LLC from 2004 to 2010. | | |
Jeremy DePalma
(Born 1974) | | Assistant Treasurer,
since 2009 | | Senior Vice President of Wells Fargo Funds Management, LLC since 2009. Senior Vice President of Evergreen Investment Management Company, LLC from 2008 to 2010. Vice President, Evergreen Investment Services, Inc. from 2004 to 2007. Head of the Fund Reporting and Control Team within Fund Administration from 2005 to 2010. | | |
Debra Ann Early
(Born 1964) | | Chief Compliance Officer, since 2007 | | Chief Compliance Officer of Wells Fargo Funds Management, LLC since 2007. Chief Compliance Officer of Parnassus Investments from 2005 to 2007. Chief Financial Officer of Parnassus Investments from 2004 to 2007 and Senior Audit Manager of PricewaterhouseCoopers LLP from 1998 to 2004. | | |
| 1. | The Statement of Additional Information includes additional information about the Trustees and is available, without charge, upon request, by calling 1-800-222-8222 or by visiting the Web site at wellsfargoadvantagefunds.com. |
| | | | | | |
| Other Information (Unaudited) | | Wells Fargo Advantage 100% Treasury Money Market Fund | | | 21 | |
BOARD CONSIDERATION OF INVESTMENT ADVISORY AND SUB-ADVISORY AGREEMENTS:
Under Section 15 of the Investment Company Act of 1940 (the “1940 Act”), the Board of Trustees (the “Board”) of Wells Fargo Funds Trust (the “Trust”), all the members of which have no direct or indirect interest in the investment advisory and sub-advisory agreements and are not “interested persons” of the Trust, as defined in the 1940 Act (the “Independent Trustees”), must determine whether to approve the continuation of the Trust’s investment advisory and sub-advisory agreements. In this regard, at an in person meeting held on March 29-30, 2012 (the “Meeting”), the Board reviewed and re-approved: (i) an investment advisory agreement with Wells Fargo Funds Management, LLC (“Funds Management”) for Wells Fargo Advantage 100% Treasury Money Market Fund (the “Fund”) and (ii) an investment sub-advisory agreement with Wells Capital Management Incorporated (“Wells Capital Management”) for the Fund. The investment advisory agreement with Funds Management and the investment sub-advisory agreement with Wells Capital Management are collectively referred to as the “Advisory Agreements.”
At the Meeting, the Board considered the factors and reached the conclusions described below relating to the selection of Funds Management and Wells Capital Management and the continuation of the Advisory Agreements. Prior to the Meeting, the Trustees conferred extensively among themselves and with representatives of Funds Management about these matters. The Board also met throughout the year and received information that was useful to them in considering the continuation of the Advisory Agreements. The Independent Trustees were assisted in their evaluation of the Advisory Agreements by independent legal counsel, from whom they received separate legal advice and with whom they met separately from Funds Management.
In providing information to the Board, Funds Management and Wells Capital Management were guided by a detailed set of requests submitted by the Independent Trustees’ independent legal counsel on their behalf at the start of the Board’s annual contract renewal process earlier in 2012. In approving the Advisory Agreements, the Board did not identify any particular information or consideration that was all-important or controlling, and each Trustee likely attributed different weights to various factors.
Nature, extent and quality of services
The Board received and considered various information regarding the nature, extent and quality of services provided to the Fund by Funds Management and Wells Capital Management under the Advisory Agreements. The Board also received and considered, among other things, information about the background and experience of senior management of Funds Management, and the qualifications, backgrounds, tenures and responsibilities of the portfolio managers primarily responsible for the day-to-day portfolio management of the Fund.
The Board evaluated the ability of Funds Management and Wells Capital Management, based on their respective financial condition, resources, reputation and other attributes, to attract and retain qualified investment professionals, including research, advisory, and supervisory personnel. The Board further considered the compliance programs and compliance records of Funds Management and Wells Capital Management. In addition, the Board took into account the administrative services provided to the Fund by Funds Management and its affiliates.
The Board’s decision to approve the continuation of the Advisory Agreements was based on a comprehensive evaluation of information provided to it. In considering these matters, the Board considered not only the specific information presented in connection with the Meeting, but also the knowledge gained over time through interaction with Funds Management and Wells Capital Management about various topics, including Funds Management’s oversight of service providers. The above factors, together with those referenced below, are some of the most important, but not necessarily all, factors considered by the Board in concluding that the nature, extent and quality of the investment advisory services provided to the Fund by Funds Management and Wells Capital Management supported the re-approval of the Advisory Agreements. Although the Board considered the continuation of the Advisory Agreements for the Fund as part of the larger process of considering the continuation of the advisory agreements for all of the funds in the complex, its decision to continue the Advisory Agreements for the Fund was ultimately made on a fund-by-fund basis.
Fund performance and expenses
The Board considered the performance results for the Fund over various time periods ended December 31, 2011. The Board also considered these results in comparison to the median performance of a universe of relevant funds (the
| | | | |
| 22 | | Wells Fargo Advantage 100% Treasury Money Market Fund | | Other Information (Unaudited) |
“Universe”) that was determined by Lipper Inc. (“Lipper”) to be similar to the Fund, and in comparison to the Fund’s benchmark index and to other comparative data. Lipper is an independent provider of investment company data. The Board received a description of the methodology used by Lipper to select the mutual funds in the Universe. The Board noted that the performance of the Fund was equal to or in range of the median performance of the Universe for all periods under review. The Board also noted that the performance of the Fund was equal to or in range of its benchmark, the Lipper U.S. Treasury Money Market Funds Index, for the periods under review.
The Board received and considered information regarding the Fund’s contractual advisory fee and net operating expense ratios and their various components, including actual management fees (which reflect fee waivers, if any), transfer agent, custodian and other non-management fees, Rule 12b-1 and non-Rule 12b-1 fees, service fees and fee waiver and expense reimbursement arrangements. The Board also considered these ratios in comparison to the median ratios of an expense Universe and a narrower expense group of mutual funds (each, an “Expense Group”) that was determined by Lipper to be similar to the Fund. The Board received a description of the methodology used by Lipper to select the mutual funds in the Fund’s Expense Group. The Board noted that the net operating expense ratios of the Fund were higher than the Fund’s Expense Group’s median net operating expense ratios.
Funds Management advised the Board that the Expense Group medians reflected voluntary waivers, whereas the Fund’s expense ratios did not reflect voluntary waivers. The Board noted that when the Fund’s expense ratios were adjusted to reflect voluntary waivers, the Fund’s net operating expense ratios were lower than the median net operating expense ratios of the Expense Group. The Board viewed favorably Funds Management’s proposal to lower the net operating expense cap of the Fund’s Sweep Class by five basis points.
Based on the above-referenced considerations and other factors, the Board concluded that the overall performance and expense structure of the Fund supported the re-approval of the Advisory Agreements for the Fund.
Investment advisory and sub-advisory fee rates
The Board reviewed and considered the contractual investment advisory fee rate that is payable by the Fund to Funds Management for investment advisory services (the “Advisory Agreement Rate”), both on a stand-alone basis and on a combined basis with the Fund’s administration fee rate. The Board took into account the separate administrative and other services covered by the administration fee rate. The Board also reviewed and considered the contractual investment sub-advisory fee rate that is payable by Funds Management to Wells Capital Management for investment sub-advisory services (the “Sub-Advisory Agreement Rate”). In addition, the Board reviewed and considered the existing fee waiver/cap arrangements applicable to the Advisory Agreement Rate and considered the Advisory Agreement Rate after taking the waivers/caps into account (the “Net Advisory Rate”).
The Board received and considered information comparing the Advisory Agreement Rate and Net Advisory Rate, combined with the administration fee rates, with those of other funds in the Fund’s Expense Group median. The Board noted that the Advisory Agreement Rate for the Fund was higher than the median rates for the Fund’s Expense Group, except for the Service Class. The Board also noted that the Net Advisory Rate for the Fund was higher than the median rates for the Fund’s Expense Group, except for the Administrator Class. The Board viewed favorably Funds Management’s willingness to voluntarily waive certain fees and its proposal to lower the net operating expense cap for the Sweep Class.
The Board also received and considered information about the nature and extent of services offered and fee rates charged by Funds Management and Wells Capital Management to other types of clients. In this regard, the Board received information about differences between the services, and the compliance, reporting, and other legal burdens and risks of providing investment advice to mutual funds and those associated with providing advice to non-mutual fund clients such as collective funds or institutional separate accounts.
The Board determined that the Advisory Agreement Rate for the Fund, both with and without the administration fee rate and before and after waivers, was reasonable in light of the Fund’s Expense Group information, the net expense ratio commitments, the services covered by the Advisory Agreements and other information provided. The Board also reviewed and considered the Sub-Advisory Agreement Rate and concluded that the Sub-Advisory Agreement Rate was reasonable in light of the services covered by the sub-advisory agreement and other information provided.
| | | | | | |
| Other Information (Unaudited) | | Wells Fargo Advantage 100% Treasury Money Market Fund | | | 23 | |
Profitability
The Board received and considered a profitability analysis of Funds Management, as well as an analysis of the profitability to the collective Wells Fargo businesses that provide services to the Fund. It considered that the information provided to it was necessarily estimated, and that the profitability information provided to it, especially on a fund-by-fund basis, did not necessarily provide a precise tool for evaluating the appropriateness of the Fund’s Advisory Agreement Rate in isolation. It noted that the levels of profitability reported on a fund-by-fund basis varied widely, depending on, among other things, the size and type of fund. The Board noted the impact of voluntary fee waivers on Funds Management’s profitability. The Board concluded that the profitability reported by Funds Management was not unreasonable.
The Board did not consider separate profitability information with respect to Wells Capital Management, because, as an affiliate of Funds Management, its profitability information was subsumed in the collective Wells Fargo profitability analysis provided by Funds Management.
Economies of scale
With respect to possible economies of scale, the Board reviewed the breakpoints in the Fund’s advisory fee and/or administration fee structure, which operate generally to reduce the expenses of the Fund (as a percentage of Fund assets) as the Fund grows in size. It considered that, as a fund shrinks in size, breakpoints conversely result in increasing fee levels. The Board noted that it would have on-going opportunities to review the appropriate levels of breakpoints in the future, and concluded that the breakpoints as implemented appeared to be a reasonable step toward sharing economies of scale, if any, with the Fund. However, the Board acknowledged the inherent limitations of any analysis of economies of scale and of any attempt to correlate breakpoints with such economies, stemming largely from the Board’s understanding that economies of scale are realized, if at all, across a variety of products and services, not just with respect to a single fund.
Other benefits to Funds Management and Wells Capital Management
The Board received and considered information regarding potential “fall-out” or ancillary benefits received by Funds Management and its affiliates, including Wells Capital Management, as a result of their relationship with the Fund. Ancillary benefits could include, among others, benefits directly attributable to the relationship of Funds Management and Wells Capital Management with the Fund and benefits potentially derived from an increase in Funds Management’s and Wells Capital Management’s business as a result of their relationship with the Fund (such as the ability to market to shareholders other financial products offered by Funds Management and its affiliates, including Wells Capital Management).
The Board considered that Wells Fargo Funds Distributor, LLC, an affiliate of Funds Management, serves as distributor to the Fund and receives certain compensation for those services. The Board noted that various financial institutions, including affiliates of Funds Management, may receive distribution-related fees, shareholder servicing payments (including amounts derived from payments under Rule 12b-1 plans) and sub-transfer agency fees in respect of shares sold or held through them and services provided.
The Board also reviewed information about whether and to what extent soft dollar credits are sought and how any such credits are utilized and any benefits that may be realized by using an affiliated broker.
Other factors and broader review
The Board also considered the markets for distribution of the Fund’s shares, including the channels through which the Fund’s shares are offered and sold. The Board noted that the Fund is part of one of the few fund families that have both direct-to-fund and intermediary distribution channels. As discussed above, the Board reviews detailed materials received from Funds Management and Wells Capital Management annually as part of the re-approval process under Section 15 of the 1940 Act and also reviews and assesses information about the quality of the services that the Fund receives throughout the year. In this regard, the Board has reviewed reports of Funds Management at each of its quarterly meetings, which include, among other things, portfolio reviews and performance reports. In addition, the Board confers with portfolio managers at various times throughout the year.
Conclusion
After considering the above-described factors and based on its deliberations and its evaluation of the information described above, the Board unanimously approved the continuation of the Advisory Agreements for an additional one-year period.
| | | | |
| 24 | | Wells Fargo Advantage 100% Treasury Money Market Fund | | List of Abbreviations |
The following is a list of common abbreviations for terms and entities which may have appeared in this report.
| ACB | — Agricultural Credit Bank |
| ADR | — American Depository Receipt |
| ADS | — American Depository Shares |
| AGC-ICC | — Assured Guaranty Corporation - Insured Custody Certificates |
| AGM | — Assured Guaranty Municipal |
| AMBAC | — American Municipal Bond Assurance Corporation |
| AMT | — Alternative Minimum Tax |
| BAN | — Bond Anticipation Notes |
| BHAC | — Berkshire Hathaway Assurance Corporation |
| CAB | — Capital Appreciation Bond |
| CCAB | — Convertible Capital Appreciation Bond |
| CDA | — Community Development Authority |
| CDO | — Collateralized Debt Obligation |
| COP | — Certificate of Participation |
| DRIVER | — Derivative Inverse Tax-Exempt Receipts |
| DW&P | — Department of Water & Power |
| DWR | — Department of Water Resources |
| ECFA | — Educational & Cultural Facilities Authority |
| EDA | — Economic Development Authority |
| EDFA | — Economic Development Finance Authority |
| ETF | — Exchange-Traded Fund |
| FFCB | — Federal Farm Credit Bank |
| FGIC | — Financial Guaranty Insurance Corporation |
| FGLMC | — Federal Government Loan Mortgage Company |
| FHA | — Federal Housing Authority |
| FHLB | — Federal Home Loan Bank |
| FHLMC | — Federal Home Loan Mortgage Corporation |
| FICO | — The Financing Corporation |
| FNMA | — Federal National Mortgage Association |
| GDR | — Global Depository Receipt |
| GNMA | — Government National Mortgage Association |
| HCFR | — Healthcare Facilities Revenue |
| HEFA | — Health & Educational Facilities Authority |
| HEFAR | — Higher Education Facilities Authority Revenue |
| HFA | — Housing Finance Authority |
| HFFA | — Health Facilities Financing Authority |
| IBC | — Insured Bond Certificate |
| IDA | — Industrial Development Authority |
| IDAG | — Industrial Development Agency |
| IDR | — Industrial Development Revenue |
| KRW | — Republic of Korea Won |
| LIBOR | — London Interbank Offered Rate |
| LLC | — Limited Liability Company |
| LLP | — Limited Liability Partnership |
| MBIA | — Municipal Bond Insurance Association |
| MFHR | — Multi-Family Housing Revenue |
| MSTR | — Municipal Securities Trust Receipts |
| MUD | — Municipal Utility District |
| NATL-RE | — National Public Finance Guarantee Corporation |
| PCFA | — Pollution Control Finance Authority |
| PCR | — Pollution Control Revenue |
| PFA | — Public Finance Authority |
| PFFA | — Public Facilities Financing Authority |
| PFOTER | — Puttable Floating Option Tax-Exempt Receipts |
| plc | — Public Limited Company |
| PUTTER | — Puttable Tax-Exempt Receipts |
| R&D | — Research & Development |
| RDA | — Redevelopment Authority |
| RDFA | — Redevelopment Finance Authority |
| REIT | — Real Estate Investment Trust |
| ROC | — Reset Option Certificates |
| SAVRS | — Select Auction Variable Rate Securities |
| SBA | — Small Business Authority |
| SFHR | — Single Family Housing Revenue |
| SFMR | — Single Family Mortgage Revenue |
| SPA | — Standby Purchase Agreement |
| SPDR | — Standard & Poor’s Depositary Receipts |
| STRIPS | — Separate Trading of Registered Interest and Principal Securities |
| TAN | — Tax Anticipation Notes |
| TIPS | — Treasury Inflation-Protected Securities |
| TRAN | — Tax Revenue Anticipation Notes |
| TCR | — Transferable Custody Receipts |
| TTFA | — Transportation Trust Fund Authority |
| TVA | — Tennessee Valley Authority |
| XLCA | — XL Capital Assurance |
This page is intentionally left blank.
This page is intentionally left blank.


FOR MORE INFORMATION
More information about Wells Fargo Advantage Funds is available free upon request. To obtain literature, please write, e-mail, visit the Fund’s Web site, or call:
Wells Fargo Advantage Funds
P.O. Box 8266
Boston, MA 02266-8266
E-mail: wfaf@wellsfargo.com
Web site: wellsfargoadvantagefunds.com
Individual investors: 1-800-222-8222
Retail investment professionals: 1-888-877-9275
Institutional investment professionals: 1-866-765-0778
This report and the financial statements contained herein are submitted for the general information of the shareholders of Wells Fargo Advantage Funds. If this report is used for promotional purposes, distribution of the report must be accompanied or preceded by a current prospectus. For a current prospectus and, if available, a summary prospectus containing more complete information, including charges and expenses, call 1-800-222-8222 or visit the Fund’s Web site at wellsfargoadvantagefunds.com. Please consider the investment objectives, risks, charges, and expenses of the investment carefully before investing. This and other information about Wells Fargo Advantage Funds can be found in the current prospectus. Read the prospectus carefully before you invest or send money.
Wells Fargo Funds Management, LLC, a wholly owned subsidiary of Wells Fargo & Company, provides investment advisory and administrative services for Wells Fargo Advantage Funds. Other affiliates of Wells Fargo & Company provide subadvisory and other services for the Funds. The Funds are distributed by Wells Fargo Funds Distributor, LLC, Member FINRA/SIPC, an affiliate of Wells Fargo & Company.
NOT FDIC INSURED ¡ NO BANK GUARANTEE ¡ MAY LOSE VALUE
© 2012 Wells Fargo Funds Management, LLC. All rights reserved.
| | |
 | | 211385 09-12 SA300/SAR300 07-12 |

Wells Fargo Advantage
California Municipal Money Market Fund

Semi-Annual Report
July 31, 2012

Reduce clutter. Save trees.
Sign up for electronic delivery of prospectuses and shareholder reports at wellsfargo.com/advantagedelivery
Contents
The views expressed and any forward-looking statements are as of July 31, 2012, unless otherwise noted, and are those of the Fund managers and/or Wells Fargo Funds Management, LLC. Discussions of individual securities, or the markets generally, or any Wells Fargo Advantage Fund are not intended as individual recommendations. Future events or results may vary significantly from those expressed in any forward-looking statements; the views expressed are subject to change at any time in response to changing circumstances in the market. Wells Fargo Funds Management, LLC, disclaims any obligation to publicly update or revise any views expressed or forward-looking statements.
NOT FDIC INSURED ¡ NO BANK GUARANTEE ¡ MAY LOSE VALUE

WELLS FARGO INVESTMENT HISTORY
| | |
| |
| 1932 | | Keystone creates one of the first mutual fund families. |
| |
| 1971 | | Wells Fargo & Company introduces one of the first institutional index funds. |
| |
| 1978 | | Wells Fargo applies Markowitz and Sharpe’s research on Modern Portfolio Theory to introduce one of the industry’s first Tactical Asset Allocation (TAA) models in institutional separately managed accounts. |
| |
| 1984 | | Wells Fargo Stagecoach Funds launches its first asset allocation fund. |
| |
| 1989 | | The Tactical Asset Allocation (TAA) Model is first applied to Wells Fargo’s asset allocation mutual funds. |
| |
| 1994 | | Wells Fargo introduces the LifePath Funds, one of the first suites of target date funds (now the Wells Fargo Advantage Dow Jones Target Date FundsSM). |
| |
| 1996 | | Evergreen Investments and Keystone Funds merge. |
| |
| 1997 | | Wells Fargo launches Wells Fargo Advantage WealthBuilder PortfoliosSM, a fund-of-funds suite of products that includes the use of quantitative models to shift assets among investment styles. |
| |
| 1999 | | Norwest Advantage Funds and Stagecoach Funds are reorganized into Wells Fargo Funds after the merger of Norwest and Wells Fargo. |
| |
| 2002 | | Evergreen Retail and Evergreen Institutional companies form the umbrella asset management company, Evergreen Investments. |
| |
| 2005 | | The integration of Strong Funds with Wells Fargo Funds creates Wells Fargo Advantage Funds, resulting in one of the top 20 mutual fund companies in the United States. |
| |
| 2006 | | Wells Fargo Advantage Funds relaunches the target date product line as Wells Fargo Advantage Dow Jones Target Date Funds. |
| |
| 2010 | | The mergers and reorganizations of Evergreen and Wells Fargo Advantage mutual funds are completed, unifying the families under the brand of Wells Fargo Advantage Funds. |
Wells Fargo Advantage Funds®
Wells Fargo Advantage Funds skillfully guides institutions, financial advisors, and individuals through the investment terrain to help them reach their financial objectives. Everything we do on behalf of investors is backed by our unique combination of qualifications.
Strength
Our organization is built on the standards of integrity and service established by our parent company—Wells Fargo & Company—more than 150 years ago. And, because we’re part of a highly diversified financial enterprise, we offer the depth of resources to help investors succeed.
Expertise
Our multi-boutique model offers investors access to the independent thinking of premier investment managers that have been chosen for their time-tested strategies. While each team specializes in a specific investment strategy, collectively they provide investors a wide choice of distinct investment styles. Our dedication to investment excellence doesn’t end with our expertise in manager selection—risk management, analysis, and rigorous ongoing review seek to ensure each manager’s investment process remains consistent.
Partnership
Our collaborative approach is built around understanding the needs and goals of our clients. By adhering to core principles of sound judgment and steady guidance, we support you through every stage of the investment decision process.
Carefully consider a fund’s investment objectives, risks, charges, and expenses before investing. For a current prospectus and, if available, a summary prospectus, containing this and other information, visit wellsfargoadvantagefunds.com. Read it carefully before investing.
Wells Fargo Funds Management, LLC, a wholly owned subsidiary of Wells Fargo & Company, provides investment advisory and administrative services for Wells Fargo Advantage Funds®. Other affiliates of Wells Fargo & Company provide subadvisory and other services for the Funds. The Funds are distributed by Wells Fargo Funds Distributor, LLC, Member FINRA/SIPC, an affiliate of Wells Fargo & Company.
“Dow Jones®” and “Dow Jones Target Date IndexesSM” are service marks of Dow Jones Trademark Holdings, LLC (“Dow Jones”), have been licensed to CME Group Index Services LLC (“CME Indexes”) and have been sublicensed for use for certain purposes by Global Index Advisors, Inc, and Wells Fargo Funds Management, LLC. The Wells Fargo Advantage Dow Jones Target Date FundsSM based on the Dow Jones Target Date IndexesSM, are not sponsored, endorsed, sold or promoted by Dow Jones, CME Indexes or their respective affiliates and none of them makes any representation regarding the advisability of investing in such product(s).
NOT FDIC INSURED ¡ NO BANK GUARANTEE ¡ MAY LOSE VALUE
Not part of the semi-annual report.
Wells Fargo Advantage Funds offers more than 110 mutual funds across a wide range of asset classes, representing over $209 billion in assets under management, as of July 31, 2012.
| | | | |
| Equity Funds | | | | |
Asia Pacific Fund | | Enterprise Fund† | | Opportunity Fund† |
C&B Large Cap Value Fund | | Equity Value Fund | | Precious Metals Fund |
C&B Mid Cap Value Fund | | Global Opportunities Fund | | Premier Large Company Growth Fund |
Capital Growth Fund | | Growth Fund | | Small Cap Opportunities Fund |
Common Stock Fund | | Index Fund | | Small Cap Value Fund |
Disciplined U.S. Core Fund | | International Equity Fund | | Small Company Growth Fund |
Discovery Fund† | | International Value Fund | | Small Company Value Fund |
Diversified Equity Fund | | Intrinsic Small Cap Value Fund | | Small/Mid Cap Core Fund |
Diversified International Fund | | Intrinsic Value Fund | | Small/Mid Cap Value Fund |
Diversified Small Cap Fund | | Intrinsic World Equity Fund | | Special Mid Cap Value Fund |
Emerging Growth Fund | | Large Cap Core Fund | | Special Small Cap Value Fund |
Emerging Markets Equity Fund | | Large Cap Growth Fund | | Specialized Technology Fund |
Emerging Markets Equity Income Fund | | Large Company Value Fund | | Traditional Small Cap Growth Fund |
Endeavor Select Fund† | | Omega Growth Fund | | Utility and Telecommunications Fund |
| Bond Funds | | | | |
Adjustable Rate Government Fund | | Inflation-Protected Bond Fund | | Short-Term Bond Fund |
California Limited-Term Tax-Free Fund | | Intermediate Tax/AMT-Free Fund | | Short-Term High Yield Bond Fund |
California Tax-Free Fund | | International Bond Fund | | Short-Term Municipal Bond Fund |
Colorado Tax-Free Fund | | Minnesota Tax-Free Fund | | Strategic Municipal Bond Fund |
Emerging Markets Local Bond Fund | | Municipal Bond Fund | | Total Return Bond Fund |
Government Securities Fund | | North Carolina Tax-Free Fund | | Ultra Short-Term Income Fund |
High Income Fund | | Pennsylvania Tax-Free Fund | | Ultra Short-Term Municipal Income Fund |
High Yield Bond Fund | | Short Duration Government Bond Fund | | Wisconsin Tax-Free Fund |
Income Plus Fund | | | | |
| Asset Allocation Funds | | | | |
Absolute Return Fund | | WealthBuilder Equity Portfolio† | | Target 2020 Fund† |
Asset Allocation Fund | | WealthBuilder Growth Allocation Portfolio† | | Target 2025 Fund† |
Conservative Allocation Fund | | WealthBuilder Growth Balanced Portfolio† | | Target 2030 Fund† |
Diversified Capital Builder Fund | | WealthBuilder Moderate Balanced Portfolio† | | Target 2035 Fund† |
Diversified Income Builder Fund | | WealthBuilder Tactical Equity Portfolio† | | Target 2040 Fund† |
Growth Balanced Fund | | Target Today Fund† | | Target 2045 Fund† |
Index Asset Allocation Fund | | Target 2010 Fund† | | Target 2050 Fund† |
Moderate Balanced Fund | | Target 2015 Fund† | | Target 2055 Fund† |
WealthBuilder Conservative Allocation Portfolio† | | | | |
| Money Market Funds | | | | |
100% Treasury Money Market Fund | | Heritage Money Market Fund† | | National Tax-Free Money Market Fund |
California Municipal Money Market Fund | | Money Market Fund | | Prime Investment Money Market Fund |
Cash Investment Money Market Fund | | Municipal Cash Management Money Market Fund | | Treasury Plus Money Market Fund |
Government Money Market Fund | | Municipal Money Market Fund | | |
| Variable Trust Funds1 | | | | |
VT Discovery Fund† | | VT Intrinsic Value Fund | | VT Small Cap Growth Fund |
VT Index Asset Allocation Fund | | VT Omega Growth Fund | | VT Small Cap Value Fund |
VT International Equity Fund | | VT Opportunity Fund† | | VT Total Return Bond Fund |
An investment in a money market fund is not insured or guaranteed by the Federal Deposit Insurance Corporation or any other government agency. Although the Wells Fargo Advantage Money Market Funds seek to preserve the value of your investment at $1.00 per share, it is possible to lose money by investing in a money market fund.
| 1. | The Variable Trust Funds are generally available only through insurance company variable contracts. |
| † | In this report, the Wells Fargo Advantage Discovery FundSM, Wells Fargo Advantage Endeavor Select FundSM, Wells Fargo Advantage Enterprise FundSM, Wells Fargo Advantage Opportunity FundSM, Wells Fargo Advantage WealthBuilder Conservative Allocation PortfolioSM, Wells Fargo Advantage WealthBuilder Equity PortfolioSM, Wells Fargo Advantage WealthBuilder Growth Allocation PortfolioSM, Wells Fargo Advantage WealthBuilder Growth Balanced PortfolioSM, Wells Fargo Advantage WealthBuilder Moderate Balanced PortfolioSM, Wells Fargo Advantage WealthBuilder Tactical Equity PortfolioSM, Wells Fargo Advantage Dow Jones Target Today FundSM, Wells Fargo Advantage Dow Jones Target 2010 FundSM, Wells Fargo Advantage Dow Jones Target 2015 FundSM, Wells Fargo Advantage Dow Jones Target 2020 FundSM, Wells Fargo Advantage Dow Jones Target 2025 FundSM, Wells Fargo Advantage Dow Jones Target 2030 FundSM, Wells Fargo Advantage Dow Jones Target 2035 FundSM, Wells Fargo Advantage Dow Jones Target 2040 FundSM, Wells Fargo Advantage Dow Jones Target 2045 FundSM, Wells Fargo Advantage Dow Jones Target 2050 FundSM, Wells Fargo Advantage Dow Jones Target 2055 FundSM, Wells Fargo Advantage Heritage Money Market FundSM, Wells Fargo Advantage VT Discovery FundSM, and Wells Fargo Advantage VT Opportunity FundSM are referred to as the Discovery Fund, Endeavor Select Fund, Enterprise Fund, Opportunity Fund, WealthBuilder Conservative Allocation Portfolio, WealthBuilder Equity Portfolio, WealthBuilder Growth Allocation Portfolio, WealthBuilder Growth Balanced Portfolio, WealthBuilder Moderate Balanced Portfolio, WealthBuilder Tactical Equity Portfolio, Target Today Fund, Target 2010 Fund, Target 2015 Fund, Target 2020 Fund, Target 2025 Fund, Target 2030 Fund, Target 2035 Fund, Target 2040 Fund, Target 2045 Fund, Target 2050 Fund, Target 2055 Fund, Heritage Money Market Fund, VT Discovery Fund, and VT Opportunity Fund, respectively. |
Not part of the semi-annual report.
| | | | |
| 2 | | Wells Fargo Advantage California Municipal Money Market Fund | | Letter to Shareholders (Unaudited) |

Karla M. Rabusch,
President
Wells Fargo Advantage Funds
Not only has the Fed been successful in engineering low interest rates, but investors have rushed to buy U.S. Treasury securities as a safe-haven asset in the midst of uncertainty surrounding the European debt crisis. As a result, interest rates reached record lows.
Dear Valued Shareholder:
We’re pleased to offer you this semi-annual report for the Wells Fargo Advantage California Municipal Money Market Fund for the six-month period that ended July 31, 2012.
The economy grew, but the recovery has been modest.
The U.S. is three years into a modest economic recovery, with second-quarter real gross domestic product (GDP) increasing 1.5% on an annualized basis. Several factors, however, held back growth despite the Federal Reserve’s (Fed) accommodative monetary policy. In Europe, much uncertainty remained about the outcome of the eurozone debt crisis and whether policymakers will be able to resolve it without any countries defaulting or leaving the euro. In addition, Europe has again entered a recession. In Asia, China’s economy slowed. Here at home, a potential “fiscal cliff”—automatic tax increases alongside automatic budget cuts stemming from a legislative compromise in Congress—added uncertainty and, if unaddressed, could negatively affect GDP beginning in 2013.
In an effort to further bolster the economy, especially the labor market, the Fed has indicated its commitment to maintaining a highly accommodative monetary policy. It has indicated its belief that economic conditions warrant an extremely low federal funds target rate—a short-term bank lending rate—near 0%, at least through late 2014. The Fed also continued its “Operation Twist,” which involves buying U.S. Treasury securities with maturities of greater than six years and selling U.S. Treasury securities with maturities of less than three years, in an effort to keep longer-term interest rates low.
A demand for relative safe-haven securities led to ultra-low interest rates.
Not only has the Fed been successful in engineering low interest rates, but investors have rushed to buy U.S. Treasury securities as a relative safe-haven asset in the midst of uncertainty surrounding the European debt crisis. As a result, interest rates reached record lows. Ten-year U.S. Treasury yields ranged between 2.38% and 1.38% over the past six months. Three-month U.S. Treasury bills had an average yield of 10 basis points (bps; 100 bps is 1.00%) over the past six months. Rates on seven-day commercial paper, a common investment type for prime money market funds, were 12 bps on July 31, 2012.
Lack of supply kept a lid on yields, and regulatory uncertainty remained.
Continued demand for a limited supply of money market-eligible securities also contributed to low yields. We estimate that the amount outstanding of short-term, money market fund-eligible securities (excluding U.S. Treasury securities) has declined by $3 trillion, or more than a 30% decrease, since 2008. Reasons for this decrease in supply include issuers opting to lock in rates on long-term rather than short-term debt, less need for financing as many companies have plentiful cash given record profits, and credit downgrades that have resulted in fewer firms with top credit ratings.
| | | | | | |
| Letter to Shareholders (Unaudited) | | Wells Fargo Advantage California Municipal Money Market Fund | | | 3 | |
The Chairman of the Securities and Exchange Commission (SEC) indicated in late August that the SEC has determined at this time not to propose certain amendments to the rules governing money market funds. However, the Financial Stability Oversight Council or other financial regulators could still take steps to impose additional regulations on money market funds. As we gain clarity in the coming months regarding any potential changes to regulation of money market funds, we will provide further communications to our clients about these changes.
Amid the current challenges of investing—low yields, an unresolved eurozone crisis, limited supply, and regulatory uncertainty—has been the opportunity to provide our clients an important investment option for meeting their short-term cash needs. Our focus on preservation of capital and liquidity is not a marketing phrase but rather the basis of our investment philosophy as we manage money market funds in an uncertain world. We are proud of our comprehensive lineup of prime, government, and tax-exempt money market funds.
Thank you for choosing to invest with Wells Fargo Advantage Funds. We appreciate your confidence in us and remain committed to helping you meet your financial needs. For current information about your fund investments, contact your investment professional, visit our Web site at wellsfargoadvantagefunds.com, or call us directly at 1-800-222-8222. We are available 24 hours a day, 7 days a week.
Sincerely,

Karla M. Rabusch
President
Wells Fargo Advantage Funds
Amid the current challenges of investing—low yields, an unresolved eurozone crisis, limited supply, and regulatory uncertainty—has been the opportunity to provide our clients an important investment option for meeting their short-term cash needs.
| | | | |
| 4 | | Wells Fargo Advantage California Municipal Money Market Fund | | Performance Highlights (Unaudited) |
INVESTMENT OBJECTIVE
The Fund seeks current income exempt from regular federal income tax and California individual income tax, while preserving capital and liquidity.
ADVISER
Wells Fargo Funds Management, LLC
SUB-ADVISER
Wells Capital Management Incorporated
PORTFOLIO MANAGERS
David D. Sylvester
James Randazzo
FUND INCEPTION
January 1, 1992
| | |
SECTOR DISTRIBUTION1
(AS OF JULY 31, 2012) |
|
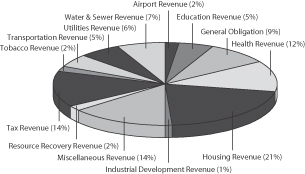
|
|
EFFECTIVE MATURITY DISTRIBUTION2
(AS OF JULY 31, 2012) |
|
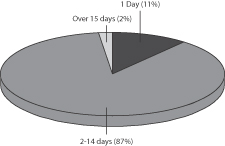 |
|
WEIGHTED AVERAGE MATURITY3
(AS OF JULY 31, 2012) |
9 Days |
|
WEIGHTED AVERAGE FINAL MATURITY4
(AS OF JULY 31, 2012) |
9 Days |
| 1. | Sector distribution is subject to change and is calculated based on the total investments of the Fund. |
| 2. | Effective maturity distribution is subject to change and is calculated based on the total investments of the Fund. |
| 3. | Weighted Average Maturity (WAM): WAM is an average of the effective maturities of all securities held in the portfolio, weighted by each security’s percentage of total investments. The maturity of a portfolio security is the period remaining until the date on which the principal amount is unconditionally required to be paid, or in the case of a security called for redemption, the date on which the redemption payment is unconditionally required to be made. WAM calculations allow for the maturities of certain securities with demand features or periodic interest rate resets to be shortened. WAM is a way to measure a fund’s sensitivity to potential interest rate changes. |
| 4. | Weighted Average Final Maturity (WAFM): WAFM is an average of the final maturities of all securities held in the portfolio, weighted by their percentage of total investments. The maturity of a portfolio security is the period remaining until the date on which the principal amount is unconditionally required to be paid, or in the case of a security called for redemption, the date on which the redemption payment is unconditionally required to be made. In contrast to WAM, the calculation of WAFM allows for the maturities of certain securities with demand features to be shortened, but not the periodic interest rate resets. WAFM is a way to measure a fund’s potential sensitivity to credit spread changes. |
| | | | | | |
| Performance Highlights (Unaudited) | | Wells Fargo Advantage California Municipal Money Market Fund | | | 5 | |
AVERAGE ANNUAL TOTAL RETURN5 (%) (AS OF JULY 31, 2012)
| | | | | | | | | | | | | | | | | | | | | | | | | | | | |
| | | | | | | | | | | | | | | | | | Expense Ratios6 | |
| | | Inception Date | | | 6 Months* | | | 1 Year | | | 5 Year | | | 10 Year | | | Gross | | | Net7 | |
Class A (SGCXX) | | | 01/01/1992 | | | | 0.00 | | | | 0.02 | | | | 0.56 | | | | 1.03 | | | | 0.63% | | | | 0.63% | |
Administrator Class (WCMXX) | | | 06/30/2010 | | | | 0.01 | | | | 0.02 | | | | 0.72 | | | | 1.21 | | | | 0.36% | | | | 0.30% | |
Institutional Class (WCTXX) | | | 03/31/2008 | | | | 0.01 | | | | 0.02 | | | | 0.73 | | | | 1.22 | | | | 0.24% | | | | 0.20% | |
Service Class (WFCXX) | | | 11/08/1999 | | | | 0.00 | | | | 0.02 | | | | 0.64 | | | | 1.17 | | | | 0.53% | | | | 0.45% | |
Sweep Class | | | 06/30/2010 | | | | 0.00 | | | | 0.02 | | | | 0.64 | | | | 1.17 | | | | 0.98% | | | | 0.98% | |
| * | Returns for periods of less than one year are not annualized. |
| | | | | | | | | | | | | | | | | | | | |
FUND YIELD SUMMARY7 (AS OF JULY 31, 2012) | | Class A | | | Administrator Class | | | Institutional Class | | | Service Class | | | Sweep Class | |
7-Day Current Yield | | | 0.01% | | | | 0.01% | | | | 0.01% | | | | 0.01% | | | | 0.01% | |
7-Day Compound Yield | | | 0.01% | | | | 0.01% | | | | 0.01% | | | | 0.01% | | | | 0.01% | |
30-Day Simple Yield | | | 0.01% | | | | 0.01% | | | | 0.01% | | | | 0.01% | | | | 0.01% | |
30-Day Compound Yield | | | 0.01% | | | | 0.01% | | | | 0.01% | | | | 0.01% | | | | 0.01% | |
Figures quoted represent past performance, which is no guarantee of future results and do not reflect the deduction of taxes that a shareholder may pay on fund distributions or the redemption of fund shares. Investment returns will fluctuate. The Fund’s yield figures more closely reflect the current earnings of the Fund than the total return figures. Current performance may be lower or higher than the performance data quoted and assumes the reinvestment of dividends and capital gains. Current month-end performance is available at the Fund’s Web site – wellsfargoadvantagefunds.com.
Each class is sold without a front-end sales charge or contingent deferred sales charge. Other fees and expenses apply to an investment in the Fund and are described in the Fund’s current prospectuses.
An investment in a money market fund is not insured or guaranteed by the Federal Deposit Insurance Corporation or any other government agency. Although the Fund seeks to preserve the value of your investment at $1.00 per share, it is possible to lose money by investing in a money market fund. A portion of the Fund’s income may be subject to federal, state and/or local income taxes or the alternative minimum tax (AMT).
| 5. | Historical performance shown for the Administrator Class shares prior to their inception reflects the performance of the Institutional Class shares, and has not been adjusted to reflect higher expenses applicable to the Administrator Class shares. If these expenses had been adjusted, returns would be lower. Historical performance shown for the Institutional Class shares prior to their inception reflects the performance of the Service Class shares, and includes the higher expenses applicable to the Service Class shares. If these expenses had not been included, returns would be higher. Historical performance shown for the Sweep Class shares prior to their inception reflects the performance of the Service Class shares, and has not been adjusted to reflect the higher expenses applicable to the Sweep Class shares. If these expenses had been adjusted, returns would be lower. |
| 6. | Reflects the expense ratios as stated in the most recent prospectuses. |
| 7. | The Adviser has committed through July 11, 2013 to waive fees and/or reimburse expenses to the extent necessary to cap the Fund’s Total Annual Fund Operating Expenses After Fee Waiver, excluding certain expenses, at 0.65% for Class A, 0.30% for Administrator Class, 0.20% for Institutional Class, 0.45% for Service Class and 1.00% for Sweep Class. Brokerage commissions, stamp duty fees, interest, taxes, acquired fund fees and expenses and extraordinary expenses are excluded from the cap. Without this cap, the Fund’s returns would have been lower. Without waived fees and/or reimbursed expenses, the Fund’s 7-day current yield would have been (0.47)%, (0.19)%, (0.08)%, (0.37)% and (0.82)% for Class A, Administrator Class, Institutional Class, Service Class and Sweep Class, respectively. |
| | | | |
| 6 | | Wells Fargo Advantage California Municipal Money Market Fund | | Fund Expenses (Unaudited) |
As a shareholder of the Fund, you incur ongoing costs, including management fees, distribution (12b-1) and/or shareholder service fees, and other Fund expenses. This example is intended to help you understand your ongoing costs (in dollars) of investing in the Fund and to compare these costs with the ongoing costs of investing in other mutual funds.
The example is based on an investment of $1,000 invested at the beginning of the six-month period and held for the entire period from February 1, 2012 to July 31, 2012.
Actual Expenses
The “Actual” line of the table below provides information about actual account values and actual expenses. You may use the information in this line, together with the amount you invested, to estimate the expenses that you paid over the period. Simply divide your account value by $1,000 (for example, an $8,600 account value divided by $1,000 = 8.6), then multiply the result by the number in the “Actual” line under the heading entitled “Expenses Paid During Period” for your applicable class of shares to estimate the expenses you paid on your account during this period.
Hypothetical Example for Comparison Purposes
The “Hypothetical” line of the table below provides information about hypothetical account values and hypothetical expenses based on the Fund’s actual expense ratio and an assumed rate of return of 5% per year before expenses, which is not the Fund’s actual return. The hypothetical account values and expenses may not be used to estimate the actual ending account balance or expenses you paid for the period. You may use this information to compare the ongoing costs of investing in the Fund and other funds. To do so, compare this 5% hypothetical example with the 5% hypothetical examples that appear in the shareholder reports of the other funds.
Please note that the expenses shown in the table are meant to highlight your ongoing costs only. Therefore, the “Hypothetical” line of the table is useful in comparing ongoing costs only, and will not help you determine the relative total costs of owning different funds.
| | | | | | | | | | | | | | | | |
| | | Beginning
Account Value
02-01-2012 | | | Ending
Account Value
07-31-2012 | | | Expenses
Paid During
the Period1 | | | Net Annual
Expense Ratio | |
Class A | | | | | | | | | | | | | | | | |
Actual | | $ | 1,000.00 | | | $ | 1,000.05 | | | $ | 0.85 | | | | 0.17 | % |
Hypothetical (5% return before expenses) | | $ | 1,000.00 | | | $ | 1,024.02 | | | $ | 0.86 | | | | 0.17 | % |
Administrator Class | | | | | | | | | | | | | | | | |
Actual | | $ | 1,000.00 | | | $ | 1,000.05 | | | $ | 0.85 | | | | 0.17 | % |
Hypothetical (5% return before expenses) | | $ | 1,000.00 | | | $ | 1,024.02 | | | $ | 0.86 | | | | 0.17 | % |
Institutional Class | | | | | | | | | | | | | | | | |
Actual | | $ | 1,000.00 | | | $ | 1,000.08 | | | $ | 0.80 | | | | 0.16 | % |
Hypothetical (5% return before expenses) | | $ | 1,000.00 | | | $ | 1,024.07 | | | $ | 0.81 | | | | 0.16 | % |
Service Class | | | | | | | | | | | | | | | | |
Actual | | $ | 1,000.00 | | | $ | 1,000.05 | | | $ | 0.85 | | | | 0.17 | % |
Hypothetical (5% return before expenses) | | $ | 1,000.00 | | | $ | 1,024.02 | | | $ | 0.86 | | | | 0.17 | % |
Sweep Class | | | | | | | | | | | | | | | | |
Actual | | $ | 1,000.00 | | | $ | 1,000.05 | | | $ | 0.85 | | | | 0.17 | % |
Hypothetical (5% return before expenses) | | $ | 1,000.00 | | | $ | 1,024.02 | | | $ | 0.86 | | | | 0.17 | % |
| 1. | Expenses paid is equal to the annualized expense ratio of each class multiplied by the average account value over the period, multiplied by the number of days in the most recent fiscal half-year divided by the number of days in the fiscal year (to reflect the one-half year period). |
| | | | | | |
| Portfolio of Investments—July 31, 2012 (Unaudited) | | Wells Fargo Advantage California Municipal Money Market Fund | | | 7 | |
| | | | | | | | | | | | | | | | |
| Security Name | | Interest Rate | | | Maturity Date | | | Principal | | | Value | |
| | | | | | | | | | | | | | | | |
| | | | |
Municipal Obligations : 99.94% | | | | | | | | | | | | | | | | |
| | | | |
California : 95.97% | | | | | | | | | | | | | | | | |
| | | | |
| Other Municipal Debt : 2.16% | | | | | | | | | | | | | | | | |
Callifornia Series 2011A-2 (GO, Royal Bank of Canada LOC) | | | 0.18 | % | | | 10/03/2012 | | | $ | 5,000,000 | | | $ | 5,000,000 | |
Los Angeles CA Schools Pooled Financing Series B-1 (Miscellaneous Revenue, GO of Participants Insured) | | | 2.00 | | | | 11/30/2012 | | | | 10,000,000 | | | | 10,057,630 | |
Riverside County CA Teeter Financing Series B (Miscellaneous Revenue) | | | 0.15 | | | | 08/09/2012 | | | | 4,900,000 | | | | 4,900,000 | |
San Diego County CA School District Series B-1 (Education Revenue) | | | 2.00 | | | | 01/31/2013 | | | | 15,380,000 | | | | 15,513,988 | |
San Diego County CA School District Series B-2 (Education Revenue) | | | 2.00 | | | | 04/30/2013 | | | | 5,440,000 | | | | 5,508,740 | |
| | | | |
| | | | | | | | | | | | | | | 40,980,358 | |
| | | | | | | | | | | | | | | | |
| | | | |
| Variable Rate Demand Notes §: 93.81% | | | | | | | | | | | | | | | | |
ABAG Finance Authority for Nonprofit Corporation California Branson School (Education Revenue, Northern Trust Company LOC) | | | 0.13 | | | | 07/01/2038 | | | | 14,950,000 | | | | 14,950,000 | |
ABAG Finance Authority for Nonprofit Corporation California Jewish Community Center (Miscellaneous Revenue, Bank of America NA LOC) | | | 0.29 | | | | 06/01/2029 | | | | 4,120,000 | | | | 4,120,000 | |
ABAG Finance Authority for Nonprofit Corporation California Menlo School (Education Revenue, Northern Trust Company LOC) | | | 0.13 | | | | 09/01/2033 | | | | 15,000,000 | | | | 15,000,000 | |
ABAG Finance Authority for Nonprofit Corporation California MFHR Acton Courtyard Series A (Housing Revenue, FHLMC Insured, FHLMC LIQ) | | | 0.17 | | | | 04/01/2037 | | | | 1,300,000 | | | | 1,300,000 | |
ABAG Finance Authority for Nonprofit Corporation California MFHR Fine Arts Building Projects Series A (Housing Revenue, FNMA Insured, FNMA LIQ) | | | 0.17 | | | | 07/15/2035 | | | | 9,200,000 | | | | 9,200,000 | |
ABAG Finance Authority for Nonprofit Corporation California San Francisco University High School Series A (Education Revenue, Northern Trust Company LOC) | | | 0.13 | | | | 04/01/2036 | | | | 6,660,000 | | | | 6,660,000 | |
ABAG Finance Authority for Nonprofit Corporation California San Francisco University High School Series A (Education Revenue, Northern Trust Company LOC) | | | 0.13 | | | | 04/01/2035 | | | | 1,640,000 | | | | 1,640,000 | |
ABAG Finance Authority for Nonprofit Corporation California Zoological Society of San Diego (Miscellaneous Revenue, Bank of America NA LOC) | | | 0.29 | | | | 10/01/2034 | | | | 13,985,000 | | | | 13,985,000 | |
Alameda CA PFA MFHA Eagle Parrot Project Series A (Housing Revenue, FNMA Insured, FNMA LOC) | | | 0.20 | | | | 05/15/2035 | | | | 1,535,000 | | | | 1,535,000 | |
Anaheim CA Housing Authority Cobblestone Apartments Series B (Housing Revenue, FNMA Insured, FNMA LIQ) | | | 0.15 | | | | 03/15/2033 | | | | 2,000,000 | | | | 2,000,000 | |
Anaheim CA Housing Authority Sea Wind Apartments Project Series C (Housing Revenue, FNMA Insured, FNMA LIQ) | | | 0.15 | | | | 07/15/2033 | | | | 6,000,000 | | | | 6,000,000 | |
Arcadia County CA United School District Series 2679 (Tax Revenue, FSA Insured) | | | 0.16 | | | | 08/01/2013 | | | | 8,680,000 | | | | 8,680,000 | |
AustinTrust Bank of America Certificates Series 2008-3312 (GO, FSA-CR, NATL-RE Insured, Bank of America NA LIQ) | | | 0.37 | | | | 08/01/2032 | | | | 6,920,000 | | | | 6,920,000 | |
Bay Area Toll Authority California Toll Bridge Series A (Transportation Revenue, Sumitomo Mitsui Banking Corporation LOC) | | | 0.12 | | | | 04/01/2045 | | | | 29,600,000 | | | | 29,600,000 | |
Bay Area Toll Authority California Toll Bridge Series A2 (Transportation Revenue, Union Bank NA LOC) | | | 0.12 | | | | 04/01/2047 | | | | 9,400,000 | | | | 9,400,000 | |
Bay Area Toll Authority California Toll Bridge Series C2 (Transportation Revenue, Union Bank NA LOC) | | | 0.13 | | | | 04/01/2047 | | | | 20,810,000 | | | | 20,810,000 | |
Bay Area Toll Authority California Toll Bridge Series D2 (Transportation Revenue, JPMorgan Chase Bank LOC) | | | 0.12 | | | | 04/01/2047 | | | | 11,000,000 | | | | 11,000,000 | |
Branch Banking & Trust Municipal Trust Series 2049 (GO, FSA Insured, Branch Banking & Trust LIQ) | | | 0.15 | | | | 02/01/2027 | | | | 9,540,000 | | | | 9,540,000 | |
The accompanying notes are an integral part of these financial statements.
| | | | |
| 8 | | Wells Fargo Advantage California Municipal Money Market Fund | | Portfolio of Investments—July 31, 2012 (Unaudited) |
| | | | | | | | | | | | | | | | |
| Security Name | | Interest Rate | | | Maturity Date | | | Principal | | | Value | |
| | | | | | | | | | | | | | | | |
| | | | |
| Variable Rate Demand Notes § (continued) | | | | | | | | | | | | | | | | |
California Alternative Energy Source Financing Authority GE Capital Corporation Series A (Utilities Revenue, Bank of America NA LOC) | | | 0.18 | % | | | 10/01/2020 | | | $ | 25,330,000 | | | $ | 25,330,000 | |
California CDA Aegis Moraga Project C (Housing Revenue, FNMA Insured , FNMA LIQ) | | | 0.16 | | | | 07/01/2027 | | | | 7,255,000 | | | | 7,255,000 | |
California CDA Aegis Pleasant Hill Series H (Housing Revenue, FNMA Insured, FNMA LIQ) | | | 0.15 | | | | 07/01/2027 | | | | 6,270,000 | | | | 6,270,000 | |
California CDA Arbor Ridge Apartments Series B (Housing Revenue, FHLMC Insured, FHLMC LIQ) | | | 0.19 | | | | 11/01/2036 | | | | 9,500,000 | | | | 9,500,000 | |
California CDA Charter Court Apartments Series L (Housing Revenue, FHLMC Insured, FHLMC LIQ) | | | 0.19 | | | | 09/01/2040 | | | | 3,555,000 | | | | 3,555,000 | |
California CDA Gas Supply Series 2010 (Utilities Revenue, Royal Bank of Canada SPA) | | | 0.14 | | | | 11/01/2040 | | | | 28,610,000 | | | | 28,610,000 | |
California CDA Grande Apartments Series TT (Housing Revenue, FNMA Insured, FNMA LIQ) | | | 0.16 | | | | 12/15/2034 | | | | 1,925,000 | | | | 1,925,000 | |
California CDA Health Facility Community Monterey Peninsula Series B (Health Revenue, U.S. Bank NA LOC) | | | 0.14 | | | | 06/01/2033 | | | | 13,000,000 | | | | 13,000,000 | |
California CDA La Puente Apartments Series JJ (Housing Revenue, U.S. Bank NA LOC) | | | 0.18 | | | | 11/01/2031 | | | | 6,775,000 | | | | 6,775,000 | |
California CDA Livermore Valley Arts Center Project (Miscellaneous Revenue, Bank of New York Mellon LOC) | | | 0.13 | | | | 12/01/2036 | | | | 11,995,000 | | | | 11,995,000 | |
California CDA MFHR Canyon Country Apartments Series M (Housing Revenue, FHLMC Insured, FHLMC LIQ) | | | 0.15 | | | | 12/01/2034 | | | | 200,000 | | | | 200,000 | |
California CDA MFHR Desert Palms Series A (Housing Revenue, FHLMC LOC) | | | 0.16 | | | | 08/01/2045 | | | | 7,000,000 | | | | 7,000,000 | |
California CDA MFHR Glen Haven Apartments Series 2002 (Housing Revenue, FNMA Insured, FNMA LIQ) | | | 0.15 | | | | 04/15/2035 | | | | 7,000,000 | | | | 7,000,000 | |
California CDA MFHR Granite Oaks Apartments Series R (Housing Revenue, FNMA Insured, FNMA LIQ) | | | 0.16 | | | | 10/15/2030 | | | | 3,985,000 | | | | 3,985,000 | |
California CDA MFHR Imperial Park Apartments Series 00 (Housing Revenue, FHLMC Insured, FHLMC LIQ) | | | 0.16 | | | | 11/01/2040 | | | | 10,620,000 | | | | 10,620,000 | |
California CDA MFHR PUTTER Series 2680 (Housing Revenue, JPMorgan Chase Bank LOC) | | | 0.23 | | | | 05/15/2018 | | | | 22,950,000 | | | | 22,950,000 | |
California CDA MFHR PUTTER Series 2681 (Housing Revenue, JPMorgan Chase Bank LOC) | | | 0.31 | | | | 05/15/2018 | | | | 1,300,000 | | | | 1,300,000 | |
California CDA MFHR Seasons at Lakewood Series A (Housing Revenue, FNMA Insured, FNMA LIQ) | | | 0.16 | | | | 05/15/2037 | | | | 3,200,000 | | | | 3,200,000 | |
California CDA Motion Picture & Television Fund Series A (Health Revenue, Northern Trust Company LOC) | | | 0.16 | | | | 03/01/2031 | | | | 24,160,000 | | | | 24,160,000 | |
California CDA Oakmont Senior Living Series Y (Housing Revenue, FNMA Insured, FNMA LIQ) | | | 0.16 | | | | 08/01/2031 | | | | 7,840,000 | | | | 7,840,000 | |
California CDA Olympus Park Apartments Series Y (Housing Revenue, FNMA Insured, FNMA LIQ) | | | 0.15 | | | | 10/15/2030 | | | | 6,440,000 | | | | 6,440,000 | |
California CDA Pennsylvania Valley Apartment Authority Project Series 2001 (Housing Revenue, FHLMC Insured, FHLMC LIQ) | | | 0.39 | | | | 08/01/2033 | | | | 1,645,000 | | | | 1,645,000 | |
California CDA Seasons Senior Apartments Series B (Housing Revenue, FNMA Insured, FNMA LIQ) | | | 0.15 | | | | 05/15/2037 | | | | 5,265,000 | | | | 5,265,000 | |
California CDA Sunrise of Danville Project Series A (Housing Revenue, FNMA Insured, FNMA LIQ) | | | 0.16 | | | | 05/01/2027 | | | | 5,665,000 | | | | 5,665,000 | |
California CDA Sutter Health ROC RR-II-R-11621 (Health Revenue, FSA Insured, Citibank NA LIQ) 144A | | | 0.16 | | | | 08/15/2032 | | | | 12,825,000 | | | | 12,825,000 | |
California CDA Sutter Health Series 3102 (Health Revenue, Credit Suisse Bank LIQ) 144A | | | 0.17 | | | | 11/15/2048 | | | | 25,422,423 | | | | 25,422,423 | |
The accompanying notes are an integral part of these financial statements.
| | | | | | |
| Portfolio of Investments—July 31, 2012 (Unaudited) | | Wells Fargo Advantage California Municipal Money Market Fund | | | 9 | |
| | | | | | | | | | | | | | | | |
| Security Name | | Interest Rate | | | Maturity Date | | | Principal | | | Value | |
| | | | | | | | | | | | | | | | |
| | | | |
| Variable Rate Demand Notes § (continued) | | | | | | | | | | | | | | | | |
California CDA Sutter Health Series 3108 (Health Revenue, AMBAC Insured, Morgan Stanley Bank LIQ) 144A | | | 0.17 | % | | | 08/15/2038 | | | $ | 6,000,000 | | | $ | 6,000,000 | |
California CDA Tyrella Gardens Apartments Series B (Housing Revenue, Citibank NA LOC) | | | 0.35 | | | | 06/01/2036 | | | | 1,145,000 | | | | 1,145,000 | |
California CDA Villa Paseo Senior Project MM (Housing Revenue, East West Bank LOC) | | | 0.16 | | | | 11/01/2035 | | | | 4,000,000 | | | | 4,000,000 | |
California CDA Village at Hesperia Series CCC (Housing Revenue, FNMA Insured, FNMA LIQ) | | | 0.16 | | | | 11/15/2039 | | | | 2,300,000 | | | | 2,300,000 | |
California CDA Village at Ninth Apartments Series D (Housing Revenue, FNMA Insured, FNMA LIQ) | | | 0.15 | | | | 11/15/2035 | | | | 4,375,000 | | | | 4,375,000 | |
California CDA Village at Shaw Apartments Series E (Housing Revenue, FNMA Insured, FNMA LIQ) | | | 0.16 | | | | 11/15/2035 | | | | 3,605,000 | | | | 3,605,000 | |
California DWR Series 3019 (Water & Sewer Revenue, JPMorgan Chase Bank LIQ) | | | 0.16 | | | | 06/01/2016 | | | | 4,885,000 | | | | 4,885,000 | |
California Educational Facilities Authority Stanford Unversity Series L (Education Revenue) | | | 0.12 | | | | 10/01/2022 | | | | 2,000,000 | | | | 2,000,000 | |
California Enterprise Development Authority Pocino Foods Company Project Series A (IDR, City National Bank LOC) | | | 0.16 | | | | 11/01/2033 | | | | 7,665,000 | | | | 7,665,000 | |
California Finance Authority Kehillah Jewish High School Series 2009 (Education Revenue, California Bank & Trust LOC) | | | 0.14 | | | | 08/01/2039 | | | | 13,790,000 | | | | 13,790,000 | |
California HFA Home Mortgage Series H (Housing Revenue, FNMA LOC) | | | 0.17 | | | | 02/01/2036 | | | | 3,400,000 | | | | 3,400,000 | |
California HFA Home Mortgage Series M (Housing Revenue, FNMA LOC) | | | 0.17 | | | | 08/01/2034 | | | | 10,600,000 | | | | 10,600,000 | |
California HFFA Adventist Health System Series A (Health Revenue) | | | 0.12 | | | | 08/01/2021 | | | | 5,000,000 | | | | 5,000,000 | |
California HFFA California Presbyterian Homes (Health Revenue, Union Bank NA LOC) | | | 0.15 | | | | 07/01/2034 | | | | 31,345,000 | | | | 31,345,000 | |
California HFFA Catholic Healthcare West Series B (Health Revenue, Bank of Montreal LOC) | | | 0.14 | | | | 03/01/2047 | | | | 6,725,000 | | | | 6,725,000 | |
California HFFA Catholic Healthcare West Series C (Health Revenue, Bank of Montreal LOC) | | | 0.10 | | | | 03/01/2047 | | | | 8,500,000 | | | | 8,500,000 | |
California HFFA Catholic Healthcare West Series I (Health Revenue, Bank of America NA LOC) | | | 0.22 | | | | 07/01/2035 | | | | 500,000 | | | | 500,000 | |
California HFFA Series B (Health Revenue) | | | 0.10 | | | | 10/01/2042 | | | | 9,075,000 | | | | 9,075,000 | |
California HFFA Series C (Health Revenue, Northern Trust Company LOC) | | | 0.10 | | | | 10/01/2040 | | | | 8,000,000 | | | | 8,000,000 | |
California HFFA Series C (Health Revenue) | | | 0.11 | | | | 10/01/2042 | | | | 18,500,000 | | | | 18,500,000 | |
California HFFA St. Joseph Health System Series C (Health Revenue, Northern Trust Company LOC) | | | 0.14 | | | | 07/01/2041 | | | | 16,500,000 | | | | 16,500,000 | |
California Infrastructure & Economic Development Bank Le Lycee Francias de Los Angeles Project (Education Revenue, U.S. Bank NA LOC) | | | 0.15 | | | | 09/01/2036 | | | | 2,865,000 | | | | 2,865,000 | |
California Infrastructure & Economic Development Bank Pacific Gas & Electric Company Series A (Utilities Revenue, Mizuho Corporate Bank LOC) | | | 0.14 | | | | 11/01/2026 | | | | 16,550,000 | | | | 16,550,000 | |
California Infrastructure & Economic Development Bank Pacific Gas & Electric Company Series B (Utilities Revenue, Mizuho Corporate Bank LOC) | | | 0.14 | | | | 11/01/2026 | | | | 13,145,000 | | | | 13,145,000 | |
California Infrastructure & Economic Development Bank Saddleback Valley Christian Schools Project Series A (Miscellaneous Revenue, East West Bank LOC) | | | 0.14 | | | | 12/01/2040 | | | | 14,940,000 | | | | 14,940,000 | |
California Infrastructure & Economic Development Bank Society for the Blind Project (Miscellaneous Revenue, U.S. Bank NA LOC) | | | 0.18 | | | | 01/01/2037 | | | | 2,150,000 | | | | 2,150,000 | |
California Infrastructure & Economic Development Bank The Bay Institute Aquarium Foundation (Miscellaneous Revenue, Pacific Capital Bank NA LOC) | | | 0.13 | | | | 06/01/2025 | | | | 6,300,000 | | | | 6,300,000 | |
California Municipal Finance Authority Pacific Institute Series A (Housing Revenue, California Bank & Trust LOC) | | | 0.13 | | | | 08/01/2037 | | | | 20,700,000 | | | | 20,700,000 | |
The accompanying notes are an integral part of these financial statements.
| | | | |
| 10 | | Wells Fargo Advantage California Municipal Money Market Fund | | Portfolio of Investments—July 31, 2012 (Unaudited) |
| | | | | | | | | | | | | | | | |
| Security Name | | Interest Rate | | | Maturity Date | | | Principal | | | Value | |
| | | | | | | | | | | | | | | | |
| | | | |
| Variable Rate Demand Notes § (continued) | | | | | | | | | | | | | | | | |
California Municipal Finance Authority San Francisco Planning Project (IDR, Pacific Capital Bank NA LOC, FHLB LOC) | | | 0.13 | % | | | 12/01/2042 | | | $ | 6,935,000 | | | $ | 6,935,000 | |
California PCFA Burney Forest Products Project Series A (Resource Recovery Revenue, Union Bank of California LOC) | | | 0.14 | | | | 09/01/2020 | | | | 14,700,000 | | | | 14,700,000 | |
California PCFA Solid Waste John B. & Ann M. Verwey Project (Resource Recovery Revenue, CoBank ACB LOC) | | | 0.23 | | | | 05/01/2028 | | | | 3,400,000 | | | | 3,400,000 | |
California PCFA Solid Waste Milk Time Dairy Farms Project (Resource Recovery Revenue, CoBank ACB LOC) | | | 0.23 | | | | 11/01/2027 | | | | 6,000,000 | | | | 6,000,000 | |
California PCFA Waste Connection Incorporated Project (Resource Recovery Revenue, Bank of America NA LOC) | | | 0.29 | | | | 08/01/2018 | | | | 10,100,000 | | | | 10,100,000 | |
California Refunding Branch Banking & Trust Company Municipal Trust Series 2000 (GO, FSA Insured, Branch Banking & Trust LIQ) | | | 0.15 | | | | 07/10/2027 | | | | 17,130,000 | | | | 17,130,000 | |
California Scripps Health Series F (Health Revenue, Northern Trust Company LOC) | | | 0.10 | | | | 10/01/2031 | | | | 4,030,000 | | | | 4,030,000 | |
California Series A Subseries A-1-1 (GO, Royal Bank of Canada LOC) | | | 0.12 | | | | 05/01/2040 | | | | 40,425,000 | | | | 40,425,000 | |
California Series A Subseries A-1-2 (GO, Royal Bank of Canada LOC) | | | 0.11 | | | | 05/01/2040 | | | | 17,150,000 | | | | 17,150,000 | |
California Series A-2 (GO, Bank of Montreal LOC) | | | 0.12 | | | | 05/01/2033 | | | | 30,100,000 | | | | 30,100,000 | |
California Series A-3 (GO, Bank of Montreal LOC) | | | 0.11 | | | | 05/01/2033 | | | | 12,550,000 | | | | 12,550,000 | |
California State Department of Veterans Affairs JPMorgan Chase PUTTER/DRIVER Trust Series 4160 (Miscellaneous Revenue) 144A | | | 0.16 | | | | 09/01/2016 | | | | 5,045,000 | | | | 5,045,000 | |
California State Department of Water Resources JPMorgan Chase PUTTER/DRIVER Trust Series 4161 (Miscellaneous Revenue) 144A | | | 0.16 | | | | 12/01/2016 | | | | 3,250,000 | | | | 3,250,000 | |
California Statewide CDA Sweep Loan Program Series A (Health Revenue, Citibank NA LOC) | | | 0.16 | | | | 08/01/2035 | | | | 20,000,000 | | | | 20,000,000 | |
Camarillo CA Hacienda de Camarillo Project (Housing Revenue, FNMA Insured, FNMA LIQ) | | | 0.15 | | | | 10/15/2026 | | | | 1,755,000 | | | | 1,755,000 | |
Central Basin California Municipal Water Distribution Series B (Water & Sewer Revenue, U.S. Bank NA LOC) | | | 0.13 | | | | 08/01/2037 | | | | 12,315,000 | | | | 12,315,000 | |
Contra Costa CA Transportation Authority Royal Bank of Canada Municipal Products Incorporated Trust Certificates Series E-17 (Miscellaneous Revenue, Royal Bank of Canada LIQ) 144A | | | 0.15 | | | | 03/01/2034 | | | | 35,985,000 | | | | 35,985,000 | |
Corona CA Household Bank Project B (Housing Revenue, FNMA Insured, FNMA LIQ) | | | 0.19 | | | | 02/01/2023 | | | | 11,000,000 | | | | 11,000,000 | |
East Bay California MUD Water System Series A-1 (Water & Sewer Revenue, Royal Bank of Canada SPA) | | | 0.11 | | | | 06/01/2038 | | | | 34,385,000 | | | | 34,385,000 | |
Eastern Municipal Water District California Water & Sewer COP Series D (Water & Sewer Revenue) | | | 0.12 | | | | 07/01/2023 | | | | 17,600,000 | | | | 17,600,000 | |
Eclipse Funding Trust 2006-0002 Solar Eclipse Los Angeles (GO, U.S. Bank NA LOC, U.S. Bank NA LIQ) | | | 0.13 | | | | 07/01/2030 | | | | 10,000 | | | | 10,000 | |
Eclipse Funding Trust 2006-0065 Solar Eclipse Pepperdine University (Education Revenue, U.S. Bank NA LOC, U.S. Bank NA LIQ) | | | 0.14 | | | | 12/01/2013 | | | | 2,170,000 | | | | 2,170,000 | |
Eclipse Funding Trust 2007-0079 Solar Eclipse Los Angeles (GO, U.S. Bank NA LOC, U.S. Bank NA LIQ) | | | 0.13 | | | | 08/01/2032 | | | | 10,170,000 | | | | 10,170,000 | |
Elsinore Valley CA Municipal Water District COP Series B (Water & Sewer Revenue, U.S. Bank NA LOC) | | | 0.13 | | | | 07/01/2035 | | | | 16,430,000 | | | | 16,430,000 | |
Golden State Tobacco Securitization Corporation California Series 3123 (Tobacco Revenue, Morgan Stanley Bank LIQ) 144A | | | 0.35 | | | | 06/01/2045 | | | | 21,290,000 | | | | 21,290,000 | |
Golden State Tobacco Securitization Corporation California Tobacco Settlement ROC RR-II-R-11442 (Tobacco Revenue, AGC-ICC Insured, Citibank NA LIQ) | | | 0.60 | | | | 06/01/2035 | | | | 17,645,000 | | | | 17,645,000 | |
The accompanying notes are an integral part of these financial statements.
| | | | | | |
| Portfolio of Investments—July 31, 2012 (Unaudited) | | Wells Fargo Advantage California Municipal Money Market Fund | | | 11 | |
| | | | | | | | | | | | | | | | |
| Security Name | | Interest Rate | | | Maturity Date | | | Principal | | | Value | |
| | | | | | | | | | | | | | | | |
| | | | |
| Variable Rate Demand Notes § (continued) | | | | | | | | | | | | | | | | |
Highland CA RDA Jeffrey Court Senior Apartments (Housing Revenue, East West Bank LOC) | | | 0.16 | % | | | 03/01/2028 | | | $ | 6,620,000 | | | $ | 6,620,000 | |
Irvine CA Improvement Bond Act 1915 Reassessment District #85-7 Series A (Miscellaneous Revenue, Bank of Tokyo-Mitsubishi UFJ LOC) | | | 0.11 | | | | 09/02/2032 | | | | 14,515,000 | | | | 14,515,000 | |
Irvine CA Ranch Water District Series1991 (Water & Sewer Revenue) | | | 0.10 | | | | 08/01/2016 | | | | 1,000,000 | | | | 1,000,000 | |
Kings County CA Housing Authority Edgewater Isle Apartments Series A (Housing Revenue, FNMA Insured, FNMA LIQ) | | | 0.17 | | | | 02/15/2031 | | | | 6,100,000 | | | | 6,100,000 | |
Los Angeles CA Airport PUTTER Series 2000-A (Airport Revenue, JPMorgan Chase Bank LIQ) 144A | | | 0.21 | | | | 11/15/2025 | | | | 8,000,000 | | | | 8,000,000 | |
Los Angeles CA CDA MFHR Met Apartments Project (Housing Revenue, FNMA Insured, FNMA LIQ) | | | 0.15 | | | | 12/15/2024 | | | | 635,000 | | | | 635,000 | |
Los Angeles CA Community College District Royal Bank of Canada Municipal Products Incorporated Trust Certificates Series O-4 (GO, Royal Bank of Canada LIQ) 144A | | | 0.13 | | | | 08/01/2033 | | | | 5,000,000 | | | | 5,000,000 | |
Los Angeles CA Community RDA Security Building Project Series A (Housing Revenue, FNMA Insured, FNMA LIQ) | | | 0.19 | | | | 12/15/2034 | | | | 6,290,000 | | | | 6,290,000 | |
Los Angeles CA COP Samuel A Fryer Yavney Series A (Education Revenue, California Bank & Trust LOC) | | | 0.13 | | | | 08/01/2038 | | | | 10,000,000 | | | | 10,000,000 | |
Los Angeles CA International Airport JPMorgan Chase PUTTER/DRIVER Trust Series 4174 (Miscellaneous Revenue) 144A | | | 0.21 | | | | 11/15/2016 | | | | 9,000,000 | | | | 9,000,000 | |
Los Angeles CA International Airport Royal Bank of Canada Municipal Products Incorporated Trust Series 0-30 (Airport Revenue, Royal Bank of Canada LIQ) 144A | | | 0.13 | | | | 05/15/2040 | | | | 8,525,000 | | | | 8,525,000 | |
Los Angeles CA JPMorgan Chase PUTTER/DRIVER Trust Series 3930 (Miscellaneous Revenue) 144A | | | 0.18 | | | | 08/12/2012 | | | | 9,450,000 | | | | 9,450,000 | |
Los Angeles CA JPMorgan Chase PUTTER/DRIVER Trust Series 3931 (GO, JPMorgan Chase & Company LIQ) | | | 0.18 | | | | 08/12/2012 | | | | 15,690,000 | | | | 15,690,000 | |
Los Angeles CA MFHR Mission Village Terrace Series D (Housing Revenue, NATL-RE Insured, JPMorgan Chase Bank LIQ) | | | 0.16 | | | | 06/01/2013 | | | | 5,770,000 | | | | 5,770,000 | |
Los Angeles CA Mission Village Terrace Apartments (Housing Revenue, East West Bank LOC) | | | 0.16 | | | | 07/01/2027 | | | | 3,540,000 | | | | 3,540,000 | |
Los Angeles CA Waste Water System Series G (Water & Sewer Revenue, Bank of America NA LOC) | | | 0.18 | | | | 06/01/2032 | | | | 8,330,000 | | | | 8,330,000 | |
Los Angeles CA Watts Athens Apartments Series A (Housing Revenue, Citibank (West) FSB LOC) | | | 0.15 | | | | 08/15/2030 | | | | 4,300,000 | | | | 4,300,000 | |
Los Rios CA Community College District Series 2972 (Tax Revenue, FSA Insured) | | | 0.16 | | | | 02/01/2013 | | | | 5,065,000 | | | | 5,065,000 | |
Manteca CA RDA Amended Merger Project (Tax Revenue, State Street Bank & Trust Company LOC) | | | 0.16 | | | | 10/01/2042 | | | | 10,530,000 | | | | 10,530,000 | |
Menlo Park CA CDA Las Pulgas Community Development (Tax Revenue, State Street Bank & Trust Company LOC) | | | 0.16 | | | | 01/01/2031 | | | | 29,105,000 | | | | 29,105,000 | |
Metropolitan Water District of Southern California JPMorgan Chase PUTTER/DRIVER Trust Series 3655Z (Water & Sewer Revenue) 144A | | | 0.16 | | | | 07/01/2017 | | | | 6,685,000 | | | | 6,685,000 | |
Modesto CA MFHR Live Oak Apartments Project (Housing Revenue, FNMA Insured, FNMA LIQ) | | | 0.17 | | | | 09/15/2024 | | | | 5,575,000 | | | | 5,575,000 | |
Morgan Hill CA RDA Tax Allocation Ojo de Agua Redevelopment Project A (Tax Revenue, Bank of Nova Scotia LOC) | | | 0.13 | | | | 09/01/2033 | | | | 58,950,000 | | | | 58,950,000 | |
Napa CA Water Utility Improvements (Water & Sewer Revenue, AMBAC Insured, JPMorgan Chase Bank LIQ) 144A | | | 0.16 | | | | 11/01/2015 | | | | 10,585,000 | | | | 10,585,000 | |
Newport Beach CA Memorial Hospital Series E (Health Revenue, Northern Trust Company LOC) | | | 0.13 | | | | 12/01/2040 | | | | 12,500,000 | | | | 12,500,000 | |
The accompanying notes are an integral part of these financial statements.
| | | | |
| 12 | | Wells Fargo Advantage California Municipal Money Market Fund | | Portfolio of Investments—July 31, 2012 (Unaudited) |
| | | | | | | | | | | | | | | | |
| Security Name | | Interest Rate | | | Maturity Date | | | Principal | | | Value | |
| | | | | | | | | | | | | | | | |
| | | | |
| Variable Rate Demand Notes § (continued) | | | | | | | | | | | | | | | | |
Oakland CA Joint Powers Financing Authority Revenue Series A (Housing Revenue, Citibank NA LOC) | | | 0.30 | % | | | 07/01/2033 | | | $ | 15,315,000 | | | $ | 15,315,000 | |
Oceanside CA MFHR Ace-Shadow Way Apartments Project Series 2009 (Housing Revenue, FHLMC LOC) | | | 0.14 | | | | 03/01/2049 | | | | 1,050,000 | | | | 1,050,000 | |
Ontario County CA Multi-Family (Housing Revenue, FHLMC Insured) | | | 0.15 | | | | 12/01/2035 | | | | 9,200,000 | | | | 9,200,000 | |
Orange County CA Apartment Development Authority Project Class A (Housing Revenue, FNMA Insured, FNMA LIQ) | | | 0.16 | | | | 12/15/2028 | | | | 6,070,000 | | | | 6,070,000 | |
Orange County CA Apartment Development Revenue Park Ridge Villas Project (Housing Revenue, FNMA Insured, FNMA LIQ) | | | 0.13 | | | | 11/15/2028 | | | | 4,000,000 | | | | 4,000,000 | |
Orange County CA Apartment Development Revenue Villas Aliento Series E Project (Housing Revenue, FNMA Insured, FNMA LIQ) | | | 0.15 | | | | 08/15/2028 | | | | 3,140,000 | | | | 3,140,000 | |
Petaluma CA CDS MFHR Oakmont at Petaluma Series A (Health Revenue, U.S. Bank NA LOC) | | | 0.24 | | | | 04/01/2026 | | | | 500,000 | | | | 500,000 | |
Rancho CA Water District Financing Authority Series B (Water & Sewer Revenue, U.S. Bank NA LOC) | | | 0.12 | | | | 08/15/2031 | | | | 7,000,000 | | | | 7,000,000 | |
Riverside CA COP Riverside Renaissance Project Series 2008 (Miscellaneous Revenue, Bank of America NA LOC) | | | 0.18 | | | | 03/01/2037 | | | | 17,000,000 | | | | 17,000,000 | |
Sacramento County CA Housing Authority Arlington Creek Apartment Series I (Housing Revenue, FNMA Insured, FNMA LIQ) | | | 0.15 | | | | 05/15/2034 | | | | 9,150,000 | | | | 9,150,000 | |
Sacramento County CA Housing Authority Logan Park Apartments Series E (Housing Revenue, FHLMC Insured, FHLMC LIQ) | | | 0.19 | | | | 05/01/2042 | | | | 10,000,000 | | | | 10,000,000 | |
Sacramento County CA Housing Authority MFHR Cascades Series D (Housing Revenue, FNMA Insured, FNMA LIQ) | | | 0.15 | | | | 09/15/2035 | | | | 6,535,000 | | | | 6,535,000 | |
Sacramento County CA Housing Authority MFHR Normandy Park Apartments Series A (Housing Revenue, FNMA Insured, FNMA LIQ) | | | 0.15 | | | | 02/15/2033 | | | | 6,000,000 | | | | 6,000,000 | |
Sacramento County CA Housing Authority River Series C (Housing Revenue, FNMA Insured, FNMA LIQ) | | | 0.13 | | | | 07/15/2029 | | | | 5,000,000 | | | | 5,000,000 | |
Sacramento County CA Housing Authority Seasons at Winter Series C2 (Housing Revenue, FHLMC Insured, FHLMC LIQ) | | | 0.17 | | | | 08/01/2034 | | | | 2,900,000 | | | | 2,900,000 | |
Sacramento County CA Housing Authority Shenandoah Apartments Series F (Housing Revenue, FNMA Insured, FNMA LIQ) | | | 0.16 | | | | 09/15/2036 | | | | 5,205,000 | | | | 5,205,000 | |
Sacramento County CA MUD Series L (Utilities Revenue, U.S. Bank NA LOC) | | | 0.14 | | | | 08/15/2041 | | | | 14,600,000 | | | | 14,600,000 | |
San Bernardino CA RDA Silver Woods Apartments Project (Housing Revenue, FNMA Insured, FNMA LIQ) | | | 0.21 | | | | 05/01/2026 | | | | 7,000,000 | | | | 7,000,000 | |
San Bernardino County CA MFHR Green Valley Apartments Project Series A (Housing Revenue, FNMA Insured, FNMA LIQ) | | | 0.21 | | | | 05/15/2029 | | | | 6,115,000 | | | | 6,115,000 | |
San Bernardino County CA Parkview Series A (Housing Revenue, FNMA Insured, FNMA LIQ) | | | 0.21 | | | | 02/15/2027 | | | | 1,500,000 | | | | 1,500,000 | |
San Diego CA Community Colledge District Royal Bank of Canada Municipal Products Incorporated Trust Certificates Series O-8 (GO, Royal Bank of Canada LIQ) 144A | | | 0.13 | | | | 08/01/2019 | | | | 4,100,000 | | | | 4,100,000 | |
San Diego County CA Burnham Institute (Miscellaneous Revenue, Bank of America NA LOC) | | | 0.23 | | | | 11/01/2030 | | | | 3,490,000 | | | | 3,490,000 | |
San Diego County CA Housing Authority Multi-Family Studio 15 Series B (Housing Revenue, Citibank NA LOC) | | | 0.19 | | | | 10/01/2039 | | | | 5,315,000 | | | | 5,315,000 | |
San Diego County CA Regional Transportation Community Limited Tax Series C (Tax Revenue, Mizuho Corporate Bank SPA) | | | 0.13 | | | | 04/01/2038 | | | | 46,230,000 | | | | 46,230,000 | |
San Diego County CA Water Authority COP Series 2873 (Water & Sewer Revenue, FSA Insured, JPMorgan Chase Bank LIQ) | | | 0.16 | | | | 05/01/2013 | | | | 1,545,000 | | | | 1,545,000 | |
San Francisco CA City & County Airports Commission Second Series 36C (Airport Revenue, U.S. Bank NA LOC) | | | 0.15 | | | | 05/01/2026 | | | | 14,070,000 | | | | 14,070,000 | |
The accompanying notes are an integral part of these financial statements.
| | | | | | |
| Portfolio of Investments—July 31, 2012 (Unaudited) | | Wells Fargo Advantage California Municipal Money Market Fund | | | 13 | |
| | | | | | | | | | | | | | | | |
| Security Name | | Interest Rate | | | Maturity Date | | | Principal | | | Value | |
| | | | | | | | | | | | | | | | |
| | | | |
| Variable Rate Demand Notes § (continued) | | | | | | | | | | | | | | | | |
San Francisco CA City & County Airports Commission Series 36-B (Airport Revenue, U.S. Bank NA LOC) | | | 0.15 | % | | | 05/01/2026 | | | $ | 12,310,000 | | | $ | 12,310,000 | |
San Francisco CA City & County Public Utilities Commission JPMorgan Chase PUTTER/DRIVER Trust Series 4065Z (Water & Sewer Revenue, JPMorgan Chase Bank LIQ) 144A | | | 0.16 | | | | 11/01/2019 | | | | 5,950,000 | | | | 5,950,000 | |
San Francisco CA City & County Public Utilities Commission PFOTER PT-4723 (Water & Sewer Revenue) 144A | | | 0.23 | | | | 11/01/2036 | | | | 18,660,000 | | | | 18,660,000 | |
San Francisco CA City & County RDA Community Facilities District # 4 (Tax Revenue, Bank of America NA LOC) | | | 0.34 | | | | 08/01/2032 | | | | 2,640,000 | | | | 2,640,000 | |
San Francisco CA City & County RDA Community Facilities District Hunters Point Series A (Tax Revenue, JPMorgan Chase & Company LOC) | | | 0.19 | | | | 08/01/2036 | | | | 9,450,000 | | | | 9,450,000 | |
San Francisco CA City & County RDA Fillmore Center Series B1 (Housing Revenue, FHLMC Insured, FHLMC LIQ) | | | 0.16 | | | | 12/01/2017 | | | | 47,500,000 | | | | 47,500,000 | |
San Francisco CA City & County RDA Orlando Cepeda Place Series D (Housing Revenue, Citibank NA LOC) | | | 0.34 | | | | 11/01/2033 | | | | 8,025,000 | | | | 8,025,000 | |
San Jose CA MFHR Raintree Apartments Series A (Housing Revenue, FHLMC Insured, FHLMC LIQ) | | | 0.16 | | | | 02/01/2038 | | | | 10,600,000 | | | | 10,600,000 | |
San Jose CA Turnleaf Apartments Series A (Housing Revenue, FHLMC Insured, FHLMC LIQ) | | | 0.18 | | | | 06/01/2036 | | | | 4,230,000 | | | | 4,230,000 | |
San Leandro CA Carlton Plaza Series A (Housing Revenue, FNMA Insured, FNMA LIQ) | | | 0.19 | | | | 09/15/2032 | | | | 1,120,000 | | | | 1,120,000 | |
San Mateo County CA JPMorgan Chase PUTTER/DRIVER Trust Series 3903Z (Tax Revenue, NATL-RE Insured, JPMorgan Chase Bank LIQ) 144A | | | 0.16 | | | | 12/01/2027 | | | | 5,000,000 | | | | 5,000,000 | |
Santa Clara Valley CA Transportation Authority Measure A Project Series C (Tax Revenue, Sumitomo Mitsui Banking Corporation SPA) | | | 0.13 | | | | 04/01/2036 | | | | 13,785,000 | | | | 13,785,000 | |
Santa Clara Valley CA Transportation Authority Series A (Tax Revenue, State Street Bank & Trust Company SPA) | | | 0.10 | | | | 06/01/2026 | | | | 24,655,000 | | | | 24,655,000 | |
Santa Clara Valley CA Transportation Authority Series C (Tax Revenue, State Street Bank & Trust Company SPA) | | | 0.11 | | | | 06/01/2026 | | | | 12,150,000 | | | | 12,150,000 | |
Santa Rosa CA Alderbrook Heights Apartments (Housing Revenue, Exchange Bank LOC) | | | 0.20 | | | | 05/01/2040 | | | | 3,120,000 | | | | 3,120,000 | |
Sonoma County CA JPMorgan Chase PUTTER/DRIVER Trust Series 4000 (Miscellaneous Revenue) 144A | | | 0.18 | | | | 10/25/2012 | | | | 23,700,000 | | | | 23,700,000 | |
Southern California Public Power Authority Magnolia Power Project Series 2009-1-A (Utilities Revenue, U.S. Bank NA LOC) | | | 0.14 | | | | 07/01/2036 | | | | 18,315,000 | | | | 18,315,000 | |
Sweetwater CA Union High School District ROC RR-II-R-11484 (GO, FSA Insured, Citibank NA LIQ) | | | 0.35 | | | | 02/01/2013 | | | | 10,100,000 | | | | 10,100,000 | |
Tahoe Forest California Hospital District (Health Revenue, U.S. Bank NA LOC) | | | 0.16 | | | | 07/01/2033 | | | | 2,445,000 | | | | 2,445,000 | |
Upland CA Community RDA Sunset Ridge Apartments (Housing Revenue, East West Bank LOC) | | | 0.13 | | | | 08/01/2037 | | | | 18,000,000 | | | | 18,000,000 | |
Vallejo CA Housing Authority Multi-Family Mortgage Refunding (Housing Revenue, FNMA Insured, FNMA LIQ) | | | 0.19 | | | | 05/15/2022 | | | | 885,000 | | | | 885,000 | |
Whittier CA Health Facilities Presbyterian Intercommunity Project Series C (Health Revenue, U.S. Bank NA LOC) | | | 0.13 | | | | 06/01/2036 | | | | 900,000 | | | | 900,000 | |
Whittier CA Whittier College Series 2008 (Education Revenue, U.S. Bank NA LOC) | | | 0.15 | | | | 12/01/2038 | | | | 7,515,000 | | | | 7,515,000 | |
| | | | |
| | | | | | | | | | | | | | | 1,783,047,423 | |
| | | | | | | | | | | | | | | | |
The accompanying notes are an integral part of these financial statements.
| | | | |
| 14 | | Wells Fargo Advantage California Municipal Money Market Fund | | Portfolio of Investments—July 31, 2012 (Unaudited) |
| | | | | | | | | | | | | | | | |
| Security Name | | Interest Rate | | | Maturity Date | | | Principal | | | Value | |
| | | | | | | | | | | | | | | | |
| | | | |
Other : 0.64% | | | | | | | | | | | | | | | | |
| | | | |
| Variable Rate Demand Notes §: 0.64% | | | | | | | | | | | | | | | | |
FHLMC Multi-Family Certificates (Housing Revenue) | | | 0.21 | % | | | 11/15/2034 | | | $ | 10,105,995 | | | $ | 10,105,995 | |
FHLMC Multi-Family Certificates (Housing Revenue) | | | 0.21 | | | | 08/15/2045 | | | | 2,043,191 | | | | 2,043,191 | |
| | | | |
| | | | | | | | | | | | | | | 12,149,186 | |
| | | | | | | | | | | | | | | | |
| | | | |
Puerto Rico : 3.33% | | | | | | | | | | | | | | | | |
| | | | |
| Variable Rate Demand Notes §: 3.33% | | | | | | | | | | | | | | | | |
Puerto Rico Commonwealth Highway & Transportation Authority Series 2148 (Transportation Revenue, AGC-ICC, CIFG Insured, Morgan Stanley Bank LIQ) | | | 0.23 | | | | 07/01/2041 | | | | 26,760,000 | | | | 26,760,000 | |
Puerto Rico Commonwealth Highway & Transportation Authority Series A (Tax Revenue, Bank of Nova Scotia LOC) | | | 0.12 | | | | 07/01/2028 | | | | 10,000,000 | | | | 10,000,000 | |
Puerto Rico Sales Tax Financing Corporation ROC RR-II-R-11763 (Tax Revenue, Citibank NA LIQ) 144A | | | 0.17 | | | | 12/01/2047 | | | | 12,750,000 | | | | 12,750,000 | |
Puerto Rico Sales Tax Financing Corporation ROC RR-II-R-11851 (Tax Revenue, BHAC-CR, FGIC Insured, Citibank NA LIQ) 144A | | | 0.17 | | | | 02/01/2016 | | | | 7,500,000 | | | | 7,500,000 | |
Puerto Rico Sales Tax Financing Corporation Series 3033 (Tax Revenue, Credit Suisse Bank LIQ) 144A | | | 0.17 | | | | 08/01/2057 | | | | 6,190,500 | | | | 6,190,500 | |
| | | | |
| | | | | | | | | | | | | | | 63,200,500 | |
| | | | | | | | | | | | | | | | |
| | | | |
Total Municipal Obligations (Cost $1,899,377,467) | | | | | | | | | | | | | | | 1,899,377,467 | |
| | | | | | | | | | | | | | | | |
| | | | | | | | |
| Total Investments in Securities | | | | | | | | |
| (Cost $1,899,377,467)* | | | 99.94 | % | | | 1,899,377,467 | |
Other Assets and Liabilities, Net | | | 0.06 | | | | 1,215,552 | |
| | | | | | | | |
| Total Net Assets | | | 100.00 | % | | $ | 1,900,593,019 | |
| | | | | | | | |
| § | These securities are subject to a demand feature which reduces the effective maturity. |
144A Security that may be resold to “qualified institutional buyers” under Rule 144A or security offered pursuant to Section 4(2) of the Securities Act of 1933, as amended.
| * | Cost for federal income tax purposes is substantially the same as for financial reporting purposes. |
The accompanying notes are an integral part of these financial statements.
| | | | | | |
| Statement of Assets and Liabilities—July 31, 2012 (Unaudited) | | Wells Fargo Advantage California Municipal Money Market Fund | | | 15 | |
| | | | |
| | | | |
| |
Assets | | | | |
Investments in unaffiliated securities, at amortized cost | | $ | 1,899,377,467 | |
Cash | | | 1,471 | |
Receivable for investments sold | | | 1,000,000 | |
Receivable for Fund shares sold | | | 120 | |
Receivable for interest | | | 564,760 | |
Receivable from adviser | | | 435,402 | |
| | | | |
Total assets | | | 1,901,379,220 | |
| | | | |
| |
Liabilities | | | | |
Dividends payable | | | 7,628 | |
Payable for Fund shares redeemed | | | 30 | |
Distribution fees payable | | | 29,857 | |
Due to other related parties | | | 365,469 | |
Shareholder servicing fees payable | | | 265,193 | |
Accrued expenses and other liabilities | | | 118,024 | |
| | | | |
Total liabilities | | | 786,201 | |
| | | | |
Total net assets | | $ | 1,900,593,019 | |
| | | | |
| |
NET ASSETS CONSIST OF | | | | |
Paid-in capital | | $ | 1,900,508,984 | |
Overdistributed net investment income | | | (152 | ) |
Accumulated net realized gains on investments | | | 84,187 | |
| | | | |
Total net assets | | $ | 1,900,593,019 | |
| | | | |
| |
COMPUTATION OF NET ASSET VALUE PER SHARE1 | | | | |
Net assets – Class A | | $ | 993,254,543 | |
Shares outstanding – Class A | | | 993,216,159 | |
Net asset value per share – Class A | | | $1.00 | |
Net assets – Administrator Class | | $ | 100,042 | |
Shares outstanding – Administrator Class | | | 100,038 | |
Net asset value per share – Administrator Class | | | $1.00 | |
Net assets – Institutional Class | | $ | 715,462,025 | |
Shares outstanding – Institutional Class | | | 715,417,270 | |
Net asset value per share – Institutional Class | | | $1.00 | |
Net assets – Service Class | | $ | 98,478,610 | |
Shares outstanding – Service Class | | | 98,476,667 | |
Net asset value per share – Service Class | | | $1.00 | |
Net assets – Sweep Class | | $ | 93,297,799 | |
Shares outstanding – Sweep Class | | | 93,287,381 | |
Net asset value per share – Sweep Class | | | $1.00 | |
| 1. | The Fund has an unlimited number of authorized shares. |
The accompanying notes are an integral part of these financial statements.
| | | | |
| 16 | | Wells Fargo Advantage California Municipal Money Market Fund | | Statement of Operations—Six Months Ended July 31, 2012 (Unaudited) |
| | | | |
| | | | |
| |
Investment income | | | | |
Interest | | $ | 1,841,727 | |
| | | | |
| |
Expenses | | | | |
Advisory fee | | | 1,012,735 | |
Administration fees | | | | |
Fund level | | | 506,367 | |
Class A | | | 1,138,548 | |
Administrator Class | | | 49 | |
Institutional Class | | | 312,441 | |
Service Class | | | 62,329 | |
Sweep Class | | | 115,912 | |
Shareholder servicing fees | | | | |
Class A | | | 1,291,153 | |
Administrator Class | | | 49 | |
Service Class | | | 127,412 | |
Sweep Class | | | 131,718 | |
Distribution fees | | | | |
Sweep Class | | | 184,404 | |
Custody and accounting fees | | | 56,167 | |
Professional fees | | | 15,992 | |
Registration fees | | | 8,843 | |
Shareholder report expenses | | | 28,112 | |
Trustees’ fees and expenses | | | 4,841 | |
Other fees and expenses | | | 44,545 | |
| | | | |
Total expenses | | | 5,041,617 | |
Less: Fee waivers and/or expense reimbursements | | | (3,325,596 | ) |
| | | | |
Net expenses | | | 1,716,021 | |
| | | | |
Net investment income | | | 125,706 | |
| | | | |
Net realized gains on investments | | | 81,385 | |
| | | | |
Net increase in net assets resulting from operations | | $ | 207,091 | |
| | | | |
The accompanying notes are an integral part of these financial statements.
| | | | | | |
| Statement of Changes in Net Assets | | Wells Fargo Advantage California Municipal Money Market Fund | | | 17 | |
| | | | | | | | | | | | | | | | |
| | | Six Months Ended July 31, 2012 (Unaudited) | | | Year Ended January 31, 2012 | |
| | | | |
Operations | | | | | | | | | | | | | | | | |
Net investment income | | | | | | $ | 125,706 | | | | | | | $ | 358,514 | |
Net realized gains on investments | | | | | | | 81,385 | | | | | | | | 147,183 | |
| | | | | | | | | | | | | | | | |
Net increase in net assets resulting from operations | | | | | | | 207,091 | | | | | | | | 505,697 | |
| | | | | | | | | | | | | | | | |
| | | | |
Distributions to shareholders from | | | | | | | | | | | | | | | | |
Net investment income | | | | | | | | | | | | | | | | |
Class A | | | | | | | (51,893 | ) | | | | | | | (130,513 | ) |
Administrator Class | | | | | | | (5 | ) | | | | | | | (11 | ) |
Institutional Class | | | | | | | (63,316 | ) | | | | | | | (190,269 | ) |
Service Class | | | | | | | (5,209 | ) | | | | | | | (10,885 | ) |
Sweep Class | | | | | | | (5,283 | ) | | | | | | | (26,836 | ) |
Net realized gains | | | | | | | | | | | | | | | | |
Class A | | | | | | | 0 | | | | | | | | (67,718 | ) |
Administrator Class | | | | | | | 0 | | | | | | | | (6 | ) |
Institutional Class | | | | | | | 0 | | | | | | | | (50,466 | ) |
Service Class | | | | | | | 0 | | | | | | | | (6,958 | ) |
Sweep Class | | | | | | | 0 | | | | | | | | (8,645 | ) |
| | | | | | | | | | | | | | | | |
Total distributions to shareholders | | | | | | | (125,706 | ) | | | | | | | (492,307 | ) |
| | | | | | | | | | | | | | | | |
| | | | |
| | | Shares | | | | | | | | Shares | | | | | |
| | | | |
Capital share transactions | | | | | | | | | | | | | | | | |
Proceeds from shares sold | | | | | | | | | | | | | | | | |
Class A | | | 550,837,566 | | | | 550,837,566 | | | | 1,829,259,476 | | | | 1,829,259,476 | |
Institutional Class | | | 943,727,110 | | | | 943,727,110 | | | | 2,448,893,444 | | | | 2,448,893,444 | |
Service Class | | | 68,631,316 | | | | 68,631,316 | | | | 133,322,261 | | | | 133,322,261 | |
Sweep Class | | | 897,014 | | | | 897,014 | | | | 607,512,369 | | | | 607,512,369 | |
| | | | | | | | | | | | | | | | |
| | | | | | | 1,564,093,006 | | | | | | | | 5,018,987,550 | |
| | | | | | | | | | | | | | | | |
Reinvestment of distributions | | | | | | | | | | | | | | | | |
Class A | | | 49,018 | | | | 49,018 | | | | 187,924 | | | | 187,924 | |
Administrator Class | | | 5 | | | | 5 | | | | 17 | | | | 17 | |
Institutional Class | | | 8,827 | | | | 8,827 | | | | 29,683 | | | | 29,683 | |
Service Class | | | 2,902 | | | | 2,902 | | | | 10,362 | | | | 10,362 | |
Sweep Class | | | 5,283 | | | | 5,283 | | | | 35,481 | | | | 35,481 | |
| | | | | | | | | | | | | | | | |
| | | | | | | 66,035 | | | | | | | | 263,467 | |
| | | | | | | | | | | | | | | | |
Payment for shares redeemed | | | | | | | | | | | | | | | | |
Class A | | | (685,995,099 | ) | | | (685,995,099 | ) | | | (2,188,008,598 | ) | | | (2,188,008,598 | ) |
Institutional Class | | | (1,113,097,949 | ) | | | (1,113,097,949 | ) | | | (2,395,240,429 | ) | | | (2,395,240,429 | ) |
Service Class | | | (76,388,998 | ) | | | (76,388,998 | ) | | | (128,403,873 | ) | | | (128,403,873 | ) |
Sweep Class | | | (28,517,103 | ) | | | (28,517,103 | ) | | | (889,485,688 | ) | | | (889,485,688 | ) |
| | | | | | | | | | | | | | | | |
| | | | | | | (1,903,999,149 | ) | | | | | | | (5,601,138,588 | ) |
| | | | | | | | | | | | | | | | |
Net decrease in net assets resulting from capital
share transactions | | | | | | | (339,840,108 | ) | | | | | | | (581,887,571 | ) |
| | | | | | | | | | | | | | | | |
Total decrease in net assets | | | | | | | (339,758,723 | ) | | | | | | | (581,874,181 | ) |
| | | | | | | | | | | | | | | | |
| | | | |
Net assets | | | | | | | | | | | | | | | | |
Beginning of period | | | | | | | 2,240,351,742 | | | | | | | | 2,822,225,923 | |
| | | | | | | | | | | | | | | | |
End of period | | | | | | $ | 1,900,593,019 | | | | | | | $ | 2,240,351,742 | |
| | | | | | | | | | | | | | | | |
Overdistributed net investment income | | | | | | $ | (152 | ) | | | | | | $ | (152 | ) |
| | | | | | | | | | | | | | | | |
The accompanying notes are an integral part of these financial statements.
| | | | |
| 18 | | Wells Fargo Advantage California Municipal Money Market Fund | | Financial Highlights |
(For a share outstanding throughout each period)
| | | | | | | | | | | | | | | | | | | | | | | | | | | | |
| | | Six Months Ended
July 31, 2012
(Unaudited) | | | Year Ended January 31, | | | Year Ended February 28, | |
| Class A | | | 2012 | | | 20111 | | | 2010 | | | 2009 | | | 20082 | | | 2007 | |
Net asset value, beginning of period | | | $1.00 | | | | $1.00 | | | | $1.00 | | | | $1.00 | | | | $1.00 | | | | $1.00 | | | | $1.00 | |
Net investment income | | | 0.00 | 3 | | | 0.00 | 3 | | | 0.00 | 3 | | | 0.00 | 3 | | | 0.01 | | | | 0.03 | | | | 0.03 | |
Net realized gains (losses) on investments | | | 0.00 | 3 | | | 0.00 | 3 | | | 0.00 | | | | (0.00 | ) | | | 0.00 | 3 | | | 0.00 | | | | 0.00 | |
| | | | | | | | | | | | | | | | | | | | | | | | | | | | |
Total from investment operations | | | 0.00 | 3 | | | 0.00 | 3 | | | 0.00 | 3 | | | 0.00 | 3 | | | 0.01 | | | | 0.03 | | | | 0.03 | |
Distributions to shareholders from | | | | | | | | | | | | | | | | | | | | | | | | | | | | |
Net investment income | | | (0.00 | )3 | | | (0.00 | )3 | | | (0.00 | )3 | | | (0.00 | )3 | | | (0.01 | ) | | | (0.03 | ) | | | (0.03 | ) |
Net realized gains | | | 0.00 | | | | (0.00 | )3 | | | 0.00 | | | | (0.00 | )3 | | | (0.00 | )3 | | | 0.00 | | | | 0.00 | |
| | | | | | | | | | | | | | | | | | | | | | | | | | | | |
Total distributions to shareholders | | | (0.00 | )3 | | | (0.00 | )3 | | | (0.00 | )3 | | | (0.00 | )3 | | | (0.01 | ) | | | (0.03 | ) | | | (0.03 | ) |
Net asset value, end of period | | | $1.00 | | | | $1.00 | | | | $1.00 | | | | $1.00 | | | | $1.00 | | | | $1.00 | | | | $1.00 | |
Total return4 | | | 0.00 | % | | | 0.02 | % | | | 0.01 | % | | | 0.02 | % | | | 1.22 | % | | | 2.85 | % | | | 2.85 | % |
Ratios to average net assets (annualized) | | | | | | | | | | | | | | | | | | | | | | | | | | | | |
Gross expenses | | | 0.64 | % | | | 0.63 | % | | | 0.69 | % | | | 0.87 | % | | | 0.85 | % | | | 0.83 | % | | | 0.84 | % |
Net expenses | | | 0.17 | % | | | 0.16 | % | | | 0.32 | % | | | 0.44 | % | | | 0.66 | % | | | 0.65 | % | | | 0.65 | % |
Net investment income | | | 0.01 | % | | | 0.01 | % | | | 0.01 | % | | | 0.01 | % | | | 1.19 | % | | | 2.79 | % | | | 2.81 | % |
Supplemental data | | | | | | | | | | | | | | | | | | | | | | | | | | | | |
Net assets, end of period (000’s omitted) | | $ | 993,255 | | | $ | 1,128,321 | | | $ | 1,486,876 | | | $ | 1,948,313 | | | $ | 3,291,922 | | | $ | 3,837,463 | | | $ | 3,064,445 | |
| 1. | For the eleven months ended January 31, 2011. The Fund changed its fiscal year end from February 28 to January 31, effective January 31, 2011. |
| 2. | Year ended February 29. |
| 3. | Amount is less than $0.005. |
| 4. | Returns for periods of less than one year are not annualized. |
The accompanying notes are an integral part of these financial statements.
| | | | | | |
| Financial Highlights | | Wells Fargo Advantage California Municipal Money Market Fund | | | 19 | |
(For a share outstanding throughout each period)
| | | | | | | | | | | | |
| | | Six Months Ended
July 31, 2012 (Unaudited) | | | Year Ended January 31, | |
| Administrator Class | | | 2012 | | | 20111 | |
Net asset value, beginning of period | | $ | 1.00 | | | $ | 1.00 | | | $ | 1.00 | |
Net investment income | | | 0.00 | 2 | | | 0.00 | 2 | | | 0.00 | 2 |
Net realized gains on investments | | | 0.00 | 2 | | | 0.00 | 2 | | | 0.00 | |
| | | | | | | | | | | | |
Total from investment operations | | | 0.00 | 2 | | | 0.00 | 2 | | | 0.00 | 2 |
Distributions to shareholders from | | | | | | | | | | | | |
Net investment income | | | (0.00 | )2 | | | (0.00 | )2 | | | (0.00 | )2 |
Net realized gains | | | 0.00 | | | | (0.00 | )2 | | | 0.00 | |
| | | | | | | | | | | | |
Total distributions to shareholders | | | (0.00 | )2 | | | (0.00 | )2 | | | (0.00 | )2 |
Net asset value, end of period | | $ | 1.00 | | | $ | 1.00 | | | $ | 1.00 | |
Total return3 | | | 0.01 | % | | | 0.02 | % | | | 0.01 | % |
Ratios to average net assets (annualized) | | | | | | | | | | | | |
Gross expenses | | | 0.36 | % | | | 0.36 | % | | | 0.37 | % |
Net expenses | | | 0.17 | % | | | 0.15 | % | | | 0.30 | % |
Net investment income | | | 0.01 | % | | | 0.01 | % | | | 0.03 | % |
Supplemental data | | | | | | | | | | | | |
Net assets, end of period (000’s omitted) | | | $100 | | | | $100 | | | | $100 | |
| 1. | For the period from June 30, 2010 (commencement of class operations) to January 31, 2011. |
| 2. | Amount is less than $0.005. |
| 3. | Returns for periods of less than one year are not annualized. |
The accompanying notes are an integral part of these financial statements.
| | | | |
| 20 | | Wells Fargo Advantage California Municipal Money Market Fund | | Financial Highlights |
(For a share outstanding throughout each period)
| | | | | | | | | | | | | | | | | | | | |
| Institutional Class | | Six Months Ended
July 31, 2012 (Unaudited) | | | Year Ended January 31, | | | Year Ended February 28, | |
| | | 2012 | | | 20111 | | | 2010 | | | 20092 | |
Net asset value, beginning of period | | | $1.00 | | | | $1.00 | | | | $1.00 | | | | $1.00 | | | | $1.00 | |
Net investment income | | | 0.00 | 3 | | | 0.00 | 3 | | | 0.00 | 3 | | | 0.00 | 3 | | | 0.01 | |
Net realized gains on investments | | | 0.00 | 3 | | | 0.00 | 3 | | | 0.00 | | | | (0.00 | ) | | | 0.00 | 3 |
| | | | | | | | | | | | | | | | | | | | |
Total from investment operations | | | 0.00 | 3 | | | 0.00 | 3 | | | 0.00 | 3 | | | 0.00 | 3 | | | 0.01 | |
Distributions to shareholders from | | | | | | | | | | | | | | | | | | | | |
Net investment income | | | (0.00 | )3 | | | (0.00 | )3 | | | (0.00 | )3 | | | (0.00 | )3 | | | (0.01 | ) |
Net realized gains | | | 0.00 | | | | (0.00 | )3 | | | 0.00 | | | | (0.00 | )3 | | | (0.00 | )3 |
| | | | | | | | | | | | | | | | | | | | |
Total distributions to shareholders | | | (0.00 | )3 | | | (0.00 | )3 | | | (0.00 | )3 | | | (0.00 | )3 | | | (0.01 | ) |
Net asset value, end of period | | | $1.00 | | | | $1.00 | | | | $1.00 | | | | $1.00 | | | | $1.00 | |
Total return4 | | | 0.01 | % | | | 0.03 | % | | | 0.12 | % | | | 0.20 | % | | | 1.47 | % |
Ratios to average net assets (annualized) | | | | | | | | | | | | | | | | | | | | |
Gross expenses | | | 0.25 | % | | | 0.24 | % | | | 0.28 | % | | | 0.48 | % | | | 0.46 | % |
Net expenses | | | 0.16 | % | | | 0.14 | % | | | 0.20 | % | | | 0.24 | % | | | 0.22 | % |
Net investment income | | | 0.02 | % | | | 0.02 | % | | | 0.12 | % | | | 0.23 | % | | | 1.59 | % |
Supplemental data | | | | | | | | | | | | | | | | | | | | |
Net assets, end of period (000’s omitted) | | $ | 715,462 | | | $ | 884,793 | | | $ | 831,108 | | | $ | 236,353 | | | $ | 370,572 | |
| 1. | For the eleven months ended January 31, 2011. The Fund changed its fiscal year end from February 28 to January 31, effective January 31, 2011. |
| 2. | For the period from March 31, 2008 (commencement of class operations) to February 28, 2009. |
| 3. | Amount is less than $0.005. |
| 4. | Returns for periods of less than one year are not annualized. |
The accompanying notes are an integral part of these financial statements.
| | | | | | |
| Financial Highlights | | Wells Fargo Advantage California Municipal Money Market Fund | | | 21 | |
(For a share outstanding throughout each period)
| | | | | | | | | | | | | | | | | | | | | | | | | | | | |
| | | Six Months Ended
July 31, 2012
(Unaudited) | | | Year Ended January 31, | | | Year Ended February 28, | |
| Service Class | | | 2012 | | | 20111 | | | 2010 | | | 2009 | | | 20082 | | | 2007 | |
Net asset value, beginning of period | | | $1.00 | | | | $1.00 | | | | $1.00 | | | | $1.00 | | | | $1.00 | | | | $1.00 | | | | $1.00 | |
Net investment income | | | 0.00 | 3 | | | 0.00 | 3 | | | 0.00 | 3 | | | 0.00 | 3 | | | 0.01 | | | | 0.03 | | | | 0.03 | |
Net realized gains (losses) on investments | | | 0.00 | 3 | | | 0.00 | 3 | | | 0.00 | | | | (0.00 | ) | | | 0.00 | 3 | | | 0.00 | | | | 0.00 | |
| | | | | | | | | | | | | | | | | | | | | | | | | | | | |
Total from investment operations | | | 0.00 | 3 | | | 0.00 | 3 | | | 0.00 | 3 | | | 0.00 | 3 | | | 0.01 | | | | 0.03 | | | | 0.03 | |
Distributions to shareholders from | | | | | | | | | | | | | | | | | | | | | | | | | | | | |
Net investment income | | | (0.00 | )3 | | | (0.00 | )3 | | | (0.00 | )3 | | | (0.00 | )3 | | | (0.01 | ) | | | (0.03 | ) | | | (0.03 | ) |
Net realized gains | | | 0.00 | | | | (0.00 | )3 | | | 0.00 | | | | (0.00 | )3 | | | (0.00 | )3 | | | 0.00 | | | | 0.00 | |
| | | | | | | | | | | | | | | | | | | | | | | | | | | | |
Total distributions to shareholders | | | (0.00 | )3 | | | (0.00 | )3 | | | (0.00 | )3 | | | (0.00 | )3 | | | (0.01 | ) | | | (0.03 | ) | | | (0.03 | ) |
Net asset value, end of period | | | $1.00 | | | | $1.00 | | | | $1.00 | | | | $1.00 | | | | $1.00 | | | | $1.00 | | | | $1.00 | |
Total return4 | | | 0.00 | % | | | 0.02 | % | | | 0.01 | % | | | 0.06 | % | | | 1.42 | % | | | 3.05 | % | | | 3.06 | % |
Ratios to average net assets (annualized) | | | | | | | | | | | | | | | | | | | | | | | | | | | | |
Gross expenses | | | 0.53 | % | | | 0.53 | % | | | 0.62 | % | | | 0.77 | % | | | 0.75 | % | | | 0.73 | % | | | 0.73 | % |
Net expenses | | | 0.17 | % | | | 0.15 | % | | | 0.32 | % | | | 0.38 | % | | | 0.47 | % | | | 0.45 | % | | | 0.45 | % |
Net investment income | | | 0.01 | % | | | 0.01 | % | | | 0.01 | % | | | 0.07 | % | | | 1.43 | % | | | 2.94 | % | | | 3.01 | % |
Supplemental data | | | | | | | | | | | | | | | | | | | | | | | | | | | | |
Net assets, end of period (000’s omitted) | | | $98,479 | | | | $106,229 | | | | $101,301 | | | | $397,508 | | | | $709,029 | | | | $970,945 | | | | $500,024 | |
| 1. | For the eleven months ended January 31, 2011. The Fund changed its fiscal year end from February 28 to January 31, effective January 31, 2011. |
| 2. | Year ended February 29. |
| 3. | Amount is less than $0.005. |
| 4. | Returns for periods of less than one year are not annualized. |
The accompanying notes are an integral part of these financial statements.
| | | | |
| 22 | | Wells Fargo Advantage California Municipal Money Market Fund | | Financial Highlights |
(For a share outstanding throughout each period)
| | | | | | | | | | | | |
| | | Six Months Ended
July 31, 2012 (Unaudited) | | | Year Ended January 31, | |
| Sweep Class | | | 2012 | | | 20111 | |
Net asset value, beginning of period | | | $1.00 | | | | $1.00 | | | | $1.00 | |
Net investment income | | | 0.00 | 2 | | | 0.00 | 2 | | | 0.00 | 2 |
Net realized gains on investments | | | 0.00 | 2 | | | 0.00 | 2 | | | 0.00 | |
| | | | | | | | | | | | |
Total from investment operations | | | 0.00 | 2 | | | 0.00 | 2 | | | 0.00 | 2 |
Distributions to shareholders from | | | | | | | | | | | | |
Net investment income | | | (0.00 | )2 | | | (0.00 | )2 | | | (0.00 | )2 |
Net realized gains | | | 0.00 | | | | (0.00 | )2 | | | 0.00 | |
| | | | | | | | | | | | |
Total distributions to shareholders | | | (0.00 | )2 | | | (0.00 | )2 | | | (0.00 | )2 |
Net asset value, end of period | | | $1.00 | | | | $1.00 | | | | $1.00 | |
Total return3 | | | 0.00 | % | | | 0.02 | % | | | 0.01 | % |
Ratios to average net assets (annualized) | | | | | | | | | | | | |
Gross expenses | | | 0.99 | % | | | 0.98 | % | | | 0.98 | % |
Net expenses | | | 0.17 | % | | | 0.17 | % | | | 0.29 | % |
Net investment income | | | 0.01 | % | | | 0.01 | % | | | 0.01 | % |
Supplemental data | | | | | | | | | | | | |
Net assets, end of period (000’s omitted) | | $ | 93,298 | | | $ | 120,909 | | | $ | 402,840 | |
| 1. | For the period from June 30, 2010 (commencement of class operations) to January 31, 2011. |
| 2. | Amount is less than $0.005. |
| 3. | Returns for periods of less than one year are not annualized. |
The accompanying notes are an integral part of these financial statements.
| | | | | | |
| Notes to Financial Statements (Unaudited) | | Wells Fargo Advantage California Municipal Money Market Fund | | | 23 | |
1. ORGANIZATION
Wells Fargo Funds Trust (the “Trust”), a Delaware statutory trust organized on March 10, 1999, is an open-end management investment company registered under the Investment Company Act of 1940, as amended (the “1940 Act”). These financial statements report on Wells Fargo Advantage California Municipal Money Market Fund (the “Fund”) which is a diversified series of the Trust.
2. SIGNIFICANT ACCOUNTING POLICIES
The following significant accounting policies, which are consistently followed in the preparation of the financial statements of the Fund, are in conformity with U.S. generally accepted accounting principles which require management to make estimates and assumptions that affect the reported amounts of assets and liabilities, disclosure of contingent assets and liabilities at the date of the financial statements, and the reported amounts of revenues and expenses during the reporting period. Actual results could differ from those estimates.
Securities valuation
As permitted under Rule 2a-7 of the 1940 Act, portfolio securities are valued at amortized cost, which approximates fair value. The amortized cost method involves valuing a security at its cost, plus accretion of discount or minus amortization of premium over the period until maturity.
Investments which are not valued using the method discussed above are valued at their fair value, as determined by procedures established in good faith and approved by the Board of Trustees. The Board of Trustees has established a Valuation Committee comprised of the Trustees and has delegated to it the authority to take any actions regarding the valuation of portfolio securities that the Valuation Committee deems necessary in determining the fair value of portfolio securities, unless the responsibility has been delegated to the Management Valuation Team of Wells Fargo Funds Management, LLC (“Funds Management”). The Board of Trustees retains the authority to make or ratify any valuation decisions or approve any changes to the Valuation Procedures as it deems appropriate. On a quarterly basis, the Board of Trustees considers for ratification any valuation actions taken by the Valuation Committee or the Management Valuation Team.
Valuations of fair valued securities are compared to the next actual sales price when available, or other appropriate market information to assess the continued appropriateness of the fair valuation methodology used. These securities are fair valued on a day-to-day basis, taking into consideration changes to appropriate market information and any significant changes to the input factors considered in the valuation process until there is a readily available price provided on the exchange or by an independent pricing service. Valuations received from an independent pricing service or broker quotes are periodically validated by comparisons to most recent trades and valuations provided by other independent pricing services in addition to the review of prices by the adviser and/or sub-adviser. Unobservable inputs used in determining fair valuations are identified based on the type of security, taking into consideration factors utilized by market participants in valuing the investment, knowledge about the issuer and the current market environment.
Security transactions and income recognition
Securities transactions are recorded on a trade date basis. Realized gains or losses are reported on the basis of identified cost of securities delivered.
Interest income is accrued daily and bond discounts are accreted and premiums are amortized daily based on the effective interest method. To the extent debt obligations are placed on non-accrual status, any related interest income may be reduced by writing off interest receivables when the collection of all or a portion of interest has become doubtful based on consistently applied procedures. If the issuer subsequently resumes interest payments or when the collectability of interest is reasonably assured, the debt obligation is removed from non-accrual status.
Distributions to shareholders
Distributions to shareholders from net investment income are accrued daily and paid monthly. Distributions from net realized gains, if any, are recorded on the ex-dividend date. Such distributions are determined in conformity with income tax regulations, which may differ from generally accepted accounting principles.
Federal and other taxes
The Fund intends to continue to qualify as a regulated investment company by distributing substantially all of its
| | | | |
| 24 | | Wells Fargo Advantage California Municipal Money Market Fund | | Notes to Financial Statements (Unaudited) |
investment company taxable and tax-exempt income and any net realized capital gains (after reduction for capital loss carryforwards) sufficient to relieve it from all, or substantially all, federal income taxes. Accordingly, no provision for federal income taxes was required.
The Fund’s income and federal excise tax returns and all financial records supporting those returns for the prior three fiscal years are subject to examination by the federal and Delaware revenue authorities. Management has analyzed the Fund’s tax positions taken on federal, state, and foreign tax returns for all open tax years and does not believe that there are any uncertain tax positions that require recognition of a tax liability.
Class allocations
The separate classes of shares offered by the Fund differ principally in distribution, shareholder servicing and administration fees. Shareholders of each class bear certain expenses that pertain to that particular class. All shareholders bear the common expenses of the Fund, earn income from the portfolio, and are allocated any unrealized gains and losses pro rata based on the average daily net assets of each class, without distinction between share classes. Dividends are determined separately for each class based on income and expenses allocable to each class. Realized gains and losses are allocated to each class pro rata based upon the net assets of each class on the date realized. Differences in per share dividend rates generally result from the relative weightings of pro rata income and realized gain allocations and from differences in separate class expenses, including distribution, shareholder servicing and administration fees.
3. FAIR VALUATION MEASUREMENTS
Fair value measurements of investments are determined within a framework that has established a fair value hierarchy based upon the various data inputs utilized in determining the value of the Fund’s investments. The three-level hierarchy gives the highest priority to unadjusted quoted prices in active markets for identical assets or liabilities (Level 1) and the lowest priority to significant unobservable inputs (Level 3). The Fund’s investments are classified within the fair value hierarchy based on the lowest level of input that is significant to the fair value measurement. The inputs are summarized into three broad levels as follows:
| n | | Level 1 – quoted prices in active markets for identical securities |
| n | | Level 2 – other significant observable inputs (including quoted prices for similar securities, interest rates, prepayment speeds, credit risk, etc.) |
| n | | Level 3 – significant unobservable inputs (including the Fund’s own assumptions in determining the fair value of investments) |
The inputs or methodologies used for valuing securities are not necessarily an indication of the risk associated with investing in those securities.
At July 31, 2012, all of the Fund’s investments in securities carried at fair value were designated as Level 2 since the primary inputs include credit quality of the issuer and short-term interest rates which are observable.
Further details on the major security types can be found in the Portfolio of Investments.
Transfers in and transfers out are recognized at the end of the reporting period. For the six months ended July 31, 2012, the Fund did not have any transfers into/out of Level 1 and Level 2.
4. TRANSACTIONS WITH AFFILIATES AND OTHER EXPENSES
Advisory fee
The Trust has entered into an advisory contract with Funds Management, an indirect wholly owned subsidiary of Wells Fargo & Company (“Wells Fargo”). The adviser is responsible for implementing investment policies and guidelines and for supervising the sub-adviser, who is responsible for day-to-day portfolio management of the Fund.
Pursuant to the contract, Funds Management is entitled to receive an annual advisory fee of 0.10% of the average daily net assets of the Fund.
Funds Management has retained the services of a sub-adviser to provide daily portfolio management to the Fund. The fee for sub-advisory services is borne by Funds Management. Wells Capital Management Incorporated, an affiliate of
| | | | | | |
| Notes to Financial Statements (Unaudited) | | Wells Fargo Advantage California Municipal Money Market Fund | | | 25 | |
Funds Management, is the sub-adviser to the Fund and is entitled to receive a fee from Funds Management at an annual rate starting at 0.05% and declining to 0.01% as the average daily net assets of the Fund increase.
Administration and transfer agent fees
The Trust has entered into an administration agreement with Funds Management. Under this agreement, for providing administrative services, which includes paying fees and expenses for services provided by the transfer agent, sub-transfer agents, omnibus account servicers and record-keepers, Funds Management is entitled to receive from the Fund an annual fund level administration fee starting at 0.05% and declining to 0.03% as the average daily net assets of the Fund increase and a class level administration fee which is calculated based on the average daily net assets of each class as follows:
| | | | |
| | | Class Level Administration Fee | |
Class A, Sweep Class | | | 0.22 | % |
Administrator Class | | | 0.10 | |
Institutional Class | | | 0.08 | |
Service Class | | | 0.12 | |
Funds Management has contractually waived and/or reimbursed advisory and administration fees to the extent necessary to maintain certain net operating expense ratios for the Fund. Waiver of fees and/or reimbursement of expenses by Funds Management were made first from fund level expenses on a proportionate basis and then from class specific expenses. Funds Management has committed through July 11, 2013 to waive fees and/or reimburse expenses to the extent necessary to cap the Fund’s expenses at 0.65% for Class A, 0.30% for Administrator Class, 0.20% for Institutional Class, 0.45% for Service Class and 1.00% for Sweep Class.
Distribution fees
The Trust has adopted a Distribution Plan for Sweep Class shares of the Fund pursuant to Rule 12b-1 under the 1940 Act. Distribution fees are charged to Sweep Class shares and paid to Wells Fargo Funds Distributor, LLC, the principal underwriter, at an annual rate of 0.35% of its average daily net assets.
Shareholder servicing fees
The Trust has entered into contracts with one or more shareholder servicing agents, whereby Class A, Service Class and Sweep Class of the Fund is charged a fee at an annual rate of 0.25% of the respective average daily net assets of each class. Administrator Class is charged a fee at an annual rate of 0.10% of its average daily net assets.
A portion of these total shareholder servicing fees were paid to affiliates of Wells Fargo.
5. CONCENTRATION RISK
The Fund invests a substantial portion of its assets in issuers of municipal debt securities located in a single state, therefore, it may be more affected by economic and political developments in that state or region than would be a comparable general tax-exempt mutual fund.
6. INDEMNIFICATION
Under the Trust’s organizational documents, the officers and directors are indemnified against certain liabilities that may arise out of performance of their duties to the Trust. Additionally, in the normal course of business, the Trust may enter into contracts with service providers that contain a variety of indemnification clauses. The Trust’s maximum exposure under these arrangements is dependent on future claims that may be made against the Fund and, therefore, cannot be estimated.
7. NEW ACCOUNTING PRONOUNCEMENT
In December 2011, the Financial Accounting Standards Board (“FASB”) issued Accounting Standard Update (“ASU”) No. 2011-11, Disclosures about Offsetting Assets and Liabilities. ASU 2011-11, which amends FASB ASC Topic 210, Balance Sheet, creates new disclosure requirements which require entities to disclose both gross and net information for derivatives and other financial instruments that are either offset in the Statement of Assets and Liabilities or subject to an enforceable master netting arrangement or similar agreement. The disclosure requirements are effective for interim and annual reporting periods beginning on or after January 1, 2013. Management is currently assessing the potential impact, in addition to expanded financial statement disclosure, that may result from adopting this ASU.
| | | | |
| 26 | | Wells Fargo Advantage California Municipal Money Market Fund | | Other Information (Unaudited) |
PROXY VOTING INFORMATION
A description of the policies and procedures that the Fund uses to determine how to vote proxies relating to portfolio securities is available without charge, upon request, by calling 1-800-222-8222, visiting our Web site at wellsfargoadvantagefunds.com, or visiting the SEC Web site at sec.gov. Information regarding how the Fund voted proxies relating to portfolio securities during the most recent 12-month period ended June 30 is available without charge on the Fund’s Web site at wellsfargoadvantagefunds.com or by visiting the SEC Web site at sec.gov.
PORTFOLIO HOLDINGS INFORMATION
The complete portfolio holdings for each Fund are publicly available on the Funds’ Web site (wellsfargoadvantagefunds.com) on a monthly, seven-day delayed basis. The Fund files its complete schedule of portfolio holdings with the SEC for the first and third quarters of each fiscal year on Form N-Q, which is available without charge by visiting the SEC Web site at sec.gov. In addition, each Fund’s Form N-Q may be reviewed and copied at the SEC’s Public Reference Room in Washington, DC, and at regional offices in New York City, at 233 Broadway, and in Chicago, at 175 West Jackson Boulevard, Suite 900. Information about the Public Reference Room may be obtained by calling 1-800-SEC-0330.
| | | | | | |
| Other Information (Unaudited) | | Wells Fargo Advantage California Municipal Money Market Fund | | | 27 | |
BOARD OF TRUSTEES AND OFFICERS
Each of the Trustees and Officers listed in the table below acts in identical capacities for the Wells Fargo Advantage family of funds, which consists of 138 funds comprising the Wells Fargo Funds Trust, Wells Fargo Variable Trust, Wells Fargo Master Trust and four closed-end funds (collectively the “Fund Complex”). This table should be read in conjunction with the Prospectus and the Statement of Additional Information1. All of the Trustees are also Members of the Audit and Governance Committees of each Trust in the Fund Complex. The mailing address of each Trustee and Officer is 525 Market Street, 12th Floor, San Francisco, CA 94105. Each Trustee and Officer serves an indefinite term, however, each Trustee serves such term until reaching the mandatory retirement age established by the Trustees.
Independent Trustees
| | | | | | |
Name and Year of Birth | | Position Held and Length of Service* | | Principal Occupations During Past Five Years | | Other Directorships During
Past Five Years |
Peter G. Gordon
(Born 1942) | | Trustee, since 1998, Chairman, since 2005 | | Co-Founder, Retired Chairman, President and CEO of Crystal Geyser Water Company. Trustee Emeritus, Colby College | | Asset Allocation Trust |
Isaiah Harris, Jr.
(Born 1952) | | Trustee, since 2009 | | Retired. Prior thereto, President and CEO of BellSouth Advertising and Publishing Corp. from 2005 to 2007, President and CEO of BellSouth Enterprises from 2004 to 2005 and President of BellSouth Consumer Services from 2000 to 2003. Emeritus member of the Iowa State University Foundation Board of Governors. Emeritus Member of the Advisory Board of Iowa State University School of Business. Mr. Harris is a certified public accountant. | | CIGNA Corporation; Deluxe Corporation; Asset Allocation Trust |
Judith M. Johnson
(Born 1949) | | Trustee, since 2008 Audit Committee Chairman, since 2008 | | Retired. Prior thereto, Chief Executive Officer and Chief Investment Officer of Minneapolis Employees Retirement Fund from 1996 to 2008. Ms. Johnson is an attorney, certified public accountant and a certified managerial accountant. | | Asset Allocation Trust |
Leroy Keith, Jr.
(Born 1939) | | Trustee, since 2010 | | Chairman, Bloc Global Services (development and construction). Trustee of the Evergreen Funds from 1983 to 2010. Former Managing Director, Almanac Capital Management (commodities firm), former Partner, Stonington Partners, Inc. (private equity fund), former Director, Obagi Medical Products Co. and former Director, Lincoln Educational Services. | | Trustee, Virtus Fund Complex (consisting of 40 portfolios as of 12/31/11); Asset Allocation Trust |
David F. Larcker
(Born 1950) | | Trustee, since 2009 | | James Irvin Miller Professor of Accounting at the Graduate School of Business, Stanford University, Director of Corporate Governance Research Program and Senior Faculty of The Rock Center for Corporate Governance since 2006. From 2005 to 2008, Professor of Accounting at the Graduate School of Business, Stanford University. Prior thereto, Ernst & Young Professor of Accounting at The Wharton School, University of Pennsylvania from 1985 to 2005. | | Asset Allocation Trust |
Olivia S. Mitchell
(Born 1953) | | Trustee, since 2006 | | International Foundation of Employee Benefit Plans Professor, Wharton School of the University of Pennsylvania since 1993. Director of Wharton’s Pension Research Council and Boettner Center on Pensions & Retirement Research, and Research Associate at the National Bureau of Economic Research. Previously, Cornell University Professor from 1978 to 1993. | | Asset Allocation Trust |
Timothy J. Penny
(Born 1951) | | Trustee, since 1996 | | President and CEO of Southern Minnesota Initiative Foundation, a non-profit organization, since 2007 and Senior Fellow at the Humphrey Institute Policy Forum at the University of Minnesota since 1995. Member of the Board of Trustees of NorthStar Education Finance, Inc., a non-profit organization, since 2007. | | Asset Allocation Trust |
| | | | |
| 28 | | Wells Fargo Advantage California Municipal Money Market Fund | | Other Information (Unaudited) |
| | | | | | |
Name and Year of Birth | | Position Held and Length of Service* | | Principal Occupations During Past Five Years | | Other Directorships During
Past Five Years |
Michael S. Scofield
(Born 1943) | | Trustee, since 2010 | | Served on the Investment Company Institute’s Board of Governors and Executive Committee from 2008-2011 as well the Governing Council of the Independent Directors Council from 2006-2011 and the Independent Directors Council Executive Committee from 2008-2011. Chairman of the IDC from 2008-2010. Institutional Investor (Fund Directions) Trustee of Year in 2007. Trustee of the Evergreen Funds (and its predecessors) from 1984 to 2010. Chairman of the Evergreen Funds from 2000-2010. Former Trustee of the Mentor Funds. Retired Attorney, Law Offices of Michael S. Scofield and former Director and Chairman, Branded Media Corporation (multi-media branding company). | | Asset Allocation Trust |
Donald C. Willeke
(Born 1940) | | Trustee, since 1996 | | Principal of the law firm of Willeke & Daniels. General Counsel of the Minneapolis Employees Retirement Fund from 1984 until its consolidation into the Minnesota Public Employees Retirement Association on June 30, 2010. Director and Vice Chair of The Free Trust (non-profit corporation). Director of the American Chestnut Foundation (non-profit corporation). | | Asset Allocation Trust |
| * | Length of service dates reflect the Trustee’s commencement of service with the Trust’s predecessor entities, where applicable. |
Officers
| | | | | | |
Name and Year of Birth | | Position Held and
Length of Service | | Principal Occupations During Past Five Years | | |
Karla M. Rabusch
(Born 1959) | | President, since 2003 | | Executive Vice President of Wells Fargo Bank, N.A. and President of Wells Fargo Funds Management, LLC since 2003. Senior Vice President and Chief Administrative Officer of Wells Fargo Funds Management, LLC from 2001 to 2003. | | |
C. David Messman
(Born 1960) | | Secretary, since 2000; Chief Legal Officer, since 2003 | | Senior Vice President and Secretary of Wells Fargo Funds Management, LLC since 2001. Vice President and Managing Senior Counsel of Wells Fargo Bank, N.A. since 1996. | | |
Nancy Wiser (Born 1967) | | Treasurer, since 2012 | | Executive Vice President of Wells Fargo Funds Management, LLC since 2011. Chief Operating Officer and Chief Compliance Officer at LightBox Capital Management LLC, from 2008 to 2011. Owned and operated a consulting business providing services to various hedge funds including acting as Chief Operating Officer and Chief Compliance Officer for a hedge fund from 2007 to 2008. Chief Operating Officer and Chief Compliance Officer of GMN Capital LLC from 2006 to 2007. | | |
David Berardi
(Born 1975) | | Assistant Treasurer, since 2009 | | Vice President of Wells Fargo Funds Management, LLC since 2009. Vice President of Evergreen Investment Management Company, LLC from 2008 to 2010. Assistant Vice President of Evergreen Investment Services, Inc. from 2004 to 2008. Manager of Fund Reporting and Control for Evergreen Investment Management Company, LLC from 2004 to 2010. | | |
Jeremy DePalma
(Born 1974) | | Assistant Treasurer, since 2009 | | Senior Vice President of Wells Fargo Funds Management, LLC since 2009. Senior Vice President of Evergreen Investment Management Company, LLC from 2008 to 2010. Vice President, Evergreen Investment Services, Inc. from 2004 to 2007. Head of the Fund Reporting and Control Team within Fund Administration from 2005 to 2010. | | |
Debra Ann Early
(Born 1964) | | Chief Compliance Officer, since 2007 | | Chief Compliance Officer of Wells Fargo Funds Management, LLC since 2007. Chief Compliance Officer of Parnassus Investments from 2005 to 2007. Chief Financial Officer of Parnassus Investments from 2004 to 2007 and Senior Audit Manager of PricewaterhouseCoopers LLP from 1998 to 2004. | | |
| 1. | The Statement of Additional Information includes additional information about the Trustees and is available, without charge, upon request, by calling 1-800-222-8222 or by visiting the Web site at wellsfargoadvantagefunds.com. |
| | | | | | |
| Other Information (Unaudited) | | Wells Fargo Advantage California Municipal Money Market Fund | | | 29 | |
BOARD CONSIDERATION OF INVESTMENT ADVISORY AND SUB-ADVISORY AGREEMENTS:
Under Section 15 of the Investment Company Act of 1940 (the “1940 Act”), the Board of Trustees (the “Board”) of Wells Fargo Funds Trust (the “Trust”), all the members of which have no direct or indirect interest in the investment advisory and sub-advisory agreements and are not “interested persons” of the Trust, as defined in the 1940 Act (the “Independent Trustees”), must determine whether to approve the continuation of the Trust’s investment advisory and sub-advisory agreements. In this regard, at an in person meeting held on March 29-30, 2012 (the “Meeting”), the Board reviewed and re-approved: (i) an investment advisory agreement with Wells Fargo Funds Management, LLC (“Funds Management”) for Wells Fargo Advantage California Municipal Money Market Fund (the “Fund”) and (ii) an investment sub-advisory agreement with Wells Capital Management Incorporated (“Wells Capital Management”) for the Fund. The investment advisory agreement with Funds Management and the investment sub-advisory agreement with Wells Capital Management are collectively referred to as the “Advisory Agreements.”
At the Meeting, the Board considered the factors and reached the conclusions described below relating to the selection of Funds Management and Wells Capital Management and the continuation of the Advisory Agreements. Prior to the Meeting, the Trustees conferred extensively among themselves and with representatives of Funds Management about these matters. The Board also met throughout the year and received information that was useful to them in considering the continuation of the Advisory Agreements. The Independent Trustees were assisted in their evaluation of the Advisory Agreements by independent legal counsel, from whom they received separate legal advice and with whom they met separately from Funds Management.
In providing information to the Board, Funds Management and Wells Capital Management were guided by a detailed set of requests submitted by the Independent Trustees’ independent legal counsel on their behalf at the start of the Board’s annual contract renewal process earlier in 2012. In approving the Advisory Agreements, the Board did not identify any particular information or consideration that was all-important or controlling, and each Trustee likely attributed different weights to various factors.
Nature, Extent and Quality of Services
The Board received and considered various information regarding the nature, extent and quality of services provided to the Fund by Funds Management and Wells Capital Management under the Advisory Agreements. The Board also received and considered, among other things, information about the background and experience of senior management of Funds Management, and the qualifications, backgrounds, tenures and responsibilities of the portfolio managers primarily responsible for the day-to-day portfolio management of the Fund.
The Board evaluated the ability of Funds Management and Wells Capital Management, based on their respective financial condition, resources, reputation and other attributes, to attract and retain qualified investment professionals, including research, advisory, and supervisory personnel. The Board further considered the compliance programs and compliance records of Funds Management and Wells Capital Management. In addition, the Board took into account the administrative services provided to the Fund by Funds Management and its affiliates.
The Board’s decision to approve the continuation of the Advisory Agreements was based on a comprehensive evaluation of information provided to it. In considering these matters, the Board considered not only the specific information presented in connection with the Meeting, but also the knowledge gained over time through interaction with Funds Management and Wells Capital Management about various topics, including Funds Management’s oversight of service providers. The above factors, together with those referenced below, are some of the most important, but not necessarily all, factors considered by the Board in concluding that the nature, extent and quality of the investment advisory services provided to the Fund by Funds Management and Wells Capital Management supported the re-approval of the Advisory Agreements. Although the Board considered the continuation of the Advisory Agreements for the Fund as part of the larger process of considering the continuation of the advisory agreements for all of the funds in the complex, its decision to continue the Advisory Agreements for the Fund was ultimately made on a fund-by-fund basis.
| | | | |
| 30 | | Wells Fargo Advantage California Municipal Money Market Fund | | Other Information (Unaudited) |
Fund Performance and Expenses
The Board considered the performance results for the Fund over various time periods ended December 31, 2011. The Board also considered these results in comparison to the median performance of a universe of relevant funds (the “Universe”) that was determined by Lipper Inc. (“Lipper”) to be similar to the Fund, and in comparison to the Fund’s benchmark index and to other comparative data. Lipper is an independent provider of investment company data. The Board received a description of the methodology used by Lipper to select the mutual funds in the Universe. The Board noted that the performance of the Fund was in range of the median performance of the Universe for all periods under review. The Board also noted that the performance of the Fund was in range of its benchmark, the Lipper California Tax-Exempt Money Market Funds Index, for the periods under review.
The Board received and considered information regarding the Fund’s contractual advisory fee and net operating expense ratios and their various components, including actual management fees (which reflect fee waivers, if any), transfer agent, custodian and other non-management fees, Rule 12b-1 and non-Rule 12b-1 fees, service fees and fee waiver and expense reimbursement arrangements. The Board also considered these ratios in comparison to the median ratios of an expense Universe and a narrower expense group of mutual funds (each, an “Expense Group”) that was determined by Lipper to be similar to the Fund. The Board received a description of the methodology used by Lipper to select the mutual funds in the Fund’s Expense Group. The Board noted that the net operating expense ratios of the Fund were equal to or in range of the Fund’s Expense Group’s median net operating expense ratios, except for Class A, Service Class and Sweep Class.
Funds Management advised the Board that the Expense Group medians reflected voluntary waivers, whereas the Fund’s expense ratios did not reflect voluntary waivers. The Board noted that when the Fund’s expense ratios were adjusted to reflect voluntary waivers, the Fund’s net operating expense ratios were lower than the median net operating expense ratios of the Expense Group. The Board viewed favorably Funds Management’s proposal to lower the net operating expense cap of the Fund’s Sweep Class by five basis points.
Based on the above-referenced considerations and other factors, the Board concluded that the overall performance and expense structure of the Fund supported the re-approval of the Advisory Agreements for the Fund.
Investment Advisory and Sub-Advisory Fee Rates
The Board reviewed and considered the contractual investment advisory fee rate that is payable by the Fund to Funds Management for investment advisory services (the “Advisory Agreement Rate”), both on a stand-alone basis and on a combined basis with the Fund’s administration fee rate. The Board took into account the separate administrative and other services covered by the administration fee rate. The Board also reviewed and considered the contractual investment sub-advisory fee rate that is payable by Funds Management to Wells Capital Management for investment sub-advisory services (the “Sub-Advisory Agreement Rate”). In addition, the Board reviewed and considered the existing fee waiver/cap arrangements applicable to the Advisory Agreement Rate and considered the Advisory Agreement Rate after taking the waivers/caps into account (the “Net Advisory Rate”).
The Board received and considered information comparing the Advisory Agreement Rate and Net Advisory Rate, combined with the administration fee rates, with those of other funds in the Fund’s Expense Group median. The Board noted that the Advisory Agreement Rate for the Fund was equal to, in range of or lower than the median rates for the Fund’s Expense Group. The Board also noted that the Net Advisory Rate for the Fund was in range of the median rates for the Fund’s Expense Group, except for Class A and Sweep Class. The Board viewed favorably Funds Management’s willingness to voluntarily waive certain fees and its proposal to lower the net operating expense cap for the Sweep Class.
The Board also received and considered information about the nature and extent of services offered and fee rates charged by Funds Management and Wells Capital Management to other types of clients. In this regard, the Board received information about differences between the services, and the compliance, reporting, and other legal burdens and risks of providing investment advice to mutual funds and those associated with providing advice to non-mutual fund clients such as collective funds or institutional separate accounts.
The Board determined that the Advisory Agreement Rate for the Fund, both with and without the administration fee rate and before and after waivers, was reasonable in light of the Fund’s Expense Group information, the net expense ratio commitments, the services covered by the Advisory Agreements and other information provided. The Board also reviewed and considered the Sub-Advisory Agreement Rate and concluded that the Sub-Advisory Agreement Rate was reasonable in light of the services covered by the sub-advisory agreement and other information provided.
| | | | | | |
| Other Information (Unaudited) | | Wells Fargo Advantage California Municipal Money Market Fund | | | 31 | |
Profitability
The Board received and considered a profitability analysis of Funds Management, as well as an analysis of the profitability to the collective Wells Fargo businesses that provide services to the Fund. It considered that the information provided to it was necessarily estimated, and that the profitability information provided to it, especially on a fund-by-fund basis, did not necessarily provide a precise tool for evaluating the appropriateness of the Fund’s Advisory Agreement Rate in isolation. It noted that the levels of profitability reported on a fund-by-fund basis varied widely, depending on, among other things, the size and type of fund. The Board noted the impact of voluntary fee waivers on Funds Management’s profitability. The Board concluded that the profitability reported by Funds Management was not unreasonable.
The Board did not consider separate profitability information with respect to Wells Capital Management, because, as an affiliate of Funds Management, its profitability information was subsumed in the collective Wells Fargo profitability analysis provided by Funds Management.
Economies of Scale
With respect to possible economies of scale, the Board reviewed the breakpoints in the Fund’s advisory fee and/or administration fee structure, which operate generally to reduce the expenses of the Fund (as a percentage of Fund assets) as the Fund grows in size. It considered that, as a fund shrinks in size, breakpoints conversely result in increasing fee levels. The Board noted that it would have on-going opportunities to review the appropriate levels of breakpoints in the future, and concluded that the breakpoints as implemented appeared to be a reasonable step toward sharing economies of scale, if any, with the Fund. However, the Board acknowledged the inherent limitations of any analysis of economies of scale and of any attempt to correlate breakpoints with such economies, stemming largely from the Board’s understanding that economies of scale are realized, if at all, across a variety of products and services, not just with respect to a single fund.
Other Benefits to Funds Management and Wells Capital Management
The Board received and considered information regarding potential “fall-out” or ancillary benefits received by Funds Management and its affiliates, including Wells Capital Management, as a result of their relationship with the Fund. Ancillary benefits could include, among others, benefits directly attributable to the relationship of Funds Management and Wells Capital Management with the Fund and benefits potentially derived from an increase in Funds Management’s and Wells Capital Management’s business as a result of their relationship with the Fund (such as the ability to market to shareholders other financial products offered by Funds Management and its affiliates, including Wells Capital Management).
The Board considered that Wells Fargo Funds Distributor, LLC, an affiliate of Funds Management, serves as distributor to the Fund and receives certain compensation for those services. The Board noted that various financial institutions, including affiliates of Funds Management, may receive distribution-related fees, shareholder servicing payments (including amounts derived from payments under Rule 12b-1 plans) and sub-transfer agency fees in respect of shares sold or held through them and services provided.
The Board also reviewed information about whether and to what extent soft dollar credits are sought and how any such credits are utilized and any benefits that may be realized by using an affiliated broker.
Other Factors and Broader Review
The Board also considered the markets for distribution of the Fund’s shares, including the channels through which the Fund’s shares are offered and sold. The Board noted that the Fund is part of one of the few fund families that have both direct-to-fund and intermediary distribution channels. As discussed above, the Board reviews detailed materials received from Funds Management and Wells Capital Management annually as part of the re-approval process under Section 15 of the 1940 Act and also reviews and assesses information about the quality of the services that the Fund receives throughout the year. In this regard, the Board has reviewed reports of Funds Management at each of its quarterly meetings, which include, among other things, portfolio reviews and performance reports. In addition, the Board confers with portfolio managers at various times throughout the year.
Conclusion
After considering the above-described factors and based on its deliberations and its evaluation of the information described above, the Board unanimously approved the continuation of the Advisory Agreements for an additional one-year period.
| | | | |
| 32 | | Wells Fargo Advantage California Municipal Money Market Fund | | List of Abbreviations |
The following is a list of common abbreviations for terms and entities which may have appeared in this report.
| ACB | — Agricultural Credit Bank |
| ADR | — American Depository Receipt |
| ADS | — American Depository Shares |
| AGC-ICC | — Assured Guaranty Corporation - Insured Custody Certificates |
| AGM | — Assured Guaranty Municipal |
| AMBAC | — American Municipal Bond Assurance Corporation |
| AMT | — Alternative Minimum Tax |
| BAN | — Bond Anticipation Notes |
| BHAC | — Berkshire Hathaway Assurance Corporation |
| CAB | — Capital Appreciation Bond |
| CCAB | — Convertible Capital Appreciation Bond |
| CDA | — Community Development Authority |
| CDO | — Collateralized Debt Obligation |
| COP | — Certificate of Participation |
| DRIVER | — Derivative Inverse Tax-Exempt Receipts |
| DW&P | — Department of Water & Power |
| DWR | — Department of Water Resources |
| ECFA | — Educational & Cultural Facilities Authority |
| EDA | — Economic Development Authority |
| EDFA | — Economic Development Finance Authority |
| ETF | — Exchange-Traded Fund |
| FFCB | — Federal Farm Credit Bank |
| FGIC | — Financial Guaranty Insurance Corporation |
| FGLMC | — Federal Government Loan Mortgage Company |
| FHA | — Federal Housing Authority |
| FHLB | — Federal Home Loan Bank |
| FHLMC | — Federal Home Loan Mortgage Corporation |
| FICO | — The Financing Corporation |
| FNMA | — Federal National Mortgage Association |
| GDR | — Global Depository Receipt |
| GNMA | — Government National Mortgage Association |
| HCFR | — Healthcare Facilities Revenue |
| HEFA | — Health & Educational Facilities Authority |
| HEFAR | — Higher Education Facilities Authority Revenue |
| HFA | — Housing Finance Authority |
| HFFA | — Health Facilities Financing Authority |
| IBC | — Insured Bond Certificate |
| IDA | — Industrial Development Authority |
| IDAG | — Industrial Development Agency |
| IDR | — Industrial Development Revenue |
| KRW | — Republic of Korea Won |
| LIBOR | — London Interbank Offered Rate |
| LLC | — Limited Liability Company |
| LLP | — Limited Liability Partnership |
| MBIA | — Municipal Bond Insurance Association |
| MFHR | — Multi-Family Housing Revenue |
| MSTR | — Municipal Securities Trust Receipts |
| MUD | — Municipal Utility District |
| NATL-RE | — National Public Finance Guarantee Corporation |
| PCFA | — Pollution Control Finance Authority |
| PCR | — Pollution Control Revenue |
| PFA | — Public Finance Authority |
| PFFA | — Public Facilities Financing Authority |
| PFOTER | — Puttable Floating Option Tax-Exempt Receipts |
| plc | — Public Limited Company |
| PUTTER | — Puttable Tax-Exempt Receipts |
| R&D | — Research & Development |
| RDA | — Redevelopment Authority |
| RDFA | — Redevelopment Finance Authority |
| REIT | — Real Estate Investment Trust |
| ROC | — Reset Option Certificates |
| SAVRS | — Select Auction Variable Rate Securities |
| SBA | — Small Business Authority |
| SFHR | — Single Family Housing Revenue |
| SFMR | — Single Family Mortgage Revenue |
| SPA | — Standby Purchase Agreement |
| SPDR | — Standard & Poor’s Depositary Receipts |
| STRIPS | — Separate Trading of Registered Interest and Principal Securities |
| TAN | — Tax Anticipation Notes |
| TIPS | — Treasury Inflation-Protected Securities |
| TRAN | — Tax Revenue Anticipation Notes |
| TCR | — Transferable Custody Receipts |
| TTFA | — Transportation Trust Fund Authority |
| TVA | — Tennessee Valley Authority |
| XLCA | — XL Capital Assurance |
This page is intentionally left blank.
This page is intentionally left blank.


FOR MORE INFORMATION
More information about Wells Fargo Advantage Funds is available free upon request. To obtain literature, please write, e-mail, visit the Fund’s Web site, or call:
Wells Fargo Advantage Funds
P.O. Box 8266
Boston, MA 02266-8266
E-mail: wfaf@wellsfargo.com
Web site: wellsfargoadvantagefunds.com
Individual investors: 1-800-222-8222
Retail investment professionals: 1-888-877-9275
Institutional investment professionals: 1-866-765-0778
This report and the financial statements contained herein are submitted for the general information of the shareholders of Wells Fargo Advantage Funds. If this report is used for promotional purposes, distribution of the report must be accompanied or preceded by a current prospectus. For a current prospectus and, if available, a summary prospectus containing more complete information, including charges and expenses, call 1-800-222-8222 or visit the Fund’s Web site at wellsfargoadvantagefunds.com. Please consider the investment objectives, risks, charges, and expenses of the investment carefully before investing. This and other information about Wells Fargo Advantage Funds can be found in the current prospectus. Read the prospectus carefully before you invest or send money.
Wells Fargo Funds Management, LLC, a wholly owned subsidiary of Wells Fargo & Company, provides investment advisory and administrative services for Wells Fargo Advantage Funds. Other affiliates of Wells Fargo & Company provide subadvisory and other services for the Funds. The Funds are distributed by Wells Fargo Funds Distributor, LLC, Member FINRA/SIPC, an affiliate of Wells Fargo & Company.
NOT FDIC INSURED ¡ NO BANK GUARANTEE ¡ MAY LOSE VALUE
© 2012 Wells Fargo Funds Management, LLC. All rights reserved.
| | |
 | | 211386 09-12 SA301/SAR301 07-12 |

Wells Fargo Advantage
Cash Investment Money Market Fund

Semi-Annual Report
July 31, 2012

Reduce clutter. Save trees.
Sign up for electronic delivery of prospectuses and shareholder reports at wellsfargo.com/advantagedelivery
Contents
The views expressed and any forward-looking statements are as of July 31, 2012 , unless otherwise noted, and are those of the Fund managers and/or Wells Fargo Funds Management, LLC. Discussions of individual securities, or the markets generally, or any Wells Fargo Advantage Fund are not intended as individual recommendations. Future events or results may vary significantly from those expressed in any forward-looking statements; the views expressed are subject to change at any time in response to changing circumstances in the market. Wells Fargo Funds Management, LLC, disclaims any obligation to publicly update or revise any views expressed or forward-looking statements.
NOT FDIC INSURED ¡ NO BANK GUARANTEE ¡ MAY LOSE VALUE

WELLS FARGO INVESTMENT HISTORY
| | |
| |
| 1932 | | Keystone creates one of the first mutual fund families. |
| |
| 1971 | | Wells Fargo & Company introduces one of the first institutional index funds. |
| |
| 1978 | | Wells Fargo applies Markowitz and Sharpe’s research on Modern Portfolio Theory to introduce one of the industry’s first Tactical Asset Allocation (TAA) models in institutional separately managed accounts. |
| |
| 1984 | | Wells Fargo Stagecoach Funds launches its first asset allocation fund. |
| |
| 1989 | | The Tactical Asset Allocation (TAA) Model is first applied to Wells Fargo’s asset allocation mutual funds. |
| |
| 1994 | | Wells Fargo introduces the LifePath Funds, one of the first suites of target date funds (now the Wells Fargo Advantage Dow Jones Target Date FundsSM). |
| |
| 1996 | | Evergreen Investments and Keystone Funds merge. |
| |
| 1997 | | Wells Fargo launches Wells Fargo Advantage WealthBuilder PortfoliosSM, a fund-of-funds suite of products that includes the use of quantitative models to shift assets among investment styles. |
| |
| 1999 | | Norwest Advantage Funds and Stagecoach Funds are reorganized into Wells Fargo Funds after the merger of Norwest and Wells Fargo. |
| |
| 2002 | | Evergreen Retail and Evergreen Institutional companies form the umbrella asset management company, Evergreen Investments. |
| |
| 2005 | | The integration of Strong Funds with Wells Fargo Funds creates Wells Fargo Advantage Funds, resulting in one of the top 20 mutual fund companies in the United States. |
| |
| 2006 | | Wells Fargo Advantage Funds relaunches the target date product line as Wells Fargo Advantage Dow Jones Target Date Funds. |
| |
| 2010 | | The mergers and reorganizations of Evergreen and Wells Fargo Advantage mutual funds are completed, unifying the families under the brand of Wells Fargo Advantage Funds. |
Wells Fargo Advantage Funds®
Wells Fargo Advantage Funds skillfully guides institutions, financial advisors, and individuals through the investment terrain to help them reach their financial objectives. Everything we do on behalf of investors is backed by our unique combination of qualifications.
Strength
Our organization is built on the standards of integrity and service established by our parent company—Wells Fargo & Company—more than 150 years ago. And, because we’re part of a highly diversified financial enterprise, we offer the depth of resources to help investors succeed.
Expertise
Our multi-boutique model offers investors access to the independent thinking of premier investment managers that have been chosen for their time-tested strategies. While each team specializes in a specific investment strategy, collectively they provide investors a wide choice of distinct investment styles. Our dedication to investment excellence doesn’t end with our expertise in manager selection—risk management, analysis, and rigorous ongoing review seek to ensure each manager’s investment process remains consistent.
Partnership
Our collaborative approach is built around understanding the needs and goals of our clients. By adhering to core principles of sound judgment and steady guidance, we support you through every stage of the investment decision process.
Carefully consider a fund’s investment objectives, risks, charges, and expenses before investing. For a current prospectus and, if available, a summary prospectus, containing this and other information, visit wellsfargoadvantagefunds.com. Read it carefully before investing.
Wells Fargo Funds Management, LLC, a wholly owned subsidiary of Wells Fargo & Company, provides investment advisory and administrative services for Wells Fargo Advantage Funds®. Other affiliates of Wells Fargo & Company provide subadvisory and other services for the Funds. The Funds are distributed by Wells Fargo Funds Distributor, LLC, Member FINRA/SIPC, an affiliate of Wells Fargo & Company.
“Dow Jones®” and “Dow Jones Target Date IndexesSM” are service marks of Dow Jones Trademark Holdings, LLC (“Dow Jones”), have been licensed to CME Group Index Services LLC (“CME Indexes”) and have been sublicensed for use for certain purposes by Global Index Advisors, Inc, and Wells Fargo Funds Management, LLC. The Wells Fargo Advantage Dow Jones Target Date FundsSM based on the Dow Jones Target Date IndexesSM, are not sponsored, endorsed, sold or promoted by Dow Jones, CME Indexes or their respective affiliates and none of them makes any representation regarding the advisability of investing in such product(s).
NOT FDIC INSURED ¡ NO BANK GUARANTEE ¡ MAY LOSE VALUE
Not part of semi-annual report.
Wells Fargo Advantage Funds offers more than 110 mutual funds across a wide range of asset classes, representing over $209 billion in assets under management, as of July 31, 2012.
| | | | |
| Equity Funds | | | | |
Asia Pacific Fund | | Enterprise Fund† | | Opportunity Fund† |
C&B Large Cap Value Fund | | Equity Value Fund | | Precious Metals Fund |
C&B Mid Cap Value Fund | | Global Opportunities Fund | | Premier Large Company Growth Fund |
Capital Growth Fund | | Growth Fund | | Small Cap Opportunities Fund |
Common Stock Fund | | Index Fund | | Small Cap Value Fund |
Disciplined U.S. Core Fund | | International Equity Fund | | Small Company Growth Fund |
Discovery Fund† | | International Value Fund | | Small Company Value Fund |
Diversified Equity Fund | | Intrinsic Small Cap Value Fund | | Small/Mid Cap Core Fund |
Diversified International Fund | | Intrinsic Value Fund | | Small/Mid Cap Value Fund |
Diversified Small Cap Fund | | Intrinsic World Equity Fund | | Special Mid Cap Value Fund |
Emerging Growth Fund | | Large Cap Core Fund | | Special Small Cap Value Fund |
Emerging Markets Equity Fund | | Large Cap Growth Fund | | Specialized Technology Fund |
Emerging Markets Equity Income Fund | | Large Company Value Fund | | Traditional Small Cap Growth Fund |
Endeavor Select Fund† | | Omega Growth Fund | | Utility and Telecommunications Fund |
| Bond Funds | | | | |
Adjustable Rate Government Fund | | Inflation-Protected Bond Fund | | Short-Term Bond Fund |
California Limited-Term Tax-Free Fund | | Intermediate Tax/AMT-Free Fund | | Short-Term High Yield Bond Fund |
California Tax-Free Fund | | International Bond Fund | | Short-Term Municipal Bond Fund |
Colorado Tax-Free Fund | | Minnesota Tax-Free Fund | | Strategic Municipal Bond Fund |
Emerging Markets Local Bond Fund | | Municipal Bond Fund | | Total Return Bond Fund |
Government Securities Fund | | North Carolina Tax-Free Fund | | Ultra Short-Term Income Fund |
High Income Fund | | Pennsylvania Tax-Free Fund | | Ultra Short-Term Municipal Income Fund |
High Yield Bond Fund | | Short Duration Government Bond Fund | | Wisconsin Tax-Free Fund |
Income Plus Fund | | | | |
| Asset Allocation Funds | | | | |
Absolute Return Fund | | WealthBuilder Equity Portfolio† | | Target 2020 Fund† |
Asset Allocation Fund | | WealthBuilder Growth Allocation Portfolio† | | Target 2025 Fund† |
Conservative Allocation Fund | | WealthBuilder Growth Balanced Portfolio† | | Target 2030 Fund† |
Diversified Capital Builder Fund | | WealthBuilder Moderate Balanced Portfolio† | | Target 2035 Fund† |
Diversified Income Builder Fund | | WealthBuilder Tactical Equity Portfolio† | | Target 2040 Fund† |
Growth Balanced Fund | | Target Today Fund† | | Target 2045 Fund† |
Index Asset Allocation Fund | | Target 2010 Fund† | | Target 2050 Fund† |
Moderate Balanced Fund | | Target 2015 Fund† | | Target 2055 Fund† |
WealthBuilder Conservative Allocation Portfolio† | | | | |
| Money Market Funds | | | | |
100% Treasury Money Market Fund | | Heritage Money Market Fund† | | National Tax-Free Money Market Fund |
California Municipal Money Market Fund | | Money Market Fund | | Prime Investment Money Market Fund |
Cash Investment Money Market Fund | | Municipal Cash Management Money Market Fund | | Treasury Plus Money Market Fund |
Government Money Market Fund | | Municipal Money Market Fund | | |
| Variable Trust Funds1 | | | | |
VT Discovery Fund† | | VT Intrinsic Value Fund | | VT Small Cap Growth Fund |
VT Index Asset Allocation Fund | | VT Omega Growth Fund | | VT Small Cap Value Fund |
VT International Equity Fund | | VT Opportunity Fund† | | VT Total Return Bond Fund |
An investment in a money market fund is not insured or guaranteed by the Federal Deposit Insurance Corporation or any other government agency. Although the Wells Fargo Advantage Money Market Funds seek to preserve the value of your investment at $1.00 per share, it is possible to lose money by investing in a money market fund.
| 1. | The Variable Trust Funds are generally available only through insurance company variable contracts. |
| † | In this report, the Wells Fargo Advantage Discovery FundSM, Wells Fargo Advantage Endeavor Select FundSM, Wells Fargo Advantage Enterprise FundSM, Wells Fargo Advantage Opportunity FundSM, Wells Fargo Advantage WealthBuilder Conservative Allocation PortfolioSM, Wells Fargo Advantage WealthBuilder Equity PortfolioSM, Wells Fargo Advantage WealthBuilder Growth Allocation PortfolioSM, Wells Fargo Advantage WealthBuilder Growth Balanced PortfolioSM, Wells Fargo Advantage WealthBuilder Moderate Balanced PortfolioSM, Wells Fargo Advantage WealthBuilder Tactical Equity PortfolioSM, Wells Fargo Advantage Dow Jones Target Today FundSM, Wells Fargo Advantage Dow Jones Target 2010 FundSM, Wells Fargo Advantage Dow Jones Target 2015 FundSM, Wells Fargo Advantage Dow Jones Target 2020 FundSM, Wells Fargo Advantage Dow Jones Target 2025 FundSM, Wells Fargo Advantage Dow Jones Target 2030 FundSM, Wells Fargo Advantage Dow Jones Target 2035 FundSM, Wells Fargo Advantage Dow Jones Target 2040 FundSM, Wells Fargo Advantage Dow Jones Target 2045 FundSM, Wells Fargo Advantage Dow Jones Target 2050 FundSM, Wells Fargo Advantage Dow Jones Target 2055 FundSM, Wells Fargo Advantage Heritage Money Market FundSM, Wells Fargo Advantage VT Discovery FundSM, and Wells Fargo Advantage VT Opportunity FundSM are referred to as the Discovery Fund, Endeavor Select Fund, Enterprise Fund, Opportunity Fund, WealthBuilder Conservative Allocation Portfolio, WealthBuilder Equity Portfolio, WealthBuilder Growth Allocation Portfolio, WealthBuilder Growth Balanced Portfolio, WealthBuilder Moderate Balanced Portfolio, WealthBuilder Tactical Equity Portfolio, Target Today Fund, Target 2010 Fund, Target 2015 Fund, Target 2020 Fund, Target 2025 Fund, Target 2030 Fund, Target 2035 Fund, Target 2040 Fund, Target 2045 Fund, Target 2050 Fund, Target 2055 Fund, Heritage Money Market Fund, VT Discovery Fund, and VT Opportunity Fund, respectively. |
Not part of semi-annual report.
| | | | |
| 2 | | Wells Fargo Advantage Cash Investment Money Market Fund | | Letter to Shareholders (Unaudited) |

Karla M. Rabusch,
President
Wells Fargo Advantage Funds
Not only has the Fed been successful in engineering low interest rates, but investors have rushed to buy U.S. Treasury securities as a safe-haven asset in the midst of uncertainty surrounding the European debt crisis. As a result, interest rates reached record lows.
Dear Valued Shareholder:
We’re pleased to offer you this semi-annual report for the Wells Fargo Advantage Cash Investment Money Market Fund for the six-month period that ended July 31, 2012.
The economy grew, but the recovery has been modest.
The U.S. is three years into a modest economic recovery, with second-quarter real gross domestic product (GDP) increasing 1.5% on an annualized basis. Several factors, however, held back growth despite the Federal Reserve’s (Fed) accommodative monetary policy. In Europe, much uncertainty remained about the outcome of the eurozone debt crisis and whether policymakers will be able to resolve it without any countries defaulting or leaving the euro. In addition, Europe has again entered a recession. In Asia, China’s economy slowed. Here at home, a potential “fiscal cliff”—automatic tax increases alongside automatic budget cuts stemming from a legislative compromise in Congress—added uncertainty and, if unaddressed, could negatively affect GDP beginning in 2013.
In an effort to further bolster the economy, especially the labor market, the Fed has indicated its commitment to maintaining a highly accommodative monetary policy. It has indicated its belief that economic conditions warrant an extremely low federal funds target rate—a short-term bank lending rate—near 0%, at least through late 2014. The Fed also continued its “Operation Twist,” which involves buying U.S. Treasury securities with maturities of greater than six years and selling U.S. Treasury securities with maturities of less than three years, in an effort to keep longer-term interest rates low.
A demand for relative safe-haven securities led to ultra-low interest rates.
Not only has the Fed been successful in engineering low interest rates, but investors have rushed to buy U.S. Treasury securities as a relative safe-haven asset in the midst of uncertainty surrounding the European debt crisis. As a result, interest rates reached record lows. Ten-year U.S. Treasury yields ranged between 2.38% and 1.38% over the past six months. Three-month U.S. Treasury bills had an average yield of 10 basis points (bps; 100 bps is 1.00%) over the past six months. Rates on seven-day commercial paper, a common investment type for prime money market funds, were 12 bps on July 31, 2012.
Lack of supply kept a lid on yields, and regulatory uncertainty remained.
Continued demand for a limited supply of money market-eligible securities also contributed to low yields. We estimate that the amount outstanding of short-term, money market fund-eligible securities (excluding U.S. Treasury securities) has declined by $3 trillion, or more than a 30% decrease, since 2008. Reasons for this decrease in supply include issuers opting to lock in rates on long-term rather than short-term debt, less need for financing as many companies have plentiful cash given record profits, and credit downgrades that have resulted in fewer firms with top credit ratings.
| | | | | | |
| Letter to Shareholders (Unaudited) | | Wells Fargo Advantage Cash Investment Money Market Fund | | | 3 | |
The Chairman of the Securities and Exchange Commission (SEC) indicated in late August that the SEC has determined at this time not to propose certain amendments to the rules governing money market funds. However, the Financial Stability Oversight Council or other financial regulators could still take steps to impose additional regulations on money market funds. As we gain clarity in the coming months regarding any potential changes to regulation of money market funds, we will provide further communications to our clients about these changes.
Amid the current challenges of investing—low yields, an unresolved eurozone crisis, limited supply, and regulatory uncertainty—has been the opportunity to provide our clients an important investment option for meeting their short-term cash needs. Our focus on preservation of capital and liquidity is not a marketing phrase but rather the basis of our investment philosophy as we manage money market funds in an uncertain world. We are proud of our comprehensive lineup of prime, government, and tax-exempt money market funds.
Thank you for choosing to invest with Wells Fargo Advantage Funds. We appreciate your confidence in us and remain committed to helping you meet your financial needs. For current information about your fund investments, contact your investment professional, visit our Web site at wellsfargoadvantagefunds.com, or call us directly at 1-800-222-8222. We are available 24 hours a day, 7 days a week.
Sincerely,

Karla M. Rabusch
President
Wells Fargo Advantage Funds
Amid the current challenges of investing—low yields, an unresolved eurozone crisis, limited supply, and regulatory uncertainty—has been the opportunity to provide our clients an important investment option for meeting their short-term cash needs.
| | | | |
| 4 | | Wells Fargo Advantage Cash Investment Money Market Fund | | Performance Highlights (Unaudited) |
INVESTMENT OBJECTIVE
The Fund seeks current income, while preserving capital and liquidity.
ADVISER
Wells Fargo Funds Management, LLC
SUB-ADVISER
Wells Capital Management Incorporated
PORTFOLIO MANAGERS
David D. Sylvester
Laurie White
FUND INCEPTION
October 14, 1987
| | |
PORTFOLIO COMPOSITION1 (AS OF JULY 31, 2012) |
|
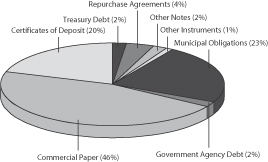
|
| | |
EFFECTIVE MATURITY DISTRIBUTION2 (AS OF JULY 31, 2012) |
|
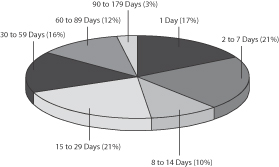 |
|
WEIGHTED AVERAGE MATURITY3 (AS OF JULY 31, 2012) |
26 Days |
|
WEIGHTED AVERAGE FINAL MATURITY4 (AS OF JULY 31, 2012) |
45 Days |
| 1. | Portfolio composition is subject to change and is calculated based on the total investments of the Fund. |
| 2. | Effective maturity distribution is subject to change and is calculated based on the total investments of the Fund. |
| 3. | Weighted Average Maturity (WAM): WAM is an average of the effective maturities of all securities held in the portfolio, weighted by each security’s percentage of total investments. The maturity of a portfolio security is the period remaining until the date on which the principal amount is unconditionally required to be paid, or in the case of a security called for redemption, the date on which the redemption payment is unconditionally required to be made. WAM calculations allow for the maturities of certain securities with demand features or periodic interest rate resets to be shortened. WAM is a way to measure a fund’s sensitivity to potential interest rate changes. |
| 4. | Weighted Average Final Maturity (WAFM): WAFM is an average of the final maturities of all securities held in the portfolio, weighted by their percentage of total investments. The maturity of a portfolio security is the period remaining until the date on which the principal amount is unconditionally required to be paid, or in the case of a security called for redemption, the date on which the redemption payment is unconditionally required to be made. In contrast to WAM, the calculation of WAFM allows for the maturities of certain securities with demand features to be shortened, but not the periodic interest rate resets. WAFM is a way to measure a fund’s potential sensitivity to credit spread changes. |
| | | | | | |
| Performance Highlights (Unaudited) | | Wells Fargo Advantage Cash Investment Money Market Fund | | | 5 | |
AVERAGE ANNUAL TOTAL RETURN5 (%) (AS OF JULY 31, 2012)
| | | | | | | | | | | | | | | | | | | | | | | | | | | | |
| | | | | | | | | | | | | | | | | | Expense Ratios6 | |
| | | Inception Date | | | 6 Months* | | | 1 Year | | | 5 Year | | | 10 Year | | | Gross | | | Net7 | |
Administrator Class (WFAXX) | | | 07/31/2003 | | | | 0.00 | | | | 0.01 | | | | 1.04 | | | | 1.83 | | | | 0.35% | | | | 0.35% | |
Institutional Class (WFIXX) | | | 10/14/1987 | | | | 0.02 | | | | 0.05 | | | | 1.14 | | | | 1.97 | | | | 0.23% | | | | 0.20% | |
Select Class (WFQXX) | | | 06/29/2007 | | | | 0.06 | | | | 0.12 | | | | 1.21 | | | | 2.00 | | | | 0.19% | | | | 0.13% | |
Service Class (NWIXX) | | | 10/14/1987 | | | | 0.00 | | | | 0.01 | | | | 0.96 | | | | 1.73 | | | | 0.52% | | | | 0.50% | |
| * | Returns for periods of less than one year are not annualized. |
| | | | | | | | | | | | | | | | |
FUND YIELD SUMMARY7 (AS OF JULY 31, 2012) | | Administrator
Class | | | Institutional
Class | | | Select
Class | | | Service
Class | |
7-Day Current Yield | | | 0.01% | | | | 0.09% | | | | 0.16% | | | | 0.01% | |
7-Day Compound Yield | | | 0.01% | | | | 0.09% | | | | 0.16% | | | | 0.01% | |
30-Day Simple Yield | | | 0.01% | | | | 0.08% | | | | 0.15% | | | | 0.01% | |
30-Day Compound Yield | | | 0.01% | | | | 0.08% | | | | 0.15% | | | | 0.01% | |
Figures quoted represent past performance, which is no guarantee of future results and do not reflect the deduction of taxes that a shareholder may pay on fund distributions or the redemption of fund shares. Investment returns will fluctuate. The Fund’s yield figures more closely reflect the current earnings of the Fund than the total return figures. Current performance may be lower or higher than the performance data quoted and assumes the reinvestment of dividends and capital gains. Current month-end performance is available at the Fund’s Web site – wellsfargoadvantagefunds.com.
Each class is sold without a front-end sales charge or contingent deferred sales charge. Other fees and expenses apply to an investment in the Fund and are described in the Fund’s current prospectuses.
An investment in a money market fund is not insured or guaranteed by the Federal Deposit Insurance Corporation or any other government agency. Although the Fund seeks to preserve the value of your investment at $1.00 per share, it is possible to lose money by investing in a money market fund.
| 5. | Historical performance shown for the Administrator Class shares prior to their inception reflects the performance of the Service Class shares, and includes the higher expenses applicable to the Service Class shares. If these expenses had not been included, returns would be higher. Historical performance shown for the Select Class shares prior to their inception reflects the performance of the Institutional Class shares, and includes the higher expenses applicable to Institutional Class shares. If these expenses had not been included, returns would be higher. |
| 6. | Reflects the expense ratios as stated in the most recent prospectuses. |
| 7. | The Adviser has committed through May 31, 2013 to waive fees and/or reimburse expenses to the extent necessary to cap the Fund’s Total Annual Fund Operating Expenses After Fee Waiver, excluding certain expenses, at the amounts shown above. Brokerage commissions, stamp duty fees, interest, taxes, acquired fund fees and expenses and extraordinary expenses are excluded from the cap. Without this cap, the Fund’s returns would have been lower. Without waived fees and/or reimbursed expenses, the Fund’s 7-day current yield would have been (0.05)%, 0.06%, 0.10% and (0.22)% for Administrator Class, Institutional Class, Select Class and Service Class, respectively. |
| | | | |
| 6 | | Wells Fargo Advantage Cash Investment Money Market Fund | | Fund Expenses (Unaudited) |
As a shareholder of the Fund, you incur ongoing costs, including management fees, shareholder service fees, and other Fund expenses. This example is intended to help you understand your ongoing costs (in dollars) of investing in the Fund and to compare these costs with the ongoing costs of investing in other mutual funds.
The example is based on an investment of $1,000 invested at the beginning of the six-month period and held for the entire period from February 1, 2012 to July 31, 2012.
Actual Expenses
The “Actual” line of the table below provides information about actual account values and actual expenses. You may use the information in this line, together with the amount you invested, to estimate the expenses that you paid over the period. Simply divide your account value by $1,000 (for example, an $8,600 account value divided by $1,000 = 8.6), then multiply the result by the number in the “Actual” line under the heading entitled “Expenses Paid During Period” for your applicable class of shares to estimate the expenses you paid on your account during this period.
Hypothetical Example for Comparison Purposes
The “Hypothetical” line of the table below provides information about hypothetical account values and hypothetical expenses based on the Fund’s actual expense ratio and an assumed rate of return of 5% per year before expenses, which is not the Fund’s actual return. The hypothetical account values and expenses may not be used to estimate the actual ending account balance or expenses you paid for the period. You may use this information to compare the ongoing costs of investing in the Fund and other funds. To do so, compare this 5% hypothetical example with the 5% hypothetical examples that appear in the shareholder reports of the other funds.
Please note that the expenses shown in the table are meant to highlight your ongoing costs only. Therefore, the “Hypothetical” line of the table is useful in comparing ongoing costs only, and will not help you determine the relative total costs of owning different funds.
| | | | | | | | | | | | | | | | |
| | | Beginning
Account Value
02-01-2012 | | | Ending
Account Value
07-31-2012 | | | Expenses
Paid During
the Period1 | | | Net Annual
Expense Ratio | |
Administrator Class | | | | | | | | | | | | | | | | |
Actual | | $ | 1,000.00 | | | $ | 1,000.05 | | | $ | 1.19 | | | | 0.24 | % |
Hypothetical (5% return before expenses) | | $ | 1,000.00 | | | $ | 1,023.67 | | | $ | 1.21 | | | | 0.24 | % |
Institutional Class | | | | | | | | | | | | | | | | |
Actual | | $ | 1,000.00 | | | $ | 1,000.23 | | | $ | 0.99 | | | | 0.20 | % |
Hypothetical (5% return before expenses) | | $ | 1,000.00 | | | $ | 1,023.87 | | | $ | 1.01 | | | | 0.20 | % |
Select Class | | | | | | | | | | | | | | | | |
Actual | | $ | 1,000.00 | | | $ | 1,000.57 | | | $ | 0.65 | | | | 0.13 | % |
Hypothetical (5% return before expenses) | | $ | 1,000.00 | | | $ | 1,024.22 | | | $ | 0.65 | | | | 0.13 | % |
Service Class | | | | | | | | | | | | | | | | |
Actual | | $ | 1,000.00 | | | $ | 1,000.05 | | | $ | 1.14 | | | | 0.23 | % |
Hypothetical (5% return before expenses) | | $ | 1,000.00 | | | $ | 1,023.72 | | | $ | 1.16 | | | | 0.23 | % |
| 1. | Expenses paid is equal to the annualized expense ratio of each class multiplied by the average account value over the period, multiplied by the number of days in the most recent fiscal half-year divided by the number of days in the fiscal year (to reflect the one-half year period). |
| | | | | | |
| Portfolio of Investments—July 31, 2012 (Unaudited) | | Wells Fargo Advantage Cash Investment Money Market Fund | | | 7 | |
| | | | | | | | | | | | | | | | |
| Security Name | | Interest Rate | | | Maturity Date | | | Principal | | | Value | |
| | | | | | | | | | | | | | | | |
| | | | |
| Certificates of Deposit: 20.21% | | | | | | | | | | | | | | | | |
Banco Del Estado De Chile | | | 0.27 | % | | | 08/13/2012 | | | $ | 40,000,000 | | | $ | 40,000,000 | |
Banco Del Estado De Chile | | | 0.44 | | | | 08/08/2012 | | | | 40,000,000 | | | | 40,000,000 | |
Bank of Montreal | | | 0.19 | | | | 08/01/2012 | | | | 34,000,000 | | | | 34,000,000 | |
Bank of Montreal | | | 0.20 | | | | 08/20/2012 | | | | 46,000,000 | | | | 45,999,879 | |
Bank of Montreal | | | 0.21 | | | | 08/21/2012 | | | | 65,000,000 | | | | 65,000,000 | |
Bank of Montreal | | | 0.23 | | | | 09/20/2012 | | | | 84,000,000 | | | | 84,000,000 | |
Bank of Nova Scotia | | | 0.21 | | | | 09/12/2012 | | | | 14,000,000 | | | | 14,000,000 | |
Bank of Nova Scotia ± | | | 0.30 | | | | 10/18/2012 | | | | 20,000,000 | | | | 20,000,000 | |
Bank of Nova Scotia | | | 0.72 | | | | 08/09/2012 | | | | 7,000,000 | | | | 7,000,762 | |
Bank of Tokyo-Mitsubishi LLC | | | 0.18 | | | | 08/06/2012 | | | | 125,000,000 | | | | 125,000,000 | |
Bank of Tokyo-Mitsubishi LLC | | | 0.19 | | | | 08/24/2012 | | | | 57,000,000 | | | | 57,000,000 | |
Bank of Tokyo-Mitsubishi LLC | | | 0.19 | | | | 08/29/2012 | | | | 49,000,000 | | | | 49,000,000 | |
Bank of Tokyo-Mitsubishi LLC | | | 0.35 | | | | 08/03/2012 | | | | 30,000,000 | | | | 30,000,250 | |
Barclays Bank plc ± | | | 0.92 | | | | 03/15/2013 | | | | 149,000,000 | | | | 149,000,000 | |
Canadian Imperial Bank ± | | | 0.77 | | | | 06/03/2013 | | | | 12,000,000 | | | | 12,031,147 | |
Citibank NA | | | 0.52 | | | | 08/09/2012 | | | | 115,000,000 | | | | 115,000,000 | |
Citibank NA | | | 0.52 | | | | 08/13/2012 | | | | 53,000,000 | | | | 53,000,000 | |
DNB Nor Bank ASA | | | 0.31 | | | | 09/13/2012 | | | | 60,000,000 | | | | 60,000,000 | |
National Australia Bank Limited ± | | | 0.35 | | | | 08/16/2012 | | | | 60,000,000 | | | | 60,004,218 | |
National Australia Bank Limited | | | 0.40 | | | | 08/21/2012 | | | | 64,000,000 | | | | 64,007,098 | |
National Bank of Kuwait | | | 0.18 | | | | 08/01/2012 | | | | 92,000,000 | | | | 92,000,000 | |
Nordea Bank plc | | | 0.87 | | | | 09/13/2012 | | | | 48,400,000 | | | | 48,405,853 | |
Norinchukin Bank | | | 0.17 | | | | 08/03/2012 | | | | 118,000,000 | | | | 118,000,000 | |
Norinchukin Bank | | | 0.20 | | | | 08/24/2012 | | | | 70,000,000 | | | | 70,000,000 | |
Oversea-Chinese Banking Corporation Limited | | | 0.23 | | | | 09/05/2012 | | | | 11,000,000 | | | | 11,000,000 | |
Oversea-Chinese Banking Corporation Limited | | | 0.25 | | | | 08/02/2012 | | | | 25,000,000 | | | | 25,000,000 | |
Oversea-Chinese Banking Corporation Limited | | | 0.26 | | | | 09/04/2012 | | | | 25,000,000 | | | | 25,000,000 | |
Oversea-Chinese Banking Corporation Limited | | | 0.26 | | | | 09/24/2012 | | | | 11,000,000 | | | | 11,000,000 | |
Oversea-Chinese Banking Corporation Limited | | | 0.27 | | | | 09/28/2012 | | | | 10,000,000 | | | | 10,000,000 | |
Royal Bank of Canada ± | | | 0.50 | | | | 07/26/2013 | | | | 75,000,000 | | | | 75,000,000 | |
Royal Bank of Canada ± | | | 0.74 | | | | 12/17/2012 | | | | 53,000,000 | | | | 53,000,000 | |
Skandinaviska Enskilda Banken AG | | | 0.50 | | | | 10/15/2012 | | | | 108,000,000 | | | | 108,000,000 | |
Skandinaviska Enskilda Banken AG | | | 0.70 | | | | 11/28/2012 | | | | 193,000,000 | | | | 193,000,000 | |
Skandinaviska Enskilda Banken AG | | | 0.75 | | | | 10/12/2012 | | | | 16,000,000 | | | | 16,006,686 | |
Standard Chartered Bank ± | | | 0.68 | | | | 03/04/2013 | | | | 124,000,000 | | | | 124,000,000 | |
State Street Bank & Trust | | | 0.17 | | | | 08/14/2012 | | | | 115,000,000 | | | | 115,000,000 | |
State Street Bank & Trust | | | 0.19 | | | | 08/17/2012 | | | | 46,000,000 | | | | 46,000,000 | |
State Street Bank & Trust | | | 0.25 | | | | 09/17/2012 | | | | 46,000,000 | | | | 46,000,000 | |
Sumitomo Mitsui Banking Corporation | | | 0.16 | | | | 08/01/2012 | | | | 90,000,000 | | | | 90,000,000 | |
Sumitomo Mitsui Banking Corporation | | | 0.16 | | | | 08/02/2012 | | | | 118,000,000 | | | | 118,000,000 | |
Sumitomo Mitsui Banking Corporation | | | 0.34 | | | | 08/08/2012 | | | | 50,000,000 | | | | 50,001,262 | |
Svenska Handelsbanken | | | 0.15 | | | | 08/01/2012 | | | | 150,000,000 | | | | 150,000,000 | |
Toronto-Dominion Bank | | | 0.18 | | | | 08/28/2012 | | | | 33,000,000 | | | | 33,000,000 | |
Toronto-Dominion Bank | | | 0.18 | | | | 08/29/2012 | | | | 60,000,000 | | | | 60,000,000 | |
Toronto-Dominion Bank ± | | | 0.45 | | | | 07/26/2013 | | | | 36,000,000 | | | | 36,000,000 | |
| | | | |
Total Certificates of Deposit (Cost $2,847,457,155) | | | | | | | | | | | | | | | 2,847,457,155 | |
| | | | | | | | | | | | | | | | |
The accompanying notes are an integral part of these financial statements.
| | | | |
| 8 | | Wells Fargo Advantage Cash Investment Money Market Fund | | Portfolio of Investments—July 31, 2012 (Unaudited) |
| | | | | | | | | | | | | | | | |
| Security Name | | Interest Rate | | | Maturity Date | | | Principal | | | Value | |
| | | | | | | | | | | | | | | | |
| | | | |
Commercial Paper: 45.91% | | | | | | | | | | | | | | | | |
| | | | |
| Asset-Backed Commercial Paper: 22.57% | | | | | | | | | | | | | | | | |
CAFCO LLC 144A (z) | | | 0.75 | % | | | 10/18/2012 | | | $ | 75,000,000 | | | $ | 74,878,125 | |
Chariot Funding LLC 144A (z) | | | 0.18 | | | | 08/13/2012 | | | | 30,000,000 | | | | 29,998,200 | |
Chariot Funding LLC 144A (z) | | | 0.19 | | | | 08/09/2012 | | | | 10,000,000 | | | | 9,999,578 | |
Chariot Funding LLC 144A (z) | | | 0.21 | | | | 09/12/2012 | | | | 35,000,000 | | | | 34,991,425 | |
Charta LLC 144A (z) | | | 0.75 | | | | 10/18/2012 | | | | 75,000,000 | | | | 74,878,125 | |
Collateralized Commercial Paper Company LLC (z) | | | 0.35 | | | | 09/25/2012 | | | | 75,000,000 | | | | 74,959,896 | |
Collateralized Commercial Paper Company LLC (z) | | | 0.35 | | | | 10/24/2012 | | | | 182,000,000 | | | | 181,851,367 | |
Fairway Finance Corporation 144A (z) | | | 0.18 | | | | 08/10/2012 | | | | 6,000,000 | | | | 5,999,730 | |
Fairway Finance Corporation 144A (z) | | | 0.19 | | | | 08/16/2012 | | | | 5,000,000 | | | | 4,999,604 | |
Fairway Finance Corporation 144A (z) | | | 0.20 | | | | 09/05/2012 | | | | 20,018,000 | | | | 20,014,108 | |
Fairway Finance Corporation 144A (z) | | | 0.21 | | | | 10/02/2012 | | | | 20,027,000 | | | | 20,019,757 | |
Gotham Funding Corporation 144A (z) | | | 0.21 | | | | 08/09/2012 | | | | 7,000,000 | | | | 6,999,673 | |
Gotham Funding Corporation 144A (z) | | | 0.20 | | | | 08/30/2012 | | | | 6,000,000 | | | | 5,998,985 | |
Gotham Funding Corporation 144A (z) | | | 0.21 | | | | 08/13/2012 | | | | 20,000,000 | | | | 19,998,600 | |
Gotham Funding Corporation 144A (z) | | | 0.21 | | | | 08/22/2012 | | | | 32,000,000 | | | | 31,996,081 | |
Gotham Funding Corporation 144A (z) | | | 0.21 | | | | 08/01/2012 | | | | 18,000,000 | | | | 18,000,000 | |
Gotham Funding Corporation 144A (z) | | | 0.21 | | | | 08/08/2012 | | | | 50,000,000 | | | | 49,997,959 | |
Gotham Funding Corporation 144A (z) | | | 0.21 | | | | 08/10/2012 | | | | 32,000,000 | | | | 31,998,320 | |
Gotham Funding Corporation 144A (z) | | | 0.21 | | | | 08/17/2012 | | | | 16,000,000 | | | | 15,998,507 | |
Gotham Funding Corporation 144A (z) | | | 0.21 | | | | 08/23/2012 | | | | 36,000,000 | | | | 35,995,380 | |
Gotham Funding Corporation 144A (z) | | | 0.21 | | | | 08/24/2012 | | | | 15,000,000 | | | | 14,997,988 | |
Gotham Funding Corporation 144A (z) | | | 0.21 | | | | 08/29/2012 | | | | 49,000,000 | | | | 48,991,997 | |
Jupiter Securitization Company LLC 144A (z) | | | 0.18 | | | | 08/13/2012 | | | | 45,000,000 | | | | 44,997,300 | |
Jupiter Securitization Company LLC 144A (z) | | | 0.21 | | | | 08/27/2012 | | | | 20,000,000 | | | | 19,996,967 | |
Jupiter Securitization Company LLC 144A (z) | | | 0.21 | | | | 09/12/2012 | | | | 35,000,000 | | | | 34,991,425 | |
Legacy Capital Company 144A (z) | | | 0.60 | | | | 08/13/2012 | | | | 27,000,000 | | | | 26,994,600 | |
Legacy Capital Company 144A (z) | | | 0.60 | | | | 08/14/2012 | | | | 27,000,000 | | | | 26,994,150 | |
Lexington Parker Capital Company LLC 144A (z) | | | 0.60 | | | | 08/13/2012 | | | | 27,000,000 | | | | 26,994,600 | |
Lexington Parker Capital Company LLC 144A (z) | | | 0.60 | | | | 08/14/2012 | | | | 27,000,000 | | | | 26,994,150 | |
Liberty Funding LLC 144A (z) | | | 0.19 | | | | 08/01/2012 | | | | 12,000,000 | | | | 12,000,000 | |
Liberty Funding LLC 144A (z) | | | 0.19 | | | | 08/15/2012 | | | | 34,000,000 | | | | 33,997,488 | |
Liberty Funding LLC 144A (z) | | | 0.19 | | | | 08/16/2012 | | | | 50,000,000 | | | | 49,996,042 | |
Liberty Funding LLC 144A (z) | | | 0.19 | | | | 08/17/2012 | | | | 55,000,000 | | | | 54,995,356 | |
Liberty Funding LLC 144A (z) | | | 0.19 | | | | 08/24/2012 | | | | 30,000,000 | | | | 29,996,358 | |
Liberty Funding LLC 144A (z) | | | 0.19 | | | | 08/28/2012 | | | | 75,000,000 | | | | 74,989,313 | |
Liberty Funding LLC 144A (z) | | | 0.21 | | | | 08/13/2012 | | | | 22,000,000 | | | | 21,998,460 | |
Liberty Funding LLC 144A (z) | | | 0.23 | | | | 10/26/2012 | | | | 17,000,000 | | | | 16,990,659 | |
Market Street Funding Corporation 144A (z) | | | 0.23 | | | | 08/27/2012 | | | | 10,000,000 | | | | 9,998,339 | |
Market Street Funding Corporation 144A (z) | | | 0.26 | | | | 10/03/2012 | | | | 20,000,000 | | | | 19,990,900 | |
Market Street Funding Corporation 144A (z) | | | 0.26 | | | | 10/16/2012 | | | | 10,000,000 | | | | 9,994,511 | |
Market Street Funding Corporation 144A (z) | | | 0.26 | | | | 10/17/2012 | | | | 24,000,000 | | | | 23,986,653 | |
Market Street Funding Corporation 144A (z) | | | 0.26 | | | | 10/18/2012 | | | | 12,000,000 | | | | 11,993,240 | |
MetLife Short Term Funding 144A (z) | | | 0.20 | | | | 08/01/2012 | | | | 27,000,000 | | | | 27,000,000 | |
MetLife Short Term Funding 144A (z) | | | 0.20 | | | | 09/24/2012 | | | | 17,000,000 | | | | 16,994,900 | |
MetLife Short Term Funding 144A (z) | | | 0.21 | | | | 09/12/2012 | | | | 10,000,000 | | | | 9,997,550 | |
MetLife Short Term Funding 144A (z) | | | 0.21 | | | | 08/06/2012 | | | | 10,000,000 | | | | 9,999,708 | |
MetLife Short Term Funding 144A (z) | | | 0.21 | | | | 08/07/2012 | | | | 30,000,000 | | | | 29,998,950 | |
MetLife Short Term Funding 144A (z) | | | 0.21 | | | | 08/02/2012 | | | | 30,000,000 | | | | 29,999,825 | |
The accompanying notes are an integral part of these financial statements.
| | | | | | |
| Portfolio of Investments—July 31, 2012 (Unaudited) | | Wells Fargo Advantage Cash Investment Money Market Fund | | | 9 | |
| | | | | | | | | | | | | | | | |
| Security Name | | Interest Rate | | | Maturity Date | | | Principal | | | Value | |
| | | | | | | | | | | | | | | | |
| | | | |
| Asset-Backed Commercial Paper (continued) | | | | | | | | | | | | | | | | |
MetLife Short Term Funding 144A (z) | | | 0.22 | % | | | 10/04/2012 | | | $ | 11,000,000 | | | $ | 10,995,698 | |
MetLife Short Term Funding 144A (z) | | | 0.22 | | | | 08/15/2012 | | | | 23,000,000 | | | | 22,998,032 | |
MetLife Short Term Funding 144A (z) | | | 0.23 | | | | 10/02/2012 | | | | 10,000,000 | | | | 9,996,039 | |
MetLife Short Term Funding 144A (z) | | | 0.24 | | | | 10/24/2012 | | | | 33,000,000 | | | | 32,981,520 | |
MetLife Short Term Funding 144A (z) | | | 0.25 | | | | 10/09/2012 | | | | 10,000,000 | | | | 9,995,208 | |
MetLife Short Term Funding 144A (z) | | | 0.25 | | | | 09/05/2012 | | | | 6,000,000 | | | | 5,998,542 | |
MetLife Short Term Funding 144A (z) | | | 0.25 | | | | 09/06/2012 | | | | 26,000,000 | | | | 25,993,500 | |
MetLife Short Term Funding 144A (z) | | | 0.25 | | | | 10/15/2012 | | | | 10,000,000 | | | | 9,994,792 | |
MetLife Short Term Funding 144A (z) | | | 0.25 | | | | 10/25/2012 | | | | 13,000,000 | | | | 12,992,326 | |
Old Line Funding LLC 144A (z) | | | 0.18 | | | | 08/13/2012 | | | | 19,000,000 | | | | 18,998,860 | |
Old Line Funding LLC 144A (z) | | | 0.18 | | | | 08/15/2012 | | | | 26,000,000 | | | | 25,998,180 | |
Old Line Funding LLC 144A (z) | | | 0.18 | | | | 08/20/2012 | | | | 26,000,000 | | | | 25,997,530 | |
Old Line Funding LLC 144A (z) | | | 0.19 | | | | 08/27/2012 | | | | 30,000,000 | | | | 29,995,883 | |
Regency Markets No.1 LLC 144A (z) | | | 0.23 | | | | 08/28/2012 | | | | 35,000,000 | | | | 34,993,963 | |
Salisbury Receivables Company 144A (z) | | | 0.22 | | | | 08/28/2012 | | | | 10,000,000 | | | | 9,998,350 | |
Salisbury Receivables Company 144A (z) | | | 0.22 | | | | 08/30/2012 | | | | 20,000,000 | | | | 19,996,456 | |
Salisbury Receivables Company 144A (z) | | | 0.23 | | | | 08/14/2012 | | | | 18,000,000 | | | | 17,998,505 | |
Salisbury Receivables Company 144A (z) | | | 0.23 | | | | 08/17/2012 | | | | 9,000,000 | | | | 8,999,080 | |
Salisbury Receivables Company 144A (z) | | | 0.23 | | | | 08/22/2012 | | | | 15,000,000 | | | | 14,997,988 | |
Salisbury Receivables Company 144A (z) | | | 0.24 | | | | 09/10/2012 | | | | 11,000,000 | | | | 10,997,067 | |
Salisbury Receivables Company 144A (z) | | | 0.27 | | | | 09/25/2012 | | | | 17,000,000 | | | | 16,992,988 | |
Salisbury Receivables Company 144A (z) | | | 0.27 | | | | 09/26/2012 | | | | 19,000,000 | | | | 18,992,020 | |
Salisbury Receivables Company 144A (z) | | | 0.27 | | | | 09/27/2012 | | | | 13,000,000 | | | | 12,994,443 | |
Salisbury Receivables Company 144A (z) | | | 0.28 | | | | 09/06/2012 | | | | 10,000,000 | | | | 9,997,200 | |
Salisbury Receivables Company 144A (z) | | | 0.28 | | | | 09/13/2012 | | | | 26,000,000 | | | | 25,991,436 | |
Salisbury Receivables Company 144A (z) | | | 0.32 | | | | 08/29/2012 | | | | 10,000,000 | | | | 9,997,511 | |
Salisbury Receivables Company 144A (z) | | | 0.34 | | | | 10/04/2012 | | | | 7,000,000 | | | | 6,995,769 | |
Sheffield Receivables Corporation 144A (z) | | | 0.22 | | | | 08/29/2012 | | | | 10,000,000 | | | | 9,998,289 | |
Solitaire Funding LLC 144A (z) | | | 0.23 | | | | 08/28/2012 | | | | 105,000,000 | | | | 104,981,888 | |
Solitaire Funding LLC 144A (z) | | | 0.30 | | | | 08/01/2012 | | | | 14,000,000 | | | | 14,000,000 | |
Solitaire Funding LLC 144A (z) | | | 0.30 | | | | 08/06/2012 | | | | 22,000,000 | | | | 21,999,083 | |
Solitaire Funding LLC 144A (z) | | | 0.30 | | | | 08/08/2012 | | | | 23,000,000 | | | | 22,998,658 | |
Solitaire Funding LLC 144A (z) | | | 0.30 | | | | 08/15/2012 | | | | 40,000,000 | | | | 39,995,333 | |
Straight-A Funding LLC 144A (z) | | | 0.18 | | | | 08/14/2012 | | | | 5,000,000 | | | | 4,999,675 | |
Straight-A Funding LLC 144A (z) | | | 0.18 | | | | 08/17/2012 | | | | 16,000,000 | | | | 15,998,720 | |
Straight-A Funding LLC 144A (z) | | | 0.18 | | | | 08/30/2012 | | | | 50,000,000 | | | | 49,992,750 | |
Straight-A Funding LLC 144A (z) | | | 0.18 | | | | 09/05/2012 | | | | 10,000,000 | | | | 9,998,250 | |
Straight-A Funding LLC 144A (z) | | | 0.18 | | | | 10/03/2012 | | | | 7,000,000 | | | | 6,997,795 | |
Straight-A Funding LLC 144A (z) | | | 0.18 | | | | 10/10/2012 | | | | 10,000,000 | | | | 9,996,500 | |
Straight-A Funding LLC 144A (z) | | | 0.18 | | | | 10/15/2012 | | | | 122,000,000 | | | | 121,954,250 | |
Straight-A Funding LLC 144A (z) | | | 0.18 | | | | 10/17/2012 | | | | 25,000,000 | | | | 24,990,375 | |
Straight-A Funding LLC 144A (z) | | | 0.18 | | | | 10/18/2012 | | | | 111,000,000 | | | | 110,956,710 | |
Surrey Funding Corporation 144A (z) | | | 0.22 | | | | 08/28/2012 | | | | 10,000,000 | | | | 9,998,350 | |
Surrey Funding Corporation 144A (z) | | | 0.22 | | | | 08/17/2012 | | | | 12,000,000 | | | | 11,998,827 | |
Surrey Funding Corporation 144A (z) | | | 0.28 | | | | 09/17/2012 | | | | 7,000,000 | | | | 6,997,441 | |
Surrey Funding Corporation 144A (z) | | | 0.28 | | | | 09/18/2012 | | | | 15,000,000 | | | | 14,994,400 | |
Sydney Capital Corporation 144A (z) | | | 0.30 | | | | 08/13/2012 | | | | 25,000,000 | | | | 24,997,500 | |
Sydney Capital Corporation 144A (z) | | | 0.30 | | | | 09/21/2012 | | | | 28,000,000 | | | | 27,988,100 | |
Sydney Capital Corporation 144A (z) | | | 0.30 | | | | 09/13/2012 | | | | 22,000,000 | | | | 21,992,117 | |
Sydney Capital Corporation 144A (z) | | | 0.30 | | | | 09/14/2012 | | | | 29,000,000 | | | | 28,989,366 | |
The accompanying notes are an integral part of these financial statements.
| | | | |
| 10 | | Wells Fargo Advantage Cash Investment Money Market Fund | | Portfolio of Investments—July 31, 2012 (Unaudited) |
| | | | | | | | | | | | | | | | |
| Security Name | | Interest Rate | | | Maturity Date | | | Principal | | | Value | |
| | | | | | | | | | | | | | | | |
| | | | |
| Asset-Backed Commercial Paper (continued) | | | | | | | | | | | | | | | | |
Sydney Capital Corporation 144A (z) | | | 0.30 | % | | | 10/03/2012 | | | $ | 20,000,000 | | | $ | 19,989,500 | |
Thunder Bay Funding LLC 144A (z) | | | 0.18 | | | | 08/08/2012 | | | | 38,000,000 | | | | 37,998,670 | |
Thunder Bay Funding LLC 144A (z) | | | 0.18 | | | | 08/14/2012 | | | | 23,000,000 | | | | 22,998,505 | |
Thunder Bay Funding LLC 144A (z) | | | 0.19 | | | | 08/27/2012 | | | | 20,000,000 | | | | 19,997,256 | |
Thunder Bay Funding LLC 144A (z) | | | 0.19 | | | | 09/04/2012 | | | | 28,032,000 | | | | 28,026,970 | |
Thunder Bay Funding LLC 144A (z) | | | 0.20 | | | | 08/20/2012 | | | | 45,000,000 | | | | 44,995,461 | |
Victory Receivables 144A (z) | | | 0.21 | | | | 08/02/2012 | | | | 27,100,000 | | | | 27,099,842 | |
Victory Receivables 144A (z) | | | 0.21 | | | | 08/03/2012 | | | | 7,000,000 | | | | 6,999,918 | |
Victory Receivables 144A (z) | | | 0.21 | | | | 08/08/2012 | | | | 19,000,000 | | | | 18,999,224 | |
Victory Receivables 144A (z) | | | 0.21 | | | | 08/09/2012 | | | | 20,000,000 | | | | 19,999,067 | |
Victory Receivables 144A (z) | | | 0.21 | | | | 08/13/2012 | | | | 36,000,000 | | | | 35,997,480 | |
Victory Receivables 144A (z) | | | 0.21 | | | | 08/14/2012 | | | | 16,996,000 | | | | 16,994,711 | |
Victory Receivables 144A (z) | | | 0.21 | | | | 08/16/2012 | | | | 30,000,000 | | | | 29,997,375 | |
Victory Receivables 144A (z) | | | 0.21 | | | | 08/23/2012 | | | | 43,000,000 | | | | 42,994,482 | |
Victory Receivables 144A (z) | | | 0.21 | | | | 08/15/2012 | | | | 34,031,000 | | | | 34,028,221 | |
Victory Receivables 144A (z) | | | 0.21 | | | | 08/17/2012 | | | | 50,000,000 | | | | 49,995,333 | |
Victory Receivables 144A (z) | | | 0.21 | | | | 08/24/2012 | | | | 14,000,000 | | | | 13,998,122 | |
White Point Funding Incorporated 144A (z) | | | 0.52 | | | | 10/22/2012 | | | | 7,000,000 | | | | 6,991,709 | |
White Point Funding Incorporated 144A (z) | | | 0.57 | | | | 08/20/2012 | | | | 5,000,000 | | | | 4,998,496 | |
| | | | |
| | | | | | | | | | | | | | | 3,180,238,454 | |
| | | | | | | | | | | | | | | | |
| | | | |
| Financial Company Commercial Paper: 18.87% | | | | | | | | | | | | | | | | |
ANZ National Limited 144A(z) | | | 0.28 | | | | 09/20/2012 | | | | 48,000,000 | | | | 47,981,333 | |
ANZ National Limited 144A(z) | | | 0.22 | | | | 08/02/2012 | | | | 23,000,000 | | | | 22,999,859 | |
ANZ National Limited 144A(z) | | | 0.22 | | | | 08/10/2012 | | | | 41,000,000 | | | | 40,997,745 | |
ANZ National Limited 144A(z) | | | 0.29 | | | | 09/25/2012 | | | | 50,000,000 | | | | 49,977,847 | |
ANZ National Limited 144A(z) | | | 0.29 | | | | 10/02/2012 | | | | 43,000,000 | | | | 42,978,524 | |
ASB Finance Limited ±144A | | | 0.54 | | | | 02/25/2013 | | | | 56,000,000 | | | | 56,000,000 | |
ASB Finance Limited ±144A | | | 0.64 | | | | 04/08/2013 | | | | 37,000,000 | | | | 37,000,000 | |
Axis Bank Limited (z) | | | 0.60 | | | | 08/13/2012 | | | | 76,000,000 | | | | 75,984,800 | |
Banco De Chile 144A(z) | | | 0.66 | | | | 09/25/2012 | | | | 13,000,000 | | | | 12,986,892 | |
Banco De Chile 144A(z) | | | 0.67 | | | | 08/06/2012 | | | | 4,000,000 | | | | 3,999,628 | |
Banco De Chile 144A(z) | | | 0.67 | | | | 08/23/2012 | | | | 9,000,000 | | | | 8,996,315 | |
Banco De Chile 144A(z) | | | 0.67 | | | | 08/28/2012 | | | | 18,000,000 | | | | 17,990,955 | |
Banco De Chile 144A(z) | | | 0.67 | | | | 08/08/2012 | | | | 12,000,000 | | | | 11,998,437 | |
Banco De Chile 144A(z) | | | 0.70 | | | | 09/06/2012 | | | | 5,000,000 | | | | 4,996,500 | |
Barclays Bank plc 144A(z) | | | 0.24 | | | | 08/20/2012 | | | | 61,000,000 | | | | 60,992,273 | |
BNZ International Funding Limited 144A(z) | | | 0.24 | | | | 08/03/2012 | | | | 9,500,000 | | | | 9,499,876 | |
BNZ International Funding Limited 144A(z) | | | 0.28 | | | | 09/12/2012 | | | | 14,000,000 | | | | 13,995,427 | |
BNZ International Funding Limited 144A(z) | | | 0.28 | | | | 09/14/2012 | | | | 12,000,000 | | | | 11,995,893 | |
BNZ International Funding Limited 144A(z) | | | 0.53 | | | | 02/28/2013 | | | | 11,000,000 | | | | 11,000,075 | |
Caisse Centrale Desjardins du Quebec 144A(z) | | | 0.18 | | | | 08/07/2012 | | | | 35,000,000 | | | | 34,998,950 | |
Caisse Centrale Desjardins du Quebec 144A(z) | | | 0.18 | | | | 08/16/2012 | | | | 30,000,000 | | | | 29,997,750 | |
Caisse Centrale Desjardins du Quebec 144A(z) | | | 0.18 | | | | 08/17/2012 | | | | 35,000,000 | | | | 34,997,200 | |
Caisse Centrale Desjardins du Quebec 144A(z) | | | 0.19 | | | | 08/20/2012 | | | | 45,000,000 | | | | 44,995,488 | |
Caisse Centrale Desjardins du Quebec 144A(z) | | | 0.20 | | | | 08/08/2012 | | | | 48,000,000 | | | | 47,998,134 | |
Caisse Centrale Desjardins du Quebec 144A(z) | | | 0.20 | | | | 08/09/2012 | | | | 20,000,000 | | | | 19,999,111 | |
Caisse Centrale Desjardins du Quebec 144A(z) | | | 0.20 | | | | 08/10/2012 | | | | 13,000,000 | | | | 12,999,350 | |
Caisse Centrale Desjardins du Quebec 144A(z) | | | 0.21 | | | | 08/03/2012 | | | | 13,000,000 | | | | 12,999,848 | |
The accompanying notes are an integral part of these financial statements.
| | | | | | |
| Portfolio of Investments—July 31, 2012 (Unaudited) | | Wells Fargo Advantage Cash Investment Money Market Fund | | | 11 | |
| | | | | | | | | | | | | | | | |
| Security Name | | Interest Rate | | | Maturity Date | | | Principal | | | Value | |
| | | | | | | | | | | | | | | | |
| | | | |
| Financial Company Commercial Paper (continued) | | | | | | | | | | | | | | | | |
Caisse Centrale Desjardins du Quebec 144A(z) | | | 0.22 | % | | | 10/16/2012 | | | $ | 12,000,000 | | | $ | 11,994,427 | |
Caisse Centrale Desjardins du Quebec 144A(z) | | | 0.25 | | | | 09/04/2012 | | | | 28,000,000 | | | | 27,993,389 | |
Commonwealth Bank of Australia 144A(z) | | | 0.00 | | | | 10/03/2012 | | | | 26,000,000 | | | | 25,991,355 | |
Commonwealth Bank of Australia 144A(z) | | | 0.19 | | | | 08/01/2012 | | | | 40,475,000 | | | | 40,475,000 | |
DBS Bank Limited 144A(z) | | | 0.22 | | | | 09/04/2012 | | | | 20,000,000 | | | | 19,995,844 | |
DBS Bank Limited 144A(z) | | | 0.23 | | | | 08/02/2012 | | | | 20,000,000 | | | | 19,999,872 | |
DBS Bank Limited 144A(z) | | | 0.25 | | | | 08/20/2012 | | | | 53,000,000 | | | | 52,993,007 | |
DBS Bank Limited 144A(z) | | | 0.25 | | | | 08/30/2012 | | | | 12,000,000 | | | | 11,997,583 | |
DBS Bank Limited 144A(z) | | | 0.26 | | | | 09/07/2012 | | | | 11,000,000 | | | | 10,997,061 | |
DBS Bank Limited 144A(z) | | | 0.26 | | | | 09/13/2012 | | | | 27,000,000 | | | | 26,991,615 | |
DBS Bank Limited 144A(z) | | | 0.26 | | | | 10/01/2012 | | | | 10,000,000 | | | | 9,995,594 | |
DBS Bank Limited 144A(z) | | | 0.26 | | | | 10/25/2012 | | | | 65,000,000 | | | | 64,960,097 | |
DBS Bank Limited 144A(z) | | | 0.26 | | | | 10/29/2012 | | | | 20,000,000 | | | | 19,987,144 | |
DBS Bank Limited 144A(z) | | | 0.27 | | | | 10/05/2012 | | | | 53,000,000 | | | | 52,974,758 | |
DNB Nor Bank ASA 144A(z) | | | 0.31 | | | | 09/11/2012 | | | | 57,000,000 | | | | 56,979,876 | |
ICICI Bank Limited (z) | | | 0.64 | | | | 09/10/2012 | | | | 28,000,000 | | | | 27,980,089 | |
JPMorgan Chase & Company (z) | | | 0.28 | | | | 10/30/2012 | | | | 90,000,000 | | | | 89,937,000 | |
Mitsubishi UFJ Trust and Banking Corporation 144A(z) | | | 0.21 | | | | 08/02/2012 | | | | 26,100,000 | | | | 26,099,848 | |
National Australia Funding Corporation 144A(z) | | | 0.18 | | | | 08/07/2012 | | | | 88,000,000 | | | | 87,997,323 | |
Nationwide Building Society 144A(z) | | | 0.55 | | | | 10/01/2012 | | | | 25,000,000 | | | | 24,976,701 | |
Nationwide Building Society 144A(z) | | | 0.58 | | | | 10/12/2012 | | | | 25,000,000 | | | | 24,971,000 | |
Nordea North America (z) | | | 0.30 | | | | 09/07/2012 | | | | 68,000,000 | | | | 67,979,033 | |
Oversea-Chinese Banking Corporation Limited (z) | | | 0.23 | | | | 09/18/2012 | | | | 38,000,000 | | | | 37,988,347 | |
Oversea-Chinese Banking Corporation Limited (z) | | | 0.25 | | | | 08/17/2012 | | | | 44,000,000 | | | | 43,995,112 | |
Oversea-Chinese Banking Corporation Limited (z) | | | 0.25 | | | | 08/22/2012 | | | | 20,000,000 | | | | 19,997,083 | |
Oversea-Chinese Banking Corporation Limited (z) | | | 0.26 | | | | 09/06/2012 | | | | 5,000,000 | | | | 4,998,700 | |
Oversea-Chinese Banking Corporation Limited (z) | | | 0.26 | | | | 08/06/2012 | | | | 4,000,000 | | | | 3,999,856 | |
Oversea-Chinese Banking Corporation Limited (z) | | | 0.27 | | | | 09/26/2012 | | | | 49,000,000 | | | | 48,979,964 | |
Oversea-Chinese Banking Corporation Limited (z) | | | 0.27 | | | | 08/29/2012 | | | | 10,000,000 | | | | 9,997,900 | |
Oversea-Chinese Banking Corporation Limited (z) | | | 0.27 | | | | 08/30/2012 | | | | 9,000,000 | | | | 8,998,043 | |
Oversea-Chinese Banking Corporation Limited (z) | | | 0.27 | | | | 10/11/2012 | | | | 23,000,000 | | | | 22,987,753 | |
Oversea-Chinese Banking Corporation Limited (z) | | | 0.30 | | | | 09/10/2012 | | | | 7,550,000 | | | | 7,547,483 | |
Oversea-Chinese Banking Corporation Limited (z) | | | 0.32 | | | | 10/09/2012 | | | | 21,000,000 | | | | 20,988,078 | |
Principal Life Insurance 144A(z) | | | 0.20 | | | | 08/03/2012 | | | | 5,000,000 | | | | 4,999,944 | |
Principal Life Insurance 144A(z) | | | 0.20 | | | | 08/06/2012 | | | | 12,000,000 | | | | 11,999,667 | |
Principal Life Insurance 144A(z) | | | 0.20 | | | | 08/17/2012 | | | | 5,000,000 | | | | 4,999,556 | |
Suncorp Group Limited 144A(z) | | | 0.45 | | | | 09/13/2012 | | | | 37,000,000 | | | | 36,980,113 | |
Suncorp Group Limited 144A(z) | | | 0.45 | | | | 09/10/2012 | | | | 12,000,000 | | | | 11,994,000 | |
Suncorp Group Limited 144A(z) | | | 0.45 | | | | 09/12/2012 | | | | 12,000,000 | | | | 11,993,700 | |
Suncorp Group Limited 144A(z) | | | 0.45 | | | | 09/17/2012 | | | | 20,000,000 | | | | 19,988,250 | |
Suncorp Group Limited 144A(z) | | | 0.46 | | | | 08/20/2012 | | | | 15,000,000 | | | | 14,996,358 | |
Suncorp Group Limited 144A(z) | | | 0.46 | | | | 08/09/2012 | | | | 13,000,000 | | | | 12,998,671 | |
Suncorp Group Limited 144A(z) | | | 0.47 | | | | 08/02/2012 | | | | 25,000,000 | | | | 24,999,674 | |
Swedbank (z) | | | 0.30 | | | | 08/08/2012 | | | | 30,000,000 | | | | 29,998,250 | |
Swedbank (z) | | | 0.30 | | | | 08/09/2012 | | | | 46,000,000 | | | | 45,996,933 | |
Swedbank (z) | | | 0.30 | | | | 08/10/2012 | | | | 46,000,000 | | | | 45,996,550 | |
Swedbank (z) | | | 0.33 | | | | 09/18/2012 | | | | 3,000,000 | | | | 2,998,680 | |
Swedbank (z) | | | 0.42 | | | | 08/29/2012 | | | | 50,000,000 | | | | 49,983,667 | |
Swedbank (z) | | | 0.42 | | | | 09/10/2012 | | | | 46,000,000 | | | | 45,978,533 | |
Swedbank (z) | | | 0.42 | | | | 09/11/2012 | | | | 46,000,000 | | | | 45,977,997 | |
The accompanying notes are an integral part of these financial statements.
| | | | |
| 12 | | Wells Fargo Advantage Cash Investment Money Market Fund | | Portfolio of Investments—July 31, 2012 (Unaudited) |
| | | | | | | | | | | | | | | | |
| Security Name | | Interest Rate | | | Maturity Date | | | Principal | | | Value | |
| | | | | | | | | | | | | | | | |
| | | | |
| Financial Company Commercial Paper (continued) | | | | | | | | | | | | | | | | |
Toyota Credit Canada Incorporated (z) | | | 0.20 | % | | | 09/25/2012 | | | $ | 14,000,000 | | | $ | 13,995,722 | |
Toyota Credit Canada Incorporated (z) | | | 0.20 | | | | 09/26/2012 | | | | 7,000,000 | | | | 6,997,822 | |
UOB Funding LLC (z) | | | 0.21 | | | | 08/27/2012 | | | | 28,000,000 | | | | 27,995,753 | |
UOB Funding LLC (z) | | | 0.25 | | | | 09/13/2012 | | | | 42,000,000 | | | | 41,987,458 | |
Westpac Banking Corporation 144A (z) | | | 0.26 | | | | 09/17/2012 | | | | 23,000,000 | | | | 22,992,182 | |
Westpac Securities NZ Limited 144A (z) | | | 0.30 | | | | 09/17/2012 | | | | 34,000,000 | | | | 33,986,683 | |
Westpac Securities NZ Limited 144A (z) | | | 0.30 | | | | 09/21/2012 | | | | 40,000,000 | | | | 39,983,000 | |
Westpac Securities NZ Limited ± 144A | | | 0.54 | | | | 02/22/2013 | | | | 58,000,000 | | | | 58,000,000 | |
Westpac Securities NZ Limited ± 144A | | | 0.54 | | | | 02/25/2013 | | | | 35,000,000 | | | | 35,000,000 | |
Westpac Securities NZ Limited 144A | | | 0.61 | | | | 07/22/2013 | | | | 53,000,000 | | | | 53,000,000 | |
Westpac Securities NZ Limited 144A | | | 0.64 | | | | 04/08/2013 | | | | 63,000,000 | | | | 63,008,838 | |
Westpac Securities NZ Limited ± 144A | | | 0.66 | | | | 04/15/2013 | | | | 23,000,000 | | | | 23,008,172 | |
| | | | |
| | | | | | | | | | | | | | | 2,658,940,318 | |
| | | | | | | | | | | | | | | | |
| | | | |
| Other Commercial Paper: 4.47% | | | | | | | | | | | | | | | | |
ACTS Retirement Life Communities Incorporated (z) | | | 0.55 | | | | 08/09/2012 | | | | 13,700,000 | | | | 13,698,325 | |
CNPC Finance 144A (z) | | | 0.38 | | | | 09/17/2012 | | | | 45,000,000 | | | | 44,977,675 | |
CNPC Finance 144A (z) | | | 0.39 | | | | 09/24/2012 | | | | 21,000,000 | | | | 20,987,715 | |
CNPC Finance 144A (z) | | | 0.42 | | | | 08/21/2012 | | | | 28,000,000 | | | | 27,993,467 | |
CNPC Finance 144A (z) | | | 0.42 | | | | 08/22/2012 | | | | 28,000,000 | | | | 27,993,140 | |
CNPC Finance 144A (z) | | | 0.42 | | | | 08/27/2012 | | | | 24,000,000 | | | | 23,992,720 | |
CNPC Finance 144A (z) | | | 0.42 | | | | 09/05/2012 | | | | 11,000,000 | | | | 10,995,508 | |
CNPC Finance 144A (z) | | | 0.42 | | | | 08/02/2012 | | | | 12,000,000 | | | | 11,999,860 | |
Coca-Cola Company 144A (z) | | | 0.16 | | | | 08/06/2012 | | | | 16,000,000 | | | | 15,999,644 | |
Coca-Cola Company 144A (z) | | | 0.16 | | | | 08/07/2012 | | | | 15,000,000 | | | | 14,999,600 | |
Coca-Cola Company 144A (z) | | | 0.22 | | | | 10/22/2012 | | | | 29,000,000 | | | | 28,985,468 | |
General Electric Company (z) | | | 0.15 | | | | 08/21/2012 | | | | 66,000,000 | | | | 65,994,500 | |
General Electric Company (z) | | | 0.15 | | | | 08/22/2012 | | | | 66,000,000 | | | | 65,994,225 | |
Louis Dreyfus Commodities LLC (z) | | | 0.42 | | | | 08/01/2012 | | | | 35,000,000 | | | | 35,000,000 | |
Louis Dreyfus Commodities LLC (z) | | | 0.55 | | | | 08/03/2012 | | | | 7,000,000 | | | | 6,999,786 | |
Louis Dreyfus Commodities LLC (z) | | | 0.55 | | | | 08/06/2012 | | | | 24,000,000 | | | | 23,998,167 | |
Toyota Motor Credit Corporation (z) | | | 0.19 | | | | 08/21/2012 | | | | 80,000,000 | | | | 79,991,556 | |
Toyota Motor Credit Corporation (z) | | | 0.20 | | | | 08/24/2012 | | | | 16,000,000 | | | | 15,997,956 | |
Toyota Motor Credit Corporation (z) | | | 0.20 | | | | 08/28/2012 | | | | 55,000,000 | | | | 54,991,750 | |
Toyota Motor Credit Corporation (z) | | | 0.20 | | | | 08/29/2012 | | | | 38,000,000 | | | | 37,994,089 | |
| | | | |
| | | | | | | | | | | | | | | 629,585,151 | |
| | | | | | | | | | | | | | | | |
| | | | |
Total Commercial Paper (Cost $6,468,763,923) | | | | | | | | | | | | | | | 6,468,763,923 | |
| | | | | | | | | | | | | | | | |
| | | | |
Government Agency Debt: 1.65% | | | | | | | | | | | | | | | | |
FHLB ± | | | 0.30 | | | | 02/05/2013 | | | | 27,500,000 | | | | 27,494,284 | |
FHLB ± | | | 0.31 | | | | 03/07/2013 | | | | 42,000,000 | | | | 41,992,379 | |
FHLB ± | | | 0.31 | | | | 05/09/2013 | | | | 8,000,000 | | | | 7,998,123 | |
FHLB ± | | | 0.32 | | | | 03/28/2013 | | | | 42,000,000 | | | | 41,994,246 | |
FHLB ± | | | 0.33 | | | | 05/02/2013 | | | | 20,000,000 | | | | 19,996,944 | |
FHLB ± | | | 0.34 | | | | 04/01/2013 | | | | 37,000,000 | | | | 37,000,000 | |
FHLB ± | | | 0.34 | | | | 05/17/2013 | | | | 41,000,000 | | | | 41,000,000 | |
FHLB ± | | | 0.36 | | | | 05/17/2013 | | | | 15,000,000 | | | | 15,000,000 | |
| | | | |
Total Government Agency Debt (Cost $232,475,976) | | | | | | | | | | | | | | | 232,475,976 | |
| | | | | | | | | | | | | | | | |
The accompanying notes are an integral part of these financial statements.
| | | | | | |
| Portfolio of Investments—July 31, 2012 (Unaudited) | | Wells Fargo Advantage Cash Investment Money Market Fund | | | 13 | |
| | | | | | | | | | | | | | | | |
| Security Name | | Interest Rate | | | Maturity Date | | | Principal | | | Value | |
| | | | | | | | | | | | | | | | |
| | | | |
Municipal Obligations: 23.24% | | | | | | | | | | | | | | | | |
| | | | |
Alabama: 0.47% | | | | | | | | | | | | | | | | |
| | | | |
| Other Municipal Debt: 0.27% | | | | | | | | | | | | | | | | |
Montgomery County (Tax Revenue) | | | 0.18 | % | | | 08/01/2012 | | | $ | 19,000,000 | | | $ | 19,000,000 | |
Montgomery County (Tax Revenue) | | | 0.18 | | | | 08/02/2012 | | | | 19,000,000 | | | | 19,000,000 | |
| | | | |
| | | | | | | | | | | | | | | 38,000,000 | |
| | | | | | | | | | | | | | | | |
| | | | |
| Variable Rate Demand Notes §: 0.20% | | | | | | | | | | | | | | | | |
Birmingham AL Special Care Facilities Finance Authority Ascension Health Series 2006-C (Miscellaneous Revenue, Morgan Stanley Bank LIQ) 144A | | | 0.23 | | | | 11/15/2046 | | | | 12,625,000 | | | | 12,625,000 | |
Homewood AL Educational Building Authority (Education Revenue, Branch Banking & Trust LOC) | | | 0.15 | | | | 12/01/2043 | | | | 16,000,000 | | | | 16,000,000 | |
| | | | |
| | | | | | | | | | | | | | | 28,625,000 | |
| | | | | | | | | | | | | | | | |
| | | | |
Alaska: 0.18% | | | | | | | | | | | | | | | | |
| | | | |
| Variable Rate Demand Notes §: 0.18% | | | | | | | | | | | | | | | | |
Alaska Housing Finance Corporation Series 2006-0022 (Housing Revenue, U.S. Bank NA LOC & LIQ) | | | 0.13 | | | | 12/01/2030 | | | | 12,735,000 | | | | 12,735,000 | |
Valdez AK Marine Terminal Exxon Pipeline Project (IDR) | | | 0.15 | | | | 10/01/2025 | | | | 12,000,000 | | | | 12,000,000 | |
| | | | |
| | | | | | | | | | | | | | | 24,735,000 | |
| | | | | | | | | | | | | | | | |
| | | | |
Arizona: 0.12% | | | | | | | | | | | | | | | | |
| | | | |
| Variable Rate Demand Notes §: 0.12% | | | | | | | | | | | | | | | | |
Phoenix AZ IDA (Housing Revenue, FHLMC Insured, FHLMC LIQ) | | | 0.20 | | | | 10/01/2029 | | | | 11,500,000 | | | | 11,500,000 | |
Arizona Health Facilities Authority Catholic Healthcare West Loan Program (Health Revenue, Citibank NA LOC) | | | 0.20 | | | | 07/01/2035 | | | | 6,000,000 | | | | 6,000,000 | |
| | | | |
| | | | | | | | | | | | | | | 17,500,000 | |
| | | | | | | | | | | | | | | | |
| | | | |
California: 2.43% | | | | | | | | | | | | | | | | |
| | | | |
| Other Municipal Debt: 0.51% | | | | | | | | | | | | | | | | |
Orange County CA Pension Obligation Series A (Miscellaneous Revenue) | | | 0.75 | | | | 02/01/2013 | | | | 2,000,000 | | | | 2,000,000 | |
Orange County CA Pension Obligation Series A (Miscellaneous Revenue) | | | 0.80 | | | | 11/01/2012 | | | | 8,000,000 | | | | 8,000,000 | |
Orange County CA Pension Obligation Series A (Miscellaneous Revenue) | | | 0.85 | | | | 02/01/2013 | | | | 7,000,000 | | | | 7,000,000 | |
San Francisco CA City & County Public Utilities Commission Series A2T (Utilities Revenue) | | | 0.20 | | | | 09/17/2012 | | | | 12,000,000 | | | | 12,000,000 | |
San Francisco CA City & County Public Utilities Commission Series IAM 14 (Utilities Revenue) | | | 0.20 | | | | 09/10/2012 | | | | 9,000,000 | | | | 9,000,000 | |
San Francisco CA City & County Public Utilities Commission Series IAM 758 (Utilities Revenue) | | | 0.19 | | | | 08/02/2012 | | | | 21,000,000 | | | | 21,000,000 | |
San Jose CA International Airport Series C-1 (Airport Revenue) | | | 0.47 | | | | 09/12/2012 | | | | 5,317,000 | | | | 5,317,000 | |
State of California Series 11B5 (Tax Revenue) | | | 0.18 | | | | 08/17/2012 | | | | 8,000,000 | | | | 8,000,000 | |
| | | | |
| | | | | | | | | | | | | | | 72,317,000 | |
| | | | | | | | | | | | | | | | |
| | | | |
| Variable Rate Demand Notes §: 1.92% | | | | | | | | | | | | | | | | |
California CDA Dublin Ranch Senior Apartments (Housing Revenue, FNMA LIQ) | | | 0.14 | | | | 12/15/2037 | | | | 14,900,000 | | | | 14,900,000 | |
California CDA Series 2554 (Miscellaneous Revenue, FSA Insured, Morgan Stanley Bank LIQ) | | | 0.23 | | | | 07/01/2047 | | | | 10,000,000 | | | | 10,000,000 | |
The accompanying notes are an integral part of these financial statements.
| | | | |
| 14 | | Wells Fargo Advantage Cash Investment Money Market Fund | | Portfolio of Investments—July 31, 2012 (Unaudited) |
| | | | | | | | | | | | | | | | |
| Security Name | | Interest Rate | | | Maturity Date | | | Principal | | | Value | |
| | | | | | | | | | | | | | | | |
| | | | |
| Variable Rate Demand Notes § (continued) | | | | | | | | | | | | | | | | |
California HFFA Catholic Healthcare Series C (Health Revenue, JPMorgan Chase & Company LOC, NATL-RE Insured) | | | 0.16 | % | | | 07/01/2020 | | | $ | 18,000,000 | | | $ | 18,000,000 | |
California Infrastructure & Economic Development Bank Contemporary Jewish Museum (Miscellaneous Revenue, Bank of America NA LOC) | | | 0.21 | | | | 12/01/2036 | | | | 5,550,000 | | | | 5,550,000 | |
California Series I (Health Revenue, Bank of America NA LOC) | | | 0.22 | | | | 07/01/2035 | | | | 22,000,000 | | | | 22,000,000 | |
JPMorgan Chase PUTTER/DRIVER Trust Series 3164 (GO, JPMorgan Chase & Company LIQ) 144A | | | 0.16 | | | | 08/01/2031 | | | | 14,000,000 | | | | 14,000,000 | |
Los Angeles CA Beverly Park Apartments Series A (Housing Revenue, FHLMC Insured & LIQ) | | | 0.14 | | | | 08/01/2018 | | | | 12,000,000 | | | | 12,000,000 | |
Los Angeles CA Community RDA Academy Village Apartments Series A (Housing Revenue, FHLMC Insured, FHLMC LIQ) | | | 0.14 | | | | 10/01/2019 | | | | 16,000,000 | | | | 16,000,000 | |
Los Angeles CA TRAN JPMorgan Chase PUTTER Series 3931 (GO, JPMorgan Chase & Company LIQ) | | | 0.18 | | | | 08/12/2012 | | | | 18,700,000 | | | | 18,700,000 | |
Los Angeles CA TRAN JPMorgan Chase PUTTER Series 3965 (GO, JPMorgan Chase & Company LIQ) 144A | | | 0.18 | | | | 08/12/2012 | | | | 7,265,000 | | | | 7,265,000 | |
Roseville CA Electric System Series A (Miscellaneous Revenue, Morgan Stanley Bank LOC) | | | 0.20 | | | | 02/01/2035 | | | | 24,100,000 | | | | 24,100,000 | |
Sacramento County CA Housing Authority Natomas Park Apartments Issue B (Housing Revenue, FNMA Insured, FNMA LIQ) | | | 0.14 | | | | 07/15/2035 | | | | 15,550,000 | | | | 15,550,000 | |
Sacramento County CA Housing Authority Shadowood Apartments Project Issue A (Housing Revenue, FHLMC Insured & LIQ) | | | 0.14 | | | | 12/01/2022 | | | | 7,945,000 | | | | 7,945,000 | |
San Bernardino County CA COP Series B (Miscellaneous Revenue) | | | 0.30 | | | | 03/01/2017 | | | | 12,297,000 | | | | 12,297,000 | |
San Diego CA Housing Authority MFHR Hillside Garden Apartments Series B (Housing Revenue, FNMA Insured & LIQ) | | | 0.14 | | | | 01/15/2035 | | | | 8,500,000 | | | | 8,500,000 | |
San Diego CA Unified School District JPMorgan Chase PUTTER Trust Series 3934 (GO, JPMorgan Chase & Company LIQ) 144A | | | 0.18 | | | | 08/07/2012 | | | | 8,000,000 | | | | 8,000,000 | |
San Diego CA Unified School District JPMorgan Chase PUTTER Trust Series 3966 (GO, JPMorgan Chase & Company LIQ) 144A | | | 0.18 | | | | 08/12/2012 | | | | 7,570,000 | | | | 7,570,000 | |
San Diego County CA Regional Transportation Community Limited Tax Series A (Tax Revenue, JPMorgan Chase Bank SPA) | | | 0.14 | | | | 04/01/2038 | | | | 3,270,000 | | | | 3,270,000 | |
San Francisco CA City & County RDA Community Facilities District # 4 (Tax Revenue, Bank of America NA LOC) | | | 0.34 | | | | 08/01/2032 | | | | 14,000,000 | | | | 14,000,000 | |
San Francisco CA City & County RDA Notre Dame Apartments Series G (Housing Revenue, Citibank NA LOC) | | | 0.21 | | | | 12/01/2033 | | | | 8,405,000 | | | | 8,405,000 | |
San Francisco CA City & County RDA Series B001 (Miscellaneous Revenue, Morgan Stanley Bank LIQ) 144A | | | 0.29 | | | | 11/01/2041 | | | | 2,000,000 | | | | 2,000,000 | |
San Francisco CA City & County Redevelopment Agency (Housing Revenue, FNMA Insured, FNMA LIQ) | | | 0.14 | | | | 06/15/2034 | | | | 8,700,000 | | | | 8,700,000 | |
San Leandro CA Carlton Plaza Series A (Housing Revenue, FNMA Insured & LIQ) | | | 0.19 | | | | 09/15/2032 | | | | 5,800,000 | | | | 5,800,000 | |
Westminster CA RDA Series 3009 (Tax Revenue, Assured Guaranty Insured, Morgan Stanley Bank LIQ) 144A | | | 0.23 | | | | 11/01/2045 | | | | 5,000,000 | | | | 5,000,000 | |
| | | | |
| | | | | | | | | | | | | | | 269,552,000 | |
| | | | | | | | | | | | | | | | |
| | | | |
Colorado: 0.73% | | | | | | | | | | | | | | | | |
| | | | |
| Variable Rate Demand Notes §: 0.73% | | | | | | | | | | | | | | | | |
Colorado HFA Class I Series A-2 (Housing Revenue, Royal Bank of Canada SPA) | | | 0.16 | | | | 11/01/2026 | | | | 6,000,000 | | | | 6,000,000 | |
Colorado HFA Class I Series B-2 (Housing Revenue, Royal Bank of Canada SPA) | | | 0.16 | | | | 05/01/2038 | | | | 18,000,000 | | | | 18,000,000 | |
Colorado HFA Taxable MFHR Project B-2 (Housing Revenue, FHLB SPA) | | | 0.18 | | | | 05/01/2050 | | | | 34,415,000 | | | | 34,415,000 | |
The accompanying notes are an integral part of these financial statements.
| | | | | | |
| Portfolio of Investments—July 31, 2012 (Unaudited) | | Wells Fargo Advantage Cash Investment Money Market Fund | | | 15 | |
| | | | | | | | | | | | | | | | |
| Security Name | | Interest Rate | | | Maturity Date | | | Principal | | | Value | |
| | | | | | | | | | | | | | | | |
| | | | |
| Variable Rate Demand Notes § (continued) | | | | | | | | | | | | | | | | |
Denver CO City & County Subseries G1 (Port Authority Revenue, Assured Guaranty Insured, Morgan Stanley Bank SPA) | | | 0.26 | % | | | 11/15/2025 | | | $ | 9,000,000 | | | $ | 9,000,000 | |
Denver CO City & County Subseries G2 (Port Authority Revenue, Assured Guaranty Insured, Morgan Stanley Bank SPA) | | | 0.26 | | | | 11/15/2025 | | | | 9,550,000 | | | | 9,550,000 | |
Denver CO Public Schools Series A-4 (Education Revenue, Royal Bank of Canada LOC, AGM Insured) | | | 0.17 | | | | 12/15/2037 | | | | 16,000,000 | | | | 16,000,000 | |
Royal Bank of Canada Municipal Products Incorporated Trust Series E-25 (Miscellaneous Revenue, Royal Bank of Canada LOC & LIQ) 144A | | | 0.18 | | | | 11/15/2025 | | | | 10,000,000 | | | | 10,000,000 | |
| | | | |
| | | | | | | | | | | | | | | 102,965,000 | |
| | | | | | | | | | | | | | | | |
| | | | |
Connecticut: 0.33% | | | | | | | | | | | | | | | | |
| | | | |
| Variable Rate Demand Notes §: 0.33% | | | | | | | | | | | | | | | | |
Connecticut HFA Series C-2 (Housing Revenue, Bank of Tokyo-Mitsubishi SPA) | | | 0.15 | | | | 05/15/2034 | | | | 25,205,000 | | | | 25,205,000 | |
New Britain CT Taxable Pension Series C (GO, JPMorgan Chase & Company LOC) | | | 0.32 | | | | 02/01/2026 | | | | 21,800,000 | | | | 21,800,000 | |
| | | | |
| | | | | | | | | | | | | | | 47,005,000 | |
| | | | | | | | | | | | | | | | |
| | | | |
Delaware: 0.18% | | | | | | | | | | | | | | | | |
| | | | |
| Variable Rate Demand Notes §: 0.18% | | | | | | | | | | | | | | | | |
Puttable Floating Option Taxable Notes Series TN (Tax Revenue) 144A | | | 0.90 | | | | 11/15/2012 | | | | 15,755,000 | | | | 15,755,000 | |
Puttable Floating Option Taxable Notes Series TN (Tax Revenue) 144A | | | 0.90 | | | | 09/01/2034 | | | | 10,000,000 | | | | 10,000,000 | |
| | | | |
| | | | | | | | | | | | | | | 25,755,000 | |
| | | | | | | | | | | | | | | | |
| | | | |
District of Columbia: 0.23% | | | | | | | | | | | | | | | | |
| | | | |
| Other Municipal Debt: 0.10% | | | | | | | | | | | | | | | | |
District Columbia Water & Sewer Authority Series C (Water & Sewer Revenue) | | | 0.20 | | | | 09/17/2012 | | | | 10,000,000 | | | | 10,000,000 | |
Metropolitan Washington DC Airports Authority Series 1-C (Airport Revenue) | | | 0.21 | | | | 08/14/2012 | | | | 4,000,000 | | | | 4,000,000 | |
| | | | |
| | | | | | | | | | | | | | | 14,000,000 | |
| | | | | | | | | | | | | | | | |
| | | | |
| Variable Rate Demand Notes §: 0.13% | | | | | | | | | | | | | | | | |
District of Columbia George Washington University (Education Revenue, Bank of America NA LOC) | | | 0.22 | | | | 09/15/2029 | | | | 11,000,000 | | | | 11,000,000 | |
District of Columbia TRAN PUTTER Series 4026 (GO, JPMorgan Chase & Company LIQ) 144A | | | 0.18 | | | | 09/28/2012 | | | | 7,400,000 | | | | 7,400,000 | |
| | | | |
| | | | | | | | | | | | | | | 18,400,000 | |
| | | | | | | | | | | | | | | | |
| | | | |
Florida: 0.38% | | | | | | | | | | | | | | | | |
| | | | |
| Variable Rate Demand Notes §: 0.38% | | | | | | | | | | | | | | | | |
Florida HEFAR Ringling College of Arts & Design Incorporated Project Series 2008 (Education Revenue, PNC Bank NA LOC) | | | 0.15 | | | | 03/01/2038 | | | | 2,865,000 | | | | 2,865,000 | |
JPMorgan Chase PUTTER Trust Series 4128 (Miscellaneous Revenue, JPMorgan Chase Bank LOC & LIQ) 144A | | | 0.22 | | | | 03/01/2021 | | | | 14,990,000 | | | | 14,990,000 | |
JPMorgan Chase PUTTERS/DRIVER Trust Series 4172 (Lease Revenue) 144A | | | 0.20 | | | | 01/01/2020 | | | | 4,000,000 | | | | 4,000,000 | |
Miami-Dade County FL Eclipse Funding Trust (Tax Revenue, U.S. Bank NA) | | | 0.14 | | | | 07/01/2013 | | | | 7,380,000 | | | | 7,380,000 | |
The accompanying notes are an integral part of these financial statements.
| | | | |
| 16 | | Wells Fargo Advantage Cash Investment Money Market Fund | | Portfolio of Investments—July 31, 2012 (Unaudited) |
| | | | | | | | | | | | | | | | |
| Security Name | | Interest Rate | | | Maturity Date | | | Principal | | | Value | |
| | | | | | | | | | | | | | | | |
| | | | |
| Variable Rate Demand Notes § (continued) | | | | | | | | | | | | | | | | |
Palm Beach County FL Pine Crest Preparatory School Incorporated Project Series 2008 (Education Revenue, Bank of America NA LOC) | | | 0.24 | % | | | 06/01/2032 | | | $ | 14,520,000 | | | $ | 14,520,000 | |
Volusia County FL Eclipse Funding Trust Series 0008 (Miscellaneous Revenue, U.S. Bank NA LOC, FSA Insured) | | | 0.14 | | | | 08/01/2013 | | | | 4,790,000 | | | | 4,790,000 | |
Volusia County FL Eclipse Funding Trust Series 0036 (Miscellaneous Revenue, U.S. Bank NA LOC, FSA Insured) | | | 0.14 | | | | 08/01/2032 | | | | 4,725,000 | | | | 4,725,000 | |
| | | | |
| | | | | | | | | | | | | | | 53,270,000 | |
| | | | | | | | | | | | | | | | |
| | | | |
Georgia: 0.19% | | | | | | | | | | | | | | | | |
| | | | |
| Variable Rate Demand Notes §: 0.19% | | | | | | | | | | | | | | | | |
Columbus GA Housing Development Authority PFOTER Series TN-024 (Housing Revenue, ACA Insured) 144A | | | 0.50 | | | | 10/01/2039 | | | | 13,000,000 | | | | 13,000,000 | |
Richmond County GA Development Authority (Education Revenue) | | | 0.17 | | | | 07/01/2037 | | | | 10,690,000 | | | | 10,690,000 | |
Wayne County GA IDA Rayonier Incorporated Project (IDR, Bank of America NA LOC) | | | 0.25 | | | | 05/01/2020 | | | | 3,000,000 | | | | 3,000,000 | |
| | | | |
| | | | | | | | | | | | | | | 26,690,000 | |
| | | | | | | | | | | | | | | | |
| | | | |
Illinois: 1.06% | | | | | | | | | | | | | | | | |
| | | | |
| Variable Rate Demand Notes §: 1.06% | | | | | | | | | | | | | | | | |
Chicago IL Water District Eclipse Funding Trust Series 2006-A (Water & Sewer Revenue, U.S. Bank NA LOC) | | | 0.14 | | | | 05/01/2014 | | | | 8,985,000 | | | | 8,985,000 | |
Cook County IL Series D-1 (GO, Harris NA SPA) | | | 0.17 | | | | 11/01/2030 | | | | 46,600,000 | | | | 46,600,000 | |
Cook County IL Series D-2 (GO, Northern Trust Company SPA) | | | 0.17 | | | | 11/01/2030 | | | | 17,400,000 | | | | 17,400,000 | |
Illinois Development Finance Authority Village of Oak Park Residence Corporation Project Series 2001 (Housing Revenue, PNC Bank NA LOC) | | | 0.17 | | | | 07/01/2041 | | | | 10,000,000 | | | | 10,000,000 | |
Illinois Educational Facilities Authority Field Museum National History (Education Revenue, Bank of America NA LOC, GO of Corporation Insured) | | | 0.27 | | | | 11/01/2032 | | | | 14,900,000 | | | | 14,900,000 | |
Illinois Finance Authority Revenue University of Chicago (Education Revenue, Bank of America NA LIQ) | | | 0.13 | | | | 07/01/2038 | | | | 32,860,000 | | | | 32,860,000 | |
Illinois Toll Highway Authority Priority Series A 2A (Transportation Revenue, Bank of Tokyo-Mitsubishi LOC) | | | 0.16 | | | | 07/01/2030 | | | | 14,500,000 | | | | 14,500,000 | |
Illinois Toll Highway Authority Series A-1B (Transportation Revenue, PNC Bank NA LOC) | | | 0.15 | | | | 07/01/2030 | | | | 4,000,000 | | | | 4,000,000 | |
| | | | |
| | | | | | | | | | | | | | | 149,245,000 | |
| | | | | | | | | | | | | | | | |
| | | | |
Indiana: 0.48% | | | | | | | | | | | | | | | | |
| | | | |
| Variable Rate Demand Notes §: 0.48% | | | | | | | | | | | | | | | | |
Indiana Finance Authority Trinity Health Credit Group Series 2008D-1 (Health Revenue) | | | 0.12 | | | | 12/01/2034 | | | | 17,000,000 | | | | 17,000,000 | |
Richmond IN Reid Hospital & Health Care Services Incorporated (Health Revenue, AGM Insured, JPMorgan Chase Bank LOC) | | | 0.18 | | | | 01/01/2040 | | | | 8,630,000 | | | | 8,630,000 | |
Indiana Finance Authority Community Health Network Project Series 2009 (Health Revenue, PNC Bank NA LOC) | | | 0.15 | | | | 07/01/2039 | | | | 8,600,000 | | | | 8,600,000 | |
Indiana Finance Authority Parkview Health System Obligation Group Project Series 2009 C (Health Revenue, PNC Bank NA LOC) | | | 0.15 | | | | 11/01/2039 | | | | 9,060,000 | | | | 9,060,000 | |
Indianapolis Local Public Improvement Bond Bank ROC 11-R-1179 (Water & Sewer Revenue, Assured Guaranty Insured, Citibank NA LIQ) 144A | | | 0.30 | | | | 01/01/2017 | | | | 24,825,000 | | | | 24,825,000 | |
| | | | |
| | | | | | | | | | | | | | | 68,115,000 | |
| | | | | | | | | | | | | | | | |
The accompanying notes are an integral part of these financial statements.
| | | | | | |
| Portfolio of Investments—July 31, 2012 (Unaudited) | | Wells Fargo Advantage Cash Investment Money Market Fund | | | 17 | |
| | | | | | | | | | | | | | | | |
| Security Name | | Interest Rate | | | Maturity Date | | | Principal | | | Value | |
| | | | | | | | | | | | | | | | |
| | | | |
Iowa: 0.16% | | | | | | | | | | | | | | | | |
| | | | |
| Variable Rate Demand Note §: 0.16% | | | | | | | | | | | | | | | | |
Iowa Finance Authority Student Housing Des Moines LLC Project A (Miscellaneous Revenue, Citibank NA LOC) | | | 0.28 | % | | | 06/01/2039 | | | $ | 22,085,000 | | | $ | 22,085,000 | |
| | | | | | | | | | | | | | | | |
| | | | |
Kentucky: 0.30% | | | | | | | | | | | | | | | | |
| | | | |
| Variable Rate Demand Notes §: 0.30% | | | | | | | | | | | | | | | | |
Kentucky EDFA Goodwill Industries Kentucky Incorporated Project Series 2007 (Miscellaneous Revenue, PNC Bank NA LOC) | | | 0.22 | | | | 12/01/2037 | | | | 9,750,000 | | | | 9,750,000 | |
Kentucky Housing Corporation Series M (Housing Revenue, PNC Bank NA SPA) | | | 0.18 | | | | 01/01/2033 | | | | 16,000,000 | | | | 16,000,000 | |
Louisville & Jefferson Counties KY Sewer District JPMorgan Chase PUTTER/DRIVER Trust Series 4012 (Water & Sewer Revenue, JPMorgan Chase Bank LOC) 144A | | | 0.18 | | | | 12/12/2012 | | | | 16,000,000 | | | | 16,000,000 | |
| | | | |
| | | | | | | | | | | | | | | 41,750,000 | |
| | | | | | | | | | | | | | | | |
| | | | |
Louisiana: 0.42% | | | | | | | | | | | | | | | | |
| | | | |
| Variable Rate Demand Notes §: 0.42% | | | | | | | | | | | | | | | | |
East Baton Rouge Parish LA IDR ExxonMobil Project Series A (IDR) | | | 0.15 | | | | 08/01/2035 | | | | 20,000,000 | | | | 20,000,000 | |
Louisiana Stadium & Exposition PFOTER Series TN-013 (Miscellaneous Revenue, Bank of America NA LIQ) 144A | | | 0.50 | | | | 07/01/2036 | | | | 17,440,000 | | | | 17,440,000 | |
Louisiana State GO JPMorgan Chase PUTTER Series 4049 (GO, AGM Insured, JPMorgan Chase & Company LIQ) 144A | | | 0.18 | | | | 05/01/2013 | | | | 10,200,000 | | | | 10,200,000 | |
St. James Parish LA Nucor Steel LLC Project Gulf Opportunity Zone Series 2010 A-1 (IDR) | | | 0.16 | | | | 11/01/2040 | | | | 6,500,000 | | | | 6,500,000 | |
St. James Parish LA Nucor Steel LLC Project Gulf Opportunity Zone Series 2010 B-1 (IDR) | | | 0.16 | | | | 11/01/2040 | | | | 5,000,000 | | | | 5,000,000 | |
| | | | |
| | | | | | | | | | | | | | | 59,140,000 | |
| | | | | | | | | | | | | | | | |
| | | | |
Maryland: 0.50% | | | | | | | | | | | | | | | | |
| | | | |
| Variable Rate Demand Notes §: 0.50% | | | | | | | | | | | | | | | | |
Maryland CDA Series 2006-G (Housing Revenue, State Street Bank & Trust Company SPA) | | | 0.19 | | | | 09/01/2040 | | | | 13,700,000 | | | | 13,700,000 | |
Maryland Community Development Administration Series D (Housing Revenue) | | | 0.18 | | | | 09/01/2038 | | | | 18,890,000 | | | | 18,890,000 | |
Maryland Health & HEFAR Series D (Miscellaneous Revenue, Bank of America NA LOC) | | | 0.28 | | | | 01/01/2029 | | | | 22,680,000 | | | | 22,680,000 | |
PFOTER (Tax Revenue) | | | 0.34 | | | | 10/15/2022 | | | | 15,750,000 | | | | 15,750,000 | |
| | | | |
| | | | | | | | | | | | | | | 71,020,000 | |
| | | | | | | | | | | | | | | | |
| | | | |
Massachusetts: 0.30% | | | | | | | | | | | | | | | | |
| | | | |
| Variable Rate Demand Notes §: 0.30% | | | | | | | | | | | | | | | | |
Massachusetts Development Finance Agency Babson College Series B (Education Revenue, Citizens Bank LOC) | | | 0.18 | | | | 10/01/2031 | | | | 24,575,000 | | | | 24,575,000 | |
Massachusetts Royal Bank of Canada Municipal Products Incorporated Trust Series E-32 (GO, Royal Bank of Canada LOC & LIQ) 144A | | | 0.13 | | | | 09/01/2013 | | | | 18,000,000 | | | | 18,000,000 | |
| | | | |
| | | | | | | | | | | | | | | 42,575,000 | |
| | | | | | | | | | | | | | | | |
The accompanying notes are an integral part of these financial statements.
| | | | |
| 18 | | Wells Fargo Advantage Cash Investment Money Market Fund | | Portfolio of Investments—July 31, 2012 (Unaudited) |
| | | | | | | | | | | | | | | | |
| Security Name | | Interest Rate | | | Maturity Date | | | Principal | | | Value | |
| | | | | | | | | | | | | | | | |
| | | | |
Michigan: 0.38% | | | | | | | | | | | | | | | | |
| | | | |
| Variable Rate Demand Notes §: 0.38% | | | | | | | | | | | | | | | | |
Michigan Housing Development Authority Series A (Housing Revenue, Bank of Tokyo-Mitsubishi SPA) | | | 0.17 | % | | | 04/01/2040 | | | $ | 10,000,000 | | | $ | 10,000,000 | |
Michigan Housing Development Authority Series A (Housing Revenue, GO of Authority Insured, JPMorgan Chase & Company SPA) | | | 0.20 | | | | 10/01/2037 | | | | 3,900,000 | | | | 3,900,000 | |
Michigan State Housing Development Authority Series D (Housing Revenue) | | | 0.18 | | | | 12/01/2038 | | | | 25,000,000 | | | | 25,000,000 | |
Michigan State University Revenues Series A (Education Revenue) | | | 0.15 | | | | 02/15/2033 | | | | 8,205,000 | | | | 8,205,000 | |
University of Michigan Series B (Education Revenue, Northern Trust Company SPA) | | | 0.14 | | | | 04/01/2042 | | | | 6,000,000 | | | | 6,000,000 | |
| | | | |
| | | | | | | | | | | | | | | 53,105,000 | |
| | | | | | | | | | | | | | | | |
| | | | |
Minnesota: 0.20% | | | | | | | | | | | | | | | | |
| | | | |
| Variable Rate Demand Notes §: 0.20% | | | | | | | | | | | | | | | | |
Minnesota Office of Higher Education Supplemental Student Loan Project Series B (Education Revenue, State Street Bank & Trust Company LOC) | | | 0.16 | | | | 09/01/2046 | | | | 6,000,000 | | | | 6,000,000 | |
Ramsey County MN Housing & Redevelopment MFHR Gateway Apartments LP Series A (Housing Revenue, Bank of America NA LOC) | | | 0.47 | | | | 10/01/2038 | | | | 6,000,000 | | | | 6,000,000 | |
St. Anthony MN Landings Silver Lake Project Series A (Housing Revenue, Bank of America NA LOC) | | | 0.47 | | | | 10/01/2037 | | | | 10,400,000 | | | | 10,400,000 | |
St. Cloud MN CentraCare Health System Series A (Health Revenue, Assured Guaranty Insured, JPMorgan Chase Bank SPA) | | | 0.38 | | | | 05/01/2042 | | | | 6,000,000 | | | | 6,000,000 | |
| | | | |
| | | | | | | | | | | | | | | 28,400,000 | |
| | | | | | | | | | | | | | | | |
| | | | |
Mississippi: 0.48% | | | | | | | | | | | | | | | | |
| | | | |
| Variable Rate Demand Notes §: 0.48% | | | | | | | | | | | | | | | | |
Mississippi Business Finance Commission Gulf Opportunity Chevron USA Incorporated Series K (IDR) | | | 0.15 | | | | 11/01/2035 | | | | 14,000,000 | | | | 14,000,000 | |
Mississippi Business Finance Commission Gulf Opportunity Chevron USA Incorporated Series D (IDR) | | | 0.16 | | | | 11/01/2035 | | | | 5,000,000 | | | | 5,000,000 | |
Mississippi Business Finance Commission Gulf Opportunity Chevron USA Incorporated Project Series A (IDR) | | | 0.16 | | | | 12/01/2030 | | | | 9,000,000 | | | | 9,000,000 | |
Mississippi Business Finance Commission Gulf Opportunity Chevron USA Incorporated Project Series H (IDR) | | | 0.16 | | | | 11/01/2035 | | | | 9,000,000 | | | | 9,000,000 | |
Mississippi Nissan Project Series A (Tax Revenue, Bank of America NA SPA) | | | 0.24 | | | | 11/01/2028 | | | | 30,730,000 | | | | 30,728,851 | |
| | | | |
| | | | | | | | | | | | | | | 67,728,851 | |
| | | | | | | | | | | | | | | | |
| | | | |
Missouri: 0.47% | | | | | | | | | | | | | | | | |
| | | | |
| Variable Rate Demand Notes §: 0.47% | | | | | | | | | | | | | | | | |
Kansas City MO Special Obligation Roe Bartle Series E (Tax Revenue, Sumitomo Mitsui Banking Corporation LOC) | | | 0.16 | | | | 04/15/2034 | | | | 52,675,000 | | | | 52,675,000 | |
Missouri Development Finance Board Nelson Gallery Foundation Series A (Miscellaneous Revenue, JPMorgan Chase Bank SPA) | | | 0.17 | | | | 12/01/2037 | | | | 5,000,000 | | | | 5,000,000 | |
Missouri Joint Municipal Electric Utility Commission Power Prairie Eclipse Funding Trust Series 2007-0111 (Miscellaneous Revenue, U.S. Bank NA LOC & LIQ) | | | 0.13 | | | | 01/01/2032 | | | | 8,015,000 | | | | 8,015,000 | |
| | | | |
| | | | | | | | | | | | | | | 65,690,000 | |
| | | | | | | | | | | | | | | | |
The accompanying notes are an integral part of these financial statements.
| | | | | | |
| Portfolio of Investments—July 31, 2012 (Unaudited) | | Wells Fargo Advantage Cash Investment Money Market Fund | | | 19 | |
| | | | | | | | | | | | | | | | |
| Security Name | | Interest Rate | | | Maturity Date | | | Principal | | | Value | |
| | | | | | | | | | | | | | | | |
| | | | |
Nebraska: 0.34% | | | | | | | | | | | | | | | | |
| | | | |
| Variable Rate Demand Note §: 0.34% | | | | | | | | | | | | | | | | |
Central Plains NE Nebraska Gas Project #2 Series 2009 (Utilities Revenue, Royal Bank of Canada SPA) | | | 0.15 | % | | | 08/01/2039 | | | $ | 47,695,000 | | | $ | 47,695,000 | |
| | | | | | | | | | | | | | | | |
| | | | |
Nevada: 0.29% | | | | | | | | | | | | | | | | |
| | | | |
| Variable Rate Demand Notes §: 0.29% | | | | | | | | | | | | | | | | |
Las Vegas NV EDFA Andre Agassi Foundation Project (Miscellaneous Revenue, Bank of America NA LOC) | | | 0.25 | | | | 10/01/2035 | | | | 25,465,000 | | | | 25,465,000 | |
Las Vegas NV EDFA Keep Memory Alive Project Series 2007A (Miscellaneous Revenue, PNC Bank NA LOC) | | | 0.15 | | | | 05/01/2037 | | | | 15,800,000 | | | | 15,800,000 | |
| | | | |
| | | | | | | | | | | | | | | 41,265,000 | |
| | | | | | | | | | | | | | | | |
| | | | |
New Jersey: 0.98% | | | | | | | | | | | | | | | | |
| | | | |
| Variable Rate Demand Notes §: 0.98% | | | | | | | | | | | | | | | | |
New Jersey EDA NUI Corporation Project Series A (Utilities Revenue, JPMorgan Chase Bank LOC) | | | 0.19 | | | | 06/01/2026 | | | | 7,000,000 | | | | 7,000,000 | |
New Jersey EDA Pivotal Utility Holdings Incorporated Project Series 2007 (Utilities Revenue, JPMorgan Chase Bank LOC) | | | 0.19 | | | | 06/01/2032 | | | | 9,000,000 | | | | 9,000,000 | |
New Jersey Housing & Mortgage Finance Agency AMT SFMR Series Y (Housing Revenue, Royal Bank of Canada SPA) | | | 0.15 | | | | 10/01/2039 | | | | 10,000,000 | | | | 10,000,000 | |
New Jersey State TRAN Series A (Miscellaneous Revenue) (i) | | | 0.50 | | | | 06/27/2013 | | | | 74,500,000 | | | | 74,513,969 | |
New Jersey Tobacco Settlement Financing Corporation Clipper Tax-Exempt Certificate Trust Series 2009-40 (Miscellaneous Revenue, State Street Bank & Trust Company LIQ) | | | 0.15 | | | | 06/01/2032 | | | | 23,505,000 | | | | 23,505,000 | |
New Jersey TTFA PUTTER Series 2009-70 (Transportation Revenue, State Street Bank & Trust Company LIQ) | | | 0.15 | | | | 12/15/2023 | | | | 10,000,000 | | | | 10,000,000 | |
Salem County NJ PCFA Atlantic City Electric Company Project Series A (Utilities Revenue, JPMorgan Chase & Company LOC) | | | 0.17 | | | | 04/15/2014 | | | | 4,000,000 | | | | 4,000,000 | |
| | | | |
| | | | | | | | | | | | | | | 138,018,969 | |
| | | | | | | | | | | | | | | | |
| | | | |
New Mexico: 0.12% | | | | | | | | | | | | | | | | |
| | | | |
| Variable Rate Demand Notes §: 0.12% | | | | | | | | | | | | | | | | |
New Mexico Municipal Energy Acquisition Authority Gas Supply Series 2009 (Utilities Revenue, Royal Bank of Canada SPA) | | | 0.15 | | | | 11/01/2039 | | | | 10,980,000 | | | | 10,980,000 | |
New Mexico Educational Authority PFOTER Series 637 (Education Revenue) | | | 0.30 | | | | 04/01/2037 | | | | 6,110,000 | | | | 6,110,000 | |
| | | | |
| | | | | | | | | | | | | | | 17,090,000 | |
| | | | | | | | | | | | | | | | |
| | | | |
New York: 3.54% | | | | | | | | | | | | | | | | |
| | | | |
| Variable Rate Demand Notes §: 3.54% | | | | | | | | | | | | | | | | |
JPMorgan Chase PUTTER/DRIVER Trust (Tax Revenue, JPMorgan Chase & Company LIQ) 144A | | | 0.18 | | | | 04/01/2014 | | | | 8,450,000 | | | | 8,450,000 | |
Metropolitan Transportation Authority New York Dedicated Tax Fund Subseries B-1 (Transportation Revenue, State Street Bank & Trust Company LOC) | | | 0.14 | | | | 11/01/2022 | | | | 7,000,000 | | | | 7,000,000 | |
Metropolitan Transportation Authority New York Series 2002-A ROC RR-II-R-11645 (Transportation Revenue, FSA Insured, Citibank NA LIQ) 144A | | | 0.30 | | | | 11/15/2025 | | | | 805,000 | | | | 805,000 | |
The accompanying notes are an integral part of these financial statements.
| | | | |
| 20 | | Wells Fargo Advantage Cash Investment Money Market Fund | | Portfolio of Investments—July 31, 2012 (Unaudited) |
| | | | | | | | | | | | | | | | |
| Security Name | | Interest Rate | | | Maturity Date | | | Principal | | | Value | |
| | | | | | | | | | | | | | | | |
| | | | |
| Variable Rate Demand Notes § (continued) | | | | | | | | | | | | | | | | |
Nassau County NY Health Care Corporation Series 2009 Subseries B-2 (Health Revenue, TD Bank NA LOC, County Guaranty Insured) | | | 0.14 | % | | | 08/01/2029 | | | $ | 15,000,000 | | | $ | 15,000,000 | |
Nassau County NY Interim Finance Authority Series 2008-B (Tax Revenue, Sumitomo Mitsui Banking Corporation LOC) | | | 0.15 | | | | 11/15/2021 | | | | 51,900,000 | | | | 51,900,000 | |
Nassau County NY Interim Finance Authority Series E (Tax Revenue, JPMorgan Chase & Company SPA) | | | 0.16 | | | | 11/15/2014 | | | | 10,000,000 | | | | 10,000,000 | |
New York City NY Housing Development Corporation Multi-Family Rental Housing The Balton Project Series A (Housing Revenue, Bank of America NA LOC, FHLMC Insured) | | | 0.32 | | | | 09/01/2049 | | | | 10,875,000 | | | | 10,875,000 | |
New York City NY Municipal Water Finance Authority (Water & Sewer Revenue, Citibank NA LIQ) 144A | | | 0.22 | | | | 06/15/2044 | | | | 8,000,000 | | | | 8,000,000 | |
New York City NY Municipal Water Finance Authority Series B3 (Water & Sewer Revenue, Bank of America NA SPA) | | | 0.18 | | | | 06/15/2025 | | | | 40,200,000 | | | | 40,200,000 | |
New York City NY Subseries G-6 (Tax Revenue, Mizuho Corporate Bank LOC) | | | 0.15 | | | | 04/01/2042 | | | | 19,050,000 | | | | 19,050,000 | |
New York City NY Subseries J-10 (GO, Bank of Tokyo-Mitsubishi LOC) | | | 0.13 | | | | 08/01/2027 | | | | 16,300,000 | | | | 16,300,000 | |
New York City NY Subseries L-3 (GO, Bank of America NA SPA) | | | 0.18 | | | | 04/01/2036 | | | | 16,280,000 | | | | 16,280,000 | |
New York City NY Transitional Financing Authority Series C (Tax Revenue, Morgan Stanley Bank LOC) | | | 0.25 | | | | 05/01/2028 | | | | 25,200,000 | | | | 25,200,000 | |
New York Dormitory Authority Revenue Series A (Education Revenue, JPMorgan Chase & Company SPA) | | | 0.15 | | | | 07/01/2039 | | | | 8,000,000 | | | | 8,000,000 | |
New York Environmental Facilities Waste Management Incorporated Project Series 2002-B (IDR, JPMorgan Chase Bank LOC) | | | 0.18 | | | | 05/01/2019 | | | | 3,700,000 | | | | 3,700,000 | |
New York HFA Biltmore Tower Housing Project Series A (Housing Revenue, FNMA Insured) | | | 0.17 | | | | 05/15/2034 | | | | 10,400,000 | | | | 10,400,000 | |
New York HFA Clinto Green South Project Series A (Housing Revenue, FHLMC Insured) | | | 0.17 | | | | 11/01/2038 | | | | 12,000,000 | | | | 12,000,000 | |
New York HFA MFHR Second Mortgage Series A (Housing Revenue, FNMA Insured & LIQ) | | | 0.16 | | | | 05/01/2029 | | | | 5,000,000 | | | | 5,000,000 | |
New York HFA Remeeder Houses Project Series A (Housing Revenue, Citibank NA LOC) | | | 0.25 | | | | 05/01/2039 | | | | 8,685,000 | | | | 8,685,000 | |
New York HFA Victory Housing Project Series 2000-A (Housing Revenue, FHLMC Insured & LIQ) | | | 0.17 | | | | 11/01/2033 | | | | 4,500,000 | | | | 4,500,000 | |
New York HFA Victory Housing Project Series 2004-A (Housing Revenue, FHLMC Insured) | | | 0.17 | | | | 11/01/2033 | | | | 2,700,000 | | | | 2,700,000 | |
New York Housing Finance Agency Eleventh Avenue Housing Project Series A (Housing Revenue, FNMA Insured & LIQ) | | | 0.17 | | | | 05/15/2041 | | | | 24,000,000 | | | | 24,000,000 | |
New York Mortgage Agency Homeowner ROC RR-II-R-11703 (Housing Revenue, Citibank NA LIQ) 144A | | | 0.35 | | | | 10/01/2031 | | | | 4,680,000 | | | | 4,680,000 | |
New York PFOTER Series TN-012 (Miscellaneous Revenue, Bank of America NA LIQ) 144A | | | 0.50 | | | | 06/15/2053 | | | | 23,000,000 | | | | 23,000,000 | |
New York State HFA 600 West 42nd Street Series 2012-A (Housing Revenue, FNMA LIQ) | | | 0.17 | | | | 05/15/2041 | | | | 25,000,000 | | | | 25,000,000 | |
New York State Liberty Development Corporation JPMorgan Chase PUTTER/DRIVER Trust Series 4011Z (Port Authority Revenue, GO of Authority Insured, JPMorgan Chase Bank LIQ) 144A | | | 0.16 | | | | 06/15/2019 | | | | 6,975,000 | | | | 6,975,000 | |
New York State Mortgage Agency Homeowner Mortgage Series 132 (Housing Revenue, JPMorgan Chase Bank SPA) | | | 0.20 | | | | 04/01/2037 | | | | 17,650,000 | | | | 17,650,000 | |
New York Urban Development Corporate Revenue Series A3B (Tax Revenue, JPMorgan Chase Bank SPA) | | | 0.14 | | | | 03/15/2033 | | | | 48,615,000 | | | | 48,615,000 | |
Puttable Floating Option Taxable Notes Series TN-037 (Miscellaneous Revenue, Bank of America NA LIQ) 144A | | | 0.50 | | | | 10/01/2046 | | | | 19,260,000 | | | | 19,260,000 | |
The accompanying notes are an integral part of these financial statements.
| | | | | | |
| Portfolio of Investments—July 31, 2012 (Unaudited) | | Wells Fargo Advantage Cash Investment Money Market Fund | | | 21 | |
| | | | | | | | | | | | | | | | |
| Security Name | | Interest Rate | | | Maturity Date | | | Principal | | | Value | |
| | | | | | | | | | | | | | | | |
| | | | |
| Variable Rate Demand Notes § (continued) | | | | | | | | | | | | | | | | |
Puttable Floating Option Taxable Notes Series TNP-1004 (Resource Recovery Revenue, AMBAC Insured, Bank of America NA LIQ) 144A | | | 0.75 | % | | | 01/29/2046 | | | $ | 45,965,000 | | | $ | 45,965,000 | |
| | | | |
| | | | | | | | | | | | | | | 499,190,000 | |
| | | | | | | | | | | | | | | | |
| | | | |
North Carolina: 0.24% | | | | | | | | | | | | | | | | |
| | | | |
| Variable Rate Demand Notes §: 0.24% | | | | | | | | | | | | | | | | |
North Carolina Education Care Community Health Care Facilities University Health Systems of Eastern Carolina Series 2008 B-2 (Health Revenue, Branch Banking & Trust LOC) | | | 0.15 | | | | 12/01/2036 | | | | 13,980,000 | | | | 13,980,000 | |
Piedmont Triad NC Airport Authority Series 2008 A (Airport Revenue, Branch Banking & Trust LOC) | | | 0.14 | | | | 07/01/2032 | | | | 11,560,000 | | | | 11,560,000 | |
Roanoke Rapids NC Music & Entertainment District Project Series 2007 (Tax Revenue, Bank of America NA LOC) | | | 0.38 | | | | 07/01/2027 | | | | 8,000,000 | | | | 8,000,000 | |
| | | | |
| | | | | | | | | | | | | | | 33,540,000 | |
| | | | | | | | | | | | | | | | |
| | | | |
Ohio: 0.58% | | | | | | | | | | | | | | | | |
| | | | |
| Variable Rate Demand Notes §: 0.58% | | | | | | | | | | | | | | | | |
Allen County OH Catholic Healthcare Series C (Health Revenue, Union Bank NA LOC) | | | 0.15 | | | | 06/01/2034 | | | | 10,000,000 | | | | 10,000,000 | |
Cleveland-Cuyahoga County OH Carnagie 89th Garage & Service Center LLC Project Series 2007 (Health Revenue, JPMorgan Chase Bank LOC) | | | 0.17 | | | | 01/01/2037 | | | | 4,595,000 | | | | 4,595,000 | |
Montgomery County OH Catholic Health Series C-2 (Health Revenue, U.S. Bank NA SPA) | | | 0.16 | | | | 10/01/2041 | | | | 4,000,000 | | | | 4,000,000 | |
Ohio HFA Residential Management Taxable Series I (Housing Revenue, GNMA, FNMA Insured, FHLB SPA) | | | 0.19 | | | | 09/01/2039 | | | | 24,152,000 | | | | 24,152,000 | |
Ohio Housing Finance Agency Mortgage Revenue (Housing Revenue, Citibank NA SPA) | | | 0.25 | | | | 09/01/2036 | | | | 20,000,000 | | | | 20,000,000 | |
Parma OH Community General Hospital Association Series 2006-A (Health Revenue, PNC Bank NA LOC) | | | 0.15 | | | | 11/01/2029 | | | | 9,860,000 | | | | 9,860,000 | |
Warren County OH Health Care Facilities Otterbein Homes Series 1998-B (Health Revenue, U.S. Bank NA LOC) | | | 0.15 | | | | 07/01/2023 | | | | 8,725,000 | | | | 8,725,000 | |
| | | | |
| | | | | | | | | | | | | | | 81,332,000 | |
| | | | | | | | | | | | | | | | |
| | | | |
Oklahoma: 0.08% | | | | | | | | | | | | | | | | |
| | | | |
| Variable Rate Demand Note §: 0.08% | | | | | | | | | | | | | | | | |
Oklahoma Turnpike Authority Series F (Transportation Revenue, JPMorgan Chase Bank SPA) | | | 0.17 | | | | 01/01/2028 | | | | 11,000,000 | | | | 11,000,000 | |
| | | | | | | | | | | | | | | | |
| | | | |
Oregon: 0.07% | | | | | | | | | | | | | | | | |
| | | | |
| Variable Rate Demand Note §: 0.07% | | | | | | | | | | | | | | | | |
Oregon State Housing & Community Services Pearl Family Housing Project 2009 Series B-1 (Housing Revenue, U.S. Bank NA LOC) | | | 0.13 | | | | 02/01/2042 | | | | 9,945,000 | | | | 9,945,000 | |
| | | | | | | | | | | | | | | | |
| | | | |
Pennsylvania: 0.63% | | | | | | | | | | | | | | | | |
| | | | |
| Variable Rate Demand Notes §: 0.63% | | | | | | | | | | | | | | | | |
Berks County PA Municipal Authority Royal Bank of Canada Municipal Products Incorporated Trust Certificates Series C-15 (Health Revenue, Royal Bank of Canada LOC) 144A | | | 0.15 | | | | 11/01/2012 | | | | 4,985,000 | | | | 4,985,000 | |
Montgomery County PA IDA Series 3238 (Health Revenue, FHA Insured, Morgan Stanley Bank LIQ) 144A | | | 0.23 | | | | 08/01/2030 | | | | 6,000,000 | | | | 6,000,000 | |
The accompanying notes are an integral part of these financial statements.
| | | | |
| 22 | | Wells Fargo Advantage Cash Investment Money Market Fund | | Portfolio of Investments—July 31, 2012 (Unaudited) |
| | | | | | | | | | | | | | | | |
| Security Name | | Interest Rate | | | Maturity Date | | | Principal | | | Value | |
| | | | | | | | | | | | | | | | |
| | | | |
| Variable Rate Demand Notes § (continued) | | | | | | | | | | | | | | | | |
Pennsylvania HFA Series 95-C (Housing Revenue, JPMorgan Chase & Company SPA) | | | 0.20 | % | | | 04/01/2026 | | | $ | 9,545,000 | | | $ | 9,545,000 | |
Pennsylvania Housing Finance Agency Series 88B (Housing Revenue, GO of Agency Insured, PNC Bank NA SPA) | | | 0.17 | | | | 10/01/2036 | | | | 3,925,000 | | | | 3,925,000 | |
Pennsylvania Public School Building Authority (Education Revenue, FSA Insured, Morgan Stanley Bank LIQ) | | | 0.23 | | | | 06/01/2032 | | | | 8,765,000 | | | | 8,765,000 | |
Pennsylvania Turnpike Commission Series 2011 C-1 Royal Bank of Canada Municipal Products Incorporated Trust Series E-22 (Miscellaneous Revenue, Royal Bank of Canada LOC & LIQ) 144A | | | 0.15 | | | | 12/01/2038 | | | | 5,000,000 | | | | 5,000,000 | |
Philadelphia PA Gas Works Series E (Utilities Revenue, PNC Bank NA LOC) | | | 0.15 | | | | 08/01/2031 | | | | 7,000,000 | | | | 7,000,000 | |
Pittsburgh & Allegheny County PA Sports & Exhibition Authority Series B (Miscellaneous Revenue, AGM Insured, PNC Bank NA SPA) | | | 0.47 | | | | 11/01/2039 | | | | 13,000,000 | | | | 13,000,000 | |
Puttable Floating Option Taxable Notes Series TNP-1003 (Education Revenue, Guaranteed Student Loans Insured, Bank of America NA LIQ) 144A | | | 0.75 | | | | 06/01/2047 | | | | 30,170,000 | | | | 30,170,000 | |
| | | | |
| | | | | | | | | | | | | | | 88,390,000 | |
| | | | | | | | | | | | | | | | |
| | | | |
Puerto Rico: 0.14% | | | | | | | | | | | | | | | | |
| | | | |
| Variable Rate Demand Note §: 0.14% | | | | | | | | | | | | | | | | |
Puerto Rico Sales Tax Financing Corporation Series 3036 (Tax Revenue, Morgan Stanley Bank LIQ) | | | 0.17 | | | | 08/01/2057 | | | | 19,000,000 | | | | 19,000,000 | |
| | | | | | | | | | | | | | | | |
| | | | |
Rhode Island: 0.07% | | | | | | | | | | | | | | | | |
| | | | |
| Variable Rate Demand Note §: 0.07% | | | | | | | | | | | | | | | | |
Narragansett RI Bay Commission Series A (Water & Sewer Revenue, RBS Citizens Bank LOC) | | | 0.14 | | | | 09/01/2034 | | | | 10,000,000 | | | | 10,000,000 | |
| | | | | | | | | | | | | | | | |
| | | | |
South Carolina: 0.50% | | | | | | | | | | | | | | | | |
| | | | |
| Other Municipal Debt: 0.32% | | | | | | | | | | | | | | | | |
South Carolina Public Service Authority Series AA (Utilities Revenue) | | | 0.19 | | | | 08/15/2012 | | | | 11,000,000 | | | | 11,000,000 | |
South Carolina Public Service Authority Series AA (Utilities Revenue) | | | 0.19 | | | | 08/21/2012 | | | | 3,000,000 | | | | 3,000,000 | |
South Carolina Public Service Authority Series AA (Utilities Revenue) | | | 0.19 | | | | 08/22/2012 | | | | 6,000,000 | | | | 6,000,000 | |
South Carolina Public Service Authority Series AA (Utilities Revenue) | | | 0.19 | | | | 08/27/2012 | | | | 7,000,000 | | | | 7,000,000 | |
South Carolina Public Service Authority Series CC (Utilities Revenue) | | | 0.18 | | | | 08/20/2012 | | | | 5,000,000 | | | | 5,000,000 | |
South Carolina Public Service Authority Series CC (Utilities Revenue) | | | 0.18 | | | | 08/23/2012 | | | | 3,000,000 | | | | 3,000,000 | |
York County SC PCR Natural Rural Utilities Cooperative Finance Corporation Guaranteed NC Electric Membership Corporation Project Series 200B-1 (Utilities Revenue) | | | 0.45 | | | | 09/04/2012 | | | | 5,500,000 | | | | 5,500,000 | |
York County SC PCR Natural Rural Utilities Cooperative Finance Corporation Guaranteed NC Electric Membership Corporation Project Series 200B-3 (Utilities Revenue) | | | 0.45 | | | | 09/04/2012 | | | | 5,000,000 | | | | 5,000,000 | |
| | | | |
| | | | | | | | | | | | | | | 45,500,000 | |
| | | | | | | | | | | | | | | | |
| | | | |
| Variable Rate Demand Notes §: 0.18% | | | | | | | | | | | | | | | | |
South Carolina Public Service Authority (Miscellaneous Revenue, Citibank NA LIQ) 144A | | | 0.22 | | | | 01/01/2050 | | | | 15,000,000 | | | | 15,000,000 | |
South Carolina State Public Service Authority JPMorgan Chase PUTTER Series 4046 (Miscellaneous Revenue, AMBAC Insured, JPMorgan Chase & Company LIQ) 144A | | | 0.18 | | | | 07/01/2013 | | | | 9,770,000 | | | | 9,770,000 | |
| | | | |
| | | | | | | | | | | | | | | 24,770,000 | |
| | | | | | | | | | | | | | | | |
The accompanying notes are an integral part of these financial statements.
| | | | | | |
| Portfolio of Investments—July 31, 2012 (Unaudited) | | Wells Fargo Advantage Cash Investment Money Market Fund | | | 23 | |
| | | | | | | | | | | | | | | | |
| Security Name | | Interest Rate | | | Maturity Date | | | Principal | | | Value | |
| | | | | | | | | | | | | | | | |
| | | | |
South Dakota: 0.04% | | | | | | | | | | | | | | | | |
| | | | |
| Variable Rate Demand Note §: 0.04% | | | | | | | | | | | | | | | | |
South Dakota Housing Development Authority Series C (Housing Revenue, FHLB SPA) | | | 0.16 | % | | | 05/01/2037 | | | $ | 5,000,000 | | | $ | 5,000,000 | |
| | | | | | | | | | | | | | | | |
| | | | |
Tennessee: 0.80% | | | | | | | | | | | | | | | | |
| | | | |
| Variable Rate Demand Notes §: 0.80% | | | | | | | | | | | | | | | | |
Chattanooga TN Industrial Development Board Bluecross Corporation (IDR) | | | 0.26 | | | | 01/01/2028 | | | | 11,000,000 | | | | 11,000,000 | |
Clarksville TN Public Building Authority Tennessee Municipal Building Fund (Miscellaneous Revenue, Bank of America NA LOC) | | | 0.26 | | | | 11/01/2035 | | | | 15,145,000 | | | | 15,145,000 | |
JPMorgan Chase PUTTER Trust Series 4149 (Tax Revenue, JPMorgan Chase Bank LOC) 144A | | | 0.18 | | | | 10/01/2013 | | | | 39,985,000 | | | | 39,985,000 | |
Montgomery County TN Public Building Authority Adjusted Tennessee County Loan Pool (Miscellaneous Revenue, Bank of America NA LOC) | | | 0.26 | | | | 02/01/2036 | | | | 4,875,000 | | | | 4,875,000 | |
Montgomery County TN Public Building Authority Pooled Financing Revenue (Miscellaneous Revenue, Bank of America NA LOC) | | | 0.26 | | | | 07/01/2034 | | | | 33,525,000 | | | | 33,525,000 | |
Nashville & Davidson County TN Metropolitan Government Stewarts Ferry Apartments Project (IDR, FHLMC Insured & LIQ) | | | 0.16 | | | | 01/01/2034 | | | | 5,000,000 | | | | 5,000,000 | |
Nashville & Davidson County TN Metropolitan Government Weatherly Ridge Apartments Project Series A (Housing Revenue, U.S. Bank NA LOC) | | | 0.18 | | | | 12/01/2041 | | | | 3,000,000 | | | | 3,000,000 | |
| | | | |
| | | | | | | | | | | | | | | 112,530,000 | |
| | | | | | | | | | | | | | | | |
| | | | |
Texas: 3.65% | | | | | | | | | | | | | | | | |
| | | | |
| Variable Rate Demand Notes §: 3.65% | | | | | | | | | | | | | | | | |
Austin TX Airport System Series A (Airport Revenue, State Street Bank & Trust Company LOC) | | | 0.17 | | | | 11/15/2017 | | | | 7,000,000 | | | | 7,000,000 | |
Bexar County TX Health Facilities El Centro Del Barrio Series A (Health Revenue, JPMorgan Chase & Company LOC) | | | 0.17 | | | | 12/01/2032 | | | | 2,395,000 | | | | 2,395,000 | |
Brazos River Authority Texas PCR Series D-2 (Utilities Revenue, Citibank NA LOC) | | | 0.20 | | | | 05/01/2033 | | | | 8,000,000 | | | | 8,000,000 | |
Calhoun County TX Formosa Plastics Corporation Project Series B (IDR, Sumitomo Mitsui Banking Corporation LOC) 144A | | | 0.18 | | | | 09/01/2041 | | | | 7,200,000 | | | | 7,200,000 | |
Calhoun County TX Formosa Plastics Corporation Project Series C (IDR, Sumitomo Mitsui Banking Corporation LOC) 144A | | | 0.18 | | | | 09/01/2031 | | | | 10,000,000 | | | | 10,000,000 | |
Harris County TX Cultural Education Facilities Finance Corporation Hermann Health Series D1 (Health Revenue, JPMorgan Chase & Company LOC) | | | 0.16 | | | | 06/01/2029 | | | | 7,000,000 | | | | 7,000,000 | |
Harris County TX Health Facilities Development Corporation Baylor Series A2 (Education Revenue, Bank of America NA LOC) | | | 0.18 | | | | 11/15/2047 | | | | 20,725,000 | | | | 20,725,000 | |
Houston TX Utilities Systems Authority Series 2010 B (Water & Sewer Revenue, Royal Bank of Canada LOC, Royal Bank of Canada LIQ) 144A | | | 0.15 | | | | 05/15/2034 | | | | 10,000,000 | | | | 10,000,000 | |
Mission TX Economic Development Solid Waste Disposal IESI Corporation (Miscellaneous Revenue, Bank of America NA LOC) | | | 0.24 | | | | 04/01/2022 | | | | 6,000,000 | | | | 6,000,000 | |
North Texas Tollway Authority Revenue Series D (Transportation Revenue, JPMorgan Chase Bank LOC) | | | 0.17 | | | | 01/01/2049 | | | | 10,000,000 | | | | 10,000,000 | |
Pasadena TX Independent School District Series B (Tax Revenue, AGM Insured, Bank of America NA SPA) | | | 0.57 | | | | 02/01/2035 | | | | 33,095,000 | | | | 33,095,000 | |
Port Arthur TX Navigation District Environmental Facilities Motiva Enterprises Project Subseries 2009B (Resource Recovery Revenue) | | | 0.15 | | | | 12/01/2039 | | | | 3,700,000 | | | | 3,700,000 | |
Port Arthur TX Navigation District Environmental Facilities Motiva Enterprises Project Subseries 2009C (Resource Recovery Revenue) | | | 0.15 | | | | 12/01/2039 | | | | 7,000,000 | | | | 7,000,000 | |
The accompanying notes are an integral part of these financial statements.
| | | | |
| 24 | | Wells Fargo Advantage Cash Investment Money Market Fund | | Portfolio of Investments—July 31, 2012 (Unaudited) |
| | | | | | | | | | | | | | | | |
| Security Name | | Interest Rate | | | Maturity Date | | | Principal | | | Value | |
| | | | | | | | | | | | | | | | |
| | | | |
| Variable Rate Demand Notes § (continued) | | | | | | | | | | | | | | | | |
Port Arthur TX Navigation District Environmental Facilities Motiva Enterprises Project Subseries 2010A (Resource Recovery Revenue) | | | 0.16 | % | | | 04/01/2040 | | | $ | 12,100,000 | | | $ | 12,100,000 | |
Port Arthur TX Navigation District Environmental Facilities Motiva Enterprises Project Subseries 2010D (Resource Recovery Revenue) | | | 0.16 | | | | 11/01/2040 | | | | 12,000,000 | | | | 12,000,000 | |
Royal Bank of Canada Municipal Products Incorporated Trust Floater Certificates Series E-18 (Miscellaneous Revenue, Royal Bank of Canada LOC & SPA) 144A | | | 0.15 | | | | 06/01/2032 | | | | 25,395,000 | | | | 25,395,000 | |
Tarant County TX Housing Finance Corporation PFOTER Evergreen at Keller Apartments Project (Housing Revenue, FHLMC Insured & LIQ) | | | 0.35 | | | | 02/01/2049 | | | | 8,860,000 | | | | 8,860,000 | |
Texas Department of Housing Providence at Rush Creek II Apartments Series 2004 (Housing Revenue, FHLMC Insured, FHLMC LIQ) | | | 0.39 | | | | 01/01/2044 | | | | 8,530,000 | | | | 8,530,000 | |
Texas Municipal Gas Acquisition & Supply Corporation Series 2848 (Miscellaneous Revenue, Morgan Stanley Bank LIQ) | | | 0.45 | | | | 12/15/2026 | | | | 39,000,000 | | | | 39,000,000 | |
Texas Municipal Gas Acquisition & Supply Corporation Series 2849 (Miscellaneous Revenue, Morgan Stanley Bank LIQ) | | | 0.45 | | | | 12/15/2026 | | | | 9,000,000 | | | | 9,000,000 | |
Texas Taxable Product Development Program Series A (GO, National Australia Bank SPA) | | | 0.21 | | | | 06/01/2045 | | | | 13,500,000 | | | | 13,500,000 | |
Texas TRAN JPMorgan Chase PUTTER Trust Series 3942 (Miscellaneous Revenue, JPMorgan Chase Bank LIQ) 144A | | | 0.18 | | | | 08/30/2012 | | | | 50,995,000 | | | | 50,995,000 | |
Texas TRAN JPMorgan Chase PUTTER Trust Series 3945 (Miscellaneous Revenue, JPMorgan Chase Bank LIQ) 144A | | | 0.18 | | | | 08/30/2012 | | | | 32,000,000 | | | | 32,000,000 | |
Texas TRAN JPMorgan Chase PUTTER Trust Series 3946 (Miscellaneous Revenue, JPMorgan Chase Bank LIQ) 144A | | | 0.18 | | | | 08/30/2012 | | | | 33,660,000 | | | | 33,660,000 | |
Texas TRAN JPMorgan Chase PUTTER Trust Series 3953 (Miscellaneous Revenue, JPMorgan Chase Bank LIQ) 144A | | | 0.18 | | | | 08/30/2012 | | | | 37,435,000 | | | | 37,435,000 | |
Texas TRAN JPMorgan Chase PUTTER Trust Series 3964 (Miscellaneous Revenue, JPMorgan Chase Bank LIQ) 144A | | | 0.18 | | | | 08/30/2012 | | | | 39,000,000 | | | | 39,000,000 | |
Texas TRAN JPMorgan Chase PUTTER Trust Series 3984 (Miscellaneous Revenue, JPMorgan Chase Bank LIQ) 144A | | | 0.18 | | | | 08/30/2012 | | | | 50,000,000 | | | | 50,000,000 | |
Tyler TX Health Facilities Development Corporation Mother Frances Hospital Regional Health Care Center Project Series 1997 B (Health Revenue, Bank of America NA LOC) | | | 0.25 | | | | 07/01/2020 | | | | 11,300,000 | | | | 11,300,000 | |
| | | | |
| | | | | | | | | | | | | | | 514,890,000 | |
| | | | | | | | | | | | | | | | |
| | | | |
Utah: 0.05% | | | | | | | | | | | | | | | | |
| | | | |
| Variable Rate Demand Note §: 0.05% | | | | | | | | | | | | | | | | |
Utah Board of Regents Series A (Education Revenue, Royal Bank of Canada LOC) | | | 0.17 | | | | 11/01/2045 | | | | 6,460,000 | | | | 6,460,000 | |
| | | | | | | | | | | | | | | | |
| | | | |
Vermont: 0.13% | | | | | | | | | | | | | | | | |
| | | | |
| Variable Rate Demand Note §: 0.13% | | | | | | | | | | | | | | | | |
Vermont Educational & Health Buildings Financing Agency Norwich University Projects Series 2008 (Education Revenue, TD Bank NA LOC) | | | 0.14 | | | | 09/01/2038 | | | | 18,255,000 | | | | 18,255,000 | |
| | | | | | | | | | | | | | | | |
| | | | |
Virginia: 0.28% | | | | | | | | | | | | | | | | |
| | | | |
| Variable Rate Demand Notes §: 0.28% | | | | | | | | | | | | | | | | |
Montgomery County VA IDA Series 2009-A (Education Revenue, Bank of New York Mellon SPA) | | | 0.15 | | | | 02/01/2039 | | | | 9,970,000 | | | | 9,970,000 | |
Virginia Small Business Financing Authority Hampton University Series 2008-A (Education Revenue, PNC Bank NA LOC) | | | 0.14 | | | | 12/01/2038 | | | | 4,000,000 | | | | 4,000,000 | |
The accompanying notes are an integral part of these financial statements.
| | | | | | |
| Portfolio of Investments—July 31, 2012 (Unaudited) | | Wells Fargo Advantage Cash Investment Money Market Fund | | | 25 | |
| | | | | | | | | | | | | | | | |
| Security Name | | Interest Rate | | | Maturity Date | | | Principal | | | Value | |
| | | | | | | | | | | | | | | | |
| | | | |
| Variable Rate Demand Notes § (continued) | | | | | | | | | | | | | | | | |
Virginia State College Building Authority (Education Revenue) | | | 0.15 | % | | | 08/01/2034 | | | $ | 26,000,000 | | | $ | 26,000,000 | |
| | | | |
| | | | | | | | | | | | | | | 39,970,000 | |
| | | | | | | | | | | | | | | | |
| | | | |
Washington: 0.48% | | | | | | | | | | | | | | | | |
| | | | |
| Other Municipal Debt: 0.06% | | | | | | | | | | | | | | | | |
Port of Seattle (Port Authority Revenue) | | | 0.55 | | | | 08/16/2012 | | | | 9,000,000 | | | | 9,000,000 | |
| | | | | | | | | | | | | | | | |
| | | | |
| Variable Rate Demand Notes §: 0.42% | | | | | | | | | | | | | | | | |
King City WA JPMorgan Chase PUTTER Trust Series 4058 (GO, JPMorgan Chase Bank LIQ) 144A | | | 0.18 | | | | 02/28/2013 | | | | 20,460,000 | | | | 20,460,000 | |
Seattle WA Eclipse Funding Trust (Port Authority Revenue, U.S. Bank NA LOC) 144A | | | 0.13 | | | | 03/01/2035 | | | | 16,500,000 | | | | 16,500,000 | |
Washington HEFAR Whitman College Project (Education Revenue, Bank of America NA LIQ) | | | 0.28 | | | | 01/01/2038 | | | | 15,000,000 | | | | 15,000,000 | |
Washington Housing Finance Commission Series 1430-R (Housing Revenue, GNMA, FNMA Insured, Bank of America NA SPA) | | | 0.38 | | | | 06/01/2037 | | | | 6,960,000 | | | | 6,960,000 | |
| | | | |
| | | | | | | | | | | | | | | 58,920,000 | |
| | | | | | | | | | | | | | | | |
| | | | |
West Virginia: 0.16% | | | | | | | | | | | | | | | | |
| | | | |
| Variable Rate Demand Notes §: 0.16% | | | | | | | | | | | | | | | | |
West Virginia EDA Morgantown Energy (IDR, Union Bank NA LOC) | | | 0.18 | | | | 04/01/2027 | | | | 7,000,000 | | | | 7,000,000 | |
West Virginia EDA Solid Waste Disposal Appalachian Power Company (Utilities Revenue, Sumitomo Mitsui Banking Corporation LOC) | | | 0.17 | | | | 12/01/2042 | | | | 15,600,000 | | | | 15,600,000 | |
| | | | |
| | | | | | | | | | | | | | | 22,600,000 | |
| | | | | | | | | | | | | | | | |
| | | | |
Wisconsin: 0.08% | | | | | | | | | | | | | | | | |
| | | | |
| Variable Rate Demand Notes §: 0.08% | | | | | | | | | | | | | | | | |
Wisconsin Housing & EDA Home Ownership Series D (Housing Revenue, FNMA LOC, GO of Authority Insured) | | | 0.19 | | | | 09/01/2035 | | | | 3,505,000 | | | | 3,505,000 | |
Wisconsin Public Power PUTTER Series 1232 (Utilities Revenue, BHAC-CR, AMBAC Insured, JPMorgan Chase & Company LIQ) | | | 0.19 | | | | 07/01/2013 | | | | 5,985,000 | | | | 5,985,000 | |
Wisconsin State HEFAR Medical College Series B (Education Revenue, U.S. Bank NA LOC) | | | 0.13 | | | | 12/01/2033 | | | | 2,000,000 | | | | 2,000,000 | |
| | | | |
| | | | | | | | | | | | | | | 11,490,000 | |
| | | | | | | | | | | | | | | | |
| | | | |
Wyoming: 0.00% | | | | | | | | | | | | | | | | |
| | | | |
| Variable Rate Demand Note §: 0.00% | | | | | | | | | | | | | | | | |
Wyoming Student Loan Corporation Series A-1 (Education Revenue, Royal Bank of Canada LOC) | | | 0.15 | | | | 06/01/2035 | | | | 590,000 | | | | 590,000 | |
| | | | | | | | | | | | | | | | |
| | | | |
| Total Municipal Obligations (Cost $3,274,108,820) | | | | | | | | | | | | | | | 3,274,108,820 | |
| | | | | | | | | | | | | | | | |
| | | | |
Other Instruments: 0.79% | | | | | | | | | | | | | | | | |
American Honda Finance Corporation ±144A | | | 0.69 | | | | 08/28/2012 | | | | 19,000,000 | | | | 19,006,355 | |
City of Austin TX Municipal Commercial Paper (z) | | | 0.19 | | | | 08/09/2012 | | | | 7,000,000 | | | | 6,999,704 | |
District of Columbia Multimodal Revenue Variable Rate Demand Note | | | 0.18 | | | | 08/16/2012 | | | | 27,200,000 | | | | 27,200,000 | |
District of Columbia Multimodal Revenue Variable Rate Demand Note | | | 0.18 | | | | 08/16/2012 | | | | 4,000,000 | | | | 4,000,000 | |
GBG LLC Custody Receipts ±144A§ | | | 0.17 | | | | 09/01/2027 | | | | 11,802,000 | | | | 11,802,000 | |
Oakland-Alameda County Series A-2 Commercial Paper | | | 0.23 | | | | 09/05/2012 | | | | 14,000,000 | | | | 14,000,000 | |
The accompanying notes are an integral part of these financial statements.
| | | | |
| 26 | | Wells Fargo Advantage Cash Investment Money Market Fund | | Portfolio of Investments—July 31, 2012 (Unaudited) |
| | | | | | | | | | | | | | | | |
| Security Name | | Interest Rate | | | Maturity Date | | | Principal | | | Value | |
| | | | | | | | | | | | | | | | |
| | | | |
Other Instruments (continued) | | | | | | | | | | | | | | | | |
Puttable Floating Option Taxable Receipt Bonds ±144A§ | | | 0.90 | % | | | 05/15/2051 | | | $ | 17,640,000 | | | $ | 17,640,000 | |
University of Chicago Series A Municipal Commercial Paper (z) | | | 0.18 | | | | 08/15/2012 | | | | 10,600,000 | | | | 10,599,258 | |
| | | | |
Total Other Instruments (Cost $111,247,317) | | | | | | | | | | | | | | | 111,247,317 | |
| | | | | | | | | | | | | | | | |
| | | | |
Other Notes: 1.53% | | | | | | | | | | | | | | | | |
| | | | |
| Corporate Bonds and Notes: 1.53% | | | | | | | | | | | | | | | | |
ACTS Retirement Life Communities Incorporated ±§ | | | 0.26 | | | | 11/15/2029 | | | | 12,004,000 | | | | 12,004,000 | |
JPMorgan Chase & Company ± | | | 0.62 | | | | 11/01/2012 | | | | 19,000,000 | | | | 19,010,990 | |
JPMorgan Chase & Company ± | | | 0.97 | | | | 09/21/2012 | | | | 22,000,000 | | | | 22,015,289 | |
JPMorgan Chase & Company ± | | | 1.12 | | | | 02/26/2013 | | | | 28,000,000 | | | | 28,074,082 | |
JPMorgan Chase Bank NA ± | | | 0.37 | | | | 11/21/2012 | | | | 13,000,000 | | | | 13,002,896 | |
JPMorgan Chase Bank NA ± | | | 0.49 | | | | 11/16/2012 | | | | 4,000,000 | | | | 4,000,000 | |
JPMorgan Chase Bank NA ± | | | 0.53 | | | | 01/18/2013 | | | | 29,000,000 | | | | 28,997,313 | |
LTF Real Estate LLC ±144A§ | | | 0.30 | | | | 06/01/2033 | | | | 15,155,000 | | | | 15,155,000 | |
Providence Health & Services ±§ | | | 0.25 | | | | 10/01/2042 | | | | 12,000,000 | | | | 12,000,000 | |
Toyota Motor Credit Corporation ± | | | 0.53 | | | | 07/19/2013 | | | | 62,000,000 | | | | 62,000,000 | |
| | | | |
Total Other Notes (Cost $216,259,570) | | | | | | | | | | | | | | | 216,259,570 | |
| | | | | | | | | | | | | | | | |
| | | | |
Repurchase Agreements ^^: 4.18% | | | | | | | | | | | | | | | | |
Citigroup Global Markets, dated 07/31/2012, maturity value $58,000,290 (1) | | | 0.18 | | | | 08/01/2012 | | | | 58,000,000 | | | | 58,000,000 | |
Credit Suisse Securities, dated 07/31/2012, maturity value $69,000,345 (2) | | | 0.18 | | | | 08/01/2012 | | | | 69,000,000 | | | | 69,000,000 | |
Deutsche Bank Securities, dated 07/31/2012, maturity value $52,300,276 (3) | | | 0.19 | | | | 08/01/2012 | | | | 52,300,000 | | | | 52,300,000 | |
GX Clarke & Company, dated 07/31/2012, maturity value $51,000,383 (4) | | | 0.27 | | | | 08/01/2012 | | | | 51,000,000 | | | | 51,000,000 | |
JPMorgan Securities, dated 07/31/2012, maturity value $35,000,243 (5) | | | 0.25 | | | | 08/01/2012 | | | | 35,000,000 | | | | 35,000,000 | |
Merrill Lynch Pierce Fenner & Smith, dated 07/31/2012, maturity value $75,000,333 (6) | | | 0.16 | | | | 08/01/2012 | | | | 75,000,000 | | | | 75,000,000 | |
Merrill Lynch Pierce Fenner & Smith, dated 07/31/2012, maturity value $76,000,401 (7) | | | 0.19 | | | | 08/01/2012 | | | | 76,000,000 | | | | 76,000,000 | |
Societe Generale New York, dated 07/31/2012, maturity value $131,000,691 (8) | | | 0.19 | | | | 08/01/2012 | | | | 131,000,000 | | | | 131,000,000 | |
Societe Generale New York, dated 07/31/2012, maturity value $41,000,261 (9) | | | 0.23 | | | | 08/01/2012 | | | | 41,000,000 | | | | 41,000,000 | |
| | | | |
Total Repurchase Agreements (Cost $588,300,000) | | | | | | | | | | | | | | | 588,300,000 | |
| | | | | | | | | | | | | | | | |
| | | | |
Treasury Debt: 2.36% | | | | | | | | | | | | | | | | |
U.S. Treasury Bill (z) | | | 0.13 | | | | 08/23/2012 | | | | 155,000,000 | | | | 154,988,372 | |
U.S. Treasury Bill (z) | | | 0.14 | | | | 10/04/2012 | | | | 44,000,000 | | | | 43,988,971 | |
U.S. Treasury Bill (z) | | | 0.14 | | | | 08/30/2012 | | | | 90,000,000 | | | | 89,989,619 | |
U.S. Treasury Bill (z) | | | 0.15 | | | | 10/11/2012 | | | | 43,000,000 | | | | 42,987,703 | |
| | | | |
Total Treasury Debt (Cost $331,954,665) | | | | | | | | | | | | | | | 331,954,665 | |
| | | | | | | | | | | | | | | | |
| | | | | | | | |
| Total Investments in Securities | | | | | | | | |
| (Cost $14,070,567,426)* | | | 99.87 | % | | | 14,070,567,426 | |
Other Assets and Liabilities, Net | | | 0.13 | | | | 17,725,614 | |
| | | | | | | | |
| Total Net Assets | | | 100.00 | % | | $ | 14,088,293,040 | |
| | | | | | | | |
The accompanying notes are an integral part of these financial statements.
| | | | | | |
| Portfolio of Investments—July 31, 2012 (Unaudited) | | Wells Fargo Advantage Cash Investment Money Market Fund | | | 27 | |
| ± | Variable rate investment |
| 144A | Security that may be resold to “qualified institutional buyers” under Rule 144A or security offered pursuant to Section 4(2) of the Securities Act of 1933, as amended. |
| (z) | Zero coupon security. Rate represents yield to maturity at time of purchase. |
| § | These securities are subject to a demand feature which reduces the effective maturity. |
| (1) | U.S. government securities, 2.65% to 5.50%, 3/1/2017 to 7/1/2042, fair value including accrued interest is $59,740,000. |
| (2) | U.S. government securities, 2.50% to 7.00%, 8/1/2013 to 8/1/2042, fair value including accrued interest is $71,070,202. |
| (3) | U.S. government securities, 4.50% to 7.00%, 10/1/2038 to 7/1/2042, fair value including accrued interest is $53,869,000. |
| (4) | U.S. government securities, 0.30% to 10.00%, 11/15/2012 to 6/1/2042, fair value including accrued interest is $52,302,057. |
| (5) | U.S. government securities, 2.50% to 6.00%, 5/1/2020 to 7/1/2042, fair value including accrued interest is $36,050,051. |
| (6) | U.S. government securities, 1.125% to 1.50%, 6/30/2016 to 1/15/2021, fair value including accrued interest is $76,500,020. |
| (7) | U.S. government securities, 4.50%, 7/20/2041 to 8/20/2041, fair value including accrued interest is $78,280,000. |
| (8) | U.S. government securities, 0.00% to 6.91%, 12/12/2014 to 4/1/2050, fair value including accrued interest is $134,921,365. |
| (9) | U.S. government securities, 1.69% to 6.42%, 7/1/2017 to 5/1/2042, fair value including accrued interest is $42,230,000. |
| * | Cost for federal income tax purposes is substantially the same as for financial reporting purposes. |
The accompanying notes are an integral part of these financial statements.
| | | | |
| 28 | | Wells Fargo Advantage Cash Investment Money Market Fund | | Statement of Assets and Liabilities—July 31, 2012 (Unaudited) |
| | | | |
| | | | |
| |
Assets | | | | |
Investments in unaffiliated securities, at amortized cost | | $ | 14,070,567,426 | |
Cash | | | 25,346 | |
Receivable for investments sold | | | 49,156,976 | |
Receivable for Fund shares sold | | | 1,898,220 | |
Receivable for interest | | | 3,142,982 | |
Prepaid expenses and other assets | | | 168,829 | |
| | | | |
Total assets | | | 14,124,959,779 | |
| | | | |
| |
Liabilities | | | | |
Dividends payable | | | 285,971 | |
Payable for investments purchased | | | 31,990,340 | |
Payable for Fund shares redeemed | | | 1,499,121 | |
Advisory fee payable | | | 257,343 | |
Due to other related parties | | | 1,398,573 | |
Accrued expenses and other liabilities | | | 1,235,391 | |
| | | | |
Total liabilities | | | 36,666,739 | |
| | | | |
Total net assets | | $ | 14,088,293,040 | |
| | | | |
| |
NET ASSETS CONSIST OF | | | | |
Paid-in capital | | $ | 14,091,954,328 | |
Overdistributed net investment income | | | (6,475 | ) |
Accumulated net realized losses on investments | | | (3,654,813 | ) |
| | | | |
Total net assets | | $ | 14,088,293,040 | |
| | | | |
| |
COMPUTATION OF NET ASSET VALUE PER SHARE1 | | | | |
Net assets – Administrator Class | | $ | 575,338,726 | |
Shares outstanding – Administrator Class | | | 575,344,128 | |
Net asset value per share – Administrator Class | | | $1.00 | |
Net assets – Institutional Class | | $ | 5,498,709,846 | |
Shares outstanding – Institutional Class | | | 5,498,962,689 | |
Net asset value per share – Institutional Class | | | $1.00 | |
Net assets – Select Class | | $ | 6,149,343,067 | |
Shares outstanding – Select Class | | | 6,149,482,398 | |
Net asset value per share – Select Class | | | $1.00 | |
Net assets – Service Class | | $ | 1,864,901,401 | |
Shares outstanding – Service Class | | | 1,864,937,548 | |
Net asset value per share – Service Class | | | $1.00 | |
| 1. | The Fund has an unlimited number of authorized shares. |
The accompanying notes are an integral part of these financial statements.
| | | | | | |
| Statement of Operations—Six Months Ended July 31, 2012 (Unaudited) | | Wells Fargo Advantage Cash Investment Money Market Fund | | | 29 | |
| | | | |
| | | | |
| |
Investment income | | | | |
Interest | | | 17,175,183 | |
| | | | |
| |
Expenses | | | | |
Advisory fee | | | 6,993,058 | |
Administration fees | | | | |
Fund level | | | 2,843,819 | |
Administrator Class | | | 285,822 | |
Institutional Class | | | 2,291,693 | |
Select Class | | | 1,143,675 | |
Service Class | | | 1,180,251 | |
Shareholder servicing fees | | | | |
Administrator Class | | | 284,383 | |
Service Class | | | 2,456,844 | |
Custody and accounting fees | | | 277,065 | |
Professional fees | | | 15,322 | |
Registration fees | | | 15,138 | |
Shareholder report expenses | | | 1,327 | |
Trustees’ fees and expenses | | | 4,238 | |
Other fees and expenses | | | 39,479 | |
| | | | |
Total expenses | | | 17,832,114 | |
Less: Fee waivers and/or expense reimbursements | | | (5,402,751 | ) |
| | | | |
Net expenses | | | 12,429,363 | |
| | | | |
Net investment income | | | 4,745,820 | |
| | | | |
Net realized gains on investments | | | 133,673 | |
| | | | |
Net increase in net assets resulting from operations | | $ | 4,879,493 | |
| | | | |
The accompanying notes are an integral part of these financial statements.
| | | | |
| 30 | | Wells Fargo Advantage Cash Investment Money Market Fund | | Statement of Changes in Net Assets |
| | | | | | | | | | | | | | | | |
| | | Six Months Ended
July 31, 2012
(Unaudited) | | | Year Ended
January 31, 2012 | |
| | | | |
Operations | | | | | | | | | | | | | | | | |
Net investment income | | | | | | $ | 4,745,820 | | | | | | | $ | 14,029,806 | |
Net realized gains on investments | | | | | | | 133,673 | | | | | | | | 187,407 | |
| | | | | | | | | | | | | | | | |
Net increase in net assets resulting from operations | | | | | | | 4,879,493 | | | | | | | | 14,217,213 | |
| | | | | | | | | | | | | | | | |
| | | | |
Distributions to shareholders from | | | | | | | | | | | | | | | | |
Net investment income | | | | | | | | | | | | | | | | |
Administrator Class | | | | | | | (28,660 | ) | | | | | | | (68,440 | ) |
Institutional Class | | | | | | | (1,287,888 | ) | | | | | | | (4,892,027 | ) |
Select Class | | | | | | | (3,330,648 | ) | | | | | | | (8,851,628 | ) |
Service Class | | | | | | | (98,624 | ) | | | | | | | (217,711 | ) |
Net realized gains | | | | | | | | | | | | | | | | |
Administrator Class | | | | | | | 0 | | | | | | | | (2,003 | ) |
Institutional Class | | | | | | | 0 | | | | | | | | (22,782 | ) |
Select Class | | | | | | | 0 | | | | | | | | (21,361 | ) |
Service Class | | | | | | | 0 | | | | | | | | (6,608 | ) |
| | | | | | | | | | | | | | | | |
Total distributions to shareholders | | | | | | | (4,745,820 | ) | | | | | | | (14,082,560 | ) |
| | | | | | | | | | | | | | | | |
| | | | |
Capital share transactions | | | Shares | | | | | | | | Shares | | | | | |
Proceeds from shares sold | | | | | | | | | | | | | | | | |
Administrator Class | | | 634,856,864 | | | | 634,856,864 | | | | 2,274,713,526 | | | | 2,274,713,526 | |
Institutional Class | | | 14,678,181,928 | | | | 14,678,181,928 | | | | 40,078,946,700 | | | | 40,078,946,700 | |
Select Class | | | 16,559,661,658 | | | | 16,559,661,658 | | | | 62,838,029,797 | | | | 62,838,029,797 | |
Service Class | | | 4,083,792,138 | | | | 4,083,792,138 | | | | 10,514,808,864 | | | | 10,514,808,864 | |
| | | | | | | | | | | | | | | | |
| | | | | | | 35,956,492,588 | | | | | | | | 115,706,498,887 | |
| | | | | | | | | | | | | | | | |
Reinvestment of distributions | | | | | | | | | | | | | | | | |
Administrator Class | | | 20,920 | | | | 20,920 | | | | 52,228 | | | | 52,228 | |
Institutional Class | | | 646,386 | | | | 646,386 | | | | 2,656,637 | | | | 2,656,637 | |
Select Class | | | 2,965,687 | | | | 2,965,687 | | | | 7,057,838 | | | | 7,057,838 | |
Service Class | | | 43,507 | | | | 43,507 | | | | 96,294 | | | | 96,294 | |
| | | | | | | | | | | | | | | | |
| | | | | | | 3,676,500 | | | | | | | | 9,862,997 | |
| | | | | | | | | | | | | | | | |
Payment for shares redeemed | | | | | | | | | | | | | | | | |
Administrator Class | | | (660,282,046 | ) | | | (660,282,046 | ) | | | (2,438,629,355 | ) | | | (2,438,629,355 | ) |
Institutional Class | | | (15,426,287,603 | ) | | | (15,426,287,603 | ) | | | (42,103,783,387 | ) | | | (42,103,783,387 | ) |
Select Class | | | (15,739,051,435 | ) | | | (15,739,051,435 | ) | | | (65,113,277,192 | ) | | | (65,113,277,192 | ) |
Service Class | | | (4,219,249,445 | ) | | | (4,219,249,445 | ) | | | (10,799,228,968 | ) | | | (10,799,228,968 | ) |
| | | | | | | | | | | | | | | | |
| | | | | | | (36,044,870,529 | ) | | | | | | | (120,454,918,902 | ) |
| | | | | | | | | | | | | | | | |
Net decrease in net assets resulting from capital share transactions | | | | | | | (84,701,441 | ) | | | | | | | (4,738,557,018 | ) |
| | | | | | | | | | | | | | | | |
Total decrease in net assets | | | | | | | (84,567,768 | ) | | | | | | | (4,738,422,365 | ) |
| | | | | | | | | | | | | | | | |
| | | | |
Net assets | | | | | | | | | | | | | | | | |
Beginning of period | | | | | | | 14,172,860,808 | | | | | | | | 18,911,283,173 | |
| | | | | | | | | | | | | | | | |
End of period | | | | | | $ | 14,088,293,040 | | | | | | | $ | 14,172,860,808 | |
| | | | | | | | | | | | | | | | |
Overdistributed net investment income | | | | | | $ | (6,475 | ) | | | | | | $ | (6,475 | ) |
| | | | | | | | | | | | | | | | |
The accompanying notes are an integral part of these financial statements.
| | | | | | |
| Financial Highlights | | Wells Fargo Advantage Cash Investment Money Market Fund | | | 31 | |
(For a share outstanding throughout each period)
| | | | | | | | | | | | | | | | | | | | | | | | | | | | |
| | | Six Months Ended
July 31, 2012 (Unaudited) | | | Year Ended January 31, | | | Year Ended February 28, | |
| Administrator Class | | | 2012 | | | 20111 | | | 2010 | | | 2009 | | | 20082 | | | 2007 | |
Net asset value, beginning of period | | $ | 1.00 | | | $ | 1.00 | | | $ | 1.00 | | | $ | 1.00 | | | $ | 1.00 | | | $ | 1.00 | | | $ | 1.00 | |
Net investment income | | | 0.00 | 3 | | | 0.00 | 3 | | | 0.00 | 3 | | | 0.00 | 3 | | | 0.02 | | | | 0.05 | | | | 0.05 | |
Net realized gains on investments | | | 0.00 | 3 | | | 0.00 | 3 | | | 0.00 | 3 | | | 0.00 | 3 | | | 0.00 | | | | 0.00 | | | | 0.00 | |
| | | | | | | | | | | | | | | | | | | | | | | | | | | | |
Total from investment operations | | | 0.00 | 3 | | | 0.00 | 3 | | | 0.00 | 3 | | | 0.00 | 3 | | | 0.02 | | | | 0.05 | | | | 0.05 | |
Distributions to shareholders from | | | | | | | | | | | | | | | | | | | | | | | | | | | | |
Net investment income | | | (0.00 | )3 | | | (0.00 | )3 | | | (0.00 | )3 | | | (0.00 | )3 | | | (0.02 | ) | | | (0.05 | ) | | | (0.05 | ) |
Net realized gains | | | 0.00 | | | | (0.00 | )3 | | | (0.00 | )3 | | | (0.00 | )3 | | | 0.00 | | | | 0.00 | | | | 0.00 | |
| | | | | | | | | | | | | | | | | | | | | | | | | | | | |
Total distributions to shareholders | | | (0.00 | )3 | | | (0.00 | )3 | | | (0.00 | )3 | | | (0.00 | )3 | | | (0.02 | ) | | | (0.05 | ) | | | (0.05 | ) |
Net asset value, end of period | | $ | 1.00 | | | $ | 1.00 | | | $ | 1.00 | | | $ | 1.00 | | | $ | 1.00 | | | $ | 1.00 | | | $ | 1.00 | |
Total return4 | | | 0.00 | % | | | 0.01 | % | | | 0.03 | % | | | 0.24 | % | | | 2.19 | % | | | 4.92 | % | | | 4.96 | % |
Ratios to average net assets (annualized) | | | | | | | | | | | | | | | | | | | | | | | | | | | | |
Gross expenses | | | 0.35 | % | | | 0.35 | % | | | 0.35 | % | | | 0.38 | % | | | 0.38 | % | | | 0.37 | % | | | 0.37 | % |
Net expenses | | | 0.24 | % | | | 0.25 | % | | | 0.32 | % | | | 0.34 | % | | | 0.34 | % | | | 0.33 | % | | | 0.35 | % |
Net investment income | | | 0.01 | % | | | 0.01 | % | | | 0.04 | % | | | 0.25 | % | | | 2.23 | % | | | 4.77 | % | | | 4.87 | % |
Supplemental data | | | | | | | | | | | | | | | | | | | | | | | | | | | | |
Net assets, end of period (000’s omitted) | | | $575,339 | | | | $600,737 | | | | $764,595 | | | | $1,013,058 | | | | $1,415,264 | | | | $2,249,470 | | | | $1,364,223 | |
| 1. | For the eleven months ended January 31, 2011. The Fund changed its fiscal year end from February 28 to January 31, effective January 31, 2011. |
| 2. | Year ended February 29. |
| 3. | Amount is less than $0.005. |
| 4. | Returns for periods of less than one year are not annualized. |
The accompanying notes are an integral part of these financial statements.
| | | | |
| 32 | | Wells Fargo Advantage Cash Investment Money Market Fund | | Financial Highlights |
(For a share outstanding throughout each period)
| | | | | | | | | | | | | | | | | | | | | | | | | | | | |
| | | Six Months Ended
July 31, 2012 (Unaudited) | | | Year Ended January 31, | |
| Institutional Class | | | 2012 | | | 20111 | | | 2010 | | | 2009 | | | 20082 | | | 2007 | |
Net asset value, beginning of period | | $ | 1.00 | | | $ | 1.00 | | | $ | 1.00 | | | $ | 1.00 | | | $ | 1.00 | | | $ | 1.00 | | | $ | 1.00 | |
Net investment income | | | 0.00 | 3 | | | 0.00 | 3 | | | 0.00 | 3 | | | 0.00 | 3 | | | 0.02 | | | | 0.05 | | | | 0.05 | |
Net realized gains on investments | | | 0.00 | 3 | | | 0.00 | 3 | | | 0.00 | 3 | | | 0.00 | 3 | | | 0.00 | | | | 0.00 | | | | 0.00 | |
| | | | | | | | | | | | | | | | | | | | | | | | | | | | |
Total from investment operations | | | 0.00 | 3 | | | 0.00 | 3 | | | 0.00 | 3 | | | 0.00 | 3 | | | 0.02 | | | | 0.05 | | | | 0.05 | |
Distributions to shareholders from | | | | | | | | | | | | | | | | | | | | | | | | | | | | |
Net investment income | | | (0.00 | )3 | | | (0.00 | )3 | | | (0.00 | )3 | | | (0.00 | )3 | | | (0.02 | ) | | | (0.05 | ) | | | (0.05 | ) |
Net realized gains | | | 0.00 | | | | (0.00 | )3 | | | (0.00 | )3 | | | (0.00 | )3 | | | 0.00 | | | | 0.00 | | | | 0.00 | |
| | | | | | | | | | | | | | | | | | | | | | | | | | | | |
Total distributions to shareholders | | | (0.00 | )3 | | | (0.00 | )3 | | | (0.00 | )3 | | | (0.00 | )3 | | | (0.02 | ) | | | (0.05 | ) | | | (0.05 | ) |
Net asset value, end of period | | $ | 1.00 | | | $ | 1.00 | | | $ | 1.00 | | | $ | 1.00 | | | $ | 1.00 | | | $ | 1.00 | | | $ | 1.00 | |
Total return4 | | | 0.02 | % | | | 0.06 | % | | | 0.15 | % | | | 0.36 | % | | | 2.32 | % | | | 5.06 | % | | | 5.12 | % |
Ratios to average net assets (annualized) | | | | | | | | | | | | | | | | | | | | | | | | | | | | |
Gross expenses | | | 0.23 | % | | | 0.23 | % | | | 0.23 | % | | | 0.26 | % | | | 0.26 | % | | | 0.25 | % | | | 0.25 | % |
Net expenses | | | 0.20 | % | | | 0.20 | % | | | 0.20 | % | | | 0.22 | % | | | 0.21 | % | | | 0.20 | % | | | 0.20 | % |
Net investment income | | | 0.04 | % | | | 0.06 | % | | | 0.16 | % | | | 0.37 | % | | | 2.28 | % | | | 4.94 | % | | | 5.01 | % |
Supplemental data | | | | | | | | | | | | | | | | | | | | | | | | | | | | |
Net assets, end of period (000’s omitted) | | | $5,498,710 | | | | $6,246,114 | | | | $8,268,232 | | | | $8,887,844 | | | | $10,132,093 | | | | $9,194,540 | | | | $7,830,847 | |
| 1. | For the eleven months ended January 31, 2011. The Fund changed its fiscal year end from February 28 to January 31, effective January 31, 2011. |
| 2. | Year ended February 29. |
| 3. | Amount is less than $0.005. |
| 4. | Returns for periods of less than one year are not annualized. |
The accompanying notes are an integral part of these financial statements.
| | | | | | |
| Financial Highlights | | Wells Fargo Advantage Cash Investment Money Market Fund | | | 33 | |
(For a share outstanding throughout each period)
| | | | | | | | | | | | | | | | | | | | | | | | |
| | | Six Months Ended
July 31, 2012 (Unaudited) | | | Year Ended January 31, | |
| Select Class | | | 2012 | | | 20111 | | | 2010 | | | 2009 | | | 20082 | |
Net asset value, beginning of period | | $ | 1.00 | | | $ | 1.00 | | | $ | 1.00 | | | $ | 1.00 | | | $ | 1.00 | | | $ | 1.00 | |
Net investment income | | | 0.00 | 3 | | | 0.00 | 3 | | | 0.00 | 3 | | | 0.00 | 3 | | | 0.02 | | | | 0.03 | |
Net realized gains on investments | | | 0.00 | | | | 0.00 | 3 | | | 0.00 | 3 | | | 0.00 | 3 | | | 0.00 | | | | 0.00 | |
| | | | | | | | | | | | | | | | | | | | | | | | |
Total from investment operations | | | 0.00 | 3 | | | 0.00 | 3 | | | 0.00 | 3 | | | 0.00 | 3 | | | 0.02 | | | | 0.03 | |
Distributions to shareholders from | | | | | | | | | | | | | | | | | | | | | | | | |
Net investment income | | | (0.00 | )3 | | | (0.00 | )3 | | | (0.00 | )3 | | | (0.00 | )3 | | | (0.02 | ) | | | (0.03 | ) |
Net realized gains | | | 0.00 | | | | (0.00 | )3 | | | (0.00 | )3 | | | (0.00 | )3 | | | 0.00 | | | | 0.00 | |
| | | | | | | | | | | | | | | | | | | | | | | | |
Total distributions to shareholders | | | (0.00 | )3 | | | (0.00 | )3 | | | (0.00 | )3 | | | (0.00 | )3 | | | (0.02 | ) | | | (0.03 | ) |
Net asset value, end of period | | $ | 1.00 | | | $ | 1.00 | | | $ | 1.00 | | | $ | 1.00 | | | $ | 1.00 | | | $ | 1.00 | |
Total return4 | | | 0.06 | % | | | 0.13 | % | | | 0.21 | % | | | 0.43 | % | | | 2.40 | % | | | 3.31 | % |
Ratios to average net assets (annualized) | | | | | | | | | | | | | | | | | | | | | | | | |
Gross expenses | | | 0.19 | % | | | 0.19 | % | | | 0.19 | % | | | 0.22 | % | | | 0.23 | % | | | 0.20 | % |
Net expenses | | | 0.13 | % | | | 0.13 | % | | | 0.13 | % | | | 0.15 | % | | | 0.15 | % | | | 0.13 | % |
Net investment income | | | 0.12 | % | | | 0.13 | % | | | 0.22 | % | | | 0.41 | % | | | 2.29 | % | | | 4.81 | % |
Supplemental data | | | | | | | | | | | | | | | | | | | | | | | | |
Net assets, end of period (000’s omitted) | | | $6,149,343 | | | | $5,325,713 | | | | $7,593,851 | | | | $4,897,725 | | | | $3,733,381 | | | | $3,025,485 | |
| 1. | For the eleven months ended January 31, 2011. The Fund changed its fiscal year end from February 28 to January 31, effective January 31, 2011. |
| 2. | For the period from June 29, 2007 (commencement of class operations) to February 29, 2008. |
| 3. | Amount is less than $0.005. |
| 4. | Returns for periods of less than one year are not annualized. |
The accompanying notes are an integral part of these financial statements.
| | | | |
| 34 | | Wells Fargo Advantage Cash Investment Money Market Fund | | Financial Highlights |
(For a share outstanding throughout each period)
| | | | | | | | | | | | | | | | | | | | | | | | | | | | |
| | | Six Months Ended July 31, 2012 (Unaudited) | | | Year Ended January 31, | | | Year Ended February 28, | |
| Service Class | | | 2012 | | | 20111 | | | 2010 | | | 2009 | | | 20082 | | | 2007 | |
Net asset value, beginning of period | | $ | 1.00 | | | $ | 1.00 | | | $ | 1.00 | | | $ | 1.00 | | | $ | 1.00 | | | $ | 1.00 | | | $ | 1.00 | |
Net investment income | | | 0.00 | 3 | | | 0.00 | 3 | | | 0.00 | 3 | | | 0.00 | 3 | | | 0.02 | | | | 0.05 | | | | 0.05 | |
Net realized gains on investments | | | 0.00 | 3 | | | 0.00 | 3 | | | 0.00 | 3 | | | 0.00 | 3 | | | 0.00 | | | | 0.00 | | | | 0.00 | |
| | | | | | | | | | | | | | | | | | | | | | | | | | | | |
Total from investment operations | | | 0.00 | 3 | | | 0.00 | 3 | | | 0.00 | 3 | | | 0.00 | 3 | | | 0.02 | | | | 0.05 | | | | 0.05 | |
Distributions to shareholders from | | | | | | | | | | | | | | | | | | | | | | | | | | | | |
Net investment income | | | (0.00 | )3 | | | (0.00 | )3 | | | (0.00 | )3 | | | (0.00 | )3 | | | (0.02 | ) | | | (0.05 | ) | | | (0.05 | ) |
Net realized gains | | | 0.00 | | | | (0.00 | )3 | | | (0.00 | )3 | | | (0.00 | )3 | | | 0.00 | | | | 0.00 | | | | 0.00 | |
| | | | | | | | | | | | | | | | | | | | | | | | | | | | |
Total distributions to shareholders | | | (0.00 | )3 | | | (0.00 | )3 | | | (0.00 | )3 | | | (0.00 | )3 | | | (0.02 | ) | | | (0.05 | ) | | | (0.05 | ) |
Net asset value, end of period | | $ | 1.00 | | | $ | 1.00 | | | $ | 1.00 | | | $ | 1.00 | | | $ | 1.00 | | | $ | 1.00 | | | $ | 1.00 | |
Total return4 | | | 0.00 | % | | | 0.01 | % | | | 0.01 | % | | | 0.14 | % | | | 2.02 | % | | | 4.75 | % | | | 4.80 | % |
Ratios to average net assets (annualized) | | | | | | | | | | | | | | | | | | | | | | | | | | | | |
Gross expenses | | | 0.52 | % | | | 0.52 | % | | | 0.52 | % | | | 0.56 | % | | | 0.56 | % | | | 0.54 | % | | | 0.54 | % |
Net expenses | | | 0.23 | % | | | 0.25 | % | | | 0.35 | % | | | 0.46 | % | | | 0.52 | % | | | 0.50 | % | | | 0.50 | % |
Net investment income | | | 0.01 | % | | | 0.01 | % | | | 0.01 | % | | | 0.16 | % | | | 1.99 | % | | | 4.64 | % | | | 4.71 | % |
Supplemental data | | | | | | | | | | | | | | | | | | | | | | | | | | | | |
Net assets, end of period (000’s omitted) | | | $1,864,901 | | | | $2,000,296 | | | | $2,284,605 | | | | $4,015,237 | | | | $6,358,514 | | | | $7,374,749 | | | | $6,328,867 | |
| 1. | For the eleven months ended January 31, 2011. The Fund changed its fiscal year end from February 28 to January 31, effective January 31, 2011. |
| 2. | Year ended February 29. |
| 3. | Amount is less than $0.005. |
| 4. | Returns for periods of less than one year are not annualized. |
The accompanying notes are an integral part of these financial statements.
| | | | | | |
| Notes to Financial Statements (Unaudited) | | Wells Fargo Advantage Cash Investment Money Market Fund | | | 35 | |
1. ORGANIZATION
Wells Fargo Funds Trust (the “Trust”), a Delaware statutory trust organized on March 10, 1999, is an open-end management investment company registered under the Investment Company Act of 1940, as amended (the “1940 Act”). These financial statements report on Wells Fargo Advantage Cash Investment Money Market Fund (the “Fund”) which is a diversified series of the Trust.
2. SIGNIFICANT ACCOUNTING POLICIES
The following significant accounting policies, which are consistently followed in the preparation of the financial statements of the Fund, are in conformity with U.S. generally accepted accounting principles which require management to make estimates and assumptions that affect the reported amounts of assets and liabilities, disclosure of contingent assets and liabilities at the date of the financial statements, and the reported amounts of revenues and expenses during the reporting period. Actual results could differ from those estimates.
Securities valuation
As permitted under Rule 2a-7 of the 1940 Act, portfolio securities are valued at amortized cost, which approximates fair value. The amortized cost method involves valuing a security at its cost, plus accretion of discount or minus amortization of premium over the period until maturity.
Investments which are not valued using the method discussed above are valued at their fair value, as determined by procedures established in good faith and approved by the Board of Trustees. The Board of Trustees has established a Valuation Committee comprised of the Trustees and has delegated to it the authority to take any actions regarding the valuation of portfolio securities that the Valuation Committee deems necessary in determining the fair value of portfolio securities, unless the responsibility has been delegated to the Management Valuation Team of Wells Fargo Funds Management, LLC (“Funds Management”). The Board of Trustees retains the authority to make or ratify any valuation decisions or approve any changes to the Valuation Procedures as it deems appropriate. On a quarterly basis, the Board of Trustees considers for ratification any valuation actions taken by the Valuation Committee or the Management Valuation Team.
Valuations of fair valued securities are compared to the next actual sales price when available, or other appropriate market information to assess the continued appropriateness of the fair valuation methodology used. These securities are fair valued on a day-to-day basis, taking into consideration changes to appropriate market information and any significant changes to the input factors considered in the valuation process until there is a readily available price provided on the exchange or by an independent pricing service. Valuations received from an independent pricing service or broker quotes are periodically validated by comparisons to most recent trades and valuations provided by other independent pricing services in addition to the review of prices by the adviser and/or sub-adviser. Unobservable inputs used in determining fair valuations are identified based on the type of security, taking into consideration factors utilized by market participants in valuing the investment, knowledge about the issuer and the current market environment.
Repurchase agreements
The Fund may invest in repurchase agreements and may participate in pooled repurchase agreement transactions with other funds advised by Funds Management. The repurchase agreements must be fully collateralized based on values that are marked-to-market daily. The collateral may be held by an agent bank under a tri-party agreement. It is the custodian’s responsibility to value collateral daily and to take action to obtain additional collateral as necessary to maintain market value equal to or greater than the resale price. The repurchase agreements are collateralized by instruments such as U.S. Treasury, federal agency, or high-grade corporate obligations. There could be potential loss to the Fund in the event that the Fund is delayed or prevented from exercising its rights to dispose of the collateral, including the risk of a possible decline in the value of the underlying obligations during the period in which the Fund seeks to assert its rights.
Security transactions and income recognition
Securities transactions are recorded on a trade date basis. Realized gains or losses are reported on the basis of identified cost of securities delivered.
Interest income is accrued daily and bond discounts are accreted and premiums are amortized daily based on the effective interest method. To the extent debt obligations are placed on non-accrual status, any related interest income
| | | | |
| 36 | | Wells Fargo Advantage Cash Investment Money Market Fund | | Notes to Financial Statements (Unaudited) |
may be reduced by writing off interest receivables when the collection of all or a portion of interest has become doubtful based on consistently applied procedures. If the issuer subsequently resumes interest payments or when the collectability of interest is reasonably assured, the debt obligation is removed from non-accrual status.
Distributions to shareholders
Distributions to shareholders from net investment income are accrued daily and paid monthly. Distributions from net realized gains, if any, are recorded on the ex-dividend date. Such distributions are determined in conformity with income tax regulations, which may differ from generally accepted accounting principles.
Federal and other taxes
The Fund intends to continue to qualify as a regulated investment company by distributing substantially all of its investment company taxable income and any net realized capital gains (after reduction for capital loss carryforwards) sufficient to relieve it from all, or substantially all, federal income taxes. Accordingly, no provision for federal income taxes was required.
The Fund’s income and federal excise tax returns and all financial records supporting those returns for the prior three fiscal years are subject to examination by the federal and Delaware revenue authorities. Management has analyzed the Fund’s tax positions taken on federal, state, and foreign tax returns for all open tax years and does not believe that there are any uncertain tax positions that require recognition of a tax liability.
As of January 31, 2012, the Fund had net capital loss carryforwards, which were available to offset future net realized capital gains, in the amount of $3,788,486 expiring in 2018.
Class allocations
The separate classes of shares offered by the Fund differ principally in shareholder servicing and administration fees. Shareholders of each class bear certain expenses that pertain to that particular class. All shareholders bear the common expenses of the Fund, earn income from the portfolio, and are allocated any unrealized gains and losses pro rata based on the average daily net assets of each class, without distinction between share classes. Dividends are determined separately for each class based on income and expenses allocable to each class. Realized gains and losses are allocated to each class pro rata based upon the net assets of each class on the date realized. Differences in per share dividend rates generally result from the relative weightings of pro rata income and realized gain allocations and from differences in separate class expenses, including shareholder servicing and administration fees.
3. FAIR VALUATION MEASUREMENTS
Fair value measurements of investments are determined within a framework that has established a fair value hierarchy based upon the various data inputs utilized in determining the value of the Fund’s investments. The three-level hierarchy gives the highest priority to unadjusted quoted prices in active markets for identical assets or liabilities (Level 1) and the lowest priority to significant unobservable inputs (Level 3). The Fund’s investments are classified within the fair value hierarchy based on the lowest level of input that is significant to the fair value measurement. The inputs are summarized into three broad levels as follows:
| n | | Level 1 – quoted prices in active markets for identical securities |
| n | | Level 2 – other significant observable inputs (including quoted prices for similar securities, interest rates, prepayment speeds, credit risk, etc.) |
| n | | Level 3 – significant unobservable inputs (including the Fund’s own assumptions in determining the fair value of investments) |
The inputs or methodologies used for valuing securities are not necessarily an indication of the risk associated with investing in those securities.
At July 31, 2012, all of the Fund’s investments in securities carried at fair value were designated as Level 2 since the primary inputs include credit quality of the issuer and short-term interest rates which are observable.
Further details on the major security types can be found in the Portfolio of Investments.
| | | | | | |
| Notes to Financial Statements (Unaudited) | | Wells Fargo Advantage Cash Investment Money Market Fund | | | 37 | |
Transfers in and transfers out are recognized at the end of the reporting period. For the six months ended July 31, 2012, the Fund did not have any transfers into/out of Level 1 and Level 2.
4. TRANSACTIONS WITH AFFILIATES AND OTHER EXPENSES
Advisory fee
The Trust has entered into an advisory contract with Funds Management, an indirect wholly owned subsidiary of Wells Fargo & Company (“Wells Fargo”). The adviser is responsible for implementing investment policies and guidelines and for supervising the sub-adviser, who is responsible for day-to-day portfolio management of the Fund.
Pursuant to the contract, Funds Management is entitled to receive at an annual rate of 0.10% of the Fund’s average daily net assets.
Funds Management has retained the services of a sub-adviser to provide daily portfolio management to the Fund. The fee for sub-advisory services is borne by Funds Management. Wells Capital Management Incorporated, an affiliate of Funds Management, is the sub-adviser to the Fund and is entitled to receive a fee from Funds Management at an annual rate starting at 0.05% and declining to 0.01% as the average daily net assets of the Fund increase.
Administration and transfer agent fees
The Trust has entered into an administration agreement with Funds Management. Under this agreement, for providing administrative services, which includes paying fees and expenses for services provided by the transfer agent, sub-transfer agents, omnibus account servicers and record-keepers, Funds Management is entitled to receive from the Fund an annual fund level administration fee starting at 0.05% and declining to 0.03% as the average daily net assets of the Fund increase and a class level administration fee which is calculated based on the average daily net assets of each class as follows:
| | | | |
| | | Class Level Administration Fee | |
Administrator Class | | | 0.10 | % |
Institutional Class | | | 0.08 | |
Select Class | | | 0.04 | |
Service Class | | | 0.12 | |
Funds Management has contractually waived and/or reimbursed advisory and administration fees to the extent necessary to maintain certain net operating expense ratios for the Fund. Waiver of fees and/or reimbursement of expenses by Funds Management were made first from fund level expenses on a proportionate basis and then from class specific expenses. Funds Management has committed through May 31, 2013 to waive fees and/or reimburse expenses to the extent necessary to cap the Fund’s expenses at 0.35% for Administrator Class, 0.20% for Institutional Class, 0.13% for Select Class and 0.50% for Service Class.
Shareholder servicing fees
The Trust has entered into contracts with one or more shareholder servicing agents, whereby Service Class of the Fund is charged a fee at an annual rate of 0.25% of its average daily net assets. Administrator Class is charged a fee at an annual rate of 0.10% of its average daily net assets.
A portion of these total shareholder servicing fees were paid to affiliates of Wells Fargo.
5. INDEMNIFICATION
Under the Trust’s organizational documents, the officers and directors are indemnified against certain liabilities that may arise out of performance of their duties to the Trust. Additionally, in the normal course of business, the Trust may enter into contracts with service providers that contain a variety of indemnification clauses. The Trust’s maximum exposure under these arrangements is dependent on future claims that may be made against the Fund and, therefore, cannot be estimated.
6. NEW ACCOUNTING PRONOUNCEMENT
In December 2011, the Financial Accounting Standards Board (“FASB”) issued Accounting Standard Update (“ASU”) No. 2011-11, Disclosures about Offsetting Assets and Liabilities. ASU 2011-11, which amends FASB ASC Topic 210, Balance
| | | | |
| 38 | | Wells Fargo Advantage Cash Investment Money Market Fund | | Notes to Financial Statements (Unaudited) |
Sheet, creates new disclosure requirements which require entities to disclose both gross and net information for derivatives and other financial instruments that are either offset in the Statement of Assets and Liabilities or subject to an enforceable master netting arrangement or similar agreement. The disclosure requirements are effective for interim and annual reporting periods beginning on or after January 1, 2013. Management is currently assessing the potential impact, in addition to expanded financial statement disclosure, that may result from adopting this ASU.
| | | | | | |
| Other Information (Unaudited) | | Wells Fargo Advantage Cash Investment Money Market Fund | | | 39 | |
PROXY VOTING INFORMATION
A description of the policies and procedures that the Fund uses to determine how to vote proxies relating to portfolio securities is available without charge, upon request, by calling 1-800-222-8222, visiting our Web site at wellsfargoadvantagefunds.com, or visiting the SEC Web site at sec.gov. Information regarding how the Fund voted proxies relating to portfolio securities during the most recent 12-month period ended June 30 is available without charge on the Fund’s Web site at wellsfargoadvantagefunds.com or by visiting the SEC Web site at sec.gov.
PORTFOLIO HOLDINGS INFORMATION
The complete portfolio holdings for each Fund are publicly available on the Funds’ Web site (wellsfargoadvantagefunds.com) on a monthly, seven-day delayed basis. The Fund files its complete schedule of portfolio holdings with the SEC for the first and third quarters of each fiscal year on Form N-Q, which is available without charge by visiting the SEC Web site at sec.gov. In addition, each Fund’s Form N-Q may be reviewed and copied at the SEC’s Public Reference Room in Washington, DC, and at regional offices in New York City, at 233 Broadway, and in Chicago, at 175 West Jackson Boulevard, Suite 900. Information about the Public Reference Room may be obtained by calling 1-800-SEC-0330.
| | | | |
| 40 | | Wells Fargo Advantage Cash Investment Money Market Fund | | Other Information (Unaudited) |
BOARD OF TRUSTEES AND OFFICERS
Each of the Trustees and Officers listed in the table below acts in identical capacities for the Wells Fargo Advantage family of funds, which consists of 138 funds comprising the Wells Fargo Funds Trust, Wells Fargo Variable Trust, Wells Fargo Master Trust and four closed-end funds (collectively the “Fund Complex”). This table should be read in conjunction with the Prospectus and the Statement of Additional Information1. All of the Trustees are also Members of the Audit and Governance Committees of each Trust in the Fund Complex. The mailing address of each Trustee and Officer is 525 Market Street, 12th Floor, San Francisco, CA 94105. Each Trustee and Officer serves an indefinite term, however, each Trustee serves such term until reaching the mandatory retirement age established by the Trustees.
Independent Trustees
| | | | | | |
Name and Year of Birth | | Position Held and Length of Service* | | Principal Occupations During Past Five Years | | Other Directorships During
Past Five Years |
Peter G. Gordon
(Born 1942) | | Trustee, since 1998 Chairman, since 2005 | | Co-Founder, Retired Chairman, President and CEO of Crystal Geyser Water Company. Trustee Emeritus, Colby College | | Asset Allocation Trust |
Isaiah Harris, Jr.
(Born 1952) | | Trustee, since 2009 | | Retired. Prior thereto, President and CEO of BellSouth Advertising and Publishing Corp. from 2005 to 2007, President and CEO of BellSouth Enterprises from 2004 to 2005 and President of BellSouth Consumer Services from 2000 to 2003. Emeritus member of the Iowa State University Foundation Board of Governors. Emeritus Member of the Advisory Board of Iowa State University School of Business. Mr. Harris is a certified public accountant. | | CIGNA Corporation; Deluxe Corporation; Asset Allocation Trust |
Judith M. Johnson
(Born 1949) | | Trustee, since 2008 Audit Committee Chairman, since 2008 | | Retired. Prior thereto, Chief Executive Officer and Chief Investment Officer of Minneapolis Employees Retirement Fund from 1996 to 2008. Ms. Johnson is an attorney, certified public accountant and a certified managerial accountant. | | Asset Allocation Trust |
Leroy Keith, Jr.
(Born 1939) | | Trustee, since 2010 | | Chairman, Bloc Global Services (development and construction). Trustee of the Evergreen Funds from 1983 to 2010. Former Managing Director, Almanac Capital Management (commodities firm), former Partner, Stonington Partners, Inc. (private equity fund), former Director, Obagi Medical Products Co. and former Director, Lincoln Educational Services. | | Trustee, Virtus Fund Complex (consisting of 40 portfolios as of 12/31/11); Asset Allocation Trust |
David F. Larcker
(Born 1950) | | Trustee, since 2009 | | James Irvin Miller Professor of Accounting at the Graduate School of Business, Stanford University, Director of Corporate Governance Research Program and Senior Faculty of The Rock Center for Corporate Governance since 2006. From 2005 to 2008, Professor of Accounting at the Graduate School of Business, Stanford University. Prior thereto, Ernst & Young Professor of Accounting at The Wharton School, University of Pennsylvania from 1985 to 2005. | | Asset Allocation Trust |
Olivia S. Mitchell
(Born 1953) | | Trustee, since 2006 | | International Foundation of Employee Benefit Plans Professor, Wharton School of the University of Pennsylvania since 1993. Director of Wharton’s Pension Research Council and Boettner Center on Pensions & Retirement Research, and Research Associate at the National Bureau of Economic Research. Previously, Cornell University Professor from 1978 to 1993. | | Asset Allocation Trust |
Timothy J. Penny
(Born 1951) | | Trustee, since 1996 | | President and CEO of Southern Minnesota Initiative Foundation, a non-profit organization, since 2007 and Senior Fellow at the Humphrey Institute Policy Forum at the University of Minnesota since 1995. Member of the Board of Trustees of NorthStar Education Finance, Inc., a non-profit organization, since 2007. | | Asset Allocation Trust |
| | | | | | |
| Other Information (Unaudited) | | Wells Fargo Advantage Cash Investment Money Market Fund | | | 41 | |
| | | | | | |
Name and Year of Birth | | Position Held and Length of Service* | | Principal Occupations During Past Five Years | | Other Directorships During
Past Five Years |
Michael S. Scofield
(Born 1943) | | Trustee, since 2010 | | Served on the Investment Company Institute’s Board of Governors and Executive Committee from 2008-2011 as well the Governing Council of the Independent Directors Council from 2006-2011 and the Independent Directors Council Executive Committee from 2008-2011. Chairman of the IDC from 2008-2010. Institutional Investor (Fund Directions) Trustee of Year in 2007. Trustee of the Evergreen Funds (and its predecessors) from 1984 to 2010. Chairman of the Evergreen Funds from 2000-2010. Former Trustee of the Mentor Funds. Retired Attorney, Law Offices of Michael S. Scofield and former Director and Chairman, Branded Media Corporation (multi-media branding company). | | Asset Allocation Trust |
Donald C. Willeke
(Born 1940) | | Trustee, since 1996 | | Principal of the law firm of Willeke & Daniels. General Counsel of the Minneapolis Employees Retirement Fund from 1984 until its consolidation into the Minnesota Public Employees Retirement Association on June 30, 2010. Director and Vice Chair of The Free Trust (non-profit corporation). Director of the American Chestnut Foundation (non-profit corporation). | | Asset Allocation Trust |
| * | Length of service dates reflect the Trustee’s commencement of service with the Trust’s predecessor entities, where applicable. |
Officers
| | | | | | |
Name and Year of Birth | | Position Held and
Length of Service | | Principal Occupations During Past Five Years | | |
Karla M. Rabusch
(Born 1959) | | President, since 2003 | | Executive Vice President of Wells Fargo Bank, N.A. and President of Wells Fargo Funds Management, LLC since 2003. Senior Vice President and Chief Administrative Officer of Wells Fargo Funds Management, LLC from 2001 to 2003. | | |
C. David Messman
(Born 1960) | | Secretary, since 2000; Chief Legal Officer, since 2003 | | Senior Vice President and Secretary of Wells Fargo Funds Management, LLC since 2001. Vice President and Managing Senior Counsel of Wells Fargo Bank, N.A. since 1996. | | |
Nancy Wiser (Born 1967) | | Treasurer, since 2012 | | Executive Vice President of Wells Fargo Funds Management, LLC since 2011. Chief Operating Officer and Chief Compliance Officer at LightBox Capital Management LLC, from 2008 to 2011. Owned and operated a consulting business providing services to various hedge funds including acting as Chief Operating Officer and Chief Compliance Officer for a hedge fund from 2007 to 2008. Chief Operating Officer and Chief Compliance Officer of GMN Capital LLC from 2006 to 2007. | | |
David Berardi
(Born 1975) | | Assistant Treasurer, since 2009 | | Vice President of Wells Fargo Funds Management, LLC since 2009. Vice President of Evergreen Investment Management Company, LLC from 2008 to 2010. Assistant Vice President of Evergreen Investment Services, Inc. from 2004 to 2008. Manager of Fund Reporting and Control for Evergreen Investment Management Company, LLC from 2004 to 2010. | | |
Jeremy DePalma
(Born 1974) | | Assistant Treasurer, since 2009 | | Senior Vice President of Wells Fargo Funds Management, LLC since 2009. Senior Vice President of Evergreen Investment Management Company, LLC from 2008 to 2010. Vice President, Evergreen Investment Services, Inc. from 2004 to 2007. Head of the Fund Reporting and Control Team within Fund Administration from 2005 to 2010. | | |
Debra Ann Early
(Born 1964) | | Chief Compliance Officer, since 2007 | | Chief Compliance Officer of Wells Fargo Funds Management, LLC since 2007. Chief Compliance Officer of Parnassus Investments from 2005 to 2007. Chief Financial Officer of Parnassus Investments from 2004 to 2007 and Senior Audit Manager of PricewaterhouseCoopers LLP from 1998 to 2004. | | |
| 1. | The Statement of Additional Information includes additional information about the Trustees and is available, without charge, upon request, by calling 1-800-222-8222 or by visiting the Web site at wellsfargoadvantagefunds.com. |
| | | | |
| 42 | | Wells Fargo Advantage Cash Investment Money Market Fund | | Other Information (Unaudited) |
BOARD CONSIDERATION OF INVESTMENT ADVISORY AND SUB-ADVISORY AGREEMENTS:
Under Section 15 of the Investment Company Act of 1940 (the “1940 Act”), the Board of Trustees (the “Board”) of Wells Fargo Funds Trust (the “Trust”), all the members of which have no direct or indirect interest in the investment advisory and sub-advisory agreements and are not “interested persons” of the Trust, as defined in the 1940 Act (the “Independent Trustees”), must determine whether to approve the continuation of the Trust’s investment advisory and sub-advisory agreements. In this regard, at an in person meeting held on March 29-30, 2012 (the “Meeting”), the Board reviewed and re-approved: (i) an investment advisory agreement with Wells Fargo Funds Management, LLC (“Funds Management”) for Wells Fargo Advantage Cash Investment Money Market Fund (the “Fund”) and (ii) an investment sub-advisory agreement with Wells Capital Management Incorporated (“Wells Capital Management”) for the Fund. The investment advisory agreement with Funds Management and the investment sub-advisory agreement with Wells Capital Management are collectively referred to as the “Advisory Agreements.”
At the Meeting, the Board considered the factors and reached the conclusions described below relating to the selection of Funds Management and Wells Capital Management and the continuation of the Advisory Agreements. Prior to the Meeting, the Trustees conferred extensively among themselves and with representatives of Funds Management about these matters. The Board also met throughout the year and received information that was useful to them in considering the continuation of the Advisory Agreements. The Independent Trustees were assisted in their evaluation of the Advisory Agreements by independent legal counsel, from whom they received separate legal advice and with whom they met separately from Funds Management.
In providing information to the Board, Funds Management and Wells Capital Management were guided by a detailed set of requests submitted by the Independent Trustees’ independent legal counsel on their behalf at the start of the Board’s annual contract renewal process earlier in 2012. In approving the Advisory Agreements, the Board did not identify any particular information or consideration that was all-important or controlling, and each Trustee likely attributed different weights to various factors.
Nature, extent and quality of services
The Board received and considered various information regarding the nature, extent and quality of services provided to the Fund by Funds Management and Wells Capital Management under the Advisory Agreements. The Board also received and considered, among other things, information about the background and experience of senior management of Funds Management, and the qualifications, backgrounds, tenures and responsibilities of the portfolio managers primarily responsible for the day-to-day portfolio management of the Fund.
The Board evaluated the ability of Funds Management and Wells Capital Management, based on their respective financial condition, resources, reputation and other attributes, to attract and retain qualified investment professionals, including research, advisory, and supervisory personnel. The Board further considered the compliance programs and compliance records of Funds Management and Wells Capital Management. In addition, the Board took into account the administrative services provided to the Fund by Funds Management and its affiliates.
The Board’s decision to approve the continuation of the Advisory Agreements was based on a comprehensive evaluation of information provided to it. In considering these matters, the Board considered not only the specific information presented in connection with the Meeting, but also the knowledge gained over time through interaction with Funds Management and Wells Capital Management about various topics, including Funds Management’s oversight of service providers. The above factors, together with those referenced below, are some of the most important, but not necessarily all, factors considered by the Board in concluding that the nature, extent and quality of the investment advisory services provided to the Fund by Funds Management and Wells Capital Management supported the re-approval of the Advisory Agreements. Although the Board considered the continuation of the Advisory Agreements for the Fund as part of the larger process of considering the continuation of the advisory agreements for all of the funds in the complex, its decision to continue the Advisory Agreements for the Fund was ultimately made on a fund-by-fund basis.
Fund performance and expenses
The Board considered the performance results for the Fund over various time periods ended December 31, 2011. The Board also considered these results in comparison to the median performance of a universe of relevant funds (the “Universe”) that was determined by Lipper Inc. (“Lipper”) to be similar to the Fund, and in comparison to the Fund’s
| | | | | | |
| Other Information (Unaudited) | | Wells Fargo Advantage Cash Investment Money Market Fund | | | 43 | |
benchmark index and to other comparative data. Lipper is an independent provider of investment company data. The Board received a description of the methodology used by Lipper to select the mutual funds in the Universe. The Board noted that the performance of the Fund was equal to or in range of the median performance of the Universe for all periods under review. The Board also noted that the performance of the Fund was equal to or in range of its benchmark, the Lipper Institutional Money Market Funds Index, for the periods under review.
The Board received and considered information regarding the Fund’s contractual advisory fee and net operating expense ratios and their various components, including actual management fees (which reflect fee waivers, if any), transfer agent, custodian and other non-management fees, Rule 12b-1 and non-Rule 12b-1 fees, service fees and fee waiver and expense reimbursement arrangements. The Board also considered these ratios in comparison to the median ratios of an expense Universe and a narrower expense group of mutual funds (each, an “Expense Group”) that was determined by Lipper to be similar to the Fund. The Board received a description of the methodology used by Lipper to select the mutual funds in the Fund’s Expense Group. The Board noted that the net operating expense ratios of the Fund were in range of the Fund’s Expense Group’s median net operating expense ratios, except for Service Class.
Funds Management advised the Board that the Expense Group medians reflected voluntary waivers, whereas the Fund’s expense ratios did not reflect voluntary waivers. The Board noted that when the Fund’s expense ratios were adjusted to reflect voluntary waivers, the Fund’s net operating expense ratios were lower than the median net operating expense ratios of the Expense Group.
Based on the above-referenced considerations and other factors, the Board concluded that the overall performance and expense structure of the Fund supported the re-approval of the Advisory Agreements for the Fund.
Investment advisory and sub-advisory fee rates
The Board reviewed and considered the contractual investment advisory fee rate that is payable by the Fund to Funds Management for investment advisory services (the “Advisory Agreement Rate”), both on a stand-alone basis and on a combined basis with the Fund’s administration fee rate. The Board took into account the separate administrative and other services covered by the administration fee rate. The Board also reviewed and considered the contractual investment sub-advisory fee rate that is payable by Funds Management to Wells Capital Management for investment sub-advisory services (the “Sub-Advisory Agreement Rate”). In addition, the Board reviewed and considered the existing fee waiver/cap arrangements applicable to the Advisory Agreement Rate and considered the Advisory Agreement Rate after taking the waivers/caps into account (the “Net Advisory Rate”).
The Board received and considered information comparing the Advisory Agreement Rate and Net Advisory Rate, combined with the administration fee rates, with those of other funds in the Fund’s Expense Group median. The Board noted that the Advisory Agreement Rate and Net Advisory Rate for the Fund were in range of the median rates for the Fund’s Expense Group. The Board viewed favorably Funds Management’s willingness to voluntarily waive certain fees.
The Board also received and considered information about the nature and extent of services offered and fee rates charged by Funds Management and Wells Capital Management to other types of clients. In this regard, the Board received information about differences between the services, and the compliance, reporting, and other legal burdens and risks of providing investment advice to mutual funds and those associated with providing advice to non-mutual fund clients such as collective funds or institutional separate accounts.
The Board determined that the Advisory Agreement Rate for the Fund, both with and without the administration fee rate and before and after waivers, was reasonable in light of the Fund’s Expense Group information, the net expense ratio commitments, the services covered by the Advisory Agreements and other information provided. The Board also reviewed and considered the Sub-Advisory Agreement Rate and concluded that the Sub-Advisory Agreement Rate was reasonable in light of the services covered by the sub-advisory agreement and other information provided.
Profitability
The Board received and considered a profitability analysis of Funds Management, as well as an analysis of the profitability to the collective Wells Fargo businesses that provide services to the Fund. It considered that the information provided to it was necessarily estimated, and that the profitability information provided to it, especially on a fund-by-fund basis, did not necessarily provide a precise tool for evaluating the appropriateness of the Fund’s Advisory Agreement Rate in
| | | | |
| 44 | | Wells Fargo Advantage Cash Investment Money Market Fund | | Other Information (Unaudited) |
isolation. It noted that the levels of profitability reported on a fund-by-fund basis varied widely, depending on, among other things, the size and type of fund. The Board noted the impact of voluntary fee waivers on Funds Management’s profitability. The Board concluded that the profitability reported by Funds Management was not unreasonable.
The Board did not consider separate profitability information with respect to Wells Capital Management, because, as an affiliate of Funds Management, its profitability information was subsumed in the collective Wells Fargo profitability analysis provided by Funds Management.
Economies of scale
With respect to possible economies of scale, the Board reviewed the breakpoints in the Fund’s advisory fee and/or administration fee structure, which operate generally to reduce the expenses of the Fund (as a percentage of Fund assets) as the Fund grows in size. It considered that, as a fund shrinks in size, breakpoints conversely result in increasing fee levels. The Board noted that it would have on-going opportunities to review the appropriate levels of breakpoints in the future, and concluded that the breakpoints as implemented appeared to be a reasonable step toward sharing economies of scale, if any, with the Fund. However, the Board acknowledged the inherent limitations of any analysis of economies of scale and of any attempt to correlate breakpoints with such economies, stemming largely from the Board’s understanding that economies of scale are realized, if at all, across a variety of products and services, not just with respect to a single fund.
Other benefits to Funds Management and Wells Capital Management
The Board received and considered information regarding potential “fall-out” or ancillary benefits received by Funds Management and its affiliates, including Wells Capital Management, as a result of their relationship with the Fund. Ancillary benefits could include, among others, benefits directly attributable to the relationship of Funds Management and Wells Capital Management with the Fund and benefits potentially derived from an increase in Funds Management’s and Wells Capital Management’s business as a result of their relationship with the Fund (such as the ability to market to shareholders other financial products offered by Funds Management and its affiliates, including Wells Capital Management).
The Board considered that Wells Fargo Funds Distributor, LLC, an affiliate of Funds Management, serves as distributor to the Fund and receives certain compensation for those services. The Board noted that various financial institutions, including affiliates of Funds Management, may receive distribution-related fees, shareholder servicing payments (including amounts derived from payments under Rule 12b-1 plans) and sub-transfer agency fees in respect of shares sold or held through them and services provided.
The Board also reviewed information about whether and to what extent soft dollar credits are sought and how any such credits are utilized and any benefits that may be realized by using an affiliated broker.
Other factors and broader review
The Board also considered the markets for distribution of the Fund’s shares, including the channels through which the Fund’s shares are offered and sold. The Board noted that the Fund is part of one of the few fund families that have both direct-to-fund and intermediary distribution channels. As discussed above, the Board reviews detailed materials received from Funds Management and Wells Capital Management annually as part of the re-approval process under Section 15 of the 1940 Act and also reviews and assesses information about the quality of the services that the Fund receives throughout the year. In this regard, the Board has reviewed reports of Funds Management at each of its quarterly meetings, which include, among other things, portfolio reviews and performance reports. In addition, the Board confers with portfolio managers at various times throughout the year.
Conclusion
After considering the above-described factors and based on its deliberations and its evaluation of the information described above, the Board unanimously approved the continuation of the Advisory Agreements for an additional one-year period.
| | | | | | |
| List of Abbreviations | | Wells Fargo Advantage Cash Investment Money Market Fund | | | 45 | |
The following is a list of common abbreviations for terms and entities which may have appeared in this report.
| ACB | — Agricultural Credit Bank |
| ADR | — American Depository Receipt |
| ADS | — American Depository Shares |
| AGC-ICC | — Assured Guaranty Corporation - Insured Custody Certificates |
| AGM | — Assured Guaranty Municipal |
| AMBAC | — American Municipal Bond Assurance Corporation |
| AMT | — Alternative Minimum Tax |
| BAN | — Bond Anticipation Notes |
| BHAC | — Berkshire Hathaway Assurance Corporation |
| CAB | — Capital Appreciation Bond |
| CCAB | — Convertible Capital Appreciation Bond |
| CDA | — Community Development Authority |
| CDO | — Collateralized Debt Obligation |
| COP | — Certificate of Participation |
| DRIVER | — Derivative Inverse Tax-Exempt Receipts |
| DW&P | — Department of Water & Power |
| DWR | — Department of Water Resources |
| ECFA | — Educational & Cultural Facilities Authority |
| EDA | — Economic Development Authority |
| EDFA | — Economic Development Finance Authority |
| ETF | — Exchange-Traded Fund |
| FFCB | — Federal Farm Credit Bank |
| FGIC | — Financial Guaranty Insurance Corporation |
| FGLMC | — Federal Government Loan Mortgage Company |
| FHA | — Federal Housing Authority |
| FHLB | — Federal Home Loan Bank |
| FHLMC | — Federal Home Loan Mortgage Corporation |
| FICO | — The Financing Corporation |
| FNMA | — Federal National Mortgage Association |
| GDR | — Global Depository Receipt |
| GNMA | — Government National Mortgage Association |
| HCFR | — Healthcare Facilities Revenue |
| HEFA | — Health & Educational Facilities Authority |
| HEFAR | — Higher Education Facilities Authority Revenue |
| HFA | — Housing Finance Authority |
| HFFA | — Health Facilities Financing Authority |
| IBC | — Insured Bond Certificate |
| IDA | — Industrial Development Authority |
| IDAG | — Industrial Development Agency |
| IDR | — Industrial Development Revenue |
| KRW | — Republic of Korea Won |
| LIBOR | — London Interbank Offered Rate |
| LLC | — Limited Liability Company |
| LLP | — Limited Liability Partnership |
| MBIA | — Municipal Bond Insurance Association |
| MFHR | — Multi-Family Housing Revenue |
| MSTR | — Municipal Securities Trust Receipts |
| MUD | — Municipal Utility District |
| NATL-RE | — National Public Finance Guarantee Corporation |
| PCFA | — Pollution Control Finance Authority |
| PCR | — Pollution Control Revenue |
| PFA | — Public Finance Authority |
| PFFA | — Public Facilities Financing Authority |
| PFOTER | — Puttable Floating Option Tax-Exempt Receipts |
| plc | — Public Limited Company |
| PUTTER | — Puttable Tax-Exempt Receipts |
| R&D | — Research & Development |
| RDA | — Redevelopment Authority |
| RDFA | — Redevelopment Finance Authority |
| REIT | — Real Estate Investment Trust |
| ROC | — Reset Option Certificates |
| SAVRS | — Select Auction Variable Rate Securities |
| SBA | — Small Business Authority |
| SFHR | — Single Family Housing Revenue |
| SFMR | — Single Family Mortgage Revenue |
| SPA | — Standby Purchase Agreement |
| SPDR | — Standard & Poor’s Depositary Receipts |
| STRIPS | — Separate Trading of Registered Interest and Principal Securities |
| TAN | — Tax Anticipation Notes |
| TIPS | — Treasury Inflation-Protected Securities |
| TRAN | — Tax Revenue Anticipation Notes |
| TCR | — Transferable Custody Receipts |
| TTFA | — Transportation Trust Fund Authority |
| TVA | — Tennessee Valley Authority |
| XLCA | — XL Capital Assurance |
This page is intentionally left blank.


FOR MORE INFORMATION
More information about Wells Fargo Advantage Funds is available free upon request. To obtain literature, please write, e-mail, visit the Fund’s Web site, or call:
Wells Fargo Advantage Funds
P.O. Box 8266
Boston, MA 02266-8266
E-mail: wfaf@wellsfargo.com
Web site: wellsfargoadvantagefunds.com
Individual investors: 1-800-222-8222
Retail investment professionals: 1-888-877-9275
Institutional investment professionals: 1-866-765-0778
This report and the financial statements contained herein are submitted for the general information of the shareholders of Wells Fargo Advantage Funds. If this report is used for promotional purposes, distribution of the report must be accompanied or preceded by a current prospectus. For a current prospectus and, if available, a summary prospectus containing more complete information, including charges and expenses, call 1-800-222-8222 or visit the Fund’s Web site at wellsfargoadvantagefunds.com. Please consider the investment objectives, risks, charges, and expenses of the investment carefully before investing. This and other information about Wells Fargo Advantage Funds can be found in the current prospectus. Read the prospectus carefully before you invest or send money.
Wells Fargo Funds Management, LLC, a wholly owned subsidiary of Wells Fargo & Company, provides investment advisory and administrative services for Wells Fargo Advantage Funds. Other affiliates of Wells Fargo & Company provide subadvisory and other services for the Funds. The Funds are distributed by Wells Fargo Funds Distributor, LLC, Member FINRA/SIPC, an affiliate of Wells Fargo & Company.
NOT FDIC INSURED ¡ NO BANK GUARANTEE ¡ MAY LOSE VALUE
© 2012 Wells Fargo Funds Management, LLC. All rights reserved.
| | |
 | | 211387 09-12 SA302/SAR302 07-12 |

Wells Fargo Advantage
Government Money Market Fund

Semi-Annual Report
July 31, 2012

Reduce clutter. Save trees.
Sign up for electronic delivery of prospectuses and shareholder reports at wellsfargo.com/advantagedelivery
Contents
The views expressed and any forward-looking statements are as of July 31, 2012, unless otherwise noted, and are those of the Fund managers and/or Wells Fargo Funds Management, LLC. Discussions of individual securities, or the markets generally, or any Wells Fargo Advantage Fund are not intended as individual recommendations. Future events or results may vary significantly from those expressed in any forward-looking statements; the views expressed are subject to change at any time in response to changing circumstances in the market. Wells Fargo Funds Management, LLC, disclaims any obligation to publicly update or revise any views expressed or forward-looking statements.
NOT FDIC INSURED ¡ NO BANK GUARANTEE ¡ MAY LOSE VALUE

WELLS FARGO INVESTMENT HISTORY
| | |
| |
| 1932 | | Keystone creates one of the first mutual fund families. |
| |
| 1971 | | Wells Fargo & Company introduces one of the first institutional index funds. |
| |
| 1978 | | Wells Fargo applies Markowitz and Sharpe’s research on Modern Portfolio Theory to introduce one of the industry’s first Tactical Asset Allocation (TAA) models in institutional separately managed accounts. |
| |
| 1984 | | Wells Fargo Stagecoach Funds launches its first asset allocation fund. |
| |
| 1989 | | The Tactical Asset Allocation (TAA) Model is first applied to Wells Fargo’s asset allocation mutual funds. |
| |
| 1994 | | Wells Fargo introduces the LifePath Funds, one of the first suites of target date funds (now the Wells Fargo Advantage Dow Jones Target Date FundsSM). |
| |
| 1996 | | Evergreen Investments and Keystone Funds merge. |
| |
| 1997 | | Wells Fargo launches Wells Fargo Advantage WealthBuilder PortfoliosSM, a fund-of-funds suite of products that includes the use of quantitative models to shift assets among investment styles. |
| |
| 1999 | | Norwest Advantage Funds and Stagecoach Funds are reorganized into Wells Fargo Funds after the merger of Norwest and Wells Fargo. |
| |
| 2002 | | Evergreen Retail and Evergreen Institutional companies form the umbrella asset management company, Evergreen Investments. |
| |
| 2005 | | The integration of Strong Funds with Wells Fargo Funds creates Wells Fargo Advantage Funds, resulting in one of the top 20 mutual fund companies in the United States. |
| |
| 2006 | | Wells Fargo Advantage Funds relaunches the target date product line as Wells Fargo Advantage Dow Jones Target Date Funds. |
| |
| 2010 | | The mergers and reorganizations of Evergreen and Wells Fargo Advantage mutual funds are completed, unifying the families under the brand of Wells Fargo Advantage Funds. |
Wells Fargo Advantage Funds®
Wells Fargo Advantage Funds skillfully guides institutions, financial advisors, and individuals through the investment terrain to help them reach their financial objectives. Everything we do on behalf of investors is backed by our unique combination of qualifications.
Strength
Our organization is built on the standards of integrity and service established by our parent company—Wells Fargo & Company—more than 150 years ago. And, because we’re part of a highly diversified financial enterprise, we offer the depth of resources to help investors succeed.
Expertise
Our multi-boutique model offers investors access to the independent thinking of premier investment managers that have been chosen for their time-tested strategies. While each team specializes in a specific investment strategy, collectively they provide investors a wide choice of distinct investment styles. Our dedication to investment excellence doesn’t end with our expertise in manager selection—risk management, analysis, and rigorous ongoing review seek to ensure each manager’s investment process remains consistent.
Partnership
Our collaborative approach is built around understanding the needs and goals of our clients. By adhering to core principles of sound judgment and steady guidance, we support you through every stage of the investment decision process.
Carefully consider a fund’s investment objectives, risks, charges, and expenses before investing. For a current prospectus and, if available, a summary prospectus, containing this and other information, visit wellsfargoadvantagefunds.com. Read it carefully before investing.
Wells Fargo Funds Management, LLC, a wholly owned subsidiary of Wells Fargo & Company, provides investment advisory and administrative services for Wells Fargo Advantage Funds®. Other affiliates of Wells Fargo & Company provide subadvisory and other services for the Funds. The Funds are distributed by Wells Fargo Funds Distributor, LLC, Member FINRA/SIPC, an affiliate of Wells Fargo & Company.
“Dow Jones®” and “Dow Jones Target Date IndexesSM” are service marks of Dow Jones Trademark Holdings, LLC (“Dow Jones”), have been licensed to CME Group Index Services LLC (“CME Indexes”) and have been sublicensed for use for certain purposes by Global Index Advisors, Inc, and Wells Fargo Funds Management, LLC. The Wells Fargo Advantage Dow Jones Target Date FundsSM based on the Dow Jones Target Date IndexesSM, are not sponsored, endorsed, sold or promoted by Dow Jones, CME Indexes or their respective affiliates and none of them makes any representation regarding the advisability of investing in such product(s).
NOT FDIC INSURED ¡ NO BANK GUARANTEE ¡ MAY LOSE VALUE
Not part of the semi-annual report.
Wells Fargo Advantage Funds offers more than 110 mutual funds across a wide range of asset classes, representing over $209 billion in assets under management, as of July 31, 2012.
| | | | |
| Equity Funds | | | | |
Asia Pacific Fund | | Enterprise Fund† | | Opportunity Fund† |
C&B Large Cap Value Fund | | Equity Value Fund | | Precious Metals Fund |
C&B Mid Cap Value Fund | | Global Opportunities Fund | | Premier Large Company Growth Fund |
Capital Growth Fund | | Growth Fund | | Small Cap Opportunities Fund |
Common Stock Fund | | Index Fund | | Small Cap Value Fund |
Disciplined U.S. Core Fund | | International Equity Fund | | Small Company Growth Fund |
Discovery Fund† | | International Value Fund | | Small Company Value Fund |
Diversified Equity Fund | | Intrinsic Small Cap Value Fund | | Small/Mid Cap Core Fund |
Diversified International Fund | | Intrinsic Value Fund | | Small/Mid Cap Value Fund |
Diversified Small Cap Fund | | Intrinsic World Equity Fund | | Special Mid Cap Value Fund |
Emerging Growth Fund | | Large Cap Core Fund | | Special Small Cap Value Fund |
Emerging Markets Equity Fund | | Large Cap Growth Fund | | Specialized Technology Fund |
Emerging Markets Equity Income Fund | | Large Company Value Fund | | Traditional Small Cap Growth Fund |
Endeavor Select Fund† | | Omega Growth Fund | | Utility and Telecommunications Fund |
| Bond Funds | | | | |
Adjustable Rate Government Fund | | Inflation-Protected Bond Fund | | Short-Term Bond Fund |
California Limited-Term Tax-Free Fund | | Intermediate Tax/AMT-Free Fund | | Short-Term High Yield Bond Fund |
California Tax-Free Fund | | International Bond Fund | | Short-Term Municipal Bond Fund |
Colorado Tax-Free Fund | | Minnesota Tax-Free Fund | | Strategic Municipal Bond Fund |
Emerging Markets Local Bond Fund | | Municipal Bond Fund | | Total Return Bond Fund |
Government Securities Fund | | North Carolina Tax-Free Fund | | Ultra Short-Term Income Fund |
High Income Fund | | Pennsylvania Tax-Free Fund | | Ultra Short-Term Municipal Income Fund |
High Yield Bond Fund | | Short Duration Government Bond Fund | | Wisconsin Tax-Free Fund |
Income Plus Fund | | | | |
| Asset Allocation Funds | | | | |
Absolute Return Fund | | WealthBuilder Equity Portfolio† | | Target 2020 Fund† |
Asset Allocation Fund | | WealthBuilder Growth Allocation Portfolio† | | Target 2025 Fund† |
Conservative Allocation Fund | | WealthBuilder Growth Balanced Portfolio† | | Target 2030 Fund† |
Diversified Capital Builder Fund | | WealthBuilder Moderate Balanced Portfolio† | | Target 2035 Fund† |
Diversified Income Builder Fund | | WealthBuilder Tactical Equity Portfolio† | | Target 2040 Fund† |
Growth Balanced Fund | | Target Today Fund† | | Target 2045 Fund† |
Index Asset Allocation Fund | | Target 2010 Fund† | | Target 2050 Fund† |
Moderate Balanced Fund | | Target 2015 Fund† | | Target 2055 Fund† |
WealthBuilder Conservative Allocation Portfolio† | | | | |
| Money Market Funds | | | | |
100% Treasury Money Market Fund | | Heritage Money Market Fund† | | National Tax-Free Money Market Fund |
California Municipal Money Market Fund | | Money Market Fund | | Prime Investment Money Market Fund |
Cash Investment Money Market Fund | | Municipal Cash Management Money Market Fund | | Treasury Plus Money Market Fund |
Government Money Market Fund | | Municipal Money Market Fund | | |
| Variable Trust Funds1 | | | | |
VT Discovery Fund† | | VT Intrinsic Value Fund | | VT Small Cap Growth Fund |
VT Index Asset Allocation Fund | | VT Omega Growth Fund | | VT Small Cap Value Fund |
VT International Equity Fund | | VT Opportunity Fund† | | VT Total Return Bond Fund |
An investment in a money market fund is not insured or guaranteed by the Federal Deposit Insurance Corporation or any other government agency. Although the Wells Fargo Advantage Money Market Funds seek to preserve the value of your investment at $1.00 per share, it is possible to lose money by investing in a money market fund.
| 1. | The Variable Trust Funds are generally available only through insurance company variable contracts. |
| † | In this report, the Wells Fargo Advantage Discovery FundSM, Wells Fargo Advantage Endeavor Select FundSM, Wells Fargo Advantage Enterprise FundSM, Wells Fargo Advantage Opportunity FundSM, Wells Fargo Advantage WealthBuilder Conservative Allocation PortfolioSM, Wells Fargo Advantage WealthBuilder Equity PortfolioSM, Wells Fargo Advantage WealthBuilder Growth Allocation PortfolioSM, Wells Fargo Advantage WealthBuilder Growth Balanced PortfolioSM, Wells Fargo Advantage WealthBuilder Moderate Balanced PortfolioSM, Wells Fargo Advantage WealthBuilder Tactical Equity PortfolioSM, Wells Fargo Advantage Dow Jones Target Today FundSM, Wells Fargo Advantage Dow Jones Target 2010 FundSM, Wells Fargo Advantage Dow Jones Target 2015 FundSM, Wells Fargo Advantage Dow Jones Target 2020 FundSM, Wells Fargo Advantage Dow Jones Target 2025 FundSM, Wells Fargo Advantage Dow Jones Target 2030 FundSM, Wells Fargo Advantage Dow Jones Target 2035 FundSM, Wells Fargo Advantage Dow Jones Target 2040 FundSM, Wells Fargo Advantage Dow Jones Target 2045 FundSM, Wells Fargo Advantage Dow Jones Target 2050 FundSM, Wells Fargo Advantage Dow Jones Target 2055 FundSM, Wells Fargo Advantage Heritage Money Market FundSM, Wells Fargo Advantage VT Discovery FundSM, and Wells Fargo Advantage VT Opportunity FundSM are referred to as the Discovery Fund, Endeavor Select Fund, Enterprise Fund, Opportunity Fund, WealthBuilder Conservative Allocation Portfolio, WealthBuilder Equity Portfolio, WealthBuilder Growth Allocation Portfolio, WealthBuilder Growth Balanced Portfolio, WealthBuilder Moderate Balanced Portfolio, WealthBuilder Tactical Equity Portfolio, Target Today Fund, Target 2010 Fund, Target 2015 Fund, Target 2020 Fund, Target 2025 Fund, Target 2030 Fund, Target 2035 Fund, Target 2040 Fund, Target 2045 Fund, Target 2050 Fund, Target 2055 Fund, Heritage Money Market Fund, VT Discovery Fund, and VT Opportunity Fund, respectively. |
Not part of the semi-annual report.
| | | | |
| 2 | | Wells Fargo Advantage Government Money Market Fund | | Letter to Shareholders (Unaudited) |

Karla M. Rabusch,
President
Wells Fargo Advantage Funds
Not only has the Fed been successful in engineering low interest rates, but investors have rushed to buy U.S. Treasury securities as a safe-haven asset in the midst of uncertainty surrounding the European debt crisis. As a result, interest rates reached record lows.
Dear Valued Shareholder:
We’re pleased to offer you this semi-annual report for the Wells Fargo Advantage Government Money Market Fund for the six-month period that ended July 31, 2012.
The economy grew, but the recovery has been modest.
The U.S. is three years into a modest economic recovery, with second-quarter real gross domestic product (GDP) increasing 1.5% on an annualized basis. Several factors, however, held back growth despite the Federal Reserve’s (Fed) accommodative monetary policy. In Europe, much uncertainty remained about the outcome of the eurozone debt crisis and whether policymakers will be able to resolve it without any countries defaulting or leaving the euro. In addition, Europe has again entered a recession. In Asia, China’s economy slowed. Here at home, a potential “fiscal cliff”—automatic tax increases alongside automatic budget cuts stemming from a legislative compromise in Congress—added uncertainty and, if unaddressed, could negatively affect GDP beginning in 2013.
In an effort to further bolster the economy, especially the labor market, the Fed has indicated its commitment to maintaining a highly accommodative monetary policy. It has indicated its belief that economic conditions warrant an extremely low federal funds target rate—a short-term bank lending rate—near 0%, at least through late 2014. The Fed also continued its “Operation Twist,” which involves buying U.S. Treasury securities with maturities of greater than six years and selling U.S. Treasury securities with maturities of less than three years, in an effort to keep longer-term interest rates low.
A demand for relative safe-haven securities led to ultra-low interest rates.
Not only has the Fed been successful in engineering low interest rates, but investors have rushed to buy U.S. Treasury securities as a relative safe-haven asset in the midst of uncertainty surrounding the European debt crisis. As a result, interest rates reached record lows. Ten-year U.S. Treasury yields ranged between 2.38% and 1.38% over the past six months. Three-month U.S. Treasury bills had an average yield of 10 basis points (bps; 100 bps is 1.00%) over the past six months. Rates on seven-day commercial paper, a common investment type for prime money market funds, were 12 bps on July 31, 2012.
Lack of supply kept a lid on yields, and regulatory uncertainty remained.
Continued demand for a limited supply of money market-eligible securities also contributed to low yields. We estimate that the amount outstanding of short-term, money market fund-eligible securities (excluding U.S. Treasury securities) has declined by $3 trillion, or more than a 30% decrease, since 2008. Reasons for this decrease in supply include issuers opting to lock in rates on long-term rather than short-term debt, less need for financing as many companies have plentiful cash given record profits, and credit downgrades that have resulted in fewer firms with top credit ratings.
The Chairman of the Securities and Exchange Commission (SEC) indicated in late August that the SEC has determined at this time not to propose certain amendments to the rules governing money market funds. However, the Financial Stability Oversight Council or other financial regulators could still take steps to impose additional regulations on money market funds. As we gain clarity in the
| | | | | | |
| Letter to Shareholders (Unaudited) | | Wells Fargo Advantage Government Money Market Fund | | | 3 | |
coming months regarding any potential changes to regulation of money market funds, we will provide further communications to our clients about these changes.
Amid the current challenges of investing—low yields, an unresolved eurozone crisis, limited supply, and regulatory uncertainty—has been the opportunity to provide our clients an important investment option for meeting their short-term cash needs. Our focus on preservation of capital and liquidity is not a marketing phrase but rather the basis of our investment philosophy as we manage money market funds in an uncertain world. We are proud of our comprehensive lineup of prime, government, and tax-exempt money market funds.
Thank you for choosing to invest with Wells Fargo Advantage Funds. We appreciate your confidence in us and remain committed to helping you meet your financial needs. For current information about your fund investments, contact your investment professional, visit our Web site at wellsfargoadvantagefunds.com, or call us directly at 1-800-222-8222. We are available 24 hours a day, 7 days a week.
Sincerely,

Karla M. Rabusch
President
Wells Fargo Advantage Funds
Amid the current challenges of investing—low yields, an unresolved eurozone crisis, limited supply, and regulatory uncertainty—has been the opportunity to provide our clients an important investment option for meeting their short-term cash needs.
| | | | |
| 4 | | Wells Fargo Advantage Government Money Market Fund | | Performance Highlights (Unaudited) |
INVESTMENT OBJECTIVE
The Fund seeks current income, while preserving capital and liquidity.
ADVISER
Wells Fargo Funds Management, LLC
SUB-ADVISER
Wells Capital Management Incorporated
PORTFOLIO MANAGERS
David D. Sylvester
Laurie White
FUND INCEPTION
November 16, 1987
| | |
PORTFOLIO COMPOSITION1
(AS OF JULY 31, 2012) |
|
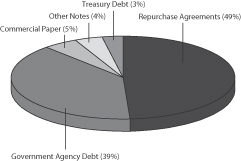 |
| | |
EFFECTIVE MATURITY DISTRIBUTION2
(AS OF JULY 31, 2012) |
|
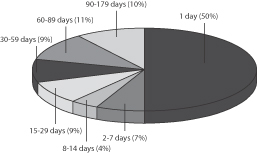 |
|
WEIGHTED AVERAGE MATURITY3
(AS OF JULY 31, 2012) |
27 Days |
|
WEIGHTED AVERAGE FINAL MATURITY4
(AS OF JULY 31, 2012) |
74 Days |
| 1. | Portfolio composition is subject to change and is calculated based on the total investments of the Fund. |
| 2. | Effective maturity distribution is subject to change and is calculated based on the total investments of the Fund. |
| 3. | Weighted Average Maturity (WAM): WAM is an average of the effective maturities of all securities held in the portfolio, weighted by each security’s percentage of total investments. The maturity of a portfolio security is the period remaining until the date on which the principal amount is unconditionally required to be paid, or in the case of a security called for redemption, the date on which the redemption payment is unconditionally required to be made. WAM calculations allow for the maturities of certain securities with demand features or periodic interest rate resets to be shortened. WAM is a way to measure a fund’s sensitivity to potential interest rate changes. |
| 4. | Weighted Average Final Maturity (WAFM): WAFM is an average of the final maturities of all securities held in the portfolio, weighted by their percentage of total investments. The maturity of a portfolio security is the period remaining until the date on which the principal amount is unconditionally required to be paid, or in the case of a security called for redemption, the date on which the redemption payment is unconditionally required to be made. In contrast to WAM, the calculation of WAFM allows for the maturities of certain securities with demand features to be shortened, but not the periodic interest rate resets. WAFM is a way to measure a fund’s potential sensitivity to credit spread changes. |
| | | | | | |
| Performance Highlights (Unaudited) | | Wells Fargo Advantage Government Money Market Fund | | | 5 | |
AVERAGE ANNUAL TOTAL RETURN5 (%) (AS OF JULY 31, 2012)
| | | | | | | | | | | | | | | | | | | | | | | | | | | | |
| | | | | | | | | Expense Ratios6 | |
| | | Inception Date | | | 6 Months* | | | 1 Year | | | 5 Year | | | 10 Year | | | Gross | | | Net7 | |
Class A (WFGXX) | | | 11/08/1999 | | | | 0.00 | | | | 0.01 | | | | 0.72 | | | | 1.51 | | | | 0.61% | | | | 0.61% | |
Administrator Class (WGAXX) | | | 07/31/2003 | | | | 0.00 | | | | 0.01 | | | | 0.81 | | | | 1.70 | | | | 0.34% | | | | 0.34% | |
Institutional Class (GVIXX) | | | 07/28/2003 | | | | 0.01 | | | | 0.01 | | | | 0.87 | | | | 1.79 | | | | 0.22% | | | | 0.20% | |
Service Class (NWGXX) | | | 11/16/1987 | | | | 0.00 | | | | 0.01 | | | | 0.76 | | | | 1.61 | | | | 0.51% | | | | 0.50% | |
Sweep Class | | | 06/30/2010 | | | | 0.00 | | | | 0.01 | | | | 0.76 | | | | 1.61 | | | | 0.96% | | | | 0.96% | |
| * | Returns for periods of less than one year are not annualized. |
FUND YIELD SUMMARY7 (AS OF JULY 31, 2012)
| | | | | | | | | | | | | | | | | | | | |
| | | Class A | | | Administrator
Class | | | Institutional
Class | | | Service Class | | | Sweep Class | |
7-Day Current Yield | | | 0.01% | | | | 0.01% | | | | 0.01% | | | | 0.01% | | | | 0.01% | |
7-Day Compound Yield | | | 0.01% | | | | 0.01% | | | | 0.01% | | | | 0.01% | | | | 0.01% | |
30-Day Simple Yield | | | 0.01% | | | | 0.01% | | | | 0.01% | | | | 0.01% | | | | 0.01% | |
30-Day Compound Yield | | | 0.01% | | | | 0.01% | | | | 0.01% | | | | 0.01% | | | | 0.01% | |
Figures quoted represent past performance, which is no guarantee of future results and do not reflect the deduction of taxes that a shareholder may pay on fund distributions or the redemption of fund shares. Investment returns will fluctuate. The Fund’s yield figures more closely reflect the current earnings of the Fund than the total return figures. Current performance may be lower or higher than the performance data quoted and assumes the reinvestment of dividends and capital gains. Current month-end performance is available at the Fund’s Web site – wellsfargoadvantagefunds.com.
Each class is sold without a front-end sales charge or contingent deferred sales charge. Other fees and expenses apply to an investment in the Fund and are described in the Fund’s current prospectuses.
An investment in a money market fund is not insured or guaranteed by the Federal Deposit Insurance Corporation or any other government agency. Although the Fund seeks to preserve the value of your investment at $1.00 per share, it is possible to lose money by investing in a money market fund. The U.S. Government guarantee applies to certain of the underlying securities held by the Fund and not to shares of the Fund itself.
| 5. | Historical performance shown for the Administrator Class and Institutional Class shares prior to their inception reflects the performance of the Service Class shares, and includes the higher expenses applicable to the Service Class shares. If these expenses had not been included, returns would be higher. Historical performance shown for the Sweep Class shares prior to their inception reflects the performance of the Service Class shares, and has not been adjusted to reflect the higher expenses applicable to the Sweep Class shares. If these expenses had been adjusted, returns would be lower. |
| 6. | Reflects the expense ratios as stated in the most recent prospectuses. |
| 7. | The Adviser has committed through July 11, 2013 to waive fees and/or reimburse expenses to the extent necessary to cap the Fund’s Total Annual Fund Operating Expenses After Fee Waiver, excluding certain expenses, at 0.65% for Class A, 0.35% for Administrator Class, 0.20% for Institutional Class, 0.50% for Service Class and 1.00% for Sweep Class . Brokerage commissions, stamp duty fees, interest, taxes, acquired fund fees and expenses and extraordinary expenses are excluded from the cap. Without this cap, the Fund’s returns would have been lower. Without waived fees and/or reimbursed expenses, the Fund’s 7-day current yield would have been (0.43)%, (0.16)%, (0.04)%, (0.33)% and (0.78)% for Class A, Administrator Class, Institutional Class, Service Class and Sweep Class, respectively. |
| | | | |
| 6 | | Wells Fargo Advantage Government Money Market Fund | | Fund Expenses (Unaudited) |
As a shareholder of the Fund, you incur ongoing costs, including management fees, distribution (12b-1) and/or shareholder service fees, and other Fund expenses. This example is intended to help you understand your ongoing costs (in dollars) of investing in the Fund and to compare these costs with the ongoing costs of investing in other mutual funds.
The example is based on an investment of $1,000 invested at the beginning of the six-month period and held for the entire period from February 1, 2012 to July 31, 2012.
Actual Expenses
The “Actual” line of the table below provides information about actual account values and actual expenses. You may use the information in this line, together with the amount you invested, to estimate the expenses that you paid over the period. Simply divide your account value by $1,000 (for example, an $8,600 account value divided by $1,000 = 8.6), then multiply the result by the number in the “Actual” line under the heading entitled “Expenses Paid During Period” for your applicable class of shares to estimate the expenses you paid on your account during this period.
Hypothetical Example for Comparison Purposes
The “Hypothetical” line of the table below provides information about hypothetical account values and hypothetical expenses based on the Fund’s actual expense ratio and an assumed rate of return of 5% per year before expenses, which is not the Fund’s actual return. The hypothetical account values and expenses may not be used to estimate the actual ending account balance or expenses you paid for the period. You may use this information to compare the ongoing costs of investing in the Fund and other funds. To do so, compare this 5% hypothetical example with the 5% hypothetical examples that appear in the shareholder reports of the other funds.
Please note that the expenses shown in the table are meant to highlight your ongoing costs only. Therefore, the “Hypothetical” line of the table is useful in comparing ongoing costs only, and will not help you determine the relative total costs of owning different funds.
| | | | | | | | | | | | | | | | |
| | | Beginning
Account Value
02-01-2012 | | | Ending
Account Value
07-31-2012 | | | Expenses
Paid During
the Period1 | | | Net Annual
Expense Ratio | |
Class A | | | | | | | | | | | | | | | | |
Actual | | $ | 1,000.00 | | | $ | 1,000.05 | | | $ | 0.80 | | | | 0.16 | % |
Hypothetical (5% return before expenses) | | $ | 1,000.00 | | | $ | 1,024.07 | | | $ | 0.81 | | | | 0.16 | % |
Administrator Class | | | | | | | | | | | | | | | | |
Actual | | $ | 1,000.00 | | | $ | 1,000.05 | | | $ | 0.80 | | | | 0.16 | % |
Hypothetical (5% return before expenses) | | $ | 1,000.00 | | | $ | 1,024.07 | | | $ | 0.81 | | | | 0.16 | % |
Institutional Class | | | | | | | | | | | | | | | | |
Actual | | $ | 1,000.00 | | | $ | 1,000.05 | | | $ | 0.80 | | | | 0.16 | % |
Hypothetical (5% return before expenses) | | $ | 1,000.00 | | | $ | 1,024.07 | | | $ | 0.81 | | | | 0.16 | % |
Service Class | | | | | | | | | | | | | | | | |
Actual | | $ | 1,000.00 | | | $ | 1,000.05 | | | $ | 0.80 | | | | 0.16 | % |
Hypothetical (5% return before expenses) | | $ | 1,000.00 | | | $ | 1,024.07 | | | $ | 0.81 | | | | 0.16 | % |
Sweep Class | | | | | | | | | | | | | | | | |
Actual | | $ | 1,000.00 | | | $ | 1,000.05 | | | $ | 0.80 | | | | 0.16 | % |
Hypothetical (5% return before expenses) | | $ | 1,000.00 | | | $ | 1,024.07 | | | $ | 0.81 | | | | 0.16 | % |
| 1. | Expenses paid is equal to the annualized expense ratio of each class multiplied by the average account value over the period, multiplied by the number of days in the most recent fiscal half-year divided by the number of days in the fiscal year (to reflect the one-half year period). |
| | | | | | |
| Portfolio of Investments—July 31, 2012 (Unaudited) | | Wells Fargo Advantage Government Money Market Fund | | | 7 | |
| | | | | | | | | | | | | | | | |
| Security Name | | Interest Rate | | | Maturity Date | | | Principal | | | Value | |
| | | | | | | | | | | | | | | | |
| | | | |
Commercial Paper : 4.89% | | | | | | | | | | | | | | | | |
| | | | |
| Asset-Backed Commercial Paper : 4.89% | | | | | | | | | | | | | | | | |
Straight-A Funding LLC 144A (z) | | | 0.18 | % | | | 09/13/2012 | | | $ | 107,982,000 | | | $ | 107,958,784 | |
Straight-A Funding LLC 144A (z) | | | 0.18 | | | | 08/01/2012 | | | | 44,110,000 | | | | 44,110,000 | |
Straight-A Funding LLC 144A (z) | | | 0.18 | | | | 08/02/2012 | | | | 66,000,000 | | | | 65,999,670 | |
Straight-A Funding LLC 144A (z) | | | 0.18 | | | | 08/06/2012 | | | | 46,000,000 | | | | 45,998,850 | |
Straight-A Funding LLC 144A (z) | | | 0.18 | | | | 08/07/2012 | | | | 9,400,000 | | | | 9,399,718 | |
Straight-A Funding LLC 144A (z) | | | 0.18 | | | | 08/09/2012 | | | | 29,000,000 | | | | 28,998,840 | |
Straight-A Funding LLC 144A (z) | | | 0.18 | | | | 08/14/2012 | | | | 17,000,000 | | | | 16,998,895 | |
Straight-A Funding LLC 144A (z) | | | 0.18 | | | | 09/05/2012 | | | | 18,171,000 | | | | 18,167,820 | |
Straight-A Funding LLC 144A (z) | | | 0.18 | | | | 09/24/2012 | | | | 123,000,000 | | | | 122,966,790 | |
Straight-A Funding LLC 144A (z) | | | 0.18 | | | | 09/25/2012 | | | | 30,000,000 | | | | 29,991,750 | |
Straight-A Funding LLC 144A (z) | | | 0.18 | | | | 09/25/2012 | | | | 90,000,000 | | | | 89,975,250 | |
Straight-A Funding LLC 144A (z) | | | 0.18 | | | | 10/01/2012 | | | | 32,000,000 | | | | 31,990,240 | |
Straight-A Funding LLC 144A (z) | | | 0.18 | | | | 10/02/2012 | | | | 79,379,000 | | | | 79,354,393 | |
Straight-A Funding LLC 144A (z) | | | 0.18 | | | | 10/03/2012 | | | | 2,000,000 | | | | 1,999,370 | |
Straight-A Funding LLC 144A (z) | | | 0.18 | | | | 10/03/2012 | | | | 110,000,000 | | | | 109,965,350 | |
Straight-A Funding LLC 144A (z) | | | 0.18 | | | | 10/04/2012 | | | | 78,089,000 | | | | 78,064,012 | |
Straight-A Funding LLC 144A (z) | | | 0.18 | | | | 10/05/2012 | | | | 28,000,000 | | | | 27,990,900 | |
Straight-A Funding LLC 144A (z) | | | 0.18 | | | | 10/05/2012 | | | | 15,000,000 | | | | 14,995,125 | |
Straight-A Funding LLC 144A (z) | | | 0.18 | | | | 10/09/2012 | | | | 53,031,000 | | | | 53,012,704 | |
Straight-A Funding LLC 144A (z) | | | 0.18 | | | | 10/10/2012 | | | | 10,000,000 | | | | 9,996,500 | |
Straight-A Funding LLC 144A (z) | | | 0.18 | | | | 10/11/2012 | | | | 50,068,000 | | | | 50,050,226 | |
Straight-A Funding LLC 144A (z) | | | 0.18 | | | | 10/12/2012 | | | | 40,160,000 | | | | 40,145,542 | |
Straight-A Funding LLC 144A (z) | | | 0.18 | | | | 10/12/2012 | | | | 25,080,000 | | | | 25,070,971 | |
Straight-A Funding LLC 144A (z) | | | 0.18 | | | | 10/15/2012 | | | | 68,000,000 | | | | 67,974,500 | |
Straight-A Funding LLC 144A (z) | | | 0.18 | | | | 10/18/2012 | | | | 55,000,000 | | | | 54,978,550 | |
Straight-A Funding LLC 144A (z) | | | 0.18 | | | | 10/22/2012 | | | | 75,397,000 | | | | 75,366,087 | |
Straight-A Funding LLC 144A (z) | | | 0.18 | | | | 10/26/2012 | | | | 103,535,000 | | | | 103,490,480 | |
| | | | |
Total Commercial Paper (Cost $1,405,011,317) | | | | | | | | | | | | | | | 1,405,011,317 | |
| | | | | | | | | | | | | | | | |
| | | | |
| Government Agency Debt : 39.35% | | | | | | | | | | | | | | | | |
FFCB (z) | | | 0.08 | | | | 09/11/2012 | | | | 100,000,000 | | | | 99,990,889 | |
FFCB (z) | | | 0.09 | | | | 08/27/2012 | | | | 15,000,000 | | | | 14,999,025 | |
FFCB ± | | | 0.13 | | | | 03/20/2013 | | | | 50,000,000 | | | | 49,992,231 | |
FFCB (z) | | | 0.14 | | | | 09/14/2012 | | | | 75,000,000 | | | | 74,987,167 | |
FFCB ± | | | 0.16 | | | | 09/13/2013 | | | | 147,670,000 | | | | 147,629,903 | |
FFCB ± | | | 0.16 | | | | 06/27/2013 | | | | 50,000,000 | | | | 49,995,384 | |
FFCB ± | | | 0.17 | | | | 03/21/2013 | | | | 165,000,000 | | | | 165,000,000 | |
FFCB | | | 0.18 | | | | 12/05/2012 | | | | 17,700,000 | | | | 17,699,448 | |
FFCB ± | | | 0.19 | | | | 08/28/2013 | | | | 100,000,000 | | | | 99,979,162 | |
FFCB ± | | | 0.20 | | | | 01/06/2014 | | | | 35,000,000 | | | | 34,993,697 | |
FFCB ± | | | 0.21 | | | | 03/06/2013 | | | | 125,000,000 | | | | 124,977,416 | |
FFCB ± | | | 0.21 | | | | 09/24/2012 | | | | 125,000,000 | | | | 124,998,120 | |
FFCB ± | | | 0.22 | | | | 04/02/2014 | | | | 150,000,000 | | | | 149,987,336 | |
FFCB ± | | | 0.22 | | | | 11/06/2012 | | | | 150,000,000 | | | | 149,995,976 | |
FFCB ± | | | 0.23 | | | | 10/28/2013 | | | | 15,000,000 | | | | 15,006,816 | |
FFCB ± | | | 0.24 | | | | 12/23/2013 | | | | 41,715,000 | | | | 41,736,326 | |
FFCB | | | 0.24 | | | | 11/23/2012 | | | | 15,215,000 | | | | 15,217,887 | |
FFCB ± | | | 0.25 | | | | 09/28/2012 | | | | 90,000,000 | | | | 90,005,113 | |
The accompanying notes are an integral part of these financial statements.
| | | | |
| 8 | | Wells Fargo Advantage Government Money Market Fund | | Portfolio of Investments—July 31, 2012 (Unaudited) |
| | | | | | | | | | | | | | | | |
| Security Name | | Interest Rate | | | Maturity Date | | | Principal | | | Value | |
| | | | | | | | | | | | | | | | |
| | | | |
| Government Agency Debt (continued) | | | | | | | | | | | | | | | | |
FFCB | | | 0.25 | % | | | 11/23/2012 | | | $ | 100,000,000 | | | $ | 100,029,622 | |
FFCB ± | | | 0.27 | | | | 11/05/2012 | | | | 52,550,000 | | | | 52,557,042 | |
FFCB ± | | | 0.27 | | | | 08/22/2013 | | | | 33,235,000 | | | | 33,257,213 | |
FFCB ± | | | 0.27 | | | | 02/24/2014 | | | | 142,000,000 | | | | 142,114,081 | |
FFCB ± | | | 0.28 | | | | 09/20/2012 | | | | 26,712,000 | | | | 26,714,419 | |
FFCB ± | | | 0.28 | | | | 10/15/2013 | | | | 35,000,000 | | | | 34,965,870 | |
FFCB ± | | | 0.37 | | | | 04/15/2013 | | | | 25,000,000 | | | | 24,994,829 | |
FFCB | | | 1.88 | | | | 12/07/2012 | | | | 66,193,000 | | | | 66,580,721 | |
FHLB (z) | | | 0.10 | | | | 08/22/2012 | | | | 32,080,000 | | | | 32,078,222 | |
FHLB (z) | | | 0.10 | | | | 08/31/2012 | | | | 25,000,000 | | | | 24,997,917 | |
FHLB (z) | | | 0.12 | | | | 08/08/2012 | | | | 200,000,000 | | | | 199,995,295 | |
FHLB (z) | | | 0.13 | | | | 08/03/2012 | | | | 150,000,000 | | | | 149,998,958 | |
FHLB (z) | | | 0.14 | | | | 08/17/2012 | | | | 50,000,000 | | | | 49,997,000 | |
FHLB (z) | | | 0.14 | | | | 08/15/2012 | | | | 59,000,000 | | | | 58,996,903 | |
FHLB (z) | | | 0.14 | | | | 08/23/2012 | | | | 22,000,000 | | | | 21,998,185 | |
FHLB (z) | | | 0.14 | | | | 08/10/2012 | | | | 80,000,000 | | | | 79,997,200 | |
FHLB (z) | | | 0.14 | | | | 09/05/2012 | | | | 78,000,000 | | | | 77,989,383 | |
FHLB (z) | | | 0.14 | | | | 10/17/2012 | | | | 90,000,000 | | | | 89,972,569 | |
FHLB | | | 0.15 | | | | 10/23/2012 | | | | 50,000,000 | | | | 49,998,565 | |
FHLB | | | 0.15 | | | | 11/26/2012 | | | | 100,000,000 | | | | 99,991,016 | |
FHLB | | | 0.16 | | | | 10/30/2012 | | | | 135,000,000 | | | | 134,997,942 | |
FHLB | | | 0.16 | | | | 11/13/2012 | | | | 100,000,000 | | | | 99,996,086 | |
FHLB (z) | | | 0.16 | | | | 09/19/2012 | | | | 33,600,000 | | | | 33,592,683 | |
FHLB (z) | | | 0.16 | | | | 10/10/2012 | | | | 56,000,000 | | | | 55,982,578 | |
FHLB (z) | | | 0.17 | | | | 08/29/2012 | | | | 50,000,000 | | | | 49,993,583 | |
FHLB | | | 0.17 | | | | 01/10/2013 | | | | 150,000,000 | | | | 149,980,190 | |
FHLB (z) | | | 0.17 | | | | 10/19/2012 | | | | 70,000,000 | | | | 69,973,886 | |
FHLB (z) | | | 0.17 | | | | 10/26/2012 | | | | 21,000,000 | | | | 20,991,472 | |
FHLB | | | 0.18 | | | | 08/22/2012 | | | | 150,000,000 | | | | 150,003,226 | |
FHLB | | | 0.18 | | | | 08/30/2012 | | | | 200,000,000 | | | | 200,008,416 | |
FHLB ± | | | 0.20 | | | | 10/25/2012 | | | | 117,500,000 | | | | 117,494,373 | |
FHLB | | | 0.20 | | | | 10/05/2012 | | | | 75,000,000 | | | | 75,004,893 | |
FHLB | | | 0.20 | | | | 11/14/2012 | | | | 75,000,000 | | | | 75,005,567 | |
FHLB | | | 0.20 | | | | 11/15/2012 | | | | 23,500,000 | | | | 23,501,754 | |
FHLB | | | 0.22 | | | | 09/12/2012 | | | | 25,000,000 | | | | 25,002,487 | |
FHLB ± | | | 0.27 | | | | 01/23/2014 | | | | 200,000,000 | | | | 199,936,852 | |
FHLB ± | | | 0.28 | | | | 06/20/2014 | | | | 96,750,000 | | | | 96,682,605 | |
FHLB ± | | | 0.29 | | | | 06/12/2014 | | | | 150,000,000 | | | | 150,000,000 | |
FHLB | | | 0.30 | | | | 08/23/2012 | | | | 13,715,000 | | | | 13,716,122 | |
FHLB ± | | | 0.30 | | | | 02/05/2013 | | | | 190,000,000 | | | | 189,960,506 | |
FHLB ± | | | 0.31 | | | | 03/07/2013 | | | | 69,000,000 | | | | 68,987,479 | |
FHLB ± | | | 0.32 | | | | 03/28/2013 | | | | 306,000,000 | | | | 305,958,075 | |
FHLB ± | | | 0.32 | | | | 06/14/2013 | | | | 150,000,000 | | | | 150,000,000 | |
FHLB ± | | | 0.33 | | | | 05/02/2013 | | | | 100,000,000 | | | | 99,984,364 | |
FHLB ± | | | 0.34 | | | | 02/25/2013 | | | | 43,200,000 | | | | 43,209,936 | |
FHLB ± | | | 0.34 | | | | 04/01/2013 | | | | 67,000,000 | | | | 67,000,000 | |
FHLB ± | | | 0.34 | | | | 04/12/2013 | | | | 25,000,000 | | | | 25,000,000 | |
FHLB ± | | | 0.34 | | | | 05/17/2013 | | | | 100,000,000 | | | | 100,000,000 | |
FHLB ± | | | 0.35 | | | | 03/12/2013 | | | | 75,000,000 | | | | 75,004,644 | |
FHLB ± | | | 0.36 | | | | 05/17/2013 | | | | 28,000,000 | | | | 28,000,000 | |
The accompanying notes are an integral part of these financial statements.
| | | | | | |
| Portfolio of Investments—July 31, 2012 (Unaudited) | | Wells Fargo Advantage Government Money Market Fund | | | 9 | |
| | | | | | | | | | | | | | | | |
| Security Name | | Interest Rate | | | Maturity Date | | | Principal | | | Value | |
| | | | | | | | | | | | | | | | |
| | | | |
| Government Agency Debt (continued) | | | | | | | | | | | | | | | | |
FHLB | | | 0.88 | % | | | 08/22/2012 | | | $ | 22,500,000 | | | $ | 22,509,239 | |
FHLB | | | 1.63 | | | | 09/26/2012 | | | | 41,160,000 | | | | 41,251,835 | |
FHLB | | | 1.63 | | | | 11/21/2012 | | | | 34,770,000 | | | | 34,923,233 | |
FHLB | | | 2.00 | | | | 09/14/2012 | | | | 15,000,000 | | | | 15,033,116 | |
FHLB | | | 4.63 | | | | 10/10/2012 | | | | 214,835,000 | | | | 216,659,092 | |
FHLMC (z) | | | 0.10 | | | | 09/04/2012 | | | | 35,000,000 | | | | 34,996,529 | |
FHLMC (z) | | | 0.11 | | | | 09/10/2012 | | | | 75,000,000 | | | | 74,990,833 | |
FHLMC (z) | | | 0.12 | | | | 08/13/2012 | | | | 99,050,000 | | | | 99,046,038 | |
FHLMC (z) | | | 0.12 | | | | 08/08/2012 | | | | 10,000,000 | | | | 9,999,767 | |
FHLMC (z) | | | 0.13 | | | | 08/06/2012 | | | | 152,344,000 | | | | 152,341,280 | |
FHLMC (z) | | | 0.13 | | | | 08/01/2012 | | | | 50,000,000 | | | | 50,000,000 | |
FHLMC (z) | | | 0.13 | | | | 11/08/2012 | | | | 100,000,000 | | | | 99,964,250 | |
FHLMC (z) | | | 0.14 | | | | 10/09/2012 | | | | 49,000,000 | | | | 48,986,617 | |
FHLMC (z) | | | 0.14 | | | | 10/16/2012 | | | | 80,000,000 | | | | 79,976,356 | |
FHLMC (z) | | | 0.14 | | | | 10/05/2012 | | | | 91,000,000 | | | | 90,976,998 | |
FHLMC (z) | | | 0.14 | | | | 11/20/2012 | | | | 50,000,000 | | | | 49,978,417 | |
FHLMC (z) | | | 0.15 | | | | 12/17/2012 | | | | 10,000,000 | | | | 9,994,250 | |
FHLMC (z) | | | 0.15 | | | | 08/20/2012 | | | | 18,716,000 | | | | 18,714,518 | |
FHLMC (z) | | | 0.15 | | | | 11/01/2012 | | | | 100,000,000 | | | | 99,961,027 | |
FHLMC (z) | | | 0.15 | | | | 10/15/2012 | | | | 163,250,000 | | | | 163,197,340 | |
FHLMC (z) | | | 0.16 | | | | 08/27/2012 | | | | 100,000,000 | | | | 99,988,806 | |
FHLMC (z) | | | 0.16 | | | | 10/22/2012 | | | | 100,000,000 | | | | 99,964,694 | |
FHLMC (z) | | | 0.16 | | | | 10/29/2012 | | | | 100,000,000 | | | | 99,961,681 | |
FHLMC (z) | | | 0.16 | | | | 10/09/2012 | | | | 129,659,000 | | | | 129,619,238 | |
FHLMC (z) | | | 0.16 | | | | 11/13/2012 | | | | 50,000,000 | | | | 49,976,889 | |
FHLMC (z) | | | 0.17 | | | | 01/22/2013 | | | | 74,000,000 | | | | 73,940,985 | |
FHLMC (z) | | | 0.17 | | | | 09/17/2012 | | | | 150,000,000 | | | | 149,967,034 | |
FHLMC ± | | | 0.19 | | | | 11/02/2012 | | | | 250,000,000 | | | | 249,980,670 | |
FHLMC ± | | | 0.19 | | | | 09/13/2013 | | | | 150,000,000 | | | | 149,984,655 | |
FHLMC ± | | | 0.20 | | | | 08/10/2012 | | | | 120,000,000 | | | | 120,000,010 | |
FHLMC | | | 0.52 | | | | 11/26/2012 | | | | 150,000,000 | | | | 150,162,730 | |
FHLMC | | | 1.00 | | | | 08/28/2012 | | | | 167,915,000 | | | | 168,021,662 | |
FHLMC | | | 1.10 | | | | 12/27/2012 | | | | 100,000,000 | | | | 100,368,458 | |
FHLMC | | | 2.13 | | | | 09/21/2012 | | | | 190,000,000 | | | | 190,517,226 | |
FHLMC | | | 4.50 | | | | 01/15/2013 | | | | 273,716,000 | | | | 279,052,528 | |
FHLMC | | | 9.58 | | | | 08/31/2012 | | | | 31,858,000 | | | | 32,105,298 | |
FNMA (z) | | | 0.10 | | | | 08/20/2012 | | | | 75,000,000 | | | | 74,996,042 | |
FNMA (z) | | | 0.10 | | | | 08/29/2012 | | | | 35,200,000 | | | | 35,197,262 | |
FNMA (z) | | | 0.11 | | | | 09/05/2012 | | | | 87,000,000 | | | | 86,991,119 | |
FNMA (z) | | | 0.12 | | | | 08/31/2012 | | | | 50,000,000 | | | | 49,995,000 | |
FNMA (z) | | | 0.15 | | | | 10/17/2012 | | | | 46,300,000 | | | | 46,285,641 | |
FNMA (z) | | | 0.15 | | | | 11/28/2012 | | | | 85,000,000 | | | | 84,959,259 | |
FNMA (z) | | | 0.15 | | | | 11/13/2012 | | | | 50,000,000 | | | | 49,978,333 | |
FNMA (z) | | | 0.16 | | | | 08/15/2012 | | | | 75,000,000 | | | | 74,995,479 | |
FNMA (z) | | | 0.16 | | | | 09/19/2012 | | | | 69,445,000 | | | | 69,431,918 | |
FNMA (z) | | | 0.16 | | | | 10/10/2012 | | | | 60,000,000 | | | | 59,981,333 | |
FNMA (z) | | | 0.16 | | | | 01/23/2013 | | | | 46,843,000 | | | | 46,806,566 | |
FNMA (z) | | | 0.17 | | | | 09/12/2012 | | | | 13,676,000 | | | | 13,673,367 | |
FNMA (z) | | | 0.17 | | | | 12/05/2012 | | | | 50,000,000 | | | | 49,970,250 | |
FNMA (z) | | | 0.17 | | | | 11/14/2012 | | | | 50,000,000 | | | | 49,975,208 | |
The accompanying notes are an integral part of these financial statements.
| | | | |
| 10 | | Wells Fargo Advantage Government Money Market Fund | | Portfolio of Investments—July 31, 2012 (Unaudited) |
| | | | | | | | | | | | | | | | |
| Security Name | | Interest Rate | | | Maturity Date | | | Principal | | | Value | |
| | | | | | | | | | | | | | | | |
| | | | |
| Government Agency Debt (continued) | | | | | | | | | | | | | | | | |
FNMA ± | | | 0.23 | % | | | 06/20/2014 | | | $ | 300,000,000 | | | $ | 299,885,618 | |
FNMA ± | | | 0.27 | | | | 11/23/2012 | | | | 88,900,000 | | | | 88,913,988 | |
FNMA ± | | | 0.28 | | | | 09/17/2012 | | | | 193,345,000 | | | | 193,376,093 | |
FNMA ± | | | 0.28 | | | | 10/18/2012 | | | | 103,645,000 | | | | 103,659,658 | |
FNMA | | | 0.50 | | | | 10/30/2012 | | | | 148,186,000 | | | | 148,307,322 | |
FNMA | | | 0.63 | | | | 09/24/2012 | | | | 150,000,000 | | | | 150,104,708 | |
FNMA | | | 1.00 | | | | 12/27/2012 | | | | 12,500,000 | | | | 12,541,075 | |
FNMA | | | 1.75 | | | | 08/10/2012 | | | | 135,071,000 | | | | 135,124,123 | |
FNMA (z) | | | 0.11 | | | | 09/18/2012 | | | | 50,000,000 | | | | 49,992,668 | |
| | | |
Total Government Agency Debt (Cost $11,311,641,954) | | | | | | | | | | | | 11,311,641,954 | |
| | | | | | | | | | | | | | | | |
| | | | |
Other Notes : 3.35% | | | | | | | | | | | | | | | | |
| | | | |
| Corporate Bonds and Notes : 3.35% | | | | | | | | | | | | | | | | |
Citibank NA ± | | | 0.47 | | | | 11/15/2012 | | | | 62,000,000 | | | | 62,045,793 | |
Citibank NA | | | 1.75 | | | | 12/28/2012 | | | | 57,710,000 | | | | 58,076,238 | |
Citigroup Funding Incorporated | | | 1.88 | | | | 10/22/2012 | | | | 178,226,000 | | | | 178,904,584 | |
Citigroup Funding Incorporated | | | 2.25 | | | | 12/10/2012 | | | | 85,850,000 | | | | 86,480,322 | |
General Electric Capital Corporation | | | 2.13 | | | | 12/21/2012 | | | | 112,918,000 | | | | 113,759,529 | |
General Electric Capital Corporation | | | 2.63 | | | | 12/28/2012 | | | | 49,292,000 | | | | 49,780,777 | |
JPMorgan Chase & Company ± | | | 0.71 | | | | 12/26/2012 | | | | 62,000,000 | | | | 62,083,492 | |
JPMorgan Chase & Company | | | 2.13 | | | | 12/26/2012 | | | | 17,130,000 | | | | 17,263,682 | |
National Credit Union Administration Guaranteed Notes ± | | | 0.27 | | | | 06/12/2013 | | | | 98,673,000 | | | | 98,690,586 | |
US Central Federal Credit Union | | | 1.90 | | | | 10/19/2012 | | | | 236,714,000 | | | | 237,583,591 | |
| | | | |
Total Other Notes (Cost $964,668,594) | | | | | | | | | | | | | | | 964,668,594 | |
| | | | | | | | | | | | | | | | |
| | | | |
| Repurchase Agreements ^^: 49.24% | | | | | | | | | | | | | | | | |
Bank of America Corporation, dated 07/31/2012, maturity value $1,000,005,000 (1) | | | 0.18 | | | | 08/01/2012 | | | | 1,000,000,000 | | | | 1,000,000,000 | |
Bank of Nova Scotia, dated 07/31/2012, maturity value $28,025,125 (2) | | | 0.16 | | | | 08/01/2012 | | | | 28,025,000 | | | | 28,025,000 | |
Bank of Nova Scotia, dated 07/31/2012, maturity value $900,004,750 (3) | | | 0.19 | | | | 08/01/2012 | | | | 900,000,000 | | | | 900,000,000 | |
BNP Paribas Securities, dated 07/31/2012, maturity value $350,001,750 (4) | | | 0.18 | | | | 08/01/2012 | | | | 350,000,000 | | | | 350,000,000 | |
Citibank NA, dated 07/31/2012, maturity value $500,002,500 (5) | | | 0.18 | | | | 08/01/2012 | | | | 500,000,000 | | | | 500,000,000 | |
Citigroup Global Markets, dated 07/31/2012, maturity value $1,350,006,750 (6) | | | 0.18 | | | | 08/01/2012 | | | | 1,350,000,000 | | | | 1,350,000,000 | |
Credit Suisse First Boston Corporation, dated 07/31/2012, maturity value $250,009,722 (7) | | | 0.20 | | | | 08/01/2012 | | | | 250,000,000 | | | | 250,000,000 | |
Credit Suisse Securities, dated 07/31/2012, maturity value $250,009,236 (8) | | | 0.19 | | | | 08/07/2012 | | | | 250,000,000 | | | | 250,000,000 | |
Credit Suisse Securities, dated 07/31/2012, maturity value $25,000,125 (9) | | | 0.18 | | | | 08/01/2012 | | | | 25,000,000 | | | | 25,000,000 | |
Credit Suisse Securities, dated 07/27/2012, maturity value $250,008,750 (10) | | | 0.18 | | | | 08/03/2012 | | | | 250,000,000 | | | | 250,000,000 | |
Deutsche Bank Securities, dated 07/31/2012, maturity value $150,000,708 (11) | | | 0.17 | | | | 08/01/2012 | | | | 150,000,000 | | | | 150,000,000 | |
Deutsche Bank Securities, dated 07/26/2012, maturity value $250,008,264 (12) | | | 0.17 | | | | 08/02/2012 | | | | 250,000,000 | | | | 250,000,000 | |
Deutsche Bank Securities, dated 07/31/2012, maturity value $786,104,149 (13) | | | 0.19 | | | | 08/01/2012 | | | | 786,100,000 | | | | 786,100,000 | |
Goldman Sachs & Company, dated 07/31/2012, maturity value $100,000,278 (14) | | | 0.10 | | | | 08/01/2012 | | | | 100,000,000 | | | | 100,000,000 | |
Goldman Sachs & Company, dated 07/30/2012, maturity value $250,008,750 (15) | | | 0.18 | | | | 08/06/2012 | | | | 250,000,000 | | | | 250,000,000 | |
Goldman Sachs & Company, dated 07/31/2012, maturity value $450,002,250 (16) | | | 0.18 | | | | 08/01/2012 | | | | 450,000,000 | | | | 450,000,000 | |
The accompanying notes are an integral part of these financial statements.
| | | | | | |
| Portfolio of Investments—July 31, 2012 (Unaudited) | | Wells Fargo Advantage Government Money Market Fund | | | 11 | |
| | | | | | | | | | | | | | | | |
| Security Name | | Interest Rate | | | Maturity Date | | | Principal | | | Value | |
| | | | | | | | | | | | | | | | |
| | | | |
| Repurchase Agreements ^^ (continued) | | | | | | | | | | | | | | | | |
JPMorgan Securities, dated 07/31/2012, maturity value $500,002,639 (17) | | | 0.19 | % | | | 08/01/2012 | | | $ | 500,000,000 | | | $ | 500,000,000 | |
Merrill Pierce Fenner Smith Incorporated, dated 07/31/2012, maturity value $125,000,556 (18) | | | 0.16 | | | | 08/01/2012 | | | | 125,000,000 | | | | 125,000,000 | |
Merrill Pierce Fenner Smith Incorporated, dated 07/31/2012, maturity value $300,001,583 (19) | | | 0.19 | | | | 08/01/2012 | | | | 300,000,000 | | | | 300,000,000 | |
Merrill Pierce Fenner Smith Incorporated, dated 07/31/2012, maturity value $475,002,375 (20) | | | 0.18 | | | | 08/01/2012 | | | | 475,000,000 | | | | 475,000,000 | |
Morgan Stanley & Company, dated 07/31/2012, maturity value $100,000,528 (21) | | | 0.19 | | | | 08/01/2012 | | | | 100,000,000 | | | | 100,000,000 | |
Morgan Stanley & Company, dated 07/31/2012, maturity value $150,000,708 (22) | | | 0.17 | | | | 08/01/2012 | | | | 150,000,000 | | | | 150,000,000 | |
RBC Capital Markets, dated 07/31/2012, maturity value $1,200,006,333 (23) | | | 0.19 | | | | 08/01/2012 | | | | 1,200,000,000 | | | | 1,200,000,000 | |
Societe Generale New York, dated 07/31/2012, maturity value $2,870,015,147 (24) | | | 0.19 | | | | 08/01/2012 | | | | 2,870,000,000 | | | | 2,870,000,000 | |
Societe Generale New York, dated 07/31/2012, maturity value $500,002,639 (25) | | | 0.19 | | | | 08/01/2012 | | | | 500,000,000 | | | | 500,000,000 | |
UBS Securities LLC, dated 07/31/2012, maturity value $1,045,005,515 (26) | | | 0.19 | | | | 08/01/2012 | | | | 1,045,000,000 | | | | 1,045,000,000 | |
| | | | |
Total Repurchase Agreements (Cost $14,154,125,000) | | | | | | | | | | | | | | | 14,154,125,000 | |
| | | | | | | | | | | | | | | | |
| | | | |
| Treasury Debt : 3.34% | | | | | | | | | | | | | | | | |
U.S. Treasury Note | | | 0.38 | | | | 08/31/2012 | | | | 100,000,000 | | | | 100,021,383 | |
U.S. Treasury Note | | | 0.38 | | | | 09/30/2012 | | | | 65,000,000 | | | | 65,024,826 | |
U.S. Treasury Note | | | 1.38 | | | | 09/15/2012 | | | | 250,000,000 | | | | 250,372,785 | |
U.S. Treasury Note | | | 1.38 | | | | 10/15/2012 | | | | 75,000,000 | | | | 75,183,804 | |
U.S. Treasury Note | | | 1.38 | | | | 11/15/2012 | | | | 211,000,000 | | | | 211,732,521 | |
U.S. Treasury Note | | | 1.75 | | | | 08/15/2012 | | | | 122,000,000 | | | | 122,076,200 | |
U.S. Treasury Note | | | 4.25 | | | | 09/30/2012 | | | | 135,000,000 | | | | 135,904,811 | |
| | | | |
Total Treasury Debt (Cost $960,316,330) | | | | | | | | | | | | | | | 960,316,330 | |
| | | | | | | | | | | | | | | | |
| | | | | | | | |
| Total Investments in Securities | | | | | | | | |
| (Cost $28,795,763,195)* | | | 100.17 | % | | | 28,795,763,195 | |
Other Assets and Liabilities, Net | | | (0.17 | ) | | | (47,925,301 | ) |
| | | | | | | | |
| Total Net Assets | | | 100.00 | % | | $ | 28,747,837,894 | |
| | | | | | | | |
The accompanying notes are an integral part of these financial statements.
| | | | |
| 12 | | Wells Fargo Advantage Government Money Market Fund | | Portfolio of Investments—July 31, 2012 (Unaudited) |
144A Security that may be resold to “qualified institutional buyers” under Rule 144A or security offered pursuant to Section 4(2) of the Securities Act of 1933, as amended.
| (z) | Zero coupon security. Rate represents yield to maturity at time of purchase. |
| ± | Variable rate investment |
| (1) | U.S. government securities, 2.54% to 7.00%, 6/1/2033 to 4/15/2040, fair value including accrued interest is $1,030,000,000. |
| (2) | U.S. government securities, 0.375% to 2.50%, 3/31/2014 to 2/15/2022, fair value including accrued interest is $28,585,502. |
| (3) | U.S. government securities, 3.00% to 4.50%, 1/1/2026 to 6/1/2042, fair value including accrued interest is $927,000,001. |
| (4) | U.S. government securities, 3.00% to 4.50%, 12/20/2040 to 7/20/2042, fair value including accrued interest is $360,500,000. |
| (5) | U.S. government securities, 1.98% to 6.00%, 12/1/2017 to 7/15/2042, fair value including accrued interest is $515,000,000. |
| (6) | U.S. government securities, 1.80% to 6.50%, 3/1/2018 to 7/15/2047, fair value including accrued interest is $1,390,500,001. |
| (7) | U.S. government securities, 2.50% to 5.00%, 2/1/2026 to 7/1/2042, fair value including accrued interest is $257,501,946. |
| (8) | U.S. government securities, 3.00% to 6.00%, 11/1/2020 to 7/1/2042, fair value including accrued interest is $257,503,796. |
| (9) | U.S. government securities, 2.50% to 7.00%, 8/1/2013 to 8/1/2042, fair value including accrued interest is $25,750,073. |
| (10) | U.S. government securities, 2.50% to 7.00%, 8/1/2018 to 7/1/2042, fair value including accrued interest is $257,504,792. |
| (11) | U.S. government security, 0.00%, 7/25/2013, fair value is $153,000,025. |
| (12) | U.S. government securities, 3.00% to 5.00%, 4/20/2027 to 7/20/2042, fair value including accrued interest is $257,500,000. |
| (13) | U.S. government securities, 3.00% to 8.00%, 4/1/2016 to 8/1/2042, fair value including accrued interest is $809,683,001. |
| (14) | U.S. government security, 1.125%, 1/15/2021, fair value including accrued interest is $102,000,085. |
| (15) | U.S. government securities, 2.17% to 6.00%, 5/1/2023 to 7/1/2042, fair value including accrued interest is $257,500,001. |
| (16) | U.S. government securities, 2.50% to 5.00%, 7/1/2022 to 8/1/2042, fair value including accrued interest is $463,500,001. |
| (17) | U.S. government securities, 2.50% to 7.00%, 8/1/2018 to 7/1/2042, fair value including accrued interest is $515,004,027. |
| (18) | U.S. government securities, 0.625% to 1.375%, 7/15/2014 to 2/28/2019, fair value including accrued interest is $127,500,059. |
| (19) | U.S. government securities, 4.50%, 7/20/2041 to 8/20/2041, fair value including accrued interest is $309,000,000. |
| (20) | U.S. government securities, 2.51% to 5.29%, 2/1/2032 to 3/1/2042, fair value including accrued interest is $489,250,001. |
| (21) | U.S. government securities, 1.38% to 5.00%, 3/1/2038 to 12/1/2044, fair value including accrued interest is $103,000,001. |
| (22) | U.S. government security, 4.50%, 8/15/2039, fair value including accrued interest is $153,000,077. |
| (23) | U.S. government securities, 2.26% to 5.10%, 2/1/2017 to 8/1/2042, fair value including accrued interest is $1,236,000,001. |
| (24) | U.S. government securities, 0.00% to 6.91%, 12/12/2014 to 4/1/2050, fair value including accrued interest is $2,955,910,825. |
| (25) | U.S. government securities, 0.25% to 2.00%, 7/15/2015 to 11/15/2021, fair value including accrued interest is $510,000,004. |
| (26) | U.S. government securities, 3.00% to 6.50%, 3/1/2020 to 7/1/2042, fair value including accrued interest is $1,076,350,000. |
| * | Cost for federal income tax purposes is substantially the same for financial reporting purposes. |
The accompanying notes are an integral part of these financial statements.
| | | | | | |
| Statement of Assets and Liabilities—July 31, 2012 (Unaudited) | | Wells Fargo Advantage Government Money Market Fund | | | 13 | |
| | | | |
| | | | |
| |
Assets | | | | |
Investments | | | | |
In unaffiliated securities, at amortized cost | | $ | 14,641,638,195 | |
In repurchase agreements, at amortized cost | | | 14,154,125,000 | |
| | | | |
Total investments, at amortized cost | | | 28,795,763,195 | |
Cash | | | 18,068 | |
Receivable for Fund shares sold | | | 1,608,078 | |
Receivable for interest | | | 18,672,177 | |
Receivable from adviser | | | 703,503 | |
Prepaid expenses and other assets | | | 168,506 | |
| | | | |
Total assets | | | 28,816,933,527 | |
| | | | |
| |
Liabilities | | | | |
Dividends payable | | | 138,186 | |
Payable for investments purchased | | | 62,108,507 | |
Payable for Fund shares redeemed | | | 1,117,187 | |
Distribution fees payable | | | 8,948 | |
Due to other related parties | | | 3,240,688 | |
Accrued expenses and other liabilities | | | 2,482,117 | |
| | | | |
Total liabilities | | | 69,095,633 | |
| | | | |
Total net assets | | $ | 28,747,837,894 | |
| | | | |
| |
NET ASSETS CONSIST OF | | | | |
Paid-in capital | | $ | 28,747,869,985 | |
Overdistributed net investment income | | | (32,091 | ) |
| | | | |
Total net assets | | $ | 28,747,837,894 | |
| | | | |
| |
COMPUTATION OF NET ASSET VALUE PER SHARE1 | | | | |
Net assets – Class A | | $ | 654,397,981 | |
Shares outstanding – Class A | | | 654,404,397 | |
Net asset value per share – Class A | | | $1.00 | |
Net assets – Administrator Class | | $ | 566,859,736 | |
Shares outstanding – Administrator Class | | | 566,860,788 | |
Net asset value per share – Administrator Class | | | $1.00 | |
Net assets – Institutional Class | | $ | 21,873,169,794 | |
Shares outstanding – Institutional Class | | | 21,873,297,919 | |
Net asset value per share – Institutional Class | | | $1.00 | |
Net assets – Service Class | | $ | 5,626,137,554 | |
Shares outstanding – Service Class | | | 5,626,096,522 | |
Net asset value per share – Service Class | | | $1.00 | |
Net assets – Sweep Class | | $ | 27,272,829 | |
Shares outstanding – Sweep Class | | | 27,272,263 | |
Net asset value per share – Sweep Class | | | $1.00 | |
| 1. | The Fund has an unlimited number of authorized shares. |
The accompanying notes are an integral part of these financial statements.
| | | | |
| 14 | | Wells Fargo Advantage Government Money Market Fund | | Statement of Operations—Six Months Ended July 31, 2012 (Unaudited) |
| | | | |
| | | | |
| |
Investment income | | | | |
Interest | | $ | 25,190,690 | |
| | | | |
| |
Expenses | | | | |
Advisory fee | | | 14,813,901 | |
Administration fees | | | | |
Fund level | | | 5,190,072 | |
Class A | | | 782,331 | |
Administrator Class | | | 263,223 | |
Institutional Class | | | 9,174,703 | |
Service Class | | | 3,251,118 | |
Sweep Class | | | 38,891 | |
Shareholder servicing fees | | | | |
Class A | | | 883,703 | |
Administrator Class | | | 262,177 | |
Service Class | | | 6,761,208 | |
Sweep Class | | | 44,195 | |
Distribution fees | | | | |
Sweep Class | | | 61,872 | |
Custody and accounting fees | | | 607,298 | |
Professional fees | | | 23,616 | |
Registration fees | | | 25,671 | |
Shareholder report expenses | | | 43,255 | |
Trustees’ fees and expenses | | | 6,998 | |
Other fees and expenses | | | 101,671 | |
| | | | |
Total expenses | | | 42,335,903 | |
Less: Fee waivers and/or expense reimbursements | | | (18,638,753 | ) |
| | | | |
Net expenses | | | 23,697,150 | |
| | | | |
Net investment income | | | 1,493,540 | |
| | | | |
Net increase in net assets resulting from operations | | $ | 1,493,540 | |
| | | | |
The accompanying notes are an integral part of these financial statements.
| | | | | | |
| Statement of Changes in Net Assets | | Wells Fargo Advantage Government Money Market Fund | | | 15 | |
| | | | | | | | | | | | | | | | |
| | | Six Months Ended July 31, 2012 (Unaudited) | | | Year Ended
January 31, 2012 | |
| | | | |
Operations | | | | | | | | | | | | | | | | |
Net investment income | | | | | | $ | 1,493,540 | | | | | | | $ | 2,949,061 | |
Net realized gains on investments | | | | | | | 0 | | | | | | | | 512,083 | |
| | | | | | | | | | | | | | | | |
Net increase in net assets resulting from operations | | | | | | | 1,493,540 | | | | | | | | 3,461,144 | |
| | | | | | | | | | | | | | | | |
| | | | |
Distributions to shareholders from | | | | | | | | | | | | | | | | |
Net investment income | | | | | | | | | | | | | | | | |
Class A | | | | | | | (35,658 | ) | | | | | | | (95,021 | ) |
Administrator Class | | | | | | | (26,394 | ) | | | | | | | (53,944 | ) |
Institutional Class | | | | | | | (1,158,053 | ) | | | | | | | (2,204,200 | ) |
Service Class | | | | | | | (271,663 | ) | | | | | | | (584,349 | ) |
Sweep Class | | | | | | | (1,772 | ) | | | | | | | (11,547 | ) |
Net realized gains | | | | | | | | | | | | | | | | |
Class A | | | | | | | 0 | | | | | | | | (4,965 | ) |
Administrator Class | | | | | | | 0 | | | | | | | | (2,834 | ) |
Institutional Class | | | | | | | 0 | | | | | | | | (147,011 | ) |
Service Class | | | | | | | 0 | | | | | | | | (29,234 | ) |
Sweep Class | | | | | | | 0 | | | | | | | | (524 | ) |
| | | | | | | | | | | | | | | | |
Total distributions to shareholders | | | | | | | (1,493,540 | ) | | | | | | | (3,133,629 | ) |
| | | | | | | | | | | | | | | | |
| | | | |
Capital share transactions | | | Shares | | | | | | | | Shares | | | | | |
Proceeds from shares sold | | | | | | | | | | | | | | | | |
Class A | | | 919,976,225 | | | | 919,976,225 | | | | 1,838,568,173 | | | | 1,838,568,173 | |
Administrator Class | | | 1,555,409,451 | | | | 1,555,409,451 | | | | 4,876,710,130 | | | | 4,876,710,130 | |
Institutional Class | | | 89,013,205,657 | | | | 89,013,205,657 | | | | 174,485,337,964 | | | | 174,485,337,964 | |
Service Class | | | 19,149,103,031 | | | | 19,149,103,031 | | | | 36,731,533,107 | | | | 36,731,533,107 | |
Sweep Class | | | 56,561,698 | | | | 56,561,698 | | | | 632,350,626 | | | | 632,350,626 | |
| | | | | | | | | | | | | | | | |
| | | | | | | 110,694,256,062 | | | | | | | | 218,564,500,000 | |
| | | | | | | | | | | | | | | | |
Reinvestment of distributions | | | | | | | | | | | | | | | | |
Class A | | | 34,167 | | | | 34,167 | | | | 97,091 | | | | 97,091 | |
Administrator Class | | | 12,039 | | | | 12,039 | | | | 26,218 | | | | 26,218 | |
Institutional Class | | | 566,772 | | | | 566,772 | | | | 1,112,563 | | | | 1,112,563 | |
Service Class | | | 25,022 | | | | 25,022 | | | | 44,175 | | | | 44,175 | |
Sweep Class | | | 1,772 | | | | 1,772 | | | | 12,071 | | | | 12,071 | |
| | | | | | | | | | | | | | | | |
| | | | | | | 639,772 | | | | | | | | 1,292,118 | |
| | | | | | | | | | | | | | | | |
Payment for shares redeemed | | | | | | | | | | | | | | | | |
Class A | | | (1,202,784,853 | ) | | | (1,202,784,853 | ) | | | (1,980,377,857 | ) | | | (1,980,377,857 | ) |
Administrator Class | | | (1,597,509,821 | ) | | | (1,597,509,821 | ) | | | (4,815,072,662 | ) | | | (4,815,072,662 | ) |
Institutional Class | | | (93,553,170,790 | ) | | | (93,553,170,790 | ) | | | (167,834,417,712 | ) | | | (167,834,417,712 | ) |
Service Class | | | (18,779,806,728 | ) | | | (18,779,806,728 | ) | | | (37,295,525,738 | ) | | | (37,295,525,738 | ) |
Sweep Class | | | (131,201,197 | ) | | | (131,201,197 | ) | | | (658,245,099 | ) | | | (658,245,099 | ) |
| | | | | | | | | | | | | | | | |
| | | | | | | (115,264,473,389 | ) | | | | | | | (212,583,639,068 | ) |
| | | | | | | | | | | | | | | | |
Net increase (decrease) in net assets resulting from capital
share transactions | | | | | | | (4,569,577,555 | ) | | | | | | | 5,982,153,050 | |
| | | | | | | | | | | | | | | | |
Total increase (decrease) in net assets | | | | | | | (4,569,577,555 | ) | | | | | | | 5,982,480,565 | |
| | | | | | | | | | | | | | | | |
| | | | |
Net assets | | | | | | | | | | | | | | | | |
Beginning of period | | | | | | | 33,317,415,449 | | | | | | | | 27,334,934,884 | |
| | | | | | | | | | | | | | | | |
End of period | | | | | | $ | 28,747,837,894 | | | | | | | $ | 33,317,415,449 | |
| | | | | | | | | | | | | | | | |
Overdistributed net investment income | | | | | | $ | (32,091 | ) | | | | | | $ | (32,091 | ) |
| | | | | | | | | | | | | | | | |
The accompanying notes are an integral part of these financial statements.
| | | | |
| 16 | | Wells Fargo Advantage Government Money Market Fund | | Financial Highlights |
(For a share outstanding throughout each period)
| | | | | | | | | | | | | | | | | | | | | | | | | | | | |
| | | Six Months Ended July 31, 2012 (Unaudited) | | | Year Ended January 31, | | | Year Ended February 28, | |
| Class A | | | 2012 | | | 20111 | | | 2010 | | | 2009 | | | 20082 | | | 2007 | |
Net asset value, beginning of period | | $ | 1.00 | | | $ | 1.00 | | | $ | 1.00 | | | $ | 1.00 | | | $ | 1.00 | | | $ | 1.00 | | | $ | 1.00 | |
Net investment income | | | 0.00 | 3 | | | 0.00 | 3 | | | 0.00 | 3 | | | 0.00 | 3 | | | 0.01 | | | | 0.04 | | | | 0.05 | |
Net realized gains (losses) on investments | | | 0.00 | | | | 0.00 | 3 | | | (0.00 | ) | | | 0.00 | 3 | | | 0.00 | | | | 0.00 | | | | 0.00 | |
| | | | | | | | | | | | | | | | | | | | | | | | | | | | |
Total from investment operations | | | 0.00 | 3 | | | 0.00 | 3 | | | 0.00 | 3 | | | 0.00 | 3 | | | 0.01 | | | | 0.04 | | | | 0.05 | |
Distributions to shareholders from | | | | | | | | | | | | | | | | | | | | | | | | | | | | |
Net investment income | | | (0.00 | )3 | | | (0.00 | )3 | | | (0.00 | )3 | | | (0.00 | )3 | | | (0.01 | ) | | | (0.04 | ) | | | (0.05 | ) |
Net realized gains | | | 0.00 | | | | (0.00 | )3 | | | (0.00 | )3 | | | (0.00 | )3 | | | 0.00 | | | | 0.00 | | | | 0.00 | |
| | | | | | | | | | | | | | | | | | | | | | | | | | | | |
Total distributions to shareholders | | | (0.00 | )3 | | | (0.00 | )3 | | | (0.00 | )3 | | | (0.00 | )3 | | | (0.01 | ) | | | (0.04 | ) | | | (0.05 | ) |
Net asset value, end of period | | $ | 1.00 | | | $ | 1.00 | | | $ | 1.00 | | | $ | 1.00 | | | $ | 1.00 | | | $ | 1.00 | | | $ | 1.00 | |
Total return4 | | | 0.00 | % | | | 0.01 | % | | | 0.01 | % | | | 0.01 | % | | | 1.22 | % | | | 4.38 | % | | | 4.61 | % |
Ratios to average net assets (annualized) | | | | | | | | | | | | | | | | | | | | | | | | | | | | |
Gross expenses | | | 0.61 | % | | | 0.60 | % | | | 0.58 | % | | | 0.65 | % | | | 0.64 | % | | | 0.64 | % | | | 0.64 | % |
Net expenses | | | 0.16 | % | | | 0.12 | % | | | 0.22 | % | | | 0.28 | % | | | 0.64 | % | | | 0.64 | % | | | 0.64 | % |
Net investment income | | | 0.01 | % | | | 0.01 | % | | | 0.01 | % | | | 0.01 | % | | | 1.29 | % | | | 4.39 | % | | | 4.57 | % |
Supplemental data | | | | | | | | | | | | | | | | | | | | | | | | | | | | |
Net assets, end of period (000’s omitted) | | | $654,398 | | | | $937,172 | | | | $1,078,873 | | | | $777,462 | | | | $1,101,904 | | | | $1,921,647 | | | | $2,866,700 | |
| 1. | For the eleven months ended January 31, 2011. The Fund changed its fiscal year end from February 28 to January 31, effective January 31, 2011. |
| 2. | Year ended February 29. |
| 3. | Amount is less than $0.005. |
| 4. | Returns for periods of less than one year are not annualized. |
The accompanying notes are an integral part of these financial statements.
| | | | | | |
| Financial Highlights | | Wells Fargo Advantage Government Money Market Fund | | | 17 | |
(For a share outstanding throughout each period)
| | | | | | | | | | | | | | | | | | | | | | | | | | | | |
| | | Six Months Ended
July 31, 2012 (Unaudited) | | | Year Ended January 31, | | | Year Ended February 28, | |
| Administrator Class | | | 2012 | | | 20111 | | | 2010 | | | 2009 | | | 20082 | | | 2007 | |
Net asset value, beginning of period | | $ | 1.00 | | | $ | 1.00 | | | $ | 1.00 | | | $ | 1.00 | | | $ | 1.00 | | | $ | 1.00 | | | $ | 1.00 | |
Net investment income | | | 0.00 | 3 | | | 0.00 | 3 | | | 0.00 | 3 | | | 0.00 | 3 | | | 0.01 | | | | 0.04 | | | | 0.05 | |
Net realized gains (losses) on investments | | | 0.00 | | | | 0.00 | 3 | | | (0.00 | ) | | | 0.00 | 3 | | | 0.00 | | | | 0.00 | | | | 0.00 | |
| | | | | | | | | | | | | | | | | | | | | | | | | | | | |
Total from investment operations | | | 0.00 | 3 | | | 0.00 | 3 | | | 0.00 | 3 | | | 0.00 | 3 | | | 0.01 | | | | 0.04 | | | | 0.05 | |
Distributions to shareholders from | | | | | | | | | | | | | | | | | | | | | | | | | | | | |
Net investment income | | | (0.00 | )3 | | | (0.00 | )3 | | | (0.00 | )3 | | | (0.00 | )3 | | | (0.01 | ) | | | (0.04 | ) | | | (0.05 | ) |
Net realized gains | | | 0.00 | | | | (0.00 | )3 | | | (0.00 | )3 | | | (0.00 | )3 | | | 0.00 | | | | 0.00 | | | | 0.00 | |
| | | | | | | | | | | | | | | | | | | | | | | | | | | | |
Total distributions to shareholders | | | (0.00 | )3 | | | (0.00 | )3 | | | (0.00 | )3 | | | (0.00 | )3 | | | (0.01 | ) | | | (0.04 | ) | | | (0.05 | ) |
Net asset value, end of period | | $ | 1.00 | | | $ | 1.00 | | | $ | 1.00 | | | $ | 1.00 | | | $ | 1.00 | | | $ | 1.00 | | | $ | 1.00 | |
Total return4 | | | 0.00 | % | | | 0.01 | % | | | 0.01 | % | | | 0.02 | % | | | 1.50 | % | | | 4.68 | % | | | 4.92 | % |
Ratios to average net assets (annualized) | | | | | | | | | | | | | | | | | | | | | | | | | | | | |
Gross expenses | | | 0.34 | % | | | 0.34 | % | | | 0.35 | % | | | 0.39 | % | | | 0.37 | % | | | 0.37 | % | | | 0.37 | % |
Net expenses | | | 0.16 | % | | | 0.12 | % | | | 0.21 | % | | | 0.28 | % | | | 0.36 | % | | | 0.35 | % | | | 0.35 | % |
Net investment income | | | 0.01 | % | | | 0.01 | % | | | 0.01 | % | | | 0.03 | % | | | 1.42 | % | | | 4.55 | % | | | 4.82 | % |
Supplemental data | | | | | | | | | | | | | | | | | | | | | | | | | | | | |
Net assets, end of period (000’s omitted) | | | $566,860 | | | | $608,948 | | | | $547,278 | | | | $788,478 | | | | $1,780,294 | | | | $1,944,435 | | | | $1,179,768 | |
| 1. | For the eleven months ended January 31, 2011. The Fund changed its fiscal year end from February 28 to January 31, effective January 31, 2011. |
| 2. | Year ended February 29. |
| 3. | Amount is less than $0.005. |
| 4. | Returns for periods of less than one year are not annualized. |
The accompanying notes are an integral part of these financial statements.
| | | | |
| 18 | | Wells Fargo Advantage Government Money Market Fund | | Financial Highlights |
(For a share outstanding throughout each period)
| | | | | | | | | | | | | | | | | | | | | | | | | | | | |
| | | Six Months Ended
July 31, 2012 (Unaudited) | | | Year Ended January 31, | | | Year Ended February 28, | |
| Institutional Class | | | 2012 | | | 20111 | | | 2010 | | | 2009 | | | 20082 | | | 2007 | |
Net asset value, beginning of period | | $ | 1.00 | | | $ | 1.00 | | | $ | 1.00 | | | $ | 1.00 | | | $ | 1.00 | | | $ | 1.00 | | | $ | 1.00 | |
Net investment income | | | 0.00 | 3 | | | 0.00 | 3 | | | 0.00 | 3 | | | 0.00 | 3 | | | 0.01 | | | | 0.04 | | | | 0.05 | |
Net realized gains (losses) on investments | | | 0.00 | | | | 0.00 | 3 | | | (0.00 | ) | | | 0.00 | 3 | | | 0.00 | | | | 0.00 | | | | 0.00 | |
| | | | | | | | | | | | | | | | | | | | | | | | | | | | |
Total from investment operations | | | 0.00 | 3 | | | 0.00 | 3 | | | 0.00 | 3 | | | 0.00 | 3 | | | 0.01 | | | | 0.04 | | | | 0.05 | |
Distributions to shareholders from | | | | | | | | | | | | | | | | | | | | | | | | | | | | |
Net investment income | | | (0.00 | )3 | | | (0.00 | )3 | | | (0.00 | )3 | | | (0.00 | )3 | | | (0.01 | ) | | | (0.04 | ) | | | (0.05 | ) |
Net realized gains | | | 0.00 | | | | (0.00 | )3 | | | (0.00 | )3 | | | (0.00 | )3 | | | 0.00 | | | | 0.00 | | | | 0.00 | |
| | | | | | | | | | | | | | | | | | | | | | | | | | | | |
Total distributions to shareholders | | | (0.00 | )3 | | | (0.00 | )3 | | | (0.00 | )3 | | | (0.00 | )3 | | | (0.01 | ) | | | (0.04 | ) | | | (0.05 | ) |
Net asset value, end of period | | $ | 1.00 | | | $ | 1.00 | | | $ | 1.00 | | | $ | 1.00 | | | $ | 1.00 | | | $ | 1.00 | | | $ | 1.00 | |
Total return4 | | | 0.01 | % | | | 0.01 | % | | | 0.03 | % | | | 0.08 | % | | | 1.65 | % | | | 4.83 | % | | | 5.07 | % |
Ratios to average net assets (annualized) | | | | | | | | | | | | | | | | | | | | | | | | | | | | |
Gross expenses | | | 0.22 | % | | | 0.22 | % | | | 0.23 | % | | | 0.27 | % | | | 0.26 | % | | | 0.25 | % | | | 0.25 | % |
Net expenses | | | 0.16 | % | | | 0.12 | % | | | 0.20 | % | | | 0.21 | % | | | 0.22 | % | | | 0.20 | % | | | 0.20 | % |
Net investment income | | | 0.01 | % | | | 0.01 | % | | | 0.03 | % | | | 0.10 | % | | | 1.42 | % | | | 4.54 | % | | | 5.00 | % |
Supplemental data | | | | | | | | | | | | | | | | | | | | | | | | | | | | |
Net assets, end of period (000’s omitted) | | | $21,873,170 | | | | $26,412,568 | | | | $19,760,296 | | | | $20,661,470 | | | | $42,393,921 | | | | $23,265,323 | | | | $7,766,684 | |
| 1. | For the eleven months ended January 31, 2011. The Fund changed its fiscal year end from February 28 to January 31, effective January 31, 2011. |
| 2. | Year ended February 29. |
| 3. | Amount is less than $0.005. |
| 4. | Returns for periods of less than one year are not annualized. |
The accompanying notes are an integral part of these financial statements.
| | | | | | |
| Financial Highlights | | Wells Fargo Advantage Government Money Market Fund | | | 19 | |
(For a share outstanding throughout each period)
| | | | | | | | | | | | | | | | | | | | | | | | | | | | |
| | | Six Months Ended
July 31, 2012 (Unaudited) | | | Year Ended January 31, | | | Year Ended February 28, | |
| Service Class | | | 2012 | | | 20111 | | | 2010 | | | 2009 | | | 20082 | | | 2007 | |
Net asset value, beginning of period | | $ | 1.00 | | | $ | 1.00 | | | $ | 1.00 | | | $ | 1.00 | | | $ | 1.00 | | | $ | 1.00 | | | $ | 1.00 | |
Net investment income | | | 0.00 | 3 | | | 0.00 | 3 | | | 0.00 | 3 | | | 0.00 | 3 | | | 0.01 | | | | 0.04 | | | | 0.05 | |
Net realized gains (losses) on investments | | | 0.00 | | | | 0.00 | 3 | | | (0.00 | ) | | | 0.00 | 3 | | | 0.00 | | | | 0.00 | | | | 0.00 | |
| | | | | | | | | | | | | | | | | | | | | | | | | | | | |
Total from investment operations | | | 0.00 | 3 | | | 0.00 | 3 | | | 0.00 | 3 | | | 0.00 | 3 | | | 0.01 | | | | 0.04 | | | | 0.05 | |
Distributions to shareholders from | | | | | | | | | | | | | | | | | | | | | | | | | | | | |
Net investment income | | | (0.00 | )3 | | | (0.00 | )3 | | | (0.00 | )3 | | | (0.00 | )3 | | | (0.01 | ) | | | (0.04 | ) | | | (0.05 | ) |
Net realized gains | | | 0.00 | | | | (0.00 | )3 | | | (0.00 | )3 | | | (0.00 | )3 | | | 0.00 | | | | 0.00 | | | | 0.00 | |
| | | | | | | | | | | | | | | | | | | | | | | | | | | | |
Total distributions to shareholders | | | (0.00 | )3 | | | (0.00 | )3 | | | (0.00 | )3 | | | (0.00 | )3 | | | (0.01 | ) | | | (0.04 | ) | | | (0.05 | ) |
Net asset value, end of period | | $ | 1.00 | | | $ | 1.00 | | | $ | 1.00 | | | $ | 1.00 | | | $ | 1.00 | | | $ | 1.00 | | | $ | 1.00 | |
Total return4 | | | 0.00 | % | | | 0.01 | % | | | 0.01 | % | | | 0.01 | % | | | 1.35 | % | | | 4.52 | % | | | 4.76 | % |
Ratios to average net assets (annualized) | | | | | | | | | | | | | | | | | | | | | | | | | | | | |
Gross expenses | | | 0.51 | % | | | 0.51 | % | | | 0.52 | % | | | 0.56 | % | | | 0.54 | % | | | 0.54 | % | | | 0.54 | % |
Net expenses | | | 0.16 | % | | | 0.12 | % | | | 0.22 | % | | | 0.28 | % | | | 0.51 | % | | | 0.50 | % | | | 0.50 | % |
Net investment income | | | 0.01 | % | | | 0.01 | % | | | 0.01 | % | | | 0.01 | % | | | 1.31 | % | | | 4.42 | % | | | 4.66 | % |
Supplemental data | | | | | | | | | | | | | | | | | | | | | | | | | | | | |
Net assets, end of period (000’s omitted) | | | $5,626,138 | | | | $5,256,816 | | | | $5,820,697 | | | | $4,595,307 | | | | $6,342,777 | | | | $6,350,025 | | | | $5,656,867 | |
| 1. | For the eleven months ended January 31, 2011. The Fund changed its fiscal year end from February 28 to January 31, effective January 31, 2011. |
| 2. | Year ended February 29. |
| 3. | Amount is less than $0.005. |
| 4. | Returns for periods of less than one year are not annualized. |
The accompanying notes are an integral part of these financial statements.
| | | | |
| 20 | | Wells Fargo Advantage Government Money Market Fund | | Financial Highlights |
(For a share outstanding throughout each period)
| | | | | | | | | | | | |
| | | Six Months Ended
July 31, 2012 (Unaudited) | | | Year Ended January 31, | |
| Sweep Class | | | 2012 | | | 20111 | |
Net asset value, beginning of period | | $ | 1.00 | | | $ | 1.00 | | | $ | 1.00 | |
Net investment income | | | 0.00 | 2 | | | 0.00 | 2 | | | 0.00 | 2 |
Net realized gains (losses) on investments | | | 0.00 | | | | 0.00 | 2 | | | (0.00 | ) |
| | | | | | | | | | | | |
Total from investment operations | | | 0.00 | 2 | | | 0.00 | 2 | | | 0.00 | 2 |
Distributions to shareholders from | | | | | | | | | | | | |
Net investment income | | | (0.00 | )2 | | | (0.00 | )2 | | | (0.00 | )2 |
Net realized gains | | | 0.00 | | | | (0.00 | )2 | | | (0.00 | )2 |
| | | | | | | | | | | | |
Total distributions to shareholders | | | (0.00 | )2 | | | (0.00 | )2 | | | (0.00 | )2 |
Net asset value, end of period | | $ | 1.00 | | | $ | 1.00 | | | $ | 1.00 | |
Total return3 | | | 0.00 | % | | | 0.01 | % | | | 0.01 | % |
Ratios to average net assets (annualized) | | | | | | | | | | | | |
Gross expenses | | | 0.96 | % | | | 0.96 | % | | | 0.94 | % |
Net expenses | | | 0.16 | % | | | 0.12 | % | | | 0.22 | % |
Net investment income | | | 0.01 | % | | | 0.01 | % | | | 0.01 | % |
Supplemental data | | | | | | | | | | | | |
Net assets, end of period (000’s omitted) | | | $27,273 | | | | $101,911 | | | | $127,791 | |
| 1. | For the period from June 30, 2010 (commencement of class operations) to January 31, 2011. |
| 2. | Amount is less than $0.005. |
| 3. | Returns for periods of less than one year are not annualized. |
The accompanying notes are an integral part of these financial statements.
| | | | | | |
| Notes to Financial Statements (Unaudited) | | Wells Fargo Advantage Government Money Market Fund | | | 21 | |
1. ORGANIZATION
Wells Fargo Funds Trust (the “Trust”), a Delaware statutory trust organized on March 10, 1999, is an open-end management investment company registered under the Investment Company Act of 1940, as amended (the “1940 Act”). These financial statements report on Wells Fargo Advantage Government Money Market Fund (the “Fund”) which is a diversified series of the Trust.
2. SIGNIFICANT ACCOUNTING POLICIES
The following significant accounting policies, which are consistently followed in the preparation of the financial statements of the Fund, are in conformity with U.S. generally accepted accounting principles which require management to make estimates and assumptions that affect the reported amounts of assets and liabilities, disclosure of contingent assets and liabilities at the date of the financial statements, and the reported amounts of revenues and expenses during the reporting period. Actual results could differ from those estimates.
Securities valuation
As permitted under Rule 2a-7 of the 1940 Act, portfolio securities are valued at amortized cost, which approximates fair value. The amortized cost method involves valuing a security at its cost, plus accretion of discount or minus amortization of premium over the period until maturity.
Investments which are not valued using the method discussed above are valued at their fair value, as determined by procedures established in good faith and approved by the Board of Trustees. The Board of Trustees has established a Valuation Committee comprised of the Trustees and has delegated to it the authority to take any actions regarding the valuation of portfolio securities that the Valuation Committee deems necessary in determining the fair value of portfolio securities, unless the responsibility has been delegated to the Management Valuation Team of Wells Fargo Funds Management, LLC (“Funds Management”). The Board of Trustees retains the authority to make or ratify any valuation decisions or approve any changes to the Valuation Procedures as it deems appropriate. On a quarterly basis, the Board of Trustees considers for ratification any valuation actions taken by the Valuation Committee or the Management Valuation Team.
Valuations of fair valued securities are compared to the next actual sales price when available, or other appropriate market information to assess the continued appropriateness of the fair valuation methodology used. These securities are fair valued on a day-to-day basis, taking into consideration changes to appropriate market information and any significant changes to the input factors considered in the valuation process until there is a readily available price provided on the exchange or by an independent pricing service. Valuations received from an independent pricing service or broker quotes are periodically validated by comparisons to most recent trades and valuations provided by other independent pricing services in addition to the review of prices by the adviser and/or sub-adviser. Unobservable inputs used in determining fair valuations are identified based on the type of security, taking into consideration factors utilized by market participants in valuing the investment, knowledge about the issuer and the current market environment.
Repurchase agreements
The Fund may invest in repurchase agreements and may participate in pooled repurchase agreement transactions with other funds advised by Funds Management. The repurchase agreements must be fully collateralized based on values that are marked-to-market daily. The collateral may be held by an agent bank under a tri-party agreement. It is the custodian’s responsibility to value collateral daily and to take action to obtain additional collateral as necessary to maintain market value equal to or greater than the resale price. The repurchase agreements are collateralized by instruments such as U.S. Treasury, federal agency, or high-grade corporate obligations. There could be potential loss to the Fund in the event that the Fund is delayed or prevented from exercising its rights to dispose of the collateral, including the risk of a possible decline in the value of the underlying obligations during the period in which the Fund seeks to assert its rights.
Security transactions and income recognition
Securities transactions are recorded on a trade date basis. Realized gains or losses are reported on the basis of identified cost of securities delivered.
Interest income is accrued daily and bond discounts are accreted and premiums are amortized daily based on the effective interest method. To the extent debt obligations are placed on non-accrual status, any related interest income
| | | | |
| 22 | | Wells Fargo Advantage Government Money Market Fund | | Notes to Financial Statements (Unaudited) |
may be reduced by writing off interest receivables when the collection of all or a portion of interest has become doubtful based on consistently applied procedures. If the issuer subsequently resumes interest payments or when the collectability of interest is reasonably assured, the debt obligation is removed from non-accrual status.
Distributions to shareholders
Distributions to shareholders from net investment income are accrued daily and paid monthly. Distributions from net realized gains, if any, are recorded on the ex-dividend date. Such distributions are determined in conformity with income tax regulations, which may differ from generally accepted accounting principles.
Federal and other taxes
The Fund intends to continue to qualify as a regulated investment company by distributing substantially all of its investment company taxable income and any net realized capital gains (after reduction for capital loss carryforwards) sufficient to relieve it from all, or substantially all, federal income taxes. Accordingly, no provision for federal income taxes was required.
The Fund’s income and federal excise tax returns and all financial records supporting those returns for the prior three fiscal years are subject to examination by the federal and Delaware revenue authorities. Management has analyzed the Fund’s tax positions taken on federal, state, and foreign tax returns for all open tax years and does not believe that there are any uncertain tax positions that require recognition of a tax liability.
Class allocations
The separate classes of shares offered by the Fund differ principally in distribution, shareholder servicing and administration fees. Shareholders of each class bear certain expenses that pertain to that particular class. All shareholders bear the common expenses of the Fund, earn income from the portfolio, and are allocated any unrealized gains and losses pro rata based on the average daily net assets of each class, without distinction between share classes. Dividends are determined separately for each class based on income and expenses allocable to each class. Realized gains and losses are allocated to each class pro rata based upon the net assets of each class on the date realized. Differences in per share dividend rates generally result from the relative weightings of pro rata income and realized gain allocations and from differences in separate class expenses, including distribution, shareholder servicing and administration fees.
3. FAIR VALUATION MEASUREMENTS
Fair value measurements of investments are determined within a framework that has established a fair value hierarchy based upon the various data inputs utilized in determining the value of the Fund’s investments. The three-level hierarchy gives the highest priority to unadjusted quoted prices in active markets for identical assets or liabilities (Level 1) and the lowest priority to significant unobservable inputs (Level 3). The Fund’s investments are classified within the fair value hierarchy based on the lowest level of input that is significant to the fair value measurement. The inputs are summarized into three broad levels as follows:
| n | | Level 1 – quoted prices in active markets for identical securities |
| n | | Level 2 – other significant observable inputs (including quoted prices for similar securities, interest rates, prepayment speeds, credit risk, etc.) |
| n | | Level 3 – significant unobservable inputs (including the Fund’s own assumptions in determining the fair value of investments) |
The inputs or methodologies used for valuing securities are not necessarily an indication of the risk associated with investing in those securities.
At July 31, 2012, all of the Fund’s investments in securities carried at fair value were designated as Level 2 since the primary inputs include credit quality of the issuer and short-term interest rates which are observable.
Further details on the major security types can be found in the Portfolio of Investments.
Transfers in and transfers out are recognized at the end of the reporting period. For the six months ended July 31, 2012, the Fund did not have any transfers into/out of Level 1 and Level 2.
| | | | | | |
| Notes to Financial Statements (Unaudited) | | Wells Fargo Advantage Government Money Market Fund | | | 23 | |
4. TRANSACTIONS WITH AFFILIATES AND OTHER EXPENSES
Advisory fee
The Trust has entered into an advisory contract with Funds Management, an indirect wholly owned subsidiary of Wells Fargo & Company (“Wells Fargo”). The adviser is responsible for implementing investment policies and guidelines and for supervising the sub-adviser, who is responsible for day-to-day portfolio management of the Fund.
Pursuant to the contract, Funds Management is entitled to receive an annual advisory fee of 0.10% of the Fund’s average daily net asset.
Funds Management has retained the services of a sub-adviser to provide daily portfolio management to the Fund. The fee for sub-advisory services is borne by Funds Management. Wells Capital Management Incorporated, an affiliate of Funds Management, is the sub-adviser to the Fund and is entitled to receive a fee from Funds Management at an annual rate starting at 0.05% and declining to 0.01% as the average daily net assets of the Fund increase.
Administration and transfer agent fees
The Trust has entered into an administration agreement with Funds Management. Under this agreement, for providing administrative services, which includes paying fees and expenses for services provided by the transfer agent, sub-transfer agents, omnibus account servicers and record-keepers, Funds Management is entitled to receive from the Fund an annual fund level administration fee starting at 0.05% and declining to 0.03% as the average daily net assets of the Fund increase and a class level administration fee which is calculated based on the average daily net assets of each class as follows:
| | | | |
| | | Class Level Administration Fee | |
Class A, Sweep Class | | | 0.22 | % |
Administrator Class | | | 0.10 | |
Institutional Class | | | 0.08 | |
Service Class | | | 0.12 | |
Funds Management has contractually waived and/or reimbursed advisory and administration fees to the extent necessary to maintain certain net operating expense ratios for the Fund. Waiver of fees and/or reimbursement of expenses by Funds Management were made first from fund level expenses on a proportionate basis and then from class specific expenses. Funds Management has committed through July 11, 2013 to waive fees and/or reimburse expenses to the extent necessary to cap the Fund’s expenses at 0.65% for Class A, 0.35% for Administrator Class, 0.20% for Institutional Class, 0.50% for Service Class and 1.00% for Sweep Class.
Distribution fees
The Trust has adopted a Distribution Plan for Sweep Class shares of the Fund pursuant to Rule 12b-1 under the 1940 Act. Distribution fees are charged to Sweep Class shares and paid to Wells Fargo Funds Distributor, LLC, the principal underwriter, at an annual rate of 0.35% of its average daily net assets.
Shareholder servicing fees
The Trust has entered into contracts with one or more shareholder servicing agents, whereby Class A, Service Class and Sweep Class of the Fund is charged a fee at an annual rate of 0.25% of the respective average daily net assets of each class. Administrator Class is charged a fee at an annual rate of 0.10% of its average daily net assets.
A portion of these total shareholder servicing fees were paid to affiliates of Wells Fargo.
5. INDEMNIFICATION
Under the Trust’s organizational documents, the officers and directors are indemnified against certain liabilities that may arise out of performance of their duties to the Trust. Additionally, in the normal course of business, the Trust may enter into contracts with service providers that contain a variety of indemnification clauses. The Trust’s maximum exposure under these arrangements is dependent on future claims that may be made against the Fund and, therefore, cannot be estimated.
| | | | |
| 24 | | Wells Fargo Advantage Government Money Market Fund | | Notes to Financial Statements (Unaudited) |
6. NEW ACCOUNTING PRONOUNCEMENT
In December 2011, the Financial Accounting Standards Board (“FASB”) issued Accounting Standard Update (“ASU”) No. 2011-11, Disclosures about Offsetting Assets and Liabilities. ASU 2011-11, which amends FASB ASC Topic 210, Balance Sheet, creates new disclosure requirements which require entities to disclose both gross and net information for derivatives and other financial instruments that are either offset in the Statement of Assets and Liabilities or subject to an enforceable master netting arrangement or similar agreement. The disclosure requirements are effective for interim and annual reporting periods beginning on or after January 1, 2013. Management is currently assessing the potential impact, in addition to expanded financial statement disclosure, that may result from adopting this ASU.
| | | | | | |
| Other Information (Unaudited) | | Wells Fargo Advantage Government Money Market Fund | | | 25 | |
PROXY VOTING INFORMATION
A description of the policies and procedures that the Fund uses to determine how to vote proxies relating to portfolio securities is available without charge, upon request, by calling 1-800-222-8222, visiting our Web site at wellsfargoadvantagefunds.com, or visiting the SEC Web site at sec.gov. Information regarding how the Fund voted proxies relating to portfolio securities during the most recent 12-month period ended June 30 is available without charge on the Fund’s Web site at wellsfargoadvantagefunds.com or by visiting the SEC Web site at sec.gov.
PORTFOLIO HOLDINGS INFORMATION
The complete portfolio holdings for each Fund are publicly available on the Funds’ Web site (wellsfargoadvantagefunds.com) on a monthly, seven-day delayed basis. The Fund files its complete schedule of portfolio holdings with the SEC for the first and third quarters of each fiscal year on Form N-Q, which is available without charge by visiting the SEC Web site at sec.gov. In addition, each Fund’s Form N-Q may be reviewed and copied at the SEC’s Public Reference Room in Washington, DC, and at regional offices in New York City, at 233 Broadway, and in Chicago, at 175 West Jackson Boulevard, Suite 900. Information about the Public Reference Room may be obtained by calling 1-800-SEC-0330.
| | | | |
| 26 | | Wells Fargo Advantage Government Money Market Fund | | Other Information (Unaudited) |
BOARD OF TRUSTEES AND OFFICERS
Each of the Trustees and Officers listed in the table below acts in identical capacities for the Wells Fargo Advantage family of funds, which consists of 138 funds comprising the Wells Fargo Funds Trust, Wells Fargo Variable Trust, Wells Fargo Master Trust and four closed-end funds (collectively the “Fund Complex”). This table should be read in conjunction with the Prospectus and the Statement of Additional Information1. All of the Trustees are also Members of the Audit and Governance Committees of each Trust in the Fund Complex. The mailing address of each Trustee and Officer is 525 Market Street, 12th Floor, San Francisco, CA 94105. Each Trustee and Officer serves an indefinite term, however, each Trustee serves such term until reaching the mandatory retirement age established by the Trustees.
Independent Trustees
| | | | | | |
Name and Year of Birth | | Position Held and Length of Service* | | Principal Occupations During Past Five Years | | Other Directorships During
Past Five Years |
Peter G. Gordon
(Born 1942) | | Trustee, since 1998, Chairman, since 2005 | | Co-Founder, Retired Chairman, President and CEO of Crystal Geyser Water Company. Trustee Emeritus, Colby College | | Asset Allocation Trust |
Isaiah Harris, Jr.
(Born 1952) | | Trustee, since 2009 | | Retired. Prior thereto, President and CEO of BellSouth Advertising and Publishing Corp. from 2005 to 2007, President and CEO of BellSouth Enterprises from 2004 to 2005 and President of BellSouth Consumer Services from 2000 to 2003. Emeritus member of the Iowa State University Foundation Board of Governors. Emeritus Member of the Advisory Board of Iowa State University School of Business. Mr. Harris is a certified public accountant. | | CIGNA Corporation; Deluxe Corporation; Asset Allocation Trust |
Judith M. Johnson
(Born 1949) | | Trustee, since 2008
Audit Committee Chairman, since 2008 | | Retired. Prior thereto, Chief Executive Officer and Chief Investment Officer of Minneapolis Employees Retirement Fund from 1996 to 2008. Ms. Johnson is an attorney, certified public accountant and a certified managerial accountant. | | Asset Allocation Trust |
Leroy Keith, Jr.
(Born 1939) | | Trustee, since 2010 | | Chairman, Bloc Global Services (development and construction). Trustee of the Evergreen Funds from 1983 to 2010. Former Managing Director, Almanac Capital Management (commodities firm), former Partner, Stonington Partners, Inc. (private equity fund), former Director, Obagi Medical Products Co. and former Director, Lincoln Educational Services. | | Trustee, Virtus Fund Complex (consisting of 40 portfolios as of 12/31/11); Asset Allocation Trust |
David F. Larcker
(Born 1950) | | Trustee, since 2009 | | James Irvin Miller Professor of Accounting at the Graduate School of Business, Stanford University, Director of Corporate Governance Research Program and Senior Faculty of The Rock Center for Corporate Governance since 2006. From 2005 to 2008, Professor of Accounting at the Graduate School of Business, Stanford University. Prior thereto, Ernst & Young Professor of Accounting at The Wharton School, University of Pennsylvania from 1985 to 2005. | | Asset Allocation Trust |
Olivia S. Mitchell
(Born 1953) | | Trustee, since 2006 | | International Foundation of Employee Benefit Plans Professor, Wharton School of the University of Pennsylvania since 1993. Director of Wharton’s Pension Research Council and Boettner Center on Pensions & Retirement Research, and Research Associate at the National Bureau of Economic Research. Previously, Cornell University Professor from 1978 to 1993. | | Asset Allocation Trust |
Timothy J. Penny
(Born 1951) | | Trustee, since 1996 | | President and CEO of Southern Minnesota Initiative Foundation, a non-profit organization, since 2007 and Senior Fellow at the Humphrey Institute Policy Forum at the University of Minnesota since 1995. Member of the Board of Trustees of NorthStar Education Finance, Inc., a non-profit organization, since 2007. | | Asset Allocation Trust |
| | | | | | |
| Other Information (Unaudited) | | Wells Fargo Advantage Government Money Market Fund | | | 27 | |
| | | | | | |
Name and Year of Birth | | Position Held and Length of Service* | | Principal Occupations During Past Five Years | | Other Directorships During
Past Five Years |
Michael S. Scofield
(Born 1943) | | Trustee, since 2010 | | Served on the Investment Company Institute’s Board of Governors and Executive Committee from 2008-2011 as well the Governing Council of the Independent Directors Council from 2006-2011 and the Independent Directors Council Executive Committee from 2008-2011. Chairman of the IDC from 2008-2010. Institutional Investor (Fund Directions) Trustee of Year in 2007. Trustee of the Evergreen Funds (and its predecessors) from 1984 to 2010. Chairman of the Evergreen Funds from 2000-2010. Former Trustee of the Mentor Funds. Retired Attorney, Law Offices of Michael S. Scofield and former Director and Chairman, Branded Media Corporation (multi-media branding company). | | Asset Allocation Trust |
Donald C. Willeke
(Born 1940) | | Trustee, since 1996 | | Principal of the law firm of Willeke & Daniels. General Counsel of the Minneapolis Employees Retirement Fund from 1984 until its consolidation into the Minnesota Public Employees Retirement Association on June 30, 2010. Director and Vice Chair of The Free Trust (non-profit corporation). Director of the American Chestnut Foundation (non-profit corporation). | | Asset Allocation Trust |
| * | Length of service dates reflect the Trustee’s commencement of service with the Trust’s predecessor entities, where applicable. |
Officers
| | | | | | |
Name and Year of Birth | | Position Held and
Length of Service | | Principal Occupations During Past Five Years | | |
Karla M. Rabusch
(Born 1959) | | President, since 2003 | | Executive Vice President of Wells Fargo Bank, N.A. and President of Wells Fargo Funds Management, LLC since 2003. Senior Vice President and Chief Administrative Officer of Wells Fargo Funds Management, LLC from 2001 to 2003. | | |
C. David Messman
(Born 1960) | | Secretary, since 2000; Chief Legal Officer, since 2003 | | Senior Vice President and Secretary of Wells Fargo Funds Management, LLC since 2001. Vice President and Managing Senior Counsel of Wells Fargo Bank, N.A. since 1996. | | |
Nancy Wiser (Born 1967) | | Treasurer, since 2012 | | Executive Vice President of Wells Fargo Funds Management, LLC since 2011. Chief Operating Officer and Chief Compliance Officer at LightBox Capital Management LLC, from 2008 to 2011. Owned and operated a consulting business providing services to various hedge funds including acting as Chief Operating Officer and Chief Compliance Officer for a hedge fund from 2007 to 2008. Chief Operating Officer and Chief Compliance Officer of GMN Capital LLC from 2006 to 2007. | | |
David Berardi
(Born 1975) | | Assistant Treasurer, since 2009 | | Vice President of Wells Fargo Funds Management, LLC since 2009. Vice President of Evergreen Investment Management Company, LLC from 2008 to 2010. Assistant Vice President of Evergreen Investment Services, Inc. from 2004 to 2008. Manager of Fund Reporting and Control for Evergreen Investment Management Company, LLC from 2004 to 2010. | | |
Jeremy DePalma
(Born 1974) | | Assistant Treasurer, since 2009 | | Senior Vice President of Wells Fargo Funds Management, LLC since 2009. Senior Vice President of Evergreen Investment Management Company, LLC from 2008 to 2010. Vice President, Evergreen Investment Services, Inc. from 2004 to 2007. Head of the Fund Reporting and Control Team within Fund Administration from 2005 to 2010. | | |
Debra Ann Early
(Born 1964) | | Chief Compliance Officer, since 2007 | | Chief Compliance Officer of Wells Fargo Funds Management, LLC since 2007. Chief Compliance Officer of Parnassus Investments from 2005 to 2007. Chief Financial Officer of Parnassus Investments from 2004 to 2007 and Senior Audit Manager of PricewaterhouseCoopers LLP from 1998 to 2004. | | |
| 1. | The Statement of Additional Information includes additional information about the Trustees and is available, without charge, upon request, by calling 1-800-222-8222 or by visiting the Web site at wellsfargoadvantagefunds.com. |
| | | | |
| 28 | | Wells Fargo Advantage Government Money Market Fund | | Other Information (Unaudited) |
BOARD CONSIDERATION OF INVESTMENT ADVISORY AND SUB-ADVISORY AGREEMENTS:
Under Section 15 of the Investment Company Act of 1940 (the “1940 Act”), the Board of Trustees (the “Board”) of Wells Fargo Funds Trust (the “Trust”), all the members of which have no direct or indirect interest in the investment advisory and sub-advisory agreements and are not “interested persons” of the Trust, as defined in the 1940 Act (the “Independent Trustees”), must determine whether to approve the continuation of the Trust’s investment advisory and sub-advisory agreements. In this regard, at an in person meeting held on March 29-30, 2012 (the “Meeting”), the Board reviewed and re-approved: (i) an investment advisory agreement with Wells Fargo Funds Management, LLC (“Funds Management”) for Wells Fargo Advantage Government Money Market Fund (the “Fund”) and (ii) an investment sub-advisory agreement with Wells Capital Management Incorporated (“Wells Capital Management”) for the Fund. The investment advisory agreement with Funds Management and the investment sub-advisory agreement with Wells Capital Management are collectively referred to as the “Advisory Agreements.”
At the Meeting, the Board considered the factors and reached the conclusions described below relating to the selection of Funds Management and Wells Capital Management and the continuation of the Advisory Agreements. Prior to the Meeting, the Trustees conferred extensively among themselves and with representatives of Funds Management about these matters. The Board also met throughout the year and received information that was useful to them in considering the continuation of the Advisory Agreements. The Independent Trustees were assisted in their evaluation of the Advisory Agreements by independent legal counsel, from whom they received separate legal advice and with whom they met separately from Funds Management.
In providing information to the Board, Funds Management and Wells Capital Management were guided by a detailed set of requests submitted by the Independent Trustees’ independent legal counsel on their behalf at the start of the Board’s annual contract renewal process earlier in 2012. In approving the Advisory Agreements, the Board did not identify any particular information or consideration that was all-important or controlling, and each Trustee likely attributed different weights to various factors.
Nature, extent and quality of services
The Board received and considered various information regarding the nature, extent and quality of services provided to the Fund by Funds Management and Wells Capital Management under the Advisory Agreements. The Board also received and considered, among other things, information about the background and experience of senior management of Funds Management, and the qualifications, backgrounds, tenures and responsibilities of the portfolio managers primarily responsible for the day-to-day portfolio management of the Fund.
The Board evaluated the ability of Funds Management and Wells Capital Management, based on their respective financial condition, resources, reputation and other attributes, to attract and retain qualified investment professionals, including research, advisory, and supervisory personnel. The Board further considered the compliance programs and compliance records of Funds Management and Wells Capital Management. In addition, the Board took into account the administrative services provided to the Fund by Funds Management and its affiliates.
The Board’s decision to approve the continuation of the Advisory Agreements was based on a comprehensive evaluation of information provided to it. In considering these matters, the Board considered not only the specific information presented in connection with the Meeting, but also the knowledge gained over time through interaction with Funds Management and Wells Capital Management about various topics, including Funds Management’s oversight of service providers. The above factors, together with those referenced below, are some of the most important, but not necessarily all, factors considered by the Board in concluding that the nature, extent and quality of the investment advisory services provided to the Fund by Funds Management and Wells Capital Management supported the re-approval of the Advisory Agreements. Although the Board considered the continuation of the Advisory Agreements for the Fund as part of the larger process of considering the continuation of the advisory agreements for all of the funds in the complex, its decision to continue the Advisory Agreements for the Fund was ultimately made on a fund-by-fund basis.
Fund performance and expenses
The Board considered the performance results for the Fund over various time periods ended December 31, 2011. The Board also considered these results in comparison to the median performance of a universe of relevant funds (the “Universe”) that was determined by Lipper Inc. (“Lipper”) to be similar to the Fund, and in comparison to the Fund’s
| | | | | | |
| Other Information (Unaudited) | | Wells Fargo Advantage Government Money Market Fund | | | 29 | |
benchmark index and to other comparative data. Lipper is an independent provider of investment company data. The Board received a description of the methodology used by Lipper to select the mutual funds in the Universe. The Board noted that the performance of the Fund was higher than the median performance of the Universe for all periods under review. The Board also noted that, except for the three-year performance results, the performance of the Fund was higher than its benchmark, the Lipper U.S. Government Money Market Funds Index, for the periods under review.
The Board received and considered information regarding the Fund’s contractual advisory fee and net operating expense ratios and their various components, including actual management fees (which reflect fee waivers, if any), transfer agent, custodian and other non-management fees, Rule 12b-1 and non-Rule 12b-1 fees, service fees and fee waiver and expense reimbursement arrangements. The Board also considered these ratios in comparison to the median ratios of an expense Universe and a narrower expense group of mutual funds (each, an “Expense Group”) that was determined by Lipper to be similar to the Fund. The Board received a description of the methodology used by Lipper to select the mutual funds in the Fund’s Expense Group. The Board noted that the net operating expense ratios of the Fund were higher than the Fund’s Expense Group’s median net operating expense ratios, except for the Administrator and Institutional Classes.
Funds Management advised the Board that the Expense Group medians reflected voluntary waivers, whereas the Fund’s expense ratios did not reflect voluntary waivers. The Board noted that when the Fund’s expense ratios were adjusted to reflect voluntary waivers, the Fund’s net operating expense ratios were lower than the median net operating expense ratios of the Expense Group. The Board viewed favorably Funds Management’s proposal to lower the net operating expense cap of the Fund’s Sweep Class by five basis points.
Based on the above-referenced considerations and other factors, the Board concluded that the overall performance and expense structure of the Fund supported the re-approval of the Advisory Agreements for the Fund.
Investment advisory and sub-advisory fee rates
The Board reviewed and considered the contractual investment advisory fee rate that is payable by the Fund to Funds Management for investment advisory services (the “Advisory Agreement Rate”), both on a stand-alone basis and on a combined basis with the Fund’s administration fee rate. The Board took into account the separate administrative and other services covered by the administration fee rate. The Board also reviewed and considered the contractual investment sub-advisory fee rate that is payable by Funds Management to Wells Capital Management for investment sub-advisory services (the “Sub-Advisory Agreement Rate”). In addition, the Board reviewed and considered the existing fee waiver/cap arrangements applicable to the Advisory Agreement Rate and considered the Advisory Agreement Rate after taking the waivers/caps into account (the “Net Advisory Rate”).
The Board received and considered information comparing the Advisory Agreement Rate and Net Advisory Rate, combined with the administration fee rates, with those of other funds in the Fund’s Expense Group median. The Board noted that the Advisory Agreement Rate for the Fund was in range of the median rates for the Fund’s Expense Group, except for the Sweep Class. The Board also noted that the Net Advisory Rate for the Fund was higher than the median rates for the Fund’s Expense Group, except for the Administrator and Institutional Classes. The Board viewed favorably Funds Management’s willingness to voluntarily waive certain fees and its proposal to lower the net operating expense cap for the Sweep Class.
The Board also received and considered information about the nature and extent of services offered and fee rates charged by Funds Management and Wells Capital Management to other types of clients. In this regard, the Board received information about differences between the services, and the compliance, reporting, and other legal burdens and risks of providing investment advice to mutual funds and those associated with providing advice to non-mutual fund clients such as collective funds or institutional separate accounts.
The Board determined that the Advisory Agreement Rate for the Fund, both with and without the administration fee rate and before and after waivers, was reasonable in light of the Fund’s Expense Group information, the net expense ratio commitments, the services covered by the Advisory Agreements and other information provided. The Board also reviewed and considered the Sub-Advisory Agreement Rate and concluded that the Sub-Advisory Agreement Rate was reasonable in light of the services covered by the sub-advisory agreement and other information provided.
| | | | |
| 30 | | Wells Fargo Advantage Government Money Market Fund | | Other Information (Unaudited) |
Profitability
The Board received and considered a profitability analysis of Funds Management, as well as an analysis of the profitability to the collective Wells Fargo businesses that provide services to the Fund. It considered that the information provided to it was necessarily estimated, and that the profitability information provided to it, especially on a fund-by-fund basis, did not necessarily provide a precise tool for evaluating the appropriateness of the Fund’s Advisory Agreement Rate in isolation. It noted that the levels of profitability reported on a fund-by-fund basis varied widely, depending on, among other things, the size and type of fund. The Board noted the impact of voluntary fee waivers on Funds Management’s profitability. The Board concluded that the profitability reported by Funds Management was not unreasonable.
The Board did not consider separate profitability information with respect to Wells Capital Management, because, as an affiliate of Funds Management, its profitability information was subsumed in the collective Wells Fargo profitability analysis provided by Funds Management.
Economies of scale
With respect to possible economies of scale, the Board reviewed the breakpoints in the Fund’s advisory fee and/or administration fee structure, which operate generally to reduce the expenses of the Fund (as a percentage of Fund assets) as the Fund grows in size. It considered that, as a fund shrinks in size, breakpoints conversely result in increasing fee levels. The Board noted that it would have on-going opportunities to review the appropriate levels of breakpoints in the future, and concluded that the breakpoints as implemented appeared to be a reasonable step toward sharing economies of scale, if any, with the Fund. However, the Board acknowledged the inherent limitations of any analysis of economies of scale and of any attempt to correlate breakpoints with such economies, stemming largely from the Board’s understanding that economies of scale are realized, if at all, across a variety of products and services, not just with respect to a single fund.
Other benefits to Funds Management and Wells Capital Management
The Board received and considered information regarding potential “fall-out” or ancillary benefits received by Funds Management and its affiliates, including Wells Capital Management, as a result of their relationship with the Fund. Ancillary benefits could include, among others, benefits directly attributable to the relationship of Funds Management and Wells Capital Management with the Fund and benefits potentially derived from an increase in Funds Management’s and Wells Capital Management’s business as a result of their relationship with the Fund (such as the ability to market to shareholders other financial products offered by Funds Management and its affiliates, including Wells Capital Management).
The Board considered that Wells Fargo Funds Distributor, LLC, an affiliate of Funds Management, serves as distributor to the Fund and receives certain compensation for those services. The Board noted that various financial institutions, including affiliates of Funds Management, may receive distribution-related fees, shareholder servicing payments (including amounts derived from payments under Rule 12b-1 plans) and sub-transfer agency fees in respect of shares sold or held through them and services provided.
The Board also reviewed information about whether and to what extent soft dollar credits are sought and how any such credits are utilized and any benefits that may be realized by using an affiliated broker.
Other factors and broader review
The Board also considered the markets for distribution of the Fund’s shares, including the channels through which the Fund’s shares are offered and sold. The Board noted that the Fund is part of one of the few fund families that have both direct-to-fund and intermediary distribution channels. As discussed above, the Board reviews detailed materials received from Funds Management and Wells Capital Management annually as part of the re-approval process under Section 15 of the 1940 Act and also reviews and assesses information about the quality of the services that the Fund receives throughout the year. In this regard, the Board has reviewed reports of Funds Management at each of its quarterly meetings, which include, among other things, portfolio reviews and performance reports. In addition, the Board confers with portfolio managers at various times throughout the year.
Conclusion
After considering the above-described factors and based on its deliberations and its evaluation of the information described above, the Board unanimously approved the continuation of the Advisory Agreements for an additional one-year period.
| | | | | | |
| List of Abbreviations | | Wells Fargo Advantage Government Money Market Fund | | | 31 | |
The following is a list of common abbreviations for terms and entities which may have appeared in this report.
| ACB | — Agricultural Credit Bank |
| ADR | — American Depository Receipt |
| ADS | — American Depository Shares |
| AGC-ICC | — Assured Guaranty Corporation - Insured Custody Certificates |
| AGM | — Assured Guaranty Municipal |
| AMBAC | — American Municipal Bond Assurance Corporation |
| AMT | — Alternative Minimum Tax |
| BAN | — Bond Anticipation Notes |
| BHAC | — Berkshire Hathaway Assurance Corporation |
| CAB | — Capital Appreciation Bond |
| CCAB | — Convertible Capital Appreciation Bond |
| CDA | — Community Development Authority |
| CDO | — Collateralized Debt Obligation |
| COP | — Certificate of Participation |
| DRIVER | — Derivative Inverse Tax-Exempt Receipts |
| DW&P | — Department of Water & Power |
| DWR | — Department of Water Resources |
| ECFA | — Educational & Cultural Facilities Authority |
| EDA | — Economic Development Authority |
| EDFA | — Economic Development Finance Authority |
| ETF | — Exchange-Traded Fund |
| FFCB | — Federal Farm Credit Bank |
| FGIC | — Financial Guaranty Insurance Corporation |
| FGLMC | — Federal Government Loan Mortgage Company |
| FHA | — Federal Housing Authority |
| FHLB | — Federal Home Loan Bank |
| FHLMC | — Federal Home Loan Mortgage Corporation |
| FICO | — The Financing Corporation |
| FNMA | — Federal National Mortgage Association |
| GDR | — Global Depository Receipt |
| GNMA | — Government National Mortgage Association |
| HCFR | — Healthcare Facilities Revenue |
| HEFA | — Health & Educational Facilities Authority |
| HEFAR | — Higher Education Facilities Authority Revenue |
| HFA | — Housing Finance Authority |
| HFFA | — Health Facilities Financing Authority |
| IBC | — Insured Bond Certificate |
| IDA | — Industrial Development Authority |
| IDAG | — Industrial Development Agency |
| IDR | — Industrial Development Revenue |
| KRW | — Republic of Korea Won |
| LIBOR | — London Interbank Offered Rate |
| LLC | — Limited Liability Company |
| LLP | — Limited Liability Partnership |
| MBIA | — Municipal Bond Insurance Association |
| MFHR | — Multi-Family Housing Revenue |
| MSTR | — Municipal Securities Trust Receipts |
| MUD | — Municipal Utility District |
| NATL-RE | — National Public Finance Guarantee Corporation |
| PCFA | — Pollution Control Finance Authority |
| PCR | — Pollution Control Revenue |
| PFA | — Public Finance Authority |
| PFFA | — Public Facilities Financing Authority |
| PFOTER | — Puttable Floating Option Tax-Exempt Receipts |
| plc | — Public Limited Company |
| PUTTER | — Puttable Tax-Exempt Receipts |
| R&D | — Research & Development |
| RDA | — Redevelopment Authority |
| RDFA | — Redevelopment Finance Authority |
| REIT | — Real Estate Investment Trust |
| ROC | — Reset Option Certificates |
| SAVRS | — Select Auction Variable Rate Securities |
| SBA | — Small Business Authority |
| SFHR | — Single Family Housing Revenue |
| SFMR | — Single Family Mortgage Revenue |
| SPA | — Standby Purchase Agreement |
| SPDR | — Standard & Poor’s Depositary Receipts |
| STRIPS | — Separate Trading of Registered Interest and Principal Securities |
| TAN | — Tax Anticipation Notes |
| TIPS | — Treasury Inflation-Protected Securities |
| TRAN | — Tax Revenue Anticipation Notes |
| TCR | — Transferable Custody Receipts |
| TTFA | — Transportation Trust Fund Authority |
| TVA | — Tennessee Valley Authority |
| XLCA | — XL Capital Assurance |
This page is intentionally left blank.
This page is intentionally left blank.
This page is intentionally left blank.


FOR MORE INFORMATION
More information about Wells Fargo Advantage Funds is available free upon request. To obtain literature, please write, e-mail, visit the Fund’s Web site, or call:
Wells Fargo Advantage Funds
P.O. Box 8266
Boston, MA 02266-8266
E-mail: wfaf@wellsfargo.com
Web site: wellsfargoadvantagefunds.com
Individual investors: 1-800-222-8222
Retail investment professionals: 1-888-877-9275
Institutional investment professionals: 1-866-765-0778
This report and the financial statements contained herein are submitted for the general information of the shareholders of Wells Fargo Advantage Funds. If this report is used for promotional purposes, distribution of the report must be accompanied or preceded by a current prospectus. For a current prospectus and, if available, a summary prospectus containing more complete information, including charges and expenses, call 1-800-222-8222 or visit the Fund’s Web site at wellsfargoadvantagefunds.com. Please consider the investment objectives, risks, charges, and expenses of the investment carefully before investing. This and other information about Wells Fargo Advantage Funds can be found in the current prospectus. Read the prospectus carefully before you invest or send money.
Wells Fargo Funds Management, LLC, a wholly owned subsidiary of Wells Fargo & Company, provides investment advisory and administrative services for Wells Fargo Advantage Funds. Other affiliates of Wells Fargo & Company provide subadvisory and other services for the Funds. The Funds are distributed by Wells Fargo Funds Distributor, LLC, Member FINRA/SIPC, an affiliate of Wells Fargo & Company.
NOT FDIC INSURED ¡ NO BANK GUARANTEE ¡ MAY LOSE VALUE
© 2012 Wells Fargo Funds Management, LLC. All rights reserved.
| | |
 | | 211388 09-12 SA303/SAR303 07-12 |

Wells Fargo Advantage
Heritage Money Market FundSM

Semi-Annual Report
July 31, 2012

Reduce clutter. Save trees.
Sign up for electronic delivery of prospectuses and shareholder reports at wellsfargo.com/advantagedelivery
Contents
The views expressed and any forward-looking statements are as of July 31, 2012, unless otherwise noted, and are those of the Fund managers and/or Wells Fargo Funds Management, LLC. Discussions of individual securities, or the markets generally, or any Wells Fargo Advantage Fund are not intended as individual recommendations. Future events or results may vary significantly from those expressed in any forward-looking statements; the views expressed are subject to change at any time in response to changing circumstances in the market. Wells Fargo Funds Management, LLC, disclaims any obligation to publicly update or revise any views expressed or forward-looking statements.
NOT FDIC INSURED ¡ NO BANK GUARANTEE ¡ MAY LOSE VALUE

WELLS FARGO INVESTMENT HISTORY
| | |
| |
| 1932 | | Keystone creates one of the first mutual fund families. |
| |
| 1971 | | Wells Fargo & Company introduces one of the first institutional index funds. |
| |
| 1978 | | Wells Fargo applies Markowitz and Sharpe’s research on Modern Portfolio Theory to introduce one of the industry’s first Tactical Asset Allocation (TAA) models in institutional separately managed accounts. |
| |
| 1984 | | Wells Fargo Stagecoach Funds launches its first asset allocation fund. |
| |
| 1989 | | The Tactical Asset Allocation (TAA) Model is first applied to Wells Fargo’s asset allocation mutual funds. |
| |
| 1994 | | Wells Fargo introduces the LifePath Funds, one of the first suites of target date funds (now the Wells Fargo Advantage Dow Jones Target Date FundsSM). |
| |
| 1996 | | Evergreen Investments and Keystone Funds merge. |
| |
| 1997 | | Wells Fargo launches Wells Fargo Advantage WealthBuilder PortfoliosSM, a fund-of-funds suite of products that includes the use of quantitative models to shift assets among investment styles. |
| |
| 1999 | | Norwest Advantage Funds and Stagecoach Funds are reorganized into Wells Fargo Funds after the merger of Norwest and Wells Fargo. |
| |
| 2002 | | Evergreen Retail and Evergreen Institutional companies form the umbrella asset management company, Evergreen Investments. |
| |
| 2005 | | The integration of Strong Funds with Wells Fargo Funds creates Wells Fargo Advantage Funds, resulting in one of the top 20 mutual fund companies in the United States. |
| |
| 2006 | | Wells Fargo Advantage Funds relaunches the target date product line as Wells Fargo Advantage Dow Jones Target Date Funds. |
| |
| 2010 | | The mergers and reorganizations of Evergreen and Wells Fargo Advantage mutual funds are completed, unifying the families under the brand of Wells Fargo Advantage Funds. |
Wells Fargo Advantage Funds®
Wells Fargo Advantage Funds skillfully guides institutions, financial advisors, and individuals through the investment terrain to help them reach their financial objectives. Everything we do on behalf of investors is backed by our unique combination of qualifications.
Strength
Our organization is built on the standards of integrity and service established by our parent company—Wells Fargo & Company—more than 150 years ago. And, because we’re part of a highly diversified financial enterprise, we offer the depth of resources to help investors succeed.
Expertise
Our multi-boutique model offers investors access to the independent thinking of premier investment managers that have been chosen for their time-tested strategies. While each team specializes in a specific investment strategy, collectively they provide investors a wide choice of distinct investment styles. Our dedication to investment excellence doesn’t end with our expertise in manager selection—risk management, analysis, and rigorous ongoing review seek to ensure each manager’s investment process remains consistent.
Partnership
Our collaborative approach is built around understanding the needs and goals of our clients. By adhering to core principles of sound judgment and steady guidance, we support you through every stage of the investment decision process.
Carefully consider a fund’s investment objectives, risks, charges, and expenses before investing. For a current prospectus and, if available, a summary prospectus, containing this and other information, visit wellsfargoadvantagefunds.com. Read it carefully before investing.
Wells Fargo Funds Management, LLC, a wholly owned subsidiary of Wells Fargo & Company, provides investment advisory and administrative services for Wells Fargo Advantage Funds®. Other affiliates of Wells Fargo & Company provide subadvisory and other services for the Funds. The Funds are distributed by Wells Fargo Funds Distributor, LLC, Member FINRA/SIPC, an affiliate of Wells Fargo & Company.
“Dow Jones®” and “Dow Jones Target Date IndexesSM” are service marks of Dow Jones Trademark Holdings, LLC (“Dow Jones”), have been licensed to CME Group Index Services LLC (“CME Indexes”) and have been sublicensed for use for certain purposes by Global Index Advisors, Inc, and Wells Fargo Funds Management, LLC. The Wells Fargo Advantage Dow Jones Target Date FundsSM based on the Dow Jones Target Date IndexesSM, are not sponsored, endorsed, sold or promoted by Dow Jones, CME Indexes or their respective affiliates and none of them makes any representation regarding the advisability of investing in such product(s).
NOT FDIC INSURED ¡ NO BANK GUARANTEE ¡ MAY LOSE VALUE
Not part of the semi-annual report.
Wells Fargo Advantage Funds offers more than 110 mutual funds across a wide range of asset classes, representing over $209 billion in assets under management, as of July 31, 2012.
| | | | |
| Equity Funds | | | | |
Asia Pacific Fund | | Enterprise Fund† | | Opportunity Fund† |
C&B Large Cap Value Fund | | Equity Value Fund | | Precious Metals Fund |
C&B Mid Cap Value Fund | | Global Opportunities Fund | | Premier Large Company Growth Fund |
Capital Growth Fund | | Growth Fund | | Small Cap Opportunities Fund |
Common Stock Fund | | Index Fund | | Small Cap Value Fund |
Disciplined U.S. Core Fund | | International Equity Fund | | Small Company Growth Fund |
Discovery Fund† | | International Value Fund | | Small Company Value Fund |
Diversified Equity Fund | | Intrinsic Small Cap Value Fund | | Small/Mid Cap Core Fund |
Diversified International Fund | | Intrinsic Value Fund | | Small/Mid Cap Value Fund |
Diversified Small Cap Fund | | Intrinsic World Equity Fund | | Special Mid Cap Value Fund |
Emerging Growth Fund | | Large Cap Core Fund | | Special Small Cap Value Fund |
Emerging Markets Equity Fund | | Large Cap Growth Fund | | Specialized Technology Fund |
Emerging Markets Equity Income Fund | | Large Company Value Fund | | Traditional Small Cap Growth Fund |
Endeavor Select Fund† | | Omega Growth Fund | | Utility and Telecommunications Fund |
| Bond Funds | | | | |
Adjustable Rate Government Fund | | Inflation-Protected Bond Fund | | Short-Term Bond Fund |
California Limited-Term Tax-Free Fund | | Intermediate Tax/AMT-Free Fund | | Short-Term High Yield Bond Fund |
California Tax-Free Fund | | International Bond Fund | | Short-Term Municipal Bond Fund |
Colorado Tax-Free Fund | | Minnesota Tax-Free Fund | | Strategic Municipal Bond Fund |
Emerging Markets Local Bond Fund | | Municipal Bond Fund | | Total Return Bond Fund |
Government Securities Fund | | North Carolina Tax-Free Fund | | Ultra Short-Term Income Fund |
High Income Fund | | Pennsylvania Tax-Free Fund | | Ultra Short-Term Municipal Income Fund |
High Yield Bond Fund | | Short Duration Government Bond Fund | | Wisconsin Tax-Free Fund |
Income Plus Fund | | | | |
| Asset Allocation Funds | | | | |
Absolute Return Fund | | WealthBuilder Equity Portfolio† | | Target 2020 Fund† |
Asset Allocation Fund | | WealthBuilder Growth Allocation Portfolio† | | Target 2025 Fund† |
Conservative Allocation Fund | | WealthBuilder Growth Balanced Portfolio† | | Target 2030 Fund† |
Diversified Capital Builder Fund | | WealthBuilder Moderate Balanced Portfolio† | | Target 2035 Fund† |
Diversified Income Builder Fund | | WealthBuilder Tactical Equity Portfolio† | | Target 2040 Fund† |
Growth Balanced Fund | | Target Today Fund† | | Target 2045 Fund† |
Index Asset Allocation Fund | | Target 2010 Fund† | | Target 2050 Fund† |
Moderate Balanced Fund | | Target 2015 Fund† | | Target 2055 Fund† |
WealthBuilder Conservative Allocation Portfolio† | | | | |
| Money Market Funds | | | | |
100% Treasury Money Market Fund | | Heritage Money Market Fund† | | National Tax-Free Money Market Fund |
California Municipal Money Market Fund | | Money Market Fund | | Prime Investment Money Market Fund |
Cash Investment Money Market Fund | | Municipal Cash Management Money Market Fund | | Treasury Plus Money Market Fund |
Government Money Market Fund | | Municipal Money Market Fund | | |
| Variable Trust Funds1 | | | | |
VT Discovery Fund† | | VT Intrinsic Value Fund | | VT Small Cap Growth Fund |
VT Index Asset Allocation Fund | | VT Omega Growth Fund | | VT Small Cap Value Fund |
VT International Equity Fund | | VT Opportunity Fund† | | VT Total Return Bond Fund |
An investment in a money market fund is not insured or guaranteed by the Federal Deposit Insurance Corporation or any other government agency. Although the Wells Fargo Advantage Money Market Funds seek to preserve the value of your investment at $1.00 per share, it is possible to lose money by investing in a money market fund.
| 1. | The Variable Trust Funds are generally available only through insurance company variable contracts. |
| † | In this report, the Wells Fargo Advantage Discovery FundSM, Wells Fargo Advantage Endeavor Select FundSM, Wells Fargo Advantage Enterprise FundSM, Wells Fargo Advantage Opportunity FundSM, Wells Fargo Advantage WealthBuilder Conservative Allocation PortfolioSM, Wells Fargo Advantage WealthBuilder Equity PortfolioSM, Wells Fargo Advantage WealthBuilder Growth Allocation PortfolioSM, Wells Fargo Advantage WealthBuilder Growth Balanced PortfolioSM, Wells Fargo Advantage WealthBuilder Moderate Balanced PortfolioSM, Wells Fargo Advantage WealthBuilder Tactical Equity PortfolioSM, Wells Fargo Advantage Dow Jones Target Today FundSM, Wells Fargo Advantage Dow Jones Target 2010 FundSM, Wells Fargo Advantage Dow Jones Target 2015 FundSM, Wells Fargo Advantage Dow Jones Target 2020 FundSM, Wells Fargo Advantage Dow Jones Target 2025 FundSM, Wells Fargo Advantage Dow Jones Target 2030 FundSM, Wells Fargo Advantage Dow Jones Target 2035 FundSM, Wells Fargo Advantage Dow Jones Target 2040 FundSM, Wells Fargo Advantage Dow Jones Target 2045 FundSM, Wells Fargo Advantage Dow Jones Target 2050 FundSM, Wells Fargo Advantage Dow Jones Target 2055 FundSM, Wells Fargo Advantage Heritage Money Market FundSM, Wells Fargo Advantage VT Discovery FundSM, and Wells Fargo Advantage VT Opportunity FundSM are referred to as the Discovery Fund, Endeavor Select Fund, Enterprise Fund, Opportunity Fund, WealthBuilder Conservative Allocation Portfolio, WealthBuilder Equity Portfolio, WealthBuilder Growth Allocation Portfolio, WealthBuilder Growth Balanced Portfolio, WealthBuilder Moderate Balanced Portfolio, WealthBuilder Tactical Equity Portfolio, Target Today Fund, Target 2010 Fund, Target 2015 Fund, Target 2020 Fund, Target 2025 Fund, Target 2030 Fund, Target 2035 Fund, Target 2040 Fund, Target 2045 Fund, Target 2050 Fund, Target 2055 Fund, Heritage Money Market Fund, VT Discovery Fund, and VT Opportunity Fund, respectively. |
Not part of the semi-annual report.
| | | | |
| 2 | | Wells Fargo Advantage Heritage Money Market Fund | | Letter to Shareholders (Unaudited) |

Karla M. Rabusch,
President
Wells Fargo Advantage Funds
Not only has the Fed been successful in engineering low interest rates, but investors have rushed to buy U.S. Treasury securities as a safe-haven asset in the midst of uncertainty surrounding the European debt crisis. As a result, interest rates reached record lows.
Dear Valued Shareholder:
We’re pleased to offer you this semi-annual report for the Wells Fargo Advantage Heritage Money Market Fund for the six-month period that ended July 31, 2012.
The economy grew, but the recovery has been modest.
The U.S. is three years into a modest economic recovery, with second-quarter real gross domestic product (GDP) increasing 1.5% on an annualized basis. Several factors, however, held back growth despite the Federal Reserve’s (Fed) accommodative monetary policy. In Europe, much uncertainty remained about the outcome of the eurozone debt crisis and whether policymakers will be able to resolve it without any countries defaulting or leaving the euro. In addition, Europe has again entered a recession. In Asia, China’s economy slowed. Here at home, a potential “fiscal cliff”—automatic tax increases alongside automatic budget cuts stemming from a legislative compromise in Congress—added uncertainty and, if unaddressed, could negatively affect GDP beginning in 2013.
In an effort to further bolster the economy, especially the labor market, the Fed has indicated its commitment to maintaining a highly accommodative monetary policy. It has indicated its belief that economic conditions warrant an extremely low federal funds target rate—a short-term bank lending rate—near 0%, at least through late 2014. The Fed also continued its “Operation Twist,” which involves buying U.S. Treasury securities with maturities of greater than six years and selling U.S. Treasury securities with maturities of less than three years, in an effort to keep longer-term interest rates low.
A demand for relative safe-haven securities led to ultra-low interest rates.
Not only has the Fed been successful in engineering low interest rates, but investors have rushed to buy U.S. Treasury securities as a relative safe-haven asset in the midst of uncertainty surrounding the European debt crisis. As a result, interest rates reached record lows. Ten-year U.S. Treasury yields ranged between 2.38% and 1.38% over the past six months. Three-month U.S. Treasury bills had an average yield of 10 basis points (bps; 100 bps is 1.00%) over the past six months. Rates on seven-day commercial paper, a common investment type for prime money market funds, were 12 bps on July 31, 2012.
Lack of supply kept a lid on yields, and regulatory uncertainty remained.
Continued demand for a limited supply of money market-eligible securities also contributed to low yields. We estimate that the amount outstanding of short-term, money market fund-eligible securities (excluding U.S. Treasury securities) has declined by $3 trillion, or more than a 30% decrease, since 2008. Reasons for this decrease in supply include issuers opting to lock in rates on long-term rather than short-term debt, less need for financing as many companies have plentiful cash given record profits, and credit downgrades that have resulted in fewer firms with top credit ratings.
The Chairman of the Securities and Exchange Commission (SEC) indicated in late August that the SEC has determined at this time not to propose certain amendments to the rules governing money market funds. However, the Financial Stability Oversight Council or other financial regulators could still take steps to impose additional regulations on money market funds.
| | | | | | |
| Letter to Shareholders (Unaudited) | | Wells Fargo Advantage Heritage Money Market Fund | | | 3 | |
As we gain clarity in the coming months regarding any potential changes to regulation of money market funds, we will provide further communications to our clients about these changes.
Amid the current challenges of investing—low yields, an unresolved eurozone crisis, limited supply, and regulatory uncertainty—has been the opportunity to provide our clients an important investment option for meeting their short-term cash needs. Our focus on preservation of capital and liquidity is not a marketing phrase but rather the basis of our investment philosophy as we manage money market funds in an uncertain world. We are proud of our comprehensive lineup of prime, government, and tax-exempt money market funds.
Thank you for choosing to invest with Wells Fargo Advantage Funds. We appreciate your confidence in us and remain committed to helping you meet your financial needs. For current information about your fund investments, contact your investment professional, visit our Web site at wellsfargoadvantagefunds.com, or call us directly at 1-800-222-8222. We are available 24 hours a day, 7 days a week.
Sincerely,

Karla M. Rabusch
President
Wells Fargo Advantage Funds
Amid the current challenges of investing—low yields, an unresolved eurozone crisis, limited supply, and regulatory uncertainty—has been the opportunity to provide our clients an important investment option for meeting their short-term cash needs.
| | | | |
| 4 | | Wells Fargo Advantage Heritage Money Market Fund | | Performance Highlights (Unaudited) |
INVESTMENT OBJECTIVE
The Fund seeks current income, while preserving capital and liquidity.
ADVISER
Wells Fargo Funds Management, LLC
SUB-ADVISER
Wells Capital Management Incorporated
PORTFOLIO MANAGERS
David D. Sylvester
Laurie White
FUND INCEPTION
June 29, 1995
| | |
PORTFOLIO COMPOSITION1 (AS OF JULY 31, 2012) |
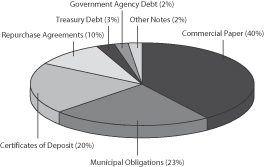
| | |
|
EFFECTIVE MATURITY DISTRIBUTION2 (AS OF JULY 31, 2012) |
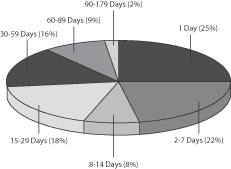 |
|
WEIGHTED AVERAGE MATURITY3 (AS OF JULY 31, 2012) |
23 Days |
|
WEIGHTED AVERAGE FINAL MATURITY4 (AS OF JULY 31, 2012) |
42 Days |
| 1. | Portfolio composition is subject to change and is calculated based on the total investments of the Fund. |
| 2. | Effective maturity distribution is subject to change and is calculated based on the total investments of the Fund. |
| 3. | Weighted Average Maturity (WAM): WAM is an average of the effective maturities of all securities held in the portfolio, weighted by each security’s percentage of total investments. The maturity of a portfolio security is the period remaining until the date on which the principal amount is unconditionally required to be paid, or in the case of a security called for redemption, the date on which the redemption payment is unconditionally required to be made. WAM calculations allow for the maturities of certain securities with demand features or periodic interest rate resets to be shortened. WAM is a way to measure a fund’s sensitivity to potential interest rate changes. |
| 4. | Weighted Average Final Maturity (WAFM): WAFM is an average of the final maturities of all securities held in the portfolio, weighted by their percentage of total investments. The maturity of a portfolio security is the period remaining until the date on which the principal amount is unconditionally required to be paid, or in the case of a security called for redemption, the date on which the redemption payment is unconditionally required to be made. In contrast to WAM, the calculation of WAFM allows for the maturities of certain securities with demand features to be shortened, but not the periodic interest rate resets. WAFM is a way to measure a fund’s potential sensitivity to credit spread changes. |
| | | | | | |
| Performance Highlights (Unaudited) | | Wells Fargo Advantage Heritage Money Market Fund | | | 5 | |
AVERAGE ANNUAL TOTAL RETURN5 (%) (AS OF JULY 31, 2012)
| | | | | | | | | | | | | | | | | | | | | | | | | | | | |
| | | | | | | | | Expense Ratios6 | |
| | | Inception Date | | | 6 Months* | | | 1 Year | | | 5 Year | | | 10 Year | | | Gross | | | Net7 | |
Administrator Class (SHMXX) | | | 06/29/1995 | | | | 0.00 | | | | 0.01 | | | | 1.03 | | | | 1.81 | | | | 0.34% | | | | 0.34% | |
Institutional Class (SHIXX) | | | 03/31/2000 | | | | 0.02 | | | | 0.03 | | | | 1.12 | | | | 1.97 | | | | 0.22% | | | | 0.20% | |
Select Class (WFJXX) | | | 06/29/2007 | | | | 0.05 | | | | 0.10 | | | | 1.19 | | | | 2.00 | | | | 0.18% | | | | 0.13% | |
Service Class (WHTXX)** | | | 06/30/2010 | | | | 0.00 | | | | 0.01 | | | | 1.03 | | | | 1.81 | | | | 0.51% | | | | 0.43% | |
| * | Returns for periods of less than one year are not annualized. |
| ** | Service Class shares are closed to new investors. |
| | | | | | | | | | | | | | | | |
FUND YIELD SUMMARY7
(AS OF JULY 31, 2012) | | Administrator Class | | | Institutional Class | | | Select Class | | | Service Class | |
7-Day Current Yield | | | 0.01% | | | | 0.07% | | | | 0.14% | | | | 0.01% | |
7-Day Compound Yield | | | 0.01% | | | | 0.07% | | | | 0.14% | | | | 0.01% | |
30-Day Simple Yield | | | 0.01% | | | | 0.07% | | | | 0.14% | | | | 0.01% | |
30-Day Compound Yield | | | 0.01% | | | | 0.07% | | | | 0.14% | | | | 0.01% | |
Figures quoted represent past performance, which is no guarantee of future results and do not reflect the deduction of taxes that a shareholder may pay on fund distributions or the redemption of fund shares. Investment returns will fluctuate. The Fund’s yield figures more closely reflect the current earnings of the Fund than the total return figures. Current performance may be lower or higher than the performance data quoted and assumes the reinvestment of dividends and capital gains. Current month-end performance is available at the Fund’s Web site – wellsfargoadvantagefunds.com.
Each class is sold without a front-end sales charge or contingent deferred sales charge. Other fees and expenses apply to an investment in the Fund and are described in the Fund’s current prospectuses.
An investment in a money market fund is not insured or guaranteed by the Federal Deposit Insurance Corporation or any other government agency. Although the Fund seeks to preserve the value of your investment at $1.00 per share, it is possible to lose money by investing in a money market fund.
| 5. | Historical performance shown for the Select Class shares prior to their inception reflects the performance of the Institutional Class shares, and includes the higher expenses applicable to Institutional Class shares. If these expenses had not been included, returns would be higher. Historical performance shown for the Service Class shares prior to their inception reflects the performance of the Administrator Class shares and has not been adjusted to reflect the higher expenses applicable to the Service Class shares. If these expenses had been adjusted, returns would be lower. |
| 6. | Reflects the expense ratios as stated in the most recent prospectuses. |
| 7. | The Adviser has committed through July 11, 2013 to waive fees and/or reimburse expenses to the extent necessary to cap the Fund’s Total Annual Fund Operating Expenses After Fee Waiver, excluding certain expenses, at 0.35% for Administrator Class, 0.20% for Institutional Class, 0.13% for Select Class and 0.43% for Service Class. Brokerage commissions, stamp duty fees, interest, taxes, acquired fund fees and expenses and extraordinary expenses are excluded from the cap. Without this cap, the Fund’s returns would have been lower. Without waived fees and/or reimbursed expenses, the Fund’s 7-day current yield would have been (0.07%), 0.05%, 0.09% and (0.24%) for Administrator Class, Institutional Class, Select Class and Service Class, respectively. |
| | | | |
| 6 | | Wells Fargo Advantage Heritage Money Market Fund | | Fund Expenses (Unaudited) |
As a shareholder of the Fund, you incur ongoing costs, including management fees, shareholder service fees, and other Fund expenses. This example is intended to help you understand your ongoing costs (in dollars) of investing in the Fund and to compare these costs with the ongoing costs of investing in other mutual funds.
The example is based on an investment of $1,000 invested at the beginning of the six-month period and held for the entire period from February 1, 2012 to July 31, 2012.
Actual Expenses
The “Actual” line of the table below provides information about actual account values and actual expenses. You may use the information in this line, together with the amount you invested, to estimate the expenses that you paid over the period. Simply divide your account value by $1,000 (for example, an $8,600 account value divided by $1,000 = 8.6), then multiply the result by the number in the “Actual” line under the heading entitled “Expenses Paid During Period” for your applicable class of shares to estimate the expenses you paid on your account during this period.
Hypothetical Example for Comparison Purposes
The “Hypothetical” line of the table below provides information about hypothetical account values and hypothetical expenses based on the Fund’s actual expense ratio and an assumed rate of return of 5% per year before expenses, which is not the Fund’s actual return. The hypothetical account values and expenses may not be used to estimate the actual ending account balance or expenses you paid for the period. You may use this information to compare the ongoing costs of investing in the Fund and other funds. To do so, compare this 5% hypothetical example with the 5% hypothetical examples that appear in the shareholder reports of the other funds.
Please note that the expenses shown in the table are meant to highlight your ongoing costs only. Therefore, the “Hypothetical” line of the table is useful in comparing ongoing costs only, and will not help you determine the relative total costs of owning different funds.
| | | | | | | | | | | | | | | | |
| | | Beginning
Account Value
02-01-2012 | | | Ending
Account Value
07-31-2012 | | | Expenses
Paid During
the Period1 | | | Net Annual
Expense Ratio | |
Administrator Class | | | | | | | | | | | | | | | | |
Actual | | $ | 1,000.00 | | | $ | 1,000.05 | | | $ | 1.09 | | | | 0.22 | % |
Hypothetical (5% return before expenses) | | $ | 1,000.00 | | | $ | 1,023.77 | | | $ | 1.11 | | | | 0.22 | % |
Institutional Class | | | | | | | | | | | | | | | | |
Actual | | $ | 1,000.00 | | | $ | 1,000.15 | | | $ | 0.99 | | | | 0.20 | % |
Hypothetical (5% return before expenses) | | $ | 1,000.00 | | | $ | 1,023.87 | | | $ | 1.01 | | | | 0.20 | % |
Select Class | | | | | | | | | | | | | | | | |
Actual | | $ | 1,000.00 | | | $ | 1,000.49 | | | $ | 0.65 | | | | 0.13 | % |
Hypothetical (5% return before expenses) | | $ | 1,000.00 | | | $ | 1,024.22 | | | $ | 0.65 | | | | 0.13 | % |
Service Class | | | | | | | | | | | | | | | | |
Actual | | $ | 1,000.00 | | | $ | 1,000.05 | | | $ | 1.09 | | | | 0.22 | % |
Hypothetical (5% return before expenses) | | $ | 1,000.00 | | | $ | 1,023.77 | | | $ | 1.11 | | | | 0.22 | % |
| 1. | Expenses paid is equal to the annualized expense ratio of each class multiplied by the average account value over the period, multiplied by the number of days in the most recent fiscal half-year divided by the number of days in the fiscal year (to reflect the one-half year period). |
| | | | | | |
| Portfolio of Investments—July 31, 2012 (Unaudited) | | Wells Fargo Advantage Heritage Money Market Fund | | | 7 | |
| | | | | | | | | | | | | | | | |
| Security Name | | Interest Rate | | | Maturity Date | | | Principal | | | Value | |
| | | | | | | | | | | | | | | | |
| | | | |
Certificates of Deposit : 20.06% | | | | | | | | | | | | | | | | |
Banco Del Estado De Chile | | | 0.27 | % | | | 08/13/2012 | | | $ | 57,000,000 | | | $ | 57,000,000 | |
Banco Del Estado De Chile | | | 0.44 | | | | 08/08/2012 | | | | 72,000,000 | | | | 72,000,000 | |
Bank of Montreal | | | 0.19 | | | | 08/01/2012 | | | | 175,000,000 | | | | 175,000,000 | |
Bank of Montreal | | | 0.20 | | | | 08/20/2012 | | | | 52,000,000 | | | | 51,999,863 | |
Bank of Montreal | | | 0.21 | | | | 08/21/2012 | | | | 74,000,000 | | | | 74,000,000 | |
Bank of Montreal | | | 0.23 | | | | 09/20/2012 | | | | 92,000,000 | | | | 92,000,000 | |
Bank of Nova Scotia | | | 0.21 | | | | 09/12/2012 | | | | 22,000,000 | | | | 22,000,000 | |
Bank of Nova Scotia ± | | | 0.30 | | | | 10/18/2012 | | | | 53,000,000 | | | | 53,000,000 | |
Bank of Nova Scotia | | | 0.72 | | | | 08/09/2012 | | | | 13,000,000 | | | | 13,001,415 | |
Bank of Tokyo-Mitsubishi LLC | | | 0.18 | | | | 08/06/2012 | | | | 197,000,000 | | | | 197,000,000 | |
Bank of Tokyo-Mitsubishi LLC | | | 0.19 | | | | 08/24/2012 | | | | 100,000,000 | | | | 100,000,000 | |
Bank of Tokyo-Mitsubishi LLC | | | 0.19 | | | | 08/29/2012 | | | | 79,000,000 | | | | 79,000,000 | |
Bank of Tokyo-Mitsubishi LLC | | | 0.35 | | | | 08/03/2012 | | | | 50,000,000 | | | | 50,000,416 | |
Barclays Bank plc ± | | | 0.92 | | | | 03/15/2013 | | | | 242,000,000 | | | | 242,000,000 | |
Canadian Imperial Bank ± | | | 0.77 | | | | 06/03/2013 | | | | 21,000,000 | | | | 21,054,508 | |
Citibank NA | | | 0.52 | | | | 08/09/2012 | | | | 130,000,000 | | | | 130,000,000 | |
Citibank NA | | | 0.52 | | | | 08/13/2012 | | | | 91,000,000 | | | | 91,000,000 | |
DNB Nor Bank ASA | | | 0.31 | | | | 09/13/2012 | | | | 103,000,000 | | | | 103,000,000 | |
National Australia Bank Limited ± | | | 0.35 | | | | 08/16/2012 | | | | 40,000,000 | | | | 40,002,812 | |
National Australia Bank Limited | | | 0.40 | | | | 08/21/2012 | | | | 111,000,000 | | | | 111,012,310 | |
National Bank of Kuwait | | | 0.18 | | | | 08/01/2012 | | | | 157,000,000 | | | | 157,000,000 | |
Nordea Bank plc | | | 0.87 | | | | 09/13/2012 | | | | 106,000,000 | | | | 106,012,818 | |
Norinchukin Bank | | | 0.17 | | | | 08/03/2012 | | | | 207,000,000 | | | | 207,000,000 | |
Norinchukin Bank | | | 0.20 | | | | 08/24/2012 | | | | 100,000,000 | | | | 100,000,000 | |
Oversea-Chinese Banking Corporation Limited | | | 0.20 | | | | 08/02/2012 | | | | 30,000,000 | | | | 30,000,000 | |
Oversea-Chinese Banking Corporation Limited | | | 0.23 | | | | 09/05/2012 | | | | 15,000,000 | | | | 15,000,000 | |
Oversea-Chinese Banking Corporation Limited | | | 0.25 | | | | 08/02/2012 | | | | 44,000,000 | | | | 44,000,000 | |
Oversea-Chinese Banking Corporation Limited | | | 0.26 | | | | 09/04/2012 | | | | 56,000,000 | | | | 56,000,000 | |
Oversea-Chinese Banking Corporation Limited | | | 0.26 | | | | 09/24/2012 | | | | 20,000,000 | | | | 19,999,999 | |
Oversea-Chinese Banking Corporation Limited | | | 0.27 | | | | 09/28/2012 | | | | 31,500,000 | | | | 31,500,000 | |
Royal Bank of Canada ± | | | 0.50 | | | | 07/26/2013 | | | | 128,000,000 | | | | 128,000,000 | |
Royal Bank of Canada ± | | | 0.74 | | | | 12/17/2012 | | | | 116,000,000 | | | | 116,000,000 | |
Skandinaviska Enskilda Banken AG | | | 0.50 | | | | 10/15/2012 | | | | 185,000,000 | | | | 185,000,000 | |
Skandinaviska Enskilda Banken AG | | | 0.70 | | | | 11/28/2012 | | | | 312,000,000 | | | | 312,000,000 | |
Skandinaviska Enskilda Banken AG | | | 0.75 | | | | 10/12/2012 | | | | 26,000,000 | | | | 26,010,864 | |
Standard Chartered Bank ± | | | 0.68 | | | | 03/04/2013 | | | | 213,000,000 | | | | 213,000,000 | |
State Street Bank & Trust | | | 0.17 | | | | 08/14/2012 | | | | 196,000,000 | | | | 196,000,000 | |
State Street Bank & Trust | | | 0.19 | | | | 08/17/2012 | | | | 75,000,000 | | | | 75,000,000 | |
State Street Bank & Trust | | | 0.25 | | | | 09/17/2012 | | | | 75,000,000 | | | | 75,000,000 | |
Sumitomo Mitsui Banking Corporation | | | 0.16 | | | | 08/01/2012 | | | | 153,000,000 | | | | 153,000,000 | |
Sumitomo Mitsui Banking Corporation | | | 0.16 | | | | 08/02/2012 | | | | 207,000,000 | | | | 207,000,000 | |
Sumitomo Mitsui Banking Corporation | | | 0.34 | | | | 08/08/2012 | | | | 72,000,000 | | | | 72,001,818 | |
Svenska Handelsbanken | | | 0.15 | | | | 08/01/2012 | | | | 277,600,000 | | | | 277,600,000 | |
Toronto-Dominion Bank | | | 0.18 | | | | 08/28/2012 | | | | 56,000,000 | | | | 56,000,000 | |
Toronto-Dominion Bank | | | 0.18 | | | | 08/29/2012 | | | | 102,000,000 | | | | 102,000,000 | |
Toronto-Dominion Bank ± | | | 0.45 | | | | 07/26/2013 | | | | 65,000,000 | | | | 65,000,000 | |
| | | | |
Total Certificates of Deposit (Cost $4,799,196,823) | | | | | | | | | | | | | | | 4,799,196,823 | |
| | | | | | | | | | | | | | | | |
The accompanying notes are an integral part of these financial statements.
| | | | |
| 8 | | Wells Fargo Advantage Heritage Money Market Fund | | Portfolio of Investments—July 31, 2012 (Unaudited) |
| | | | | | | | | | | | | | | | |
| Security Name | | Interest Rate | | | Maturity Date | | | Principal | | | Value | |
| | | | | | | | | | | | | | | | |
| | | | |
Commercial Paper : 39.14% | | | | | | | | | | | | | | | | |
| | | | |
| Asset-Backed Commercial Paper : 18.81% | | | | | | | | | | | | | | | | |
Chariot Funding LLC 144A (z) | | | 0.18 | % | | | 08/13/2012 | | | $ | 59,000,000 | | | $ | 58,996,460 | |
Chariot Funding LLC 144A (z) | | | 0.21 | | | | 09/12/2012 | | | | 57,000,000 | | | | 56,986,035 | |
Charta LLC 144A (z) | | | 0.48 | | | | 08/20/2012 | | | | 46,000,000 | | | | 45,988,347 | |
Ciesco LLC 144A (z) | | | 0.52 | | | | 09/06/2012 | | | | 21,270,000 | | | | 21,258,940 | |
CRC Funding LLC 144A (z) | | | 0.50 | | | | 09/04/2012 | | | | 135,000,000 | | | | 134,936,250 | |
Fairway Finance Corporation 144A (z) | | | 0.18 | | | | 08/10/2012 | | | | 10,000,000 | | | | 9,999,550 | |
Fairway Finance Corporation 144A (z) | | | 0.19 | | | | 08/02/2012 | | | | 28,423,000 | | | | 28,422,850 | |
Fairway Finance Corporation 144A (z) | | | 0.19 | | | | 08/16/2012 | | | | 5,013,000 | | | | 5,012,603 | |
Fairway Finance Corporation 144A (z) | | | 0.22 | | | | 10/04/2012 | | | | 27,691,000 | | | | 27,680,170 | |
Gotham Funding Corporation 144A (z) | | | 0.21 | | | | 08/09/2012 | | | | 12,000,000 | | | | 11,999,440 | |
Gotham Funding Corporation 144A (z) | | | 0.21 | | | | 08/13/2012 | | | | 16,000,000 | | | | 15,998,880 | |
Gotham Funding Corporation 144A (z) | | | 0.21 | | | | 08/23/2012 | | | | 54,000,000 | | | | 53,993,070 | |
Gotham Funding Corporation 144A (z) | | | 0.21 | | | | 08/01/2012 | | | | 29,000,000 | | | | 29,000,000 | |
Gotham Funding Corporation 144A (z) | | | 0.21 | | | | 08/08/2012 | | | | 77,500,000 | | | | 77,496,836 | |
Gotham Funding Corporation 144A (z) | | | 0.21 | | | | 08/10/2012 | | | | 37,204,000 | | | | 37,202,047 | |
Gotham Funding Corporation 144A (z) | | | 0.21 | | | | 08/17/2012 | | | | 100,000,000 | | | | 99,990,667 | |
Gotham Funding Corporation 144A (z) | | | 0.21 | | | | 08/22/2012 | | | | 78,000,000 | | | | 77,990,445 | |
Gotham Funding Corporation 144A (z) | | | 0.21 | | | | 08/24/2012 | | | | 22,000,000 | | | | 21,997,048 | |
Govco LLC 144A (z) | | | 0.50 | | | | 09/04/2012 | | | | 97,000,000 | | | | 96,954,194 | |
Govco LLC 144A (z) | | | 0.50 | | | | 09/05/2012 | | | | 82,000,000 | | | | 81,960,139 | |
Govco LLC 144A (z) | | | 0.50 | | | | 09/06/2012 | | | | 81,000,000 | | | | 80,959,500 | |
Jupiter Securitization Company LLC 144A (z) | | | 0.18 | | | | 08/13/2012 | | | | 33,000,000 | | | | 32,998,020 | |
Jupiter Securitization Company LLC 144A (z) | | | 0.21 | | | | 08/27/2012 | | | | 32,689,000 | | | | 32,684,042 | |
Jupiter Securitization Company LLC 144A (z) | | | 0.21 | | | | 09/12/2012 | | | | 57,000,000 | | | | 56,986,035 | |
Legacy Capital Company 144A (z) | | | 0.60 | | | | 08/13/2012 | | | | 48,000,000 | | | | 47,990,400 | |
Legacy Capital Company 144A (z) | | | 0.60 | | | | 08/14/2012 | | | | 48,000,000 | | | | 47,989,600 | |
Lexington Parker Capital Company LLC (z) | | | 0.60 | | | | 08/13/2012 | | | | 48,000,000 | | | | 47,990,400 | |
Lexington Parker Capital Company LLC 144A (z) | | | 0.60 | | | | 08/14/2012 | | | | 48,000,000 | | | | 47,989,600 | |
Liberty Funding LLC 144A (z) | | | 0.19 | | | | 08/01/2012 | | | | 20,000,000 | | | | 20,000,000 | |
Liberty Funding LLC 144A (z) | | | 0.19 | | | | 08/15/2012 | | | | 54,000,000 | | | | 53,996,010 | |
Liberty Funding LLC 144A (z) | | | 0.19 | | | | 08/16/2012 | | | | 40,000,000 | | | | 39,996,833 | |
Liberty Funding LLC 144A (z) | | | 0.19 | | | | 08/17/2012 | | | | 76,000,000 | | | | 75,993,582 | |
Liberty Funding LLC 144A (z) | | | 0.19 | | | | 08/24/2012 | | | | 42,000,000 | | | | 41,994,902 | |
Liberty Funding LLC 144A (z) | | | 0.20 | | | | 08/28/2012 | | | | 71,000,000 | | | | 70,989,643 | |
Liberty Funding LLC 144A (z) | | | 0.21 | | | | 08/13/2012 | | | | 37,000,000 | | | | 36,997,410 | |
Liberty Funding LLC 144A (z) | | | 0.23 | | | | 10/26/2012 | | | | 11,000,000 | | | | 10,993,956 | |
Market Street Funding Corporation 144A (z) | | | 0.23 | | | | 08/27/2012 | | | | 13,298,000 | | | | 13,295,791 | |
Market Street Funding Corporation 144A (z) | | | 0.26 | | | | 10/03/2012 | | | | 10,041,000 | | | | 10,036,431 | |
Market Street Funding Corporation 144A (z) | | | 0.26 | | | | 10/16/2012 | | | | 39,000,000 | | | | 38,978,593 | |
Market Street Funding Corporation 144A (z) | | | 0.26 | | | | 10/17/2012 | | | | 40,121,000 | | | | 40,098,688 | |
Market Street Funding Corporation 144A (z) | | | 0.26 | | | | 10/18/2012 | | | | 22,046,000 | | | | 22,033,581 | |
MetLife Short Term Funding 144A (z) | | | 0.20 | | | | 09/24/2012 | | | | 30,000,000 | | | | 29,991,000 | |
MetLife Short Term Funding 144A (z) | | | 0.25 | | | | 10/25/2012 | | | | 17,000,000 | | | | 16,989,965 | |
MetLife Short Term Funding LLC 144A (z) | | | 0.20 | | | | 08/01/2012 | | | | 49,000,000 | | | | 49,000,000 | |
MetLife Short Term Funding LLC 144A (z) | | | 0.21 | | | | 09/12/2012 | | | | 23,000,000 | | | | 22,994,365 | |
MetLife Short Term Funding LLC 144A (z) | | | 0.21 | | | | 08/06/2012 | | | | 17,000,000 | | | | 16,999,504 | |
MetLife Short Term Funding LLC 144A (z) | | | 0.21 | | | | 08/07/2012 | | | | 51,000,000 | | | | 50,998,215 | |
MetLife Short Term Funding LLC 144A (z) | | | 0.21 | | | | 08/02/2012 | | | | 19,000,000 | | | | 18,999,889 | |
The accompanying notes are an integral part of these financial statements.
| | | | | | |
| Portfolio of Investments—July 31, 2012 (Unaudited) | | Wells Fargo Advantage Heritage Money Market Fund | | | 9 | |
| | | | | | | | | | | | | | | | |
| Security Name | | Interest Rate | | | Maturity Date | | | Principal | | | Value | |
| | | | | | | | | | | | | | | | |
| | | | |
| Asset-Backed Commercial Paper (continued) | | | | | | | | | | | | | | | | |
MetLife Short Term Funding LLC 144A (z) | | | 0.22 | % | | | 10/04/2012 | | | $ | 45,250,000 | | | $ | 45,231,858 | |
MetLife Short Term Funding LLC 144A (z) | | | 0.22 | | | | 08/15/2012 | | | | 22,000,000 | | | | 21,998,118 | |
MetLife Short Term Funding LLC 144A (z) | | | 0.23 | | | | 10/02/2012 | | | | 25,760,000 | | | | 25,749,796 | |
MetLife Short Term Funding LLC 144A (z) | | | 0.24 | | | | 10/24/2012 | | | | 57,700,000 | | | | 57,667,688 | |
MetLife Short Term Funding LLC 144A (z) | | | 0.25 | | | | 10/09/2012 | | | | 25,000,000 | | | | 24,988,021 | |
MetLife Short Term Funding LLC 144A (z) | | | 0.25 | | | | 09/05/2012 | | | | 9,125,000 | | | | 9,122,782 | |
MetLife Short Term Funding LLC 144A (z) | | | 0.25 | | | | 09/06/2012 | | | | 39,000,000 | | | | 38,990,250 | |
MetLife Short Term Funding LLC 144A (z) | | | 0.25 | | | | 10/15/2012 | | | | 25,500,000 | | | | 25,486,719 | |
Old Line Funding LLC 144A (z) | | | 0.18 | | | | 08/13/2012 | | | | 20,000,000 | | | | 19,998,800 | |
Old Line Funding LLC 144A (z) | | | 0.18 | | | | 08/15/2012 | | | | 21,060,000 | | | | 21,058,526 | |
Old Line Funding LLC 144A (z) | | | 0.18 | | | | 08/20/2012 | | | | 29,000,000 | | | | 28,997,245 | |
Old Line Funding LLC 144A (z) | | | 0.19 | | | | 08/27/2012 | | | | 36,118,000 | | | | 36,113,044 | |
Regency Markets No.1 LLC 144A (z) | | | 0.23 | | | | 08/28/2012 | | | | 42,395,000 | | | | 42,387,687 | |
Salisbury Receivables Company 144A (z) | | | 0.22 | | | | 08/28/2012 | | | | 8,000,000 | | | | 7,998,680 | |
Salisbury Receivables Company 144A (z) | | | 0.22 | | | | 08/30/2012 | | | | 23,000,000 | | | | 22,995,924 | |
Salisbury Receivables Company 144A (z) | | | 0.23 | | | | 08/14/2012 | | | | 28,000,000 | | | | 27,997,674 | |
Salisbury Receivables Company 144A (z) | | | 0.23 | | | | 08/17/2012 | | | | 15,000,000 | | | | 14,998,467 | |
Salisbury Receivables Company 144A (z) | | | 0.23 | | | | 08/22/2012 | | | | 31,000,000 | | | | 30,995,841 | |
Salisbury Receivables Company 144A (z) | | | 0.24 | | | | 09/10/2012 | | | | 13,000,000 | | | | 12,996,533 | |
Salisbury Receivables Company 144A (z) | | | 0.27 | | | | 09/13/2012 | | | | 39,000,000 | | | | 38,987,112 | |
Salisbury Receivables Company 144A (z) | | | 0.27 | | | | 09/25/2012 | | | | 11,000,000 | | | | 10,995,463 | |
Salisbury Receivables Company 144A (z) | | | 0.27 | | | | 09/26/2012 | | | | 23,000,000 | | | | 22,990,340 | |
Salisbury Receivables Company 144A (z) | | | 0.27 | | | | 09/27/2012 | | | | 16,000,000 | | | | 15,993,160 | |
Salisbury Receivables Company 144A (z) | | | 0.28 | | | | 09/06/2012 | | | | 23,000,000 | | | | 22,993,560 | |
Salisbury Receivables Company 144A (z) | | | 0.32 | | | | 08/29/2012 | | | | 16,000,000 | | | | 15,996,018 | |
Salisbury Receivables Company 144A (z) | | | 0.34 | | | | 10/04/2012 | | | | 7,000,000 | | | | 6,995,769 | |
Sheffield Receivables Corporation 144A (z) | | | 0.22 | | | | 08/29/2012 | | | | 20,000,000 | | | | 19,996,578 | |
Solitaire Funding LLC 144A (z) | | | 0.23 | | | | 08/28/2012 | | | | 118,000,000 | | | | 117,979,645 | |
Solitaire Funding LLC 144A (z) | | | 0.30 | | | | 08/01/2012 | | | | 22,000,000 | | | | 22,000,000 | |
Solitaire Funding LLC 144A (z) | | | 0.30 | | | | 08/06/2012 | | | | 35,000,000 | | | | 34,998,542 | |
Solitaire Funding LLC 144A (z) | | | 0.30 | | | | 08/08/2012 | | | | 41,000,000 | | | | 40,997,608 | |
Solitaire Funding LLC 144A (z) | | | 0.30 | | | | 08/15/2012 | | | | 68,000,000 | | | | 67,992,067 | |
Straight-A Funding LLC 144A (z) | | | 0.18 | | | | 08/16/2012 | | | | 12,000,000 | | | | 11,999,100 | |
Straight-A Funding LLC 144A (z) | | | 0.18 | | | | 08/14/2012 | | | | 10,000,000 | | | | 9,999,350 | |
Straight-A Funding LLC 144A (z) | | | 0.18 | | | | 08/17/2012 | | | | 17,172,000 | | | | 17,170,626 | |
Straight-A Funding LLC 144A (z) | | | 0.18 | | | | 08/30/2012 | | | | 100,000,000 | | | | 99,985,500 | |
Straight-A Funding LLC 144A (z) | | | 0.18 | | | | 09/05/2012 | | | | 37,000,000 | | | | 36,993,525 | |
Straight-A Funding LLC 144A (z) | | | 0.18 | | | | 10/03/2012 | | | | 17,070,000 | | | | 17,064,623 | |
Straight-A Funding LLC 144A (z) | | | 0.18 | | | | 10/10/2012 | | | | 22,000,000 | | | | 21,992,300 | |
Straight-A Funding LLC 144A (z) | | | 0.18 | | | | 10/17/2012 | | | | 51,000,000 | | | | 50,980,365 | |
Straight-A Funding LLC 144A (z) | | | 0.18 | | | | 10/23/2012 | | | | 80,344,000 | | | | 80,310,657 | |
Straight-A Funding LLC 144A (z) | | | 0.18 | | | | 10/25/2012 | | | | 65,295,000 | | | | 65,267,250 | |
Surrey Funding Corporation 144A (z) | | | 0.22 | | | | 08/28/2012 | | | | 8,000,000 | | | | 7,998,680 | |
Surrey Funding Corporation 144A (z) | | | 0.22 | | | | 08/17/2012 | | | | 14,000,000 | | | | 13,998,631 | |
Surrey Funding Corporation 144A (z) | | | 0.28 | | | | 09/17/2012 | | | | 8,000,000 | | | | 7,997,075 | |
Surrey Funding Corporation 144A (z) | | | 0.28 | | | | 09/18/2012 | | | | 12,600,000 | | | | 12,595,296 | |
Sydney Capital Corporation 144A (z) | | | 0.30 | | | | 09/21/2012 | | | | 45,700,000 | | | | 45,680,577 | |
Sydney Capital Corporation 144A (z) | | | 0.30 | | | | 08/13/2012 | | | | 37,100,000 | | | | 37,096,290 | |
Sydney Capital Corporation 144A (z) | | | 0.30 | | | | 09/13/2012 | | | | 37,100,000 | | | | 37,086,706 | |
Sydney Capital Corporation 144A (z) | | | 0.30 | | | | 09/14/2012 | | | | 47,000,000 | | | | 46,982,766 | |
The accompanying notes are an integral part of these financial statements.
| | | | |
| 10 | | Wells Fargo Advantage Heritage Money Market Fund | | Portfolio of Investments—July 31, 2012 (Unaudited) |
| | | | | | | | | | | | | | | | |
| Security Name | | Interest Rate | | | Maturity Date | | | Principal | | | Value | |
| | | | | | | | | | | | | | | | |
| | | | |
| Asset-Backed Commercial Paper (continued) | | | | | | | | | | | | | | | | |
Sydney Capital Corporation 144A (z) | | | 0.30 | % | | | 10/03/2012 | | | $ | 35,000,000 | | | $ | 34,981,625 | |
Thunder Bay Funding LLC 144A (z) | | | 0.18 | | | | 08/08/2012 | | | | 66,049,000 | | | | 66,046,688 | |
Thunder Bay Funding LLC 144A (z) | | | 0.18 | | | | 08/14/2012 | | | | 40,000,000 | | | | 39,997,400 | |
Thunder Bay Funding LLC 144A (z) | | | 0.18 | | | | 08/15/2012 | | | | 44,764,000 | | | | 44,760,866 | |
Thunder Bay Funding LLC 144A (z) | | | 0.18 | | | | 08/20/2012 | | | | 81,000,000 | | | | 80,991,883 | |
Thunder Bay Funding LLC 144A (z) | | | 0.19 | | | | 08/27/2012 | | | | 28,052,000 | | | | 28,048,151 | |
Victory Receivables 144A (z) | | | 0.21 | | | | 08/02/2012 | | | | 36,544,000 | | | | 36,543,787 | |
Victory Receivables 144A (z) | | | 0.21 | | | | 08/03/2012 | | | | 11,348,000 | | | | 11,347,868 | |
Victory Receivables 144A (z) | | | 0.21 | | | | 08/08/2012 | | | | 21,000,000 | | | | 20,999,142 | |
Victory Receivables 144A (z) | | | 0.21 | | | | 08/09/2012 | | | | 25,497,000 | | | | 25,495,810 | |
Victory Receivables 144A (z) | | | 0.21 | | | | 08/10/2012 | | | | 22,000,000 | | | | 21,998,845 | |
Victory Receivables 144A (z) | | | 0.21 | | | | 08/13/2012 | | | | 40,000,000 | | | | 39,997,200 | |
Victory Receivables 144A (z) | | | 0.21 | | | | 08/14/2012 | | | | 73,000,000 | | | | 72,994,465 | |
Victory Receivables 144A (z) | | | 0.21 | | | | 08/16/2012 | | | | 61,000,000 | | | | 60,994,662 | |
Victory Receivables 144A (z) | | | 0.21 | | | | 08/17/2012 | | | | 81,957,000 | | | | 81,949,351 | |
Victory Receivables 144A (z) | | | 0.21 | | | | 08/23/2012 | | | | 74,000,000 | | | | 73,990,503 | |
Victory Receivables 144A (z) | | | 0.21 | | | | 08/22/2012 | | | | 49,544,000 | | | | 49,537,931 | |
Victory Receivables 144A (z) | | | 0.21 | | | | 08/24/2012 | | | | 34,000,000 | | | | 33,995,439 | |
White Point Funding Incorporated 144A (z) | | | 0.52 | | | | 10/22/2012 | | | | 12,000,000 | | | | 11,985,787 | |
White Point Funding Incorporated 144A (z) | | | 0.57 | | | | 08/20/2012 | | | | 17,404,000 | | | | 17,398,764 | |
| | | | |
| | | | | | | | | | | | | | | 4,500,774,925 | |
| | | | | | | | | | | | | | | | |
| | | | |
| Financial Company Commercial Paper : 16.40% | | | | | | | | | | | | | | | | |
ANZ National Limited 144A (z) | | | 0.28 | | | | 09/20/2012 | | | | 77,000,000 | | | | 76,970,056 | |
ANZ National Limited 144A (z) | | | 0.22 | | | | 08/02/2012 | | | | 41,000,000 | | | | 40,999,749 | |
ANZ National Limited 144A (z) | | | 0.22 | | | | 08/10/2012 | | | | 84,000,000 | | | | 83,995,380 | |
ANZ National Limited 144A (z) | | | 0.29 | | | | 09/25/2012 | | | | 71,000,000 | | | | 70,968,543 | |
ANZ National Limited 144A (z) | | | 0.29 | | | | 10/02/2012 | | | | 69,000,000 | | | | 68,965,538 | |
ASB Finance Limited 144A ± | | | 0.54 | | | | 02/25/2013 | | | | 98,000,000 | | | | 98,000,000 | |
ASB Finance Limited 144A ± | | | 0.64 | | | | 04/08/2013 | | | | 61,000,000 | | | | 61,000,000 | |
Banco De Chile 144A (z) | | | 0.66 | | | | 09/25/2012 | | | | 21,000,000 | | | | 20,978,825 | |
Banco De Chile 144A (z) | | | 0.67 | | | | 08/06/2012 | | | | 8,000,000 | | | | 7,999,256 | |
Banco De Chile 144A (z) | | | 0.67 | | | | 08/23/2012 | | | | 16,000,000 | | | | 15,993,449 | |
Banco De Chile 144A (z) | | | 0.67 | | | | 08/28/2012 | | | | 26,000,000 | | | | 25,986,936 | |
Banco De Chile 144A (z) | | | 0.67 | | | | 08/08/2012 | | | | 12,000,000 | | | | 11,998,437 | |
Banco De Chile 144A (z) | | | 0.70 | | | | 09/06/2012 | | | | 9,000,000 | | | | 8,993,700 | |
Barclays Bank plc 144A (z) | | | 0.24 | | | | 08/20/2012 | | | | 97,000,000 | | | | 96,987,713 | |
BNZ International Funding Limited 144A (z) | | | 0.24 | | | | 08/03/2012 | | | | 17,000,000 | | | | 16,999,778 | |
BNZ International Funding Limited 144A (z) | | | 0.28 | | | | 09/12/2012 | | | | 23,000,000 | | | | 22,992,487 | |
BNZ International Funding Limited 144A (z) | | | 0.28 | | | | 09/14/2012 | | | | 22,000,000 | | | | 21,992,471 | |
BNZ International Funding Limited 144A (z) | | | 0.53 | | | | 02/28/2013 | | | | 13,000,000 | | | | 13,000,088 | |
Caisse Centrale Desjardins du Quebec 144A (z) | | | 0.18 | | | | 08/07/2012 | | | | 40,000,000 | | | | 39,998,800 | |
Caisse Centrale Desjardins du Quebec 144A (z) | | | 0.18 | | | | 08/16/2012 | | | | 47,000,000 | | | | 46,996,475 | |
Caisse Centrale Desjardins du Quebec 144A (z) | | | 0.18 | | | | 08/17/2012 | | | | 20,000,000 | | | | 19,998,400 | |
Caisse Centrale Desjardins du Quebec 144A (z) | | | 0.19 | | | | 08/20/2012 | | | | 92,000,000 | | | | 91,990,774 | |
Caisse Centrale Desjardins du Quebec 144A (z) | | | 0.20 | | | | 08/08/2012 | | | | 53,250,000 | | | | 53,247,929 | |
Caisse Centrale Desjardins du Quebec 144A (z) | | | 0.20 | | | | 08/09/2012 | | | | 10,000,000 | | | | 9,999,556 | |
Caisse Centrale Desjardins du Quebec 144A (z) | | | 0.20 | | | | 08/10/2012 | | | | 14,000,000 | | | | 13,999,300 | |
Caisse Centrale Desjardins du Quebec 144A (z) | | | 0.21 | | | | 08/03/2012 | | | | 9,000,000 | | | | 8,999,895 | |
Caisse Centrale Desjardins du Quebec 144A (z) | | | 0.22 | | | | 10/16/2012 | | | | 18,000,000 | | | | 17,991,640 | |
The accompanying notes are an integral part of these financial statements.
| | | | | | |
| Portfolio of Investments—July 31, 2012 (Unaudited) | | Wells Fargo Advantage Heritage Money Market Fund | | | 11 | |
| | | | | | | | | | | | | | | | |
| Security Name | | Interest Rate | | | Maturity Date | | | Principal | | | Value | |
| | | | | | | | | | | | | | | | |
| | | | |
| Financial Company Commercial Paper (continued) | | | | | | | | | | | | | | | | |
Caisse Centrale Desjardins du Quebec 144A (z) | | | 0.25 | % | | | 09/04/2012 | | | $ | 27,700,000 | | | $ | 27,693,460 | |
Commonwealth Bank of Australia 144A (z) | | | 0.19 | | | | 08/01/2012 | | | | 124,000,000 | | | | 124,000,000 | |
DBS Bank Limited 144A (z) | | | 0.22 | | | | 09/04/2012 | | | | 14,000,000 | | | | 13,997,091 | |
DBS Bank Limited 144A (z) | | | 0.23 | | | | 08/02/2012 | | | | 32,000,000 | | | | 31,999,796 | |
DBS Bank Limited 144A (z) | | | 0.25 | | | | 08/20/2012 | | | | 57,000,000 | | | | 56,992,479 | |
DBS Bank Limited 144A (z) | | | 0.25 | | | | 08/30/2012 | | | | 19,000,000 | | | | 18,996,174 | |
DBS Bank Limited 144A (z) | | | 0.26 | | | | 09/07/2012 | | | | 20,000,000 | | | | 19,994,656 | |
DBS Bank Limited 144A (z) | | | 0.26 | | | | 09/13/2012 | | | | 41,000,000 | | | | 40,987,267 | |
DBS Bank Limited 144A (z) | | | 0.26 | | | | 10/01/2012 | | | | 21,000,000 | | | | 20,990,748 | |
DBS Bank Limited 144A (z) | | | 0.26 | | | | 10/25/2012 | | | | 118,000,000 | | | | 117,927,561 | |
DBS Bank Limited 144A (z) | | | 0.26 | | | | 10/29/2012 | | | | 42,000,000 | | | | 41,973,003 | |
DBS Bank Limited 144A (z) | | | 0.27 | | | | 10/05/2012 | | | | 101,000,000 | | | | 100,950,871 | |
DNB Nor Bank ASA 144A (z) | | | 0.31 | | | | 09/11/2012 | | | | 106,000,000 | | | | 105,962,576 | |
JPMorgan Chase & Company (z) | | | 0.28 | | | | 10/30/2012 | | | | 96,000,000 | | | | 95,932,800 | |
National Australia Funding Corporation 144A (z) | | | 0.18 | | | | 08/07/2012 | | | | 164,000,000 | | | | 163,995,012 | |
Nationwide Building Society 144A (z) | | | 0.55 | | | | 10/01/2012 | | | | 42,000,000 | | | | 41,960,858 | |
Nationwide Building Society 144A (z) | | | 0.58 | | | | 10/12/2012 | | | | 42,000,000 | | | | 41,951,280 | |
Nordea North America (z) | | | 0.30 | | | | 09/07/2012 | | | | 105,000,000 | | | | 104,967,625 | |
Oversea-Chinese Banking Corporation Limited (z) | | | 0.23 | | | | 09/18/2012 | | | | 58,000,000 | | | | 57,982,213 | |
Oversea-Chinese Banking Corporation Limited (z) | | | 0.25 | | | | 08/17/2012 | | | | 28,000,000 | | | | 27,996,889 | |
Oversea-Chinese Banking Corporation Limited (z) | | | 0.25 | | | | 08/22/2012 | | | | 36,000,000 | | | | 35,994,750 | |
Oversea-Chinese Banking Corporation Limited (z) | | | 0.26 | | | | 09/06/2012 | | | | 8,000,000 | | | | 7,997,920 | |
Oversea-Chinese Banking Corporation Limited (z) | | | 0.26 | | | | 09/26/2012 | | | | 60,000,000 | | | | 59,975,360 | |
Oversea-Chinese Banking Corporation Limited (z) | | | 0.26 | | | | 08/06/2012 | | | | 6,420,000 | | | | 6,419,768 | |
Oversea-Chinese Banking Corporation Limited (z) | | | 0.27 | | | | 08/29/2012 | | | | 23,000,000 | | | | 22,995,170 | |
Oversea-Chinese Banking Corporation Limited (z) | | | 0.27 | | | | 08/30/2012 | | | | 16,000,000 | | | | 15,996,520 | |
Oversea-Chinese Banking Corporation Limited (z) | | | 0.27 | | | | 10/11/2012 | | | | 40,000,000 | | | | 39,978,700 | |
Oversea-Chinese Banking Corporation Limited (z) | | | 0.30 | | | | 09/10/2012 | | | | 12,000,000 | | | | 11,996,000 | |
Oversea-Chinese Banking Corporation Limited (z) | | | 0.32 | | | | 10/09/2012 | | | | 29,100,000 | | | | 29,083,973 | |
Principal Life Insurance 144A (z) | | | 0.20 | | | | 08/03/2012 | | | | 8,000,000 | | | | 7,999,911 | |
Principal Life Insurance 144A (z) | | | 0.20 | | | | 08/06/2012 | | | | 19,000,000 | | | | 18,999,472 | |
Principal Life Insurance 144A (z) | | | 0.20 | | | | 08/17/2012 | | | | 7,000,000 | | | | 6,999,378 | |
Suncorp Group Limited 144A (z) | | | 0.45 | | | | 09/13/2012 | | | | 60,000,000 | | | | 59,967,750 | |
Suncorp Group Limited 144A (z) | | | 0.45 | | | | 09/10/2012 | | | | 23,000,000 | | | | 22,988,500 | |
Suncorp Group Limited 144A (z) | | | 0.45 | | | | 09/12/2012 | | | | 21,000,000 | | | | 20,988,975 | |
Suncorp Group Limited 144A (z) | | | 0.45 | | | | 09/17/2012 | | | | 43,000,000 | | | | 42,974,738 | |
Suncorp Group Limited 144A (z) | | | 0.46 | | | | 08/20/2012 | | | | 25,000,000 | | | | 24,993,931 | |
Suncorp Group Limited 144A (z) | | | 0.46 | | | | 08/09/2012 | | | | 23,000,000 | | | | 22,997,649 | |
Suncorp Group Limited 144A (z) | | | 0.47 | | | | 08/02/2012 | | | | 38,000,000 | | | | 37,999,504 | |
Swedbank (z) | | | 0.30 | | | | 08/08/2012 | | | | 50,000,000 | | | | 49,997,083 | |
Swedbank (z) | | | 0.30 | | | | 08/09/2012 | | | | 80,000,000 | | | | 79,994,667 | |
Swedbank (z) | | | 0.30 | | | | 08/10/2012 | | | | 78,000,000 | | | | 77,994,150 | |
Swedbank (z) | | | 0.33 | | | | 09/18/2012 | | | | 2,000,000 | | | | 1,999,120 | |
Swedbank (z) | | | 0.42 | | | | 08/29/2012 | | | | 61,000,000 | | | | 60,980,073 | |
Swedbank (z) | | | 0.42 | | | | 09/10/2012 | | | | 81,000,000 | | | | 80,962,200 | |
Swedbank (z) | | | 0.42 | | | | 09/11/2012 | | | | 83,000,000 | | | | 82,960,298 | |
Toyota Credit Canada Incorporated (z) | | | 0.20 | | | | 09/25/2012 | | | | 16,000,000 | | | | 15,995,111 | |
Toyota Credit Canada Incorporated (z) | | | 0.20 | | | | 09/26/2012 | | | | 9,000,000 | | | | 8,997,200 | |
UOB Funding LLC (z) | | | 0.21 | | | | 08/27/2012 | | | | 33,000,000 | | | | 32,994,995 | |
UOB Funding LLC (z) | | | 0.25 | | | | 09/13/2012 | | | | 55,000,000 | | | | 54,983,576 | |
The accompanying notes are an integral part of these financial statements.
| | | | |
| 12 | | Wells Fargo Advantage Heritage Money Market Fund | | Portfolio of Investments—July 31, 2012 (Unaudited) |
| | | | | | | | | | | | | | | | |
| Security Name | | Interest Rate | | | Maturity Date | | | Principal | | | Value | |
| | | | | | | | | | | | | | | | |
| | | | |
| Financial Company Commercial Paper (continued) | | | | | | | | | | | | | | | | |
Westpac Banking Corporation 144A (z) | | | 0.26 | % | | | 09/17/2012 | | | $ | 38,550,000 | | | $ | 38,536,914 | |
Westpac Securities NZ Limited 144A (z) | | | 0.30 | | | | 09/17/2012 | | | | 35,000,000 | | | | 34,986,292 | |
Westpac Securities NZ Limited 144A (z) | | | 0.30 | | | | 09/21/2012 | | | | 64,000,000 | | | | 63,972,800 | |
Westpac Securities NZ Limited 144A ± | | | 0.54 | | | | 02/22/2013 | | | | 100,000,000 | | | | 100,000,000 | |
Westpac Securities NZ Limited 144A ± | | | 0.54 | | | | 02/25/2013 | | | | 60,000,000 | | | | 60,000,000 | |
Westpac Securities NZ Limited 144A ± | | | 0.61 | | | | 07/22/2013 | | | | 97,000,000 | | | | 97,000,000 | |
Westpac Securities NZ Limited 144A ± | | | 0.64 | | | | 04/08/2013 | | | | 118,000,000 | | | | 118,018,736 | |
Westpac Securities NZ Limited 144A ± | | | 0.66 | | | | 04/15/2013 | | | | 40,000,000 | | | | 40,014,211 | |
| | | | |
| | | | | | | | | | | | | | | 3,923,032,929 | |
| | | | | | | | | | | | | | | | |
| | | | |
| Other Commercial Paper : 3.93% | | | | | | | | | | | | | | | | |
CNPC Finance 144A (z) | | | 0.38 | | | | 09/17/2012 | | | | 72,000,000 | | | | 71,964,280 | |
CNPC Finance 144A (z) | | | 0.39 | | | | 09/24/2012 | | | | 38,000,000 | | | | 37,977,770 | |
CNPC Finance 144A (z) | | | 0.42 | | | | 08/21/2012 | | | | 33,000,000 | | | | 32,992,300 | |
CNPC Finance 144A (z) | | | 0.42 | | | | 08/22/2012 | | | | 33,000,000 | | | | 32,991,915 | |
CNPC Finance 144A (z) | | | 0.42 | | | | 08/27/2012 | | | | 40,000,000 | | | | 39,987,867 | |
CNPC Finance 144A (z) | | | 0.42 | | | | 09/05/2012 | | | | 20,000,000 | | | | 19,991,833 | |
CNPC Finance 144A (z) | | | 0.42 | | | | 08/02/2012 | | | | 20,000,000 | | | | 19,999,767 | |
Coca-Cola Company 144A (z) | | | 0.16 | | | | 08/06/2012 | | | | 30,000,000 | | | | 29,999,333 | |
Coca-Cola Company 144A (z) | | | 0.16 | | | | 08/07/2012 | | | | 64,000,000 | | | | 63,998,293 | |
Coca-Cola Company 144A (z) | | | 0.22 | | | | 10/22/2012 | | | | 51,000,000 | | | | 50,974,443 | |
General Electric Company (z) | | | 0.15 | | | | 08/21/2012 | | | | 107,000,000 | | | | 106,991,083 | |
General Electric Company (z) | | | 0.15 | | | | 08/22/2012 | | | | 107,000,000 | | | | 106,990,638 | |
Louis Dreyfus Commodities LLC (z) | | | 0.42 | | | | 08/01/2012 | | | | 60,000,000 | | | | 60,000,000 | |
Louis Dreyfus Commodities LLC (z) | | | 0.55 | | | | 08/03/2012 | | | | 24,000,000 | | | | 23,999,353 | |
Louis Dreyfus Commodities LLC (z) | | | 0.55 | | | | 08/06/2012 | | | | 38,000,000 | | | | 37,997,097 | |
Toyota Motor Credit Corporation (z) | | | 0.19 | | | | 08/21/2012 | | | | 84,000,000 | | | | 83,991,133 | |
Toyota Motor Credit Corporation (z) | | | 0.20 | | | | 08/24/2012 | | | | 18,000,000 | | | | 17,997,700 | |
Toyota Motor Credit Corporation (z) | | | 0.20 | | | | 08/28/2012 | | | | 62,000,000 | | | | 61,990,700 | |
Toyota Motor Credit Corporation (z) | | | 0.20 | | | | 08/29/2012 | | | | 40,000,000 | | | | 39,993,778 | |
| | | | |
| | | | | | | | | | | | | | | 940,829,283 | |
| | | | | | | | | | | | | | | | |
| | | | |
Total Commercial Paper (Cost $9,364,637,137) | | | | | | | | | | | | | | | 9,364,637,137 | |
| | | | | | | | | | | | | | | | |
| | | | |
Municipal Obligations : 23.26% | | | | | | | | | | | | | | | | |
| | | | |
Alabama : 0.04% | | | | | | | | | | | | | | | | |
| | | | |
| Variable Rate Demand Note § : 0.04% | | | | | | | | | | | | | | | | |
Tuscaloosa County AL IDA Tax Exempt Gulf Opportunity Zone Hunt Refining Project Series 2008-A (IDR, JPMorgan Chase Bank LOC) | | | 0.21 | | | | 03/01/2027 | | | | 10,000,000 | | | | 10,000,000 | |
| | | | | | | | | | | | | | | | |
| | | | |
Alaska : 0.08% | | | | | | | | | | | | | | | | |
| | | | |
| Variable Rate Demand Note § : 0.08% | | | | | | | | | | | | | | | | |
Valdez AK Marine Terminal Exxon Pipeline Project (IDR) | | | 0.15 | | | | 10/01/2025 | | | | 20,090,000 | | | | 20,090,000 | |
| | | | | | | | | | | | | | | | |
| | | | |
Arizona : 0.19% | | | | | | | | | | | | | | | | |
| | | | |
| Variable Rate Demand Notes § : 0.19% | | | | | | | | | | | | | | | | |
Glendale AZ IDA Midwestern University (Education Revenue, JPMorgan Chase Bank LOC) | | | 0.17 | | | | 05/01/2041 | | | | 39,560,000 | | | | 39,560,000 | |
Glendale AZ IDA Thunderbird Garvin School Series A (IDR, JPMorgan Chase Bank LOC) | | | 0.21 | | | | 07/01/2035 | | | | 6,535,000 | | | | 6,535,000 | |
| | | | |
| | | | | | | | | | | | | | | 46,095,000 | |
| | | | | | | | | | | | | | | | |
The accompanying notes are an integral part of these financial statements.
| | | | | | |
| Portfolio of Investments—July 31, 2012 (Unaudited) | | Wells Fargo Advantage Heritage Money Market Fund | | | 13 | |
| | | | | | | | | | | | | | | | |
| Security Name | | Interest Rate | | | Maturity Date | | | Principal | | | Value | |
| | | | | | | | | | | | | | | | |
| | | | |
California : 3.45% | | | | | | | | | | | | | | | | |
| | | | |
| Other Municipal Debt : 0.40% | | | | | | | | | | | | | | | | |
California Series 2011B-5 (GO) | | | 0.18 | % | | | 08/17/2012 | | | $ | 5,000,000 | | | $ | 5,000,000 | |
Orange County CA Pension Obligation Series A (Miscellaneous Revenue) | | | 0.75 | | | | 08/01/2012 | | | | 3,000,000 | | | | 3,000,000 | |
Orange County CA Pension Obligation Series A (Miscellaneous Revenue) | | | 0.80 | | | | 11/01/2012 | | | | 16,000,000 | | | | 16,000,000 | |
Orange County CA Pension Obligation Series A (Miscellaneous Revenue) | | | 0.85 | | | | 02/01/2013 | | | | 13,000,000 | | | | 13,000,000 | |
San Francisco CA City & County Public Utilities Commission Series A2T (Utilities Revenue) | | | 0.20 | | | | 09/17/2012 | | | | 18,000,000 | | | | 18,000,000 | |
San Francisco CA City & County Public Utilities Commission Series IAM 14 (Utilities Revenue) | | | 0.20 | | | | 09/10/2012 | | | | 11,000,000 | | | | 11,000,000 | |
San Francisco CA City & County Public Utilities Commission Series IAM 758 (Utilities Revenue) | | | 0.19 | | | | 08/02/2012 | | | | 20,000,000 | | | | 20,000,000 | |
San Jose CA International Airport Series C-1 (Airport Revenue) | | | 0.47 | | | | 09/12/2012 | | | | 9,000,000 | | | | 9,000,000 | |
| | | | |
| | | | | | | | | | | | | | | 95,000,000 | |
| | | | | | | | | | | | | | | | |
| | | | |
| Variable Rate Demand Notes § : 3.05% | | | | | | | | | | | | | | | | |
California CDA Series 2554 (Miscellaneous Revenue, FSA Insured, Morgan Stanley Bank LIQ) | | | 0.23 | | | | 07/01/2047 | | | | 14,190,000 | | | | 14,190,000 | |
California HFA Series B (Housing Revenue, FNMA LOC) | | | 0.17 | | | | 08/01/2036 | | | | 5,110,000 | | | | 5,110,000 | |
California HFFA Catholic Healthcare Series H (Health Revenue, Bank of America NA LOC) | | | 0.22 | | | | 07/01/2035 | | | | 64,965,000 | | | | 64,965,000 | |
California HFFA Catholic Healthcare Series L (Health Revenue, Citibank NA LOC) | | | 0.19 | | | | 07/01/2033 | | | | 9,000,000 | | | | 9,000,000 | |
California Infrastructure & Economic Development Bank Rand Corporation Series B (IDR, Bank of America NA LOC) | | | 0.18 | | | | 04/01/2042 | | | | 16,340,000 | | | | 16,340,000 | |
California Statewide CDA Rady Children’s Hospital Series A (Health Revenue, U.S. Bank NA LOC) | | | 0.13 | | | | 08/15/2047 | | | | 63,845,000 | | | | 63,845,000 | |
Golden State Tobacco Securitization Corporation CA Series 3107 (Tobacco Revenue, BHAC-CR AMBAC-TCRS-BNY Insured, Morgan Stanley Bank LIQ) 144A | | | 0.23 | | | | 12/01/2045 | | | | 25,710,000 | | | | 25,710,000 | |
Loma Linda CA Hospital Loma Linda University Medical Center Series B (Health Revenue, Bank of America NA LOC) | | | 0.19 | | | | 12/01/2038 | | | | 19,300,000 | | | | 19,300,000 | |
Loma Linda CA Hospital Loma Linda University Medical Center Series B-2 (Health Revenue, Bank of America NA LOC) | | | 0.19 | | | | 12/01/2037 | | | | 31,800,000 | | | | 31,800,000 | |
Los Angeles CA Multi-Family Housing Fountain Park (Housing Revenue, FNMA Insured, FNMA LIQ) | | | 0.15 | | | | 03/15/2034 | | | | 32,615,000 | | | | 32,615,000 | |
Los Angeles CA TRAN JPMorgan Chase PUTTER Series 3931 (GO, JPMorgan Chase & Company LIQ) | | | 0.18 | | | | 08/12/2012 | | | | 61,070,000 | | | | 61,070,000 | |
Los Angeles CA TRAN JPMorgan Chase PUTTER Series 3965 (GO, JPMorgan Chase & Company LIQ) 144A | | | 0.18 | | | | 08/12/2012 | | | | 24,765,000 | | | | 24,765,000 | |
Newport Beach CA Hoag Memorial Hospital Series F (Health Revenue, Bank of America NA LOC) | | | 0.22 | | | | 12/01/2040 | | | | 52,580,000 | | | | 52,580,000 | |
Roseville CA Electric System Series A (Miscellaneous Revenue, Morgan Stanley Bank LOC) | | | 0.20 | | | | 02/01/2035 | | | | 18,000,000 | | | | 18,000,000 | |
Sacramento CA MUD Series K (Utilities Revenue, Bank of America NA LOC) | | | 0.20 | | | | 08/15/2028 | | | | 48,900,000 | | | | 48,900,000 | |
San Bernardino County CA Flood Control District (Miscellaneous Revenue, Bank of America NA LOC) | | | 0.21 | | | | 08/01/2037 | | | | 31,295,000 | | | | 31,295,000 | |
San Diego CA Unified School District JPMorgan Chase PUTTER Trust Series 3934 (GO, JPMorgan Chase & Company LIQ) 144A | | | 0.18 | | | | 08/07/2012 | | | | 47,945,000 | | | | 47,945,000 | |
San Diego CA Unified School District JPMorgan Chase PUTTER Trust Series 3966 (GO, JPMorgan Chase & Company LIQ) 144A | | | 0.18 | | | | 08/12/2012 | | | | 18,000,000 | | | | 18,000,000 | |
San Diego County CA Regional Transportation Community Limited Tax Series A (Tax Revenue, JPMorgan Chase Bank SPA) | | | 0.14 | | | | 04/01/2038 | | | | 31,750,000 | | | | 31,750,000 | |
The accompanying notes are an integral part of these financial statements.
| | | | |
| 14 | | Wells Fargo Advantage Heritage Money Market Fund | | Portfolio of Investments—July 31, 2012 (Unaudited) |
| | | | | | | | | | | | | | | | |
| Security Name | | Interest Rate | | | Maturity Date | | | Principal | | | Value | |
| | | | | | | | | | | | | | | | |
| | | |
| Variable Rate Demand Notes § (continued) | | | | | | | | | | | | | |
San Diego County CA Regional Transportation Community Limited Tax Series C (Tax Revenue, Mizuho Corporate Bank SPA) | | | 0.13 | % | | | 04/01/2038 | | | $ | 11,800,000 | | | $ | 11,800,000 | |
San Francisco CA City & County Finance Corporation Moscone Center Project Series 2008 (Miscellaneous Revenue, Bank of America NA LOC) | | | 0.20 | | | | 04/01/2030 | | | | 54,250,000 | | | | 54,250,000 | |
San Francisco CA City & County RDA Series B001 (Miscellaneous Revenue, Morgan Stanley Bank LIQ) 144A | | | 0.29 | | | | 11/01/2041 | | | | 4,000,000 | | | | 4,000,000 | |
San Luis Obispo County CA Financing Authority Series 3030 Nacimiento Water Project A (Water & Sewer Revenue, BHAC-CR MBIA Insured, Morgan Stanley Bank LIQ) 144A | | | 0.23 | | | | 09/01/2038 | | | | 23,570,000 | | | | 23,570,000 | |
Santa Clara County CA Financing Authority Multiple Facilities Projects Series M (Miscellaneous Revenue, Bank of America NA LOC) | | | 0.23 | | | | 05/15/2035 | | | | 10,430,000 | | | | 10,430,000 | |
Westminster CA RDA Series 3009 (Tax Revenue, Assured Guaranty Insured, Morgan Stanley Bank LIQ) 144A | | | 0.23 | | | | 11/01/2045 | | | | 8,875,000 | | | | 8,875,000 | |
| | | | |
| | | | | | | | | | | | | | | 730,105,000 | |
| | | | | | | | | | | | | | | | |
| | | | |
Colorado : 1.54% | | | | | | | | | | | | | | | | |
| | | | |
| Variable Rate Demand Notes § : 1.54% | | | | | | | | | | | | | | | | |
Colorado HFA Class I Series A-1 (Housing Revenue, FHLB SPA) | | | 0.19 | | | | 10/01/2033 | | | | 13,665,000 | | | | 13,665,000 | |
Colorado HFA Class I Series A-1 (Housing Revenue, FHLB SPA) | | | 0.19 | | | | 11/01/2036 | | | | 1,220,000 | | | | 1,220,000 | |
Colorado HFA Class I Series A-2 (Housing Revenue, Royal Bank of Canada SPA) | | | 0.16 | | | | 11/01/2026 | | | | 12,240,000 | | | | 12,240,000 | |
Colorado HFA Class I Series A-2 (Housing Revenue, FNMA LOC) | | | 0.21 | | | | 05/01/2038 | | | | 10,185,000 | | | | 10,185,000 | |
Colorado HFA Class I Series B-1 (Housing Revenue, Go of Authority, JPMorgan Chase Bank NA) | | | 0.23 | | | | 10/01/2038 | | | | 50,675,000 | | | | 50,675,000 | |
Colorado HFA Class I Series B-2 (Housing Revenue, JPMorgan Chase Bank NA) | | | 0.22 | | | | 04/01/2038 | | | | 12,590,000 | | | | 12,590,000 | |
Colorado HFA Class I Series B-3 (Housing Revenue, FHLB SPA) | | | 0.17 | | | | 11/01/2036 | | | | 25,445,000 | | | | 25,445,000 | |
Colorado HFA Taxable MFHR Project B-2 (Housing Revenue, FHLB SPA) | | | 0.18 | | | | 05/01/2050 | | | | 80,815,000 | | | | 80,815,000 | |
Denver CO City & County Subseries G1 (Port Authority Revenue, Assured Guaranty Insured, Morgan Stanley Bank SPA) | | | 0.26 | | | | 11/15/2025 | | | | 19,905,000 | | | | 19,905,000 | |
Denver CO City & County Subseries G2 (Port Authority Revenue, Assured Guaranty Insured, Morgan Stanley Bank SPA) | | | 0.26 | | | | 11/15/2025 | | | | 19,000,000 | | | | 19,000,000 | |
Denver CO Public Schools Series A-1 (Lease Revenue, JPMorgan Chase Bank LOC, AGM Insured) | | | 0.17 | | | | 12/15/2037 | | | | 14,845,000 | | | | 14,845,000 | |
Denver CO Public Schools Series A-4 (Education Revenue, Royal Bank of Canada LOC, AGM Insured) | | | 0.17 | | | | 12/15/2037 | | | | 46,000,000 | | | | 46,000,000 | |
Southern Ute Indian Tribe Reservation Colorado (Miscellaneous Revenue) 144A | | | 0.16 | | | | 04/01/2040 | | | | 62,735,000 | | | | 62,735,000 | |
| | | | |
| | | | | | | | | | | | | | | 369,320,000 | |
| | | | | | | | | | | | | | | | |
| | | | |
Connecticut : 0.14% | | | | | | | | | | | | | | | | |
| | | | |
| Variable Rate Demand Note § : 0.14% | | | | | | | | | | | | | | | | |
Connecticut State HFA Subseries 2011 E-3 (Housing Revenue, GO of Authority Insured, Bank of Tokyo-Mitsubishi SPA) | | | 0.13 | | | | 11/15/2041 | | | | 33,000,000 | | | | 33,000,000 | |
| | | | | | | | | | | | | | | | |
| | | | |
District of Columbia : 0.51% | | | | | | | | | | | | | | | | |
| | | | |
| Other Municipal Debt : 0.06% | | | | | | | | | | | | | | | | |
District of Columbia Water & Sewer Authority Series C (Water & Sewer Revenue) | | | 0.20 | | | | 09/17/2012 | | | | 7,200,000 | | | | 7,200,000 | |
Metropolitan Washington DC Airports Authority Series 1-C (Airport Revenue) | | | 0.21 | | | | 08/14/2012 | | | | 6,500,000 | | | | 6,500,000 | |
| | | | |
| | | | | | | | | | | | | | | 13,700,000 | |
| | | | | | | | | | | | | | | | |
The accompanying notes are an integral part of these financial statements.
| | | | | | |
| Portfolio of Investments—July 31, 2012 (Unaudited) | | Wells Fargo Advantage Heritage Money Market Fund | | | 15 | |
| | | | | | | | | | | | | | | | |
| Security Name | | Interest Rate | | | Maturity Date | | | Principal | | | Value | |
| | | | | | | | | | | | | | | | |
| | | | |
| Variable Rate Demand Notes § : 0.45% | | | | | | | | | | | | | | | | |
District of Columbia PUTTER Series 4026 (GO, JPMorgan Chase & Company LIQ) 144A | | | 0.18 | % | | | 09/28/2012 | | | $ | 5,000,000 | | | $ | 5,000,000 | |
District of Columbia The Pew Charitable Trusts Series A (Miscellaneous Revenue, PNC Bank NA LOC) | | | 0.15 | | | | 04/01/2038 | | | | 70,400,000 | | | | 70,400,000 | |
Metropolitan Washington DC Airports Authority Subseries D-1 (Airport Revenue, Bank of America NA LOC) | | | 0.19 | | | | 10/01/2039 | | | | 33,590,000 | | | | 33,590,000 | |
| | | | |
| | | | | | | | | | | | | | | 108,990,000 | |
| | | | | | | | | | | | | | | | |
| | | | |
Florida : 0.25% | | | | | | | | | | | | | | | | |
| | | | |
| Variable Rate Demand Notes § : 0.25% | | | | | | | | | | | | | | | | |
Florida HEFAR Ringling College of Arts & Design Incorporated Project Series 2008 (Education Revenue, PNC Bank NA LOC) | | | 0.15 | | | | 03/01/2038 | | | | 5,530,000 | | | | 5,530,000 | |
JPMorgan Chase PUTTER/DRIVER Trust Series 4172 (Lease Revenue) 144A | | | 0.20 | | | | 01/01/2020 | | | | 7,995,000 | | | | 7,995,000 | |
Palm Bay FL Special Obligation Variable Taxable Pension Funding Project (Miscellaneous Revenue, AGM Insured, State Street Bank & Trust Company SPA) | | | 0.55 | | | | 10/01/2037 | | | | 24,260,000 | | | | 24,260,000 | |
Volusia County FL Eclipse Funding Trust Series 0008 (Miscellaneous Revenue, U.S. Bank NA LOC, FSA Insured) | | | 0.14 | | | | 08/01/2013 | | | | 11,940,000 | | | | 11,940,000 | |
Volusia County FL Eclipse Funding Trust Series 0036 (Miscellaneous Revenue, U.S. Bank NA LOC, FSA Insured) | | | 0.14 | | | | 08/01/2032 | | | | 10,940,000 | | | | 10,940,000 | |
| | | | |
| | | | | | | | | | | | | | | 60,665,000 | |
| | | | | | | | | | | | | | | | |
| | | | |
Georgia : 0.31% | | | | | | | | | | | | | | | | |
| | | | |
| Variable Rate Demand Notes § : 0.31% | | | | | | | | | | | | | | | | |
Main Street Natural Gas Incorporated Georgia Gas Project Series A (Utilities Revenue, Royal Bank of Canada SPA) | | | 0.15 | | | | 08/01/2040 | | | | 25,245,000 | | | | 25,245,000 | |
Savannah GA College of Art & Design Series 2004 BD (Education Revenue, Bank of America NA LOC) | | | 0.26 | | | | 04/01/2024 | | | | 40,700,000 | | | | 40,700,000 | |
Wayne County GA IDA Rayonier Incorporated Project (IDR, Bank of America NA LOC) | | | 0.25 | | | | 05/01/2020 | | | | 8,000,000 | | | | 8,000,000 | |
| | | | |
| | | | | | | | | | | | | | | 73,945,000 | |
| | | | | | | | | | | | | | | | |
| | | | |
Illinois : 1.27% | | | | | | | | | | | | | | | | |
| | | | |
| Variable Rate Demand Notes § : 1.27% | | | | | | | | | | | | | | | | |
Chicago IL Metropolitan Water Reclamation PFOTER Series 727 (Tax Revenue, Bank of America NA LIQ) 144A | | | 0.23 | | | | 12/01/2028 | | | | 47,810,000 | | | | 47,810,000 | |
Chicago IL Midway Airport 2nd Lien Series A-2 (Airport Revenue, JPMorgan Chase Bank LOC) | | | 0.19 | | | | 01/01/2025 | | | | 5,135,000 | | | | 5,135,000 | |
Chicago IL Midway Airport 2nd Lien Series C-1 (Airport Revenue, Bank of Montreal LOC) | | | 0.19 | | | | 01/01/2035 | | | | 20,040,000 | | | | 20,040,000 | |
Chicago IL PFOTER Series O-6 (Tax Revenue, Royal Bank of Canada LIQ) 144A | | | 0.15 | | | | 01/01/2041 | | | | 7,985,000 | | | | 7,985,000 | |
Chicago IL Series B-1 (GO, JPMorgan Chase & Company LOC) | | | 0.17 | | | | 01/01/2034 | | | | 14,645,000 | | | | 14,645,000 | |
Chicago IL Water District Eclipse Funding Trust Series 2006-A (Water & Sewer Revenue, U.S. Bank NA LOC) | | | 0.14 | | | | 05/01/2014 | | | | 17,780,000 | | | | 17,780,000 | |
Cook County IL Series A (GO, Bank of America NA SPA) | | | 0.21 | | | | 11/01/2023 | | | | 25,680,000 | | | | 25,680,000 | |
Cook County IL Series D-1 (GO, Harris NA SPA) | | | 0.17 | | | | 11/01/2030 | | | | 19,000,000 | | | | 19,000,000 | |
Cook County IL Series D-2 (GO, Northern Trust Company SPA) | | | 0.17 | | | | 11/01/2030 | | | | 28,000,000 | | | | 28,000,000 | |
IIlinois Health Facilities Authority Centegra Health System Series 2002 (Health Revenue, FSA Insured, JPMorgan Chase Bank LOC) | | | 0.38 | | | | 09/01/2032 | | | | 12,440,000 | | | | 12,440,000 | |
Illinois Finance Authority Bradley University Series A (Education Revenue, PNC Bank NA LOC) | | | 0.15 | | | | 04/01/2033 | | | | 24,635,000 | | | | 24,635,000 | |
The accompanying notes are an integral part of these financial statements.
| | | | |
| 16 | | Wells Fargo Advantage Heritage Money Market Fund | | Portfolio of Investments—July 31, 2012 (Unaudited) |
| | | | | | | | | | | | | | | | |
| Security Name | | Interest Rate | | | Maturity Date | | | Principal | | | Value | |
| | | | | | | | | | | | | | | | |
| | | | |
| Variable Rate Demand Notes § (continued) | | | | | | | | | | | | | | | | |
Illinois Finance Authority Spertus Institute (Education Revenue, Northern Trust Company LOC) | | | 0.16 | % | | | 09/01/2035 | | | $ | 43,570,000 | | | $ | 43,570,000 | |
Illinois Housing Development Authority Larkin Village Project Series A (Housing Revenue, JPMorgan Chase Bank LOC, GO of Authority Insured) | | | 0.22 | | | | 01/01/2027 | | | | 13,090,000 | | | | 13,090,000 | |
Illinois International Port District Facilities (Port Authority Revenue, U.S. Bank NA LOC) | | | 0.16 | | | | 01/01/2023 | | | | 8,000,000 | | | | 8,000,000 | |
Illinois Toll Highway Authority Series A-1B (Transportation Revenue, PNC Bank NA LOC) | | | 0.15 | | | | 07/01/2030 | | | | 16,000,000 | | | | 16,000,000 | |
| | | | |
| | | | | | | | | | | | | | | 303,810,000 | |
| | | | | | | | | | | | | | | | |
| | | | |
Indiana : 0.35% | | | | | | | | | | | | | | | | |
| | | | |
| Variable Rate Demand Notes § : 0.35% | | | | | | | | | | | | | | | | |
Indiana Finance Authority Indiana University Health Series K (Health Revenue, JPMorgan Chase Bank LOC) | | | 0.19 | | | | 03/01/2033 | | | | 20,375,000 | | | | 20,375,000 | |
Indiana Housing & CDA Series B-3 (Housing Revenue, JPMorgan Chase & Company SPA) | | | 0.20 | | | | 07/01/2036 | | | | 14,060,000 | | | | 14,060,000 | |
Richmond IN Reid Hospital & Health Care Services Incorporated (Health Revenue, AGM Insured, JPMorgan Chase Bank LOC) | | | 0.18 | | | | 01/01/2040 | | | | 49,450,000 | | | | 49,450,000 | |
| | | | |
| | | | | | | | | | | | | | | 83,885,000 | |
| | | | | | | | | | | | | | | | |
| | | | |
Kentucky : 0.36% | | | | | | | | | | | | | | | | |
| | | | |
| Variable Rate Demand Notes § : 0.36% | | | | | | | | | | | | | | | | |
Carroll County KY Environmental Facility Revenue Series A (Utilities Revenue, Sumitomo Mitsui Banking Corporation LOC) | | | 0.17 | | | | 10/01/2034 | | | | 26,000,000 | | | | 26,000,000 | |
Kentucky Municipal Power Agency Series B002 (Miscellaneous Revenue, Assured Guaranty Insured, Morgan Stanley Bank LIQ) 144A | | | 0.29 | | | | 09/01/2037 | | | | 20,000,000 | | | | 20,000,000 | |
Logan County KY Solid Waste Disposal Waste Management LLC Project (Resource Recovery Revenue, PNC Bank NA LOC) | | | 0.20 | | | | 03/01/2021 | | | | 6,000,000 | | | | 6,000,000 | |
Louisville & Jefferson Counties KY Sewer District JPMorgan Chase PUTTER/DRIVER Trust Series 4012 (Water & Sewer Revenue, JPMorgan Chase Bank LOC) 144A | | | 0.18 | | | | 12/12/2012 | | | | 35,000,000 | | | | 35,000,000 | |
| | | | |
| | | | | | | | | | | | | | | 87,000,000 | |
| | | | | | | | | | | | | | | | |
| | | | |
Louisiana : 0.80% | | | | | | | | | | | | | | | | |
| | | | |
| Variable Rate Demand Notes § : 0.80% | | | | | | | | | | | | | | | | |
East Baton Rouge Parish LA IDR ExxonMobil Project Series A (IDR) | | | 0.15 | | | | 08/01/2035 | | | | 44,500,000 | | | | 44,500,000 | |
East Baton Rouge Parish LA Road & Street Improvement Project Series A (Tax Revenue, JPMorgan Chase Bank LOC) | | | 0.16 | | | | 08/01/2030 | | | | 71,440,000 | | | | 71,440,000 | |
East Baton Rouge Parish LA Sewerage Commission Revenue Series B005 (Water & Sewer Revenue, Morgan Stanley Bank LIQ) 144A | | | 0.29 | | | | 02/01/2045 | | | | 16,280,000 | | | | 16,280,000 | |
St. James Parish LA Nucor Steel LLC Project Gulf Opportunity Zone Series 2010 A-1 (IDR) | | | 0.16 | | | | 11/01/2040 | | | | 39,200,000 | | | | 39,200,000 | |
St. James Parish LA Nucor Steel LLC Project Gulf Opportunity Zone Series 2010 B-1 (IDR) | | | 0.16 | | | | 11/01/2040 | | | | 18,700,000 | | | | 18,700,000 | |
| | | | |
| | | | | | | | | | | | | | | 190,120,000 | |
| | | | | | | | | | | | | | | | |
The accompanying notes are an integral part of these financial statements.
| | | | | | |
| Portfolio of Investments—July 31, 2012 (Unaudited) | | Wells Fargo Advantage Heritage Money Market Fund | | | 17 | |
| | | | | | | | | | | | | | | | |
| Security Name | | Interest Rate | | | Maturity Date | | | Principal | | | Value | |
| | | | | | | | | | | | | | | | |
| | | | |
Maryland : 0.38% | | | | | | | | | | | | | | | | |
| | | | |
| Variable Rate Demand Notes § : 0.38% | | | | | | | | | | | | | | | | |
Baltimore MD Package Systems Facilities (Transportation Revenue, Bank of America NA LOC) | | | 0.25 | % | | | 07/01/2032 | | | $ | 45,210,000 | | | $ | 45,210,000 | |
Maryland Health & HEFA Anne Arundel Health System B (Health Revenue, Bank of America NA LOC) | | | 0.24 | | | | 07/01/2043 | | | | 44,500,000 | | | | 44,500,000 | |
| | | | |
| | | | | | | | | | | | | | | 89,710,000 | |
| | | | | | | | | | | | | | | | |
| | | | |
Massachusetts : 0.38% | | | | | | | | | | | | | | | | |
| | | | |
| Variable Rate Demand Notes § : 0.38% | | | | | | | | | | | | | | | | |
Massachusetts Department of Transportation Series A6 (Transportation Revenue, GO of Commonwealth Insured, JPMorgan Chase Bank SPA) | | | 0.15 | | | | 01/01/2029 | | | | 15,000,000 | | | | 15,000,000 | |
Massachusetts HEFA Boston University Project Series N (Education Revenue, Bank of America NA LOC) | | | 0.23 | | | | 10/01/2034 | | | | 10,330,000 | | | | 10,330,000 | |
Massachusetts Water Resources Authority Series A-1 (Water & Sewer Revenue, GO of Authority Insured, JPMorgan Chase Bank SPA) | | | 0.14 | | | | 08/01/2037 | | | | 19,675,000 | | | | 19,675,000 | |
Massachusetts Water Resources Authority Series C-1 (Water & Sewer Revenue, GO of Authority Insured, Bank of America NA SPA) | | | 0.22 | | | | 11/01/2026 | | | | 20,085,000 | | | | 20,085,000 | |
Massachusetts Water Resources Authority Series E (Water & Sewer Revenue, GO of Authority Insured, JPMorgan Chase Bank SPA) | | | 0.16 | | | | 08/01/2037 | | | | 26,930,000 | | | | 26,930,000 | |
| | | | |
| | | | | | | | | | | | | | | 92,020,000 | |
| | | | | | | | | | | | | | | | |
| | | | |
Michigan : 1.25% | | | | | | | | | | | | | | | | |
| | | | |
| Variable Rate Demand Notes § : 1.25% | | | | | | | | | | | | | | | | |
Michigan Finance Authority Series A (Miscellaneous Revenue, Bank of America NA LOC) | | | 0.26 | | | | 09/01/2050 | | | | 100,000,000 | | | | 100,000,000 | |
Michigan Finance Authority Series B (Miscellaneous Revenue, PNC Bank NA LOC) | | | 0.20 | | | | 09/01/2050 | | | | 25,000,000 | | | | 25,000,000 | |
Michigan Finance Authority Series C (Miscellaneous Revenue, Bank of Montreal LOC) | | | 0.19 | | | | 09/01/2050 | | | | 22,000,000 | | | | 22,000,000 | |
Michigan Housing Development Authority Series A (Housing Revenue, Bank of Tokyo-Mitsubishi SPA) | | | 0.17 | | | | 04/01/2040 | | | | 16,335,000 | | | | 16,335,000 | |
Michigan Housing Development Authority Series A (Housing Revenue, GO of Authority Insured, JPMorgan Chase & Company SPA) | | | 0.20 | | | | 10/01/2037 | | | | 62,295,000 | | | | 62,295,000 | |
University of Michigan Series B (Education Revenue, Northern Trust Company SPA) | | | 0.14 | | | | 04/01/2042 | | | | 10,000,000 | | | | 10,000,000 | |
Wayne County MI Airport Authority Series E-1 (Airport Revenue, JPMorgan Chase Bank LOC) | | | 0.17 | | | | 12/01/2028 | | | | 25,000,000 | | | | 25,000,000 | |
Wayne County MI Airport Authority Series F (Airport Revenue, JPMorgan Chase Bank LOC) | | | 0.18 | | | | 12/01/2033 | | | | 37,320,000 | | | | 37,320,000 | |
| | | | |
| | | | | | | | | | | | | | | 297,950,000 | |
| | | | | | | | | | | | | | | | |
| | | | |
Minnesota : 0.17% | | | | | | | | | | | | | | | | |
| | | | |
| Variable Rate Demand Notes § : 0.17% | | | | | | | | | | | | | | | | |
Minnesota HFA Residential Housing Series E (Housing Revenue, GO of Agency Insured, State Street Bank & Trust Company SPA) | | | 0.21 | | | | 07/01/2038 | | | | 2,770,000 | | | | 2,770,000 | |
Minnesota HFA Residential Housing Series T (Housing Revenue, GO of Agency Insured, State Street Bank & Trust Company SPA) | | | 0.21 | | | | 07/01/2048 | | | | 4,400,000 | | | | 4,400,000 | |
Minnesota Office of Higher Education Supplemental Student Loan Program Series A (Education Revenue, U.S. Bank NA LOC) | | | 0.15 | | | | 09/01/2046 | | | | 10,500,000 | | | | 10,500,000 | |
The accompanying notes are an integral part of these financial statements.
| | | | |
| 18 | | Wells Fargo Advantage Heritage Money Market Fund | | Portfolio of Investments—July 31, 2012 (Unaudited) |
| | | | | | | | | | | | | | | | |
| Security Name | | Interest Rate | | | Maturity Date | | | Principal | | | Value | |
| | | | | | | | | | | | | | | | |
| | | | |
| Variable Rate Demand Notes § (continued) | | | | | | | | | | | | | | | | |
Minnesota Office of Higher Education Supplemental Student Loan Project Series B (Education Revenue, State Street Bank & Trust Company LOC) | | | 0.16 | % | | | 09/01/2046 | | | $ | 9,200,000 | | | $ | 9,200,000 | |
St. Cloud MN CentraCare Health System Series A (Health Revenue, Assured Guaranty Insured, JPMorgan Chase Bank SPA) | | | 0.38 | | | | 05/01/2042 | | | | 13,000,000 | | | | 13,000,000 | |
| | | | |
| | | | | | | | | | | | | | | 39,870,000 | |
| | | | | | | | | | | | | | | | |
| | | | |
Mississippi : 0.34% | | | | | | | | | | | | | | | | |
| | | | |
| Variable Rate Demand Notes § : 0.34% | | | | | | | | | | | | | | | | |
Mississippi Business Finance Commission Gulf Opportunity Zone Chevron USA Series D (IDR) | | | 0.16 | | | | 11/01/2035 | | | | 11,200,000 | | | | 11,200,000 | |
Mississippi Business Finance Corporation Chevron USA Incorporated Project Series A (IDR) | | | 0.16 | | | | 12/01/2030 | | | | 15,600,000 | | | | 15,600,000 | |
Mississippi Business Finance Corporation Chevron USA Incorporated Project Series H (IDR) | | | 0.16 | | | | 11/01/2035 | | | | 16,000,000 | | | | 16,000,000 | |
Mississippi Nissan Project Series A (Tax Revenue, Bank of America NA SPA) | | | 0.24 | | | | 11/01/2028 | | | | 415,000 | | | | 415,000 | |
Mississippi State Nissan Project Series B (GO, Bank of America NA SPA) | | | 0.23 | | | | 11/01/2028 | | | | 37,995,000 | | | | 37,995,000 | |
| | | | |
| | | | | | | | | | | | | | | 81,210,000 | |
| | | | | | | | | | | | | | | | |
| | | | |
Missouri : 0.03% | | | | | | | | | | | | | | | | |
| | | | |
| Variable Rate Demand Note § : 0.03% | | | | | | | | | | | | | | | | |
Missouri Development Finance Board Nelson Gallery Foundation Series A (Miscellaneous Revenue, JPMorgan Chase Bank SPA) | | | 0.17 | | | | 12/01/2037 | | | | 8,000,000 | | | | 8,000,000 | |
| | | | | | | | | | | | | | | | |
| | | | |
Nevada : 0.21% | | | | | | | | | | | | | | | | |
| | | | |
| Variable Rate Demand Notes § : 0.21% | | | | | | | | | | | | | | | | |
Clark County NV Southwest Gas Project Series A (Utilities Revenue, JPMorgan Chase & Company LOC) | | | 0.19 | | | | 03/01/2038 | | | | 29,000,000 | | | | 29,000,000 | |
Las Vegas NV EDFA Keep Memory Alive Project Series 2007A (Miscellaneous Revenue, PNC Bank NA LOC) | | | 0.15 | | | | 05/01/2037 | | | | 20,300,000 | | | | 20,300,000 | |
| | | | |
| | | | | | | | | | | | | | | 49,300,000 | |
| | | | | | | | | | | | | | | | |
| | | | |
New Hampshire : 0.22% | | | | | | | | | | | | | | | | |
| | | | |
| Variable Rate Demand Notes § : 0.22% | | | | | | | | | | | | | | | | |
New Hampshire HEFA St. Anselm College Series 2008 (Education Revenue, RBS Citizens NA LOC) | | | 0.15 | | | | 06/01/2038 | | | | 24,815,000 | | | | 24,815,000 | |
New Hampshire HEFA Taxable Series A (Miscellaneous Revenue, Royal Bank of Canada LOC) | | | 0.18 | | | | 12/01/2032 | | | | 27,305,000 | | | | 27,305,000 | |
| | | | |
| | | | | | | | | | | | | | | 52,120,000 | |
| | | | | | | | | | | | | | | | |
| | | | |
New Jersey : 0.21% | | | | | | | | | | | | | | | | |
| | | | |
| Variable Rate Demand Notes § : 0.21% | | | | | | | | | | | | | | | | |
New Jersey EDA Pivotal Utility Holdings Incorporated Project Series 2007 (Utilities Revenue, JPMorgan Chase Bank LOC) | | | 0.19 | | | | 06/01/2032 | | | | 24,000,000 | | | | 24,000,000 | |
New Jersey EDA Series A (Utilities Revenue, JPMorgan Chase Bank LOC) | | | 0.19 | | | | 06/01/2026 | | | | 16,000,000 | | | | 16,000,000 | |
North Hudson NJ Sewerage Authority Senior Lien Series C (Water & Sewer Revenue) | | | 0.19 | | | | 06/01/2044 | | | | 10,000,000 | | | | 10,000,000 | |
| | | | |
| | | | | | | | | | | | | | | 50,000,000 | |
| | | | | | | | | | | | | | | | |
The accompanying notes are an integral part of these financial statements.
| | | | | | |
| Portfolio of Investments—July 31, 2012 (Unaudited) | | Wells Fargo Advantage Heritage Money Market Fund | | | 19 | |
| | | | | | | | | | | | | | | | |
| Security Name | | Interest Rate | | | Maturity Date | | | Principal | | | Value | |
| | | | | | | | | | | | | | | | |
| | | | |
New Mexico : 0.12% | | | | | | | | | | | | | | | | |
| | | | |
| Variable Rate Demand Notes § : 0.12% | | | | | | | | | | | | | | | | |
New Mexico Educational Authority PFOTER Series 637 (Education Revenue) | | | 0.30 | % | | | 04/01/2037 | | | $ | 12,000,000 | | | $ | 12,000,000 | |
New Mexico Municipal Energy Acquisition Authority Gas Supply Series 2009 (Utilities Revenue, Royal Bank of Canada SPA) | | | 0.15 | | | | 11/01/2039 | | | | 17,270,000 | | | | 17,270,000 | |
| | | | |
| | | | | | | | | | | | | | | 29,270,000 | |
| | | | | | | | | | | | | | | | |
| | | | |
New York : 2.25% | | | | | | | | | | | | | | | | |
| | | | |
| Variable Rate Demand Notes § : 2.25% | | | | | | | | | | | | | | | | |
Abraham Joshua Hesehal School New York Series 2010 (Education Revenue, TD Bank NA LOC) | | | 0.19 | | | | 01/01/2040 | | | | 17,380,000 | | | | 17,380,000 | |
Metropolitan Transportation Authority of New York Dedicated Tax Fund Subseries B-1 (Transportation Revenue, State Street Bank & Trust Company LOC) | | | 0.14 | | | | 11/01/2022 | | | | 13,000,000 | | | | 13,000,000 | |
Metropolitan Transportation Authority of New York Series 2002-A ROC RR-II-R-11645 (Transportation Revenue, FSA Insured, Citibank NA LIQ) 144A | | | 0.30 | | | | 11/15/2025 | | | | 16,100,000 | | | | 16,100,000 | |
New York City NY Housing Development Corporation Mortgage Thessalonica Court Series A (Housing Revenue, Citibank NA LOC) | | | 0.18 | | | | 01/01/2036 | | | | 9,220,000 | | | | 9,220,000 | |
New York City NY Housing Development Corporation Via Verde Apartments Series A (Housing Revenue, JPMorgan Chase & Company LOC) | | | 0.26 | | | | 01/01/2016 | | | | 7,000,000 | | | | 7,000,000 | |
New York City NY Municipal Water Finance Authority Series B3 (Water & Sewer Revenue, Bank of America NA SPA) | | | 0.18 | | | | 06/15/2025 | | | | 57,360,000 | | | | 57,360,000 | |
New York City NY Municipal Water Finance Authority Subseries A-1 (Water & Sewer Revenue, Mizuho Corporate Bank SPA) | | | 0.15 | | | | 06/15/2044 | | | | 27,000,000 | | | | 27,000,000 | |
New York City NY Subseries J-10 (GO, Bank of Tokyo-Mitsubishi LOC) | | | 0.13 | | | | 08/01/2027 | | | | 12,700,000 | | | | 12,700,000 | |
New York City NY Subseries L-3 (GO, Bank of America NA SPA) | | | 0.18 | | | | 04/01/2036 | | | | 33,000,000 | | | | 33,000,000 | |
New York City NY Transitional Financing Authority Series C (Tax Revenue, Morgan Stanley Bank LOC) | | | 0.25 | | | | 05/01/2028 | | | | 28,000,000 | | | | 28,000,000 | |
New York HFA MFHR Second Mortgage Series A (Housing Revenue, FNMA Insured, FNMA LIQ) | | | 0.16 | | | | 05/01/2029 | | | | 74,505,000 | | | | 74,505,000 | |
New York HFA Victory Housing Project Series 2000-A (Housing Revenue, FHLMC Insured, FHLMC LIQ) | | | 0.17 | | | | 11/01/2033 | | | | 8,000,000 | | | | 8,000,000 | |
New York HFA Victory Housing Project Series 2004-A (Housing Revenue, FHLMC Insured) | | | 0.17 | | | | 11/01/2033 | | | | 2,000,000 | | | | 2,000,000 | |
New York State Dormitory Authority St. John University Series B-1 (Education Revenue, Bank of America NA LOC) | | | 0.25 | | | | 07/01/2034 | | | | 19,380,000 | | | | 19,380,000 | |
New York State HFA 600 West 42nd Street Series 2009-A (Housing Revenue, FHLMC Insured, FHLMC LIQ) | | | 0.14 | | | | 05/15/2041 | | | | 40,000,000 | | | | 40,000,000 | |
New York State HFA 600 West 42nd Street Series 2012-A (Housing Revenue, FNMA LIQ) | | | 0.17 | | | | 05/15/2041 | | | | 60,000,000 | | | | 60,000,000 | |
New York State Housing Finance Agency Series A (Housing Revenue) | | | 0.16 | | | | 05/15/2041 | | | | 50,000,000 | | | | 50,000,000 | |
New York State Liberty Development Corporation JPMorgan Chase PUTTER/DRIVER Trust Series 4011Z (Port Authority Revenue, GO of Authority Insured, JPMorgan Chase Bank LIQ) 144A | | | 0.16 | | | | 06/15/2019 | | | | 20,675,000 | | | | 20,675,000 | |
New York State Urban Development Corporate Revenue Series A3A (Tax Revenue, JPMorgan Chase & Company SPA) | | | 0.15 | | | | 03/15/2033 | | | | 24,150,000 | | | | 24,150,000 | |
New York State Urban Development Corporate Revenue Series A3D (Tax Revenue, JPMorgan Chase & Company SPA) | | | 0.15 | | | | 03/15/2033 | | | | 18,500,000 | | | | 18,500,000 | |
| | | | |
| | | | | | | | | | | | | | | 537,970,000 | |
| | | | | | | | | | | | | | | | |
The accompanying notes are an integral part of these financial statements.
| | | | |
| 20 | | Wells Fargo Advantage Heritage Money Market Fund | | Portfolio of Investments—July 31, 2012 (Unaudited) |
| | | | | | | | | | | | | | | | |
| Security Name | | Interest Rate | | | Maturity Date | | | Principal | | | Value | |
| | | | | | | | | | | | | | | | |
| | | | |
Ohio : 0.96% | | | | | | | | | | | | | | | | |
| | | | |
| Variable Rate Demand Notes § : 0.96% | | | | | | | | | | | | | | | | |
Allen County OH Catholic Healthcare Series C (Health Revenue, Union Bank NA LOC) | | | 0.15 | % | | | 06/01/2034 | | | $ | 25,500,000 | | | $ | 25,500,000 | |
Cleveland-Cuyahoga County OH Carnagie 89th Garage & Service Center LLC Project Series 2007 (Health Revenue, JPMorgan Chase Bank LOC) | | | 0.17 | | | | 01/01/2037 | | | | 32,765,000 | | | | 32,765,000 | |
Franklin County OH Health Care Facilities Presbyterian Series A (Health Revenue, PNC Bank NA LOC) | | | 0.15 | | | | 07/01/2036 | | | | 11,450,000 | | | | 11,450,000 | |
Hamilton County OH Parking System (Transportation Revenue, JPMorgan Chase & Company LOC) | | | 0.17 | | | | 12/01/2026 | | | | 11,900,000 | | | | 11,900,000 | |
Lancaster OH Port Authority Gas Series 2008 (Energy Revenue, Royal Bank of Canada SPA) | | | 0.15 | | | | 05/01/2038 | | | | 18,835,000 | | | | 18,835,000 | |
Montgomery County OH Catholic Health Series C-2 (Health Revenue, U.S. Bank NA SPA) | | | 0.16 | | | | 10/01/2041 | | | | 8,000,000 | | | | 8,000,000 | |
Ohio Housing Finance Agency Mortgage (Housing Revenue, FHLB SPA) | | | 0.16 | | | | 09/01/2036 | | | | 19,850,000 | | | | 19,850,000 | |
Ohio Housing Finance Agency Mortgage (Housing Revenue, Citibank NA SPA) | | | 0.25 | | | | 09/01/2036 | | | | 54,700,000 | | | | 54,700,000 | |
Ohio State Higher Education Facilities Ohio Dominican University Project (Education Revenue, JPMorgan Chase Bank LOC) | | | 0.17 | | | | 12/01/2037 | | | | 12,655,000 | | | | 12,655,000 | |
Wood County OH Hospital Facilities Wood County Hospital Association Project Series 2008 (Health Revenue, JPMorgan Chase Bank LOC) | | | 0.17 | | | | 03/01/2039 | | | | 33,350,000 | | | | 33,350,000 | |
| | | | |
| | | | | | | | | | | | | | | 229,005,000 | |
| | | | | | | | | | | | | | | | |
| | | | |
Oklahoma : 0.08% | | | | | | | | | | | | | | | | |
| | | | |
| Variable Rate Demand Note § : 0.08% | | | | | | | | | | | | | | | | |
Oklahoma Turnpike Authority Series F (Transportation Revenue, JPMorgan Chase Bank SPA) | | | 0.17 | | | | 01/01/2028 | | | | 18,000,000 | | | | 18,000,000 | |
| | | | | | | | | | | | | | | | |
| | | | |
Oregon : 0.11% | | | | | | | | | | | | | | | | |
| | | | |
| Variable Rate Demand Note § : 0.11% | | | | | | | | | | | | | | | | |
Port of Portland Oregon Special Obligation Bulk Terminal (Port Authority Revenue, Canadian Imperial Bank LOC) | | | 0.16 | | | | 03/01/2036 | | | | 27,300,000 | | | | 27,300,000 | |
| | | | | | | | | | | | | | | | |
| | | | |
Pennsylvania : 1.42% | | | | | | | | | | | | | | | | |
| | | | |
| Variable Rate Demand Notes § : 1.42% | | | | | | | | | | | | | | | | |
Allegheny County PA Hospital Development Authority University of Pittsburgh Medical Center Project Series 2007 B-2 (Health Revenue, Royal Bank of Canada LOC, Royal Bank of Canada LIQ) 144A | | | 0.15 | | | | 04/15/2039 | | | | 15,650,000 | | | | 15,650,000 | |
Allegheny County PA IDA Longwood Oakmont Incorporated Series 2011-A (Health Revenue, PNC Bank NA LOC) | | | 0.15 | | | | 12/01/2041 | | | | 30,980,000 | | | | 30,980,000 | |
Berks County PA Municipal Authority Royal Bank of Canada Municipal Products Incorporated Trust Certificates Series C-15 (Health Revenue, Royal Bank of Canada LOC) 144A (l) | | | 0.15 | | | | 11/01/2012 | | | | 9,970,000 | | | | 9,970,000 | |
Doylestown PA Hospital Authority Series B (Health Revenue, PNC Bank NA LOC) | | | 0.15 | | | | 07/01/2037 | | | | 38,100,000 | | | | 38,100,000 | |
Montgomery County PA IDA New Regional Medical Center PFOTER Series PT-4674 (Health Revenue, FHA Insured, Bank of America NA SPA) 144A | | | 0.23 | | | | 08/01/2038 | | | | 14,000,000 | | | | 14,000,000 | |
Montgomery County PA IDA Series 3238 (Health Revenue, FHA Insured, Morgan Stanley Bank LIQ) 144A | | | 0.23 | | | | 08/01/2030 | | | | 8,500,000 | | | | 8,500,000 | |
Pennsylvania Housing Finance Agency Series 100-C (Housing Revenue, JPMorgan Chase Bank SPA) | | | 0.20 | | | | 04/01/2038 | | | | 28,525,000 | | | | 28,525,000 | |
The accompanying notes are an integral part of these financial statements.
| | | | | | |
| Portfolio of Investments—July 31, 2012 (Unaudited) | | Wells Fargo Advantage Heritage Money Market Fund | | | 21 | |
| | | | | | | | | | | | | | | | |
| Security Name | | Interest Rate | | | Maturity Date | | | Principal | | | Value | |
| | | | | | | | | | | | | | | | |
| | | | |
| Variable Rate Demand Notes § (continued) | | | | | | | | | | | | | | | | |
Pennsylvania Housing Finance Agency Series 81C (Housing Revenue, Royal Bank of Canada SPA) | | | 0.16 | % | | | 10/01/2034 | | | $ | 14,900,000 | | | $ | 14,900,000 | |
Pennsylvania Housing Finance Agency Series 86B (Housing Revenue, Bank of Tokyo-Mitsubishi SPA) | | | 0.18 | | | | 04/01/2035 | | | | 20,000,000 | | | | 20,000,000 | |
Pennsylvania Housing Finance Agency Series 88B (Housing Revenue, GO of Agency Insured, PNC Bank NA SPA) | | | 0.17 | | | | 10/01/2036 | | | | 6,270,000 | | | | 6,270,000 | |
Pennsylvania Housing Finance Agency Series 89 (Housing Revenue, Bank of Tokyo-Mitsubishi SPA) | | | 0.18 | | | | 10/01/2035 | | | | 27,485,000 | | | | 27,485,000 | |
Pennsylvania Housing Finance Agency Series 93-B (Housing Revenue, JPMorgan Chase Bank SPA) | | | 0.20 | | | | 04/01/2037 | | | | 37,185,000 | | | | 37,185,000 | |
Pennsylvania Housing Finance Agency Series C (Housing Revenue, GO of Agency Housing & Urban Development Section 8 Insured, Bank of America NA SPA) | | | 0.22 | | | | 07/01/2020 | | | | 9,900,000 | | | | 9,900,000 | |
Pennsylvania Housing Finance PFOTER Series PT-4653 (Housing Revenue, Bank of America NA LIQ) 144A | | | 0.23 | | | | 10/01/2039 | | | | 12,725,000 | | | | 12,725,000 | |
Pennsylvania Turnpike Commission Series 2011 C-1 Royal Bank of Canada Municipal Products Incorporated Trust Series E-22 (Miscellaneous Revenue, Royal Bank of Canada LOC, Royal Bank of Canada LIQ) 144A | | | 0.15 | | | | 12/01/2038 | | | | 2,000,000 | | | | 2,000,000 | |
Pittsburgh & Allegheny County PA Sports & Exhibition Authority Series B (Miscellaneous Revenue, AGM Insured, PNC Bank NA SPA) | | | 0.47 | | | | 11/01/2039 | | | | 26,885,000 | | | | 26,885,000 | |
Southeastern Pennsylvania Transportation Authority Series 2007 (Tax Revenue, PNC Bank NA LOC) | | | 0.15 | | | | 03/01/2022 | | | | 35,510,000 | | | | 35,510,000 | |
| | | | |
| | | | | | | | | | | | | | | 338,585,000 | |
| | | | | | | | | | | | | | | | |
| | | | |
Puerto Rico : 0.13% | | | | | | | | | | | | | | | | |
| | | | |
| Variable Rate Demand Note § : 0.13% | | | | | | | | | | | | | | | | |
Puerto Rico Sales Tax Financing Corporation Series 3036 (Tax Revenue, Morgan Stanley Bank LIQ) | | | 0.17 | | | | 08/01/2057 | | | | 31,716,933 | | | | 31,716,933 | |
| | | | | | | | | | | | | | | | |
| | | | |
Rhode Island : 0.07% | | | | | | | | | | | | | | | | |
| | | | |
| Variable Rate Demand Note § : 0.07% | | | | | | | | | | | | | | | | |
Narragansett RI Bay Commission Series A (Water & Sewer Revenue, RBS Citizens Bank LOC) | | | 0.14 | | | | 09/01/2034 | | | | 15,700,000 | | | | 15,700,000 | |
| | | | | | | | | | | | | | | | |
| | | | |
South Carolina : 0.43% | | | | | | | | | | | | | | | | |
| | | | |
| Other Municipal Debt : 0.21% | | | | | | | | | | | | | | | | |
South Carolina Public Service Authority Series AA (Utilities Revenue) | | | 0.19 | | | | 08/21/2012 | | | | 6,000,000 | | | | 6,000,000 | |
South Carolina Public Service Authority Series AA (Utilities Revenue) | | | 0.19 | | | | 08/22/2012 | | | | 10,000,000 | | | | 10,000,000 | |
South Carolina Public Service Authority Series AA (Utilities Revenue) | | | 0.19 | | | | 08/27/2012 | | | | 9,001,000 | | | | 9,001,000 | |
South Carolina Public Service Authority Series CC (Utilities Revenue) | | | 0.18 | | | | 08/20/2012 | | | | 8,000,000 | | | | 8,000,000 | |
South Carolina Public Service Authority Series CC (Utilities Revenue) | | | 0.18 | | | | 08/23/2012 | | | | 2,900,000 | | | | 2,900,000 | |
York County SC PCR Natural Rural Utilities Cooperative Finance Corporation Guaranteed NC Electric Membership Corporation Project Series 200B-1 (Utilities Revenue) | | | 0.45 | | | | 09/04/2012 | | | | 5,000,000 | | | | 5,000,000 | |
York County SC PCR Natural Rural Utilities Cooperative Finance Corporation Guaranteed NC Electric Membership Corporation Project Series 200B-3 (Utilities Revenue) | | | 0.45 | | | | 09/04/2012 | | | | 10,550,000 | | | | 10,550,000 | |
| | | | |
| | | | | | | | | | | | | | | 51,451,000 | |
| | | | | | | | | | | | | | | | |
The accompanying notes are an integral part of these financial statements.
| | | | |
| 22 | | Wells Fargo Advantage Heritage Money Market Fund | | Portfolio of Investments—July 31, 2012 (Unaudited) |
| | | | | | | | | | | | | | | | |
| Security Name | | Interest Rate | | | Maturity Date | | | Principal | | | Value | |
| | | | | | | | | | | | | | | | |
| | | | |
| Variable Rate Demand Note § : 0.22% | | | | | | | | | | | | | | | | |
Greenville County SC School District Installment PFOTER Series 730 (Miscellaneous Revenue, Bank of America NA LIQ) 144A | | | 0.23 | % | | | 12/01/2028 | | | $ | 52,115,000 | | | $ | 52,115,000 | |
| | | | | | | | | | | | | | | | |
| | | | |
South Dakota : 0.11% | | | | | | | | | | | | | | | | |
| | | | |
| Variable Rate Demand Notes § : 0.11% | | | | | | | | | | | | | | | | |
South Dakota HEFA Sioux Valley Hospital & Health Systems Project Series 2001-C (Health Revenue, U.S. Bank NA LOC) | | | 0.16 | | | | 11/01/2019 | | | | 15,000,000 | | | | 15,000,000 | |
South Dakota Housing Development Authority Series C (Housing Revenue, FHLB SPA) | | | 0.16 | | | | 05/01/2037 | | | | 10,800,000 | | | | 10,800,000 | |
| | | | |
| | | | | | | | | | | | | | | 25,800,000 | |
| | | | | | | | | | | | | | | | |
| | | | |
Tennessee : 0.41% | | | | | | | | | | | | | | | | |
| | | | |
| Variable Rate Demand Notes § : 0.41% | | | | | | | | | | | | | | | | |
Chattanooga TN Industrial Development Board Bluecross Corporation (IDR) | | | 0.26 | | | | 01/01/2028 | | | | 23,000,000 | | | | 23,000,000 | |
Johnson City TN Health & Educational Facilities Board (Health Revenue, PNC Bank NA LOC) | | | 0.20 | | | | 07/01/2033 | | | | 7,415,000 | | | | 7,415,000 | |
Johnson City TN Health & Educational Facilities Board (Health Revenue, U.S. Bank NA LOC) | | | 0.21 | | | | 07/01/2033 | | | | 1,450,000 | | | | 1,450,000 | |
JPMorgan Chase PUTTER Trust Series 4149 (Tax Revenue, JPMorgan Chase Bank LOC) 144A | | | 0.18 | | | | 10/01/2013 | | | | 11,000,000 | | | | 11,000,000 | |
Knox County TN Health Educational and Housing Facilities Board Series A (Health Revenue, Bank of America NA LOC) | | | 0.19 | | | | 01/01/2033 | | | | 16,945,000 | | | | 16,945,000 | |
Nashville & Davidson County TN Metropolitan Government Stewarts Ferry Apartments Project (IDR, FHLMC Insured, FHLMC LIQ) | | | 0.16 | | | | 01/01/2034 | | | | 13,985,000 | | | | 13,985,000 | |
Sevier County TN Public Building Authority Local Government Public Improvement Series VI-L-1 (Miscellaneous Revenue, Municipal Government Guaranty Insured, Bank of America NA SPA) | | | 0.35 | | | | 06/01/2020 | | | | 24,370,000 | | | | 24,370,000 | |
| | | | |
| | | | | | | | | | | | | | | 98,165,000 | |
| | | | | | | | | | | | | | | | |
| | | | |
Texas : 3.93% | | | | | | | | | | | | | | | | |
| | | | |
| Variable Rate Demand Notes § : 3.93% | | | | | | | | | | | | | | | | |
Austin TX Airport System Series A (Airport Revenue, State Street Bank & Trust Company LOC) | | | 0.17 | | | | 11/15/2017 | | | | 13,200,000 | | | | 13,200,000 | |
Brazos River Authority Texas PCR Series D-2 (Utilities Revenue, Citibank NA LOC) | | | 0.20 | | | | 05/01/2033 | | | | 14,000,000 | | | | 14,000,000 | |
Calhoun Port Authority Texas Formosa Plastics Corporation Project A (IDR, Sumitomo Mitsui Banking Corporation LOC) 144A | | | 0.18 | | | | 09/01/2039 | | | | 13,900,000 | | | | 13,900,000 | |
Harris County TX Cultural Education Facilities Finance Corporation Hermann Health Series D2 (Health Revenue, JPMorgan Chase Bank LOC) | | | 0.16 | | | | 06/01/2029 | | | | 20,000,000 | | | | 20,000,000 | |
Lower Neches Valley TX IDA ExxonMobil Project (IDR) | | | 0.14 | | | | 05/01/2046 | | | | 30,280,000 | | | | 30,280,000 | |
Mission TX Economic Development Solid Waste Disposal IESI Corporation (Miscellaneous Revenue, Bank of America NA LOC) | | | 0.24 | | | | 04/01/2022 | | | | 9,000,000 | | | | 9,000,000 | |
North Texas Tollway Authority Revenue Series A (Transportation Revenue, Morgan Stanley Bank LOC) | | | 0.21 | | | | 01/01/2051 | | | | 12,500,000 | | | | 12,500,000 | |
North Texas Tollway Authority Revenue Series D (Transportation Revenue, JPMorgan Chase Bank LOC) | | | 0.17 | | | | 01/01/2049 | | | | 45,400,000 | | | | 45,400,000 | |
Port Arthur TX Navigation District Environmental Facilities Motiva Enterprises Project Subseries 2009A (IDR) | | | 0.16 | | | | 04/01/2040 | | | | 10,000,000 | | | | 10,000,000 | |
Port Arthur TX Navigation District Environmental Facilities Motiva Enterprises Project Subseries 2009B (Resource Recovery Revenue) | | | 0.15 | | | | 12/01/2039 | | | | 9,000,000 | | | | 9,000,000 | |
The accompanying notes are an integral part of these financial statements.
| | | | | | |
| Portfolio of Investments—July 31, 2012 (Unaudited) | | Wells Fargo Advantage Heritage Money Market Fund | | | 23 | |
| | | | | | | | | | | | | | | | |
| Security Name | | Interest Rate | | | Maturity Date | | | Principal | | | Value | |
| | | | | | | | | | | | | | | | |
| | | | |
| Variable Rate Demand Notes § (continued) | | | | | | | | | | | | | | | | |
Port Arthur TX Navigation District Environmental Facilities Motiva Enterprises Project Subseries 2009C (Resource Recovery Revenue) | | | 0.15 | % | | | 12/01/2039 | | | $ | 13,400,000 | | | $ | 13,400,000 | |
Port Arthur TX Navigation District Environmental Facilities Motiva Enterprises Project Subseries 2010A (IDR) | | | 0.16 | | | | 04/01/2040 | | | | 15,300,000 | | | | 15,300,000 | |
Port Arthur TX Navigation District Environmental Facilities Motiva Enterprises Project Subseries 2010D (IDR) | | | 0.16 | | | | 11/01/2040 | | | | 24,450,000 | | | | 24,450,000 | |
Port Arthur TX Navigation District Environmental Facilities Various Refunding Motiva Enterprises LLC Project Series 2010C (Resource Recovery Revenue) | | | 0.15 | | | | 04/01/2040 | | | | 15,100,000 | | | | 15,100,000 | |
Port Corpus Christi TX Flint Hills Resources Project Series 2007 (Resource Recovery Revenue) | | | 0.22 | | | | 01/01/2032 | | | | 5,000,000 | | | | 5,000,000 | |
Texas Municipal Gas Acquisition & Supply Corporation Series 2848 (Miscellaneous Revenue, Morgan Stanley Bank LIQ) | | | 0.45 | | | | 12/15/2026 | | | | 62,000,000 | | | | 62,000,000 | |
Texas Municipal Gas Acquisition & Supply Corporation Series 2849 (Miscellaneous Revenue, Morgan Stanley Bank LIQ) | | | 0.45 | | | | 12/15/2026 | | | | 18,000,000 | | | | 18,000,000 | |
Texas Taxable Product Development Program Series A (GO, National Australia Bank SPA) | | | 0.21 | | | | 06/01/2045 | | | | 2,100,000 | | | | 2,100,000 | |
Texas TRAN JPMorgan Chase PUTTER Trust Series 3942 (Miscellaneous Revenue, JPMorgan Chase Bank LIQ) 144A | | | 0.18 | | | | 08/30/2012 | | | | 110,000,000 | | | | 110,000,000 | |
Texas TRAN JPMorgan Chase PUTTER Trust Series 3945 (Miscellaneous Revenue, JPMorgan Chase Bank LIQ) 144A | | | 0.18 | | | | 08/30/2012 | | | | 90,000,000 | | | | 90,000,000 | |
Texas TRAN JPMorgan Chase PUTTER Trust Series 3946 (Miscellaneous Revenue, JPMorgan Chase Bank LIQ) 144A | | | 0.18 | | | | 08/30/2012 | | | | 86,820,000 | | | | 86,820,000 | |
Texas TRAN JPMorgan Chase PUTTER Trust Series 3953 (Miscellaneous Revenue, JPMorgan Chase Bank LIQ) 144A | | | 0.18 | | | | 08/30/2012 | | | | 100,710,000 | | | | 100,710,000 | |
Texas TRAN JPMorgan Chase PUTTER Trust Series 3964 (Miscellaneous Revenue, JPMorgan Chase Bank LIQ) 144A | | | 0.18 | | | | 08/30/2012 | | | | 91,000,000 | | | | 91,000,000 | |
Texas TRAN JPMorgan Chase PUTTER Trust Series 3984 (Miscellaneous Revenue, JPMorgan Chase Bank LIQ) 144A | | | 0.18 | | | | 08/30/2012 | | | | 104,595,000 | | | | 104,595,000 | |
Texas Veterans Housing Class ID (GO, JPMorgan Chase Bank SPA) | | | 0.21 | | | | 06/01/2020 | | | | 4,585,000 | | | | 4,585,000 | |
Texas Veterans Housing Class II Series E (GO, JPMorgan Chase Bank SPA) | | | 0.21 | | | | 12/01/2026 | | | | 20,560,000 | | | | 20,560,000 | |
| | | | |
| | | | | | | | | | | | | | | 940,900,000 | |
| | | | | | | | | | | | | | | | |
| | | | |
Utah : 0.04% | | | | | | | | | | | | | | | | |
| | | | |
| Variable Rate Demand Note § : 0.04% | | | | | | | | | | | | | | | | |
Utah State Board of Regents Student Loan Series A (Education Revenue, Royal Bank of Canada LOC) | | | 0.17 | | | | 11/01/2045 | | | | 9,229,000 | | | | 9,229,000 | |
| | | | | | | | | | | | | | | | |
| | | | |
Virginia : 0.03% | | | | | | | | | | | | | | | | |
| | | | |
| Variable Rate Demand Note § : 0.03% | | | | | | | | | | | | | | | | |
Virginia Small Business Financing Authority Hampton University Series 2008-A (Education Revenue, PNC Bank NA LOC) | | | 0.14 | | | | 12/01/2038 | | | | 8,000,000 | | | | 8,000,000 | |
| | | | | | | | | | | | | | | | |
| | | | |
Washington : 0.12% | | | | | | | | | | | | | | | | |
| | | | |
| Variable Rate Demand Notes § : 0.12% | | | | | | | | | | | | | | | | |
King City WA JPMorgan Chase PUTTER Trust Series 4058 (GO, JPMorgan Chase Bank LIQ) 144A | | | 0.18 | | | | 02/28/2013 | | | | 13,270,000 | | | | 13,270,000 | |
Seattle WA Municipal Light & Power JPMorgan Chase PUTTER Trust Series T0001 (Utilities Revenue, JPMorgan Chase Bank LIQ) 144A | | | 0.23 | | | | 02/01/2040 | | | | 8,000,000 | | | | 8,000,000 | |
Washington State Housing Finance Commission Regency Park Apartments Project Series A (Housing Revenue, FHLMC Insured, FHLMC LIQ) | | | 0.21 | | | | 06/01/2027 | | | | 7,805,000 | | | | 7,805,000 | |
| | | | |
| | | | | | | | | | | | | | | 29,075,000 | |
| | | | | | | | | | | | | | | | |
The accompanying notes are an integral part of these financial statements.
| | | | |
| 24 | | Wells Fargo Advantage Heritage Money Market Fund | | Portfolio of Investments—July 31, 2012 (Unaudited) |
| | | | | | | | | | | | | | | | |
| Security Name | | Interest Rate | | | Maturity Date | | | Principal | | | Value | |
| | | | | | | | | | | | | | | | |
| | | | |
Wisconsin : 0.24% | | | | | | | | | | | | | | | | |
| | | | |
| Variable Rate Demand Notes § : 0.24% | | | | | | | | | | | | | | | | |
Wisconsin Housing & EDA Home Ownership Series D (Housing Revenue, FNMA LOC, GO of Authority Insured) | | | 0.19 | % | | | 09/01/2035 | | | $ | 6,080,000 | | | $ | 6,080,000 | |
Wisconsin Housing & EDA Series F (Housing Revenue, GO of Authority Insured, Bank of Nova Scotia SPA) | | | 0.23 | | | | 05/01/2030 | | | | 8,135,000 | | | | 8,135,000 | |
Wisconsin Housing & EDA Series F (Housing Revenue, GO of Authority Insured, Bank of Nova Scotia SPA) | | | 0.23 | | | | 11/01/2030 | | | | 14,060,000 | | | | 14,060,000 | |
Wisconsin Public Power PUTTER Series 1232 (Utilities Revenue, BHAC-CR, AMBAC Insured, JPMorgan Chase & Company LIQ) | | | 0.19 | | | | 07/01/2013 | | | | 9,975,000 | | | | 9,975,000 | |
Wisconsin State HEFAR Medical College Series B (Education Revenue, U.S. Bank NA LOC) | | | 0.13 | | | | 12/01/2033 | | | | 18,700,000 | | | | 18,700,000 | |
| | | | |
| | | | | | | | | | | | | | | 56,950,000 | |
| | | | | | | | | | | | | | | | |
| | | | |
Wyoming : 0.33% | | | | | | | | | | | | | | | | |
| | | | |
| Variable Rate Demand Notes § : 0.33% | | | | | | | | | | | | | | | | |
Wyoming CDA (Housing Revenue, Bank of America NA SPA) | | | 0.21 | | | | 12/01/2032 | | | | 31,000,000 | | | | 31,000,000 | |
Wyoming Student Loan Corporation Series A-1 (Education Revenue, Royal Bank of Canada LOC) | | | 0.15 | | | | 06/01/2035 | | | | 11,215,000 | | | | 11,215,000 | |
Wyoming Student Loan Corporation Series A-3 (Education Revenue, Royal Bank of Canada LOC) | | | 0.15 | | | | 12/01/2043 | | | | 36,150,000 | | | | 36,150,000 | |
| | | | |
| | | | | | | | | | | | | | | 78,365,000 | |
| | | | | | | | | | | | | | | | |
| | | | |
Total Municipal Obligations (Cost $5,563,501,933) | | | | | | | | | | | | | | | 5,563,501,933 | |
| | | | | | | | | | | | | | | | |
| | | | |
| Other Instruments : 0.25% | | | | | | | | | | | | | | | | |
American Honda Finance Corporation Floating Rate Note 144A ± | | | 0.69 | | | | 08/28/2012 | | | | 27,000,000 | | | | 27,009,031 | |
City of Austin TX Municipal Commercial Paper (z) | | | 0.19 | | | | 08/09/2012 | | | | 9,165,000 | | | | 9,164,613 | |
District of Columbia Multimodal Revenue Municipal Commercial Paper | | | 0.18 | | | | 08/16/2012 | | | | 6,100,000 | | | | 6,100,000 | |
Oakland-Alameda County Series A-2 Municipal Commercial Paper | | | 0.23 | | | | 09/05/2012 | | | | 11,680,000 | | | | 11,680,000 | |
University of Chicago Series A Municipal Commercial Paper (z) | | | 0.18 | | | | 08/15/2012 | | | | 6,000,000 | | | | 5,999,580 | |
| | | | |
Total Other Instruments (Cost $59,953,224) | | | | | | | | | | | | | | | 59,953,224 | |
| | | | | | | | | | | | | | | | |
| | | | |
| Government Agency Debt : 2.12% | | | | | | | | | | | | | | | | |
FHLB ± | | | 0.30 | | | | 02/05/2013 | | | | 57,000,000 | | | | 56,988,153 | |
FHLB ± | | | 0.31 | | | | 03/07/2013 | | | | 84,000,000 | | | | 83,984,757 | |
FHLB ± | | | 0.31 | | | | 05/09/2013 | | | | 18,000,000 | | | | 17,995,777 | |
FHLB ± | | | 0.32 | | | | 03/28/2013 | | | | 87,500,000 | | | | 87,488,012 | |
FHLB ± | | | 0.33 | | | | 05/02/2013 | | | | 45,000,000 | | | | 44,993,124 | |
FHLB ± | | | 0.34 | | | | 04/01/2013 | | | | 88,000,000 | | | | 88,000,000 | |
FHLB ± | | | 0.34 | | | | 05/17/2013 | | | | 94,000,000 | | | | 94,000,000 | |
FHLB ± | | | 0.36 | | | | 05/17/2013 | | | | 33,000,000 | | | | 33,000,000 | |
| | | | |
Total Government Agency Debt (Cost $506,449,823) | | | | | | | | | | | | | | | 506,449,823 | |
| | | | | | | | | | | | | | | | |
| | | | |
Other Notes : 1.39% | | | | | | | | | | | | | | | | |
| | | | |
| Corporate Bonds and Notes : 1.39% | | | | | | | | | | | | | | | | |
JPMorgan Chase & Company ± | | | 0.62 | | | | 11/01/2012 | | | | 37,000,000 | | | | 37,021,401 | |
JPMorgan Chase & Company ± | | | 0.97 | | | | 09/21/2012 | | | | 43,000,000 | | | | 43,029,883 | |
JPMorgan Chase & Company ± | | | 1.12 | | | | 02/26/2013 | | | | 55,245,000 | | | | 55,391,165 | |
JPMorgan Chase Bank NA ± | | | 0.37 | | | | 11/21/2012 | | | | 23,000,000 | | | | 23,005,124 | |
The accompanying notes are an integral part of these financial statements.
| | | | | | |
| Portfolio of Investments—July 31, 2012 (Unaudited) | | Wells Fargo Advantage Heritage Money Market Fund | | | 25 | |
| | | | | | | | | | | | | | | | |
| Security Name | | Interest Rate | | | Maturity Date | | | Principal | | | Value | |
| | | | | | | | | | | | | | | | |
| | | | |
| Corporate Bonds and Notes (continued) | | | | | | | | | | | | | | | | |
JPMorgan Chase Bank NA ± | | | 0.49 | % | | | 11/16/2012 | | | $ | 10,000,000 | | | $ | 10,000,000 | |
JPMorgan Chase Bank NA ± | | | 0.53 | | | | 01/18/2013 | | | | 62,500,000 | | | | 62,494,210 | |
Toyota Motor Credit Corporation ± | | | 0.53 | | | | 07/19/2013 | | | | 102,000,000 | | | | 102,000,000 | |
| | | | |
Total Other Notes (Cost $332,941,783) | | | | | | | | | | | | | | | 332,941,783 | |
| | | | | | | | | | | | | | | | |
| | | | | | | | | | | | | | | | |
| | | | |
| Repurchase Agreements ^^: 10.24% | | | | | | | | | | | | | | | | |
Citigroup Global Markets, dated 07/31/2012, maturity value $316,001,580 (1) | | | 0.18 | | | | 08/01/2012 | | | | 316,000,000 | | | | 316,000,000 | |
Credit Suisse Securities, dated 07/31/2012, maturity value $372,001,860 (2) | | | 0.18 | | | | 08/01/2012 | | | | 372,000,000 | | | | 372,000,000 | |
Deutsche Bank Securities, dated 07/31/2012, maturity value $96,900,511 (3) | | | 0.19 | | | | 08/01/2012 | | | | 96,900,000 | | | | 96,900,000 | |
JPMorgan Securities, dated 07/31/2012, maturity value $190,001,319 (4) | | | 0.25 | | | | 08/01/2012 | | | | 190,000,000 | | | | 190,000,000 | |
Merrill Lynch Pierce Fenner & Smith, dated 07/31/2012, maturity value $410,002,164 (5) | | | 0.19 | | | | 08/01/2012 | | | | 410,000,000 | | | | 410,000,000 | |
Merrill Lynch Pierce Fenner & Smith, dated 07/31/2012, maturity value $145,000,644 (6) | | | 0.16 | | | | 08/01/2012 | | | | 145,000,000 | | | | 145,000,000 | |
Societe Generale New York, dated 07/31/2012, maturity value $220,001,406 (7) | | | 0.23 | | | | 08/01/2012 | | | | 220,000,000 | | | | 220,000,000 | |
Societe Generale New York, dated 07/31/2012, maturity value $700,003,694 (8) | | | 0.19 | | | | 08/01/2012 | | | | 700,000,000 | | | | 700,000,000 | |
| | | | |
Total Repurchase Agreements (Cost $2,449,900,000) | | | | | | | | | | | | | | | 2,449,900,000 | |
| | | | | | | | | | | | | | | | |
| | | | |
Treasury Debt : 2.61% | | | | | | | | | | | | | | | | |
U.S. Treasury Bill (z) | | | 0.12 | | | | 08/23/2012 | | | | 295,000,000 | | | | 294,977,872 | |
U.S. Treasury Bill (z) | | | 0.14 | | | | 10/04/2012 | | | | 82,000,000 | | | | 81,979,445 | |
U.S. Treasury Bill (z) | | | 0.14 | | | | 08/30/2012 | | | | 167,000,000 | | | | 166,980,735 | |
U.S. Treasury Bill (z) | | | 0.15 | | | | 10/11/2012 | | | | 80,000,000 | | | | 79,977,122 | |
| | | | |
Total Treasury Debt (Cost $623,915,174) | | | | | | | | | | | | | | | 623,915,174 | |
| | | | | | | | | | | | | | | | |
| | | | | | | | |
| | |
| Total Investments in Securities | | | | | | | | |
| (Cost $23,700,495,897)* | | | 99.07 | % | | | 23,700,495,897 | |
Other Assets and Liabilities, Net | | | 0.93 | | | | 223,360,729 | |
| | | | | | | | |
Total Net Assets | | | 100.00 | % | | $ | 23,923,856,626 | |
| | | | | | | | |
| ± | Variable rate investment |
| 144A | Security that may be resold to “qualified institutional buyers” under Rule 144A or security offered pursuant to Section 4(2) of the Securities Act of 1933, as amended. |
| (z) | Zero coupon security. Rate represents yield to maturity at time of purchase. |
| § | These securities are subject to a demand feature which reduces the effective maturity. |
| | (1) | U.S. government securities, 2.65% to 5.50%, 3/1/2017 to 7/1/2042, fair value including accrued interest is $325,480,000. |
| | (2) | U.S. government securities, 2.50% to 7.00%, 8/1/2013 to 8/1/2042, fair value including accrued interest is $383,161,090. |
| | (3) | U.S. government securities, 4.50% to 7.00%, 10/1/2038 to 7/1/2042, fair value including accrued interest is $99,807,000. |
| | (4) | U.S. government securities, 2.50% to 6.00%, 5/1/2020 to 7/1/2042, fair value including accrued interest is $195,700,279. |
| | (5) | U.S. government securities, 4.50%, 7/20/2041 to 8/20/2041, fair value including accrued interest is $422,300,000. |
| | (6) | U.S. government securities, 1.125% to 1.50%, 6/30/2016 to 1/15/2021, fair value including accrued interest is $147,900,038. |
| | (7) | U.S. government securities, 1.69% to 6.42%, 7/1/2017 to 5/1/2042, fair value including accrued interest is $226,600,000. |
| | (8) | U.S. government securities, 0.00% to 6.91%, 12/12/2014 to 4/1/2050, fair value including accrued interest is $720,953,860. |
| * | Cost for federal income tax purposes is substantially the same as for financial reporting purposes. |
The accompanying notes are an integral part of these financial statements.
| | | | |
| 26 | | Wells Fargo Advantage Heritage Money Market Fund | | Statement of Assets and Liabilities—July 31, 2012 (Unaudited) |
| | | | |
| | | | |
| |
Assets | | | | |
Investments | | | | |
In unaffiliated securities, at amortized cost | | $ | 21,250,595,897 | |
In repurchase agreements, at amortized cost | | | 2,449,900,000 | |
| | | | |
Total investments, at amortized cost | | | 23,700,495,897 | |
Cash | | | 58,597 | |
Receivable for investments sold | | | 223,597,624 | |
Receivable for Fund shares sold | | | 751,576 | |
Receivable for interest | | | 5,487,114 | |
Prepaid expenses and other assets | | | 97,954 | |
| | | | |
Total assets | | | 23,930,488,762 | |
| | | | |
| |
Liabilities | | | | |
Dividends payable | | | 1,300,728 | |
Payable for Fund shares redeemed | | | 852,038 | |
Advisory fee payable | | | 912,085 | |
Due to other related parties | | | 2,026,322 | |
Custodian and accounting fees payable | | | 575,325 | |
Trustees’ fees and expenses payable | | | 463,699 | |
Accrued expenses and other liabilities | | | 501,939 | |
| | | | |
Total liabilities | | | 6,632,136 | |
| | | | |
Total net assets | | $ | 23,923,856,626 | |
| | | | |
| |
NET ASSETS CONSIST OF | | | | |
Paid-in capital | | $ | 23,932,915,645 | |
Overdistributed net investment income | | | (519,010 | ) |
Accumulated net realized losses on investments | | | (8,540,009 | ) |
| | | | |
Total net assets | | $ | 23,923,856,626 | |
| | | | |
| |
COMPUTATION OF NET ASSET VALUE PER SHARE1 | | | | |
Net assets – Administrator Class | | $ | 327,863,706 | |
Shares outstanding – Administrator Class | | | 327,881,854 | |
Net asset value per share – Administrator Class | | | $1.00 | |
Net assets – Institutional Class | | $ | 8,569,625,633 | |
Shares outstanding – Institutional Class | | | 8,569,834,409 | |
Net asset value per share – Institutional Class | | | $1.00 | |
Net assets – Select Class | | $ | 14,175,312,364 | |
Shares outstanding – Select Class | | | 14,175,689,897 | |
Net asset value per share – Select Class | | | $1.00 | |
Net assets – Service Class | | $ | 851,054,923 | |
Shares outstanding – Service Class | | | 851,078,841 | |
Net asset value per share – Service Class | | | $1.00 | |
| 1. | The Fund has an unlimited number of authorized shares. |
The accompanying notes are an integral part of these financial statements.
| | | | | | |
| Statement of Operations—Six Months Ended July 31, 2012 (Unaudited) | | Wells Fargo Advantage Heritage Money Market Fund | | | 27 | |
| | | | |
| | | | |
| |
Investment income | | | | |
Interest | | $ | 28,283,150 | |
| | | | |
| |
Expenses | | | | |
Advisory fee | | | 12,436,114 | |
Administration fees | | | | |
Fund level | | | 4,476,736 | |
Administrator Class | | | 174,553 | |
Institutional Class | | | 3,756,264 | |
Select Class | | | 2,851,570 | |
Service Class | | | 525,004 | |
Shareholder servicing fees | | | | |
Administrator Class | | | 174,553 | |
Service Class | | | 1,056,655 | |
Custody and accounting fees | | | 587,138 | |
Professional fees | | | 28,434 | |
Registration fees | | | 61,218 | |
Shareholder report expenses | | | 40,170 | |
Trustees’ fees and expenses | | | 29 | |
Other fees and expenses | | | 171,937 | |
| | | | |
Total expenses | | | 26,340,375 | |
Less: Fee waivers and/or expense reimbursements | | | (6,454,667 | ) |
| | | | |
Net expenses | | | 19,885,708 | |
| | | | |
Net investment income | | | 8,397,442 | |
| | | | |
Net realized gains on investments | | | 166,332 | |
| | | | |
Net increase in net assets resulting from operations | | $ | 8,563,774 | |
| | | | |
The accompanying notes are an integral part of these financial statements.
| | | | |
| 28 | | Wells Fargo Advantage Heritage Money Market Fund | | Statement of Changes in Net Assets |
| | | | | | | | | | | | | | | | |
| | | Six Months Ended July 31, 2012 (Unaudited) | | | Year Ended January 31, 2012 | |
| | | | |
Operations | | | | | | | | | | | | | | | | |
Net investment income | | | | | | $ | 8,397,442 | | | | | | | $ | 38,122,997 | |
Net realized gains on investments | | | | | | | 166,332 | | | | | | | | 560,750 | |
| | | | | | | | | | | | | | | | |
Net increase in net assets resulting from operations | | | | | | | 8,563,774 | | | | | | | | 38,683,747 | |
| | | | | | | | | | | | | | | | |
| | | | |
Distributions to shareholders from | | | | | | | | | | | | | | | | |
Net investment income | | | | | | | | | | | | | | | | |
Administrator Class | | | | | | | (17,499 | ) | | | | | | | (60,427 | ) |
Institutional Class | | | | | | | (1,380,276 | ) | | | | | | | (7,283,767 | ) |
Select Class | | | | | | | (6,955,794 | ) | | | | | | | (30,671,556 | ) |
Service Class | | | | | | | (43,873 | ) | | | | | | | (107,247 | ) |
Net realized gains | | | | | | | | | | | | | | | | |
Administrator Class | | | | | | | 0 | | | | | | | | (1,107 | ) |
Institutional Class | | | | | | | 0 | | | | | | | | (39,864 | ) |
Select Class | | | | | | | 0 | | | | | | | | (57,745 | ) |
Service Class | | | | | | | 0 | | | | | | | | (2,536 | ) |
| | | | | | | | | | | | | | | | |
Total distributions to shareholders | | | | | | | (8,397,442 | ) | | | | | | | (38,224,249 | ) |
| | | | | | | | | | | | | | | | |
| | | | |
Capital share transactions | | | Shares | | | | | | | | Shares | | | | | |
Proceeds from shares sold | | | | | | | | | | | | | | | | |
Administrator Class | | | 597,989,629 | | | | 597,989,629 | | | | 1,729,301,118 | | | | 1,729,301,118 | |
Institutional Class | | | 29,866,419,467 | | | | 29,866,419,467 | | | | 79,868,865,049 | | | | 79,868,865,049 | |
Select Class | | | 48,276,741,980 | | | | 48,276,741,980 | | | | 181,368,899,601 | | | | 181,368,899,601 | |
Service Class | | | 1,679,021,618 | | | | 1,679,021,618 | | | | 4,705,951,971 | | | | 4,705,951,971 | |
| | | | | | | | | | | | | | | | |
| | | | | | | 80,420,172,694 | | | | | | | | 267,673,017,739 | |
| | | | | | | | | | | | | | | | |
Reinvestment of distributions | | | | | | | | | | | | | | | | |
Administrator Class | | | 8,465 | | | | 8,465 | | | | 24,310 | | | | 24,310 | |
Institutional Class | | | 367,011 | | | | 367,011 | | | | 1,705,105 | | | | 1,705,105 | |
Select Class | | | 2,702,203 | | | | 2,702,203 | | | | 16,489,304 | | | | 16,489,304 | |
Service Class | | | 8,637 | | | | 8,637 | | | | 21,546 | | | | 21,546 | |
| | | | | | | | | | | | | | | | |
| | | | | | | 3,086,316 | | | | | | | | 18,240,265 | |
| | | | | | | | | | | | | | | | |
Payment for shares redeemed | | | | | | | | | | | | | | | | |
Administrator Class | | | (644,507,751 | ) | | | (644,507,751 | ) | | | (2,049,786,165 | ) | | | (2,049,786,165 | ) |
Institutional Class | | | (32,386,780,369 | ) | | | (32,386,780,369 | ) | | | (83,725,804,748 | ) | | | (83,725,804,748 | ) |
Select Class | | | (49,457,983,480 | ) | | | (49,457,983,480 | ) | | | (192,662,513,528 | ) | | | (192,662,513,528 | ) |
Service Class | | | (1,821,314,298 | ) | | | (1,821,314,298 | ) | | | (4,944,176,567 | ) | | | (4,944,176,567 | ) |
| | | | | | | | | | | | | | | | |
| | | | | | | (84,310,585,898 | ) | | | | | | | (283,382,281,008 | ) |
| | | | | | | | | | | | | | | | |
Net decrease in net assets resulting from capital share transactions | | | | | | | (3,887,326,888 | ) | | | | | | | (15,691,023,004 | ) |
| | | | | | | | | | | | | | | | |
Total decrease in net assets | | | | | | | (3,887,160,556 | ) | | | | | | | (15,690,563,506 | ) |
| | | | | | | | | | | | | | | | |
| | | | |
Net assets | | | | | | | | | | | | | | | | |
Beginning of period | | | | | | | 27,811,017,182 | | | | | | | | 43,501,580,688 | |
| | | | | | | | | | | | | | | | |
End of period | | | | | | $ | 23,923,856,626 | | | | | | | $ | 27,811,017,182 | |
| | | | | | | | | | | | | | | | |
Overdistributed net investment income | | | | | | $ | (519,010 | ) | | | | | | $ | (519,010 | ) |
| | | | | | | | | | | | | | | | |
The accompanying notes are an integral part of these financial statements.
| | | | | | |
| Financial Highlights | | Wells Fargo Advantage Heritage Money Market Fund | | | 29 | |
(For a share outstanding throughout each period)
| | | | | | | | | | | | | | | | | | | | | | | | | | | | |
| | | Six Months Ended
July 31, 2012 (Unaudited) | | | Year Ended January 31, | | | Year Ended February 28, | |
| Administrator Class | | | 2012 | | | 20111 | | | 2010 | | | 2009 | | | 20082 | | | 2007 | |
Net asset value, beginning of period | | $ | 1.00 | | | $ | 1.00 | | | $ | 1.00 | | | $ | 1.00 | | | $ | 1.00 | | | $ | 1.00 | | | $ | 1.00 | |
Net investment income | | | 0.00 | 3 | | | 0.00 | 3 | | | 0.00 | 3 | | | 0.00 | 3 | | | 0.02 | | | | 0.05 | | | | 0.05 | |
Net realized gains on investments | | | 0.00 | 3 | | | 0.00 | 3 | | | 0.00 | 3 | | | 0.00 | 3 | | | 0.00 | | | | 0.00 | | | | 0.00 | |
| | | | | | | | | | | | | | | | | | | | | | | | | | | | |
Total from investment operations | | | 0.00 | 3 | | | 0.00 | 3 | | | 0.00 | 3 | | | 0.00 | 3 | | | 0.02 | | | | 0.05 | | | | 0.05 | |
Distributions to shareholders from | | | | | | | | | | | | | | | | | | | | | | | | | | | | |
Net investment income | | | (0.00 | )3 | | | (0.00 | )3 | | | (0.00 | )3 | | | (0.00 | )3 | | | (0.02 | ) | | | (0.05 | ) | | | (0.05 | ) |
Net realized gains | | | 0.00 | | | | (0.00 | )3 | | | (0.00 | )3 | | | (0.00 | )3 | | | (0.00 | )3 | | | 0.00 | | | | 0.00 | |
| | | | | | | | | | | | | | | | | | | | | | | | | | | | |
Total distributions to shareholders | | | (0.00 | )3 | | | (0.00 | )3 | | | (0.00 | )3 | | | (0.00 | )3 | | | (0.02 | ) | | | (0.05 | ) | | | (0.05 | ) |
Net asset value, end of period | | $ | 1.00 | | | $ | 1.00 | | | $ | 1.00 | | | $ | 1.00 | | | $ | 1.00 | | | $ | 1.00 | | | $ | 1.00 | |
Total return4 | | | 0.00 | % | | | 0.01 | % | | | 0.03 | % | | | 0.21 | % | | | 2.19 | % | | | 4.90 | % | | | 4.91 | % |
Ratios to average net assets (annualized) | | | | | | | | | | | | | | | | | | | | | | | | | | | | |
Gross expenses | | | 0.34 | % | | | 0.34 | % | | | 0.34 | % | | | 0.37 | % | | | 0.38 | % | | | 0.38 | % | | | 0.40 | % |
Net expenses | | | 0.22 | % | | | 0.24 | % | | | 0.31 | % | | | 0.33 | % | | | 0.34 | % | | | 0.34 | % | | | 0.38 | % |
Net investment income | | | 0.01 | % | | | 0.01 | % | | | 0.03 | % | | | 0.17 | % | | | 2.09 | % | | | 4.68 | % | | | 4.80 | % |
Supplemental data | | | | | | | | | | | | | | | | | | | | | | | | | | | | |
Net assets, end of period (000’s omitted) | | | $327,864 | | | | $374,371 | | | | $694,823 | | | | $1,201,158 | | | | $918,595 | | | | $608,865 | | | | $287,293 | |
| 1. | For the eleven months ended January 31, 2011. The Fund changed its fiscal year end from February 28 to January 31, effective January 31, 2011. |
| 2. | Year ended February 29. |
| 3. | Amount is less than $0.005. |
| 4. | Returns for periods of less than one year are not annualized. |
The accompanying notes are an integral part of these financial statements.
| | | | |
| 30 | | Wells Fargo Advantage Heritage Money Market Fund | | Financial Highlights |
(For a share outstanding throughout each period)
| | | | | | | | | | | | | | | | | | | | | | | | | | | | |
| | | Six Months Ended
July 31, 2012 (Unaudited) | | | Year Ended January 31, | | | Year Ended February 28, | |
| Institutional Class | | | 2012 | | | 20111 | | | 2010 | | | 2009 | | | 20082 | | | 2007 | |
Net asset value, beginning of period | | $ | 1.00 | | | $ | 1.00 | | | $ | 1.00 | | | $ | 1.00 | | | $ | 1.00 | | | $ | 1.00 | | | $ | 1.00 | |
Net investment income | | | 0.00 | 3 | | | 0.00 | 3 | | | 0.00 | 3 | | | 0.00 | 3 | | | 0.02 | | | | 0.05 | | | | 0.05 | |
Net realized gains on investments | | | 0.00 | 3 | | | 0.00 | 3 | | | 0.00 | 3 | | | 0.00 | 3 | | | 0.00 | | | | 0.00 | | | | 0.00 | |
| | | | | | | | | | | | | | | | | | | | | | | | | | | | |
Total from investment operations | | | 0.00 | 3 | | | 0.00 | 3 | | | 0.00 | 3 | | | 0.00 | 3 | | | 0.02 | | | | 0.05 | | | | 0.05 | |
Distributions to shareholders from | | | | | | | | | | | | | | | | | | | | | | | | | | | | |
Net investment income | | | (0.00 | )3 | | | (0.00 | )3 | | | (0.00 | )3 | | | (0.00 | )3 | | | (0.02 | ) | | | (0.05 | ) | | | (0.05 | ) |
Net realized gains | | | 0.00 | | | | (0.00 | )3 | | | (0.00 | )3 | | | (0.00 | )3 | | | (0.00 | )3 | | | 0.00 | | | | 0.00 | |
| | | | | | | | | | | | | | | | | | | | | | | | | | | | |
Total distributions to shareholders | | | (0.00 | )3 | | | (0.00 | )3 | | | (0.00 | )3 | | | (0.00 | )3 | | | (0.02 | ) | | | (0.05 | ) | | | (0.05 | ) |
Net asset value, end of period | | $ | 1.00 | | | $ | 1.00 | | | $ | 1.00 | | | $ | 1.00 | | | $ | 1.00 | | | $ | 1.00 | | | $ | 1.00 | |
Total return4 | | | 0.02 | % | | | 0.05 | % | | | 0.13 | % | | | 0.33 | % | | | 2.32 | % | | | 5.06 | % | | | 5.12 | % |
Ratios to average net assets (annualized) | | | | | | | | | | | | | | | | | | | | | | | | | | | | |
Gross expenses | | | 0.22 | % | | | 0.22 | % | | | 0.22 | % | | | 0.25 | % | | | 0.27 | % | | | 0.26 | % | | | 0.28 | % |
Net expenses | | | 0.20 | % | | | 0.20 | % | | | 0.20 | % | | | 0.21 | % | | | 0.22 | % | | | 0.20 | % | | | 0.18 | % |
Net investment income | | | 0.03 | % | | | 0.05 | % | | | 0.14 | % | | | 0.31 | % | | | 2.09 | % | | | 4.77 | % | | | 4.98 | % |
Supplemental data | | | | | | | | | | | | | | | | | | | | | | | | | | | | |
Net assets, end of period (000’s omitted) | | | $8,569,626 | | | | $11,089,557 | | | | $14,944,657 | | | | $7,795,659 | | | | $5,862,075 | | | | $1,579,225 | | | | $353,755 | |
| 1. | For the eleven months ended January 31, 2011. The Fund changed its fiscal year end from February 28 to January 31, effective January 31, 2011. |
| 2. | Year ended February 29. |
| 3. | Amount is less than $0.005. |
| 4. | Returns for periods of less than one year are not annualized. |
The accompanying notes are an integral part of these financial statements.
| | | | | | |
| Financial Highlights | | Wells Fargo Advantage Heritage Money Market Fund | | | 31 | |
(For a share outstanding throughout each period)
| | | | | | | | | | | | | | | | | | | | | | | | |
| | | Six Months Ended
July 31, 2012 (Unaudited) | | | Year Ended January 31, | | | Year Ended February 28, | |
| Select Class | | | 2012 | | | 20111 | | | 2010 | | | 2009 | | | 20082,3 | |
Net asset value, beginning of period | | $ | 1.00 | | | $ | 1.00 | | | $ | 1.00 | | | $ | 1.00 | | | $ | 1.00 | | | $ | 1.00 | |
Net investment income | | | 0.00 | 4 | | | 0.00 | 4 | | | 0.00 | 4 | | | 0.00 | 4 | | | 0.02 | | | | 0.03 | |
Net realized gains on investments | | | 0.00 | 4 | | | 0.00 | | | | 0.00 | 4 | | | 0.00 | | | | 0.00 | | | | 0.00 | |
| | | | | | | | | | | | | | | | | | | | | | | | |
Total from investment operations | | | 0.00 | 4 | | | 0.00 | 4 | | | 0.00 | 4 | | | 0.00 | 4 | | | 0.02 | | | | 0.03 | |
Distributions to shareholders from | | | | | | | | | | | | | | | | | | | | | | | | |
Net investment income | | | (0.00 | )4 | | | (0.00 | )4 | | | (0.00 | )4 | | | (0.00 | )4 | | | (0.02 | ) | | | (0.03 | ) |
Net realized gains | | | 0.00 | | | | (0.00 | )4 | | | (0.00 | )4 | | | (0.00 | )4 | | | 0.00 | | | | 0.00 | |
| | | | | | | | | | | | | | | | | | | | | | | | |
Total distributions to shareholders | | | (0.00 | )4 | | | (0.00 | )4 | | | (0.00 | )4 | | | (0.00 | )4 | | | (0.02 | ) | | | (0.03 | ) |
Net asset value, end of period | | $ | 1.00 | | | $ | 1.00 | | | $ | 1.00 | | | $ | 1.00 | | | $ | 1.00 | | | $ | 1.00 | |
Total return5 | | | 0.05 | % | | | 0.12 | % | | | 0.19 | % | | | 0.40 | % | | | 2.40 | % | | | 3.30 | % |
Ratios to average net assets (annualized) | | | | | | | | | | | | | | | | | | | | | | | | |
Gross expenses | | | 0.18 | % | | | 0.18 | % | | | 0.18 | % | | | 0.20 | % | | | 0.23 | % | | | 0.22 | % |
Net expenses | | | 0.13 | % | | | 0.13 | % | | | 0.13 | % | | | 0.14 | % | | | 0.15 | % | | | 0.13 | % |
Net investment income | | | 0.10 | % | | | 0.12 | % | | | 0.21 | % | | | 0.30 | % | | | 2.14 | % | | | 4.58 | % |
Supplemental data | | | | | | | | | | | | | | | | | | | | | | | | |
Net assets, end of period (000’s omitted) | | $ | 14,175,312 | | | $ | 15,353,756 | | | $ | 26,630,573 | | | $ | 22,489,644 | | | $ | 6,066,768 | | | $ | 1,368,330 | |
| 1. | For the eleven months ended January 31, 2011. The Fund changed its fiscal year end from February 28, to January 31, effective January 31, 2011. |
| 2. | For the period from June 29, 2007 (commencement of class operations) to February 29, 2008. |
| 3. | Year ended February 29. |
| 4. | Amount is less than $0.005 per share. |
| 5. | Returns for periods of less than one year are not annualized. |
The accompanying notes are an integral part of these financial statements.
| | | | |
| 32 | | Wells Fargo Advantage Heritage Money Market Fund | | Financial Highlights |
(For a share outstanding throughout each period)
| | | | | | | | | | | | |
Service Class | | Six Months Ended
July 31, 2012 (Unaudited) | | | Year Ended January 31, | |
| | | 2012 | | | 20111 | |
Net asset value, beginning of period | | $ | 1.00 | | | $ | 1.00 | | | $ | 1.00 | |
Net investment income | | | 0.00 | 2 | | | 0.00 | 2 | | | 0.00 | 2 |
Net realized gains on investments | | | 0.00 | 2 | | | 0.00 | 2 | | | 0.00 | 2 |
| | | | | | | | | | | | |
Total from investment operations | | | 0.00 | 2 | | | 0.00 | 2 | | | 0.00 | 2 |
Distributions to shareholders from | | | | | | | | | | | | |
Net investment income | | | (0.00 | )2 | | | (0.00 | )2 | | | (0.00 | )2 |
Net realized gains | | | 0.00 | | | | (0.00 | )2 | | | (0.00 | )2 |
| | | | | | | | | | | | |
Total distributions to shareholders | | | (0.00 | )2 | | | (0.00 | )2 | | | (0.00 | )2 |
Net asset value, end of period | | $ | 1.00 | | | $ | 1.00 | | | $ | 1.00 | |
Total return3 | | | 0.00 | % | | | 0.01 | % | | | 0.01 | % |
Ratios to average net assets (annualized) | | | | | | | | | | | | |
Gross expenses | | | 0.50 | % | | | 0.51 | % | | | 0.51 | % |
Net expenses | | | 0.22 | % | | | 0.24 | % | | | 0.34 | % |
Net investment income | | | 0.01 | % | | | 0.01 | % | | | 0.01 | % |
Supplemental data | | | | | | | | | | | | |
Net assets, end of period (000’s omitted) | | $ | 851,055 | | | $ | 993,333 | | | $ | 1,231,527 | |
| 1. | For the period from June 30, 2010 (commencement of class operations) to January 31, 2011. |
| 2. | Amount is less than $0.005. |
| 3. | Returns for periods of less than one year are not annualized. |
The accompanying notes are an integral part of these financial statements.
| | | | | | |
| Notes to Financial Statements (Unaudited) | | Wells Fargo Advantage Heritage Money Market Fund | | | 33 | |
1. ORGANIZATION
Wells Fargo Fund Trust (the “Trust”), a Delaware statutory trust organized on March 10, 1999, is an open-end management investment company registered under the Investment Company Act of 1940, as amended (the “1940 Act”). These financial statements report on Wells Fargo Advantage Heritage Money Market Fund (the “Fund”) which is a diversified series of the Trust.
2. SIGNIFICANT ACCOUNTING POLICIES
The following significant accounting policies, which are consistently followed in the preparation of the financial statements of the Fund, are in conformity with U.S. generally accepted accounting principles which require management to make estimates and assumptions that affect the reported amounts of assets and liabilities, disclosure of contingent assets and liabilities at the date of the financial statements, and the reported amounts of revenues and expenses during the reporting period. Actual results could differ from those estimates.
Securities valuation
As permitted under Rule 2a-7 of the 1940 Act, portfolio securities are valued at amortized cost, which approximates fair value. The amortized cost method involves valuing a security at its cost, plus accretion of discount or minus amortization of premium over the period until maturity.
Investments which are not valued using the method discussed above are valued at their fair value, as determined by procedures established in good faith and approved by the Board of Trustees. The Board of Trustees has established a Valuation Committee comprised of the Trustees and has delegated to it the authority to take any actions regarding the valuation of portfolio securities that the Valuation Committee deems necessary in determining the fair value of portfolio securities, unless the responsibility has been delegated to the Management Valuation Team of Wells Fargo Funds Management, LLC (“Funds Management”). The Board of Trustees retains the authority to make or ratify any valuation decisions or approve any changes to the Valuation Procedures as it deems appropriate. On a quarterly basis, the Board of Trustees considers for ratification any valuation actions taken by the Valuation Committee or the Management Valuation Team.
Valuations of fair valued prices are compared to the next actual sales price when available, or other appropriate market information to assess the continued appropriateness of the fair valuation methodology used. These securities are fair valued on a day-to-day basis, taking into consideration changes to appropriate market information and any significant changes to the input factors considered in the valuation process until there is a readily available price provided on the exchange or by an independent pricing service. Valuations received from an independent pricing service or broker quotes are periodically validated by comparisons to most recent trades and valuations provided by other independent pricing services in addition to the review of prices by the adviser and/or sub-adviser. Unobservable inputs used in determining fair valuations are identified based on the type of security, taking into consideration factors utilized by market participants in valuing the investment, knowledge about the issuer and the current market environment.
Repurchase agreements
The Fund may invest in repurchase agreements and may participate in pooled repurchase agreement transactions with other funds advised by Funds Management. The repurchase agreements must be fully collateralized based on values that are marked-to-market daily. The collateral may be held by an agent bank under a tri-party agreement. It is the custodian’s responsibility to value collateral daily and to take action to obtain additional collateral as necessary to maintain market value equal to or greater than the resale price. The repurchase agreements are collateralized by instruments such as U.S. Treasury, federal agency, or high-grade corporate obligations. There could be potential loss to the Fund in the event that the Fund is delayed or prevented from exercising its rights to dispose of the collateral, including the risk of a possible decline in the value of the underlying obligations during the period in which the Fund seeks to assert its rights.
Security transactions and income recognition
Securities transactions are recorded on a trade date basis. Realized gains or losses are reported on the basis of identified cost of securities delivered.
| | | | |
| 34 | | Wells Fargo Advantage Heritage Money Market Fund | | Notes to Financial Statements (Unaudited) |
Interest income is accrued daily and bond discounts are accreted and premiums are amortized daily based on the effective interest method. To the extent debt obligations are placed on non-accrual status, any related interest income may be reduced by writing off interest receivables when the collection of all or a portion of interest has become doubtful based on consistently applied procedures. If the issuer subsequently resumes interest payments or when the collectability of interest is reasonably assured, the debt obligation is removed from non-accrual status.
Distributions to shareholders
Distributions to shareholders from net investment income are accrued daily and paid monthly. Distributions from net realized gains, if any, are recorded on the ex-dividend date. Such distributions are determined in conformity with income tax regulations, which may differ from generally accepted accounting principles.
Federal and other taxes
The Fund intends to continue to qualify as a regulated investment company by distributing substantially all of its investment company taxable income and any net realized capital gains (after reduction for capital loss carryforwards) sufficient to relieve it from all, or substantially all, federal income taxes. Accordingly, no provision for federal income taxes was required.
The Fund’s income and federal excise tax returns and all financial records supporting those returns for the prior three fiscal years are subject to examination by the federal and Delaware revenue authorities. Management has analyzed the Fund’s tax positions taken on federal, state, and foreign tax returns for all open tax years and does not believe that there are any uncertain tax positions that require recognition of a tax liability.
As of January 31, 2012, the Fund had net capital loss carryforwards, which were available to offset future net realized capital gains, in the amount of $8,706,341 expiring in 2017.
Class allocations
The separate classes of shares offered by the Fund differ principally in shareholder servicing and administration fees. Shareholders of each class bear certain expenses that pertain to that particular class. All shareholders bear the common expenses of the Fund, earn income from the portfolio, and are allocated any unrealized gains and losses pro rata based on the average daily net assets of each class, without distinction between share classes. Dividends are determined separately for each class based on income and expenses allocable to each class. Realized gains and losses are allocated to each class pro rata based upon the net assets of each class on the date realized. Differences in per share dividend rates generally result from the relative weightings of pro rata income and realized gain allocations and from differences in separate class expenses, including shareholder servicing and administration fees.
3. FAIR VALUATION MEASUREMENTS
Fair value measurements of investments are determined within a framework that has established a fair value hierarchy based upon the various data inputs utilized in determining the value of the Fund’s investments. The three-level hierarchy gives the highest priority to unadjusted quoted prices in active markets for identical assets or liabilities (Level 1) and the lowest priority to significant unobservable inputs (Level 3). The Fund’s investments are classified within the fair value hierarchy based on the lowest level of input that is significant to the fair value measurement. The inputs are summarized into three broad levels as follows:
| n | | Level 1 – quoted prices in active markets for identical securities |
| n | | Level 2 – other significant observable inputs (including quoted prices for similar securities, interest rates, prepayment speeds, credit risk, etc.) |
| n | | Level 3 – significant unobservable inputs (including the Fund’s own assumptions in determining the fair value of investments) |
The inputs or methodologies used for valuing securities are not necessarily an indication of the risk associated with investing in those securities.
| | | | | | |
| Notes to Financial Statements (Unaudited) | | Wells Fargo Advantage Heritage Money Market Fund | | | 35 | |
At July 31, 2012, all of the Fund’s investments in securities carried at fair value were designated as Level 2 since the primary inputs include credit quality of the issuer and short-term interest rates which are observable.
Further details on the major security types can be found in the Portfolio of Investments.
Transfers in and transfers out are recognized at the end of the reporting period. For the six months ended July 31, 2012, the Fund did not have any transfers into/out of Level 1 and Level 2.
4. TRANSACTIONS WITH AFFILIATES AND OTHER EXPENSES
Advisory fee
The Trust has entered into an advisory contract with Funds Management, an indirect wholly owned subsidiary of Wells Fargo & Company (“Wells Fargo”). The adviser is responsible for implementing investment policies and guidelines and for supervising the sub-adviser, who is responsible for day-to-day portfolio management of the Fund.
Pursuant to the contract, Funds Management is entitled to receive an annual advisory fee of 0.10% of the Fund’s average daily net assets.
Funds Management has retained the services of a sub-adviser to provide daily portfolio management to the Fund. The fee for sub-advisory services is borne by Funds Management. Wells Capital Management Incorporated, an affiliate of Funds Management, is the sub-adviser to the Fund and is entitled to receive a fee from Funds Management at an annual rate starting at 0.05% and declining to 0.01% as the average daily net assets of the Fund increase.
Administration and transfer agent fees
The Trust has entered into an administration agreement with Funds Management. Under this agreement, for providing administrative services, which includes paying fees and expenses for services provided by the transfer agent, sub-transfer agents, omnibus account servicers and record-keepers, Funds Management is entitled to receive from the Fund an annual fund level administration fee starting at 0.05% and declining to 0.03% as the average daily net assets of the Fund increase and a class level administration fee which is calculated based on the average daily net assets of each class as follows:
| | | | |
| | | Class Level Administration Fee | |
Administrator Class | | | 0.10 | % |
Institutional Class | | | 0.08 | |
Select Class | | | 0.04 | |
Service Class | | | 0.12 | |
Funds Management has contractually waived and/or reimbursed advisory and administration fees to the extent necessary to maintain certain net operating expense ratios for the Fund. Waiver of fees and/or reimbursement of expenses by Funds Management were made first from fund level expenses on a proportionate basis and then from class specific expenses. Funds Management has committed through July 11, 2013 to waive fees and/or reimburse expenses to the extent necessary to cap the Fund’s expenses at 0.35% for Administrator Class, 0.20% for Institutional Class, 0.13% for Select Class and 0.43% for Service Class.
Shareholder servicing fees
The Trust has entered into contracts with one or more shareholder servicing agents, whereby Service Class and Administrator Class of the Fund is charged a fee at an annual rate of 0.25% and 0.10% of their average daily net assets, respectively.
A portion of these total shareholder servicing fees were paid to affiliates of Wells Fargo.
| | | | |
| 36 | | Wells Fargo Advantage Heritage Money Market Fund | | Notes to Financial Statements (Unaudited) |
5. INDEMNIFICATION
Under the Trust’s organizational documents, the officers and directors are indemnified against certain liabilities that may arise out of performance of their duties to the Trust. Additionally, in the normal course of business, the Trust may enter into contracts with service providers that contain a variety of indemnification clauses. The Trust’s maximum exposure under these arrangements is dependent on future claims that may be made against the Fund and, therefore, cannot be estimated.
6. NEW ACCOUNTING PRONOUNCEMENT
In December 2011, the Financial Accounting Standards Board (“FASB”) issued Accounting Standard Update (“ASU”) No. 2011-11, Disclosures about Offsetting Assets and Liabilities. ASU 2011-11, which amends FASB ASC Topic 210, Balance Sheet, creates new disclosure requirements which require entities to disclose both gross and net information for derivatives and other financial instruments that are either offset in the Statement of Assets and Liabilities or subject to an enforceable master netting arrangement or similar agreement. The disclosure requirements are effective for interim and annual reporting periods beginning on or after January 1, 2013. Management is currently assessing the potential impact, in addition to expanded financial statement disclosure, that may result from adopting this ASU.
| | | | | | |
| Other Information (Unaudited) | | Wells Fargo Advantage Heritage Money Market Fund | | | 37 | |
PROXY VOTING INFORMATION
A description of the policies and procedures that the Fund uses to determine how to vote proxies relating to portfolio securities is available without charge, upon request, by calling 1-800-222-8222, visiting our Web site at wellsfargoadvantagefunds.com, or visiting the SEC Web site at sec.gov. Information regarding how the Fund voted proxies relating to portfolio securities during the most recent 12-month period ended June 30 is available without charge on the Fund’s Web site at wellsfargoadvantagefunds.com or by visiting the SEC Web site at sec.gov.
PORTFOLIO HOLDINGS INFORMATION
The complete portfolio holdings for each Fund are publicly available on the Funds’ Web site (wellsfargoadvantagefunds.com) on a monthly, seven-day delayed basis. The Fund files its complete schedule of portfolio holdings with the SEC for the first and third quarters of each fiscal year on Form N-Q, which is available without charge by visiting the SEC Web site at sec.gov. In addition, each Fund’s Form N-Q may be reviewed and copied at the SEC’s Public Reference Room in Washington, DC, and at regional offices in New York City, at 233 Broadway, and in Chicago, at 175 West Jackson Boulevard, Suite 900. Information about the Public Reference Room may be obtained by calling 1-800-SEC-0330.
| | | | |
| 38 | | Wells Fargo Advantage Heritage Money Market Fund | | Other Information (Unaudited) |
BOARD OF TRUSTEES AND OFFICERS
Each of the Trustees and Officers listed in the table below acts in identical capacities for the Wells Fargo Advantage family of funds, which consists of 138 funds comprising the Wells Fargo Funds Trust, Wells Fargo Variable Trust, Wells Fargo Master Trust and four closed-end funds (collectively the “Fund Complex”). This table should be read in conjunction with the Prospectus and the Statement of Additional Information1. All of the Trustees are also Members of the Audit and Governance Committees of each Trust in the Fund Complex. The mailing address of each Trustee and Officer is 525 Market Street, 12th Floor, San Francisco, CA 94105. Each Trustee and Officer serves an indefinite term, however, each Trustee serves such term until reaching the mandatory retirement age established by the Trustees.
Independent Trustees
| | | | | | |
Name and Year of Birth | | Position Held and Length of Service* | | Principal Occupations During Past Five Years | | Other Directorships During
Past Five Years |
Peter G. Gordon
(Born 1942) | | Trustee, since 1998, Chairman, since 2005 | | Co-Founder, Retired Chairman, President and CEO of Crystal Geyser Water Company. Trustee Emeritus, Colby College | | Asset Allocation Trust |
Isaiah Harris, Jr.
(Born 1952) | | Trustee, since 2009 | | Retired. Prior thereto, President and CEO of BellSouth Advertising and Publishing Corp. from 2005 to 2007, President and CEO of BellSouth Enterprises from 2004 to 2005 and President of BellSouth Consumer Services from 2000 to 2003. Emeritus member of the Iowa State University Foundation Board of Governors. Emeritus Member of the Advisory Board of Iowa State University School of Business. Mr. Harris is a certified public accountant. | | CIGNA Corporation; Deluxe Corporation; Asset Allocation Trust |
Judith M. Johnson
(Born 1949) | | Trustee, since 2008 Audit Committee Chairman, since 2008 | | Retired. Prior thereto, Chief Executive Officer and Chief Investment Officer of Minneapolis Employees Retirement Fund from 1996 to 2008. Ms. Johnson is an attorney, certified public accountant and a certified managerial accountant. | | Asset Allocation Trust |
Leroy Keith, Jr.
(Born 1939) | | Trustee, since 2010 | | Chairman, Bloc Global Services (development and construction). Trustee of the Evergreen Funds from 1983 to 2010. Former Managing Director, Almanac Capital Management (commodities firm), former Partner, Stonington Partners, Inc. (private equity fund), former Director, Obagi Medical Products Co. and former Director, Lincoln Educational Services. | | Trustee, Virtus Fund Complex (consisting of 40 portfolios as of 12/31/11); Asset Allocation Trust |
David F. Larcker
(Born 1950) | | Trustee, since 2009 | | James Irvin Miller Professor of Accounting at the Graduate School of Business, Stanford University, Director of Corporate Governance Research Program and Senior Faculty of The Rock Center for Corporate Governance since 2006. From 2005 to 2008, Professor of Accounting at the Graduate School of Business, Stanford University. Prior thereto, Ernst & Young Professor of Accounting at The Wharton School, University of Pennsylvania from 1985 to 2005. | | Asset Allocation Trust |
Olivia S. Mitchell
(Born 1953) | | Trustee, since 2006 | | International Foundation of Employee Benefit Plans Professor, Wharton School of the University of Pennsylvania since 1993. Director of Wharton’s Pension Research Council and Boettner Center on Pensions & Retirement Research, and Research Associate at the National Bureau of Economic Research. Previously, Cornell University Professor from 1978 to 1993. | | Asset Allocation Trust |
Timothy J. Penny
(Born 1951) | | Trustee, since 1996 | | President and CEO of Southern Minnesota Initiative Foundation, a non-profit organization, since 2007 and Senior Fellow at the Humphrey Institute Policy Forum at the University of Minnesota since 1995. Member of the Board of Trustees of NorthStar Education Finance, Inc., a non-profit organization, since 2007. | | Asset Allocation Trust |
| | | | | | |
| Other Information (Unaudited) | | Wells Fargo Advantage Heritage Money Market Fund | | | 39 | |
| | | | | | |
Name and Year of Birth | | Position Held and Length of Service* | | Principal Occupations During Past Five Years | | Other Directorships During
Past Five Years |
Michael S. Scofield
(Born 1943) | | Trustee, since 2010 | | Served on the Investment Company Institute’s Board of Governors and Executive Committee from 2008-2011 as well the Governing Council of the Independent Directors Council from 2006-2011 and the Independent Directors Council Executive Committee from 2008-2011. Chairman of the IDC from 2008-2010. Institutional Investor (Fund Directions) Trustee of Year in 2007. Trustee of the Evergreen Funds (and its predecessors) from 1984 to 2010. Chairman of the Evergreen Funds from 2000-2010. Former Trustee of the Mentor Funds. Retired Attorney, Law Offices of Michael S. Scofield and former Director and Chairman, Branded Media Corporation (multi-media branding company). | | Asset Allocation Trust |
Donald C. Willeke
(Born 1940) | | Trustee, since 1996 | | Principal of the law firm of Willeke & Daniels. General Counsel of the Minneapolis Employees Retirement Fund from 1984 until its consolidation into the Minnesota Public Employees Retirement Association on June 30, 2010. Director and Vice Chair of The Free Trust (non-profit corporation). Director of the American Chestnut Foundation (non-profit corporation). | | Asset Allocation Trust |
| * | Length of service dates reflect the Trustee’s commencement of service with the Trust’s predecessor entities, where applicable. |
Officers
| | | | | | |
Name and Year of Birth | | Position Held and
Length of Service | | Principal Occupations During Past Five Years | | |
Karla M. Rabusch
(Born 1959) | | President, since 2003 | | Executive Vice President of Wells Fargo Bank, N.A. and President of Wells Fargo Funds Management, LLC since 2003. Senior Vice President and Chief Administrative Officer of Wells Fargo Funds Management, LLC from 2001 to 2003. | | |
C. David Messman
(Born 1960) | | Secretary, since 2000; Chief Legal Officer, since 2003 | | Senior Vice President and Secretary of Wells Fargo Funds Management, LLC since 2001. Vice President and Managing Senior Counsel of Wells Fargo Bank, N.A. since 1996. | | |
Nancy Wiser (Born 1967) | | Treasurer, since 2012 | | Executive Vice President of Wells Fargo Funds Management, LLC since 2011. Chief Operating Officer and Chief Compliance Officer at LightBox Capital Management LLC, from 2008 to 2011. Owned and operated a consulting business providing services to various hedge funds including acting as Chief Operating Officer and Chief Compliance Officer for a hedge fund from 2007 to 2008. Chief Operating Officer and Chief Compliance Officer of GMN Capital LLC from 2006 to 2007. | | |
David Berardi
(Born 1975) | | Assistant Treasurer, since 2009 | | Vice President of Wells Fargo Funds Management, LLC since 2009. Vice President of Evergreen Investment Management Company, LLC from 2008 to 2010. Assistant Vice President of Evergreen Investment Services, Inc. from 2004 to 2008. Manager of Fund Reporting and Control for Evergreen Investment Management Company, LLC from 2004 to 2010. | | |
Jeremy DePalma
(Born 1974) | | Assistant Treasurer, since 2009 | | Senior Vice President of Wells Fargo Funds Management, LLC since 2009. Senior Vice President of Evergreen Investment Management Company, LLC from 2008 to 2010. Vice President, Evergreen Investment Services, Inc. from 2004 to 2007. Head of the Fund Reporting and Control Team within Fund Administration from 2005 to 2010. | | |
Debra Ann Early
(Born 1964) | | Chief Compliance Officer, since 2007 | | Chief Compliance Officer of Wells Fargo Funds Management, LLC since 2007. Chief Compliance Officer of Parnassus Investments from 2005 to 2007. Chief Financial Officer of Parnassus Investments from 2004 to 2007 and Senior Audit Manager of PricewaterhouseCoopers LLP from 1998 to 2004. | | |
| 1. | The Statement of Additional Information includes additional information about the Trustees and is available, without charge, upon request, by calling 1-800-222-8222 or by visiting the Web site at wellsfargoadvantagefunds.com. |
| | | | |
| 40 | | Wells Fargo Advantage Heritage Money Market Fund | | Other Information (Unaudited) |
BOARD CONSIDERATION OF INVESTMENT ADVISORY AND SUB-ADVISORY AGREEMENTS:
Under Section 15 of the Investment Company Act of 1940 (the “1940 Act”), the Board of Trustees (the “Board”) of Wells Fargo Funds Trust (the “Trust”), all the members of which have no direct or indirect interest in the investment advisory and sub-advisory agreements and are not “interested persons” of the Trust, as defined in the 1940 Act (the “Independent Trustees”), must determine whether to approve the continuation of the Trust’s investment advisory and sub-advisory agreements. In this regard, at an in person meeting held on March 29-30, 2012 (the “Meeting”), the Board reviewed and re-approved: (i) an investment advisory agreement with Wells Fargo Funds Management, LLC (“Funds Management”) for Wells Fargo Advantage Heritage Money Market Fund (the “Fund”) and (ii) an investment sub-advisory agreement with Wells Capital Management Incorporated (“Wells Capital Management”) for the Fund. The investment advisory agreement with Funds Management and the investment sub-advisory agreement with Wells Capital Management are collectively referred to as the “Advisory Agreements.”
At the Meeting, the Board considered the factors and reached the conclusions described below relating to the selection of Funds Management and Wells Capital Management and the continuation of the Advisory Agreements. Prior to the Meeting, the Trustees conferred extensively among themselves and with representatives of Funds Management about these matters. The Board also met throughout the year and received information that was useful to them in considering the continuation of the Advisory Agreements. The Independent Trustees were assisted in their evaluation of the Advisory Agreements by independent legal counsel, from whom they received separate legal advice and with whom they met separately from Funds Management.
In providing information to the Board, Funds Management and Wells Capital Management were guided by a detailed set of requests submitted by the Independent Trustees’ independent legal counsel on their behalf at the start of the Board’s annual contract renewal process earlier in 2012. In approving the Advisory Agreements, the Board did not identify any particular information or consideration that was all-important or controlling, and each Trustee likely attributed different weights to various factors.
Nature, Extent and Quality of Services
The Board received and considered various information regarding the nature, extent and quality of services provided to the Fund by Funds Management and Wells Capital Management under the Advisory Agreements. The Board also received and considered, among other things, information about the background and experience of senior management of Funds Management, and the qualifications, backgrounds, tenures and responsibilities of the portfolio managers primarily responsible for the day-to-day portfolio management of the Fund.
The Board evaluated the ability of Funds Management and Wells Capital Management, based on their respective financial condition, resources, reputation and other attributes, to attract and retain qualified investment professionals, including research, advisory, and supervisory personnel. The Board further considered the compliance programs and compliance records of Funds Management and Wells Capital Management. In addition, the Board took into account the administrative services provided to the Fund by Funds Management and its affiliates.
The Board’s decision to approve the continuation of the Advisory Agreements was based on a comprehensive evaluation of information provided to it. In considering these matters, the Board considered not only the specific information presented in connection with the Meeting, but also the knowledge gained over time through interaction with Funds Management and Wells Capital Management about various topics, including Funds Management’s oversight of service providers. The above factors, together with those referenced below, are some of the most important, but not necessarily all, factors considered by the Board in concluding that the nature, extent and quality of the investment advisory services provided to the Fund by Funds Management and Wells Capital Management supported the re-approval of the Advisory Agreements. Although the Board considered the continuation of the Advisory Agreements for the Fund as part of the larger process of considering the continuation of the advisory agreements for all of the funds in the complex, its decision to continue the Advisory Agreements for the Fund was ultimately made on a fund-by-fund basis.
| | | | | | |
| Other Information (Unaudited) | | Wells Fargo Advantage Heritage Money Market Fund | | | 41 | |
Fund Performance and Expenses
The Board considered the performance results for the Fund over various time periods ended December 31, 2011. The Board also considered these results in comparison to the median performance of a universe of relevant funds (the “Universe”) that was determined by Lipper Inc. (“Lipper”) to be similar to the Fund, and in comparison to the Fund’s benchmark index and to other comparative data. Lipper is an independent provider of investment company data. The Board received a description of the methodology used by Lipper to select the mutual funds in the Universe. The Board noted that the performance of the Fund was equal to or in range of the median performance of the Universe for all periods under review. The Board also noted that the performance of the Fund was equal to or in range of its benchmark, the Lipper Money Market Funds Index, for the periods under review.
The Board received and considered information regarding the Fund’s contractual advisory fee and net operating expense ratios and their various components, including actual management fees (which reflect fee waivers, if any), transfer agent, custodian and other non-management fees, Rule 12b-1 and non-Rule 12b-1 fees, service fees and fee waiver and expense reimbursement arrangements. The Board also considered these ratios in comparison to the median ratios of an expense Universe and a narrower expense group of mutual funds (each, an “Expense Group”) that was determined by Lipper to be similar to the Fund. The Board received a description of the methodology used by Lipper to select the mutual funds in the Fund’s Expense Group. The Board noted that the net operating expense ratios of the Fund were in range of the Fund’s Expense Group’s median net operating expense ratios, except for Service Class.
Funds Management advised the Board that the Expense Group medians reflected voluntary waivers, whereas the Fund’s expense ratios did not reflect voluntary waivers. The Board noted that when the Fund’s expense ratios were adjusted to reflect voluntary waivers, the Fund’s net operating expense ratios were lower than the median net operating expense ratios of the Expense Group.
Based on the above-referenced considerations and other factors, the Board concluded that the overall performance and expense structure of the Fund supported the re-approval of the Advisory Agreements for the Fund.
Investment Advisory and Sub-Advisory Fee Rates
The Board reviewed and considered the contractual investment advisory fee rate that is payable by the Fund to Funds Management for investment advisory services (the “Advisory Agreement Rate”), both on a stand-alone basis and on a combined basis with the Fund’s administration fee rate. The Board took into account the separate administrative and other services covered by the administration fee rate. The Board also reviewed and considered the contractual investment sub-advisory fee rate that is payable by Funds Management to Wells Capital Management for investment sub-advisory services (the “Sub-Advisory Agreement Rate”). In addition, the Board reviewed and considered the existing fee waiver/cap arrangements applicable to the Advisory Agreement Rate and considered the Advisory Agreement Rate after taking the waivers/caps into account (the “Net Advisory Rate”).
The Board received and considered information comparing the Advisory Agreement Rate and Net Advisory Rate, combined with the administration fee rates, with those of other funds in the Fund’s Expense Group median. The Board noted that the Advisory Agreement Rate and Net Advisory Rate for the Fund were in range of the median rates for the Fund’s Expense Group. The Board viewed favorably Funds Management’s willingness to voluntarily waive certain fees.
The Board also received and considered information about the nature and extent of services offered and fee rates charged by Funds Management and Wells Capital Management to other types of clients. In this regard, the Board received information about differences between the services, and the compliance, reporting, and other legal burdens and risks of providing investment advice to mutual funds and those associated with providing advice to non-mutual fund clients such as collective funds or institutional separate accounts.
The Board determined that the Advisory Agreement Rate for the Fund, both with and without the administration fee rate and before and after waivers, was reasonable in light of the Fund’s Expense Group information, the net expense ratio commitments, the services covered by the Advisory Agreements and other information provided. The Board also reviewed and considered the Sub-Advisory Agreement Rate and concluded that the Sub-Advisory Agreement Rate was reasonable in light of the services covered by the sub-advisory agreement and other information provided.
| | | | |
| 42 | | Wells Fargo Advantage Heritage Money Market Fund | | Other Information (Unaudited) |
Profitability
The Board received and considered a profitability analysis of Funds Management, as well as an analysis of the profitability to the collective Wells Fargo businesses that provide services to the Fund. It considered that the information provided to it was necessarily estimated, and that the profitability information provided to it, especially on a fund-by-fund basis, did not necessarily provide a precise tool for evaluating the appropriateness of the Fund’s Advisory Agreement Rate in isolation. It noted that the levels of profitability reported on a fund-by-fund basis varied widely, depending on, among other things, the size and type of fund. The Board noted the impact of voluntary fee waivers on Funds Management’s profitability. The Board concluded that the profitability reported by Funds Management was not unreasonable.
The Board did not consider separate profitability information with respect to Wells Capital Management, because, as an affiliate of Funds Management, its profitability information was subsumed in the collective Wells Fargo profitability analysis provided by Funds Management.
Economies of Scale
With respect to possible economies of scale, the Board reviewed the breakpoints in the Fund’s advisory fee and/or administration fee structure, which operate generally to reduce the expenses of the Fund (as a percentage of Fund assets) as the Fund grows in size. It considered that, as a fund shrinks in size, breakpoints conversely result in increasing fee levels. The Board noted that it would have on-going opportunities to review the appropriate levels of breakpoints in the future, and concluded that the breakpoints as implemented appeared to be a reasonable step toward sharing economies of scale, if any, with the Fund. However, the Board acknowledged the inherent limitations of any analysis of economies of scale and of any attempt to correlate breakpoints with such economies, stemming largely from the Board’s understanding that economies of scale are realized, if at all, across a variety of products and services, not just with respect to a single fund.
Other Benefits to Funds Management and Wells Capital Management
The Board received and considered information regarding potential “fall-out” or ancillary benefits received by Funds Management and its affiliates, including Wells Capital Management, as a result of their relationship with the Fund. Ancillary benefits could include, among others, benefits directly attributable to the relationship of Funds Management and Wells Capital Management with the Fund and benefits potentially derived from an increase in Funds Management’s and Wells Capital Management’s business as a result of their relationship with the Fund (such as the ability to market to shareholders other financial products offered by Funds Management and its affiliates, including Wells Capital Management).
The Board considered that Wells Fargo Funds Distributor, LLC, an affiliate of Funds Management, serves as distributor to the Fund and receives certain compensation for those services. The Board noted that various financial institutions, including affiliates of Funds Management, may receive distribution-related fees, shareholder servicing payments (including amounts derived from payments under Rule 12b-1 plans) and sub-transfer agency fees in respect of shares sold or held through them and services provided.
The Board also reviewed information about whether and to what extent soft dollar credits are sought and how any such credits are utilized and any benefits that may be realized by using an affiliated broker.
Other Factors and Broader Review
The Board also considered the markets for distribution of the Fund’s shares, including the channels through which the Fund’s shares are offered and sold. The Board noted that the Fund is part of one of the few fund families that have both direct-to-fund and intermediary distribution channels. As discussed above, the Board reviews detailed materials received from Funds Management and Wells Capital Management annually as part of the re-approval process under Section 15 of the 1940 Act and also reviews and assesses information about the quality of the services that the Fund receives throughout the year. In this regard, the Board has reviewed reports of Funds Management at each of its quarterly meetings, which include, among other things, portfolio reviews and performance reports. In addition, the Board confers with portfolio managers at various times throughout the year.
| | | | | | |
| Other Information (Unaudited) | | Wells Fargo Advantage Heritage Money Market Fund | | | 43 | |
Conclusion
After considering the above-described factors and based on its deliberations and its evaluation of the information described above, the Board unanimously approved the continuation of the Advisory Agreements for an additional one-year period.
| | | | |
| 44 | | Wells Fargo Advantage Heritage Money Market Fund | | List of Abbreviations |
The following is a list of common abbreviations for terms and entities which may have appeared in this report.
| ACB | — Agricultural Credit Bank |
| ADR | — American Depository Receipt |
| ADS | — American Depository Shares |
| AGC-ICC | — Assured Guaranty Corporation - Insured Custody Certificates |
| AGM | — Assured Guaranty Municipal |
| AMBAC | — American Municipal Bond Assurance Corporation |
| AMT | — Alternative Minimum Tax |
| BAN | — Bond Anticipation Notes |
| BHAC | — Berkshire Hathaway Assurance Corporation |
| CAB | — Capital Appreciation Bond |
| CCAB | — Convertible Capital Appreciation Bond |
| CDA | — Community Development Authority |
| CDO | — Collateralized Debt Obligation |
| COP | — Certificate of Participation |
| DRIVER | — Derivative Inverse Tax-Exempt Receipts |
| DW&P | — Department of Water & Power |
| DWR | — Department of Water Resources |
| ECFA | — Educational & Cultural Facilities Authority |
| EDA | — Economic Development Authority |
| EDFA | — Economic Development Finance Authority |
| ETF | — Exchange-Traded Fund |
| FFCB | — Federal Farm Credit Bank |
| FGIC | — Financial Guaranty Insurance Corporation |
| FGLMC | — Federal Government Loan Mortgage Company |
| FHA | — Federal Housing Authority |
| FHLB | — Federal Home Loan Bank |
| FHLMC | — Federal Home Loan Mortgage Corporation |
| FICO | — The Financing Corporation |
| FNMA | — Federal National Mortgage Association |
| GDR | — Global Depository Receipt |
| GNMA | — Government National Mortgage Association |
| HCFR | — Healthcare Facilities Revenue |
| HEFA | — Health & Educational Facilities Authority |
| HEFAR | — Higher Education Facilities Authority Revenue |
| HFA | — Housing Finance Authority |
| HFFA | — Health Facilities Financing Authority |
| IBC | — Insured Bond Certificate |
| IDA | — Industrial Development Authority |
| IDAG | — Industrial Development Agency |
| IDR | — Industrial Development Revenue |
| KRW | — Republic of Korea Won |
| LIBOR | — London Interbank Offered Rate |
| LLC | — Limited Liability Company |
| LLP | — Limited Liability Partnership |
| MBIA | — Municipal Bond Insurance Association |
| MFHR | — Multi-Family Housing Revenue |
| MSTR | — Municipal Securities Trust Receipts |
| MUD | — Municipal Utility District |
| NATL-RE | — National Public Finance Guarantee Corporation |
| PCFA | — Pollution Control Finance Authority |
| PCR | — Pollution Control Revenue |
| PFA | — Public Finance Authority |
| PFFA | — Public Facilities Financing Authority |
| PFOTER | — Puttable Floating Option Tax-Exempt Receipts |
| plc | — Public Limited Company |
| PUTTER | — Puttable Tax-Exempt Receipts |
| R&D | — Research & Development |
| RDA | — Redevelopment Authority |
| RDFA | — Redevelopment Finance Authority |
| REIT | — Real Estate Investment Trust |
| ROC | — Reset Option Certificates |
| SAVRS | — Select Auction Variable Rate Securities |
| SBA | — Small Business Authority |
| SFHR | — Single Family Housing Revenue |
| SFMR | — Single Family Mortgage Revenue |
| SPA | — Standby Purchase Agreement |
| SPDR | — Standard & Poor’s Depositary Receipts |
| STRIPS | — Separate Trading of Registered Interest and Principal Securities |
| TAN | — Tax Anticipation Notes |
| TIPS | — Treasury Inflation-Protected Securities |
| TRAN | — Tax Revenue Anticipation Notes |
| TCR | — Transferable Custody Receipts |
| TTFA | — Transportation Trust Fund Authority |
| TVA | — Tennessee Valley Authority |
| XLCA | — XL Capital Assurance |
This page is intentionally left blank.
This page is intentionally left blank.


FOR MORE INFORMATION
More information about Wells Fargo Advantage Funds is available free upon request. To obtain literature, please write, e-mail, visit the Fund’s Web site, or call:
Wells Fargo Advantage Funds
P.O. Box 8266
Boston, MA 02266-8266
E-mail: wfaf@wellsfargo.com
Web site: wellsfargoadvantagefunds.com
Individual investors: 1-800-222-8222
Retail investment professionals: 1-888-877-9275
Institutional investment professionals: 1-866-765-0778
This report and the financial statements contained herein are submitted for the general information of the shareholders of Wells Fargo Advantage Funds. If this report is used for promotional purposes, distribution of the report must be accompanied or preceded by a current prospectus. For a current prospectus and, if available, a summary prospectus containing more complete information, including charges and expenses, call 1-800-222-8222 or visit the Fund’s Web site at wellsfargoadvantagefunds.com. Please consider the investment objectives, risks, charges, and expenses of the investment carefully before investing. This and other information about Wells Fargo Advantage Funds can be found in the current prospectus. Read the prospectus carefully before you invest or send money.
Wells Fargo Funds Management, LLC, a wholly owned subsidiary of Wells Fargo & Company, provides investment advisory and administrative services for Wells Fargo Advantage Funds. Other affiliates of Wells Fargo & Company provide subadvisory and other services for the Funds. The Funds are distributed by Wells Fargo Funds Distributor, LLC, Member FINRA/SIPC, an affiliate of Wells Fargo & Company.
NOT FDIC INSURED ¡ NO BANK GUARANTEE ¡ MAY LOSE VALUE
© 2012 Wells Fargo Funds Management, LLC. All rights reserved.
| | |
 | | 211389 09-12 SA304/SAR304 07-12 |

Wells Fargo Advantage
Money Market Fund

Semi-Annual Report
July 31, 2012

Reduce clutter. Save trees.
Sign up for electronic delivery of prospectuses and shareholder reports at wellsfargo.com/advantagedelivery
Contents
The views expressed and any forward-looking statements are as of July 31, 2012, unless otherwise noted, and are those of the Fund managers and/or Wells Fargo Funds Management, LLC. Discussions of individual securities, or the markets generally, or any Wells Fargo Advantage Fund are not intended as individual recommendations. Future events or results may vary significantly from those expressed in any forward-looking statements; the views expressed are subject to change at any time in response to changing circumstances in the market. Wells Fargo Funds Management, LLC, disclaims any obligation to publicly update or revise any views expressed or forward-looking statements.
NOT FDIC INSURED ¡ NO BANK GUARANTEE ¡ MAY LOSE VALUE

WELLS FARGO INVESTMENT HISTORY
| | |
| |
| 1932 | | Keystone creates one of the first mutual fund families. |
| |
| 1971 | | Wells Fargo & Company introduces one of the first institutional index funds. |
| |
| 1978 | | Wells Fargo applies Markowitz and Sharpe’s research on Modern Portfolio Theory to introduce one of the industry’s first Tactical Asset Allocation (TAA) models in institutional separately managed accounts. |
| |
| 1984 | | Wells Fargo Stagecoach Funds launches its first asset allocation fund. |
| |
| 1989 | | The Tactical Asset Allocation (TAA) Model is first applied to Wells Fargo’s asset allocation mutual funds. |
| |
| 1994 | | Wells Fargo introduces the LifePath Funds, one of the first suites of target date funds (now the Wells Fargo Advantage Dow Jones Target Date FundsSM). |
| |
| 1996 | | Evergreen Investments and Keystone Funds merge. |
| |
| 1997 | | Wells Fargo launches Wells Fargo Advantage WealthBuilder PortfoliosSM, a fund-of-funds suite of products that includes the use of quantitative models to shift assets among investment styles. |
| |
| 1999 | | Norwest Advantage Funds and Stagecoach Funds are reorganized into Wells Fargo Funds after the merger of Norwest and Wells Fargo. |
| |
| 2002 | | Evergreen Retail and Evergreen Institutional companies form the umbrella asset management company, Evergreen Investments. |
| |
| 2005 | | The integration of Strong Funds with Wells Fargo Funds creates Wells Fargo Advantage Funds, resulting in one of the top 20 mutual fund companies in the United States. |
| |
| 2006 | | Wells Fargo Advantage Funds relaunches the target date product line as Wells Fargo Advantage Dow Jones Target Date Funds. |
| |
| 2010 | | The mergers and reorganizations of Evergreen and Wells Fargo Advantage mutual funds are completed, unifying the families under the brand of Wells Fargo Advantage Funds. |
Wells Fargo Advantage Funds®
Wells Fargo Advantage Funds skillfully guides institutions, financial advisors, and individuals through the investment terrain to help them reach their financial objectives. Everything we do on behalf of investors is backed by our unique combination of qualifications.
Strength
Our organization is built on the standards of integrity and service established by our parent company—Wells Fargo & Company—more than 150 years ago. And, because we’re part of a highly diversified financial enterprise, we offer the depth of resources to help investors succeed.
Expertise
Our multi-boutique model offers investors access to the independent thinking of premier investment managers that have been chosen for their time-tested strategies. While each team specializes in a specific investment strategy, collectively they provide investors a wide choice of distinct investment styles. Our dedication to investment excellence doesn’t end with our expertise in manager selection—risk management, analysis, and rigorous ongoing review seek to ensure each manager’s investment process remains consistent.
Partnership
Our collaborative approach is built around understanding the needs and goals of our clients. By adhering to core principles of sound judgment and steady guidance, we support you through every stage of the investment decision process.
Carefully consider a fund’s investment objectives, risks, charges, and expenses before investing. For a current prospectus and, if available, a summary prospectus, containing this and other information, visit wellsfargoadvantagefunds.com. Read it carefully before investing.
Wells Fargo Funds Management, LLC, a wholly owned subsidiary of Wells Fargo & Company, provides investment advisory and administrative services for Wells Fargo Advantage Funds®. Other affiliates of Wells Fargo & Company provide subadvisory and other services for the Funds. The Funds are distributed by Wells Fargo Funds Distributor, LLC, Member FINRA/SIPC, an affiliate of Wells Fargo & Company.
“Dow Jones®” and “Dow Jones Target Date IndexesSM” are service marks of Dow Jones Trademark Holdings, LLC (“Dow Jones”), have been licensed to CME Group Index Services LLC (“CME Indexes”) and have been sublicensed for use for certain purposes by Global Index Advisors, Inc, and Wells Fargo Funds Management, LLC. The Wells Fargo Advantage Dow Jones Target Date FundsSM based on the Dow Jones Target Date IndexesSM, are not sponsored, endorsed, sold or promoted by Dow Jones, CME Indexes or their respective affiliates and none of them makes any representation regarding the advisability of investing in such product(s).
NOT FDIC INSURED ¡ NO BANK GUARANTEE ¡ MAY LOSE VALUE
Not part of the semi-annual report.
Wells Fargo Advantage Funds offers more than 110 mutual funds across a wide range of asset classes, representing over $209 billion in assets under management, as of July 31, 2012.
| | | | |
| Equity Funds | | | | |
Asia Pacific Fund | | Enterprise Fund† | | Opportunity Fund† |
C&B Large Cap Value Fund | | Equity Value Fund | | Precious Metals Fund |
C&B Mid Cap Value Fund | | Global Opportunities Fund | | Premier Large Company Growth Fund |
Capital Growth Fund | | Growth Fund | | Small Cap Opportunities Fund |
Common Stock Fund | | Index Fund | | Small Cap Value Fund |
Disciplined U.S. Core Fund | | International Equity Fund | | Small Company Growth Fund |
Discovery Fund† | | International Value Fund | | Small Company Value Fund |
Diversified Equity Fund | | Intrinsic Small Cap Value Fund | | Small/Mid Cap Core Fund |
Diversified International Fund | | Intrinsic Value Fund | | Small/Mid Cap Value Fund |
Diversified Small Cap Fund | | Intrinsic World Equity Fund | | Special Mid Cap Value Fund |
Emerging Growth Fund | | Large Cap Core Fund | | Special Small Cap Value Fund |
Emerging Markets Equity Fund | | Large Cap Growth Fund | | Specialized Technology Fund |
Emerging Markets Equity Income Fund | | Large Company Value Fund | | Traditional Small Cap Growth Fund |
Endeavor Select Fund† | | Omega Growth Fund | | Utility and Telecommunications Fund |
| Bond Funds | | | | |
Adjustable Rate Government Fund | | Inflation-Protected Bond Fund | | Short-Term Bond Fund |
California Limited-Term Tax-Free Fund | | Intermediate Tax/AMT-Free Fund | | Short-Term High Yield Bond Fund |
California Tax-Free Fund | | International Bond Fund | | Short-Term Municipal Bond Fund |
Colorado Tax-Free Fund | | Minnesota Tax-Free Fund | | Strategic Municipal Bond Fund |
Emerging Markets Local Bond Fund | | Municipal Bond Fund | | Total Return Bond Fund |
Government Securities Fund | | North Carolina Tax-Free Fund | | Ultra Short-Term Income Fund |
High Income Fund | | Pennsylvania Tax-Free Fund | | Ultra Short-Term Municipal Income Fund |
High Yield Bond Fund | | Short Duration Government Bond Fund | | Wisconsin Tax-Free Fund |
Income Plus Fund | | | | |
| Asset Allocation Funds | | | | |
Absolute Return Fund | | WealthBuilder Equity Portfolio† | | Target 2020 Fund† |
Asset Allocation Fund | | WealthBuilder Growth Allocation Portfolio† | | Target 2025 Fund† |
Conservative Allocation Fund | | WealthBuilder Growth Balanced Portfolio† | | Target 2030 Fund† |
Diversified Capital Builder Fund | | WealthBuilder Moderate Balanced Portfolio† | | Target 2035 Fund† |
Diversified Income Builder Fund | | WealthBuilder Tactical Equity Portfolio† | | Target 2040 Fund† |
Growth Balanced Fund | | Target Today Fund† | | Target 2045 Fund† |
Index Asset Allocation Fund | | Target 2010 Fund† | | Target 2050 Fund† |
Moderate Balanced Fund | | Target 2015 Fund† | | Target 2055 Fund† |
WealthBuilder Conservative Allocation Portfolio† | | | | |
| Money Market Funds | | | | |
100% Treasury Money Market Fund | | Heritage Money Market Fund† | | National Tax-Free Money Market Fund |
California Municipal Money Market Fund | | Money Market Fund | | Prime Investment Money Market Fund |
Cash Investment Money Market Fund | | Municipal Cash Management Money Market Fund | | Treasury Plus Money Market Fund |
Government Money Market Fund | | Municipal Money Market Fund | | |
| Variable Trust Funds1 | | | | |
VT Discovery Fund† | | VT Intrinsic Value Fund | | VT Small Cap Growth Fund |
VT Index Asset Allocation Fund | | VT Omega Growth Fund | | VT Small Cap Value Fund |
VT International Equity Fund | | VT Opportunity Fund† | | VT Total Return Bond Fund |
An investment in a money market fund is not insured or guaranteed by the Federal Deposit Insurance Corporation or any other government agency. Although the Wells Fargo Advantage Money Market Funds seek to preserve the value of your investment at $1.00 per share, it is possible to lose money by investing in a money market fund.
| 1. | The Variable Trust Funds are generally available only through insurance company variable contracts. |
| † | In this report, the Wells Fargo Advantage Discovery FundSM, Wells Fargo Advantage Endeavor Select FundSM, Wells Fargo Advantage Enterprise FundSM, Wells Fargo Advantage Opportunity FundSM, Wells Fargo Advantage WealthBuilder Conservative Allocation PortfolioSM, Wells Fargo Advantage WealthBuilder Equity PortfolioSM, Wells Fargo Advantage WealthBuilder Growth Allocation PortfolioSM, Wells Fargo Advantage WealthBuilder Growth Balanced PortfolioSM, Wells Fargo Advantage WealthBuilder Moderate Balanced PortfolioSM, Wells Fargo Advantage WealthBuilder Tactical Equity PortfolioSM, Wells Fargo Advantage Dow Jones Target Today FundSM, Wells Fargo Advantage Dow Jones Target 2010 FundSM, Wells Fargo Advantage Dow Jones Target 2015 FundSM, Wells Fargo Advantage Dow Jones Target 2020 FundSM, Wells Fargo Advantage Dow Jones Target 2025 FundSM, Wells Fargo Advantage Dow Jones Target 2030 FundSM, Wells Fargo Advantage Dow Jones Target 2035 FundSM, Wells Fargo Advantage Dow Jones Target 2040 FundSM, Wells Fargo Advantage Dow Jones Target 2045 FundSM, Wells Fargo Advantage Dow Jones Target 2050 FundSM, Wells Fargo Advantage Dow Jones Target 2055 FundSM, Wells Fargo Advantage Heritage Money Market FundSM, Wells Fargo Advantage VT Discovery FundSM, and Wells Fargo Advantage VT Opportunity FundSM are referred to as the Discovery Fund, Endeavor Select Fund, Enterprise Fund, Opportunity Fund, WealthBuilder Conservative Allocation Portfolio, WealthBuilder Equity Portfolio, WealthBuilder Growth Allocation Portfolio, WealthBuilder Growth Balanced Portfolio, WealthBuilder Moderate Balanced Portfolio, WealthBuilder Tactical Equity Portfolio, Target Today Fund, Target 2010 Fund, Target 2015 Fund, Target 2020 Fund, Target 2025 Fund, Target 2030 Fund, Target 2035 Fund, Target 2040 Fund, Target 2045 Fund, Target 2050 Fund, Target 2055 Fund, Heritage Money Market Fund, VT Discovery Fund, and VT Opportunity Fund, respectively. |
Not part of the semi-annual report.
| | | | |
| 2 | | Wells Fargo Advantage Money Market Fund | | Letter to Shareholders (Unaudited) |

Karla M. Rabusch,
President
Wells Fargo Advantage Funds
Not only has the Fed been successful in engineering low interest rates, but investors have rushed to buy U.S. Treasury securities as a safe-haven asset in the midst of uncertainty surrounding the European debt crisis. As a result, interest rates reached record lows.
Dear Valued Shareholder:
We’re pleased to offer you this semi-annual report for the Wells Fargo Advantage Money Market Fund for the six-month period that ended July 31, 2012. Upon reviewing the report, you may notice that your Fund has included a summary portfolio schedule in lieu of a complete portfolio schedule, which we hope will help you focus on your Fund’s principal holdings and assist you in evaluating your Fund’s risk profile and investment strategy. The Fund’s full portfolio schedule is still available upon request or at wellsfargoadvantagefunds.com for those investors who wish to see it.
The economy grew, but the recovery has been modest.
The U.S. is three years into a modest economic recovery, with second-quarter real gross domestic product (GDP) increasing 1.5% on an annualized basis. Several factors, however, held back growth despite the Federal Reserve’s (Fed) accommodative monetary policy. In Europe, much uncertainty remained about the outcome of the eurozone debt crisis and whether policymakers will be able to resolve it without any countries defaulting or leaving the euro. In addition, Europe has again entered a recession. In Asia, China’s economy slowed. Here at home, a potential “fiscal cliff”—automatic tax increases alongside automatic budget cuts stemming from a legislative compromise in Congress—added uncertainty and, if unaddressed, could negatively affect GDP beginning in 2013.
In an effort to further bolster the economy, especially the labor market, the Fed has indicated its commitment to maintaining a highly accommodative monetary policy. It has indicated its belief that economic conditions warrant an extremely low federal funds target rate—a short-term bank lending rate—near 0%, at least through late 2014. The Fed also continued its “Operation Twist,” which involves buying U.S. Treasury securities with maturities of greater than six years and selling U.S. Treasury securities with maturities of less than three years, in an effort to keep longer-term interest rates low.
A demand for relative safe-haven securities led to ultra-low interest rates.
Not only has the Fed been successful in engineering low interest rates, but investors have rushed to buy U.S. Treasury securities as a relative safe-haven asset in the midst of uncertainty surrounding the European debt crisis. As a result, interest rates reached record lows. Ten-year U.S. Treasury yields ranged between 2.38% and 1.38% over the past six months. Three-month U.S. Treasury bills had an average yield of 10 basis points (bps; 100 bps is 1.00%) over the past six months. Rates on seven-day commercial paper, a common investment type for prime money market funds, were 12 bps on July 31, 2012.
Lack of supply kept a lid on yields, and regulatory uncertainty remained.
Continued demand for a limited supply of money market-eligible securities also contributed to low yields. We estimate that the amount outstanding of short-term, money market fund-eligible securities (excluding U.S. Treasury securities) has declined by $3 trillion, or more than a 30% decrease, since 2008. Reasons for this decrease in supply include issuers opting to lock in rates on long-term rather than short-term debt, less need for financing as many companies have plentiful cash given record profits, and credit downgrades that have resulted in fewer firms with top credit ratings.
| | | | | | |
| Letter to Shareholders (Unaudited) | | Wells Fargo Advantage Money Market Fund | | | 3 | |
The Chairman of the Securities and Exchange Commission (SEC) indicated in late August that the SEC has determined at this time not to propose certain amendments to the rules governing money market funds. However, the Financial Stability Oversight Council or other financial regulators could still take steps to impose additional regulations on money market funds. As we gain clarity in the coming months regarding any potential changes to regulation of money market funds, we will provide further communications to our clients about these changes.
Amid the current challenges of investing—low yields, an unresolved eurozone crisis, limited supply, and regulatory uncertainty—has been the opportunity to provide our clients an important investment option for meeting their short-term cash needs. Our focus on preservation of capital and liquidity is not a marketing phrase but rather the basis of our investment philosophy as we manage money market funds in an uncertain world. We are proud of our comprehensive lineup of prime, government, and tax-exempt money market funds.
Thank you for choosing to invest with Wells Fargo Advantage Funds. We appreciate your confidence in us and remain committed to helping you meet your financial needs. For current information about your fund investments, contact your investment professional, visit our Web site at wellsfargoadvantagefunds.com, or call us directly at 1-800-222-8222. We are available 24 hours a day, 7 days a week.
Sincerely,

Karla M. Rabusch
President
Wells Fargo Advantage Funds
Amid the current challenges of investing–low yields, an unresolved eurozone crisis, limited supply, and regulatory uncertainty–has been the opportunity to provide our clients an important investment option for meeting their short-term cash needs.
| | | | |
| 4 | | Wells Fargo Advantage Money Market Fund | | Performance Highlights (Unaudited) |
INVESTMENT OBJECTIVE
The Fund seeks current income, while preserving capital and liquidity.
ADVISER
Wells Fargo Funds Management, LLC
SUB-ADVISER
Wells Capital Management Incorporated
PORTFOLIO MANAGERS
David D. Sylvester
Laurie White
FUND INCEPTION
July 1, 1992
| | |
PORTFOLIO COMPOSITION1 (AS OF JULY 31, 2012) | | |
|
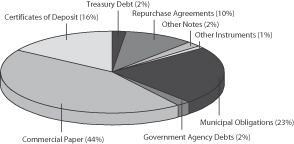 |
| | |
EFFECTIVE MATURITY DISTRIBUTION2 (AS OF JULY 31, 2012) |
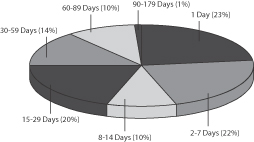
|
|
WEIGHTED AVERAGE MATURITY3 (AS OF JULY 31, 2012) |
22 Days |
|
WEIGHTED AVERAGE FINAL MATURITY4 (AS OF JULY 31, 2012) |
36 Days |
| 1. | Portfolio composition is subject to change and is calculated based on the total investments of the Fund. |
| 2. | Effective maturity distribution is subject to change and is calculated based on the total investments of the Fund. |
| 3. | Weighted Average Maturity (WAM): WAM is an average of the effective maturities of all securities held in the portfolio, weighted by each security’s percentage of total investments. The maturity of a portfolio security is the period remaining until the date on which the principal amount is unconditionally required to be paid, or in the case of a security called for redemption, the date on which the redemption payment is unconditionally required to be made. WAM calculations allow for the maturities of certain securities with demand features or periodic interest rate resets to be shortened. WAM is a way to measure a fund’s sensitivity to potential interest rate changes. |
| 4. | Weighted Average Final Maturity (WAFM): WAFM is an average of the final maturities of all securities held in the portfolio, weighted by their percentage of total investments. The maturity of a portfolio security is the period remaining until the date on which the principal amount is unconditionally required to be paid, or in the case of a security called for redemption, the date on which the redemption payment is unconditionally required to be made. In contrast to WAM, the calculation of WAFM allows for the maturities of certain securities with demand features to be shortened, but not the periodic interest rate resets. WAFM is a way to measure a fund’s potential sensitivity to credit spread changes. |
| | | | | | |
| Performance Highlights (Unaudited) | | Wells Fargo Advantage Money Market Fund | | | 5 | |
AVERAGE ANNUAL TOTAL RETURN5 (%) (AS OF JULY 31, 2012)
| | | | | | | | | | | | | | | | | | | | | | | | | | | | | | | | | | | | | | | | | | | | |
| | | | | | Including Sales Charge | | | Excluding Sales Charge | | | Expense Ratios6 | |
| | | Inception Date | | | 6 Months* | | | 1 Year | | | 5 Year | | | 10 Year | | | 6 Months* | | | 1 Year | | | 5 Year | | | 10 Year | | | Gross | | | Net7 | |
Class A (STGXX) | | | 07/01/1992 | | | | | | | | | | | | | | | | | | | | 0.00 | | | | 0.01 | | | | 0.85 | | | | 1.54 | | | | 0.81% | | | | 0.70% | |
Class B** | | | 07/01/1992 | | | | (5.00 | ) | | | (4.99 | ) | | | 0.22 | | | | 1.11 | | | | 0.00 | | | | 0.01 | | | | 0.62 | | | | 1.11 | | | | 1.56% | | | | 1.45% | |
Class C | | | 06/30/2010 | | | | (1.00 | ) | | | (0.99 | ) | | | 0.62 | | | | 1.11 | | | | 0.00 | | | | 0.01 | | | | 0.62 | | | | 1.11 | | | | 1.56% | | | | 1.45% | |
Daily Class | | | 06/30/2010 | | | | | | | | | | | | | | | | | | | | 0.00 | | | | 0.01 | | | | 0.85 | | | | 1.54 | | | | 1.06% | | | | 1.00% | |
Investor Class (WMMXX) | | | 04/08/2005 | | | | | | | | | | | | | | | | | | | | 0.00 | | | | 0.01 | | | | 0.89 | | | | 1.59 | | | | 0.84% | | | | 0.65% | |
Service Class (WMOXX) | | | 06/30/2010 | | | | | | | | | | | | | | | | | | | | 0.00 | | | | 0.01 | | | | 0.89 | | | | 1.59 | | | | 0.71% | | | | 0.50% | |
| * | Returns for periods of less than one year are not annualized. |
| ** | Class B shares are closed to investment, except in connection with the reinvestment of any distributions and permitted exchanges. |
| | | | | | | | | | | | | | | | | | | | | | | | |
FUND YIELD SUMMARY7
(AS OF JULY 31, 2012) | | Class A | | | Class B | | | Class C | | | Daily Class | | | Investor Class | | | Service Class | |
7-Day Current Yield | | | 0.01% | | | | 0.01% | | | | 0.01% | | | | 0.01% | | | | 0.01% | | | | 0.01% | |
7-Day Compound Yield | | | 0.01% | | | | 0.01% | | | | 0.01% | | | | 0.01% | | | | 0.01% | | | | 0.01% | |
30-Day Simple Yield | | | 0.01% | | | | 0.01% | | | | 0.01% | | | | 0.01% | | | | 0.01% | | | | 0.01% | |
30-Day Compound Yield | | | 0.01% | | | | 0.01% | | | | 0.01% | | | | 0.01% | | | | 0.01% | | | | 0.01% | |
Figures quoted represent past performance, which is no guarantee of future results and do not reflect the deduction of taxes that a shareholder may pay on fund distributions or the redemption of fund shares. Investment returns will fluctuate. The Fund’s yield figures more closely reflect the current earnings of the Fund than the total return figures. Current performance may be lower or higher than the performance data quoted and assumes the reinvestment of dividends and capital gains. Current month-end performance is available at the Fund’s Web site – wellsfargoadvantagefunds.com.
Class A shares, Daily Class shares, Investor Class, and Service Class shares are sold without a front-end sales charge or contingent deferred sales charge. For Class B shares, the maximum contingent deferred sales charge (CDSC) is 5.00%. For Class C shares, the maximum CDSC is 1.00%. Performance including sales charge assumes the sales charge for the corresponding time period. Other fees and expenses apply to an investment in the Fund and are described in the Fund’s current prospectuses.
An investment in a money market fund is not insured or guaranteed by the Federal Deposit Insurance Corporation or any other government agency. Although the Fund seeks to preserve the value of your investment at $1.00 per share, it is possible to lose money by investing in a money market fund.
| 5. | Historical performance shown for the Service Class shares prior to their inception reflects the performance of the Investor Class shares, and includes the higher expenses applicable to the Investor Class shares. If these expenses had not been included, returns would be higher. Historical performance shown for the Class C shares prior to their inception reflects the performance of the Class B shares. Class B and Class C shares have the same expenses. Historical performance shown for the Daily Class shares prior to their inception reflects the performance of the Class A shares, and has not been adjusted to reflect the higher expenses applicable to the Daily Class shares. If these expenses had been adjusted, returns would be lower. Historical performance shown for the Investor Class shares prior to their inception reflects the performance of the Class A shares, and includes the higher expenses applicable to the Class A shares. If these expenses had not been included, returns would be higher. |
| 6. | Reflects the expense ratios as stated in the most recent prospectuses. |
| 7. | The Adviser has committed through July 11, 2013 to waive fees and/or reimburse expenses to the extent necessary to cap the Fund’s Total Annual Fund Operating Expenses After Fee Waiver, excluding certain expenses, at the amounts shown above. Brokerage commissions, stamp duty fees, interest, taxes, acquired fund fees and expenses and extraordinary expenses are excluded from the cap. Without this cap, the Fund’s returns would have been lower. Without waived fees and/or reimbursed expenses, the Fund’s 7-day current yield would have been (0.53)%, (1.27)%, (1.27)%, (0.78)%, (0.56)% and (0.43)% for Class A, Class B, Class C, Daily Class, Investor Class and Service Class, respectively. | |
| | | | |
| 6 | | Wells Fargo Advantage Money Market Fund | | Fund Expenses (Unaudited) |
As a shareholder of the Fund, you incur two types of costs: (1) transaction costs, including contingent deferred sales charges (if any) on redemptions and (2) ongoing costs, including management fees, distribution (12b-1) and/or shareholder service fees, and other Fund expenses. This example is intended to help you understand your ongoing costs (in dollars) of investing in the Fund and to compare these costs with the ongoing costs of investing in other mutual funds.
The example is based on an investment of $1,000 invested at the beginning of the six-month period and held for the entire period from February 1, 2012 to July 31, 2012.
Actual Expenses
The “Actual” line of the table below provides information about actual account values and actual expenses. You may use the information in this line, together with the amount you invested, to estimate the expenses that you paid over the period. Simply divide your account value by $1,000 (for example, an $8,600 account value divided by $1,000 = 8.6), then multiply the result by the number in the “Actual” line under the heading entitled “Expenses Paid During Period” for your applicable class of shares to estimate the expenses you paid on your account during this period.
Hypothetical Example for Comparison Purposes
The “Hypothetical” line of the table below provides information about hypothetical account values and hypothetical expenses based on the Fund’s actual expense ratio and an assumed rate of return of 5% per year before expenses, which is not the Fund’s actual return. The hypothetical account values and expenses may not be used to estimate the actual ending account balance or expenses you paid for the period. You may use this information to compare the ongoing costs of investing in the Fund and other funds. To do so, compare this 5% hypothetical example with the 5% hypothetical examples that appear in the shareholder reports of the other funds.
Please note that the expenses shown in the table are meant to highlight your ongoing costs only and do not reflect any transactional costs, such as any contingent deferred sales charges. Therefore, the “Hypothetical” line of the table is useful in comparing ongoing costs only, and will not help you determine the relative total costs of owning different funds. In addition, if these transactional costs were included, your costs would have been higher.
| | | | | | | | | | | | | | | | |
| | | Beginning
Account Value
02-01-2012 | | | Ending
Account Value
07-31-2012 | | | Expenses
Paid During
the Period¹ | | | Net Annual
Expense Ratio | |
Class A | | | | | | | | | | | | | | | | |
Actual | | $ | 1,000.00 | | | $ | 1,000.05 | | | $ | 1.19 | | | | 0.24 | % |
Hypothetical (5% return before expenses) | | $ | 1,000.00 | | | $ | 1,023.67 | | | $ | 1.21 | | | | 0.24 | % |
Class B | | | | | | | | | | | | | | | | |
Actual | | $ | 1,000.00 | | | $ | 1,000.05 | | | $ | 1.14 | | | | 0.23 | % |
Hypothetical (5% return before expenses) | | $ | 1,000.00 | | | $ | 1,023.72 | | | $ | 1.16 | | | | 0.23 | % |
Class C | | | | | | | | | | | | | | | | |
Actual | | $ | 1,000.00 | | | $ | 1,000.05 | | | $ | 1.19 | | | | 0.24 | % |
Hypothetical (5% return before expenses) | | $ | 1,000.00 | | | $ | 1,023.67 | | | $ | 1.21 | | | | 0.24 | % |
Daily Class | | | | | | | | | | | | | | | | |
Actual | | $ | 1,000.00 | | | $ | 1,000.05 | | | $ | 1.14 | | | | 0.23 | % |
Hypothetical (5% return before expenses) | | $ | 1,000.00 | | | $ | 1,023.72 | | | $ | 1.16 | | | | 0.23 | % |
Investor Class | | | | | | | | | | | | | | | | |
Actual | | $ | 1,000.00 | | | $ | 1,000.05 | | | $ | 1.19 | | | | 0.24 | % |
Hypothetical (5% return before expenses) | | $ | 1,000.00 | | | $ | 1,023.67 | | | $ | 1.21 | | | | 0.24 | % |
Service Class | | | | | | | | | | | | | | | | |
Actual | | $ | 1,000.00 | | | $ | 1,000.05 | | | $ | 1.19 | | | | 0.24 | % |
Hypothetical (5% return before expenses) | | $ | 1,000.00 | | | $ | 1,023.67 | | | $ | 1.21 | | | | 0.24 | % |
| 1. | Expenses paid is equal to the annualized expense ratio of each class multiplied by the average account value over the period, multiplied by the number of days in the most recent fiscal half-year divided by the number of days in the fiscal year (to reflect the one-half year period). |
| | | | | | |
| Summary Portfolio of Investments—July 31, 2012 (Unaudited) | | Wells Fargo Advantage Money Market Fund | | | 7 | |
The Summary Portfolio of Investments shows the Fund’s 50 largest portfolio holdings in unaffiliated issuers and any holdings exceeding 1% of the Fund’s total net assets as of the report date. The remaining securities held by the Fund are grouped as “Other securities” in each category. You can request a complete schedule of portfolio holdings as of the report date, free of charge, by accessing the following website: http://a584.g.akamai.net/f/584/1326/1d/www.wellsfargoadvantagefunds.com/pdf/semi/holdings/moneymarket.pdf or by calling Wells Fargo Advantage Funds at 1-800-222-8222. This complete schedule, filed on the Form N-CSR, is also available on the SEC’s website at sec.gov.
| | | | | | | | | | | | | | | | |
| Security Name | | Interest Rate | | Maturity Date | | Principal | | | Value | | | Percent of
Net Assets | |
| | | | | | | | | | | | | | | | |
| | | | | |
Certificates of Deposit : 16.30% | | | | | | | | | | | | | | | | |
Bank of Montreal | | 0.19 – 0.23% | | 08/01/2012 – 09/20/2012 | | $ | 46,000,000 | | | $ | 45,999,945 | | | | 0.83 | % |
Bank of Montreal | | 0.21 | | 08/21/2012 | | | 31,000,000 | | | | 31,000,000 | | | | 0.56 | |
Bank of Tokyo-Mitsubishi LLC | | 0.18 | | 08/06/2012 | | | 48,000,000 | | | | 48,000,000 | | | | 0.87 | |
Bank of Tokyo-Mitsubishi LLC | | 0.19 | | 08/24/2012 | | | 22,000,000 | | | | 22,000,000 | | | | 0.40 | |
Bank of Tokyo-Mitsubishi LLC | | 0.19 – 0.35 | | 08/03/2012 – 08/29/2012 | | | 30,000,000 | | | | 30,000,000 | | | | 0.54 | |
Barclays Bank plc ± | | 0.92 | | 03/15/2013 | | | 33,000,000 | | | | 33,000,000 | | | | 0.60 | |
Citibank NA | | 0.52 | | 08/09/2012 | | | 30,000,000 | | | | 30,000,000 | | | | 0.54 | |
DNB Nor Bank ASA | | 0.31 | | 09/13/2012 | | | 24,000,000 | | | | 24,000,000 | | | | 0.43 | |
National Australia Bank Limited ± | | 0.35 | | 08/16/2012 | | | 25,000,000 | | | | 25,001,757 | | | | 0.45 | |
National Australia Bank Limited | | 0.40 | | 08/21/2012 | | | 25,000,000 | | | | 25,002,773 | | | | 0.45 | |
National Bank of Kuwait | | 0.18 | | 08/01/2012 | | | 37,000,000 | | | | 37,000,000 | | | | 0.67 | |
Norinchukin Bank | | 0.17 | | 08/03/2012 | | | 46,000,000 | | | | 46,000,000 | | | | 0.83 | |
Norinchukin Bank | | 0.20 | | 08/24/2012 | | | 19,000,000 | | | | 19,000,000 | | | | 0.34 | |
Oversea-Chinese Banking Corporation Limited | | 0.23 | | 09/05/2012 | | | 3,000,000 | | | | 3,000,000 | | | | 0.05 | |
Skandinaviska Enskilda Banken AG | | 0.50 | | 10/15/2012 | | | 24,000,000 | | | | 24,000,000 | | | | 0.43 | |
Skandinaviska Enskilda Banken AG | | 0.70 | | 11/28/2012 | | | 37,000,000 | | | | 37,000,000 | | | | 0.67 | |
Skandinaviska Enskilda Banken AG | | 0.75 | | 10/12/2012 | | | 7,000,000 | | | | 7,002,913 | | | | 0.13 | |
Standard Chartered Bank ± | | 0.68 | | 03/04/2013 | | | 26,000,000 | | | | 26,000,000 | | | | 0.47 | |
State Street Bank & Trust | | 0.17 | | 08/14/2012 | | | 50,000,000 | | | | 50,000,000 | | | | 0.90 | |
State Street Bank & Trust | | 0.19 – 0.25 | | 08/17/2012 – 09/17/2012 | | | 38,000,000 | | | | 38,000,000 | | | | 0.68 | |
Sumitomo Mitsui Banking Corporation | | 0.16 | | 08/01/2012 | | | 34,000,000 | | | | 34,000,000 | | | | 0.61 | |
Sumitomo Mitsui Banking Corporation | | 0.16 | | 08/02/2012 | | | 46,000,000 | | | | 46,000,000 | | | | 0.83 | |
Sumitomo Mitsui Banking Corporation | | 0.34 | | 08/08/2012 | | | 20,000,000 | | | | 20,000,505 | | | | 0.36 | |
Toronto-Dominion Bank | | 0.18 | | 08/29/2012 | | | 23,000,000 | | | | 23,000,000 | | | | 0.41 | |
Other securities | | | | | | | | | | | 180,010,391 | | | | 3.25 | |
| | | | |
Total Certificates of Deposit (Cost $904,018,284) | | | | | | | | | 904,018,284 | | | | 16.30 | |
| | | | | | | | | | | | | | | | |
| | | | | |
Commercial Paper : 43.76% | | | | | | | | | | | | | | | | |
| | | | | |
| Asset-Backed Commercial Paper : 22.48% | | | | | | | | | | | | | | | | |
CAFCO LLC 144A(z) | | 0.75 | | 10/18/2012 | | | 25,000,000 | | | | 24,959,375 | | | | 0.45 | |
Charta LLC 144A(z) | | 0.75 | | 10/18/2012 | | | 25,000,000 | | | | 24,959,375 | | | | 0.45 | |
Collateralized Commercial Paper Company LLC (z) | | 0.35 | | 09/25/2012 | | | 25,000,000 | | | | 24,986,632 | | | | 0.45 | |
Collateralized Commercial Paper Company LLC (z) | | 0.35 | | 10/24/2012 | | | 53,000,000 | | | | 52,956,717 | | | | 0.95 | |
Gotham Funding Corporation 144A(z) | | 0.20 – 0.21 | | 08/01/2012 – 08/30/2012 | | | 113,000,000 | | | | 112,989,589 | | | | 2.04 | |
Liberty Funding LLC 144A(z) | | 0.19 – 0.23 | | 08/01/2012 – 10/26/2012 | | | 55,000,000 | | | | 54,993,367 | | | | 0.98 | |
Liberty Funding LLC 144A(z) | | 0.19 | | 08/17/2012 | | | 30,000,000 | | | | 29,997,467 | | | | 0.54 | |
Liberty Funding LLC 144A(z) | | 0.19 | | 08/28/2012 | | | 25,000,000 | | | | 24,996,438 | | | | 0.45 | |
The accompanying notes are an integral part of these financial statements.
| | | | |
| 8 | | Wells Fargo Advantage Money Market Fund | | Summary Portfolio of Investments—July 31, 2012 (Unaudited) |
| | | | | | | | | | | | | | | | |
| Security Name | | Interest Rate | | Maturity Date | | Principal | | | Value | | | Percent of
Net Assets | |
| | | | | | | | | | | | | | | | |
| | | | |
| Asset-Backed Commercial Paper: (continued) | | | | | | | | | | | | | | |
MetLife Short Term Funding LLC 144A(z) | | 0.20 – 0.251% | | 08/01/2012 –10/24/2012 | | $ | 107000,000 | | | $ | 106,979,806 | | | | 1.93 | % |
Salisbury Receivables Company 144A(z) | | 0.22 – 0.34 | | 08/14/2012 –10/04/2012 | | | 79,000,000 | | | | 78,978,809 | | | | 1.42 | |
Solitaire Funding LLC 144A(z) | | 0.23 | | 08/28/2012 | | | 27,000,000 | | | | 26,995,343 | | | | 0.49 | |
Solitaire Funding LLC 144A(z) | | 0.30 | | 08/01/2012 – 08/15/2012 | | | 39,000,000 | | | | 38,997,217 | | | | 0.70 | |
Straight-A Funding LLC 144A(z) | | 0.18 | | 10/03/2012 | | | 33,000,000 | | | | 32,989,605 | | | | 0.60 | |
Straight-A Funding LLC 144A(z) | | 0.18 | | 10/15/2012 | | | 33,000,000 | | | | 32,987,625 | | | | 0.60 | |
Straight-A Funding LLC 144A(z) | | 0.18 | | 08/16/2012 – 10/25/2012 | | | 42,000,000 | | | | 41,987,115 | | | | 0.76 | |
Straight-A Funding LLC 144A(z) | | 0.18 | | 10/18/2012 | | | 33,000,000 | | | | 32,987,130 | | | | 0.60 | |
Thunder Bay Funding LLC 144A(z) | | 0.18 – 0.19 | | 08/08/2012 – 09/04/2012 | | | 63,000,000 | | | | 62,994,710 | | | | 1.14 | |
Thunder Bay Funding LLC 144A(z) | | 0.20 | | 08/20/2012 | | | 23,000,000 | | | | 22,997,731 | | | | 0.41 | |
Victory Receivables 144A(z) | | 0.21 | | 08/02/2012 – 08/24/2012 | | | 111,000,000 | | | | 110,992,091 | | | | 2.00 | |
Other securities | | | | | | | | | | | 305,928,801 | | | | 5.52 | |
| | | | | |
| | | | | | | | | | | 1,246,654,943 | | | | 22.48 | |
| | | | | | | | | | | | | | | | |
| | | | |
| Financial Company Commercial Paper : 17.16% | | | | | | | | | | | | | | |
ANZ National Limited 144A(z) | | 0.22 – 0.29 | | 08/02/2012 – 10/02/2012 | | | 77,000,000 | | | | 76,974,925 | | | | 1.39 | |
ASB Finance Limited ±144A | | 0.54 | | 02/25/2013 | | | 22,000,000 | | | | 22,000,000 | | | | 0.40 | |
Axis Bank Limited (z) | | 0.60 | | 08/13/2012 | | | 30,000,000 | | | | 29,994,000 | | | | 0.54 | |
Barclays Bank plc 144A(z) | | 0.24 | | 08/20/2012 | | | 24,000,000 | | | | 23,996,960 | | | | 0.43 | |
Caisse Centrale Desjardins du Quebec 144A(z) | | 0.18 – 0.25 | | 08/03/2012 – 10/16/2012 | | | 80,000,000 | | | | 79,992,332 | | | | 1.44 | |
Caisse Centrale Desjardins du Quebec 144A(z) | | 0.20 | | 08/08/2012 | | | 23,000,000 | | | | 22,999,106 | | | | 0.41 | |
Commonwealth Bank of Australia 144A(z) | | 0.19 | | 08/01/2012 | | | 30,000,000 | | | | 30,000,000 | | | | 0.54 | |
DBS Bank Limited 144A(z) | | 0.22 – 0.26 | | 08/20/2012 – 10/29/2012 | | | 86,000,000 | | | | 85,975,201 | | | | 1.55 | |
DBS Bank Limited 144A(z) | | 0.26 | | 10/25/2012 | | | 25,000,000 | | | | 24,984,653 | | | | 0.45 | |
DNB Nor Bank ASA 144A(z) | | 0.31 | | 09/11/2012 | | | 24,000,000 | | | | 23,991,527 | | | | 0.43 | |
National Australia Funding Corporation 144A(z) | | 0.18 | | 08/07/2012 | | | 36,000,000 | | | | 35,998,905 | | | | 0.65 | |
Nordea North America (z) | | 0.30 | | 09/07/2012 | | | 25,000,000 | | | | 24,992,292 | | | | 0.45 | |
Oversea-Chinese Banking Corporation Limited (z) | | 0.23 – 0.30 | | 08/06/2012 – 10/11/2012 | | | 76,000,000 | | | | 75,978,722 | | | | 1.37 | |
Swedbank (z) | | 0.30 – 0.42 | | 08/08/2012 – 09/18/2012 | | | 108,000,000 | | | | 107,972,253 | | | | 1.95 | |
Swedbank (z) | | 0.42 | | 09/11/2012 | | | 20,000,000 | | | | 19,990,433 | | | | 0.36 | |
Westpac Securities NZ Limited 144A | | 0.30 – 0.66 | | 09/17/2012 – 07/22/2013 | | | 71,000,000 | | | | 70,987,893 | | | | 1.28 | |
Westpac Securities NZ Limited ±144A | | 0.54 | | 02/22/2013 | | | 23,000,000 | | | | 23,000,000 | | | | 0.42 | |
Other securities | | | | | | | | | | | 171,937,702 | | | | 3.10 | |
| | | | | |
| | | | | | | | | | | 951,766,904 | | | | 17.16 | |
| | | | | | | | | | | | | | | | |
| | | | | |
| Other Commercial Paper : 4.12% | | | | | | | | | | | | | | | | |
CNPC Finance 144A(z) | | 0.38 – 0.42 | | 08/02/2012 – 09/17/2012 | | | 61,000,000 | | | | 60,977,733 | | | | 1.10 | |
General Electric Company (z) | | 0.15 | | 08/21/2012 | | | 25,000,000 | | | | 24,997,917 | | | | 0.45 | |
General Electric Company (z) | | 0.15 | | 08/22/2012 | | | 25,000,000 | | | | 24,997,813 | | | | 0.45 | |
Toyota Motor Credit Corporation (z) | | 0.19 – 0.20 | | 08/21/2012 – 08/29/2012 | | | 46,000,000 | | | | 45,993,983 | | | | 0.83 | |
Other securities | | | | | | | | | | | 71,492,371 | | | | 1.29 | |
| | | | | |
| | | | | | | | | | | 228,459,817 | | | | 4.12 | |
| | | | | | | | | | | | | | | | |
| | | | |
Total Commercial Paper (Cost $2,426,881,664) | | | | | | | | | 2,426,881,664 | | | | 43.76 | |
| | | | | | | | | | | | | | | | |
| | | | | |
Government Agency Debt : 1.61% | | | | | | | | | | | | | | | | |
FHLB ± | | 0.30 – 0.36 | | 02/05/2013 – 05/17/2013 | | | 89,000,000 | | | | 88,991,053 | | | | 1.61 | |
| | | | |
Total Government Agency Debt (Cost $88,991,053) | | | | | | | | | 88,991,053 | | | | 1.61 | |
| | | | | | | | | | | | | | | | |
The accompanying notes are an integral part of these financial statements.
| | | | | | |
| Summary Portfolio of Investments—July 31, 2012 (Unaudited) | | Wells Fargo Advantage Money Market Fund | | | 9 | |
| | | | | | | | | | | | | | |
| Security Name | | | | | | | | Value | | | Percent of
Net Assets | |
| | | | | | | | | | | | | | |
| | | | | |
Municipal Obligations : 23.24% | | | | | | | | | | | | | | |
| | | | | |
Alabama : 0.63% | | | | | | | | | | | | | | |
| | | | | |
| Other Municipal Debt : 0.36% | | | | | | | | | | | | | | |
Other securities | | | | | | | | $ | 20,000,000 | | | | 0.36 | % |
| | | | | | | | | | | | | | |
| | | | | |
| Variable Rate Demand Note §: 0.27% | | | | | | | | | | | | | | |
Other securities | | | | | | | | | 15,000,000 | | | | 0.27 | |
| | | | | | | | | | | | | | |
| | | | | |
California : 2.21% | | | | | | | | | | | | | | |
| | | | | |
| Other Municipal Debt : 0.57% | | | | | | | | | | | | | | |
Other securities | | | | | | | | | 31,500,000 | | | | 0.57 | |
| | | | | | | | | | | | | | |
| | | | | |
| Variable Rate Demand Note §: 1.64% | | | | | | | | | | | | | | |
Other securities | | | | | | | | | 91,085,000 | | | | 1.64 | |
| | | | | | | | | | | | | | |
| | | | | |
Colorado : 1.10% | | | | | | | | | | | | | | |
| | | | | |
| Variable Rate Demand Notes §: 1.10% | | | | | | | | | | | | | | |
Other securities | | | | | | | | | 60,824,999 | | | | 1.10 | |
| | | | | | | | | | | | | | |
| | | | | |
Connecticut : 0.27% | | | | | | | | | | | | | | |
| | | | | |
| Variable Rate Demand Note §: 0.27% | | | | | | | | | | | | | | |
Other securities | | | | | | | | | 15,000,000 | | | | 0.27 | |
| | | | | | | | | | | | | | |
| | | | | |
Delaware : 0.25% | | | | | | | | | | | | | | |
| | | | | |
| Variable Rate Demand Note §: 0.25% | | | | | | | | | | | | | | |
Other securities | | | | | | | | | 13,730,000 | | | | 0.25 | |
| | | | | | | | | | | | | | |
| | | | | |
District of Columbia : 0.48% | | | | | | | | | | | | | | |
| | | | | |
| Other Municipal Debt : 0.09% | | | | | | | | | | | | | | |
Other securities | | | | | | | | | 5,000,000 | | | | 0.09 | |
| | | | | | | | | | | | | | |
| | | | | |
| Variable Rate Demand Note §: 0.39% | | | | | | | | | | | | | | |
Other securities | | | | | | | | | 21,695,000 | | | | 0.39 | |
| | | | | | | | | | | | | | |
| | | | | |
Florida : 0.36% | | | | | | | | | | | | | | |
| | | | | |
| Variable Rate Demand Note §: 0.36% | | | | | | | | | | | | | | |
Other securities | | | | | | | | | 19,805,000 | | | | 0.36 | |
| | | | | | | | | | | | | | |
| | | | | |
Georgia : 0.48% | | | | | | | | | | | | | | |
| | | | | |
| Variable Rate Demand Note §: 0.48% | | | | | | | | | | | | | | |
Other securities | | | | | | | | | 26,880,000 | | | | 0.48 | |
| | | | | | | | | | | | | | |
| | | | | |
Illinois : 0.68% | | | | | | | | | | | | | | |
| | | | | |
| Variable Rate Demand Note §: 0.68% | | | | | | | | | | | | | | |
Other securities | | | | | | | | | 37,425,000 | | | | 0.68 | |
| | | | | | | | | | | | | | |
| | | | | |
Indiana : 0.23% | | | | | | | | | | | | | | |
| | | | | |
| Variable Rate Demand Note §: 0.23% | | | | | | | | | | | | | | |
Other securities | | | | | | | | | 13,000,000 | | | | 0.23 | |
| | | | | | | | | | | | | | |
The accompanying notes are an integral part of these financial statements.
| | | | |
| 10 | | Wells Fargo Advantage Money Market Fund | | Summary Portfolio of Investments—July 31, 2012 (Unaudited) |
| | | | | | | | | | | | | | | | |
| Security Name | | Interest Rate | | Maturity Date | | Principal | | | Value | | | Percent of
Net Assets | |
| | | | | | | | | | | | | | | | |
| | | | | |
Iowa : 0.25% | | | | | | | | | | | | | | | | |
| | | | | |
| Variable Rate Demand Note §: 0.25% | | | | | | | | | | | | | | | | |
Other securities | | | | | | | | | | $ | 13,940,000 | | | | 0.25 | % |
| | | | | | | | | | | | | | | | |
| | | | | |
Kentucky : 0.16% | | | | | | | | | | | | | | | | |
| | | | | |
| Variable Rate Demand Note §: 0.16% | | | | | | | | | | | | | | | | |
Other securities | | | | | | | | | | | 9,000,000 | | | | 0.16 | |
| | | | | | | | | | | | | | | | |
| | | | | |
Louisiana : 0.32% | | | | | | | | | | | | | | | | |
| | | | | |
| Variable Rate Demand Note §: 0.32% | | | | | | | | | | | | | | | | |
Other securities | | | | | | | | | | | 17,900,000 | | | | 0.32 | |
| | | | | | | | | | | | | | | | |
| | | | | |
Maryland : 0.29% | | | | | | | | | | | | | | | | |
| | | | | |
| Variable Rate Demand Note §: 0.29% | | | | | | | | | | | | | | | | |
Other securities | | | | | | | | | | | 16,070,000 | | | | 0.29 | |
| | | | | | | | | | | | | | | | |
| | | | | |
Massachusetts : 0.26% | | | | | | | | | | | | | | | | |
| | | | | |
| Variable Rate Demand Notes §: 0.26% | | | | | | | | | | | | | | | | |
Other securities | | | | | | | | | | | 14,635,000 | | | | 0.26 | |
| | | | | | | | | | | | | | | | |
| | | | | |
Michigan : 0.35% | | | | | | | | | | | | | | | | |
| | | | | |
| Variable Rate Demand Note §: 0.35% | | | | | | | | | | | | | | | | |
Other securities | | | | | | | | | | | 19,485,000 | | | | 0.35 | |
| | | | | | | | | | | | | | | | |
| | | | | |
Minnesota : 0.16% | | | | | | | | | | | | | | | | |
| | | | | |
| Variable Rate Demand Note §: 0.16% | | | | | | | | | | | | | | | | |
Other securities | | | | | | | | | | | 9,100,000 | | | | 0.16 | |
| | | | | | | | | | | | | | | | |
| | | | | |
Mississippi : 0.57% | | | | | | | | | | | | | | | | |
| | | | | |
| Variable Rate Demand Notes §: 0.57% | | | | | | | | | | | | | | | | |
Mississippi Nissan Project Series A (Tax Revenue, Bank of America NA SPA) | | 0.24% | | 11/01/2028 | | $ | 25,440,000 | | | | 25,439,049 | | | | 0.46 | |
Other securities | | | | | | | | | | | 6,000,000 | | | | 0.11 | |
| | | | | |
| | | | | | | | | | | 31,439,049 | | | | 0.57 | |
| | | | | | | | | | | | | | | | |
| | | | | |
Missouri : 0.20% | | | | | | | | | | | | | | | | |
| | | | | |
| Variable Rate Demand Note §: 0.20% | | | | | | | | | | | | | | | | |
Other securities | | | | | | | | | | | 10,995,000 | | | | 0.20 | |
| | | | | | | | | | | | | | | | |
| | | | | |
Nebraska : 0.18% | | | | | | | | | | | | | | | | |
| | | | | |
| Variable Rate Demand Note §: 0.18% | | | | | | | | | | | | | | | | |
Other securities | | | | | | | | | | | 9,910,000 | | | | 0.18 | |
| | | | | | | | | | | | | | | | |
| | | | | |
Nevada : 0.47% | | | | | | | | | | | | | | | | |
| | | | | |
| Variable Rate Demand Note §: 0.47% | | | | | | | | | | | | | | | | |
Other securities | | | | | | | | | | | 25,835,000 | | | | 0.47 | |
| | | | | | | | | | | | | | | | |
The accompanying notes are an integral part of these financial statements.
| | | | | | |
| Summary Portfolio of Investments—July 31, 2012 (Unaudited) | | Wells Fargo Advantage Money Market Fund | | | 11 | |
| | | | | | | | | | | | | | |
| Security Name | | | | | | | | Value | | | Percent of
Net Assets | |
| | | | | | | | | | | | | | |
| | | | | |
New Hampshire : 0.07% | | | | | | | | | | | | | | |
| | | | | |
| Variable Rate Demand Note §: 0.07% | | | | | | | | | | | | | | |
Other securities | | | | | | | | $ | 3,835,000 | | | | 0.07 | % |
| | | | | | | | | | | | | | |
| | | | | |
New Jersey : 0.91% | | | | | | | | | | | | | | |
| | | | | |
| Variable Rate Demand Note §: 0.91% | | | | | | | | | | | | | | |
Other securities | | | | | | | | | 50,203,375 | | | | 0.91 | |
| | | | | | | | | | | | | | |
| | | | | |
New Mexico : 0.11% | | | | | | | | | | | | | | |
| | | | | |
| Variable Rate Demand Note §: 0.11% | | | | | | | | | | | | | | |
Other securities | | | | | | | | | 5,990,000 | | | | 0.11 | |
| | | | | | | | | | | | | | |
| | | | | |
New York : 3.11% | | | | | | | | | | | | | | |
| | | | | |
| Variable Rate Demand Note §: 3.11% | | | | | | | | | | | | | | |
Other securities | | | | | | | | | 172,655,000 | | | | 3.11 | |
| | | | | | | | | | | | | | |
| | | | | |
North Carolina : 0.20% | | | | | | | | | | | | | | |
| | | | | |
| Variable Rate Demand Note §: 0.20% | | | | | | | | | | | | | | |
Other securities | | | | | | | | | 10,890,000 | | | | 0.20 | |
| | | | | | | | | | | | | | |
| | | | | |
Ohio : 0.20% | | | | | | | | | | | | | | |
| | | | | |
| Variable Rate Demand Note §: 0.20% | | | | | | | | | | | | | | |
Other securities | | | | | | | | | 11,004,000 | | | | 0.20 | |
| | | | | | | | | | | | | | |
| | | | | |
Oklahoma : 0.07% | | | | | | | | | | | | | | |
| | | | | |
| Variable Rate Demand Note §: 0.07% | | | | | | | | | | | | | | |
Other securities | | | | | | | | | 4,000,000 | | | | 0.07 | |
| | | | | | | | | | | | | | |
| | | | | |
Oregon : 0.09% | | | | | | | | | | | | | | |
| | | | | |
| Variable Rate Demand Note §: 0.09% | | | | | | | | | | | | | | |
Other securities | | | | | | | | | 5,000,000 | | | | 0.09 | |
| | | | | | | | | | | | | | |
| | | | | |
Pennsylvania : 1.73% | | | | | | | | | | | | | | |
| | | | | |
| Variable Rate Demand Notes §: 1.73% | | | | | | | | | | | | | | |
Other securities | | | | | | | | | 95,695,000 | | | | 1.73 | |
| | | | | | | | | | | | | | |
| | | | | |
Puerto Rico : 0.14% | | | | | | | | | | | | | | |
| | | | | |
| Variable Rate Demand Note §: 0.14% | | | | | | | | | | | | | | |
Other securities | | | | | | | | | 8,000,000 | | | | 0.14 | |
| | | | | | | | | | | | | | |
| | | | | |
Rhode Island : 0.05% | | | | | | | | | | | | | | |
| | | | | |
| Variable Rate Demand Note §: 0.05% | | | | | | | | | | | | | | |
Other securities | | | | | | | | | 3,000,000 | | | | 0.05 | |
| | | | | | | | | | | | | | |
| | | | | |
South Carolina : 0.32% | | | | | | | | | | | | | | |
| | | | | |
| Other Municipal Debt : 0.32% | | | | | | | | | | | | | | |
Other securities | | | | | | | | | 18,000,000 | | | | 0.32 | |
| | | | | | | | | | | | | | |
The accompanying notes are an integral part of these financial statements.
| | | | |
| 12 | | Wells Fargo Advantage Money Market Fund | | Summary Portfolio of Investments—July 31, 2012 (Unaudited) |
| | | | | | | | | | | | | | | | | | | | |
| Security Name | | Interest Rate | | | Maturity Date | | | Principal | | | Value | | | Percent of
Net Assets | |
| | | | | | | | | | | | | | | | | | | | |
| | | | | |
South Dakota : 0.04% | | | | | | | | | | | | | | | | | | | | |
| | | | | |
| Variable Rate Demand Note §: 0.04% | | | | | | | | | | | | | | | | | | | | |
Other securities | | | | | | | | | | | | | | $ | 2,000,000 | | | | 0.04 | % |
| | | | | | | | | | | | | | | | | | | | |
| | | | | |
Tennessee : 0.69% | | | | | | | | | | | | | | | | | | | | |
| | | | | |
| Variable Rate Demand Note §: 0.69% | | | | | | | | | | | | | | | | | | | | |
Other securities | | | | | | | | | | | | | | | 38,345,000 | | | | 0.69 | |
| | | | | | | | | | | | | | | | | | | | |
| | | | | |
Texas : 4.33% | | | | | | | | | | | | | | | | | | | | |
| | | | | |
| Variable Rate Demand Notes §: 4.33% | | | | | | | | | | | | | | | | | | | | |
Houston TX Utilities Systems Authority Series 2010 B (Water & Sewer Revenue, Royal Bank of Canada LOC,
Royal Bank of Canada LIQ) 144A | | | 0.15 | % | | | 05/15/2034 | | | $ | 15,000,000 | | | | 15,000,000 | | | | 0.27 | |
Texas TRAN JPMorgan Chase PUTTER Trust Series 3942 (Miscellaneous Revenue, JPMorgan Chase Bank LIQ) 144A | | | 0.18 | | | | 08/30/2012 | | | | 26,000,000 | | | | 26,000,000 | | | | 0.47 | |
Other securities | | | | | | | | | | | | | | | 198,870,000 | | | | 3.59 | |
| | | | | |
| | | | | | | | | | | | | | | 239,870,000 | | | | 4.33 | |
| | | | | | | | | | | | | | | | | | | | |
| | | | | |
Utah : 0.05% | | | | | | | | | | | | | | | | | | | | |
| | | | | |
| Variable Rate Demand Note §: 0.05% | | | | | | | | | | | | | | | | | | | | |
Other securities | | | | | | | | | | | | | | | 2,768,000 | | | | 0.05 | |
| | | | | | | | | | | | | | | | | | | | |
| | | | | |
Vermont : 0.07% | | | | | | | | | | | | | | | | | | | | |
| | | | | |
| Variable Rate Demand Note §: 0.07% | | | | | | | | | | | | | | | | | | | | |
Other securities | | | | | | | | | | | | | | | 4,000,000 | | | | 0.07 | |
| | | | | | | | | | | | | | | | | | | | |
| | | | | |
Virginia : 0.05% | | | | | | | | | | | | | | | | | | | | |
| | | | | |
| Variable Rate Demand Note §: 0.05% | | | | | | | | | | | | | | | | | | | | |
Other securities | | | | | | | | | | | | | | | 3,000,000 | | | | 0.05 | |
| | | | | | | | | | | | | | | | | | | | |
| | | | | |
Washington : 0.41% | | | | | | | | | | | | | | | | | | | | |
| | | | | |
| Other Municipal Debt : 0.05% | | | | | | | | | | | | | | | | | | | | |
Other securities | | | | | | | | | | | | | | | 3,000,000 | | | | 0.05 | |
| | | | | | | | | | | | | | | | | | | | |
| | | | | |
| Variable Rate Demand Note §: 0.36% | | | | | | | | | | | | | | | | | | | | |
Other securities | | | | | | | | | | | | | | | 19,940,000 | | | | 0.36 | |
| | | | | | | | | | | | | | | | | | | | |
| | | | | |
West Virginia : 0.24% | | | | | | | | | | | | | | | | | | | | |
Other securities | | | | | | | | | | | | | | | 13,100,000 | | | | 0.24 | |
| | | | | | | | | | | | | | | | | | | | |
| | | | | |
Wisconsin : 0.46% | | | | | | | | | | | | | | | | | | | | |
| | | | | |
| Variable Rate Demand Note §: 0.46% | | | | | | | | | | | | | | | | | | | | |
Other securities | | | | | | | | | | | | | | | 25,400,000 | | | | 0.46 | |
| | | | | | | | | | | | | | | | | | | | |
| | | | | |
Total Municipal Obligations (Cost $1,288,949,423) | | | | | | | | | | | | | | | 1,288,949,423 | | | | 23.24 | |
| | | | | | | | | | | | | | | | | | | | |
| | | | | |
Other Instruments : 0.68% | | | | | | | | | | | | | | | | | | | | |
Other securities | | | | | | | | | | | | | | | 37,825,600 | | | | 0.68 | |
| | | | | | | | | | | | | | | | | | | | |
| | | | | |
Total Other Instruments (Cost $37,825,600) | | | | | | | | | | | | | | | 37,825,600 | | | | 0.68 | |
| | | | | | | | | | | | | | | | | | | | |
The accompanying notes are an integral part of these financial statements.
| | | | | | |
| Summary Portfolio of Investments—July 31, 2012 (Unaudited) | | Wells Fargo Advantage Money Market Fund | | | 13 | |
| | | | | | | | | | | | | | | | | | | | |
| Security Name | | Interest Rate | | | Maturity Date | | | Principal | | | Value | | | Percent of
Net Assets | |
| | | | | | | | | | | | | | | | | | | | |
| | | | | |
Other Notes : 1.55% | | | | | | | | | | | | | | | | | | | | |
| | | | | |
| Corporate Bonds and Notes : 1.55% | | | | | | | | | | | | | | | | | | | | |
Toyota Motor Credit Corporation ± | | | 0.53 | % | | | 07/19/2013 | | | $ | 15,000,000 | | | $ | 15,000,000 | | | | 0.27 | % |
Other securities | | | | | | | | | | | | | | | 70,807,441 | | | | 1.28 | |
| | | | | |
| | | | | | | | | | | | | | | 85,807,441 | | | | 1.55 | |
| | | | | | | | | | | | | | | | | | | | |
| | | | | |
Total Other Notes (Cost $85,807,441) | | | | | | | | | | | | | | | 85,807,441 | | | | 1.55 | |
| | | | | | | | | | | | | | | | | | | | |
| | | | | |
Repurchase Agreements^^ : 10.47% | | | | | | | | | | | | | | | | | | | | |
Citigroup Global Markets, dated 07/31/2012, maturity value $80,000,400 (1) | | | 0.18 | | | | 08/01/2012 | | | | 80,000,000 | | | | 80,000,000 | | | | 1.44 | |
Credit Suisse Securities, dated 07/31/2012, maturity value $95,000,475 (2) | | | 0.18 | | | | 08/01/2012 | | | | 95,000,000 | | | | 95,000,000 | | | | 1.71 | |
GX Clarke & Company, dated 07/31/12, maturity
value $20,000,150 (3) | | | 0.27 | | | | 08/01/2012 | | | | 20,000,000 | | | | 20,000,000 | | | | 0.36 | |
JPMorgan Securities, dated 07/31/2012, maturity
value $48,000,333 (4) | | | 0.25 | | | | 08/01/2012 | | | | 48,000,000 | | | | 48,000,000 | | | | 0.87 | |
Merrill Lynch Pierce Fenner & Smith Incorporated, dated 07/31/2012, maturity value $104,000,549 (5) | | | 0.19 | | | | 08/01/2012 | | | | 104,000,000 | | | | 104,000,000 | | | | 1.88 | |
Societe Generale, dated 07/31/2012, maturity value $177,381,585 (6) | | | 0.19 | | | | 08/01/2012 | | | | 177,380,649 | | | | 177,380,649 | | | | 3.20 | |
Societe Generale, dated 07/31/2012, maturity value $56,000,358 (7) | | | 0.23 | | | | 08/01/2012 | | | | 56,000,000 | | | | 56,000,000 | | | | 1.01 | |
| | | | | |
Total Repurchase Agreements (Cost $580,380,649) | | | | | | | | | | | | | | | 580,380,649 | | | | 10.47 | |
| | | | | | | | | | | | | | | | | | | | |
| | | | | |
Treasury Debt : 2.45% | | | | | | | | | | | | | | | | | | | | |
U.S. Treasury Bill (z) | | | 0.12 | | | | 08/23/2012 | | | | 62,000,000 | | | | 61,995,350 | | | | 1.12 | |
U.S. Treasury Bill (z) | | | 0.14 | | | | 10/04/2012 | | | | 19,000,000 | | | | 18,995,237 | | | | 0.34 | |
U.S. Treasury Bill (z) | | | 0.14 | | | | 08/30/2012 | | | | 36,000,000 | | | | 35,995,850 | | | | 0.65 | |
U.S. Treasury Bill (z) | | | 0.15 | | | | 10/11/2012 | | | | 19,000,000 | | | | 18,994,567 | | | | 0.34 | |
| | | | | |
Total Treasury Debt (Cost $135,981,004) | | | | | | | | | | | | | | | 135,981,004 | | | | 2.45 | |
| | | | | | | | | | | | | | | | | | | | |
| | | | | | | | |
| Total Investments in Securities | | | | | | | | |
| (Cost $5,548,835,118)* | | | 5,548,835,118 | | | | 100.06 | % |
Other Assets and Liabilities, Net | | | (3,326,472 | ) | | | (0.06 | ) |
| | | | | | | | |
| Total Net Assets | | $ | 5,545,508,646 | | | | 100.00 | % |
| | | | | | | | |
| ± | Variable rate investment |
| 144A | Security that may be resold to “qualified institutional buyers” under Rule 144A or security offered pursuant to Section 4(2) of the Securities Act of 1933, as amended. |
| (z) | Zero coupon security. Rate represents yield to maturity at time of purchase. |
| § | These securities are subject to a demand feature which reduces the effective maturity. |
| ^^ | (1) U.S. government securities, 2.65% to 5.50%, 3/1/2017 to 7/1/2042, fair value including accrued interest is $82,400,000. |
(2) U.S. government securities, 2.50% to 7.00%, 8/1/2013 to 8/1/2042, fair value including accrued interest is $97,850,278.
(3) U.S. government securities, 0.30% to 10.00%, 11/15/2012 to 6/1/2042, fair value including accrued interest is $20,510,610.
(4) U.S. government securities, 2.50% to 6.00%, 5/1/2020 to 7/1/2042, fair value including accrued interest is $49,440,070.
(5) U.S. government securities, 4.50%, 7/20/2041 to 8/20/2041, fair value including accrued interest is $107,120,000.
(6) U.S. government securities, 0.00% to 6.91%, 12/12/2014 to 4/1/2050, fair value including accrued interest is $182,690,377.
(7) U.S. government securities, 1.69% to 6.42%, 7/1/2017 to 5/1/2042, fair value including accrued interest is $57,680,000.
| * | Cost for federal income tax purposes is substantially the same as for financial reporting purposes. |
The accompanying notes are an integral part of these financial statements.
| | | | |
| 14 | | Wells Fargo Advantage Money Market Fund | | Statement of Assets and Liabilities—July 31, 2012 (Unaudited) |
| | | | |
| | | | |
| |
Assets | | | | |
Investments | | | | |
In unaffiliated securities, at amortized cost | | $ | 4,968,454,469 | |
In repurchase agreements, at amortized cost | | | 580,380,649 | |
| | | | |
Total investments, at amortized cost | | | 5,548,835,118 | |
Receivable for investments sold | | | 22,051,650 | |
Receivable for Fund shares sold | | | 675,193 | |
Receivable for interest | | | 1,071,797 | |
Receivable from adviser | | | 1,986,786 | |
Prepaid expenses and other assets | | | 278,387 | |
| | | | |
Total assets | | | 5,574,898,931 | |
| | | | |
| |
Liabilities | | | | |
Dividends payable | | | 41,711 | |
Payable for investments purchased | | | 23,993,490 | |
Payable for Fund shares redeemed | | | 747,112 | |
Due to custodian bank | | | 714 | |
Distribution fees payable | | | 494,066 | |
Due to other related parties | | | 1,317,052 | |
Accrued expenses and other liabilities | | | 2,796,140 | |
| | | | |
Total liabilities | | | 29,390,285 | |
| | | | |
Total net assets | | $ | 5,545,508,646 | |
| | | | |
| |
NET ASSETS CONSIST OF | | | | |
Paid-in capital | | $ | 5,550,321,884 | |
Overdistributed net investment income | | | (482,582 | ) |
Accumulated net realized losses on investments | | | (4,330,656 | ) |
| | | | |
Total net assets | | $ | 5,545,508,646 | |
| | | | |
| |
COMPUTATION OF NET ASSET VALUE PRICE PER SHARE1 | | | | |
Net assets – Class A | | $ | 2,887,568,722 | |
Shares outstanding – Class A | | | 2,887,706,731 | |
Net asset value per share – Class A | | | $1.00 | |
Net assets – Class B | | $ | 316,535,403 | |
Shares outstanding – Class B | | | 316,548,696 | |
Net asset value per share – Class B | | | $1.00 | |
Net assets – Class C | | $ | 15,777,725 | |
Shares outstanding – Class C | | | 15,778,259 | |
Net asset value per share – Class C | | | $1.00 | |
Net assets – Daily Class | | $ | 1,194,214,570 | |
Shares outstanding – Daily Class | | | 1,194,266,664 | |
Net asset value per share – Daily Class | | | $1.00 | |
Net assets – Investor Class | | $ | 656,621,433 | |
Shares outstanding – Investor Class | | | 656,636,730 | |
Net asset value per share – Investor Class | | | $1.00 | |
Net assets – Service Class | | $ | 474,790,793 | |
Shares outstanding – Service Class | | | 474,806,411 | |
Net asset value per share – Service Class | | | $1.00 | |
| 1. | The Fund has an unlimited number of authorized shares. |
The accompanying notes are an integral part of these financial statements.
| | | | | | |
| Statement of Operations—Six Months Ended July 31, 2012 (Unaudited) | | Wells Fargo Advantage Money Market Fund | | | 15 | |
| | | | |
| | | | |
| |
Investment income | | | | |
Interest | | $ | 7,009,373 | |
| | | | |
| |
Expenses | | | | |
Advisory fee | | | 7,895,151 | |
Administration fees | | | | |
Fund level | | | 1,392,514 | |
Class A | | | 3,239,264 | |
Class B | | | 375,537 | |
Class C | | | 17,985 | |
Daily Class | | | 1,464,110 | |
Investor Class | | | 776,453 | |
Service Class | | | 278,871 | |
Shareholder servicing fees | | | | |
Class A | | | 3,671,692 | |
Class B | | | 417,141 | |
Class C | | | 19,568 | |
Daily Class | | | 1,663,761 | |
Investor Class | | | 769,776 | |
Service Class | | | 580,982 | |
Distribution fees | | | | |
Class B | | | 1,280,238 | |
Class C | | | 61,312 | |
Daily Class | | | 1,663,761 | |
Custody and accounting fees | | | 123,867 | |
Professional fees | | | 15,577 | |
Registration fees | | | 8,226 | |
Shareholder report expenses | | | 11,685 | |
Trustees’ fees and expenses | | | 1,505 | |
Other fees and expenses | | | 25,665 | |
| | | | |
Total expenses | | | 25,754,641 | |
Less: Fee waivers and/or expense reimbursements | | | (19,032,034 | ) |
| | | | |
Net expenses | | | 6,722,607 | |
| | | | |
Net investment income | | | 286,766 | |
| | | | |
Net realized gains on investments | | | 36,695 | |
| | | | |
Net increase in net assets resulting from operations | | $ | 323,461 | |
| | | | |
The accompanying notes are an integral part of these financial statements.
| | | | |
| 16 | | Wells Fargo Advantage Money Market Fund | | Statement of Changes in Net Assets |
| | | | | | | | | | | | | | | | |
| | | Six Months Ended
July 31, 2012 (Unaudited) | | | Year Ended
January 31, 2012 | |
| | | | |
Operations | | | | | | | | | | | | | | | | |
Net investment income | | | | | | $ | 286,766 | | | | | | | $ | 703,981 | |
Net realized gains on investments | | | | | | | 36,695 | | | | | | | | 80,715 | |
| | | | | | | | | | | | | | | | |
Net increase in net assets resulting from operations | | | | | | | 323,461 | | | | | | | | 784,696 | |
| | | | | | | | | | | | | | | | |
| | | | |
Distributions to shareholders from | | | | | | | | | | | | | | | | |
Net investment income | | | | | | | | | | | | | | | | |
Class A | | | | | | | (147,648 | ) | | | | | | | (375,905 | ) |
Class B | | | | | | | (17,117 | ) | | | | | | | (44,994 | ) |
Class C | | | | | | | (820 | ) | | | | | | | (1,907 | ) |
Daily Class | | | | | | | (66,735 | ) | | | | | | | (166,296 | ) |
Investor Class | | | | | | | (31,143 | ) | | | | | | | (65,026 | ) |
Service Class | | | | | | | (23,303 | ) | | | | | | | (49,853 | ) |
| | | | | | | | | | | | | | | | |
Total distributions to shareholders | | | | | | | (286,766 | ) | | | | | | | (703,981 | ) |
| | | | | | | | | | | | | | | | |
| | | | |
| | | Shares | | | | | | | | Shares | | | | | |
| | | | |
Capital share transactions | | | | | | | | | | | | | | | | |
Proceeds from shares sold | | | | | | | | | | | | | | | | |
Class A | | | 1,579,065,067 | | | | 1,579,065,067 | | | | 4,660,952,539 | | | | 4,660,952,539 | |
Class B | | | 179,250,184 | | | | 179,250,184 | | | | 605,005,674 | | | | 605,005,674 | |
Class C | | | 3,638,861 | | | | 3,638,861 | | | | 15,936,028 | | | | 15,936,028 | |
Daily Class | | | 1,861,967,896 | | | | 1,861,967,896 | | | | 6,255,183,944 | | | | 6,255,183,944 | |
Investor Class | | | 177,256,846 | | | | 177,256,846 | | | | 276,409,375 | | | | 276,409,375 | |
Service Class | | | 1,367,016,350 | | | | 1,367,016,350 | | | | 2,437,493,083 | | | | 2,437,493,083 | |
| | | | | | | | | | | | | | | | |
| | | | | | | 5,168,195,204 | | | | | | | | 14,250,980,643 | |
| | | | | | | | | | | | | | | | |
Reinvestment of distributions | | | | | | | | | | | | | | | | |
Class A | | | 143,731 | | | | 143,731 | | | | 365,212 | | | | 365,212 | |
Class B | | | 17,036 | | | | 17,036 | | | | 44,458 | | | | 44,458 | |
Class C | | | 759 | | | | 759 | | | | 1,656 | | | | 1,656 | |
Daily Class | | | 40,326 | | | | 40,326 | | | | 107,591 | | | | 107,591 | |
Investor Class | | | 25,602 | | | | 25,602 | | | | 52,900 | | | | 52,900 | |
Service Class | | | 2,509 | | | | 2,509 | | | | 3,898 | | | | 3,898 | |
| | | | | | | | | | | | | | | | |
| | | | | | | 229,963 | | | | | | | | 575,715 | |
| | | | | | | | | | | | | | | | |
Payment for shares redeemed | | | | | | | | | | | | | | | | |
Class A | | | (1,801,679,516 | ) | | | (1,801,679,516 | ) | | | (6,460,081,692 | ) | | | (6,460,081,692 | ) |
Class B | | | (263,411,153 | ) | | | (263,411,153 | ) | | | (747,072,959 | ) | | | (747,072,959 | ) |
Class C | | | (6,772,218 | ) | | | (6,772,218 | ) | | | (17,011,914 | ) | | | (17,011,914 | ) |
Daily Class | | | (2,232,628,846 | ) | | | (2,232,628,846 | ) | | | (6,788,474,703 | ) | | | (6,788,474,703 | ) |
Investor Class | | | (151,349,521 | ) | | | (151,349,521 | ) | | | (314,677,938 | ) | | | (314,677,938 | ) |
Service Class | | | (1,364,992,576 | ) | | | (1,364,992,576 | ) | | | (2,541,454,832 | ) | | | (2,541,454,832 | ) |
| | | | | | | | | | | | | | | | |
| | | | | | | (5,820,833,830 | ) | | | | | | | (16,868,774,038 | ) |
| | | | | | | | | | | | | | | | |
Net decrease in net assets resulting from capital share transactions | | | | | | | (652,408,663 | ) | | | | | | | (2,617,217,680 | ) |
| | | | | | | | | | | | | | | | |
Total decrease in net assets | | | | | | | (652,371,968 | ) | | | | | | | (2,617,136,965 | ) |
| | | | | | | | | | | | | | | | |
| | | | |
Net assets | | | | | | | | | | | | | | | | |
Beginning of period | | | | | | | 6,197,880,614 | | | | | | | | 8,815,017,579 | |
| | | | | | | | | | | | | | | | |
End of period | | | | | | $ | 5,545,508,646 | | | | | | | $ | 6,197,880,614 | |
| | | | | | | | | | | | | | | | |
Overdistributed net investment income | | | | | | $ | (482,582 | ) | | | | | | $ | (482,582 | ) |
| | | | | | | | | | | | | | | | |
The accompanying notes are an integral part of these financial statements.
| | | | | | |
| Financial Highlights | | Wells Fargo Advantage Money Market Fund | | | 17 | |
(For a share outstanding throughout each period)
| | | | | | | | | | | | | | | | | | | | | | | | | | | | |
| | | Six Months Ended
July 31, 2012 (Unaudited) | | | Year Ended January 31, | | | Year Ended February 28, | |
| Class A | | | 2012 | | | 20111 | | | 2010 | | | 2009 | | | 20082 | | | 2007 | |
Net asset value, beginning of period | | $ | 1.00 | | | $ | 1.00 | | | $ | 1.00 | | | $ | 1.00 | | | $ | 1.00 | | | $ | 1.00 | | | $ | 1.00 | |
Net investment income | | | 0.00 | 3 | | | 0.00 | 3 | | | 0.00 | 3 | | | 0.00 | 3 | | | 0.02 | | | | 0.04 | | | | 0.04 | |
Net realized gains on investments | | | 0.00 | 3 | | | 0.00 | 3 | | | 0.00 | 3 | | | 0.00 | 3 | | | 0.00 | | | | 0.00 | | | | 0.00 | |
| | | | | | | | | | | | | | | | | | | | | | | | | | | | |
Total from investment operations | | | 0.00 | 3 | | | 0.00 | 3 | | | 0.00 | 3 | | | 0.00 | 3 | | | 0.02 | | | | 0.04 | | | | 0.04 | |
Distributions to shareholders from | | | | | | | | | | | | | | | | | | | | | | | | | | | | |
Net investment income | | | (0.00 | )3 | | | (0.00 | )3 | | | (0.00 | )3 | | | (0.00 | )3 | | | (0.02 | ) | | | (0.04 | ) | | | (0.04 | ) |
Net realized gains | | | 0.00 | | | | 0.00 | | | | 0.00 | | | | 0.00 | | | | (0.00 | )3 | | | 0.00 | | | | 0.00 | |
| | | | | | | | | | | | | | | | | | | | | | | | | | | | |
Total distributions to shareholders | | | (0.00 | )3 | | | (0.00 | )3 | | | (0.00 | )3 | | | (0.00 | )3 | | | (0.02 | ) | | | (0.04 | ) | | | (0.04 | ) |
Net asset value, end of period | | $ | 1.00 | | | $ | 1.00 | | | $ | 1.00 | | | $ | 1.00 | | | $ | 1.00 | | | $ | 1.00 | | | $ | 1.00 | |
Total return4 | | | 0.00 | % | | | 0.01 | % | | | 0.01 | % | | | 0.04 | % | | | 1.74 | % | | | 4.48 | % | | | 4.54 | % |
Ratios to average net assets (annualized) | | | | | | | | | | | | | | | | | | | | | | | | | |
Gross expenses | | | 0.80 | % | | | 0.80 | % | | | 0.79 | % | | | 0.88 | % | | | 0.83 | % | | | 0.81 | % | | | 0.82 | % |
Net expenses | | | 0.24 | % | | | 0.26 | % | | | 0.35 | % | | | 0.58 | % | | | 0.79 | % | | | 0.76 | % | | | 0.76 | % |
Net investment income | | | 0.01 | % | | | 0.01 | % | | | 0.01 | % | | | 0.05 | % | | | 1.75 | % | | | 4.37 | % | | | 4.46 | % |
Supplemental data | | | | | | | | | | | | | | | | | | | | | | | | | | | | |
Net assets, end of period (000’s omitted) | | | $2,887,569 | | | | $3,110,020 | | | | $4,908,741 | | | | $5,218,601 | | | | $8,894,795 | | | | $11,659,129 | | | | $8,430,922 | |
| 1. | For the eleven months ended January 31, 2011. The Fund changed its fiscal year end from February 28 to January 31, effective January 31, 2011. |
| 2. | Year ended February 29. |
| 3. | Amount is less than $0.005. |
| 4. | Returns for periods of less than one year are not annualized. |
The accompanying notes are an integral part of these financial statements.
| | | | |
| 18 | | Wells Fargo Advantage Money Market Fund | | Financial Highlights |
(For a share outstanding throughout each period)
| | | | | | | | | | | | | | | | | | | | | | | | | | | | |
| | | Six Months Ended
July 31, 2012 (Unaudited) | | | Year Ended January 31, | | | Year Ended February 28, | |
| Class B | | | 2012 | | | 20111 | | | 2010 | | | 2009 | | | 20082 | | | 2007 | |
Net asset value, beginning of period | | $ | 1.00 | | | $ | 1.00 | | | $ | 1.00 | | | $ | 1.00 | | | $ | 1.00 | | | $ | 1.00 | | | $ | 1.00 | |
Net investment income | | | 0.00 | 3 | | | 0.00 | 3 | | | 0.00 | 3 | | | 0.00 | 3 | | | 0.01 | | | | 0.04 | | | | 0.04 | |
Net realized gains on investments | | | 0.00 | 3 | | | 0.00 | 3 | | | 0.00 | 3 | | | 0.00 | 3 | | | 0.00 | | | | 0.00 | | | | 0.00 | |
| | | | | | | | | | | | | | | | | | | | | | | | | | | | |
Total from investment operations | | | 0.00 | 3 | | | 0.00 | 3 | | | 0.00 | 3 | | | 0.00 | 3 | | | 0.01 | | | | 0.04 | | | | 0.04 | |
Distributions to shareholders from | | | | | | | | | | | | | | | | | | | | | | | | | | | | |
Net investment income | | | (0.00 | )3 | | | (0.00 | )3 | | | (0.00 | )3 | | | (0.00 | )3 | | | (0.01 | ) | | | (0.04 | ) | | | (0.04 | ) |
Net realized gains | | | 0.00 | | | | 0.00 | | | | 0.00 | | | | 0.00 | | | | (0.00 | )3 | | | 0.00 | | | | 0.00 | |
| | | | | | | | | | | | | | | | | | | | | | | | | | | | |
Total distributions to shareholders | | | (0.00 | )3 | | | (0.00 | )3 | | | (0.00 | )3 | | | (0.00 | )3 | | | (0.01 | ) | | | (0.04 | ) | | | (0.04 | ) |
Net asset value, end of period | | $ | 1.00 | | | $ | 1.00 | | | $ | 1.00 | | | $ | 1.00 | | | $ | 1.00 | | | $ | 1.00 | | | $ | 1.00 | |
Total return4 | | | 0.00 | % | | | 0.01 | % | | | 0.01 | % | | | 0.01 | % | | | 1.03 | % | | | 3.71 | % | | | 3.76 | % |
Ratios to average net assets (annualized) | | | | | | | | | | | | | | | | | | | | | | | | | | | | |
Gross expenses | | | 1.55 | % | | | 1.55 | % | | | 1.56 | % | | | 1.62 | % | | | 1.58 | % | | | 1.57 | % | | | 1.57 | % |
Net expenses | | | 0.23 | % | | | 0.26 | % | | | 0.35 | % | | | 0.62 | % | | | 1.49 | % | | | 1.51 | % | | | 1.51 | % |
Net investment income | | | 0.01 | % | | | 0.01 | % | | | 0.01 | % | | | 0.01 | % | | | 1.04 | % | | | 3.66 | % | | | 3.70 | % |
Supplemental data | | | | | | | | | | | | | | | | | | | | | | | | | | | | |
Net assets, end of period (000’s omitted) | | | $316,535 | | | | $400,677 | | | | $542,695 | | | | $628,445 | | | | $1,238,714 | | | | $1,438,346 | | | | $1,431,103 | |
| 1. | For the eleven months ended January 31, 2011. The Fund changed its fiscal year end from February 28 to January 31, effective January 31, 2011. |
| 2. | Year ended February 29. |
| 3. | Amount is less than $0.005. |
| 4. | Total return calculations do not include any sales charges. Returns for periods of less than one year are not annualized. |
The accompanying notes are an integral part of these financial statements.
| | | | | | |
| Financial Highlights | | Wells Fargo Advantage Money Market Fund | | | 19 | |
(For a share outstanding throughout each period)
| | | | | | | | | | | | |
| | | Six Months Ended
July 31, 2012
(Unaudited) | | | Year Ended January 31, | |
| Class C | | | 2012 | | | 20111 | |
Net asset value, beginning of period | | $ | 1.00 | | | $ | 1.00 | | | $ | 1.00 | |
Net investment income | | | 0.00 | 2 | | | 0.00 | 2 | | | 0.00 | 2 |
Net realized gains on investments | | | 0.00 | 2 | | | 0.00 | 2 | | | 0.00 | 2 |
| | | | | | | | | | | | |
Total from investment operations | | | 0.00 | 2 | | | 0.00 | 2 | | | 0.00 | 2 |
Distributions to shareholders from | | | | | | | | | | | | |
Net investment income | | | (0.00 | )2 | | | (0.00 | )2 | | | (0.00 | )2 |
Net asset value, end of period | | $ | 1.00 | | | $ | 1.00 | | | $ | 1.00 | |
Total return3 | | | 0.00 | % | | | 0.01 | % | | | 0.01 | % |
Ratios to average net assets (annualized) | | | | | | | | | | | | |
Gross expenses | | | 1.54 | % | | | 1.51 | % | | | 1.52 | % |
Net expenses | | | 0.24 | % | | | 0.26 | % | | | 0.36 | % |
Net investment income | | | 0.01 | % | | | 0.01 | % | | | 0.01 | % |
Supplemental data | | | | | | | | | | | | |
Net assets, end of period (000’s omitted) | | | $15,778 | | | | $18,910 | | | | $19,984 | |
| 1. | For the period from June 30, 2010 (commencement of class operations) to January 31, 2011. |
| 2. | Amount is less than $0.005. |
| 3. | Total return calculations do not include any sales charges. Returns for periods of less than one year are not annualized. |
The accompanying notes are an integral part of these financial statements.
| | | | |
| 20 | | Wells Fargo Advantage Money Market Fund | | Financial Highlights |
(For a share outstanding throughout each period)
| | | | | | | | | | | | |
| | | Six Months Ended
July 31, 2012 (Unaudited) | | | Year Ended January 31, | |
| Daily Class | | | 2012 | | | 20111 | |
Net asset value, beginning of period | | $ | 1.00 | | | $ | 1.00 | | | $ | 1.00 | |
Net investment income | | | 0.00 | 2 | | | 0.00 | 2 | | | 0.00 | 2 |
Net realized gains on investments | | | 0.00 | 2 | | | 0.00 | 2 | | | 0.00 | 2 |
| | | | | | | | | | | | |
Total from investment operations | | | 0.00 | 2 | | | 0.00 | 2 | | | 0.00 | 2 |
Distributions to shareholders from | | | | | | | | | | | | |
Net investment income | | | (0.00 | )2 | | | (0.00 | )2 | | | (0.00 | )2 |
Net asset value, end of period | | $ | 1.00 | | | $ | 1.00 | | | $ | 1.00 | |
Total return3 | | | 0.00 | % | | | 0.01 | % | | | 0.01 | % |
Ratios to average net assets (annualized) | | | | | | | | | | | | |
Gross expenses | | | 1.05 | % | | | 1.06 | % | | | 1.04 | % |
Net expenses | | | 0.23 | % | | | 0.26 | % | | | 0.36 | % |
Net investment income | | | 0.01 | % | | | 0.01 | % | | | 0.01 | % |
Supplemental data | | | | | | | | | | | | |
Net assets, end of period (000’s omitted) | | | $1,194,215 | | | | $1,564,827 | | | | $2,097,990 | |
| 1. | For the period from June 30, 2010 (commencement of class operations) to January 31, 2011. |
| 2. | Amount is less than $0.005. |
| 3. | Returns for periods of less than one year are not annualized. |
The accompanying notes are an integral part of these financial statements.
| | | | | | |
| Financial Highlights | | Wells Fargo Advantage Money Market Fund | | | 21 | |
(For a share outstanding throughout each period)
| | | | | | | | | | | | | | | | | | | | | | | | | | | | |
| | | Six Months Ended
July 31, 2012
(Unaudited) | | | Year Ended
January 31, | | | Year Ended February 28, | |
| Investor Class | | | 2012 | | | 20111 | | | 2010 | | | 2009 | | | 20082 | | | 2007 | |
Net asset value, beginning of period | | $ | 1.00 | | | $ | 1.00 | | | $ | 1.00 | | | $ | 1.00 | | | $ | 1.00 | | | $ | 1.00 | | | $ | 1.00 | |
Net investment income | | | 0.00 | 3 | | | 0.00 | 3 | | | 0.00 | 3 | | | 0.00 | 3 | | | 0.02 | | | | 0.05 | | | | 0.05 | |
Net realized gains on investments | | | 0.00 | 3 | | | 0.00 | 3 | | | 0.00 | 3 | | | 0.00 | 3 | | | 0.00 | 3 | | | 0.00 | | | | 0.00 | |
| | | | | | | | | | | | | | | | | | | | | | | | | | | | |
Total from investment operations | | | 0.00 | 3 | | | 0.00 | 3 | | | 0.00 | 3 | | | 0.00 | 3 | | | 0.02 | | | | 0.05 | | | | 0.05 | |
Distributions to shareholders from | | | | | | | | | | | | | | | | | | | | | | | | | | | | |
Net investment income | | | (0.00 | )3 | | | (0.00 | )3 | | | (0.00 | )3 | | | (0.00 | )3 | | | (0.02 | ) | | | (0.05 | ) | | | (0.05 | ) |
Net realized gains | | | 0.00 | | | | 0.00 | | | | 0.00 | | | | 0.00 | | | | (0.00 | )3 | | | 0.00 | | | | 0.00 | |
| | | | | | | | | | | | | | | | | | | | | | | | | | | | |
Total distributions to shareholders | | | (0.00 | )3 | | | (0.00 | )3 | | | (0.00 | )3 | | | (0.00 | )3 | | | (0.02 | ) | | | (0.05 | ) | | | (0.05 | ) |
Net asset value, end of period | | $ | 1.00 | | | $ | 1.00 | | | $ | 1.00 | | | $ | 1.00 | | | $ | 1.00 | | | $ | 1.00 | | | $ | 1.00 | |
Total return4 | | | 0.00 | % | | | 0.01 | % | | | 0.01 | % | | | 0.08 | % | | | 1.85 | % | | | 4.60 | % | | | 4.65 | % |
Ratios to average net assets (annualized) | | | | | | | | | | | | | | | | | | | | | | | | | | | | |
Gross expenses | | | 0.83 | % | | | 0.84 | % | | | 0.84 | % | | | 0.92 | % | | | 0.90 | % | | | 0.94 | % | | | 0.99 | % |
Net expenses | | | 0.24 | % | | | 0.26 | % | | | 0.35 | % | | | 0.52 | % | | | 0.68 | % | | | 0.65 | % | | | 0.65 | % |
Net investment income | | | 0.01 | % | | | 0.01 | % | | | 0.01 | % | | | 0.08 | % | | | 1.82 | % | | | 4.50 | % | | | 4.56 | % |
Supplemental data | | | | | | | | | | | | | | | | | | | | | | | | | | | | |
Net assets, end of period (000’s omitted) | | | $656,621 | | | | $630,684 | | | | $668,894 | | | | $731,932 | | | | $921,649 | | | | $926,851 | | | | $764,268 | |
| 1. | For the eleven months ended January 31, 2011. The Fund changed its fiscal year end from February 28 to January 31, effective January 31, 2011. |
| 2. | Year ended February 29. |
| 3. | Amount is less than $0.005. |
| 4. | Returns for periods of less than one year are not annualized. |
The accompanying notes are an integral part of these financial statements.
| | | | |
| 22 | | Wells Fargo Advantage Money Market Fund | | Financial Highlights |
(For a share outstanding throughout each period)
| | | | | | | | | | | | |
| | | Six Months Ended
July 31, 2012 (Unaudited) | | | Year Ended January 31, | |
| Service Class | | | 2012 | | | 20111 | |
Net asset value, beginning of period | | $ | 1.00 | | | $ | 1.00 | | | $ | 1.00 | |
Net investment income | | | 0.00 | 2 | | | 0.00 | 2 | | | 0.00 | 2 |
Net realized gains on investments | | | 0.00 | 2 | | | 0.00 | 2 | | | 0.00 | 2 |
| | | | | | | | | | | | |
Total from investment operations | | | 0.00 | 2 | | | 0.00 | 2 | | | 0.00 | 2 |
Distributions to shareholders from | | | | | | | | | | | | |
Net investment income | | | (0.00 | )2 | | | (0.00 | )2 | | | (0.00 | )2 |
Net asset value, end of period | | $ | 1.00 | | | $ | 1.00 | | | $ | 1.00 | |
Total return3 | | | 0.00 | % | | | 0.01 | % | | | 0.01 | % |
Ratios to average net assets (annualized) | | | | | | | | | | | | |
Gross expenses | | | 0.70 | % | | | 0.71 | % | | | 0.69 | % |
Net expenses | | | 0.24 | % | | | 0.26 | % | | | 0.35 | % |
Net investment income | | | 0.01 | % | | | 0.01 | % | | | 0.01 | % |
Supplemental data | | | | | | | | | | | | |
Net assets, end of period (000’s omitted) | | | $474,791 | | | | $472,761 | | | | $576,714 | |
| 1. | For the period from June 30, 2010 (commencement of class operations) to January 31, 2011. |
| 2. | Amount is less than $0.005. |
| 3. | Returns for periods of less than one year are not annualized. |
The accompanying notes are an integral part of these financial statements.
| | | | | | |
| Notes to Financial Statements (Unaudited) | | Wells Fargo Advantage Money Market Fund | | | 23 | |
1. ORGANIZATION
Wells Fargo Funds Trust (the “Trust”), a Delaware statutory trust organized on March 10, 1999, is an open-end management investment company registered under the Investment Company Act of 1940, as amended (the “1940 Act”). These financial statements report on Wells Fargo Advantage Money Market Fund (the “Fund”) which is a diversified series of the Trust.
2. SIGNIFICANT ACCOUNTING POLICIES
The following significant accounting policies, which are consistently followed in the preparation of the financial statements of the Fund, are in conformity with U.S. generally accepted accounting principles which require management to make estimates and assumptions that affect the reported amounts of assets and liabilities, disclosure of contingent assets and liabilities at the date of the financial statements, and the reported amounts of revenues and expenses during the reporting period. Actual results could differ from those estimates.
Securities valuation
As permitted under Rule 2a-7 of the 1940 Act, portfolio securities are valued at amortized cost, which approximates fair value. The amortized cost method involves valuing a security at its cost, plus accretion of discount or minus amortization of premium over the period until maturity.
Investments which are not valued using the method discussed above are valued at their fair value, as determined by procedures established in good faith and approved by the Board of Trustees. The Board of Trustees has established a Valuation Committee comprised of the Trustees and has delegated to it the authority to take any actions regarding the valuation of portfolio securities that the Valuation Committee deems necessary in determining the fair value of portfolio securities, unless the responsibility has been delegated to the Management Valuation Team of Wells Fargo Funds Management, LLC (“Funds Management”). The Board of Trustees retains the authority to make or ratify any valuation decisions or approve any changes to the Valuation Procedures as it deems appropriate. On a quarterly basis, the Board of Trustees considers for ratification any valuation actions taken by the Valuation Committee or the Management Valuation Team.
Valuations of fair valued securities are compared to the next actual sales price when available, or other appropriate market information to assess the continued appropriateness of the fair valuation methodology used. These securities are fair valued on a day-to-day basis, taking into consideration changes to appropriate market information and any significant changes to the input factors considered in the valuation process until there is a readily available price provided on the exchange or by an independent pricing service. Valuations received from an independent pricing service or broker quotes are periodically validated by comparisons to most recent trades and valuations provided by other independent pricing services in addition to the review of prices by the adviser and/or sub-adviser. Unobservable inputs used in determining fair valuations are identified based on the type of security, taking into consideration factors utilized by market participants in valuing the investment, knowledge about the issuer and the current market environment.
Repurchase agreements
The Fund may invest in repurchase agreements and may participate in pooled repurchase agreement transactions with other funds advised by Funds Management. The repurchase agreements must be fully collateralized based on values that are marked-to-market daily. The collateral may be held by an agent bank under a tri-party agreement. It is the custodian’s responsibility to value collateral daily and to take action to obtain additional collateral as necessary to maintain market value equal to or greater than the resale price. The repurchase agreements are collateralized by instruments such as U.S. Treasury, federal agency, or high-grade corporate obligations. There could be potential loss to the Fund in the event that the Fund is delayed or prevented from exercising its rights to dispose of the collateral, including the risk of a possible decline in the value of the underlying obligations during the period in which the Fund seeks to assert its rights.
Security transactions and income recognition
Securities transactions are recorded on a trade date basis. Realized gains or losses are reported on the basis of identified cost of securities delivered.
Interest income is accrued daily and bond discounts are accreted and premiums are amortized daily based on the effective interest method. To the extent debt obligations are placed on non-accrual status, any related interest income
| | | | |
| 24 | | Wells Fargo Advantage Money Market Fund | | Notes to Financial Statements (Unaudited) |
may be reduced by writing off interest receivables when the collection of all or a portion of interest has become doubtful based on consistently applied procedures. If the issuer subsequently resumes interest payments or when the collectability of interest is reasonably assured, the debt obligation is removed from non-accrual status.
Distributions to shareholders
Distributions to shareholders from net investment income are accrued daily and paid monthly. Distributions from net realized gains, if any, are recorded on the ex-dividend date. Such distributions are determined in conformity with income tax regulations, which may differ from generally accepted accounting principles.
Federal and other taxes
The Fund intends to continue to qualify as a regulated investment company by distributing substantially all of its investment company taxable income and any net realized capital gains (after reduction for capital loss carryforwards) sufficient to relieve it from all, or substantially all, federal income taxes. Accordingly, no provision for federal income taxes was required.
The Fund’s income and federal excise tax returns and all financial records supporting those returns for the prior three fiscal years are subject to examination by the federal and Delaware revenue authorities. Management has analyzed the Fund’s tax positions taken on federal, state, and foreign tax returns for all open tax years and does not believe that there are any uncertain tax positions that require recognition of a tax liability.
As of January 31, 2012, the Fund had net capital loss carryforwards, which are available to offset future net realized capital gains, in the amount of $4,367,351 with $3,959,065 expiring in 2017 and $408,286 expiring in 2019.
Class allocations
The separate classes of shares offered by the Fund differ principally in applicable sales charges, distribution, shareholder servicing and administration fees. Shareholders of each class bear certain expenses that pertain to that particular class. All shareholders bear the common expenses of the Fund, earn income from the portfolio, and are allocated any unrealized gains and losses pro rata based on the average daily net assets of each class, without distinction between share classes. Dividends are determined separately for each class based on income and expenses allocable to each class. Realized gains and losses are allocated to each class pro rata based upon the net assets of each class on the date realized. Differences in per share dividend rates generally result from the relative weightings of pro rata income and realized gain allocations and from differences in separate class expenses, including distribution, shareholder servicing and administration fees.
3. FAIR VALUATION MEASUREMENTS
Fair value measurements of investments are determined within a framework that has established a fair value hierarchy based upon the various data inputs utilized in determining the value of the Fund’s investments. The three-level hierarchy gives the highest priority to unadjusted quoted prices in active markets for identical assets or liabilities (Level 1) and the lowest priority to significant unobservable inputs (Level 3). The Fund’s investments are classified within the fair value hierarchy based on the lowest level of input that is significant to the fair value measurement. The inputs are summarized into three broad levels as follows:
| n | | Level 1 – quoted prices in active markets for identical securities |
| n | | Level 2 – other significant observable inputs (including quoted prices for similar securities, interest rates, prepayment speeds, credit risk, etc.) |
| n | | Level 3 – significant unobservable inputs (including the Fund’s own assumptions in determining the fair value of investments) |
The inputs or methodologies used for valuing securities are not necessarily an indication of the risk associated with investing in those securities.
At July 31, 2012, all of the Fund’s investments in securities carried at fair value were designated as Level 2 since the primary inputs include credit quality of the issuer and short-term interest rates which are observable.
Further details on the major security types can be found in the Summary Portfolio of Investments.
| | | | | | |
| Notes to Financial Statements (Unaudited) | | Wells Fargo Advantage Money Market Fund | | | 25 | |
Transfers in and transfers out are recognized at the end of the reporting period. For the six months ended July 31, 2012, the Fund did not have any transfers into/out of Level 1 and Level 2.
4. TRANSACTIONS WITH AFFILIATES AND OTHER EXPENSES
Advisory fee
The Trust has entered into an advisory contract with Funds Management, an indirect wholly owned subsidiary of Wells Fargo & Company (“Wells Fargo”). The adviser is responsible for implementing investment policies and guidelines and for supervising the sub-adviser, who is responsible for day-to-day portfolio management of the Fund.
Pursuant to the contract, Funds Management is entitled to receive an annual advisory fee starting at 0.30% and declining to 0.20% as the average daily net assets of the Fund increase. For the six months ended July 31, 2012, the advisory fee was equivalent to an annual rate of 0.28% of the Fund’s average daily net assets.
Funds Management has retained the services of a sub-adviser to provide daily portfolio management to the Fund. The fee for sub-advisory services is borne by Funds Management. Wells Capital Management Incorporated, an affiliate of Funds Management, is the sub-adviser to the Fund and is entitled to receive a fee from Funds Management at an annual rate starting at 0.05% and declining to 0.01% as the average daily net assets of the Fund increase.
Administration and transfer agent fees
The Trust has entered into an administration agreement with Funds Management. Under this agreement, for providing administrative services, which includes paying fees and expenses for services provided by the transfer agent, sub-transfer agents, omnibus account servicers and record-keepers, Funds Management is entitled to receive from the Fund an annual fund level administration fee starting at 0.05% and declining to 0.03% as the average daily net assets of the Fund increase and a class level administration fee which is calculated based on the average daily net assets of each class as follows:
| | | | |
| | | Class Level Administration Fee | |
Class A, Class B, Class C, Daily Class | | | 0.22 | % |
Investor Class | | | 0.25 | |
Service Class | | | 0.12 | |
Funds Management has contractually waived and/or reimbursed advisory and administration fees to the extent necessary to maintain certain net operating expense ratios for the Fund. Waiver of fees and/or reimbursement of expenses by Funds Management were made first from fund level expenses on a proportionate basis and then from class specific expenses. Funds Management has committed through July 11, 2013 to waive fees and/or reimburse expenses to the extent necessary to cap the Fund’s expenses at 0.70% for Class A, 1.45% for Class B, 1.45% for Class C, 1.00% for Daily Class, 0.65% for Investor Class, and 0.50% for Service Class.
Distribution fees
The Trust has adopted a Distribution Plan for Class B, Class C and Daily Class shares of the Fund pursuant to Rule 12b-1 under the 1940 Act. Distribution fees are charged to Class B, Class C and Daily Class shares and paid to Wells Fargo Funds Distributor, LLC, the principal underwriter, at an annual rate of 0.75% of the average daily net assets of Class B and Class C shares and 0.25% of the average daily net assets for Daily Class shares.
For the six months ended July 31, 2012, Wells Fargo Funds Distributor, LLC received $2,217, $10,131 and $1,452 in contingent deferred sales charges from redemptions of Class A, Class B and Class C shares, respectively.
Shareholder servicing fees
The Trust has entered into contracts with one or more shareholder servicing agents, whereby each class of the Fund is charged a fee at an annual rate of 0.25% of the respective average daily net assets of each class.
A portion of these total shareholder servicing fees were paid to affiliates of Wells Fargo.
| | | | |
| 26 | | Wells Fargo Advantage Money Market Fund | | Notes to Financial Statements (Unaudited) |
5. INDEMNIFICATION
Under the Trust’s organizational documents, the officers and directors are indemnified against certain liabilities that may arise out of performance of their duties to the Trust. Additionally, in the normal course of business, the Trust may enter into contracts with service providers that contain a variety of indemnification clauses. The Trust’s maximum exposure under these arrangements is dependent on future claims that may be made against the Fund and, therefore, cannot be estimated.
6. NEW ACCOUNTING PRONOUNCEMENT
In December 2011, the Financial Accounting Standards Board (“FASB”) issued Accounting Standard Update (“ASU”) No. 2011-11, Disclosures about Offsetting Assets and Liabilities. ASU 2011-11, which amends FASB ASC Topic 210, Balance Sheet, creates new disclosure requirements which require entities to disclose both gross and net information for derivatives and other financial instruments that are either offset in the Statement of Assets and Liabilities or subject to an enforceable master netting arrangement or similar agreement. The disclosure requirements are effective for interim and annual reporting periods beginning on or after January 1, 2013. Management is currently assessing the potential impact, in addition to expanded financial statement disclosure, that may result from adopting this ASU.
| | | | | | |
| Other Information (Unaudited) | | Wells Fargo Advantage Money Market Fund | | | 27 | |
PROXY VOTING INFORMATION
A description of the policies and procedures that the Fund uses to determine how to vote proxies relating to portfolio securities is available without charge, upon request, by calling 1-800-222-8222, visiting our Web site at wellsfargoadvantagefunds.com, or visiting the SEC Web site at sec.gov. Information regarding how the Fund voted proxies relating to portfolio securities during the most recent 12-month period ended June 30 is available without charge on the Fund’s Web site at wellsfargoadvantagefunds.com or by visiting the SEC Web site at sec.gov.
PORTFOLIO HOLDINGS INFORMATION
The complete portfolio holdings for each Fund are publicly available on the Funds’ Web site (wellsfargoadvantagefunds.com) on a monthly, seven-day delayed basis. The Fund files its complete schedule of portfolio holdings with the SEC for the first and third quarters of each fiscal year on Form N-Q, which is available without charge by visiting the SEC Web site at sec.gov. In addition, each Fund’s Form N-Q may be reviewed and copied at the SEC’s Public Reference Room in Washington, DC, and at regional offices in New York City, at 233 Broadway, and in Chicago, at 175 West Jackson Boulevard, Suite 900. Information about the Public Reference Room may be obtained by calling 1-800-SEC-0330.
| | | | |
| 28 | | Wells Fargo Advantage Money Market Fund | | Other Information (Unaudited) |
BOARD OF TRUSTEES AND OFFICERS
Each of the Trustees and Officers listed in the table below acts in identical capacities for the Wells Fargo Advantage family of funds, which consists of 138 funds comprising the Wells Fargo Funds Trust, Wells Fargo Variable Trust, Wells Fargo Master Trust and four closed-end funds (collectively the “Fund Complex”). This table should be read in conjunction with the Prospectus and the Statement of Additional Information1. All of the Trustees are also Members of the Audit and Governance Committees of each Trust in the Fund Complex. The mailing address of each Trustee and Officer is 525 Market Street, 12th Floor, San Francisco, CA 94105. Each Trustee and Officer serves an indefinite term, however, each Trustee serves such term until reaching the mandatory retirement age established by the Trustees.
Independent Trustees
| | | | | | |
Name and Year of Birth | | Position Held and Length of Service* | | Principal Occupations During Past Five Years | | Other Directorships During
Past Five Years |
Peter G. Gordon
(Born 1942) | | Trustee, since 1998, Chairman, since 2005 | | Co-Founder, Retired Chairman, President and CEO of Crystal Geyser Water Company. Trustee Emeritus, Colby College | | Asset Allocation Trust |
Isaiah Harris, Jr.
(Born 1952) | | Trustee, since 2009 | | Retired. Prior thereto, President and CEO of BellSouth Advertising and Publishing Corp. from 2005 to 2007, President and CEO of BellSouth Enterprises from 2004 to 2005 and President of BellSouth Consumer Services from 2000 to 2003. Emeritus member of the Iowa State University Foundation Board of Governors. Emeritus Member of the Advisory Board of Iowa State University School of Business. Mr. Harris is a certified public accountant. | | CIGNA Corporation; Deluxe Corporation; Asset Allocation Trust |
Judith M. Johnson
(Born 1949) | | Trustee, since 2008
Audit Committee Chairman, since 2008 | | Retired. Prior thereto, Chief Executive Officer and Chief Investment Officer of Minneapolis Employees Retirement Fund from 1996 to 2008. Ms. Johnson is an attorney, certified public accountant and a certified managerial accountant. | | Asset Allocation Trust |
Leroy Keith, Jr.
(Born 1939) | | Trustee, since 2010 | | Chairman, Bloc Global Services (development and construction). Trustee of the Evergreen Funds from 1983 to 2010. Former Managing Director, Almanac Capital Management (commodities firm), former Partner, Stonington Partners, Inc. (private equity fund), former Director, Obagi Medical Products Co. and former Director, Lincoln Educational Services. | | Trustee, Virtus Fund Complex (consisting of 40 portfolios as of 12/31/11); Asset Allocation Trust |
David F. Larcker
(Born 1950) | | Trustee, since 2009 | | James Irvin Miller Professor of Accounting at the Graduate School of Business, Stanford University, Director of Corporate Governance Research Program and Senior Faculty of The Rock Center for Corporate Governance since 2006. From 2005 to 2008, Professor of Accounting at the Graduate School of Business, Stanford University. Prior thereto, Ernst & Young Professor of Accounting at The Wharton School, University of Pennsylvania from 1985 to 2005. | | Asset Allocation Trust |
Olivia S. Mitchell
(Born 1953) | | Trustee, since 2006 | | International Foundation of Employee Benefit Plans Professor, Wharton School of the University of Pennsylvania since 1993. Director of Wharton’s Pension Research Council and Boettner Center on Pensions & Retirement Research, and Research Associate at the National Bureau of Economic Research. Previously, Cornell University Professor from 1978 to 1993. | | Asset Allocation Trust |
Timothy J. Penny
(Born 1951) | | Trustee, since 1996 | | President and CEO of Southern Minnesota Initiative Foundation, a non-profit organization, since 2007 and Senior Fellow at the Humphrey Institute Policy Forum at the University of Minnesota since 1995. Member of the Board of Trustees of NorthStar Education Finance, Inc., a non-profit organization, since 2007. | | Asset Allocation Trust |
| | | | | | |
| Other Information (Unaudited) | | Wells Fargo Advantage Money Market Fund | | | 29 | |
| | | | | | |
Name and Year of Birth | | Position Held and Length of Service* | | Principal Occupations During Past Five Years | | Other Directorships During
Past Five Years |
Michael S. Scofield
(Born 1943) | | Trustee, since 2010 | | Served on the Investment Company Institute’s Board of Governors and Executive Committee from 2008-2011 as well the Governing Council of the Independent Directors Council from 2006-2011 and the Independent Directors Council Executive Committee from 2008-2011. Chairman of the IDC from 2008-2010. Institutional Investor (Fund Directions) Trustee of Year in 2007. Trustee of the Evergreen Funds (and its predecessors) from 1984 to 2010. Chairman of the Evergreen Funds from 2000-2010. Former Trustee of the Mentor Funds. Retired Attorney, Law Offices of Michael S. Scofield and former Director and Chairman, Branded Media Corporation (multi-media branding company). | | Asset Allocation Trust |
Donald C. Willeke
(Born 1940) | | Trustee, since 1996 | | Principal of the law firm of Willeke & Daniels. General Counsel of the Minneapolis Employees Retirement Fund from 1984 until its consolidation into the Minnesota Public Employees Retirement Association on June 30, 2010. Director and Vice Chair of The Free Trust (non-profit corporation). Director of the American Chestnut Foundation (non-profit corporation). | | Asset Allocation Trust |
| * | Length of service dates reflect the Trustee’s commencement of service with the Trust’s predecessor entities, where applicable. |
Officers
| | | | | | |
Name and Year of Birth | | Position Held and
Length of Service | | Principal Occupations During Past Five Years | | |
Karla M. Rabusch
(Born 1959) | | President, since 2003 | | Executive Vice President of Wells Fargo Bank, N.A. and President of Wells Fargo Funds Management, LLC since 2003. Senior Vice President and Chief Administrative Officer of Wells Fargo Funds Management, LLC from 2001 to 2003. | | |
C. David Messman
(Born 1960) | | Secretary, since 2000; Chief Legal Officer, since 2003 | | Senior Vice President and Secretary of Wells Fargo Funds Management, LLC since 2001. Vice President and Managing Senior Counsel of Wells Fargo Bank, N.A. since 1996. | | |
Nancy Wiser (Born 1967) | | Treasurer, since 2012 | | Executive Vice President of Wells Fargo Funds Management, LLC since 2011. Chief Operating Officer and Chief Compliance Officer at LightBox Capital Management LLC, from 2008 to 2011. Owned and operated a consulting business providing services to various hedge funds including acting as Chief Operating Officer and Chief Compliance Officer for a hedge fund from 2007 to 2008. Chief Operating Officer and Chief Compliance Officer of GMN Capital LLC from 2006 to 2007. | | |
David Berardi
(Born 1975) | | Assistant Treasurer, since 2009 | | Vice President of Wells Fargo Funds Management, LLC since 2009. Vice President of Evergreen Investment Management Company, LLC from 2008 to 2010. Assistant Vice President of Evergreen Investment Services, Inc. from 2004 to 2008. Manager of Fund Reporting and Control for Evergreen Investment Management Company, LLC from 2004 to 2010. | | |
Jeremy DePalma
(Born 1974) | | Assistant Treasurer, since 2009 | | Senior Vice President of Wells Fargo Funds Management, LLC since 2009. Senior Vice President of Evergreen Investment Management Company, LLC from 2008 to 2010. Vice President, Evergreen Investment Services, Inc. from 2004 to 2007. Head of the Fund Reporting and Control Team within Fund Administration from 2005 to 2010. | | |
Debra Ann Early
(Born 1964) | | Chief Compliance Officer, since 2007 | | Chief Compliance Officer of Wells Fargo Funds Management, LLC since 2007. Chief Compliance Officer of Parnassus Investments from 2005 to 2007. Chief Financial Officer of Parnassus Investments from 2004 to 2007 and Senior Audit Manager of PricewaterhouseCoopers LLP from 1998 to 2004. | | |
| 1. | The Statement of Additional Information includes additional information about the Trustees and is available, without charge, upon request, by calling 1-800-222-8222 or by visiting the Web site at wellsfargoadvantagefunds.com. |
| | | | |
| 30 | | Wells Fargo Advantage Money Market Fund | | Other Information (Unaudited) |
BOARD CONSIDERATION OF INVESTMENT ADVISORY AND SUB-ADVISORY AGREEMENTS:
Under Section 15 of the Investment Company Act of 1940 (the “1940 Act”), the Board of Trustees (the “Board”) of Wells Fargo Funds Trust (the “Trust”), all the members of which have no direct or indirect interest in the investment advisory and sub-advisory agreements and are not “interested persons” of the Trust, as defined in the 1940 Act (the “Independent Trustees”), must determine whether to approve the continuation of the Trust’s investment advisory and sub-advisory agreements. In this regard, at an in person meeting held on March 29-30, 2012 (the “Meeting”), the Board reviewed and re-approved: (i) an investment advisory agreement with Wells Fargo Funds Management, LLC (“Funds Management”) for Wells Fargo Advantage Money Market Fund (the “Fund”) and (ii) an investment sub-advisory agreement with Wells Capital Management Incorporated (“Wells Capital Management”) for the Fund. The investment advisory agreement with Funds Management and the investment sub-advisory agreement with Wells Capital Management are collectively referred to as the “Advisory Agreements.”
At the Meeting, the Board considered the factors and reached the conclusions described below relating to the selection of Funds Management and Wells Capital Management and the continuation of the Advisory Agreements. Prior to the Meeting, the Trustees conferred extensively among themselves and with representatives of Funds Management about these matters. The Board also met throughout the year and received information that was useful to them in considering the continuation of the Advisory Agreements. The Independent Trustees were assisted in their evaluation of the Advisory Agreements by independent legal counsel, from whom they received separate legal advice and with whom they met separately from Funds Management.
In providing information to the Board, Funds Management and Wells Capital Management were guided by a detailed set of requests submitted by the Independent Trustees’ independent legal counsel on their behalf at the start of the Board’s annual contract renewal process earlier in 2012. In approving the Advisory Agreements, the Board did not identify any particular information or consideration that was all-important or controlling, and each Trustee likely attributed different weights to various factors.
Nature, Extent and Quality of Services
The Board received and considered various information regarding the nature, extent and quality of services provided to the Fund by Funds Management and Wells Capital Management under the Advisory Agreements. The Board also received and considered, among other things, information about the background and experience of senior management of Funds Management, and the qualifications, backgrounds, tenures and responsibilities of the portfolio managers primarily responsible for the day-to-day portfolio management of the Fund.
The Board evaluated the ability of Funds Management and Wells Capital Management, based on their respective financial condition, resources, reputation and other attributes, to attract and retain qualified investment professionals, including research, advisory, and supervisory personnel. The Board further considered the compliance programs and compliance records of Funds Management and Wells Capital Management. In addition, the Board took into account the administrative services provided to the Fund by Funds Management and its affiliates.
The Board’s decision to approve the continuation of the Advisory Agreements was based on a comprehensive evaluation of information provided to it. In considering these matters, the Board considered not only the specific information presented in connection with the Meeting, but also the knowledge gained over time through interaction with Funds Management and Wells Capital Management about various topics, including Funds Management’s oversight of service providers. The above factors, together with those referenced below, are some of the most important, but not necessarily all, factors considered by the Board in concluding that the nature, extent and quality of the investment advisory services provided to the Fund by Funds Management and Wells Capital Management supported the re-approval of the Advisory Agreements. Although the Board considered the continuation of the Advisory Agreements for the Fund as part of the larger process of considering the continuation of the advisory agreements for all of the funds in the complex, its decision to continue the Advisory Agreements for the Fund was ultimately made on a fund-by-fund basis.
Fund Performance and Expenses
The Board considered the performance results for the Fund over various time periods ended December 31, 2011. The Board also considered these results in comparison to the median performance of a universe of relevant funds (the
| | | | | | |
| Other Information (Unaudited) | | Wells Fargo Advantage Money Market Fund | | | 31 | |
“Universe”) that was determined by Lipper Inc. (“Lipper”) to be similar to the Fund, and in comparison to the Fund’s benchmark index and to other comparative data. Lipper is an independent provider of investment company data. The Board received a description of the methodology used by Lipper to select the mutual funds in the Universe. The Board noted that the performance of the Fund was equal to or in range of the median performance of the Universe for all periods under review. The Board also noted that the performance of the Fund was in range of its benchmark, the Lipper Money Market Funds Index, for the periods under review.
The Board received and considered information regarding the Fund’s contractual advisory fee and net operating expense ratios and their various components, including actual management fees (which reflect fee waivers, if any), transfer agent, custodian and other non-management fees, Rule 12b-1 and non-Rule 12b-1 fees, service fees and fee waiver and expense reimbursement arrangements. The Board also considered these ratios in comparison to the median ratios of an expense Universe and a narrower expense group of mutual funds (each, an “Expense Group”) that was determined by Lipper to be similar to the Fund. The Board received a description of the methodology used by Lipper to select the mutual funds in the Fund’s Expense Group. The Board noted that the net operating expense ratios of the Fund were higher than the Fund’s Expense Group’s median net operating expense ratios.
Funds Management advised the Board that the Expense Group medians reflected voluntary waivers, whereas the Fund’s expense ratios did not reflect voluntary waivers. The Board noted that when the Fund’s expense ratios were adjusted to reflect voluntary waivers, the Fund’s net operating expense ratios were lower than the median net operating expense ratios of the Expense Group. The Board viewed favorably Funds Management’s proposal to lower the net operating expense cap of the Fund’s Daily Class by three basis points.
Based on the above-referenced considerations and other factors, the Board concluded that the overall performance and expense structure of the Fund supported the re-approval of the Advisory Agreements for the Fund.
Investment Advisory and Sub-Advisory Fee Rates
The Board reviewed and considered the contractual investment advisory fee rate that is payable by the Fund to Funds Management for investment advisory services (the “Advisory Agreement Rate”), both on a stand-alone basis and on a combined basis with the Fund’s administration fee rate. The Board took into account the separate administrative and other services covered by the administration fee rate. The Board also reviewed and considered the contractual investment sub-advisory fee rate that is payable by Funds Management to Wells Capital Management for investment sub-advisory services (the “Sub-Advisory Agreement Rate”). In addition, the Board reviewed and considered the existing fee waiver/cap arrangements applicable to the Advisory Agreement Rate and considered the Advisory Agreement Rate after taking the waivers/caps into account (the “Net Advisory Rate”).
The Board received and considered information comparing the Advisory Agreement Rate and Net Advisory Rate, combined with the administration fee rates, with those of other funds in the Fund’s Expense Group median. The Board noted that the Advisory Agreement Rate for the Fund was higher than the median rates for the Fund’s Expense Group. The Board also noted that the Net Advisory Rate for the Fund was higher than the median rates for the Fund’s Expense Group, except for the Service Class. The Board viewed favorably Funds Management’s willingness to voluntarily waive certain fees and its proposal to lower the net operating expense cap for the Daily Class.
The Board also received and considered information about the nature and extent of services offered and fee rates charged by Funds Management and Wells Capital Management to other types of clients. In this regard, the Board received information about differences between the services, and the compliance, reporting, and other legal burdens and risks of providing investment advice to mutual funds and those associated with providing advice to non-mutual fund clients such as collective funds or institutional separate accounts.
The Board determined that the Advisory Agreement Rate for the Fund, both with and without the administration fee rate and before and after waivers, was reasonable in light of the Fund’s Expense Group information, the net expense ratio commitments, the services covered by the Advisory Agreements and other information provided. The Board also reviewed and considered the Sub-Advisory Agreement Rate and concluded that the Sub-Advisory Agreement Rate was reasonable in light of the services covered by the sub-advisory agreement and other information provided.
| | | | |
| 32 | | Wells Fargo Advantage Money Market Fund | | Other Information (Unaudited) |
Profitability
The Board received and considered a profitability analysis of Funds Management, as well as an analysis of the profitability to the collective Wells Fargo businesses that provide services to the Fund. It considered that the information provided to it was necessarily estimated, and that the profitability information provided to it, especially on a fund-by-fund basis, did not necessarily provide a precise tool for evaluating the appropriateness of the Fund’s Advisory Agreement Rate in isolation. It noted that the levels of profitability reported on a fund-by-fund basis varied widely, depending on, among other things, the size and type of fund. The Board noted the impact of voluntary fee waivers on Funds Management’s profitability. The Board concluded that the profitability reported by Funds Management was not unreasonable.
The Board did not consider separate profitability information with respect to Wells Capital Management, because, as an affiliate of Funds Management, its profitability information was subsumed in the collective Wells Fargo profitability analysis provided by Funds Management.
Economies of Scale
With respect to possible economies of scale, the Board reviewed the breakpoints in the Fund’s advisory fee and/or administration fee structure, which operate generally to reduce the expenses of the Fund (as a percentage of Fund assets) as the Fund grows in size. It considered that, as a fund shrinks in size, breakpoints conversely result in increasing fee levels. The Board noted that it would have on-going opportunities to review the appropriate levels of breakpoints in the future, and concluded that the breakpoints as implemented appeared to be a reasonable step toward sharing economies of scale, if any, with the Fund. However, the Board acknowledged the inherent limitations of any analysis of economies of scale and of any attempt to correlate breakpoints with such economies, stemming largely from the Board’s understanding that economies of scale are realized, if at all, across a variety of products and services, not just with respect to a single fund.
Other Benefits to Funds Management and Wells Capital Management
The Board received and considered information regarding potential “fall-out” or ancillary benefits received by Funds Management and its affiliates, including Wells Capital Management, as a result of their relationship with the Fund. Ancillary benefits could include, among others, benefits directly attributable to the relationship of Funds Management and Wells Capital Management with the Fund and benefits potentially derived from an increase in Funds Management’s and Wells Capital Management’s business as a result of their relationship with the Fund (such as the ability to market to shareholders other financial products offered by Funds Management and its affiliates, including Wells Capital Management).
The Board considered that Wells Fargo Funds Distributor, LLC, an affiliate of Funds Management, serves as distributor to the Fund and receives certain compensation for those services. The Board noted that various financial institutions, including affiliates of Funds Management, may receive distribution-related fees, shareholder servicing payments (including amounts derived from payments under Rule 12b-1 plans) and sub-transfer agency fees in respect of shares sold or held through them and services provided.
The Board also reviewed information about whether and to what extent soft dollar credits are sought and how any such credits are utilized and any benefits that may be realized by using an affiliated broker.
Other Factors and Broader Review
The Board also considered the markets for distribution of the Fund’s shares, including the channels through which the Fund’s shares are offered and sold. The Board noted that the Fund is part of one of the few fund families that have both direct-to-fund and intermediary distribution channels. As discussed above, the Board reviews detailed materials received from Funds Management and Wells Capital Management annually as part of the re-approval process under Section 15 of the 1940 Act and also reviews and assesses information about the quality of the services that the Fund receives throughout the year. In this regard, the Board has reviewed reports of Funds Management at each of its quarterly meetings, which include, among other things, portfolio reviews and performance reports. In addition, the Board confers with portfolio managers at various times throughout the year.
Conclusion
After considering the above-described factors and based on its deliberations and its evaluation of the information described above, the Board unanimously approved the continuation of the Advisory Agreements for an additional one-year period.
| | | | | | |
| List of Abbreviations | | Wells Fargo Advantage Money Market Fund | | | 33 | |
The following is a list of common abbreviations for terms and entities which may have appeared in this report.
| ACB | — Agricultural Credit Bank |
| ADR | — American Depository Receipt |
| ADS | — American Depository Shares |
| AGC-ICC | — Assured Guaranty Corporation - Insured Custody Certificates |
| AGM | — Assured Guaranty Municipal |
| AMBAC | — American Municipal Bond Assurance Corporation |
| AMT | — Alternative Minimum Tax |
| BAN | — Bond Anticipation Notes |
| BHAC | — Berkshire Hathaway Assurance Corporation |
| CAB | — Capital Appreciation Bond |
| CCAB | — Convertible Capital Appreciation Bond |
| CDA | — Community Development Authority |
| CDO | — Collateralized Debt Obligation |
| COP | — Certificate of Participation |
| DRIVER | — Derivative Inverse Tax-Exempt Receipts |
| DW&P | — Department of Water & Power |
| DWR | — Department of Water Resources |
| ECFA | — Educational & Cultural Facilities Authority |
| EDA | — Economic Development Authority |
| EDFA | — Economic Development Finance Authority |
| ETF | — Exchange-Traded Fund |
| FFCB | — Federal Farm Credit Bank |
| FGIC | — Financial Guaranty Insurance Corporation |
| FGLMC | — Federal Government Loan Mortgage Company |
| FHA | — Federal Housing Authority |
| FHLB | — Federal Home Loan Bank |
| FHLMC | — Federal Home Loan Mortgage Corporation |
| FICO | — The Financing Corporation |
| FNMA | — Federal National Mortgage Association |
| GDR | — Global Depository Receipt |
| GNMA | — Government National Mortgage Association |
| HCFR | — Healthcare Facilities Revenue |
| HEFA | — Health & Educational Facilities Authority |
| HEFAR | — Higher Education Facilities Authority Revenue |
| HFA | — Housing Finance Authority |
| HFFA | — Health Facilities Financing Authority |
| IBC | — Insured Bond Certificate |
| IDA | — Industrial Development Authority |
| IDAG | — Industrial Development Agency |
| IDR | — Industrial Development Revenue |
| KRW | — Republic of Korea Won |
| LIBOR | — London Interbank Offered Rate |
| LLC | — Limited Liability Company |
| LLP | — Limited Liability Partnership |
| MBIA | — Municipal Bond Insurance Association |
| MFHR | — Multi-Family Housing Revenue |
| MSTR | — Municipal Securities Trust Receipts |
| MUD | — Municipal Utility District |
| NATL-RE | — National Public Finance Guarantee Corporation |
| PCFA | — Pollution Control Finance Authority |
| PCR | — Pollution Control Revenue |
| PFA | — Public Finance Authority |
| PFFA | — Public Facilities Financing Authority |
| PFOTER | — Puttable Floating Option Tax-Exempt Receipts |
| plc | — Public Limited Company |
| PUTTER | — Puttable Tax-Exempt Receipts |
| R&D | — Research & Development |
| RDA | — Redevelopment Authority |
| RDFA | — Redevelopment Finance Authority |
| REIT | — Real Estate Investment Trust |
| ROC | — Reset Option Certificates |
| SAVRS | — Select Auction Variable Rate Securities |
| SBA | — Small Business Authority |
| SFHR | — Single Family Housing Revenue |
| SFMR | — Single Family Mortgage Revenue |
| SPA | — Standby Purchase Agreement |
| SPDR | — Standard & Poor’s Depositary Receipts |
| STRIPS | — Separate Trading of Registered Interest and Principal Securities |
| TAN | — Tax Anticipation Notes |
| TIPS | — Treasury Inflation-Protected Securities |
| TRAN | — Tax Revenue Anticipation Notes |
| TCR | — Transferable Custody Receipts |
| TTFA | — Transportation Trust Fund Authority |
| TVA | — Tennessee Valley Authority |
| XLCA | — XL Capital Assurance |
This page is intentionally left blank.


FOR MORE INFORMATION
More information about Wells Fargo Advantage Funds is available free upon request. To obtain literature, please write, e-mail, visit the Fund’s Web site, or call:
Wells Fargo Advantage Funds
P.O. Box 8266
Boston, MA 02266-8266
E-mail: wfaf@wellsfargo.com
Web site: wellsfargoadvantagefunds.com
Individual investors: 1-800-222-8222
Retail investment professionals: 1-888-877-9275
Institutional investment professionals: 1-866-765-0778
This report and the financial statements contained herein are submitted for the general information of the shareholders of Wells Fargo Advantage Funds. If this report is used for promotional purposes, distribution of the report must be accompanied or preceded by a current prospectus. For a current prospectus and, if available, a summary prospectus containing more complete information, including charges and expenses, call 1-800-222-8222 or visit the Fund’s Web site at wellsfargoadvantagefunds.com. Please consider the investment objectives, risks, charges, and expenses of the investment carefully before investing. This and other information about Wells Fargo Advantage Funds can be found in the current prospectus. Read the prospectus carefully before you invest or send money.
Wells Fargo Funds Management, LLC, a wholly owned subsidiary of Wells Fargo & Company, provides investment advisory and administrative services for Wells Fargo Advantage Funds. Other affiliates of Wells Fargo & Company provide subadvisory and other services for the Funds. The Funds are distributed by Wells Fargo Funds Distributor, LLC, Member FINRA/SIPC, an affiliate of Wells Fargo & Company.
NOT FDIC INSURED ¡ NO BANK GUARANTEE ¡ MAY LOSE VALUE
© 2012 Wells Fargo Funds Management, LLC. All rights reserved.
| | |
 | | 211390 09-12 SA306/SAR306 07-12 |

Wells Fargo Advantage
Municipal Cash Management Money Market Fund

Semi-Annual Report
July 31, 2012

Reduce clutter. Save trees.
Sign up for electronic delivery of prospectuses and shareholder reports at wellsfargo.com/advantagedelivery
Contents
The views expressed and any forward-looking statements are as of July 31, 2012, unless otherwise noted, and are those of the Fund managers and/or Wells Fargo Funds Management, LLC. Discussions of individual securities, or the markets generally, or any Wells Fargo Advantage Fund are not intended as individual recommendations. Future events or results may vary significantly from those expressed in any forward-looking statements; the views expressed are subject to change at any time in response to changing circumstances in the market. Wells Fargo Funds Management, LLC, disclaims any obligation to publicly update or revise any views expressed or forward-looking statements.
NOT FDIC INSURED ¡ NO BANK GUARANTEE ¡ MAY LOSE VALUE

WELLS FARGO INVESTMENT HISTORY
| | |
| |
| 1932 | | Keystone creates one of the first mutual fund families. |
| |
| 1971 | | Wells Fargo & Company introduces one of the first institutional index funds. |
| |
| 1978 | | Wells Fargo applies Markowitz and Sharpe’s research on Modern Portfolio Theory to introduce one of the industry’s first Tactical Asset Allocation (TAA) models in institutional separately managed accounts. |
| |
| 1984 | | Wells Fargo Stagecoach Funds launches its first asset allocation fund. |
| |
| 1989 | | The Tactical Asset Allocation (TAA) Model is first applied to Wells Fargo’s asset allocation mutual funds. |
| |
| 1994 | | Wells Fargo introduces the LifePath Funds, one of the first suites of target date funds (now the Wells Fargo Advantage Dow Jones Target Date FundsSM). |
| |
| 1996 | | Evergreen Investments and Keystone Funds merge. |
| |
| 1997 | | Wells Fargo launches Wells Fargo Advantage WealthBuilder PortfoliosSM, a fund-of-funds suite of products that includes the use of quantitative models to shift assets among investment styles. |
| |
| 1999 | | Norwest Advantage Funds and Stagecoach Funds are reorganized into Wells Fargo Funds after the merger of Norwest and Wells Fargo. |
| |
| 2002 | | Evergreen Retail and Evergreen Institutional companies form the umbrella asset management company, Evergreen Investments. |
| |
| 2005 | | The integration of Strong Funds with Wells Fargo Funds creates Wells Fargo Advantage Funds, resulting in one of the top 20 mutual fund companies in the United States. |
| |
| 2006 | | Wells Fargo Advantage Funds relaunches the target date product line as Wells Fargo Advantage Dow Jones Target Date Funds. |
| |
| 2010 | | The mergers and reorganizations of Evergreen and Wells Fargo Advantage mutual funds are completed, unifying the families under the brand of Wells Fargo Advantage Funds. |
Wells Fargo Advantage Funds®
Wells Fargo Advantage Funds skillfully guides institutions, financial advisors, and individuals through the investment terrain to help them reach their financial objectives. Everything we do on behalf of investors is backed by our unique combination of qualifications.
Strength
Our organization is built on the standards of integrity and service established by our parent company—Wells Fargo & Company—more than 150 years ago. And, because we’re part of a highly diversified financial enterprise, we offer the depth of resources to help investors succeed.
Expertise
Our multi-boutique model offers investors access to the independent thinking of premier investment managers that have been chosen for their time-tested strategies. While each team specializes in a specific investment strategy, collectively they provide investors a wide choice of distinct investment styles. Our dedication to investment excellence doesn’t end with our expertise in manager selection—risk management, analysis, and rigorous ongoing review seek to ensure each manager’s investment process remains consistent.
Partnership
Our collaborative approach is built around understanding the needs and goals of our clients. By adhering to core principles of sound judgment and steady guidance, we support you through every stage of the investment decision process.
Carefully consider a fund’s investment objectives, risks, charges, and expenses before investing. For a current prospectus and, if available, a summary prospectus, containing this and other information, visit wellsfargoadvantagefunds.com. Read it carefully before investing.
Wells Fargo Funds Management, LLC, a wholly owned subsidiary of Wells Fargo & Company, provides investment advisory and administrative services for Wells Fargo Advantage Funds®. Other affiliates of Wells Fargo & Company provide subadvisory and other services for the Funds. The Funds are distributed by Wells Fargo Funds Distributor, LLC, Member FINRA/SIPC, an affiliate of Wells Fargo & Company.
“Dow Jones®” and “Dow Jones Target Date IndexesSM” are service marks of Dow Jones Trademark Holdings, LLC (“Dow Jones”), have been licensed to CME Group Index Services LLC (“CME Indexes”) and have been sublicensed for use for certain purposes by Global Index Advisors, Inc, and Wells Fargo Funds Management, LLC. The Wells Fargo Advantage Dow Jones Target Date FundsSM based on the Dow Jones Target Date IndexesSM, are not sponsored, endorsed, sold or promoted by Dow Jones, CME Indexes or their respective affiliates and none of them makes any representation regarding the advisability of investing in such product(s).
NOT FDIC INSURED ¡ NO BANK GUARANTEE ¡ MAY LOSE VALUE
Not part of semi-annual report.
Wells Fargo Advantage Funds offers more than 110 mutual funds across a wide range of asset classes, representing over $209 billion in assets under management, as of July 31, 2012.
| | | | |
| Equity Funds | | | | |
Asia Pacific Fund | | Enterprise Fund† | | Opportunity Fund† |
C&B Large Cap Value Fund | | Equity Value Fund | | Precious Metals Fund |
C&B Mid Cap Value Fund | | Global Opportunities Fund | | Premier Large Company Growth Fund |
Capital Growth Fund | | Growth Fund | | Small Cap Opportunities Fund |
Common Stock Fund | | Index Fund | | Small Cap Value Fund |
Disciplined U.S. Core Fund | | International Equity Fund | | Small Company Growth Fund |
Discovery Fund† | | International Value Fund | | Small Company Value Fund |
Diversified Equity Fund | | Intrinsic Small Cap Value Fund | | Small/Mid Cap Core Fund |
Diversified International Fund | | Intrinsic Value Fund | | Small/Mid Cap Value Fund |
Diversified Small Cap Fund | | Intrinsic World Equity Fund | | Special Mid Cap Value Fund |
Emerging Growth Fund | | Large Cap Core Fund | | Special Small Cap Value Fund |
Emerging Markets Equity Fund | | Large Cap Growth Fund | | Specialized Technology Fund |
Emerging Markets Equity Income Fund | | Large Company Value Fund | | Traditional Small Cap Growth Fund |
Endeavor Select Fund† | | Omega Growth Fund | | Utility and Telecommunications Fund |
| Bond Funds | | | | |
Adjustable Rate Government Fund | | Inflation-Protected Bond Fund | | Short-Term Bond Fund |
California Limited-Term Tax-Free Fund | | Intermediate Tax/AMT-Free Fund | | Short-Term High Yield Bond Fund |
California Tax-Free Fund | | International Bond Fund | | Short-Term Municipal Bond Fund |
Colorado Tax-Free Fund | | Minnesota Tax-Free Fund | | Strategic Municipal Bond Fund |
Emerging Markets Local Bond Fund | | Municipal Bond Fund | | Total Return Bond Fund |
Government Securities Fund | | North Carolina Tax-Free Fund | | Ultra Short-Term Income Fund |
High Income Fund | | Pennsylvania Tax-Free Fund | | Ultra Short-Term Municipal Income Fund |
High Yield Bond Fund | | Short Duration Government Bond Fund | | Wisconsin Tax-Free Fund |
Income Plus Fund | | | | |
| Asset Allocation Funds | | | | |
Absolute Return Fund | | WealthBuilder Equity Portfolio† | | Target 2020 Fund† |
Asset Allocation Fund | | WealthBuilder Growth Allocation Portfolio† | | Target 2025 Fund† |
Conservative Allocation Fund | | WealthBuilder Growth Balanced Portfolio† | | Target 2030 Fund† |
Diversified Capital Builder Fund | | WealthBuilder Moderate Balanced Portfolio† | | Target 2035 Fund† |
Diversified Income Builder Fund | | WealthBuilder Tactical Equity Portfolio† | | Target 2040 Fund† |
Growth Balanced Fund | | Target Today Fund† | | Target 2045 Fund† |
Index Asset Allocation Fund | | Target 2010 Fund† | | Target 2050 Fund† |
Moderate Balanced Fund | | Target 2015 Fund† | | Target 2055 Fund† |
WealthBuilder Conservative Allocation Portfolio† | | | | |
| Money Market Funds | | | | |
100% Treasury Money Market Fund | | Heritage Money Market Fund† | | National Tax-Free Money Market Fund |
California Municipal Money Market Fund | | Money Market Fund | | Prime Investment Money Market Fund |
Cash Investment Money Market Fund | | Municipal Cash Management Money Market Fund | | Treasury Plus Money Market Fund |
Government Money Market Fund | | Municipal Money Market Fund | | |
| Variable Trust Funds1 | | | | |
VT Discovery Fund† | | VT Intrinsic Value Fund | | VT Small Cap Growth Fund |
VT Index Asset Allocation Fund | | VT Omega Growth Fund | | VT Small Cap Value Fund |
VT International Equity Fund | | VT Opportunity Fund† | | VT Total Return Bond Fund |
An investment in a money market fund is not insured or guaranteed by the Federal Deposit Insurance Corporation or any other government agency. Although the Wells Fargo Advantage Money Market Funds seek to preserve the value of your investment at $1.00 per share, it is possible to lose money by investing in a money market fund.
| 1. | The Variable Trust Funds are generally available only through insurance company variable contracts. |
| † | In this report, the Wells Fargo Advantage Discovery FundSM, Wells Fargo Advantage Endeavor Select FundSM, Wells Fargo Advantage Enterprise FundSM, Wells Fargo Advantage Opportunity FundSM, Wells Fargo Advantage WealthBuilder Conservative Allocation PortfolioSM, Wells Fargo Advantage WealthBuilder Equity PortfolioSM, Wells Fargo Advantage WealthBuilder Growth Allocation PortfolioSM, Wells Fargo Advantage WealthBuilder Growth Balanced PortfolioSM, Wells Fargo Advantage WealthBuilder Moderate Balanced PortfolioSM, Wells Fargo Advantage WealthBuilder Tactical Equity PortfolioSM, Wells Fargo Advantage Dow Jones Target Today FundSM, Wells Fargo Advantage Dow Jones Target 2010 FundSM, Wells Fargo Advantage Dow Jones Target 2015 FundSM, Wells Fargo Advantage Dow Jones Target 2020 FundSM, Wells Fargo Advantage Dow Jones Target 2025 FundSM, Wells Fargo Advantage Dow Jones Target 2030 FundSM, Wells Fargo Advantage Dow Jones Target 2035 FundSM, Wells Fargo Advantage Dow Jones Target 2040 FundSM, Wells Fargo Advantage Dow Jones Target 2045 FundSM, Wells Fargo Advantage Dow Jones Target 2050 FundSM, Wells Fargo Advantage Dow Jones Target 2055 FundSM, Wells Fargo Advantage Heritage Money Market FundSM, Wells Fargo Advantage VT Discovery FundSM, and Wells Fargo Advantage VT Opportunity FundSM are referred to as the Discovery Fund, Endeavor Select Fund, Enterprise Fund, Opportunity Fund, WealthBuilder Conservative Allocation Portfolio, WealthBuilder Equity Portfolio, WealthBuilder Growth Allocation Portfolio, WealthBuilder Growth Balanced Portfolio, WealthBuilder Moderate Balanced Portfolio, WealthBuilder Tactical Equity Portfolio, Target Today Fund, Target 2010 Fund, Target 2015 Fund, Target 2020 Fund, Target 2025 Fund, Target 2030 Fund, Target 2035 Fund, Target 2040 Fund, Target 2045 Fund, Target 2050 Fund, Target 2055 Fund, Heritage Money Market Fund, VT Discovery Fund, and VT Opportunity Fund, respectively. |
Not part of semi-annual report.
| | | | |
| 2 | | Wells Fargo Advantage Municipal Cash Management Money Market Fund | | Letter to Shareholders (Unaudited) |

Karla M. Rabusch,
President
Wells Fargo Advantage Funds
Not only has the Fed been successful in engineering low interest rates, but investors have rushed to buy U.S. Treasury securities as a safe-haven asset in the midst of uncertainty surrounding the European debt crisis. As a result, interest rates reached record lows.
Dear Valued Shareholder:
We’re pleased to offer you this semi-annual report for the Wells Fargo Advantage Municipal Cash Management Money Market Fund for the six-month period that ended July 31, 2012.
The economy grew, but the recovery has been modest.
The U.S. is three years into a modest economic recovery, with second-quarter real gross domestic product (GDP) increasing 1.5% on an annualized basis. Several factors, however, held back growth despite the Federal Reserve’s (Fed) accommodative monetary policy. In Europe, much uncertainty remained about the outcome of the eurozone debt crisis and whether policymakers will be able to resolve it without any countries defaulting or leaving the euro. In addition, Europe has again entered a recession. In Asia, China’s economy slowed. Here at home, a potential “fiscal cliff”—automatic tax increases alongside automatic budget cuts stemming from a legislative compromise in Congress—added uncertainty and, if unaddressed, could negatively affect GDP beginning in 2013.
In an effort to further bolster the economy, especially the labor market, the Fed has indicated its commitment to maintaining a highly accommodative monetary policy. It had indicated its belief that economic conditions warrant an extremely low federal funds target rate—a short-term bank lending rate—near 0%, at least through late 2014. The Fed also continued its “Operation Twist,” which involves buying U.S. Treasury securities with maturities of greater than six years and selling U.S. Treasury securities with maturities of less than three years, in an effort to keep longer-term interest rates low.
A demand for relative safe-haven securities led to ultra-low interest rates.
Not only has the Fed been successful in engineering low interest rates, but investors have rushed to buy U.S. Treasury securities as a relative safe-haven asset in the midst of uncertainty surrounding the European debt crisis. As a result, interest rates reached record lows. Ten-year U.S. Treasury yields ranged between 2.38% and 1.38% over the past six months. Three-month U.S. Treasury bills had an average yield of 10 basis points (bps; 100 bps is 1.00%) over the past six months. Rates on seven-day commercial paper, a common investment type for prime money market funds, were 12 bps on July 31, 2012.
Lack of supply kept a lid on yields, and regulatory uncertainty remained.
Continued demand for a limited supply of money market-eligible securities also contributed to low yields. We estimate that the amount outstanding of short-term, money market fund-eligible securities (excluding U.S. Treasury securities) has declined by $3 trillion, or more than a 30% decrease, since 2008. Reasons for this decrease in supply include issuers opting to lock in rates on long-term rather than short-term debt, less need for financing as many companies have plentiful cash given record profits, and credit downgrades that have resulted in fewer firms with top credit ratings.
The Chairman of the Securities and Exchange Commission (SEC) indicated in late August that the SEC has determined at this time not to propose certain amendments to the rules governing money market funds. However, the Financial Stability Oversight Council or other financial regulators could still take steps to impose additional regulations on money market funds.
| | | | | | |
| Letter to Shareholders (Unaudited) | | Wells Fargo Advantage Municipal Cash Management Money Market Fund | | | 3 | |
As we gain clarity in the coming months regarding any potential changes to regulation of money market funds, we will provide further communications to our clients about these changes.
Amid the current challenges of investing—low yields, an unresolved eurozone crisis, limited supply, and regulatory uncertainty—has been the opportunity to provide our clients an important investment option for meeting their short-term cash needs. Our focus on preservation of capital and liquidity is not a marketing phrase but rather the basis of our investment philosophy as we manage money market funds in an uncertain world. We are proud of our comprehensive lineup of prime, government, and tax-exempt money market funds.
Thank you for choosing to invest with Wells Fargo Advantage Funds. We appreciate your confidence in us and remain committed to helping you meet your financial needs. For current information about your fund investments, contact your investment professional, visit our Web site at wellsfargoadvantagefunds.com, or call us directly at 1-800-222-8222. We are available 24 hours a day, 7 days a week.
Sincerely,

Karla M. Rabusch
President
Wells Fargo Advantage Funds
Amid the current challenges of investing—low yields, an unresolved eurozone crisis, limited supply, and regulatory uncertainty—has been the opportunity to provide our clients an important investment option for meeting their short-term cash needs.
| | | | |
| 4 | | Wells Fargo Advantage Municipal Cash Management Money Market Fund | | Performance Highlights (Unaudited) |
INVESTMENT OBJECTIVE
The Fund seeks current income exempt from regular federal income tax, while preserving capital and liquidity.
ADVISER
Wells Fargo Funds Management, LLC
SUB-ADVISER
Wells Capital Management Incorporated
PORTFOLIO MANAGERS
David D. Sylvester
James Randazzo
FUND INCEPTION
November 20, 1996
| | |
SECTOR DISTRIBUTION1 (AS OF JULY 31, 2012) |
|
 |
| | |
EFFECTIVE MATURITY DISTRIBUTION2 (AS OF JULY 31, 2012) |
|
 |
| 1. | Sector distribution is subject to change and is calculated based on the total investments of the Fund. |
| 2. | Effective maturity distribution is subject to change and is calculated based on the total investments of the Fund. |
| | | | | | |
| Performance Highlights (Unaudited) | | Wells Fargo Advantage Municipal Cash Management Money Market Fund | | | 5 | |
| | |
WEIGHTED AVERAGE MATURITY3 (AS OF JULY 31, 2012) |
15 Days | | |
| | |
WEIGHTED AVERAGE FINAL MATURITY4 (AS OF JULY 31, 2012) |
15 Days | | |
| 3. | Weighted Average Maturity (WAM): WAM is an average of the effective maturities of all securities held in the portfolio, weighted by each security’s percentage of total investments. The maturity of a portfolio security is the period remaining until the date on which the principal amount is unconditionally required to be paid, or in the case of a security called for redemption, the date on which the redemption payment is unconditionally required to be made. WAM calculations allow for the maturities of certain securities with demand features or periodic interest rate resets to be shortened. WAM is a way to measure a fund’s sensitivity to potential interest rate changes. |
| 4. | Weighted Average Final Maturity (WAFM): WAFM is an average of the final maturities of all securities held in the portfolio, weighted by their percentage of total investments. The maturity of a portfolio security is the period remaining until the date on which the principal amount is unconditionally required to be paid, or in the case of a security called for redemption, the date on which the redemption payment is unconditionally required to be made. In contrast to WAM, the calculation of WAFM allows for the maturities of certain securities with demand features to be shortened, but not the periodic interest rate resets. WAFM is a way to measure a fund’s potential sensitivity to credit spread changes. |
| | | | |
| 6 | | Wells Fargo Advantage Municipal Cash Management Money Market Fund | | Performance Highlights (Unaudited) |
AVERAGE ANNUAL TOTAL RETURN5 (%) (AS OF JULY 31, 2012)
| | | | | | | | | | | | | | | | | | | | | | | | | | | | |
| | | | | | | | | | | | | | | | | | Expense Ratios6 | |
| | | Inception Date | | | 6 Months* | | | 1 Year | | | 5 Year | | | 10 Year | | | Gross | | | Net7 | |
Administrator Class (WUCXX) | | | 07/09/2010 | | | | 0.01 | | | | 0.01 | | | | 0.93 | | | | 1.53 | | | | 0.36% | | | | 0.30% | |
Institutional Class (EMMXX) | | | 11/20/1996 | | | | 0.02 | | | | 0.04 | | | | 0.95 | | | | 1.54 | | | | 0.24% | | | | 0.20% | |
Service Class (EISXX) | | | 11/25/1996 | | | | 0.00 | | | | 0.01 | | | | 0.79 | | | | 1.34 | | | | 0.53% | | | | 0.45% | |
| * | Returns for periods of less than one year are not annualized. |
| | | | | | | | | | | | |
FUND YIELD SUMMARY7 (AS OF JULY 31, 2012) | | Administrator
Class | | | Institutional
Class | | | Service Class | |
7-Day Current Yield | | | 0.01% | | | | 0.03% | | | | 0.01% | |
7-Day Compound Yield | | | 0.01% | | | | 0.03% | | | | 0.01% | |
30-Day Simple Yield | | | 0.01% | | | | 0.02% | | | | 0.01% | |
30-Day Compound Yield | | | 0.01% | | | | 0.02% | | | | 0.01% | |
Figures quoted represent past performance, which is no guarantee of future results and do not reflect the deduction of taxes that a shareholder may pay on fund distributions or the redemption of fund shares. Investment returns will fluctuate. The Fund’s yield figures more closely reflect the current earnings of the Fund than the total return figures. Current performance may be lower or higher than the performance data quoted and assumes the reinvestment of dividends and capital gains. Current month-end performance is available at the Fund’s Web site – wellsfargoadvantagefunds.com.
Each class is sold without a front-end sales charge or contingent deferred sales charge. Other fees and expenses apply to an investment in the Fund and are described in the Fund’s current prospectuses.
An investment in a money market fund is not insured or guaranteed by the Federal Deposit Insurance Corporation or any other government agency. Although the Fund seeks to preserve the value of your investment at $1.00 per share, it is possible to lose money by investing in a money market fund. A portion of the Fund’s income may be subject to federal, state and/or local income taxes or the alternative minimum tax (AMT).
| 5. | Historical performance shown for the Administrator Class shares prior to their inception reflects the performance of the Institutional Class shares, and has not been adjusted to include the higher expenses applicable to the Administrator Class shares. If these expenses had been adjusted, returns would be lower. Historical performance shown for all classes of the Fund prior to July 12, 2010 is based on the performance of the Fund’s predecessor, Evergreen Institutional Municipal Money Market Fund. |
| 6. | Reflects the expense ratios as stated in the most recent prospectuses. |
| 7. | The Adviser has committed through July 11, 2013 to waive fees and/or reimburse expenses to the extent necessary to cap the Fund’s Total Annual Fund Operating Expenses After Fee Waiver, excluding certain expenses, at the amounts shown above. Brokerage commissions, stamp duty fees, interest, taxes, acquired fund fees and expenses and extraordinary expenses are excluded from the cap. Without this cap, the Fund’s returns would have been lower. Without waived fees and/or reimbursed expenses, the Fund’s 7-day current yield would have been (0.13)%, (0.01)% and (0.30)% for Administrator Class, Institutional Class and Service Class, respectively. |
| | | | | | |
| Fund Expenses (Unaudited) | | Wells Fargo Advantage Municipal Cash Management Money Market Fund | | | 7 | |
As a shareholder of the Fund, you incur ongoing costs, including management fees, shareholder service fees, and other Fund expenses. This example is intended to help you understand your ongoing costs (in dollars) of investing in the Fund and to compare these costs with the ongoing costs of investing in other mutual funds.
The example is based on an investment of $1,000 invested at the beginning of the six-month period and held for the entire period from February 1, 2012 to July 31, 2012.
Actual Expenses
The “Actual” line of the table below provides information about actual account values and actual expenses. You may use the information in this line, together with the amount you invested, to estimate the expenses that you paid over the period. Simply divide your account value by $1,000 (for example, an $8,600 account value divided by $1,000 = 8.6), then multiply the result by the number in the “Actual” line under the heading entitled “Expenses Paid During Period” for your applicable class of shares to estimate the expenses you paid on your account during this period.
Hypothetical Example for Comparison Purposes
The “Hypothetical” line of the table below provides information about hypothetical account values and hypothetical expenses based on the Fund’s actual expense ratio and an assumed rate of return of 5% per year before expenses, which is not the Fund’s actual return. The hypothetical account values and expenses may not be used to estimate the actual ending account balance or expenses you paid for the period. You may use this information to compare the ongoing costs of investing in the Fund and other funds. To do so, compare this 5% hypothetical example with the 5% hypothetical examples that appear in the shareholder reports of the other funds.
Please note that the expenses shown in the table are meant to highlight your ongoing costs only. Therefore, the “Hypothetical” line of the table is useful in comparing ongoing costs only, and will not help you determine the relative total costs of owning different funds.
| | | | | | | | | | | | | | | | |
| | | Beginning
Account Value
02-01-2012 | | | Ending
Account Value
07-31-2012 | | | Expenses
Paid During
the Period¹ | | | Net Annual
Expense Ratio | |
Administrator Class | | | | | | | | | | | | | | | | |
Actual | | $ | 1,000.00 | | | $ | 1,000.06 | | | $ | 1.14 | | | | 0.23 | % |
Hypothetical (5% return before expenses) | | $ | 1,000.00 | | | $ | 1,023.72 | | | $ | 1.16 | | | | 0.23 | % |
Institutional Class | | | | | | | | | | | | | | | | |
Actual | | $ | 1,000.00 | | | $ | 1,000.24 | | | $ | 0.99 | | | | 0.20 | % |
Hypothetical (5% return before expenses) | | $ | 1,000.00 | | | $ | 1,023.87 | | | $ | 1.01 | | | | 0.20 | % |
Service Class | | | | | | | | | | | | | | | | |
Actual | | $ | 1,000.00 | | | $ | 1,000.05 | | | $ | 1.19 | | | | 0.24 | % |
Hypothetical (5% return before expenses) | | $ | 1,000.00 | | | $ | 1,023.67 | | | $ | 1.21 | | | | 0.24 | % |
| 1. | Expenses paid is equal to the annualized expense ratio of each class multiplied by the average account value over the period, multiplied by the number of days in the most recent fiscal half-year divided by the number of days in the fiscal year (to reflect the one-half year period). |
| | | | |
| 8 | | Wells Fargo Advantage Municipal Cash Management Money Market Fund | | Portfolio of Investments—July 31, 2012 (Unaudited) |
| | | | | | | | | | | | | | | | |
| Security Name | | Interest Rate | | | Maturity Date | | | Principal | | | Value | |
| | | | | | | | | | | | | | | | |
| | | | |
Municipal Obligations: 100.10% | | | | | | | | | | | | | | | | |
| | | | |
Alabama: 0.50% | | | | | | | | | | | | | | | | |
| | | | |
| Variable Rate Demand Notes§: 0.50% | | | | | | | | | | | | | | | | |
Chatom AL Industrial Development Board Powersouth Energy | | | | | | | | | | | | | | | | |
Cooperative Project (Utilities Revenue, National Rural Utilities | | | | | | | | | | | | | | | | |
Cooperative Finance Corporation Insured) | | | 0.30 | % | | | 08/01/2041 | | | $ | 4,500,000 | | | $ | 4,500,000 | |
Tuscaloosa County AL IDA Series A (IDR) | | | 0.20 | | | | 09/01/2020 | | | | 6,700,000 | | | | 6,700,000 | |
| | | | |
| | | | | | | | | | | | | | | 11,200,000 | |
| | | | | | | | | | | | | | | | |
| | | | |
Arizona: 0.87% | | | | | | | | | | | | | | | | |
| | | | |
| Other Municipal Debt: 0.45% | | | | | | | | | | | | | | | | |
Phoenix AZ City Improvement Corporation Project
(Miscellaneous Revenue) | | | 0.17 | | | | 08/06/2012 | | | | 10,000,000 | | | | 10,000,000 | |
| | | | | | | | | | | | | | | | |
| | | | |
| Variable Rate Demand Notes§: 0.42% | | | | | | | | | | | | | | | | |
Maricopa County AZ Desert Eagles Estate Project Series 2003A-1 (Housing Revenue, FHLMC Insured & LIQ) | | | 0.39 | | | | 07/01/2036 | | | | 9,220,000 | | | | 9,220,000 | |
| | | | | | | | | | | | | | | | |
| | | | |
| | | | | | | | | | | | | | | 19,220,000 | |
| | | | | | | | | | | | | | | | |
| | | | |
Arkansas: 0.03% | | | | | | | | | | | | | | | | |
| | | | |
| Variable Rate Demand Notes§: 0.03% | | | | | | | | | | | | | | | | |
Arkansas Development Finance Authority Stratton Seed Company Project (IDR, Bank of America NA LOC) | | | 0.65 | | | | 03/01/2014 | | | | 600,000 | | | | 600,000 | |
| | | | | | | | | | | | | | | | |
| | | | |
California: 5.24% | | | | | | | | | | | | | | | | |
| | | | |
| Other Municipal Debt: 0.54% | | | | | | | | | | | | | | | | |
Los Angeles County CA School Pooled Financing Program TRAN B-1 (Miscellaneous Revenue, GO of Participants Insured) | | | 2.00 | | | | 11/30/2012 | | | | 2,000,000 | | | | 2,011,526 | |
San Diego County CA School District TRAN B-1 (Miscellaneous Revenue, GO of Participants Insured) | | | 2.00 | | | | 01/31/2013 | | | | 8,000,000 | | | | 8,069,695 | |
San Diego County CA School District TRAN B-2 (Miscellaneous Revenue, GO of Participants Insured) | | | 2.00 | | | | 04/30/2013 | | | | 2,000,000 | | | | 2,025,273 | |
| | | | |
| | | | | | | | | | | | | | | 12,106,494 | |
| | | | | | | | | | | | | | | | |
| | | | |
| Variable Rate Demand Notes§: 4.70% | | | | | | | | | | | | | | | | |
California CDA PUTTER Series 2680 (Miscellaneous Revenue, JPMorgan Chase Bank LOC) | | | 0.23 | | | | 05/15/2018 | | | | 6,750,000 | | | | 6,750,000 | |
California CDA PUTTER Series 2681 (Miscellaneous Revenue, JPMorgan Chase Bank LOC) | | | 0.31 | | | | 05/15/2018 | | | | 7,300,000 | | | | 7,300,000 | |
California Infrastructure & Economic Development Bank Pacific Gas & Electric Company Project Series A (Utilities Revenue, Mizuho Corporate Bank LOC) | | | 0.14 | | | | 11/01/2026 | | | | 5,900,000 | | | | 5,900,000 | |
California Series A-2 (GO, Bank of Montreal LOC) | | | 0.12 | | | | 05/01/2033 | | | | 19,200,000 | | | | 19,200,000 | |
California Statewide CDA Gas Supply Project Series 2010 (Utilities Revenue, Royal Bank of Canada SPA) | | | 0.14 | | | | 11/01/2040 | | | | 9,400,000 | | | | 9,400,000 | |
California Statewide CDA Olympus Park Apartments Series Y (Housing Revenue, FNMA Insured & LIQ) | | | 0.15 | | | | 10/15/2030 | | | | 2,200,000 | | | | 2,200,000 | |
FHLMC Series M001 Class A (Housing Revenue) | | | 0.21 | | | | 08/15/2045 | | | | 21,794,033 | | | | 21,794,033 | |
FHLMC Series M002 Class A (Housing Revenue) | | | 0.21 | | | | 01/15/2047 | | | | 4,326,394 | | | | 4,326,394 | |
FHLMC Series M008 Class A (Housing Revenue) | | | 0.21 | | | | 02/15/2035 | | | | 19,602,132 | | | | 19,602,133 | |
The accompanying notes are an integral part of these financial statements.
| | | | | | |
| Portfolio of Investments—July 31, 2012 (Unaudited) | | Wells Fargo Advantage Municipal Cash Management Money Market Fund | | | 9 | |
| | | | | | | | | | | | | | | | |
| Security Name | | Interest Rate | | | Maturity Date | | | Principal | | | Value | |
| | | | | | | | | | | | | | | | |
| | | | |
| Variable Rate Demand Notes§ (continued) | | | | | | | | | | | | | | | | |
San Jose CA MFHR Villa Monterey Apartments Series F (Housing Revenue, FNMA Insured) | | | 0.16 | % | | | 07/15/2035 | | | $ | 7,945,000 | | | $ | 7,945,000 | |
| | | | |
| | | | | | | | | | | | | | | 104,417,560 | |
| | | | | | | | | | | | | | | | |
| | | | |
| | | | | | | | | | | | | | | 116,524,054 | |
| | | | | | | | | | | | | | | | |
| | | | |
Colorado: 1.04% | | | | | | | | | | | | | | | | |
| | | | |
| Variable Rate Demand Notes§: 1.04% | | | | | | | | | | | | | | | | |
Arapahoe County CO Cottrell Printing Project (IDR, KeyBank NA LOC) | | | 0.30 | | | | 10/01/2019 | | | | 2,000,000 | | | | 2,000,000 | |
Colorado HFA Series B-3 (Housing Revenue, KBC Bank NV SPA) | | | 0.18 | | | | 05/01/2038 | | | | 20,000,000 | | | | 20,000,000 | |
Colorado Southern Ute Indian Tribe Reservation Casino (Miscellaneous Revenue) 144A | | | 0.16 | | | | 04/01/2040 | | | | 1,000,000 | | | | 1,000,000 | |
| | | | |
| | | | | | | | | | | | | | | 23,000,000 | |
| | | | | | | | | | | | | | | | |
| | | | |
Connecticut: 0.46% | | | | | | | | | | | | | | | | |
| | | | |
| Variable Rate Demand Notes§: 0.46% | | | | | | | | | | | | | | | | |
Connecticut HFA AMT Housing Mortgage Finance Series D-5 (Housing Revenue, GO of Authority Insured, Bank of Tokyo-Mitsubishi SPA) | | | 0.18 | | | | 11/15/2023 | | | | 3,900,000 | | | | 3,900,000 | |
Connecticut HFA AMT Housing Mortgage Finance Subseries D-3
(Housing Revenue) | | | 0.18 | | | | 05/15/2033 | | | | 6,335,000 | | | | 6,335,000 | |
| | | | |
| | | | | | | | | | | | | | | 10,235,000 | |
| | | | | | | | | | | | | | | | |
| | | | |
Delaware: 5.95% | | | | | | | | | | | | | | | | |
| | | | |
| Variable Rate Demand Notes§: 5.95% | | | | | | | | | | | | | | | | |
Clipper Tax-Exempt Certified Trust Series 2004-10 (Miscellaneous Revenue, State Street Bank & Trust Company LIQ) | | | 0.30 | | | | 12/01/2035 | | | | 2,252,000 | | | | 2,252,000 | |
Clipper Tax-Exempt Certified Trust Series 2005-30 (Miscellaneous Revenue, State Street Bank & Trust Company LIQ) | | | 0.30 | | | | 06/01/2038 | | | | 9,750,000 | | | | 9,750,000 | |
Clipper Tax-Exempt Certified Trust Series 2005-31 (Miscellaneous Revenue, State Street Bank & Trust Company LIQ) | | | 0.30 | | | | 01/01/2036 | | | | 8,250,000 | | | | 8,250,000 | |
Clipper Tax-Exempt Certified Trust Series 2006-02 (Miscellaneous Revenue, State Street Bank & Trust Company LIQ) | | | 0.30 | | | | 10/01/2036 | | | | 11,075,000 | | | | 11,075,000 | |
Clipper Tax-Exempt Certified Trust Series 2006-06 (Miscellaneous Revenue, State Street Bank & Trust Company LIQ) | | | 0.30 | | | | 07/01/2037 | | | | 7,146,000 | | | | 7,146,000 | |
Clipper Tax-Exempt Certified Trust Series 2006-10 (Miscellaneous Revenue, State Street Bank & Trust Company LIQ) | | | 0.30 | | | | 09/01/2013 | | | | 1,005,000 | | | | 1,005,000 | |
Clipper Tax-Exempt Certified Trust Series 2007-26 (Miscellaneous Revenue, State Street Bank & Trust Company LIQ) | | | 0.20 | | | | 05/01/2017 | | | | 77,207,000 | | | | 77,207,000 | |
Clipper Tax-Exempt Certified Trust Series 2007-40 (Miscellaneous Revenue, State Street Bank & Trust Company LIQ) | | | 0.30 | | | | 02/01/2013 | | | | 3,032,000 | | | | 3,032,000 | |
Delaware Housing Authority ROC RR-II-R-1165 (Housing Revenue) | | | 0.40 | | | | 01/01/2016 | | | | 7,540,000 | | | | 7,540,000 | |
University of Delaware Series 2005 (Education Revenue, TD Bank NA SPA) | | | 0.16 | | | | 11/01/2035 | | | | 5,000,000 | | | | 5,000,000 | |
| | | | |
| | | | | | | | | | | | | | | 132,257,000 | |
| | | | | | | | | | | | | | | | |
| | | | |
District of Columbia: 0.61% | | | | | | | | | | | | | | | | |
| | | | |
| Variable Rate Demand Notes§: 0.61% | | | | | | | | | | | | | | | | |
District of Columbia Community Connections Project Series A
(Health Revenue) | | | 0.15 | | | | 07/01/2032 | | | | 2,200,000 | | | | 2,200,000 | |
District of Columbia HFA PFOTER Carver Senior Apartments Project Series 4566 (Housing Revenue, FHLMC Insured & LIQ) | | | 0.39 | | | | 10/01/2049 | | | | 7,110,000 | | | | 7,110,000 | |
The accompanying notes are an integral part of these financial statements.
| | | | |
| 10 | | Wells Fargo Advantage Municipal Cash Management Money Market Fund | | Portfolio of Investments—July 31, 2012 (Unaudited) |
| | | | | | | | | | | | | | | | |
| Security Name | | Interest Rate | | | Maturity Date | | | Principal | | | Value | |
| | | | | | | | | | | | | | | | |
| | | | |
| Variable Rate Demand Notes§ (continued) | | | | | | | | | | | | | | | | |
District of Columbia HFA PFOTER Galen Terrace Project Series 4568 (Housing Revenue, FHLMC Insured & LIQ) | | | 0.39 | % | | | 02/01/2049 | | | $ | 4,280,000 | | | $ | 4,280,000 | |
| | | | |
| | | | | | | | | | | | | | | 13,590,000 | |
| | | | | | | | | | | | | | | | |
| | | | |
Florida: 6.91% | | | | | | | | | | | | | | | | |
| | | | |
| Other Municipal Debt: 1.09% | | | | | | | | | | | | | | | | |
Hillsborough County FL Capital Improvement Notes Series A (Miscellaneous Revenue) | | | 0.18 | | | | 08/30/2012 | | | | 4,800,000 | | | | 4,800,000 | |
JEA Florida Series F-1 (Utilities Revenue) | | | 0.17 | | | | 08/16/2012 | | | | 6,750,000 | | | | 6,750,000 | |
JEA Florida Series F-2 (Utilities Revenue) | | | 0.18 | | | | 08/14/2012 | | | | 12,700,000 | | | | 12,700,000 | |
| | | | |
| | | | | | | | | | | | | | | 24,250,000 | |
| | | | | | | | | | | | | | | | |
| | | | |
| Variable Rate Demand Notes§: 5.82% | | | | | | | | | | | | | | | | |
Alachua County FL HFA MFHR University Cove Apartments Project (Housing Revenue, FNMA Insured & LIQ) | | | 0.19 | | | | 06/15/2034 | | | | 5,545,000 | | | | 5,545,000 | |
Brevard County FL HFA Shore View Apartments Project Series 1995 (Housing Revenue, Harris Trust & Savings Bank LOC) | | | 0.17 | | | | 02/01/2015 | | | | 800,000 | | | | 800,000 | |
Duval County FL HFA Mortgage Camri Green Apartments (Housing Revenue, FNMA Insured & LIQ) | | | 0.18 | | | | 11/15/2036 | | | | 6,800,000 | | | | 6,800,000 | |
Florida HFA Vizcaya Villas Project Series 1996-M (Housing Revenue, Royal Bank of Canada LIQ) 144A | | | 0.18 | | | | 07/25/2015 | | | | 5,525,000 | | | | 5,525,000 | |
Florida Housing Finance Corporation Brook Haven Apartments Multi-Family Mortgage Project Series 2006-H (Miscellaneous Revenue, FNMA Insured & LIQ) | | | 0.17 | | | | 04/15/2039 | | | | 6,295,000 | | | | 6,295,000 | |
Greater Orlando FL Aviation Authority Flight Safety Project Series A (Airport Revenue) | | | 0.17 | | | | 10/01/2023 | | | | 5,800,000 | | | | 5,800,000 | |
Liberty County FL IDA Georgia Pacific Corporation Project (IDR, Bank of Nova Scotia LOC) | | | 0.18 | | | | 10/01/2028 | | | | 5,000,000 | | | | 5,000,000 | |
Marion County FL HFA Paddock Apartments Project (Housing Revenue, FNMA Insured & LIQ) | | | 0.16 | | | | 10/15/2032 | | | | 4,000,000 | | | | 4,000,000 | |
Miami-Dade County FL Eclipse Funding Trust Series 2006-049 (Tax Revenue, U.S. Bank NA LOC) | | | 0.14 | | | | 07/01/2013 | | | | 2,700,000 | | | | 2,700,000 | |
Miami-Dade County FL IDA Reflectone Incorporated Project Series 2000-A (IDR, Royal Bank of Canada LOC) | | | 0.22 | | | | 03/01/2024 | | | | 10,600,000 | | | | 10,600,000 | |
Miami-Dade County FL International Airport Aviation Series 2008-1139X (Airport Revenue, Assured Guaranty Insured, Bank of America NA LIQ) | | | 0.54 | | | | 04/01/2028 | | | | 7,500,000 | | | | 7,500,000 | |
Orange County FL Health Facilities Authority Adventist Health Systems Project Series 237 (Health Revenue, AMBAC Insured, Bank of America
NA LIQ) | | | 0.32 | | | | 11/15/2025 | | | | 44,905,000 | | | | 44,905,000 | |
Orange County FL HFA Landings on Millenia Boulevard Apartments Project Series 2002-A (Housing Revenue, FNMA LOC) | | | 0.18 | | | | 08/15/2035 | | | | 7,060,000 | | | | 7,060,000 | |
Orlando FL Utilities Commission Series A (Utilities Revenue) (i) | | | 0.26 | | | | 10/01/2027 | | | | 6,745,000 | | | | 6,745,000 | |
Palm Beach County FL Jewish Community Campus Corporation Project (Miscellaneous Revenue, Northern Trust Company LOC, AMBAC Insured) | | | 0.22 | | | | 03/01/2027 | | | | 4,000,000 | | | | 4,000,000 | |
RBC Municipal Products Incorporated PFOTER Series O-43 (Tax Revenue, Royal Bank of Canada LOC) 144A | | | 0.15 | | | | 01/01/2020 | | | | 5,115,000 | | | | 5,115,000 | |
Tampa FL Baycare Health System Series B (Health Revenue) | | | 0.25 | | | | 11/15/2033 | | | | 1,000,000 | | | | 1,000,000 | |
| | | | |
| | | | | | | | | | | | | | | 129,390,000 | |
| | | | | | | | | | | | | | | | |
| | | | |
| | | | | | | | | | | | | | | 153,640,000 | |
| | | | | | | | | | | | | | | | |
The accompanying notes are an integral part of these financial statements.
| | | | | | |
| Portfolio of Investments—July 31, 2012 (Unaudited) | | Wells Fargo Advantage Municipal Cash Management Money Market Fund | | | 11 | |
| | | | | | | | | | | | | | | | |
| Security Name | | Interest Rate | | | Maturity Date | | | Principal | | | Value | |
| | | | | | | | | | | | | | | | |
| | | | |
Georgia: 0.47% | | | | | | | | | | | | | | | | |
| | | | |
| Variable Rate Demand Notes§: 0.47% | | | | | | | | | | | | | | | | |
Atlanta GA Housing Authority Villages at Carver Project (Housing Revenue, FNMA Insured & LIQ) | | | 0.18 | % | | | 12/15/2039 | | | $ | 3,425,000 | | | $ | 3,425,000 | |
Fulton County GA Development Authority Shepherd Center Project (Health Revenue, FHLB LOC) | | | 0.16 | | | | 09/01/2035 | | | | 1,620,000 | | | | 1,620,000 | |
Gwinnet County GA Development Authority Ole Mexican Foods Incorporated Project (IDR, Branch Banking & Trust LOC) | | | 0.20 | | | | 05/01/2031 | | | | 1,320,000 | | | | 1,320,000 | |
Richmond County GA Development Authority MCG Health Incorporated Project Series B (IDR, Branch Banking & Trust LOC) | | | 0.17 | | | | 07/01/2037 | | | | 3,995,000 | | | | 3,995,000 | |
| | | | |
| | | | | | | | | | | | | | | 10,360,000 | |
| | | | | | | | | | | | | | | | |
| | | | |
Illinois: 5.70% | | | | | | | | | | | | | | | | |
| | | | |
| Other Municipal Debt: 0.45% | | | | | | | | | | | | | | | | |
Illinois Finance Authority Loyola University Series LOY (Education Revenue) | | | 0.16 | | | | 08/07/2012 | | | | 6,600,000 | | | | 6,600,000 | |
Illinois State Unemployment Insurance Program Series A (Miscellaneous Revenue) | | | 2.00 | | | | 06/15/2013 | | | | 3,500,000 | | | | 3,552,231 | |
| | | | |
| | | | | | | | | | | | | | | 10,152,231 | |
| | | | | | | | | | | | | | | | |
| | | | |
| Variable Rate Demand Notes§: 5.25% | | | | | | | | | | | | | | | | |
Chicago IL Education Marine Project Series 1984 (IDR, FHLB LOC) | | | 0.17 | | | | 07/01/2023 | | | | 4,200,000 | | | | 4,200,000 | |
Chicago IL Enterprise Center Project Series IX (IDR, Bank of America NA LOC) | | | 0.55 | | | | 06/01/2022 | | | | 3,146,000 | | | | 3,146,000 | |
Chicago IL Enterprise Center Project Series X (IDR, LaSalle Bank NA LOC) | | | 0.55 | | | | 06/01/2022 | | | | 4,300,000 | | | | 4,300,000 | |
Chicago IL Midway Airport 2nd Lien Series C-1 (Airport Revenue, Bank of Montreal LOC) | | | 0.19 | | | | 01/01/2035 | | | | 19,520,000 | | | | 19,520,000 | |
Chicago IL Neighborhoods Alive 21 Series B-4 (GO, Bank of New York Mellon LOC) | | | 0.15 | | | | 01/01/2037 | | | | 6,370,000 | | | | 6,370,000 | |
Chicago IL O’Hare International Airport ROC RR-II-R-605PB (Airport Revenue, FSA-CR, FGIC Insured, Citibank NA LIQ) | | | 0.35 | | | | 01/01/2014 | | | | 9,700,000 | | | | 9,700,000 | |
Illinois Development Finance Authority Glenwood School for Boys Series 1998 (Education Revenue, Harris Trust & Savings Bank LOC) | | | 0.16 | | | | 02/01/2033 | | | | 650,000 | | | | 650,000 | |
Illinois Development Finance Authority St. Ignatius College Series 1994 (Education Revenue, Northern Trust Company LOC) | | | 0.17 | | | | 06/01/2024 | | | | 3,800,000 | | | | 3,800,000 | |
Illinois Development Finance Authority YMCA Metropolitan Chicago Project Series 2001 (Miscellaneous Revenue, Harris Trust & Savings Bank LOC) | | | 0.17 | | | | 06/01/2029 | | | | 4,500,000 | | | | 4,500,000 | |
Illinois Finance Authority Advocate Healthcare Project Series A-1 (Health Revenue) | | | 0.22 | | | | 11/01/2030 | | | | 3,000,000 | | | | 3,000,000 | |
Illinois Finance Authority Advocate Healthcare Project Series B (Health Revenue) (i) | | | 0.27 | | | | 04/01/2051 | | | | 5,000,000 | | | | 5,000,000 | |
Illinois Housing Development Authority Homeowner Mortgage A3 (Housing Revenue, FHLB SPA) | | | 0.18 | | | | 08/01/2035 | | | | 20,000,000 | | | | 20,000,000 | |
Illinois State Finance Authority Various Hospital Sisters Services Series C (Health Revenue, AGM Insured, JPMorgan Chase Bank SPA) | | | 0.40 | | | | 03/15/2036 | | | | 25,000,000 | | | | 25,000,000 | |
RBC Municipal Products Incorporated PFOTER Series O-42 (Tax Revenue, Royal Bank of Canada LOC) 144A | | | 0.15 | | | | 06/15/2020 | | | | 4,320,000 | | | | 4,320,000 | |
Southwestern Illinois IDA Mattingly Lumber Project Series 2005-A (IDR, First Bank LOC) | | | 0.30 | | | | 12/01/2035 | | | | 3,080,000 | | | | 3,080,000 | |
| | | | |
| | | | | | | | | | | | | | | 116,586,000 | |
| | | | | | | | | | | | | | | | |
| | | | |
| | | | | | | | | | | | | | | 126,738,231 | |
| | | | | | | | | | | | | | | | |
The accompanying notes are an integral part of these financial statements.
| | | | |
| 12 | | Wells Fargo Advantage Municipal Cash Management Money Market Fund | | Portfolio of Investments—July 31, 2012 (Unaudited) |
| | | | | | | | | | | | | | | | |
| Security Name | | Interest Rate | | | Maturity Date | | | Principal | | | Value | |
| | | | | | | | | | | | | | | | |
| | | | |
Indiana: 2.93% | | | | | | | | | | | | | | | | |
| | | | |
| Other Municipal Debt: 0.29% | | | | | | | | | | | | | | | | |
Indiana Bond Bank Interim Advance Funding Program Notes Series A (Miscellaneous Revenue) | | | 1.25 | % | | | 01/03/2013 | | | $ | 6,550,000 | | | $ | 6,574,834 | |
| | | | | | | | | | | | | | | | |
| | | | |
| Variable Rate Demand Notes§: 2.64% | | | | | | | | | | | | | | | | |
Gary IN Grant Street Project (IDR, JPMorgan Chase Bank LOC) | | | 0.25 | | | | 07/01/2034 | | | | 5,555,000 | | | | 5,555,000 | |
Indiana Finance Autority Ohio Valley Electric Corporation Project Series C (IDR, Bank of Nova Scotia LOC) | | | 0.15 | | | | 06/01/2040 | | | | 3,100,000 | | | | 3,100,000 | |
Indiana HFFA Fayette Memorial Hospital Association Series A (Health Revenue, U.S. Bank NA LOC) | | | 0.18 | | | | 10/01/2032 | | | | 4,475,000 | | | | 4,475,000 | |
Indiana State Finance Authority Ascension Health Project Senior
Notes (IDR) | | | 0.14 | | | | 11/15/2036 | | | | 1,500,000 | | | | 1,500,000 | |
Indiana State Housing & CDA Series C (Tax Revenue) | | | 0.20 | | | | 07/01/2036 | | | | 20,425,000 | | | | 20,425,000 | |
Madison IN EDA Arvin Sango Incorporated Project (IDR, Bank of Tokyo-Mitsubishi SPA) | | | 0.19 | | | | 08/01/2017 | | | | 6,000,000 | | | | 6,000,000 | |
Saint Joseph County IN Grace Christian Schools Project (Miscellaneous Revenue, Bank of New York Mellon LOC) | | | 0.01 | | | | 12/01/2016 | | | | 900,000 | | | | 900,000 | |
Spencer County IN American Iron Oxide Company Project (IDR, Bank of Tokyo-Mitsubishi LOC) | | | 0.35 | | | | 09/01/2018 | | | | 8,600,000 | | | | 8,600,000 | |
Valparaiso IN EDA Task Force Tips Incorporated Project (Miscellaneous Revenue, Harris NA LOC) | | | 0.25 | | | | 05/01/2033 | | | | 8,025,000 | | | | 8,025,000 | |
| | | | |
| | | | | | | | | | | | | | | 58,580,000 | |
| | | | | | | | | | | | | | | | |
| | | | |
| | | | | | | | | | | | | | | 65,154,834 | |
| | | | | | | | | | | | | | | | |
| | | | |
Iowa: 0.78% | | | | | | | | | | | | | | | | |
| | | | |
| Variable Rate Demand Notes§: 0.78% | | | | | | | | | | | | | | | | |
Iowa Finance Authority Archer Daniels Midland Company Project (IDR) | | | 0.22 | | | | 12/01/2051 | | | | 7,900,000 | | | | 7,900,000 | |
Iowa Finance Authority Chrisbro III Incorporated Project (IDR, Great Western Bank LOC) | | | 0.16 | | | | 08/01/2041 | | | | 4,250,000 | | | | 4,250,000 | |
Iowa HFA SFHR Series N (Housing Revenue, GNMA/FNMA Insured,
FHLB SPA) | | | 0.17 | | | | 01/01/2039 | | | | 4,865,000 | | | | 4,865,000 | |
Scott County IA Nichols Aluminum Recycling Project (Resource Recovery Revenue, U.S. Bank NA LOC) | | | 1.46 | | | | 06/01/2014 | | | | 400,000 | | | | 400,000 | |
| | | | |
| | | | | | | | | | | | | | | 17,415,000 | |
| | | | | | | | | | | | | | | | |
| | | | |
| | | | | | | | | | | | | | | 17,415,000 | |
| | | | | | | | | | | | | | | | |
| | | | |
Kansas: 0.58% | | | | | | | | | | | | | | | | |
| | | | |
| Variable Rate Demand Notes§: 0.58% | | | | | | | | | | | | | | | | |
Kansas State Development Finance Authority Adventist Health C (Hospital Revenue, Royal Bank of Canada LOC) | | | 0.13 | | | | 11/15/2034 | | | | 10,600,000 | | | | 10,600,000 | |
Nemaha County KS Midwest AG Services LLC Project (IDR, CoBank
ACB LOC) | | | 0.23 | | | | 11/01/2020 | | | | 2,265,000 | | | | 2,265,000 | |
| | | | |
| | | | | | | | | | | | | | | 12,865,000 | |
| | | | | | | | | | | | | | | | |
| | | | |
Kentucky: 0.85% | | | | | | | | | | | | | | | | |
| | | | |
| Other Municipal Debt: 0.05% | | | | | | | | | | | | | | | | |
Kentucky Rural Water Finance Corporation Series A
(Water & Sewer Revenue) | | | 1.25 | | | | 02/01/2013 | | | | 1,000,000 | | | | 1,003,745 | |
| | | | | | | | | | | | | | | | |
| | | | |
| Variable Rate Demand Notes§: 0.80% | | | | | | | | | | | | | | | | |
Hopkins County KY Industrial Building J-Lok Corporation Project Series 2007 (IDR, PNC Bank NA LOC) | | | 0.20 | | | | 10/01/2017 | | | | 5,250,000 | | | | 5,250,000 | |
The accompanying notes are an integral part of these financial statements.
| | | | | | |
| Portfolio of Investments—July 31, 2012 (Unaudited) | | Wells Fargo Advantage Municipal Cash Management Money Market Fund | | | 13 | |
| | | | | | | | | | | | | | | | |
| Security Name | | Interest Rate | | | Maturity Date | | | Principal | | | Value | |
| | | | | | | | | | | | | | | | |
| | | | |
| Variable Rate Demand Notes§ (continued) | | | | | | | | | | | | | | | | |
JPMorgan Chase PUTTER/DRIVER Trust Series 4096 (Miscellaneous Revenue, JPMorgan Chase Bank LIQ) 144A | | | 0.24 | % | | | 07/01/2022 | | | $ | 5,165,000 | | | $ | 5,165,000 | |
Kentucky Rural Water Finance Corporation Series H (Housing Revenue, State Street Bank & Trust Company SPA) | | | 0.18 | | | | 07/01/2036 | | | | 7,385,000 | | | | 7,385,000 | |
| | | | |
| | | | | | | | | | | | | | | 17,800,000 | |
| | | | | | | | | | | | | | | | |
| | | | |
| | | | | | | | | | | | | | | 18,803,745 | |
| | | | | | | | | | | | | | | | |
| | | | |
Louisiana: 1.61% | | | | | | | | | | | | | | | | |
| | | | |
| Variable Rate Demand Notes§: 1.61% | | | | | | | | | | | | | | | | |
Ascension Parish LA BASF Corporation Project (IDR) | | | 0.31 | | | | 03/01/2025 | | | | 7,900,000 | | | | 7,900,000 | |
Louisiana PFA PC Allied Signal Incorporated Project (IDR) | | | 0.19 | | | | 08/01/2017 | | | | 6,815,000 | | | | 6,815,000 | |
Louisiana State Series A-1 Royal Bank of Canada Municipal Products Incorporated Trust Floater Certificates Series 0-31 (Tax Revenue, Royal Bank of Canada LOC) 144A | | | 0.15 | | | | 05/01/2034 | | | | 1,000,000 | | | | 1,000,000 | |
Saint James Parish LA Nucor Steel Louisiana LLC Project
Series 2010A-1 (IDR) | | | 0.16 | | | | 11/01/2040 | | | | 20,000,000 | | | | 20,000,000 | |
| | | | |
| | | | | | | | | | | | | | | 35,715,000 | |
| | | | | | | | | | | | | | | | |
| | | | |
Maine: 0.39% | | | | | | | | | | | | | | | | |
| | | | |
| Variable Rate Demand Notes§: 0.39% | | | | | | | | | | | | | | | | |
Maine Finance Authority Foxcroft Academy (Education Revenue,
TD Bank NA LOC) | | | 0.13 | | | | 06/01/2038 | | | | 3,700,000 | | | | 3,700,000 | |
Old Town ME Georgia Pacific Corporation Project (Resource Recovery Revenue, Bank of Nova Scotia LOC) | | | 0.18 | | | | 12/01/2024 | | | | 5,000,000 | | | | 5,000,000 | |
| | | | |
| | | | | | | | | | | | | | | 8,700,000 | |
| | | | | | | | | | | | | | | | |
| | | | |
Maryland: 1.03% | | | | | | | | | | | | | | | | |
| | | | |
| Other Municipal Debt: 0.42% | | | | | | | | | | | | | | | | |
Montgomery County MD Consolidated Public Improvement BAN Series 10-A (Miscellaneous Revenue, PNC Bank NA LIQ) | | | 0.16 | | | | 08/07/2012 | | | | 9,300,000 | | | | 9,300,000 | |
| | | | | | | | | | | | | | | | |
| | | | |
| Variable Rate Demand Notes§: 0.61% | | | | | | | | | | | | | | | | |
Baltimore County MD Cross Creek Apartments Project Series 2008 (Housing Revenue, PNC Bank NA LOC) | | | 0.19 | | | | 11/01/2033 | | | | 4,445,000 | | | | 4,445,000 | |
Baltimore County MD Maryvale Preparatory School Facilities Project Series 2005-A (Education Revenue, Manufacturers & Traders Bank LOC) | | | 0.20 | | | | 12/03/2035 | | | | 1,000,000 | | | | 1,000,000 | |
Maryland HEFA Stella Maris Issue Series 1997 (Health Revenue,
M&T Bank LOC) | | | 0.16 | | | | 07/01/2021 | | | | 3,130,000 | | | | 3,130,000 | |
RBC Municipal Products Incorporated PFOTER Series O-29 (Tax Revenue, Royal Bank of Canada LOC) 144A | | | 0.15 | | | | 11/15/2051 | | | | 5,000,000 | | | | 5,000,000 | |
| | | | |
| | | | | | | | | | | | | | | 13,575,000 | |
| | | | | | | | | | | | | | | | |
| | | | |
| | | | | | | | | | | | | | | 22,875,000 | |
| | | | | | | | | | | | | | | | |
| | | | |
Massachusetts: 0.85% | | | | | | | | | | | | | | | | |
| | | | |
| Other Municipal Debt: 0.45% | | | | | | | | | | | | | | | | |
Massachusetts Port Authority AMT Series 12-B (Miscellaneous Revenue) | | | 0.20 | | | | 08/08/2012 | | | | 10,000,000 | | | | 10,000,000 | |
| | | | | | | | | | | | | | | | |
| | | | |
| Variable Rate Demand Notes§: 0.40% | | | | | | | | | | | | | | | | |
Massachusetts Industrial Finance Agency Constitution Project (Miscellaneous Revenue, TD Bank NA LOC) | | | 0.55 | | | | 06/01/2018 | | | | 1,800,000 | | | | 1,800,000 | |
The accompanying notes are an integral part of these financial statements.
| | | | |
| 14 | | Wells Fargo Advantage Municipal Cash Management Money Market Fund | | Portfolio of Investments—July 31, 2012 (Unaudited) |
| | | | | | | | | | | | | | | | |
| Security Name | | Interest Rate | | | Maturity Date | | | Principal | | | Value | |
| | | | | | | | | | | | | | | | |
| | | | |
| Variable Rate Demand Notes§ (continued) | | | | | | | | | | | | | | | | |
University of Massachusetts Building Authority (Education Revenue, State Guaranteed Insured) (i) | | | 0.24 | % | | | 11/01/2034 | | | $ | 7,045,000 | | | $ | 7,045,000 | |
| | | | |
| | | | | | | | | | | | | | | 8,845,000 | |
| | | | | | | | | | | | | | | | |
| | | | |
| | | | | | | | | | | | | | | 18,845,000 | |
| | | | | | | | | | | | | | | | |
| | | | |
Michigan: 3.76% | | | | | | | | | | | | | | | | |
| | | | |
| Other Municipal Debt: 0.83% | | | | | | | | | | | | | | | | |
Michigan State Hospital Finance Authority Trinity Health Credit Group Project Series 08-C (Health Revenue) | | | 0.14 | | | | 08/07/2012 | | | | 7,900,000 | | | | 7,900,000 | |
Michigan State University Board of Trustees Series D (Education Revenue) | | | 0.18 | | | | 10/15/2012 | | | | 5,000,000 | | | | 5,000,000 | |
University of Michigan Regents Series B (Education Revenue) | | | 0.14 | | | | 08/07/2012 | | | | 5,600,000 | | | | 5,600,000 | |
| | | | |
| | | | | | | | | | | | | | | 18,500,000 | |
| | | | | | | | | | | | | | | | |
| | | | |
| Variable Rate Demand Notes§: 2.93% | | | | | | | | | | | | | | | | |
Eastern Michigan University Various Refunding Notes Series B (Education Revenue, JPMorgan Chase & Company LOC) | | | 0.19 | | | | 03/01/2049 | | | | 8,400,000 | | | | 8,400,000 | |
Michigan Higher Education Authority Student Loan Royal Bank of Canada Municipal Products Trust Incorporated Certificate Series L-33 (Education Revenue, Royal Bank of Canada LOC & LIQ) | | | 0.19 | | | | 09/01/2026 | | | | 20,000,000 | | | | 20,000,000 | |
Michigan Housing Development Authority Rental Housing Project (Housing Revenue, GO of Authority Insured, JPMorgan Chase & Company SPA) | | | 0.20 | | | | 10/01/2037 | | | | 17,560,000 | | | | 17,560,000 | |
Michigan Housing Development Authority Rental Housing Project Series 2010-F (Health Revenue) (i) | | | 0.24 | | | | 11/15/2049 | | | | 6,500,000 | | | | 6,500,000 | |
Michigan State Hospital Finance Authority Ascension Health Senior Credit (Health Revenue) | | | 0.24 | | | | 11/15/2049 | | | | 5,200,000 | | | | 5,200,000 | |
Michigan State Hospital Finance Authority Trinity Health Credit Group Series 2011 Royal Bank of Canada Municipal Products Incorporated Trust Floater Certificates Series O-32 (Tax Revenue, Royal Bank of Canada LOC) 144A | | | 0.15 | | | | 06/01/2020 | | | | 2,000,000 | | | | 2,000,000 | |
Michigan State University Various Refunding Notes (Education Revenue) | | | 0.15 | | | | 02/15/2034 | | | | 3,400,000 | | | | 3,400,000 | |
University of Michigan Board of Regents GO Series 2012-A
(Education Revenue) | | | 0.12 | | | | 04/01/2036 | | | | 2,000,000 | | | | 2,000,000 | |
| | | | |
| | | | | | | | | | | | | | | 65,060,000 | |
| | | | | | | | | | | | | | | | |
| | | | |
| | | | | | | | | | | | | | | 83,560,000 | |
| | | | | | | | | | | | | | | | |
| | | | |
Minnesota: 4.27% | | | | | | | | | | | | | | | | |
| | | | |
| Other Municipal Debt: 1.19% | | | | | | | | | | | | | | | | |
Hennepin County MN Unlimited Series B (Tax Revenue) | | | 2.00 | | | | 12/01/2012 | | | | 1,000,000 | | | | 1,005,998 | |
Rochester MN HCFR Mayo Foundation Series 00-A (Health Revenue) | | | 0.16 | | | | 08/21/2012 | | | | 17,000,000 | | | | 17,000,000 | |
University of Minnesota Regents Series 05-A (GO) | | | 0.14 | | | | 08/07/2012 | | | | 8,300,000 | | | | 8,300,000 | |
| | | | |
| | | | | | | | | | | | | | | 26,305,998 | |
| | | | | | | | | | | | | | | | |
| | | | |
| Variable Rate Demand Notes§: 3.08% | | | | | | | | | | | | | | | | |
Bloomington MN Norlan Partners Series B (Housing Revenue,
LaSalle Bank NA LOC) | | | 0.57 | | | | 07/15/2032 | | | | 2,410,000 | | | | 2,410,000 | |
Dakota County MN CDA View Pointe Apartments Project Series 2007-A (Housing Revenue, FNMA Insured & LIQ) | | | 0.18 | | | | 01/15/2038 | | | | 15,865,000 | | | | 15,865,000 | |
Forest Lake MN Kilkenny Court Apartments Project (Housing Revenue, FNMA Insured & LIQ) | | | 0.16 | | | | 08/15/2038 | | | | 750,000 | | | | 750,000 | |
The accompanying notes are an integral part of these financial statements.
| | | | | | |
| Portfolio of Investments—July 31, 2012 (Unaudited) | | Wells Fargo Advantage Municipal Cash Management Money Market Fund | | | 15 | |
| | | | | | | | | | | | | | | | |
| Security Name | | Interest Rate | | | Maturity Date | | | Principal | | | Value | |
| | | | | | | | | | | | | | | | |
| | | | |
| Variable Rate Demand Notes§ (continued) | | | | | | | | | | | | | | | | |
Minneapolis MN MFHR Driftwood Apartments Project Series A (Housing Revenue, U.S. Bank NA LOC) | | | 0.21 | % | | | 10/01/2024 | | | $ | 235,000 | | | $ | 235,000 | |
Minneapolis MN Minnehaha Academy Project (Education Revenue, U.S. Bank NA LOC) | | | 0.18 | | | | 05/01/2026 | | | | 1,042,000 | | | | 1,042,000 | |
Minnesota Bond Securitization Trust Certificate Carleton Lofts Project Class A (Miscellaneous Revenue, U.S. Bank NA LOC) | | | 0.30 | | | | 12/01/2048 | | | | 300,000 | | | | 300,000 | |
Minnesota Bond Securitization Trust Certificate Series S1 Class A (Miscellaneous Revenue, PNC Bank NA LOC) | | | 0.30 | | | | 02/01/2027 | | | | 1,480,000 | | | | 1,480,000 | |
Minnesota Bond Securitization Trust Certificate Series S2 Class A (Miscellaneous Revenue, PNC Bank NA LOC) | | | 0.30 | | | | 11/01/2028 | | | | 2,990,000 | | | | 2,990,000 | |
Minnesota HFA Residential Housing Finance Project Series C (Miscellaneous Revenue, FHLB SPA) | | | 0.16 | | | | 07/01/2036 | | | | 11,700,000 | | | | 11,700,000 | |
Minnesota HFA Series C (Housing Revenue, GO of Agency
Insured, FHLB LIQ) | | | 0.16 | | | | 07/01/2048 | | | | 6,000,000 | | | | 6,000,000 | |
Minnesota State HEFAR MacAlester College Series 5-Q (Education Revenue) | | | 0.20 | | | | 03/01/2033 | | | | 1,000,000 | | | | 1,000,000 | |
Minnesota State HEFAR Trustees Hamline University Series 6E3 (Education Revenue, Harris NA LOC) | | | 0.16 | | | | 10/01/2016 | | | | 1,185,000 | | | | 1,185,000 | |
Minnesota State Residential Housing Series C (Housing Revenue, GO of Authority Insured) | | | 0.18 | | | | 01/01/2035 | | | | 8,215,000 | | | | 8,215,000 | |
Minnesota State Residential Housing Series G (Housing Revenue) | | | 0.18 | | | | 01/01/2032 | | | | 6,000,000 | | | | 6,000,000 | |
Plymouth MN MFHR The Lake Apartments Project (Housing Revenue, FHLMC Insured & LIQ) | | | 0.18 | | | | 08/01/2034 | | | | 1,900,000 | | | | 1,900,000 | |
Ramsey County MN MFHR Gateway Apartments LP Series A (Miscellaneous Revenue, Bank of America NA LOC) | | | 0.47 | | | | 10/01/2038 | | | | 300,000 | | | | 300,000 | |
St. Paul MN Housing & RDA Hampden Square Apartments Series A (Housing Revenue, FNMA Insured & LIQ) | | | 0.18 | | | | 06/01/2032 | | | | 700,000 | | | | 700,000 | |
Stevens County MN Riverview Dairy Project Series 2007 (Resource Recovery Revenue, AgCountry Farm Credit Services LOC) | | | 0.26 | | | | 08/01/2032 | | | | 3,350,000 | | | | 3,350,000 | |
Swift County MN East Dublin Dairy LLP Project Series 2008 (Resource Recovery Revenue, AgCountry Farm Credit Services LOC) | | | 0.26 | | | | 04/01/2033 | | | | 3,050,000 | | | | 3,050,000 | |
| | | | |
| | | | | | | | | | | | | | | 68,472,000 | |
| | | | | | | | | | | | | | | | |
| | | | |
| | | | | | | | | | | | | | | 94,777,998 | |
| | | | | | | | | | | | | | | | |
| | | | |
Mississippi: 0.68% | | | | | | | | | | | | | | | | |
| | | | |
| Variable Rate Demand Note§: 0.68% | | | | | | | | | | | | | | | | |
Perry County MS River Forest Products Incorporated Project (Miscellaneous Revenue, Bank of Nova Scotia LOC) | | | 0.15 | | | | 02/01/2022 | | | | 15,180,000 | | | | 15,180,000 | |
| | | | | | | | | | | | | | | | |
| | | | |
Missouri: 1.31% | | | | | | | | | | | | | | | | |
| | | | |
| Other Municipal Debt: 0.35% | | | | | | | | | | | | | | | | |
University of Missouri Curators Series A (Education Revenue) | | | 0.15 | | | | 08/07/2012 | | | | 7,700,000 | | | | 7,700,000 | |
| | | | | | | | | | | | | | | | |
| | | | |
| Variable Rate Demand Notes§: 0.96% | | | | | | | | | | | | | | | | |
Greene County MO Stasbourg Estates Project (Housing Revenue,
U.S. Bank NA LOC) | | | 0.22 | | | | 08/01/2038 | | | | 2,160,000 | | | | 2,160,000 | |
Kansas City MO IDA Ewing Marion Kauffman Foundation
(Miscellaneous Revenue) | | | 0.17 | | | | 04/01/2027 | | | | 4,700,000 | | | | 4,700,000 | |
Missouri State Development Finance Board Ewing Marion Kauffman Project Series A (Miscellaneous Revenue) | | | 0.17 | | | | 06/01/2037 | | | | 3,475,000 | | | | 3,475,000 | |
The accompanying notes are an integral part of these financial statements.
| | | | |
| 16 | | Wells Fargo Advantage Municipal Cash Management Money Market Fund | | Portfolio of Investments—July 31, 2012 (Unaudited) |
| | | | | | | | | | | | | | | | |
| Security Name | | Interest Rate | | | Maturity Date | | | Principal | | | Value | |
| | | | | | | | | | | | | | | | |
| | | | |
| Variable Rate Demand Notes§ (continued) | | | | | | | | | | | | | | | | |
Missouri State HEFA Ascension Health Project Series C4 (Health Revenue) | | | 0.13 | % | | | 11/15/2026 | | | $ | 3,000,000 | | | $ | 3,000,000 | |
Missouri State Housing Development Commission Homeowner Loan Program Series C-1 Clipper Tax-Exempt Certificate Trust Series 2009-12 Certificate Partner Multi-State (Miscellaneous Revenue, State Street Bank & Trust Company LIQ) | | | 0.30 | | | | 03/01/2038 | | | | 4,442,000 | | | | 4,442,000 | |
St. Charles County MO United Handicap Services (Education Revenue,
U.S. Bank NA LOC) | | | 0.31 | | | | 07/01/2023 | | | | 3,675,000 | | | | 3,675,000 | |
| | | | |
| | | | | | | | | | | | | | | 21,452,000 | |
| | | | | | | | | | | | | | | | |
| | | | |
| | | | | | | | | | | | | | | 29,152,000 | |
| | | | | | | | | | | | | | | | |
| | | | |
Montana: 0.24% | | | | | | | | | | | | | | | | |
| | | | |
| Variable Rate Demand Note§: 0.24% | | | | | | | | | | | | | | | | |
Clipper Tax-Exempt Certified Trust Series 2009-22 (Miscellaneous Revenue, State Street Bank & Trust Company LIQ) | | | 0.27 | | | | 12/01/2036 | | | | 5,220,000 | | | | 5,220,000 | |
| | | | | | | | | | | | | | | | |
| | | | |
Nebraska: 0.28% | | | | | | | | | | | | | | | | |
| | | | |
| Variable Rate Demand Note§: 0.28% | | | | | | | | | | | | | | | | |
Nebraska Investment Finance Authority Apple Creek Associates Project Series 1985-A (Housing Revenue, Northern Trust Company LOC) | | | 0.26 | | | | 09/01/2031 | | | | 6,190,000 | | | | 6,190,000 | |
| | | | | | | | | | | | | | | | |
| | | | |
Nevada: 0.95% | | | | | | | | | | | | | | | | |
| | | | |
| Variable Rate Demand Notes§: 0.95% | | | | | | | | | | | | | | | | |
Nevada Housing Development Authority MFHR Vintage at Laughlin Apartments Project (Housing Revenue, East West Bank LOC, FHLB SPA) | | | 0.17 | | | | 04/15/2041 | | | | 11,000,000 | | | | 11,000,000 | |
Reno NV Refunding Senior Lien Reno Transportation Rail Access Corridor Project (Tax Revenue, Bank of New York Mellon LOC) | | | 0.17 | | | | 06/01/2042 | | | | 10,000,000 | | | | 10,000,000 | |
| | | | |
| | | | | | | | | | | | | | | 21,000,000 | |
| | | | | | | | | | | | | | | | |
| | | | |
New Hampshire: 1.37% | | | | | | | | | | | | | | | | |
| | | | |
| Variable Rate Demand Notes§: 1.37% | | | | | | | | | | | | | | | | |
Clipper Tax-Exempt Certified Trust Series 2005-03 (Miscellaneous Revenue, State Street Bank & Trust Company LIQ) | | | 0.27 | | | | 02/01/2013 | | | | 19,075,000 | | | | 19,075,000 | |
JPMorgan Chase PUTTER/DRIVER Trust Series 3648 (Miscellaneous Revenue, JPMorgan Chase Bank LIQ) 144A | | | 0.25 | | | | 10/01/2017 | | | | 5,000,000 | | | | 5,000,000 | |
New Hampshire HEFA Dartmouth College Project Series 3069 (Education Revenue, Morgan Stanley Bank LIQ) 144A | | | 0.23 | | | | 06/01/2039 | | | | 6,280,139 | | | | 6,280,139 | |
| | | | |
| | | | | | | | | | | | | | | 30,355,139 | |
| | | | | | | | | | | | | | | | |
| | | | |
New Jersey: 3.44% | | | | | | | | | | | | | | | | |
| | | | |
| Variable Rate Demand Notes§: 3.44% | | | | | | | | | | | | | | | | |
Clipper Tax-Exempt Certified Trust Series 2009-32 (Miscellaneous Revenue, State Street Bank & Trust Company LIQ) | | | 0.20 | | | | 01/01/2018 | | | | 2,400,000 | | | | 2,400,000 | |
Clipper Tax-Exempt Certified Trust Series A-2006 (Transportation Revenue) | | | 0.15 | | | | 12/15/2023 | | | | 7,000,000 | | | | 7,000,000 | |
New Jersey EDA Natural Gas Company Series A (Utilities Revenue) | | | 0.17 | | | | 09/01/2027 | | | | 3,345,000 | | | | 3,345,000 | |
New Jersey EDA Natural Gas Company Series C (Utilities Revenue) | | | 0.20 | | | | 08/01/2041 | | | | 17,900,000 | | | | 17,900,000 | |
New Jersey Educational Facilities Authority Various Institute Defense Analyses Series D (Miscellaneous Revenue, Branch Banking & Trust LOC, AMBAC Insured) | | | 0.16 | | | | 10/01/2030 | | | | 1,000,000 | | | | 1,000,000 | |
The accompanying notes are an integral part of these financial statements.
| | | | | | |
| Portfolio of Investments—July 31, 2012 (Unaudited) | | Wells Fargo Advantage Municipal Cash Management Money Market Fund | | | 17 | |
| | | | | | | | | | | | | | | | |
| Security Name | | Interest Rate | | | Maturity Date | | | Principal | | | Value | |
| | | | | | | | | | | | | | | | |
| | | | |
| Variable Rate Demand Notes§ (continued) | | | | | | | | | | | | | | | | |
New Jersey Higher Education Assistance Authority Student Loan ROC RR-II-R-11853 (Education Revenue, Assured Guaranty Insured, Citibank NA LIQ) 144A | | | 0.30 | % | | | 06/01/2016 | | | $ | 20,595,000 | | | $ | 20,595,000 | |
New Jersey Housing & Mortgage Finance Agency SFHR Series R
(Housing Revenue) | | | 0.17 | | | | 04/01/2038 | | | | 14,565,000 | | | | 14,565,000 | |
New Jersey TRAN Series A (Tax Revenue) (i) | | | 0.50 | | | | 06/27/2013 | | | | 9,600,000 | | | | 9,601,800 | |
| | | | |
| | | | | | | | | | | | | | | 76,406,800 | |
| | | | | | | | | | | | | | | | |
| | | | |
New Mexico: 0.41% | | | | | | | | | | | | | | | | |
| | | | |
| Variable Rate Demand Notes§: 0.41% | | | | | | | | | | | | | | | | |
New Mexico Educational Assistance Foundation Series A-1 (Education Revenue, Royal Bank of Canada LOC, Guaranteed Student Loans Insured) | | | 0.18 | | | | 04/01/2034 | | | | 4,505,000 | | | | 4,505,000 | |
New Mexico Educational Assistance Foundation Series A-2 (Education Revenue, Royal Bank of Canada LOC, Guaranteed Student Loans Insured) | | | 0.18 | | | | 04/01/2034 | | | | 4,535,000 | | | | 4,535,000 | |
| | | | |
| | | | | | | | | | | | | | | 9,040,000 | |
| | | | | | | | | | | | | | | | |
| | | | |
New York: 5.16% | | | | | | | | | | | | | | | | |
| | | | |
| Other Municipal Debt: 0.23% | | | | | | | | | | | | | | | | |
New York Metropolitan Transportation Authority BAN Series CP-2 Subseries A (Transportation Revenue) | | | 0.18 | | | | 10/04/2012 | | | | 5,000,000 | | | | 5,000,000 | |
| | | | | | | | | | | | | | | | |
| | | | |
| Variable Rate Demand Notes§: 4.93% | | | | | | | | | | | | | | | | |
Clipper Tax-Exempt Certified Trust Series 2009-85 (Miscellaneous Revenue, State Street Bank & Trust Company LIQ) 144A | | | 0.30 | | | | 09/01/2034 | | | | 8,355,000 | | | | 8,355,000 | |
New York & New Jersey Port Authority PFOTER Series O-19 (Airport Revenue, GO of Authority Insured, Royal Bank of Canada LIQ) 144A | | | 0.16 | | | | 10/15/2041 | | | | 11,170,000 | | | | 11,170,000 | |
New York City NY Housing Development Corporation AMT Series H-2 (Housing Revenue) | | | 0.32 | | | | 05/01/2013 | | | | 5,500,000 | | | | 5,500,000 | |
New York City NY Housing Development Corporation MFHR Renaissance Court Project Series A (Housing Revenue, FHLMC Insured & LIQ) | | | 0.17 | | | | 06/01/2037 | | | | 20,000,000 | | | | 20,000,000 | |
New York City NY Housing Development Corporation MFHR Series H-2 (Housing Revenue) | | | 0.25 | | | | 05/01/2041 | | | | 2,150,000 | | | | 2,150,000 | |
New York City NY Housing Development Corporation Series C (Housing Revenue) | | | 0.27 | | | | 05/01/2045 | | | | 4,700,000 | | | | 4,700,000 | |
New York Convention Center Development Corporation New York Hotel Unit Fee Secured Series 3095 (Tax Revenue, BHAC-CR, AMBAC Insured, Morgan Stanley Bank LIQ) 144A | | | 0.23 | | | | 11/15/2044 | | | | 3,000,000 | | | | 3,000,000 | |
New York HFA MFHR 388 Bridge Street Housing Project Series A (Housing Revenue, Manufacturers & Traders Bank LOC) | | | 0.16 | | | | 05/01/2046 | | | | 1,600,000 | | | | 1,600,000 | |
New York HFA ROC RR-II-R-11700 Series B (Housing Revenue,
Citibank NA LIQ) 144A | | | 0.35 | | | | 05/01/2038 | | | | 6,810,000 | | | | 6,810,000 | |
New York Metropolitan Transportation Authority Series 2005-A ROC RR-II-R-594PB (Transportation Revenue, AMBAC Insured, Citibank NA LIQ) | | | 0.30 | | | | 11/15/2013 | | | | 7,120,000 | | | | 7,120,000 | |
New York Metropolitan Transportation Authority Series 2006-B ROC RR-II-R-11711 (Transportation Revenue, FSA Insured, Citibank NA LIQ) 144A | | | 0.30 | | | | 11/15/2027 | | | | 8,000,000 | | | | 8,000,000 | |
New York Mortgage Agency Homeowner ROC RR-II-R-11704 (Housing Revenue, Citibank NA LIQ) 144A | | | 0.40 | | | | 10/01/2031 | | | | 4,925,000 | | | | 4,925,000 | |
New York Mortgage Agency Homeowner Series 71 ROC RR-II-R-11706 (Housing Revenue, Citibank NA LIQ) 144A | | | 0.40 | | | | 10/01/2024 | | | | 5,405,000 | | | | 5,405,000 | |
The accompanying notes are an integral part of these financial statements.
| | | | |
| 18 | | Wells Fargo Advantage Municipal Cash Management Money Market Fund | | Portfolio of Investments—July 31, 2012 (Unaudited) |
| | | | | | | | | | | | | | | | |
| Security Name | | Interest Rate | | | Maturity Date | | | Principal | | | Value | |
| | | | | | | | | | | | | | | | |
| | | | |
| Variable Rate Demand Notes§ (continued) | | | | | | | | | | | | | | | | |
New York Mortgage Agency Homeowner Series 73-A ROC RR-II-R-11707 (Housing Revenue, Citibank NA LIQ) 144A | | | 0.40 | % | | | 10/01/2024 | | | $ | 12,620,000 | | | $ | 12,620,000 | |
New York NY DRIVER Trust Series 3381 (Housing Revenue, JPMorgan Chase Bank LIQ) 144A | | | 0.24 | | | | 10/01/2023 | | | | 2,115,000 | | | | 2,115,000 | |
Riverhead NY IDAG Central Suffolk Hospital Project Series A (Housing Revenue, M&T Bank LOC) | | | 0.18 | | | | 07/01/2031 | | | | 2,140,000 | | | | 2,140,000 | |
Riverhead NY IDAG Central Suffolk Hospital Project Series B (Housing Revenue, M&T Bank LOC) | | | 0.18 | | | | 07/01/2031 | | | | 2,015,000 | | | | 2,015,000 | |
Riverhead NY IDAG Central Suffolk Hospital Project Series C (Housing Revenue, M&T Bank LOC) | | | 0.18 | | | | 07/01/2017 | | | | 1,945,000 | | | | 1,945,000 | |
| | | | |
| | | | | | | | | | | | | | | 109,570,000 | |
| | | | | | | | | | | | | | | | |
| | | | |
| | | | | | | | | | | | | | | 114,570,000 | |
| | | | | | | | | | | | | | | | |
| | | | |
North Carolina: 3.02% | | | | | | | | | | | | | | | | |
| | | | |
| Variable Rate Demand Notes§: 3.02% | | | | | | | | | | | | | | | | |
North Carolina Capital Facilities Finance Agency Pfeifer University Project (Education Revenue, Bank of America NA LOC) | | | 1.00 | | | | 11/01/2026 | | | | 7,815,000 | | | | 7,815,000 | |
North Carolina Healthcare Facilities Authority Hospice Alamance Project (Health Revenue, Branch Banking & Trust LOC) | | | 0.17 | | | | 12/01/2033 | | | | 4,800,000 | | | | 4,800,000 | |
North Carolina Housing Finance Agency AMT Home Ownership Series 16-C (Housing Revenue) | | | 0.17 | | | | 07/01/2032 | | | | 12,815,000 | | | | 12,815,000 | |
North Carolina Housing Finance Agency AMT Home Ownership Series 17-C (Housing Revenue) | | | 0.17 | | | | 07/01/2033 | | | | 14,615,000 | | | | 14,615,000 | |
North Carolina Housing Finance Agency AMT Home Ownership Series 18-C (Housing Revenue) | | | 0.17 | | | | 01/01/2035 | | | | 12,625,000 | | | | 12,625,000 | |
Raleigh-Durham NC Airport Authority PUTTER Trust Series 2012 (Airport Revenue, JPMorgan Chase Bank LIQ) | | | 0.23 | | | | 05/01/2015 | | | | 14,470,000 | | | | 14,470,000 | |
| | | | |
| | | | | | | | | | | | | | | 67,140,000 | |
| | | | | | | | | | | | | | | | |
| | | | |
North Dakota: 2.36% | | | | | | | | | | | | | | | | |
| | | | |
| Other Municipal Debt: 1.21% | | | | | | | | | | | | | | | | |
Mercer County ND Series 09-1 (Resource Recovery Revenue) | | | 0.30 | | | | 08/07/2012 | | | | 25,000,000 | | | | 25,000,000 | |
North Dakota Water Finance Corporation Public Projects Construction Notes (IDR) § | | | 0.37 | | | | 08/01/2034 | | | | 2,000,000 | | | | 2,000,000 | |
| | | | |
| | | | | | | | | | | | | | | 27,000,000 | |
| | | | | | | | | | | | | | | | |
| | | | |
| Variable Rate Demand Notes§: 1.15% | | | | | | | | | | | | | | | | |
Mandan ND IDA Cloverdale Foods Company Project (IDR, BNC National Bank LOC) | | | 0.38 | | | | 12/01/2022 | | | | 2,260,000 | | | | 2,260,000 | |
North Dakota HFA Home Mortgage Program Series A (Housing Revenue, GO of Agency Insured, FHLB SPA) | | | 0.15 | | | | 07/01/2037 | | | | 7,210,000 | | | | 7,210,000 | |
North Dakota HFA Home Mortgage Program Series A (Housing Revenue) | | | 0.19 | | | | 01/01/2036 | | | | 7,810,000 | | | | 7,810,000 | |
North Dakota HFA Home Mortgage Program Series B (Housing Revenue) | | | 0.19 | | | | 07/01/2034 | | | | 5,205,000 | | | | 5,205,000 | |
Richland County ND Recovery Zone Facility Minnesota-Dakota Farmers Cooperative Project Series 2010-C (IDR, CoBank ACB LOC) | | | 0.16 | | | | 11/01/2028 | | | | 3,000,000 | | | | 3,000,000 | |
| | | | |
| | | | | | | | | | | | | | | 25,485,000 | |
| | | | | | | | | | | | | | | | |
| | | | |
| | | | | | | | | | | | | | | 52,485,000 | |
| | | | | | | | | | | | | | | | |
The accompanying notes are an integral part of these financial statements.
| | | | | | |
| Portfolio of Investments—July 31, 2012 (Unaudited) | | Wells Fargo Advantage Municipal Cash Management Money Market Fund | | | 19 | |
| | | | | | | | | | | | | | | | |
| Security Name | | Interest Rate | | | Maturity Date | | | Principal | | | Value | |
| | | | | | | | | | | | | | | | |
| | | | |
Ohio: 2.98% | | | | | | | | | | | | | | | | |
| | | | |
| Variable Rate Demand Notes§: 2.98% | | | | | | | | | | | | | | | | |
Allen County OH Hospital Facilities Authority Catholic Health Parnters Project Series B (Hospital Revenue) | | | 0.14 | % | | | 05/01/2036 | | | $ | 5,600,000 | | | $ | 5,600,000 | |
Ohio Air Quality Development Authority Andersons Marathon Ethanol LLC Project Series 2007 (Resource Recovery Revenue, CoBank ACB LOC) | | | 0.20 | | | | 09/01/2037 | | | | 49,500,000 | | | | 49,500,000 | |
Ohio HEFAR Xavier University Project Series B (Education Revenue, PNC Bank NA LOC) | | | 0.15 | | | | 11/01/2030 | | | | 2,200,000 | | | | 2,200,000 | |
Ohio HFA Series N (Housing Revenue, GNMA/FNMA Insured, State Street Bank & Trust Company SPA) | | | 0.18 | | | | 09/01/2036 | | | | 7,000,000 | | | | 7,000,000 | |
Ohio State Water Development Authority First Energy Generation Project Series B (IDR, Bank of Nova Scotia LOC) | | | 0.15 | | | | 10/01/2033 | | | | 1,975,000 | | | | 1,975,000 | |
| | | | |
| | | | | | | | | | | | | | | 66,275,000 | |
| | | | | | | | | | | | | | | | |
| | | | |
Oklahoma: 0.40% | | | | | | | | | | | | | | | | |
| | | | |
| Variable Rate Demand Note§: 0.40% | | | | | | | | | | | | | | | | |
Oklahoma Development Finance Authority Seaboard Farms Incorporation Project (IDR, Bank of New York Mellon LOC) | | | 0.16 | | | | 03/01/2027 | | | | 8,800,000 | | | | 8,800,000 | |
| | | | | | | | | | | | | | | | |
| | | | |
Oregon: 1.31% | | | | | | | | | | | | | | | | |
| | | | |
| Variable Rate Demand Notes§: 1.31% | | | | | | | | | | | | | | | | |
Oregon Beef Northwest Feeders Project (IDR, Northwest Farm Credit LOC) | | | 0.35 | | | | 01/01/2016 | | | | 725,000 | | | | 725,000 | |
Oregon Beef Northwest Feeders Project Series 207 (IDR, Northwest Farm Credit LOC) | | | 0.35 | | | | 01/01/2019 | | | | 710,000 | | | | 710,000 | |
Oregon Health & Science University Series B-2 (Miscellaneous Revenue, Union Bank NA LOC) | | | 0.15 | | | | 07/01/2042 | | | | 2,000,000 | | | | 2,000,000 | |
Oregon State Veterans Welfare Series 90B (GO, Bank of Tokyo-Mitsubishi SPA) | | | 0.16 | | | | 12/01/2045 | | | | 3,300,000 | | | | 3,300,000 | |
Portland Oregon Special Obligation Revenue Bulk Terminal (Port Authority Revenue, Canadian Imperial Bank LOC) | | | 0.16 | | | | 03/01/2036 | | | | 22,400,000 | | | | 22,400,000 | |
| | | | |
| | | | | | | | | | | | | | | 29,135,000 | |
| | | | | | | | | | | | | | | | |
| | | | |
Other: 0.50% | | | | | | | | | | | | | | | | |
| | | | |
| Variable Rate Demand Notes§: 0.50% | | | | | | | | | | | | | | | | |
Clipper Tax-Exempt Certified Trust Series 2007-14 (Miscellaneous Revenue, State Street Bank & Trust Company LIQ) | | | 0.30 | | | | 01/01/2038 | | | | 10,215,000 | | | | 10,215,000 | |
FHLMC MFHR Series M019 Class A (Housing Revenue, FHLMC Insured) | | | 0.20 | | | | 01/15/2047 | | | | 995,000 | | | | 995,000 | |
| | | | |
| | | | | | | | | | | | | | | 11,210,000 | |
| | | | | | | | | | | | | | | | |
| | | | |
Pennsylvania: 3.13% | | | | | | | | | | | | | | | | |
| | | | |
| Variable Rate Demand Notes§: 3.13% | | | | | | | | | | | | | | | | |
Allegheny County PA IDA United Jewish Federation Project Series A (Health Revenue, PNC Bank NA LOC) | | | 0.17 | | | | 10/01/2026 | | | | 3,122,000 | | | | 3,122,000 | |
Beaver County PA IDA BSF Corporation Project (IDR) | | | 0.31 | | | | 09/01/2032 | | | | 2,000,000 | | | | 2,000,000 | |
Berks County PA IDA Fleetwood Business Trust (IDR, U.S. Bank NA LOC) | | | 0.19 | | | | 05/15/2025 | | | | 3,610,000 | | | | 3,610,000 | |
Branch Banking & Trust Municipal Trust Floater Certificates Series 2004 (GO, Branch Banking & Trust LOC & LIQ) | | | 0.15 | | | | 01/04/2029 | | | | 3,425,000 | | | | 3,425,000 | |
Butler County PA IDA Mine Safety Appliances Series B (Miscellaneous Revenue, Virginia State LOC) | | | 0.28 | | | | 05/01/2022 | | | | 1,000,000 | | | | 1,000,000 | |
Central Bradford County PA PFOTER Series C-14 (Health Revenue, Royal Bank of Canada LOC & LIQ) 144A | | | 0.15 | | | | 12/01/2041 | | | | 3,000,000 | | | | 3,000,000 | |
The accompanying notes are an integral part of these financial statements.
| | | | |
| 20 | | Wells Fargo Advantage Municipal Cash Management Money Market Fund | | Portfolio of Investments—July 31, 2012 (Unaudited) |
| | | | | | | | | | | | | | | | |
| Security Name | | Interest Rate | | | Maturity Date | | | Principal | | | Value | |
| | | | | | | | | | | | | | | | |
| | | | |
| Variable Rate Demand Notes§ (continued) | | | | | | | | | | | | | | | | |
Franconia Township PA IDA Ashers Chocolate Project Series A (IDR, Commerce Bank NA LOC) | | | 0.35 | % | | | 05/01/2017 | | | $ | 985,000 | | | $ | 985,000 | |
Lehigh County PA PFOTER (Miscellaneous Revenue, Bank of America NA LIQ) | | | 0.43 | | | | 08/15/2042 | | | | 9,900,000 | | | | 9,900,000 | |
Montgomery County PA IDA Girl Scouts Southeastern (IDR, TD Bank NA LOC) | | | 0.15 | | | | 02/01/2025 | | | | 1,350,000 | | | | 1,350,000 | |
Moon PA IDA Community Facilities YMCA Greater Pittsburgh Project
Series 2005 (Miscellaneous Revenue, PNC Bank NA LOC) | | | 0.17 | | | | 06/01/2025 | | | | 1,305,000 | | | | 1,305,000 | |
Pennsylvania EDFA Fitzpatrick Container Company Project (IDR, PNC
Bank NA LOC) | | | 0.24 | | | | 12/01/2023 | | | | 1,500,000 | | | | 1,500,000 | |
Pennsylvania EDFA Ganflec Corporation Project Series E
(IDR, PNC Bank NA LOC) | | | 0.28 | | | | 11/01/2019 | | | | 1,000,000 | | | | 1,000,000 | |
Pennsylvania EDFA Series B1 (IDR, PNC Bank NA LOC) | | | 0.36 | | | | 05/01/2015 | | | | 100,000 | | | | 100,000 | |
Pennsylvania EDFA Series B2 (IDR, PNC Bank NA LOC) | | | 0.36 | | | | 08/01/2014 | | | | 200,000 | | | | 200,000 | |
Pennsylvania EDFA Series G10 (Miscellaneous Revenue, PNC Bank NA LOC) | | | 0.24 | | | | 12/01/2025 | | | | 2,000,000 | | | | 2,000,000 | |
Pennsylvania EDFA Series G12 (Miscellaneous Revenue, PNC Bank NA LOC) | | | 0.36 | | | | 12/01/2013 | | | | 100,000 | | | | 100,000 | |
Pennsylvania EDFA Series J1 (IDR, PNC Bank NA LOC) | | | 0.36 | | | | 05/01/2015 | | | | 300,000 | | | | 300,000 | |
Pennsylvania HEFA Association of Independent Colleges & University of Pennsylvania Finance Program Keystone College Project Series J2 (Education Revenue, PNC Bank NA LOC) | | | 0.17 | | | | 05/01/2027 | | | | 1,500,000 | | | | 1,500,000 | |
Pennsylvania HEFA St. Josephs University Project Series A
(Education Revenue, TD Bank NA LOC) | | | 0.16 | | | | 07/15/2036 | | | | 4,000,000 | | | | 4,000,000 | |
Pennsylvania HFA Series 83B (Housing Revenue, Bank of Tokyo-Mitsubishi SPA) | | | 0.18 | | | | 04/01/2035 | | | | 14,005,000 | | | | 14,005,000 | |
Philadelphia PA IDA 1100 Walnut Street Project (Health Revenue, PNC Bank NA LOC) | | | 0.30 | | | | 12/01/2014 | | | | 600,000 | | | | 600,000 | |
Philadelphia PA Subseries C-1 (Airport Revenue, TD Bank NA LOC) | | | 0.15 | | | | 06/15/2025 | | | | 12,945,000 | | | | 12,945,000 | |
RBC Municipal Products Incorporated PFOTER Series E-22 (Miscellaneous Revenue, Royal Bank of Canada LOC & LIQ) 144A | | | 0.15 | | | | 12/01/2038 | | | | 1,600,000 | | | | 1,600,000 | |
| | | | |
| | | | | | | | | | | | | | | 69,547,000 | |
| | | | | | | | | | | | | | | | |
| | | | |
Puerto Rico: 0.39% | | | | | | | | | | | | | | | | |
| | | | |
| Variable Rate Demand Notes§: 0.39% | | | | | | | | | | | | | | | | |
Puerto Rico Sales Tax Corporate Financing ROC RR-II-R-11778
(Tax Revenue, Citibank NA LIQ) 144A | | | 0.17 | | | | 08/01/2047 | | | | 4,875,000 | | | | 4,875,000 | |
Puerto Rico Sales Tax Finance Corporation Series 3033 (Tax Revenue, Morgan Stanley Bank LIQ) 144A | | | 0.17 | | | | 08/01/2050 | | | | 3,804,500 | | | | 3,804,500 | |
| | | | |
| | | | | | | | | | | | | | | 8,679,500 | |
| | | | | | | | | | | | | | | | |
| | | | |
Rhode Island: 0.20% | | | | | | | | | | | | | | | | |
| | | | |
| Variable Rate Demand Notes§: 0.20% | | | | | | | | | | | | | | | | |
Rhode Island HEFA Bryant University Project (Education Revenue,
TD Bank NA LOC) | | | 0.16 | | | | 06/01/2035 | | | | 4,500,000 | | | | 4,500,000 | |
| | | | | | | | | | | | | | | | |
| | | | |
South Carolina: 1.97% | | | | | | | | | | | | | | | | |
| | | | |
| Other Municipal Debt: 0.58% | | | | | | | | | | | | | | | | |
York County SC Electric Membership Corporation Project Series 00B-1 (Utilities Revenue, National Rural Utilities Cooperative Finance Corporation Insured) | | | 0.45 | | | | 09/04/2012 | | | | 5,200,000 | | | | 5,200,000 | |
The accompanying notes are an integral part of these financial statements.
| | | | | | |
| Portfolio of Investments—July 31, 2012 (Unaudited) | | Wells Fargo Advantage Municipal Cash Management Money Market Fund | | | 21 | |
| | | | | | | | | | | | | | | | |
| Security Name | | Interest Rate | | | Maturity Date | | | Principal | | | Value | |
| | | | | | | | | | | | | | | | |
| | | | |
| Other Municipal Debt (continued) | | | | | | | | | | | | | | | | |
York County SC Electric Membership Corporation Project Series 00B-2 (Utilities Revenue, National Rural Utilities Cooperative Finance Corporation Insured) | | | 0.45 | % | | | 09/04/2012 | | | $ | 6,700,000 | | | $ | 6,700,000 | |
York County SC Electric Membership Corporation Project Series 00B-3 (Utilities Revenue, National Rural Utilities Cooperative Finance Corporation Insured) | | | 0.45 | | | | 09/04/2012 | | | | 1,000,000 | | | | 1,000,000 | |
| | | | |
| | | | | | | | | | | | | | | 12,900,000 | |
| | | | | | | | | | | | | | | | |
| | | | |
| Variable Rate Demand Notes§: 1.39% | | | | | | | | | | | | | | | | |
Berkeley County SC Nucor Corporation Project (IDR) | | | 0.20 | | | | 09/01/2028 | | | | 24,000,000 | | | | 24,000,000 | |
South Carolina Housing Finance & Development Authority PFOTER Wyndham Pointe Apartments Project (Housing Revenue, FHLMC Insured & LIQ) | | | 0.39 | | | | 03/21/2019 | | | | 6,875,000 | | | | 6,875,000 | |
| | | | |
| | | | | | | | | | | | | | | 30,875,000 | |
| | | | | | | | | | | | | | | | |
| | | | |
| | | | | | | | | | | | | | | 43,775,000 | |
| | | | | | | | | | | | | | | | |
| | | | |
South Dakota: 0.34% | | | | | | | | | | | | | | | | |
| | | | |
| Variable Rate Demand Notes§: 0.34% | | | | | | | | | | | | | | | | |
Grant County SD Mill Valley LLC Project (Solid Waste Revenue, Farm Credit Services of America Insured) | | | 0.23 | | | | 07/01/2037 | | | | 1,600,000 | | | | 1,600,000 | |
South Dakota Housing Development Authority Homeownership Mortgage Series C (Housing Revenue, FHLB SPA) | | | 0.16 | | | | 05/01/2037 | | | | 2,000,000 | | | | 2,000,000 | |
South Dakota Housing Development Authority Homeownership Mortgage Series F (Housing Revenue, FHLB SPA) | | | 0.17 | | | | 05/01/2039 | | | | 4,000,000 | | | | 4,000,000 | |
| | | | |
| | | | | | | | | | | | | | | 7,600,000 | |
| | | | | | | | | | | | | | | | |
| | | | |
Tennessee: 0.64% | | | | | | | | | | | | | | | | |
| | | | |
| Other Municipal Debt: 0.09% | | | | | | | | | | | | | | | | |
Sevier County TN Public Building Authority Public Project Construction Notes Series C-1 (Miscellaneous Revenue) | | | 1.25 | | | | 04/01/2013 | | | | 2,000,000 | | | | 2,010,607 | |
| | | | | | | | | | | | | | | | |
| | | | |
| Variable Rate Demand Notes§: 0.55% | | | | | | | | | | | | | | | | |
Franklin County TN HEFA Board University of the South Project
Series 1998B (Education Revenue) | | | 0.19 | | | | 09/01/2018 | | | | 6,430,000 | | | | 6,430,000 | |
Nashville & Davidson Counties TN HEFA Lipscomb University Project (Education Revenue, FHLB LOC) | | | 0.16 | | | | 11/01/2028 | | | | 1,100,000 | | | | 1,100,000 | |
Sevier County TN Public Building Authority Public Improvement Project Series B-1 (Water & Sewer Revenue, Branch Banking & Trust LOC) | | | 0.17 | | | | 06/01/2035 | | | | 4,635,000 | | | | 4,635,000 | |
| | | | |
| | | | | | | | | | | | | | | 12,165,000 | |
| | | | | | | | | | | | | | | | |
| | | | |
| | | | | | | | | | | | | | | 14,175,607 | |
| | | | | | | | | | | | | | | | |
| | | | |
Texas: 15.22% | | | | | | | | | | | | | | | | |
| | | | |
| Variable Rate Demand Notes§: 15.22% | | | | | | | | | | | | | | | | |
Calhoun County TX Formosa Plastics Corporation Project (Solid Waste Revenue, JPMorgan Chase Bank LOC) | | | 0.28 | | | | 05/01/2031 | | | | 12,500,000 | | | | 12,500,000 | |
Clipper Tax-Exempt Certified Trust COP Series 2007-23
(Miscellaneous Revenue, State Street Bank & Trust Company LIQ) | | | 0.20 | | | | 10/01/2018 | | | | 1,460,000 | | | | 1,460,000 | |
The accompanying notes are an integral part of these financial statements.
| | | | |
| 22 | | Wells Fargo Advantage Municipal Cash Management Money Market Fund | | Portfolio of Investments—July 31, 2012 (Unaudited) |
| | | | | | | | | | | | | | | | |
| Security Name | | Interest Rate | | | Maturity Date | | | Principal | | | Value | |
| | | | | | | | | | | | | | | | |
| | | | |
| Variable Rate Demand Notes§ (continued) | | | | | | | | | | | | | | | | |
First Rio Grande Regional Water Authority EDA Rio Grande Valley Sugar Growers Incorporated Project (IDR, CoBank ACB LOC) | | | 0.16 | % | | | 03/01/2032 | | | $ | 2,900,000 | | | $ | 2,900,000 | |
Harris County TX Cultural Education Facilities Finance Corporation Hermann Health Series D3 (Education Revenue, Northern Trust Company LOC) | | | 0.15 | | | | 06/01/2029 | | | | 2,000,000 | | | | 2,000,000 | |
Harris County TX Industrial Development Corporation Deer Park Convertible (Resource Recovery Revenue) | | | 0.20 | | | | 03/01/2023 | | | | 10,800,000 | | | | 10,800,000 | |
Houston TX Housing Finance Corporation PFOTER Kensington Place Apartments Series 2004 (Housing Revenue, FHLMC Insured & LIQ) | | | 0.35 | | | | 02/01/2048 | | | | 11,980,000 | | | | 11,980,000 | |
Houston TX Housing Finance Corporation PFOTER Sterlingshire Apartments Project Series 2003 A-1 (Miscellaneous Revenue, FHLMC Insured & LIQ) | | | 0.39 | | | | 04/01/2040 | | | | 2,870,000 | | | | 2,870,000 | |
Jewett TX Economic Development Corporation Nucor Corporation Project (IDR) | | | 0.20 | | | | 08/01/2038 | | | | 6,200,000 | | | | 6,200,000 | |
Nueces County TX Port Corpus Christi Authority Solid Waste Disposal Flint Hills Resources Project Series 2006 (Resource Recovery Revenue, Flint Hills Resources Guaranteed) | | | 0.22 | | | | 01/01/2030 | | | | 18,500,000 | | | | 18,500,000 | |
Nueces County TX Port Corpus Christi Authority Solid Waste Disposal Flint Hills Resources Project Series 2007 (Resource Recovery Revenue, Flint Hills Resources Guaranteed) | | | 0.22 | | | | 01/01/2032 | | | | 13,200,000 | | | | 13,200,000 | |
Port Arthur TX Navigation District Environmental Facilities BASF Corporation Project (IDR) | | | 0.31 | | | | 05/01/2033 | | | | 12,900,000 | | | | 12,900,000 | |
Port Arthur TX Navigation District Environmental Facilities BASF Corporation Project Class A (IDR) | | | 0.31 | | | | 04/01/2037 | | | | 15,000,000 | | | | 15,000,000 | |
Port Arthur TX Navigation District Environmental Facilities Motiva Enterprises LLC Project Series 2002 (IDR) | | | 0.19 | | | | 12/01/2027 | | | | 22,035,000 | | | | 22,035,000 | |
Port Arthur TX Navigation District Environmental Facilities Motiva Enterprises LLC Project Series C (Resource Recovery Revenue) | | | 0.15 | | | | 12/01/2039 | | | | 9,800,000 | | | | 9,800,000 | |
Port Arthur TX Navigation District Industrial Development Corporation Total Petrochemicals Incorporated Project (Resource Recovery Revenue) | | | 0.22 | | | | 03/01/2039 | | | | 10,000,000 | | | | 10,000,000 | |
Port Arthur TX Navigation District Industrial Development Corporation Total Petrochemicals Incorporated Project Series 2012 (IDR) | | | 0.22 | | | | 03/01/2042 | | | | 46,500,000 | | | | 46,500,000 | |
Port Corpus Christi TX Solid Waste Disposal Flint Hills Resources Project Series 2005 (Resource Recovery Revenue) | | | 0.22 | | | | 01/01/2030 | | | | 15,000,000 | | | | 15,000,000 | |
Port Corpus Christi TX Solid Waste Disposal Flint Hills Resources Project Series A (Resource Recovery Revenue) | | | 0.22 | | | | 04/01/2028 | | | | 17,500,000 | | | | 17,500,000 | |
San Antonio TX Education Facilities Corporation St. Anthony Catholic High School Series A (Education Revenue, JPMorgan Chase & Company LOC) | | | 0.25 | | | | 12/01/2023 | | | | 1,540,000 | | | | 1,540,000 | |
San Antonio TX PFOTER Series 4590 (GO, FHLMC Insured & LIQ) | | | 0.35 | | | | 07/01/2048 | | | | 5,740,000 | | | | 5,740,000 | |
Texas Department of Housing & Community Affairs SFHR Series A (Housing Revenue, GNMA/FNMA Insured, Texas State Comptroller of Public Accounts SPA) | | | 0.20 | | | | 09/01/2038 | | | | 43,675,000 | | | | 43,675,000 | |
Texas Municipal Gas Acquisition & Supply Corporation Series 2848 (Miscellaneous Revenue, Morgan Stanley Bank LIQ) | | | 0.45 | | | | 12/15/2026 | | | | 19,250,531 | | | | 19,250,531 | |
Texas PFOTER Series O-5 (Tax Revenue, Royal Bank of Canada LIQ) 144A | | | 0.15 | | | | 11/01/2041 | | | | 5,000,000 | | | | 5,000,000 | |
Texas Series A (Miscellaneous Revenue, State Street Bank & Trust Company LIQ) | | | 0.15 | | | | 12/01/2042 | | | | 4,000,000 | | | | 4,000,000 | |
Texas TRAN JPMorgan Chase PUTTER Trust Series 3964 (Miscellaneous Revenue, JPMorgan Chase & Company LIQ) 144A | | | 0.18 | | | | 08/30/2012 | | | | 27,900,000 | | | | 27,900,000 | |
| | | | |
| | | | | | | | | | | | | | | 338,250,531 | |
| | | | | | | | | | | | | | | | |
The accompanying notes are an integral part of these financial statements.
| | | | | | |
| Portfolio of Investments—July 31, 2012 (Unaudited) | | Wells Fargo Advantage Municipal Cash Management Money Market Fund | | | 23 | |
| | | | | | | | | | | | | | | | |
| Security Name | | Interest Rate | | | Maturity Date | | | Principal | | | Value | |
| | | | | | | | | | | | | | | | |
| | | | |
Vermont: 0.44% | | | | | | | | | | | | | | | | |
| | | | |
| Variable Rate Demand Notes§: 0.44% | | | | | | | | | | | | | | | | |
Vermont HFA Series A (Housing Revenue, Financial Security Assurance Incorporated Insured, Bank of New York Mellon SPA) | | | 0.22 | % | | | 05/01/2037 | | | $ | 4,200,000 | | | $ | 4,200,000 | |
Vermont HFA Series C (Housing Revenue, Financial Security Assurance Incorporated Insured, Bank of New York Mellon SPA) | | | 0.22 | | | | 11/01/2037 | | | | 5,500,000 | | | | 5,500,000 | |
| | | | |
| | | | | | | | | | | | | | | 9,700,000 | |
| | | | | | | | | | | | | | | | |
| | | | |
Virginia: 2.96% | | | | | | | | | | | | | | | | |
| | | | |
| Variable Rate Demand Notes§: 2.96% | | | | | | | | | | | | | | | | |
Alexandria VA Redevelopment & Housing PFOTER Series C-2 (Miscellaneous Revenue, Royal Bank of Canada LOC & SPA) | | | 0.20 | | | | 01/01/2014 | | | | 16,670,000 | | | | 16,670,000 | |
Campbell County VA IDA Georgia Pacific Corporation Project (IDR, U.S. Bank NA LOC) | | | 0.18 | | | | 12/01/2019 | | | | 6,500,000 | | | | 6,500,000 | |
Chesterfield County VA IDA Super Radiator Coils Project Series A (IDR, Marshall & Ilsley Bank LOC) | | | 0.27 | | | | 04/01/2026 | | | | 3,100,000 | | | | 3,100,000 | |
Fairfax County VA IDA Inova Health Project Series A-1 (Miscellaneous Revenue) (i) | | | 0.27 | | | | 05/15/2039 | | | | 7,000,000 | | | | 7,000,000 | |
FHLMC Series M020 Class A (Housing Revenue, FHLMC Insured) | | | 0.20 | | | | 11/15/2036 | | | | 24,489,000 | | | | 24,489,000 | |
Norfolk VA EDA Sentra Healthcare Project (Health Revenue) (i) | | | 0.27 | | | | 11/01/2034 | | | | 5,905,000 | | | | 5,905,000 | |
Virginia Commonwealth University Health System Authority Series B (Health Revenue, Branch Banking & Trust LOC) | | | 0.15 | | | | 07/01/2037 | | | | 2,120,000 | | | | 2,120,000 | |
| | | | |
| | | | | | | | | | | | | | | 65,784,000 | |
| | | | | | | | | | | | | | | | |
| | | | |
Washington: 0.64% | | | | | | | | | | | | | | | | |
| | | | |
| Variable Rate Demand Note§: 0.64% | | | | | | | | | | | | | | | | |
King County WA Series 3090 (Water & Sewer Revenue, FSA Insured, Morgan Stanley Bank LIQ) 144A | | | 0.23 | | | | 01/01/2039 | | | | 14,190,000 | | | | 14,190,000 | |
| | | | | | | | | | | | | | | | |
| | | | |
West Virginia: 1.23% | | | | | | | | | | | | | | | | |
| | | | |
| Variable Rate Demand Notes§: 1.23% | | | | | | | | | | | | | | | | |
West Virginia EDA Appalachian Power Company Series B (Utilities Revenue, Mizuho Corporate Bank LOC) | | | 0.20 | | | | 02/01/2036 | | | | 10,000,000 | | | | 10,000,000 | |
West Virginia EDA Collins Hardwood Company LLC (Miscellaneous Revenue, CoBank ACB LOC) | | | 0.23 | | | | 10/01/2017 | | | | 4,000,000 | | | | 4,000,000 | |
West Virginia EDA Collins Hardwood Company LLC (IDR, American AgCredit LOC) | | | 0.23 | | | | 10/01/2031 | | | | 2,700,000 | | | | 2,700,000 | |
West Virginia EDA Morgantown Energy (IDR, Union Bank NA LOC) | | | 0.18 | | | | 04/01/2027 | | | | 10,600,000 | | | | 10,600,000 | |
| | | | |
| | | | | | | | | | | | | | | 27,300,000 | |
| | | | | | | | | | | | | | | | |
| | | | |
Wisconsin: 3.70% | | | | | | | | | | | | | | | | |
| | | | |
| Variable Rate Demand Notes§: 3.70% | | | | | | | | | | | | | | | | |
Menomonee Falls WI Mero Structures Incorporated Project (IDR, U.S. Bank NA LOC) | | | 0.20 | | | | 09/01/2021 | | | | 1,430,000 | | | | 1,430,000 | |
West Bend WI Bestech Tool Corporation Project Series A (IDR, U.S. Bank NA LOC) | | | 1.46 | | | | 09/01/2019 | | | | 720,000 | | | | 720,000 | |
Wisconsin HEFA Hospital Sisters Services Incorporation Project Series B-2 (Hospital Revenue) | | | 0.40 | | | | 03/15/2036 | | | | 15,000,000 | | | | 15,000,000 | |
Wisconsin Housing & EDA AMT Series A (Housing Revenue, GO of Authority Insured, FHLB LIQ) | | | 0.16 | | | | 05/01/2055 | | | | 5,000,000 | | | | 5,000,000 | |
The accompanying notes are an integral part of these financial statements.
| | | | |
| 24 | | Wells Fargo Advantage Municipal Cash Management Money Market Fund | | Portfolio of Investments—July 31, 2012 (Unaudited) |
| | | | | | | | | | | | | | | | |
| Security Name | | Interest Rate | | | Maturity Date | | | Principal | | | Value | |
| | | | | | | | | | | | | | | | |
| | | | |
| Variable Rate Demand Notes§ (continued) | | | | | | | | | | | | | | | | |
Wisconsin Housing & EDA AMT Series A (Housing Revenue, GO of Authority Insured, FHLB SPA) | | | 0.17 | % | | | 09/01/2022 | | | $ | 27,020,000 | | | $ | 27,020,000 | |
Wisconsin Housing & EDA AMT Series A (Housing Revenue, GO of Authority Insured) | | | 0.17 | | | | 03/01/2035 | | | | 13,845,000 | | | | 13,845,000 | |
Wisconsin Housing & EDA Series B (Housing Revenue, GO of Authority Insured, FHLB LIQ) | | | 0.16 | | | | 05/01/2055 | | | | 4,440,000 | | | | 4,440,000 | |
Wisconsin Housing & EDA Series B (Housing Revenue, GO of Authority Insured) | | | 0.27 | | | | 05/01/2034 | | | | 1,535,000 | | | | 1,535,000 | |
Wisconsin Housing & EDA Series C (Housing Revenue, GO of Authority Insured) | | | 0.18 | | | | 09/01/2033 | | | | 10,525,000 | | | | 10,525,000 | |
Wisconsin PFA Midwestern Disaster Area Series A (IDR, Farm Credit Services of America Insured) | | | 0.16 | | | | 09/01/2036 | | | | 2,800,000 | | | | 2,800,000 | |
| | | | |
| | | | | | | | | | | | | | | 82,315,000 | |
| | | | | | | | | | | | | | | | |
| | | | |
Total Municipal Obligations (Cost $2,224,051,439) | | | | | | | | | | | | | | | 2,224,051,439 | |
| | | | | | | | | | | | | | | | |
| | | | | | | | |
| Total Investments in Securities | | | | | | | | |
| (Cost $2,224,051,439) * | | | 100.10 | % | | | 2,224,051,439 | |
Other Assets and Liabilities, Net | | | (0.10 | ) | | | (2,131,439 | ) |
| | | | | | | | |
| Total Net Assets | | | 100.00 | % | | $ | 2,221,920,000 | |
| | | | | | | | |
| § | These securities are subject to a demand feature which reduces the effective maturity. |
| 144A | Security that may be resold to “qualified institutional buyers” under Rule 144A or security offered pursuant to Section 4(2) of the Securities Act of 1933, as amended. |
| * | Cost for federal income tax purposes is substantially the same as for financial reporting purposes. |
The accompanying notes are an integral part of these financial statements.
| | | | | | |
| Statement of Assets and Liabilities—July 31, 2012 (Unaudited) | | Wells Fargo Advantage Municipal Cash Management Money Market Fund | | | 25 | |
| | | | |
| | | | |
| |
Assets | | | | |
Investments in unaffiliated securities, at amortized cost | | $ | 2,224,051,439 | |
Receivable for investments sold | | | 19,171,002 | |
Receivable for interest | | | 884,355 | |
Prepaid expenses and other assets | | | 139,807 | |
| | | | |
Total assets | | | 2,244,246,603 | |
| | | | |
| |
Liabilities | | | | |
Dividends payable | | | 36,939 | |
Payable for investments purchased | | | 21,246,460 | |
Payable for Fund shares redeemed | | | 115,447 | |
Due to custodian bank | | | 11,720 | |
Advisory fee payable | | | 26,702 | |
Due to other related parties | | | 283,343 | |
Accrued expenses and other liabilities | | | 605,992 | |
| | | | |
Total liabilities | | | 22,326,603 | |
| | | | |
Total net assets | | $ | 2,221,920,000 | |
| | | | |
| |
NET ASSETS CONSIST OF | | | | |
Paid-in capital | | $ | 2,221,476,964 | |
Accumulated net realized gains on investments | | | 443,036 | |
| | | | |
Total net assets | | $ | 2,221,920,000 | |
| | | | |
| |
COMPUTATION OF NET ASSET VALUE PER SHARE1 | | | | |
Net assets – Administrator Class | | $ | 3,533,309 | |
Shares outstanding – Administrator Class | | | 3,532,758 | |
Net asset value per share – Administrator Class | | | $1.00 | |
Net assets – Institutional Class | | $ | 2,048,177,955 | |
Shares outstanding – Institutional Class | | | 2,047,735,310 | |
Net asset value per share – Institutional Class | | | $1.00 | |
Net assets – Service Class | | $ | 170,208,736 | |
Shares outstanding – Service Class | | | 170,205,888 | |
Net asset value per share – Service Class | | | $1.00 | |
| 1. | The Fund has an unlimited number of authorized shares. |
The accompanying notes are an integral part of these financial statements.
| | | | |
| 26 | | Wells Fargo Advantage Municipal Cash Management Money Market Fund | | Statement of Operations—Six Months Ended July 31, 2012 (Unaudited) |
| | | | |
| | | | |
| |
Investment income | | | | |
Interest | | $ | 2,953,738 | |
| | | | |
| |
Expenses | | | | |
Advisory fee | | | 1,211,024 | |
Administration fees | | | | |
Fund level | | | 605,512 | |
Administrator Class | | | 1,756 | |
Institutional Class | | | 887,622 | |
Service Class | | | 119,710 | |
Shareholder servicing fees | | | | |
Administrator Class | | | 1,756 | |
Service Class | | | 194,783 | |
Custody and accounting fees | | | 46,967 | |
Professional fees | | | 4,534 | |
Registration fees | | | 49,770 | |
Shareholder report expenses | | | 1,721 | |
Trustees’ fees and expenses | | | 719 | |
Other fees and expenses | | | 23,222 | |
| | | | |
Total expenses | | | 3,149,096 | |
Less: Fee waivers and/or expense reimbursements | | | (721,471 | ) |
| | | | |
Net expenses | | | 2,427,625 | |
| | | | |
Net investment income | | | 526,113 | |
| | | | |
Net realized gains on investments | | | 249,319 | |
| | | | |
Net increase in net assets resulting from operations | | $ | 775,432 | |
| | | | |
The accompanying notes are an integral part of these financial statements.
| | | | | | |
| Statement of Changes in Net Assets | | Wells Fargo Advantage Municipal Cash Management Money Market Fund | | | 27 | |
| | | | | | | | | | | | | | | | |
| | | Six Months Ended
July 31, 2012
(Unaudited) | | | Year Ended
January 31, 2012 | |
| | | | |
Operations | | | | | | | | | | | | | | | | |
Net investment income | | | | | | $ | 526,113 | | | | | | | $ | 1,774,418 | |
Net realized gains on investments | | | | | | | 249,319 | | | | | | | | 337,817 | |
| | | | | | | | | | | | | | | | |
Net increase in net assets resulting from operations | | | | | | | 775,432 | | | | | | | | 2,112,235 | |
| | | | | | | | | | | | | | | | |
| | | | |
Distributions to shareholders from | | | | | | | | | | | | | | | | |
Net investment income | | | | | | | | | | | | | | | | |
Administrator Class | | | | | | | (204 | ) | | | | | | | (723 | ) |
Institutional Class | | | | | | | (515,905 | ) | | | | | | | (1,827,427 | ) |
Service Class | | | | | | | (10,004 | ) | | | | | | | (29,618 | ) |
| | | | | | | | | | | | | | | | |
Total distributions to shareholders | | | | | | | (526,113 | ) | | | | | | | (1,857,768 | ) |
| | | | | | | | | | | | | | | | |
| | | | |
Capital share transactions | | | Shares | | | | | | | | Shares | | | | | |
Proceeds from shares sold | | | | | | | | | | | | | | | | |
Institutional Class | | | 3,668,968,956 | | | | 3,668,968,956 | | | | 9,313,833,219 | | | | 9,313,833,219 | |
Service Class | | | 235,332,146 | | | | 235,332,146 | | | | 1,004,481,308 | | | | 1,004,481,308 | |
| | | | | | | | | | | | | | | | |
| | | | | | | 3,904,301,102 | | | | | | | | 10,318,314,527 | |
| | | | | | | | | | | | | | | | |
Reinvestment of distributions | | | | | | | | | | | | | | | | |
Administrator Class | | | 204 | | | | 204 | | | | 717 | | | | 717 | |
Institutional Class | | | 118,281 | | | | 118,281 | | | | 560,947 | | | | 560,947 | |
Service Class | | | 4,455 | | | | 4,455 | | | | 8,327 | | | | 8,327 | |
| | | | | | | | | | | | | | | | |
| | | | | | | 122,940 | | | | | | | | 569,991 | |
| | | | | | | | | | | | | | | | |
Payment for shares redeemed | | | | | | | | | | | | | | | | |
Administrator Class | | | 0 | | | | 0 | | | | (6,094,977 | ) | | | (6,094,977 | ) |
Institutional Class | | | (3,958,914,527 | ) | | | (3,958,914,527 | ) | | | (11,092,077,575 | ) | | | (11,092,077,575 | ) |
Service Class | | | (278,529,252 | ) | | | (278,529,252 | ) | | | (1,103,766,077 | ) | | | (1,103,766,077 | ) |
| | | | | | | | | | | | | | | | |
| | | | | | | (4,237,443,779 | ) | | | | | | | (12,201,938,629 | ) |
| | | | | | | | | | | | | | | | |
Net decrease in net assets resulting from capital share transactions | | | | | | | (333,019,737 | ) | | | | | | | (1,883,054,111 | ) |
| | | | | | | | | | | | | | | | |
Total decrease in net assets | | | | | | | (332,770,418 | ) | | | | | | | (1,882,799,644 | ) |
| | | | | | | | | | | | | | | | |
| | | | |
Net assets | | | | | | | | | | | | | | | | |
Beginning of period | | | | | | | 2,554,690,418 | | | | | | | | 4,437,490,062 | |
| | | | | | | | | | | | | | | | |
End of period | | | | | | $ | 2,221,920,000 | | | | | | | $ | 2,554,690,418 | |
| | | | | | | | | | | | | | | | |
Undistributed net investment income | | | | | | $ | 0 | | | | | | | $ | 0 | |
| | | | | | | | | | | | | | | | |
The accompanying notes are an integral part of these financial statements.
| | | | |
| 28 | | Wells Fargo Advantage Municipal Cash Management Money Market Fund | | Financial Highlights |
(For a share outstanding throughout each period)
| | | | | | | | | | | | |
| | | Six Months Ended July 31, 2012 (Unaudited) | | | Year Ended January 31, | |
| Administrator Class | | | 2012 | | | 20111 | |
Net asset value, beginning of period | | $ | 1.00 | | | $ | 1.00 | | | $ | 1.00 | |
Net investment income | | | 0.00 | 2 | | | 0.00 | 2 | | | 0.00 | 2 |
Net realized gains on investments | | | 0.00 | 2 | | | 0.00 | 2 | | | 0.00 | 2 |
| | | | | | | | | | | | |
Total from investment operations | | | 0.00 | 2 | | | 0.00 | 2 | | | 0.00 | 2 |
Distribution to shareholders from | | | | | | | | | | | | |
Net investment income | | | (0.00 | )2 | | | (0.00 | )2 | | | (0.00 | )2 |
Net asset value, end of period | | $ | 1.00 | | | $ | 1.00 | | | $ | 1.00 | |
Total return3 | | | 0.01 | % | | | 0.02 | % | | | 0.03 | % |
Ratios to average net assets (annualized) | | | | | | | | | | | | |
Gross expenses | | | 0.36 | % | | | 0.36 | % | | | 0.38 | % |
Net expenses | | | 0.23 | % | | | 0.24 | % | | | 0.30 | % |
Net investment income | | | 0.01 | % | | | 0.01 | % | | | 0.07 | % |
Supplemental data | | | | | | | | | | | | |
Net assets, end of period (000’s omitted) | | | $3,533 | | | | $3,533 | | | | $9,627 | |
| 1. | For the period from July 9, 2010 (commencement of class operations) to January 31, 2011 |
| 2. | Amount is less than $0.005. |
| 3. | Returns for periods of less than one year are not annualized. |
The accompanying notes are an integral part of these financial statements.
| | | | | | |
| Financial Highlights | | Wells Fargo Advantage Municipal Cash Management Money Market Fund | | | 29 | |
(For a share outstanding throughout each period)
| | | | | | | | | | | | | | | | | | | | | | | | | | | | |
| | | Six Months Ended July 31, 2012
(Unaudited) | | | Year Ended January 31, | | | Year Ended February 28, | |
| Institutional Class | | | 2012 | | | 20111,2 | | | 20101 | | | 20091 | | | 20081,3 | | | 20071 | |
Net asset value, beginning of period | | $ | 1.00 | | | $ | 1.00 | | | $ | 1.00 | | | $ | 1.00 | | | $ | 1.00 | | | $ | 1.00 | | | $ | 1.00 | |
Net investment income | | | 0.00 | 4 | | | 0.00 | 4 | | | 0.00 | 4 | | | 0.00 | 4 | | | 0.02 | | | | 0.03 | | | | 0.03 | |
Net realized gains (losses) on investments | | | 0.00 | 4 | | | 0.00 | 4 | | | 0.00 | 4 | | | (0.00 | )4 | | | 0.00 | | | | 0.00 | | | | 0.00 | |
| | | | | | | | | | | | | | | | | | | | | | | | | | | | |
Total from investment operations | | | 0.00 | 4 | | | 0.00 | 4 | | | 0.00 | 4 | | | 0.00 | 4 | | | 0.02 | | | | 0.03 | | | | 0.03 | |
Distributions to shareholders from | | | | | | | | | | | | | | | | | | | | | | | | | | | | |
Net investment income | | | (0.00 | )4 | | | (0.00 | )4 | | | (0.00 | )4 | | | (0.00 | )4 | | | (0.02 | ) | | | (0.03 | ) | | | (0.03 | ) |
Net asset value, end of period | | $ | 1.00 | | | $ | 1.00 | | | $ | 1.00 | | | $ | 1.00 | | | $ | 1.00 | | | $ | 1.00 | | | $ | 1.00 | |
Total return5 | | | 0.02 | % | | | 0.05 | % | | | 0.16 | % | | | 0.40 | % | | | 2.20 | % | | | 3.49 | % | | | 3.47 | % |
Ratios to average net assets (annualized) | | | | | | | | | | | | | | | | | | | | | | | | | | | | |
Gross expenses | | | 0.24 | % | | | 0.24 | % | | | 0.24 | % | | | 0.23 | % | | | 0.22 | % | | | 0.21 | % | | | 0.22 | % |
Net expenses | | | 0.20 | % | | | 0.19 | % | | | 0.21 | % | | | 0.23 | % | | | 0.22 | % | | | 0.21 | % | | | 0.22 | % |
Net investment income | | | 0.05 | % | | | 0.06 | % | | | 0.18 | % | | | 0.40 | % | | | 2.10 | % | | | 3.44 | % | | | 3.40 | % |
Supplemental data | | | | | | | | | | | | | | | | | | | | | | | | | | | | |
Net assets, end of period (000’s omitted) | | | $2,048,178 | | | | $2,337,778 | | | | $4,115,192 | | | | $4,580,024 | | | | $6,154,387 | | | | $5,671,591 | | | | $7,122,239 | |
| 1. | After the close of business on July 9, 2010, the Fund acquired the net assets of Evergreen Institutional Municipal Money Market Fund which became the accounting and performance survivor in the transaction. The information for the periods prior to July 12, 2010 is that of Class I of Evergreen Institutional Municipal Money Market Fund. |
| 2. | For the eleven months ended January 31, 2011. The Fund changed its fiscal year end from February 28 to January 31, effective January 31, 2011. |
| 4. | Amount is less than $0.005. |
| 5. | Returns for periods of less than one year are not annualized. |
The accompanying notes are an integral part of these financial statements.
| | | | |
| 30 | | Wells Fargo Advantage Municipal Cash Management Money Market Fund | | Financial Highlights |
(For a share outstanding throughout each period)
| | | | | | | | | | | | | | | | | | | | | | | | | | | | |
| | | Six Months Ended July 31, 2012
(Unaudited) | | | Year Ended January 31, | | | Year Ended February 28, | |
| Service Class | | | 2012 | | | 20111,2 | | | 20101 | | | 20091 | | | 20081,3 | | | 20071 | |
Net asset value, beginning of period | | $ | 1.00 | | | $ | 1.00 | | | $ | 1.00 | | | $ | 1.00 | | | $ | 1.00 | | | $ | 1.00 | | | $ | 1.00 | |
Net investment income (loss) | | | 0.00 | 4 | | | (0.00 | ) | | | 0.00 | 4 | | | 0.00 | 4 | | | 0.02 | | | | 0.03 | | | | 0.03 | |
Net realized gains (losses) on investments | | | 0.00 | 4 | | | 0.00 | 4 | | | 0.00 | 4 | | | (0.00 | )4 | | | 0.00 | | | | 0.00 | | | | 0.00 | |
| | | | | | | | | | | | | | | | | | | | | | | | | | | | |
Total from investment operations | | | 0.00 | 4 | | | 0.00 | 4 | | | 0.00 | 4 | | | 0.00 | 4 | | | 0.02 | | | | 0.03 | | | | 0.03 | |
Distributions to shareholders from | | | | | | | | | | | | | | | | | | | | | | | | | | | | |
Net investment income | | | (0.00 | )4 | | | (0.00 | )4 | | | (0.00 | )4 | | | (0.00 | )4 | | | (0.02 | ) | | | (0.03 | ) | | | (0.03 | ) |
Net asset value, end of period | | $ | 1.00 | | | $ | 1.00 | | | $ | 1.00 | | | $ | 1.00 | | | $ | 1.00 | | | $ | 1.00 | | | $ | 1.00 | |
Total return5 | | | 0.00 | % | | | 0.01 | % | | | 0.01 | % | | | 0.20 | % | | | 1.95 | % | | | 3.23 | % | | | 3.21 | % |
Ratios to average net assets (annualized) | | | | | | | | | | | | | | | | | | | | | | | | | | | | |
Gross expenses | | | 0.48 | % | | | 0.50 | % | | | 0.50 | % | | | 0.48 | % | | | 0.47 | % | | | 0.46 | % | | | 0.47 | % |
Net expenses | | | 0.24 | % | | | 0.25 | % | | | 0.37 | % | | | 0.44 | % | | | 0.47 | % | | | 0.46 | % | | | 0.47 | % |
Net investment income (loss) | | | 0.01 | % | | | (0.01 | )% | | | 0.01 | % | | | 0.21 | % | | | 1.85 | % | | | 3.16 | % | | | 3.15 | % |
Supplemental data | | | | | | | | | | | | | | | | | | | | | | | | | | | | |
Net assets, end of period (000’s omitted) | | | $170,209 | | | | $213,380 | | | | $312,671 | | | | $564,325 | | | | $830,779 | | | | $732,031 | | | | $676,614 | |
| 1. | After the close of business on July 9, 2010, the Fund acquired the net assets of Evergreen Institutional Municipal Money Market Fund which became the accounting and performance survivor in the transaction. The information for the periods prior to July 12, 2010 is that of Class IS of Evergreen Institutional Municipal Money Market Fund. |
| 2. | For the eleven months ended January 31, 2011. The Fund changed its fiscal year end from February 28 to January 31, effective January 31, 2011. |
| 4. | Amount is less than $0.005. |
| 5. | Returns for periods of less than one year are not annualized. |
The accompanying notes are an integral part of these financial statements.
| | | | | | |
| Notes to Financial Statements (Unaudited) | | Wells Fargo Advantage Municipal Cash Management Money Market Fund | | | 31 | |
1. ORGANIZATION
Wells Fargo Funds Trust (the “Trust”), a Delaware statutory trust organized on March 10, 1999, is an open-end management investment company registered under the Investment Company Act of 1940, as amended (the “1940 Act”). These financial statements report on Wells Fargo Advantage Municipal Cash Management Money Market Fund (the “Fund”) which is a diversified series of the Trust.
2. SIGNIFICANT ACCOUNTING POLICIES
The following significant accounting policies, which are consistently followed in the preparation of the financial statements of the Fund, are in conformity with U.S. generally accepted accounting principles which require management to make estimates and assumptions that affect the reported amounts of assets and liabilities, disclosure of contingent assets and liabilities at the date of the financial statements, and the reported amounts of revenues and expenses during the reporting period. Actual results could differ from those estimates.
Securities valuation
As permitted under Rule 2a-7 of the 1940 Act, portfolio securities are valued at amortized cost, which approximates fair value. The amortized cost method involves valuing a security at its cost, plus accretion of discount or minus amortization of premium over the period until maturity.
Investments which are not valued using the method discussed above are valued at their fair value, as determined by procedures established in good faith and approved by the Board of Trustees. The Board of Trustees has established a Valuation Committee comprised of the Trustees and has delegated to it the authority to take any actions regarding the valuation of portfolio securities that the Valuation Committee deems necessary in determining the fair value of portfolio securities, unless the responsibility has been delegated to the Management Valuation Team of Wells Fargo Funds Management, LLC (“Funds Management”). The Board of Trustees retains the authority to make or ratify any valuation decisions or approve any changes to the Valuation Procedures as it deems appropriate. On a quarterly basis, the Board of Trustees considers for ratification any valuation actions taken by the Valuation Committee or the Management Valuation Team.
Valuations of fair valued prices are compared to the next actual sales price when available, or other appropriate market information to assess the continued appropriateness of the fair valuation methodology used. The securities are fair valued on a day-to-day basis, taking into consideration changes to appropriate market information and any significant changes to the input factors considered in the valuation process until there is a readily available price provided on the exchange or by an independent pricing service. Valuations received from an independent pricing service or broker quotes are periodically validated by comparisons to most recent trades and valuations provided by other independent pricing services in addition to the review of prices by the adviser and/or sub-adviser. Unobservable inputs used in determining fair valuations are identified based on the type of security, taking into consideration factors utilized by market participants in valuing the investment, knowledge about the issuer and the current market environment.
Security transactions and income recognition
Securities transactions are recorded on a trade date basis. Realized gains or losses are reported on the basis of identified cost of securities delivered.
Interest income is accrued daily and bond discounts are accreted and premiums are amortized daily based on the effective interest method. To the extent debt obligations are placed on non-accrual status, any related interest income may be reduced by writing off interest receivables when the collection of all or a portion of interest has become doubtful based on consistently applied procedures. If the issuer subsequently resumes interest payments or when the collectability of interest is reasonably assured, the debt obligation is removed from non-accrual status.
Distributions to shareholders
Distributions to shareholders from net investment income are accrued daily and paid monthly. Distributions from net realized gains, if any, are recorded on the ex-dividend date. Such distributions are determined in conformity with income tax regulations, which may differ from generally accepted accounting principles.
Federal and other taxes
The Fund intends to continue to qualify as a regulated investment company by distributing substantially all of its investment company taxable and tax-exempt income and any net realized capital gains (after reduction for capital loss
| | | | |
| 32 | | Wells Fargo Advantage Municipal Cash Management Money Market Fund | | Notes to Financial Statements (Unaudited) |
carryforwards) sufficient to relieve it from all, or substantially all, federal income taxes. Accordingly, no provision for federal income taxes was required.
The Fund’s income and federal excise tax returns and all financial records supporting those returns for the prior three fiscal years are subject to examination by the federal and Delaware revenue authorities. Management has analyzed the Fund’s tax positions taken on federal, state, and foreign tax returns for all open tax years and does not believe that there are any uncertain tax positions that require recognition of a tax liability.
Class allocations
The separate classes of shares offered by the Fund differ principally in shareholder servicing and administration fees. Shareholders of each class bear certain expenses that pertain to that particular class. All shareholders bear the common expenses of the Fund, earn income from the portfolio, and are allocated any unrealized gains and losses pro rata based on the average daily net assets of each class, without distinction between share classes. Dividends are determined separately for each class based on income and expenses allocable to each class. Realized gains and losses are allocated to each class pro rata based upon the net assets of each class on the date realized. Differences in per share dividend rates generally result from the relative weightings of pro rata income and realized gain allocations and from differences in separate class expenses, including shareholder servicing and administration fees.
3. FAIR VALUATION MEASUREMENTS
Fair value measurements of investments are determined within a framework that has established a fair value hierarchy based upon the various data inputs utilized in determining the value of the Fund’s investments. The three-level hierarchy gives the highest priority to unadjusted quoted prices in active markets for identical assets or liabilities (Level 1) and the lowest priority to significant unobservable inputs (Level 3). The Fund’s investments are classified within the fair value hierarchy based on the lowest level of input that is significant to the fair value measurement. The inputs are summarized into three broad levels as follows:
| n | | Level 1 – quoted prices in active markets for identical securities |
| n | | Level 2 – other significant observable inputs (including quoted prices for similar securities, interest rates, prepayment speeds, credit risk, etc.) |
| n | | Level 3 – significant unobservable inputs (including the Fund’s own assumptions in determining the fair value of investments) |
The inputs or methodologies used for valuing securities are not necessarily an indication of the risk associated with investing in those securities.
At July 31, 2012, all of the Fund’s investments in securities carried at fair value were designated as Level 2 since the primary inputs include credit quality of the issuer and short-term interest rates which are observable.
Transfers in and transfers out are recognized at the end of the reporting period. For the six months ended July 31, 2012, the Fund did not have any transfers into/out of Level 1 and Level 2.
Further details on the major security types can be found in the Portfolio of Investments.
4. TRANSACTIONS WITH AFFILIATES AND OTHER EXPENSES
Advisory fee
The Trust has entered into an advisory contract with Funds Management, an indirect wholly owned subsidiary of Wells Fargo & Company (“Wells Fargo”). The adviser is responsible for implementing investment policies and guidelines and for supervising the sub-adviser, who is responsible for day-to-day portfolio management of the Fund.
Pursuant to the contract, Funds Management is entitled to receive an annual advisory fee of 0.10% of the Fund’s average daily net assets.
Funds Management has retained the services of a sub-adviser to provide daily portfolio management to the Fund. The fee for sub-advisory services is borne by Funds Management. Wells Capital Management Incorporated, an affiliate of Funds Management, is the sub-adviser to the Fund and is entitled to receive a fee from Funds Management at an annual rate starting at 0.05% and declining to 0.01% as the average daily net assets of the Fund increase.
| | | | | | |
| Notes to Financial Statements (Unaudited) | | Wells Fargo Advantage Municipal Cash Management Money Market Fund | | | 33 | |
Administration and transfer agent fees
The Trust has entered into an administration agreement with Funds Management. Under this agreement, for providing administrative services, which includes paying fees and expenses for services provided by the transfer agent, sub-transfer agents, omnibus account servicers and record-keepers, Funds Management is entitled to receive from the Fund an annual fund level administration fee starting at 0.05% and declining to 0.03% as the average daily net assets of the Fund increase and a class level administration fee which is calculated based on the average daily net assets of each class as follows:
| | | | |
| | | Class Level Administration Fee | |
Administrator Class | | | 0.10 | % |
Institutional Class | | | 0.08 | |
Service Class | | | 0.12 | |
Funds Management has contractually waived and/or reimbursed advisory and administration fees to the extent necessary to maintain certain net operating expense ratios for the Fund. Waiver of fees and/or reimbursement of expenses by Funds Management were made first from fund level expenses on a proportionate basis and then from class specific expenses. Funds Management has committed through July 11, 2013 to waive fees and/or reimburse expenses to the extent necessary to cap the Fund’s expenses at 0.30% for Administrator Class, 0.20% for Institutional Class and 0.45% for Service Class.
Shareholder servicing fees
The Trust has entered into contracts with one or more shareholder servicing agents, whereby Service Class of the Fund is charged a fee at an annual rate of 0.25% of its average daily net assets. Administrator Class is charged a fee at an annual rate of 0.10% of its average daily net assets.
A portion of these total shareholder servicing fees were paid to affiliates of Wells Fargo.
5. INDEMNIFICATION
Under the Trust’s organizational documents, the officers and directors are indemnified against certain liabilities that may arise out of performance of their duties to the Trust. Additionally, in the normal course of business, the Trust may enter into contracts with service providers that contain a variety of indemnification clauses. The Trust’s maximum exposure under these arrangements is dependent on future claims that may be made against the Fund and, therefore, cannot be estimated.
6. NEW ACCOUNTING PRONOUNCEMENT
In December 2011, the Financial Accounting Standards Board (“FASB”) issued Accounting Standard Update (“ASU”) No. 2011-11, Disclosures about Offsetting Assets and Liabilities. ASU 2011-11, which amends FASB ASC Topic 210, Balance Sheet, creates new disclosure requirements which require entities to disclose both gross and net information for derivatives and other financial instruments that are either offset in the Statement of Assets and Liabilities or subject to an enforceable master netting arrangement or similar agreement. The disclosure requirements are effective for interim and annual reporting periods beginning on or after January 1, 2013. Management is currently assessing the potential impact, in addition to expanded financial statement disclosure, that may result from adopting this ASU.
| | | | |
| 34 | | Wells Fargo Advantage Municipal Cash Management Money Market Fund | | Other Information (Unaudited) |
PROXY VOTING INFORMATION
A description of the policies and procedures that the Fund uses to determine how to vote proxies relating to portfolio securities is available without charge, upon request, by calling 1-800-222-8222, visiting our Web site at wellsfargoadvantagefunds.com, or visiting the SEC Web site at sec.gov. Information regarding how the Fund voted proxies relating to portfolio securities during the most recent 12-month period ended June 30 is available without charge on the Fund’s Web site at wellsfargoadvantagefunds.com or by visiting the SEC Web site at sec.gov.
PORTFOLIO HOLDINGS INFORMATION
The complete portfolio holdings for each Fund are publicly available on the Funds’ Web site (wellsfargoadvantagefunds.com) on a monthly, seven-day delayed basis. The Fund files its complete schedule of portfolio holdings with the SEC for the first and third quarters of each fiscal year on Form N-Q, which is available without charge by visiting the SEC Web site at sec.gov. In addition, each Fund’s Form N-Q may be reviewed and copied at the SEC’s Public Reference Room in Washington, DC, and at regional offices in New York City, at 233 Broadway, and in Chicago, at 175 West Jackson Boulevard, Suite 900. Information about the Public Reference Room may be obtained by calling 1-800-SEC-0330.
| | | | | | |
| Other Information (Unaudited) | | Wells Fargo Advantage Municipal Cash Management Money Market Fund | | | 35 | |
BOARD OF TRUSTEES AND OFFICERS
Each of the Trustees and Officers listed in the table below acts in identical capacities for the Wells Fargo Advantage family of funds, which consists of 138 funds comprising the Wells Fargo Funds Trust, Wells Fargo Variable Trust, Wells Fargo Master Trust and four closed-end funds (collectively the “Fund Complex”). This table should be read in conjunction with the Prospectus and the Statement of Additional Information1. All of the Trustees are also Members of the Audit and Governance Committees of each Trust in the Fund Complex. The mailing address of each Trustee and Officer is 525 Market Street, 12th Floor, San Francisco, CA 94105. Each Trustee and Officer serves an indefinite term, however, each Trustee serves such term until reaching the mandatory retirement age established by the Trustees.
Independent Trustees
| | | | | | |
Name and Year of Birth | | Position Held and Length of Service* | | Principal Occupations During Past Five Years | | Other Directorships During
Past Five Years |
Peter G. Gordon
(Born 1942) | | Trustee, since 1998, Chairman, since 2005 | | Co-Founder, Retired Chairman, President and CEO of Crystal Geyser Water Company. Trustee Emeritus, Colby College | | Asset Allocation Trust |
Isaiah Harris, Jr.
(Born 1952) | | Trustee, since 2009 | | Retired. Prior thereto, President and CEO of BellSouth Advertising and Publishing Corp. from 2005 to 2007, President and CEO of BellSouth Enterprises from 2004 to 2005 and President of BellSouth Consumer Services from 2000 to 2003. Emeritus member of the Iowa State University Foundation Board of Governors. Emeritus Member of the Advisory Board of Iowa State University School of Business. Mr. Harris is a certified public accountant. | | CIGNA Corporation; Deluxe Corporation; Asset Allocation Trust |
Judith M. Johnson
(Born 1949) | | Trustee, since 2008
Audit Committee Chairman, since 2008 | | Retired. Prior thereto, Chief Executive Officer and Chief Investment Officer of Minneapolis Employees Retirement Fund from 1996 to 2008. Ms. Johnson is an attorney, certified public accountant and a certified managerial accountant. | | Asset Allocation Trust |
Leroy Keith, Jr.
(Born 1939) | | Trustee, since 2010 | | Chairman, Bloc Global Services (development and construction). Trustee of the Evergreen Funds from 1983 to 2010. Former Managing Director, Almanac Capital Management (commodities firm), former Partner, Stonington Partners, Inc. (private equity fund), former Director, Obagi Medical Products Co. and former Director, Lincoln Educational Services. | | Trustee, Virtus Fund Complex (consisting of 40 portfolios as of 12/31/11); Asset Allocation Trust |
David F. Larcker
(Born 1950) | | Trustee, since 2009 | | James Irvin Miller Professor of Accounting at the Graduate School of Business, Stanford University, Director of Corporate Governance Research Program and Senior Faculty of The Rock Center for Corporate Governance since 2006. From 2005 to 2008, Professor of Accounting at the Graduate School of Business, Stanford University. Prior thereto, Ernst & Young Professor of Accounting at The Wharton School, University of Pennsylvania from 1985 to 2005. | | Asset Allocation Trust |
Olivia S. Mitchell
(Born 1953) | | Trustee, since 2006 | | International Foundation of Employee Benefit Plans Professor, Wharton School of the University of Pennsylvania since 1993. Director of Wharton’s Pension Research Council and Boettner Center on Pensions & Retirement Research, and Research Associate at the National Bureau of Economic Research. Previously, Cornell University Professor from 1978 to 1993. | | Asset Allocation Trust |
Timothy J. Penny
(Born 1951) | | Trustee, since 1996 | | President and CEO of Southern Minnesota Initiative Foundation, a non-profit organization, since 2007 and Senior Fellow at the Humphrey Institute Policy Forum at the University of Minnesota since 1995. Member of the Board of Trustees of NorthStar Education Finance, Inc., a non-profit organization, since 2007. | | Asset Allocation Trust |
| | | | |
| 36 | | Wells Fargo Advantage Municipal Cash Management Money Market Fund | | Other Information (Unaudited) |
| | | | | | |
Name and Year of Birth | | Position Held and Length of Service* | | Principal Occupations During Past Five Years | | Other Directorships During
Past Five Years |
Michael S. Scofield
(Born 1943) | | Trustee, since 2010 | | Served on the Investment Company Institute’s Board of Governors and Executive Committee from 2008-2011 as well the Governing Council of the Independent Directors Council from 2006-2011 and the Independent Directors Council Executive Committee from 2008-2011. Chairman of the IDC from 2008-2010. Institutional Investor (Fund Directions) Trustee of Year in 2007. Trustee of the Evergreen Funds (and its predecessors) from 1984 to 2010. Chairman of the Evergreen Funds from 2000-2010. Former Trustee of the Mentor Funds. Retired Attorney, Law Offices of Michael S. Scofield and former Director and Chairman, Branded Media Corporation (multi-media branding company). | | Asset Allocation Trust |
Donald C. Willeke
(Born 1940) | | Trustee, since 1996 | | Principal of the law firm of Willeke & Daniels. General Counsel of the Minneapolis Employees Retirement Fund from 1984 until its consolidation into the Minnesota Public Employees Retirement Association on June 30, 2010. Director and Vice Chair of The Free Trust (non-profit corporation). Director of the American Chestnut Foundation (non-profit corporation). | | Asset Allocation Trust |
| * | Length of service dates reflect the Trustee’s commencement of service with the Trust’s predecessor entities, where applicable. |
Officers
| | | | | | |
Name and Year of Birth | | Position Held and
Length of Service | | Principal Occupations During Past Five Years | | |
Karla M. Rabusch
(Born 1959) | | President, since 2003 | | Executive Vice President of Wells Fargo Bank, N.A. and President of Wells Fargo Funds Management, LLC since 2003. Senior Vice President and Chief Administrative Officer of Wells Fargo Funds Management, LLC from 2001 to 2003. | | |
C. David Messman
(Born 1960) | | Secretary, since 2000; Chief Legal Officer, since 2003 | | Senior Vice President and Secretary of Wells Fargo Funds Management, LLC since 2001. Vice President and Managing Senior Counsel of Wells Fargo Bank, N.A. since 1996. | | |
Nancy Wiser (Born 1967) | | Treasurer, since 2012 | | Executive Vice President of Wells Fargo Funds Management, LLC since 2011. Chief Operating Officer and Chief Compliance Officer at LightBox Capital Management LLC, from 2008 to 2011. Owned and operated a consulting business providing services to various hedge funds including acting as Chief Operating Officer and Chief Compliance Officer for a hedge fund from 2007 to 2008. Chief Operating Officer and Chief Compliance Officer of GMN Capital LLC from 2006 to 2007. | | |
David Berardi
(Born 1975) | | Assistant Treasurer, since 2009 | | Vice President of Wells Fargo Funds Management, LLC since 2009. Vice President of Evergreen Investment Management Company, LLC from 2008 to 2010. Assistant Vice President of Evergreen Investment Services, Inc. from 2004 to 2008. Manager of Fund Reporting and Control for Evergreen Investment Management Company, LLC from 2004 to 2010. | | |
Jeremy DePalma
(Born 1974) | | Assistant Treasurer, since 2009 | | Senior Vice President of Wells Fargo Funds Management, LLC since 2009. Senior Vice President of Evergreen Investment Management Company, LLC from 2008 to 2010. Vice President, Evergreen Investment Services, Inc. from 2004 to 2007. Head of the Fund Reporting and Control Team within Fund Administration from 2005 to 2010. | | |
Debra Ann Early
(Born 1964) | | Chief Compliance Officer, since 2007 | | Chief Compliance Officer of Wells Fargo Funds Management, LLC since 2007. Chief Compliance Officer of Parnassus Investments from 2005 to 2007. Chief Financial Officer of Parnassus Investments from 2004 to 2007 and Senior Audit Manager of PricewaterhouseCoopers LLP from 1998 to 2004. | | |
| 1. | The Statement of Additional Information includes additional information about the Trustees and is available, without charge, upon request, by calling 1-800-222-8222 or by visiting the Web site at wellsfargoadvantagefunds.com. |
| | | | | | |
| Other Information (Unaudited) | | Wells Fargo Advantage Municipal Cash Management Money Market Fund | | | 37 | |
BOARD CONSIDERATION OF INVESTMENT ADVISORY AND SUB-ADVISORY AGREEMENTS:
Under Section 15 of the Investment Company Act of 1940 (the “1940 Act”), the Board of Trustees (the “Board”) of Wells Fargo Funds Trust (the “Trust”), all the members of which have no direct or indirect interest in the investment advisory and sub-advisory agreements and are not “interested persons” of the Trust, as defined in the 1940 Act (the “Independent Trustees”), must determine whether to approve the continuation of the Trust’s investment advisory and sub-advisory agreements. In this regard, at an in person meeting held on March 29-30, 2012 (the “Meeting”), the Board reviewed and re-approved: (i) an investment advisory agreement with Wells Fargo Funds Management, LLC (“Funds Management”) for Wells Fargo Advantage Municipal Cash Management Money Market Fund (the “Fund”) and (ii) an investment sub-advisory agreement with Wells Capital Management Incorporated (“Wells Capital Management”) for the Fund. The investment advisory agreement with Funds Management and the investment sub-advisory agreement with Wells Capital Management are collectively referred to as the “Advisory Agreements.”
At the Meeting, the Board considered the factors and reached the conclusions described below relating to the selection of Funds Management and Wells Capital Management and the continuation of the Advisory Agreements. Prior to the Meeting, the Trustees conferred extensively among themselves and with representatives of Funds Management about these matters. The Board also met throughout the year and received information that was useful to them in considering the continuation of the Advisory Agreements. The Independent Trustees were assisted in their evaluation of the Advisory Agreements by independent legal counsel, from whom they received separate legal advice and with whom they met separately from Funds Management.
In providing information to the Board, Funds Management and Wells Capital Management were guided by a detailed set of requests submitted by the Independent Trustees’ independent legal counsel on their behalf at the start of the Board’s annual contract renewal process earlier in 2012. In approving the Advisory Agreements, the Board did not identify any particular information or consideration that was all-important or controlling, and each Trustee likely attributed different weights to various factors.
Nature, extent and quality of services
The Board received and considered various information regarding the nature, extent and quality of services provided to the Fund by Funds Management and Wells Capital Management under the Advisory Agreements. The Board also received and considered, among other things, information about the background and experience of senior management of Funds Management, and the qualifications, backgrounds, tenures and responsibilities of the portfolio managers primarily responsible for the day-to-day portfolio management of the Fund.
The Board evaluated the ability of Funds Management and Wells Capital Management, based on their respective financial condition, resources, reputation and other attributes, to attract and retain qualified investment professionals, including research, advisory, and supervisory personnel. The Board further considered the compliance programs and compliance records of Funds Management and Wells Capital Management. In addition, the Board took into account the administrative services provided to the Fund by Funds Management and its affiliates.
The Board’s decision to approve the continuation of the Advisory Agreements was based on a comprehensive evaluation of information provided to it. In considering these matters, the Board considered not only the specific information presented in connection with the Meeting, but also the knowledge gained over time through interaction with Funds Management and Wells Capital Management about various topics, including Funds Management’s oversight of service providers. The above factors, together with those referenced below, are some of the most important, but not necessarily all, factors considered by the Board in concluding that the nature, extent and quality of the investment advisory services provided to the Fund by Funds Management and Wells Capital Management supported the re-approval of the Advisory Agreements. Although the Board considered the continuation of the Advisory Agreements for the Fund as part of the larger process of considering the continuation of the advisory agreements for all of the funds in the complex, its decision to continue the Advisory Agreements for the Fund was ultimately made on a fund-by-fund basis.
Fund performance and expenses
The Board considered the performance results for the Fund over various time periods ended December 31, 2011. The Board also considered these results in comparison to the median performance of a universe of relevant funds (the “Universe”) that was determined by Lipper Inc. (“Lipper”) to be similar to the Fund, and in comparison to the Fund’s
| | | | |
| 38 | | Wells Fargo Advantage Municipal Cash Management Money Market Fund | | Other Information (Unaudited) |
benchmark index and to other comparative data. Lipper is an independent provider of investment company data. The Board received a description of the methodology used by Lipper to select the mutual funds in the Universe. The Board noted that the performance of the Fund was equal to or in range of the median performance of the Universe for all periods under review. The Board also noted that the performance of the Fund was in range of its benchmark, the Lipper Tax-Exempt Money Market Funds Index, for the periods under review.
The Board received and considered information regarding the Fund’s contractual advisory fee and net operating expense ratios and their various components, including actual management fees (which reflect fee waivers, if any), transfer agent, custodian and other non-management fees, Rule 12b-1 and non-Rule 12b-1 fees, service fees and fee waiver and expense reimbursement arrangements. The Board also considered these ratios in comparison to the median ratios of an expense Universe and a narrower expense group of mutual funds (each, an “Expense Group”) that was determined by Lipper to be similar to the Fund. The Board received a description of the methodology used by Lipper to select the mutual funds in the Fund’s Expense Group. The Board noted that the net operating expense ratios of the Fund were equal to or in range of the Fund’s Expense Group’s median net operating expense ratios.
Funds Management advised the Board that the Expense Group medians reflected voluntary waivers, whereas the Fund’s expense ratios did not reflect voluntary waivers. The Board noted that when the Fund’s expense ratios were adjusted to reflect voluntary waivers, the Fund’s net operating expense ratios were lower than the median net operating expense ratios of the Expense Group.
Based on the above-referenced considerations and other factors, the Board concluded that the overall performance and expense structure of the Fund supported the re-approval of the Advisory Agreements for the Fund.
Investment advisory and sub-advisory fee rates
The Board reviewed and considered the contractual investment advisory fee rate that is payable by the Fund to Funds Management for investment advisory services (the “Advisory Agreement Rate”), both on a stand-alone basis and on a combined basis with the Fund’s administration fee rate. The Board took into account the separate administrative and other services covered by the administration fee rate. The Board also reviewed and considered the contractual investment sub-advisory fee rate that is payable by Funds Management to Wells Capital Management for investment sub-advisory services (the “Sub-Advisory Agreement Rate”). In addition, the Board reviewed and considered the existing fee waiver/cap arrangements applicable to the Advisory Agreement Rate and considered the Advisory Agreement Rate after taking the waivers/caps into account (the “Net Advisory Rate”).
The Board received and considered information comparing the Advisory Agreement Rate and Net Advisory Rate, combined with the administration fee rates, with those of other funds in the Fund’s Expense Group median. The Board noted that the Advisory Agreement Rate and Net Advisory Rate for the Fund were equal to or in range of the median rates for the Fund’s Expense Group. The Board viewed favorably Funds Management’s willingness to voluntarily waive certain fees.
The Board also received and considered information about the nature and extent of services offered and fee rates charged by Funds Management and Wells Capital Management to other types of clients. In this regard, the Board received information about differences between the services, and the compliance, reporting, and other legal burdens and risks of providing investment advice to mutual funds and those associated with providing advice to non-mutual fund clients such as collective funds or institutional separate accounts.
The Board determined that the Advisory Agreement Rate for the Fund, both with and without the administration fee rate and before and after waivers, was reasonable in light of the Fund’s Expense Group information, the net expense ratio commitments, the services covered by the Advisory Agreements and other information provided. The Board also reviewed and considered the Sub-Advisory Agreement Rate and concluded that the Sub-Advisory Agreement Rate was reasonable in light of the services covered by the sub-advisory agreement and other information provided.
Profitability
The Board received and considered a profitability analysis of Funds Management, as well as an analysis of the profitability to the collective Wells Fargo businesses that provide services to the Fund. It considered that the information provided to it was necessarily estimated, and that the profitability information provided to it, especially on a fund-by-fund basis, did not necessarily provide a precise tool for evaluating the appropriateness of the Fund’s Advisory Agreement Rate in isolation. It noted that the levels of profitability reported on a fund-by-fund basis varied widely, depending on, among
| | | | | | |
| Other Information (Unaudited) | | Wells Fargo Advantage Municipal Cash Management Money Market Fund | | | 39 | |
other things, the size and type of fund. The Board noted the impact of voluntary fee waivers on Funds Management’s profitability. The Board concluded that the profitability reported by Funds Management was not unreasonable.
The Board did not consider separate profitability information with respect to Wells Capital Management, because, as an affiliate of Funds Management, its profitability information was subsumed in the collective Wells Fargo profitability analysis provided by Funds Management.
Economies of scale
With respect to possible economies of scale, the Board reviewed the breakpoints in the Fund’s advisory fee and/or administration fee structure, which operate generally to reduce the expenses of the Fund (as a percentage of Fund assets) as the Fund grows in size. It considered that, as a fund shrinks in size, breakpoints conversely result in increasing fee levels. The Board noted that it would have on-going opportunities to review the appropriate levels of breakpoints in the future, and concluded that the breakpoints as implemented appeared to be a reasonable step toward sharing economies of scale, if any, with the Fund. However, the Board acknowledged the inherent limitations of any analysis of economies of scale and of any attempt to correlate breakpoints with such economies, stemming largely from the Board’s understanding that economies of scale are realized, if at all, across a variety of products and services, not just with respect to a single fund.
Other benefits to Funds Management and Wells Capital Management
The Board received and considered information regarding potential “fall-out” or ancillary benefits received by Funds Management and its affiliates, including Wells Capital Management, as a result of their relationship with the Fund. Ancillary benefits could include, among others, benefits directly attributable to the relationship of Funds Management and Wells Capital Management with the Fund and benefits potentially derived from an increase in Funds Management’s and Wells Capital Management’s business as a result of their relationship with the Fund (such as the ability to market to shareholders other financial products offered by Funds Management and its affiliates, including Wells Capital Management).
The Board considered that Wells Fargo Funds Distributor, LLC, an affiliate of Funds Management, serves as distributor to the Fund and receives certain compensation for those services. The Board noted that various financial institutions, including affiliates of Funds Management, may receive distribution-related fees, shareholder servicing payments (including amounts derived from payments under Rule 12b-1 plans) and sub-transfer agency fees in respect of shares sold or held through them and services provided.
The Board also reviewed information about whether and to what extent soft dollar credits are sought and how any such credits are utilized and any benefits that may be realized by using an affiliated broker.
Other factors and broader review
The Board also considered the markets for distribution of the Fund’s shares, including the channels through which the Fund’s shares are offered and sold. The Board noted that the Fund is part of one of the few fund families that have both direct-to-fund and intermediary distribution channels. As discussed above, the Board reviews detailed materials received from Funds Management and Wells Capital Management annually as part of the re-approval process under Section 15 of the 1940 Act and also reviews and assesses information about the quality of the services that the Fund receives throughout the year. In this regard, the Board has reviewed reports of Funds Management at each of its quarterly meetings, which include, among other things, portfolio reviews and performance reports. In addition, the Board confers with portfolio managers at various times throughout the year.
Conclusion
After considering the above-described factors and based on its deliberations and its evaluation of the information described above, the Board unanimously approved the continuation of the Advisory Agreements for an additional one-year period.
| | | | |
| 40 | | Wells Fargo Advantage Municipal Cash Management Money Market Fund | | List of Abbreviations |
The following is a list of common abbreviations for terms and entities which may have appeared in this report.
| ACB | — Agricultural Credit Bank |
| ADR | — American Depository Receipt |
| ADS | — American Depository Shares |
| AGC-ICC | — Assured Guaranty Corporation - Insured Custody Certificates |
| AGM | — Assured Guaranty Municipal |
| AMBAC | — American Municipal Bond Assurance Corporation |
| AMT | — Alternative Minimum Tax |
| BAN | — Bond Anticipation Notes |
| BHAC | — Berkshire Hathaway Assurance Corporation |
| CAB | — Capital Appreciation Bond |
| CCAB | — Convertible Capital Appreciation Bond |
| CDA | — Community Development Authority |
| CDO | — Collateralized Debt Obligation |
| COP | — Certificate of Participation |
| DRIVER | — Derivative Inverse Tax-Exempt Receipts |
| DW&P | — Department of Water & Power |
| DWR | — Department of Water Resources |
| ECFA | — Educational & Cultural Facilities Authority |
| EDA | — Economic Development Authority |
| EDFA | — Economic Development Finance Authority |
| ETF | — Exchange-Traded Fund |
| FFCB | — Federal Farm Credit Bank |
| FGIC | — Financial Guaranty Insurance Corporation |
| FGLMC | — Federal Government Loan Mortgage Company |
| FHA | — Federal Housing Authority |
| FHLB | — Federal Home Loan Bank |
| FHLMC | — Federal Home Loan Mortgage Corporation |
| FICO | — The Financing Corporation |
| FNMA | — Federal National Mortgage Association |
| GDR | — Global Depository Receipt |
| GNMA | — Government National Mortgage Association |
| HCFR | — Healthcare Facilities Revenue |
| HEFA | — Health & Educational Facilities Authority |
| HEFAR | — Higher Education Facilities Authority Revenue |
| HFA | — Housing Finance Authority |
| HFFA | — Health Facilities Financing Authority |
| IBC | — Insured Bond Certificate |
| IDA | — Industrial Development Authority |
| IDAG | — Industrial Development Agency |
| IDR | — Industrial Development Revenue |
| KRW | — Republic of Korea Won |
| LIBOR | — London Interbank Offered Rate |
| LLC | — Limited Liability Company |
| LLP | — Limited Liability Partnership |
| MBIA | — Municipal Bond Insurance Association |
| MFHR | — Multi-Family Housing Revenue |
| MSTR | — Municipal Securities Trust Receipts |
| MUD | — Municipal Utility District |
| NATL-RE | — National Public Finance Guarantee Corporation |
| PCFA | — Pollution Control Finance Authority |
| PCR | — Pollution Control Revenue |
| PFA | — Public Finance Authority |
| PFFA | — Public Facilities Financing Authority |
| PFOTER | — Puttable Floating Option Tax-Exempt Receipts |
| plc | — Public Limited Company |
| PUTTER | — Puttable Tax-Exempt Receipts |
| R&D | — Research & Development |
| RDA | — Redevelopment Authority |
| RDFA | — Redevelopment Finance Authority |
| REIT | — Real Estate Investment Trust |
| ROC | — Reset Option Certificates |
| SAVRS | — Select Auction Variable Rate Securities |
| SBA | — Small Business Authority |
| SFHR | — Single Family Housing Revenue |
| SFMR | — Single Family Mortgage Revenue |
| SPA | — Standby Purchase Agreement |
| SPDR | — Standard & Poor’s Depositary Receipts |
| STRIPS | — Separate Trading of Registered Interest and Principal Securities |
| TAN | — Tax Anticipation Notes |
| TIPS | — Treasury Inflation-Protected Securities |
| TRAN | — Tax Revenue Anticipation Notes |
| TCR | — Transferable Custody Receipts |
| TTFA | — Transportation Trust Fund Authority |
| TVA | — Tennessee Valley Authority |
| XLCA | — XL Capital Assurance |
This page is intentionally left blank.
This page is intentionally left blank.


FOR MORE INFORMATION
More information about Wells Fargo Advantage Funds is available free upon request. To obtain literature, please write, e-mail, visit the Fund’s Web site, or call:
Wells Fargo Advantage Funds
P.O. Box 8266
Boston, MA 02266-8266
E-mail: wfaf@wellsfargo.com
Web site: wellsfargoadvantagefunds.com
Individual investors: 1-800-222-8222
Retail investment professionals: 1-888-877-9275
Institutional investment professionals: 1-866-765-0778
This report and the financial statements contained herein are submitted for the general information of the shareholders of Wells Fargo Advantage Funds. If this report is used for promotional purposes, distribution of the report must be accompanied or preceded by a current prospectus. For a current prospectus and, if available, a summary prospectus containing more complete information, including charges and expenses, call 1-800-222-8222 or visit the Fund’s Web site at wellsfargoadvantagefunds.com. Please consider the investment objectives, risks, charges, and expenses of the investment carefully before investing. This and other information about Wells Fargo Advantage Funds can be found in the current prospectus. Read the prospectus carefully before you invest or send money.
Wells Fargo Funds Management, LLC, a wholly owned subsidiary of Wells Fargo & Company, provides investment advisory and administrative services for Wells Fargo Advantage Funds. Other affiliates of Wells Fargo & Company provide subadvisory and other services for the Funds. The Funds are distributed by Wells Fargo Funds Distributor, LLC, Member FINRA/SIPC, an affiliate of Wells Fargo & Company.
NOT FDIC INSURED ¡ NO BANK GUARANTEE ¡ MAY LOSE VALUE
© 2012 Wells Fargo Funds Management, LLC. All rights reserved.
| | |
 | | 211391 09-12 SA307/SAR307 07-12 |

Wells Fargo Advantage
Municipal Money Market Fund

Semi-Annual Report
July 31, 2012

Reduce clutter. Save trees.
Sign up for electronic delivery of prospectuses and shareholder reports at wellsfargo.com/advantagedelivery
Contents
The views expressed and any forward-looking statements are as of July 31, 2012, unless otherwise noted, and are those of the Fund managers and/or Wells Fargo Funds Management, LLC. Discussions of individual securities, or the markets generally, or any Wells Fargo Advantage Fund are not intended as individual recommendations. Future events or results may vary significantly from those expressed in any forward-looking statements; the views expressed are subject to change at any time in response to changing circumstances in the market. Wells Fargo Funds Management, LLC, disclaims any obligation to publicly update or revise any views expressed or forward-looking statements.
NOT FDIC INSURED ¡ NO BANK GUARANTEE ¡ MAY LOSE VALUE

WELLS FARGO INVESTMENT HISTORY
| | |
| |
| 1932 | | Keystone creates one of the first mutual fund families. |
| |
| 1971 | | Wells Fargo & Company introduces one of the first institutional index funds. |
| |
| 1978 | | Wells Fargo applies Markowitz and Sharpe’s research on Modern Portfolio Theory to introduce one of the industry’s first Tactical Asset Allocation (TAA) models in institutional separately managed accounts. |
| |
| 1984 | | Wells Fargo Stagecoach Funds launches its first asset allocation fund. |
| |
| 1989 | | The Tactical Asset Allocation (TAA) Model is first applied to Wells Fargo’s asset allocation mutual funds. |
| |
| 1994 | | Wells Fargo introduces the LifePath Funds, one of the first suites of target date funds (now the Wells Fargo Advantage Dow Jones Target Date FundsSM). |
| |
| 1996 | | Evergreen Investments and Keystone Funds merge. |
| |
| 1997 | | Wells Fargo launches Wells Fargo Advantage WealthBuilder PortfoliosSM, a fund-of-funds suite of products that includes the use of quantitative models to shift assets among investment styles. |
| |
| 1999 | | Norwest Advantage Funds and Stagecoach Funds are reorganized into Wells Fargo Funds after the merger of Norwest and Wells Fargo. |
| |
| 2002 | | Evergreen Retail and Evergreen Institutional companies form the umbrella asset management company, Evergreen Investments. |
| |
| 2005 | | The integration of Strong Funds with Wells Fargo Funds creates Wells Fargo Advantage Funds, resulting in one of the top 20 mutual fund companies in the United States. |
| |
| 2006 | | Wells Fargo Advantage Funds relaunches the target date product line as Wells Fargo Advantage Dow Jones Target Date Funds. |
| |
| 2010 | | The mergers and reorganizations of Evergreen and Wells Fargo Advantage mutual funds are completed, unifying the families under the brand of Wells Fargo Advantage Funds. |
Wells Fargo Advantage Funds®
Wells Fargo Advantage Funds skillfully guides institutions, financial advisors, and individuals through the investment terrain to help them reach their financial objectives. Everything we do on behalf of investors is backed by our unique combination of qualifications.
Strength
Our organization is built on the standards of integrity and service established by our parent company—Wells Fargo & Company—more than 150 years ago. And, because we’re part of a highly diversified financial enterprise, we offer the depth of resources to help investors succeed.
Expertise
Our multi-boutique model offers investors access to the independent thinking of premier investment managers that have been chosen for their time-tested strategies. While each team specializes in a specific investment strategy, collectively they provide investors a wide choice of distinct investment styles. Our dedication to investment excellence doesn’t end with our expertise in manager selection—risk management, analysis, and rigorous ongoing review seek to ensure each manager’s investment process remains consistent.
Partnership
Our collaborative approach is built around understanding the needs and goals of our clients. By adhering to core principles of sound judgment and steady guidance, we support you through every stage of the investment decision process.
Carefully consider a fund’s investment objectives, risks, charges, and expenses before investing. For a current prospectus and, if available, a summary prospectus, containing this and other information, visit wellsfargoadvantagefunds.com. Read it carefully before investing.
Wells Fargo Funds Management, LLC, a wholly owned subsidiary of Wells Fargo & Company, provides investment advisory and administrative services for Wells Fargo Advantage Funds®. Other affiliates of Wells Fargo & Company provide subadvisory and other services for the Funds. The Funds are distributed by Wells Fargo Funds Distributor, LLC, Member FINRA/SIPC, an affiliate of Wells Fargo & Company.
“Dow Jones®” and “Dow Jones Target Date IndexesSM” are service marks of Dow Jones Trademark Holdings, LLC (“Dow Jones”), have been licensed to CME Group Index Services LLC (“CME Indexes”) and have been sublicensed for use for certain purposes by Global Index Advisors, Inc, and Wells Fargo Funds Management, LLC. The Wells Fargo Advantage Dow Jones Target Date FundsSM based on the Dow Jones Target Date IndexesSM, are not sponsored, endorsed, sold or promoted by Dow Jones, CME Indexes or their respective affiliates and none of them makes any representation regarding the advisability of investing in such product(s).
NOT FDIC INSURED ¡ NO BANK GUARANTEE ¡ MAY LOSE VALUE
Not part of the semi-annual report.
Wells Fargo Advantage Funds offers more than 110 mutual funds across a wide range of asset classes, representing over $209 billion in assets under management, as of July 31, 2012.
| | | | |
| Equity Funds | | | | |
Asia Pacific Fund | | Enterprise Fund† | | Opportunity Fund† |
C&B Large Cap Value Fund | | Equity Value Fund | | Precious Metals Fund |
C&B Mid Cap Value Fund | | Global Opportunities Fund | | Premier Large Company Growth Fund |
Capital Growth Fund | | Growth Fund | | Small Cap Opportunities Fund |
Common Stock Fund | | Index Fund | | Small Cap Value Fund |
Disciplined U.S. Core Fund | | International Equity Fund | | Small Company Growth Fund |
Discovery Fund† | | International Value Fund | | Small Company Value Fund |
Diversified Equity Fund | | Intrinsic Small Cap Value Fund | | Small/Mid Cap Core Fund |
Diversified International Fund | | Intrinsic Value Fund | | Small/Mid Cap Value Fund |
Diversified Small Cap Fund | | Intrinsic World Equity Fund | | Special Mid Cap Value Fund |
Emerging Growth Fund | | Large Cap Core Fund | | Special Small Cap Value Fund |
Emerging Markets Equity Fund | | Large Cap Growth Fund | | Specialized Technology Fund |
Emerging Markets Equity Income Fund | | Large Company Value Fund | | Traditional Small Cap Growth Fund |
Endeavor Select Fund† | | Omega Growth Fund | | Utility and Telecommunications Fund |
| Bond Funds | | | | |
Adjustable Rate Government Fund | | Inflation-Protected Bond Fund | | Short-Term Bond Fund |
California Limited-Term Tax-Free Fund | | Intermediate Tax/AMT-Free Fund | | Short-Term High Yield Bond Fund |
California Tax-Free Fund | | International Bond Fund | | Short-Term Municipal Bond Fund |
Colorado Tax-Free Fund | | Minnesota Tax-Free Fund | | Strategic Municipal Bond Fund |
Emerging Markets Local Bond Fund | | Municipal Bond Fund | | Total Return Bond Fund |
Government Securities Fund | | North Carolina Tax-Free Fund | | Ultra Short-Term Income Fund |
High Income Fund | | Pennsylvania Tax-Free Fund | | Ultra Short-Term Municipal Income Fund |
High Yield Bond Fund | | Short Duration Government Bond Fund | | Wisconsin Tax-Free Fund |
Income Plus Fund | | | | |
| Asset Allocation Funds | | | | |
Absolute Return Fund | | WealthBuilder Equity Portfolio† | | Target 2020 Fund† |
Asset Allocation Fund | | WealthBuilder Growth Allocation Portfolio† | | Target 2025 Fund† |
Conservative Allocation Fund | | WealthBuilder Growth Balanced Portfolio† | | Target 2030 Fund† |
Diversified Capital Builder Fund | | WealthBuilder Moderate Balanced Portfolio† | | Target 2035 Fund† |
Diversified Income Builder Fund | | WealthBuilder Tactical Equity Portfolio† | | Target 2040 Fund† |
Growth Balanced Fund | | Target Today Fund† | | Target 2045 Fund† |
Index Asset Allocation Fund | | Target 2010 Fund† | | Target 2050 Fund† |
Moderate Balanced Fund | | Target 2015 Fund† | | Target 2055 Fund† |
WealthBuilder Conservative Allocation Portfolio† | | | | |
| Money Market Funds | | | | |
100% Treasury Money Market Fund | | Heritage Money Market Fund† | | National Tax-Free Money Market Fund |
California Municipal Money Market Fund | | Money Market Fund | | Prime Investment Money Market Fund |
Cash Investment Money Market Fund | | Municipal Cash Management Money Market Fund | | Treasury Plus Money Market Fund |
Government Money Market Fund | | Municipal Money Market Fund | | |
| Variable Trust Funds1 | | | | |
VT Discovery Fund† | | VT Intrinsic Value Fund | | VT Small Cap Growth Fund |
VT Index Asset Allocation Fund | | VT Omega Growth Fund | | VT Small Cap Value Fund |
VT International Equity Fund | | VT Opportunity Fund† | | VT Total Return Bond Fund |
An investment in a money market fund is not insured or guaranteed by the Federal Deposit Insurance Corporation or any other government agency. Although the Wells Fargo Advantage Money Market Funds seek to preserve the value of your investment at $1.00 per share, it is possible to lose money by investing in a money market fund.
| 1. | The Variable Trust Funds are generally available only through insurance company variable contracts. |
| † | In this report, the Wells Fargo Advantage Discovery FundSM, Wells Fargo Advantage Endeavor Select FundSM, Wells Fargo Advantage Enterprise FundSM, Wells Fargo Advantage Opportunity FundSM, Wells Fargo Advantage WealthBuilder Conservative Allocation PortfolioSM, Wells Fargo Advantage WealthBuilder Equity PortfolioSM, Wells Fargo Advantage WealthBuilder Growth Allocation PortfolioSM, Wells Fargo Advantage WealthBuilder Growth Balanced PortfolioSM, Wells Fargo Advantage WealthBuilder Moderate Balanced PortfolioSM, Wells Fargo Advantage WealthBuilder Tactical Equity PortfolioSM, Wells Fargo Advantage Dow Jones Target Today FundSM, Wells Fargo Advantage Dow Jones Target 2010 FundSM, Wells Fargo Advantage Dow Jones Target 2015 FundSM, Wells Fargo Advantage Dow Jones Target 2020 FundSM, Wells Fargo Advantage Dow Jones Target 2025 FundSM, Wells Fargo Advantage Dow Jones Target 2030 FundSM, Wells Fargo Advantage Dow Jones Target 2035 FundSM, Wells Fargo Advantage Dow Jones Target 2040 FundSM, Wells Fargo Advantage Dow Jones Target 2045 FundSM, Wells Fargo Advantage Dow Jones Target 2050 FundSM, Wells Fargo Advantage Dow Jones Target 2055 FundSM, Wells Fargo Advantage Heritage Money Market FundSM, Wells Fargo Advantage VT Discovery FundSM, and Wells Fargo Advantage VT Opportunity FundSM are referred to as the Discovery Fund, Endeavor Select Fund, Enterprise Fund, Opportunity Fund, WealthBuilder Conservative Allocation Portfolio, WealthBuilder Equity Portfolio, WealthBuilder Growth Allocation Portfolio, WealthBuilder Growth Balanced Portfolio, WealthBuilder Moderate Balanced Portfolio, WealthBuilder Tactical Equity Portfolio, Target Today Fund, Target 2010 Fund, Target 2015 Fund, Target 2020 Fund, Target 2025 Fund, Target 2030 Fund, Target 2035 Fund, Target 2040 Fund, Target 2045 Fund, Target 2050 Fund, Target 2055 Fund, Heritage Money Market Fund, VT Discovery Fund, and VT Opportunity Fund, respectively. |
Not part of the semi-annual report.
| | | | |
| 2 | | Wells Fargo Advantage Municipal Money Market Fund | | Letter to Shareholders (Unaudited) |

Karla M. Rabusch,
President
Wells Fargo Advantage Funds
Not only has the Fed been successful in engineering low interest rates, but investors have rushed to buy U.S. Treasury securities as a safe-haven asset in the midst of uncertainty surrounding the European debt crisis. As a result, interest rates reached record lows.
Dear Valued Shareholder:
We’re pleased to offer you this semi-annual report for the Wells Fargo Advantage Municipal Money Market Fund for the six-month period that ended July 31, 2012.
The economy grew, but the recovery has been modest.
The U.S. is three years into a modest economic recovery, with second-quarter real gross domestic product (GDP) increasing 1.5% on an annualized basis. Several factors, however, held back growth despite the Federal Reserve’s (Fed) accommodative monetary policy. In Europe, much uncertainty remained about the outcome of the eurozone debt crisis and whether policymakers will be able to resolve it without any countries defaulting or leaving the euro. In addition, Europe has again entered a recession. In Asia, China’s economy slowed. Here at home, a potential “fiscal cliff”—automatic tax increases alongside automatic budget cuts stemming from a legislative compromise in Congress—added uncertainty and, if unaddressed, could negatively affect GDP beginning in 2013.
In an effort to further bolster the economy, especially the labor market, the Fed has indicated its commitment to maintaining a highly accommodative monetary policy. It has indicated its belief that economic conditions warrant an extremely low federal funds target rate—a short-term bank lending rate—near 0%, at least through late 2014. The Fed also continued its “Operation Twist,” which involves buying U.S. Treasury securities with maturities of greater than six years and selling U.S. Treasury securities with maturities of less than three years, in an effort to keep longer-term interest rates low.
A demand for relative safe-haven securities led to ultra-low interest rates.
Not only has the Fed been successful in engineering low interest rates, but investors have rushed to buy U.S. Treasury securities as a relative safe-haven asset in the midst of uncertainty surrounding the European debt crisis. As a result, interest rates reached record lows. Ten-year U.S. Treasury yields ranged between 2.38% and 1.38% over the past six months. Three-month U.S. Treasury bills had an average yield of 10 basis points (bps; 100 bps is 1.00%) over the past six months. Rates on seven-day commercial paper, a common investment type for prime money market funds, were 12 bps on July 31, 2012.
Lack of supply kept a lid on yields, and regulatory uncertainty remained.
Continued demand for a limited supply of money market-eligible securities also contributed to low yields. We estimate that the amount outstanding of short-term, money market fund-eligible securities (excluding U.S. Treasury securities) has declined by $3 trillion, or more than a 30% decrease, since 2008. Reasons for this decrease in supply include issuers opting to lock in rates on long-term rather than short-term debt, less need for financing as many companies have plentiful cash given record profits, and credit downgrades that have resulted in fewer firms with top credit ratings.
| | | | | | |
| Letter to Shareholders (Unaudited) | | Wells Fargo Advantage Municipal Money Market Fund | | | 3 | |
The Chairman of the Securities and Exchange Commission (SEC) indicated in late August that the SEC has determined at this time not to propose certain amendments to the rules governing money market funds. However, the Financial Stability Oversight Council or other financial regulators could still take steps to impose additional regulations on money market funds. As we gain clarity in the coming months regarding proposed changes to money market fund rules that may be issued by the SECany potential changes to regulation of money market funds, we will provide further communications to our clients about these changes.
Amid the current challenges of investing—low yields, an unresolved eurozone crisis, limited supply, and regulatory uncertainty—has been the opportunity to provide our clients an important investment option for meeting their short-term cash needs. Our focus on preservation of capital and liquidity is not a marketing phrase but rather the basis of our investment philosophy as we manage money market funds in an uncertain world. We are proud of our comprehensive lineup of prime, government, and tax-exempt money market funds.
Thank you for choosing to invest with Wells Fargo Advantage Funds. We appreciate your confidence in us and remain committed to helping you meet your financial needs. For current information about your fund investments, contact your investment professional, visit our Web site at wellsfargoadvantagefunds.com, or call us directly at 1-800-222-8222. We are available 24 hours a day, 7 days a week.
Sincerely,

Karla M. Rabusch
President
Wells Fargo Advantage Funds
Amid the current challenges of investing—low yields, an unresolved eurozone crisis, limited supply, and regulatory uncertainty—has been the opportunity to provide our clients an important investment option for meeting their short-term cash needs.
| | | | |
| 4 | | Wells Fargo Advantage Municipal Money Market Fund | | Performance Highlights (Unaudited) |
INVESTMENT OBJECTIVE
The Fund seeks current income exempt from regular federal income tax, while preserving capital and liquidity.
ADVISER
Wells Fargo Funds Management, LLC
SUB-ADVISER
Wells Capital Management Incorporated
PORTFOLIO MANAGERS
David D. Sylvester
James Randazzo
FUND INCEPTION
November 2, 1988
| | |
SECTOR DISTRIBUTION1 (AS OF JULY 31, 2012) |
| |
 | | |
| | |
EFFECTIVE MATURITY DISTRIBUTION2 (AS OF JULY 31, 2012) |
|
 |
|
WEIGHTED AVERAGE MATURITY3 (AS OF JULY 31, 2012) |
13 Days |
|
WEIGHTED AVERAGE FINAL MATURITY4 (AS OF JULY 31, 2012) |
13 Days |
| 1. | Sector distribution is subject to change and is calculated based on the total investments of the Fund. |
| 2. | Effective maturity distribution is subject to change and is calculated based on the total investments of the Fund. |
| 3. | Weighted Average Maturity (WAM): WAM is an average of the effective maturities of all securities held in the portfolio, weighted by each security’s percentage of total investments. The maturity of a portfolio security is the period remaining until the date on which the principal amount is unconditionally required to be paid, or in the case of a security called for redemption, the date on which the redemption payment is unconditionally required to be made. WAM calculations allow for the maturities of certain securities with demand features or periodic interest rate resets to be shortened. WAM is a way to measure a fund’s sensitivity to potential interest rate changes. |
| 4. | Weighted Average Final Maturity (WAFM): WAFM is an average of the final maturities of all securities held in the portfolio, weighted by their percentage of total investments. The maturity of a portfolio security is the period remaining until the date on which the principal amount is unconditionally required to be paid, or in the case of a security called for redemption, the date on which the redemption payment is unconditionally required to be made. In contrast to WAM, the calculation of WAFM allows for the maturities of certain securities with demand features to be shortened, but not the periodic interest rate resets. WAFM is a way to measure a fund’s potential sensitivity to credit spread changes. |
| | | | | | |
| Performance Highlights (Unaudited) | | Wells Fargo Advantage Municipal Money Market Fund | | | 5 | |
AVERAGE ANNUAL TOTAL RETURN5 (%) (AS OF JULY 31, 2012)
| | | | | | | | | | | | | | | | | | | | | | | | | | | | |
| | | | | | | | | Expense Ratios6 | |
| | | Inception Date | | | 6 Months* | | | 1 Year | | | 5 Year | | | 10 Year | | | Gross | | | Net7 | |
Class A (WMUXX) | | | 01/05/1995 | | | | 0.00 | | | | 0.02 | | | | 0.64 | | | | 1.10 | | | | 0.82% | | | | 0.65% | |
Institutional Class (WMTXX)** | | | 07/09/2010 | | | | 0.03 | | | | 0.05 | | | | 0.78 | | | | 1.32 | | | | 0.43% | | | | 0.20% | |
Investor Class (WMVXX) | | | 07/09/2010 | | | | 0.00 | | | | 0.02 | | | | 0.75 | | | | 1.31 | | | | 0.85% | | | | 0.64% | |
Service Class (WMSXX) | | | 11/02/1988 | | | | 0.00 | | | | 0.02 | | | | 0.75 | | | | 1.31 | | | | 0.72% | | | | 0.45% | |
Sweep Class | | | 06/30/2000 | | | | 0.00 | | | | 0.02 | | | | 0.54 | | | | 0.90 | | | | 1.17% | | | | 1.00% | |
| * | Returns for periods of less than one year are not annualized. |
| ** | Institutional Class shares are closed to new investors. |
| | | | | | | | | | | | | | | | | | | | |
FUND YIELD SUMMARY7 (AS OF JULY 31, 2012) | | Class A | | | Institutional Class | | | Investor Class | | | Service Class | | | Sweep Class | |
7-Day Current Yield | | | 0.01% | | | | 0.04% | | | | 0.01% | | | | 0.01% | | | | 0.01% | |
7-Day Compound Yield | | | 0.01% | | | | 0.04% | | | | 0.01% | | | | 0.01% | | | | 0.01% | |
30-Day Simple Yield | | | 0.01% | | | | 0.04% | | | | 0.01% | | | | 0.01% | | | | 0.01% | |
30-Day Compound Yield | | | 0.01% | | | | 0.04% | | | | 0.01% | | | | 0.01% | | | | 0.01% | |
Figures quoted represent past performance, which is no guarantee of future results and do not reflect the deduction of taxes that a shareholder may pay on fund distributions or the redemption of fund shares. Investment returns will fluctuate. The Fund’s yield figures more closely reflect the current earnings of the Fund than the total return figures. Current performance may be lower or higher than the performance data quoted and assumes the reinvestment of dividends and capital gains. Current month-end performance is available at the Fund’s Web site – wellsfargoadvantagefunds.com.
Each class is sold without a front-end sales charge or contingent deferred sales charge. Other fees and expenses apply to an investment in the Fund and are described in the Fund’s current prospectuses.
An investment in a money market fund is not insured or guaranteed by the Federal Deposit Insurance Corporation or any other government agency. Although the Fund seeks to preserve the value of your investment at $1.00 per share, it is possible to lose money by investing in a money market fund. A portion of the Fund’s income may be subject to federal, state and/or local income taxes or the alternative minimum tax (AMT).
| 5. | Historical performance shown for the Institutional Class shares prior to their inception reflects the performance of the Service Class shares, and includes the higher expenses applicable to the Service Class shares. If these expenses had not been included, returns would be higher. Historical performance shown for the Investor Class shares prior to their inception reflects the performance of the Service Class shares, and has not been adjusted to include the higher expenses applicable to the Investor Class shares. If these expenses had been adjusted, returns would be lower. Historical performance shown for all classes of the Fund prior to July 12, 2010 is based on the performance of the Fund’s predecessor, Evergreen Municipal Money Market Fund. |
| 6. | Reflects the expense ratios as stated in the most recent prospectuses. |
| 7. | The Adviser has committed through July 11, 2013 to waive fees and/or reimburse expenses to the extent necessary to cap the Fund’s Total Annual Fund Operating Expenses After Fee Waiver, excluding certain expenses, at the amounts shown above. Brokerage commissions, stamp duty fees, interest, taxes, acquired fund fees and expenses and extraordinary expenses are excluded from the cap. Without this cap, the Fund’s returns would have been lower. Without waived fees and/or reimbursed expenses, the Fund’s 7-day current yield would have been (0.59%), (0.21%), (0.62%), (0.49%) and (0.94%) for Class A, Institutional Class, Investor Class, Service Class and Sweep Class, respectively. |
| | | | |
| 6 | | Wells Fargo Advantage Municipal Money Market Fund | | Fund Expenses (Unaudited) |
As a shareholder of the Fund, you incur ongoing costs, including management fees, distribution (12b-1) and/or shareholder service fees, and other Fund expenses. This example is intended to help you understand your ongoing costs (in dollars) of investing in the Fund and to compare these costs with the ongoing costs of investing in other mutual funds.
The example is based on an investment of $1,000 invested at the beginning of the six-month period and held for the entire period from February 1, 2012 to July 31, 2012.
Actual Expenses
The “Actual” line of the table below provides information about actual account values and actual expenses. You may use the information in this line, together with the amount you invested, to estimate the expenses that you paid over the period. Simply divide your account value by $1,000 (for example, an $8,600 account value divided by $1,000 = 8.6), then multiply the result by the number in the “Actual” line under the heading entitled “Expenses Paid During Period” for your applicable class of shares to estimate the expenses you paid on your account during this period.
Hypothetical Example for Comparison Purposes
The “Hypothetical” line of the table below provides information about hypothetical account values and hypothetical expenses based on the Fund’s actual expense ratio and an assumed rate of return of 5% per year before expenses, which is not the Fund’s actual return. The hypothetical account values and expenses may not be used to estimate the actual ending account balance or expenses you paid for the period. You may use this information to compare the ongoing costs of investing in the Fund and other funds. To do so, compare this 5% hypothetical example with the 5% hypothetical examples that appear in the shareholder reports of the other funds.
Please note that the expenses shown in the table are meant to highlight your ongoing costs only. Therefore, the “Hypothetical” line of the table is useful in comparing ongoing costs only, and will not help you determine the relative total costs of owning different funds.
| | | | | | | | | | | | | | | | |
| | | Beginning
Account Value
02-01-2012 | | | Ending
Account Value
07-31-2012 | | | Expenses
Paid During
the Period¹ | | | Net Annual
Expense Ratio | |
Class A | | | | | | | | | | | | | | | | |
Actual | | $ | 1,000.00 | | | $ | 1,000.05 | | | $ | 1.24 | | | | 0.25 | % |
Hypothetical (5% return before expenses) | | $ | 1,000.00 | | | $ | 1,023.62 | | | $ | 1.26 | | | | 0.25 | % |
Institutional Class | | | | | | | | | | | | | | | | |
Actual | | $ | 1,000.00 | | | $ | 1,000.31 | | | $ | 0.99 | | | | 0.20 | % |
Hypothetical (5% return before expenses) | | $ | 1,000.00 | | | $ | 1,023.87 | | | $ | 1.01 | | | | 0.20 | % |
Investor Class | | | | | | | | | | | | | | | | |
Actual | | $ | 1,000.00 | | | $ | 1,000.05 | | | $ | 1.24 | | | | 0.25 | % |
Hypothetical (5% return before expenses) | | $ | 1,000.00 | | | $ | 1,023.62 | | | $ | 1.26 | | | | 0.25 | % |
Service Class | | | | | | | | | | | | | | | | |
Actual | | $ | 1,000.00 | | | $ | 1,000.05 | | | $ | 1.24 | | | | 0.25 | % |
Hypothetical (5% return before expenses) | | $ | 1,000.00 | | | $ | 1,023.62 | | | $ | 1.26 | | | | 0.25 | % |
Sweep Class | | | | | | | | | | | | | | | | |
Actual | | $ | 1,000.00 | | | $ | 1,000.05 | | | $ | 1.24 | | | | 0.25 | % |
Hypothetical (5% return before expenses) | | $ | 1,000.00 | | | $ | 1,023.62 | | | $ | 1.26 | | | | 0.25 | % |
| 1. | Expenses paid is equal to the annualized expense ratio of each class multiplied by the average account value over the period, multiplied by the number of days in the most recent fiscal half-year divided by the number of days in the fiscal year (to reflect the one-half year period). |
| | | | | | |
| Portfolio of Investments—July 31, 2012 (Unaudited) | | Wells Fargo Advantage Municipal Money Market Fund | | | 7 | |
| | | | | | | | | | | | | | | | |
| Security Name | | Interest Rate | | | Maturity Date | | | Principal | | | Value | |
| | | | | | | | | | | | | | | | |
| | | | |
Municipal Obligations : 98.85% | | | | | | | | | | | | | | | | |
| | | | |
Alabama : 0.64% | | | | | | | | | | | | | | | | |
| | | | |
| Variable Rate Demand Notes §: 0.64% | | | | | | | | | | | | | | | | |
Calhoun County AL Economic Development Council Southern Bag Corporation Limited Expansion Project Series 1998 (IDR, TD Bank NA LOC) | | | 0.43 | % | | | 03/01/2013 | | | $ | 600,000 | | | $ | 600,000 | |
Chatom AL Industrial Development Board Gulf Opportunity Zone Power South Energy Cooperative Projects Series 2011 (Utilities Revenue, National Rural Utilities Cooperative Finance Corporation LOC) | | | 0.30 | | | | 08/01/2041 | | | | 2,600,000 | | | | 2,600,000 | |
Mobile AL Downtown RDA Gulf Opportunity Zone Austal USA LLC Project Series B (IDR, National Australia Bank LOC) | | | 0.15 | | | | 05/01/2041 | | | | 1,370,000 | | | | 1,370,000 | |
Mobile AL Industrial Development Board Project Series 2006 (IDR, Whitney National Bank LOC) | | | 0.20 | | | | 08/01/2031 | | | | 1,950,000 | | | | 1,950,000 | |
| | | | |
| | | | | | | | | | | | | | | 6,520,000 | |
| | | | | | | | | | | | | | | | |
| | | | |
Arizona : 1.62% | | | | | | | | | | | | | | | | |
| | | | |
| Other Municipal Debt : 0.49% | | | | | | | | | | | | | | | | |
Phoenix Civic Improvement Corporation Series 2012-A (Miscellaneous Revenue) | | | 0.17 | | | | 08/06/2012 | | | | 5,000,000 | | | | 5,000,000 | |
| | | | | | | | | | | | | | | | |
| | | | |
| Variable Rate Demand Notes §: 1.13% | | | | | | | | | | | | | | | | |
Maricopa County AZ IDA Solid Waste Disposal Ambian Dairy LLC Project Series 2008 (Resource Recovery Revenue, Farm Credit Services America LOC) | | | 0.25 | | | | 11/01/2033 | | | | 3,600,000 | | | | 3,600,000 | |
Maricopa County AZ IDA Solid Waste Disposal Series 2006 (Resource Recovery Revenue, Farm Credit Services America LOC) | | | 0.23 | | | | 08/01/2026 | | | | 2,500,000 | | | | 2,500,000 | |
Maricopa County AZ IDA Trans-Matic Manufacturing Production Project (IDR, PNC Bank NA LOC) | | | 0.24 | | | | 10/01/2026 | | | | 2,995,000 | | | | 2,995,000 | |
Pinal County AZ IDA Solid Waste Disposal Feenstra Investments LLC Project Series 2002 (Resource Recovery Revenue, Farm Credit Services America LOC) | | | 0.23 | | | | 08/01/2027 | | | | 1,250,000 | | | | 1,250,000 | |
Pinal County AZ IDA Solid Waste Disposal Rio Bravo Dairy Farm LLC Series 2002 (IDR, Farm Credit Services America LOC) | | | 0.23 | | | | 05/01/2027 | | | | 1,250,000 | | | | 1,250,000 | |
| | | | |
| | | | | | | | | | | | | | | 11,595,000 | |
| | | | | | | | | | | | | | | | |
| | | | |
California : 4.88% | | | | | | | | | | | | | | | | |
| | | | |
| Other Municipal Debt : 0.39% | | | | | | | | | | | | | | | | |
Los Angeles County CA School Pooled Financing Program TRAN Series B-1 (Miscellaneous Revenue, GO of Participants Insured) | | | 2.00 | | | | 11/30/2012 | | | | 2,000,000 | | | | 2,011,526 | |
San Diego County CA School District TRAN Series B-1
(Miscellaneous Revenue, Go of Participants Insured) | | | 2.00 | | | | 01/31/2013 | | | | 2,000,000 | | | | 2,017,424 | |
| | | | |
| | | | | | | | | | | | | | | 4,028,950 | |
| | | | | | | | | | | | | | | | |
| | | | |
| Variable Rate Demand Notes §: 4.49% | | | | | | | | | | | | | | | | |
California State GO Kindergarten University Public Education Facilities Series 2003-A (GO, Bank of Montreal LOC) | | | 0.11 | | | | 05/01/2033 | | | | 18,700,000 | | | | 18,700,000 | |
California State GO Kindergarten University Public Education Facilities Series 2005-A (GO, Royal Bank of Canada LOC) | | | 0.11 | | | | 05/01/2040 | | | | 13,900,000 | | | | 13,900,000 | |
Morgan Hill CA RDA Tax Allocation Ojo de Agua Redevelopment Project A (Tax Revenue, Bank of Nova Scotia LOC) | | | 0.13 | | | | 09/01/2033 | | | | 10,000,000 | | | | 10,000,000 | |
Sacramento County CA Housing Authority Arlington Creek Apartment Series I (Housing Revenue, FNMA Insured, FNMA LIQ) | | | 0.15 | | | | 05/15/2034 | | | | 850,000 | | | | 850,000 | |
San Leandro CA Carlton Plaza Series A (Housing Revenue, FNMA Insured, FNMA LIQ) | | | 0.19 | | | | 09/15/2032 | | | | 2,500,000 | | | | 2,500,000 | |
| | | | |
| | | | | | | | | | | | | | | 45,950,000 | |
| | | | | | | | | | | | | | | | |
The accompanying notes are an integral part of these financial statements.
| | | | |
| 8 | | Wells Fargo Advantage Municipal Money Market Fund | | Portfolio of Investments—July 31, 2012 (Unaudited) |
| | | | | | | | | | | | | | | | |
| Security Name | | Interest Rate | | | Maturity Date | | | Principal | | | Value | |
| | | | | | | | | | | | | | | | |
| | | | |
Colorado : 1.05% | | | | | | | | | | | | | | | | |
| | | | |
| Variable Rate Demand Notes §: 1.05% | | | | | | | | | | | | | | | | |
Colorado HFA Ready Foods Incorporated Project Series A (IDR, U.S. Bank NA LOC) | | | 0.20 | % | | | 01/01/2032 | | | $ | 3,570,000 | | | $ | 3,570,000 | |
Colorado HFA Worldwest LLP Project Series 1999-A (IDR, UMB Bank Colorado LOC) 144A | | | 0.50 | | | | 09/01/2023 | | | | 3,230,000 | | | | 3,230,000 | |
Denver CO City & County Western Stock Show Project (IDR, U.S. Bank NA LOC) | | | 0.23 | | | | 07/01/2029 | | | | 1,710,000 | | | | 1,710,000 | |
Southern Ute Indian Tribe Reservation Colorado (Miscellaneous Revenue) 144A | | | 0.16 | | | | 04/01/2040 | | | | 1,000,000 | | | | 1,000,000 | |
Town of Hudson CO Series A (IDR, U.S. Bank NA LOC) | | | 0.31 | | | | 11/01/2020 | | | | 1,250,000 | | | | 1,250,000 | |
| | | | |
| | | | | | | | | | | | | | | 10,760,000 | |
| | | | | | | | | | | | | | | | |
| | | | |
District of Columbia : 0.66% | | | | | | | | | | | | | | | | |
| | | | |
| Variable Rate Demand Notes §: 0.66% | | | | | | | | | | | | | | | | |
District of Columbia Community Connection Real Estate Foundation Series 2007-A (Miscellaneous Revenue) | | | 0.15 | | | | 07/01/2032 | | | | 1,300,000 | | | | 1,300,000 | |
District of Columbia Enterprise Zone 14th & Irving (IDR, Bank of America NA LOC) | | | 0.65 | | | | 05/01/2022 | | | | 1,670,000 | | | | 1,670,000 | |
Metropolitan Washington DC Airport Authority Series 2855 (Airport Revenue, FSA-CR, FGIC Insured, JPMorgan Chase Bank LIQ) | | | 0.25 | | | | 10/01/2014 | | | | 3,755,000 | | | | 3,755,000 | |
| | | | |
| | | | | | | | | | | | | | | 6,725,000 | |
| | | | | | | | | | | | | | | | |
| | | | |
Florida : 5.92% | | | | | | | | | | | | | | | | |
| | | | |
| Other Municipal Debt : 0.86% | | | | | | | | | | | | | | | | |
Hillsborough County FL Capital Improvement Program Series A
(Miscellaneous Revenue) | | | 0.18 | | | | 08/30/2012 | | | | 2,200,000 | | | | 2,200,000 | |
JEA Florida Electric System Series 2000 F-1 (Utilities Revenue) | | | 0.17 | | | | 08/16/2012 | | | | 1,000,000 | | | | 1,000,000 | |
JEA Florida Electric System Series 2000 F-2 (Utilities Revenue) | | | 0.18 | | | | 08/14/2012 | | | | 5,600,000 | | | | 5,600,000 | |
| | | | |
| | | | | | | | | | | | | | | 8,800,000 | |
| | | | | | | | | | | | | | | | |
| | | | |
| Variable Rate Demand Notes §: 5.06% | | | | | | | | | | | | | | | | |
Alachua County FL Florida Rock Project (IDR, Bank of America NA LOC) | | | 0.94 | | | | 11/01/2022 | | | | 1,850,000 | | | | 1,850,000 | |
Alachua County FL HFA MFHR University Cove Apartments Project (Housing Revenue, FNMA Insured, FNMA LIQ) | | | 0.19 | | | | 06/15/2034 | | | | 1,850,000 | | | | 1,850,000 | |
Florida Housing Finance Corporation MFHR Mariner’s Cay Apartments Series 2008-M (Housing Revenue, FNMA Insured, FNMA LIQ) | | | 0.16 | | | | 12/15/2041 | | | | 1,860,000 | | | | 1,860,000 | |
Greater Orlando FL Aviation Authority Flight Safety International Project Series A (Airport Revenue) | | | 0.17 | | | | 10/01/2035 | | | | 6,380,000 | | | | 6,380,000 | |
Hillsborough County FL Aviation Authority Tampa International Airport PUTTER Series 2008-A (Airport Revenue, Assured Guaranty Insured, JPMorgan Chase Bank LIQ) 144A | | | 0.32 | | | | 10/01/2032 | | | | 8,505,000 | | | | 8,505,000 | |
Jacksonville FL HFA MFHR Christine Cove Apartments (Housing Revenue, California Bank & Trust LOC) | | | 0.19 | | | | 09/15/2038 | | | | 1,210,000 | | | | 1,210,000 | |
Lee County FL HFA SFHR Series 2908-Z (Housing Revenue, GNMA, FNMA Insured, JPMorgan Chase Bank LIQ) | | | 0.23 | | | | 09/01/2015 | | | | 3,295,000 | | | | 3,295,000 | |
Lee County FL HFA SFHR Series 2909-Z (Housing Revenue, GNMA, FNMA Insured, JPMorgan Chase Bank LIQ) | | | 0.23 | | | | 09/01/2015 | | | | 3,150,000 | | | | 3,150,000 | |
Miami-Dade County FL IDA Reflectone Incorporated Project Series 2000-A (IDR, Royal Bank of Canada LOC) | | | 0.22 | | | | 03/01/2024 | | | | 400,000 | | | | 400,000 | |
Orange County FL HFA MFHR Lakeside Pointe Apartments Series B (Housing Revenue, FNMA Insured) | | | 0.18 | | | | 05/15/2038 | | | | 6,830,000 | | | | 6,830,000 | |
Orange County FL HFA MFHR Marbella Pointe Series 2007-A (Housing Revenue, FHLB LOC, JPMorgan Chase Bank LIQ) | | | 0.19 | | | | 04/15/2040 | | | | 7,650,000 | | | | 7,650,000 | |
The accompanying notes are an integral part of these financial statements.
| | | | | | |
| Portfolio of Investments—July 31, 2012 (Unaudited) | | Wells Fargo Advantage Municipal Money Market Fund | | | 9 | |
| | | | | | | | | | | | | | | | |
| Security Name | | Interest Rate | | | Maturity Date | | | Principal | | | Value | |
| | | | | | | | | | | | | | | | |
| | | | |
| Variable Rate Demand Notes § (continued) | | | | | | | | | | | | | | | | |
Orange County FL HFFA Adventist Health System Sunbelt Obligated Group Series 1995 (Health Revenue) | | | 0.12 | % | | | 11/15/2026 | | | $ | 3,495,000 | | | $ | 3,495,000 | |
Pasco County FL PAC-MED Incorporated Project (IDR, Bank of America NA LOC) | | | 0.60 | | | | 08/01/2017 | | | | 700,000 | | | | 700,000 | |
Sarasota County FL Planned Parenthood Incorporated Project (Health Revenue, Harris NA LOC) | | | 0.18 | | | | 10/01/2041 | | | | 1,700,000 | | | | 1,700,000 | |
Tampa FL Baycare Health System Series B (Health Revenue) | | | 0.25 | | | | 11/15/2033 | | | | 3,000,000 | | | | 3,000,000 | |
| | | | |
| | | | | | | | | | | | | | | 51,875,000 | |
| | | | | | | | | | | | | | | | |
| | | | |
Georgia : 2.66% | | | | | | | | | | | | | | | | |
| | | | |
| Variable Rate Demand Notes §: 2.66% | | | | | | | | | | | | | | | | |
Atkinson & Coffee Counties GA Joint Development Authority Solid Waste Langboard Incorporated Project Series 2008 (Resource Recovery Revenue, CoBank ACB LOC) | | | 0.23 | | | | 11/01/2033 | | | | 16,800,000 | | | | 16,800,000 | |
Carroll County GA Development Authority Royal Metal Products Incorporated Project Series 2007 (IDR, Branch Banking & Trust LOC) | | | 0.24 | | | | 01/18/2027 | | | | 2,355,000 | | | | 2,355,000 | |
Georgia Port Authority Adjusted Colonels Island Terminal Project (IDR, Branch Banking & Trust LOC) | | | 0.24 | | | | 10/01/2023 | | | | 3,360,000 | | | | 3,360,000 | |
Georgia Port Authority Colonels Island Terminal Project (Port Authority Revenue, Branch Banking & Trust LOC) | | | 0.24 | | | | 06/01/2022 | | | | 3,000,000 | | | | 3,000,000 | |
Richmond County GA Development Authority MCG Health Incorporated Project Series B (Health Revenue, Branch Banking & Trust LOC) | | | 0.17 | | | | 07/01/2037 | | | | 1,755,000 | | | | 1,755,000 | |
| | | | |
| | | | | | | | | | | | | | | 27,270,000 | |
| | | | | | | | | | | | | | | | |
| | | | |
Idaho : 0.20% | | | | | | | | | | | | | | | | |
| | | | |
| Variable Rate Demand Note §: 0.20% | | | | | | | | | | | | | | | | |
Cassia County ID Industrial Development Corporation Oak Valley Heifers LLC (Resource Recovery Revenue, Northwest Farm Credit LOC) | | | 0.31 | | | | 06/01/2027 | | | | 2,000,000 | | | | 2,000,000 | |
| | | | | | | | | | | | | | | | |
| | | | |
Illinois : 3.26% | | | | | | | | | | | | | | | | |
| | | | |
| Other Municipal Debt : 0.28% | | | | | | | | | | | | | | | | |
Illinois Finance Authority Loyola University of Chicago Financing Program Series LOY (Education Revenue) | | | 0.16 | | | | 08/07/2012 | | | | 2,900,000 | | | | 2,900,000 | |
| | | | | | | | | | | | | | | | |
| | | | |
| Variable Rate Demand Notes §: 2.98% | | | | | | | | | | | | | | | | |
Chicago IL Enterprise Zone Gardner Gibson Project (IDR, Harris Trust & Savings Bank LOC) | | | 0.23 | | | | 07/01/2033 | | | | 2,810,000 | | | | 2,810,000 | |
East Peoria IL Commercial Development Kroger Company Project Series 2003 (IDR, Bank of Nova Scotia LOC) | | | 0.22 | | | | 12/01/2013 | | �� | | 3,125,000 | | | | 3,125,000 | |
Illinois Development Finance Authority MCL Incorporated Project (IDR, GE Capital Corporation LOC) | | | 0.42 | | | | 06/01/2017 | | | | 1,735,000 | | | | 1,735,000 | |
Illinois Development Finance Authority St. Ignatius College Series 1994 (Education Revenue, PNC Bank NA LOC) | | | 0.17 | | | | 06/01/2024 | | | | 1,800,000 | | | | 1,800,000 | |
Illinois Finance Authority Easter Seals Metro Chicago Incorporated Project Series 2007 (Miscellaneous Revenue, Harris NA LOC) | | | 0.17 | | | | 04/01/2037 | | | | 400,000 | | | | 400,000 | |
Illinois Finance Authority Merug LLC Series B (IDR, JPMorgan Chase Bank LOC) | | | 0.42 | | | | 12/01/2018 | | | | 535,000 | | | | 535,000 | |
Illinois Metropolitan Pier & Exposition Authority Series 3219 (Port Authority Revenue, Morgan Stanley Bank LIQ) 144A | | | 0.23 | | | | 06/15/2050 | | | | 2,400,000 | | | | 2,400,000 | |
Illinois State Finance Authority Hospital Sisters Services Series C (Health Revenue, AGM Insured, JPMorgan Chase Bank SPA) | | | 0.40 | | | | 03/15/2036 | | | | 11,425,000 | | | | 11,425,000 | |
The accompanying notes are an integral part of these financial statements.
| | | | |
| 10 | | Wells Fargo Advantage Municipal Money Market Fund | | Portfolio of Investments—July 31, 2012 (Unaudited) |
| | | | | | | | | | | | | | | | |
| Security Name | | Interest Rate | | | Maturity Date | | | Principal | | | Value | |
| | | | | | | | | | | | | | | | |
| | | | |
| Variable Rate Demand Notes § (continued) | | | | | | | | | | | | | | | | |
Lake County IL Brown Paper Goods Project (IDR, JPMorgan Chase Bank LOC) | | | 0.42 | % | | | 10/01/2021 | | | $ | 1,025,000 | | | $ | 1,025,000 | |
Lake County IL Northpoint Association (IDR, Northern Trust Company LOC) | | | 0.22 | | | | 07/01/2029 | | | | 2,600,000 | | | | 2,600,000 | |
Skokie IL Economic Development Revenue Skokie Fashion Square Project Series 1984 (IDR, Bank of America NA LOC) | | | 0.56 | | | | 12/01/2014 | | | | 1,850,000 | | | | 1,850,000 | |
West Frankfort IL Kroger Company Series 2004 (Miscellaneous Revenue, U.S. Bank NA LOC) | | | 0.22 | | | | 11/01/2012 | | | | 800,000 | | | | 800,000 | |
| | | | |
| | | | | | | | | | | | | | | 30,505,000 | |
| | | | | | | | | | | | | | | | |
| | | | |
Indiana : 2.03% | | | | | | | | | | | | | | | | |
| | | | |
| Other Municipal Debt : 0.10% | | | | | | | | | | | | | | | | |
Indiana State Bond Bank Advance Funding Program Series 2012-A (Miscellaneous Revenue) | | | 1.25 | | | | 01/03/2013 | | | | 1,000,000 | | | | 1,003,791 | |
| | | | | | | | | | | | | | | | |
| | | | |
| Variable Rate Demand Notes §: 1.93% | | | | | | | | | | | | | | | | |
Greensburg IN MFHR Community Partners Village II Project Series 2002 (Housing Revenue, FHLB LOC) | | | 0.17 | | | | 09/01/2029 | | | | 2,540,000 | | | | 2,540,000 | |
Indiana Finance Authority Midwestern Disaster Relief Ohio Valley Electric Corporation Project Series C (Miscellaneous Revenue, Bank of Nova Scotia LOC) | | | 0.15 | | | | 06/01/2040 | | | | 1,400,000 | | | | 1,400,000 | |
Indiana HFFA Fayette Memorial Hospital Association Series A (Health Revenue, U.S. Bank NA LOC) | | | 0.18 | | | | 10/01/2032 | | | | 945,000 | | | | 945,000 | |
Indiana State Development Finance Authority Goodwill Industries Central Project Series 1996 (IDR, JPMorgan Chase Bank LOC) | | | 0.21 | | | | 06/01/2016 | | | | 365,000 | | | | 365,000 | |
Indiana State Development Finance Authority Shelby Gravel Incorporated Project (IDR, PNC Bank NA LOC) | | | 0.28 | | | | 10/01/2017 | | | | 1,430,000 | | | | 1,430,000 | |
Indiana State Finance Authority Ascension Health Senior Credit Group Series E-4 (Miscellaneous Revenue) | | | 0.14 | | | | 11/15/2036 | | | | 1,000,000 | | | | 1,000,000 | |
Madison IN Arvin Sango Incorporated Project (IDR, Bank of Tokyo-Mitsubishi LOC) | | | 0.19 | | | | 08/01/2017 | | | | 3,600,000 | | | | 3,600,000 | |
Noblesville IN Greystone Apartments Project Series B (Housing Revenue, FHLB LOC) | | | 0.17 | | | | 03/01/2041 | | | | 1,480,000 | | | | 1,480,000 | |
St. Joseph County IN Economic Development Revenue Hannah & Friends Project Series 2007 (Miscellaneous Revenue, LaSalle Bank Midwest LOC) | | | 0.55 | | | | 11/01/2035 | | | | 1,985,000 | | | | 1,985,000 | |
St. Joseph County IN Midcorr Land Development LLC Project (IDR, PNC Bank NA LOC) | | | 0.28 | | | | 10/01/2023 | | | | 2,350,000 | | | | 2,350,000 | |
Wabash IN Economic Development Revenue Martin Yale Industries Project Series 1998 (IDR, JPMorgan Chase Bank LOC) | | | 0.42 | | | | 09/01/2028 | | | | 2,700,000 | | | | 2,700,000 | |
| | | | |
| | | | | | | | | | | | | | | 19,795,000 | |
| | | | | | | | | | | | | | | | |
| | | | |
Iowa : 2.36% | | | | | | | | | | | | | | | | |
| | | | |
| Variable Rate Demand Notes §: 2.36% | | | | | | | | | | | | | | | | |
Des Moines IA Elliot Aviation Project (Airport Revenue, U.S. Bank NA LOC) | | | 0.24 | | | | 08/01/2027 | | | | 4,910,000 | | | | 4,910,000 | |
Iowa Finance Authority Interwest Project Series 2001 (IDR, CoBank ACB LOC) | | | 0.23 | | | | 11/01/2016 | | | | 1,700,000 | | | | 1,700,000 | |
Iowa Finance Authority Midwestern Disaster Area Archer Daniels Midland Company Project Series 2011 (IDR) | | | 0.22 | | | | 12/01/2051 | | | | 3,000,000 | | | | 3,000,000 | |
Iowa Finance Authority Powerfilm Incorporated Project (IDR, Bank of America NA LOC) | | | 0.55 | | | | 06/01/2028 | | | | 1,415,000 | | | | 1,415,000 | |
Iowa Finance Authority SFHR Series 2006-F (Housing Revenue, GNMA, FNMA Insured, State Street Bank & Trust Company SPA) | | | 0.18 | | | | 07/01/2036 | | | | 9,925,000 | | | | 9,925,000 | |
Iowa Higher Education Loan Authority Private Colleges Ambrose (Education Revenue, Northern Trust Company LOC) | | | 0.17 | | | | 04/01/2033 | | | | 2,625,000 | | | | 2,625,000 | |
Iowa Higher Education Loan Authority University of Dubuque (Education Revenue, Northern Trust Company LOC) | | | 0.17 | | | | 04/01/2035 | | | | 600,000 | | | | 600,000 | |
| | | | |
| | | | | | | | | | | | | | | 24,175,000 | |
| | | | | | | | | | | | | | | | |
The accompanying notes are an integral part of these financial statements.
| | | | | | |
| Portfolio of Investments—July 31, 2012 (Unaudited) | | Wells Fargo Advantage Municipal Money Market Fund | | | 11 | |
| | | | | | | | | | | | | | | | |
| Security Name | | Interest Rate | | | Maturity Date | | | Principal | | | Value | |
| | | | | | | | | | | | | | | | |
| | | | |
Kansas : 0.43% | | | | | | | | | | | | | | | | |
| | | | |
| Variable Rate Demand Notes §: 0.43% | | | | | | | | | | | | | | | | |
Olathe KS Insulite Glass Company Incorporated Project Series 2000 (IDR, U.S. Bank NA LOC) | | | 0.26 | % | | | 06/01/2020 | | | $ | 825,000 | | | $ | 825,000 | |
Olathe KS ISL LLC Project (IDR, U.S. Bank NA LOC) | | | 0.25 | | | | 08/01/2027 | | | | 3,540,000 | | | | 3,540,000 | |
| | | | |
| | | | | | | | | | | | | | | 4,365,000 | |
| | | | | | | | | | | | | | | | |
| | | | |
Kentucky : 1.23% | | | | | | | | | | | | | | | | |
| | | | |
| Variable Rate Demand Notes §: 1.23% | | | | | | | | | | | | | | | | |
Bardstown KY Industrial Building Linpac Materials Handling Project (IDR, U.S. Bank NA LOC) | | | 0.24 | | | | 10/01/2019 | | | | 2,790,000 | | | | 2,790,000 | |
Jefferson County KY Industrial Building Dant Growth LLC Project Series 2002 (IDR, Stock Yards Bank & Trust LOC) | | | 0.28 | | | | 09/01/2022 | | | | 2,450,000 | | | | 2,450,000 | |
Kentucky EDFA Madonna Manor Project PUTTER (Miscellaneous Revenue, Bank of America NA LIQ) 144A | | | 0.43 | | | | 12/01/2039 | | | | 2,500,000 | | | | 2,500,000 | |
Kentucky State Housing Corporation Series A PUTTER (Housing Revenue, JPMorgan Chase Bank LIQ) 144A | | | 0.25 | | | | 07/01/2022 | | | | 1,000,000 | | | | 1,000,000 | |
Kentucky State Housing Corporation Series B (Housing Revenue, State Street Bank & Trust Company SPA) | | | 0.18 | | | | 07/01/2032 | | | | 1,530,000 | | | | 1,530,000 | |
Logan County KY Solid Waste Disposal Waste Management LLC Project (Resource Recovery Revenue, PNC Bank NA LOC) | | | 0.20 | | | | 03/01/2021 | | | | 1,450,000 | | | | 1,450,000 | |
Montgomery County KY Industrial Building Facilities Fineblanking Corporation Project Series 1996 (IDR, Bank of America NA LOC) | | | 0.55 | | | | 08/01/2015 | | | | 930,000 | | | | 930,000 | |
| | | | |
| | | | | | | | | | | | | | | 12,650,000 | |
| | | | | | | | | | | | | | | | |
| | | | |
Louisiana : 1.27% | | | | | | | | | | | | | | | | |
| | | | |
| Variable Rate Demand Notes §: 1.27% | | | | | | | | | | | | | | | | |
Louisiana HFA Arbor Place Apartments Project Series 2008 (Housing Revenue, FHLMC Insured, FHLMC LIQ) | | | 0.20 | | | | 03/01/2043 | | | | 8,015,000 | | | | 8,015,000 | |
Louisiana Local Government Environmental Facilities CDA Honeywell International Incorporated Project (IDR) | | | 0.35 | | | | 12/01/2036 | | | | 4,000,000 | | | | 4,000,000 | |
Louisiana State Series A-1 Royal Bank of Canada Municipal Products Incorporated Trust Series 0-31 (Tax Revenue, Royal Bank of Canada LIQ) 144A | | | 0.15 | | | | 05/01/2034 | | | | 1,000,000 | | | | 1,000,000 | |
| | | | |
| | | | | | | | | | | | | | | 13,015,000 | |
| | | | | | | | | | | | | | | | |
| | | | |
Maine : 0.38% | | | | | | | | | | | | | | | | |
| | | | |
| Variable Rate Demand Note §: 0.38% | | | | | | | | | | | | | | | | |
Maine Housing Authority Mortgage Purchase Program Series 2004-D-3 (Housing Revenue, State Street Bank & Trust Company SPA) | | | 0.21 | | | | 11/15/2039 | | | | 3,900,000 | | | | 3,900,000 | |
| | | | | | | | | | | | | | | | |
| | | | |
Maryland : 0.61% | | | | | | | | | | | | | | | | |
| | | | |
| Other Municipal Debt : 0.40% | | | | | | | | | | | | | | | | |
Montgomery County MD Consolidated Public Improvement BAN Series 2010-A (Miscellaneous Revenue) | | | 0.16 | | | | 08/07/2012 | | | | 4,100,000 | | | | 4,100,000 | |
| | | | | | | | | | | | | | | | |
| | | | |
| Variable Rate Demand Note §: 0.21% | | | | | | | | | | | | | | | | |
Maryland State Health & HEFA Stella Maris Issue Series 1997 (Health Revenue, Manufacturers & Traders Bank LOC) | | | 0.16 | | | | 07/01/2021 | | | | 2,115,000 | | | | 2,115,000 | |
| | | | | | | | | | | | | | | | |
The accompanying notes are an integral part of these financial statements.
| | | | |
| 12 | | Wells Fargo Advantage Municipal Money Market Fund | | Portfolio of Investments—July 31, 2012 (Unaudited) |
| | | | | | | | | | | | | | | | |
| Security Name | | Interest Rate | | | Maturity Date | | | Principal | | | Value | |
| | | | | | | | | | | | | | | | |
| | | | |
Massachusetts : 0.49% | | | | | | | | | | | | | | | | |
| | | | |
| Other Municipal Debt : 0.49% | | | | | | | | | | | | | | | | |
Massachusetts Port Authority Series 2012-B (Port Authority Revenue) | | | 0.20 | % | | | 08/08/2012 | | | $ | 5,000,000 | | | $ | 5,000,000 | |
| | | | | | | | | | | | | | | | |
| | | | |
Michigan : 4.22% | | | | | | | | | | | | | | | | |
| | | | |
| Other Municipal Debt : 0.91% | | | | | | | | | | | | | | | | |
Michigan State Hospital Finance Authority Trinity Health Credit Group Series 2008-C (Health Revenue) | | | 0.14 | | | | 08/07/2012 | | | | 3,500,000 | | | | 3,500,000 | |
Michigan State University Board of Trustees Series D (Education Revenue) | | | 0.18 | | | | 10/15/2012 | | | | 3,250,000 | | | | 3,250,000 | |
University of Michigan Series B (Education Revenue) | | | 0.14 | | | | 08/07/2012 | | | | 2,600,000 | | | | 2,600,000 | |
| | | | |
| | | | | | | | | | | | | | | 9,350,000 | |
| | | | | | | | | | | | | | | | |
| | | | |
| Variable Rate Demand Notes §: 3.31% | | | | | | | | | | | | | | | | |
Green Lake Township MI Economic Development Corporation (Miscellaneous Revenue, Harris NA LOC) | | | 0.17 | | | | 06/01/2034 | | | | 800,000 | | | | 800,000 | |
Michigan Higher Education Authority Student Loan Royal Bank of Canada Municipal Products Incorporated Trust Certificate Series L-33 (Education Revenue, Royal Bank of Canada LOC, Royal Bank of Canada LIQ) | | | 0.19 | | | | 09/01/2026 | | | | 20,495,000 | | | | 20,495,000 | |
Michigan State Hospital Finance Authority Ascension Health Group Series 2010-8 (Health Revenue) (i) | | | 0.24 | | | | 11/15/2049 | | | | 7,100,000 | | | | 7,100,000 | |
Michigan State Hospital Finance Authority Trinity Health Credit Group Series 2011 Royal Bank of Canada Municipal Products Incorporated Trust Certificates Series 0-32 (Health Revenue, Royal Bank of Canada LIQ) 144A | | | 0.15 | | | | 06/01/2020 | | | | 1,000,000 | | | | 1,000,000 | |
Michigan State Strategic Fund Fitz Land LLC Project (IDR, PNC Bank NA LOC) | | | 0.28 | | | | 08/01/2025 | | | | 680,000 | | | | 680,000 | |
Michigan State Strategic Fund Limited Methodist Children’s Home Project Series 1995 (Health Revenue, Bank One Michigan LOC) | | | 0.57 | | | | 08/01/2015 | | | | 200,000 | | | | 200,000 | |
Michigan State University Board of Trustees Series 2005 (Education Revenue, Bank of New York Mellon Trust SPA) | | | 0.15 | | | | 02/15/2034 | | | | 1,640,000 | | | | 1,640,000 | |
University of Michigan Board of Regents GO Series 2012-A (Education Revenue) | | | 0.12 | | | | 04/01/2036 | | | | 2,000,000 | | | | 2,000,000 | |
| | | | |
| | | | | | | | | | | | | | | 33,915,000 | |
| | | | | | | | | | | | | | | | |
| | | | |
Minnesota : 6.92% | | | | | | | | | | | | | | | | |
| | | | |
| Other Municipal Debt : 0.59% | | | | | | | | | | | | | | | | |
Regents of the University of Minnesota Series 2005-A (Education Revenue) | | | 0.14 | | | | 08/07/2012 | | | | 4,060,000 | | | | 4,060,000 | |
Rochester Minnesota HCFR Mayo Foundation Series 2000-A (Health Revenue) | | | 0.16 | | | | 08/21/2012 | | | | 2,000,000 | | | | 2,000,000 | |
| | | | |
| | | | | | | | | | | | | | | 6,060,000 | |
| | | | | | | | | | | | | | | | |
| | | | |
| Variable Rate Demand Notes §: 6.33% | | | | | | | | | | | | | | | | |
Becker MN Plymouth Foam Project (IDR, U.S. Bank NA LOC) | | | 0.37 | | | | 05/01/2019 | | | | 1,460,000 | | | | 1,460,000 | |
Bloomington MN Refunding MFHR Norlan Partnership Series A-1 (Housing Revenue, FNMA Insured, FNMA LIQ) | | | 0.18 | | | | 07/15/2032 | | | | 5,090,000 | | | | 5,090,000 | |
Coon Rapids MN Drake Apartments Project A (Housing Revenue, FNMA Insured, FNMA LIQ) | | | 0.18 | | | | 06/15/2038 | | | | 2,755,000 | | | | 2,755,000 | |
Dakota County MN CDA View Pointe Apartments Project Series 2007-A (Housing Revenue, FNMA Insured, FNMA LIQ) | | | 0.18 | | | | 01/15/2038 | | | | 1,000,000 | | | | 1,000,000 | |
Forest Lake MN Kilkenny Court Apartments Project Series 2008 (Housing Revenue, FNMA Insured, FNMA LIQ) | | | 0.16 | | | | 08/15/2038 | | | | 400,000 | | | | 400,000 | |
Hennepin County MN Housing & RDA Stone Arch Apartments Project (Housing Revenue, FNMA Insured, FNMA LIQ) | | | 0.21 | | | | 04/15/2035 | | | | 2,800,000 | | | | 2,800,000 | |
The accompanying notes are an integral part of these financial statements.
| | | | | | |
| Portfolio of Investments—July 31, 2012 (Unaudited) | | Wells Fargo Advantage Municipal Money Market Fund | | | 13 | |
| | | | | | | | | | | | | | | | |
| Security Name | | Interest Rate | | | Maturity Date | | | Principal | | | Value | |
| | | | | | | | | | | | | | | | |
| | | | |
| Variable Rate Demand Notes § (continued) | | | | | | | | | | | | | | | | |
Mahtomedi MN Briarcliff Manor Apartments Series A (Housing Revenue, FNMA Insured, FNMA LIQ) | | | 0.18 | % | | | 06/15/2038 | | | $ | 3,645,000 | | | $ | 3,645,000 | |
Minneapolis MN CDA C&G Partners Project (Miscellaneous Revenue, U.S. Bank NA LOC) | | | 0.17 | | | | 12/01/2015 | | | | 160,000 | | | | 160,000 | |
Minneapolis MN Driftwood Apartments Project A (Housing Revenue, U.S. Bank NA LOC) | | | 0.21 | | | | 10/01/2024 | | | | 4,240,000 | | | | 4,240,000 | |
Minneapolis MN MacPhail Center for Music Project (Miscellaneous Revenue, U.S. Bank NA LOC) | | | 0.18 | | | | 08/01/2036 | | | | 930,000 | | | | 930,000 | |
Minneapolis MN MFHR Stone Arch Apartments (Housing Revenue, FNMA Insured, FNMA LIQ) | | | 0.21 | | | | 04/15/2035 | | | | 3,600,000 | | | | 3,600,000 | |
Minneapolis MN Minnehaha Academy Project (Education Revenue, U.S. Bank NA LOC) | | | 0.18 | | | | 05/01/2026 | | | | 603,000 | | | | 603,000 | |
Minnesota Agriculture & EDA Como Partnership Project Series 1996 (IDR, U.S. Bank NA LOC) | | | 0.31 | | | | 05/01/2016 | | | | 690,000 | | | | 690,000 | |
Minnesota Bond Securitization Trust Certificate Carleton Lofts Project Class A (Miscellaneous Revenue, U.S. Bank NA LOC) | | | 0.30 | | | | 12/01/2048 | | | | 7,945,000 | | | | 7,945,000 | |
Minnesota Bond Securitization Trust Series S1 (Miscellaneous Revenue, PNC Bank NA LOC) | | | 0.30 | | | | 02/01/2027 | | | | 1,430,000 | | | | 1,430,000 | |
Minnesota State HFA Residential Housing Finance Series C (Housing Revenue, FHLB SPA) | | | 0.16 | | | | 07/01/2036 | | | | 300,000 | | | | 300,000 | |
Minnesota State HFA Residential Housing Finance Series C (Housing Revenue, Royal Bank of Canada SPA) | | | 0.18 | | | | 01/01/2035 | | | | 3,400,000 | | | | 3,400,000 | |
Minnesota State HFA Residential Housing Finance Series G (Housing Revenue, Royal Bank of Canada SPA) | | | 0.18 | | | | 01/01/2032 | | | | 2,500,000 | | | | 2,500,000 | |
Ramsey County MN Housing & Redevelopment MFHR Gateway Apartments LP Series A (Housing Revenue, Bank of America NA LOC) | | | 0.47 | | | | 10/01/2038 | | | | 2,600,000 | | | | 2,600,000 | |
St. Anthony MN Landings Silver Lake Project Series 2007 (Housing Revenue, Bank of America NA LOC) | | | 0.57 | | | | 10/01/2037 | | | | 1,400,000 | | | | 1,400,000 | |
St. Anthony MN Landings Silver Lake Project Series A (Housing Revenue, Bank of America NA LOC) | | | 0.47 | | | | 10/01/2037 | | | | 3,600,000 | | | | 3,600,000 | |
St. Paul MN Housing & RDA Hampden Square Apartments Series A (Housing Revenue, FNMA Insured, FNMA LIQ) | | | 0.18 | | | | 06/01/2032 | | | | 2,140,000 | | | | 2,140,000 | |
St. Paul MN Housing & RDA Leased Housing Association Series A (Housing Revenue, Bank of America NA LOC) | | | 0.57 | | | | 09/01/2035 | | | | 2,595,000 | | | | 2,595,000 | |
Stevens County MN Solid Waste Disposal Riverview Dairy Project Series 2007 (Resource Recovery Revenue, AgCountry Farm Credit Services LOC) | | | 0.26 | | | | 08/01/2032 | | | | 2,650,000 | | | | 2,650,000 | |
Swift County MN Solid Waste Disposal East Dublin Dairy LLP Project Series 2008 (Resource Recovery Revenue, AgCountry Farm Credit Services LOC) | | | 0.26 | | | | 04/01/2033 | | | | 6,950,000 | | | | 6,950,000 | |
| | | | |
| | | | | | | | | | | | | | | 64,883,000 | |
| | | | | | | | | | | | | | | | |
| | | | |
Mississippi : 1.41% | | | | | | | | | | | | | | | | |
| | | | |
| Variable Rate Demand Note §: 1.41% | | | | | | | | | | | | | | | | |
Mississippi State Series A Clipper Tax-Exempt Certificate Trust Series 2009-60 (Miscellaneous Revenue, State Street Bank & Trust Company LIQ) | | | 0.20 | | | | 02/01/2016 | | | | 14,500,000 | | | | 14,500,000 | |
| | | | | | | | | | | | | | | | |
| | | | |
Missouri : 1.69% | | | | | | | | | | | | | | | | |
| | | | |
| Other Municipal Debt : 0.35% | | | | | | | | | | | | | | | | |
University of Missouri Curators Series A (Education Revenue) | | | 0.15 | | | | 08/07/2012 | | | | 3,600,000 | | | | 3,600,000 | |
| | | | | | | | | | | | | | | | |
The accompanying notes are an integral part of these financial statements.
| | | | |
| 14 | | Wells Fargo Advantage Municipal Money Market Fund | | Portfolio of Investments—July 31, 2012 (Unaudited) |
| | | | | | | | | | | | | | | | |
| Security Name | | Interest Rate | | | Maturity Date | | | Principal | | | Value | |
| | | | | | | | | | | | | | | | |
| | | | |
| Variable Rate Demand Notes §: 1.34% | | | | | | | | | | | | | | | | |
Kansas City MO IDA Ewing Marion Kauffman Foundation Series 1997-A (Miscellaneous Revenue) | | | 0.17 | % | | | 04/01/2027 | | | $ | 2,495,000 | | | $ | 2,495,000 | |
Missouri State HEFA Ascension Health Series C-3 (Health Revenue) | | | 0.13 | | | | 11/15/2039 | | | | 3,000,000 | | | | 3,000,000 | |
Missouri State HEFA Ascension Health Series C-4 (Health Revenue) | | | 0.13 | | | | 11/15/2026 | | | | 1,000,000 | | | | 1,000,000 | |
Missouri State Housing Development Commission Homeowner Loan Program Series C-1 Clipper Tax-Exempt Certificate Trust Series 2009-12 (Miscellaneous Revenue, State Street Bank & Trust Company LIQ) | | | 0.30 | | | | 03/01/2038 | | | | 1,000,000 | | | | 1,000,000 | |
St. Charles County MO IDA Craftsmen Industries Project Series 1998-A (IDR, U.S. Bank NA LOC) | | | 0.27 | | | | 12/01/2019 | | | | 4,370,000 | | | | 4,370,000 | |
St. Charles County MO IDA Kuenz Heating & Sheet Metal Series 2001 (IDR, U.S. Bank NA LOC) | | | 0.32 | | | | 04/01/2026 | | | | 1,840,000 | | | | 1,840,000 | |
| | | | |
| | | | | | | | | | | | | | | 13,705,000 | |
| | | | | | | | | | | | | | | | |
| | | | |
Nebraska : 0.45% | | | | | | | | | | | | | | | | |
| | | | |
| Variable Rate Demand Notes §: 0.45% | | | | | | | | | | | | | | | | |
Douglas County NE James Skinner Company Project Series 1999 (IDR, U.S. Bank NA LOC) | | | 0.26 | | | | 12/01/2012 | | | | 300,000 | | | | 300,000 | |
Nebraska Investment Finance Authority MFHR Apple Creek Associates Project Series 1985-A (Housing Revenue, Northern Trust Company LOC) | | | 0.26 | | | | 09/01/2031 | | | | 4,310,000 | | | | 4,310,000 | |
| | | | |
| | | | | | | | | | | | | | | 4,610,000 | |
| | | | | | | | | | | | | | | | |
| | | | |
Nevada : 0.67% | | | | | | | | | | | | | | | | |
| | | | |
| Variable Rate Demand Notes §: 0.67% | | | | | | | | | | | | | | | | |
Nevada State Housing Division Vista Creek Apartments (Housing Revenue, East West Bank LOC, FHLB SPA) | | | 0.17 | | | | 04/15/2041 | | | | 3,000,000 | | | | 3,000,000 | |
Reno NV Senior Lien Transportation Rail Access Corridor Project Series 2008-A (Tax Revenue, Bank of New York Mellon LOC) | | | 0.17 | | | | 06/01/2042 | | | | 3,900,000 | | | | 3,900,000 | |
| | | | |
| | | | | | | | | | | | | | | 6,900,000 | |
| | | | | | | | | | | | | | | | |
| | | | |
New Jersey : 3.79% | | | | | | | | | | | | | | | | |
| | | | |
| Variable Rate Demand Notes §: 3.79% | | | | | | | | | | | | | | | | |
Clipper Tax-Exempt Certificate Trust Series 2009-32 Certificate Partner (Miscellaneous Revenue, State Street Bank & Trust Company LIQ) | | | 0.20 | | | | 01/01/2018 | | | | 7,650,000 | | | | 7,650,000 | |
New Jersey EDA National Gas Company Series C (Utilities Revenue) | | | 0.20 | | | | 08/01/2041 | | | | 11,200,000 | | | | 11,200,000 | |
New Jersey Educational Facilities Authority Defense Analyses Issue Series 2000-D (Miscellaneous Revenue, Branch Banking & Trust LOC, AMBAC Insured) | | | 0.16 | | | | 10/01/2030 | | | | 125,000 | | | | 125,000 | |
New Jersey Higher Education Assistance Authority Student Loan ROC RR-II-R-11853 (Education Revenue, Assured Guaranty Insured, Citibank NA LIQ) 144A | | | 0.30 | | | | 06/01/2016 | | | | 15,900,000 | | | | 15,900,000 | |
New Jersey State TRAN Series A (Miscellaneous Revenue) (i) | | | 0.50 | | | | 06/27/2013 | | | | 4,000,000 | | | | 4,000,750 | |
| | | | |
| | | | | | | | | | | | | | | 38,875,750 | |
| | | | | | | | | | | | | | | | |
| | | | |
New Mexico : 0.28% | | | | | | | | | | | | | | | | |
| | | | |
| Variable Rate Demand Note §: 0.28% | | | | | | | | | | | | | | | | |
New Mexico Educational Assistance Foundation (Education Revenue, Royal Bank of Canada LOC, Guaranteed Student Loans Insured) | | | 0.18 | | | | 04/01/2034 | | | | 2,905,000 | | | | 2,905,000 | |
| | | | | | | | | | | | | | | | |
The accompanying notes are an integral part of these financial statements.
| | | | | | |
| Portfolio of Investments—July 31, 2012 (Unaudited) | | Wells Fargo Advantage Municipal Money Market Fund | | | 15 | |
| | | | | | | | | | | | | | | | |
| Security Name | | Interest Rate | | | Maturity Date | | | Principal | | | Value | |
| | | | | | | | | | | | | | | | |
| | | | |
New York : 7.39% | | | | | | | | | | | | | | | | |
| | | | |
| Other Municipal Debt : 0.49% | | | | | | | | | | | | | | | | |
Metropolitan Transportation Authority New York Credit Enhanced Transportation BAN Series 2 Subseries A (Transportation Revenue) | | | 0.18 | % | | | 10/04/2012 | | | $ | 3,000,000 | | | $ | 3,000,000 | |
New York City NY Housing Development Corporation Multi-Family Series H-2 (Housing Revenue) | | | 0.32 | | | | 05/01/2013 | | | | 2,000,000 | | | | 2,000,000 | |
| | | | |
| | | | | | | | | | | | | | | 5,000,000 | |
| | | | | | | | | | | | | | | | |
| | | | |
| Variable Rate Demand Notes §: 6.90% | | | | | | | | | | | | | | | | |
JPMorgan Chase PUTTER Trust Series 4070 (Utilities Revenue, BHAC-CR, FSA-CR, AMBAC Insured, JPMorgan Chase & Company LIQ) 144A | | | 0.18 | | | | 03/01/2014 | | | | 6,855,000 | | | | 6,855,000 | |
New York City NY Housing Development Corporation Multi-Family Series C (Housing Revenue) | | | 0.27 | | | | 05/01/2045 | | | | 2,300,000 | | | | 2,300,000 | |
New York City NY Housing Development Corporation Multi-Family Series H-2 (Housing Revenue) | | | 0.25 | | | | 05/01/2041 | | | | 1,000,000 | | | | 1,000,000 | |
New York City NY Housing Development Corporation State Renaissance LLC Series A (Housing Revenue, FNMA LIQ) | | | 0.17 | | | | 06/01/2037 | | | | 6,500,000 | | | | 6,500,000 | |
New York Metropolitan Transportation Authority Series 2006-B ROC RR-II-R-11711 (Transportation Revenue, FSA Insured, Citibank NA LIQ) 144A | | | 0.30 | | | | 11/15/2027 | | | | 15,300,000 | | | | 15,300,000 | |
New York Mortgage Agency Series 106 ROC RR-II-R-11708 (Housing Revenue, Citibank NA LIQ) 144A | | | 0.40 | | | | 10/01/2028 | | | | 6,350,000 | | | | 6,350,000 | |
New York State Dormitory Authority Series 12 Clipper Tax-Exempt Certificate Trust Series 2009-35 (Miscellaneous Revenue, State Street Bank & Trust Company LIQ) | | | 0.18 | | | | 11/15/2026 | | | | 2,500,000 | | | | 2,500,000 | |
New York State Dormitory Authority Series 14 Clipper Tax-Exempt Certificate Trust Series 2009-45 (Miscellaneous Revenue, State Street Bank & Trust Company LIQ) | | | 0.15 | | | | 07/01/2025 | | | | 16,220,000 | | | | 16,220,000 | |
New York State HFA 388 Bridge Street Series 2012-A (Housing Revenue, Manufacturers & Traders Bank LOC) | | | 0.16 | | | | 05/01/2046 | | | | 1,400,000 | | | | 1,400,000 | |
New York State HFA 600 West 42nd Street Series 2012-A (Housing Revenue, FNMA LIQ) | | | 0.17 | | | | 05/15/2041 | | | | 10,000,000 | | | | 10,000,000 | |
Riverhead NY IDR Central Suffolk Hospital Project A (Health Revenue, Manufacturers & Traders Bank LOC) | | | 0.18 | | | | 07/01/2031 | | | | 1,360,000 | | | | 1,360,000 | |
Riverhead NY IDR Central Suffolk Hospital Project B (Health Revenue, Manufacturers & Traders Bank LOC) | | | 0.18 | | | | 07/01/2031 | | | | 1,000,000 | | | | 1,000,000 | |
| | | | |
| | | | | | | | | | | | | | | 70,785,000 | |
| | | | | | | | | | | | | | | | |
| | | | |
North Carolina : 0.96% | | | | | | | | | | | | | | | | |
| | | | |
| Variable Rate Demand Notes §: 0.96% | | | | | | | | | | | | | | | | |
North Carolina State HFA Home Ownership Series C (Housing Revenue, TD Bank NA SPA) | | | 0.17 | | | | 07/01/2032 | | | | 1,740,000 | | | | 1,740,000 | |
Rockingham County NC Industrial Facilities & PCFA Innofa USA Project Series 2007 (IDR, Branch Banking & Trust LOC) | | | 0.24 | | | | 12/01/2026 | | | | 3,000,000 | | | | 3,000,000 | |
Stanly County NC Industrial Facilities & PCFA Chicago Tube Company (IDR, JPMorgan Chase Bank LOC) | | | 0.22 | | | | 04/01/2018 | | | | 5,125,000 | | | | 5,125,000 | |
| | | | |
| | | | | | | | | | | | | | | 9,865,000 | |
| | | | | | | | | | | | | | | | |
| | | | |
North Dakota : 4.42% | | | | | | | | | | | | | | | | |
| | | | |
| Other Municipal Debt : 0.59% | | | | | | | | | | | | | | | | |
Mercer County ND PCR Basin Electric Power Cooperative Series 2009-1 (Utilities Revenue) | | | 0.30 | | | | 08/07/2012 | | | | 5,000,000 | | | | 5,000,000 | |
The accompanying notes are an integral part of these financial statements.
| | | | |
| 16 | | Wells Fargo Advantage Municipal Money Market Fund | | Portfolio of Investments—July 31, 2012 (Unaudited) |
| | | | | | | | | | | | | | | | |
| Security Name | | Interest Rate | | | Maturity Date | | | Principal | | | Value | |
| | | | | | | | | | | | | | | | |
| | | | |
| Other Municipal Debt (continued) | | | | | | | | | | | | | | | | |
North Dakota State Water Finance Corporation Public Projects Construction Series B-1 (Miscellaneous Revenue) | | | 0.37 | % | | | 07/01/2013 | | | $ | 1,000,000 | | | $ | 1,000,000 | |
| | | | |
| | | | | | | | | | | | | | | 6,000,000 | |
| | | | | | | | | | | | | | | | |
| | | | |
| Variable Rate Demand Notes §: 3.83% | | | | | | | | | | | | | | | | |
North Dakota State HFA Home Mortgage Finance Program Series A (Housing Revenue, Federal Home Loan Bank SPA) | | | 0.19 | | | | 01/01/2036 | | | | 3,195,000 | | | | 3,195,000 | |
North Dakota State HFA Home Mortgage Finance Program Series B (Housing Revenue, Federal Home Loan Bank SPA) | | | 0.19 | | | | 07/01/2034 | | | | 2,000,000 | | | | 2,000,000 | |
North Dakota State HFA Home Mortgage Finance Program Series A
(Housing Revenue, GO of Agency Insured, FHLB SPA) | | | 0.15 | | | | 07/01/2037 | | | | 3,000,000 | | | | 3,000,000 | |
North Dakota State HFA Home Mortgage Finance Program Series B
(Housing Revenue, FHLB SPA) | | | 0.15 | | | | 01/01/2030 | | | | 1,430,000 | | | | 1,430,000 | |
Richland County ND Recovery Zone Project Series 2010-C (IDR, CoBank ACB LOC) | | | 0.16 | | | | 11/01/2028 | | | | 2,315,000 | | | | 2,315,000 | |
Traill County ND IDR American Crystal Project (Resource Recovery Revenue, CoBank ACB LOC) | | | 0.23 | | | | 09/01/2017 | | | | 27,330,000 | | | | 27,330,000 | |
| | | | |
| | | | | | | | | | | | | | | 39,270,000 | |
| | | | | | | | | | | | | | | | |
| | | | |
Ohio : 2.73% | | | | | | | | | | | | | | | | |
| | | | |
| Variable Rate Demand Notes §: 2.73% | | | | | | | | | | | | | | | | |
Allen County OH Catholic Health Partners Series B (Health Revenue) | | | 0.14 | | | | 05/01/2036 | | | | 2,700,000 | | | | 2,700,000 | |
Allen County OH Catholic Health Partners Series C (Health Revenue, Union Bank NA LOC) | | | 0.15 | | | | 06/01/2034 | | | | 2,200,000 | | | | 2,200,000 | |
Franklin County OH Lifeline Shelter Systems Project (IDR, Bank One NA LOC) | | | 0.57 | | | | 10/01/2021 | | | | 975,000 | | | | 975,000 | |
Madeira OH Economic Development Kroger Company Series 2004 (IDR, Bank of Nova Scotia LOC) | | | 0.22 | | | | 11/01/2012 | | | | 2,050,000 | | | | 2,050,000 | |
Montgomery County OH Cambridge Commons Apartments A (Housing Revenue, FHLB LOC) | | | 0.18 | | | | 04/01/2038 | | | | 1,145,000 | | | | 1,145,000 | |
Ohio State Water Development Authority First Energy Generation Series B (IDR, Bank of Nova Scotia LOC) | | | 0.15 | | | | 10/01/2033 | | | | 10,975,000 | | | | 10,975,000 | |
Stark County OH Kroger Company Series 2004 (IDR, Bank of Nova Scotia LOC) | | | 0.22 | | | | 09/01/2012 | | | | 3,100,000 | | | | 3,100,000 | |
Tuscarawas County OH Port Authority Plymouth Incorporated Project (IDR, U.S. Bank NA LOC) | | | 0.22 | | | | 08/01/2038 | | | | 4,810,000 | | | | 4,810,000 | |
| | | | |
| | | | | | | | | | | | | | | 27,955,000 | |
| | | | | | | | | | | | | | | | |
| | | | |
Oklahoma : 0.10% | | | | | | | | | | | | | | | | |
| | | | |
| Variable Rate Demand Note §: 0.10% | | | | | | | | | | | | | | | | |
Oklahoma Development Finance Authority Industrial Development Tracker Marine Project (Miscellaneous Revenue, Bank of America NA LOC) | | | 0.65 | | | | 03/01/2018 | | | | 1,025,000 | | | | 1,025,000 | |
| | | | | | | | | | | | | | | | |
| | | | |
Oregon : 0.27% | | | | | | | | | | | | | | | | |
| | | | |
| Variable Rate Demand Notes §: 0.27% | | | | | | | | | | | | | | | | |
Oregon State Beef Northwest Feeders Incorporated Series 1999 (Resource Recovery Revenue, Northwest Farm Credit LOC) | | | 0.35 | | | | 01/01/2016 | | | | 735,000 | | | | 735,000 | |
Oregon State Health & Science University Series B-2 (Education Revenue, Union Bank NA LOC) | | | 0.15 | | | | 07/01/2042 | | | | 2,000,000 | | | | 2,000,000 | |
| | | | |
| | | | | | | | | | | | | | | 2,735,000 | |
| | | | | | | | | | | | | | | | |
The accompanying notes are an integral part of these financial statements.
| | | | | | |
| Portfolio of Investments—July 31, 2012 (Unaudited) | | Wells Fargo Advantage Municipal Money Market Fund | | | 17 | |
| | | | | | | | | | | | | | | | |
| Security Name | | Interest Rate | | | Maturity Date | | | Principal | | | Value | |
| | | | | | | | | | | | | | | | |
| | | | |
Other : 9.47% | | | | | | | | | | | | | | | | |
| | | | |
| Variable Rate Demand Notes §: 9.47% | | | | | | | | | | | | | | | | |
Clipper Tax-Exempt Certificate Trust Series 2007-19 (Miscellaneous Revenue, State Street Bank & Trust Company LIQ) | | | 0.30 | % | | | 09/01/2039 | | | $ | 6,974,000 | | | $ | 6,974,000 | |
Clipper Tax-Exempt Certificate Trust Series 2009-10 (Miscellaneous Revenue, State Street Bank & Trust Company LIQ) | | | 0.30 | | | | 12/01/2035 | | | | 1,703,000 | | | | 1,703,000 | |
Clipper Tax-Exempt Certificate Trust Series 2009-26 (Miscellaneous Revenue, State Street Bank & Trust Company LIQ) | | | 0.30 | | | | 07/01/2037 | | | | 1,174,000 | | | | 1,174,000 | |
Clipper Tax-Exempt Certificate Trust Series 2009-54 (Miscellaneous Revenue, State Street Bank & Trust Company LIQ) | | | 0.20 | | | | 05/01/2017 | | | | 28,243,000 | | | | 28,243,000 | |
FHLMC MFHR Series M019 (Housing Revenue, FHLMC Insured) | | | 0.20 | | | | 05/01/2017 | | | | 17,608,000 | | | | 17,608,000 | |
FHLMC MFHR Series M021 (Housing Revenue, FHLMC Insured, FHLMC LIQ) | | | 0.20 | | | | 06/15/2036 | | | | 33,140,000 | | | | 33,140,000 | |
FHLMC Multi-Class Mortgage Certificates (Housing Revenue) | | | 0.21 | | | | 08/15/2045 | | | | 8,172,762 | | | | 8,172,762 | |
| | | | |
| | | | | | | | | | | | | | | 97,014,762 | |
| | | | | | | | | | | | | | | | |
| | | | |
Pennsylvania : 4.88% | | | | | | | | | | | | | | | | |
| | | | |
| Variable Rate Demand Notes §: 4.88% | | | | | | | | | | | | | | | | |
Allegheny County PA Hospital Development Authority University of Pittsburgh Medical Center Senior Community Incorporated Series 2003 (Health Revenue, FNMA Insured, FNMA LIQ) | | | 0.16 | | | | 07/15/2028 | | | | 2,275,000 | | | | 2,275,000 | |
Allegheny County PA Residential Finance Authority Mortgage SFHR Series 2005-SS (Housing Revenue, GNMA, FNMA Insured, PNC Bank NA SPA) | | | 0.24 | | | | 05/01/2036 | | | | 2,515,000 | | | | 2,515,000 | |
Beaver County PA IDA Daily Corporation Project (IDR) | | | 0.31 | | | | 09/01/2032 | | | | 6,300,000 | | | | 6,300,000 | |
Branch Banking & Trust Municipal Trust Series 2004 (Tax Revenue, Branch Banking & Trust LOC, Branch Banking & Trust LIQ) | | | 0.15 | | | | 01/04/2029 | | | | 680,000 | | | | 680,000 | |
Butler County PA IDA Mine Safety Appliances Series A (Miscellaneous Revenue, JPMorgan Chase Bank LOC) | | | 0.28 | | | | 05/01/2022 | | | | 3,000,000 | | | | 3,000,000 | |
Central Bradford Progress Authority Robert Packer Hospital Royal Bank of Canada Municipal Products Incorporated Trust Certificates Series C-14 (Health Revenue, Royal Bank of Canada LOC, Royal Bank of Canada LIQ) 144A | | | 0.15 | | | | 12/01/2041 | | | | 1,000,000 | | | | 1,000,000 | |
Lancaster PA IDA Purple Crow Partners LLC Project (IDR, U.S. Bank NA LOC) | | | 0.19 | | | | 09/01/2026 | | | | 3,745,000 | | | | 3,745,000 | |
Lehigh County PA General Purpose Authority St. Luke’s Hospital Bethlehem PFOTER (Health Revenue, Bank of America NA LIQ) | | | 0.43 | | | | 08/15/2042 | | | | 2,500,000 | | | | 2,500,000 | |
Lehigh County PA PFOTER Series MT-566 (Miscellaneous Revenue, Bank of America NA LIQ) | | | 0.43 | | | | 08/15/2042 | | | | 15,415,000 | | | | 15,415,000 | |
Manheim Township PA School District Royal Bank of Canada Municipal Products Incorporated Trust Certificates Series E-28 (GO, Royal Bank of Canada LOC, Royal Bank of Canada LIQ) 144A | | | 0.15 | | | | 12/12/2014 | | | | 1,955,000 | | | | 1,955,000 | |
Pennsylvania EDFA Series D7 (IDR, PNC Bank NA LOC) | | | 0.24 | | | | 08/01/2022 | | | | 1,200,000 | | | | 1,200,000 | |
Pennsylvania HFA Series 89 (Housing Revenue, Bank of Tokyo-Mitsubishi SPA) | | | 0.18 | | | | 10/01/2035 | | | | 5,000,000 | | | | 5,000,000 | |
Pennsylvania HFA SFHR Series 3297 (Housing Revenue, JPMorgan Chase Bank LIQ) 144A | | | 0.24 | | | | 10/01/2019 | | | | 1,000,000 | | | | 1,000,000 | |
Pennsylvania Public School Building Authority School District of Philadelphia Project Series 2006-B (Education Revenue, FSA State Aid Withholding Insured, JPMorgan Chase Bank LIQ) 144A | | | 0.30 | | | | 06/01/2015 | | | | 3,465,000 | | | | 3,465,000 | |
| | | | |
| | | | | | | | | | | | | | | 50,050,000 | |
| | | | | | | | | | | | | | | | |
| | | | |
Puerto Rico : 0.13% | | | | | | | | | | | | | | | | |
| | | | |
| Variable Rate Demand Note §: 0.13% | | | | | | | | | | | | | | | | |
Puerto Rico Sales Tax Corporate Financing ROC RR-II-R-11779 (Tax Revenue, Citibank NA LIQ) 144A | | | 0.17 | | | | 12/01/2047 | | | | 1,300,000 | | | | 1,300,000 | |
| | | | | | | | | | | | | | | | |
The accompanying notes are an integral part of these financial statements.
| | | | |
| 18 | | Wells Fargo Advantage Municipal Money Market Fund | | Portfolio of Investments—July 31, 2012 (Unaudited) |
| | | | | | | | | | | | | | | | |
| Security Name | | Interest Rate | | | Maturity Date | | | Principal | | | Value | |
| | | | | | | | | | | | | | | | |
| | | | |
Rhode Island : 0.27% | | | | | | | | | | | | | | | | |
| | | | |
| Variable Rate Demand Note §: 0.27% | | | | | | | | | | | | | | | | |
Rhode Island State Student Loan Series 3235 (Education Revenue, Guaranteed Student Loans Insured, Morgan Stanley Bank LIQ) 144A | | | 0.23 | % | | | 12/01/2023 | | | $ | 2,800,000 | | | $ | 2,800,000 | |
| | | | | | | | | | | | | | | | |
| | | | |
South Carolina : 2.00% | | | | | | | | | | | | | | | | |
| | | | |
| Other Municipal Debt : 0.55% | | | | | | | | | | | | | | | | |
York County SC PCR Natural Rural Utilities Cooperative Finance Corporation Guaranteed NC Electric Membership Corporation Project Series 200B-1 (Utilities Revenue) | | | 0.45 | | | | 09/04/2012 | | | | 2,600,000 | | | | 2,600,000 | |
York County SC PCR Natural Rural Utilities Cooperative Finance Corporation Guaranteed NC Electric Membership Corporation Project Series 200B-2 (Utilities Revenue) | | | 0.45 | | | | 09/04/2012 | | | | 3,000,000 | | | | 3,000,000 | |
| | | | |
| | | | | | | | | | | | | | | 5,600,000 | |
| | | | | | | | | | | | | | | | |
| | | | |
| Variable Rate Demand Notes §: 1.45% | | | | | | | | | | | | | | | | |
South Carolina Educational Facilities Authority for Private Non-Profit Institutions Higher Learning Educational Facilities Spartanburg Methodist Series 2005 (Education Revenue, Branch Banking & Trust LOC) | | | 0.20 | | | | 08/01/2025 | | | | 2,450,000 | | | | 2,450,000 | |
South Carolina Educational Facilities Authority Newbury College Series 2008 (Education Revenue, Branch Banking & Trust LOC) | | | 0.17 | | | | 06/01/2035 | | | | 2,175,000 | | | | 2,175,000 | |
South Carolina Jobs EDA Blue Ridge Log Cabins LLC Series 2007 (IDR, Branch Banking & Trust LOC) | | | 0.24 | | | | 03/01/2032 | | | | 5,645,000 | | | | 5,645,000 | |
South Carolina Jobs EDA South Carolina Generating Company Incorporated Project (IDR, Branch Banking & Trust LOC) | | | 0.21 | | | | 12/01/2038 | | | | 4,600,000 | | | | 4,600,000 | |
| | | | |
| | | | | | | | | | | | | | | 14,870,000 | |
| | | | | | | | | | | | | | | | |
| | | | |
Tennessee : 0.27% | | | | | | | | | | | | | | | | |
| | | | |
| Variable Rate Demand Notes §: 0.27% | | | | | | | | | | | | | | | | |
Franklin County TN HEFA Board University of the South Project Series 1994 (Education Revenue) | | | 0.20 | | | | 01/01/2013 | | | | 1,500,000 | | | | 1,500,000 | |
Pulaski & Giles County TN Lomar Development Company Project (IDR, U.S. Bank NA LOC) | | | 0.26 | | | | 01/01/2017 | | | | 1,235,000 | | | | 1,235,000 | |
| | | | |
| | | | | | | | | | | | | | | 2,735,000 | |
| | | | | | | | | | | | | | | | |
| | | | |
Texas : 11.42% | | | | | | | | | | | | | | | | |
| | | | |
| Variable Rate Demand Notes §: 11.42% | | | | | | | | | | | | | | | | |
Brazos Harbor TX Industrial Development Corporation BASF Corporation Project (IDR) | | | 0.28 | | | | 07/01/2022 | | | | 4,900,000 | | | | 4,900,000 | |
Brazos River Harbor TX Naval District BASF Corporation Project (IDR) | | | 0.31 | | | | 05/01/2036 | | | | 500,000 | | | | 500,000 | |
Dallam County TX Industrial Development Corporation Economic Development Revenue Dallhart Jersey Ranch Incorporated Series 2008 (Resource Recovery Revenue, Fresno-Madera Federal Land Bank Association LOC) | | | 0.22 | | | | 08/01/2039 | | | | 1,700,000 | | | | 1,700,000 | |
First Rio Grande Regional Water Authority Economic Development Corporation Rio Grande Valley Sugar (IDR, CoBank ACB LOC) | | | 0.16 | | | | 03/01/2032 | | | | 1,015,000 | | | | 1,015,000 | |
Harris County TX Health Facilities Development Authority Hermann Healthcare Series A-1 Royal Bank of Canada Municipal Products Incorporated Trust Certificates Series E-27 (Health Revenue, Royal Bank of Canada LOC, Royal Bank of Canada LIQ) 144A | | | 0.15 | | | | 06/01/2027 | | | | 1,000,000 | | | | 1,000,000 | |
The accompanying notes are an integral part of these financial statements.
| | | | | | |
| Portfolio of Investments—July 31, 2012 (Unaudited) | | Wells Fargo Advantage Municipal Money Market Fund | | | 19 | |
| | | | | | | | | | | | | | | | |
| Security Name | | Interest Rate | | | Maturity Date | | | Principal | | | Value | |
| | | | | | | | | | | | | | | | |
| | | | |
| Variable Rate Demand Notes § (continued) | | | | | | | | | | | | | | | | |
Harris County TX Cultural Education Facilities Finance Corporation Hermann Health Series D-3 (Health Revenue, Northern Trust Company LOC) | | | 0.15 | % | | | 06/01/2029 | | | $ | 1,000,000 | | | $ | 1,000,000 | |
Harris County TX Industrial Development Corporation Deer Park Refining Limited Partnership Series 2002 (Resource Recovery Revenue) | | | 0.20 | | | | 03/01/2023 | | | | 7,500,000 | | | | 7,500,000 | |
Harris County TX Industrial Development Corporation Deer Park Refining Limited Partnership Series 2004-A (Resource Recovery Revenue) | | | 0.17 | | | | 03/01/2023 | | | | 19,900,000 | | | | 19,900,000 | |
Port Arthur TX Navigation District Environmental Facilities Motiva Enterprises Project Subseries 2009C (Resource Recovery Revenue) | | | 0.15 | | | | 12/01/2039 | | | | 10,500,000 | | | | 10,500,000 | |
Port Arthur TX Navigation District Environmental Facilities Motiva Enterprises Project Subseries 2010D (IDR) | | | 0.16 | | | | 11/01/2040 | | | | 500,000 | | | | 500,000 | |
Port Arthur TX Navigation District Industrial Development Corporation Total Petrochemicals USA Incorporated Project Series 2011 (IDR) | | | 0.22 | | | | 06/01/2041 | | | | 5,000,000 | | | | 5,000,000 | |
Port Arthur TX Navigation District Industrial Development Corporation Total Petrochemicals USA Incorporated Project Series 2012 (IDR) | | | 0.22 | | | | 03/01/2042 | | | | 16,000,000 | | | | 16,000,000 | |
Port Arthur TX Navigation District of Jefferson County Total Petrochemicals USA Incorporated Project (Resource Recovery Revenue) | | | 0.22 | | | | 03/01/2039 | | | | 4,000,000 | | | | 4,000,000 | |
Port Arthur TX Navigation District of Jefferson County Total Petrochemicals USA Incorporated Project Series 2003-C (IDR) | | | 0.23 | | | | 04/01/2027 | | | | 1,000,000 | | | | 1,000,000 | |
Port Corpus Christi TX Flint Hills Resources Project Series 2006 (Resource Recovery Revenue) | | | 0.22 | | | | 01/01/2030 | | | | 23,500,000 | | | | 23,500,000 | |
Port Corpus Christi TX Flint Hills Resources Project Series 2007 (Resource Recovery Revenue) | | | 0.22 | | | | 01/01/2032 | | | | 1,800,000 | | | | 1,800,000 | |
Port Corpus Christi TX Flint Hills Resources Project Series A (Resource Recovery Revenue) | | | 0.22 | | | | 04/01/2028 | | | | 2,000,000 | | | | 2,000,000 | |
San Marcos TX Industrial Development Corporation Butler Manufacturing Company Project (IDR, Bank of America NA LOC) | | | 0.41 | | | | 04/01/2015 | | | | 6,250,000 | | | | 6,250,000 | |
Texas Municipal Gas Acquisition & Supply Corporation Series 2848 (Miscellaneous Revenue, Morgan Stanley Bank LIQ) | | | 0.45 | | | | 12/15/2026 | | | | 8,984,488 | | | | 8,984,488 | |
| | | | |
| | | | | | | | | | | | | | | 117,049,488 | |
| | | | | | | | | | | | | | | | |
| | | | |
Utah : 0.22% | | | | | | | | | | | | | | | | |
| | | | |
| Variable Rate Demand Notes §: 0.22% | | | | | | | | | | | | | | | | |
Juab County UT Intermountain Farmers Association Project (IDR, CoBank ACB LOC) | | | 0.23 | | | | 08/01/2012 | | | | 300,000 | | | | 300,000 | |
Juab County UT Intermountain Farmers Association Project (IDR, CoBank ACB LOC) | | | 0.23 | | | | 10/01/2021 | | | | 2,000,000 | | | | 2,000,000 | |
| | | | |
| | | | | | | | | | | | | | | 2,300,000 | |
| | | | | | | | | | | | | | | | |
| | | | |
Vermont : 0.11% | | | | | | | | | | | | | | | | |
| | | | |
| Variable Rate Demand Note §: 0.11% | | | | | | | | | | | | | | | | |
Vermont Educational & Health Buildings Financing Agency North County Hospital Project Series 2007-A (Health Revenue, TD Bank NA LOC) | | | 0.18 | | | | 10/01/2034 | | | | 1,095,000 | | | | 1,095,000 | |
| | | | | | | | | | | | | | | | |
| | | | |
Virginia : 1.43% | | | | | | | | | | | | | | | | |
| | | | |
| Variable Rate Demand Notes §: 1.43% | | | | | | | | | | | | | | | | |
Henrico County VA EDA Residential Care Facilities Westminster-Cantebury Richmond Series 2008 (Health Revenue, Branch Banking & Trust LOC) | | | 0.20 | | | | 10/01/2037 | | | | 2,630,000 | | | | 2,630,000 | |
Norfolk VA EDA Hospital Facilities Sentra Healthcare Series C (Health Revenue) (i) | | | 0.27 | | | | 11/01/2034 | | | | 9,250,000 | | | | 9,250,000 | |
Salem VA IDA MFHR Oak Park Apartments Project Series 2008 (Housing Revenue, FNMA Insured, FNMA LIQ) | | | 0.16 | | | | 08/15/2043 | | | | 2,745,000 | | | | 2,745,000 | |
| | | | |
| | | | | | | | | | | | | | | 14,625,000 | |
| | | | | | | | | | | | | | | | |
The accompanying notes are an integral part of these financial statements.
| | | | |
| 20 | | Wells Fargo Advantage Municipal Money Market Fund | | Portfolio of Investments—July 31, 2012 (Unaudited) |
| | | | | | | | | | | | | | | | |
| Security Name | | Interest Rate | | | Maturity Date | | | Principal | | | Value | |
| | | | | | | | | | | | | | | | |
| | | | |
Washington : 1.21% | | | | | | | | | | | | | | | | |
| | | | |
| Variable Rate Demand Notes §: 1.21% | | | | | | | | | | | | | | | | |
King County WA Sewer Series 3090 (Water & Sewer Revenue, FSA Insured, Morgan Stanley Bank LIQ) 144A | | | 0.23 | % | | | 01/01/2039 | | | $ | 3,700,000 | | | $ | 3,700,000 | |
Washington Finance Authority Smith Brothers Farms Incorporated Series 2001 (IDR, Northwest Farm Credit LOC) | | | 0.30 | | | | 09/01/2021 | | | | 3,300,000 | | | | 3,300,000 | |
Washington Housing Finance Commission Whisperwood Apartments Project Series A (Housing Revenue, FNMA Insured, FNMA LIQ) | | | 0.17 | | | | 05/15/2035 | | | | 1,590,000 | | | | 1,590,000 | |
Yakima County WA Public Corporation Valley Processing Project (IDR, Bank of America NA LOC) | | | 0.65 | | | | 02/01/2015 | | | | 1,300,000 | | | | 1,300,000 | |
Yakima County WA Solid Waste Disposal George Deruyter & Son Project Series 2006 (Resource Recovery Revenue, Northwest Farm Credit LOC) | | | 0.23 | | | | 08/01/2026 | | | | 2,500,000 | | | | 2,500,000 | |
| | | | |
| | | | | | | | | | | | | | | 12,390,000 | |
| | | | | | | | | | | | | | | | |
| | | | |
West Virginia : 0.30% | | | | | | | | | | | | | | | | |
| | | | |
| Variable Rate Demand Note §: 0.30% | | | | | | | | | | | | | | | | |
Marmet WV Commercial Development Kroger Company Series 2004 (IDR, Bank of Nova Scotia LOC) | | | 0.22 | | | | 11/01/2012 | | | | 3,100,000 | | | | 3,100,000 | |
| | | | | | | | | | | | | | | | |
| | | | |
Wisconsin : 2.15% | | | | | | | | | | | | | | | | |
| | | | |
| Variable Rate Demand Notes §: 2.15% | | | | | | | | | | | | | | | | |
Belgium WI Trimen Industries Incorporated Project Series 2006 (Miscellaneous Revenue, U.S. Bank NA LOC) | | | 0.27 | | | | 02/01/2026 | | | | 3,610,000 | | | | 3,610,000 | |
Hull WI Welcome Dairy Incorporated Project Series 2010-A (IDR, Associated Bank NA LOC) | | | 0.20 | | | | 01/01/2027 | | | | 325,000 | | | | 325,000 | |
Manitowoc WI CDA Regency House Project (Housing Revenue, Bank First National LOC) | | | 0.38 | | | | 11/01/2020 | | | | 1,365,000 | | | | 1,365,000 | |
Newton WI Stecker Machine Company Incorporated Project Series 2001 (IDR, FHLB LOC) | | | 0.22 | | | | 09/01/2021 | | | | 1,945,000 | | | | 1,945,000 | |
Sheboygan WI Alaark Manufacturing Corporation Project Series 2000 (IDR, U.S. Bank NA LOC) | | | 0.23 | | | | 12/01/2021 | | | | 1,505,000 | | | | 1,505,000 | |
Sheboygan WI Vortex Liquid Color Project (IDR, Bank First National LOC) | | | 0.18 | | | | 11/01/2020 | | | | 1,340,000 | | | | 1,340,000 | |
Two Rivers WI Riverside Foods Incorporated Project (IDR, Bank First National LOC) | | | 0.19 | | | | 12/01/2022 | | | | 1,870,000 | | | | 1,870,000 | |
Wisconsin Housing & EDFA Series 2879 (Housing Revenue, GO of Authority Insured, JPMorgan Chase Bank LIQ) | | | 0.26 | | | | 03/01/2015 | | | | 1,805,000 | | | | 1,805,000 | |
Wisconsin Housing & EDFA Zero Zone Incorporated Project Series 1999 (IDR, U.S. Bank NA LOC) | | | 0.55 | | | | 08/01/2019 | | | | 3,420,000 | | | | 3,420,000 | |
Wisconsin State HEFA Sisters Services Incorporated Obligation Group Series 2007B-2 (Health Revenue, JPMorgan Chase Bank SPA) | | | 0.40 | | | | 03/15/2036 | | | | 4,900,000 | | | | 4,900,000 | |
| | | | |
| | | | | | | | | | | | | | | 22,085,000 | |
| | | | | | | | | | | | | | | | |
| | | | |
Total Municipal Obligations (Cost $1,013,000,741) | | | | | | | | | | | | | | | 1,013,000,741 | |
| | | | | | | | | | | | | | | | |
| | | | | | | | |
| Total Investments in Securities | | | | | | | | |
| (Cost $1,013,000,741)* | | | 98.85 | % | | | 1,013,000,741 | |
Other Assets and Liabilities, Net | | | 1.15 | | | | 11,795,374 | |
| | | | | | | | |
| Total Net Assets | | | 100.00 | % | | $ | 1,024,796,115 | |
| | | | | | | | |
| § | These securities are subject to a demand feature which reduces the effective maturity. |
| 144A | Security that may be resold to “qualified institutional buyers” under Rule 144A or security offered pursuant to Section 4(2) of the Securities Act of 1933, as amended. |
| * | Cost for federal income tax purposes is substantially the same as for financial reporting purposes. |
The accompanying notes are an integral part of these financial statements.
| | | | | | |
| Statement of Assets and Liabilities—July 31, 2012 (Unaudited) | | Wells Fargo Advantage Municipal Money Market Fund | | | 21 | |
| | | | |
| | | | |
| |
Assets | | | | |
Investments in unaffiliated securities, at amortized cost | | $ | 1,013,000,741 | |
Cash | | | 4,297 | |
Receivable for investments sold | | | 12,720,198 | |
Receivable for Fund shares sold | | | 108,937 | |
Receivable for interest | | | 354,115 | |
Receivable from adviser | | | 481,466 | |
Prepaid expenses and other assets | | | 28,214 | |
| | | | |
Total assets | | | 1,026,697,968 | |
| | | | |
Liabilities | | | | |
Dividends payable | | | 4,741 | |
Payable for Fund shares redeemed | | | 761,047 | |
Distribution fees payable | | | 197,930 | |
Due to other related parties | | | 185,403 | |
Shareholder servicing fees payable | | | 230,431 | |
Trustees’ fees and expense payable | | | 118,010 | |
Accrued expenses and other liabilities | | | 404,291 | |
| | | | |
Total liabilities | | | 1,901,853 | |
| | | | |
Total net assets | | $ | 1,024,796,115 | |
| | | | |
| |
NET ASSETS CONSIST OF | | | | |
Paid-in capital | | $ | 1,024,749,508 | |
Overdistributed net investment income | | | (123,932 | ) |
Accumulated net realized gains on investments | | | 170,539 | |
| | | | |
Total net assets | | $ | 1,024,796,115 | |
| | | | |
| |
COMPUTATION OF NET ASSET VALUE PER SHARE1 | | | | |
Net assets – Class A | | $ | 80,241,629 | |
Shares outstanding – Class A | | | 80,238,293 | |
Net asset value per share – Class A | | | $1.00 | |
Net assets – Institutional Class | | $ | 25,241,521 | |
Shares outstanding – Institutional Class | | | 25,242,218 | |
Net asset value per share – Institutional Class | | | $1.00 | |
Net assets – Investor Class | | $ | 170,497,946 | |
Shares outstanding – Investor Class | | | 170,490,500 | |
Net asset value per share – Investor Class | | | $1.00 | |
Net assets – Service Class | | $ | 139,763,797 | |
Shares outstanding – Service Class | | | 139,758,927 | |
Net asset value per share – Service Class | | | $1.00 | |
Net assets – Sweep Class | | $ | 609,051,222 | |
Shares outstanding – Sweep Class | | | 609,049,944 | |
Net asset value per share – Sweep Class | | | $1.00 | |
| 1. | The Fund has an unlimited number of authorized shares. |
The accompanying notes are an integral part of these financial statements.
| | | | |
| 22 | | Wells Fargo Advantage Municipal Money Market Fund | | Statement of Operations—Six Months Ended July 31, 2012 (Unaudited) |
| | | | |
| | | | |
| |
Investment income | | | | |
Interest | | $ | 1,499,796 | |
| | | | |
| |
Expenses | | | | |
Advisory fee | | | 1,716,166 | |
Administration fees | | | | |
Fund level | | | 289,427 | |
Class A | | | 102,918 | |
Institutional Class | | | 8,242 | |
Investor Class | | | 218,976 | |
Service Class | | | 77,438 | |
Sweep Class | | | 813,248 | |
Shareholder servicing fees | | | | |
Class A | | | 115,314 | |
Investor Class | | | 217,422 | |
Service Class | | | 161,028 | |
Sweep Class | | | 924,146 | |
Distribution fees | | | | |
Sweep Class | | | 1,293,804 | |
Custody and accounting fees | | | 35,153 | |
Professional fees | | | 9,627 | |
Registration fees | | | 17,784 | |
Shareholder report expenses | | | 22,527 | |
Trustees’ fees and expenses | | | 3,285 | |
Other fees and expenses | | | 14,611 | |
| | | | |
Total expenses | | | 6,041,116 | |
Less: Fee waivers and/or expense reimbursements | | | (4,604,669 | ) |
| | | | |
Net expenses | | | 1,436,447 | |
| | | | |
Net investment income | | | 63,349 | |
| | | | |
Net realized gains on investments | | | 76,230 | |
| | | | |
Net increase in net assets resulting from operations | | $ | 139,579 | |
| | | | |
The accompanying notes are an integral part of these financial statements.
| | | | | | |
| Statement of Changes in Net Assets | | Wells Fargo Advantage Municipal Money Market Fund | | | 23 | |
| | | | | | | | | | | | | | | | |
| | | Six Months Ended July 31, 2012 (Unaudited) | | | Year Ended
January 31, 2012 | |
| | | | |
Operations | | | | | | | | | | | | | | | | |
Net investment income | | | | | | $ | 63,349 | | | | | | | $ | 285,518 | |
Net realized gains on investments | | | | | | | 76,230 | | | | | | | | 159,721 | |
| | | | | | | | | | | | | | | | |
Net increase in net assets resulting from operations | | | | | | | 139,579 | | | | | | | | 445,239 | |
| | | | | | | | | | | | | | | | |
| | | | |
Distributions to shareholders from | | | | | | | | | | | | | | | | |
Net investment income | | | | | | | | | | | | | | | | |
Class A | | | | | | | (4,690 | ) | | | | | | | (11,600 | ) |
Institutional Class | | | | | | | (6,339 | ) | | | | | | | (29,231 | ) |
Investor Class | | | | | | | (8,782 | ) | | | | | | | (19,193 | ) |
Service Class | | | | | | | (6,471 | ) | | | | | | | (10,991 | ) |
Sweep Class | | | | | | | (37,067 | ) | | | | | | | (214,503 | ) |
Net realized gains | | | | | | | | | | | | | | | | |
Class A | | | | | | | 0 | | | | | | | | (6,943 | ) |
Institutional Class | | | | | | | 0 | | | | | | | | (1,309 | ) |
Investor Class | | | | | | | 0 | | | | | | | | (11,733 | ) |
Service Class | | | | | | | 0 | | | | | | | | (7,456 | ) |
Sweep Class | | | | | | | 0 | | | | | | | | (71,497 | ) |
| | | | | | | | | | | | | | | | |
Total distributions to shareholders | | | | | | | (63,349 | ) | | | | | | | (384,456 | ) |
| | | | | | | | | | | | | | | | |
| | | | |
Capital share transactions | | | Shares | | | | | | | | Shares | | | | | |
Proceeds from shares sold | | | | | | | | | | | | | | | | |
Class A | | | 105,276,846 | | | | 105,276,846 | | | | 311,378,558 | | | | 311,378,558 | |
Institutional Class | | | 185,928,081 | | | | 185,928,081 | | | | 222,045,609 | | | | 222,045,609 | |
Investor Class | | | 29,677,739 | | | | 29,677,739 | | | | 57,489,195 | | | | 57,489,195 | |
Service Class | | | 61,196,519 | | | | 61,196,519 | | | | 140,648,565 | | | | 140,648,565 | |
Sweep Class | | | 2,846,173 | | | | 2,846,173 | | | | 4,261,256,065 | | | | 4,261,256,065 | |
| | | | | | | | | | | | | | | | |
| | | | | | | 384,925,358 | | | | | | | | 4,992,817,992 | |
| | | | | | | | | | | | | | | | |
Reinvestment of distributions | | | | | | | | | | | | | | | | |
Class A | | | 4,406 | | | | 4,406 | | | | 17,165 | | | | 17,165 | |
Institutional Class | | | 6,339 | | | | 6,339 | | | | 30,501 | | | | 30,501 | |
Investor Class | | | 8,280 | | | | 8,280 | | | | 29,636 | | | | 29,636 | |
Service Class | | | 1,816 | | | | 1,816 | | | | 7,029 | | | | 7,029 | |
Sweep Class | | | 37,067 | | | | 37,067 | | | | 286,000 | | | | 286,000 | |
| | | | | | | | | | | | | | | | |
| | | | | | | 57,908 | | | | | | | | 370,331 | |
| | | | | | | | | | | | | | | | |
Payment for shares redeemed | | | | | | | | | | | | | | | | |
Class A | | | (127,127,253 | ) | | | (127,127,253 | ) | | | (339,854,956 | ) | | | (339,854,956 | ) |
Institutional Class | | | (178,590,222 | ) | | | (178,590,222 | ) | | | (310,367,604 | ) | | | (310,367,604 | ) |
Investor Class | | | (39,083,186 | ) | | | (39,083,186 | ) | | | (86,678,324 | ) | | | (86,678,324 | ) |
Service Class | | | (40,754,893 | ) | | | (40,754,893 | ) | | | (117,684,493 | ) | | | (117,684,493 | ) |
Sweep Class | | | (313,999,025 | ) | | | (313,999,025 | ) | | | (6,575,010,709 | ) | | | (6,575,010,709 | ) |
| | | | | | | | | | | | | | | | |
| | | | | | | (699,554,579 | ) | | | | | | | (7,429,596,086 | ) |
| | | | | | | | | | | | | | | | |
Net decrease in net assets resulting from capital share transactions | | | | | | | (314,571,313 | ) | | | | | | | (2,436,407,763 | ) |
| | | | | | | | | | | | | | | | |
Total decrease in net assets | | | | | | | (314,495,083 | ) | | | | | | | (2,436,346,980 | ) |
| | | | | | | | | | | | | | | | |
| | | | |
Net assets | | | | | | | | | | | | | | | | |
Beginning of period | | | | | | | 1,339,291,198 | | | | | | | | 3,775,638,178 | |
| | | | | | | | | | | | | | | | |
End of period | | | | | | $ | 1,024,796,115 | | | | | | | $ | 1,339,291,198 | |
| | | | | | | | | | | | | | | | |
Overdistributed net investment income | | | | | | $ | (123,932 | ) | | | | | | $ | (123,932 | ) |
| | | | | | | | | | | | | | | | |
The accompanying notes are an integral part of these financial statements.
| | | | |
| 24 | | Wells Fargo Advantage Municipal Money Market Fund | | Financial Highlights |
(For a share outstanding throughout each period)
| | | | | | | | | | | | | | | | | | | | | | | | |
| | | Six Months Ended July 31, 2012 (Unaudited) | | | Year Ended January 31, | |
| Class A | | | 2012 | | | 20111 | | | 20101 | | | 20091 | | | 20081 | |
Net asset value, beginning of period | | $ | 1.00 | | | $ | 1.00 | | | $ | 1.00 | | | $ | 1.00 | | | $ | 1.00 | | | $ | 1.00 | |
Net investment income | | | 0.00 | 2 | | | 0.00 | 2 | | | 0.00 | 2 | | | 0.00 | 2 | | | 0.02 | | | | 0.03 | |
Net realized gains on investments | | | 0.00 | 2 | | | 0.00 | 2 | | | 0.00 | 2 | | | 0.00 | 2 | | | 0.00 | 2 | | | 0.00 | 2 |
| | | | | | | | | | | | | | | | | | | | | | | | |
Total from investment operations | | | 0.00 | 2 | | | 0.00 | 2 | | | 0.00 | 2 | | | 0.00 | 2 | | | 0.02 | | | | 0.03 | |
Distributions to shareholders from | | | | | | | | | | | | | | | | | | | | | | | | |
Net investment income | | | (0.00 | )2 | | | (0.00 | )2 | | | (0.00 | )2 | | | (0.00 | )2 | | | (0.02 | ) | | | (0.03 | ) |
Net realized gains | | | 0.00 | | | | (0.00 | )2 | | | (0.00 | )2 | | | 0.00 | | | | 0.00 | | | | 0.00 | |
| | | | | | | | | | | | | | | | | | | | | | | | |
Total distributions to shareholders | | | (0.00 | )2 | | | (0.00 | )2 | | | (0.00 | )2 | | | (0.00 | )2 | | | (0.02 | ) | | | (0.03 | ) |
Net asset value, end of period | | $ | 1.00 | | | $ | 1.00 | | | $ | 1.00 | | | $ | 1.00 | | | $ | 1.00 | | | $ | 1.00 | |
Total return3 | | | 0.00 | % | | | 0.02 | % | | | 0.01 | % | | | 0.08 | % | | | 1.63 | % | | | 2.97 | % |
Ratios to average net assets (annualized) | | | | | | | | | | | | | | | | | | | | | | | | |
Gross expenses | | | 0.83 | % | | | 0.82 | % | | | 0.84 | % | | | 0.86 | % | | | 0.84 | % | | | 0.85 | % |
Net expenses | | | 0.25 | % | | | 0.22 | % | | | 0.35 | % | | | 0.61 | % | | | 0.81 | % | | | 0.82 | % |
Net investment income | | | 0.01 | % | | | 0.01 | % | | | 0.01 | % | | | 0.09 | % | | | 1.58 | % | | | 2.92 | % |
Supplemental data | | | | | | | | | | | | | | | | | | | | | | | | |
Net assets, end of period (000’s omitted) | | | $80,242 | | | | $102,082 | | | | $130,539 | | | | $149,162 | | | | $329,511 | | | | $391,651 | |
| 1. | After the close of business on July 9, 2010, the Fund acquired the net assets of Evergreen Municipal Money Market Fund which became the accounting and performance survivor in the transaction. The information for the periods prior to July 12, 2010 is that of Class A of Evergreen Municipal Money Market Fund. |
| 2. | Amount is less than $0.005. |
| 3. | Returns for periods of less than one year are not annualized. |
The accompanying notes are an integral part of these financial statements.
| | | | | | |
| Financial Highlights | | Wells Fargo Advantage Municipal Money Market Fund | | | 25 | |
(For a share outstanding throughout each period)
| | | | | | | | | | | | |
| | | Six Months Ended
July 31, 2012 (Unaudited) | | | Year Ended January 31, | |
| Institutional Class | | | 2012 | | | 20111 | |
Net asset value, beginning of period | | $ | 1.00 | | | $ | 1.00 | | | $ | 1.00 | |
Net investment income | | | 0.00 | 2 | | | 0.00 | 2 | | | 0.00 | 2 |
Net realized gains on investments | | | 0.00 | 2 | | | 0.00 | 2 | | | 0.00 | 2 |
| | | | | | | | | | | | |
Total from investment operations | | | 0.00 | 2 | | | 0.00 | 2 | | | 0.00 | 2 |
Distributions to shareholders from | | | | | | | | | | | | |
Net investment income | | | (0.00 | )2 | | | (0.00 | )2 | | | (0.00 | )2 |
Net realized gains | | | 0.00 | | | | (0.00 | )2 | | | (0.00 | )2 |
| | | | | | | | | | | | |
Total distributions to shareholders | | | (0.00 | )2 | | | (0.00 | )2 | | | (0.00 | )2 |
Net asset value, end of period | | $ | 1.00 | | | $ | 1.00 | | | $ | 1.00 | |
Total return3 | | | 0.03 | % | | | 0.05 | % | | | 0.09 | % |
Ratios to average net assets (annualized) | | | | | | | | | | | | |
Gross expenses | | | 0.44 | % | | | 0.44 | % | | | 0.45 | % |
Net expenses | | | 0.20 | % | | | 0.19 | % | | | 0.20 | % |
Net investment income | | | 0.06 | % | | | 0.06 | % | | | 0.16 | % |
Supplemental data | | | | | | | | | | | | |
Net assets, end of period (000’s omitted) | | | $25,242 | | | | $17,896 | | | | $106,186 | |
| 1. | For the period from July 9, 2010 (commencement of class operations) to January 31, 2011 |
| 2. | Amount is less than $0.005. |
| 3. | Returns for periods of less than one year are not annualized. |
The accompanying notes are an integral part of these financial statements.
| | | | |
| 26 | | Wells Fargo Advantage Municipal Money Market Fund | | Financial Highlights |
(For a share outstanding throughout each period)
| | | | | | | | | | | | |
| | | Six Months Ended
July 31, 2012 (Unaudited) | | | Year Ended January 31, | |
| Investor Class | | | 2012 | | | 20111 | |
Net asset value, beginning of period | | | $1.00 | | | | $1.00 | | | | $1.00 | |
Net investment income | | | 0.00 | 2 | | | 0.00 | 2 | | | 0.00 | 2 |
Net realized gains on investments | | | 0.00 | 2 | | | 0.00 | 2 | | | 0.00 | 2 |
| | | | | | | | | | | | |
Total from investment operations | | | 0.00 | 2 | | | 0.00 | 2 | | | 0.00 | 2 |
Distributions to shareholders from | | | | | | | | | | | | |
Net investment income | | | (0.00 | )2 | | | (0.00 | )2 | | | (0.00 | )2 |
Net realized gains | | | 0.00 | | | | (0.00 | )2 | | | (0.00 | )2 |
| | | | | | | | | | | | |
Total distributions to shareholders | | | (0.00 | )2 | | | (0.00 | )2 | | | (0.00 | )2 |
Net asset value, end of period | | | $1.00 | | | | $1.00 | | | | $1.00 | |
Total return3 | | | 0.00 | % | | | 0.02 | % | | | 0.01 | % |
Ratios to average net assets (annualized) | | | | | | | | | | | | |
Gross expenses | | | 0.86 | % | | | 0.85 | % | | | 0.89 | % |
Net expenses | | | 0.25 | % | | | 0.22 | % | | | 0.35 | % |
Net investment income | | | 0.01 | % | | | 0.01 | % | | | 0.01 | % |
Supplemental data | | | | | | | | | | | | |
Net assets, end of period (000’s omitted) | | | $170,498 | | | | $179,884 | | | | $209,041 | |
| 1. | For the period from July 9, 2010 (commencement of class operations) to January 31, 2011 |
| 2. | Amount is less than $0.005. |
| 3. | Returns for periods of less than one year are not annualized. |
The accompanying notes are an integral part of these financial statements.
| | | | | | |
| Financial Highlights | | Wells Fargo Advantage Municipal Money Market Fund | | | 27 | |
(For a share outstanding throughout each period)
| | | | | | | | | | | | | | | | | | | | | | | | |
| | | Six Months Ended
July 31, 2012 (Unaudited) | | | Year Ended January 31, | |
| Service Class | | | 2012 | | | 20111 | | | 20101 | | | 20091 | | | 20081 | |
Net asset value, beginning of period | | | $1.00 | | | | $1.00 | | | | $1.00 | | | | $1.00 | | | | $1.00 | | | | $1.00 | |
Net investment income | | | 0.00 | 2 | | | 0.00 | 2 | | | 0.00 | 2 | | | 0.00 | 2 | | | 0.02 | | | | 0.03 | |
Net realized gains on investments | | | 0.00 | 2 | | | 0.00 | 2 | | | 0.00 | 2 | | | 0.00 | 2 | | | 0.00 | 2 | | | 0.00 | 2 |
| | | | | | | | | | | | | | | | | | | | | | | | |
Total from investment operations | | | 0.00 | 2 | | | 0.00 | 2 | | | 0.00 | 2 | | | 0.00 | 2 | | | 0.02 | | | | 0.03 | |
Distributions to shareholders from | | | | | | | | | | | | | | | | | | | | | | | | |
Net investment income | | | (0.00 | )2 | | | (0.00 | )2 | | | (0.00 | )2 | | | (0.00 | )2 | | | (0.02 | ) | | | (0.03 | ) |
Net realized gains | | | 0.00 | | | | (0.00 | )2 | | | (0.00 | )2 | | | 0.00 | | | | 0.00 | | | | 0.00 | |
| | | | | | | | | | | | | | | | | | | | | | | | |
Total distributions to shareholders | | | (0.00 | )2 | | | (0.00 | )2 | | | (0.00 | )2 | | | (0.00 | )2 | | | (0.02 | ) | | | (0.03 | ) |
Net asset value, end of period | | | $1.00 | | | | $1.00 | | | | $1.00 | | | | $1.00 | | | | $1.00 | | | | $1.00 | |
Total return3 | | | 0.00 | % | | | 0.02 | % | | | 0.01 | % | | | 0.20 | % | | | 1.94 | % | | | 3.28 | % |
Ratios to average net assets (annualized) | | | | | | | | | | | | | | | | | | | | | | | | |
Gross expenses | | | 0.73 | % | | | 0.72 | % | | | 0.64 | % | | | 0.56 | % | | | 0.54 | % | | | 0.55 | % |
Net expenses | | | 0.25 | % | | | 0.21 | % | | | 0.35 | % | | | 0.46 | % | | | 0.51 | % | | | 0.52 | % |
Net investment income | | | 0.01 | % | | | 0.01 | % | | | 0.01 | % | | | 0.23 | % | | | 1.88 | % | | | 3.22 | % |
Supplemental data | | | | | | | | | | | | | | | | | | | | | | | | |
Net assets, end of period (000’s omitted) | | | $139,764 | | | | $119,313 | | | | $96,341 | | | | $154,410 | | | | $265,743 | | | | $363,542 | |
| 1. | After the close of business on July 9, 2010, the Fund acquired the net assets of Evergreen Municipal Money Market Fund which became the accounting and performance survivor in the transaction. The information for the periods prior to July 12, 2010 is that of Class I of Evergreen Municipal Money Market Fund. |
| 2. | Amount is less than $0.005. |
| 3. | Returns for periods of less than one year are not annualized. |
The accompanying notes are an integral part of these financial statements.
| | | | |
| 28 | | Wells Fargo Advantage Municipal Money Market Fund | | Financial Highlights |
(For a share outstanding throughout each period)
| | | | | | | | | | | | | | | | | | | | | | | | |
| | | Six Months Ended
July 31, 2012 (Unaudited) | | | Year Ended January 31, | |
| Sweep Class | | | 2012 | | | 20111 | | | 20101 | | | 20091 | | | 20081 | |
Net asset value, beginning of period | | | $1.00 | | | | $1.00 | | | | $1.00 | | | | $1.00 | | | | $1.00 | | | | $1.00 | |
Net investment income | | | 0.00 | 2 | | | 0.00 | 2 | | | 0.00 | 2 | | | 0.00 | 2 | | | 0.01 | | | | 0.03 | |
Net realized gains on investments | | | 0.00 | 2 | | | 0.00 | 2 | | | 0.00 | 2 | | | 0.00 | 2 | | | 0.00 | 2 | | | 0.00 | 2 |
| | | | | | | | | | | | | | | | | | | | | | | | |
Total from investment operations | | | 0.00 | 2 | | | 0.00 | 2 | | | 0.00 | 2 | | | 0.00 | 2 | | | 0.01 | | | | 0.03 | |
Distributions to shareholders from | | | | | | | | | | | | | | | | | | | | | | | | |
Net investment income | | | (0.00 | )2 | | | (0.00 | )2 | | | (0.00 | )2 | | | (0.00 | )2 | | | (0.01 | ) | | | (0.03 | ) |
Net realized gains | | | 0.00 | | | | (0.00 | )2 | | | (0.00 | )2 | | | 0.00 | | | | 0.00 | | | | 0.00 | |
| | | | | | | | | | | | | | | | | | | | | | | | |
Total distributions to shareholders | | | (0.00 | )2 | | | (0.00 | )2 | | | (0.00 | )2 | | | (0.00 | )2 | | | (0.01 | ) | | | (0.03 | ) |
Net asset value, end of period | | | $1.00 | | | | $1.00 | | | | $1.00 | | | | $1.00 | | | | $1.00 | | | | $1.00 | |
Total return3 | | | 0.00 | % | | | 0.02 | % | | | 0.01 | % | | | 0.03 | % | | | 1.34 | % | | | 2.67 | % |
Ratios to average net assets (annualized) | | | | | | | | | | | | | | | | | | | | | | | | |
Gross expenses | | | 1.18 | % | | | 1.18 | % | | | 1.17 | % | | | 1.15 | % | | | 1.15 | % | | | 1.15 | % |
Net expenses | | | 0.25 | % | | | 0.23 | % | | | 0.35 | % | | | 0.63 | % | | | 1.11 | % | | | 1.12 | % |
Net investment income | | | 0.01 | % | | | 0.01 | % | | | 0.01 | % | | | 0.03 | % | | | 1.29 | % | | | 2.50 | % |
Supplemental data | | | | | | | | | | | | | | | | | | | | | | | | |
Net assets, end of period (000’s omitted) | | | $609,051 | | | | $920,116 | | | | $3,233,532 | | | | $3,527,022 | | | | $2,485,601 | | �� | | $1,731,950 | |
| 1. | After the close of business on July 9, 2010, the Fund acquired the net assets of Evergreen Municipal Money Market Fund which became the accounting and performance survivor in the transaction. The information for the periods prior to July 12, 2010 is that of Class S of Evergreen Municipal Money Market Fund. |
| 2. | Amount is less than $0.005. |
| 3. | Returns for periods of less than one year are not annualized. |
The accompanying notes are an integral part of these financial statements.
| | | | | | |
| Notes to Financial Statements (Unaudited) | | Wells Fargo Advantage Municipal Money Market Fund | | | 29 | |
1. ORGANIZATION
Wells Fargo Funds Trust (the “Trust”), a Delaware statutory trust organized on March 10, 1999, is an open-end management investment company registered under the Investment Company Act of 1940, as amended (the “1940 Act”). These financial statements report on Wells Fargo Advantage Municipal Money Market Fund (the “Fund”) which is a diversified series of the Trust.
2. SIGNIFICANT ACCOUNTING POLICIES
The following significant accounting policies, which are consistently followed in the preparation of the financial statements of the Fund, are in conformity with U.S. generally accepted accounting principles which require management to make estimates and assumptions that affect the reported amounts of assets and liabilities, disclosure of contingent assets and liabilities at the date of the financial statements, and the reported amounts of revenues and expenses during the reporting period. Actual results could differ from those estimates.
Securities valuation
As permitted under Rule 2a-7 of the 1940 Act, portfolio securities are valued at amortized cost, which approximates fair value. The amortized cost method involves valuing a security at its cost, plus accretion of discount or minus amortization of premium over the period until maturity.
Investments which are not valued using the method discussed above are valued at their fair value, as determined by procedures established in good faith and approved by the Board of Trustees. The Board of Trustees has established a Valuation Committee comprised of the Trustees and has delegated to it the authority to take any actions regarding the valuation of portfolio securities that the Valuation Committee deems necessary in determining the fair value of portfolio securities, unless the responsibility has been delegated to the Management Valuation Team of Wells Fargo Funds Management, LLC (“Funds Management”). The Board of Trustees retains the authority to make or ratify any valuation decisions or approve any changes to the Valuation Procedures as it deems appropriate. On a quarterly basis, the Board of Trustees considers for ratification any valuation actions taken by the Valuation Committee or the Management Valuation Team.
Valuations of fair valued prices are compared to the next actual sales price when available, or other appropriate market information to assess the continued appropriateness of the fair valuation methodology used. The securities are fair valued on a day-to-day basis, taking into consideration changes to appropriate market information and any significant changes to the input factors considered in the valuation process until there is a readily available price provided on the exchange or by an independent pricing service. Valuations received from an independent pricing service or broker quotes are periodically validated by comparisons to most recent trades and valuations provided by other independent pricing services in addition to the review of prices by the adviser and/or sub-adviser. Unobservable inputs used in determining fair valuations are identified based on the type of security, taking into consideration factors utilized by market participants in valuing the investment, knowledge about the issuer and the current market environment.
Security transactions and income recognition
Securities transactions are recorded on a trade date basis. Realized gains or losses are reported on the basis of identified cost of securities delivered.
Interest income is accrued daily and bond discounts are accreted and premiums are amortized daily based on the effective interest method. To the extent debt obligations are placed on non-accrual status, any related interest income may be reduced by writing off interest receivables when the collection of all or a portion of interest has become doubtful based on consistently applied procedures. If the issuer subsequently resumes interest payments or when the collectability of interest is reasonably assured, the debt obligation is removed from non-accrual status.
Distributions to shareholders
Distributions to shareholders from net investment income are accrued daily and paid monthly. Distributions from net realized gains, if any, are recorded on the ex-dividend date. Such distributions are determined in conformity with income tax regulations, which may differ from generally accepted accounting principles.
| | | | |
| 30 | | Wells Fargo Advantage Municipal Money Market Fund | | Notes to Financial Statements (Unaudited) |
Federal and other taxes
The Fund intends to continue to qualify as a regulated investment company by distributing substantially all of its investment company taxable and tax-exempt income and any net realized capital gains (after reduction for capital loss carryforwards) sufficient to relieve it from all, or substantially all, federal income taxes. Accordingly, no provision for federal income taxes was required.
The Fund’s income and federal excise tax returns and all financial records supporting those returns for the prior three fiscal years are subject to examination by the federal and Delaware revenue authorities. Management has analyzed the Fund’s tax positions taken on federal, state, and foreign tax returns for all open tax years and does not believe that there are any uncertain tax positions that require recognition of a tax liability.
Class allocations
The separate classes of shares offered by the Fund differ principally in distribution, shareholder servicing and administration fees. Shareholders of each class bear certain expenses that pertain to that particular class. All shareholders bear the common expenses of the Fund, earn income from the portfolio, and are allocated any unrealized gains and losses pro rata based on the average daily net assets of each class, without distinction between share classes. Dividends are determined separately for each class based on income and expenses allocable to each class. Realized gains and losses are allocated to each class pro rata based upon the net assets of each class on the date realized. Differences in per share dividend rates generally result from the relative weightings of pro rata income and realized gain allocations and from differences in separate class expenses, including distribution, shareholder servicing and administration fees.
3. FAIR VALUATION MEASUREMENTS
Fair value measurements of investments are determined within a framework that has established a fair value hierarchy based upon the various data inputs utilized in determining the value of the Fund’s investments. The three-level hierarchy gives the highest priority to unadjusted quoted prices in active markets for identical assets or liabilities (Level 1) and the lowest priority to significant unobservable inputs (Level 3). The Fund’s investments are classified within the fair value hierarchy based on the lowest level of input that is significant to the fair value measurement. The inputs are summarized into three broad levels as follows:
| n | | Level 1 – quoted prices in active markets for identical securities |
| n | | Level 2 – other significant observable inputs (including quoted prices for similar securities, interest rates, prepayment speeds, credit risk, etc.) |
| n | | Level 3 – significant unobservable inputs (including the Fund’s own assumptions in determining the fair value of investments) |
The inputs or methodologies used for valuing securities are not necessarily an indication of the risk associated with investing in those securities.
At July 31, 2012, all of the Fund’s investments in securities carried at fair value were designated as Level 2 since the primary inputs include credit quality of the issuer and short-term interest rates which are observable.
Further details on the major security types can be found in the Portfolio of Investments.
Transfers in and transfers out are recognized at the end of the reporting period. For the six months ended July 31, 2012, the Fund did not have any transfers into/out of Level 1 and Level 2.
4. TRANSACTIONS WITH AFFILIATES AND OTHER EXPENSES
Advisory fee
The Trust has entered into an advisory contract with Funds Management, an indirect wholly owned subsidiary of Wells Fargo & Company (“Wells Fargo”). The adviser is responsible for implementing investment policies and guidelines and for supervising the sub-adviser, who is responsible for day-to-day portfolio management of the Fund.
Pursuant to the contract, Funds Management is entitled to receive an annual advisory fee starting at 0.30% and declining to 0.20% as the average daily net assets of the Fund increase. For the six months ended July 31, 2012, the advisory fee was equivalent to an annual rate of 0.30% of the Fund’s average daily net assets.
| | | | | | |
| Notes to Financial Statements (Unaudited) | | Wells Fargo Advantage Municipal Money Market Fund | | | 31 | |
Funds Management has retained the services of a sub-adviser to provide daily portfolio management to the Fund. The fee for sub-advisory services is borne by Funds Management. Wells Capital Management Incorporated an affiliate of Funds Management, is the sub-adviser to the Fund and is entitled to receive a fee from Funds Management at an annual rate starting at 0.05% and declining to 0.01% as the average daily net assets of the Fund increase.
Administration and transfer agent fees
The Trust has entered into an administration agreement with Funds Management. Under this agreement, for providing administrative services, which includes paying fees and expenses for services provided by the transfer agent, sub-transfer agents, omnibus account servicers and record-keepers, Funds Management is entitled to receive from the Fund an annual fund level administration fee starting at 0.05% and declining to 0.03% as the average daily net assets of the Fund increase and a class level administration fee which is calculated based on the average daily net assets of each class as follows:
| | |
| | | Class Level Administration Fee |
Class A, Sweep Class | | 0.22% |
Institutional Class | | 0.08 |
Investor Class | | 0.25 |
Service Class | | 0.12 |
Funds Management has contractually waived and/or reimbursed advisory and administration fees to the extent necessary to maintain certain net operating expense ratios for the Fund. Waiver of fees and/or reimbursement of expenses by Funds Management were made first from fund level expenses on a proportionate basis and then from class specific expenses. Funds Management has committed through July 11, 2013 to waive fees and/or reimburse expenses to the extent necessary to cap the Fund’s expenses at 0.65% for Class A, 0.20% for Institutional Class, 0.64% for Investor Class, 0.45% for Service Class and 1.00% for Sweep Class.
Distribution fees
The Trust has adopted a Distribution Plan for Sweep Class shares of the Fund pursuant to Rule 12b-1 under the 1940 Act. Distribution fees are charged to Sweep Class shares and paid to Wells Fargo Funds Distributor, LLC, the principal underwriter, at an annual rate of 0.35% of its average daily net assets.
Shareholder servicing fees
The Trust has entered into contracts with one or more shareholder servicing agents, whereby Class A, Investor Class, Service Class and Sweep Class of the Fund is charged a fee at an annual rate of 0.25% of the respective average daily net assets of each class.
A portion of these total shareholder servicing fees were paid to affiliates of Wells Fargo.
5. INDEMNIFICATION
Under the Trust’s organizational documents, the officers and directors are indemnified against certain liabilities that may arise out of performance of their duties to the Trust. Additionally, in the normal course of business, the Trust may enter into contracts with service providers that contain a variety of indemnification clauses. The Trust’s maximum exposure under these arrangements is dependent on future claims that may be made against the Fund and, therefore, cannot be estimated.
6. NEW ACCOUNTING PRONOUNCEMENT
In December 2011, the Financial Accounting Standards Board (“FASB”) issued Accounting Standard Update (“ASU”) No. 2011-11, Disclosures about Offsetting Assets and Liabilities. ASU 2011-11, which amends FASB ASC Topic 210, Balance Sheet, creates new disclosure requirements which require entities to disclose both gross and net information for derivatives and other financial instruments that are either offset in the Statement of Assets and Liabilities or subject to an enforceable master netting arrangement or similar agreement. The disclosure requirements are effective for interim and annual reporting periods beginning on or after January 1, 2013. Management is currently assessing the potential impact, in addition to expanded financial statement disclosure, that may result from adopting this ASU.
| | | | |
| 32 | | Wells Fargo Advantage Municipal Money Market Fund | | Other Information (Unaudited) |
PROXY VOTING INFORMATION
A description of the policies and procedures that the Fund uses to determine how to vote proxies relating to portfolio securities is available without charge, upon request, by calling 1-800-222-8222, visiting our Web site at wellsfargoadvantagefunds.com, or visiting the SEC Web site at sec.gov. Information regarding how the Fund voted proxies relating to portfolio securities during the most recent 12-month period ended June 30 is available without charge on the Fund’s Web site at wellsfargoadvantagefunds.com or by visiting the SEC Web site at sec.gov.
PORTFOLIO HOLDINGS INFORMATION
The complete portfolio holdings for each Fund are publicly available on the Funds’ Web site (wellsfargoadvantagefunds.com) on a monthly, seven-day delayed basis. The Fund files its complete schedule of portfolio holdings with the SEC for the first and third quarters of each fiscal year on Form N-Q, which is available without charge by visiting the SEC Web site at sec.gov. In addition, each Fund’s Form N-Q may be reviewed and copied at the SEC’s Public Reference Room in Washington, DC, and at regional offices in New York City, at 233 Broadway, and in Chicago, at 175 West Jackson Boulevard, Suite 900. Information about the Public Reference Room may be obtained by calling 1-800-SEC-0330.
| | | | | | |
| Other Information (Unaudited) | | Wells Fargo Advantage Municipal Money Market Fund | | | 33 | |
BOARD OF TRUSTEES AND OFFICERS
Each of the Trustees and Officers listed in the table below acts in identical capacities for the Wells Fargo Advantage family of funds, which consists of 138 funds comprising the Wells Fargo Funds Trust, Wells Fargo Variable Trust, Wells Fargo Master Trust and four closed-end funds (collectively the “Fund Complex”). This table should be read in conjunction with the Prospectus and the Statement of Additional Information1. All of the Trustees are also Members of the Audit and Governance Committees of each Trust in the Fund Complex. The mailing address of each Trustee and Officer is 525 Market Street, 12th Floor, San Francisco, CA 94105. Each Trustee and Officer serves an indefinite term, however, each Trustee serves such term until reaching the mandatory retirement age established by the Trustees.
Independent Trustees
| | | | | | |
Name and Year of Birth | | Position Held and Length of Service* | | Principal Occupations During Past Five Years | | Other Directorships During
Past Five Years |
Peter G. Gordon
(Born 1942) | | Trustee, since 1998, Chairman, since 2005 | | Co-Founder, Retired Chairman, President and CEO of Crystal Geyser Water Company. Trustee Emeritus, Colby College | | Asset Allocation Trust |
Isaiah Harris, Jr.
(Born 1952) | | Trustee, since 2009 | | Retired. Prior thereto, President and CEO of BellSouth Advertising and Publishing Corp. from 2005 to 2007, President and CEO of BellSouth Enterprises from 2004 to 2005 and President of BellSouth Consumer Services from 2000 to 2003. Emeritus member of the Iowa State University Foundation Board of Governors. Emeritus Member of the Advisory Board of Iowa State University School of Business. Mr. Harris is a certified public accountant. | | CIGNA Corporation; Deluxe Corporation; Asset Allocation Trust |
Judith M. Johnson
(Born 1949) | | Trustee, since 2008 Audit Committee Chairman, since 2008 | | Retired. Prior thereto, Chief Executive Officer and Chief Investment Officer of Minneapolis Employees Retirement Fund from 1996 to 2008. Ms. Johnson is an attorney, certified public accountant and a certified managerial accountant. | | Asset Allocation Trust |
Leroy Keith, Jr.
(Born 1939) | | Trustee, since 2010 | | Chairman, Bloc Global Services (development and construction). Trustee of the Evergreen Funds from 1983 to 2010. Former Managing Director, Almanac Capital Management (commodities firm), former Partner, Stonington Partners, Inc. (private equity fund), former Director, Obagi Medical Products Co. and former Director, Lincoln Educational Services. | | Trustee, Virtus Fund Complex (consisting of 40 portfolios as of 12/31/11); Asset Allocation Trust |
David F. Larcker
(Born 1950) | | Trustee, since 2009 | | James Irvin Miller Professor of Accounting at the Graduate School of Business, Stanford University, Director of Corporate Governance Research Program and Senior Faculty of The Rock Center for Corporate Governance since 2006. From 2005 to 2008, Professor of Accounting at the Graduate School of Business, Stanford University. Prior thereto, Ernst & Young Professor of Accounting at The Wharton School, University of Pennsylvania from 1985 to 2005. | | Asset Allocation Trust |
Olivia S. Mitchell
(Born 1953) | | Trustee, since 2006 | | International Foundation of Employee Benefit Plans Professor, Wharton School of the University of Pennsylvania since 1993. Director of Wharton’s Pension Research Council and Boettner Center on Pensions & Retirement Research, and Research Associate at the National Bureau of Economic Research. Previously, Cornell University Professor from 1978 to 1993. | | Asset Allocation Trust |
Timothy J. Penny
(Born 1951) | | Trustee, since 1996 | | President and CEO of Southern Minnesota Initiative Foundation, a non-profit organization, since 2007 and Senior Fellow at the Humphrey Institute Policy Forum at the University of Minnesota since 1995. Member of the Board of Trustees of NorthStar Education Finance, Inc., a non-profit organization, since 2007. | | Asset Allocation Trust |
| | | | |
| 34 | | Wells Fargo Advantage Municipal Money Market Fund | | Other Information (Unaudited) |
| | | | | | |
Name and Year of Birth | | Position Held and Length of Service* | | Principal Occupations During Past Five Years | | Other Directorships During
Past Five Years |
Michael S. Scofield
(Born 1943) | | Trustee, since 2010 | | Served on the Investment Company Institute’s Board of Governors and Executive Committee from 2008-2011 as well the Governing Council of the Independent Directors Council from 2006-2011 and the Independent Directors Council Executive Committee from 2008-2011. Chairman of the IDC from 2008-2010. Institutional Investor (Fund Directions) Trustee of Year in 2007. Trustee of the Evergreen Funds (and its predecessors) from 1984 to 2010. Chairman of the Evergreen Funds from 2000-2010. Former Trustee of the Mentor Funds. Retired Attorney, Law Offices of Michael S. Scofield and former Director and Chairman, Branded Media Corporation (multi-media branding company). | | Asset Allocation Trust |
Donald C. Willeke
(Born 1940) | | Trustee, since 1996 | | Principal of the law firm of Willeke & Daniels. General Counsel of the Minneapolis Employees Retirement Fund from 1984 until its consolidation into the Minnesota Public Employees Retirement Association on June 30, 2010. Director and Vice Chair of The Free Trust (non-profit corporation). Director of the American Chestnut Foundation (non-profit corporation). | | Asset Allocation Trust |
| * | Length of service dates reflect the Trustee’s commencement of service with the Trust’s predecessor entities, where applicable. |
Officers
| | | | | | |
Name and Year of Birth | | Position Held and
Length of Service | | Principal Occupations During Past Five Years | | |
Karla M. Rabusch
(Born 1959) | | President, since 2003 | | Executive Vice President of Wells Fargo Bank, N.A. and President of Wells Fargo Funds Management, LLC since 2003. Senior Vice President and Chief Administrative Officer of Wells Fargo Funds Management, LLC from 2001 to 2003. | | |
C. David Messman
(Born 1960) | | Secretary, since 2000; Chief Legal Officer, since 2003 | | Senior Vice President and Secretary of Wells Fargo Funds Management, LLC since 2001. Vice President and Managing Senior Counsel of Wells Fargo Bank, N.A. since 1996. | | |
Nancy Wiser (Born 1967) | | Treasurer, since 2012 | | Executive Vice President of Wells Fargo Funds Management, LLC since 2011. Chief Operating Officer and Chief Compliance Officer at LightBox Capital Management LLC, from 2008 to 2011. Owned and operated a consulting business providing services to various hedge funds including acting as Chief Operating Officer and Chief Compliance Officer for a hedge fund from 2007 to 2008. Chief Operating Officer and Chief Compliance Officer of GMN Capital LLC from 2006 to 2007. | | |
David Berardi
(Born 1975) | | Assistant Treasurer, since 2009 | | Vice President of Wells Fargo Funds Management, LLC since 2009. Vice President of Evergreen Investment Management Company, LLC from 2008 to 2010. Assistant Vice President of Evergreen Investment Services, Inc. from 2004 to 2008. Manager of Fund Reporting and Control for Evergreen Investment Management Company, LLC from 2004 to 2010. | | |
Jeremy DePalma
(Born 1974) | | Assistant Treasurer, since 2009 | | Senior Vice President of Wells Fargo Funds Management, LLC since 2009. Senior Vice President of Evergreen Investment Management Company, LLC from 2008 to 2010. Vice President, Evergreen Investment Services, Inc. from 2004 to 2007. Head of the Fund Reporting and Control Team within Fund Administration from 2005 to 2010. | | |
Debra Ann Early
(Born 1964) | | Chief Compliance Officer, since 2007 | | Chief Compliance Officer of Wells Fargo Funds Management, LLC since 2007. Chief Compliance Officer of Parnassus Investments from 2005 to 2007. Chief Financial Officer of Parnassus Investments from 2004 to 2007 and Senior Audit Manager of PricewaterhouseCoopers LLP from 1998 to 2004. | | |
| 1. | The Statement of Additional Information includes additional information about the Trustees and is available, without charge, upon request, by calling 1-800-222-8222 or by visiting the Web site at wellsfargoadvantagefunds.com. |
| | | | | | |
| Other Information (Unaudited) | | Wells Fargo Advantage Municipal Money Market Fund | | | 35 | |
BOARD CONSIDERATION OF INVESTMENT ADVISORY AND SUB-ADVISORY AGREEMENTS:
Under Section 15 of the Investment Company Act of 1940 (the “1940 Act”), the Board of Trustees (the “Board”) of Wells Fargo Funds Trust (the “Trust”), all the members of which have no direct or indirect interest in the investment advisory and sub-advisory agreements and are not “interested persons” of the Trust, as defined in the 1940 Act (the “Independent Trustees”), must determine whether to approve the continuation of the Trust’s investment advisory and sub-advisory agreements. In this regard, at an in person meeting held on March 29-30, 2012 (the “Meeting”), the Board reviewed and re-approved: (i) an investment advisory agreement with Wells Fargo Funds Management, LLC (“Funds Management”) for Wells Fargo Advantage Municipal Money Market Fund (the “Fund”) and (ii) an investment sub-advisory agreement with Wells Capital Management Incorporated (“Wells Capital Management”) for the Fund. The investment advisory agreement with Funds Management and the investment sub-advisory agreement with Wells Capital Management are collectively referred to as the “Advisory Agreements.”
At the Meeting, the Board considered the factors and reached the conclusions described below relating to the selection of Funds Management and Wells Capital Management and the continuation of the Advisory Agreements. Prior to the Meeting, the Trustees conferred extensively among themselves and with representatives of Funds Management about these matters. The Board also met throughout the year and received information that was useful to them in considering the continuation of the Advisory Agreements. The Independent Trustees were assisted in their evaluation of the Advisory Agreements by independent legal counsel, from whom they received separate legal advice and with whom they met separately from Funds Management.
In providing information to the Board, Funds Management and Wells Capital Management were guided by a detailed set of requests submitted by the Independent Trustees’ independent legal counsel on their behalf at the start of the Board’s annual contract renewal process earlier in 2012. In approving the Advisory Agreements, the Board did not identify any particular information or consideration that was all-important or controlling, and each Trustee likely attributed different weights to various factors.
Nature, extent and quality of services
The Board received and considered various information regarding the nature, extent and quality of services provided to the Fund by Funds Management and Wells Capital Management under the Advisory Agreements. The Board also received and considered, among other things, information about the background and experience of senior management of Funds Management, and the qualifications, backgrounds, tenures and responsibilities of the portfolio managers primarily responsible for the day-to-day portfolio management of the Fund.
The Board evaluated the ability of Funds Management and Wells Capital Management, based on their respective financial condition, resources, reputation and other attributes, to attract and retain qualified investment professionals, including research, advisory, and supervisory personnel. The Board further considered the compliance programs and compliance records of Funds Management and Wells Capital Management. In addition, the Board took into account the administrative services provided to the Fund by Funds Management and its affiliates.
The Board’s decision to approve the continuation of the Advisory Agreements was based on a comprehensive evaluation of information provided to it. In considering these matters, the Board considered not only the specific information presented in connection with the Meeting, but also the knowledge gained over time through interaction with Funds Management and Wells Capital Management about various topics, including Funds Management’s oversight of service providers. The above factors, together with those referenced below, are some of the most important, but not necessarily all, factors considered by the Board in concluding that the nature, extent and quality of the investment advisory services provided to the Fund by Funds Management and Wells Capital Management supported the re-approval of the Advisory Agreements. Although the Board considered the continuation of the Advisory Agreements for the Fund as part of the larger process of considering the continuation of the advisory agreements for all of the funds in the complex, its decision to continue the Advisory Agreements for the Fund was ultimately made on a fund-by-fund basis.
| | | | |
| 36 | | Wells Fargo Advantage Municipal Money Market Fund | | Other Information (Unaudited) |
Fund performance and expenses
The Board considered the performance results for the Fund over various time periods ended December 31, 2011. The Board also considered these results in comparison to the median performance of a universe of relevant funds (the “Universe”) that was determined by Lipper Inc. (“Lipper”) to be similar to the Fund, and in comparison to the Fund’s benchmark index and to other comparative data. Lipper is an independent provider of investment company data. The Board received a description of the methodology used by Lipper to select the mutual funds in the Universe. The Board noted that the performance of the Fund was equal to or in range of the median performance of the Universe for all periods under review. The Board also noted that the performance of the Fund was equal to or in range of its benchmark, the Lipper Tax-Exempt Money Market Funds Index, for the periods under review.
The Board received and considered information regarding the Fund’s contractual advisory fee and net operating expense ratios and their various components, including actual management fees (which reflect fee waivers, if any), transfer agent, custodian and other non-management fees, Rule 12b-1 and non-Rule 12b-1 fees, service fees and fee waiver and expense reimbursement arrangements. The Board also considered these ratios in comparison to the median ratios of an expense Universe and a narrower expense group of mutual funds (each, an “Expense Group”) that was determined by Lipper to be similar to the Fund. The Board received a description of the methodology used by Lipper to select the mutual funds in the Fund’s Expense Group. The Board noted that the net operating expense ratios of the Fund were higher than the Fund’s Expense Group’s median net operating expense ratios, except for the Service and Institutional Classes.
Funds Management advised the Board that the Expense Group medians reflected voluntary waivers, whereas the Fund’s expense ratios did not reflect voluntary waivers. The Board noted that when the Fund’s expense ratios were adjusted to reflect voluntary waivers, the Fund’s net operating expense ratios were lower than the median net operating expense ratios of the Expense Group. The Board viewed favorably Funds Management’s proposal to lower the net operating expense cap of the Fund’s Sweep Class by five basis points.
Based on the above-referenced considerations and other factors, the Board concluded that the overall performance and expense structure of the Fund supported the re-approval of the Advisory Agreements for the Fund.
Investment advisory and sub-advisory fee rates
The Board reviewed and considered the contractual investment advisory fee rate that is payable by the Fund to Funds Management for investment advisory services (the “Advisory Agreement Rate”), both on a stand-alone basis and on a combined basis with the Fund’s administration fee rate. The Board took into account the separate administrative and other services covered by the administration fee rate. The Board also reviewed and considered the contractual investment sub-advisory fee rate that is payable by Funds Management to Wells Capital Management for investment sub-advisory services (the “Sub-Advisory Agreement Rate”). In addition, the Board reviewed and considered the existing fee waiver/cap arrangements applicable to the Advisory Agreement Rate and considered the Advisory Agreement Rate after taking the waivers/caps into account (the “Net Advisory Rate”).
The Board received and considered information comparing the Advisory Agreement Rate and Net Advisory Rate, combined with the administration fee rates, with those of other funds in the Fund’s Expense Group median. The Board noted that the Advisory Agreement Rate for the Fund was higher than the median rates for the Fund’s Expense Group, except for the Service Class. The Board also noted that the Net Advisory Rate for the Fund was higher than the median rates for the Fund’s Expense Group, except for the Service and Institutional Classes. The Board viewed favorably Funds Management’s willingness to voluntarily waive certain fees and its proposal to lower the net operating expense cap for the Sweep Class.
The Board also received and considered information about the nature and extent of services offered and fee rates charged by Funds Management and Wells Capital Management to other types of clients. In this regard, the Board received information about differences between the services, and the compliance, reporting, and other legal burdens and risks of providing investment advice to mutual funds and those associated with providing advice to non-mutual fund clients such as collective funds or institutional separate accounts.
| | | | | | |
| Other Information (Unaudited) | | Wells Fargo Advantage Municipal Money Market Fund | | | 37 | |
The Board determined that the Advisory Agreement Rate for the Fund, both with and without the administration fee rate and before and after waivers, was reasonable in light of the Fund’s Expense Group information, the net expense ratio commitments, the services covered by the Advisory Agreements and other information provided. The Board also reviewed and considered the Sub-Advisory Agreement Rate and concluded that the Sub-Advisory Agreement Rate was reasonable in light of the services covered by the sub-advisory agreement and other information provided.
Profitability
The Board received and considered a profitability analysis of Funds Management, as well as an analysis of the profitability to the collective Wells Fargo businesses that provide services to the Fund. It considered that the information provided to it was necessarily estimated, and that the profitability information provided to it, especially on a fund-by-fund basis, did not necessarily provide a precise tool for evaluating the appropriateness of the Fund’s Advisory Agreement Rate in isolation. It noted that the levels of profitability reported on a fund-by-fund basis varied widely, depending on, among other things, the size and type of fund. The Board noted the impact of voluntary fee waivers on Funds Management’s profitability. The Board concluded that the profitability reported by Funds Management was not unreasonable.
The Board did not consider separate profitability information with respect to Wells Capital Management, because, as an affiliate of Funds Management, its profitability information was subsumed in the collective Wells Fargo profitability analysis provided by Funds Management.
Economies of scale
With respect to possible economies of scale, the Board reviewed the breakpoints in the Fund’s advisory fee and/or administration fee structure, which operate generally to reduce the expenses of the Fund (as a percentage of Fund assets) as the Fund grows in size. It considered that, as a fund shrinks in size, breakpoints conversely result in increasing fee levels. The Board noted that it would have on-going opportunities to review the appropriate levels of breakpoints in the future, and concluded that the breakpoints as implemented appeared to be a reasonable step toward sharing economies of scale, if any, with the Fund. However, the Board acknowledged the inherent limitations of any analysis of economies of scale and of any attempt to correlate breakpoints with such economies, stemming largely from the Board’s understanding that economies of scale are realized, if at all, across a variety of products and services, not just with respect to a single fund.
Other benefits to Funds Management and Wells Capital Management
The Board received and considered information regarding potential “fall-out” or ancillary benefits received by Funds Management and its affiliates, including Wells Capital Management, as a result of their relationship with the Fund. Ancillary benefits could include, among others, benefits directly attributable to the relationship of Funds Management and Wells Capital Management with the Fund and benefits potentially derived from an increase in Funds Management’s and Wells Capital Management’s business as a result of their relationship with the Fund (such as the ability to market to shareholders other financial products offered by Funds Management and its affiliates, including Wells Capital Management).
The Board considered that Wells Fargo Funds Distributor, LLC, an affiliate of Funds Management, serves as distributor to the Fund and receives certain compensation for those services. The Board noted that various financial institutions, including affiliates of Funds Management, may receive distribution-related fees, shareholder servicing payments (including amounts derived from payments under Rule 12b-1 plans) and sub-transfer agency fees in respect of shares sold or held through them and services provided.
The Board also reviewed information about whether and to what extent soft dollar credits are sought and how any such credits are utilized and any benefits that may be realized by using an affiliated broker.
| | | | |
| 38 | | Wells Fargo Advantage Municipal Money Market Fund | | Other Information (Unaudited) |
Other factors and broader review
The Board also considered the markets for distribution of the Fund’s shares, including the channels through which the Fund’s shares are offered and sold. The Board noted that the Fund is part of one of the few fund families that have both direct-to-fund and intermediary distribution channels. As discussed above, the Board reviews detailed materials received from Funds Management and Wells Capital Management annually as part of the re-approval process under Section 15 of the 1940 Act and also reviews and assesses information about the quality of the services that the Fund receives throughout the year. In this regard, the Board has reviewed reports of Funds Management at each of its quarterly meetings, which include, among other things, portfolio reviews and performance reports. In addition, the Board confers with portfolio managers at various times throughout the year.
Conclusion
After considering the above-described factors and based on its deliberations and its evaluation of the information described above, the Board unanimously approved the continuation of the Advisory Agreements for an additional one-year period.
| | | | | | |
| List of Abbreviations | | Wells Fargo Advantage Municipal Money Market Fund | | | 39 | |
The following is a list of common abbreviations for terms and entities which may have appeared in this report.
| ACB | — Agricultural Credit Bank |
| ADR | — American Depository Receipt |
| ADS | — American Depository Shares |
| AGC-ICC | — Assured Guaranty Corporation - Insured Custody Certificates |
| AGM | — Assured Guaranty Municipal |
| AMBAC | — American Municipal Bond Assurance Corporation |
| AMT | — Alternative Minimum Tax |
| BAN | — Bond Anticipation Notes |
| BHAC | — Berkshire Hathaway Assurance Corporation |
| CAB | — Capital Appreciation Bond |
| CCAB | — Convertible Capital Appreciation Bond |
| CDA | — Community Development Authority |
| CDO | — Collateralized Debt Obligation |
| COP | — Certificate of Participation |
| DRIVER | — Derivative Inverse Tax-Exempt Receipts |
| DW&P | — Department of Water & Power |
| DWR | — Department of Water Resources |
| ECFA | — Educational & Cultural Facilities Authority |
| EDA | — Economic Development Authority |
| EDFA | — Economic Development Finance Authority |
| ETF | — Exchange-Traded Fund |
| FFCB | — Federal Farm Credit Bank |
| FGIC | — Financial Guaranty Insurance Corporation |
| FGLMC | — Federal Government Loan Mortgage Company |
| FHA | — Federal Housing Authority |
| FHLB | — Federal Home Loan Bank |
| FHLMC | — Federal Home Loan Mortgage Corporation |
| FICO | — The Financing Corporation |
| FNMA | — Federal National Mortgage Association |
| GDR | — Global Depository Receipt |
| GNMA | — Government National Mortgage Association |
| HCFR | — Healthcare Facilities Revenue |
| HEFA | — Health & Educational Facilities Authority |
| HEFAR | — Higher Education Facilities Authority Revenue |
| HFA | — Housing Finance Authority |
| HFFA | — Health Facilities Financing Authority |
| IBC | — Insured Bond Certificate |
| IDA | — Industrial Development Authority |
| IDAG | — Industrial Development Agency |
| IDR | — Industrial Development Revenue |
| KRW | — Republic of Korea Won |
| LIBOR | — London Interbank Offered Rate |
| LLC | — Limited Liability Company |
| LLP | — Limited Liability Partnership |
| MBIA | — Municipal Bond Insurance Association |
| MFHR | — Multi-Family Housing Revenue |
| MSTR | — Municipal Securities Trust Receipts |
| MUD | — Municipal Utility District |
| NATL-RE | — National Public Finance Guarantee Corporation |
| PCFA | — Pollution Control Finance Authority |
| PCR | — Pollution Control Revenue |
| PFA | — Public Finance Authority |
| PFFA | — Public Facilities Financing Authority |
| PFOTER | — Puttable Floating Option Tax-Exempt Receipts |
| plc | — Public Limited Company |
| PUTTER | — Puttable Tax-Exempt Receipts |
| R&D | — Research & Development |
| RDA | — Redevelopment Authority |
| RDFA | — Redevelopment Finance Authority |
| REIT | — Real Estate Investment Trust |
| ROC | — Reset Option Certificates |
| SAVRS | — Select Auction Variable Rate Securities |
| SBA | — Small Business Authority |
| SFHR | — Single Family Housing Revenue |
| SFMR | — Single Family Mortgage Revenue |
| SPA | — Standby Purchase Agreement |
| SPDR | — Standard & Poor’s Depositary Receipts |
| STRIPS | — Separate Trading of Registered Interest and Principal Securities |
| TAN | — Tax Anticipation Notes |
| TIPS | — Treasury Inflation-Protected Securities |
| TRAN | — Tax Revenue Anticipation Notes |
| TCR | — Transferable Custody Receipts |
| TTFA | — Transportation Trust Fund Authority |
| TVA | — Tennessee Valley Authority |
| XLCA | — XL Capital Assurance |
This page is intentionally left blank.
This page is intentionally left blank.
This page is intentionally left blank.


FOR MORE INFORMATION
More information about Wells Fargo Advantage Funds is available free upon request. To obtain literature, please write, e-mail, visit the Fund’s Web site, or call:
Wells Fargo Advantage Funds
P.O. Box 8266
Boston, MA 02266-8266
E-mail: wfaf@wellsfargo.com
Web site: wellsfargoadvantagefunds.com
Individual investors: 1-800-222-8222
Retail investment professionals: 1-888-877-9275
Institutional investment professionals: 1-866-765-0778
This report and the financial statements contained herein are submitted for the general information of the shareholders of Wells Fargo Advantage Funds. If this report is used for promotional purposes, distribution of the report must be accompanied or preceded by a current prospectus. For a current prospectus and, if available, a summary prospectus containing more complete information, including charges and expenses, call 1-800-222-8222 or visit the Fund’s Web site at wellsfargoadvantagefunds.com. Please consider the investment objectives, risks, charges, and expenses of the investment carefully before investing. This and other information about Wells Fargo Advantage Funds can be found in the current prospectus. Read the prospectus carefully before you invest or send money.
Wells Fargo Funds Management, LLC, a wholly owned subsidiary of Wells Fargo & Company, provides investment advisory and administrative services for Wells Fargo Advantage Funds. Other affiliates of Wells Fargo & Company provide subadvisory and other services for the Funds. The Funds are distributed by Wells Fargo Funds Distributor, LLC, Member FINRA/SIPC, an affiliate of Wells Fargo & Company.
NOT FDIC INSURED ¡ NO BANK GUARANTEE ¡ MAY LOSE VALUE
© 2012 Wells Fargo Funds Management, LLC. All rights reserved.
| | |
 | | 211392 09-12 SA308/SAR308 07-12 |

Wells Fargo Advantage
National Tax-Free Money Market Fund

Semi-Annual Report
July 31, 2012

Reduce clutter. Save trees.
Sign up for electronic delivery of prospectuses and shareholder reports at wellsfargo.com/advantagedelivery
Contents
The views expressed and any forward-looking statements are as of July 31, 2012, unless otherwise noted, and are those of the Fund managers and/or Wells Fargo Funds Management, LLC. Discussions of individual securities, or the markets generally, or any Wells Fargo Advantage Fund are not intended as individual recommendations. Future events or results may vary significantly from those expressed in any forward-looking statements; the views expressed are subject to change at any time in response to changing circumstances in the market. Wells Fargo Funds Management, LLC, disclaims any obligation to publicly update or revise any views expressed or forward-looking statements.
NOT FDIC INSURED ¡ NO BANK GUARANTEE ¡ MAY LOSE VALUE

WELLS FARGO INVESTMENT HISTORY
| | |
| |
| 1932 | | Keystone creates one of the first mutual fund families. |
| |
| 1971 | | Wells Fargo & Company introduces one of the first institutional index funds. |
| |
| 1978 | | Wells Fargo applies Markowitz and Sharpe’s research on Modern Portfolio Theory to introduce one of the industry’s first Tactical Asset Allocation (TAA) models in institutional separately managed accounts. |
| |
| 1984 | | Wells Fargo Stagecoach Funds launches its first asset allocation fund. |
| |
| 1989 | | The Tactical Asset Allocation (TAA) Model is first applied to Wells Fargo’s asset allocation mutual funds. |
| |
| 1994 | | Wells Fargo introduces the LifePath Funds, one of the first suites of target date funds (now the Wells Fargo Advantage Dow Jones Target Date FundsSM). |
| |
| 1996 | | Evergreen Investments and Keystone Funds merge. |
| |
| 1997 | | Wells Fargo launches Wells Fargo Advantage WealthBuilder PortfoliosSM, a fund-of-funds suite of products that includes the use of quantitative models to shift assets among investment styles. |
| |
| 1999 | | Norwest Advantage Funds and Stagecoach Funds are reorganized into Wells Fargo Funds after the merger of Norwest and Wells Fargo. |
| |
| 2002 | | Evergreen Retail and Evergreen Institutional companies form the umbrella asset management company, Evergreen Investments. |
| |
| 2005 | | The integration of Strong Funds with Wells Fargo Funds creates Wells Fargo Advantage Funds, resulting in one of the top 20 mutual fund companies in the United States. |
| |
| 2006 | | Wells Fargo Advantage Funds relaunches the target date product line as Wells Fargo Advantage Dow Jones Target Date Funds. |
| |
| 2010 | | The mergers and reorganizations of Evergreen and Wells Fargo Advantage mutual funds are completed, unifying the families under the brand of Wells Fargo Advantage Funds. |
Wells Fargo Advantage Funds®
Wells Fargo Advantage Funds skillfully guides institutions, financial advisors, and individuals through the investment terrain to help them reach their financial objectives. Everything we do on behalf of investors is backed by our unique combination of qualifications.
Strength
Our organization is built on the standards of integrity and service established by our parent company—Wells Fargo & Company—more than 150 years ago. And, because we’re part of a highly diversified financial enterprise, we offer the depth of resources to help investors succeed.
Expertise
Our multi-boutique model offers investors access to the independent thinking of premier investment managers that have been chosen for their time-tested strategies. While each team specializes in a specific investment strategy, collectively they provide investors a wide choice of distinct investment styles. Our dedication to investment excellence doesn’t end with our expertise in manager selection—risk management, analysis, and rigorous ongoing review seek to ensure each manager’s investment process remains consistent.
Partnership
Our collaborative approach is built around understanding the needs and goals of our clients. By adhering to core principles of sound judgment and steady guidance, we support you through every stage of the investment decision process.
Carefully consider a fund’s investment objectives, risks, charges, and expenses before investing. For a current prospectus and, if available, a summary prospectus, containing this and other information, visit wellsfargoadvantagefunds.com. Read it carefully before investing.
Wells Fargo Funds Management, LLC, a wholly owned subsidiary of Wells Fargo & Company, provides investment advisory and administrative services for Wells Fargo Advantage Funds®. Other affiliates of Wells Fargo & Company provide subadvisory and other services for the Funds. The Funds are distributed by Wells Fargo Funds Distributor, LLC, Member FINRA/SIPC, an affiliate of Wells Fargo & Company.
“Dow Jones®” and “Dow Jones Target Date IndexesSM” are service marks of Dow Jones Trademark Holdings, LLC (“Dow Jones”), have been licensed to CME Group Index Services LLC (“CME Indexes”) and have been sublicensed for use for certain purposes by Global Index Advisors, Inc, and Wells Fargo Funds Management, LLC. The Wells Fargo Advantage Dow Jones Target Date FundsSM based on the Dow Jones Target Date IndexesSM, are not sponsored, endorsed, sold or promoted by Dow Jones, CME Indexes or their respective affiliates and none of them makes any representation regarding the advisability of investing in such product(s).
NOT FDIC INSURED ¡ NO BANK GUARANTEE ¡ MAY LOSE VALUE
Not part of the semi-annual report.
Wells Fargo Advantage Funds offers more than 110 mutual funds across a wide range of asset classes, representing over $209 billion in assets under management, as of July 31, 2012.
| | | | |
| Equity Funds | | | | |
Asia Pacific Fund | | Enterprise Fund† | | Opportunity Fund† |
C&B Large Cap Value Fund | | Equity Value Fund | | Precious Metals Fund |
C&B Mid Cap Value Fund | | Global Opportunities Fund | | Premier Large Company Growth Fund |
Capital Growth Fund | | Growth Fund | | Small Cap Opportunities Fund |
Common Stock Fund | | Index Fund | | Small Cap Value Fund |
Disciplined U.S. Core Fund | | International Equity Fund | | Small Company Growth Fund |
Discovery Fund† | | International Value Fund | | Small Company Value Fund |
Diversified Equity Fund | | Intrinsic Small Cap Value Fund | | Small/Mid Cap Core Fund |
Diversified International Fund | | Intrinsic Value Fund | | Small/Mid Cap Value Fund |
Diversified Small Cap Fund | | Intrinsic World Equity Fund | | Special Mid Cap Value Fund |
Emerging Growth Fund | | Large Cap Core Fund | | Special Small Cap Value Fund |
Emerging Markets Equity Fund | | Large Cap Growth Fund | | Specialized Technology Fund |
Emerging Markets Equity Income Fund | | Large Company Value Fund | | Traditional Small Cap Growth Fund |
Endeavor Select Fund† | | Omega Growth Fund | | Utility and Telecommunications Fund |
| Bond Funds | | | | |
Adjustable Rate Government Fund | | Inflation-Protected Bond Fund | | Short-Term Bond Fund |
California Limited-Term Tax-Free Fund | | Intermediate Tax/AMT-Free Fund | | Short-Term High Yield Bond Fund |
California Tax-Free Fund | | International Bond Fund | | Short-Term Municipal Bond Fund |
Colorado Tax-Free Fund | | Minnesota Tax-Free Fund | | Strategic Municipal Bond Fund |
Emerging Markets Local Bond Fund | | Municipal Bond Fund | | Total Return Bond Fund |
Government Securities Fund | | North Carolina Tax-Free Fund | | Ultra Short-Term Income Fund |
High Income Fund | | Pennsylvania Tax-Free Fund | | Ultra Short-Term Municipal Income Fund |
High Yield Bond Fund | | Short Duration Government Bond Fund | | Wisconsin Tax-Free Fund |
Income Plus Fund | | | | |
| Asset Allocation Funds | | | | |
Absolute Return Fund | | WealthBuilder Equity Portfolio† | | Target 2020 Fund† |
Asset Allocation Fund | | WealthBuilder Growth Allocation Portfolio† | | Target 2025 Fund† |
Conservative Allocation Fund | | WealthBuilder Growth Balanced Portfolio† | | Target 2030 Fund† |
Diversified Capital Builder Fund | | WealthBuilder Moderate Balanced Portfolio† | | Target 2035 Fund† |
Diversified Income Builder Fund | | WealthBuilder Tactical Equity Portfolio† | | Target 2040 Fund† |
Growth Balanced Fund | | Target Today Fund† | | Target 2045 Fund† |
Index Asset Allocation Fund | | Target 2010 Fund† | | Target 2050 Fund† |
Moderate Balanced Fund | | Target 2015 Fund† | | Target 2055 Fund† |
WealthBuilder Conservative Allocation Portfolio† | | | | |
| Money Market Funds | | | | |
100% Treasury Money Market Fund | | Heritage Money Market Fund† | | National Tax-Free Money Market Fund |
California Municipal Money Market Fund | | Money Market Fund | | Prime Investment Money Market Fund |
Cash Investment Money Market Fund | | Municipal Cash Management Money Market Fund | | Treasury Plus Money Market Fund |
Government Money Market Fund | | Municipal Money Market Fund | | |
| Variable Trust Funds1 | | | | |
VT Discovery Fund† | | VT Intrinsic Value Fund | | VT Small Cap Growth Fund |
VT Index Asset Allocation Fund | | VT Omega Growth Fund | | VT Small Cap Value Fund |
VT International Equity Fund | | VT Opportunity Fund† | | VT Total Return Bond Fund |
An investment in a money market fund is not insured or guaranteed by the Federal Deposit Insurance Corporation or any other government agency. Although the Wells Fargo Advantage Money Market Funds seek to preserve the value of your investment at $1.00 per share, it is possible to lose money by investing in a money market fund.
| 1. | The Variable Trust Funds are generally available only through insurance company variable contracts. |
| † | In this report, the Wells Fargo Advantage Discovery FundSM, Wells Fargo Advantage Endeavor Select FundSM, Wells Fargo Advantage Enterprise FundSM, Wells Fargo Advantage Opportunity FundSM, Wells Fargo Advantage WealthBuilder Conservative Allocation PortfolioSM, Wells Fargo Advantage WealthBuilder Equity PortfolioSM, Wells Fargo Advantage WealthBuilder Growth Allocation PortfolioSM, Wells Fargo Advantage WealthBuilder Growth Balanced PortfolioSM, Wells Fargo Advantage WealthBuilder Moderate Balanced PortfolioSM, Wells Fargo Advantage WealthBuilder Tactical Equity PortfolioSM, Wells Fargo Advantage Dow Jones Target Today FundSM, Wells Fargo Advantage Dow Jones Target 2010 FundSM, Wells Fargo Advantage Dow Jones Target 2015 FundSM, Wells Fargo Advantage Dow Jones Target 2020 FundSM, Wells Fargo Advantage Dow Jones Target 2025 FundSM, Wells Fargo Advantage Dow Jones Target 2030 FundSM, Wells Fargo Advantage Dow Jones Target 2035 FundSM, Wells Fargo Advantage Dow Jones Target 2040 FundSM, Wells Fargo Advantage Dow Jones Target 2045 FundSM, Wells Fargo Advantage Dow Jones Target 2050 FundSM, Wells Fargo Advantage Dow Jones Target 2055 FundSM, Wells Fargo Advantage Heritage Money Market FundSM, Wells Fargo Advantage VT Discovery FundSM, and Wells Fargo Advantage VT Opportunity FundSM are referred to as the Discovery Fund, Endeavor Select Fund, Enterprise Fund, Opportunity Fund, WealthBuilder Conservative Allocation Portfolio, WealthBuilder Equity Portfolio, WealthBuilder Growth Allocation Portfolio, WealthBuilder Growth Balanced Portfolio, WealthBuilder Moderate Balanced Portfolio, WealthBuilder Tactical Equity Portfolio, Target Today Fund, Target 2010 Fund, Target 2015 Fund, Target 2020 Fund, Target 2025 Fund, Target 2030 Fund, Target 2035 Fund, Target 2040 Fund, Target 2045 Fund, Target 2050 Fund, Target 2055 Fund, Heritage Money Market Fund, VT Discovery Fund, and VT Opportunity Fund, respectively. |
Not part of the semi-annual report.
| | | | |
| 2 | | Wells Fargo Advantage National Tax-Free Money Market Fund | | Letter to Shareholders (Unaudited) |

Karla M. Rabusch,
President
Wells Fargo Advantage Funds
Not only has the Fed been successful in engineering low interest rates, but investors have rushed to buy U.S. Treasury securities as a safe-haven asset in the midst of uncertainty surrounding the European debt crisis. As a result, interest rates reached record lows.
Dear Valued Shareholder:
We’re pleased to offer you this semi-annual report for the Wells Fargo Advantage National Tax-Free Money Market Fund for the six-month period that ended July 31, 2012. Upon reviewing the report, you may notice that your Fund has included a summary portfolio schedule in lieu of a complete portfolio schedule, which we hope will help you focus on your Fund’s principal holdings and assist you in evaluating your Fund’s risk profile and investment strategy. The Fund’s full portfolio schedule is still available upon request or at wellsfargoadvantagefunds.com for those investors who wish to see it.
The economy grew, but the recovery has been modest.
The U.S. is three years into a modest economic recovery, with second-quarter real gross domestic product (GDP) increasing 1.5% on an annualized basis. Several factors, however, held back growth despite the Federal Reserve’s (Fed) accommodative monetary policy. In Europe, much uncertainty remained about the outcome of the eurozone debt crisis and whether policymakers will be able to resolve it without any countries defaulting or leaving the euro. In addition, Europe has again entered a recession. In Asia, China’s economy slowed. Here at home, a potential “fiscal cliff”—automatic tax increases alongside automatic budget cuts stemming from a legislative compromise in Congress—added uncertainty and, if unaddressed, could negatively affect GDP beginning in 2013.
In an effort to further bolster the economy, especially the labor market, the Fed has indicated its commitment to maintaining a highly accommodative monetary policy. It has indicated its belief that economic conditions warrant an extremely low federal funds target rate—a short-term bank lending rate—near 0%, at least through late 2014. The Fed also continued its “Operation Twist,” which involves buying U.S. Treasury securities with maturities of greater than six years and selling U.S. Treasury securities with maturities of less than three years, in an effort to keep longer-term interest rates low.
A demand for relative safe-haven securities led to ultra-low interest rates.
Not only has the Fed been successful in engineering low interest rates, but investors have rushed to buy U.S. Treasury securities as a relative safe-haven asset in the midst of uncertainty surrounding the European debt crisis. As a result, interest rates reached record lows. Ten-year U.S. Treasury yields ranged between 2.38% and 1.38% over the past six months. Three-month U.S. Treasury bills had an average yield of 10 basis points (bps; 100 bps is 1.00%) over the past six months. Rates on seven-day commercial paper, a common investment type for prime money market funds, were 12 bps on July 31, 2012.
Lack of supply kept a lid on yields, and regulatory uncertainty remained.
Continued demand for a limited supply of money market-eligible securities also contributed to low yields. We estimate that the amount outstanding of short-term, money market fund-eligible securities (excluding U.S. Treasury securities) has declined by $3 trillion, or more than a 30% decrease, since 2008. Reasons for this decrease in supply include issuers opting to lock in rates on long-term rather than short-term debt, less need for financing as many companies have plentiful cash given record profits, and credit downgrades that have resulted in fewer firms with top credit ratings.
| | | | | | |
| Letter to Shareholders (Unaudited) | | Wells Fargo Advantage National Tax-Free Money Market Fund | | | 3 | |
The Chairman of the Securities and Exchange Commission (SEC) indicated in late August that the SEC has determined at this time not to propose certain amendments to the rules governing money market funds. However, the Financial Stability Oversight Council or other financial regulators could still take steps to impose additional regulations on money market funds. As we gain clarity in the coming months regarding any potential changes to regulation of money market funds, we will provide further communications to our clients about these changes.
Amid the current challenges of investing—low yields, an unresolved eurozone crisis, limited supply, and regulatory uncertainty—has been the opportunity to provide our clients an important investment option for meeting their short-term cash needs. Our focus on preservation of capital and liquidity is not a marketing phrase but rather the basis of our investment philosophy as we manage money market funds in an uncertain world. We are proud of our comprehensive lineup of prime, government, and tax-exempt money market funds.
Thank you for choosing to invest with Wells Fargo Advantage Funds. We appreciate your confidence in us and remain committed to helping you meet your financial needs. For current information about your fund investments, contact your investment professional, visit our Web site at wellsfargoadvantagefunds.com, or call us directly at 1-800-222-8222. We are available 24 hours a day, 7 days a week.
Sincerely,

Karla M. Rabusch
President
Wells Fargo Advantage Funds
Amid the current challenges of investing—low yields, an unresolved eurozone crisis, limited supply, and regulatory uncertainty—has been the opportunity to provide our clients an important investment option for meeting their short-term cash needs.
| | | | |
| 4 | | Wells Fargo Advantage National Tax-Free Money Market Fund | | Performance Highlights (Unaudited) |
INVESTMENT OBJECTIVE
The Fund seeks current income exempt from federal income tax, while preserving capital and liquidity.
ADVISER
Wells Fargo Funds Management, LLC
SUB-ADVISER
Wells Capital Management Incorporated
PORTFOLIO MANAGERS
David D. Sylvester
James Randazzo
FUND INCEPTION
January 7, 1988
| | |
SECTOR DISTRIBUTION1
(AS OF JULY 31, 2012) | | |
|
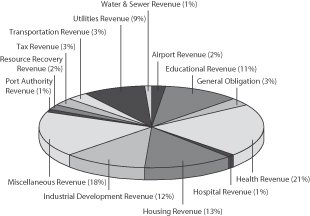 |
| | |
EFFECTIVE MATURITY DISTRIBUTION2 (AS OF JULY 31, 2012) | | |
|
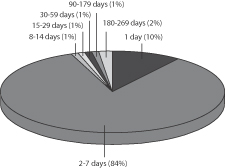 |
| | |
WEIGHTED AVERAGE MATURITY3 (AS OF JULY 31, 2012) | | |
13 Days | | |
| | |
WEIGHTED AVERAGE FINAL MATURITY4
(AS OF JULY 31, 2012) | | |
13 Days | | |
| 1. | Sector distribution is subject to change and is calculated based on the total investments of the Fund. |
| 2. | Effective maturity distribution is subject to change and is calculated based on the total investments of the Fund. |
| 3. | Weighted Average Maturity (WAM): WAM is an average of the effective maturities of all securities held in the portfolio, weighted by each security’s percentage of total investments. The maturity of a portfolio security is the period remaining until the date on which the principal amount is unconditionally required to be paid, or in the case of a security called for redemption, the date on which the redemption payment is unconditionally required to be made. WAM calculations allow for the maturities of certain securities with demand features or periodic interest rate resets to be shortened. WAM is a way to measure a fund’s sensitivity to potential interest rate changes. |
| 4. | Weighted Average Final Maturity (WAFM): WAFM is an average of the final maturities of all securities held in the portfolio, weighted by their percentage of total investments. The maturity of a portfolio security is the period remaining until the date on which the principal amount is unconditionally required to be paid, or in the case of a security called for redemption, the date on which the redemption payment is unconditionally required to be made. In contrast to WAM, the calculation of WAFM allows for the maturities of certain securities with demand features to be shortened, but not the periodic interest rate resets. WAFM is a way to measure a fund’s potential sensitivity to credit spread changes. |
| | | | | | |
| Performance Highlights (Unaudited) | | Wells Fargo Advantage National Tax-Free Money Market Fund | | | 5 | |
AVERAGE ANNUAL TOTAL RETURN5 (%) (AS OF JULY 31, 2012)
| | | | | | | | | | | | | | | | | | | | | | | | | | | | |
| | | | | | | | | Expense Ratios6 | |
| | | Inception Date | | | 6 Months* | | | 1 Year | | | 5 Year | | | 10 Year | | | Gross | | | Net7 | |
Class A (NWMXX) | | | 07/28/2003 | | |
| 0.00
|
| | | 0.02 | | | | 0.60 | | | | 1.08 | | | | 0.63% | | | | 0.63% | |
Administrator Class (WNTXX) | | | 04/08/2005 | | | | 0.00 | | | | 0.02 | | | | 0.74 | | | | 1.29 | | | | 0.36% | | | | 0.30% | |
Institutional Class (WFNXX) | | | 11/08/1999 | | | | 0.01 | | | | 0.03 | | | | 0.81 | | | | 1.41 | | | | 0.24% | | | | 0.20% | |
Service Class (MMIXX) | | | 08/03/1993 | | | | 0.00 | | | | 0.02 | | | | 0.67 | | | | 1.22 | | | | 0.53% | | | | 0.45% | |
Sweep Class | | | 06/30/2010 | | | | 0.00 | | | | 0.02 | | |
| 0.60
|
| | | 1.10 | | | | 0.98% | | | | 0.98% | |
| * | Returns for periods of less than one year are not annualized. |
| | | | | | | | | | | | | | | | | | | | |
FUND YIELD SUMMARY7
(AS OF JULY 31, 2012) | | Class A | | | Administrator
Class | | | Institutional
Class | | | Service
Class | | | Sweep
Class | |
7-Day Current Yield | | | 0.01% | | | | 0.01% | | | | 0.01% | | | | 0.01% | | | | 0.01% | |
7-Day Compound Yield | | | 0.01% | | | | 0.01% | | | | 0.01% | | | | 0.01% | | | | 0.01% | |
30-Day Simple Yield | | | 0.01% | | | | 0.01% | | | | 0.01% | | | | 0.01% | | | | 0.01% | |
30-Day Compound Yield | | | 0.01% | | | | 0.01% | | | | 0.01% | | | | 0.01% | | | | 0.01% | |
Figures quoted represent past performance, which is no guarantee of future results and do not reflect the deduction of taxes that a shareholder may pay on fund distributions or the redemption of fund shares. Investment returns will fluctuate. The Fund’s yield figures more closely reflect the current earnings of the Fund than the total return figures. Current performance may be lower or higher than the performance data quoted and assumes the reinvestment of dividends and capital gains. Current month-end performance is available at the Fund’s Web site – wellsfargoadvantagefunds.com.
Each class is sold without a front-end sales charge or contingent deferred sales charge. Other fees and expenses apply to an investment in the Fund and are described in the Fund’s current prospectuses.
An investment in a money market fund is not insured or guaranteed by the Federal Deposit Insurance Corporation or any other government agency. Although the Fund seeks to preserve the value of your investment at $1.00 per share, it is possible to lose money by investing in a money market fund. A portion of the Fund’s income may be subject to federal, state and/or local income taxes or the alternative minimum tax (AMT).
| 5. | Historical performance shown for the Administrator Class shares prior to their inception reflects the performance of the Service Class shares, and includes the higher expenses applicable to the Service Class shares. If these expenses had not been included, returns would be higher. Historical performance shown for the Sweep Class shares prior to their inception reflects the performance of the Class A shares, and has not been adjusted to include the higher expenses applicable to the Sweep Class shares. If these expenses had been adjusted, returns would be lower. Historical performance shown for Class A shares prior to their inception reflects the performance of the Service Class shares, and is adjusted to reflect the higher expenses applicable to Class A shares. |
| 6. | Reflects the expense ratios as stated in the most recent prospectuses. |
| 7. | The Adviser has committed through May 31, 2013 to waive fees and/or reimburse expenses to the extent necessary to cap the Fund’s Total Annual Fund Operating Expenses After Fee Waiver, excluding certain expenses, at 0.65% for Class A, 0.30% for Administrator Class, 0.20% for Institutional Class, 0.45% for Service Class and 1.00% for Sweep Class. Brokerage commissions, stamp duty fees, interest, taxes, acquired fund fees and expenses and extraordinary expenses are excluded from the cap. Without this cap, the Fund’s returns would have been lower. Without waived fees and/or reimbursed expenses, the Fund’s 7-day current yield would have been (0.45)%, (0.18)%, (0.06)%, (0.35)% and (0.79)% for Class A, Administrator Class, Institutional Class, Service Class and Sweep Class, respectively. |
| | | | |
| 6 | | Wells Fargo Advantage National Tax-Free Money Market Fund | | Fund Expenses (Unaudited) |
As a shareholder of the Fund, you incur ongoing costs, including management fees, distribution (12b-1) and/or shareholder service fees, and other Fund expenses. This example is intended to help you understand your ongoing costs (in dollars) of investing in the Fund and to compare these costs with the ongoing costs of investing in other mutual funds.
The example is based on an investment of $1,000 invested at the beginning of the six-month period and held for the entire period from February 1, 2012 to July 31, 2012.
Actual Expenses
The “Actual” line of the table below provides information about actual account values and actual expenses. You may use the information in this line, together with the amount you invested, to estimate the expenses that you paid over the period. Simply divide your account value by $1,000 (for example, an $8,600 account value divided by $1,000 = 8.6), then multiply the result by the number in the “Actual” line under the heading entitled “Expenses Paid During Period” for your applicable class of shares to estimate the expenses you paid on your account during this period.
Hypothetical Example for Comparison Purposes
The “Hypothetical” line of the table below provides information about hypothetical account values and hypothetical expenses based on the Fund’s actual expense ratio and an assumed rate of return of 5% per year before expenses, which is not the Fund’s actual return. The hypothetical account values and expenses may not be used to estimate the actual ending account balance or expenses you paid for the period. You may use this information to compare the ongoing costs of investing in the Fund and other funds. To do so, compare this 5% hypothetical example with the 5% hypothetical examples that appear in the shareholder reports of the other funds.
Please note that the expenses shown in the table are meant to highlight your ongoing costs only. Therefore, the “Hypothetical” line of the table is useful in comparing ongoing costs only, and will not help you determine the relative total costs of owning different funds.
| | | | | | | | | | | | | | | | |
| | | Beginning
Account Value
02-01-2012 | | | Ending
Account Value
07-31-2012 | | | Expenses
Paid During
the Period1 | | | Net Annual
Expense Ratio | |
Class A | | | | | | | | | | | | | | | | |
Actual | | $ | 1,000.00 | | | $ | 1,000.05 | | | $ | 0.94 | | | | 0.19 | % |
Hypothetical (5% return before expenses) | | $ | 1,000.00 | | | $ | 1,023.92 | | | $ | 0.96 | | | | 0.19 | % |
Administrator Class | | | | | | | | | | | | | | | | |
Actual | | $ | 1,000.00 | | | $ | 1,000.05 | | | $ | 0.94 | | | | 0.19 | % |
Hypothetical (5% return before expenses) | | $ | 1,000.00 | | | $ | 1,023.92 | | | $ | 0.96 | | | | 0.19 | % |
Institutional Class | | | | | | | | | | | | | | | | |
Actual | | $ | 1,000.00 | | | $ | 1,000.12 | | | $ | 0.90 | | | | 0.18 | % |
Hypothetical (5% return before expenses) | | $ | 1,000.00 | | | $ | 1,023.97 | | | $ | 0.91 | | | | 0.18 | % |
Service Class | | | | | | | | | | | | | | | | |
Actual | | $ | 1,000.00 | | | $ | 1,000.05 | | | $ | 0.94 | | | | 0.19 | % |
Hypothetical (5% return before expenses) | | $ | 1,000.00 | | | $ | 1,023.92 | | | $ | 0.96 | | | | 0.19 | % |
Sweep Class | | | | | | | | | | | | | | | | |
Actual | | $ | 1,000.00 | | | $ | 1,000.05 | | | $ | 0.94 | | | | 0.19 | % |
Hypothetical (5% return before expenses) | | $ | 1,000.00 | | | $ | 1,023.92 | | | $ | 0.96 | | | | 0.19 | % |
| 1. | Expenses paid is equal to the annualized expense ratio of each class multiplied by the average account value over the period, multiplied by the number of days in the most recent fiscal half-year divided by the number of days in the fiscal year (to reflect the one-half year period). |
| | | | | | |
| Summary Portfolio of Investments—July 31, 2012 (Unaudited) | | Wells Fargo Advantage National Tax-Free Money Market Fund | | | 7 | |
The Summary Portfolio of Investments shows the Fund’s 50 largest portfolio holdings in unaffiliated issuers and any holdings exceeding 1% of the Fund’s total net assets as of the report date. The remaining securities held by the fund are grouped as “Other securities” in each category. You can request a complete schedule of portfolio holdings as of the report date, free of charge, by accessing the following web site: http://a584.g.akamai.net/f/584/1326/1d/www.wellsfargoadvantagefunds.com/pdf/semi/holdings/nationaltaxfreemoneymarket.pdf or by calling Wells Fargo Advantage Funds at 1-800-222-8222. This complete schedule, filed on the Portfolio’s Form N-CSR, is also available on the SEC’s web site at sec.gov.
| | | | | | | | | | | | | | | | |
| Security Name | | Interest Rate | | Maturity Date | | Principal | | | Value | | | Percent of
Net Assets | |
| | | | | | | | | | | | | | | | |
| | | | | |
Municipal Obligations : 98.97% | | | | | | | | | | | | | | | | |
| | | | | |
Alabama : 4.05% | | | | | | | | | | | | | | | | |
| | | | | |
| Variable Rate Demand Notes §: 4.05% | | | | | | | | | | | | | | | | |
Mobile AL Downtown RDA Gulf Opportunity Zone Austal USA LLC Project Series A (IDR, National Australia Bank LOC) | | 0.15% | | 05/01/2041 | | $ | 33,000,000 | | | $ | 33,000,000 | | | | 0.86 | % |
Mobile AL Downtown RDA Gulf Opportunity Zone Austal USA LLC Project Series B (IDR, National Australia Bank LOC) | | 0.15 | | 05/01/2041 | | | 30,770,000 | | | | 30,770,000 | | | | 0.80 | |
Tuscaloosa County AL IDA Gulf Opportunity Zone Hunt Refining Project Series 2011 G (IDR, Bank of Nova Scotia LOC) | | 0.16 | | 04/01/2028 | | | 20,000,000 | | | | 20,000,000 | | | | 0.52 | |
Tuscaloosa County AL IDA Gulf Opportunity Zone Hunt Refining Project (IDR, Bank of Nova Scotia LOC) | | 0.16 - 0.21 | | 12/01/2027 - 04/01/2028 | | | 25,000,000 | | | | 25,000,000 | | | | 0.65 | |
University of Alabama at Birmingham Hospital Series 2012 C (Hospital Revenue, PNB Bank NA LOC) | | 0.20 | | 09/01/2042 | | | 22,500,000 | | | | 22,500,000 | | | | 0.59 | |
Other securities | | | | | | | | | | | 23,950,000 | | | | 0.63 | |
| | | | | |
| | | | | | | | | | | 155,220,000 | | | | 4.05 | |
| | | | | | | | | | | | | | | | |
| | | | | |
Arizona : 2.19% | | | | | | | | | | | | | | | | |
| | | | | |
| Other Municipal Debt : 0.26% | | | | | | | | | | | | | | | | |
Other securities | | | | | | | | | | | 10,000,000 | | | | 0.26 | |
| | | | | | | | | | | | | | | | |
| | | | | |
| Variable Rate Demand Notes §: 1.93% | | | | | | | | | | | | | | | | |
Arizona Health Facilities Authority Banner Health Series 2008 B (Health Revenue, Bank of Novia Scotia LOC) | | 0.14 | | 01/01/2035 | | | 28,510,000 | | | | 28,510,000 | | | | 0.74 | |
Mesa AZ Utility System Clipper Tax-Exempt Certificate Trust 2009-33 (Miscellaneous Revenue, State Street Bank & Trust Company LIQ) | | 0.15 | | 07/01/2024 | | | 35,055,000 | | | | 35,055,000 | | | | 0.92 | |
Other securities | | | | | | | | | | | 10,200,000 | | | | 0.27 | |
| | | | | |
| | | | | | | | | | | 73,765,000 | | | | 1.93 | |
| | | | | | | | | | | | | | | | |
| | | | | |
California : 8.04% | | | | | | | | | | | | | | | | |
| | | | | |
| Other Municipal Debt : 0.42% | | | | | | | | | | | | | | | | |
Other securities | | | | | | | | | | | 16,135,443 | | | | 0.42 | |
| | | | | | | | | | | | | | | | |
The accompanying notes are an integral part of these financial statements.
| | | | |
| 8 | | Wells Fargo Advantage National Tax-Free Money Market Fund | | Summary Portfolio of Investments—July 31, 2012 (Unaudited) |
| | | | | | | | | | | | | | | | |
| Security Name | | Interest Rate | | Maturity Date | | Principal | | | Value | | | Percent of
Net Assets | |
| | | | | | | | | | | | | | | | |
| | | | | |
| Variable Rate Demand Notes §: 7.62% | | | | | | | | | | | | | | | | |
California CDA Gas Supply Series 2010 (Utilities Revenue, Royal Bank of Canada SPA) | | 0.14% | | 11/01/2040 | | $ | 101,480,000 | | | $ | 101,480,000 | | | | 2.65 | % |
California CDA Refunding MFHR PUTTER Series 2680 (Housing Revenue, JPMorgan Chase Bank LOC) | | 0.23 | | 05/15/2018 | | | 15,900,000 | | | | 15,900,000 | | | | 0.42 | |
Sonoma County CA TAN JPMorgan Chase PUTTER Series 4000 (Miscellaneous Revenue, JPMorgan Chase Bank LIQ) | | 0.18 | | 10/25/2012 | | | 38,795,000 | | | | 38,795,000 | | | | 1.01 | |
Other securities | | | | | | | | | | | 135,700,000 | | | | 3.54 | |
| | | | | |
| | | | | | | | | | | 291,875,000 | | | | 7.62 | |
| | | | | | | | | | | | | | | | |
| | | | | |
Colorado : 2.83% | | | | | | | | | | | | | | | | |
| | | | | |
| Variable Rate Demand Notes §: 2.83% | | | | | | | | | | | | | | | | |
Colorado ECFA Nature Conservancy Project
Series 2012 (Miscellaneous Revenue) | | 0.14 | | 07/01/2033 | | | 39,880,000 | | | | 39,880,000 | | | | 1.04 | |
Colorado ECFA Vail Valley Foundation Project
Series 2007 (Miscellaneous Revenue, U.S. Bank NA LOC) | | 0.16 | | 12/01/2037 | | | 5,600,000 | | | | 5,600,000 | | | | 0.15 | |
Other securities | | | | | | | | | | | 62,750,000 | | | | 1.64 | |
| | | | | |
| | | | | | | | | | | 108,230,000 | | | | 2.83 | |
| | | | | | | | | | | | | | | | |
| | | | | |
Delaware : 0.36% | | | | | | | | | | | | | | | | |
| | | | | |
| Variable Rate Demand Note §: 0.36% | | | | | | | | | | | | | | | | |
Other securities | | | | | | | | | | | 13,835,000 | | | | 0.36 | |
| | | | | | | | | | | | | | | | |
| | | | | |
District of Columbia : 0.22% | | | | | | | | | | | | | | | | |
| | | | | |
| Variable Rate Demand Note §: 0.22% | | | | | | | | | | | | | | | | |
Other securities | | | | | | | | | | | 8,310,000 | | | | 0.22 | |
| | | | | | | | | | | | | | | | |
| | | | | |
Florida : 7.19% | | | | | | | | | | | | | | | | |
| | | | | |
| Other Municipal Debt : 1.06% | | | | | | | | | | | | | | | | |
JEA Florida Electric System Series 2000 F-2
(Utilities Revenue) | | 0.18 | | 08/14/2012 | | | 21,700,000 | | | | 21,700,000 | | | | 0.56 | |
Other securities | | | | | | | | | | | 19,000,000 | | | | 0.50 | |
| | | | | |
| | | | | | | | | | | 40,700,000 | | | | 1.06 | |
| | | | | | | | | | | | | | | | |
| | | | | |
| Variable Rate Demand Notes §: 6.13% | | | | | | | | | | | | | | | | |
Jacksonville FL Electrical System Series 2000 A
(Utilities Revenue, Bank of Montreal LOC) | | 0.14 | | 10/01/2035 | | | 17,315,000 | | | | 17,315,000 | | | | 0.45 | |
Orange County FL HFFA Adventist Health System Sunbelt Obligated Group Series 1995 (Health Revenue) | | 0.12 | | 11/15/2026 | | | 44,705,000 | | | | 44,705,000 | | | | 1.17 | |
Orange County FL HFFA Adventist Health Systems Sunbelt Obligated Group Series 1995 (Health Revenue, AMBAC Insured, Bank of America NA LIQ) | | 0.32 | | 11/15/2025 | | | 31,960,000 | | | | 31,960,000 | | | | 0.83 | |
Orlando & Orange County FL Expressway Authority Series 2003 C (Transportation Revenue, Bank of Montreal LOC) | | 0.14 | | 07/01/2040 | | | 20,000,000 | | | | 20,000,000 | | | | 0.52 | |
Other securities | | | | | | | | | | | 120,765,000 | | | | 3.16 | |
| | | | | |
| | | | | | | | | | | 234,745,000 | | | | 6.13 | |
| | | | | | | | | | | | | | | | |
The accompanying notes are an integral part of these financial statements.
| | | | | | |
| Summary Portfolio of Investments—July 31, 2012 (Unaudited) | | Wells Fargo Advantage National Tax-Free Money Market Fund | | | 9 | |
| | | | | | | | | | | | | | | | |
| Security Name | | Interest Rate | | Maturity Date | | Principal | | | Value | | | Percent of
Net Assets | |
| | | | | | | | | | | | | | | | |
| | | | | |
Georgia : 2.25% | | | | | | | | | | | | | | | | |
| | | | | |
| Variable Rate Demand Note §: 2.25% | | | | | | | | | | | | | | | | |
Other securities | | | | | | | | | | $ | 86,085,000 | | | | 2.25 | % |
| | | | | | | | | | | | | | | | |
| | | | | |
Hawaii : 0.26% | | | | | | | | | | | | | | | | |
| | | | | |
| Variable Rate Demand Note §: 0.26% | | | | | | | | | | | | | | | | |
Other securities | | | | | | | | | | | 9,995,000 | | | | 0.26 | |
| | | | | | | | | | | | | | | | |
| | | | | |
Idaho : 0.51% | | | | | | | | | | | | | | | | |
| | | | | |
| Variable Rate Demand Note §: 0.51% | | | | | | | | | | | | | | | | |
Jerome County ID Economic Development Corporation Davisco Foods International Project Series 2009 (IDR, Bank of
Montreal LOC) | | 0.17% | | 12/01/2029 | | $ | 19,420,000 | | | | 19,420,000 | | | | 0.51 | |
| | | | | | | | | | | | | | | | |
| | | | | |
Illinois : 6.48% | | | | | | | | | | | | | | | | |
| | | | | |
| Other Municipal Debt : 0.42% | | | | | | | | | | | | | | | | |
Other securities | | | | | | | | | | | 16,067,154 | | | | 0.42 | |
| | | | | | | | | | | | | | | | |
| | | | | |
| Variable Rate Demand Notes §: 6.06% | | | | | | | | | | | | | | | | |
Illinois Development Finance Authority McCormick Theological Seminary Project Series 2001-B (Education Revenue, Northern Trust Company LOC) | | 0.16 | | 06/01/2035 | | | 22,435,000 | | | | 22,435,000 | | | | 0.59 | |
Illinois Development Finance Authority (Various Revenue, Northern Trust
Company LOC) | | 0.16 - 0.50 | | 03/01/2017 - 04/01/2035 | | | 20,900,000 | | | | 20,900,000 | | | | 0.55 | |
Illinois Development Finance Authority YMCA Metropolitan Chicago Project Series 2001 (Miscellaneous Revenue, Harris Trust & Savings Bank LOC) | | 0.17 | | 06/01/2029 | | | 19,300,000 | | | | 19,300,000 | | | | 0.50 | |
Illinois Finance Authority (Various Revenue, Northern Trust Company LOC) | | 0.16 - 0.27 | | 11/01/2030 - 09/01/2046 | | | 45,770,000 | | | | 45,770,000 | | | | 1.19 | |
Illinois Finance Authority Presbyterian Homes Lake Forest Project Series 2006 (Health Revenue, Northern Trust
Company LOC) | | 0.16 | | 09/01/2024 | | | 21,345,000 | | | | 21,345,000 | | | | 0.56 | |
Illinois State Finance Authority Hospital Sisters Services Series C (Health Revenue, AGM Insured, JPMorgan Chase Bank SPA) | | 0.40 | | 03/15/2036 | | | 45,000,000 | | | | 45,000,000 | | | | 1.17 | |
Other securities | | | | | | | | | | | 57,505,000 | | | | 1.50 | |
| | | | | |
| | | | | | | | | | | 232,255,000 | | | | 6.06 | |
| | | | | | | | | | | | | | | | |
| | | | | |
Indiana : 2.13% | | | | | | | | | | | | | | | | |
| | | | | |
| Other Municipal Debt : 0.30% | | | | | | | | | | | | | | | | |
Other securities | | | | | | | | | | | 11,643,980 | | | | 0.30 | |
| | | | | | | | | | | | | | | | |
| | | | | |
| Variable Rate Demand Notes §: 1.83% | | | | | | | | | | | | | | | | |
Clipper Tax-Exempt Certified Trust Series 2007-02 (Miscellaneous Revenue, State Street Bank & Trust Company LIQ) | | 0.18 | | 07/01/2023 | | | 26,140,000 | | | | 26,140,000 | | | | 0.68 | |
Other securities | | | | | | | | | | | 43,835,000 | | | | 1.15 | |
| | | | | |
| | | | | | | | | | | 69,975,000 | | | | 1.83 | |
| | | | | | | | | | | | | | | | |
The accompanying notes are an integral part of these financial statements.
| | | | |
| 10 | | Wells Fargo Advantage National Tax-Free Money Market Fund | | Summary Portfolio of Investments—July 31, 2012 (Unaudited) |
| | | | | | | | | | | | | | | | |
| Security Name | | Interest Rate | | Maturity Date | | Principal | | | Value | | | Percent of
Net Assets | |
| | | | | | | | | | | | | | | | |
| | | | | |
Iowa : 1.22% | | | | | | | | | | | | | | | | |
| | | | | |
| Variable Rate Demand Note §: 1.22% | | | | | | | | | | | | | | | | |
Other securities | | | | | | | | | | $ | 46,695,000 | | | | 1.22 | % |
| | | | | | | | | | | | | | | | |
| | | | | |
Kansas : 0.23% | | | | | | | | | | | | | | | | |
| | | | | |
| Variable Rate Demand Note §: 0.23% | | | | | | | | | | | | | | | | |
Other securities | | | | | | | | | | | 9,000,000 | | | | 0.23 | |
| | | | | | | | | | | | | | | | |
| | | | | |
Kentucky : 1.00% | | | | | | | | | | | | | | | | |
| | | | | |
| Other Municipal Debt : 0.03% | | | | | | | | | | | | | | | | |
Other securities | | | | | | | | | | | 1,304,869 | | | | 0.03 | |
| | | | | | | | | | | | | | | | |
| | | | | |
| Variable Rate Demand Note §: 0.97% | | | | | | | | | | | | | | | | |
Other securities | | | | | | | | | | | 36,990,000 | | | | 0.97 | |
| | | | | | | | | | | | | | | | |
| | | | | |
Louisiana : 2.99% | | | | | | | | | | | | | | | | |
| | | | | |
| Variable Rate Demand Notes §: 2.99% | | | | | | | | | | | | | | | | |
St. James Parish LA Nucor Steel LLC Project Gulf Opportunity Zone Series 2010 A-1 (IDR) | | 0.16% | | 11/01/2040 | | $ | 36,300,000 | | | | 36,300,000 | | | | 0.95 | |
St. James Parish LA Nucor Steel LLC Project Gulf Opportunity Zone Series 2010 B-1 (IDR) | | 0.16 | | 11/01/2040 | | | 52,000,000 | | | | 52,000,000 | | | | 1.36 | |
Other securities | | | | | | | | | | | 26,160,000 | | | | 0.68 | |
| | | | | |
| | | | | | | | | | | 114,460,000 | | | | 2.99 | |
| | | | | | | | | | | | | | | | |
| | | | | |
Maine : 0.22% | | | | | | | | | | | | | | | | |
| | | | | |
| Variable Rate Demand Note §: 0.22% | | | | | | | | | | | | | | | | |
Other securities | | | | | | | | | | | 8,300,000 | | | | 0.22 | |
| | | | | | | | | | | | | | | | |
| | | | | |
Maryland : 3.06% | | | | | | | | | | | | | | | | |
| | | | | |
| Other Municipal Debt : 0.43% | | | | | | | | | | | | | | | | |
Other securities | | | | | | | | | | | 16,600,000 | | | | 0.43 | |
| | | | | | | | | | | | | | | | |
| | | | | |
| Variable Rate Demand Notes §: 2.63% | | | | | | | | | | | | | | | | |
Maryland CDA (Housing Revenue, KBC Bank NV SPA) | | 0.15 - 0.16 | | 09/01/2031 - 11/01/2038 | | | 16,495,000 | | | | 16,495,000 | | | | 0.43 | |
Maryland CDA Residential Series 2007-F (Housing Revenue, PNC Bank NA LOC) | | 0.16 | | 09/01/2031 | | | 36,020,000 | | | | 36,020,000 | | | | 0.94 | |
Other securities | | | | | | | | | | | 48,145,000 | | | | 1.26 | |
| | | | | |
| | | | | | | | | | | 100,660,000 | | | | 2.63 | |
| | | | | | | | | | | | | | | | |
| | | | | |
Massachusetts : 0.95% | | | | | | | | | | | | | | | | |
| | | | | |
| Other Municipal Debt : 0.10% | | | | | | | | | | | | | | | | |
Other securities | | | | | | | | | | | 4,000,000 | | | | 0.10 | |
| | | | | | | | | | | | | | | | |
| | | | | |
| Variable Rate Demand Note §: 0.85% | | | | | | | | | | | | | | | | |
Other securities | | | | | | | | | | | 32,440,000 | | | | 0.85 | |
| | | | | | | | | | | | | | | | |
| | | | | |
Michigan : 1.60% | | | | | | | | | | | | | | | | |
| | | | | |
| Other Municipal Debt : 0.87% | | | | | | | | | | | | | | | | |
Other securities | | | | | | | | | | | 33,400,000 | | | | 0.87 | |
| | | | | | | | | | | | | | | | |
The accompanying notes are an integral part of these financial statements.
| | | | | | |
| Summary Portfolio of Investments—July 31, 2012 (Unaudited) | | Wells Fargo Advantage National Tax-Free Money Market Fund | | | 11 | |
| | | | | | | | | | | | | | | | | | | | |
| Security Name | | Interest Rate | | | Maturity Date | | | Principal | | | Value | | | Percent of
Net Assets | |
| | | | | | | | | | | | | | | | | | | | |
| | | | | |
| Variable Rate Demand Note §: 0.73% | | | | | | | | | | | | | | | | | | | | |
Other securities | | | | | | | | | | | | | | $ | 27,965,000 | | | | 0.73 | % |
| | | | | | | | | | | | | | | | | | | | |
| | | | | |
Minnesota : 4.03% | | | | | | | | | | | | | | | | | | | | |
| | | | | |
| Other Municipal Debt : 1.22% | | | | | | | | | | | | | | | | | | | | |
Rochester MN HCFR Mayo Foundation Series 2000-A (Health Revenue) | | | 0.16% | | | | 08/21/2012 | | | $ | 31,600,000 | | | | 31,600,000 | | | | 0.83 | |
Other securities | | | | | | | | | | | | | | | 14,905,998 | | | | 0.39 | |
| | | | | |
| | | | | | | | | | | | | | | 46,505,998 | | | | 1.22 | |
| | | | | | | | | | | | | | | | | | | | |
| | | | | |
| Variable Rate Demand Note §: 2.81% | | | | | | | | | | | | | | | | | | | | |
Other securities | | | | | | | | | | | | | | | 107,785,000 | | | | 2.81 | |
| | | | | | | | | | | | | | | | | | | | |
| | | | | |
Mississippi : 1.17% | | | | | | | | | | | | | | | | | | | | |
| | | | | |
| Variable Rate Demand Notes §: 1.17% | | | | | | | | | | | | | | | | | | | | |
Mississippi State Series A Clipper Tax-Exempt Certificate Trust Series 2009-60 (Miscellaneous Revenue, State Street Bank & Trust Company LIQ) | | | 0.20 | | | | 11/01/2018 | | | | 18,960,000 | | | | 18,960,000 | | | | 0.49 | |
Perry County MS PCR Leaf River Forest Product Project Series 2002 (IDR, Bank of Nova Scotia LOC) | | | 0.15 | | | | 02/01/2022 | | | | 25,965,000 | | | | 25,965,000 | | | | 0.68 | |
| | | | | |
| | | | | | | | | | | | | | | 44,925,000 | | | | 1.17 | |
| | | | | | | | | | | | | | | | | | | | |
| | | | | |
Missouri : 1.92% | | | | | | | | | | | | | | | | | | | | |
| | | | | |
| Other Municipal Debt : 0.33% | | | | | | | | | | | | | | | | | | | | |
Other securities | | | | | | | | | | | | | | | 12,700,000 | | | | 0.33 | |
| | | | | | | | | | | | | | | | | | | | |
| | | | | |
| Variable Rate Demand Notes §: 1.59% | | | | | | | | | | | | | | | | | | | | |
St. Louis County MO IDA The Pelican Cove Project Series 2004 (Housing Revenue, FNMA Insured,
FNMA LIQ) | | | 0.15 | | | | 03/15/2034 | | | | 18,000,000 | | | | 18,000,000 | | | | 0.47 | |
Other securities | | | | | | | | | | | | | | | 43,055,000 | | | | 1.12 | |
| | | | | |
| | | | | | | | | | | | | | | 61,055,000 | | | | 1.59 | |
| | | | | | | | | | | | | | | | | | | | |
| | | | | |
Nebraska : 0.92% | | | | | | | | | | | | | | | | | | | | |
| | | | | |
| Variable Rate Demand Note §: 0.92% | | | | | | | | | | | | | | | | | | | | |
Central Plains NE Nebraska Gas Project #2 Series 2009 (Utilities Revenue, Royal Bank of Canada SPA) | | | 0.15 | | | | 08/01/2039 | | | | 35,325,000 | | | | 35,325,000 | | | | 0.92 | |
| | | | | | | | | | | | | | | | | | | | |
| | | | | |
Nevada : 1.15% | | | | | | | | | | | | | | | | | | | | |
| | | | | |
| Variable Rate Demand Notes §: 1.15% | | | | | | | | | | | | | | | | | | | | |
Reno NV Senior Lien Transportation Rail Access Corridor Project Series 2008-A (Tax Revenue, Bank of New York Mellon LOC) | | | 0.17 | | | | 06/01/2042 | | | | 39,345,000 | | | | 39,345,000 | | | | 1.03 | |
Other securities | | | | | | | | | | | | | | | 4,800,000 | | | | 0.12 | |
| | | | | |
| | | | | | | | | | | | | | | 44,145,000 | | | | 1.15 | |
| | | | | | | | | | | | | | | | | | | | |
| | | | | |
New Hampshire : 0.68% | | | | | | | | | | | | | | | | | | | | |
| | | | | |
| Variable Rate Demand Note §: 0.68% | | | | | | | | | | | | | | | | | | | | |
Other securities | | | | | | | | | | | | | | | 26,150,000 | | | | 0.68 | |
| | | | | | | | | | | | | | | | | | | | |
The accompanying notes are an integral part of these financial statements.
| | | | |
| 12 | | Wells Fargo Advantage National Tax-Free Money Market Fund | | Summary Portfolio of Investments—July 31, 2012 (Unaudited) |
| | | | | | | | | | | | | | | | |
| Security Name | | Interest Rate | | Maturity Date | | Principal | | | Value | | | Percent of
Net Assets | |
| | | | | | | | | | | | | | | | |
| | | | | |
New Jersey : 2.10% | | | | | | | | | | | | | | | | |
| | | | | |
| Variable Rate Demand Notes §: 2.10% | | | | | | | | | | | | | | | | |
New Jersey TTFA PUTTER Series 2009-70 (Transportation Revenue, State Street Bank & Trust Company LIQ) | | 0.15% | | 12/15/2023 | | $ | 50,725,000 | | | $ | 50,725,000 | | | | 1.32 | % |
Other securities | | | | | | | | | | | 29,558,075 | | | | 0.78 | |
| | | | | |
| | | | | | | | | | | 80,283,075 | | | | 2.10 | |
| | | | | | | | | | | | | | | | |
| | | | | |
New York : 5.66% | | | | | | | | | | | | | | | | |
| | | | | |
| Other Municipal Debt : 0.18% | | | | | | | | | | | | | | | | |
Other securities | | | | | | | | | | | 7,000,000 | | | | 0.18 | |
| | | | | | | | | | | | | | | | |
| | | | | |
| Variable Rate Demand Notes §: 5.48% | | | | | | | | | | | | | | | | |
New York City NY GO Subseries B-3 (GO, TD Bank NA LOC) | | 0.12 | | 09/01/2027 | | | 20,200,000 | | | | 20,200,000 | | | | 0.53 | |
New York Convention Center Development Corporation New York Hotel Unit Fee Secured Series 3095 (Tax Revenue, BHAC-CR AMBAC Insured, Morgan Stanley Bank LIQ) 144A | | 0.23 | | 11/15/2044 | | | 32,335,000 | | | | 32,335,000 | | | | 0.85 | |
New York State Dormitory Authority Series 12 Clipper Tax-Exempt Certificate Trust Series 2009-35 (Miscellaneous Revenue, State Street Bank & Trust Company LIQ) | | 0.18 | | 11/15/2026 | | | 22,500,000 | | | | 22,500,000 | | | | 0.59 | |
New York State HFA 388 Bridge Street Series 2012-A (Housing Revenue, Manufacturers & Traders Bank LOC) | | 0.16 | | 05/01/2046 | | | 17,000,000 | | | | 17,000,000 | | | | 0.44 | |
New York State HFA 600 West 42nd Street Series 2009-A (Housing Revenue, FHLMC Insured, FHLMC LIQ) | | 0.14 | | 05/15/2041 | | | 46,175,000 | | | | 46,175,000 | | | | 1.21 | |
Other securities | | | | | | | | | | | 71,425,000 | | | | 1.86 | |
| | | | | |
| | | | | | | | | | | 209,635,000 | | | | 5.48 | |
| | | | | | | | | | | | | | | | |
| | | | | |
North Carolina : 2.37% | | | | | | | | | | | | | | | | |
| | | | | |
| Variable Rate Demand Note §: 2.37% | | | | | | | | | | | | | | | | |
Other securities | | | | | | | | | | | 90,625,000 | | | | 2.37 | |
| | | | | | | | | | | | | | | | |
| | | | | |
North Dakota : 1.08% | | | | | | | | | | | | | | | | |
| | | | | |
| Other Municipal Debt : 0.99% | | | | | | | | | | | | | | | | |
Mercer County ND PCR Basin Electric Power Cooperative Series 2009 -1 (Utilities Revenue) | | 0.30 | | 08/07/2012 | | | 35,000,000 | | | | 35,000,000 | | | | 0.91 | |
Other securities | | | | | | | | | | | 3,000,000 | | | | 0.08 | |
| | | | | |
| | | | | | | | | | | 38,000,000 | | | | 0.99 | |
| | | | | | | | | | | | | | | | |
| | | | | |
| Variable Rate Demand Note §: 0.09% | | | | | | | | | | | | | | | | |
Other securities | | | | | | | | | | | 3,500,000 | | | | 0.09 | |
| | | | | | | | | | | | | | | | |
| | | | | |
Ohio : 0.76% | | | | | | | | | | | | | | | | |
| | | | | |
| Variable Rate Demand Note §: 0.76% | | | | | | | | | | | | | | | | |
Other securities | | | | | | | | | | | 29,085,308 | | | | 0.76 | |
| | | | | | | | | | | | | | | | |
The accompanying notes are an integral part of these financial statements.
| | | | | | |
| Summary Portfolio of Investments—July 31, 2012 (Unaudited) | | Wells Fargo Advantage National Tax-Free Money Market Fund | | | 13 | |
| | | | | | | | | | | | | | | | |
| Security Name | | Interest Rate | | Maturity Date | | Principal | | | Value | | | Percent of
Net Assets | |
| | | | | | | | | | | | | | | | |
| | | | | |
Oklahoma : 0.26% | | | | | | | | | | | | | | | | |
| | | | | |
| Variable Rate Demand Note §: 0.26% | | | | | | | | | | | | | | | | |
Other securities | | | | | | | | | | $ | 10,090,000 | | | | 0.26 | % |
| | | | | | | | | | | | | | | | |
| | | | | |
Oregon : 0.22% | | | | | | | | | | | | | | | | |
| | | | | |
| Variable Rate Demand Note §: 0.22% | | | | | | | | | | | | | | | | |
Other securities | | | | | | | | | | | 8,485,000 | | | | 0.22 | |
| | | | | | | | | | | | | | | | |
| | | | | |
Other : 1.50% | | | | | | | | | | | | | | | | |
| | | | | |
| Variable Rate Demand Notes §: 1.50% | | | | | | | | | | | | | | | | |
Austin Trust Various States Certificates Series 2008-3506 (Health Revenue, Assured Guaranty Insured, Bank of America NA LIQ) | | 0.40% | | 08/15/2047 | | $ | 23,375,000 | | | | 23,375,000 | | | | 0.61 | |
Clipper Tax-Exempt Certified Trust Series 2004-05 (Miscellaneous Revenue, State Street Bank & Trust Company LIQ) | | 0.20 | | 05/01/2014 | | | 14,500,000 | | | | 14,500,000 | | | | 0.38 | |
Other securities | | | | | | | | | | | 19,420,000 | | | | 0.51 | |
| | | | | |
| | | | | | | | | | | 57,295,000 | | | | 1.50 | |
| | | | | | | | | | | | | | | | |
| | | | | |
Pennsylvania : 7.34% | | | | | | | | | | | | | | | | |
| | | | | |
| Variable Rate Demand Notes §: 7.34% | | | | | | | | | | | | | | | | |
Beaver County PA IDA (Utilities Revenue, Bank of Nova Scotia LOC) | | 0.17 | | 11/01/2020 – 07/15/2021 | | | 20,000,000 | | | | 20,000,000 | | | | 0.52 | |
Beaver County PA IDA First Energy Generation Corporation Project Series 2008-B (IDR, Bank of Nova Scotia LOC) | | 0.15 | | 10/01/2047 | | | 21,300,000 | | | | 21,300,000 | | | | 0.56 | |
Lehigh County PA General Purpose Authority St. Luke’s Hospital Bethlehem PFOTER (Health Revenue, Bank of America NA LIQ) | | 0.43 | | 08/15/2042 | | | 18,140,000 | | | | 18,140,000 | | | | 0.47 | |
Other securities | | | | | | | | | | | 221,773,000 | | | | 5.79 | |
| | | | | |
| | | | | | | | | | | 281,213,000 | | | | 7.34 | |
| | | | | | | | | | | | | | | | |
| | | | | |
Puerto Rico : 0.38% | | | | | | | | | | | | | | | | |
| | | | | |
| Variable Rate Demand Note §: 0.38% | | | | | | | | | | | | | | | | |
Other securities | | | | | | | | | | | 14,700,000 | | | | 0.38 | |
| | | | | | | | | | | | | | | | |
| | | | | |
Rhode Island : 0.12% | | | | | | | | | | | | | | | | |
| | | | | |
| Variable Rate Demand Note §: 0.12% | | | | | | | | | | | | | | | | |
Other securities | | | | | | | | | | | 4,555,000 | | | | 0.12 | |
| | | | | | | | | | | | | | | | |
| | | | | |
South Carolina : 1.27% | | | | | | | | | | | | | | | | |
| | | | | |
| Other Municipal Debt : 0.68% | | | | | | | | | | | | | | | | |
Other securities | | | | | | | | | | | 25,900,000 | | | | 0.68 | |
| | | | | | | | | | | | | | | | |
| | | | | |
| Variable Rate Demand Note §: 0.59% | | | | | | | | | | | | | | | | |
Other securities | | | | | | | | | | | 22,645,000 | | | | 0.59 | |
| | | | | | | | | | | | | | | | |
| | | | | |
South Dakota : 0.29% | | | | | | | | | | | | | | | | |
| | | | | |
| Variable Rate Demand Note §: 0.29% | | | | | | | | | | | | | | | | |
Other securities | | | | | | | | | | | 11,125,000 | | | | 0.29 | |
| | | | | | | | | | | | | | | | |
The accompanying notes are an integral part of these financial statements.
| | | | |
| 14 | | Wells Fargo Advantage National Tax-Free Money Market Fund | | Summary Portfolio of Investments—July 31, 2012 (Unaudited) |
| | | | | | | | | | | | | | | | |
| Security Name | | Interest Rate | | Maturity Date | | Principal | | | Value | | | Percent of
Net Assets | |
| | | | | | | | | | | | | | | | |
| | | | | |
Tennessee : 1.65% | | | | | | | | | | | | | | | | |
| | | | | |
| Other Municipal Debt : 0.06% | | | | | | | | | | | | | | | | |
Other securities | | | | | | | | | | $ | 2,111,139 | | | | 0.06 | % |
| | | | | | | | | | | | | | | | |
| | | | | |
| Variable Rate Demand Notes §: 1.59% | | | | | | | | | | | | | | | | |
Johnson City TN Health & Educational Facilities Board Health Alliance Series 2011A (Health Revenue, U.S. Bank NA LOC) | | 0.17% | | 07/01/2033 | | $ | 22,375,000 | | | | 22,375,000 | | | | 0.58 | |
Other securities | | | | | | | | | | | 38,660,000 | | | | 1.01 | |
| | | | | |
| | | | | | | | | | | 61,035,000 | | | | 1.59 | |
| | | | | | | | | | | | | | | | |
| | | | | |
Texas : 8.30% | | | | | | | | | | | | | | | | |
| | | | | |
| Variable Rate Demand Notes §: 8.30% | | | | | | | | | | | | | | | | |
Clipper Tax-Exempt Certified Trust Series 2007-44 (Miscellaneous Revenue, State Street Bank & Trust Company LIQ) | | 0.20 | | 09/01/2014 | | | 28,780,000 | | | | 28,780,000 | | | | 0.75 | |
Port Arthur TX Navigation District Environmental Facilities Motiva Enterprises Project Subseries 2009A (Resource Recovery Revenue) | | 0.16 | | 12/01/2039 | | | 18,850,000 | | | | 18,850,000 | | | | 0.49 | |
Port Arthur TX Navigation District Environmental Facilities Motiva Enterprises Project Subseries 2009C (Resource Recovery Revenue) | | 0.15 | | 12/01/2039 | | | 40,500,000 | | | | 40,500,000 | | | | 1.06 | |
Port Arthur TX Navigation District Industrial Development Corporation Total Petrochemicals USA Incorporated Project Series 2011 (IDR) | | 0.22 | | 06/01/2041 | | | 45,000,000 | | | | 45,000,000 | | | | 1.18 | |
Port Arthur TX Navigation District Industrial Development Corporation Total Petrochemicals USA Incorporated Project Series 2012 (IDR) | | 0.22 | | 03/01/2042 | | | 37,500,000 | | | | 37,500,000 | | | | 0.98 | |
Port Arthur TX Navigation District of Jefferson County Total Petrochemicals USA Incorporated Project (Various Recovery Revenue) | | 0.22 - 0.23 | | 04/01/2027 - 03/01/2039 | | | 17,000,000 | | | | 17,000,000 | | | | 0.44 | |
Other securities | | | | | | | | | | | 130,239,981 | | | | 3.40 | |
| | | | | |
| | | | | | | | | | | 317,869,981 | | | | 8.30 | |
| | | | | | | | | | | | | | | | |
| | | | | |
Utah : 0.25% | | | | | | | | | | | | | | | | |
| | | | | |
| Variable Rate Demand Note §: 0.25% | | | | | | | | | | | | | | | | |
Other securities | | | | | | | | | | | 9,675,000 | | | | 0.25 | |
| | | | | | | | | | | | | | | | |
| | | | | |
Vermont : 1.02% | | | | | | | | | | | | | | | | |
| | | | | |
| Variable Rate Demand Notes §: 1.02% | | | | | | | | | | | | | | | | |
Vermont Educational & Health Buildings Financing Agency Fletcher Allen Health Care Project Series 2008-A (Health Revenue, TD Bank NA LOC) | | 0.15 | | 12/01/2030 | | | 21,690,000 | | | | 21,690,000 | | | | 0.57 | |
Vermont Educational & Health Buildings Financing Agency (Various Revenue, TD Bank NA LOC) | | 0.18 | | 10/01/2028 - 10/01/2034 | | | 17,205,000 | | | | 17,205,000 | | | | 0.45 | |
| | | | | |
| | | | | | | | | | | 38,895,000 | | | | 1.02 | |
| | | | | | | | | | | | | | | | |
The accompanying notes are an integral part of these financial statements.
| | | | | | |
| Summary Portfolio of Investments—July 31, 2012 (Unaudited) | | Wells Fargo Advantage National Tax-Free Money Market Fund | | | 15 | |
| | | | | | | | | | | | | | | | |
| Security Name | | Interest Rate | | Maturity Date | | Principal | | | Value | | | Percent of
Net Assets | |
| | | | | | | | | | | | | | | | |
| | | | | |
Virginia : 0.72% | | | | | | | | | | | | | | | | |
| | | | | |
| Variable Rate Demand Note §: 0.72% | | | | | | | | | | | | | | | | |
Other securities | | | | | | | | | | $ | 27,590,000 | | | | 0.72 | % |
| | | | | | | | | | | | | | | | |
| | | | | |
Washington : 0.48% | | | | | | | | | | | | | | | | |
| | | | | |
| Variable Rate Demand Note §: 0.48% | | | | | | | | | | | | | | | | |
Other securities | | | | | | | | | | | 18,585,000 | | | | 0.48 | |
| | | | | | | | | | | | | | | | |
| | | | | |
| West Virginia : 0.18% | | | | | | | | | | | | | | | | |
Other securities | | | | | | | | | | | 6,850,000 | | | | 0.18 | |
| | | | | | | | | | | | | | | | |
| | | | | |
Wisconsin : 5.27% | | | | | | | | | | | | | | | | |
| | | | | |
| Variable Rate Demand Notes §: 5.27% | | | | | | | | | | | | | | | | |
Appleton WI Recovery Zone Facilities Foremost Farms Project Series 2010 (IDR, CoBank ACB LOC) | | 0.15% | | 05/01/2037 | | $ | 30,000,000 | | | | 30,000,000 | | | | 0.78 | |
Wisconsin HEFA Aurora Health Care Incorporated Series 2012-C (Health Revenue, Bank of Montreal LOC) | | 0.15 | | 07/15/2028 | | | 36,500,000 | | | | 36,500,000 | | | | 0.95 | |
Wisconsin HEFA (Health Revenue) | | 0.16 - 0.17 | | 08/01/2022 - 03/01/2038 | | | 18,160,000 | | | | 18,160,000 | | | | 0.47 | |
Wisconsin State Clipper Tax Exempt Certificate Trust Series 1 2009-36 (Miscellaneous Revenue, State Street Bank & Trust Company LIQ) | | 0.20 | | 05/01/2020 | | | 26,755,000 | | | | 26,755,000 | | | | 0.70 | |
Wisconsin State Clipper Tax-Exempt Certificate Trust Series 1 2009-6 (Miscellaneous Revenue, State Street Bank & Trust Company LIQ) | | 0.20 | | 05/01/2013 | | | 25,000,000 | | | | 25,000,000 | | | | 0.65 | |
Wisconsin State HEFA Sisters Services Incorporated Obligation Group Series 2007B-2 (Health Revenue, JPMorgan Chase Bank SPA) | | 0.40 | | 03/15/2036 | | | 21,000,000 | | | | 21,000,000 | | | | 0.55 | |
Other securities | | | | | | | | | | | 44,465,000 | | | | 1.17 | |
| | | | | |
| | | | | | | | | | | 201,880,000 | | | | 5.27 | |
| | | | | | | | | | | | | | | | |
| | | | | |
Wyoming : 0.10% | | | | | | | | | | | | | | | | |
| | | | | |
| Variable Rate Demand Note §: 0.10% | | | | | | | | | | | | | | | | |
Other securities | | | | | | | | | | | 3,850,000 | | | | 0.10 | |
| | | | | | | | | | | | | | | | |
| | | |
Total Municipal Obligations (Cost $3,791,139,947) | | | | | | | 3,791,139,947 | | | | | |
| | | | | | | | | | | | | | | | |
| | | | | |
Total Investments in Securities
| | | | | | | | | | | | | | | | |
| (Cost $3,791,139,947)* | | | | | | | | | | | 3,791,139,947 | | | | 98.97 | % |
Other Assets and Liabilities, Net | | | | | | | | | | | 39,342,556 | | | | 1.03 | |
| | | | | | | | | | | | | | | | |
| | | | | |
Total Net Assets | | | | | | | | | | $ | 3,830,482,503 | | | | 100.00 | % |
| | | | | | | | | | | | | | | | |
| § | These securities are subject to a demand feature which reduces the effective maturity. |
| 144A | Security that may be resold to “qualified institutional buyers” under Rule 144A or security offered pursuant to Section 4(2) of the Securities Act of 1933, as amended. |
| * | Cost for federal income tax purposes is substantially the same as for financial reporting purposes. |
The accompanying notes are an integral part of these financial statements.
| | | | |
| 16 | | Wells Fargo Advantage National Tax-Free Money Market Fund | | Statement of Assets and Liabilities—July 31, 2012 (Unaudited) |
| | | | |
| | | | |
| |
Assets | | | | |
Investments in unaffiliated securities, at amortized cost | | $ | 3,791,139,947 | |
Cash | | | 87,270 | |
Receivable for investments sold | | | 75,446,235 | |
Receivable for Fund shares sold | | | 70,257 | |
Receivable for interest | | | 943,372 | |
Receivable from adviser | | | 644,617 | |
Prepaid expenses and other assets | | | 101,154 | |
| | | | |
Total assets | | | 3,868,432,852 | |
| | | | |
| |
Liabilities | | | | |
Dividends payable | | | 19,949 | |
Payable for investments purchased | | | 36,486,640 | |
Payable for Fund shares redeemed | | | 45,606 | |
Distribution fees payable | | | 174,928 | |
Due to other related parties | | | 609,185 | |
Accrued expenses and other liabilities | | | 614,041 | |
| | | | |
Total liabilities | | | 37,950,349 | |
| | | | |
Total net assets | | $ | 3,830,482,503 | |
| | | | |
| |
NET ASSETS CONSIST OF | | | | |
Paid-in capital | | $ | 3,830,113,155 | |
Undistributed net investment income | | | 18 | |
Accumulated net realized gains on investments | | | 369,330 | |
| | | | |
Total net assets | | $ | 3,830,482,503 | |
| | | | |
| |
COMPUTATION OF NET ASSET VALUE PER SHARE1 | | | | |
Net assets – Class A | | $ | 412,723,666 | |
Shares outstanding – Class A | | | 412,633,968 | |
Net asset value per share – Class A | | | $1.00 | |
Net assets – Administrator Class | | $ | 260,674,978 | |
Shares outstanding – Administrator Class | | | 260,636,148 | |
Net asset value per share – Administrator Class | | | $1.00 | |
Net assets – Institutional Class | | $ | 1,961,110,403 | |
Shares outstanding – Institutional Class | | | 1,960,762,353 | |
Net asset value per share – Institutional Class | | | $1.00 | |
Net assets – Service Class | | $ | 652,220,262 | |
Shares outstanding – Service Class | | | 652,147,441 | |
Net asset value per share – Service Class | | | $1.00 | |
Net assets – Sweep Class | | $ | 543,753,194 | |
Shares outstanding – Sweep Class | | | 543,725,685 | |
Net asset value per share – Sweep Class | | | $1.00 | |
| 1. | The Fund has an unlimited number of authorized shares. |
The accompanying notes are an integral part of these financial statements.
| | | | | | |
| Statement of Operations—Six Months Ended July 31, 2012 (Unaudited) | | Wells Fargo Advantage National Tax-Free Money Market Fund | | | 17 | |
| | | | |
| | | | |
| |
Investment income | | | | |
Interest | | $ | 4,204,976 | |
| | | | |
| |
Expenses | | | | |
Advisory fee | | | 2,081,951 | |
Administration fees | | | | |
Fund level | | | 1,040,490 | |
Class A | | | 497,923 | |
Administrator Class | | | 135,386 | |
Institutional Class | | | 894,514 | |
Service Class | | | 399,702 | |
Sweep Class | | | 591,897 | |
Shareholder servicing fees | | | | |
Class A | | | 564,278 | |
Administrator Class | | | 131,604 | |
Service Class | | | 828,154 | |
Sweep Class | | | 672,610 | |
Distribution fees | | | | |
Sweep Class | | | 941,654 | |
Custody and accounting fees | | | 94,001 | |
Professional fees | | | 20,793 | |
Registration fees | | | 43,562 | |
Shareholder report expenses | | | 9,062 | |
Trustees’ fees and expenses | | | 4,967 | |
Other fees and expenses | | | 49,579 | |
| | | | |
Total expenses | | | 9,002,127 | |
Less: Fee waivers and/or expense reimbursements | | | (5,144,022 | ) |
| | | | |
Net expenses | | | 3,858,105 | |
| | | | |
Net investment income | | | 346,871 | |
| | | | |
Net realized gains on investments | | | 173,122 | |
| | | | |
Net increase in net assets resulting from operations | | $ | 519,993 | |
| | | | |
The accompanying notes are an integral part of these financial statements.
| | | | |
| 18 | | Wells Fargo Advantage National Tax-Free Money Market Fund | | Statement of Changes in Net Assets |
| | | | | | | | | | | | | | | | |
| | | Six Months Ended July 31, 2012 (Unaudited) | | | Year Ended January 31, 2012 | |
| | | | |
Operations | | | | | | | | | | | | | | | | |
Net investment income | | | | | | $ | 346,871 | | | | | | | $ | 1,098,117 | |
Net realized gains on investments | | | | | | | 173,122 | | | | | | | | 548,316 | |
| | | | | | | | | | | | | | | | |
Net increase in net assets resulting from operations | | | | | | | 519,993 | | | | | | | | 1,646,433 | |
| | | | | | | | | | | | | | | | |
| | | | |
Distributions to shareholders from | | | | | | | | | | | | | | | | |
Net investment income | | | | | | | | | | | | | | | | |
Class A | | | | | | | (22,690 | ) | | | | | | | (72,688 | ) |
Administrator Class | | | | | | | (13,573 | ) | | | | | | | (31,557 | ) |
Institutional Class | | | | | | | (250,236 | ) | | | | | | | (897,306 | ) |
Service Class | | | | | | | (33,396 | ) | | | | | | | (63,398 | ) |
Sweep Class | | | | | | | (26,976 | ) | | | | | | | (33,168 | ) |
Net realized gains | | | | | | | | | | | | | | | | |
Class A | | | | | | | 0 | | | | | | | | (49,111 | ) |
Administrator Class | | | | | | | 0 | | | | | | | | (24,818 | ) |
Institutional Class | | | | | | | 0 | | | | | | | | (211,146 | ) |
Service Class | | | | | | | 0 | | | | | | | | (59,138 | ) |
Sweep Class | | | | | | | 0 | | | | | | | | (47,043 | ) |
| | | | | | | | | | | | | | | | |
Total distributions to shareholders | | | | | | | (346,871 | ) | | | | | | | (1,489,373 | ) |
| | | | | | | | | | | | | | | | |
| | | | |
Capital share transactions | | | Shares | | | | | | | | Shares | | | | | |
Proceeds from shares sold | | | | | | | | | | | | | | | | |
Class A | | | 105,018,759 | | | | 105,018,759 | | | | 1,289,900,552 | | | | 1,289,900,552 | |
Administrator Class | | | 50,846,818 | | | | 50,846,818 | | | | 192,875,256 | | | | 192,875,256 | |
Institutional Class | | | 5,353,779,647 | | | | 5,353,779,647 | | | | 12,035,015,509 | | | | 12,035,015,509 | |
Service Class | | | 438,094,601 | | | | 438,094,601 | | | | 1,112,744,849 | | | | 1,112,744,849 | |
Sweep Class | | | 922,043,779 | | | | 922,043,779 | | | | 1,722,795,827 | | | | 1,722,795,827 | |
| | | | | | | | | | | | | | | | |
| | | | | | | 6,869,783,604 | | | | | | | | 16,353,331,993 | |
| | | | | | | | | | | | | | | | |
Reinvestment of distributions | | | | | | | | | | | | | | | | |
Class A | | | 22,517 | | | | 22,517 | | | | 120,235 | | | | 120,235 | |
Administrator Class | | | 12,249 | | | | 12,249 | | | | 50,360 | | | | 50,360 | |
Institutional Class | | | 63,310 | | | | 63,310 | | | | 335,925 | | | | 335,925 | |
Service Class | | | 3,673 | | | | 3,673 | | | | 17,019 | | | | 17,019 | |
Sweep Class | | | 26,976 | | | | 26,976 | | | | 80,211 | | | | 80,211 | |
| | | | | | | | | | | | | | | | |
| | | | | | | 128,725 | | | | | | | | 603,750 | |
| | | | | | | | | | | | | | | | |
Payment for shares redeemed | | | | | | | | | | | | | | | | |
Class A | | | (211,284,099 | ) | | | (211,284,099 | ) | | | (1,717,015,064 | ) | | | (1,717,015,064 | ) |
Administrator Class | | | (71,321,546 | ) | | | (71,321,546 | ) | | | (273,543,487 | ) | | | (273,543,487 | ) |
Institutional Class | | | (6,429,108,086 | ) | | | (6,429,108,086 | ) | | | (11,887,717,946 | ) | | | (11,887,717,946 | ) |
Service Class | | | (459,307,219 | ) | | | (459,307,219 | ) | | | (1,091,356,421 | ) | | | (1,091,356,421 | ) |
Sweep Class | | | (944,838,186 | ) | | | (944,838,186 | ) | | | (1,161,374,500 | ) | | | (1,161,374,500 | ) |
| | | | | | | | | | | | | | | | |
| | | | | | | (8,115,859,136 | ) | | | | | | | (16,131,007,418 | ) |
| | | | | | | | | | | | | | | | |
Net increase (decrease) in net assets resulting from capital share transactions | | | | | | | (1,245,946,807 | ) | | | | | | | 222,928,325 | |
| | | | | | | | | | | | | | | | |
Total increase (decrease) in net assets | | | | | | | (1,245,773,685 | ) | | | | | | | 223,085,385 | |
| | | | | | | | | | | | | | | | |
| | | | |
Net assets | | | | | | | | | | | | | | | | |
Beginning of period | | | | | | | 5,076,256,188 | | | | | | | | 4,853,170,803 | |
| | | | | | | | | | | | | | | | |
End of period | | | | | | $ | 3,830,482,503 | | | | | | | $ | 5,076,256,188 | |
| | | | | | | | | | | | | | | | |
Undistributed net investment income | | | | | | $ | 18 | | | | | | | $ | 18 | |
| | | | | | | | | | | | | | | | |
The accompanying notes are an integral part of these financial statements.
| | | | | | |
| Financial Highlights | | Wells Fargo Advantage National Tax-Free Money Market Fund | | | 19 | |
(For a share outstanding throughout each period)
| | | | | | | | | | | | | | | | | | | | | | | | | | | | |
| | | Six Months Ended
July 31, 2012 (Unaudited) | | | Year Ended January 31, | | | Year Ended February 28, | |
| Class A | | | 2012 | | | 20111 | | | 2010 | | | 2009 | | | 20082 | | | 2007 | |
Net asset value, beginning of period | | $ | 1.00 | | | $ | 1.00 | | | $ | 1.00 | | | $ | 1.00 | | | $ | 1.00 | | | $ | 1.00 | | | $ | 1.00 | |
Net investment income | | | 0.00 | 3 | | | 0.00 | 3 | | | 0.00 | 3 | | | 0.00 | 3 | | | 0.01 | | | | 0.03 | | | | 0.03 | |
Net realized gains on investments | | | 0.00 | 3 | | | 0.00 | 3 | | | 0.00 | 3 | | | 0.00 | 3 | | | 0.00 | 3 | | | 0.00 | | | | 0.00 | |
| | | | | | | | | | | | | | | | | | | | | | | | | | | | |
Total from investment operations | | | 0.00 | 3 | | | 0.00 | 3 | | | 0.00 | 3 | | | 0.00 | 3 | | | 0.01 | | | | 0.03 | | | | 0.03 | |
Distributions to shareholders from | | | | | | | | | | | | | | | | | | | | | | | | | | | | |
Net investment income | | | (0.00 | )3 | | | (0.00 | )3 | | | (0.00 | )3 | | | (0.00 | )3 | | | (0.01 | ) | | | (0.03 | ) | | | (0.03 | ) |
Net realized gains | | | 0.00 | | | | (0.00 | )3 | | | (0.00 | )3 | | | (0.00 | )3 | | | (0.00 | )3 | | | 0.00 | | | | 0.00 | |
| | | | | | | | | | | | | | | | | | | | | | | | | | | | |
Total distributions to shareholders | | | (0.00 | )3 | | | (0.00 | )3 | | | (0.00 | )3 | | | (0.00 | )3 | | | (0.01 | ) | | | (0.03 | ) | | | (0.03 | ) |
Net asset value, end of period | | $ | 1.00 | | | $ | 1.00 | | | $ | 1.00 | | | $ | 1.00 | | | $ | 1.00 | | | $ | 1.00 | | | $ | 1.00 | |
Total return4 | | | 0.00 | % | | | 0.02 | % | | | 0.01 | % | | | 0.05 | % | | | 1.32 | % | | | 2.91 | % | | | 2.92 | % |
Ratios to average net assets (annualized) | | | | | | | | | | | | | | | | | | | | | | | | | | | | |
Gross expenses | | | 0.63 | % | | | 0.62 | % | | | 0.61 | % | | | 0.67 | % | | | 0.67 | % | | | 0.65 | % | | | 0.65 | % |
Net expenses | | | 0.19 | % | | | 0.19 | % | | | 0.32 | % | | | 0.46 | % | | | 0.67 | % | | | 0.65 | % | | | 0.65 | % |
Net investment income | | | 0.01 | % | | | 0.01 | % | | | 0.01 | % | | | 0.05 | % | | | 1.27 | % | | | 2.86 | % | | | 2.89 | % |
Supplemental data | | | | | | | | | | | | | | | | | | | | | | | | | | | | |
Net assets, end of period (000’s omitted) | | | $412,724 | | | | $518,949 | | | | $945,917 | | | | $1,018,470 | | | | $1,568,362 | | | | $1,562,483 | | | | $1,164,801 | |
| 1. | For the eleven months ended January 31, 2011. The Fund changed its fiscal year end from February 28 to January 31, effective January 31, 2011. |
| 2. | Year ended February 29. |
| 3. | Amount is less than $0.005. |
| 4. | Returns for periods of less than one year are not annualized. |
The accompanying notes are an integral part of these financial statements.
| | | | |
| 20 | | Wells Fargo Advantage National Tax-Free Money Market Fund | | Financial Highlights |
(For a share outstanding throughout each period)
| | | | | | | | | | | | | | | | | | | | | | | | | | | | |
| | | Six Months Ended
July 31, 2012 (Unaudited) | | | Year Ended January 31, | | | Year Ended February 28, | |
| Administrator Class | | | 2012 | | | 20111 | | | 2010 | | | 2009 | | | 20082 | | | 2007 | |
Net asset value, beginning of period | | $ | 1.00 | | | $ | 1.00 | | | $ | 1.00 | | | $ | 1.00 | | | $ | 1.00 | | | $ | 1.00 | | | $ | 1.00 | |
Net investment income | | | 0.00 | 3 | | | 0.00 | 3 | | | 0.00 | 3 | | | 0.00 | 3 | | | 0.02 | | | | 0.03 | | | | 0.03 | |
Net realized gains on investments | | | 0.00 | 3 | | | 0.00 | 3 | | | 0.00 | 3 | | | 0.00 | 3 | | | 0.00 | 3 | | | 0.00 | | | | 0.00 | |
| | | | | | | | | | | | | | | | | | | | | | | | | | | | |
Total from investment operations | | | 0.00 | 3 | | | 0.00 | 3 | | | 0.00 | 3 | | | 0.00 | 3 | | | 0.02 | | | | 0.03 | | | | 0.03 | |
Distributions to shareholders from | | | | | | | | | | | | | | | | | | | | | | | | | | | | |
Net investment income | | | (0.00 | )3 | | | (0.00 | )3 | | | (0.00 | )3 | | | (0.00 | )3 | | | (0.02 | ) | | | (0.03 | ) | | | (0.03 | ) |
Net realized gains | | | 0.00 | | | | (0.00 | )3 | | | (0.00 | )3 | | | (0.00 | )3 | | | (0.00 | )3 | | | 0.00 | | | | 0.00 | |
| | | | | | | | | | | | | | | | | | | | | | | | | | | | |
Total distributions to shareholders | | | (0.00 | )3 | | | (0.00 | )3 | | | (0.00 | )3 | | | (0.00 | )3 | | | (0.02 | ) | | | (0.03 | ) | | | (0.03 | ) |
Net asset value, end of period | | $ | 1.00 | | | $ | 1.00 | | | $ | 1.00 | | | $ | 1.00 | | | $ | 1.00 | | | $ | 1.00 | | | $ | 1.00 | |
Total return4 | | | 0.00 | % | | | 0.02 | % | | | 0.04 | % | | | 0.18 | % | | | 1.68 | % | | | 3.27 | % | | | 3.28 | % |
Ratios to average net assets (annualized) | | | | | | | | | | | | | | | | | | | | | | | | | | | | |
Gross expenses | | | 0.36 | % | | | 0.36 | % | | | 0.36 | % | | | 0.40 | % | | | 0.40 | % | | | 0.38 | % | | | 0.38 | % |
Net expenses | | | 0.19 | % | | | 0.18 | % | | | 0.29 | % | | | 0.31 | % | | | 0.32 | % | | | 0.30 | % | | | 0.30 | % |
Net investment income | | | 0.01 | % | | | 0.01 | % | | | 0.04 | % | | | 0.18 | % | | | 1.63 | % | | | 3.24 | % | | | 3.23 | % |
Supplemental data | | | | | | | | | | | | | | | | | | | | | | | | | | | | |
Net assets, end of period (000’s omitted) | | | $260,675 | | | | $281,128 | | | | $361,735 | | | | $419,954 | | | | $517,520 | | | | $517,666 | | | | $541,840 | |
| 1. | For the eleven months ended January 31, 2011. The Fund changed its fiscal year end from February 28 to January 31, effective January 31, 2011. |
| 2. | Year ended February 29. |
| 3. | Amount is less than $0.005. |
| 4. | Returns for periods of less than one year are not annualized. |
The accompanying notes are an integral part of these financial statements.
| | | | | | |
| Financial Highlights | | Wells Fargo Advantage National Tax-Free Money Market Fund | | | 21 | |
(For a share outstanding throughout each period)
| | | | | | | | | | | | | | | | | | | | | | | | | | | | |
| | | Six Months Ended
July 31, 2012 (Unaudited) | | | Year Ended January 31, | | | Year Ended February 28, | |
| Institutional Class | | | 2012 | | | 20111 | | | 2010 | | | 2009 | | | 20082 | | | 2007 | |
Net asset value, beginning of period | | $ | 1.00 | | | $ | 1.00 | | | $ | 1.00 | | | $ | 1.00 | | | $ | 1.00 | | | $ | 1.00 | | | $ | 1.00 | |
Net investment income | | | 0.00 | 3 | | | 0.00 | 3 | | | 0.00 | 3 | | | 0.00 | 3 | | | 0.02 | | | | 0.03 | | | | 0.03 | |
Net realized gains on investments | | | 0.00 | 3 | | | 0.00 | 3 | | | 0.00 | 3 | | | 0.00 | 3 | | | 0.00 | 3 | | | 0.00 | | | | 0.00 | |
| | | | | | | | | | | | | | | | | | | | | | | | | | | | |
Total from investment operations | | | 0.00 | 3 | | | 0.00 | 3 | | | 0.00 | 3 | | | 0.00 | 3 | | | 0.02 | | | | 0.03 | | | | 0.03 | |
Distributions to shareholders from | | | | | | | | | | | | | | | | | | | | | | | | | | | | |
Net investment income | | | (0.00 | )3 | | | (0.00 | )3 | | | (0.00 | )3 | | | (0.00 | )3 | | | (0.02 | ) | | | (0.03 | ) | | | (0.03 | ) |
Net realized gains | | | 0.00 | | | | (0.00 | )3 | | | (0.00 | )3 | | | (0.00 | )3 | | | (0.00 | )3 | | | 0.00 | | | | 0.00 | |
| | | | | | | | | | | | | | | | | | | | | | | | | | | | |
Total distributions to shareholders | | | (0.00 | )3 | | | (0.00 | )3 | | | (0.00 | )3 | | | (0.00 | )3 | | | (0.02 | ) | | | (0.03 | ) | | | (0.03 | ) |
Net asset value, end of period | | $ | 1.00 | | | $ | 1.00 | | | $ | 1.00 | | | $ | 1.00 | | | $ | 1.00 | | | $ | 1.00 | | | $ | 1.00 | |
Total return4 | | | 0.01 | % | | | 0.04 | % | | | 0.12 | % | | | 0.27 | % | | | 1.78 | % | | | 3.37 | % | | | 3.39 | % |
Ratios to average net assets (annualized) | | | | | | | | | | | | | | | | | | | | | | | | | | | | |
Gross expenses | | | 0.24 | % | | | 0.24 | % | | | 0.25 | % | | | 0.29 | % | | | 0.28 | % | | | 0.26 | % | | | 0.26 | % |
Net expenses | | | 0.18 | % | | | 0.16 | % | | | 0.20 | % | | | 0.23 | % | | | 0.22 | % | | | 0.20 | % | | | 0.20 | % |
Net investment income | | | 0.02 | % | | | 0.03 | % | | | 0.13 | % | | | 0.28 | % | | | 1.77 | % | | | 3.31 | % | | | 3.35 | % |
Supplemental data | | | | | | | | | | | | | | | | | | | | | | | | | | | | |
Net assets, end of period (000’s omitted) | | | $1,961,110 | | | | $3,036,275 | | | | $2,888,542 | | | | $2,048,774 | | | | $2,381,083 | | | | $1,403,838 | | | | $1,146,902 | |
| 1. | For the eleven months ended January 31, 2011. The Fund changed its fiscal year end from February 28 to January 31, effective January 31, 2011. |
| 2. | Year ended February 29. |
| 3. | Amount is less than $0.005. |
| 4. | Returns for periods of less than one year are not annualized. |
The accompanying notes are an integral part of these financial statements.
| | | | |
| 22 | | Wells Fargo Advantage National Tax-Free Money Market Fund | | Financial Highlights |
(For a share outstanding throughout each period)
| | | | | | | | | | | | | | | | | | | | | | | | | | | | |
| | | Six Months Ended
July 31, 2012 (Unaudited) | | | Year Ended January 31, | | | Year Ended February 28, | |
| Service Class | | | 2012 | | | 20111 | | | 2010 | | | 2009 | | | 20082 | | | 2007 | |
Net asset value, beginning of period | | $ | 1.00 | | | $ | 1.00 | | | $ | 1.00 | | | $ | 1.00 | | | $ | 1.00 | | | $ | 1.00 | | | $ | 1.00 | |
Net investment income | | | 0.00 | 3 | | | 0.00 | 3 | | | 0.00 | 3 | | | 0.00 | 3 | | | 0.01 | | | | 0.03 | | | | 0.03 | |
Net realized gains on investments | | | 0.00 | 3 | | | 0.00 | 3 | | | 0.00 | 3 | | | 0.00 | 3 | | | 0.00 | 3 | | | 0.00 | | | | 0.00 | |
| | | | | | | | | | | | | | | | | | | | | | | | | | | | |
Total from investment operations | | | 0.00 | 3 | | | 0.00 | 3 | | | 0.00 | 3 | | | 0.00 | 3 | | | 0.01 | | | | 0.03 | | | | 0.03 | |
Distributions to shareholders from | | | | | | | | | | | | | | | | | | | | | | | | | | | | |
Net investment income | | | (0.00 | )3 | | | (0.00 | )3 | | | (0.00 | )3 | | | (0.00 | )3 | | | (0.01 | ) | | | (0.03 | ) | | | (0.03 | ) |
Net realized gains | | | 0.00 | | | | (0.00 | )3 | | | (0.00 | )3 | | | (0.00 | )3 | | | (0.00 | )3 | | | 0.00 | | | | 0.00 | |
| | | | | | | | | | | | | | | | | | | | | | | | | | | | |
Total distributions to shareholders | | | (0.00 | )3 | | | (0.00 | )3 | | | (0.00 | )3 | | | (0.00 | )3 | | | (0.01 | ) | | | (0.03 | ) | | | (0.03 | ) |
Net asset value, end of period | | $ | 1.00 | | | $ | 1.00 | | | $ | 1.00 | | | $ | 1.00 | | | $ | 1.00 | | | $ | 1.00 | | | $ | 1.00 | |
Total return4 | | | 0.00 | % | | | 0.02 | % | | | 0.01 | % | | | 0.10 | % | | | 1.52 | % | | | 3.12 | % | | | 3.13 | % |
Ratios to average net assets (annualized) | | | | | | | | | | | | | | | | | | | | | | | | | | | | |
Gross expenses | | | 0.53 | % | | | 0.53 | % | | | 0.53 | % | | | 0.58 | % | | | 0.57 | % | | | 0.55 | % | | | 0.55 | % |
Net expenses | | | 0.19 | % | | | 0.18 | % | | | 0.32 | % | | | 0.40 | % | | | 0.47 | % | | | 0.45 | % | | | 0.45 | % |
Net investment income | | | 0.01 | % | | | 0.01 | % | | | 0.01 | % | | | 0.12 | % | | | 1.47 | % | | | 3.07 | % | | | 3.09 | % |
Supplemental data | | | | | | | | | | | | | | | | | | | | | | | | | | | | |
Net assets, end of period (000’s omitted) | | | $652,220 | | | | $673,405 | | | | $651,984 | | | | $1,055,420 | | | | $1,875,018 | | | | $1,674,047 | | | | $1,303,728 | |
| 1. | For the eleven months ended January 31, 2011. The Fund changed its fiscal year end from February 28 to January 31, effective January 31, 2011. |
| 2. | Year ended February 29. |
| 3. | Amount is less than $0.005. |
| 4. | Returns for periods of less than one year are not annualized. |
The accompanying notes are an integral part of these financial statements.
| | | | | | |
| Financial Highlights | | Wells Fargo Advantage National Tax-Free Money Market Fund | | | 23 | |
(For a share outstanding throughout each period)
| | | | | | | | | | | | |
| | | Six Months Ended
July 31, 2012 (Unaudited) | | | Year Ended January 31, | |
| Sweep Class | | | 2012 | | | 20111 | |
Net asset value, beginning of period | | | $1.00 | | | | $1.00 | | | | $1.00 | |
Net investment income | | | 0.00 | 2 | | | 0.00 | 2 | | | 0.00 | 2 |
Net realized gains on investments | | | 0.00 | 2 | | | 0.00 | 2 | | | 0.00 | 2 |
| | | | | | | | | | | | |
Total from investment operations | | | 0.00 | 2 | | | 0.00 | 2 | | | 0.00 | 2 |
Distributions to shareholders from | | | | | | | | | | | | |
Net investment income | | | (0.00 | )2 | | | (0.00 | )2 | | | (0.00 | )2 |
Net realized gains | | | 0.00 | | | | (0.00 | )2 | | | (0.00 | )2 |
| | | | | | | | | | | | |
Total distributions to shareholders | | | (0.00 | )2 | | | (0.00 | )2 | | | (0.00 | )2 |
Net asset value, end of period | | | $1.00 | | | | $1.00 | | | | $1.00 | |
Total return3 | | | 0.00 | % | | | 0.02 | % | | | 0.01 | % |
Ratios to average net assets (annualized) | | | | | | | | | | | | |
Gross expenses | | | 0.98 | % | | | 0.98 | % | | | 0.98 | % |
Net expenses | | | 0.19 | % | | | 0.14 | % | | | 0.32 | % |
Net investment income | | | 0.01 | % | | | 0.01 | % | | | 0.01 | % |
Supplemental data | | | | | | | | | | | | |
Net assets, end of period (000’s omitted) | | | $543,753 | | | | $566,501 | | | | $4,992 | |
| 1. | For the period from June 30, 2010 (commencement of class operations) to January 31, 2011. |
| 2. | Amount is less than $0.005. |
| 3. | Returns for periods of less than one year are not annualized. |
The accompanying notes are an integral part of these financial statements.
| | | | |
| 24 | | Wells Fargo Advantage National Tax-Free Money Market Fund | | Notes to Financial Statements (Unaudited) |
1. ORGANIZATION
Wells Fargo Funds Trust (the “Trust”), a Delaware statutory trust organized on March 10, 1999, is an open-end management investment company registered under the Investment Company Act of 1940, as amended (the “1940 Act”). These financial statements report on Wells Fargo Advantage National Tax-Free Money Market Fund (the “Fund”) which is a diversified series of the Trust.
2. SIGNIFICANT ACCOUNTING POLICIES
The following significant accounting policies, which are consistently followed in the preparation of the financial statements of the Fund, are in conformity with U.S. generally accepted accounting principles which require management to make estimates and assumptions that affect the reported amounts of assets and liabilities, disclosure of contingent assets and liabilities at the date of the financial statements, and the reported amounts of revenues and expenses during the reporting period. Actual results could differ from those estimates.
Securities valuation
As permitted under Rule 2a-7 of the 1940 Act, portfolio securities are valued at amortized cost, which approximates fair value. The amortized cost method involves valuing a security at its cost, plus accretion of discount or minus amortization of premium over the period until maturity.
Investments which are not valued using the method discussed above are valued at their fair value, as determined by procedures established in good faith and approved by the Board of Trustees. The Board of Trustees has established a Valuation Committee comprised of the Trustees and has delegated to it the authority to take any actions regarding the valuation of portfolio securities that the Valuation Committee deems necessary in determining the fair value of portfolio securities, unless the responsibility has been delegated to the Management Valuation Team of Wells Fargo Funds Management, LLC (“Funds Management”). The Board of Trustees retains the authority to make or ratify any valuation decisions or approve any changes to the Valuation Procedures as it deems appropriate. On a quarterly basis, the Board of Trustees considers for ratification any valuation actions taken by the Valuation Committee or the Management Valuation Team.
Valuations of fair valued prices are compared to the next actual sales price when available, or other appropriate market information to assess the continued appropriateness of the fair valuation methodology used. The securities are fair valued on a day-to-day basis, taking into consideration changes to appropriate market information and any significant changes to the input factors considered in the valuation process until there is a readily available price provided on the exchange or by an independent pricing service. Valuations received from an independent pricing service or broker quotes are periodically validated by comparisons to most recent trades and valuations provided by other independent pricing services in addition to the review of prices by the adviser and/or sub-adviser. Unobservable inputs used in determining fair valuations are identified based on the type of security, taking into consideration factors utilized by market participants in valuing the investment, knowledge about the issuer and the current market environment.
Security transactions and income recognition
Securities transactions are recorded on a trade date basis. Realized gains or losses are reported on the basis of identified cost of securities delivered.
Interest income is accrued daily and bond discounts are accreted and premiums are amortized daily based on the effective interest method. To the extent debt obligations are placed on non-accrual status, any related interest income may be reduced by writing off interest receivables when the collection of all or a portion of interest has become doubtful based on consistently applied procedures. If the issuer subsequently resumes interest payments or when the collectability of interest is reasonably assured, the debt obligation is removed from non-accrual status.
Distributions to shareholders
Distributions to shareholders from net investment income are accrued daily and paid monthly. Distributions from net realized gains, if any, are recorded on the ex-dividend date. Such distributions are determined in conformity with income tax regulations, which may differ from generally accepted accounting principles.
Federal and other taxes
The Fund intends to continue to qualify as a regulated investment company by distributing substantially all of its investment company taxable and tax-exempt income and any net realized capital gains (after reduction for capital loss carryforwards) sufficient to relieve it from all, or substantially all, federal income taxes. Accordingly, no provision for federal income taxes was required.
| | | | | | |
| Notes to Financial Statements (Unaudited) | | Wells Fargo Advantage National Tax-Free Money Market Fund | | | 25 | |
The Fund’s income and federal excise tax returns and all financial records supporting those returns for the prior three fiscal years are subject to examination by the federal and Delaware revenue authorities. Management has analyzed the Fund’s tax positions taken on federal, state, and foreign tax returns for all open tax years and does not believe that there are any uncertain tax positions that require recognition of a tax liability.
Class allocations
The separate classes of shares offered by the Fund differ principally in distribution, shareholder servicing and administration fees. Shareholders of each class bear certain expenses that pertain to that particular class. All shareholders bear the common expenses of the Fund, earn income from the portfolio, and are allocated any unrealized gains and losses pro rata based on the average daily net assets of each class, without distinction between share classes. Dividends are determined separately for each class based on income and expenses allocable to each class. Realized gains and losses are allocated to each class pro rata based upon the net assets of each class on the date realized. Differences in per share dividend rates generally result from the relative weightings of pro rata income and realized gain allocations and from differences in separate class expenses, including distribution, shareholder servicing and administration fees.
3. FAIR VALUATION MEASUREMENTS
Fair value measurements of investments are determined within a framework that has established a fair value hierarchy based upon the various data inputs utilized in determining the value of the Fund’s investments. The three-level hierarchy gives the highest priority to unadjusted quoted prices in active markets for identical assets or liabilities (Level 1) and the lowest priority to significant unobservable inputs (Level 3). The Fund’s investments are classified within the fair value hierarchy based on the lowest level of input that is significant to the fair value measurement. The inputs are summarized into three broad levels as follows:
| n | | Level 1 – quoted prices in active markets for identical securities |
| n | | Level 2 – other significant observable inputs (including quoted prices for similar securities, interest rates, prepayment speeds, credit risk, etc.) |
| n | | Level 3 – significant unobservable inputs (including the Fund’s own assumptions in determining the fair value of investments) |
The inputs or methodologies used for valuing securities are not necessarily an indication of the risk associated with investing in those securities.
At July 31, 2012, all of the Fund’s investments in securities carried at fair value were designated as Level 2 since the primary inputs include credit quality of the issuer and short-term interest rates which are observable.
Further details on the major security types can be found in the Summary Portfolio of Investments.
Transfers in and transfers out are recognized at the end of the reporting period. For the six months ended July 31, 2012, the Fund did not have any transfers into/out of Level 1 and Level 2.
4. TRANSACTIONS WITH AFFILIATES AND OTHER EXPENSES
Advisory fee
The Trust has entered into an advisory contract with Funds Management, an indirect wholly owned subsidiary of Wells Fargo & Company (“Wells Fargo”). The adviser is responsible for implementing investment policies and guidelines and for supervising the sub-adviser, who is responsible for day-to-day portfolio management of the Fund.
Pursuant to the contract, Funds Management is entitled to receive an annual advisory of 0.10% of the Fund’s average daily net assets.
Funds Management has retained the services of a sub-adviser to provide daily portfolio management to the Fund. The fee for sub-advisory services is borne by Funds Management. Wells Capital Management Incorporated, an affiliate of Funds Management, is the sub-adviser to the Fund and is entitled to receive a fee from Funds Management at an annual rate starting at 0.05% and declining to 0.01% as the average daily net assets of the Fund increase.
Administration and transfer agent fees
The Trust has entered into an administration agreement with Funds Management. Under this agreement, for providing administrative services, which includes paying fees and expenses for services provided by the transfer agent, sub-transfer
| | | | |
| 26 | | Wells Fargo Advantage National Tax-Free Money Market Fund | | Notes to Financial Statements (Unaudited) |
agents, omnibus account servicers and record-keepers, Funds Management is entitled to receive from the Fund an annual fund level administration fee starting at 0.05% and declining to 0.03% as the average daily net assets of the Fund increase and a class level administration fee which is calculated based on the average daily net assets of each class as follows:
| | | | |
| | | Class Level Administration Fee | |
Class A, Sweep Class | | | 0.22 | % |
Administrator Class | | | 0.10 | |
Institutional Class | | | 0.08 | |
Service Class | | | 0.12 | |
Funds Management has contractually waived and/or reimbursed advisory and administration fees to the extent necessary to maintain certain net operating expense ratios for the Fund. Waiver of fees and/or reimbursement of expenses by Funds Management were made first from fund level expenses on a proportionate basis and then from class specific expenses. Funds Management has committed through May 31, 2013 to waive fees and/or reimburse expenses to the extent necessary to cap the Fund’s expenses at 0.65% for Class A, 0.30% for Administrator, 0.20% for Institutional Class, 0.45% for Service Class and 1.00% for Sweep Class.
Distribution fees
The Trust has adopted a Distribution Plan for Sweep Class shares of the Fund pursuant to Rule 12b-1 under the 1940 Act. Distribution fees are charged to Sweep Class shares and paid to Wells Fargo Funds Distributor, LLC, the principal underwriter, at an annual rate of 0.35% of its average daily net assets.
Shareholder servicing fees
The Trust has entered into contracts with one or more shareholder servicing agents, whereby Class A, Service Class and Sweep Class of the Fund is charged a fee at an annual rate of 0.25% of the respective average daily net assets of each class. Administrator Class is charged a fee at an annual rate of 0.10% of its average daily net assets.
A portion of these total shareholder servicing fees were paid to affiliates of Wells Fargo.
5. INDEMNIFICATION
Under the Trust’s organizational documents, the officers and directors are indemnified against certain liabilities that may arise out of performance of their duties to the Trust. Additionally, in the normal course of business, the Trust may enter into contracts with service providers that contain a variety of indemnification clauses. The Trust’s maximum exposure under these arrangements is dependent on future claims that may be made against the Fund and, therefore, cannot be estimated.
6. NEW ACCOUNTING PRONOUNCEMENT
In December 2011, the Financial Accounting Standards Board (“FASB”) issued Accounting Standard Update (“ASU”) No. 2011-11, Disclosures about Offsetting Assets and Liabilities. ASU 2011-11, which amends FASB ASC Topic 210, Balance Sheet, creates new disclosure requirements which require entities to disclose both gross and net information for derivatives and other financial instruments that are either offset in the Statement of Assets and Liabilities or subject to an enforceable master netting arrangement or similar agreement. The disclosure requirements are effective for interim and annual reporting periods beginning on or after January 1, 2013. Management is currently assessing the potential impact, in addition to expanded financial statement disclosure, that may result from adopting this ASU.
| | | | | | |
| Other Information (Unaudited) | | Wells Fargo Advantage National Tax-Free Money Market Fund | | | 27 | |
PROXY VOTING INFORMATION
A description of the policies and procedures that the Fund uses to determine how to vote proxies relating to portfolio securities is available without charge, upon request, by calling 1-800-222-8222, visiting our Web site at wellsfargoadvantagefunds.com, or visiting the SEC Web site at sec.gov. Information regarding how the Fund voted proxies relating to portfolio securities during the most recent 12-month period ended June 30 is available without charge on the Fund’s Web site at wellsfargoadvantagefunds.com or by visiting the SEC Web site at sec.gov.
PORTFOLIO HOLDINGS INFORMATION
The complete portfolio holdings for each Fund are publicly available on the Funds’ Web site (wellsfargoadvantagefunds.com) on a monthly, seven-day delayed basis. The Fund files its complete schedule of portfolio holdings with the SEC for the first and third quarters of each fiscal year on Form N-Q, which is available without charge by visiting the SEC Web site at sec.gov. In addition, each Fund’s Form N-Q may be reviewed and copied at the SEC’s Public Reference Room in Washington, DC, and at regional offices in New York City, at 233 Broadway, and in Chicago, at 175 West Jackson Boulevard, Suite 900. Information about the Public Reference Room may be obtained by calling 1-800-SEC-0330.
| | | | |
| 28 | | Wells Fargo Advantage National Tax-Free Money Market Fund | | Other Information (Unaudited) |
BOARD OF TRUSTEES AND OFFICERS
Each of the Trustees and Officers listed in the table below acts in identical capacities for the Wells Fargo Advantage family of funds, which consists of 138 funds comprising the Wells Fargo Funds Trust, Wells Fargo Variable Trust, Wells Fargo Master Trust and four closed-end funds (collectively the “Fund Complex”). This table should be read in conjunction with the Prospectus and the Statement of Additional Information1. All of the Trustees are also Members of the Audit and Governance Committees of each Trust in the Fund Complex. The mailing address of each Trustee and Officer is 525 Market Street, 12th Floor, San Francisco, CA 94105. Each Trustee and Officer serves an indefinite term, however, each Trustee serves such term until reaching the mandatory retirement age established by the Trustees.
Independent Trustees
| | | | | | |
Name and Year of Birth | | Position Held and Length of Service* | | Principal Occupations During Past Five Years | | Other Directorships During
Past Five Years |
Peter G. Gordon
(Born 1942) | | Trustee, since 1998, Chairman, since 2005 | | Co-Founder, Retired Chairman, President and CEO of Crystal Geyser Water Company. Trustee Emeritus, Colby College | | Asset Allocation Trust |
Isaiah Harris, Jr.
(Born 1952) | | Trustee, since 2009 | | Retired. Prior thereto, President and CEO of BellSouth Advertising and Publishing Corp. from 2005 to 2007, President and CEO of BellSouth Enterprises from 2004 to 2005 and President of BellSouth Consumer Services from 2000 to 2003. Emeritus member of the Iowa State University Foundation Board of Governors. Emeritus Member of the Advisory Board of Iowa State University School of Business. Mr. Harris is a certified public accountant. | | CIGNA Corporation; Deluxe Corporation; Asset Allocation Trust |
Judith M. Johnson
(Born 1949) | | Trustee, since 2008 Audit Committee Chairman, since 2008 | | Retired. Prior thereto, Chief Executive Officer and Chief Investment Officer of Minneapolis Employees Retirement Fund from 1996 to 2008. Ms. Johnson is an attorney, certified public accountant and a certified managerial accountant. | | Asset Allocation Trust |
Leroy Keith, Jr.
(Born 1939) | | Trustee, since 2010 | | Chairman, Bloc Global Services (development and construction). Trustee of the Evergreen Funds from 1983 to 2010. Former Managing Director, Almanac Capital Management (commodities firm), former Partner, Stonington Partners, Inc. (private equity fund), former Director, Obagi Medical Products Co. and former Director, Lincoln Educational Services. | | Trustee, Virtus Fund Complex (consisting of 40 portfolios as of 12/31/11); Asset Allocation Trust |
David F. Larcker
(Born 1950) | | Trustee, since 2009 | | James Irvin Miller Professor of Accounting at the Graduate School of Business, Stanford University, Director of Corporate Governance Research Program and Senior Faculty of The Rock Center for Corporate Governance since 2006. From 2005 to 2008, Professor of Accounting at the Graduate School of Business, Stanford University. Prior thereto, Ernst & Young Professor of Accounting at The Wharton School, University of Pennsylvania from 1985 to 2005. | | Asset Allocation Trust |
Olivia S. Mitchell
(Born 1953) | | Trustee, since 2006 | | International Foundation of Employee Benefit Plans Professor, Wharton School of the University of Pennsylvania since 1993. Director of Wharton’s Pension Research Council and Boettner Center on Pensions & Retirement Research, and Research Associate at the National Bureau of Economic Research. Previously, Cornell University Professor from 1978 to 1993. | | Asset Allocation Trust |
Timothy J. Penny
(Born 1951) | | Trustee, since 1996 | | President and CEO of Southern Minnesota Initiative Foundation, a non-profit organization, since 2007 and Senior Fellow at the Humphrey Institute Policy Forum at the University of Minnesota since 1995. Member of the Board of Trustees of NorthStar Education Finance, Inc., a non-profit organization, since 2007. | | Asset Allocation Trust |
| | | | | | |
| Other Information (Unaudited) | | Wells Fargo Advantage National Tax-Free Money Market Fund | | | 29 | |
| | | | | | |
Name and Year of Birth | | Position Held and Length of Service* | | Principal Occupations During Past Five Years | | Other Directorships During
Past Five Years |
Michael S. Scofield
(Born 1943) | | Trustee, since 2010 | | Served on the Investment Company Institute’s Board of Governors and Executive Committee from 2008-2011 as well the Governing Council of the Independent Directors Council from 2006-2011 and the Independent Directors Council Executive Committee from 2008-2011. Chairman of the IDC from 2008-2010. Institutional Investor (Fund Directions) Trustee of Year in 2007. Trustee of the Evergreen Funds (and its predecessors) from 1984 to 2010. Chairman of the Evergreen Funds from 2000-2010. Former Trustee of the Mentor Funds. Retired Attorney, Law Offices of Michael S. Scofield and former Director and Chairman, Branded Media Corporation (multi-media branding company). | | Asset Allocation Trust |
Donald C. Willeke
(Born 1940) | | Trustee, since 1996 | | Principal of the law firm of Willeke & Daniels. General Counsel of the Minneapolis Employees Retirement Fund from 1984 until its consolidation into the Minnesota Public Employees Retirement Association on June 30, 2010. Director and Vice Chair of The Free Trust (non-profit corporation). Director of the American Chestnut Foundation (non-profit corporation). | | Asset Allocation Trust |
| * | Length of service dates reflect the Trustee’s commencement of service with the Trust’s predecessor entities, where applicable. |
Officers
| | | | | | |
Name and Year of Birth | | Position Held and
Length of Service | | Principal Occupations During Past Five Years | | |
Karla M. Rabusch
(Born 1959) | | President, since 2003 | | Executive Vice President of Wells Fargo Bank, N.A. and President of Wells Fargo Funds Management, LLC since 2003. Senior Vice President and Chief Administrative Officer of Wells Fargo Funds Management, LLC from 2001 to 2003. | | |
C. David Messman
(Born 1960) | | Secretary, since 2000; Chief Legal Officer, since 2003 | | Senior Vice President and Secretary of Wells Fargo Funds Management, LLC since 2001. Vice President and Managing Senior Counsel of Wells Fargo Bank, N.A. since 1996. | | |
Nancy Wiser (Born 1967) | | Treasurer, since 2012 | | Executive Vice President of Wells Fargo Funds Management, LLC since 2011. Chief Operating Officer and Chief Compliance Officer at LightBox Capital Management LLC, from 2008 to 2011. Owned and operated a consulting business providing services to various hedge funds including acting as Chief Operating Officer and Chief Compliance Officer for a hedge fund from 2007 to 2008. Chief Operating Officer and Chief Compliance Officer of GMN Capital LLC from 2006 to 2007. | | |
David Berardi
(Born 1975) | | Assistant Treasurer, since 2009 | | Vice President of Wells Fargo Funds Management, LLC since 2009. Vice President of Evergreen Investment Management Company, LLC from 2008 to 2010. Assistant Vice President of Evergreen Investment Services, Inc. from 2004 to 2008. Manager of Fund Reporting and Control for Evergreen Investment Management Company, LLC from 2004 to 2010. | | |
Jeremy DePalma
(Born 1974) | | Assistant Treasurer, since 2009 | | Senior Vice President of Wells Fargo Funds Management, LLC since 2009. Senior Vice President of Evergreen Investment Management Company, LLC from 2008 to 2010. Vice President, Evergreen Investment Services, Inc. from 2004 to 2007. Head of the Fund Reporting and Control Team within Fund Administration from 2005 to 2010. | | |
Debra Ann Early
(Born 1964) | | Chief Compliance Officer, since 2007 | | Chief Compliance Officer of Wells Fargo Funds Management, LLC since 2007. Chief Compliance Officer of Parnassus Investments from 2005 to 2007. Chief Financial Officer of Parnassus Investments from 2004 to 2007 and Senior Audit Manager of PricewaterhouseCoopers LLP from 1998 to 2004. | | |
| 1. | The Statement of Additional Information includes additional information about the Trustees and is available, without charge, upon request, by calling 1-800-222-8222 or by visiting the Web site at wellsfargoadvantagefunds.com. |
| | | | |
| 30 | | Wells Fargo Advantage National Tax-Free Money Market Fund | | Other Information (Unaudited) |
BOARD CONSIDERATION OF INVESTMENT ADVISORY AND SUB-ADVISORY AGREEMENTS:
Under Section 15 of the Investment Company Act of 1940 (the “1940 Act”), the Board of Trustees (the “Board”) of Wells Fargo Funds Trust (the “Trust”), all the members of which have no direct or indirect interest in the investment advisory and sub-advisory agreements and are not “interested persons” of the Trust, as defined in the 1940 Act (the “Independent Trustees”), must determine whether to approve the continuation of the Trust’s investment advisory and sub-advisory agreements. In this regard, at an in person meeting held on March 29-30, 2012 (the “Meeting”), the Board reviewed and re-approved: (i) an investment advisory agreement with Wells Fargo Funds Management, LLC (“Funds Management”) for Wells Fargo Advantage National Tax-Free Money Market Fund (the “Fund”) and (ii) an investment sub-advisory agreement with Wells Capital Management Incorporated (“Wells Capital Management”) for the Fund. The investment advisory agreement with Funds Management and the investment sub-advisory agreement with Wells Capital Management are collectively referred to as the “Advisory Agreements.”
At the Meeting, the Board considered the factors and reached the conclusions described below relating to the selection of Funds Management and Wells Capital Management and the continuation of the Advisory Agreements. Prior to the Meeting, the Trustees conferred extensively among themselves and with representatives of Funds Management about these matters. The Board also met throughout the year and received information that was useful to them in considering the continuation of the Advisory Agreements. The Independent Trustees were assisted in their evaluation of the Advisory Agreements by independent legal counsel, from whom they received separate legal advice and with whom they met separately from Funds Management.
In providing information to the Board, Funds Management and Wells Capital Management were guided by a detailed set of requests submitted by the Independent Trustees’ independent legal counsel on their behalf at the start of the Board’s annual contract renewal process earlier in 2012. In approving the Advisory Agreements, the Board did not identify any particular information or consideration that was all-important or controlling, and each Trustee likely attributed different weights to various factors.
Nature, Extent and Quality of Services
The Board received and considered various information regarding the nature, extent and quality of services provided to the Fund by Funds Management and Wells Capital Management under the Advisory Agreements. The Board also received and considered, among other things, information about the background and experience of senior management of Funds Management, and the qualifications, backgrounds, tenures and responsibilities of the portfolio managers primarily responsible for the day-to-day portfolio management of the Fund.
The Board evaluated the ability of Funds Management and Wells Capital Management, based on their respective financial condition, resources, reputation and other attributes, to attract and retain qualified investment professionals, including research, advisory, and supervisory personnel. The Board further considered the compliance programs and compliance records of Funds Management and Wells Capital Management. In addition, the Board took into account the administrative services provided to the Fund by Funds Management and its affiliates.
The Board’s decision to approve the continuation of the Advisory Agreements was based on a comprehensive evaluation of information provided to it. In considering these matters, the Board considered not only the specific information presented in connection with the Meeting, but also the knowledge gained over time through interaction with Funds Management and Wells Capital Management about various topics, including Funds Management’s oversight of service providers. The above factors, together with those referenced below, are some of the most important, but not necessarily all, factors considered by the Board in concluding that the nature, extent and quality of the investment advisory services provided to the Fund by Funds Management and Wells Capital Management supported the re-approval of the Advisory Agreements. Although the Board considered the continuation of the Advisory Agreements for the Fund as part of the larger process of considering the continuation of the advisory agreements for all of the funds in the complex, its decision to continue the Advisory Agreements for the Fund was ultimately made on a fund-by-fund basis.
Fund Performance and Expenses
The Board considered the performance results for the Fund over various time periods ended December 31, 2011. The Board also considered these results in comparison to the median performance of a universe of relevant funds (the
| | | | | | |
| Other Information (Unaudited) | | Wells Fargo Advantage National Tax-Free Money Market Fund | | | 31 | |
“Universe”) that was determined by Lipper Inc. (“Lipper”) to be similar to the Fund, and in comparison to the Fund’s benchmark index and to other comparative data. Lipper is an independent provider of investment company data. The Board received a description of the methodology used by Lipper to select the mutual funds in the Universe. The Board noted that the performance of the Fund was equal to or in range of the median performance of the Universe for all periods under review. The Board also noted that the performance of the Fund was equal to or in range of its benchmark, the Lipper Tax-Exempt Money Market Funds Index, for the periods under review.
The Board received and considered information regarding the Fund’s contractual advisory fee and net operating expense ratios and their various components, including actual management fees (which reflect fee waivers, if any), transfer agent, custodian and other non-management fees, Rule 12b-1 and non-Rule 12b-1 fees, service fees and fee waiver and expense reimbursement arrangements. The Board also considered these ratios in comparison to the median ratios of an expense Universe and a narrower expense group of mutual funds (each, an “Expense Group”) that was determined by Lipper to be similar to the Fund. The Board received a description of the methodology used by Lipper to select the mutual funds in the Fund’s Expense Group. The Board noted that the net operating expense ratios of the Fund were higher than the Fund’s Expense Group’s median net operating expense ratios, except for the Administrator and Institutional Classes.
Funds Management advised the Board that the Expense Group medians reflected voluntary waivers, whereas the Fund’s expense ratios did not reflect voluntary waivers. The Board noted that when the Fund’s expense ratios were adjusted to reflect voluntary waivers, the Fund’s net operating expense ratios were lower than the median net operating expense ratios of the Expense Group. The Board viewed favorably Funds Management’s proposal to lower the net operating expense cap of the Fund’s Sweep Class by five basis points.
Based on the above-referenced considerations and other factors, the Board concluded that the overall performance and expense structure of the Fund supported the re-approval of the Advisory Agreements for the Fund.
Investment Advisory and Sub-Advisory Fee Rates
The Board reviewed and considered the contractual investment advisory fee rate that is payable by the Fund to Funds Management for investment advisory services (the “Advisory Agreement Rate”), both on a stand-alone basis and on a combined basis with the Fund’s administration fee rate. The Board took into account the separate administrative and other services covered by the administration fee rate. The Board also reviewed and considered the contractual investment sub-advisory fee rate that is payable by Funds Management to Wells Capital Management for investment sub-advisory services (the “Sub- Advisory Agreement Rate”). In addition, the Board reviewed and considered the existing fee waiver/cap arrangements applicable to the Advisory Agreement Rate and considered the Advisory Agreement Rate after taking the waivers/caps into account (the “Net Advisory Rate”).
The Board received and considered information comparing the Advisory Agreement Rate and Net Advisory Rate, combined with the administration fee rates, with those of other funds in the Fund’s Expense Group median. The Board noted that the Advisory Agreement Rate for the Fund was equal to or in range of the median rates for the Fund’s Expense Group, except for the Sweep Class. The Board also noted that the Net Advisory Rate for the Fund was in range of the median rates for the Fund’s Expense Group, except for Class A and Sweep Class. The Board viewed favorably Funds Management’s willingness to voluntarily waive certain fees and its proposal to lower the net operating expense cap for the Sweep Class.
The Board also received and considered information about the nature and extent of services offered and fee rates charged by Funds Management and Wells Capital Management to other types of clients. In this regard, the Board received information about differences between the services, and the compliance, reporting, and other legal burdens and risks of providing investment advice to mutual funds and those associated with providing advice to non-mutual fund clients such as collective funds or institutional separate accounts.
The Board determined that the Advisory Agreement Rate for the Fund, both with and without the administration fee rate and before and after waivers, was reasonable in light of the Fund’s Expense Group information, the net expense ratio commitments, the services covered by the Advisory Agreements and other information provided. The Board also reviewed and considered the Sub-Advisory Agreement Rate and concluded that the Sub-Advisory Agreement Rate was reasonable in light of the services covered by the sub-advisory agreement and other information provided.
| | | | |
| 32 | | Wells Fargo Advantage National Tax-Free Money Market Fund | | Other Information (Unaudited) |
Profitability
The Board received and considered a profitability analysis of Funds Management, as well as an analysis of the profitability to the collective Wells Fargo businesses that provide services to the Fund. It considered that the information provided to it was necessarily estimated, and that the profitability information provided to it, especially on a fund-by-fund basis, did not necessarily provide a precise tool for evaluating the appropriateness of the Fund’s Advisory Agreement Rate in isolation. It noted that the levels of profitability reported on a fund-by-fund basis varied widely, depending on, among other things, the size and type of fund. The Board noted the impact of voluntary fee waivers on Funds Management’s profitability. The Board concluded that the profitability reported by Funds Management was not unreasonable.
The Board did not consider separate profitability information with respect to Wells Capital Management, because, as an affiliate of Funds Management, its profitability information was subsumed in the collective Wells Fargo profitability analysis provided by Funds Management.
Economies of Scale
With respect to possible economies of scale, the Board reviewed the breakpoints in the Fund’s advisory fee and/or administration fee structure, which operate generally to reduce the expenses of the Fund (as a percentage of Fund assets) as the Fund grows in size. It considered that, as a fund shrinks in size, breakpoints conversely result in increasing fee levels. The Board noted that it would have on-going opportunities to review the appropriate levels of breakpoints in the future, and concluded that the breakpoints as implemented appeared to be a reasonable step toward sharing economies of scale, if any, with the Fund. However, the Board acknowledged the inherent limitations of any analysis of economies of scale and of any attempt to correlate breakpoints with such economies, stemming largely from the Board’s understanding that economies of scale are realized, if at all, across a variety of products and services, not just with respect to a single fund.
Other Benefits to Funds Management and Wells Capital Management
The Board received and considered information regarding potential “fall-out” or ancillary benefits received by Funds Management and its affiliates, including Wells Capital Management, as a result of their relationship with the Fund. Ancillary benefits could include, among others, benefits directly attributable to the relationship of Funds Management and Wells Capital Management with the Fund and benefits potentially derived from an increase in Funds Management’s and Wells Capital Management’s business as a result of their relationship with the Fund (such as the ability to market to shareholders other financial products offered by Funds Management and its affiliates, including Wells Capital Management).
The Board considered that Wells Fargo Funds Distributor, LLC, an affiliate of Funds Management, serves as distributor to the Fund and receives certain compensation for those services. The Board noted that various financial institutions, including affiliates of Funds Management, may receive distribution-related fees, shareholder servicing payments (including amounts derived from payments under Rule 12b-1 plans) and sub-transfer agency fees in respect of shares sold or held through them and services provided.
The Board also reviewed information about whether and to what extent soft dollar credits are sought and how any such credits are utilized and any benefits that may be realized by using an affiliated broker.
Other Factors and Broader Review
The Board also considered the markets for distribution of the Fund’s shares, including the channels through which the Fund’s shares are offered and sold. The Board noted that the Fund is part of one of the few fund families that have both direct-to-fund and intermediary distribution channels. As discussed above, the Board reviews detailed materials received from Funds Management and Wells Capital Management annually as part of the re-approval process under Section 15 of the 1940 Act and also reviews and assesses information about the quality of the services that the Fund receives throughout the year. In this regard, the Board has reviewed reports of Funds Management at each of its quarterly meetings, which include, among other things, portfolio reviews and performance reports. In addition, the Board confers with portfolio managers at various times throughout the year.
Conclusion
After considering the above-described factors and based on its deliberations and its evaluation of the information described above, the Board unanimously approved the continuation of the Advisory Agreements for an additional one-year period.
| | | | | | |
| List of Abbreviations | | Wells Fargo Advantage National Tax-Free Money Market Fund | | | 33 | |
The following is a list of common abbreviations for terms and entities which may have appeared in this report.
| ACB | — Agricultural Credit Bank |
| ADR | — American Depository Receipt |
| ADS | — American Depository Shares |
| AGC-ICC | — Assured Guaranty Corporation - Insured Custody Certificates |
| AGM | — Assured Guaranty Municipal |
| AMBAC | — American Municipal Bond Assurance Corporation |
| AMT | — Alternative Minimum Tax |
| BAN | — Bond Anticipation Notes |
| BHAC | — Berkshire Hathaway Assurance Corporation |
| CAB | — Capital Appreciation Bond |
| CCAB | — Convertible Capital Appreciation Bond |
| CDA | — Community Development Authority |
| CDO | — Collateralized Debt Obligation |
| COP | — Certificate of Participation |
| DRIVER | — Derivative Inverse Tax-Exempt Receipts |
| DW&P | — Department of Water & Power |
| DWR | — Department of Water Resources |
| ECFA | — Educational & Cultural Facilities Authority |
| EDA | — Economic Development Authority |
| EDFA | — Economic Development Finance Authority |
| ETF | — Exchange-Traded Fund |
| FFCB | — Federal Farm Credit Bank |
| FGIC | — Financial Guaranty Insurance Corporation |
| FGLMC | — Federal Government Loan Mortgage Company |
| FHA | — Federal Housing Authority |
| FHLB | — Federal Home Loan Bank |
| FHLMC | — Federal Home Loan Mortgage Corporation |
| FICO | — The Financing Corporation |
| FNMA | — Federal National Mortgage Association |
| GDR | — Global Depository Receipt |
| GNMA | — Government National Mortgage Association |
| HCFR | — Healthcare Facilities Revenue |
| HEFA | — Health & Educational Facilities Authority |
| HEFAR | — Higher Education Facilities Authority Revenue |
| HFA | — Housing Finance Authority |
| HFFA | — Health Facilities Financing Authority |
| IBC | — Insured Bond Certificate |
| IDA | — Industrial Development Authority |
| IDAG | — Industrial Development Agency |
| IDR | — Industrial Development Revenue |
| KRW | — Republic of Korea Won |
| LIBOR | — London Interbank Offered Rate |
| LLC | — Limited Liability Company |
| LLP | — Limited Liability Partnership |
| MBIA | — Municipal Bond Insurance Association |
| MFHR | — Multi-Family Housing Revenue |
| MSTR | — Municipal Securities Trust Receipts |
| MUD | — Municipal Utility District |
| NATL-RE | — National Public Finance Guarantee Corporation |
| PCFA | — Pollution Control Finance Authority |
| PCR | — Pollution Control Revenue |
| PFA | — Public Finance Authority |
| PFFA | — Public Facilities Financing Authority |
| PFOTER | — Puttable Floating Option Tax-Exempt Receipts |
| plc | — Public Limited Company |
| PUTTER | — Puttable Tax-Exempt Receipts |
| R&D | — Research & Development |
| RDA | — Redevelopment Authority |
| RDFA | — Redevelopment Finance Authority |
| REIT | — Real Estate Investment Trust |
| ROC | — Reset Option Certificates |
| SAVRS | — Select Auction Variable Rate Securities |
| SBA | — Small Business Authority |
| SFHR | — Single Family Housing Revenue |
| SFMR | — Single Family Mortgage Revenue |
| SPA | — Standby Purchase Agreement |
| SPDR | — Standard & Poor’s Depositary Receipts |
| STRIPS | — Separate Trading of Registered Interest and Principal |
| TAN | — Tax Anticipation Notes |
| TIPS | — Treasury Inflation-Protected Securities |
| TRAN | — Tax Revenue Anticipation Notes |
| TCR | — Transferable Custody Receipts |
| TTFA | — Transportation Trust Fund Authority |
| TVA | — Tennessee Valley Authority |
| XLCA | — XL Capital Assurance |
This page is intentionally left blank.


FOR MORE INFORMATION
More information about Wells Fargo Advantage Funds is available free upon request. To obtain literature, please write, e-mail, visit the Fund’s Web site, or call:
Wells Fargo Advantage Funds
P.O. Box 8266
Boston, MA 02266-8266
E-mail: wfaf@wellsfargo.com
Web site: wellsfargoadvantagefunds.com
Individual investors: 1-800-222-8222
Retail investment professionals: 1-888-877-9275
Institutional investment professionals: 1-866-765-0778
This report and the financial statements contained herein are submitted for the general information of the shareholders of Wells Fargo Advantage Funds. If this report is used for promotional purposes, distribution of the report must be accompanied or preceded by a current prospectus. For a current prospectus and, if available, a summary prospectus containing more complete information, including charges and expenses, call 1-800-222-8222 or visit the Fund’s Web site at wellsfargoadvantagefunds.com. Please consider the investment objectives, risks, charges, and expenses of the investment carefully before investing. This and other information about Wells Fargo Advantage Funds can be found in the current prospectus. Read the prospectus carefully before you invest or send money.
Wells Fargo Funds Management, LLC, a wholly owned subsidiary of Wells Fargo & Company, provides investment advisory and administrative services for Wells Fargo Advantage Funds. Other affiliates of Wells Fargo & Company provide subadvisory and other services for the Funds. The Funds are distributed by Wells Fargo Funds Distributor, LLC, Member FINRA/SIPC, an affiliate of Wells Fargo & Company.
NOT FDIC INSURED ¡ NO BANK GUARANTEE ¡ MAY LOSE VALUE
© 2012 Wells Fargo Funds Management, LLC. All rights reserved.
| | |
 | | 211393 09-12 SA309/SAR309 07-12 |

Wells Fargo Advantage
Prime Investment Money Market Fund

Semi-Annual Report
July 31, 2012

Reduce clutter. Save trees.
Sign up for electronic delivery of prospectuses and shareholder reports at wellsfargo.com/advantagedelivery
Contents
The views expressed and any forward-looking statements are as of July 31, 2012, unless otherwise noted, and are those of the Fund managers and/or Wells Fargo Funds Management, LLC. Discussions of individual securities, or the markets generally, or any Wells Fargo Advantage Fund are not intended as individual recommendations. Future events or results may vary significantly from those expressed in any forward-looking statements; the views expressed are subject to change at any time in response to changing circumstances in the market. Wells Fargo Funds Management, LLC, disclaims any obligation to publicly update or revise any views expressed or forward-looking statements.
NOT FDIC INSURED ¡ NO BANK GUARANTEE ¡ MAY LOSE VALUE

WELLS FARGO INVESTMENT HISTORY
| | |
| |
| 1932 | | Keystone creates one of the first mutual fund families. |
| |
| 1971 | | Wells Fargo & Company introduces one of the first institutional index funds. |
| |
| 1978 | | Wells Fargo applies Markowitz and Sharpe’s research on Modern Portfolio Theory to introduce one of the industry’s first Tactical Asset Allocation (TAA) models in institutional separately managed accounts. |
| |
| 1984 | | Wells Fargo Stagecoach Funds launches its first asset allocation fund. |
| |
| 1989 | | The Tactical Asset Allocation (TAA) Model is first applied to Wells Fargo’s asset allocation mutual funds. |
| |
| 1994 | | Wells Fargo introduces the LifePath Funds, one of the first suites of target date funds (now the Wells Fargo Advantage Dow Jones Target Date FundsSM). |
| |
| 1996 | | Evergreen Investments and Keystone Funds merge. |
| |
| 1997 | | Wells Fargo launches Wells Fargo Advantage WealthBuilder PortfoliosSM, a fund-of-funds suite of products that includes the use of quantitative models to shift assets among investment styles. |
| |
| 1999 | | Norwest Advantage Funds and Stagecoach Funds are reorganized into Wells Fargo Funds after the merger of Norwest and Wells Fargo. |
| |
| 2002 | | Evergreen Retail and Evergreen Institutional companies form the umbrella asset management company, Evergreen Investments. |
| |
| 2005 | | The integration of Strong Funds with Wells Fargo Funds creates Wells Fargo Advantage Funds, resulting in one of the top 20 mutual fund companies in the United States. |
| |
| 2006 | | Wells Fargo Advantage Funds relaunches the target date product line as Wells Fargo Advantage Dow Jones Target Date Funds. |
| |
| 2010 | | The mergers and reorganizations of Evergreen and Wells Fargo Advantage mutual funds are completed, unifying the families under the brand of Wells Fargo Advantage Funds. |
Wells Fargo Advantage Funds®
Wells Fargo Advantage Funds skillfully guides institutions, financial advisors, and individuals through the investment terrain to help them reach their financial objectives. Everything we do on behalf of investors is backed by our unique combination of qualifications.
Strength
Our organization is built on the standards of integrity and service established by our parent company—Wells Fargo & Company—more than 150 years ago. And, because we’re part of a highly diversified financial enterprise, we offer the depth of resources to help investors succeed.
Expertise
Our multi-boutique model offers investors access to the independent thinking of premier investment managers that have been chosen for their time-tested strategies. While each team specializes in a specific investment strategy, collectively they provide investors a wide choice of distinct investment styles. Our dedication to investment excellence doesn’t end with our expertise in manager selection—risk management, analysis, and rigorous ongoing review seek to ensure each manager’s investment process remains consistent.
Partnership
Our collaborative approach is built around understanding the needs and goals of our clients. By adhering to core principles of sound judgment and steady guidance, we support you through every stage of the investment decision process.
Carefully consider a fund’s investment objectives, risks, charges, and expenses before investing. For a current prospectus and, if available, a summary prospectus, containing this and other information, visit wellsfargoadvantagefunds.com. Read it carefully before investing.
Wells Fargo Funds Management, LLC, a wholly owned subsidiary of Wells Fargo & Company, provides investment advisory and administrative services for Wells Fargo Advantage Funds®. Other affiliates of Wells Fargo & Company provide subadvisory and other services for the Funds. The Funds are distributed by Wells Fargo Funds Distributor, LLC, Member FINRA/SIPC, an affiliate of Wells Fargo & Company.
“Dow Jones®” and “Dow Jones Target Date IndexesSM” are service marks of Dow Jones Trademark Holdings, LLC (“Dow Jones”), have been licensed to CME Group Index Services LLC (“CME Indexes”) and have been sublicensed for use for certain purposes by Global Index Advisors, Inc, and Wells Fargo Funds Management, LLC. The Wells Fargo Advantage Dow Jones Target Date FundsSM based on the Dow Jones Target Date IndexesSM, are not sponsored, endorsed, sold or promoted by Dow Jones, CME Indexes or their respective affiliates and none of them makes any representation regarding the advisability of investing in such product(s).
NOT FDIC INSURED ¡ NO BANK GUARANTEE ¡ MAY LOSE VALUE
Not part of the semi-annual report.
Wells Fargo Advantage Funds offers more than 110 mutual funds across a wide range of asset classes, representing over $209 billion in assets under management, as of July 31, 2012.
| | | | |
| Equity Funds | | | | |
Asia Pacific Fund | | Enterprise Fund† | | Opportunity Fund† |
C&B Large Cap Value Fund | | Equity Value Fund | | Precious Metals Fund |
C&B Mid Cap Value Fund | | Global Opportunities Fund | | Premier Large Company Growth Fund |
Capital Growth Fund | | Growth Fund | | Small Cap Opportunities Fund |
Common Stock Fund | | Index Fund | | Small Cap Value Fund |
Disciplined U.S. Core Fund | | International Equity Fund | | Small Company Growth Fund |
Discovery Fund† | | International Value Fund | | Small Company Value Fund |
Diversified Equity Fund | | Intrinsic Small Cap Value Fund | | Small/Mid Cap Core Fund |
Diversified International Fund | | Intrinsic Value Fund | | Small/Mid Cap Value Fund |
Diversified Small Cap Fund | | Intrinsic World Equity Fund | | Special Mid Cap Value Fund |
Emerging Growth Fund | | Large Cap Core Fund | | Special Small Cap Value Fund |
Emerging Markets Equity Fund | | Large Cap Growth Fund | | Specialized Technology Fund |
Emerging Markets Equity Income Fund | | Large Company Value Fund | | Traditional Small Cap Growth Fund |
Endeavor Select Fund† | | Omega Growth Fund | | Utility and Telecommunications Fund |
| Bond Funds | | | | |
Adjustable Rate Government Fund | | Inflation-Protected Bond Fund | | Short-Term Bond Fund |
California Limited-Term Tax-Free Fund | | Intermediate Tax/AMT-Free Fund | | Short-Term High Yield Bond Fund |
California Tax-Free Fund | | International Bond Fund | | Short-Term Municipal Bond Fund |
Colorado Tax-Free Fund | | Minnesota Tax-Free Fund | | Strategic Municipal Bond Fund |
Emerging Markets Local Bond Fund | | Municipal Bond Fund | | Total Return Bond Fund |
Government Securities Fund | | North Carolina Tax-Free Fund | | Ultra Short-Term Income Fund |
High Income Fund | | Pennsylvania Tax-Free Fund | | Ultra Short-Term Municipal Income Fund |
High Yield Bond Fund | | Short Duration Government Bond Fund | | Wisconsin Tax-Free Fund |
Income Plus Fund | | | | |
| Asset Allocation Funds | | | | |
Absolute Return Fund | | WealthBuilder Equity Portfolio† | | Target 2020 Fund† |
Asset Allocation Fund | | WealthBuilder Growth Allocation Portfolio† | | Target 2025 Fund† |
Conservative Allocation Fund | | WealthBuilder Growth Balanced Portfolio† | | Target 2030 Fund† |
Diversified Capital Builder Fund | | WealthBuilder Moderate Balanced Portfolio† | | Target 2035 Fund† |
Diversified Income Builder Fund | | WealthBuilder Tactical Equity Portfolio† | | Target 2040 Fund† |
Growth Balanced Fund | | Target Today Fund† | | Target 2045 Fund† |
Index Asset Allocation Fund | | Target 2010 Fund† | | Target 2050 Fund† |
Moderate Balanced Fund | | Target 2015 Fund† | | Target 2055 Fund† |
WealthBuilder Conservative Allocation Portfolio† | | | | |
| Money Market Funds | | | | |
100% Treasury Money Market Fund | | Heritage Money Market Fund† | | National Tax-Free Money Market Fund |
California Municipal Money Market Fund | | Money Market Fund | | Prime Investment Money Market Fund |
Cash Investment Money Market Fund | | Municipal Cash Management Money Market Fund | | Treasury Plus Money Market Fund |
Government Money Market Fund | | Municipal Money Market Fund | | |
| Variable Trust Funds1 | | | | |
VT Discovery Fund† | | VT Intrinsic Value Fund | | VT Small Cap Growth Fund |
VT Index Asset Allocation Fund | | VT Omega Growth Fund | | VT Small Cap Value Fund |
VT International Equity Fund | | VT Opportunity Fund† | | VT Total Return Bond Fund |
An investment in a money market fund is not insured or guaranteed by the Federal Deposit Insurance Corporation or any other government agency. Although the Wells Fargo Advantage Money Market Funds seek to preserve the value of your investment at $1.00 per share, it is possible to lose money by investing in a money market fund.
| 1. | The Variable Trust Funds are generally available only through insurance company variable contracts. |
| † | In this report, the Wells Fargo Advantage Discovery FundSM, Wells Fargo Advantage Endeavor Select FundSM, Wells Fargo Advantage Enterprise FundSM, Wells Fargo Advantage Opportunity FundSM, Wells Fargo Advantage WealthBuilder Conservative Allocation PortfolioSM, Wells Fargo Advantage WealthBuilder Equity PortfolioSM, Wells Fargo Advantage WealthBuilder Growth Allocation PortfolioSM, Wells Fargo Advantage WealthBuilder Growth Balanced PortfolioSM, Wells Fargo Advantage WealthBuilder Moderate Balanced PortfolioSM, Wells Fargo Advantage WealthBuilder Tactical Equity PortfolioSM, Wells Fargo Advantage Dow Jones Target Today FundSM, Wells Fargo Advantage Dow Jones Target 2010 FundSM, Wells Fargo Advantage Dow Jones Target 2015 FundSM, Wells Fargo Advantage Dow Jones Target 2020 FundSM, Wells Fargo Advantage Dow Jones Target 2025 FundSM, Wells Fargo Advantage Dow Jones Target 2030 FundSM, Wells Fargo Advantage Dow Jones Target 2035 FundSM, Wells Fargo Advantage Dow Jones Target 2040 FundSM, Wells Fargo Advantage Dow Jones Target 2045 FundSM, Wells Fargo Advantage Dow Jones Target 2050 FundSM, Wells Fargo Advantage Dow Jones Target 2055 FundSM, Wells Fargo Advantage Heritage Money Market FundSM, Wells Fargo Advantage VT Discovery FundSM, and Wells Fargo Advantage VT Opportunity FundSM are referred to as the Discovery Fund, Endeavor Select Fund, Enterprise Fund, Opportunity Fund, WealthBuilder Conservative Allocation Portfolio, WealthBuilder Equity Portfolio, WealthBuilder Growth Allocation Portfolio, WealthBuilder Growth Balanced Portfolio, WealthBuilder Moderate Balanced Portfolio, WealthBuilder Tactical Equity Portfolio, Target Today Fund, Target 2010 Fund, Target 2015 Fund, Target 2020 Fund, Target 2025 Fund, Target 2030 Fund, Target 2035 Fund, Target 2040 Fund, Target 2045 Fund, Target 2050 Fund, Target 2055 Fund, Heritage Money Market Fund, VT Discovery Fund, and VT Opportunity Fund, respectively. |
Not part of the semi-annual report.
| | | | |
| 2 | | Wells Fargo Advantage Prime Investment Money Market Fund | | Letter to Shareholders (Unaudited) |

Karla M. Rabusch,
President
Wells Fargo Advantage Funds
Not only has the Fed been successful in engineering low interest rates, but investors have rushed to buy U.S. Treasury securities as a safe-haven asset in the midst of uncertainty surrounding the European debt crisis. As a result, interest rates reached record lows.
Dear Valued Shareholder:
We’re pleased to offer you this semi-annual report for the Wells Fargo Advantage Prime Investment Money Market Fund for the six-month period that ended July 31, 2012.
The economy grew, but the recovery has been modest.
The U.S. is three years into a modest economic recovery, with second-quarter real gross domestic product (GDP) increasing 1.5% on an annualized basis. Several factors, however, held back growth despite the Federal Reserve’s (Fed) accommodative monetary policy. In Europe, much uncertainty remained about the outcome of the eurozone debt crisis and whether policymakers will be able to resolve it without any countries defaulting or leaving the euro. In addition, Europe has again entered a recession. In Asia, China’s economy slowed. Here at home, a potential “fiscal cliff”—automatic tax increases alongside automatic budget cuts stemming from a legislative compromise in Congress—added uncertainty and, if unaddressed, could negatively affect GDP beginning in 2013.
In an effort to further bolster the economy, especially the labor market, the Fed has indicated its commitment to maintaining a highly accommodative monetary policy. It has indicated its belief that economic conditions warrant an extremely low federal funds target rate—a short-term bank lending rate—near 0%, at least through late 2014. The Fed also continued its “Operation Twist,” which involves buying U.S. Treasury securities with maturities of greater than six years and selling U.S. Treasury securities with maturities of less than three years, in an effort to keep longer-term interest rates low.
A demand for relative safe-haven securities led to ultra-low interest rates.
Not only has the Fed been successful in engineering low interest rates, but investors have rushed to buy U.S. Treasury securities as a relative safe-haven asset in the midst of uncertainty surrounding the European debt crisis. As a result, interest rates reached record lows. Ten-year U.S. Treasury yields ranged between 2.38% and 1.38% over the past six months. Three-month U.S. Treasury bills had an average yield of 10 basis points (bps; 100 bps is 1.00%) over the past six months. Rates on seven-day commercial paper, a common investment type for prime money market funds, were 12 bps on July 31, 2012.
Lack of supply kept a lid on yields, and regulatory uncertainty remained.
Continued demand for a limited supply of money market-eligible securities also contributed to low yields. We estimate that the amount outstanding of short-term, money market fund-eligible securities (excluding U.S. Treasury securities) has declined by $3 trillion, or more than a 30% decrease, since 2008. Reasons for this decrease in supply include issuers opting to lock in rates on long-term rather than short-term debt, less need for financing as many companies have plentiful cash given record profits, and credit downgrades that have resulted in fewer firms with top credit ratings.
| | | | | | |
| Letter to Shareholders (Unaudited) | | Wells Fargo Advantage Prime Investment Money Market Fund | | | 3 | |
The Chairman of the Securities and Exchange Commission (SEC) indicated in late August that the SEC has determined at this time not to propose certain amendments to the rules governing money market funds. However, the Financial Stability Oversight Council or other financial regulators could still take steps to impose additional regulations on money market funds. As we gain clarity in the coming months regarding any potential changes to regulation of money market funds, we will provide further communications to our clients about these changes.
Amid the current challenges of investing—low yields, an unresolved eurozone crisis, limited supply, and regulatory uncertainty—has been the opportunity to provide our clients an important investment option for meeting their short-term cash needs. Our focus on preservation of capital and liquidity is not a marketing phrase but rather the basis of our investment philosophy as we manage money market funds in an uncertain world. We are proud of our comprehensive lineup of prime, government, and tax-exempt money market funds.
Thank you for choosing to invest with Wells Fargo Advantage Funds. We appreciate your confidence in us and remain committed to helping you meet your financial needs. For current information about your fund investments, contact your investment professional, visit our Web site at wellsfargoadvantagefunds.com, or call us directly at 1-800-222-8222. We are available 24 hours a day, 7 days a week.
Sincerely,

Karla M. Rabusch
President
Wells Fargo Advantage Funds
Amid the current challenges of investing—low yields, an unresolved eurozone crisis, limited supply, and regulatory uncertainty—has been the opportunity to provide our clients an important investment option for meeting their short-term cash needs.
| | | | |
| 4 | | Wells Fargo Advantage Prime Investment Money Market Fund | | Performance Highlights (Unaudited) |
INVESTMENT OBJECTIVE
The Fund seeks current income, while preserving capital and liquidity.
ADVISER
Wells Fargo Funds Management, LLC
SUB-ADVISER
Wells Capital Management Incorporated
PORTFOLIO MANAGERS
David D. Sylvester
Laurie White
FUND INCEPTION
September 2, 1998
| | |
PORTFOLIO COMPOSITION1 (AS OF JULY 31, 2012) |
| |
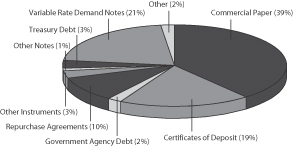 | | |
| | |
EFFECTIVE MATURITY DISTRIBUTION2 (AS OF JULY 31, 2012) |
| |
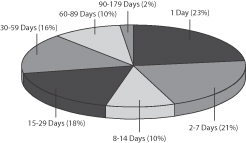 | | |
|
WEIGHTED AVERAGE MATURITY3 (AS OF JULY 31, 2012) |
23 Days |
|
WEIGHTED AVERAGE FINAL MATURITY4 (AS OF JULY 31, 2012) |
40 Days |
| 1. | Portfolio composition is subject to change and is calculated based on the total investments of the Fund. |
| 2. | Effective maturity distribution is subject to change and is calculated based on the total investments of the Fund. |
| 3. | Weighted Average Maturity (WAM): WAM is an average of the effective maturities of all securities held in the portfolio, weighted by each security’s percentage of total investments. The maturity of a portfolio security is the period remaining until the date on which the principal amount is unconditionally required to be paid, or in the case of a security called for redemption, the date on which the redemption payment is unconditionally required to be made. WAM calculations allow for the maturities of certain securities with demand features or periodic interest rate resets to be shortened. WAM is a way to measure a fund’s sensitivity to potential interest rate changes. |
| 4. | Weighted Average Final Maturity (WAFM): WAFM is an average of the final maturities of all securities held in the portfolio, weighted by their percentage of total investments. The maturity of a portfolio security is the period remaining until the date on which the principal amount is unconditionally required to be paid, or in the case of a security called for redemption, the date on which the redemption payment is unconditionally required to be made. In contrast to WAM, the calculation of WAFM allows for the maturities of certain securities with demand features to be shortened, but not the periodic interest rate resets. WAFM is a way to measure a fund’s potential sensitivity to credit spread changes. |
| | | | | | |
| Performance Highlights (Unaudited) | | Wells Fargo Advantage Prime Investment Money Market Fund | | | 5 | |
AVERAGE ANNUAL TOTAL RETURN5 (%) (AS OF JULY 31, 2012)
| | | | | | | | | | | | | | | | | | | | | | | | | | | | |
| | | | | | | | | | | | | | | | | | Expense Ratios6 | |
| | | Inception Date | | | 6 Months* | | | 1 Year | | | 5 Year | | | 10 Year | | | Gross | | | Net7 | |
Institutional Class (PISXX) | | | 07/28/2003 | | | | 0.01 | | | | 0.03 | | | | 1.09 | | | | 1.90 | | | | 0.24% | | | | 0.20% | |
Service Class (PRVXX) | | | 09/02/1998 | | | | 0.00 | | | | 0.01 | | | | 0.89 | | | | 1.66 | | | | 0.53% | | | | 0.53% | |
| * | Returns for periods of less than one year are not annualized. |
| | | | | | | | |
FUND YIELD SUMMARY7
(AS OF JULY 31, 2012) | | Institutional
Class | | | Service
Class | |
7-Day Current Yield | | | 0.07% | | | | 0.01% | |
7-Day Compound Yield | | | 0.07% | | | | 0.01% | |
30-Day Simple Yield | | | 0.06% | | | | 0.01% | |
30-Day Compound Yield | | | 0.06% | | | | 0.01% | |
Figures quoted represent past performance, which is no guarantee of future results and do not reflect the deduction of taxes that a shareholder may pay on fund distributions or the redemption of fund shares. Investment returns will fluctuate. The Fund’s yield figures more closely reflect the current earnings of the Fund than the total return figures. Current performance may be lower or higher than the performance data quoted and assumes the reinvestment of dividends and capital gains. Current month-end performance is available at the Fund’s Web site – wellsfargoadvantagefunds.com.
Each class is sold without a front-end sales charge or contingent deferred sales charge. Other fees and expenses apply to an investment in the Fund and are described in the Fund’s current prospectuses.
An investment in a money market fund is not insured or guaranteed by the Federal Deposit Insurance Corporation or any other government agency. Although the Fund seeks to preserve the value of your investment at $1.00 per share, it is possible to lose money by investing in a money market fund.
| 5. | Historical performance shown for the Institutional Class shares prior to their inception reflects the performance of the Service Class shares, and includes the higher expenses applicable to the Service Class shares. If these expenses had not been included, returns would be higher. |
| 6. | Reflects the expense ratios as stated in the most recent prospectuses. |
| 7. | The Adviser has committed through May 31, 2013 to waive fees and/or reimburse expenses to the extent necessary to cap the Fund’s Total Annual Fund Operating Expenses After Fee Waiver, excluding certain expenses, at 0.20% for Institutional Class and 0.55% for Service Class. Brokerage commissions, stamp duty fees, interest, taxes, acquired fund fees and expenses and extraordinary expenses are excluded from the cap. Without this cap, the Fund’s returns would have been lower. Without waived fees and/or reimbursed expenses, the Fund’s 7-day current yield would have been 0.03% and (0.26)% for Institutional Class and Service Class, respectively. |
| | | | |
| 6 | | Wells Fargo Advantage Prime Investment Money Market Fund | | Fund Expenses (Unaudited) |
As a shareholder of the Fund, you incur ongoing costs, including management fees, shareholder service fees, and other Fund expenses. This example is intended to help you understand your ongoing costs (in dollars) of investing in the Fund and to compare these costs with the ongoing costs of investing in other mutual funds.
The example is based on an investment of $1,000 invested at the beginning of the six-month period and held for the entire period from February 1, 2012 to July 31, 2012.
Actual Expenses
The “Actual” line of the table below provides information about actual account values and actual expenses. You may use the information in this line, together with the amount you invested, to estimate the expenses that you paid over the period. Simply divide your account value by $1,000 (for example, an $8,600 account value divided by $1,000 = 8.6), then multiply the result by the number in the “Actual” line under the heading entitled “Expenses Paid During Period” for your applicable class of shares to estimate the expenses you paid on your account during this period.
Hypothetical Example for Comparison Purposes
The “Hypothetical” line of the table below provides information about hypothetical account values and hypothetical expenses based on the Fund’s actual expense ratio and an assumed rate of return of 5% per year before expenses, which is not the Fund’s actual return. The hypothetical account values and expenses may not be used to estimate the actual ending account balance or expenses you paid for the period. You may use this information to compare the ongoing costs of investing in the Fund and other funds. To do so, compare this 5% hypothetical example with the 5% hypothetical examples that appear in the shareholder reports of the other funds.
Please note that the expenses shown in the table are meant to highlight your ongoing costs only. Therefore, the “Hypothetical” line of the table is useful in comparing ongoing costs only, and will not help you determine the relative total costs of owning different funds.
| | | | | | | | | | | | | | | | |
| | | Beginning Account Value
02-01-2012 | | | Ending Account Value
07-31-2012 | | | Expenses Paid During
the Period1 | | | Net Annual Expense Ratio | |
Institutional Class | | | | | | | | | | | | | | | | |
Actual | | $ | 1,000.00 | | | $ | 1,000.14 | | | $ | 0.99 | | | | 0.20 | % |
Hypothetical (5% return before expenses) | | $ | 1,000.00 | | | $ | 1,023.87 | | | $ | 1.01 | | | | 0.20 | % |
Service Class | | | | | | | | | | | | | | | | |
Actual | | $ | 1,000.00 | | | $ | 1,000.05 | | | $ | 1.04 | | | | 0.21 | % |
Hypothetical (5% return before expenses) | | $ | 1,000.00 | | | $ | 1,023.82 | | | $ | 1.06 | | | | 0.21 | % |
| 1. | Expenses paid is equal to the annualized expense ratio of each class multiplied by the average account value over the period, multiplied by the number of days in the most recent fiscal half-year divided by the number of days in the fiscal year (to reflect the one-half year period). |
| | | | | | |
| Portfolio of Investments—July 31, 2012 (Unaudited) | | Wells Fargo Advantage Prime Investment Money Market Fund | | | 7 | |
| | | | | | | | | | | | | | | | |
| Security Name | | Interest Rate | | | Maturity Date | | | Principal | | | Value | |
| | | | | | | | | | | | | | | | |
| | | | |
Certificates of Deposit : 19.54% | | | | | | | | | | | | | | | | |
Banco Del Estado De Chile | | | 0.27 | % | | | 08/13/2012 | | | $ | 8,000,000 | | | $ | 8,000,000 | |
Banco Del Estado De Chile | | | 0.44 | | | | 08/08/2012 | | | | 9,000,000 | | | | 9,000,000 | |
Bank of Montreal | | | 0.19 | | | | 08/01/2012 | | | | 3,000,000 | | | | 3,000,000 | |
Bank of Montreal | | | 0.20 | | | | 08/20/2012 | | | | 15,000,000 | | | | 14,999,960 | |
Bank of Montreal | | | 0.21 | | | | 08/21/2012 | | | | 14,000,000 | | | | 14,000,000 | |
Bank of Montreal | | | 0.23 | | | | 09/20/2012 | | | | 7,000,000 | | | | 7,000,000 | |
Bank of Nova Scotia | | | 0.21 | | | | 09/12/2012 | | | | 3,000,000 | | | | 3,000,000 | |
Bank of Nova Scotia ± | | | 0.30 | | | | 10/18/2012 | | | | 5,000,000 | | | | 5,000,000 | |
Bank of Nova Scotia | | | 0.72 | | | | 08/09/2012 | | | | 1,000,000 | | | | 1,000,109 | |
Bank of Tokyo-Mitsubishi LLC | | | 0.18 | | | | 08/06/2012 | | | | 26,000,000 | | | | 26,000,000 | |
Bank of Tokyo-Mitsubishi LLC | | | 0.19 | | | | 08/24/2012 | | | | 12,000,000 | | | | 12,000,000 | |
Bank of Tokyo-Mitsubishi LLC | | | 0.19 | | | | 08/29/2012 | | | | 10,000,000 | | | | 10,000,000 | |
Bank of Tokyo-Mitsubishi LLC | | | 0.35 | | | | 08/03/2012 | | | | 7,000,000 | | | | 7,000,058 | |
Barclays Bank plc ± | | | 0.92 | | | | 03/15/2013 | | | | 31,000,000 | | | | 31,000,000 | |
Canadian Imperial Bank ± | | | 0.77 | | | | 06/03/2013 | | | | 3,000,000 | | | | 3,007,787 | |
Citibank NA | | | 0.52 | | | | 08/09/2012 | | | | 18,000,000 | | | | 18,000,000 | |
Citibank NA | | | 0.52 | | | | 08/13/2012 | | | | 10,000,000 | | | | 10,000,000 | |
DNB Nor Bank ASA | | | 0.31 | | | | 09/13/2012 | | | | 13,000,000 | | | | 13,000,000 | |
National Australia Bank Limited ± | | | 0.35 | | | | 08/16/2012 | | | | 5,000,000 | | | | 5,000,351 | |
National Australia Bank Limited | | | 0.40 | | | | 08/21/2012 | | | | 13,000,000 | | | | 13,001,442 | |
National Bank of Kuwait | | | 0.18 | | | | 08/01/2012 | | | | 21,000,000 | | | | 21,000,000 | |
Nordea Bank plc | | | 0.87 | | | | 09/13/2012 | | | | 10,000,000 | | | | 10,001,210 | |
Norinchukin Bank | | | 0.17 | | | | 08/03/2012 | | | | 25,000,000 | | | | 25,000,000 | |
Norinchukin Bank | | | 0.20 | | | | 08/24/2012 | | | | 7,000,000 | | | | 7,000,000 | |
Oversea-Chinese Banking Corporation Limited | | | 0.23 | | | | 09/05/2012 | | | | 1,000,000 | | | | 1,000,000 | |
Oversea-Chinese Banking Corporation Limited | | | 0.26 | | | | 09/04/2012 | | | | 6,000,000 | | | | 6,000,000 | |
Oversea-Chinese Banking Corporation Limited | | | 0.26 | | | | 09/24/2012 | | | | 12,000,000 | | | | 12,000,000 | |
Oversea-Chinese Banking Corporation Limited | | | 0.27 | | | | 09/28/2012 | | | | 3,000,000 | | | | 3,000,000 | |
Royal Bank of Canada ± | | | 0.50 | | | | 07/26/2013 | | | | 16,000,000 | | | | 16,000,000 | |
Royal Bank of Canada ± | | | 0.74 | | | | 12/17/2012 | | | | 14,000,000 | | | | 14,000,000 | |
Skandinaviska Enskilda Banken AG | | | 0.50 | | | | 10/15/2012 | | | | 25,000,000 | | | | 25,000,000 | |
Skandinaviska Enskilda Banken AG | | | 0.70 | | | | 11/28/2012 | | | | 37,000,000 | | | | 37,000,000 | |
Skandinaviska Enskilda Banken AG | | | 0.75 | | | | 10/12/2012 | | | | 4,000,000 | | | | 4,001,671 | |
Standard Chartered Bank ± | | | 0.68 | | | | 03/04/2013 | | | | 26,000,000 | | | | 26,000,000 | |
State Street Bank & Trust | | | 0.17 | | | | 08/14/2012 | | | | 35,000,000 | | | | 35,000,000 | |
State Street Bank & Trust | | | 0.19 | | | | 08/17/2012 | | | | 10,000,000 | | | | 10,000,000 | |
State Street Bank & Trust | | | 0.25 | | | | 09/17/2012 | | | | 10,000,000 | | | | 10,000,000 | |
Sumitomo Mitsui Banking Corporation | | | 0.16 | | | | 08/01/2012 | | | | 19,000,000 | | | | 19,000,000 | |
Sumitomo Mitsui Banking Corporation | | | 0.16 | | | | 08/02/2012 | | | | 25,000,000 | | | | 25,000,000 | |
Sumitomo Mitsui Banking Corporation | | | 0.34 | | | | 08/08/2012 | | | | 11,000,000 | | | | 11,000,278 | |
Svenska Handelsbanken | | | 0.15 | | | | 08/01/2012 | | | | 50,000,000 | | | | 50,000,000 | |
Toronto-Dominion Bank | | | 0.18 | | | | 08/28/2012 | | | | 7,000,000 | | | | 7,000,000 | |
Toronto-Dominion Bank | | | 0.18 | | | | 08/29/2012 | | | | 13,000,000 | | | | 13,000,000 | |
Toronto-Dominion Bank ± | | | 0.45 | | | | 07/26/2013 | | | | 8,000,000 | | | | 8,000,000 | |
| | | | |
Total Certificates of Deposit (Cost $608,012,866) | | | | | | | | | | | | | | | 608,012,866 | |
| | | | | | | | | | | | | | | | |
| | | | |
Commercial Paper : 41.11% | | | | | | | | | | | | | | | | |
| | | | |
| Asset-Backed Commercial Paper : 19.88% | | | | | | | | | | | | | | | | |
Chariot Funding LLC 144A (z) | | | 0.18 | | | | 08/13/2012 | | | | 9,000,000 | | | | 8,999,460 | |
The accompanying notes are an integral part of these financial statements.
| | | | |
| 8 | | Wells Fargo Advantage Prime Investment Money Market Fund | | Portfolio of Investments—July 31, 2012 (Unaudited) |
| | | | | | | | | | | | | | | | |
| Security Name | | Interest Rate | | | Maturity Date | | | Principal | | | Value | |
| | | | | | | | | | | | | | | | |
| | | | |
| Asset-Backed Commercial Paper (continued) | | | | | | | | | | | | | | | | |
Chariot Funding LLC 144A (z) | | | 0.21 | % | | | 09/12/2012 | | | $ | 5,000,000 | | | $ | 4,998,775 | |
Charta LLC 144A (z) | | | 0.48 | | | | 08/20/2012 | | | | 3,000,000 | | | | 2,999,240 | |
Ciesco LLC 144A (z) | | | 0.52 | | | | 09/06/2012 | | | | 2,000,000 | | | | 1,998,960 | |
CRC Funding LLC 144A (z) | | | 0.50 | | | | 09/04/2012 | | | | 10,000,000 | | | | 9,995,278 | |
Fairway Finance Corporation 144A (z) | | | 0.18 | | | | 08/10/2012 | | | | 2,000,000 | | | | 1,999,910 | |
Fairway Finance Corporation 144A (z) | | | 0.19 | | | | 08/16/2012 | | | | 2,000,000 | | | | 1,999,842 | |
Fairway Finance Corporation 144A (z) | | | 0.22 | | | | 10/04/2012 | | | | 5,000,000 | | | | 4,998,044 | |
Gotham Funding Corporation 144A (z) | | | 0.21 | | | | 08/09/2012 | | | | 3,000,000 | | | | 2,999,860 | |
Gotham Funding Corporation 144A (z) | | | 0.00 | | | | 08/30/2012 | | | | 8,000,000 | | | | 7,998,647 | |
Gotham Funding Corporation 144A (z) | | | 0.21 | | | | 08/08/2012 | | | | 12,000,000 | | | | 11,999,511 | |
Gotham Funding Corporation 144A (z) | | | 0.21 | | | | 08/13/2012 | | | | 1,000,000 | | | | 999,930 | |
Gotham Funding Corporation 144A (z) | | | 0.21 | | | | 08/24/2012 | | | | 2,000,000 | | | | 1,999,732 | |
Gotham Funding Corporation 144A (z) | | | 0.21 | | | | 08/01/2012 | | | | 4,000,000 | | | | 4,000,000 | |
Gotham Funding Corporation 144A (z) | | | 0.21 | | | | 08/10/2012 | | | | 11,000,000 | | | | 10,999,423 | |
Gotham Funding Corporation 144A (z) | | | 0.21 | | | | 08/17/2012 | | | | 9,000,000 | | | | 8,999,160 | |
Gotham Funding Corporation 144A (z) | | | 0.21 | | | | 08/22/2012 | | | | 3,000,000 | | | | 2,999,633 | |
Gotham Funding Corporation 144A (z) | | | 0.21 | | | | 08/23/2012 | | | | 6,000,000 | | | | 5,999,230 | |
Gotham Funding Corporation 144A (z) | | | 0.21 | | | | 08/29/2012 | | | | 5,000,000 | | | | 4,999,183 | |
Govco LLC 144A (z) | | | 0.50 | | | | 09/05/2012 | | | | 15,000,000 | | | | 14,992,708 | |
Govco LLC 144A (z) | | | 0.50 | | | | 09/06/2012 | | | | 15,000,000 | | | | 14,992,500 | |
Jupiter Securitization Company LLC 144A (z) | | | 0.18 | | | | 08/13/2012 | | | | 9,000,000 | | | | 8,999,460 | |
Jupiter Securitization Company LLC 144A (z) | | | 0.21 | | | | 08/27/2012 | | | | 4,000,000 | | | | 3,999,393 | |
Jupiter Securitization Company LLC 144A (z) | | | 0.21 | | | | 09/12/2012 | | | | 5,000,000 | | | | 4,998,775 | |
Legacy Capital Company 144A (z) | | | 0.60 | | | | 08/13/2012 | | | | 6,000,000 | | | | 5,998,800 | |
Legacy Capital Company 144A (z) | | | 0.60 | | | | 08/14/2012 | | | | 6,000,000 | | | | 5,998,700 | |
Lexington Parker Capital Company LLC 144A (z) | | | 0.60 | | | | 08/13/2012 | | | | 6,000,000 | | | | 5,998,800 | |
Lexington Parker Capital Company LLC 144A (z) | | | 0.60 | | | | 08/14/2012 | | | | 6,000,000 | | | | 5,998,700 | |
Liberty Funding LLC 144A (z) | | | 0.19 | | | | 08/01/2012 | | | | 3,000,000 | | | | 3,000,000 | |
Liberty Funding LLC 144A (z) | | | 0.19 | | | | 08/15/2012 | | | | 7,000,000 | | | | 6,999,483 | |
Liberty Funding LLC 144A (z) | | | 0.19 | | | | 08/16/2012 | | | | 14,000,000 | | | | 13,998,892 | |
Liberty Funding LLC 144A (z) | | | 0.19 | | | | 08/17/2012 | | | | 14,000,000 | | | | 13,998,818 | |
Liberty Funding LLC 144A (z) | | | 0.19 | | | | 08/28/2012 | | | | 10,000,000 | | | | 9,998,575 | |
Liberty Funding LLC 144A (z) | | | 0.21 | | | | 08/13/2012 | | | | 5,000,000 | | | | 4,999,650 | |
Liberty Funding LLC 144A (z) | | | 0.23 | | | | 10/26/2012 | | | | 3,000,000 | | | | 2,998,352 | |
Market Street Funding Corporation 144A (z) | | | 0.23 | | | | 08/27/2012 | | | | 2,000,000 | | | | 1,999,668 | |
Market Street Funding Corporation 144A (z) | | | 0.26 | | | | 10/03/2012 | | | | 5,000,000 | | | | 4,997,725 | |
Market Street Funding Corporation 144A (z) | | | 0.26 | | | | 10/16/2012 | | | | 4,000,000 | | | | 3,997,804 | |
Market Street Funding Corporation 144A (z) | | | 0.26 | | | | 10/17/2012 | | | | 5,000,000 | | | | 4,997,219 | |
Market Street Funding Corporation 144A (z) | | | 0.26 | | | | 10/18/2012 | | | | 2,000,000 | | | | 1,998,873 | |
MetLife Short Term Funding 144A (z) | | | 0.20 | | | | 08/01/2012 | | | | 5,000,000 | | | | 5,000,000 | |
MetLife Short Term Funding 144A (z) | | | 0.21 | | | | 09/12/2012 | | | | 2,000,000 | | | | 1,999,510 | |
MetLife Short Term Funding 144A (z) | | | 0.21 | | | | 08/06/2012 | | | | 5,000,000 | | | | 4,999,854 | |
MetLife Short Term Funding 144A (z) | | | 0.21 | | | | 08/07/2012 | | | | 6,000,000 | | | | 5,999,790 | |
MetLife Short Term Funding 144A (z) | | | 0.21 | | | | 08/02/2012 | | | | 8,546,000 | | | | 8,545,950 | |
MetLife Short Term Funding 144A (z) | | | 0.22 | | | | 10/04/2012 | | | | 2,000,000 | | | | 1,999,218 | |
MetLife Short Term Funding 144A (z) | | | 0.22 | | | | 08/15/2012 | | | | 4,000,000 | | | | 3,999,658 | |
MetLife Short Term Funding 144A (z) | | | 0.23 | | | | 10/02/2012 | | | | 2,000,000 | | | | 1,999,208 | |
MetLife Short Term Funding 144A (z) | | | 0.24 | | | | 10/24/2012 | | | | 8,000,000 | | | | 7,995,520 | |
MetLife Short Term Funding 144A (z) | | | 0.25 | | | | 10/09/2012 | | | | 2,000,000 | | | | 1,999,042 | |
MetLife Short Term Funding 144A (z) | | | 0.25 | | | | 09/05/2012 | | | | 2,000,000 | | | | 1,999,514 | |
The accompanying notes are an integral part of these financial statements.
| | | | | | |
| Portfolio of Investments—July 31, 2012 (Unaudited) | | Wells Fargo Advantage Prime Investment Money Market Fund | | | 9 | |
| | | | | | | | | | | | | | | | |
| Security Name | | Interest Rate | | | Maturity Date | | | Principal | | | Value | |
| | | | | | | | | | | | | | | | |
| | | | |
| Asset-Backed Commercial Paper (continued) | | | | | | | | | | | | | | | | |
MetLife Short Term Funding 144A (z) | | | 0.25 | % | | | 09/06/2012 | | | $ | 9,000,000 | | | $ | 8,997,750 | |
MetLife Short Term Funding 144A (z) | | | 0.25 | | | | 10/15/2012 | | | | 2,000,000 | | | | 1,998,958 | |
Old Line Funding LLC 144A (z) | | | 0.18 | | | | 08/13/2012 | | | | 5,000,000 | | | | 4,999,700 | |
Old Line Funding LLC 144A (z) | | | 0.18 | | | | 08/15/2012 | | | | 10,000,000 | | | | 9,999,300 | |
Old Line Funding LLC 144A (z) | | | 0.18 | | | | 08/20/2012 | | | | 5,000,000 | | | | 4,999,525 | |
Old Line Funding LLC 144A (z) | | | 0.19 | | | | 08/27/2012 | | | | 6,000,000 | | | | 5,999,177 | |
Regency Markets No.1 LLC 144A (z) | | | 0.23 | | | | 08/28/2012 | | | | 1,000,000 | | | | 999,828 | |
Salisbury Receivables Company 144A (z) | | | 0.22 | | | | 08/28/2012 | | | | 3,000,000 | | | | 2,999,505 | |
Salisbury Receivables Company 144A (z) | | | 0.22 | | | | 08/30/2012 | | | | 4,000,000 | | | | 3,999,291 | |
Salisbury Receivables Company 144A (z) | | | 0.23 | | | | 08/14/2012 | | | | 4,000,000 | | | | 3,999,668 | |
Salisbury Receivables Company 144A (z) | | | 0.23 | | | | 08/17/2012 | | | | 3,000,000 | | | | 2,999,693 | |
Salisbury Receivables Company 144A (z) | | | 0.23 | | | | 08/22/2012 | | | | 3,000,000 | | | | 2,999,598 | |
Salisbury Receivables Company 144A (z) | | | 0.24 | | | | 09/10/2012 | | | | 1,000,000 | | | | 999,733 | |
Salisbury Receivables Company 144A (z) | | | 0.27 | | | | 09/25/2012 | | | | 3,000,000 | | | | 2,998,763 | |
Salisbury Receivables Company 144A (z) | | | 0.27 | | | | 09/26/2012 | | | | 2,000,000 | | | | 1,999,160 | |
Salisbury Receivables Company 144A (z) | | | 0.27 | | | | 09/27/2012 | | | | 2,000,000 | | | | 1,999,145 | |
Salisbury Receivables Company 144A (z) | | | 0.28 | | | | 09/06/2012 | | | | 2,000,000 | | | | 1,999,440 | |
Salisbury Receivables Company 144A (z) | | | 0.28 | | | | 09/13/2012 | | | | 7,000,000 | | | | 6,997,707 | |
Salisbury Receivables Company 144A (z) | | | 0.32 | | | | 08/29/2012 | | | | 2,000,000 | | | | 1,999,502 | |
Salisbury Receivables Company 144A (z) | | | 0.34 | | | | 10/04/2012 | | | | 2,000,000 | | | | 1,998,791 | |
Solitaire Funding LLC 144A (z) | | | 0.23 | | | | 08/28/2012 | | | | 10,000,000 | | | | 9,998,275 | |
Solitaire Funding LLC 144A (z) | | | 0.30 | | | | 08/01/2012 | | | | 3,000,000 | | | | 3,000,000 | |
Solitaire Funding LLC 144A (z) | | | 0.30 | | | | 08/06/2012 | | | | 7,000,000 | | | | 6,999,708 | |
Solitaire Funding LLC 144A (z) | | | 0.30 | | | | 08/08/2012 | | | | 6,000,000 | | | | 5,999,650 | |
Solitaire Funding LLC 144A (z) | | | 0.30 | | | | 08/15/2012 | | | | 9,000,000 | | | | 8,998,950 | |
Straight-A Funding LLC 144A (z) | | | 0.18 | | | | 08/17/2012 | | | | 3,000,000 | | | | 2,999,760 | |
Straight-A Funding LLC 144A (z) | | | 0.18 | | | | 10/03/2012 | | | | 15,000,000 | | | | 14,995,275 | |
Straight-A Funding LLC 144A (z) | | | 0.18 | | | | 10/15/2012 | | | | 33,000,000 | | | | 32,987,625 | |
Straight-A Funding LLC 144A (z) | | | 0.18 | | | | 10/18/2012 | | | | 20,000,000 | | | | 19,992,200 | |
Surrey Funding Corporation 144A (z) | | | 0.22 | | | | 08/28/2012 | | | | 3,000,000 | | | | 2,999,505 | |
Surrey Funding Corporation 144A (z) | | | 0.22 | | | | 08/17/2012 | | | | 6,000,000 | | | | 5,999,413 | |
Surrey Funding Corporation 144A (z) | | | 0.28 | | | | 09/17/2012 | | | | 1,000,000 | | | | 999,634 | |
Surrey Funding Corporation 144A (z) | | | 0.28 | | | | 09/18/2012 | | | | 2,000,000 | | | | 1,999,253 | |
Sydney Capital Corporation 144A (z) | | | 0.30 | | | | 08/13/2012 | | | | 6,000,000 | | | | 5,999,400 | |
Sydney Capital Corporation 144A (z) | | | 0.30 | | | | 09/21/2012 | | | | 5,000,000 | | | | 4,997,875 | |
Sydney Capital Corporation 144A (z) | | | 0.30 | | | | 09/13/2012 | | | | 5,000,000 | | | | 4,998,208 | |
Sydney Capital Corporation 144A (z) | | | 0.30 | | | | 09/14/2012 | | | | 12,000,000 | | | | 11,995,600 | |
Sydney Capital Corporation 144A (z) | | | 0.30 | | | | 10/03/2012 | | | | 4,000,000 | | | | 3,997,900 | |
Thunder Bay Funding LLC 144A (z) | | | 0.18 | | | | 08/08/2012 | | | | 9,000,000 | | | | 8,999,685 | |
Thunder Bay Funding LLC 144A (z) | | | 0.18 | | | | 08/14/2012 | | | | 5,000,000 | | | | 4,999,675 | |
Thunder Bay Funding LLC 144A (z) | | | 0.18 | | | | 08/15/2012 | | | | 8,000,000 | | | | 7,999,440 | |
Thunder Bay Funding LLC 144A (z) | | | 0.18 | | | | 08/20/2012 | | | | 10,000,000 | | | | 9,998,997 | |
Thunder Bay Funding LLC 144A (z) | | | 0.19 | | | | 09/04/2012 | | | | 5,000,000 | | | | 4,999,103 | |
Thunder Bay Funding LLC 144A (z) | | | 0.19 | | | | 08/27/2012 | | | | 5,000,000 | | | | 4,999,314 | |
Victory Receivables 144A (z) | | | 0.21 | | | | 08/02/2012 | | | | 6,000,000 | | | | 5,999,965 | |
Victory Receivables 144A (z) | | | 0.21 | | | | 08/03/2012 | | | | 2,000,000 | | | | 1,999,977 | |
Victory Receivables 144A (z) | | | 0.21 | | | | 08/08/2012 | | | | 7,000,000 | | | | 6,999,714 | |
Victory Receivables 144A (z) | | | 0.21 | | | | 08/09/2012 | | | | 9,000,000 | | | | 8,999,580 | |
Victory Receivables 144A (z) | | | 0.21 | | | | 08/14/2012 | | | | 4,000,000 | | | | 3,999,697 | |
Victory Receivables 144A (z) | | | 0.21 | | | | 08/15/2012 | | | | 8,000,000 | | | | 7,999,346 | |
The accompanying notes are an integral part of these financial statements.
| | | | |
| 10 | | Wells Fargo Advantage Prime Investment Money Market Fund | | Portfolio of Investments—July 31, 2012 (Unaudited) |
| | | | | | | | | | | | | | | | |
| Security Name | | Interest Rate | | | Maturity Date | | | Principal | | | Value | |
| | | | | | | | | | | | | | | | |
| | | | |
| Asset-Backed Commercial Paper (continued) | | | | | | | | | | | | | | | | |
Victory Receivables 144A (z) | | | 0.21 | % | | | 08/23/2012 | | | $ | 9,000,000 | | | $ | 8,998,845 | |
Victory Receivables 144A (z) | | | 0.21 | | | | 08/17/2012 | | | | 5,000,000 | | | | 4,999,533 | |
Victory Receivables 144A (z) | | | 0.21 | | | | 08/24/2012 | | | | 3,000,000 | | | | 2,999,598 | |
White Point Funding Incorporated 144A (z) | | | 0.52 | | | | 10/22/2012 | | | | 1,000,000 | | | | 998,816 | |
White Point Funding Incorporated 144A (z) | | | 0.57 | | | | 08/20/2012 | | | | 2,000,000 | | | | 1,999,398 | |
| | | | |
| | | | | | | | | | | | | | | 618,417,125 | |
| | | | | | | | | | | | | | | | |
| | | | |
| Financial Company Commercial Paper : 17.41% | | | | | | | | | | | | | | | | |
ANZ National Limited 144A (z) | | | 0.28 | | | | 09/20/2012 | | | | 11,000,000 | | | | 10,995,722 | |
ANZ National Limited 144A (z) | | | 0.22 | | | | 08/02/2012 | | | | 5,000,000 | | | | 4,999,969 | |
ANZ National Limited 144A (z) | | | 0.22 | | | | 08/10/2012 | | | | 9,000,000 | | | | 8,999,505 | |
ANZ National Limited 144A (z) | | | 0.29 | | | | 09/25/2012 | | | | 9,000,000 | | | | 8,996,013 | |
ANZ National Limited 144A (z) | | | 0.29 | | | | 10/02/2012 | | | | 9,000,000 | | | | 8,995,505 | |
ASB Finance Limited 144A ± | | | 0.54 | | | | 02/25/2013 | | | | 13,000,000 | | | | 13,000,000 | |
ASB Finance Limited 144A ± | | | 0.64 | | | | 04/08/2013 | | | | 8,000,000 | | | | 8,000,000 | |
Banco De Chile 144A (z) | | | 0.66 | | | | 09/25/2012 | | | | 2,000,000 | | | | 1,997,983 | |
Banco De Chile 144A (z) | | | 0.67 | | | | 08/06/2012 | | | | 1,000,000 | | | | 999,907 | |
Banco De Chile 144A (z) | | | 0.67 | | | | 08/28/2012 | | | | 4,000,000 | | | | 3,997,991 | |
Banco De Chile 144A (z) | | | 0.67 | | | | 08/23/2012 | | | | 2,000,000 | | | | 1,999,181 | |
Banco De Chile 144A (z) | | | 0.67 | | | | 08/08/2012 | | | | 3,000,000 | | | | 2,999,609 | |
Banco De Chile 144A (z) | | | 0.70 | | | | 09/06/2012 | | | | 1,000,000 | | | | 999,300 | |
Barclays Bank plc 144A (z) | | | 0.24 | | | | 08/20/2012 | | | | 13,000,000 | | | | 12,998,353 | |
BNZ International Funding Limited 144A (z) | | | 0.24 | | | | 08/03/2012 | | | | 3,000,000 | | | | 2,999,961 | |
BNZ International Funding Limited 144A (z) | | | 0.28 | | | | 09/12/2012 | | | | 3,000,000 | | | | 2,999,020 | |
BNZ International Funding Limited 144A (z) | | | 0.28 | | | | 09/14/2012 | | | | 2,000,000 | | | | 1,999,316 | |
BNZ International Funding Limited 144A (z) | | | 0.53 | | | | 02/28/2013 | | | | 1,000,000 | | | | 1,000,007 | |
Caisse Centrale Desjardins du Quebec 144A (z) | | | 0.18 | | | | 08/07/2012 | | | | 9,000,000 | | | | 8,999,730 | |
Caisse Centrale Desjardins du Quebec 144A (z) | | | 0.18 | | | | 08/16/2012 | | | | 3,000,000 | | | | 2,999,775 | |
Caisse Centrale Desjardins du Quebec 144A (z) | | | 0.18 | | | | 08/17/2012 | | | | 8,000,000 | | | | 7,999,360 | |
Caisse Centrale Desjardins du Quebec 144A (z) | | | 0.19 | | | | 08/20/2012 | | | | 6,000,000 | | | | 5,999,398 | |
Caisse Centrale Desjardins du Quebec 144A (z) | | | 0.20 | | | | 08/08/2012 | | | | 13,000,000 | | | | 12,999,495 | |
Caisse Centrale Desjardins du Quebec 144A (z) | | | 0.20 | | | | 08/09/2012 | | | | 6,000,000 | | | | 5,999,733 | |
Caisse Centrale Desjardins du Quebec 144A (z) | | | 0.20 | | | | 08/10/2012 | | | | 4,000,000 | | | | 3,999,800 | |
Caisse Centrale Desjardins du Quebec 144A (z) | | | 0.21 | | | | 08/03/2012 | | | | 4,000,000 | | | | 3,999,953 | |
Caisse Centrale Desjardins du Quebec 144A (z) | | | 0.22 | | | | 10/16/2012 | | | | 2,000,000 | | | | 1,999,071 | |
Caisse Centrale Desjardins du Quebec 144A (z) | | | 0.25 | | | | 09/04/2012 | | | | 4,000,000 | | | | 3,999,056 | |
Commonwealth Bank of Australia 144A (z) | | | 0.19 | | | | 10/03/2012 | | | | 5,000,000 | | | | 4,998,338 | |
Commonwealth Bank of Australia 144A (z) | | | 0.19 | | | | 08/01/2012 | | | | 11,000,000 | | | | 11,000,000 | |
DBS Bank Limited 144A (z) | | | 0.22 | | | | 09/04/2012 | | | | 2,000,000 | | | | 1,999,584 | |
DBS Bank Limited 144A (z) | | | 0.23 | | | | 08/02/2012 | | | | 4,000,000 | | | | 3,999,974 | |
DBS Bank Limited 144A (z) | | | 0.25 | | | | 08/20/2012 | | | | 10,000,000 | | | | 9,998,681 | |
DBS Bank Limited 144A (z) | | | 0.25 | | | | 08/30/2012 | | | | 3,000,000 | | | | 2,999,396 | |
DBS Bank Limited 144A (z) | | | 0.26 | | | | 09/07/2012 | | | | 3,000,000 | | | | 2,999,198 | |
DBS Bank Limited 144A (z) | | | 0.26 | | | | 09/13/2012 | | | | 9,000,000 | | | | 8,997,205 | |
DBS Bank Limited 144A (z) | | | 0.26 | | | | 10/01/2012 | | | | 3,000,000 | | | | 2,998,678 | |
DBS Bank Limited 144A (z) | | | 0.26 | | | | 10/25/2012 | | | | 10,000,000 | | | | 9,993,861 | |
DBS Bank Limited 144A (z) | | | 0.27 | | | | 10/05/2012 | | | | 16,000,000 | | | | 15,992,399 | |
DNB Nor Bank ASA 144A (z) | | | 0.31 | | | | 09/11/2012 | | | | 13,000,000 | | | | 12,995,410 | |
JPMorgan Chase & Company (z) | | | 0.28 | | | | 10/30/2012 | | | | 15,000,000 | | | | 14,989,500 | |
National Australia Funding Corporation 144A (z) | | | 0.19 | | | | 08/07/2012 | | | | 20,000,000 | | | | 19,999,392 | |
The accompanying notes are an integral part of these financial statements.
| | | | | | |
| Portfolio of Investments—July 31, 2012 (Unaudited) | | Wells Fargo Advantage Prime Investment Money Market Fund | | | 11 | |
| | | | | | | | | | | | | | | | |
| Security Name | | Interest Rate | | | Maturity Date | | | Principal | | | Value | |
| | | | | | | | | | | | | | | | |
| | | | |
| Financial Company Commercial Paper (continued) | | | | | | | | | | | | | | | | |
Nationwide Building Society 144A (z) | | | 0.55 | % | | | 10/01/2012 | | | $ | 5,000,000 | | | $ | 4,995,340 | |
Nationwide Building Society 144A (z) | | | 0.58 | | | | 10/12/2012 | | | | 5,000,000 | | | | 4,994,200 | |
Nordea North America (z) | | | 0.30 | | | | 09/07/2012 | | | | 22,000,000 | | | | 21,993,217 | |
Oversea-Chinese Banking Corporation Limited (z) | | | 0.23 | | | | 09/18/2012 | | | | 9,000,000 | | | | 8,997,240 | |
Oversea-Chinese Banking Corporation Limited (z) | | | 0.25 | | | | 08/17/2012 | | | | 8,000,000 | | | | 7,999,111 | |
Oversea-Chinese Banking Corporation Limited (z) | | | 0.25 | | | | 08/22/2012 | | | | 5,000,000 | | | | 4,999,271 | |
Oversea-Chinese Banking Corporation Limited (z) | | | 0.26 | | | | 09/06/2012 | | | | 1,000,000 | | | | 999,740 | |
Oversea-Chinese Banking Corporation Limited (z) | | | 0.26 | | | | 08/06/2012 | | | | 1,000,000 | | | | 999,964 | |
Oversea-Chinese Banking Corporation Limited (z) | | | 0.27 | | | | 09/26/2012 | | | | 5,000,000 | | | | 4,997,931 | |
Oversea-Chinese Banking Corporation Limited (z) | | | 0.27 | | | | 08/29/2012 | | | | 2,000,000 | | | | 1,999,580 | |
Oversea-Chinese Banking Corporation Limited (z) | | | 0.27 | | | | 08/30/2012 | | | | 2,000,000 | | | | 1,999,565 | |
Oversea-Chinese Banking Corporation Limited (z) | | | 0.27 | | | | 10/09/2012 | | | | 2,000,000 | | | | 1,998,965 | |
Oversea-Chinese Banking Corporation Limited (z) | | | 0.27 | | | | 10/11/2012 | | | | 5,000,000 | | | | 4,997,338 | |
Oversea-Chinese Banking Corporation Limited (z) | | | 0.30 | | | | 09/10/2012 | | | | 2,000,000 | | | | 1,999,333 | |
Principal Life Insurance 144A (z) | | | 0.20 | | | | 08/06/2012 | | | | 3,000,000 | | | | 2,999,917 | |
Principal Life Insurance 144A (z) | | | 0.20 | | | | 08/17/2012 | | | | 1,000,000 | | | | 999,911 | |
Suncorp Group Limited 144A (z) | | | 0.45 | | | | 09/13/2012 | | | | 8,000,000 | | | | 7,995,700 | |
Suncorp Group Limited 144A (z) | | | 0.45 | | | | 09/10/2012 | | | | 2,000,000 | | | | 1,999,000 | |
Suncorp Group Limited 144A (z) | | | 0.45 | | | | 09/12/2012 | | | | 2,000,000 | | | | 1,998,950 | |
Suncorp Group Limited 144A (z) | | | 0.45 | | | | 09/17/2012 | | | | 5,000,000 | | | | 4,997,063 | |
Suncorp Group Limited 144A (z) | | | 0.46 | | | | 08/09/2012 | | | | 2,000,000 | | | | 1,999,796 | |
Suncorp Group Limited 144A (z) | | | 0.46 | | | | 08/20/2012 | | | | 3,000,000 | | | | 2,999,272 | |
Suncorp Group Limited 144A (z) | | | 0.47 | | | | 08/02/2012 | | | | 5,000,000 | | | | 4,999,935 | |
Swedbank (z) | | | 0.30 | | | | 08/08/2012 | | | | 8,000,000 | | | | 7,999,533 | |
Swedbank (z) | | | 0.30 | | | | 08/09/2012 | | | | 13,000,000 | | | | 12,999,133 | |
Swedbank (z) | | | 0.30 | | | | 08/10/2012 | | | | 14,000,000 | | | | 13,998,950 | |
Swedbank (z) | | | 0.33 | | | | 09/18/2012 | | | | 1,000,000 | | | | 999,560 | |
Swedbank (z) | | | 0.42 | | | | 08/29/2012 | | | | 12,000,000 | | | | 11,996,080 | |
Swedbank (z) | | | 0.42 | | | | 09/10/2012 | | | | 10,000,000 | | | | 9,995,333 | |
Swedbank (z) | | | 0.42 | | | | 09/11/2012 | | | | 8,000,000 | | | | 7,996,173 | |
Toyota Credit Canada Incorporated (z) | | | 0.20 | | | | 09/25/2012 | | | | 4,000,000 | | | | 3,998,778 | |
Toyota Credit Canada Incorporated (z) | | | 0.20 | | | | 09/26/2012 | | | | 2,000,000 | | | | 1,999,378 | |
UOB Funding LLC (z) | | | 0.21 | | | | 08/27/2012 | | | | 6,000,000 | | | | 5,999,090 | |
UOB Funding LLC (z) | | | 0.25 | | | | 09/13/2012 | | | | 10,000,000 | | | | 9,997,014 | |
Westpac Banking Corporation 144A (z) | | | 0.26 | | | | 09/17/2012 | | | | 5,000,000 | | | | 4,998,303 | |
Westpac Securities NZ Limited 144A (z) | | | 0.30 | | | | 09/17/2012 | | | | 6,000,000 | | | | 5,997,650 | |
Westpac Securities NZ Limited 144A (z) | | | 0.30 | | | | 09/21/2012 | | | | 10,000,000 | | | | 9,995,750 | |
Westpac Securities NZ Limited 144A ± | | | 0.54 | | | | 02/22/2013 | | | | 13,000,000 | | | | 13,000,000 | |
Westpac Securities NZ Limited 144A ± | | | 0.54 | | | | 02/25/2013 | | | | 8,000,000 | | | | 8,000,000 | |
Westpac Securities NZ Limited 144A (z) | | | 0.61 | | | | 07/22/2013 | | | | 11,000,000 | | | | 11,000,000 | |
Westpac Securities NZ Limited 144A (z) | | | 0.64 | | | | 04/08/2013 | | | | 9,000,000 | | | | 9,000,707 | |
Westpac Securities NZ Limited 144A ± | | | 0.66 | | | | 04/15/2013 | | | | 5,000,000 | | | | 5,001,776 | |
| | | | |
| | | | | | | | | | | | | | | 541,867,876 | |
| | | | | | | | | | | | | | | | |
| | | | |
| Other Commercial Paper : 3.82% | | | | | | | | | | | | | | | | |
CNPC Finance 144A (z) | | | 0.38 | | | | 09/17/2012 | | | | 11,000,000 | | | | 10,994,543 | |
CNPC Finance 144A (z) | | | 0.39 | | | | 09/24/2012 | | | | 5,000,000 | | | | 4,997,075 | |
CNPC Finance 144A (z) | | | 0.42 | | | | 08/21/2012 | | | | 6,000,000 | | | | 5,998,600 | |
CNPC Finance 144A (z) | | | 0.42 | | | | 08/22/2012 | | | | 6,000,000 | | | | 5,998,530 | |
CNPC Finance 144A (z) | | | 0.42 | | | | 08/27/2012 | | | | 4,000,000 | | | | 3,998,787 | |
The accompanying notes are an integral part of these financial statements.
| | | | |
| 12 | | Wells Fargo Advantage Prime Investment Money Market Fund | | Portfolio of Investments—July 31, 2012 (Unaudited) |
| | | | | | | | | | | | | | | | |
| Security Name | | Interest Rate | | | Maturity Date | | | Principal | | | Value | |
| | | | | | | | | | | | | | | | |
| | | | |
| Other Commercial Paper (continued) | | | | | | | | | | | | | | | | |
CNPC Finance 144A (z) | | | 0.42 | % | | | 09/05/2012 | | | $ | 3,000,000 | | | $ | 2,998,775 | |
CNPC Finance 144A (z) | | | 0.42 | | | | 08/02/2012 | | | | 2,000,000 | | | | 1,999,977 | |
Coca-Cola Company 144A (z) | | | 0.16 | | | | 08/06/2012 | | | | 5,000,000 | | | | 4,999,889 | |
Coca-Cola Company 144A (z) | | | 0.16 | | | | 08/07/2012 | | | | 5,000,000 | | | | 4,999,867 | |
Coca-Cola Company 144A (z) | | | 0.22 | | | | 10/22/2012 | | | | 6,000,000 | | | | 5,996,993 | |
General Electric Company (z) | | | 0.15 | | | | 08/21/2012 | | | | 16,000,000 | | | | 15,998,667 | |
General Electric Company (z) | | | 0.15 | | | | 08/22/2012 | | | | 16,000,000 | | | | 15,998,600 | |
Louis Dreyfus Commodities LLC (z) | | | 0.42 | | | | 08/01/2012 | | | | 8,000,000 | | | | 8,000,000 | |
Louis Dreyfus Commodities LLC (z) | | | 0.55 | | | | 08/03/2012 | | | | 3,000,000 | | | | 2,999,916 | |
Louis Dreyfus Commodities LLC (z) | | | 0.55 | | | | 08/06/2012 | | | | 5,000,000 | | | | 4,999,618 | |
Toyota Motor Credit Corporation (z) | | | 0.19 | | | | 08/21/2012 | | | | 8,000,000 | | | | 7,999,156 | |
Toyota Motor Credit Corporation (z) | | | 0.20 | | | | 08/24/2012 | | | | 1,000,000 | | | | 999,872 | |
Toyota Motor Credit Corporation (z) | | | 0.20 | | | | 08/28/2012 | | | | 5,000,000 | | | | 4,999,250 | |
Toyota Motor Credit Corporation (z) | | | 0.20 | | | | 08/29/2012 | | | | 4,000,000 | | | | 3,999,378 | |
| | | | |
| | | | | | | | | | | | | | | 118,977,493 | |
| | | | | | | | | | | | | | | | |
| | | | |
Total Commercial Paper (Cost $1,279,262,494) | | | | | | | | | | | | | | | 1,279,262,494 | |
| | | | | | | | | | | | | | | | |
| | | | |
Government Agency Debt : 1.83% | | | | | | | | | | | | | | | | |
FHLB ± | | | 0.30 | | | | 02/05/2013 | | | | 6,000,000 | | | | 5,998,753 | |
FHLB ± | | | 0.31 | | | | 03/07/2013 | | | | 10,000,000 | | | | 9,998,185 | |
FHLB ± | | | 0.31 | | | | 05/09/2013 | | | | 2,000,000 | | | | 1,999,531 | |
FHLB ± | | | 0.32 | | | | 03/28/2013 | | | | 11,000,000 | | | | 10,998,493 | |
FHLB ± | | | 0.33 | | | | 05/02/2013 | | | | 5,000,000 | | | | 4,999,236 | |
FHLB ± | | | 0.34 | | | | 04/01/2013 | | | | 9,000,000 | | | | 9,000,000 | |
FHLB ± | | | 0.34 | | | | 05/17/2013 | | | | 10,000,000 | | | | 10,000,000 | |
FHLB ± | | | 0.36 | | | | 05/17/2013 | | | | 4,000,000 | | | | 4,000,000 | |
| | | | |
Total Government Agency Debt (Cost $56,994,198) | | | | | | | | | | | | | | | 56,994,198 | |
| | | | | | | | | | | | | | | | |
| | | | |
Municipal Obligations : 22.43% | | | | | | | | | | | | | | | | |
| | | | |
Alabama : 0.12% | | | | | | | | | | | | | | | | |
| | | | |
| Variable Rate Demand Note §: 0.12% | | | | | | | | | | | | | | | | |
Homewood AL Educational Building Authority (Education Revenue, Branch Banking & Trust LOC) | | | 0.15 | | | | 12/01/2043 | | | | 3,655,000 | | | | 3,655,000 | |
| | | | | | | | | | | | | | | | |
| | | | |
Alaska : 0.06% | | | | | | | | | | | | | | | | |
| | | | |
| Variable Rate Demand Note §: 0.06% | | | | | | | | | | | | | | | | |
Alaska Housing Finance Corporation Series 2006-0022 (Housing Revenue, U.S. Bank NA LOC & LIQ) | | | 0.13 | | | | 12/01/2030 | | | | 2,000,000 | | | | 2,000,000 | |
| | | | | | | | | | | | | | | | |
| | | | |
California : 2.25% | | | | | | | | | | | | | | | | |
| | | | |
| Other Municipal Debt : 0.55% | | | | | | | | | | | | | | | | |
Orange County CA Pension Obligation Series A (Miscellaneous Revenue) | | | 0.80 | | | | 11/01/2012 | | | | 3,000,000 | | | | 3,000,000 | |
Orange County CA Pension Obligation Series A (Miscellaneous Revenue) | | | 0.85 | | | | 02/01/2013 | | | | 2,000,000 | | | | 2,000,000 | |
San Francisco CA City & County Public Utilities Commission Series A2T (Utilities Revenue) | | | 0.20 | | | | 09/17/2012 | | | | 1,000,000 | | | | 1,000,000 | |
San Francisco CA City & County Public Utilities Commission (Utilities Revenue) | | | 0.20 | | | | 09/10/2012 | | | | 3,000,000 | | | | 3,000,000 | |
The accompanying notes are an integral part of these financial statements.
| | | | | | |
| Portfolio of Investments—July 31, 2012 (Unaudited) | | Wells Fargo Advantage Prime Investment Money Market Fund | | | 13 | |
| | | | | | | | | | | | | | | | |
| Security Name | | Interest Rate | | | Maturity Date | | | Principal | | | Value | |
| | | | | | | | | | | | | | | | |
| | | | |
| Other Municipal Debt (continued) | | | | | | | | | | | | | | | | |
San Francisco CA City & County Public Utilities Commission (Utilities Revenue) | | | 0.19 | % | | | 08/02/2012 | | | $ | 5,000,000 | | | $ | 5,000,000 | |
San Jose CA International Airport Series C-1 (Airport Revenue) | | | 0.47 | | | | 09/12/2012 | | | | 1,000,000 | | | | 1,000,000 | |
State of California Series 11B5 (Tax Revenue) | | | 0.18 | | | | 08/17/2012 | | | | 2,000,000 | | | | 2,000,000 | |
| | | | |
| | | | | | | | | | | | | | | 17,000,000 | |
| | | | | | | | | | | | | | | | |
| | | | |
| Variable Rate Demand Notes §: 1.70% | | | | | | | | | | | | | | | | |
California CDA Series 2554 (Miscellaneous Revenue, FSA Insured, Morgan Stanley Bank LIQ) | | | 0.23 | | | | 07/01/2047 | | | | 5,000,000 | | | | 5,000,000 | |
California HFFA Catholic Healthcare Series L (Health Revenue, Citibank NA LOC) | | | 0.19 | | | | 07/01/2033 | | | | 3,000,000 | | | | 3,000,000 | |
Loma Linda CA Hospital Loma Linda University Medical Center Series B (Health Revenue, Bank of America NA LOC) | | | 0.19 | | | | 12/01/2038 | | | | 2,000,000 | | | | 2,000,000 | |
Loma Linda CA Hospital Loma Linda University Medical Center Series B-2 (Health Revenue, Bank of America NA LOC) | | | 0.19 | | | | 12/01/2037 | | | | 5,000,000 | | | | 5,000,000 | |
Los Angeles CA TRAN JPMorgan Chase PUTTER Series 3931 (GO, JPMorgan Chase Bank LIQ) | | | 0.18 | | | | 08/12/2012 | | | | 3,000,000 | | | | 3,000,000 | |
Los Angeles CA TRAN JPMorgan Chase PUTTER Series 3965 (GO, JPMorgan Chase Bank LIQ) 144A | | | 0.18 | | | | 08/12/2012 | | | | 1,615,000 | | | | 1,615,000 | |
Newport Beach CA Hoag Memorial Hospital Series F (Health Revenue, Bank of America NA LOC) | | | 0.22 | | | | 12/01/2040 | | | | 11,000,000 | | | | 11,000,000 | |
Roseville CA Electric System Series A (Miscellaneous Revenue, Morgan Stanley Bank LOC) | | | 0.20 | | | | 02/01/2035 | | | | 3,800,000 | | | | 3,800,000 | |
San Bernardino County CA Flood Control District (Miscellaneous Revenue, Bank of America NA LOC) | | | 0.21 | | | | 08/01/2037 | | | | 4,500,000 | | | | 4,500,000 | |
San Diego CA Unified School District JPMorgan Chase PUTTER Trust Series 3934 (GO, JPMorgan Chase Bank LIQ) 144A | | | 0.18 | | | | 08/07/2012 | | | | 5,000,000 | | | | 5,000,000 | |
San Diego CA Unified School District JPMorgan Chase PUTTER Trust Series 3966 (GO, JPMorgan Chase Bank LIQ) 144A | | | 0.18 | | | | 08/12/2012 | | | | 2,000,000 | | | | 2,000,000 | |
San Francisco CA City & County Finance Corporation Moscone Center Project Series 2008 (Miscellaneous Revenue, Bank of America NA LOC) | | | 0.20 | | | | 04/01/2030 | | | | 4,000,000 | | | | 4,000,000 | |
San Francisco CA City & County RDA Notre Dame Apartments Series G (Housing Revenue, Citibank NA LOC) | | | 0.21 | | | | 12/01/2033 | | | | 985,000 | | | | 985,000 | |
San Francisco CA City & County RDA Series B001 (Miscellaneous Revenue, Morgan Stanley Bank LIQ) 144A | | | 0.29 | | | | 11/01/2041 | | | | 1,000,000 | | | | 1,000,000 | |
Westminster CA RDA Series 3009 (Tax Revenue, Assured Guaranty Insured, Morgan Stanley Bank LIQ) 144A | | | 0.23 | | | | 11/01/2045 | | | | 1,000,000 | | | | 1,000,000 | |
| | | | |
| | | | | | | | | | | | | | | 52,900,000 | |
| | | | | | | | | | | | | | | | |
| | | | |
Colorado : 0.70% | | | | | | | | | | | | | | | | |
| | | | |
| Variable Rate Demand Notes §: 0.70% | | | | | | | | | | | | | | | | |
Colorado HFA Class I Series A-2 (Housing Revenue, Royal Bank of
Canada SPA) | | | 0.16 | | | | 11/01/2026 | | | | 2,000,000 | | | | 2,000,000 | |
Colorado HFA Taxable MFHR Project B-2 (Housing Revenue, FHLB SPA) | | | 0.18 | | | | 05/01/2050 | | | | 9,720,000 | | | | 9,720,000 | |
Denver CO City & County Subseries G1 (Port Authority Revenue, Assured Guaranty Insured, Morgan Stanley Bank SPA) | | | 0.26 | | | | 11/15/2025 | | | | 1,000,000 | | | | 1,000,000 | |
Denver CO City & County Subseries G2 (Port Authority Revenue, Assured Guaranty Insured, Morgan Stanley Bank SPA) | | | 0.26 | | | | 11/15/2025 | | | | 5,000,000 | | | | 5,000,000 | |
Denver CO Public Schools Series A-4 (Education Revenue, Royal Bank of Canada LOC, AGM Insured) | | | 0.17 | | | | 12/15/2037 | | | | 4,000,000 | | | | 4,000,000 | |
| | | | |
| | | | | | | | | | | | | | | 21,720,000 | |
| | | | | | | | | | | | | | | | |
The accompanying notes are an integral part of these financial statements.
| | | | |
| 14 | | Wells Fargo Advantage Prime Investment Money Market Fund | | Portfolio of Investments—July 31, 2012 (Unaudited) |
| | | | | | | | | | | | | | | | |
| Security Name | | Interest Rate | | | Maturity Date | | | Principal | | | Value | |
| | | | | | | | | | | | | | | | |
| | | | |
District of Columbia : 0.60% | | | | | | | | | | | | | | | | |
| | | | |
| Other Municipal Debt : 0.10% | | | | | | | | | | | | | | | | |
District of Columbia Water & Sewer Authority Series C (Water & Sewer Revenue) | | | 0.20 | % | | | 09/17/2012 | | | $ | 1,000,000 | | | $ | 1,000,000 | |
Metropolitan Washington DC Airports Authority Series 1-C (Airport Revenue) | | | 0.21 | | | | 08/14/2012 | | | | 2,000,000 | | | | 2,000,000 | |
| | | | |
| | | | | | | | | | | | | | | 3,000,000 | |
| | | | | | | | | | | | | | | | |
| | | | |
| Variable Rate Demand Notes §: 0.50% | | | | | | | | | | | | | | | | |
District of Columbia George Washington University (Education Revenue, Bank of America NA LOC) | | | 0.22 | | | | 09/15/2029 | | | | 2,000,000 | | | | 2,000,000 | |
District of Columbia The Pew Charitable Trusts Series A (Miscellaneous Revenue, PNC Bank NA LOC) | | | 0.15 | | | | 04/01/2038 | | | | 1,000,000 | | | | 1,000,000 | |
Metropolitan Washington DC Airports Authority Subseries D-1 (Airport Revenue, Bank of America NA LOC) | | | 0.19 | | | | 10/01/2039 | | | | 12,570,000 | | | | 12,570,000 | |
| | | | |
| | | | | | | | | | | | | | | 15,570,000 | |
| | | | | | | | | | | | | | | | |
| | | | |
Florida : 0.41% | | | | | | | | | | | | | | | | |
| | | | |
| Variable Rate Demand Notes §: 0.41% | | | | | | | | | | | | | | | | |
Florida HEFAR Ringling College of Arts & Design Incorporated Project Series 2008 (Education Revenue, PNC Bank NA LOC) | | | 0.15 | | | | 03/01/2038 | | | | 2,865,000 | | | | 2,865,000 | |
JPMorgan Chase PUTTER Trust Series 4128 (Miscellaneous Revenue, JPMorgan Chase Bank LOC & LIQ) 144A | | | 0.22 | | | | 03/01/2021 | | | | 4,000,000 | | | | 4,000,000 | |
JPMorgan Chase PUTTER/DRIVER Trust Series 4172 (Lease Revenue) 144A | | | 0.20 | | | | 01/01/2020 | | | | 1,000,000 | | | | 1,000,000 | |
Volusia County FL Eclipse Funding Trust Series 0008 (Miscellaneous Revenue, U.S. Bank NA LOC, FSA Insured) | | | 0.14 | | | | 08/01/2013 | | | | 1,990,000 | | | | 1,990,000 | |
Volusia County FL Eclipse Funding Trust Series 0036 (Miscellaneous Revenue, U.S. Bank NA LOC, FSA Insured) | | | 0.14 | | | | 08/01/2032 | | | | 2,980,000 | | | | 2,980,000 | |
| | | | |
| | | | | | | | | | | | | | | 12,835,000 | |
| | | | | | | | | | | | | | | | |
| | | | |
Georgia : 0.38% | | | | | | | | | | | | | | | | |
| | | | |
| Variable Rate Demand Notes §: 0.38% | | | | | | | | | | | | | | | | |
Richmond County GA Development Authority (Education Revenue) | | | 0.17 | | | | 07/01/2037 | | | | 9,750,000 | | | | 9,750,000 | |
Wayne County GA IDA Rayonier Incorporated Project (IDR, Bank of America NA LOC) | | | 0.25 | | | | 05/01/2020 | | | | 2,000,000 | | | | 2,000,000 | |
| | | | |
| | | | | | | | | | | | | | | 11,750,000 | |
| | | | | | | | | | | | | | | | |
| | | | |
Illinois : 1.44% | | | | | | | | | | | | | | | | |
| | | | |
| Variable Rate Demand Notes §: 1.44% | | | | | | | | | | | | | | | | |
Chicago IL Metropolitan Water Reclamation PFOTER Series 727 (Tax Revenue, Bank of America NA LIQ) 144A | | | 0.23 | | | | 12/01/2028 | | | | 4,000,000 | | | | 4,000,000 | |
Chicago IL Series B-1 (GO, JPMorgan Chase Bank LOC) | | | 0.17 | | | | 01/01/2034 | | | | 10,355,000 | | | | 10,355,000 | |
Chicago IL Water District Eclipse Funding Trust Series 2006-A (Water & Sewer Revenue, U.S. Bank NA LOC) | | | 0.14 | | | | 05/01/2014 | | | | 2,995,000 | | | | 2,995,000 | |
Cook County IL Series D-1 (GO, Harris NA SPA) | | | 0.17 | | | | 11/01/2030 | | | | 6,400,000 | | | | 6,400,000 | |
Cook County IL Series D-2 (GO, Northern Trust Company SPA) | | | 0.17 | | | | 11/01/2030 | | | | 3,600,000 | | | | 3,600,000 | |
IIlinois Health Facilities Authority Centegra Health System Series 2002 (Health Revenue, FSA Insured, JPMorgan Chase Bank LOC) | | | 0.38 | | | | 09/01/2032 | | | | 2,000,000 | | | | 2,000,000 | |
Illinois Educational Facilities Authority Field Museum of National History (Education Revenue, Bank of America NA LOC, GO of Corporation Insured) | | | 0.27 | | | | 11/01/2032 | | | | 2,000,000 | | | | 2,000,000 | |
The accompanying notes are an integral part of these financial statements.
| | | | | | |
| Portfolio of Investments—July 31, 2012 (Unaudited) | | Wells Fargo Advantage Prime Investment Money Market Fund | | | 15 | |
| | | | | | | | | | | | | | | | |
| Security Name | | Interest Rate | | | Maturity Date | | | Principal | | | Value | |
| | | | | | | | | | | | | | | | |
| | | | |
| Variable Rate Demand Notes § (continued) | | | | | | | | | | | | | | | | |
Illinois Finance Authority Revenue University of Chicago (Education Revenue, Bank of America NA LIQ) | | | 0.13 | % | | | 07/01/2038 | | | $ | 5,795,000 | | | $ | 5,795,000 | |
Springfield IL PUTTER Series 1314 (Utilities Revenue, BHAC-CR MBIA Insured, JPMorgan Chase Bank LOC) | | | 0.16 | | | | 03/01/2014 | | | | 7,540,000 | | | | 7,540,000 | |
| | | | |
| | | | | | | | | | | | | | | 44,685,000 | |
| | | | | | | | | | | | | | | | |
| | | | |
Indiana : 0.25% | | | | | | | | | | | | | | | | |
| | | | |
| Variable Rate Demand Notes §: 0.25% | | | | | | | | | | | | | | | | |
Indiana Finance Authority Parkview Health System Obligation Group Project Series 2009 C (Health Revenue, PNC Bank NA LOC) | | | 0.15 | | | | 11/01/2039 | | | | 2,000,000 | | | | 2,000,000 | |
Indiana Finance Authority Trinity Health Credit Group Series 2008D-1 (Health Revenue) | | | 0.12 | | | | 12/01/2034 | | | | 3,000,000 | | | | 3,000,000 | |
Richmond IN Reid Hospital & Health Care Services Incorporated (Health Revenue, AGM Insured, JPMorgan Chase Bank LOC) | | | 0.18 | | | | 01/01/2040 | | | | 2,865,000 | | | | 2,865,000 | |
| | | | |
| | | | | | | | | | | | | | | 7,865,000 | |
| | | | | | | | | | | | | | | | |
| | | | |
Iowa : 0.36% | | | | | | | | | | | | | | | | |
| | | | |
| Variable Rate Demand Note §: 0.36% | | | | | | | | | | | | | | | | |
Iowa Financial Authority SFMR Series C (Housing Revenue, GNMA, FNMA Insured, FHLB SPA) | | | 0.19 | | | | 01/01/2039 | | | | 11,375,000 | | | | 11,375,000 | |
| | | | | | | | | | | | | | | | |
| | | | |
Kentucky : 0.19% | | | | | | | | | | | | | | | | |
| | | | |
| Variable Rate Demand Notes §: 0.19% | | | | | | | | | | | | | | | | |
Kentucky Housing Corporation Series M (Housing Revenue, PNC Bank
NA SPA) | | | 0.18 | | | | 01/01/2033 | | | | 2,000,000 | | | | 2,000,000 | |
Louisville & Jefferson Counties KY Sewer District JPMorgan Chase PUTTER/DRIVER Trust Series 4012 (Water & Sewer Revenue, JPMorgan Chase Bank LOC) 144A | | | 0.18 | | | | 12/12/2012 | | | | 4,000,000 | | | | 4,000,000 | |
| | | | |
| | | | | | | | | | | | | | | 6,000,000 | |
| | | | | | | | | | | | | | | | |
| | | | |
Louisiana : 0.71% | | | | | | | | | | | | | | | | |
| | | | |
| Variable Rate Demand Notes §: 0.71% | | | | | | | | | | | | | | | | |
East Baton Rouge Parish LA IDR ExxonMobil Project Series A (IDR) | | | 0.15 | | | | 08/01/2035 | | | | 3,000,000 | | | | 3,000,000 | |
East Baton Rouge Parish LA Road & Street Improvement Project Series A (Tax Revenue, JPMorgan Chase Bank LOC) | | | 0.16 | | | | 08/01/2030 | | | | 15,000,000 | | | | 15,000,000 | |
St. James Parish LA Nucor Steel LLC Project Gulf Opportunity Zone Series 2010 A-1 (IDR) | | | 0.16 | | | | 11/01/2040 | | | | 2,000,000 | | | | 2,000,000 | |
St. James Parish LA Nucor Steel LLC Project Gulf Opportunity Zone Series 2010 B-1 (IDR) | | | 0.16 | | | | 11/01/2040 | | | | 2,000,000 | | | | 2,000,000 | |
| | | | |
| | | | | | | | | | | | | | | 22,000,000 | |
| | | | | | | | | | | | | | | | |
| | | | |
Maryland : 0.29% | | | | | | | | | | | | | | | | |
| | | | |
| Variable Rate Demand Notes §: 0.29% | | | | | | | | | | | | | | | | |
Baltimore MD Package Systems Facilities (Transportation Revenue, Bank of America NA LOC) | | | 0.25 | | | | 07/01/2032 | | | | 4,705,000 | | | | 4,705,000 | |
Maryland Health & HEFAR Series D (Miscellaneous Revenue, Bank of America NA LOC) | | | 0.28 | | | | 01/01/2029 | | | | 4,440,000 | | | | 4,440,000 | |
| | | | |
| | | | | | | | | | | | | | | 9,145,000 | |
| | | | | | | | | | | | | | | | |
The accompanying notes are an integral part of these financial statements.
| | | | |
| 16 | | Wells Fargo Advantage Prime Investment Money Market Fund | | Portfolio of Investments—July 31, 2012 (Unaudited) |
| | | | | | | | | | | | | | | | |
| Security Name | | Interest Rate | | | Maturity Date | | | Principal | | | Value | |
| | | | | | | | | | | | | | | | |
| | | | |
Massachusetts : 0.63% | | | | | | | | | | | | | | | | |
| | | | |
| Variable Rate Demand Notes §: 0.63% | | | | | | | | | | | | | | | | |
Massachusetts Department of Transportation Series A6 (Transportation Revenue, GO of Commonwealth Insured, JPMorgan Chase Bank SPA) | | | 0.15 | % | | | 01/01/2029 | | | $ | 10,000,000 | | | $ | 10,000,000 | |
Massachusetts HEFA Boston University Project Series N (Education Revenue, Bank of America NA LOC) | | | 0.23 | | | | 10/01/2034 | | | | 2,590,000 | | | | 2,590,000 | |
Massachusetts Water Resources Authority Series E (Water & Sewer Revenue, GO of Authority Insured, JPMorgan Chase Bank SPA) | | | 0.16 | | | | 08/01/2037 | | | | 6,920,000 | | | | 6,920,000 | |
| | | | |
| | | | | | | | | | | | | | | 19,510,000 | |
| | | | | | | | | | | | | | | | |
| | | | |
Michigan : 0.13% | | | | | | | | | | | | | | | | |
| | | | |
| Variable Rate Demand Notes §: 0.13% | | | | | | | | | | | | | | | | |
Michigan Housing Development Authority Series A (Housing Revenue, Bank of Tokyo-Mitsubishi SPA) | | | 0.17 | | | | 04/01/2040 | | | | 3,000,000 | | | | 3,000,000 | |
University of Michigan Series B (Education Revenue, Northern Trust Company SPA) | | | 0.14 | | | | 04/01/2042 | | | | 1,000,000 | | | | 1,000,000 | |
| | | | |
| | | | | | | | | | | | | | | 4,000,000 | |
| | | | | | | | | | | | | | | | |
| | | | |
Minnesota : 0.58% | | | | | | | | | | | | | | | | |
| | | | |
| Variable Rate Demand Notes §: 0.58% | | | | | | | | | | | | | | | | |
Minnesota HFA Residential Housing Series E (Housing Revenue, GO of Agency Insured, State Street Bank & Trust Company SPA) | | | 0.21 | | | | 07/01/2038 | | | | 5,080,000 | | | | 5,080,000 | |
Minnesota HFA Residential Housing Series T (Housing Revenue, GO of Agency Insured, State Street Bank & Trust Company SPA) | | | 0.21 | | | | 07/01/2048 | | | | 8,110,000 | | | | 8,110,000 | |
Minnesota Office of Higher Education Supplemental Student Loan Program Series A (Education Revenue, U.S. Bank NA LOC) | | | 0.15 | | | | 09/01/2046 | | | | 2,000,000 | | | | 2,000,000 | |
Minnesota Office of Higher Education Supplemental Student Loan Project Series B (Education Revenue, State Street Bank & Trust Company LOC) | | | 0.16 | | | | 09/01/2046 | | | | 1,800,000 | | | | 1,800,000 | |
St. Cloud MN CentraCare Health System Series A (Health Revenue, Assured Guaranty Insured, JPMorgan Chase Bank SPA) | | | 0.38 | | | | 05/01/2042 | | | | 1,000,000 | | | | 1,000,000 | |
| | | | |
| | | | | | | | | | | | | | | 17,990,000 | |
| | | | | | | | | | | | | | | | |
| | | | |
Mississippi : 0.73% | | | | | | | | | | | | | | | | |
| | | | |
| Variable Rate Demand Notes §: 0.73% | | | | | | | | | | | | | | | | |
Mississippi Business Finance Commission Gulf Opportunity Zone Chevron USA Series D (IDR) | | | 0.16 | | | | 11/01/2035 | | | | 1,000,000 | | | | 1,000,000 | |
Mississippi Business Finance Commission Gulf Opportunity Zone Chevron USA Series A (IDR) | | | 0.16 | | | | 12/01/2030 | | | | 2,000,000 | | | | 2,000,000 | |
Mississippi Business Finance Commission Gulf Opportunity Zone Chevron USA Series H (IDR) | | | 0.16 | | | | 11/01/2035 | | | | 2,000,000 | | | | 2,000,000 | |
Mississippi Nissan Project Series A (Tax Revenue, Bank of America NA SPA) | | | 0.24 | | | | 11/01/2028 | | | | 17,640,000 | | | | 17,639,340 | |
| | | | |
| | | | | | | | | | | | | | | 22,639,340 | |
| | | | | | | | | | | | | | | | |
| | | | |
Missouri : 0.12% | | | | | | | | | | | | | | | | |
| | | | |
| Variable Rate Demand Notes §: 0.12% | | | | | | | | | | | | | | | | |
Kansas City MO Special Obligation Roe Bartle Series E (Tax Revenue, Sumitomo Mitsui Banking Corporation LOC) | | | 0.16 | | | | 04/15/2034 | | | | 3,000,000 | | | | 3,000,000 | |
The accompanying notes are an integral part of these financial statements.
| | | | | | |
| Portfolio of Investments—July 31, 2012 (Unaudited) | | Wells Fargo Advantage Prime Investment Money Market Fund | | | 17 | |
| | | | | | | | | | | | | | | | |
| Security Name | | Interest Rate | | | Maturity Date | | | Principal | | | Value | |
| | | | | | | | | | | | | | | | |
| | | | |
| Variable Rate Demand Notes § (continued) | | | | | | | | | | | | | | | | |
Missouri Development Finance Board Nelson Gallery Foundation Series A (Miscellaneous Revenue, JPMorgan Chase Bank SPA) | | | 0.17 | % | | | 12/01/2037 | | | $ | 900,000 | | | $ | 900,000 | |
| | | | |
| | | | | | | | | | | | | | | 3,900,000 | |
| | | | | | | | | | | | | | | | |
| | | | |
Nevada : 0.27% | | | | | | | | | | | | | | | | |
| | | | |
| Variable Rate Demand Note §: 0.27% | | | | | | | | | | | | | | | | |
Washoe County NV Eclipse Funding Trust Series 2006-0142 (GO, U.S. Bank NA LOC & LIQ) | | | 0.17 | | | | 03/01/2036 | | | | 8,320,000 | | | | 8,320,000 | |
| | | | | | | | | | | | | | | | |
| | | | |
New Jersey : 0.44% | | | | | | | | | | | | | | | | |
| | | | |
| Variable Rate Demand Notes §: 0.44% | | | | | | | | | | | | | | | | |
New Jersey EDA NUI Corporation Project Series A (Utilities Revenue, JPMorgan Chase Bank LOC) | | | 0.19 | | | | 06/01/2026 | | | | 3,000,000 | | | | 3,000,000 | |
New Jersey EDA Pivotal Utility Holdings Incorporated Project Series 2007 (Utilities Revenue, JPMorgan Chase Bank LOC) | | | 0.19 | | | | 06/01/2032 | | | | 10,600,000 | | | | 10,600,000 | |
| | | | |
| | | | | | | | | | | | | | | 13,600,000 | |
| | | | | | | | | | | | | | | | |
| | | | |
New Mexico : 0.03% | | | | | | | | | | | | | | | | |
| | | | |
| Variable Rate Demand Note §: 0.03% | | | | | | | | | | | | | | | | |
New Mexico Educational Authority PFOTER Series 637 (Education Revenue) | | | 0.30 | | | | 04/01/2037 | | | | 1,000,000 | | | | 1,000,000 | |
| | | | | | | | | | | | | | | | |
| | | | |
New York : 2.61% | | | | | | | | | | | | | | | | |
| | | | |
| Variable Rate Demand Notes §: 2.61% | | | | | | | | | | | | | | | | |
Metropolitan Transportation Authority New York Dedicated Tax Fund Subseries B-1 (Transportation Revenue, State Street Bank & Trust
Company LOC) | | | 0.14 | | | | 11/01/2022 | | | | 1,000,000 | | | | 1,000,000 | |
Metropolitan Transportation Authority New York Series 2002-A ROC RR-II-R-11645 (Transportation Revenue, FSA Insured, Citibank NA LIQ) 144A | | | 0.30 | | | | 11/15/2025 | | | | 4,025,000 | | | | 4,025,000 | |
Nassau County NY Health Care Corporation Series 2009 Subseries B-2 (Health Revenue, TD Bank NA LOC, County Guaranty Insured) | | | 0.14 | | | | 08/01/2029 | | | | 2,000,000 | | | | 2,000,000 | |
Nassau County NY Interim Finance Authority Series 2008-B (Tax Revenue, Sumitomo Mitsui Banking Corporation LOC) | | | 0.15 | | | | 11/15/2021 | | | | 5,500,000 | | | | 5,500,000 | |
New York City NY Housing Development Corporation Mortgage Thessalonica Court Series A (Housing Revenue, Citibank NA LOC) | | | 0.18 | | | | 01/01/2036 | | | | 3,880,000 | | | | 3,880,000 | |
New York City NY Subseries J-10 (GO, Bank of Tokyo-Mitsubishi LOC) | | | 0.13 | | | | 08/01/2027 | | | | 8,000,000 | | | | 8,000,000 | |
New York City NY Subseries L-3 (GO, Bank of America NA SPA) | | | 0.18 | | | | 04/01/2036 | | | | 6,000,000 | | | | 6,000,000 | |
New York City NY Transitional Financing Authority Series C (Tax Revenue, Morgan Stanley Bank LOC) | | | 0.25 | | | | 05/01/2028 | | | | 9,000,000 | | | | 9,000,000 | |
New York Dormitory Authority Revenue Series A (Education Revenue, JPMorgan Chase & Company SPA) | | | 0.15 | | | | 07/01/2039 | | | | 2,000,000 | | | | 2,000,000 | |
New York HFA Biltmore Tower Housing Project Series A (Housing Revenue, FNMA Insured) | | | 0.17 | | | | 05/15/2034 | | | | 5,000,000 | | | | 5,000,000 | |
New York HFA Clinto Green South Project Series A (Housing Revenue, FHLMC Insured) | | | 0.17 | | | | 11/01/2038 | | | | 2,000,000 | | | | 2,000,000 | |
New York HFA Victory Housing Project Series 2004-A (Housing Revenue, FHLMC Insured) | | | 0.17 | | | | 11/01/2033 | | | | 2,000,000 | | | | 2,000,000 | |
New York HFA West 31st Street Housing Project Series A (Housing Revenue, FNMA Insured) | | | 0.17 | | | | 05/15/2038 | | | | 10,000,000 | | | | 10,000,000 | |
New York HFA 600 West 42nd Street Series 2012-A (Housing Revenue, FNMA LIQ) | | | 0.17 | | | | 05/15/2041 | | | | 3,000,000 | | | | 3,000,000 | |
The accompanying notes are an integral part of these financial statements.
| | | | |
| 18 | | Wells Fargo Advantage Prime Investment Money Market Fund | | Portfolio of Investments—July 31, 2012 (Unaudited) |
| | | | | | | | | | | | | | | | |
| Security Name | | Interest Rate | | | Maturity Date | | | Principal | | | Value | |
| | | | | | | | | | | | | | | | |
| | | | |
| Variable Rate Demand Notes § (continued) | | | | | | | | | | | | | | | | |
New York State Housing Finance Agency Series A (Housing Revenue) | | | 0.16 | % | | | 05/15/2041 | | | $ | 5,000,000 | | | $ | 5,000,000 | |
New York State Liberty Development Corporation JPMorgan Chase PUTTER/DRIVER Trust Seres 4011Z (Port Authority Revenue, GO of Authority Insured, JPMorgan Chase Bank LIQ) 144A | | | 0.16 | | | | 06/15/2019 | | | | 2,990,000 | | | | 2,990,000 | |
New York Urban Development Corporate Revenue Series A3B (Tax Revenue, JPMorgan Chase Bank SPA) | | | 0.14 | | | | 03/15/2033 | | | | 10,000,000 | | | | 10,000,000 | |
| | | | |
| | | | | | | | | | | | | | | 81,395,000 | |
| | | | | | | | | | | | | | | | |
| | | | |
Ohio : 1.05% | | | | | | | | | | | | | | | | |
| | | | |
| Variable Rate Demand Notes §: 1.05% | | | | | | | | | | | | | | | | |
Allen County OH Catholic Healthcare Series C (Health Revenue, Union Bank NA LOC) | | | 0.15 | | | | 06/01/2034 | | | | 3,000,000 | | | | 3,000,000 | |
Lancaster OH Port Authority Gas Series 2008 (Energy Revenue, Royal Bank of Canada SPA) | | | 0.15 | | | | 05/01/2038 | | | | 24,930,000 | | | | 24,930,000 | |
Ohio HFA Mortgage Revenue (Housing Revenue, FHLB SPA) | | | 0.16 | | | | 09/01/2036 | | | | 2,000,000 | | | | 2,000,000 | |
Warren County OH Health Care Facilities Otterbein Homes Series 1998-B (Health Revenue, U.S. Bank NA LOC) | | | 0.15 | | | | 07/01/2023 | | | | 2,775,000 | | | | 2,775,000 | |
| | | | |
| | | | | | | | | | | | | | | 32,705,000 | |
| | | | | | | | | | | | | | | | |
| | | | |
Oklahoma : 0.10% | | | | | | | | | | | | | | | | |
| | | | |
| Variable Rate Demand Note §: 0.10% | | | | | | | | | | | | | | | | |
Oklahoma Turnpike Authority Series F (Transportation Revenue, JPMorgan Chase Bank SPA) | | | 0.17 | | | | 01/01/2028 | | | | 3,000,000 | | | | 3,000,000 | |
| | | | | | | | | | | | | | | | |
| | | | |
Oregon : 0.16% | | | | | | | | | | | | | | | | |
| | | | |
| Variable Rate Demand Note §: 0.16% | | | | | | | | | | | | | | | | |
Port of Portland Oregon Special Obligation Revenue Bulk Terminal (Port Authority Revenue, Canadian Imperial Bank LOC) | | | 0.16 | | | | 03/01/2036 | | | | 5,000,000 | | | | 5,000,000 | |
| | | | | | | | | | | | | | | | |
| | | | |
Pennsylvania : 0.92% | | | | | | | | | | | | | | | | |
| | | | |
| Variable Rate Demand Notes §: 0.92% | | | | | | | | | | | | | | | | |
Berks County PA Municipal Authority Royal Bank of Canada Municipal Products Incorporated Trust Certificates Series C-15 (Health Revenue, Royal Bank of Canada LOC) 144A | | | 0.15 | | | | 11/01/2012 | | | | 1,995,000 | | | | 1,995,000 | |
Montgomery County PA IDA Series 3238 (Health Revenue, FHA Insured, Morgan Stanley Bank LIQ) 144A | | | 0.23 | | | | 08/01/2030 | | | | 1,000,000 | | | | 1,000,000 | |
Pennsylvania HFA Series 94-B (Housing Revenue, GO of Agency Insured, PNC Bank NA SPA) | | | 0.17 | | | | 04/01/2027 | | | | 4,880,000 | | | | 4,880,000 | |
Pennsylvania Public School Building Authority (Education Revenue, FSA Insured, Morgan Stanley Bank LIQ) | | | 0.23 | | | | 06/01/2032 | | | | 10,000,000 | | | | 10,000,000 | |
Pennsylvania Turnpike Commission Series 2011 C-1 Royal Bank of Canada Municipal Products Incorporated Trust Series E-22 (Miscellaneous Revenue, Royal Bank of Canada LOC & LIQ) 144A | | | 0.15 | | | | 12/01/2038 | | | | 2,000,000 | | | | 2,000,000 | |
Philadelphia PA Gas Works Series E (Utilities Revenue, PNC Bank NA LOC) | | | 0.15 | | | | 08/01/2031 | | | | 2,000,000 | | | | 2,000,000 | |
Philadelphia PA Series 2005 C-2 (Airport Revenue, Royal Bank of
Canada LOC) | | | 0.15 | | | | 06/15/2025 | | | | 6,720,000 | | | | 6,720,000 | |
| | | | | | | | | | | | | | | 28,595,000 | |
| | | | | | | | | | | | | | | | |
The accompanying notes are an integral part of these financial statements.
| | | | | | |
| Portfolio of Investments—July 31, 2012 (Unaudited) | | Wells Fargo Advantage Prime Investment Money Market Fund | | | 19 | |
| | | | | | | | | | | | | | | | |
| Security Name | | Interest Rate | | | Maturity Date | | | Principal | | | Value | |
| | | | | | | | | | | | | | | | |
| | | | |
Puerto Rico : 0.13% | | | | | | | | | | | | | | | | |
| | | | |
| Variable Rate Demand Note §: 0.13% | | | | | | | | | | | | | | | | |
Puerto Rico Sales Tax Financing Corporation Series 3036 (Tax Revenue, Morgan Stanley Bank LIQ) | | | 0.17 | % | | | 08/01/2057 | | | $ | 4,000,000 | | | $ | 4,000,000 | |
| | | | | | | | | | | | | | | | |
| | | | |
Rhode Island : 0.13% | | | | | | | | | | | | | | | | |
| | | | |
| Variable Rate Demand Note §: 0.13% | | | | | | | | | | | | | | | | |
| | | | |
Narragansett RI Bay Commission Series A (Water & Sewer Revenue, RBS Citizens Bank LOC) | | | 0.14 | | | | 09/01/2034 | | | | 4,000,000 | | | | 4,000,000 | |
| | | | | | | | | | | | | | | | |
| | | | |
South Carolina : 0.55% | | | | | | | | | | | | | | | | |
| | | | |
| Other Municipal Debt : 0.32% | | | | | | | | | | | | | | | | |
South Carolina Public Service Authority Series AA (Utilities Revenue) | | | 0.19 | | | | 08/15/2012 | | | | 3,000,000 | | | | 3,000,000 | |
South Carolina Public Service Authority Series AA (Utilities Revenue) | | | 0.19 | | | | 08/21/2012 | | | | 1,000,000 | | | | 1,000,000 | |
South Carolina Public Service Authority Series AA (Utilities Revenue) | | | 0.19 | | | | 08/22/2012 | | | | 1,000,000 | | | | 1,000,000 | |
South Carolina Public Service Authority Series CC (Utilities Revenue) | | | 0.18 | | | | 08/20/2012 | | | | 1,000,000 | | | | 1,000,000 | |
South Carolina Public Service Authority Series CC (Utilities Revenue) | | | 0.18 | | | | 08/23/2012 | | | | 2,000,000 | | | | 2,000,000 | |
York County SC PCR Natural Rural Utilities Cooperative Finance Corporation Guaranteed NC Electric Membership Corporation Project Series 200B-1 (Utilities Revenue) | | | 0.45 | | | | 09/04/2012 | | | | 1,000,000 | | | | 1,000,000 | |
York County SC PCR Natural Rural Utilities Cooperative Finance Corporation Guaranteed NC Electric Membership Corporation Project Series 200B-3 (Utilities Revenue) | | | 0.45 | | | | 09/04/2012 | | | | 1,000,000 | | | | 1,000,000 | |
| | | | | | | | | | | | | | | 10,000,000 | |
| | | | | | | | | | | | | | | | |
| | | | |
| Variable Rate Demand Note §: 0.23% | | | | | | | | | | | | | | | | |
Greenville County SC School District Installment PFOTER Series 730 (Miscellaneous Revenue, Bank of America NA LIQ) 144A | | | 0.23 | | | | 12/01/2028 | | | | 7,000,000 | | | | 7,000,000 | |
| | | | | | | | | | | | | | | | |
| | | | |
South Dakota : 0.10% | | | | | | | | | | | | | | | | |
| | | | |
| Variable Rate Demand Note §: 0.10% | | | | | | | | | | | | | | | | |
| | | | |
South Dakota Housing Development Authority Series C (Housing Revenue, FHLB SPA) | | | 0.16 | | | | 05/01/2037 | | | | 3,000,000 | | | | 3,000,000 | |
| | | | | | | | | | | | | | | | |
| | | | |
Tennessee : 0.39% | | | | | | | | | | | | | | | | |
| | | | |
| Variable Rate Demand Notes §: 0.39% | | | | | | | | | | | | | | | | |
Chattanooga TN Industrial Development Board Bluecross Corporation (IDR) | | | 0.26 | | | | 01/01/2028 | | | | 2,000,000 | | | | 2,000,000 | |
Johnson City TN Health & Educational Facilities Board (Health Revenue, PNC Bank NA LOC) | | | 0.20 | | | | 07/01/2033 | | | | 7,655,000 | | | | 7,655,000 | |
Johnson City TN Health & Educational Facilities Board (Health Revenue, U.S. Bank NA LOC) | | | 0.21 | | | | 07/01/2033 | | | | 635,000 | | | | 635,000 | |
Knox County TN Health Educational & Housing Facilities Board Series A (Health Revenue, Bank of America NA LOC) | | | 0.19 | | | | 01/01/2033 | | | | 2,000,000 | | | | 2,000,000 | |
| | | | | | | | | | | | | | | 12,290,000 | |
| | | | | | | | | | | | | | | | |
| | | | |
Texas : 3.86% | | | | | | | | | | | | | | | | |
| | | | |
| Variable Rate Demand Notes §: 3.86% | | | | | | | | | | | | | | | | |
Austin TX Airport System Series A (Airport Revenue, State Street Bank & Trust Company LOC) | | | 0.17 | | | | 11/15/2017 | | | | 1,000,000 | | | | 1,000,000 | |
Brazos River Authority Texas PCR Series D-2 (Utilities Revenue, Citibank NA LOC) | | | 0.20 | | | | 05/01/2033 | | | | 2,000,000 | | | | 2,000,000 | |
The accompanying notes are an integral part of these financial statements.
| | | | |
| 20 | | Wells Fargo Advantage Prime Investment Money Market Fund | | Portfolio of Investments—July 31, 2012 (Unaudited) |
| | | | | | | | | | | | | | | | |
| Security Name | | Interest Rate | | | Maturity Date | | | Principal | | | Value | |
| | | | | | | | | | | | | | | | |
| | | | |
| Variable Rate Demand Notes § (continued) | | | | | | | | | | | | | | | | |
Harris County TX Cultural Education Facilities Finance Corporation Hermann Health Series D2 (Health Revenue, JPMorgan Chase Bank LOC) | | | 0.16 | % | | | 06/01/2029 | | | $ | 2,000,000 | | | $ | 2,000,000 | |
Mission TX Economic Development Solid Waste Disposal IESI Corporation (Miscellaneous Revenue, Bank of America NA LOC) | | | 0.24 | | | | 04/01/2022 | | | | 3,000,000 | | | | 3,000,000 | |
North Texas Tollway Authority Revenue Series D (Transportation Revenue, JPMorgan Chase Bank LOC) | | | 0.17 | | | | 01/01/2049 | | | | 6,000,000 | | | | 6,000,000 | |
Port Arthur TX Navigation District Environmental Facilities Motiva Enterprises Project Subseries 2009B (Resource Recovery Revenue) | | | 0.15 | | | | 12/01/2039 | | | | 1,000,000 | | | | 1,000,000 | |
Port Arthur TX Navigation District Environmental Facilities Motiva Enterprises Project Subseries 2009C (Resource Recovery Revenue) | | | 0.15 | | | | 12/01/2039 | | | | 2,000,000 | | | | 2,000,000 | |
Port Arthur TX Navigation District Environmental Facilities Motiva Enterprises Project Subseries 2010A (Resource Recovery Revenue) | | | 0.16 | | | | 04/01/2040 | | | | 4,000,000 | | | | 4,000,000 | |
Port Arthur TX Navigation District Environmental Facilities Motiva Enterprises Project Subseries 2010D (Resource Recovery Revenue) | | | 0.16 | | | | 11/01/2040 | | | | 8,200,000 | | | | 8,200,000 | |
Texas Municipal Gas Acquisition & Supply Corporation Series 2848 (Miscellaneous Revenue, Morgan Stanley Bank LIQ) | | | 0.45 | | | | 12/15/2026 | | | | 8,000,000 | | | | 8,000,000 | |
Texas Taxable Product Development Program Series A (GO, National Australia Bank SPA) | | | 0.21 | | | | 06/01/2045 | | | | 3,000,000 | | | | 3,000,000 | |
Texas TRAN JPMorgan Chase PUTTER Trust Series 3942 (Miscellaneous Revenue, JPMorgan Chase Bank LIQ) 144A | | | 0.18 | | | | 08/30/2012 | | | | 12,000,000 | | | | 12,000,000 | |
Texas TRAN JPMorgan Chase PUTTER Trust Series 3945 (Miscellaneous Revenue, JPMorgan Chase Bank LIQ) 144A | | | 0.18 | | | | 08/30/2012 | | | | 7,000,000 | | | | 7,000,000 | |
Texas TRAN JPMorgan Chase PUTTER Trust Series 3946 (Miscellaneous Revenue, JPMorgan Chase Bank LIQ) 144A | | | 0.18 | | | | 08/30/2012 | | | | 17,620,000 | | | | 17,620,000 | |
Texas TRAN JPMorgan Chase PUTTER Trust Series 3953 (Miscellaneous Revenue, JPMorgan Chase Bank LIQ) 144A | | | 0.18 | | | | 08/30/2012 | | | | 13,880,000 | | | | 13,880,000 | |
Texas TRAN JPMorgan Chase PUTTER Trust Series 3964 (Miscellaneous Revenue, JPMorgan Chase Bank LIQ) 144A | | | 0.18 | | | | 08/30/2012 | | | | 9,000,000 | | | | 9,000,000 | |
Texas TRAN JPMorgan Chase PUTTER Trust Series 3984 (Miscellaneous Revenue, JPMorgan Chase Bank LIQ) 144A | | | 0.18 | | | | 08/30/2012 | | | | 20,565,000 | | | | 20,565,000 | |
| | | | | | | | | | | | | | | 120,265,000 | |
| | | | | | | | | | | | | | | | |
| | | | |
Vermont : 0.16% | | | | | | | | | | | | | | | | |
| | | | |
| Variable Rate Demand Note §: 0.16% | | | | | | | | | | | | | | | | |
Vermont Educational & Health Buildings Financing Agency Norwich University Projects Series 2008 (Education Revenue, TD Bank NA LOC) | | | 0.14 | | | | 09/01/2038 | | | | 5,000,000 | | | | 5,000,000 | |
| | | | | | | | | | | | | | | | |
| | | | |
Virginia : 0.26% | | | | | | | | | | | | | | | | |
| | | | |
| Variable Rate Demand Notes §: 0.26% | | | | | | | | | | | | | | | | |
Montgomery County VA IDA Series 2009-A (Education Revenue, Bank of New York Mellon SPA) | | | 0.15 | | | | 02/01/2039 | | | | 1,000,000 | | | | 1,000,000 | |
Virginia Small Business Financing Authority Hampton University Series 2008-A (Education Revenue, PNC Bank NA LOC) | | | 0.14 | | | | 12/01/2038 | | | | 1,000,000 | | | | 1,000,000 | |
Virginia State College Building Authority (Education Revenue) | | | 0.15 | | | | 08/01/2034 | | | | 6,000,000 | | | | 6,000,000 | |
| | | | | | | | | | | | | | | 8,000,000 | |
| | | | | | | | | | | | | | | | |
| | | | |
Washington : 0.51% | | | | | | | | | | | | | | | | |
| | | | |
| Variable Rate Demand Notes §: 0.51% | | | | | | | | | | | | | | | | |
King City WA JPMorgan Chase PUTTER Trust Series 4058 (GO, JPMorgan Chase Bank LIQ) 144A | | | 0.18 | | | | 02/28/2013 | | | | 2,000,000 | | | | 2,000,000 | |
The accompanying notes are an integral part of these financial statements.
| | | | | | |
| Portfolio of Investments—July 31, 2012 (Unaudited) | | Wells Fargo Advantage Prime Investment Money Market Fund | | | 21 | |
| | | | | | | | | | | | | | | | |
| Security Name | | Interest Rate | | | Maturity Date | | | Principal | | | Value | |
| | | | | | | | | | | | | | | | |
| | | | |
| Variable Rate Demand Notes § (continued) | | | | | | | | | | | | | | | | |
Seattle WA Eclipse Funding Trust (Port Authority Revenue, U.S. Bank NA LOC) 144A | | | 0.13 | % | | | 03/01/2035 | | | $ | 2,000,000 | | | $ | 2,000,000 | |
Washington GO PUTTER Series 2640 (GO, JPMorgan Chase Bank LIQ) | | | 0.16 | | | | 01/01/2016 | | | | 9,995,000 | | | | 9,995,000 | |
Washington Housing Finance Commission Series 1430-R (Housing Revenue, GNMA, FNMA Insured, Bank of America NA SPA) | | | 0.38 | | | | 06/01/2037 | | | | 2,000,000 | | | | 2,000,000 | |
| | | | | | | | | | | | | | | 15,995,000 | |
| | | | | | | | | | | | | | | | |
| | | | |
Wisconsin : 0.67% | | | | | | | | | | | | | | | | |
| | | | |
| Variable Rate Demand Notes §: 0.67% | | | | | | | | | | | | | | | | |
Wisconsin HEFA Hess Memorial Hospital Incorporated Series 2007 (Health Revenue, U.S. Bank NA LOC) | | | 0.15 | | | | 05/01/2024 | | | | 3,390,000 | | | | 3,390,000 | |
Wisconsin Housing & EDA Home Ownership Series D (Housing Revenue, FNMA LOC, GO of Authority Insured) | | | 0.19 | | | | 09/01/2035 | | | | 2,100,000 | | | | 2,100,000 | |
Wisconsin Housing & EDA Series F (Housing Revenue, GO of Authority Insured, Bank of Nova Scotia SPA) | | | 0.23 | | | | 05/01/2030 | | | | 6,790,000 | | | | 6,790,000 | |
Wisconsin Housing & EDA Series F (Housing Revenue, GO of Authority Insured, Bank of Nova Scotia SPA) | | | 0.23 | | | | 11/01/2030 | | | | 8,585,000 | | | | 8,585,000 | |
| | | | | | | | | | | | | | | 20,865,000 | |
| | | | | | | | | | | | | | | | |
| | | | |
Wyoming : 0.14% | | | | | | | | | | | | | | | | |
| | | | |
| Variable Rate Demand Notes §: 0.14% | | | | | | | | | | | | | | | | |
Wyoming CDA (Housing Revenue, Bank of America NA SPA) | | | 0.21 | | | | 12/01/2032 | | | | 4,000,000 | | | | 4,000,000 | |
Wyoming Student Loan Corporation Series A-1 (Education Revenue, Royal Bank of Canada LOC) | | | 0.15 | | | | 06/01/2035 | | | | 290,000 | | | | 290,000 | |
| | | | | | | | | | | | | | | 4,290,000 | |
| | | | | | | | | | | | | | | | |
| | | | |
Total Municipal Obligations (Cost $697,859,340) | | | | | | | | | | | | | | | 697,859,340 | |
| | | | | | | | | | | | | | | | |
| | | | |
Other Instruments : 0.35% | | | | | | | | | | | | | | | | |
American Honda Finance Corporation 144A ± | | | 0.69 | | | | 08/28/2012 | | | | 4,000,000 | | | | 4,001,338 | |
City of Austin TX Municipal Commercial Paper (z) | | | 0.19 | | | | 08/09/2012 | | | | 2,000,000 | | | | 1,999,916 | |
District of Columbia Multimodal Revenue Variable Rate Demand Note | | | 0.18 | | | | 08/16/2012 | | | | 1,000,000 | | | | 1,000,000 | |
Oakland-Alameda County Series A-2 Commercial Paper | | | 0.23 | | | | 09/05/2012 | | | | 3,000,000 | | | | 3,000,000 | |
University of Chicago Series A Municipal Commercial Paper (z) | | | 0.18 | | | | 08/15/2012 | | | | 1,000,000 | | | | 999,930 | |
| | | | |
Total Other Instruments (Cost $11,001,184) | | | | | | | | | | | | | | | 11,001,184 | |
| | | | | | | | | | | | | | | | |
| | | | |
Other Notes : 1.29% | | | | | | | | | | | | | | | | |
| | | | |
| Corporate Bonds and Notes : 1.29% | | | | | | | | | | | | | | | | |
JPMorgan Chase & Company ± | | | 0.62 | | | | 11/01/2012 | | | | 5,000,000 | | | | 5,002,892 | |
JPMorgan Chase & Company ± | | | 0.97 | | | | 09/21/2012 | | | | 6,000,000 | | | | 6,004,170 | |
JPMorgan Chase & Company ± | | | 1.12 | | | | 02/26/2013 | | | | 3,000,000 | | | | 3,007,937 | |
JPMorgan Chase Bank NA ± | | | 0.37 | | | | 11/21/2012 | | | | 3,000,000 | | | | 3,000,668 | |
JPMorgan Chase Bank NA ± | | | 0.49 | | | | 11/16/2012 | | | | 1,000,000 | | | | 1,000,000 | |
JPMorgan Chase Bank NA ± | | | 0.53 | | | | 01/18/2013 | | | | 8,000,000 | | | | 7,999,259 | |
Toyota Motor Credit Corporation ± | | | 0.53 | | | | 07/19/2013 | | | | 14,000,000 | | | | 14,000,000 | |
| | | | |
Total Other Notes (Cost $40,014,926) | | | | | | | | | | | | | | | 40,014,926 | |
| | | | | | | | | | | | | | | | |
| | | | |
Repurchase Agreements ^^: 10.73% | | | | | | | | | | | | | | | | |
Citigroup Global Markets, dated 07/31/2012, maturity value
$41,000,205 (1) | | | 0.18 | | | | 08/01/2012 | | | | 41,000,000 | | | | 41,000,000 | |
Goldman Sachs & Company, dated 07/31/2012, maturity value
$48,000, 240 (2) | | | 0.18 | | | | 08/01/2012 | | | | 48,000,000 | | | | 48,000,000 | |
The accompanying notes are an integral part of these financial statements.
| | | | |
| 22 | | Wells Fargo Advantage Prime Investment Money Market Fund | | Portfolio of Investments—July 31, 2012 (Unaudited) |
| | | | | | | | | | | | | | | | |
| Security Name | | Interest Rate | | | Maturity Date | | | Principal | | | Value | |
| | | | | | | | | | | | | | | | |
| | | | |
| Repurchase Agreements (continued) | | | | | | | | | | | | | | | | |
Merrill Pierce Fenner Smith, dated 07/31/2012, maturity value $14,700,078 (3) | | | 0.19 | % | | | 08/01/2012 | | | $ | 14,700,000 | | | $ | 14,700,000 | |
Morgan Stanley & Company, dated 07/31/2012, maturity value $24,000,167 (4) | | | 0.25 | | | | 08/01/2012 | | | | 24,000,000 | | | | 24,000,000 | |
Societe Generale (New York), dated 07/31/2012, maturity value $53,000,280 (5) | | | 0.19 | | | | 08/01/2012 | | | | 53,000,000 | | | | 53,000,000 | |
UBS Securities LLC, dated 07/31/2012, maturity value $30,000,133 (6) | | | 0.16 | | | | 08/01/2012 | | | | 30,000,000 | | | | 30,000,000 | |
UBS Securities LLC, dated 07/31/2012, maturity value $94,233,224 (7) | | | 0.19 | | | | 08/01/2012 | | | | 94,232,727 | | | | 94,232,727 | |
UBS Securities LLC, dated 07/31/2012, maturity value $29,000,185 (8) | | | 0.23 | | | | 08/01/2012 | | | | 29,000,000 | | | | 29,000,000 | |
| | | | |
Total Repurchase Agreements (Cost $333,932,727) | | | | | | | | | | | | | | | 333,932,727 | |
| | | | | | | | | | | | | | | | |
| | | | |
Treasury Debt : 2.67% | | | | | | | | | | | | | | | | |
U.S. Treasury Bill (z) | | | 0.13 | | | | 08/23/2012 | | | | 41,000,000 | | | | 40,996,924 | |
U.S. Treasury Bill (z) | | | 0.14 | | | | 10/04/2012 | | | | 9,000,000 | | | | 8,997,744 | |
U.S. Treasury Bill (z) | | | 0.14 | | | | 08/30/2012 | | | | 23,000,000 | | | | 22,997,345 | |
U.S. Treasury Bill (z) | | | 0.15 | | | | 10/11/2012 | | | | 10,000,000 | | | | 9,997,136 | |
| | | | |
Total Treasury Debt (Cost $82,989,149) | | | | | | | | | | | | | | | 82,989,149 | |
| | | | | | | | | | | | | | | | |
| | | | | | | | |
| | |
| Total Investments in Securities | | | | | | | | |
| (Cost $3,110,066,884) * | | | 99.95 | % | | | 3,110,066,884 | |
Other Assets and Liabilities, Net | | | 0.05 | | | | 1,520,827 | |
| | | | | | | | |
| | |
Total Net Assets | | | 100.00 | % | | $ | 3,111,587,711 | |
| | | | | | | | |
| ± | Variable rate investment |
| 144A | Security that may be resold to “qualified institutional buyers” under Rule 144A or security offered pursuant to Section 4(2) of the Securities Act of 1933, as amended. |
| (z) | Zero coupon security. Rate represents yield to maturity at time of purchase. |
| § | These securities are subject to a demand feature which reduces the effective maturity. |
| (1) | U.S. government securities, 2.65% to 5.50%, 3/1/2017 to 7/1/2042, fair value including accrued interest is $42,230,000. |
| (2) | U.S. government securities, 2.50% to 7.00%, 8/1/2013 to 8/1/2042, fair value including accrued interest is $49,440,141. |
| (3) | U.S. government securities, 4.50% to 7.00%, 10/1/2038 to 7/1/2042, fair value including accrued interest is $15,141,000. |
| (4) | U.S. government securities, 2.50% to 6.00%, 5/1/2020 to 7/1/2042, fair value including accrued interest is $24,720,035. |
| (5) | U.S. government securities, 1.125% to 1.50%, 6/30/2016 to 1/15/2021, fair value including accrued interest is $54,590,000. |
| (6) | U.S. government securities, 4.50%, 7/20/2041 to 8/20/2041, fair value including accrued interest is $30,600,008. |
| (7) | U.S. government securities, 1.69% to 6.42%, 7/1/2017 to 5/1/2042, fair value including accrued interest is $97,053,498. |
| (8) | U.S. government securities, 0.00% to 6.91%, 12/12/2014 to 4/1/2050, fair value including accrued interest is $29,870,000. |
| * | Cost for federal income tax purposes is substantially the same as for financial reporting purposes. |
The accompanying notes are an integral part of these financial statements.
| | | | | | |
| Statement of Assets and Liabilities—July 31, 2012 (Unaudited) | | Wells Fargo Advantage Prime Investment Money Market Fund | | | 23 | |
| | | | |
| | | | |
| |
Assets | | | | |
Investments | | | | |
In unaffiliated securities, at amortized cost | | $ | 2,776,134,157 | |
In repurchase agreements, at amortized cost | | | 333,932,727 | |
| | | | |
Total investments, at amortized cost | | | 3,110,066,884 | |
| | | | |
| |
Cash | | | 40,606 | |
Receivable for investments sold | | | 14,586,117 | |
Receivable for interest | | | 686,561 | |
Receivable from adviser | | | 130,523 | |
Prepaid expenses and other assets | | | 67,008 | |
| | | | |
Total assets | | | 3,125,577,699 | |
| | | | |
| |
Liabilities | | | | |
Dividends payable | | | 83,716 | |
Payable for investments purchased | | | 12,996,984 | |
Due to related parties | | | 402,877 | |
Accrued expenses and other liabilities | | | 506,411 | |
| | | | |
Total liabilities | | | 13,989,988 | |
| | | | |
Total net assets | | $ | 3,111,587,711 | |
| | | | |
| |
NET ASSETS CONSIST OF | | | | |
Paid-in capital | | $ | 3,111,573,481 | |
Undistributed net investment income | | | 1,278 | |
Accumulated net realized gains on investments | | | 12,952 | |
| | | | |
Total net assets | | $ | 3,111,587,711 | |
| | | | |
| |
COMPUTATION OF NET ASSET VALUE PER SHARE1 | | | | |
Net assets – Institutional Class | | $ | 2,479,631,827 | |
Shares outstanding – Institutional Class | | | 2,479,627,485 | |
Net asset value per share – Institutional Class | | | $1.00 | |
Net assets – Service Class | | $ | 631,955,884 | |
Shares outstanding – Service Class | | | 631,953,458 | |
Net asset value per share – Service Class | | | $1.00 | |
| 1. | The Fund has an unlimited number of authorized shares. |
The accompanying notes are an integral part of these financial statements.
| | | | |
| 24 | | Wells Fargo Advantage Prime Investment Money Market Fund | | Statement of Operations—Six Months Ended July 31, 2012 (Unaudited) |
| | | | |
| | | | |
| |
Investment income | | | | |
Interest | | $ | 3,784,845 | |
| | | | |
| |
Expenses | | | | |
Advisory fee | | | 1,698,887 | |
Administration fees | | | | |
Fund level | | | 845,739 | |
Institutional Class | | | 1,006,850 | |
Service Class | | | 528,420 | |
Shareholder servicing fees | | | | |
Service Class | | | 1,100,876 | |
Custody and accounting fees | | | 73,093 | |
Professional fees | | | 8,173 | |
Registration fees | | | 9,526 | |
Shareholder report expenses | | | 5,100 | |
Trustees’ fees and expenses | | | 4,462 | |
Other fees and expenses | | | 45,581 | |
| | | | |
Total expenses | | | 5,326,707 | |
Less: Fee waivers and/or expense reimbursements | | | (1,919,831 | ) |
| | | | |
Net expenses | | | 3,406,876 | |
| | | | |
Net investment income | | | 377,969 | |
| | | | |
Net realized gains on investments | | | 11,319 | |
| | | | |
Net increase in net assets resulting from operations | | $ | 389,288 | |
| | | | |
The accompanying notes are an integral part of these financial statements.
| | | | | | |
| Statement of Changes in Net Assets | | Wells Fargo Advantage Prime Investment Money Market Fund | | | 25 | |
| | | | | | | | | | | | | | | | |
| | | Six Months Ended July 31, 2012 (Unaudited) | | | Year Ended January 31, 2012 | |
| | | | |
Operations | | | | | | | | | | | | | | | | |
Net investment income | | | | | | $ | 377,969 | | | | | | | $ | 2,207,992 | |
Net realized gains on investments | | | | | | | 11,319 | | | | | | | | 70,709 | |
| | | | | | | | | | | | | | | | |
Net increase in net assets resulting from operations | | | | | | | 389,288 | | | | | | | | 2,278,701 | |
| | | | | | | | | | | | | | | | |
| | | | |
Distributions to shareholders from | | | | | | | | | | | | | | | | |
Net investment income | | | | | | | | | | | | | | | | |
Institutional Class | | | | | | | (333,814 | ) | | | | | | | (2,124,098 | ) |
Service Class | | | | | | | (44,155 | ) | | | | | | | (83,894 | ) |
Net realized gains | | | | | | | | | | | | | | | | |
Institutional Class | | | | | | | 0 | | | | | | | | (96,132 | ) |
Service Class | | | | | | | 0 | | | | | | | | (22,124 | ) |
| | | | | | | | | | | | | | | | |
Total distributions to shareholders | | | | | | | (377,969 | ) | | | | | | | (2,326,248 | ) |
| | | | | | | | | | | | | | | | |
| | | | |
Capital share transactions | | | Shares | | | | | | | | Shares | | | | | |
Proceeds from shares sold | | | | | | | | | | | | | | | | |
Institutional Class | | | 7,154,705,053 | | | | 7,154,705,053 | | | | 25,396,197,861 | | | | 25,396,197,861 | |
Service Class | | | 26,651,166,635 | | | | 26,651,166,635 | | | | 45,468,215,349 | | | | 45,468,215,349 | |
| | | | | | | | | | | | | | | | |
| | | | | | | 33,805,871,688 | | | | | | | | 70,864,413,210 | |
| | | | | | | | | | | | | | | | |
Reinvestment of distributions | | | | | | | | | | | | | | | | |
Institutional Class | | | 116,468 | | | | 116,468 | | | | 670,408 | | | | 670,408 | |
Service Class | | | 824 | | | | 824 | | | | 5,413 | | | | 5,413 | |
| | | | | | | | | | | | | | | | |
| | | | | | | 117,292 | | | | | | | | 675,821 | |
| | | | | | | | | | | | | | | | |
Payment for shares redeemed | | | | | | | | | | | | | | | | |
Institutional Class | | | (7,914,780,374 | ) | | | (7,914,780,374 | ) | | | (27,099,580,029 | ) | | | (27,099,580,029 | ) |
Service Class | | | (26,643,722,505 | ) | | | (26,643,722,505 | ) | | | (45,699,276,109 | ) | | | (45,699,276,109 | ) |
| | | | | | | | | | | | | | | | |
| | | | | | | (34,558,502,879 | ) | | | | | | | (72,798,856,138 | ) |
| | | | | | | | | | | | | | | | |
Net decrease in net assets resulting from capital share transactions | | | | | | | (752,513,899 | ) | | | | | | | (1,933,767,107 | ) |
| | | | | | | | | | | | | | | | |
Total decrease in net assets | | | | | | | (752,502,580 | ) | | | | | | | (1,933,814,654 | ) |
| | | | | | | | | | | | | | | | |
| | | | |
Net assets | | | | | | | | | | | | | | | | |
Beginning of period | | | | | | | 3,864,090,291 | | | | | | | | 5,797,904,945 | |
| | | | | | | | | | | | | | | | |
End of period | | | | | | $ | 3,111,587,711 | | | | | | | $ | 3,864,090,291 | |
| | | | | | | | | | | | | | | | |
Undistributed net investment income | | | | | | $ | 1,278 | | | | | | | $ | 1,278 | |
| | | | | | | | | | | | | | | | |
The accompanying notes are an integral part of these financial statements.
| | | | |
| 26 | | Wells Fargo Advantage Prime Investment Money Market Fund | | Financial Highlights |
(For a share outstanding throughout each period)
| | | | | | | | | | | | | | | | | | | | | | | | | | | | |
| | | Six Months Ended July 31, 2012 (Unaudited) | | | Year Ended January 31, | | | Year Ended February 28, | |
| Institutional Class | | | 2012 | | | 20111 | | | 2010 | | | 2009 | | | 20082 | | | 2007 | |
Net asset value, beginning of period | | $ | 1.00 | | | $ | 1.00 | | | $ | 1.00 | | | $ | 1.00 | | | $ | 1.00 | | | $ | 1.00 | | | $ | 1.00 | |
Net investment income | | | 0.00 | 3 | | | 0.00 | 3 | | | 0.00 | 3 | | | 0.00 | 3 | | | 0.02 | | | | 0.05 | | | | 0.05 | |
Net realized gains on investments | | | 0.00 | 3 | | | 0.00 | 3 | | | 0.00 | 3 | | | 0.00 | 3 | | | 0.00 | | | | 0.00 | | | | 0.00 | |
| | | | | | | | | | | | | | | | | | | | | | | | | | | | |
Total from investment operations | | | 0.00 | 3 | | | 0.00 | 3 | | | 0.00 | 3 | | | 0.00 | 3 | | | 0.02 | | | | 0.05 | | | | 0.05 | |
Distributions to shareholders from | | | | | | | | | | | | | | | | | | | | | | | | | | | | |
Net investment income | | | (0.00 | )3 | | | (0.00 | )3 | | | (0.00 | )3 | | | (0.00 | )3 | | | (0.02 | ) | | | (0.05 | ) | | | (0.05 | ) |
Net realized gains | | | 0.00 | | | | (0.00 | )3 | | | (0.00 | )3 | | | (0.00 | )3 | | | (0.00 | )3 | | | 0.00 | | | | 0.00 | |
| | | | | | | | | | | | | | | | | | | | | | | | | | | | |
Total distributions to shareholders | | | (0.00 | )3 | | | (0.00 | )3 | | | (0.00 | )3 | | | (0.00 | )3 | | | (0.02 | ) | | | (0.05 | ) | | | (0.05 | ) |
Net asset value, end of period | | $ | 1.00 | | | $ | 1.00 | | | $ | 1.00 | | | $ | 1.00 | | | $ | 1.00 | | | $ | 1.00 | | | $ | 1.00 | |
Total return4 | | | 0.01 | % | | | 0.05 | % | | | 0.13 | % | | | 0.30 | % | | | 2.22 | % | | | 4.99 | % | | | 5.10 | % |
Ratios to average net assets (annualized) | | | | | | | | | | | | | | | | | | | | | | | | | | | | |
Gross expenses | | | 0.24 | % | | | 0.24 | % | | | 0.24 | % | | | 0.27 | % | | | 0.28 | % | | | 0.25 | % | | | 0.26 | % |
Net expenses | | | 0.20 | % | | | 0.20 | % | | | 0.20 | % | | | 0.22 | % | | | 0.23 | % | | | 0.20 | % | | | 0.20 | % |
Net investment income | | | 0.03 | % | | | 0.06 | % | | | 0.13 | % | | | 0.29 | % | | | 2.13 | % | | | 4.87 | % | | | 5.06 | % |
Supplemental data | | | | | | | | | | | | | | | | | | | | | | | | | | | | |
Net assets, end of period (000’s omitted) | | | $2,479,632 | | | | $3,239,581 | | | | $4,942,329 | | | | $10,124,807 | | | | $9,422,441 | | | | $7,525,254 | | | | $7,088,329 | |
| 1. | For the eleven months ended January 31, 2011. The Fund changed its fiscal year end from February 28 to January 31, effective January 31, 2011. |
| 2. | Year ended February 29. |
| 3. | Amount is less than $0.005. |
| 4. | Returns for periods of less than one year are not annualized. |
The accompanying notes are an integral part of these financial statements.
| | | | | | |
| Financial Highlights | | Wells Fargo Advantage Prime Investment Money Market Fund | | | 27 | |
(For a share outstanding throughout each period)
| | | | | | | | | | | | | | | | | | | | | | | | | | | | |
| | | Six Months Ended
July 31, 2012 (Unaudited) | | | Year Ended January 31, | | | Year Ended February 28, | |
| Service Class | | | 2012 | | | 20111 | | | 2010 | | | 2009 | | | 20082 | | | 2007 | |
Net asset value, beginning of period | | $ | 1.00 | | | $ | 1.00 | | | $ | 1.00 | | | $ | 1.00 | | | $ | 1.00 | | | $ | 1.00 | | | $ | 1.00 | |
Net investment income | | | 0.00 | 3 | | | 0.00 | 3 | | | 0.00 | 3 | | | 0.00 | 3 | | | 0.02 | | | | 0.05 | | | | 0.05 | |
Net realized gains on investments | | | 0.00 | 3 | | | 0.00 | 3 | | | 0.00 | 3 | | | 0.00 | 3 | | | 0.00 | | | | 0.00 | | | | 0.00 | |
| | | | | | | | | | | | | | | | | | | | | | | | | | | | |
Total from investment operations | | | 0.00 | 3 | | | 0.00 | 3 | | | 0.00 | 3 | | | 0.00 | 3 | | | 0.02 | | | | 0.05 | | | | 0.05 | |
Distributions to shareholders from | | | | | | | | | | | | | | | | | | | | | | | | | | | | |
Net investment income | | | (0.00 | )3 | | | (0.00 | )3 | | | (0.00 | )3 | | | (0.00 | )3 | | | (0.02 | ) | | | (0.05 | ) | | | (0.05 | ) |
Net realized gains | | | 0.00 | | | | (0.00 | )3 | | | (0.00 | )3 | | | (0.00 | )3 | | | (0.00 | )3 | | | 0.00 | | | | 0.00 | |
| | | | | | | | | | | | | | | | | | | | | | | | | | | | |
Total distributions to shareholders | | | (0.00 | )3 | | | (0.00 | )3 | | | (0.00 | )3 | | | (0.00 | )3 | | | (0.02 | ) | | | (0.05 | ) | | | (0.05 | ) |
Net asset value, end of period | | $ | 1.00 | | | $ | 1.00 | | | $ | 1.00 | | | $ | 1.00 | | | $ | 1.00 | | | $ | 1.00 | | | $ | 1.00 | |
Total return4 | | | 0.00 | % | | | 0.01 | % | | | 0.01 | % | | | 0.07 | % | | | 1.87 | % | | | 4.63 | % | | | 4.74 | % |
Ratios to average net assets (annualized) | | | | | | | | | | | | | | | | | | | | | | | | | | | | |
Gross expenses | | | 0.53 | % | | | 0.53 | % | | | 0.53 | % | | | 0.56 | % | | | 0.57 | % | | | 0.55 | % | | | 0.55 | % |
Net expenses | | | 0.21 | % | | | 0.24 | % | | | 0.33 | % | | | 0.45 | % | | | 0.57 | % | | | 0.55 | % | | | 0.55 | % |
Net investment income | | | 0.01 | % | | | 0.01 | % | | | 0.01 | % | | | 0.06 | % | | | 1.83 | % | | | 4.55 | % | | | 4.64 | % |
Supplemental data | | | | | | | | | | | | | | | | | | | | | | | | | | | | |
Net assets, end of period (000’s omitted) | | | $631,956 | | | | $624,509 | | | | $855,576 | | | | $900,490 | | | | $1,226,787 | | | | $1,402,557 | | | | $1,190,293 | |
| 1. | For the eleven months ended January 31, 2011. The Fund changed its fiscal year end from February 28 to January 31, effective January 31, 2011. |
| 2. | Year ended February 29. |
| 3. | Amount is less than $0.005. |
| 4. | Returns for periods of less than one year are not annualized. |
The accompanying notes are an integral part of these financial statements.
| | | | |
| 28 | | Wells Fargo Advantage Prime Investment Money Market Fund | | Notes to Financial Statements (Unaudited) |
1. ORGANIZATION
Wells Fargo Funds Trust (the “Trust”), a Delaware statutory trust organized on March 10, 1999, is an open-end management investment company registered under the Investment Company Act of 1940, as amended (the “1940 Act”). These financial statements report on Wells Fargo Advantage Prime Investment Money Market Fund (the “Fund”) which is a diversified series of the Trust.
2. SIGNIFICANT ACCOUNTING POLICIES
The following significant accounting policies, which are consistently followed in the preparation of the financial statements of the Fund, are in conformity with U.S. generally accepted accounting principles which require management to make estimates and assumptions that affect the reported amounts of assets and liabilities, disclosure of contingent assets and liabilities at the date of the financial statements, and the reported amounts of revenues and expenses during the reporting period. Actual results could differ from those estimates.
Securities valuation
As permitted under Rule 2a-7 of the 1940 Act, portfolio securities are valued at amortized cost, which approximates fair value. The amortized cost method involves valuing a security at its cost, plus accretion of discount or minus amortization of premium over the period until maturity.
Investments which are not valued using the method discussed above are valued at their fair value, as determined by procedures established in good faith and approved by the Board of Trustees. The Board of Trustees has established a Valuation Committee comprised of the Trustees and has delegated to it the authority to take any actions regarding the valuation of portfolio securities that the Valuation Committee deems necessary to determining the fair value of portfolio securities, unless the responsibility has been delegated to the Management Valuation Team of Wells Fargo Funds Management, LLC (“Funds Management”). The Board of Trustees retains the authority to make or ratify any valuation decisions or approve any changes to the Valuation Procedures as it deems appropriate. On a quarterly basis, the Board of Trustees considers for ratification any valuation actions taken by the Valuation Committee or the Management Valuation Team.
Valuations of fair valued prices are compared to the next actual sales price when available, or other appropriate market information to assess the continued appropriateness of the fair valuation methodology used. The securities are fair valued on a day-to-day basis, taking into consideration changes to appropriate market information and any significant changes to the input factors considered in the valuation process until there is a readily available price provided on the exchange or by an independent pricing service. Valuations received from an independent pricing service or broker quotes are periodically validated by comparisons to most recent trades and valuations provided by other independent pricing services in addition to the review of prices by the adviser and/or sub-adviser. Unobservable inputs used in determining fair valuations are identified based on the type of security, taking into consideration factors utilized by market participants in valuing the investment, knowledge about the issuer and the current market environment.
Repurchase agreements
The Fund may invest in repurchase agreements and may participate in pooled repurchase agreement transactions with other funds advised by Funds Management. The repurchase agreements must be fully collateralized based on values that are marked-to- market daily. The collateral may be held by an agent bank under a tri-party agreement. It is the custodian’s responsibility to value collateral daily and to take action to obtain additional collateral as necessary to maintain market value equal to or greater than the resale price. The repurchase agreements are collateralized by instruments such as U.S. Treasury, federal agency, or high-grade corporate obligations. There could be potential loss to the Fund in the event that the Fund is delayed or prevented from exercising its rights to dispose of the collateral, including the risk of a possible decline in the value of the underlying obligations during the period in which the Fund seeks to assert its rights.
Security transactions and income recognition
Securities transactions are recorded on a trade date basis. Realized gains or losses are reported on the basis of identified cost of securities delivered.
Interest income is accrued daily and bond discounts are accreted and premiums are amortized daily based on the effective interest method. To the extent debt obligations are placed on non-accrual status, any related interest income
| | | | | | |
| Notes to Financial Statements (Unaudited) | | Wells Fargo Advantage Prime Investment Money Market Fund | | | 29 | |
may be reduced by writing off interest receivables when the collection of all or a portion of interest has become doubtful based on consistently applied procedures. If the issuer subsequently resumes interest payments or when the collectability of interest is reasonably assured, the debt obligation is removed from non-accrual status.
Distributions to shareholders
Distributions to shareholders from net investment income are accrued daily and paid monthly. Distributions from net realized gains, if any, are recorded on the ex-dividend date. Such distributions are determined in conformity with income tax regulations, which may differ from generally accepted accounting principles.
Federal and other taxes
The Fund intends to continue to qualify as a regulated investment company by distributing substantially all of its investment company taxable income and any net realized capital gains (after reduction for capital loss carryforwards) sufficient to relieve it from all, or substantially all, federal income taxes. Accordingly, no provision for federal income taxes was required.
The Fund’s income and federal excise tax returns and all financial records supporting those returns for the prior three fiscal years are subject to examination by the federal and Delaware revenue authorities. Management has analyzed the Fund’s tax positions taken on federal, state, and foreign tax returns for all open tax years and does not believe that there are any uncertain tax positions that require recognition of a tax liability.
Class allocations
The separate classes of shares offered by the Fund differ principally in shareholder servicing and administration fees. Shareholders of each class bear certain expenses that pertain to that particular class. All shareholders bear the common expenses of the Fund, earn income from the portfolio, and are allocated any unrealized gains and losses pro rata based on the average daily net assets of each class, without distinction between share classes. Dividends are determined separately for each class based on income and expenses allocable to each class. Realized gains and losses are allocated to each class pro rata based upon the net assets of each class on the date realized. Differences in per share dividend rates generally result from the relative weightings of pro rata income and realized gain allocations and from differences in separate class expenses, including shareholder servicing and administration fees.
3. FAIR VALUATION MEASUREMENTS
Fair value measurements of investments are determined within a framework that has established a fair value hierarchy based upon the various data inputs utilized in determining the value of the Fund’s investments. The three-level hierarchy gives the highest priority to unadjusted quoted prices in active markets for identical assets or liabilities (Level 1) and the lowest priority to significant unobservable inputs (Level 3). The Fund’s investments are classified within the fair value hierarchy based on the lowest level of input that is significant to the fair value measurement. The inputs are summarized into three broad levels as follows:
| n | | Level 1 – quoted prices in active markets for identical securities |
| n | | Level 2 – other significant observable inputs (including quoted prices for similar securities, interest rates, prepayment speeds, credit risk, etc.) |
| n | | Level 3 – significant unobservable inputs (including the Fund’s own assumptions in determining the fair value of investments) |
The inputs or methodologies used for valuing securities are not necessarily an indication of the risk associated with investing in those securities.
At July 31, 2012, all of the Fund’s investments in securities carried at fair value were designated as Level 2 since the primary inputs include credit quality of the issuer and short-term interest rates which are observable.
Further details on the major security types can be found in the Portfolio of Investments.
Transfers in and transfers out are recognized at the end of the reporting period. For the six months ended July 31, 2012, the Fund did not have any transfers into/out of Level 1 and Level 2.
| | | | |
| 30 | | Wells Fargo Advantage Prime Investment Money Market Fund | | Notes to Financial Statements (Unaudited) |
4. TRANSACTIONS WITH AFFILIATES AND OTHER EXPENSES
Advisory fee
The Trust has entered into an advisory contract with Funds Management, an indirect wholly owned subsidiary of Wells Fargo & Company (“Wells Fargo”). The adviser is responsible for implementing investment policies and guidelines and for supervising the sub-adviser, who is responsible for day-to-day portfolio management of the Fund.
Pursuant to the contract, Funds Management is entitled to receive an annual rate of 0.10% of the Fund’s average daily net assets.
Funds Management has retained the services of a sub-adviser to provide daily portfolio management to the Fund. The fee for sub-advisory services is borne by Funds Management. Wells Capital Management Incorporated, an affiliate of Funds Management, is the sub-adviser to the Fund and is entitled to receive a fee from Funds Management at an annual rate starting at 0.05% and declining to 0.01% as the average daily net assets of the Fund increase.
Administration and transfer agent fees
The Trust has entered into an administration agreement with Funds Management. Under this agreement, for providing administrative services, which includes paying fees and expenses for services provided by the transfer agent, sub-transfer agents, omnibus account servicers and record-keepers, Funds Management is entitled to receive from the Fund an annual fund level administration fee starting at 0.05% and declining to 0.03% as the average daily net assets of the Fund increase and a class level administration fee which is calculated based on the average daily net assets of each class as follows:
| | | | |
| | | Class Level Administration Fee | |
Institutional Class | | | 0.08 | % |
Service Class | | | 0.12 | |
Funds Management has contractually waived and/or reimbursed advisory and administration fees to the extent necessary to maintain certain net operating expense ratios for the Fund. Waiver of fees and/or reimbursement of expenses by Funds Management were made first from fund level expenses on a proportionate basis and then from class specific expenses. Funds Management has committed through May 31, 2013 to waive fees and/or reimburse expenses to the extent necessary to cap the Fund’s expenses at 0.20% for Institutional Class and 0.55% for Service Class.
Shareholder servicing fees
The Trust has entered into contracts with one or more shareholder servicing agents, whereby Service Class of the Fund is charged a fee at an annual rate of 0.25% of its average daily net assets.
A portion of these total shareholder servicing fees were paid to affiliates of Wells Fargo.
5. INDEMNIFICATION
Under the Trust’s organizational documents, the officers and directors are indemnified against certain liabilities that may arise out of performance of their duties to the Trust. Additionally, in the normal course of business, the Trust may enter into contracts with service providers that contain a variety of indemnification clauses. The Trust’s maximum exposure under these arrangements is dependent on future claims that may be made against the Fund and, therefore, cannot be estimated.
6. NEW ACCOUNTING PRONOUNCEMENT
In December 2011, the Financial Accounting Standards Board (“FASB”) issued Accounting Standard Update (“ASU”) No. 2011-11, Disclosures about Offsetting Assets and Liabilities. ASU 2011-11, which amends FASB ASC Topic 210, Balance Sheet, creates new disclosure requirements which require entities to disclose both gross and net information for derivatives and other financial instruments that are either offset in the Statement of Assets and Liabilities or subject to an enforceable master netting arrangement or similar agreement. The disclosure requirements are effective for interim and annual reporting periods beginning on or after January 1, 2013. Management is currently assessing the potential impact, in addition to expanded financial statement disclosure, that may result from adopting this ASU.
| | | | | | |
| Other Information (Unaudited) | | Wells Fargo Advantage Prime Investment Money Market Fund | | | 31 | |
PROXY VOTING INFORMATION
A description of the policies and procedures that the Fund uses to determine how to vote proxies relating to portfolio securities is available without charge, upon request, by calling 1-800-222-8222, visiting our Web site at wellsfargoadvantagefunds.com, or visiting the SEC Web site at sec.gov. Information regarding how the Fund voted proxies relating to portfolio securities during the most recent 12-month period ended June 30 is available without charge on the Fund’s Web site at wellsfargoadvantagefunds.com or by visiting the SEC Web site at sec.gov.
PORTFOLIO HOLDINGS INFORMATION
The complete portfolio holdings for each Fund are publicly available on the Funds’ Web site (wellsfargoadvantagefunds.com) on a monthly, seven-day delayed basis. The Fund files its complete schedule of portfolio holdings with the SEC for the first and third quarters of each fiscal year on Form N-Q, which is available without charge by visiting the SEC Web site at sec.gov. In addition, each Fund’s Form N-Q may be reviewed and copied at the SEC’s Public Reference Room in Washington, DC, and at regional offices in New York City, at 233 Broadway, and in Chicago, at 175 West Jackson Boulevard, Suite 900. Information about the Public Reference Room may be obtained by calling 1-800-SEC-0330.
| | | | |
| 32 | | Wells Fargo Advantage Prime Investment Money Market Fund | | Other Information (Unaudited) |
BOARD OF TRUSTEES AND OFFICERS
Each of the Trustees and Officers listed in the table below acts in identical capacities for the Wells Fargo Advantage family of funds, which consists of 138 funds comprising the Wells Fargo Funds Trust, Wells Fargo Variable Trust, Wells Fargo Master Trust and four closed-end funds (collectively the “Fund Complex”). This table should be read in conjunction with the Prospectus and the Statement of Additional Information1. All of the Trustees are also Members of the Audit and Governance Committees of each Trust in the Fund Complex. The mailing address of each Trustee and Officer is 525 Market Street, 12th Floor, San Francisco, CA 94105. Each Trustee and Officer serves an indefinite term, however, each Trustee serves such term until reaching the mandatory retirement age established by the Trustees.
Independent Trustees
| | | | | | |
Name and Year of Birth | | Position Held and Length of Service* | | Principal Occupations During Past Five Years | | Other Directorships During
Past Five Years |
Peter G. Gordon
(Born 1942) | | Trustee, since 1998, Chairman, since 2005 | | Co-Founder, Retired Chairman, President and CEO of Crystal Geyser Water Company. Trustee Emeritus, Colby College | | Asset Allocation Trust |
Isaiah Harris, Jr.
(Born 1952) | | Trustee, since 2009 | | Retired. Prior thereto, President and CEO of BellSouth Advertising and Publishing Corp. from 2005 to 2007, President and CEO of BellSouth Enterprises from 2004 to 2005 and President of BellSouth Consumer Services from 2000 to 2003. Emeritus member of the Iowa State University Foundation Board of Governors. Emeritus Member of the Advisory Board of Iowa State University School of Business. Mr. Harris is a certified public accountant. | | CIGNA Corporation; Deluxe Corporation; Asset Allocation Trust |
Judith M. Johnson
(Born 1949) | | Trustee, since 2008 Audit Committee Chairman, since 2008 | | Retired. Prior thereto, Chief Executive Officer and Chief Investment Officer of Minneapolis Employees Retirement Fund from 1996 to 2008. Ms. Johnson is an attorney, certified public accountant and a certified managerial accountant. | | Asset Allocation Trust |
Leroy Keith, Jr.
(Born 1939) | | Trustee, since 2010 | | Chairman, Bloc Global Services (development and construction). Trustee of the Evergreen Funds from 1983 to 2010. Former Managing Director, Almanac Capital Management (commodities firm), former Partner, Stonington Partners, Inc. (private equity fund), former Director, Obagi Medical Products Co. and former Director, Lincoln Educational Services. | | Trustee, Virtus Fund Complex (consisting of 40 portfolios as of 12/31/11); Asset Allocation Trust |
David F. Larcker
(Born 1950) | | Trustee, since 2009 | | James Irvin Miller Professor of Accounting at the Graduate School of Business, Stanford University, Director of Corporate Governance Research Program and Senior Faculty of The Rock Center for Corporate Governance since 2006. From 2005 to 2008, Professor of Accounting at the Graduate School of Business, Stanford University. Prior thereto, Ernst & Young Professor of Accounting at The Wharton School, University of Pennsylvania from 1985 to 2005. | | Asset Allocation Trust |
Olivia S. Mitchell
(Born 1953) | | Trustee, since 2006 | | International Foundation of Employee Benefit Plans Professor, Wharton School of the University of Pennsylvania since 1993. Director of Wharton’s Pension Research Council and Boettner Center on Pensions & Retirement Research, and Research Associate at the National Bureau of Economic Research. Previously, Cornell University Professor from 1978 to 1993. | | Asset Allocation Trust |
Timothy J. Penny
(Born 1951) | | Trustee, since 1996 | | President and CEO of Southern Minnesota Initiative Foundation, a non-profit organization, since 2007 and Senior Fellow at the Humphrey Institute Policy Forum at the University of Minnesota since 1995. Member of the Board of Trustees of NorthStar Education Finance, Inc., a non-profit organization, since 2007. | | Asset Allocation Trust |
| | | | | | |
| Other Information (Unaudited) | | Wells Fargo Advantage Prime Investment Money Market Fund | | | 33 | |
| | | | | | |
Name and Year of Birth | | Position Held and Length of Service* | | Principal Occupations During Past Five Years | | Other Directorships During
Past Five Years |
Michael S. Scofield
(Born 1943) | | Trustee, since 2010 | | Served on the Investment Company Institute’s Board of Governors and Executive Committee from 2008-2011 as well the Governing Council of the Independent Directors Council from 2006-2011 and the Independent Directors Council Executive Committee from 2008-2011. Chairman of the IDC from 2008-2010. Institutional Investor (Fund Directions) Trustee of Year in 2007. Trustee of the Evergreen Funds (and its predecessors) from 1984 to 2010. Chairman of the Evergreen Funds from 2000-2010. Former Trustee of the Mentor Funds. Retired Attorney, Law Offices of Michael S. Scofield and former Director and Chairman, Branded Media Corporation (multi-media branding company). | | Asset Allocation Trust |
Donald C. Willeke
(Born 1940) | | Trustee, since 1996 | | Principal of the law firm of Willeke & Daniels. General Counsel of the Minneapolis Employees Retirement Fund from 1984 until its consolidation into the Minnesota Public Employees Retirement Association on June 30, 2010. Director and Vice Chair of The Free Trust (non-profit corporation). Director of the American Chestnut Foundation (non-profit corporation). | | Asset Allocation Trust |
| * | Length of service dates reflect the Trustee’s commencement of service with the Trust’s predecessor entities, where applicable. |
Officers
| | | | | | |
Name and Year of Birth | | Position Held and
Length of Service | | Principal Occupations During Past Five Years | | |
Karla M. Rabusch
(Born 1959) | | President, since 2003 | | Executive Vice President of Wells Fargo Bank, N.A. and President of Wells Fargo Funds Management, LLC since 2003. Senior Vice President and Chief Administrative Officer of Wells Fargo Funds Management, LLC from 2001 to 2003. | | |
C. David Messman
(Born 1960) | | Secretary, since 2000; Chief Legal Officer, since 2003 | | Senior Vice President and Secretary of Wells Fargo Funds Management, LLC since 2001. Vice President and Managing Senior Counsel of Wells Fargo Bank, N.A. since 1996. | | |
Nancy Wiser (Born 1967) | | Treasurer, since 2012 | | Executive Vice President of Wells Fargo Funds Management, LLC since 2011. Chief Operating Officer and Chief Compliance Officer at LightBox Capital Management LLC, from 2008 to 2011. Owned and operated a consulting business providing services to various hedge funds including acting as Chief Operating Officer and Chief Compliance Officer for a hedge fund from 2007 to 2008. Chief Operating Officer and Chief Compliance Officer of GMN Capital LLC from 2006 to 2007. | | |
David Berardi
(Born 1975) | | Assistant Treasurer, since 2009 | | Vice President of Wells Fargo Funds Management, LLC since 2009. Vice President of Evergreen Investment Management Company, LLC from 2008 to 2010. Assistant Vice President of Evergreen Investment Services, Inc. from 2004 to 2008. Manager of Fund Reporting and Control for Evergreen Investment Management Company, LLC from 2004 to 2010. | | |
Jeremy DePalma
(Born 1974) | | Assistant Treasurer, since 2009 | | Senior Vice President of Wells Fargo Funds Management, LLC since 2009. Senior Vice President of Evergreen Investment Management Company, LLC from 2008 to 2010. Vice President, Evergreen Investment Services, Inc. from 2004 to 2007. Head of the Fund Reporting and Control Team within Fund Administration from 2005 to 2010. | | |
Debra Ann Early
(Born 1964) | | Chief Compliance Officer, since 2007 | | Chief Compliance Officer of Wells Fargo Funds Management, LLC since 2007. Chief Compliance Officer of Parnassus Investments from 2005 to 2007. Chief Financial Officer of Parnassus Investments from 2004 to 2007 and Senior Audit Manager of PricewaterhouseCoopers LLP from 1998 to 2004. | | |
| 1. | The Statement of Additional Information includes additional information about the Trustees and is available, without charge, upon request, by calling 1-800-222-8222 or by visiting the Web site at wellsfargoadvantagefunds.com. |
| | | | |
| 34 | | Wells Fargo Advantage Prime Investment Money Market Fund | | Other Information (Unaudited) |
BOARD CONSIDERATION OF INVESTMENT ADVISORY AND SUB-ADVISORY AGREEMENTS:
Under Section 15 of the Investment Company Act of 1940 (the “1940 Act”), the Board of Trustees (the “Board”) of Wells Fargo Funds Trust (the “Trust”), all the members of which have no direct or indirect interest in the investment advisory and sub-advisory agreements and are not “interested persons” of the Trust, as defined in the 1940 Act (the “Independent Trustees”), must determine whether to approve the continuation of the Trust’s investment advisory and sub-advisory agreements. In this regard, at an in person meeting held on March 29-30, 2012 (the “Meeting”), the Board reviewed and re-approved: (i) an investment advisory agreement with Wells Fargo Funds Management, LLC (“Funds Management”) for Wells Fargo Advantage Prime Investment Money Market Fund (the “Fund”) and (ii) an investment sub-advisory agreement with Wells Capital Management Incorporated (“Wells Capital Management”) for the Fund. The investment advisory agreement with Funds Management and the investment sub-advisory agreement with Wells Capital Management are collectively referred to as the “Advisory Agreements.”
At the Meeting, the Board considered the factors and reached the conclusions described below relating to the selection of Funds Management and Wells Capital Management and the continuation of the Advisory Agreements. Prior to the Meeting, the Trustees conferred extensively among themselves and with representatives of Funds Management about these matters. The Board also met throughout the year and received information that was useful to them in considering the continuation of the Advisory Agreements. The Independent Trustees were assisted in their evaluation of the Advisory Agreements by independent legal counsel, from whom they received separate legal advice and with whom they met separately from Funds Management.
In providing information to the Board, Funds Management and Wells Capital Management were guided by a detailed set of requests submitted by the Independent Trustees’ independent legal counsel on their behalf at the start of the Board’s annual contract renewal process earlier in 2012. In approving the Advisory Agreements, the Board did not identify any particular information or consideration that was all-important or controlling, and each Trustee likely attributed different weights to various factors.
Nature, extent and quality of services
The Board received and considered various information regarding the nature, extent and quality of services provided to the Fund by Funds Management and Wells Capital Management under the Advisory Agreements. The Board also received and considered, among other things, information about the background and experience of senior management of Funds Management, and the qualifications, backgrounds, tenures and responsibilities of the portfolio managers primarily responsible for the day-to-day portfolio management of the Fund.
The Board evaluated the ability of Funds Management and Wells Capital Management, based on their respective financial condition, resources, reputation and other attributes, to attract and retain qualified investment professionals, including research, advisory, and supervisory personnel. The Board further considered the compliance programs and compliance records of Funds Management and Wells Capital Management. In addition, the Board took into account the administrative services provided to the Fund by Funds Management and its affiliates.
The Board’s decision to approve the continuation of the Advisory Agreements was based on a comprehensive evaluation of information provided to it. In considering these matters, the Board considered not only the specific information presented in connection with the Meeting, but also the knowledge gained over time through interaction with Funds Management and Wells Capital Management about various topics, including Funds Management’s oversight of service providers. The above factors, together with those referenced below, are some of the most important, but not necessarily all, factors considered by the Board in concluding that the nature, extent and quality of the investment advisory services provided to the Fund by Funds Management and Wells Capital Management supported the re-approval of the Advisory Agreements. Although the Board considered the continuation of the Advisory Agreements for the Fund as part of the larger process of considering the continuation of the advisory agreements for all of the funds in the complex, its decision to continue the Advisory Agreements for the Fund was ultimately made on a fund-by-fund basis.
Fund performance and expenses
The Board considered the performance results for the Fund over various time periods ended December 31, 2011. The Board also considered these results in comparison to the median performance of a universe of relevant funds (the
| | | | | | |
| Other Information (Unaudited) | | Wells Fargo Advantage Prime Investment Money Market Fund | | | 35 | |
“Universe”) that was determined by Lipper Inc. (“Lipper”) to be similar to the Fund, and in comparison to the Fund’s benchmark index and to other comparative data. Lipper is an independent provider of investment company data. The Board received a description of the methodology used by Lipper to select the mutual funds in the Universe. The Board noted that the performance of the Fund was equal to or in range of the median performance of the Universe for all periods under review. The Board also noted that the performance of the Fund was in range of its benchmark, the Lipper Money Market Funds Index, for the periods under review.
The Board received and considered information regarding the Fund’s contractual advisory fee and net operating expense ratios and their various components, including actual management fees (which reflect fee waivers, if any), transfer agent, custodian and other non-management fees, Rule 12b-1 and non-Rule 12b-1 fees, service fees and fee waiver and expense reimbursement arrangements. The Board also considered these ratios in comparison to the median ratios of an expense Universe and a narrower expense group of mutual funds (each, an “Expense Group”) that was determined by Lipper to be similar to the Fund. The Board received a description of the methodology used by Lipper to select the mutual funds in the Fund’s Expense Group. The Board noted that the net operating expense ratios of the Fund were in range of the Fund’s Expense Group’s median net operating expense ratios, except for Service Class.
Funds Management advised the Board that the Expense Group medians reflected voluntary waivers, whereas the Fund’s expense ratios did not reflect voluntary waivers. The Board noted that when the Fund’s expense ratios were adjusted to reflect voluntary waivers, the Fund’s net operating expense ratios were lower than the median net operating expense ratios of the Expense Group.
Based on the above-referenced considerations and other factors, the Board concluded that the overall performance and expense structure of the Fund supported the re-approval of the Advisory Agreements for the Fund.
Investment advisory and sub-advisory fee rates
The Board reviewed and considered the contractual investment advisory fee rate that is payable by the Fund to Funds Management for investment advisory services (the “Advisory Agreement Rate”), both on a stand-alone basis and on a combined basis with the Fund’s administration fee rate. The Board took into account the separate administrative and other services covered by the administration fee rate. The Board also reviewed and considered the contractual investment sub-advisory fee rate that is payable by Funds Management to Wells Capital Management for investment sub-advisory services (the “Sub-Advisory Agreement Rate”). In addition, the Board reviewed and considered the existing fee waiver/cap arrangements applicable to the Advisory Agreement Rate and considered the Advisory Agreement Rate after taking the waivers/caps into account (the “Net Advisory Rate”).
The Board received and considered information comparing the Advisory Agreement Rate and Net Advisory Rate, combined with the administration fee rates, with those of other funds in the Fund’s Expense Group median. The Board noted that the Advisory Agreement Rate for the Fund was in range of the median rates for the Fund’s Expense Group. The Board also noted that the Net Advisory Rate for the Fund was in range of the median rates for the Fund’s Expense Group, except for the Service Class. The Board viewed favorably Funds Management’s willingness to voluntarily waive certain fees.
The Board also received and considered information about the nature and extent of services offered and fee rates charged by Funds Management and Wells Capital Management to other types of clients. In this regard, the Board received information about differences between the services, and the compliance, reporting, and other legal burdens and risks of providing investment advice to mutual funds and those associated with providing advice to non-mutual fund clients such as collective funds or institutional separate accounts.
The Board determined that the Advisory Agreement Rate for the Fund, both with and without the administration fee rate and before and after waivers, was reasonable in light of the Fund’s Expense Group information, the net expense ratio commitments, the services covered by the Advisory Agreements and other information provided. The Board also reviewed and considered the Sub-Advisory Agreement Rate and concluded that the Sub-Advisory Agreement Rate was reasonable in light of the services covered by the sub-advisory agreement and other information provided.
Profitability
The Board received and considered a profitability analysis of Funds Management, as well as an analysis of the profitability to the collective Wells Fargo businesses that provide services to the Fund. It considered that the information provided to it was necessarily estimated, and that the profitability information provided to it, especially on a fund-by-fund basis, did
| | | | |
| 36 | | Wells Fargo Advantage Prime Investment Money Market Fund | | Other Information (Unaudited) |
not necessarily provide a precise tool for evaluating the appropriateness of the Fund’s Advisory Agreement Rate in isolation. It noted that the levels of profitability reported on a fund-by-fund basis varied widely, depending on, among other things, the size and type of fund. The Board noted the impact of voluntary fee waivers on Funds Management’s profitability. The Board concluded that the profitability reported by Funds Management was not unreasonable.
The Board did not consider separate profitability information with respect to Wells Capital Management, because, as an affiliate of Funds Management, its profitability information was subsumed in the collective Wells Fargo profitability analysis provided by Funds Management.
Economies of scale
With respect to possible economies of scale, the Board reviewed the breakpoints in the Fund’s advisory fee and/or administration fee structure, which operate generally to reduce the expenses of the Fund (as a percentage of Fund assets) as the Fund grows in size. It considered that, as a fund shrinks in size, breakpoints conversely result in increasing fee levels. The Board noted that it would have on-going opportunities to review the appropriate levels of breakpoints in the future, and concluded that the breakpoints as implemented appeared to be a reasonable step toward sharing economies of scale, if any, with the Fund. However, the Board acknowledged the inherent limitations of any analysis of economies of scale and of any attempt to correlate breakpoints with such economies, stemming largely from the Board’s understanding that economies of scale are realized, if at all, across a variety of products and services, not just with respect to a single fund.
Other benefits to Funds Management and Wells Capital Management
The Board received and considered information regarding potential “fall-out” or ancillary benefits received by Funds Management and its affiliates, including Wells Capital Management, as a result of their relationship with the Fund. Ancillary benefits could include, among others, benefits directly attributable to the relationship of Funds Management and Wells Capital Management with the Fund and benefits potentially derived from an increase in Funds Management’s and Wells Capital Management’s business as a result of their relationship with the Fund (such as the ability to market to shareholders other financial products offered by Funds Management and its affiliates, including Wells Capital Management).
The Board considered that Wells Fargo Funds Distributor, LLC, an affiliate of Funds Management, serves as distributor to the Fund and receives certain compensation for those services. The Board noted that various financial institutions, including affiliates of Funds Management, may receive distribution-related fees, shareholder servicing payments (including amounts derived from payments under Rule 12b-1 plans) and sub-transfer agency fees in respect of shares sold or held through them and services provided.
The Board also reviewed information about whether and to what extent soft dollar credits are sought and how any such credits are utilized and any benefits that may be realized by using an affiliated broker.
Other factors and broader review
The Board also considered the markets for distribution of the Fund’s shares, including the channels through which the Fund’s shares are offered and sold. The Board noted that the Fund is part of one of the few fund families that have both direct-to-fund and intermediary distribution channels. As discussed above, the Board reviews detailed materials received from Funds Management and Wells Capital Management annually as part of the re-approval process under Section 15 of the 1940 Act and also reviews and assesses information about the quality of the services that the Fund receives throughout the year. In this regard, the Board has reviewed reports of Funds Management at each of its quarterly meetings, which include, among other things, portfolio reviews and performance reports. In addition, the Board confers with portfolio managers at various times throughout the year.
Conclusion
After considering the above-described factors and based on its deliberations and its evaluation of the information described above, the Board unanimously approved the continuation of the Advisory Agreements for an additional one-year period.
| | | | | | |
| List of Abbreviations | | Wells Fargo Advantage Prime Investment Money Market Fund | | | 37 | |
The following is a list of common abbreviations for terms and entities which may have appeared in this report.
| ACB | — Agricultural Credit Bank |
| ADR | — American Depository Receipt |
| ADS | — American Depository Shares |
| AGC-ICC | — Assured Guaranty Corporation - Insured Custody Certificates |
| AGM | — Assured Guaranty Municipal |
| AMBAC | — American Municipal Bond Assurance Corporation |
| AMT | — Alternative Minimum Tax |
| BAN | — Bond Anticipation Notes |
| BHAC | — Berkshire Hathaway Assurance Corporation |
| CAB | — Capital Appreciation Bond |
| CCAB | — Convertible Capital Appreciation Bond |
| CDA | — Community Development Authority |
| CDO | — Collateralized Debt Obligation |
| COP | — Certificate of Participation |
| DRIVER | — Derivative Inverse Tax-Exempt Receipts |
| DW&P | — Department of Water & Power |
| DWR | — Department of Water Resources |
| ECFA | — Educational & Cultural Facilities Authority |
| EDA | — Economic Development Authority |
| EDFA | — Economic Development Finance Authority |
| ETF | — Exchange-Traded Fund |
| FFCB | — Federal Farm Credit Bank |
| FGIC | — Financial Guaranty Insurance Corporation |
| FGLMC | — Federal Government Loan Mortgage Company |
| FHA | — Federal Housing Authority |
| FHLB | — Federal Home Loan Bank |
| FHLMC | — Federal Home Loan Mortgage Corporation |
| FICO | — The Financing Corporation |
| FNMA | — Federal National Mortgage Association |
| GDR | — Global Depository Receipt |
| GNMA | — Government National Mortgage Association |
| HCFR | — Healthcare Facilities Revenue |
| HEFA | — Health & Educational Facilities Authority |
| HEFAR | — Higher Education Facilities Authority Revenue |
| HFA | — Housing Finance Authority |
| HFFA | — Health Facilities Financing Authority |
| IBC | — Insured Bond Certificate |
| IDA | — Industrial Development Authority |
| IDAG | — Industrial Development Agency |
| IDR | — Industrial Development Revenue |
| KRW | — Republic of Korea Won |
| LIBOR | — London Interbank Offered Rate |
| LLC | — Limited Liability Company |
| LLP | — Limited Liability Partnership |
| MBIA | — Municipal Bond Insurance Association |
| MFHR | — Multi-Family Housing Revenue |
| MSTR | — Municipal Securities Trust Receipts |
| MUD | — Municipal Utility District |
| NATL-RE | — National Public Finance Guarantee Corporation |
| PCFA | — Pollution Control Finance Authority |
| PCR | — Pollution Control Revenue |
| PFA | — Public Finance Authority |
| PFFA | — Public Facilities Financing Authority |
| PFOTER | — Puttable Floating Option Tax-Exempt Receipts |
| plc | — Public Limited Company |
| PUTTER | — Puttable Tax-Exempt Receipts |
| R&D | — Research & Development |
| RDA | — Redevelopment Authority |
| RDFA | — Redevelopment Finance Authority |
| REIT | — Real Estate Investment Trust |
| ROC | — Reset Option Certificates |
| SAVRS | — Select Auction Variable Rate Securities |
| SBA | — Small Business Authority |
| SFHR | — Single Family Housing Revenue |
| SFMR | — Single Family Mortgage Revenue |
| SPA | — Standby Purchase Agreement |
| SPDR | — Standard & Poor’s Depositary Receipts |
| STRIPS | — Separate Trading of Registered Interest and Principal Securities |
| TAN | — Tax Anticipation Notes |
| TIPS | — Treasury Inflation-Protected Securities |
| TRAN | — Tax Revenue Anticipation Notes |
| TCR | — Transferable Custody Receipts |
| TTFA | — Transportation Trust Fund Authority |
| TVA | — Tennessee Valley Authority |
| XLCA | — XL Capital Assurance |
This page is intentionally left blank.


FOR MORE INFORMATION
More information about Wells Fargo Advantage Funds is available free upon request. To obtain literature, please write, e-mail, visit the Fund’s Web site, or call:
Wells Fargo Advantage Funds
P.O. Box 8266
Boston, MA 02266-8266
E-mail: wfaf@wellsfargo.com
Web site: wellsfargoadvantagefunds.com
Individual investors: 1-800-222-8222
Retail investment professionals: 1-888-877-9275
Institutional investment professionals: 1-866-765-0778
This report and the financial statements contained herein are submitted for the general information of the shareholders of Wells Fargo Advantage Funds. If this report is used for promotional purposes, distribution of the report must be accompanied or preceded by a current prospectus. For a current prospectus and, if available, a summary prospectus containing more complete information, including charges and expenses, call 1-800-222-8222 or visit the Fund’s Web site at wellsfargoadvantagefunds.com. Please consider the investment objectives, risks, charges, and expenses of the investment carefully before investing. This and other information about Wells Fargo Advantage Funds can be found in the current prospectus. Read the prospectus carefully before you invest or send money.
Wells Fargo Funds Management, LLC, a wholly owned subsidiary of Wells Fargo & Company, provides investment advisory and administrative services for Wells Fargo Advantage Funds. Other affiliates of Wells Fargo & Company provide subadvisory and other services for the Funds. The Funds are distributed by Wells Fargo Funds Distributor, LLC, Member FINRA/SIPC, an affiliate of Wells Fargo & Company.
NOT FDIC INSURED ¡ NO BANK GUARANTEE ¡ MAY LOSE VALUE
© 2012 Wells Fargo Funds Management, LLC. All rights reserved.
| | |
 | | 211394 09-12 SA313/SAR313 07-12 |

Wells Fargo Advantage
Treasury Plus Money Market Fund

Semi-Annual Report
July 31, 2012

Reduce clutter. Save trees.
Sign up for electronic delivery of prospectuses and shareholder reports at wellsfargo.com/advantagedelivery
Contents
The views expressed and any forward-looking statements are as of July 31, 2012, unless otherwise noted, and are those of the Fund managers and/or Wells Fargo Funds Management, LLC. Discussions of individual securities, or the markets generally, or any Wells Fargo Advantage Fund are not intended as individual recommendations. Future events or results may vary significantly from those expressed in any forward-looking statements; the views expressed are subject to change at any time in response to changing circumstances in the market. Wells Fargo Funds Management, LLC, disclaims any obligation to publicly update or revise any views expressed or forward-looking statements.
NOT FDIC INSURED ¡ NO BANK GUARANTEE ¡ MAY LOSE VALUE

WELLS FARGO INVESTMENT HISTORY
| | |
| |
| 1932 | | Keystone creates one of the first mutual fund families. |
| |
| 1971 | | Wells Fargo & Company introduces one of the first institutional index funds. |
| |
| 1978 | | Wells Fargo applies Markowitz and Sharpe’s research on Modern Portfolio Theory to introduce one of the industry’s first Tactical Asset Allocation (TAA) models in institutional separately managed accounts. |
| |
| 1984 | | Wells Fargo Stagecoach Funds launches its first asset allocation fund. |
| |
| 1989 | | The Tactical Asset Allocation (TAA) Model is first applied to Wells Fargo’s asset allocation mutual funds. |
| |
| 1994 | | Wells Fargo introduces the LifePath Funds, one of the first suites of target date funds (now the Wells Fargo Advantage Dow Jones Target Date FundsSM). |
| |
| 1996 | | Evergreen Investments and Keystone Funds merge. |
| |
| 1997 | | Wells Fargo launches Wells Fargo Advantage WealthBuilder PortfoliosSM, a fund-of-funds suite of products that includes the use of quantitative models to shift assets among investment styles. |
| |
| 1999 | | Norwest Advantage Funds and Stagecoach Funds are reorganized into Wells Fargo Funds after the merger of Norwest and Wells Fargo. |
| |
| 2002 | | Evergreen Retail and Evergreen Institutional companies form the umbrella asset management company, Evergreen Investments. |
| |
| 2005 | | The integration of Strong Funds with Wells Fargo Funds creates Wells Fargo Advantage Funds, resulting in one of the top 20 mutual fund companies in the United States. |
| |
| 2006 | | Wells Fargo Advantage Funds relaunches the target date product line as Wells Fargo Advantage Dow Jones Target Date Funds. |
| |
| 2010 | | The mergers and reorganizations of Evergreen and Wells Fargo Advantage mutual funds are completed, unifying the families under the brand of Wells Fargo Advantage Funds. |
Wells Fargo Advantage Funds®
Wells Fargo Advantage Funds skillfully guides institutions, financial advisors, and individuals through the investment terrain to help them reach their financial objectives. Everything we do on behalf of investors is backed by our unique combination of qualifications.
Strength
Our organization is built on the standards of integrity and service established by our parent company—Wells Fargo & Company—more than 150 years ago. And, because we’re part of a highly diversified financial enterprise, we offer the depth of resources to help investors succeed.
Expertise
Our multi-boutique model offers investors access to the independent thinking of premier investment managers that have been chosen for their time-tested strategies. While each team specializes in a specific investment strategy, collectively they provide investors a wide choice of distinct investment styles. Our dedication to investment excellence doesn’t end with our expertise in manager selection—risk management, analysis, and rigorous ongoing review seek to ensure each manager’s investment process remains consistent.
Partnership
Our collaborative approach is built around understanding the needs and goals of our clients. By adhering to core principles of sound judgment and steady guidance, we support you through every stage of the investment decision process.
Carefully consider a fund’s investment objectives, risks, charges, and expenses before investing. For a current prospectus and, if available, a summary prospectus, containing this and other information, visit wellsfargoadvantagefunds.com. Read it carefully before investing.
Wells Fargo Funds Management, LLC, a wholly owned subsidiary of Wells Fargo & Company, provides investment advisory and administrative services for Wells Fargo Advantage Funds®. Other affiliates of Wells Fargo & Company provide subadvisory and other services for the Funds. The Funds are distributed by Wells Fargo Funds Distributor, LLC, Member FINRA/SIPC, an affiliate of Wells Fargo & Company.
“Dow Jones®” and “Dow Jones Target Date IndexesSM” are service marks of Dow Jones Trademark Holdings, LLC (“Dow Jones”), have been licensed to CME Group Index Services LLC (“CME Indexes”) and have been sublicensed for use for certain purposes by Global Index Advisors, Inc, and Wells Fargo Funds Management, LLC. The Wells Fargo Advantage Dow Jones Target Date FundsSM based on the Dow Jones Target Date IndexesSM, are not sponsored, endorsed, sold or promoted by Dow Jones, CME Indexes or their respective affiliates and none of them makes any representation regarding the advisability of investing in such product(s).
NOT FDIC INSURED ¡ NO BANK GUARANTEE ¡ MAY LOSE VALUE
Not part of semi-annual report.
Wells Fargo Advantage Funds offers more than 110 mutual funds across a wide range of asset classes, representing over $209 billion in assets under management, as of July 31, 2012.
| | | | |
| Equity Funds | | | | |
Asia Pacific Fund | | Enterprise Fund† | | Opportunity Fund† |
C&B Large Cap Value Fund | | Equity Value Fund | | Precious Metals Fund |
C&B Mid Cap Value Fund | | Global Opportunities Fund | | Premier Large Company Growth Fund |
Capital Growth Fund | | Growth Fund | | Small Cap Opportunities Fund |
Common Stock Fund | | Index Fund | | Small Cap Value Fund |
Disciplined U.S. Core Fund | | International Equity Fund | | Small Company Growth Fund |
Discovery Fund† | | International Value Fund | | Small Company Value Fund |
Diversified Equity Fund | | Intrinsic Small Cap Value Fund | | Small/Mid Cap Core Fund |
Diversified International Fund | | Intrinsic Value Fund | | Small/Mid Cap Value Fund |
Diversified Small Cap Fund | | Intrinsic World Equity Fund | | Special Mid Cap Value Fund |
Emerging Growth Fund | | Large Cap Core Fund | | Special Small Cap Value Fund |
Emerging Markets Equity Fund | | Large Cap Growth Fund | | Specialized Technology Fund |
Emerging Markets Equity Income Fund | | Large Company Value Fund | | Traditional Small Cap Growth Fund |
Endeavor Select Fund† | | Omega Growth Fund | | Utility and Telecommunications Fund |
| Bond Funds | | | | |
Adjustable Rate Government Fund | | Inflation-Protected Bond Fund | | Short-Term Bond Fund |
California Limited-Term Tax-Free Fund | | Intermediate Tax/AMT-Free Fund | | Short-Term High Yield Bond Fund |
California Tax-Free Fund | | International Bond Fund | | Short-Term Municipal Bond Fund |
Colorado Tax-Free Fund | | Minnesota Tax-Free Fund | | Strategic Municipal Bond Fund |
Emerging Markets Local Bond Fund | | Municipal Bond Fund | | Total Return Bond Fund |
Government Securities Fund | | North Carolina Tax-Free Fund | | Ultra Short-Term Income Fund |
High Income Fund | | Pennsylvania Tax-Free Fund | | Ultra Short-Term Municipal Income Fund |
High Yield Bond Fund | | Short Duration Government Bond Fund | | Wisconsin Tax-Free Fund |
Income Plus Fund | | | | |
| Asset Allocation Funds | | | | |
Absolute Return Fund | | WealthBuilder Equity Portfolio† | | Target 2020 Fund† |
Asset Allocation Fund | | WealthBuilder Growth Allocation Portfolio† | | Target 2025 Fund† |
Conservative Allocation Fund | | WealthBuilder Growth Balanced Portfolio† | | Target 2030 Fund† |
Diversified Capital Builder Fund | | WealthBuilder Moderate Balanced Portfolio† | | Target 2035 Fund† |
Diversified Income Builder Fund | | WealthBuilder Tactical Equity Portfolio† | | Target 2040 Fund† |
Growth Balanced Fund | | Target Today Fund† | | Target 2045 Fund† |
Index Asset Allocation Fund | | Target 2010 Fund† | | Target 2050 Fund† |
Moderate Balanced Fund | | Target 2015 Fund† | | Target 2055 Fund† |
WealthBuilder Conservative Allocation Portfolio† | | | | |
| Money Market Funds | | | | |
100% Treasury Money Market Fund | | Heritage Money Market Fund† | | National Tax-Free Money Market Fund |
California Municipal Money Market Fund | | Money Market Fund | | Prime Investment Money Market Fund |
Cash Investment Money Market Fund | | Municipal Cash Management Money Market Fund | | Treasury Plus Money Market Fund |
Government Money Market Fund | | Municipal Money Market Fund | | |
| Variable Trust Funds1 | | | | |
VT Discovery Fund† | | VT Intrinsic Value Fund | | VT Small Cap Growth Fund |
VT Index Asset Allocation Fund | | VT Omega Growth Fund | | VT Small Cap Value Fund |
VT International Equity Fund | | VT Opportunity Fund† | | VT Total Return Bond Fund |
An investment in a money market fund is not insured or guaranteed by the Federal Deposit Insurance Corporation or any other government agency. Although the Wells Fargo Advantage Money Market Funds seek to preserve the value of your investment at $1.00 per share, it is possible to lose money by investing in a money market fund.
| 1. | The Variable Trust Funds are generally available only through insurance company variable contracts. |
| † | In this report, the Wells Fargo Advantage Discovery FundSM, Wells Fargo Advantage Endeavor Select FundSM, Wells Fargo Advantage Enterprise FundSM, Wells Fargo Advantage Opportunity FundSM, Wells Fargo Advantage WealthBuilder Conservative Allocation PortfolioSM, Wells Fargo Advantage WealthBuilder Equity PortfolioSM, Wells Fargo Advantage WealthBuilder Growth Allocation PortfolioSM, Wells Fargo Advantage WealthBuilder Growth Balanced PortfolioSM, Wells Fargo Advantage WealthBuilder Moderate Balanced PortfolioSM, Wells Fargo Advantage WealthBuilder Tactical Equity PortfolioSM, Wells Fargo Advantage Dow Jones Target Today FundSM, Wells Fargo Advantage Dow Jones Target 2010 FundSM, Wells Fargo Advantage Dow Jones Target 2015 FundSM, Wells Fargo Advantage Dow Jones Target 2020 FundSM, Wells Fargo Advantage Dow Jones Target 2025 FundSM, Wells Fargo Advantage Dow Jones Target 2030 FundSM, Wells Fargo Advantage Dow Jones Target 2035 FundSM, Wells Fargo Advantage Dow Jones Target 2040 FundSM, Wells Fargo Advantage Dow Jones Target 2045 FundSM, Wells Fargo Advantage Dow Jones Target 2050 FundSM, Wells Fargo Advantage Dow Jones Target 2055 FundSM, Wells Fargo Advantage Heritage Money Market FundSM, Wells Fargo Advantage VT Discovery FundSM, and Wells Fargo Advantage VT Opportunity FundSM are referred to as the Discovery Fund, Endeavor Select Fund, Enterprise Fund, Opportunity Fund, WealthBuilder Conservative Allocation Portfolio, WealthBuilder Equity Portfolio, WealthBuilder Growth Allocation Portfolio, WealthBuilder Growth Balanced Portfolio, WealthBuilder Moderate Balanced Portfolio, WealthBuilder Tactical Equity Portfolio, Target Today Fund, Target 2010 Fund, Target 2015 Fund, Target 2020 Fund, Target 2025 Fund, Target 2030 Fund, Target 2035 Fund, Target 2040 Fund, Target 2045 Fund, Target 2050 Fund, Target 2055 Fund, Heritage Money Market Fund, VT Discovery Fund, and VT Opportunity Fund, respectively. |
Not part of semi-annual report.
| | | | |
| 2 | | Wells Fargo Advantage Treasury Plus Money Market Fund | | Letter to Shareholders (Unaudited) |

Karla M. Rabusch,
President
Wells Fargo Advantage Funds
Not only has the Fed been successful in engineering low interest rates, but investors have rushed to buy U.S. Treasury securities as a safe-haven asset in the midst of uncertainty surrounding the European debt crisis. As a result, interest rates reached record lows.
Dear Valued Shareholder:
We’re pleased to offer you this semi-annual report for the Wells Fargo Advantage Treasury Plus Money Market Fund for the six-month period that ended July 31, 2012.
The economy grew, but the recovery has been modest.
The U.S. is three years into a modest economic recovery, with second-quarter real gross domestic product (GDP) increasing 1.5% on an annualized basis. Several factors, however, held back growth despite the Federal Reserve’s (Fed) accommodative monetary policy. In Europe, much uncertainty remained about the outcome of the eurozone debt crisis and whether policymakers will be able to resolve it without any countries defaulting or leaving the euro. In addition, Europe has again entered a recession. In Asia, China’s economy slowed. Here at home, a potential “fiscal cliff”—automatic tax increases alongside automatic budget cuts stemming from a legislative compromise in Congress—added uncertainty and, if unaddressed, could negatively affect GDP beginning in 2013.
In an effort to further bolster the economy, especially the labor market, the Fed has indicated its commitment to maintaining a highly accommodative monetary policy. It has indicated its belief that economic conditions warrant an extremely low federal funds target rate—a short-term bank lending rate—near 0%, at least through late 2014. The Fed also continued its “Operation Twist,” which involves buying U.S. Treasury securities with maturities of greater than six years and selling U.S. Treasury securities with maturities of less than three years, in an effort to keep longer-term interest rates low.
A demand for relative safe-haven securities led to ultra-low interest rates.
Not only has the Fed been successful in engineering low interest rates, but investors have rushed to buy U.S. Treasury securities as a relative safe-haven asset in the midst of uncertainty surrounding the European debt crisis. As a result, interest rates reached record lows. Ten-year U.S. Treasury yields ranged between 2.38% and 1.38% over the past six months. Three-month U.S. Treasury bills had an average yield of 10 basis points (bps; 100 bps is 1.00%) over the past six months. Rates on seven-day commercial paper, a common investment type for prime money market funds, were 12 bps on July 31, 2012.
Lack of supply kept a lid on yields, and regulatory uncertainty remained.
Continued demand for a limited supply of money market-eligible securities also contributed to low yields. We estimate that the amount outstanding of short-term, money market fund-eligible securities (excluding U.S. Treasury securities) has declined by $3 trillion, or more than a 30% decrease, since 2008. Reasons for this decrease in supply include issuers opting to lock in rates on long-term rather than short-term debt, less need for financing as many companies have plentiful cash given record profits, and credit downgrades that have resulted in fewer firms with top credit ratings.
The Chairman of the Securities and Exchange Commission (SEC) indicated in late August that the SEC has determined at this time not to propose certain amendments to the rules governing money market funds. However, the Financial Stability Oversight Council or other financial regulators could still take steps to impose additional regulations on money market funds. As we gain clarity in the
| | | | | | |
| Letter to Shareholders (Unaudited) | | Wells Fargo Advantage Treasury Plus Money Market Fund | | | 3 | |
coming months regarding any potential changes to regulation of money market funds, we will provide further communications to our clients about these changes.
Amid the current challenges of investing—low yields, an unresolved eurozone crisis, limited supply, and regulatory uncertainty—has been the opportunity to provide our clients an important investment option for meeting their short-term cash needs. Our focus on preservation of capital and liquidity is not a marketing phrase but rather the basis of our investment philosophy as we manage money market funds in an uncertain world. We are proud of our comprehensive lineup of prime, government, and tax-exempt money market funds.
Thank you for choosing to invest with Wells Fargo Advantage Funds. We appreciate your confidence in us and remain committed to helping you meet your financial needs. For current information about your fund investments, contact your investment professional, visit our Web site at wellsfargoadvantagefunds.com, or call us directly at 1-800-222-8222. We are available 24 hours a day, 7 days a week.
Sincerely,

Karla M. Rabusch
President
Wells Fargo Advantage Funds
Amid the current challenges of investing—low yields, an unresolved eurozone crisis, limited supply, and regulatory uncertainty—has been the opportunity to provide our clients an important investment option for meeting their short-term cash needs.
| | | | |
| 4 | | Wells Fargo Advantage Treasury Plus Money Market Fund | | Performance Highlights (Unaudited) |
INVESTMENT OBJECTIVE
The Fund seeks current income, while preserving capital and liquidity.
ADVISER
Wells Fargo Funds Management, LLC
SUB-ADVISER
Wells Capital Management Incorporated
PORTFOLIO MANAGERS
David D. Sylvester
Laurie White
FUND INCEPTION
October 1, 1985
| | |
PORTFOLIO COMPOSITION1 (AS OF JULY 31, 2012) | | |
|
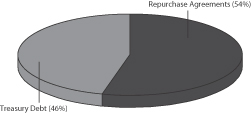
|
| | |
EFFECTIVE MATURITY DISTRIBUTION2 (AS OF JULY 31, 2012) | | |
|
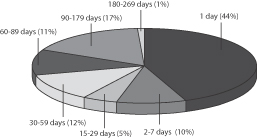 |
| | |
WEIGHTED AVERAGE MATURITY3 (AS OF JULY 31, 2012) | | |
38 Days | | |
| | |
WEIGHTED AVERAGE FINAL MATURITY4 (AS OF JULY 31, 2012) | | |
38 Days | | |
| 1. | Portfolio composition is subject to change and is calculated based on the total investments of the Fund. |
| 2. | Effective maturity distribution is subject to change and is calculated based on the total investments of the Fund. |
| 3. | Weighted Average Maturity (WAM): WAM is an average of the effective maturities of all securities held in the portfolio, weighted by each security’s percentage of total investments. The maturity of a portfolio security is the period remaining until the date on which the principal amount is unconditionally required to be paid, or in the case of a security called for redemption, the date on which the redemption payment is unconditionally required to be made. WAM calculations allow for the maturities of certain securities with demand features or periodic interest rate resets to be shortened. WAM is a way to measure a fund’s sensitivity to potential interest rate changes. |
| 4. | Weighted Average Final Maturity (WAFM): WAFM is an average of the final maturities of all securities held in the portfolio, weighted by their percentage of total investments. The maturity of a portfolio security is the period remaining until the date on which the principal amount is unconditionally required to be paid, or in the case of a security called for redemption, the date on which the redemption payment is unconditionally required to be made. In contrast to WAM, the calculation of WAFM allows for the maturities of certain securities with demand features to be shortened, but not the periodic interest rate resets. WAFM is a way to measure a fund’s potential sensitivity to credit spread changes. |
| | | | | | |
| Performance Highlights (Unaudited) | | Wells Fargo Advantage Treasury Plus Money Market Fund | | | 5 | |
AVERAGE ANNUAL TOTAL RETURN5 (%) (AS OF JULY 31, 2012)
| | | | | | | | | | | | | | | | | | | | | | | | | | | | |
| | | | | | | | | | | | | | | | | | Expense Ratios6 | |
| | | Inception Date | | | 6 Months* | | | 1 Year | | | 5 Year | | | 10 Year | | | Gross | | | Net7 | |
Class A (PIVXX) | | | 07/28/2003 | | | | 0.00 | | | | 0.01 | | | | 0.57 | | | | 1.40 | | | | 0.62% | | | | 0.62% | |
Administrator Class (WTPXX) | | | 03/31/2008 | | | | 0.00 | | | | 0.01 | | | | 0.64 | | | | 1.58 | | | | 0.35% | | | | 0.35% | |
Institutional Class (PISXX) | | | 08/11/1995 | | | | 0.00 | | | | 0.01 | | | | 0.68 | | | | 1.68 | | | | 0.23% | | | | 0.20% | |
Service Class (PRVXX) | | | 10/01/1985 | | | | 0.00 | | | | 0.01 | | | | 0.60 | | | | 1.49 | | | | 0.52% | | | | 0.45% | |
Sweep Class | | | 06/30/2010 | | | | 0.00 | | | | 0.01 | | | | 0.57 | | | | 1.41 | | | | 0.97% | | | | 0.97% | |
| * | Returns for periods of less than one year are not annualized. |
| | | | | | | | | | | | | | | | | | | | |
FUND YIELD SUMMARY7 (AS OF JULY 31, 2012) | | Class A | | | Administrator
Class | | | Institutional
Class | | | Service
Class | | | Sweep
Class | |
7-Day Current Yield | | | 0.01% | | | | 0.01% | | | | 0.01% | | | | 0.01% | | | | 0.01% | |
7-Day Compound Yield | | | 0.01% | | | | 0.01% | | | | 0.01% | | | | 0.01% | | | | 0.01% | |
30-Day Simple Yield | | | 0.01% | | | | 0.01% | | | | 0.01% | | | | 0.01% | | | | 0.01% | |
30-Day Compound Yield | | | 0.01% | | | | 0.01% | | | | 0.01% | | | | 0.01% | | | | 0.01% | |
Figures quoted represent past performance, which is no guarantee of future results and do not reflect the deduction of taxes that a shareholder may pay on fund distributions or the redemption of fund shares. Investment returns will fluctuate. The Fund’s yield figures more closely reflect the current earnings of the Fund than the total return figures. Current performance may be lower or higher than the performance data quoted and assumes the reinvestment of dividends and capital gains. Current month-end performance is available at the Fund’s Web site – wellsfargoadvantagefunds.com.
Each class is sold without a front-end sales charge or contingent deferred sales charge. Other fees and expenses apply to an investment in the Fund and are described in the Fund’s current prospectuses.
An investment in a money market fund is not insured or guaranteed by the Federal Deposit Insurance Corporation or any other government agency. Although the Fund seeks to preserve the value of your investment at $1.00 per share, it is possible to lose money by investing in a money market fund. The U.S. Government guarantee applies to certain of the underlying securities held by the Fund and not to shares of the Fund itself.
| 5. | Historical performance shown for the Administrator Class shares prior to their inception reflects the performance of the Institutional Class shares, adjusted to reflect the higher expenses applicable to the Administrator Class shares. Historical performance shown for the Sweep Class shares prior to their inception reflects the performance of the Class A shares, and has not been adjusted to include the higher expenses applicable to the Sweep Class shares. If these expenses had been adjusted, returns would be lower. Historical performance shown for Class A shares prior to their inception reflects the performance of the Service Class shares, adjusted to reflect the higher expenses applicable to Class A shares. |
| 6. | Reflects the expense ratios as stated in the most recent prospectuses. |
| 7. | The Adviser has committed through July 11, 2013 to waive fees and/or reimburse expenses to the extent necessary to cap the Fund’s Total Annual Fund Operating Expenses After Fee Waiver, excluding certain expenses, at 0.65% for Class A, 0.35% for Administrator Class, 0.20% for Institutional Class, 0.45% for Service Class and 1.00% for Sweep Class. Brokerage commissions, stamp duty fees, interest, taxes, acquired fund fees and expenses and extraordinary expenses are excluded from the cap. Without this cap, the Fund’s returns would have been lower. Without waived fees and/or reimbursed expenses, the Fund’s 7-day current yield would have been (0.49)%, (0.22)%, (0.10)%, (0.39)% and (0.84)% for Class A, Administrator Class, Institutional Class, Service Class and Sweep Class, respectively. |
| | | | |
| 6 | | Wells Fargo Advantage Treasury Plus Money Market Fund | | Fund Expenses (Unaudited) |
As a shareholder of the Fund, you incur ongoing costs, including management fees, distribution (12b-1) and/or shareholder service fees, and other Fund expenses. This example is intended to help you understand your ongoing costs (in dollars) of investing in the Fund and to compare these costs with the ongoing costs of investing in other mutual funds.
The example is based on an investment of $1,000 invested at the beginning of the six-month period and held for the entire period from February 1, 2012 to July 31, 2012.
Actual Expenses
The “Actual” line of the table below provides information about actual account values and actual expenses. You may use the information in this line, together with the amount you invested, to estimate the expenses that you paid over the period. Simply divide your account value by $1,000 (for example, an $8,600 account value divided by $1,000 = 8.6), then multiply the result by the number in the “Actual” line under the heading entitled “Expenses Paid During Period” for your applicable class of shares to estimate the expenses you paid on your account during this period.
Hypothetical Example for Comparison Purposes
The “Hypothetical” line of the table below provides information about hypothetical account values and hypothetical expenses based on the Fund’s actual expense ratio and an assumed rate of return of 5% per year before expenses, which is not the Fund’s actual return. The hypothetical account values and expenses may not be used to estimate the actual ending account balance or expenses you paid for the period. You may use this information to compare the ongoing costs of investing in the Fund and other funds. To do so, compare this 5% hypothetical example with the 5% hypothetical examples that appear in the shareholder reports of the other funds.
Please note that the expenses shown in the table are meant to highlight your ongoing costs only. Therefore, the “Hypothetical” line of the table is useful in comparing ongoing costs only, and will not help you determine the relative total costs of owning different funds.
| | | | | | | | | | | | | | | | |
| | | Beginning
Account Value
02-01-2012 | | | Ending
Account Value
07-31-2012 | | | Expenses
Paid During
the Period¹ | | | Net Annual
Expense Ratio | |
Class A | | | | | | | | | | | | | | | | |
Actual | | $ | 1,000.00 | | | $ | 1,000.05 | | | $ | 0.55 | | | | 0.11 | % |
Hypothetical (5% return before expenses) | | $ | 1,000.00 | | | $ | 1,024.32 | | | $ | 0.55 | | | | 0.11 | % |
Administrator Class | | | | | | | | | | | | | | | | |
Actual | | $ | 1,000.00 | | | $ | 1,000.05 | | | $ | 0.55 | | | | 0.11 | % |
Hypothetical (5% return before expenses) | | $ | 1,000.00 | | | $ | 1,024.32 | | | $ | 0.55 | | | | 0.11 | % |
Institutional Class | | | | | | | | | | | | | | | | |
Actual | | $ | 1,000.00 | | | $ | 1,000.05 | | | $ | 0.55 | | | | 0.11 | % |
Hypothetical (5% return before expenses) | | $ | 1,000.00 | | | $ | 1,024.32 | | | $ | 0.55 | | | | 0.11 | % |
Service Class | | | | | | | | | | | | | | | | |
Actual | | $ | 1,000.00 | | | $ | 1,000.05 | | | $ | 0.55 | | | | 0.11 | % |
Hypothetical (5% return before expenses) | | $ | 1,000.00 | | | $ | 1,024.32 | | | $ | 0.55 | | | | 0.11 | % |
Sweep Class | | | | | | | | | | | | | | | | |
Actual | | $ | 1,000.00 | | | $ | 1,000.05 | | | $ | 0.55 | | | | 0.11 | % |
Hypothetical (5% return before expenses) | | $ | 1,000.00 | | | $ | 1,024.32 | | | $ | 0.55 | | | | 0.11 | % |
| 1. | Expenses paid is equal to the annualized expense ratio of each class multiplied by the average account value over the period, multiplied by the number of days in the most recent fiscal half-year divided by the number of days in the fiscal year (to reflect the one-half-year period). |
| | | | | | |
| Portfolio of Investments—July 31, 2012 (Unaudited) | | Wells Fargo Advantage Treasury Plus Money Market Fund | | | 7 | |
| | | | | | | | | | | | | | | | |
| Security Name | | Interest Rate | | | Maturity Date | | | Principal | | | Value | |
| | | | | | | | | | | | | | | | |
| | | | |
| Repurchase Agreements^^: 55.51% | | | | | | | | | | | | | | | | |
Bank of Nova Scotia, dated 07/31/2012, maturity value
$971,979,320 (1) | | | 0.16 | % | | | 08/01/2012 | | | $ | 971,975,000 | | | $ | 971,975,000 | |
Barclays Capital Incorporated, dated 07/26/2012, maturity value $250,007,292 (2) | | | 0.15 | | | | 08/02/2012 | | | | 250,000,000 | | | | 250,000,000 | |
Barclays Capital Incorporated, dated 07/31/2012, maturity value $250,001,181 (3) | | | 0.17 | | | | 08/01/2012 | | | | 250,000,000 | | | | 250,000,000 | |
BNP Paribus Securities Corporation, dated 07/31/2012, maturity value $500,002,361 (4) | | | 0.17 | | | | 08/01/2012 | | | | 500,000,000 | | | | 500,000,000 | |
Credit Suisse Securities USA, dated 07/25/2012, maturity value $250,008,264 (5) | | | 0.17 | | | | 08/01/2012 | | | | 250,000,000 | | | | 250,000,000 | |
Credit Suisse Securities USA, dated 07/31/2012, maturity value $250,007,778 (6) | | | 0.16 | | | | 08/07/2012 | | | | 250,000,000 | | | | 250,000,000 | |
Credit Suisse Securities USA, dated 07/31/2012, maturity value $500,002,083 (7) | | | 0.15 | | | | 08/01/2012 | | | | 500,000,000 | | | | 500,000,000 | |
Deutsche Bank Securities, dated 07/27/2012, maturity value $250,007,292 (8) | | | 0.15 | | | | 08/03/2012 | | | | 250,000,000 | | | | 250,000,000 | |
Deutsche Bank Securities, dated 07/30/2012, maturity value $250,007,292 (9) | | | 0.15 | | | | 08/06/2012 | | | | 250,000,000 | | | | 250,000,000 | |
Deutsche Bank Securities, dated 07/31/2012, maturity value $500,002,361 (10) | | | 0.17 | | | | 08/01/2012 | | | | 500,000,000 | | | | 500,000,000 | |
Royal Bank Scotland, dated 07/31/2012, maturity value $750,003,542 (11) | | | 0.17 | | | | 08/01/2012 | | | | 750,000,000 | | | | 750,000,000 | |
SG Americas Securities, dated 07/31/2012, maturity value $1,000,004,722 (12) | | | 0.17 | | | | 08/01/2012 | | | | 1,000,000,000 | | | | 1,000,000,000 | |
UBS Securities LLC, dated 07/31/2012, maturity value
$500,002,361 (13) | | | 0.17 | | | | 08/01/2012 | | | | 500,000,000 | | | | 500,000,000 | |
| | | |
Total Repurchase Agreements (Cost $6,221,975,000) | | | | | | | | | | | | 6,221,975,000 | |
| | | | | | | | | | | | | | | | |
| | | | | | | | | | | | | | | | |
| Treasury Debt: 47.57% | | | | | | | | | | | | | |
U.S. Treasury Bill (z) | | | 0.15 | | | | 01/31/2013 | | | | 100,000,000 | | | | 99,925,178 | |
U.S. Treasury Bill (z) | | | 0.06 | | | | 08/02/2012 | | | | 150,000,000 | | | | 149,999,750 | |
U.S. Treasury Bill (z) | | | 0.08 | | | | 09/06/2012 | | | | 350,000,000 | | | | 349,973,487 | |
U.S. Treasury Bill (z) | | | 0.09 | | | | 08/23/2012 | | | | 350,000,000 | | | | 349,981,514 | |
U.S. Treasury Bill (z) | | | 0.09 | | | | 09/13/2012 | | | | 267,000,000 | | | | 266,972,095 | |
U.S. Treasury Bill (z) | | | 0.09 | | | | 09/27/2012 | | | | 200,000,000 | | | | 199,971,421 | |
U.S. Treasury Bill (z) | | | 0.09 | | | | 10/11/2012 | | | | 350,000,000 | | | | 349,936,149 | |
U.S. Treasury Bill (z) | | | 0.09 | | | | 10/18/2012 | | | | 300,000,000 | | | | 299,940,644 | |
U.S. Treasury Bill (z) | | | 0.10 | | | | 10/25/2012 | | | | 200,000,000 | | | | 199,956,184 | |
U.S. Treasury Bill (z) | | | 0.10 | | | | 10/04/2012 | | | | 300,000,000 | | | | 299,945,533 | |
U.S. Treasury Bill (z) | | | 0.13 | | | | 12/06/2012 | | | | 150,000,000 | | | | 149,933,854 | |
U.S. Treasury Bill (z) | | | 0.14 | | | | 01/24/2013 | | | | 100,000,000 | | | | 99,932,533 | |
U.S. Treasury Bill (z) | | | 0.14 | | | | 01/17/2013 | | | | 200,000,000 | | | | 199,869,729 | |
U.S. Treasury Bill (z) | | | 0.14 | | | | 11/29/2012 | | | | 100,000,000 | | | | 99,952,500 | |
U.S. Treasury Bill (z) | | | 0.14 | | | | 12/13/2012 | | | | 200,000,000 | | | | 199,893,917 | |
U.S. Treasury Bill (z) | | | 0.15 | | | | 11/08/2012 | | | | 150,000,000 | | | | 149,940,188 | |
U.S. Treasury Bill (z) | | | 0.15 | | | | 11/23/2012 | | | | 100,000,000 | | | | 99,954,083 | |
U.S. Treasury Bill (z) | | | 0.15 | | | | 01/10/2013 | | | | 250,000,000 | | | | 249,836,875 | |
U.S. Treasury Bill (z) | | | 0.15 | | | | 12/20/2012 | | | | 50,000,000 | | | | 49,971,017 | |
U.S. Treasury Bill (z) | | | 0.15 | | | | 11/01/2012 | | | | 300,000,000 | | | | 299,913,018 | |
U.S. Treasury Bill (z) | | | 0.15 | | | | 12/27/2012 | | | | 100,000,000 | | | | 99,937,306 | |
The accompanying notes are an integral part of these financial statements.
| | | | |
| 8 | | Wells Fargo Advantage Treasury Plus Money Market Fund | | Portfolio of Investments—July 31, 2012 (Unaudited) |
| | | | | | | | | | | | | | | | |
| Security Name | | Interest Rate | | | Maturity Date | | | Principal | | | Value | |
| | | | | | | | | | | | | | | | |
| | | | |
| Treasury Debt (continued) | | | | | | | | | | | | | | | | |
U.S. Treasury Bill (z) | | | 0.15 | % | | | 01/03/2013 | | | $ | 50,000,000 | | | $ | 49,967,170 | |
U.S. Treasury Note | | | 0.50 | | | | 11/30/2012 | | | | 100,000,000 | | | | 100,109,924 | |
U.S. Treasury Note | | | 0.38 | | | | 08/31/2012 | | | | 200,000,000 | | | | 200,044,247 | |
U.S. Treasury Note | | | 0.38 | | | | 09/30/2012 | | | | 20,000,000 | | | | 20,007,639 | |
U.S. Treasury Note | | | 1.13 | | | | 12/15/2012 | | | | 25,000,000 | | | | 25,087,690 | |
U.S. Treasury Note | | | 1.38 | | | | 09/15/2012 | | | | 225,000,000 | | | | 225,345,835 | |
U.S. Treasury Note | | | 1.38 | | | | 11/15/2012 | | | | 50,000,000 | | | | 50,177,292 | |
U.S. Treasury Note | | | 1.75 | | | | 08/15/2012 | | | | 235,000,000 | | | | 235,148,100 | |
U.S. Treasury Note | | | 4.13 | | | | 08/31/2012 | | | | 109,500,000 | | | | 109,858,966 | |
U.S. Treasury Note | | | 4.25 | | | | 09/30/2012 | | | | 50,000,000 | | | | 50,334,325 | |
| | | |
Total Treasury Debt (Cost $5,331,818,163) | | | | | | | | | | | | 5,331,818,163 | |
| | | | | | | | | | | | | | | | |
| | | | | | | | |
| Total Investments in Securities | | | | | | | | |
| (Cost $11,553,793,163) * | | | 103.08 | % | | | 11,553,793,163 | |
Other Assets and Liabilities, Net | | | (3.08 | ) | | | (345,212,364 | ) |
| | | | | | | | |
| Total Net Assets | | | 100.00 | % | | $ | 11,208,580,799 | |
| | | | | | | | |
| | (1) | U.S. government securities, 0.375% to 2.50%, 3/31/2014 to 2/15/2022, fair value including accrued interest is $991,414,578. |
| | (2) | U.S. government securities, 1.375% to 3.125%, 3/31/2013 to 2/15/2042, fair value including accrued interest is $255,000,046. |
| | (3) | U.S. government security, 0.875%, 2/28/2017, fair value including accrued interest is $255,000,009. |
| | (4) | U.S. government securities, 0.25% to 0.75%, 4/30/2014 to 6/30/2017, fair value including accrued interest is $510,000,012. |
| | (5) | U.S. government securities, 0.00% to 8.00%, 11/29/2012 to 11/15/2041, fair value including accrued interest is $255,000,999. |
| | (6) | U.S. government securities, 2.375% to 2.75%, 10/31/2014 to 2/28/2018, fair value including accrued interest is $255,001,304. |
| | (7) | U.S. government securities, 2.75% to 4.125%, 5/15/2015 to 12/31/2017, fair value including accrued interest is $510,004,763. |
| | (8) | U.S. government securities, 0.00% to 4.125%, 1/31/2013 to 11/15/2021, fair value including accrued interest is $255,000,001. |
| | (9) | U.S. government securities, 0.00% to 2.50%, 2/15/2015 to 8/15/2017, fair value including accrued interest is $255,000,022. |
| | (10) | U.S. government securities, 3.875% to 8.75%, 5/15/2017 to 8/15/2040, fair value including accrued interest is $510,000,116. |
| | (11) | U.S. government securities, 1.375% to 4.25%, 3/15/2013 to 8/15/2040, fair value including accrued interest is $765,002,060. |
| | (12) | U.S. government securities, 0.00% to 2.50%, 12/6/2012 to 8/15/2021, fair value including accrued interest is $1,020,000,105. |
| | (13) | U.S. government securities, 0.125% to 3.625%, 4/15/2013 to 4/15/2028, fair value including accrued interest is $510,000,066. |
| (z) | Zero coupon security. Rate represents yield to maturity at time of purchase. |
| * | Cost for federal income tax purposes is substantially the same as for financial reporting purposes. |
The accompanying notes are an integral part of these financial statements.
| | | | | | |
| Statement of Assets and Liabilities—July 31, 2012 (Unaudited) | | Wells Fargo Advantage Treasury Plus Money Market Fund | | | 9 | |
| | | | |
| | | | |
| |
Assets | | | | |
Investments | | | | |
In unaffiliated securities, at amortized cost | | $ | 5,331,818,163 | |
In repurchase agreements, at amortized cost | | | 6,221,975,000 | |
| | | | |
Total investments, at amortized cost | | | 11,553,793,163 | |
Cash | | | 32,815 | |
Receivable for Fund shares sold | | | 100,184 | |
Receivable for interest | | | 6,322,871 | |
Receivable from adviser | | | 1,269,374 | |
Prepaid expenses and other assets | | | 140,171 | |
| | | | |
Total assets | | | 11,561,658,578 | |
| | | | |
| |
Liabilities | | | | |
Dividends payable | | | 62,479 | |
Payable for investments purchased | | | 349,857,363 | |
Payable for Fund shares redeemed | | | 16,816 | |
Distribution fees payable | | | 10,222 | |
Due to other related parties | | | 1,577,869 | |
Accrued expenses and other liabilities | | | 1,553,030 | |
| | | | |
Total liabilities | | | 353,077,779 | |
| | | | |
Total net assets | | $ | 11,208,580,799 | |
| | | | |
| |
NET ASSETS CONSIST OF | | | | |
Paid-in capital | | $ | 11,210,778,114 | |
Overdistributed net investment income | | | (381,312 | ) |
Accumulated net realized losses on investments | | | (1,816,003 | ) |
| | | | |
Total net assets | | $ | 11,208,580,799 | |
| | | | |
| |
COMPUTATION OF NET ASSET VALUE PER SHARE1 | | | | |
Net assets – Class A | | $ | 1,602,759,560 | |
Shares outstanding – Class A | | | 1,602,770,222 | |
Net asset value per share – Class A | | | $1.00 | |
Net assets – Administrator Class | | $ | 184,255,827 | |
Shares outstanding – Administrator Class | | | 184,256,437 | |
Net asset value per share – Administrator Class | | | $1.00 | |
Net assets – Institutional Class | | $ | 7,286,578,546 | |
Shares outstanding – Institutional Class | | | 7,286,567,028 | |
Net asset value per share – Institutional Class | | | $1.00 | |
Net assets – Service Class | | $ | 2,104,603,504 | |
Shares outstanding – Service Class | | | 2,104,609,650 | |
Net asset value per share – Service Class | | | $1.00 | |
Net assets – Sweep Class | | $ | 30,383,362 | |
Shares outstanding – Sweep Class | | | 30,388,362 | |
Net asset value per share – Sweep Class | | | $1.00 | |
| 1. | The Fund has an unlimited number of authorized shares. |
The accompanying notes are an integral part of these financial statements.
| | | | |
| 10 | | Wells Fargo Advantage Treasury Plus Money Market Fund | | Statement of Operations—Six Months Ended July 31, 2012 (Unaudited) |
| | | | |
| | | | |
| |
Investment income | | | | |
Interest | | $ | 7,001,274 | |
| | | | |
| |
Expenses | | | | |
Advisory fee | | | 5,632,490 | |
Administration fees | | | | |
Fund level | | | 2,435,649 | |
Class A | | | 1,831,834 | |
Administrator Class | | | 84,871 | |
Institutional Class | | | 2,963,498 | |
Service Class | | | 1,191,631 | |
Sweep Class | | | 38,834 | |
Shareholder servicing fees | | | | |
Class A | | | 2,071,169 | |
Administrator Class | | | 82,239 | |
Service Class | | | 2,461,822 | |
Sweep Class | | | 44,129 | |
Distribution fees | | | | |
Sweep Class | | | 61,781 | |
Custody and accounting fees | | | 249,564 | |
Professional fees | | | 19,811 | |
Registration fees | | | 27,726 | |
Shareholder report expenses | | | 62,195 | |
Trustees’ fees and expenses | | | 5,817 | |
Other fees and expenses | | | 142,923 | |
| | | | |
Total expenses | | | 19,407,983 | |
Less: Fee waivers and/or expense reimbursements | | | (12,971,519 | ) |
| | | | |
Net expenses | | | 6,436,464 | |
| | | | |
Net investment income | | | 564,810 | |
| | | | |
Net realized gains on investments | | | 379,823 | |
| | | | |
Net increase in net assets resulting from operations | | $ | 944,633 | |
| | | | |
The accompanying notes are an integral part of these financial statements.
| | | | | | |
| Statement of Changes in Net Assets | | Wells Fargo Advantage Treasury Plus Money Market Fund | | | 11 | |
| | | | | | | | | | | | | | | | |
| | | Six Months Ended July 31, 2012
(Unaudited) | | | Year Ended January 31, 2012 | |
| | | | |
Operations | | | | | | | | | | | | | | | | |
Net investment income | | | | | | $ | 564,810 | | | | | | | $ | 1,060,324 | |
Net realized gains on investments | | | | | | | 379,823 | | | | | | | | 36,368 | |
| | | | | | | | | | | | | | | | |
Net increase in net assets resulting from operations | | | | | | | 944,633 | | | | | | | | 1,096,692 | |
| | | | | | | | | | | | | | | | |
| | | | |
Distributions to shareholders from | | | | | | | | | | | | | | | | |
Net investment income | | | | | | | | | | | | | | | | |
Class A | | | | | | | (83,495 | ) | | | | | | | (173,778 | ) |
Administrator Class | | | | | | | (8,510 | ) | | | | | | | (18,627 | ) |
Institutional Class | | | | | | | (371,459 | ) | | | | | | | (645,429 | ) |
Service Class | | | | | | | (99,576 | ) | | | | | | | (216,095 | ) |
Sweep Class | | | | | | | (1,770 | ) | | | | | | | (6,395 | ) |
| | | | | | | | | | | | | | | | |
Total distributions to shareholders | | | | | | | (564,810 | ) | | | | | | | (1,060,324 | ) |
| | | | | | | | | | | | | | | | |
| | | | |
Capital share transactions | | | Shares | | | | | | | | Shares | | | | | |
Proceeds from shares sold | | | | | | | | | | | | | | | | |
Class A | | | 4,479,616,950 | | | | 4,479,616,950 | | | | 7,437,770,255 | | | | 7,437,770,255 | |
Administrator Class | | | 331,084,706 | | | | 331,084,706 | | | | 783,225,197 | | | | 783,225,197 | |
Institutional Class | | | 20,051,318,223 | | | | 20,051,318,223 | | | | 30,134,617,076 | | | | 30,134,617,076 | |
Service Class | | | 3,797,185,596 | | | | 3,797,185,596 | | | | 9,283,414,528 | | | | 9,283,414,528 | |
Sweep Class | | | 17,946,362 | | | | 17,946,362 | | | | 84,523,996 | | | | 84,523,996 | |
| | | | | | | | | | | | | | | | |
| | | | | | | 28,677,151,837 | | | | | | | | 47,723,551,052 | |
| | | | | | | | | | | | | | | | |
Reinvestment of distributions | | | | | | | | | | | | | | | | |
Class A | | | 29,794 | | | | 29,794 | | | | 61,801 | | | | 61,801 | |
Administrator Class | | | 8,351 | | | | 8,351 | | | | 17,560 | | | | 17,560 | |
Institutional Class | | | 172,939 | | | | 172,939 | | | | 242,061 | | | | 242,061 | |
Service Class | | | 9,677 | | | | 9,677 | | | | 22,750 | | | | 22,750 | |
Sweep Class | | | 1,770 | | | | 1,770 | | | | 6,395 | | | | 6,395 | |
| | | | | | | | | | | | | | | | |
| | | | | | | 222,531 | | | | | | | | 350,567 | |
| | | | | | | | | | | | | | | | |
Payment for shares redeemed | | | | | | | | | | | | | | | | |
Class A | | | (4,569,073,846 | ) | | | (4,569,073,846 | ) | | | (7,651,772,462 | ) | | | (7,651,772,462 | ) |
Administrator Class | | | (356,355,057 | ) | | | (356,355,057 | ) | | | (708,731,591 | ) | | | (708,731,591 | ) |
Institutional Class | | | (19,159,055,341 | ) | | | (19,159,055,341 | ) | | | (29,048,349,946 | ) | | | (29,048,349,946 | ) |
Service Class | | | (3,578,163,931 | ) | | | (3,578,163,931 | ) | | | (9,624,205,462 | ) | | | (9,624,205,462 | ) |
Sweep Class | | | (30,423,874 | ) | | | (30,423,874 | ) | | | (132,968,472 | ) | | | (132,968,472 | ) |
| | | | | | | | | | | | | | | | |
| | | | | | | (27,693,072,049 | ) | | | | | | | (47,166,027,933 | ) |
| | | | | | | | | | | | | | | | |
Net increase in net assets resulting from capital share
transactions | | | | | | | 984,302,319 | | | | | | | | 557,873,686 | |
| | | | | | | | | | | | | | | | |
Total increase in net assets | | | | | | | 984,682,142 | | | | | | | | 557,910,054 | |
| | | | | | | | | | | | | | | | |
| | | | |
Net assets | | | | | | | | | | | | | | | | |
Beginning of period | | | | | | | 10,223,898,657 | | | | | | | | 9,665,988,603 | |
| | | | | | | | | | | | | | | | |
End of period | | | | | | $ | 11,208,580,799 | | | | | | | $ | 10,223,898,657 | |
| | | | | | | | | | | | | | | | |
Overdistributed net investment income | | | | | | $ | (381,312 | ) | | | | | | $ | (381,312 | ) |
| | | | | | | | | | | | | | | | |
The accompanying notes are an integral part of these financial statements.
| | | | |
| 12 | | Wells Fargo Advantage Treasury Plus Money Market Fund | | Financial Highlights |
(For a share outstanding throughout each period)
| | | | | | | | | | | | | | | | | | | | | | | | |
| | | Six Months Ended
July 31, 2012
(Unaudited) | | | Year Ended January 31, | | | Year Ended February 28, | |
| Class A | | | 2012 | | | 20111 | | | 2010 | | | 2009 | | | 20082 | |
Net asset value, beginning of period | | $ | 1.00 | | | $ | 1.00 | | | $ | 1.00 | | | $ | 1.00 | | | $ | 1.00 | | | $ | 1.00 | |
Net investment income | | | 0.00 | 3 | | | 0.00 | 3 | | | 0.00 | 3 | | | 0.00 | 3 | | | 0.01 | | | | 0.04 | |
Net realized gains on investments | | | 0.00 | 3 | | | 0.00 | 3 | | | 0.00 | 3 | | | 0.00 | | | | 0.00 | | | | 0.00 | |
| | | | | | | | | | | | | | | | | | | | | | | | |
Total from investment operations | | | 0.00 | 3 | | | 0.00 | 3 | | | 0.00 | 3 | | | 0.00 | 3 | | | 0.01 | | | | 0.04 | |
Distributions to shareholders from | | | | | | | | | | | | | | | | | | | | | | | | |
Net investment income | | | (0.00 | )3 | | | (0.00 | )3 | | | (0.00 | )3 | | | (0.00 | )3 | | | (0.01 | ) | | | (0.04 | ) |
Net asset value, end of period | | $ | 1.00 | | | $ | 1.00 | | | $ | 1.00 | | | $ | 1.00 | | | $ | 1.00 | | | $ | 1.00 | |
Total return4 | | | 0.00 | % | | | 0.01 | % | | | 0.01 | % | | | 0.01 | % | | | 0.79 | % | | | 3.99 | % |
Ratios to average net assets (annualized) | | | | | | | | | | | | | | | | | | | | | | | | |
Gross expenses | | | 0.62 | % | | | 0.62 | % | | | 0.62 | % | | | 0.65 | % | | | 0.66 | % | | | 0.65 | % |
Net expenses | | | 0.11 | % | | | 0.06 | % | | | 0.18 | % | | | 0.17 | % | | | 0.48 | % | | | 0.65 | % |
Net investment income | | | 0.01 | % | | | 0.01 | % | | | 0.01 | % | | | 0.01 | % | | | 0.75 | % | | | 3.95 | % |
Supplemental data | | | | | | | | | | | | | | | | | | | | | | | | |
Net assets, end of period (000’s omitted) | | | $1,602,760 | | | | $1,692,131 | | | | $1,906,066 | | | | $1,600,619 | | | | $2,482,147 | | | | $2,636,076 | |
| 1. | For the eleven months ended January 31, 2011. The Fund changed its fiscal year end from February 28 to January 31, effective January 31, 2011. |
| 2. | Year ended February 29. |
| 3. | Amount is less than $0.005. |
| 4. | Returns for periods of less than one year are not annualized. |
The accompanying notes are an integral part of these financial statements.
| | | | | | |
| Financial Highlights | | Wells Fargo Advantage Treasury Plus Money Market Fund | | | 13 | |
(For a share outstanding throughout each period)
| | | | | | | | | | | | | | | | | | | | |
| | | Six Months Ended
July 31, 2012 (Unaudited) | | | Year Ended January 31, | | | Year Ended February 28, | |
| Administrator Class | | | 2012 | | | 20111 | | | 2010 | | | 20092 | |
Net asset value, beginning of period | | $ | 1.00 | | | $ | 1.00 | | | $ | 1.00 | | | $ | 1.00 | | | $ | 1.00 | |
Net investment income | | | 0.00 | 3 | | | 0.00 | 3 | | | 0.00 | 3 | | | 0.00 | 3 | | | 0.01 | |
Net realized gains on investments | | | 0.00 | 3 | | | 0.00 | 3 | | | 0.00 | 3 | | | 0.00 | | | | 0.00 | |
| | | | | | | | | | | | | | | | | | | | |
Total from investment operations | | | 0.00 | 3 | | | 0.00 | 3 | | | 0.00 | 3 | | | 0.00 | 3 | | | 0.01 | |
Distributions to shareholders from | | | | | | | | | | | | | | | | | | | | |
Net investment income | | | (0.00 | )3 | | | (0.00 | )3 | | | (0.00 | )3 | | | (0.00 | )3 | | | (0.01 | ) |
Net asset value, end of period | | $ | 1.00 | | | $ | 1.00 | | | $ | 1.00 | | | $ | 1.00 | | | $ | 1.00 | |
Total return4 | | | 0.00 | % | | | 0.01 | % | | | 0.01 | % | | | 0.01 | % | | | 0.84 | % |
Ratios to average net assets (annualized) | | | | | | | | | | | | | | | | | | | | |
Gross expenses | | | 0.35 | % | | | 0.35 | % | | | 0.36 | % | | | 0.38 | % | | | 0.39 | % |
Net expenses | | | 0.11 | % | | | 0.05 | % | | | 0.18 | % | | | 0.16 | % | | | 0.30 | % |
Net investment income | | | 0.01 | % | | | 0.01 | % | | | 0.01 | % | | | 0.01 | % | | | 0.73 | % |
Supplemental data | | | | | | | | | | | | | | | | | | | | |
Net assets, end of period (000’s omitted) | | | $184,256 | | | | $209,513 | | | | $135,001 | | | | $180,021 | | | | $132,423 | |
| 1. | For the eleven months ended January 31, 2011. The Fund changed its fiscal year end from February 28 to January 31, effective January 31, 2011. |
| 2. | For the period from March 31, 2008 (commencement of class operations) to February 28, 2009. |
| 3. | Amount is less than $0.005. |
| 4. | Returns for periods of less than one year are not annualized. |
The accompanying notes are an integral part of these financial statements.
| | | | |
| 14 | | Wells Fargo Advantage Treasury Plus Money Market Fund | | Financial Highlights |
(For a share outstanding throughout each period)
| | | | | | | | | | | | | | | | | | | | | | | | |
| | | Six Months Ended
July 31, 2012 (Unaudited) | | | Year Ended January 31, | | | Year Ended February 28, | |
| Institutional Class | | | 2012 | | | 20111 | | | 2010 | | | 2009 | | | 20082 | |
Net asset value, beginning of period | | $ | 1.00 | | | $ | 1.00 | | | $ | 1.00 | | | $ | 1.00 | | | $ | 1.00 | | | $ | 1.00 | |
Net investment income | | | 0.00 | 3 | | | 0.00 | 3 | | | 0.00 | 3 | | | 0.00 | 3 | | | 0.01 | | | | 0.04 | |
Net realized gains on investments | | | 0.00 | 3 | | | 0.00 | 3 | | | 0.00 | 3 | | | 0.00 | | | | 0.00 | | | | 0.00 | |
| | | | | | | | | | | | | | | | | | | | | | | | |
Total from investment operations | | | 0.00 | 3 | | | 0.00 | 3 | | | 0.00 | 3 | | | 0.00 | 3 | | | 0.01 | | | | 0.04 | |
Distributions to shareholders from | | | | | | | | | | | | | | | | | | | | | | | | |
Net investment income | | | (0.00 | )3 | | | (0.00 | )3 | | | (0.00 | )3 | | | (0.00 | )3 | | | (0.01 | ) | | | (0.04 | ) |
Net asset value, end of period | | $ | 1.00 | | | $ | 1.00 | | | $ | 1.00 | | | $ | 1.00 | | | $ | 1.00 | | | $ | 1.00 | |
Total return4 | | | 0.00 | % | | | 0.01 | % | | | 0.01 | % | | | 0.02 | % | | | 1.08 | % | | | 4.45 | % |
Ratios to average net assets (annualized) | | | | | | | | | | | | | | | | | | | | | | | | |
Gross expenses | | | 0.23 | % | | | 0.23 | % | | | 0.24 | % | | | 0.26 | % | | | 0.28 | % | | | 0.26 | % |
Net expenses | | | 0.11 | % | | | 0.06 | % | | | 0.18 | % | | | 0.15 | % | | | 0.20 | % | | | 0.20 | % |
Net investment income | | | 0.01 | % | | | 0.01 | % | | | 0.01 | % | | | 0.02 | % | | | 0.81 | % | | | 4.19 | % |
Supplemental data | | | | | | | | | | | | | | | | | | | | | | | | |
Net assets, end of period (000’s omitted) | | | $7,286,579 | | | | $6,393,891 | | | | $5,307,359 | | | | $4,091,490 | | | | $5,092,437 | | | | $2,951,408 | |
| 1. | For the eleven months ended January 31, 2011. The Fund changed its fiscal year end from February 28 to January 31, effective January 31, 2011. |
| 2. | Year ended February 29. |
| 3. | Amount is less than $0.005. |
| 4. | Returns for periods of less than one year are not annualized. |
The accompanying notes are an integral part of these financial statements.
| | | | | | |
| Financial Highlights | | Wells Fargo Advantage Treasury Plus Money Market Fund | | | 15 | |
(For a share outstanding throughout each period)
| | | | | | | | | | | | | | | | | | | | | | | | |
| | | Six Months Ended
July 31, 2012 (Unaudited) | | | Year Ended January 31, | | | Year Ended February 28, | |
| Service Class | | | 2012 | | | 20111 | | | 2010 | | | 2009 | | | 20082 | |
Net asset value, beginning of period | | $ | 1.00 | | | $ | 1.00 | | | $ | 1.00 | | | $ | 1.00 | | | $ | 1.00 | | | $ | 1.00 | |
Net investment income | | | 0.00 | 3 | | | 0.00 | 3 | | | 0.00 | 3 | | | 0.00 | 3 | | | 0.01 | | | | 0.04 | |
Net realized gains on investments | | | 0.00 | 3 | | | 0.00 | 3 | | | 0.00 | 3 | | | 0.00 | | | | 0.00 | | | | 0.00 | |
| | | | | | | | | | | | | | | | | | | | | | | | |
Total from investment operations | | | 0.00 | 3 | | | 0.00 | 3 | | | 0.00 | 3 | | | 0.00 | 3 | | | 0.01 | | | | 0.04 | |
Distributions to shareholders from | | | | | | | | | | | | | | | | | | | | | | | | |
Net investment income | | | (0.00 | )3 | | | (0.00 | )3 | | | (0.00 | )3 | | | (0.00 | )3 | | | (0.01 | ) | | | (0.04 | ) |
Net asset value, end of period | | $ | 1.00 | | | $ | 1.00 | | | $ | 1.00 | | | $ | 1.00 | | | $ | 1.00 | | | $ | 1.00 | |
Total return4 | | | 0.00 | % | | | 0.01 | % | | | 0.01 | % | | | 0.01 | % | | | 0.88 | % | | | 4.14 | % |
Ratios to average net assets (annualized) | | | | | | | | | | | | | | | | | | | | | | | | |
Gross expenses | | | 0.52 | % | | | 0.52 | % | | | 0.52 | % | | | 0.55 | % | | | 0.56 | % | | | 0.55 | % |
Net expenses | | | 0.11 | % | | | 0.06 | % | | | 0.19 | % | | | 0.17 | % | | | 0.41 | % | | | 0.50 | % |
Net investment income | | | 0.01 | % | | | 0.01 | % | | | 0.01 | % | | | 0.01 | % | | | 0.93 | % | | | 4.11 | % |
Supplemental data | | | | | | | | | | | | | | | | | | | | | | | | |
Net assets, end of period (000’s omitted) | | | $2,104,604 | | | | $1,885,503 | | | | $2,226,264 | | | | $702,363 | | | | $862,686 | | | | $1,187,468 | |
| 1. | For the eleven months ended January 31, 2011. The Fund changed its fiscal year end from February 28 to January 31, effective January 31, 2011. |
| 2. | Year ended February 29. |
| 3. | Amount is less than $0.005. |
| 4. | Returns for periods of less than one year are not annualized. |
The accompanying notes are an integral part of these financial statements.
| | | | |
| 16 | | Wells Fargo Advantage Treasury Plus Money Market Fund | | Financial Highlights |
(For a share outstanding throughout each period)
| | | | | | | | | | | | |
| | | Six Months Ended
July 31, 2012 (Unaudited) | | | Year Ended January 31, | |
| Sweep Class | | | 2012 | | | 20111 | |
Net asset value, beginning of period | | $ | 1.00 | | | $ | 1.00 | | | $ | 1.00 | |
Net investment income | | | 0.00 | 2 | | | 0.00 | 2 | | | 0.00 | 2 |
Net realized gains on investments | | | 0.00 | 2 | | | 0.00 | 2 | | | 0.00 | 2 |
| | | | | | | | | | | | |
Total from investment operations | | | 0.00 | 2 | | | 0.00 | 2 | | | 0.00 | 2 |
Distributions to shareholders from | | | | | | | | | | | | |
Net investment income | | | (0.00 | )2 | | | (0.00 | )2 | | | (0.00 | )2 |
Net asset value, end of period | | $ | 1.00 | | | $ | 1.00 | | | $ | 1.00 | |
Total return3 | | | 0.00 | % | | | 0.01 | % | | | 0.01 | % |
Ratios to average net assets (annualized) | | | | | | | | | | | | |
Gross expenses | | | 0.97 | % | | | 0.97 | % | | | 0.97 | % |
Net expenses | | | 0.11 | % | | | 0.07 | % | | | 0.19 | % |
Net investment income | | | 0.01 | % | | | 0.01 | % | | | 0.01 | % |
Supplemental data | | | | | | | | | | | | |
Net assets, end of period (000’s omitted) | | | $30,383 | | | | $42,861 | | | | $91,299 | |
| 1. | For the period from June 30, 2010 (commencement of class operations) to January 31, 2011. |
| 2. | Amount is less than $0.005. |
| 3. | Returns for periods of less than one year are not annualized. |
The accompanying notes are an integral part of these financial statements.
| | | | | | |
| Notes to Financial Statements (Unaudited) | | Wells Fargo Advantage Treasury Plus Money Market Fund | | | 17 | |
1. ORGANIZATION
Wells Fargo Funds Trust (the “Trust”), a Delaware statutory trust organized on March 10, 1999, is an open-end management investment company registered under the Investment Company Act of 1940, as amended (the “1940 Act”). These financial statements report on Wells Fargo Advantage Treasury Plus Money Market Fund (the “Fund”) which is a diversified series of the Trust.
2. SIGNIFICANT ACCOUNTING POLICIES
The following significant accounting policies, which are consistently followed in the preparation of the financial statements of the Fund, are in conformity with U.S. generally accepted accounting principles which require management to make estimates and assumptions that affect the reported amounts of assets and liabilities, disclosure of contingent assets and liabilities at the date of the financial statements, and the reported amounts of revenues and expenses during the reporting period. Actual results could differ from those estimates.
Securities valuation
As permitted under Rule 2a-7 of the 1940 Act, portfolio securities are valued at amortized cost, which approximates fair value. The amortized cost method involves valuing a security at its cost, plus accretion of discount or minus amortization of premium over the period until maturity.
Investments which are not valued using the method discussed above are valued at their fair value, as determined by procedures established in good faith and approved by the Board of Trustees. The Board of Trustees has established a Valuation Committee comprised of the Trustees and has delegated to it the authority to take any actions regarding the valuation of portfolio securities that the Valuation Committee deems necessary in determining the fair value of portfolio securities, unless the responsibility has been delegated to the Management Valuation Team of Wells Fargo Funds Management, LLC (“Funds Management”). The Board of Trustees retains the authority to make or ratify any valuation decisions or approve any changes to the Valuation Procedures as it deems appropriate. On a quarterly basis, the Board of Trustees considers for ratification any valuation actions taken by the Valuation Committee or the Management Valuation Team.
Valuations of fair valued prices are compared to the next actual sales price when available, or other appropriate market information to assess the continued appropriateness of the fair valuation methodology used. These securities are fair valued on a day-to-day basis, taking into consideration changes to appropriate market information and any significant changes to the input factors considered in the valuation process until there is a readily available price provided on the exchange or by an independent pricing service. Valuations received from an independent pricing service or broker quotes are periodically validated by comparisons to most recent trades and valuations provided by other independent pricing services in addition to the review of prices by the adviser and/or sub-adviser. Unobservable inputs used in determining fair valuations are identified based on the type of security, taking into consideration factors utilized by market participants in valuing the investment, knowledge about the issuer and the current market environment.
Repurchase agreements
The Fund may invest in repurchase agreements and may participate in pooled repurchase agreement transactions with other funds advised by Funds Management. The repurchase agreements must be fully collateralized based on values that are marked-to- market daily. The collateral may be held by an agent bank under a tri-party agreement. It is the custodian’s responsibility to value collateral daily and to take action to obtain additional collateral as necessary to maintain market value equal to or greater than the resale price. The repurchase agreements are collateralized by instruments such as U.S. Treasury, federal agency, or high-grade corporate obligations. There could be potential loss to the Fund in the event that the Fund is delayed or prevented from exercising its rights to dispose of the collateral, including the risk of a possible decline in the value of the underlying obligations during the period in which the Fund seeks to assert its rights.
Security transactions and income recognition
Securities transactions are recorded on a trade date basis. Realized gains or losses are reported on the basis of identified cost of securities delivered.
Interest income is accrued daily and bond discounts are accreted and premiums are amortized daily based on the effective interest method. To the extent debt obligations are placed on non-accrual status, any related interest income
| | | | |
| 18 | | Wells Fargo Advantage Treasury Plus Money Market Fund | | Notes to Financial Statements (Unaudited) |
may be reduced by writing off interest receivables when the collection of all or a portion of interest has become doubtful based on consistently applied procedures. If the issuer subsequently resumes interest payments or when the collectability of interest is reasonably assured, the debt obligation is removed from non-accrual status.
Distributions to shareholders
Distributions to shareholders from net investment income are accrued daily and paid monthly. Distributions from net realized gains, if any, are recorded on the ex-dividend date. Such distributions are determined in conformity with income tax regulations, which may differ from generally accepted accounting principles.
Federal and other taxes
The Fund intends to continue to qualify as a regulated investment company by distributing substantially all of its investment company taxable income and any net realized capital gains (after reduction for capital loss carryforwards) sufficient to relieve it from all, or substantially all, federal income taxes. Accordingly, no provision for federal income taxes was required.
The Fund’s income and federal excise tax returns and all financial records supporting those returns for the prior three fiscal years are subject to examination by the federal and Delaware revenue authorities. Management has analyzed the Fund’s tax positions taken on federal, state, and foreign tax returns for all open tax years and does not believe that there are any uncertain tax positions that require recognition of a tax liability.
As of January 31, 2012, the Fund had net capital loss carryforwards, which were available to offset future net realized capital gains, in the amount of $2,195,826 with $2,176,255 expiring in 2013 and $19,571 expiring in 2017.
Class allocations
The separate classes of shares offered by the Fund differ principally in distribution, shareholder servicing and administration fees. Shareholders of each class bear certain expenses that pertain to that particular class. All shareholders bear the common expenses of the Fund, earn income from the portfolio, and are allocated any unrealized gains and losses pro rata based on the average daily net assets of each class, without distinction between share classes. Dividends are determined separately for each class based on income and expenses allocable to each class. Realized gains and losses are allocated to each class pro rata based upon the net assets of each class on the date realized. Differences in per share dividend rates generally result from the relative weightings of pro rata income and realized gain allocations and from differences in separate class expenses, including distribution, shareholder servicing and administration fees.
3. FAIR VALUATION MEASUREMENTS
Fair value measurements of investments are determined within a framework that has established a fair value hierarchy based upon the various data inputs utilized in determining the value of the Fund’s investments. The three-level hierarchy gives the highest priority to unadjusted quoted prices in active markets for identical assets or liabilities (Level 1) and the lowest priority to significant unobservable inputs (Level 3). The Fund’s investments are classified within the fair value hierarchy based on the lowest level of input that is significant to the fair value measurement. The inputs are summarized into three broad levels as follows:
| n | | Level 1 – quoted prices in active markets for identical securities |
| n | | Level 2 – other significant observable inputs (including quoted prices for similar securities, interest rates, prepayment speeds, credit risk, etc.) |
| n | | Level 3 – significant unobservable inputs (including the Fund’s own assumptions in determining the fair value of investments) |
The inputs or methodologies used for valuing securities are not necessarily an indication of the risk associated with investing in those securities.
At July 31, 2012, all of the Fund’s investments in securities carried at fair value were designated as Level 2 since the primary inputs include credit quality of the issuer and short-term interest rates which are observable.
Further details on the major security types can be found in the Portfolio of Investments.
| | | | | | |
| Notes to Financial Statements (Unaudited) | | Wells Fargo Advantage Treasury Plus Money Market Fund | | | 19 | |
Transfers in and transfers out are recognized at the end of the reporting period. For the six months ended July 31, 2012, the Fund did not have any transfers into/out of Level 1 and Level 2.
4. TRANSACTIONS WITH AFFILIATES AND OTHER EXPENSES
Advisory fee
The Trust has entered into an advisory contract with Funds Management, an indirect wholly owned subsidiary of Wells Fargo & Company (“Wells Fargo”). The adviser is responsible for implementing investment policies and guidelines and for supervising the sub-adviser, who is responsible for day-to-day portfolio management of the Fund.
Pursuant to the contract, Funds Management is entitled to receive an annual advisory fee of 0.10% of the Fund’s average daily net assets.
Funds Management has retained the services of a sub-adviser to provide daily portfolio management to the Fund. The fee for sub-advisory services is borne by Funds Management. Wells Capital Management Incorporated, an affiliate of Funds Management, is the sub-adviser to the Fund and is entitled to receive a fee from Funds Management at an annual rate starting at 0.05% and declining to 0.01% as the average daily net assets of the Fund increase.
Administration and transfer agent fees
The Trust has entered into an administration agreement with Funds Management. Under this agreement, for providing administrative services, which includes paying fees and expenses for services provided by the transfer agent, sub-transfer agents, omnibus account servicers and record-keepers, Funds Management is entitled to receive from the Fund an annual fund level administration fee starting at 0.05% and declining to 0.03% as the average daily net assets of the Fund increase and a class level administration fee which is calculated based on the average daily net assets of each class as follows:
| | | | |
| | | Class Level Administration Fee | |
Class A, Sweep Class | | | 0.22 | % |
Administrator Class | | | 0.10 | |
Institutional Class | | | 0.08 | |
Service Class | | | 0.12 | |
Funds Management has contractually waived and/or reimbursed advisory and administration fees to the extent necessary to maintain certain net operating expense ratios for the Fund. Waiver of fees and/or reimbursement of expenses by Funds Management were made first from fund level expenses on a proportionate basis and then from class specific expenses. Funds Management has committed through July 11, 2013 to waive fees and/or reimburse expenses to the extent necessary to cap the Fund’s expenses at 0.65% for Class��A, 0.35% for Administrator Class, 0.20% for Institutional Class, 0.45% for Service Class and 1.00% for Sweep Class.
Distribution fees
The Trust has adopted a Distribution Plan for Sweep Class shares of the Fund pursuant to Rule 12b-1 under the 1940 Act. Distribution fees are charged to Sweep Class shares and paid to Wells Fargo Funds Distributor, LLC, the principal underwriter, at an annual rate of 0.35% of its average daily net assets.
Shareholder servicing fees
The Trust has entered into contracts with one or more shareholder servicing agents, whereby Class A, Service Class and Sweep Class of the Fund is charged a fee at an annual rate of 0.25% of the respective average daily net assets of each class. Administrator Class is charged a fee at an annual rate of 0.10% of its average daily net assets.
A portion of these total shareholder servicing fees were paid to affiliates of Wells Fargo.
| | | | |
| 20 | | Wells Fargo Advantage Treasury Plus Money Market Fund | | Notes to Financial Statements (Unaudited) |
5. INDEMNIFICATION
Under the Trust’s organizational documents, the officers and directors are indemnified against certain liabilities that may arise out of performance of their duties to the Trust. Additionally, in the normal course of business, the Trust may enter into contracts with service providers that contain a variety of indemnification clauses. The Trust’s maximum exposure under these arrangements is dependent on future claims that may be made against the Fund and, therefore, cannot be estimated.
6. NEW ACCOUNTING PRONOUNCEMENT
In December 2011, the Financial Accounting Standards Board (“FASB”) issued Accounting Standard Update (“ASU”) No. 2011-11, Disclosures about Offsetting Assets and Liabilities. ASU 2011-11, which amends FASB ASC Topic 210, Balance Sheet, creates new disclosure requirements which require entities to disclose both gross and net information for derivatives and other financial instruments that are either offset in the Statement of Assets and Liabilities or subject to an enforceable master netting arrangement or similar agreement. The disclosure requirements are effective for interim and annual reporting periods beginning on or after January 1, 2013. Management is currently assessing the potential impact, in addition to expanded financial statement disclosure, that may result from adopting this ASU.
| | | | | | |
| Other Information (Unaudited) | | Wells Fargo Advantage Treasury Plus Money Market Fund | | | 21 | |
PROXY VOTING INFORMATION
A description of the policies and procedures that the Fund uses to determine how to vote proxies relating to portfolio securities is available without charge, upon request, by calling 1-800-222-8222, visiting our Web site at wellsfargoadvantagefunds.com, or visiting the SEC Web site at sec.gov. Information regarding how the Fund voted proxies relating to portfolio securities during the most recent 12-month period ended June 30 is available without charge on the Fund’s Web site at wellsfargoadvantagefunds.com or by visiting the SEC Web site at sec.gov.
PORTFOLIO HOLDINGS INFORMATION
The complete portfolio holdings for the Fund are publicly available on the Fund’s Web site (wellsfargoadvantagefunds.com) on a monthly, seven day delayed basis. The Fund files its complete schedule of portfolio holdings with the SEC for the first and third quarters of each fiscal year on Form N-Q, which is available without charge by visiting the SEC Web site at sec.gov. In addition, the Fund’s Form N-Q may be reviewed and copied at the SEC’s Public Reference Room in Washington, DC, and at regional offices in New York City, at 233 Broadway, and in Chicago, at 175 West Jackson Boulevard, Suite 900. Information about the Public Reference Room may be obtained by calling 1-800-SEC-0330.
| | | | |
| 22 | | Wells Fargo Advantage Treasury Plus Money Market Fund | | Other Information (Unaudited) |
BOARD OF TRUSTEES AND OFFICERS
Each of the Trustees and Officers listed in the table below acts in identical capacities for the Wells Fargo Advantage family of funds, which consists of 138 funds comprising the Wells Fargo Funds Trust, Wells Fargo Variable Trust, Wells Fargo Master Trust and four closed-end funds (collectively the “Fund Complex”). This table should be read in conjunction with the Prospectus and the Statement of Additional Information1. All of the Trustees are also Members of the Audit and Governance Committees of each Trust in the Fund Complex. The mailing address of each Trustee and Officer is 525 Market Street, 12th Floor, San Francisco, CA 94105. Each Trustee and Officer serves an indefinite term, however, each Trustee serves such term until reaching the mandatory retirement age established by the Trustees.
Independent Trustees
| | | | | | |
Name and Year of Birth | | Position Held and Length of Service* | | Principal Occupations During Past Five Years | | Other Directorships During
Past Five Years |
Peter G. Gordon
(Born 1942) | | Trustee, since 1998, Chairman, since 2005 | | Co-Founder, Retired Chairman, President and CEO of Crystal Geyser Water Company. Trustee Emeritus, Colby College | | Asset Allocation Trust |
Isaiah Harris, Jr.
(Born 1952) | | Trustee, since 2009 | | Retired. Prior thereto, President and CEO of BellSouth Advertising and Publishing Corp. from 2005 to 2007, President and CEO of BellSouth Enterprises from 2004 to 2005 and President of BellSouth Consumer Services from 2000 to 2003. Emeritus member of the Iowa State University Foundation Board of Governors. Emeritus Member of the Advisory Board of Iowa State University School of Business. Mr. Harris is a certified public accountant. | | CIGNA Corporation; Deluxe Corporation; Asset Allocation Trust |
Judith M. Johnson
(Born 1949) | | Trustee, since 2008 Audit Committee Chairman, since 2008 | | Retired. Prior thereto, Chief Executive Officer and Chief Investment Officer of Minneapolis Employees Retirement Fund from 1996 to 2008. Ms. Johnson is an attorney, certified public accountant and a certified managerial accountant. | | Asset Allocation Trust |
Leroy Keith, Jr.
(Born 1939) | | Trustee, since 2010 | | Chairman, Bloc Global Services (development and construction). Trustee of the Evergreen Funds from 1983 to 2010. Former Managing Director, Almanac Capital Management (commodities firm), former Partner, Stonington Partners, Inc. (private equity fund), former Director, Obagi Medical Products Co. and former Director, Lincoln Educational Services. | | Trustee, Virtus Fund Complex (consisting of 40 portfolios as of 12/31/11); Asset Allocation Trust |
David F. Larcker
(Born 1950) | | Trustee, since 2009 | | James Irvin Miller Professor of Accounting at the Graduate School of Business, Stanford University, Director of Corporate Governance Research Program and Senior Faculty of The Rock Center for Corporate Governance since 2006. From 2005 to 2008, Professor of Accounting at the Graduate School of Business, Stanford University. Prior thereto, Ernst & Young Professor of Accounting at The Wharton School, University of Pennsylvania from 1985 to 2005. | | Asset Allocation Trust |
Olivia S. Mitchell
(Born 1953) | | Trustee, since 2006 | | International Foundation of Employee Benefit Plans Professor, Wharton School of the University of Pennsylvania since 1993. Director of Wharton’s Pension Research Council and Boettner Center on Pensions & Retirement Research, and Research Associate at the National Bureau of Economic Research. Previously, Cornell University Professor from 1978 to 1993. | | Asset Allocation Trust |
Timothy J. Penny
(Born 1951) | | Trustee, since 1996 | | President and CEO of Southern Minnesota Initiative Foundation, a non-profit organization, since 2007 and Senior Fellow at the Humphrey Institute Policy Forum at the University of Minnesota since 1995. Member of the Board of Trustees of NorthStar Education Finance, Inc., a non-profit organization, since 2007. | | Asset Allocation Trust |
| | | | | | |
| Other Information (Unaudited) | | Wells Fargo Advantage Treasury Plus Money Market Fund | | | 23 | |
| | | | | | |
Name and Year of Birth | | Position Held and Length of Service* | | Principal Occupations During Past Five Years | | Other Directorships During
Past Five Years |
Michael S. Scofield
(Born 1943) | | Trustee, since 2010 | | Served on the Investment Company Institute’s Board of Governors and Executive Committee from 2008-2011 as well the Governing Council of the Independent Directors Council from 2006-2011 and the Independent Directors Council Executive Committee from 2008-2011. Chairman of the IDC from 2008-2010. Institutional Investor (Fund Directions) Trustee of Year in 2007. Trustee of the Evergreen Funds (and its predecessors) from 1984 to 2010. Chairman of the Evergreen Funds from 2000-2010. Former Trustee of the Mentor Funds. Retired Attorney, Law Offices of Michael S. Scofield and former Director and Chairman, Branded Media Corporation (multi-media branding company). | | Asset Allocation Trust |
Donald C. Willeke
(Born 1940) | | Trustee, since 1996 | | Principal of the law firm of Willeke & Daniels. General Counsel of the Minneapolis Employees Retirement Fund from 1984 until its consolidation into the Minnesota Public Employees Retirement Association on June 30, 2010. Director and Vice Chair of The Free Trust (non-profit corporation). Director of the American Chestnut Foundation (non-profit corporation). | | Asset Allocation Trust |
| * | Length of service dates reflect the Trustee’s commencement of service with the Trust’s predecessor entities, where applicable. |
Officers
| | | | | | |
Name and Year of Birth | | Position Held and
Length of Service | | Principal Occupations During Past Five Years | | |
Karla M. Rabusch
(Born 1959) | | President, since 2003 | | Executive Vice President of Wells Fargo Bank, N.A. and President of Wells Fargo Funds Management, LLC since 2003. Senior Vice President and Chief Administrative Officer of Wells Fargo Funds Management, LLC from 2001 to 2003. | | |
C. David Messman
(Born 1960) | | Secretary, since 2000; Chief Legal Officer, since 2003 | | Senior Vice President and Secretary of Wells Fargo Funds Management, LLC since 2001. Vice President and Managing Senior Counsel of Wells Fargo Bank, N.A. since 1996. | | |
Nancy Wiser (Born 1967) | | Treasurer, since 2012 | | Executive Vice President of Wells Fargo Funds Management, LLC since 2011. Chief Operating Officer and Chief Compliance Officer at LightBox Capital Management LLC, from 2008 to 2011. Owned and operated a consulting business providing services to various hedge funds including acting as Chief Operating Officer and Chief Compliance Officer for a hedge fund from 2007 to 2008. Chief Operating Officer and Chief Compliance Officer of GMN Capital LLC from 2006 to 2007. | | |
David Berardi
(Born 1975) | | Assistant Treasurer, since 2009 | | Vice President of Wells Fargo Funds Management, LLC since 2009. Vice President of Evergreen Investment Management Company, LLC from 2008 to 2010. Assistant Vice President of Evergreen Investment Services, Inc. from 2004 to 2008. Manager of Fund Reporting and Control for Evergreen Investment Management Company, LLC from 2004 to 2010. | | |
Jeremy DePalma
(Born 1974) | | Assistant Treasurer, since 2009 | | Senior Vice President of Wells Fargo Funds Management, LLC since 2009. Senior Vice President of Evergreen Investment Management Company, LLC from 2008 to 2010. Vice President, Evergreen Investment Services, Inc. from 2004 to 2007. Head of the Fund Reporting and Control Team within Fund Administration from 2005 to 2010. | | |
Debra Ann Early
(Born 1964) | | Chief Compliance Officer, since 2007 | | Chief Compliance Officer of Wells Fargo Funds Management, LLC since 2007. Chief Compliance Officer of Parnassus Investments from 2005 to 2007. Chief Financial Officer of Parnassus Investments from 2004 to 2007 and Senior Audit Manager of PricewaterhouseCoopers LLP from 1998 to 2004. | | |
| 1. | The Statement of Additional Information includes additional information about the Trustees and is available, without charge, upon request, by calling 1-800-222-8222 or by visiting the Web site at wellsfargoadvantagefunds.com. |
| | | | |
| 24 | | Wells Fargo Advantage Treasury Plus Money Market Fund | | Other Information (Unaudited) |
BOARD CONSIDERATION OF INVESTMENT ADVISORY AND SUB-ADVISORY AGREEMENTS:
Under Section 15 of the Investment Company Act of 1940 (the “1940 Act”), the Board of Trustees (the “Board”) of Wells Fargo Funds Trust (the “Trust”), all the members of which have no direct or indirect interest in the investment advisory and sub-advisory agreements and are not “interested persons” of the Trust, as defined in the 1940 Act (the “Independent Trustees”), must determine whether to approve the continuation of the Trust’s investment advisory and sub-advisory agreements. In this regard, at an in person meeting held on March 29-30, 2012 (the “Meeting”), the Board reviewed and re-approved: (i) an investment advisory agreement with Wells Fargo Funds Management, LLC (“Funds Management”) for Wells Fargo Advantage Treasury Plus Money Market Fund (the “Fund”) and (ii) an investment sub-advisory agreement with Wells Capital Management Incorporated (“Wells Capital Management”) for the Fund. The investment advisory agreement with Funds Management and the investment sub-advisory agreement with Wells Capital Management are collectively referred to as the “Advisory Agreements.”
At the Meeting, the Board considered the factors and reached the conclusions described below relating to the selection of Funds Management and Wells Capital Management and the continuation of the Advisory Agreements. Prior to the Meeting, the Trustees conferred extensively among themselves and with representatives of Funds Management about these matters. The Board also met throughout the year and received information that was useful to them in considering the continuation of the Advisory Agreements. The Independent Trustees were assisted in their evaluation of the Advisory Agreements by independent legal counsel, from whom they received separate legal advice and with whom they met separately from Funds Management.
In providing information to the Board, Funds Management and Wells Capital Management were guided by a detailed set of requests submitted by the Independent Trustees’ independent legal counsel on their behalf at the start of the Board’s annual contract renewal process earlier in 2012. In approving the Advisory Agreements, the Board did not identify any particular information or consideration that was all-important or controlling, and each Trustee likely attributed different weights to various factors.
Nature, extent and quality of services
The Board received and considered various information regarding the nature, extent and quality of services provided to the Fund by Funds Management and Wells Capital Management under the Advisory Agreements. The Board also received and considered, among other things, information about the background and experience of senior management of Funds Management, and the qualifications, backgrounds, tenures and responsibilities of the portfolio managers primarily responsible for the day-to-day portfolio management of the Fund.
The Board evaluated the ability of Funds Management and Wells Capital Management, based on their respective financial condition, resources, reputation and other attributes, to attract and retain qualified investment professionals, including research, advisory, and supervisory personnel. The Board further considered the compliance programs and compliance records of Funds Management and Wells Capital Management. In addition, the Board took into account the administrative services provided to the Fund by Funds Management and its affiliates.
The Board’s decision to approve the continuation of the Advisory Agreements was based on a comprehensive evaluation of information provided to it. In considering these matters, the Board considered not only the specific information presented in connection with the Meeting, but also the knowledge gained over time through interaction with Funds Management and Wells Capital Management about various topics, including Funds Management’s oversight of service providers. The above factors, together with those referenced below, are some of the most important, but not necessarily all, factors considered by the Board in concluding that the nature, extent and quality of the investment advisory services provided to the Fund by Funds Management and Wells Capital Management supported the re-approval of the Advisory Agreements. Although the Board considered the continuation of the Advisory Agreements for the Fund as part of the larger process of considering the continuation of the advisory agreements for all of the funds in the complex, its decision to continue the Advisory Agreements for the Fund was ultimately made on a fund-by-fund basis.
Fund performance and expenses
The Board considered the performance results for the Fund over various time periods ended December 31, 2011. The Board also considered these results in comparison to the median performance of a universe of relevant funds (the “Universe”) that was determined by Lipper Inc. (“Lipper”) to be similar to the Fund, and in comparison to the Fund’s
| | | | | | |
| Other Information (Unaudited) | | Wells Fargo Advantage Treasury Plus Money Market Fund | | | 25 | |
benchmark index and to other comparative data. Lipper is an independent provider of investment company data. The Board received a description of the methodology used by Lipper to select the mutual funds in the Universe. The Board noted that the performance of the Fund was equal to or in range of the median performance of the Universe for all periods under review. The Board also noted that the performance of the Fund was equal to or in range of its benchmark, the Lipper U.S. Treasury Money Market Funds Index, for the periods under review.
The Board received and considered information regarding the Fund’s contractual advisory fee and net operating expense ratios and their various components, including actual management fees (which reflect fee waivers, if any), transfer agent, custodian and other non-management fees, Rule 12b-1 and non-Rule 12b-1 fees, service fees and fee waiver and expense reimbursement arrangements. The Board also considered these ratios in comparison to the median ratios of an expense Universe and a narrower expense group of mutual funds (each, an “Expense Group”) that was determined by Lipper to be similar to the Fund. The Board received a description of the methodology used by Lipper to select the mutual funds in the Fund’s Expense Group. The Board noted that the net operating expense ratios of the Fund were higher than the Fund’s Expense Group’s median net operating expense ratios, except for the Institutional Class.
Funds Management advised the Board that the Expense Group medians reflected voluntary waivers, whereas the Fund’s expense ratios did not reflect voluntary waivers. The Board noted that when the Fund’s expense ratios were adjusted to reflect voluntary waivers, the Fund’s net operating expense ratios were lower than the median net operating expense ratios of the Expense Group. The Board viewed favorably Funds Management’s proposal to lower the net operating expense cap of the Fund’s Sweep Class by five basis points.
Based on the above-referenced considerations and other factors, the Board concluded that the overall performance and expense structure of the Fund supported the re-approval of the Advisory Agreements for the Fund.
Investment advisory and sub-advisory fee rates
The Board reviewed and considered the contractual investment advisory fee rate that is payable by the Fund to Funds Management for investment advisory services (the “Advisory Agreement Rate”), both on a stand-alone basis and on a combined basis with the Fund’s administration fee rate. The Board took into account the separate administrative and other services covered by the administration fee rate. The Board also reviewed and considered the contractual investment sub-advisory fee rate that is payable by Funds Management to Wells Capital Management for investment sub-advisory services (the “Sub-Advisory Agreement Rate”). In addition, the Board reviewed and considered the existing fee waiver/cap arrangements applicable to the Advisory Agreement Rate and considered the Advisory Agreement Rate after taking the waivers/caps into account (the “Net Advisory Rate”).
The Board received and considered information comparing the Advisory Agreement Rate and Net Advisory Rate, combined with the administration fee rates, with those of other funds in the Fund’s Expense Group median. The Board noted that the Advisory Agreement Rate for the Fund was equal to or in range of the median rates for the Fund’s Expense Group. The Board also noted that the Net Advisory Rate for the Fund was higher than the median rates for the Fund’s Expense Group, except for the Institutional Class. The Board viewed favorably Funds Management’s willingness to voluntarily waive certain fees and its proposal to lower the net operating expense cap for the Sweep Class.
The Board also received and considered information about the nature and extent of services offered and fee rates charged by Funds Management and Wells Capital Management to other types of clients. In this regard, the Board received information about differences between the services, and the compliance, reporting, and other legal burdens and risks of providing investment advice to mutual funds and those associated with providing advice to non-mutual fund clients such as collective funds or institutional separate accounts.
The Board determined that the Advisory Agreement Rate for the Fund, both with and without the administration fee rate and before and after waivers, was reasonable in light of the Fund’s Expense Group information, the net expense ratio commitments, the services covered by the Advisory Agreements and other information provided. The Board also reviewed and considered the Sub-Advisory Agreement Rate and concluded that the Sub-Advisory Agreement Rate was reasonable in light of the services covered by the sub-advisory agreement and other information provided.
Profitability
The Board received and considered a profitability analysis of Funds Management, as well as an analysis of the profitability to the collective Wells Fargo businesses that provide services to the Fund. It considered that the information provided to
| | | | |
| 26 | | Wells Fargo Advantage Treasury Plus Money Market Fund | | Other Information (Unaudited) |
it was necessarily estimated, and that the profitability information provided to it, especially on a fund-by-fund basis, did not necessarily provide a precise tool for evaluating the appropriateness of the Fund’s Advisory Agreement Rate in isolation. It noted that the levels of profitability reported on a fund-by-fund basis varied widely, depending on, among other things, the size and type of fund. The Board noted the impact of voluntary fee waivers on Funds Management’s profitability. The Board concluded that the profitability reported by Funds Management was not unreasonable.
The Board did not consider separate profitability information with respect to Wells Capital Management, because, as an affiliate of Funds Management, its profitability information was subsumed in the collective Wells Fargo profitability analysis provided by Funds Management.
Economies of scale
With respect to possible economies of scale, the Board reviewed the breakpoints in the Fund’s advisory fee and/or administration fee structure, which operate generally to reduce the expenses of the Fund (as a percentage of Fund assets) as the Fund grows in size. It considered that, as a fund shrinks in size, breakpoints conversely result in increasing fee levels. The Board noted that it would have on-going opportunities to review the appropriate levels of breakpoints in the future, and concluded that the breakpoints as implemented appeared to be a reasonable step toward sharing economies of scale, if any, with the Fund. However, the Board acknowledged the inherent limitations of any analysis of economies of scale and of any attempt to correlate breakpoints with such economies, stemming largely from the Board’s understanding that economies of scale are realized, if at all, across a variety of products and services, not just with respect to a single fund.
Other benefits to Funds Management and Wells Capital Management
The Board received and considered information regarding potential “fall-out” or ancillary benefits received by Funds Management and its affiliates, including Wells Capital Management, as a result of their relationship with the Fund. Ancillary benefits could include, among others, benefits directly attributable to the relationship of Funds Management and Wells Capital Management with the Fund and benefits potentially derived from an increase in Funds Management’s and Wells Capital Management’s business as a result of their relationship with the Fund (such as the ability to market to shareholders other financial products offered by Funds Management and its affiliates, including Wells Capital Management).
The Board considered that Wells Fargo Funds Distributor, LLC, an affiliate of Funds Management, serves as distributor to the Fund and receives certain compensation for those services. The Board noted that various financial institutions, including affiliates of Funds Management, may receive distribution-related fees, shareholder servicing payments (including amounts derived from payments under Rule 12b-1 plans) and sub-transfer agency fees in respect of shares sold or held through them and services provided.
The Board also reviewed information about whether and to what extent soft dollar credits are sought and how any such credits are utilized and any benefits that may be realized by using an affiliated broker.
Other factors and broader review
The Board also considered the markets for distribution of the Fund’s shares, including the channels through which the Fund’s shares are offered and sold. The Board noted that the Fund is part of one of the few fund families that have both direct-to-fund and intermediary distribution channels. As discussed above, the Board reviews detailed materials received from Funds Management and Wells Capital Management annually as part of the re-approval process under Section 15 of the 1940 Act and also reviews and assesses information about the quality of the services that the Fund receives throughout the year. In this regard, the Board has reviewed reports of Funds Management at each of its quarterly meetings, which include, among other things, portfolio reviews and performance reports. In addition, the Board confers with portfolio managers at various times throughout the year.
Conclusion
After considering the above-described factors and based on its deliberations and its evaluation of the information described above, the Board unanimously approved the continuation of the Advisory Agreements for an additional one-year period.
| | | | | | |
| List of Abbreviations | | Wells Fargo Advantage Treasury Plus Money Market Fund | | | 27 | |
The following is a list of common abbreviations for terms and entities which may have appeared in this report.
| ACB | — Agricultural Credit Bank |
| ADR | — American Depository Receipt |
| ADS | — American Depository Shares |
| AGC-ICC | — Assured Guaranty Corporation - Insured Custody Certificates |
| AGM | — Assured Guaranty Municipal |
| AMBAC | — American Municipal Bond Assurance Corporation |
| AMT | — Alternative Minimum Tax |
| BAN | — Bond Anticipation Notes |
| BHAC | — Berkshire Hathaway Assurance Corporation |
| CAB | — Capital Appreciation Bond |
| CCAB | — Convertible Capital Appreciation Bond |
| CDA | — Community Development Authority |
| CDO | — Collateralized Debt Obligation |
| COP | — Certificate of Participation |
| DRIVER | — Derivative Inverse Tax-Exempt Receipts |
| DW&P | — Department of Water & Power |
| DWR | — Department of Water Resources |
| ECFA | — Educational & Cultural Facilities Authority |
| EDA | — Economic Development Authority |
| EDFA | — Economic Development Finance Authority |
| ETF | — Exchange-Traded Fund |
| FFCB | — Federal Farm Credit Bank |
| FGIC | — Financial Guaranty Insurance Corporation |
| FGLMC | — Federal Government Loan Mortgage Company |
| FHA | — Federal Housing Authority |
| FHLB | — Federal Home Loan Bank |
| FHLMC | — Federal Home Loan Mortgage Corporation |
| FICO | — The Financing Corporation |
| FNMA | — Federal National Mortgage Association |
| GDR | — Global Depository Receipt |
| GNMA | — Government National Mortgage Association |
| HCFR | — Healthcare Facilities Revenue |
| HEFA | — Health & Educational Facilities Authority |
| HEFAR | — Higher Education Facilities Authority Revenue |
| HFA | — Housing Finance Authority |
| HFFA | — Health Facilities Financing Authority |
| IBC | — Insured Bond Certificate |
| IDA | — Industrial Development Authority |
| IDAG | — Industrial Development Agency |
| IDR | — Industrial Development Revenue |
| KRW | — Republic of Korea Won |
| LIBOR | — London Interbank Offered Rate |
| LLC | — Limited Liability Company |
| LLP | — Limited Liability Partnership |
| MBIA | — Municipal Bond Insurance Association |
| MFHR | — Multi-Family Housing Revenue |
| MSTR | — Municipal Securities Trust Receipts |
| MUD | — Municipal Utility District |
| NATL-RE | — National Public Finance Guarantee Corporation |
| PCFA | — Pollution Control Finance Authority |
| PCR | — Pollution Control Revenue |
| PFA | — Public Finance Authority |
| PFFA | — Public Facilities Financing Authority |
| PFOTER | — Puttable Floating Option Tax-Exempt Receipts |
| plc | — Public Limited Company |
| PUTTER | — Puttable Tax-Exempt Receipts |
| R&D | — Research & Development |
| RDA | — Redevelopment Authority |
| RDFA | — Redevelopment Finance Authority |
| REIT | — Real Estate Investment Trust |
| ROC | — Reset Option Certificates |
| SAVRS | — Select Auction Variable Rate Securities |
| SBA | — Small Business Authority |
| SFHR | — Single Family Housing Revenue |
| SFMR | — Single Family Mortgage Revenue |
| SPA | — Standby Purchase Agreement |
| SPDR | — Standard & Poor’s Depositary Receipts |
| STRIPS | — Separate Trading of Registered Interest and Principal Securities |
| TAN | — Tax Anticipation Notes |
| TIPS | — Treasury Inflation-Protected Securities |
| TRAN | — Tax Revenue Anticipation Notes |
| TCR | — Transferable Custody Receipts |
| TTFA | — Transportation Trust Fund Authority |
| TVA | — Tennessee Valley Authority |
| XLCA | — XL Capital Assurance |
This page is intentionally left blank.
This page is intentionally left blank.
This page is intentionally left blank.


FOR MORE INFORMATION
More information about Wells Fargo Advantage Funds is available free upon request. To obtain literature, please write, e-mail, visit the Fund’s Web site, or call:
Wells Fargo Advantage Funds
P.O. Box 8266
Boston, MA 02266-8266
E-mail: wfaf@wellsfargo.com
Web site: wellsfargoadvantagefunds.com
Individual investors: 1-800-222-8222
Retail investment professionals: 1-888-877-9275
Institutional investment professionals: 1-866-765-0778
This report and the financial statements contained herein are submitted for the general information of the shareholders of Wells Fargo Advantage Funds. If this report is used for promotional purposes, distribution of the report must be accompanied or preceded by a current prospectus. For a current prospectus and, if available, a summary prospectus containing more complete information, including charges and expenses, call 1-800-222-8222 or visit the Fund’s Web site at wellsfargoadvantagefunds.com. Please consider the investment objectives, risks, charges, and expenses of the investment carefully before investing. This and other information about Wells Fargo Advantage Funds can be found in the current prospectus. Read the prospectus carefully before you invest or send money.
Wells Fargo Funds Management, LLC, a wholly owned subsidiary of Wells Fargo & Company, provides investment advisory and administrative services for Wells Fargo Advantage Funds. Other affiliates of Wells Fargo & Company provide subadvisory and other services for the Funds. The Funds are distributed by Wells Fargo Funds Distributor, LLC, Member FINRA/SIPC, an affiliate of Wells Fargo & Company.
NOT FDIC INSURED ¡ NO BANK GUARANTEE ¡ MAY LOSE VALUE
© 2012 Wells Fargo Funds Management, LLC. All rights reserved.
| | |
 | | 211395 09-12 SA314/SAR314 07-12 |
Not required in this filing
| ITEM 3. | AUDIT COMMITTEE FINANCIAL EXPERT |
Not required in this filing.
| ITEM 4. | PRINCIPAL ACCOUNTANT FEES AND SERVICES |
Not required in this filing.
| ITEM 5. | AUDIT COMMITTEE OF LISTED REGISTRANTS |
Not required in this filing.
| ITEM 6. | PORTFOLIO OF INVESTMENTS |
| | | | | | |
| Portfolio of Investments—July 31, 2012 (Unaudited) | | Wells Fargo Advantage Money Market Fund | | | 1 | |
| | | | | | | | | | | | | | | | |
| Security Name | | Interest Rate | | | Maturity Date | | | Principal | | | Value | |
| | | | | | | | | | | | | | | | |
| | | | |
Certificates of Deposit : 16.30% | | | | | | | | | | | | | | | | |
Banco Del Estado De Chile | | | 0.27 | % | | | 08/13/2012 | | | $ | 15,000,000 | | | $ | 15,000,000 | |
Banco Del Estado De Chile | | | 0.44 | | | | 08/08/2012 | | | | 16,000,000 | | | | 16,000,000 | |
Bank of Montreal | | | 0.19 | | | | 08/01/2012 | | | | 15,000,000 | | | | 15,000,000 | |
Bank of Montreal | | | 0.20 | | | | 08/20/2012 | | | | 21,000,000 | | | | 20,999,945 | |
Bank of Montreal | | | 0.21 | | | | 08/21/2012 | | | | 31,000,000 | | | | 31,000,000 | |
Bank of Montreal | | | 0.23 | | | | 09/20/2012 | | | | 10,000,000 | | | | 10,000,000 | |
Bank of Nova Scotia | | | 0.21 | | | | 09/12/2012 | | | | 5,000,000 | | | | 5,000,000 | |
Bank of Nova Scotia ± | | | 0.30 | | | | 10/18/2012 | | | | 10,000,000 | | | | 10,000,000 | |
Bank of Nova Scotia | | | 0.72 | | | | 08/09/2012 | | | | 3,000,000 | | | | 3,000,327 | |
Bank of Tokyo-Mitsubishi LLC | | | 0.18 | | | | 08/06/2012 | | | | 48,000,000 | | | | 48,000,000 | |
Bank of Tokyo-Mitsubishi LLC | | | 0.19 | | | | 08/24/2012 | | | | 22,000,000 | | | | 22,000,000 | |
Bank of Tokyo-Mitsubishi LLC | | | 0.19 | | | | 08/29/2012 | | | | 18,000,000 | | | | 18,000,000 | |
Bank of Tokyo-Mitsubishi LLC | | | 0.35 | | | | 08/03/2012 | | | | 12,000,000 | | | | 12,000,100 | |
Barclays Bank plc ± | | | 0.92 | | | | 03/15/2013 | | | | 33,000,000 | | | | 33,000,000 | |
Canadian Imperial Bank ± | | | 0.77 | | | | 06/03/2013 | | | | 3,000,000 | | | | 3,007,787 | |
Citibank NA | | | 0.52 | | | | 08/09/2012 | | | | 30,000,000 | | | | 30,000,000 | |
Citibank NA | | | 0.52 | | | | 08/13/2012 | | | | 20,000,000 | | | | 20,000,000 | |
DNB Nor Bank ASA | | | 0.31 | | | | 09/13/2012 | | | | 24,000,000 | | | | 24,000,000 | |
National Australia Bank Limited ± | | | 0.35 | | | | 08/16/2012 | | | | 25,000,000 | | | | 25,001,757 | |
National Australia Bank Limited | | | 0.40 | | | | 08/21/2012 | | | | 25,000,000 | | | | 25,002,773 | |
National Bank of Kuwait | | | 0.18 | | | | 08/01/2012 | | | | 37,000,000 | | | | 37,000,000 | |
Nordea Bank plc | | | 0.87 | | | | 09/13/2012 | | | | 18,000,000 | | | | 18,002,177 | |
Norinchukin Bank | | | 0.17 | | | | 08/03/2012 | | | | 46,000,000 | | | | 46,000,000 | |
Norinchukin Bank | | | 0.20 | | | | 08/24/2012 | | | | 19,000,000 | | | | 19,000,000 | |
Oversea-Chinese Banking Corporation Limited | | | 0.23 | | | | 09/05/2012 | | | | 3,000,000 | | | | 3,000,000 | |
Oversea-Chinese Banking Corporation Limited | | | 0.26 | | | | 09/04/2012 | | | | 12,000,000 | | | | 12,000,000 | |
Oversea-Chinese Banking Corporation Limited | | | 0.26 | | | | 09/24/2012 | | | | 16,000,000 | | | | 16,000,000 | |
Oversea-Chinese Banking Corporation Limited | | | 0.27 | | | | 09/28/2012 | | | | 5,000,000 | | | | 5,000,000 | |
Royal Bank of Canada ± | | | 0.50 | | | | 07/26/2013 | | | | 16,000,000 | | | | 16,000,000 | |
Royal Bank of Canada ± | | | 0.74 | | | | 12/17/2012 | | | | 20,000,000 | | | | 20,000,000 | |
Skandinaviska Enskilda Banken AG | | | 0.50 | | | | 10/15/2012 | | | | 24,000,000 | | | | 24,000,000 | |
Skandinaviska Enskilda Banken AG | | | 0.70 | | | | 11/28/2012 | | | | 37,000,000 | | | | 37,000,000 | |
Skandinaviska Enskilda Banken AG | | | 0.75 | | | | 10/12/2012 | | | | 7,000,000 | | | | 7,002,913 | |
Standard Chartered Bank ± | | | 0.68 | | | | 03/04/2013 | | | | 26,000,000 | | | | 26,000,000 | |
State Street Bank & Trust | | | 0.17 | | | | 08/14/2012 | | | | 50,000,000 | | | | 50,000,000 | |
State Street Bank & Trust | | | 0.19 | | | | 08/17/2012 | | | | 19,000,000 | | | | 19,000,000 | |
State Street Bank & Trust | | | 0.25 | | | | 09/17/2012 | | | | 19,000,000 | | | | 19,000,000 | |
Sumitomo Mitsui Banking Corporation | | | 0.16 | | | | 08/01/2012 | | | | 34,000,000 | | | | 34,000,000 | |
Sumitomo Mitsui Banking Corporation | | | 0.16 | | | | 08/02/2012 | | | | 46,000,000 | | | | 46,000,000 | |
Sumitomo Mitsui Banking Corporation | | | 0.34 | | | | 08/08/2012 | | | | 20,000,000 | | | | 20,000,505 | |
Toronto-Dominion Bank | | | 0.18 | | | | 08/28/2012 | | | | 13,000,000 | | | | 13,000,000 | |
Toronto-Dominion Bank | | | 0.18 | | | | 08/29/2012 | | | | 23,000,000 | | | | 23,000,000 | |
Toronto-Dominion Bank ± | | | 0.45 | | | | 07/26/2013 | | | | 8,000,000 | | | | 8,000,000 | |
| | | | |
Total Certificates of Deposit (Cost $904,018,284) | | | | | | | | | | | | | | | 904,018,284 | |
| | | | | | | | | | | | | | | | |
| | | | |
Commercial Paper : 43.76% | | | | | | | | | | | | | | | | |
| | | | |
| Asset-Backed Commercial Paper : 22.48% | | | | | | | | | | | | | | | | |
CAFCO LLC 144A (z) | | | 0.75 | | | | 10/18/2012 | | | | 25,000,000 | | | | 24,959,375 | |
Chariot Funding LLC 144A (z) | | | 0.18 | | | | 08/13/2012 | | | | 18,000,000 | | | | 17,998,920 | |
| | | | |
| 2 | | Wells Fargo Advantage Money Market Fund | | Portfolio of Investments—July 31, 2012 (Unaudited) |
| | | | | | | | | | | | | | | | |
| Security Name | | Interest Rate | | | Maturity Date | | | Principal | | | Value | |
| | | | | | | | | | | | | | | | |
| | | | |
| Asset-Backed Commercial Paper (continued) | | | | | | | | | | | | | | | | |
Chariot Funding LLC 144A (z) | | | 0.21 | % | | | 09/12/2012 | | | $ | 15,000,000 | | | $ | 14,996,325 | |
Charta LLC 144A (z) | | | 0.75 | | | | 10/18/2012 | | | | 25,000,000 | | | | 24,959,375 | |
Collateralized Commercial Paper Company LLC (z) | | | 0.35 | | | | 09/25/2012 | | | | 25,000,000 | | | | 24,986,632 | |
Collateralized Commercial Paper Company LLC (z) | | | 0.35 | | | | 10/24/2012 | | | | 53,000,000 | | | | 52,956,717 | |
Fairway Finance Corporation 144A (z) | | | 0.18 | | | | 08/10/2012 | | | | 2,000,000 | | | | 1,999,910 | |
Fairway Finance Corporation 144A (z) | | | 0.19 | | | | 08/16/2012 | | | | 2,000,000 | | | | 1,999,842 | |
Fairway Finance Corporation 144A (z) | | | 0.20 | | | | 09/05/2012 | | | | 6,000,000 | | | | 5,998,833 | |
Fairway Finance Corporation 144A (z) | | | 0.21 | | | | 10/02/2012 | | | | 6,000,000 | | | | 5,997,830 | |
Gotham Funding Corporation 144A (z) | | | 0.21 | | | | 08/09/2012 | | | | 3,000,000 | | | | 2,999,860 | |
Gotham Funding Corporation 144A (z) | | | 0.20 | | | | 08/30/2012 | | | | 9,000,000 | | | | 8,998,478 | |
Gotham Funding Corporation 144A (z) | | | 0.21 | | | | 08/13/2012 | | | | 4,000,000 | | | | 3,999,720 | |
Gotham Funding Corporation 144A (z) | | | 0.21 | | | | 08/01/2012 | | | | 7,000,000 | | | | 7,000,000 | |
Gotham Funding Corporation 144A (z) | | | 0.21 | | | | 08/08/2012 | | | | 22,000,000 | | | | 21,999,102 | |
Gotham Funding Corporation 144A (z) | | | 0.21 | | | | 08/10/2012 | | | | 15,000,000 | | | | 14,999,213 | |
Gotham Funding Corporation 144A (z) | | | 0.21 | | | | 08/17/2012 | | | | 15,000,000 | | | | 14,998,600 | |
Gotham Funding Corporation 144A (z) | | | 0.21 | | | | 08/22/2012 | | | | 7,000,000 | | | | 6,999,143 | |
Gotham Funding Corporation 144A (z) | | | 0.21 | | | | 08/23/2012 | | | | 12,000,000 | | | | 11,998,460 | |
Gotham Funding Corporation 144A (z) | | | 0.21 | | | | 08/24/2012 | | | | 4,000,000 | | | | 3,999,463 | |
Gotham Funding Corporation 144A (z) | | | 0.21 | | | | 08/29/2012 | | | | 15,000,000 | | | | 14,997,550 | |
Jupiter Securitization Company LLC 144A (z) | | | 0.18 | | | | 08/13/2012 | | | | 18,000,000 | | | | 17,998,920 | |
Jupiter Securitization Company LLC 144A (z) | | | 0.21 | | | | 08/27/2012 | | | | 7,000,000 | | | | 6,998,938 | |
Jupiter Securitization Company LLC 144A (z) | | | 0.21 | | | | 09/12/2012 | | | | 15,000,000 | | | | 14,996,325 | |
Legacy Capital Company 144A (z) | | | 0.60 | | | | 08/13/2012 | | | | 11,000,000 | | | | 10,997,800 | |
Legacy Capital Company 144A (z) | | | 0.60 | | | | 08/14/2012 | | | | 11,000,000 | | | | 10,997,617 | |
Lexington Parker Capital Company LLC (z) | | | 0.60 | | | | 08/13/2012 | | | | 11,000,000 | | | | 10,997,800 | |
Lexington Parker Capital Company LLC 144A (z) | | | 0.60 | | | | 08/14/2012 | | | | 11,000,000 | | | | 10,997,617 | |
Liberty Funding LLC 144A (z) | | | 0.19 | | | | 08/01/2012 | | | | 5,000,000 | | | | 5,000,000 | |
Liberty Funding LLC 144A (z) | | | 0.19 | | | | 08/15/2012 | | | | 14,000,000 | | | | 13,998,966 | |
Liberty Funding LLC 144A (z) | | | 0.19 | | | | 08/16/2012 | | | | 22,000,000 | | | | 21,998,258 | |
Liberty Funding LLC 144A (z) | | | 0.19 | | | | 08/17/2012 | | | | 30,000,000 | | | | 29,997,467 | |
Liberty Funding LLC 144A (z) | | | 0.19 | | | | 08/28/2012 | | | | 25,000,000 | | | | 24,996,438 | |
Liberty Funding LLC 144A (z) | | | 0.21 | | | | 08/13/2012 | | | | 8,000,000 | | | | 7,999,440 | |
Liberty Funding LLC 144A (z) | | | 0.23 | | | | 10/26/2012 | | | | 6,000,000 | | | | 5,996,703 | |
Market Street Funding Corporation 144A (z) | | | 0.23 | | | | 08/27/2012 | | | | 3,000,000 | | | | 2,999,502 | |
Market Street Funding Corporation 144A (z) | | | 0.26 | | | | 10/03/2012 | | | | 5,000,000 | | | | 4,997,725 | |
Market Street Funding Corporation 144A (z) | | | 0.26 | | | | 10/16/2012 | | | | 7,000,000 | | | | 6,996,158 | |
Market Street Funding Corporation 144A (z) | | | 0.26 | | | | 10/17/2012 | | | | 10,000,000 | | | | 9,994,439 | |
Market Street Funding Corporation 144A (z) | | | 0.26 | | | | 10/18/2012 | | | | 4,000,000 | | | | 3,997,747 | |
MetLife Short Term Funding LLC 144A (z) | | | 0.20 | | | | 08/01/2012 | | | | 10,000,000 | | | | 10,000,000 | |
MetLife Short Term Funding LLC 144A (z) | | | 0.21 | | | | 09/12/2012 | | | | 4,000,000 | | | | 3,999,020 | |
MetLife Short Term Funding LLC 144A (z) | | | 0.21 | | | | 08/06/2012 | | | | 15,000,000 | | | | 14,999,563 | |
MetLife Short Term Funding LLC 144A (z) | | | 0.21 | | | | 08/07/2012 | | | | 12,000,000 | | | | 11,999,580 | |
MetLife Short Term Funding LLC 144A (z) | | | 0.21 | | | | 08/02/2012 | | | | 15,000,000 | | | | 14,999,913 | |
MetLife Short Term Funding LLC 144A (z) | | | 0.22 | | | | 10/04/2012 | | | | 4,000,000 | | | | 3,998,436 | |
MetLife Short Term Funding LLC 144A (z) | | | 0.22 | | | | 08/15/2012 | | | | 10,000,000 | | | | 9,999,144 | |
MetLife Short Term Funding LLC 144A (z) | | | 0.23 | | | | 10/02/2012 | | | | 4,000,000 | | | | 3,998,416 | |
MetLife Short Term Funding LLC 144A (z) | | | 0.24 | | | | 10/24/2012 | | | | 13,000,000 | | | | 12,992,720 | |
MetLife Short Term Funding LLC 144A (z) | | | 0.25 | | | | 10/09/2012 | | | | 4,000,000 | | | | 3,998,083 | |
MetLife Short Term Funding LLC 144A (z) | | | 0.25 | | | | 09/05/2012 | | | | 2,000,000 | | | | 1,999,514 | |
MetLife Short Term Funding LLC 144A (z) | | | 0.25 | | | | 09/06/2012 | | | | 10,000,000 | | | | 9,997,500 | |
| | | | | | |
| Portfolio of Investments—July 31, 2012 (Unaudited) | | Wells Fargo Advantage Money Market Fund | | | 3 | |
| | | | | | | | | | | | | | | | |
| Security Name | | Interest Rate | | | Maturity Date | | | Principal | | | Value | |
| | | | | | | | | | | | | | | | |
| | | | |
| Asset-Backed Commercial Paper (continued) | | | | | | | | | | | | | | | | |
MetLife Short Term Funding LLC 144A (z) | | | 0.25 | % | | | 10/15/2012 | | | $ | 4,000,000 | | | $ | 3,997,917 | |
Old Line Funding LLC 144A (z) | | | 0.18 | | | | 08/13/2012 | | | | 9,000,000 | | | | 8,999,460 | |
Old Line Funding LLC 144A (z) | | | 0.18 | | | | 08/15/2012 | | | | 12,000,000 | | | | 11,999,160 | |
Old Line Funding LLC 144A (z) | | | 0.18 | | | | 08/20/2012 | | | | 10,000,000 | | | | 9,999,050 | |
Old Line Funding LLC 144A (z) | | | 0.19 | | | | 08/27/2012 | | | | 15,000,000 | | | | 14,997,942 | |
Regency Markets No.1 LLC 144A (z) | | | 0.23 | | | | 08/28/2012 | | | | 8,000,000 | | | | 7,998,620 | |
Salisbury Receivables Company 144A (z) | | | 0.22 | | | | 08/28/2012 | | | | 8,000,000 | | | | 7,998,680 | |
Salisbury Receivables Company 144A (z) | | | 0.22 | | | | 08/30/2012 | | | | 11,000,000 | | | | 10,998,051 | |
Salisbury Receivables Company 144A (z) | | | 0.23 | | | | 08/14/2012 | | | | 7,000,000 | | | | 6,999,419 | |
Salisbury Receivables Company 144A (z) | | | 0.23 | | | | 08/17/2012 | | | | 4,000,000 | | | | 3,999,591 | |
Salisbury Receivables Company 144A (z) | | | 0.23 | | | | 08/22/2012 | | | | 6,000,000 | | | | 5,999,195 | |
Salisbury Receivables Company 144A (z) | | | 0.24 | | | | 09/10/2012 | | | | 4,000,000 | | | | 3,998,933 | |
Salisbury Receivables Company 144A (z) | | | 0.27 | | | | 09/13/2012 | | | | 9,000,000 | | | | 8,997,026 | |
Salisbury Receivables Company 144A (z) | | | 0.27 | | | | 09/25/2012 | | | | 6,000,000 | | | | 5,997,525 | |
Salisbury Receivables Company 144A (z) | | | 0.27 | | | | 09/26/2012 | | | | 7,000,000 | | | | 6,997,060 | |
Salisbury Receivables Company 144A (z) | | | 0.27 | | | | 09/27/2012 | | | | 5,000,000 | | | | 4,997,863 | |
Salisbury Receivables Company 144A (z) | | | 0.28 | | | | 09/06/2012 | | | | 4,000,000 | | | | 3,998,880 | |
Salisbury Receivables Company 144A (z) | | | 0.32 | | | | 08/29/2012 | | | | 4,000,000 | | | | 3,999,004 | |
Salisbury Receivables Company 144A (z) | | | 0.34 | | | | 10/04/2012 | | | | 4,000,000 | | | | 3,997,582 | |
Sheffield Receivables Corporation 144A (z) | | | 0.22 | | | | 08/29/2012 | | | | 10,000,000 | | | | 9,998,289 | |
Solitaire Funding LLC 144A (z) | | | 0.23 | | | | 08/28/2012 | | | | 27,000,000 | | | | 26,995,343 | |
Solitaire Funding LLC 144A (z) | | | 0.30 | | | | 08/01/2012 | | | | 5,000,000 | | | | 5,000,000 | |
Solitaire Funding LLC 144A (z) | | | 0.30 | | | | 08/06/2012 | | | | 8,000,000 | | | | 7,999,667 | |
Solitaire Funding LLC 144A (z) | | | 0.30 | | | | 08/08/2012 | | | | 10,000,000 | | | | 9,999,417 | |
Solitaire Funding LLC 144A (z) | | | 0.30 | | | | 08/15/2012 | | | | 16,000,000 | | | | 15,998,133 | |
Straight-A Funding LLC 144A (z) | | | 0.18 | | | | 08/16/2012 | | | | 5,000,000 | | | | 4,999,625 | |
Straight-A Funding LLC 144A (z) | | | 0.18 | | | | 08/17/2012 | | | | 7,000,000 | | | | 6,999,440 | |
Straight-A Funding LLC 144A (z) | | | 0.18 | | | | 10/03/2012 | | | | 33,000,000 | | | | 32,989,605 | |
Straight-A Funding LLC 144A (z) | | | 0.18 | | | | 10/15/2012 | | | | 33,000,000 | | | | 32,987,625 | |
Straight-A Funding LLC 144A (z) | | | 0.18 | | | | 10/17/2012 | | | | 20,000,000 | | | | 19,992,300 | |
Straight-A Funding LLC 144A (z) | | | 0.18 | | | | 10/18/2012 | | | | 33,000,000 | | | | 32,987,130 | |
Straight-A Funding LLC 144A (z) | | | 0.18 | | | | 10/25/2012 | | | | 10,000,000 | | | | 9,995,750 | |
Surrey Funding Corporation 144A (z) | | | 0.22 | | | | 08/28/2012 | | | | 8,000,000 | | | | 7,998,680 | |
Surrey Funding Corporation 144A (z) | | | 0.22 | | | | 08/17/2012 | | | | 6,000,000 | | | | 5,999,413 | |
Surrey Funding Corporation 144A (z) | | | 0.28 | | | | 09/17/2012 | | | | 3,000,000 | | | | 2,998,903 | |
Surrey Funding Corporation 144A (z) | | | 0.28 | | | | 09/18/2012 | | | | 5,000,000 | | | | 4,998,133 | |
Sydney Capital Corporation 144A (z) | | | 0.30 | | | | 08/13/2012 | | | | 12,000,000 | | | | 11,998,800 | |
Sydney Capital Corporation 144A (z) | | | 0.30 | | | | 09/21/2012 | | | | 8,000,000 | | | | 7,996,600 | |
Sydney Capital Corporation 144A (z) | | | 0.30 | | | | 09/13/2012 | | | | 9,000,000 | | | | 8,996,775 | |
Sydney Capital Corporation 144A (z) | | | 0.30 | | | | 09/14/2012 | | | | 15,000,000 | | | | 14,994,500 | |
Sydney Capital Corporation 144A (z) | | | 0.30 | | | | 10/03/2012 | | | | 8,000,000 | | | | 7,995,800 | |
Thunder Bay Funding LLC 144A (z) | | | 0.18 | | | | 08/08/2012 | | | | 18,000,000 | | | | 17,999,370 | |
Thunder Bay Funding LLC 144A (z) | | | 0.18 | | | | 08/14/2012 | | | | 9,000,000 | | | | 8,999,415 | |
Thunder Bay Funding LLC 144A (z) | | | 0.18 | | | | 08/15/2012 | | | | 16,000,000 | | | | 15,998,880 | |
Thunder Bay Funding LLC 144A (z) | | | 0.19 | | | | 09/04/2012 | | | | 5,000,000 | | | | 4,999,103 | |
Thunder Bay Funding LLC 144A (z) | | | 0.19 | | | | 08/27/2012 | | | | 15,000,000 | | | | 14,997,942 | |
Thunder Bay Funding LLC 144A (z) | | | 0.20 | | | | 08/20/2012 | | | | 23,000,000 | | | | 22,997,731 | |
Victory Receivables 144A (z) | | | 0.21 | | | | 08/02/2012 | | | | 18,000,000 | | | | 17,999,895 | |
Victory Receivables 144A (z) | | | 0.21 | | | | 08/03/2012 | | | | 3,000,000 | | | | 2,999,965 | |
Victory Receivables 144A (z) | | | 0.21 | | | | 08/08/2012 | | | | 10,000,000 | | | | 9,999,592 | |
| | | | |
| 4 | | Wells Fargo Advantage Money Market Fund | | Portfolio of Investments—July 31, 2012 (Unaudited) |
| | | | | | | | | | | | | | | | |
| Security Name | | Interest Rate | | | Maturity Date | | | Principal | | | Value | |
| | | | | | | | | | | | | | | | |
| | | | |
| Asset-Backed Commercial Paper (continued) | | | | | | | | | | | | | | | | |
Victory Receivables 144A (z) | | | 0.21 | % | | | 08/09/2012 | | | $ | 11,000,000 | | | $ | 10,999,487 | |
Victory Receivables 144A (z) | | | 0.21 | | | | 08/14/2012 | | | | 8,000,000 | | | | 7,999,393 | |
Victory Receivables 144A (z) | | | 0.21 | | | | 08/23/2012 | | | | 16,000,000 | | | | 15,997,947 | |
Victory Receivables 144A (z) | | | 0.21 | | | | 08/15/2012 | | | | 16,000,000 | | | | 15,998,693 | |
Victory Receivables 144A (z) | | | 0.21 | | | | 08/16/2012 | | | | 5,000,000 | | | | 4,999,563 | |
Victory Receivables 144A (z) | | | 0.21 | | | | 08/17/2012 | | | | 19,000,000 | | | | 18,998,227 | |
Victory Receivables 144A (z) | | | 0.21 | | | | 08/24/2012 | | | | 5,000,000 | | | | 4,999,329 | |
White Point Funding Incorporated 144A (z) | | | 0.52 | | | | 10/22/2012 | | | | 2,000,000 | | | | 1,997,631 | |
White Point Funding Incorporated 144A (z) | | | 0.57 | | | | 08/20/2012 | | | | 4,000,000 | | | | 3,998,797 | |
| | | | |
| | | | | | | | | | | | | | | 1,246,654,943 | |
| | | | | | | | | | | | | | | | |
| | | | |
| Financial Company Commercial Paper : 17.16% | | | | | | | | | | | | | | | | |
ANZ National Limited 144A (z) | | | 0.28 | | | | 09/20/2012 | | | | 19,000,000 | | | | 18,992,611 | |
ANZ National Limited 144A (z) | | | 0.22 | | | | 08/02/2012 | | | | 10,000,000 | | | | 9,999,939 | |
ANZ National Limited 144A (z) | | | 0.22 | | | | 08/10/2012 | | | | 12,000,000 | | | | 11,999,340 | |
ANZ National Limited 144A (z) | | | 0.29 | | | | 09/25/2012 | | | | 18,000,000 | | | | 17,992,025 | |
ANZ National Limited 144A (z) | | | 0.29 | | | | 10/02/2012 | | | | 18,000,000 | | | | 17,991,010 | |
ASB Finance Limited 144A ± | | | 0.54 | | | | 02/25/2013 | | | | 22,000,000 | | | | 22,000,000 | |
ASB Finance Limited 144A ± | | | 0.64 | | | | 04/08/2013 | | | | 8,000,000 | | | | 8,000,000 | |
Axis Bank Limited (z) | | | 0.60 | | | | 08/13/2012 | | | | 30,000,000 | | | | 29,994,000 | |
Banco De Chile 144A (z) | | | 0.66 | | | | 09/25/2012 | | | | 5,000,000 | | | | 4,994,958 | |
Banco De Chile 144A (z) | | | 0.67 | | | | 08/06/2012 | | | | 2,000,000 | | | | 1,999,814 | |
Banco De Chile 144A (z) | | | 0.67 | | | | 08/28/2012 | | | | 7,000,000 | | | | 6,996,483 | |
Banco De Chile 144A (z) | | | 0.67 | | | | 08/23/2012 | | | | 4,000,000 | | | | 3,998,362 | |
Banco De Chile 144A (z) | | | 0.67 | | | | 08/08/2012 | | | | 6,000,000 | | | | 5,999,218 | |
Banco De Chile 144A (z) | | | 0.70 | | | | 09/06/2012 | | | | 2,000,000 | | | | 1,998,600 | |
Barclays Bank plc 144A (z) | | | 0.24 | | | | 08/20/2012 | | | | 24,000,000 | | | | 23,996,960 | |
BNZ International Funding Limited 144A (z) | | | 0.24 | | | | 08/03/2012 | | | | 8,000,000 | | | | 7,999,896 | |
BNZ International Funding Limited 144A (z) | | | 0.28 | | | | 09/12/2012 | | | | 5,000,000 | | | | 4,998,367 | |
BNZ International Funding Limited 144A (z) | | | 0.28 | | | | 09/14/2012 | | | | 5,000,000 | | | | 4,998,289 | |
BNZ International Funding Limited 144A | | | 0.53 | | | | 02/28/2013 | | | | 4,000,000 | | | | 4,000,027 | |
Caisse Centrale Desjardins du Quebec 144A (z) | | | 0.18 | | | | 08/07/2012 | | | | 14,000,000 | | | | 13,999,580 | |
Caisse Centrale Desjardins du Quebec 144A (z) | | | 0.18 | | | | 08/16/2012 | | | | 13,000,000 | | | | 12,999,025 | |
Caisse Centrale Desjardins du Quebec 144A (z) | | | 0.18 | | | | 08/17/2012 | | | | 15,000,000 | | | | 14,998,800 | |
Caisse Centrale Desjardins du Quebec 144A (z) | | | 0.19 | | | | 08/20/2012 | | | | 10,000,000 | | | | 9,998,997 | |
Caisse Centrale Desjardins du Quebec 144A (z) | | | 0.20 | | | | 08/08/2012 | | | | 23,000,000 | | | | 22,999,106 | |
Caisse Centrale Desjardins du Quebec 144A (z) | | | 0.20 | | | | 08/09/2012 | | | | 11,000,000 | | | | 10,999,511 | |
Caisse Centrale Desjardins du Quebec 144A (z) | | | 0.21 | | | | 08/03/2012 | | | | 6,000,000 | | | | 5,999,930 | |
Caisse Centrale Desjardins du Quebec 144A (z) | | | 0.22 | | | | 10/16/2012 | | | | 4,000,000 | | | | 3,998,142 | |
Caisse Centrale Desjardins du Quebec 144A (z) | | | 0.25 | | | | 09/04/2012 | | | | 7,000,000 | | | | 6,998,347 | |
Commonwealth Bank of Australia 144A (z) | | | 0.19 | | | | 10/03/2012 | | | | 15,000,000 | | | | 14,995,013 | |
Commonwealth Bank of Australia 144A (z) | | | 0.19 | | | | 08/01/2012 | | | | 30,000,000 | | | | 30,000,000 | |
DBS Bank Limited 144A (z) | | | 0.22 | | | | 09/04/2012 | | | | 6,000,000 | | | | 5,998,753 | |
DBS Bank Limited 144A (z) | | | 0.23 | | | | 08/02/2012 | | | | 12,000,000 | | | | 11,999,923 | |
DBS Bank Limited 144A (z) | | | 0.25 | | | | 08/20/2012 | | | | 22,000,000 | | | | 21,997,097 | |
DBS Bank Limited 144A (z) | | | 0.25 | | | | 08/30/2012 | | | | 5,000,000 | | | | 4,998,993 | |
DBS Bank Limited 144A (z) | | | 0.26 | | | | 09/07/2012 | | | | 5,000,000 | | | | 4,998,664 | |
DBS Bank Limited 144A (z) | | | 0.26 | | | | 09/13/2012 | | | | 8,000,000 | | | | 7,997,516 | |
DBS Bank Limited 144A (z) | | | 0.26 | | | | 10/05/2012 | | | | 13,000,000 | | | | 12,993,897 | |
| | | | | | |
| Portfolio of Investments—July 31, 2012 (Unaudited) | | Wells Fargo Advantage Money Market Fund | | | 5 | |
| | | | | | | | | | | | | | | | |
| Security Name | | Interest Rate | | | Maturity Date | | | Principal | | | Value | |
| | | | | | | | | | | | | | | | |
| | | | |
| Financial Company Commercial Paper (continued) | | | | | | | | | | | | | | | | |
DBS Bank Limited 144A (z) | | | 0.26 | % | | | 10/25/2012 | | | $ | 25,000,000 | | | $ | 24,984,653 | |
DBS Bank Limited 144A (z) | | | 0.26 | | | | 10/29/2012 | | | | 15,000,000 | | | | 14,990,358 | |
DNB Nor Bank ASA 144A (z) | | | 0.31 | | | | 09/11/2012 | | | | 24,000,000 | | | | 23,991,527 | |
ICICI Bank Limited (z) | | | 0.64 | | | | 09/10/2012 | | | | 9,000,000 | | | | 8,993,600 | |
JPMorgan Chase & Company (z) | | | 0.28 | | | | 10/30/2012 | | | | 7,000,000 | | | | 6,995,100 | |
National Australia Funding Corporation 144A (z) | | | 0.18 | | | | 08/07/2012 | | | | 36,000,000 | | | | 35,998,905 | |
Nationwide Building Society 144A (z) | | | 0.55 | | | | 10/01/2012 | | | | 5,000,000 | | | | 4,995,340 | |
Nationwide Building Society 144A (z) | | | 0.58 | | | | 10/12/2012 | | | | 5,000,000 | | | | 4,994,200 | |
Nordea North America (z) | | | 0.30 | | | | 09/07/2012 | | | | 25,000,000 | | | | 24,992,292 | |
Oversea-Chinese Banking Corporation Limited (z) | | | 0.23 | | | | 09/18/2012 | | | | 10,000,000 | | | | 9,996,933 | |
Oversea-Chinese Banking Corporation Limited (z) | | | 0.25 | | | | 08/17/2012 | | | | 19,000,000 | | | | 18,997,888 | |
Oversea-Chinese Banking Corporation Limited (z) | | | 0.25 | | | | 08/22/2012 | | | | 8,000,000 | | | | 7,998,833 | |
Oversea-Chinese Banking Corporation Limited (z) | | | 0.26 | | | | 09/06/2012 | | | | 2,000,000 | | | | 1,999,480 | |
Oversea-Chinese Banking Corporation Limited (z) | | | 0.26 | | | | 08/06/2012 | | | | 2,000,000 | | | | 1,999,928 | |
Oversea-Chinese Banking Corporation Limited (z) | | | 0.27 | | | | 09/26/2012 | | | | 9,000,000 | | | | 8,996,282 | |
Oversea-Chinese Banking Corporation Limited (z) | | | 0.27 | | | | 08/29/2012 | | | | 4,000,000 | | | | 3,999,160 | |
Oversea-Chinese Banking Corporation Limited (z) | | | 0.27 | | | | 08/30/2012 | | | | 4,000,000 | | | | 3,999,130 | |
Oversea-Chinese Banking Corporation Limited (z) | | | 0.27 | | | | 10/09/2012 | | | | 5,000,000 | | | | 4,997,413 | |
Oversea-Chinese Banking Corporation Limited (z) | | | 0.27 | | | | 10/11/2012 | | | | 10,000,000 | | | | 9,994,675 | |
Oversea-Chinese Banking Corporation Limited (z) | | | 0.30 | | | | 09/10/2012 | | | | 3,000,000 | | | | 2,999,000 | |
Principal Life Insurance 144A (z) | | | 0.20 | | | | 08/03/2012 | | | | 2,000,000 | | | | 1,999,978 | |
Principal Life Insurance 144A (z) | | | 0.20 | | | | 08/06/2012 | | | | 5,000,000 | | | | 4,999,861 | |
Principal Life Insurance 144A (z) | | | 0.20 | | | | 08/17/2012 | | | | 2,000,000 | | | | 1,999,822 | |
Suncorp Group Limited 144A (z) | | | 0.45 | | | | 09/13/2012 | | | | 14,000,000 | | | | 13,992,475 | |
Suncorp Group Limited 144A (z) | | | 0.45 | | | | 09/10/2012 | | | | 4,000,000 | | | | 3,998,000 | |
Suncorp Group Limited 144A (z) | | | 0.45 | | | | 09/12/2012 | | | | 4,000,000 | | | | 3,997,900 | |
Suncorp Group Limited 144A (z) | | | 0.45 | | | | 09/17/2012 | | | | 10,000,000 | | | | 9,994,125 | |
Suncorp Group Limited 144A (z) | | | 0.46 | | | | 08/20/2012 | | | | 5,000,000 | | | | 4,998,786 | |
Suncorp Group Limited 144A (z) | | | 0.46 | | | | 08/09/2012 | | | | 5,000,000 | | | | 4,999,489 | |
Suncorp Group Limited 144A (z) | | | 0.47 | | | | 08/02/2012 | | | | 10,000,000 | | | | 9,999,869 | |
Swedbank (z) | | | 0.30 | | | | 08/08/2012 | | | | 12,000,000 | | | | 11,999,300 | |
Swedbank (z) | | | 0.30 | | | | 08/09/2012 | | | | 20,000,000 | | | | 19,998,667 | |
Swedbank (z) | | | 0.30 | | | | 08/10/2012 | | | | 20,000,000 | | | | 19,998,500 | |
Swedbank (z) | | | 0.33 | | | | 09/18/2012 | | | | 2,000,000 | | | | 1,999,120 | |
Swedbank (z) | | | 0.42 | | | | 08/29/2012 | | | | 15,000,000 | | | | 14,995,100 | |
Swedbank (z) | | | 0.42 | | | | 09/10/2012 | | | | 19,000,000 | | | | 18,991,133 | |
Swedbank (z) | | | 0.42 | | | | 09/11/2012 | | | | 20,000,000 | | | | 19,990,433 | |
Toyota Credit Canada Incorporated (z) | | | 0.20 | | | | 09/25/2012 | | | | 4,000,000 | | | | 3,998,778 | |
Toyota Credit Canada Incorporated (z) | | | 0.20 | | | | 09/26/2012 | | | | 2,000,000 | | | | 1,999,378 | |
UOB Funding LLC (z) | | | 0.21 | | | | 08/27/2012 | | | | 8,000,000 | | | | 7,998,787 | |
UOB Funding LLC (z) | | | 0.25 | | | | 09/13/2012 | | | | 10,000,000 | | | | 9,997,014 | |
Westpac Banking Corporation 144A (z) | | | 0.26 | | | | 09/17/2012 | | | | 10,000,000 | | | | 9,996,606 | |
Westpac Securities NZ Limited 144A (z) | | | 0.30 | | | | 09/17/2012 | | | | 17,000,000 | | | | 16,993,342 | |
Westpac Securities NZ Limited 144A (z) | | | 0.30 | | | | 09/21/2012 | | | | 17,000,000 | | | | 16,992,775 | |
Westpac Securities NZ Limited 144A ± | | | 0.54 | | | | 02/22/2013 | | | | 23,000,000 | | | | 23,000,000 | |
Westpac Securities NZ Limited 144A ± | | | 0.54 | | | | 02/25/2013 | | | | 14,000,000 | | | | 14,000,000 | |
Westpac Securities NZ Limited 144A | | | 0.61 | | | | 07/22/2013 | | | | 11,000,000 | | | | 11,000,000 | |
Westpac Securities NZ Limited 144A | | | 0.64 | | | | 04/08/2013 | | | | 7,000,000 | | | | 7,000,000 | |
Westpac Securities NZ Limited 144A ± | | | 0.66 | | | | 04/15/2013 | | | | 5,000,000 | | | | 5,001,776 | |
| | | | |
| | | | | | | | | | | | | | | 951,766,904 | |
| | | | | | | | | | | | | | | | |
| | | | |
| 6 | | Wells Fargo Advantage Money Market Fund | | Portfolio of Investments—July 31, 2012 (Unaudited) |
| | | | | | | | | | | | | | | | |
| Security Name | | Interest Rate | | | Maturity Date | | | Principal | | | Value | |
| | | | | | | | | | | | | | | | |
| | | | |
| Other Commercial Paper : 4.12% | | | | | | | | | | | | | | | | |
ACTS Retirement Life Communities Incorporated (z) | | | 0.55 | % | | | 08/09/2012 | | | $ | 2,000,000 | | | $ | 1,999,756 | |
ACTS Retirement Life Communities Incorporated (z) | | | 0.55 | | | | 08/09/2012 | | | | 2,500,000 | | | | 2,499,694 | |
CNPC Finance 144A (z) | | | 0.38 | | | | 09/17/2012 | | | | 18,000,000 | | | | 17,991,070 | |
CNPC Finance 144A (z) | | | 0.39 | | | | 09/24/2012 | | | | 8,000,000 | | | | 7,995,320 | |
CNPC Finance 144A (z) | | | 0.42 | | | | 08/21/2012 | | | | 8,000,000 | | | | 7,998,133 | |
CNPC Finance 144A (z) | | | 0.42 | | | | 08/22/2012 | | | | 8,000,000 | | | | 7,998,040 | |
CNPC Finance 144A (z) | | | 0.42 | | | | 08/27/2012 | | | | 9,000,000 | | | | 8,997,270 | |
CNPC Finance 144A (z) | | | 0.42 | | | | 09/05/2012 | | | | 5,000,000 | | | | 4,997,958 | |
CNPC Finance 144A (z) | | | 0.42 | | | | 08/02/2012 | | | | 5,000,000 | | | | 4,999,942 | |
Coca-Cola Company 144A (z) | | | 0.16 | | | | 08/06/2012 | | | | 14,000,000 | | | | 13,999,689 | |
Coca-Cola Company 144A (z) | | | 0.16 | | | | 08/07/2012 | | | | 15,000,000 | | | | 14,999,600 | |
Coca-Cola Company 144A (z) | | | 0.22 | | | | 10/22/2012 | | | | 11,000,000 | | | | 10,994,488 | |
General Electric Company (z) | | | 0.15 | | | | 08/21/2012 | | | | 25,000,000 | | | | 24,997,917 | |
General Electric Company (z) | | | 0.15 | | | | 08/22/2012 | | | | 25,000,000 | | | | 24,997,813 | |
Louis Dreyfus Commodities LLC (z) | | | 0.42 | | | | 08/01/2012 | | | | 14,000,000 | | | | 14,000,000 | |
Louis Dreyfus Commodities LLC (z) | | | 0.55 | | | | 08/03/2012 | | | | 3,000,000 | | | | 2,999,908 | |
Louis Dreyfus Commodities LLC (z) | | | 0.55 | | | | 08/06/2012 | | | | 10,000,000 | | | | 9,999,236 | |
Toyota Motor Credit Corporation (z) | | | 0.19 | | | | 08/21/2012 | | | | 19,000,000 | | | | 18,997,994 | |
Toyota Motor Credit Corporation (z) | | | 0.20 | | | | 08/24/2012 | | | | 4,000,000 | | | | 3,999,489 | |
Toyota Motor Credit Corporation (z) | | | 0.20 | | | | 08/28/2012 | | | | 14,000,000 | | | | 13,997,900 | |
Toyota Motor Credit Corporation (z) | | | 0.20 | | | | 08/29/2012 | | | | 9,000,000 | | | | 8,998,600 | |
| | | | |
| | | | | | | | | | | | | | | 228,459,817 | |
| | | | | | | | | | | | | | | | |
| | | | |
Total Commercial Paper (Cost $2,426,881,664) | | | | | | | | | | | | | | | 2,426,881,664 | |
| | | | | | | | | | | | | | | | |
| | | | |
| Government Agency Debt : 1.61% | | | | | | | | | | | | | | | | |
FHLB ± | | | 0.30 | | | | 02/05/2013 | | | | 10,000,000 | | | | 9,997,922 | |
FHLB ± | | | 0.31 | | | | 03/07/2013 | | | | 16,000,000 | | | | 15,997,097 | |
FHLB ± | | | 0.31 | | | | 05/09/2013 | | | | 3,000,000 | | | | 2,999,296 | |
FHLB ± | | | 0.32 | | | | 03/28/2013 | | | | 16,000,000 | | | | 15,997,808 | |
FHLB ± | | | 0.33 | | | | 05/02/2013 | | | | 7,000,000 | | | | 6,998,930 | |
FHLB ± | | | 0.34 | | | | 04/01/2013 | | | | 15,000,000 | | | | 15,000,000 | |
FHLB ± | | | 0.34 | | | | 05/17/2013 | | | | 16,000,000 | | | | 16,000,000 | |
FHLB ± | | | 0.36 | | | | 05/17/2013 | | | | 6,000,000 | | | | 6,000,000 | |
| | | | |
Total Government Agency Debt (Cost $88,991,053) | | | | | | | | | | | | | | | 88,991,053 | |
| | | | | | | | | | | | | | | | |
| | | | |
Municipal Obligations : 23.24% | | | | | | | | | | | | | | | | |
| | | | |
Alabama : 0.63% | | | | | | | | | | | | | | | | |
| | | | |
| Other Municipal Debt : 0.36% | | | | | | | | | | | | | | | | |
Montgomery County AL (Tax Revenue) | | | 0.18 | | | | 08/01/2012 | | | | 10,000,000 | | | | 10,000,000 | |
Montgomery County AL (Tax Revenue) | | | 0.18 | | | | 08/02/2012 | | | | 10,000,000 | | | | 10,000,000 | |
| | | | |
| | | | | | | | | | | | | | | 20,000,000 | |
| | | | | | | | | | | | | | | | |
| | | | |
| Variable Rate Demand Notes §: 0.27% | | | | | | | | | | | | | | | | |
Birmingham AL Special Care Facilities Finance Authority Ascension Health Series 2006-C (Miscellaneous Revenue, Morgan Stanley Bank LIQ) 144A | | | 0.23 | | | | 11/15/2046 | | | | 10,000,000 | | | | 10,000,000 | |
Homewood AL Educational Building Authority (Education Revenue, Branch Banking & Trust LOC) | | | 0.15 | | | | 12/01/2043 | | | | 5,000,000 | | | | 5,000,000 | |
| | | | |
| | | | | | | | | | | | | | | 15,000,000 | |
| | | | | | | | | | | | | | | | |
| | | | | | |
| Portfolio of Investments—July 31, 2012 (Unaudited) | | Wells Fargo Advantage Money Market Fund | | | 7 | |
| | | | | | | | | | | | | | | | |
| Security Name | | Interest Rate | | | Maturity Date | | | Principal | | | Value | |
| | | | | | | | | | | | | | | | |
| | | | |
California : 2.21% | | | | | | | | | | | | | | | | |
| | | | |
| Other Municipal Debt : 0.57% | | | | | | | | | | | | | | | | |
California Series 11B5 (Tax Revenue) | | | 0.18 | % | | | 08/17/2012 | | | $ | 10,500,000 | | | $ | 10,500,000 | |
Orange County CA Pension Obligation Series A (Miscellaneous Revenue) | | | 0.80 | | | | 11/01/2012 | | | | 3,000,000 | | | | 3,000,000 | |
Orange County CA Pension Obligation Series A (Miscellaneous Revenue) | | | 0.85 | | | | 02/01/2013 | | | | 3,000,000 | | | | 3,000,000 | |
San Francisco CA City & County Public Utilities Commission Series A2T
(Utilities Revenue) | | | 0.20 | | | | 09/17/2012 | | | | 3,000,000 | | | | 3,000,000 | |
San Francisco CA City & County Public Utilities Commission Series IAM 14
(Utilities Revenue) | | | 0.20 | | | | 09/10/2012 | | | | 4,000,000 | | | | 4,000,000 | |
San Francisco CA City & County Public Utilities Commission Series IAM 758 (Utilities Revenue) | | | 0.19 | | | | 08/02/2012 | | | | 6,000,000 | | | | 6,000,000 | |
San Jose CA International Airport Series C-1 (Airport Revenue) | | | 0.47 | | | | 09/12/2012 | | | | 2,000,000 | | | | 2,000,000 | |
| | | | |
| | | | | | | | | | | | | | | 31,500,000 | |
| | | | | | | | | | | | | | | | |
| | | | |
| Variable Rate Demand Notes §: 1.64% | | | | | | | | | | | | | | | | |
California CDA Series 2554 (Miscellaneous Revenue, FSA Insured, Morgan Stanley Bank LIQ) | | | 0.23 | | | | 07/01/2047 | | | | 9,000,000 | | | | 9,000,000 | |
California HFFA Catholic Healthcare Series C (Health Revenue, JPMorgan Chase & Company LOC, NATL-RE Insured) | | | 0.16 | | | | 07/01/2020 | | | | 2,000,000 | | | | 2,000,000 | |
California Infrastructure & Economic Development Bank Contemporary Jewish Museum (Miscellaneous Revenue, Bank of America NA LOC) | | | 0.21 | | | | 12/01/2036 | | | | 5,000,000 | | | | 5,000,000 | |
JPMorgan Chase PUTTER/DRIVER Trust Series 3164 (GO, JPMorgan Chase & Company LIQ) 144A | | | 0.16 | | | | 08/01/2031 | | | | 4,145,000 | | | | 4,145,000 | |
Los Angeles CA Beverly Park Apartments Series A (Housing Revenue, FHLMC Insured, FHLMC LIQ) | | | 0.14 | | | | 08/01/2018 | | | | 6,500,000 | | | | 6,500,000 | |
Los Angeles CA Community RDA Academy Village Apartments Series A (Housing Revenue, FHLMC Insured, FHLMC LIQ) | | | 0.14 | | | | 10/01/2019 | | | | 500,000 | | | | 500,000 | |
Los Angeles CA TRAN JPMorgan Chase PUTTER Series 3931 (GO, JPMorgan Chase & Company LIQ) | | | 0.18 | | | | 08/12/2012 | | | | 7,000,000 | | | | 7,000,000 | |
Los Angeles CA TRAN JPMorgan Chase PUTTER Series 3965 (GO, JPMorgan Chase & Company LIQ) 144A | | | 0.18 | | | | 08/12/2012 | | | | 6,230,000 | | | | 6,230,000 | |
Roseville CA Electric System Series A (Miscellaneous Revenue, Morgan Stanley Bank LOC) | | | 0.20 | | | | 02/01/2035 | | | | 7,000,000 | | | | 7,000,000 | |
Sacramento County CA Housing Authority Shadowood Apartments Project Issue A (Housing Revenue, FHLMC Insured, FHLMC LIQ) | | | 0.14 | | | | 12/01/2022 | | | | 4,000,000 | | | | 4,000,000 | |
Sacramento County CA MUD JPMorgan Chase PUTTER Series 4071 (Utilities Revenue, BHAC-CR, FSA-CR, AMBAC Insured, JPMorgan Chase & Company LIQ) 144A | | | 0.18 | | | | 11/15/2013 | | | | 9,945,000 | | | | 9,945,000 | |
San Bernardino County CA COP Series B (Miscellaneous Revenue) | | | 0.30 | | | | 03/01/2017 | | | | 4,500,000 | | | | 4,500,000 | |
San Diego CA Housing Authority MFHR Hillside Garden Apartments Series B (Housing Revenue, FNMA Insured, FNMA LIQ) | | | 0.14 | | | | 01/15/2035 | | | | 3,500,000 | | | | 3,500,000 | |
San Diego CA Unified School District JPMorgan Chase PUTTER Trust Series 3934 (GO, JPMorgan Chase & Company LIQ) 144A | | | 0.18 | | | | 08/07/2012 | | | | 3,000,000 | | | | 3,000,000 | |
San Diego CA Unified School District JPMorgan Chase PUTTER Trust Series 3966 (GO, JPMorgan Chase & Company LIQ) 144A | | | 0.18 | | | | 08/12/2012 | | | | 3,000,000 | | | | 3,000,000 | |
San Francisco CA City & County RDA Community Facilities District # 4 (Tax Revenue, Bank of America NA LOC) | | | 0.34 | | | | 08/01/2032 | | | | 5,000,000 | | | | 5,000,000 | |
San Francisco CA City & County RDA Notre Dame Apartments Series G (Housing Revenue, Citibank NA LOC) | | | 0.21 | | | | 12/01/2033 | | | | 1,965,000 | | | | 1,965,000 | |
San Francisco CA City & County Redevelopment Agency 3rd Mission C (Housing Revenue, FNMA Insured, FNMA LIQ) | | | 0.14 | | | | 06/15/2034 | | | | 5,000,000 | | | | 5,000,000 | |
| | | | |
| 8 | | Wells Fargo Advantage Money Market Fund | | Portfolio of Investments—July 31, 2012 (Unaudited) |
| | | | | | | | | | | | | | | | |
| Security Name | | Interest Rate | | | Maturity Date | | | Principal | | | Value | |
| | | | | | | | | | | | | | | | |
| | | | |
| Variable Rate Demand Notes § (continued) | | | | | | | | | | | | | | | | |
San Leandro CA Carlton Plaza Series A (Housing Revenue, FNMA Insured,
FNMA LIQ) | | | 0.19 | % | | | 09/15/2032 | | | $ | 1,800,000 | | | $ | 1,800,000 | |
Westminster CA RDA Series 3009 (Tax Revenue, Assured Guaranty Insured,
Morgan Stanley Bank LIQ) 144A | | | 0.23 | | | | 11/01/2045 | | | | 2,000,000 | | | | 2,000,000 | |
| | | | |
| | | | | | | | | | | | | | | 91,085,000 | |
| | | | | | | | | | | | | | | | |
| | | | |
Colorado : 1.10% | | | | | | | | | | | | | | | | |
| | | | |
| Variable Rate Demand Notes §: 1.10% | | | | | | | | | | | | | | | | |
Colorado HFA Class I Series B-2 (Housing Revenue, Royal Bank of Canada SPA) | | | 0.16 | | | | 05/01/2038 | | | | 6,000,000 | | | | 6,000,000 | |
Colorado HFA Taxable MFHR Project B-2 (Housing Revenue, FHLB SPA) | | | 0.18 | | | | 05/01/2050 | | | | 15,425,000 | | | | 15,425,000 | |
Denver CO City & County Subseries G1 (Port Authority Revenue, Assured Guaranty Insured, Morgan Stanley Bank SPA) | | | 0.26 | | | | 11/15/2025 | | | | 4,000,000 | | | | 4,000,000 | |
Denver CO City & County Subseries G2 (Port Authority Revenue, Assured Guaranty Insured, Morgan Stanley Bank SPA) | | | 0.26 | | | | 11/15/2025 | | | | 8,050,000 | | | | 8,049,999 | |
Denver CO Public Schools Series A-4 (Education Revenue, Royal Bank of Canada LOC, AGM Insured) | | | 0.17 | | | | 12/15/2037 | | | | 7,000,000 | | | | 7,000,000 | |
Moffat County CO Tri State General Association Project (IDR, Bank of America NA LOC) | | | 0.23 | | | | 03/01/2036 | | | | 10,350,000 | | | | 10,350,000 | |
Royal Bank of Canada Municipal Products Incorporated Trust Series E-25 (Miscellaneous Revenue, Royal Bank of Canada LOC, Royal Bank of Canada LIQ) 144A | | | 0.18 | | | | 11/15/2025 | | | | 10,000,000 | | | | 10,000,000 | |
| | | | |
| | | | | | | | | | | | | | | 60,824,999 | |
| | | | | | | | | | | | | | | | |
| | | | |
Connecticut : 0.27% | | | | | | | | | | | | | | | | |
| | | | |
| Variable Rate Demand Notes §: 0.27% | | | | | | | | | | | | | | | | |
Connecticut HFA Series C-2 (Housing Revenue, Bank of Tokyo-Mitsubishi SPA) | | | 0.15 | | | | 05/15/2034 | | | | 10,000,000 | | | | 10,000,000 | |
New Britain CT Taxable Pension Series C (GO, JPMorgan Chase & Company LOC) | | | 0.32 | | | | 02/01/2026 | | | | 5,000,000 | | | | 5,000,000 | |
| | | | |
| | | | | | | | | | | | | | | 15,000,000 | |
| | | | | | | | | | | | | | | | |
| | | | |
Delaware : 0.25% | | | | | | | | | | | | | | | | |
| | | | |
| Variable Rate Demand Notes §: 0.25% | | | | | | | | | | | | | | | | |
Puttable Floating Option Taxable Notes Series TN (Tax Revenue) 144A | | | 0.90 | | | | 11/15/2012 | | | | 11,730,000 | | | | 11,730,000 | |
Puttable Floating Option Taxable Notes Series TN (Tax Revenue) 144A | | | 0.90 | | | | 09/01/2034 | | | | 2,000,000 | | | | 2,000,000 | |
| | | | |
| | | | | | | | | | | | | | | 13,730,000 | |
| | | | | | | | | | | | | | | | |
| | | | |
District of Columbia : 0.48% | | | | | | | | | | | | | | | | |
| | | | |
| Other Municipal Debt : 0.09% | | | | | | | | | | | | | | | | |
District of Columbia Water & Sewer Authority Series C (Water & Sewer Revenue) | | | 0.20 | | | | 09/17/2012 | | | | 3,000,000 | | | | 3,000,000 | |
Metropolitan Washington DC Airports Authority Series 1-C (Airport Revenue) | | | 0.21 | | | | 08/14/2012 | | | | 2,000,000 | | | | 2,000,000 | |
| | | | |
| | | | | | | | | | | | | | | 5,000,000 | |
| | | | | | | | | | | | | | | | |
| | | | |
| Variable Rate Demand Notes §: 0.39% | | | | | | | | | | | | | | | | |
District of Columbia George Washington University (Education Revenue,
Bank of America NA LOC) | | | 0.22 | | | | 09/15/2029 | | | | 5,000,000 | | | | 5,000,000 | |
District of Columbia PUTTER Series 4026 (GO, JPMorgan Chase & Company LIQ) 144A | | | 0.18 | | | | 09/28/2012 | | | | 7,695,000 | | | | 7,695,000 | |
District of Columbia The Pew Charitable Trusts Series A (Miscellaneous Revenue, PNC Bank NA LOC) | | | 0.15 | | | | 04/01/2038 | | | | 9,000,000 | | | | 9,000,000 | |
| | | | |
| | | | | | | | | | | | | | | 21,695,000 | |
| | | | | | | | | | | | | | | | |
| | | | | | |
| Portfolio of Investments—July 31, 2012 (Unaudited) | | Wells Fargo Advantage Money Market Fund | | | 9 | |
| | | | | | | | | | | | | | | | |
| Security Name | | Interest Rate | | | Maturity Date | | | Principal | | | Value | |
| | | | | | | | | | | | | | | | |
| | | | |
Florida : 0.36% | | | | | | | | | | | | | | | | |
| | | | |
| Variable Rate Demand Notes §: 0.36% | | | | | | | | | | | | | | | | |
Florida HEFAR Ringling College of Arts & Design Incorporated Project Series 2008 (Education Revenue, PNC Bank NA LOC) | | | 0.15 | % | | | 03/01/2038 | | | $ | 1,910,000 | | | $ | 1,910,000 | |
JPMorgan Chase PUTTER Trust Series 4128 (Miscellaneous Revenue, JPMorgan Chase Bank LOC, JPMorgan Chase Bank LIQ) 144A | | | 0.22 | | | | 03/01/2021 | | | | 5,995,000 | | | | 5,995,000 | |
JPMorgan Chase PUTTER/DRIVER Trust Series 4172 (Lease Revenue) 144A | | | 0.20 | | | | 01/01/2020 | | | | 2,000,000 | | | | 2,000,000 | |
Palm Beach County FL Pine Crest Preparatory School Incorporated Project Series 2008 (Education Revenue, Bank of America NA LOC) | | | 0.24 | | | | 06/01/2032 | | | | 5,920,000 | | | | 5,920,000 | |
Volusia County FL Eclipse Funding Trust Series 0008 (Miscellaneous Revenue, U.S. Bank NA LOC, FSA Insured) | | | 0.14 | | | | 08/01/2013 | | | | 1,990,000 | | | | 1,990,000 | |
Volusia County FL Eclipse Funding Trust Series 0036 (Miscellaneous Revenue, U.S. Bank NA LOC, FSA Insured) | | | 0.14 | | | | 08/01/2032 | | | | 1,990,000 | | | | 1,990,000 | |
| | | | |
| | | | | | | | | | | | | | | 19,805,000 | |
| | | | | | | | | | | | | | | | |
| | | | |
Georgia : 0.48% | | | | | | | | | | | | | | | | |
| | | | |
| Variable Rate Demand Notes §: 0.48% | | | | | | | | | | | | | | | | |
Columbus GA Housing Development Authority PFOTER Series TN-024 (Housing Revenue, ACA Insured) 144A | | | 0.50 | | | | 10/01/2039 | | | | 5,265,000 | | | | 5,265,000 | |
Main Street Natural Gas Incorporated Georgia Gas Project Series A (Utilities Revenue, Royal Bank of Canada SPA) | | | 0.15 | | | | 08/01/2040 | | | | 6,990,000 | | | | 6,990,000 | |
Richmond County GA Development Authority (Education Revenue) | | | 0.17 | | | | 07/01/2037 | | | | 14,625,000 | | | | 14,625,000 | |
| | | | |
| | | | | | | | | | | | | | | 26,880,000 | |
| | | | | | | | | | | | | | | | |
| | | | |
Illinois : 0.68% | | | | | | | | | | | | | | | | |
| | | | |
| Variable Rate Demand Notes §: 0.68% | | | | | | | | | | | | | | | | |
Chicago IL Midway Airport Series A2 (Airport Revenue, JPMorgan Chase & Company LOC) | | | 0.19 | | | | 01/01/2025 | | | | 935,000 | | | | 935,000 | |
Chicago IL Series B-1 (GO, JPMorgan Chase & Company LOC) | | | 0.17 | | | | 01/01/2034 | | | | 7,815,000 | | | | 7,815,000 | |
Chicago IL Water District Eclipse Funding Trust Series 2006-A (Water & Sewer Revenue, U.S. Bank NA LOC) | | | 0.14 | | | | 05/01/2014 | | | | 3,995,000 | | | | 3,995,000 | |
Cook County IL Series D-2 (GO, Northern Trust Company SPA) | | | 0.17 | | | | 11/01/2030 | | | | 1,000,000 | | | | 1,000,000 | |
Illinois Development Finance Authority Village of Oak Park Residence Corporation Project Series 2001 (Housing Revenue, PNC Bank NA LOC) | | | 0.17 | | | | 07/01/2041 | | | | 3,000,000 | | | | 3,000,000 | |
Illinois Educational Facilities Authority Field Museum National History (Education Revenue, Bank of America NA LOC, GO of Corporation Insured) | | | 0.27 | | | | 11/01/2032 | | | | 5,000,000 | | | | 5,000,000 | |
Quincy IL Blessing Hospital (Health Revenue, JPMorgan Chase & Company LOC) | | | 0.19 | | | | 11/15/2029 | | | | 10,690,000 | | | | 10,690,000 | |
Springfield IL PUTTER Series 1314 (Utilities Revenue, BHAC-CR MBIA Insured, JPMorgan Chase Bank LOC) | | | 0.16 | | | | 03/01/2014 | | | | 4,990,000 | | | | 4,990,000 | |
| | | | |
| | | | | | | | | | | | | | | 37,425,000 | |
| | | | | | | | | | | | | | | | |
| | | | |
Indiana : 0.23% | | | | | | | | | | | | | | | | |
| | | | |
| Variable Rate Demand Notes §: 0.23% | | | | | | | | | | | | | | | | |
Indiana Finance Authority Trinity Health Credit Group Series 2008D-1
(Health Revenue) | | | 0.12 | | | | 12/01/2034 | | | | 4,000,000 | | | | 4,000,000 | |
Indiana Finance Authority Parkview Health System Obligation Group Project Series 2009 C (Health Revenue, PNC Bank NA LOC) | | | 0.15 | | | | 11/01/2039 | | | | 4,000,000 | | | | 4,000,000 | |
Indiana Housing & CDA Series B-3 (Housing Revenue, JPMorgan Chase & Company SPA) | | | 0.20 | | | | 07/01/2036 | | | | 5,000,000 | | | | 5,000,000 | |
| | | | |
| | | | | | | | | | | | | | | 13,000,000 | |
| | | | | | | | | | | | | | | | |
| | | | |
| 10 | | Wells Fargo Advantage Money Market Fund | | Portfolio of Investments—July 31, 2012 (Unaudited) |
| | | | | | | | | | | | | | | | |
| Security Name | | Interest Rate | | | Maturity Date | | | Principal | | | Value | |
| | | | | | | | | | | | | | | | |
| | | | |
Iowa : 0.25% | | | | | | | | | | | | | | | | |
| | | | |
| Variable Rate Demand Note §: 0.25% | | | | | | | | | | | | | | | | |
Iowa Finance Authority Student Housing Des Moines LLC Project A (Miscellaneous Revenue, Citibank NA LOC) | | | 0.28 | % | | | 06/01/2039 | | | $ | 13,940,000 | | | $ | 13,940,000 | |
| | | | | | | | | | | | | | | | |
| | | | |
Kentucky : 0.16% | | | | | | | | | | | | | | | | |
| | | | |
| Variable Rate Demand Notes §: 0.16% | | | | | | | | | | | | | | | | |
Kentucky Housing Corporation Series M (Housing Revenue, PNC Bank NA SPA) | | | 0.18 | | | | 01/01/2033 | | | | 3,000,000 | | | | 3,000,000 | |
Louisville & Jefferson Counties KY Sewer District JPMorgan Chase PUTTER/DRIVER Trust Series 4012 (Water & Sewer Revenue, JPMorgan Chase Bank LOC) 144A | | | 0.18 | | | | 12/12/2012 | | | | 6,000,000 | | | | 6,000,000 | |
| | | | |
| | | | | | | | | | | | | | | 9,000,000 | |
| | | | | | | | | | | | | | | | |
| | | | |
Louisiana : 0.32% | | | | | | | | | | | | | | | | |
| | | | |
| Variable Rate Demand Notes §: 0.32% | | | | | | | | | | | | | | | | |
Louisiana Stadium & Exposition PFOTER Series TN-013 (Miscellaneous Revenue, Bank of America NA LIQ) 144A | | | 0.50 | | | | 07/01/2036 | | | | 6,900,000 | | | | 6,900,000 | |
St. James Parish LA Nucor Steel LLC Project Gulf Opportunity Zone Series 2010
A-1 (IDR) | | | 0.16 | | | | 11/01/2040 | | | | 7,000,000 | | | | 7,000,000 | |
St. James Parish LA Nucor Steel LLC Project Gulf Opportunity Zone Series 2010
B-1 (IDR) | | | 0.16 | | | | 11/01/2040 | | | | 4,000,000 | | | | 4,000,000 | |
| | | | |
| | | | | | | | | | | | | | | 17,900,000 | |
| | | | | | | | | | | | | | | | |
| | | | |
Maryland : 0.29% | | | | | | | | | | | | | | | | |
| | | | |
| Variable Rate Demand Notes §: 0.29% | | | | | | | | | | | | | | | | |
Maryland CDA Series 2006-G (Housing Revenue, State Street Bank & Trust Company SPA) | | | 0.19 | | | | 09/01/2040 | | | | 4,000,000 | | | | 4,000,000 | |
Maryland Health & HEFAR Series D (Miscellaneous Revenue, Bank of America NA LOC) | | | 0.28 | | | | 01/01/2029 | | | | 9,070,000 | | | | 9,070,000 | |
Baltimore MD PFOTER (Tax Revenue) | | | 0.34 | | | | 10/15/2022 | | | | 3,000,000 | | | | 3,000,000 | |
| | | | |
| | | | | | | | | | | | | | | 16,070,000 | |
| | | | | | | | | | | | | | | | |
| | | | |
Massachusetts : 0.26% | | | | | | | | | | | | | | | | |
| | | | |
| Variable Rate Demand Notes §: 0.26% | | | | | | | | | | | | | | | | |
Massachusetts Department of Transportation Series A6 (Transportation Revenue, GO of Commonwealth Insured, JPMorgan Chase Bank SPA) | | | 0.15 | | | | 01/01/2029 | | | | 2,000,000 | | | | 2,000,000 | |
Massachusetts Development Finance Agency Babson College Series B (Education Revenue, Citizens Bank LOC) | | | 0.18 | | | | 10/01/2031 | | | | 2,330,000 | | | | 2,330,000 | |
Massachusetts Water Resources Authority Series E (Water & Sewer Revenue, GO of Authority Insured, JPMorgan Chase Bank SPA) | | | 0.16 | | | | 08/01/2037 | | | | 2,305,000 | | | | 2,305,000 | |
Royal Bank of Canada Municipal Products Incorporated Trust Series E-32 (GO, Royal Bank of Canada LOC, Royal Bank of Canada LIQ) 144A | | | 0.13 | | | | 09/01/2013 | | | | 8,000,000 | | | | 8,000,000 | |
| | | | |
| | | | | | | | | | | | | | | 14,635,000 | |
| | | | | | | | | | | | | | | | |
| | | | |
Michigan : 0.35% | | | | | | | | | | | | | | | | |
| | | | |
| Variable Rate Demand Notes §: 0.35% | | | | | | | | | | | | | | | | |
Michigan Housing Development Authority Series A (Housing Revenue, Bank of Tokyo-Mitsubishi SPA) | | | 0.17 | | | | 04/01/2040 | | | | 4,000,000 | | | | 4,000,000 | |
Michigan Housing Development Authority Series A (Housing Revenue, GO of Authority Insured, JPMorgan Chase & Company SPA) | | | 0.20 | | | | 10/01/2037 | | | | 7,485,000 | | | | 7,485,000 | |
| | | | | | |
| Portfolio of Investments—July 31, 2012 (Unaudited) | | Wells Fargo Advantage Money Market Fund | | | 11 | |
| | | | | | | | | | | | | | | | |
| Security Name | | Interest Rate | | | Maturity Date | | | Principal | | | Value | |
| | | | | | | | | | | | | | | | |
| | | | |
| Variable Rate Demand Notes § (continued) | | | | | | | | | | | | | | | | |
Michigan State University Revenues Series A (Education Revenue) | | | 0.15 | % | | | 02/15/2033 | | | $ | 4,000,000 | | | $ | 4,000,000 | |
University of Michigan Series B (Education Revenue, Northern Trust Company SPA) | | | 0.14 | | | | 04/01/2042 | | | | 2,000,000 | | | | 2,000,000 | |
Wayne County MI IDA Rayonier Project Series 2000 (IDR, Bank of America NA LOC) | | | 0.25 | | | | 05/01/2020 | | | | 2,000,000 | | | | 2,000,000 | |
| | | | |
| | | | | | | | | | | | | | | 19,485,000 | |
| | | | | | | | | | | | | | | | |
| | | | |
Minnesota : 0.16% | | | | | | | | | | | | | | | | |
| | | | |
| Variable Rate Demand Notes §: 0.16% | | | | | | | | | | | | | | | | |
Ramsey County MN Housing & Redevelopment MFHR Gateway Apartments LP Series A (Housing Revenue, Bank of America NA LOC) | | | 0.47 | | | | 10/01/2038 | | | | 4,100,000 | | | | 4,100,000 | |
St. Anthony MN Landings Silver Lake Project Series A (Housing Revenue, Bank of America NA LOC) | | | 0.47 | | | | 10/01/2037 | | | | 3,000,000 | | | | 3,000,000 | |
St. Cloud MN CentraCare Health System Series A (Health Revenue, Assured Guaranty Insured, JPMorgan Chase Bank SPA) | | | 0.38 | | | | 05/01/2042 | | | | 2,000,000 | | | | 2,000,000 | |
| | | | |
| | | | | | | | | | | | | | | 9,100,000 | |
| | | | | | | | | | | | | | | | |
| | | | |
Mississippi : 0.57% | | | | | | | | | | | | | | | | |
| | | | |
| Variable Rate Demand Notes §: 0.57% | | | | | | | | | | | | | | | | |
Mississippi Business Finance Corporation Chevron USA Incorporated Project Series A (IDR) | | | 0.16 | | | | 12/01/2030 | | | | 3,000,000 | | | | 3,000,000 | |
Mississippi Business Finance Corporation Chevron USA Incorporated Project Series H (IDR) | | | 0.16 | | | | 11/01/2035 | | | | 3,000,000 | | | | 3,000,000 | |
Mississippi Nissan Project Series A (Tax Revenue, Bank of America NA SPA) | | | 0.24 | | | | 11/01/2028 | | | | 25,440,000 | | | | 25,439,049 | |
| | | | |
| | | | | | | | | | | | | | | 31,439,049 | |
| | | | | | | | | | | | | | | | |
| | | | |
Missouri : 0.20% | | | | | | | | | | | | | | | | |
| | | | |
| Variable Rate Demand Notes §: 0.20% | | | | | | | | | | | | | | | | |
Kansas City MO Special Obligation Roe Bartle Series E (Tax Revenue, Sumitomo Mitsui Banking Corporation LOC) | | | 0.16 | | | | 04/15/2034 | | | | 6,000,000 | | | | 6,000,000 | |
Missouri Development Finance Board Nelson Gallery Foundation Series A (Miscellaneous Revenue, JPMorgan Chase Bank SPA) | | | 0.17 | | | | 12/01/2037 | | | | 2,000,000 | | | | 2,000,000 | |
Missouri Joint Municipal Electric Utility Commission Power Prairie Eclipse Funding Trust Series 2007-0111 (Miscellaneous Revenue, U.S. Bank NA LOC, U.S. Bank NA LIQ) | | | 0.13 | | | | 01/01/2032 | | | | 2,995,000 | | | | 2,995,000 | |
| | | | |
| | | | | | | | | | | | | | | 10,995,000 | |
| | | | | | | | | | | | | | | | |
| | | | |
Nebraska : 0.18% | | | | | | | | | | | | | | | | |
| | | | |
| Variable Rate Demand Note §: 0.18% | | | | | | | | | | | | | | | | |
Central Plains NE Nebraska Gas Project #2 Series 2009 (Utilities Revenue, Royal Bank of Canada SPA) | | | 0.15 | | | | 08/01/2039 | | | | 9,910,000 | | | | 9,910,000 | |
| | | | | | | | | | | | | | | | |
| | | | |
Nevada : 0.47% | | | | | | | | | | | | | | | | |
| | | | |
| Variable Rate Demand Notes §: 0.47% | | | | | | | | | | | | | | | | |
Clark County NV Southwest Gas Project Series A (Utilities Revenue, JPMorgan Chase & Company LOC) | | | 0.19 | | | | 03/01/2038 | | | | 6,000,000 | | | | 6,000,000 | |
Las Vegas NV EDFA Andre Agassi Foundation Project (Miscellaneous Revenue, Bank of America NA LOC) | | | 0.25 | | | | 10/01/2035 | | | | 7,835,000 | | | | 7,835,000 | |
Las Vegas NV EDFA Keep Memory Alive Project Series 2007A (Miscellaneous Revenue, PNC Bank NA LOC) | | | 0.15 | | | | 05/01/2037 | | | | 12,000,000 | | | | 12,000,000 | |
| | | | |
| | | | | | | | | | | | | | | 25,835,000 | |
| | | | | | | | | | | | | | | | |
| | | | |
| 12 | | Wells Fargo Advantage Money Market Fund | | Portfolio of Investments—July 31, 2012 (Unaudited) |
| | | | | | | | | | | | | | | | |
| Security Name | | Interest Rate | | | Maturity Date | | | Principal | | | Value | |
| | | | | | | | | | | | | | | | |
| | | | |
New Hampshire : 0.07% | | | | | | | | | | | | | | | | |
| | | | |
| Variable Rate Demand Note §: 0.07% | | | | | | | | | | | | | | | | |
New Hampshire HEFA St. Anselm College Series 2008 (Education Revenue, RBS Citizens NA LOC) | | | 0.15 | % | | | 06/01/2038 | | | $ | 3,835,000 | | | $ | 3,835,000 | |
| | | | | | | | | | | | | | | | |
| | | | |
New Jersey : 0.91% | | | | | | | | | | | | | | | | |
| | | | |
| Variable Rate Demand Notes §: 0.91% | | | | | | | | | | | | | | | | |
New Jersey EDA Pivotal Utility Holdings Incorporated Project Series 2007 (Utilities Revenue, JPMorgan Chase Bank LOC) | | | 0.19 | | | | 06/01/2032 | | | | 6,000,000 | | | | 6,000,000 | |
New Jersey EDA Series A (Utilities Revenue, JPMorgan Chase Bank LOC) | | | 0.19 | | | | 06/01/2026 | | | | 5,000,000 | | | | 5,000,000 | |
New Jersey Housing & Mortgage Finance Agency AMT SFMR Series Y (Housing Revenue, Royal Bank of Canada SPA) | | | 0.15 | | | | 10/01/2039 | | | | 3,000,000 | | | | 3,000,000 | |
New Jersey TRAN Series A (Miscellaneous Revenue) | | | 0.50 | | | | 06/27/2013 | | | | 18,000,000 | | | | 18,003,375 | |
New Jersey TTFA PUTTER Series 2009-70 (Transportation Revenue, State Street Bank & Trust Company LIQ) | | | 0.15 | | | | 12/15/2023 | | | | 5,000,000 | | | | 5,000,000 | |
Salem County NJ PCFA Atlantic City Electric Company Project Series A (Utilities Revenue, JPMorgan Chase & Company LOC) | | | 0.17 | | | | 04/15/2014 | | | | 13,200,000 | | | | 13,200,000 | |
| | | | |
| | | | | | | | | | | | | | | 50,203,375 | |
| | | | | | | | | | | | | | | | |
| | | | |
New Mexico : 0.11% | | | | | | | | | | | | | | | | |
| | | | |
| Variable Rate Demand Notes §: 0.11% | | | | | | | | | | | | | | | | |
New Mexico Municipal Energy Acquisition Authority Gas Supply Series 2009 (Utilities Revenue, Royal Bank of Canada SPA) | | | 0.15 | | | | 11/01/2039 | | | | 3,990,000 | | | | 3,990,000 | |
New Mexico Educational Authority PFOTER Series 637 (Education Revenue) | | | 0.30 | | | | 04/01/2037 | | | | 2,000,000 | | | | 2,000,000 | |
| | | | |
| | | | | | | | | | | | | | | 5,990,000 | |
| | | | | | | | | | | | | | | | |
| | | | |
New York : 3.11% | | | | | | | | | | | | | | | | |
| | | | |
| Variable Rate Demand Notes §: 3.11% | | | | | | | | | | | | | | | | |
Abraham Joshua Hesehal School New York Series 2010 (Education Revenue, TD Bank NA LOC) | | | 0.19 | | | | 01/01/2040 | | | | 2,490,000 | | | | 2,490,000 | |
JPMorgan Chase PUTTER/DRIVER Trust (Tax Revenue, JPMorgan Chase & Company LIQ) 144A | | | 0.18 | | | | 04/01/2014 | | | | 4,000,000 | | | | 4,000,000 | |
Metropolitan Transportation Authority New York Dedicated Tax Fund Subseries B-1 (Transportation Revenue, State Street Bank & Trust Company LOC) | | | 0.14 | | | | 11/01/2022 | | | | 3,000,000 | | | | 3,000,000 | |
Metropolitan Transportation Authority New York Series 2002-A ROC RR-II-R-11645 (Transportation Revenue, FSA Insured, Citibank NA LIQ) 144A | | | 0.30 | | | | 11/15/2025 | | | | 4,830,000 | | | | 4,830,000 | |
Monroe County NY PFOTER Series PT-4564 (Housing Revenue, FHLMC Insured, FHLMC LIQ) | | | 0.35 | | | | 02/01/2046 | | | | 12,050,000 | | | | 12,050,000 | |
Nassau County NY Health Care Corporation Series 2009 Subseries B-2 (Health Revenue, TD Bank NA LOC, County Guaranty Insured) | | | 0.14 | | | | 08/01/2029 | | | | 3,760,000 | | | | 3,760,000 | |
Nassau County NY Interim Finance Authority Series 2008-B (Tax Revenue, Sumitomo Mitsui Banking Corporation LOC) | | | 0.15 | | | | 11/15/2021 | | | | 11,100,000 | | | | 11,100,000 | |
Nassau County NY Interim Finance Authority Series E (Tax Revenue, JPMorgan Chase & Company SPA) | | | 0.16 | | | | 11/15/2014 | | | | 5,000,000 | | | | 5,000,000 | |
New York City NY Housing Development Corporation Multi-Family Rental Housing The Balton Project Series A (Housing Revenue, Bank of America NA LOC, FHLMC Insured) | | | 0.32 | | | | 09/01/2049 | | | | 4,000,000 | | | | 4,000,000 | |
New York City NY Housing Development Corporation Via Verde Apartments Series A (Housing Revenue, JPMorgan Chase & Company LOC) | | | 0.26 | | | | 01/01/2016 | | | | 1,600,000 | | | | 1,600,000 | |
New York City NY Subseries J-10 (GO, Bank of Tokyo-Mitsubishi LOC) | | | 0.13 | | | | 08/01/2027 | | | | 2,000,000 | | | | 2,000,000 | |
New York City NY Subseries L-3 (GO, Bank of America NA SPA) | | | 0.18 | | | | 04/01/2036 | | | | 8,770,000 | | | | 8,770,000 | |
| | | | | | |
| Portfolio of Investments—July 31, 2012 (Unaudited) | | Wells Fargo Advantage Money Market Fund | | | 13 | |
| | | | | | | | | | | | | | | | |
| Security Name | | Interest Rate | | | Maturity Date | | | Principal | | | Value | |
| | | | | | | | | | | | | | | | |
| | | | |
| Variable Rate Demand Notes § (continued) | | | | | | | | | | | | | | | | |
New York City NY Transitional Financing Authority Series C (Tax Revenue, Morgan Stanley Bank LOC) | | | 0.25 | % | | | 05/01/2028 | | | $ | 7,000,000 | | | $ | 7,000,000 | |
New York Dormitory Authority Revenue Series A (Education Revenue, JPMorgan Chase & Company SPA) | | | 0.15 | | | | 07/01/2039 | | | | 4,000,000 | | | | 4,000,000 | |
New York HFA Biltmore Tower Housing Project Series A (Housing Revenue, FNMA Insured) | | | 0.17 | | | | 05/15/2034 | | | | 5,000,000 | | | | 5,000,000 | |
New York HFA Clinto Green South Project Series A (Housing Revenue, FHLMC Insured) | | | 0.17 | | | | 11/01/2038 | | | | 5,000,000 | | | | 5,000,000 | |
New York HFA MFHR Second Mortgage Series A (Housing Revenue, FNMA Insured, FNMA LIQ) | | | 0.16 | | | | 05/01/2029 | | | | 2,000,000 | | | | 2,000,000 | |
New York HFA Remeeder Housing Project Series A (Housing Revenue, Citibank NA LOC) | | | 0.25 | | | | 05/01/2039 | | | | 4,930,000 | | | | 4,930,000 | |
New York HFA Victory Housing Project Series 2000-A (Housing Revenue, FHLMC Insured, FHLMC LIQ) | | | 0.17 | | | | 11/01/2033 | | | | 2,000,000 | | | | 2,000,000 | |
New York HFA Victory Housing Project Series 2004-A (Housing Revenue, FHLMC Insured) | | | 0.17 | | | | 11/01/2033 | | | | 10,400,000 | | | | 10,400,000 | |
New York HFA West 31st Street Housing Project Series A (Housing Revenue, FNMA Insured) | | | 0.17 | | | | 05/15/2038 | | | | 5,000,000 | | | | 5,000,000 | |
New York Housing Finance Agency Eleventh Avenue Housing Project Series A (Housing Revenue, FNMA Insured, FNMA LIQ) | | | 0.17 | | | | 05/15/2041 | | | | 5,000,000 | | | | 5,000,000 | |
New York Mortgage Agency Homeowner ROC RR-II-R-11703 (Housing Revenue, Citibank NA LIQ) 144A | | | 0.35 | | | | 10/01/2031 | | | | 2,765,000 | | | | 2,765,000 | |
New York PFOTER Series TN-012 (Miscellaneous Revenue, Bank of America NA LIQ) 144A | | | 0.50 | | | | 06/15/2053 | | | | 7,710,000 | | | | 7,710,000 | |
New York State Housing Finance Agency Series A (Housing Revenue) | | | 0.16 | | | | 05/15/2041 | | | | 9,000,000 | | | | 9,000,000 | |
New York Urban Development Corporate Revenue Series A3B (Tax Revenue, JPMorgan Chase Bank SPA) | | | 0.14 | | | | 03/15/2033 | | | | 15,000,000 | | | | 15,000,000 | |
Puttable Floating Option Taxable Notes Series TN-037 (Miscellaneous Revenue, Bank of America NA LIQ) 144A | | | 0.50 | | | | 10/01/2046 | | | | 7,825,000 | | | | 7,825,000 | |
Puttable Floating Option Taxable Notes Series TNP-1004 (Resource Recovery Revenue, AMBAC Insured, Bank of America NA LIQ) 144A | | | 0.75 | | | | 01/29/2046 | | | | 17,425,000 | | | | 17,425,000 | |
| | | | |
| | | | | | | | | | | | | | | 172,655,000 | |
| | | | | | | | | | | | | | | | |
| | | | |
North Carolina : 0.20% | | | | | | | | | | | | | | | | |
| | | | |
| Variable Rate Demand Notes §: 0.20% | | | | | | | | | | | | | | | | |
North Carolina Education Care Community Health Care Facilities University Health Systems of Eastern Carolina Series 2008 B-2 (Health Revenue, Branch Banking & Trust LOC) | | | 0.15 | | | | 12/01/2036 | | | | 4,890,000 | | | | 4,890,000 | |
Piedmont Triad NC Airport Authority Series 2008 A (Airport Revenue, Branch Banking & Trust LOC) | | | 0.14 | | | | 07/01/2032 | | | | 3,000,000 | | | | 3,000,000 | |
Roanoke Rapids NC Music & Entertainment District Project Series 2007 (Tax Revenue, Bank of America NA LOC) | | | 0.38 | | | | 07/01/2027 | | | | 3,000,000 | | | | 3,000,000 | |
| | | | |
| | | | | | | | | | | | | | | 10,890,000 | |
| | | | | | | | | | | | | | | | |
| | | | |
Ohio : 0.20% | | | | | | | | | | | | | | | | |
| | | | |
| Variable Rate Demand Notes §: 0.20% | | | | | | | | | | | | | | | | |
Montgomery County OH Catholic Health Series C-2 (Health Revenue, U.S. Bank NA SPA) | | | 0.16 | | | | 10/01/2041 | | | | 2,000,000 | | | | 2,000,000 | |
Ohio HFA Residential Management Taxable Series I (Housing Revenue, GNMA, FNMA Insured, FHLB SPA) | | | 0.19 | | | | 09/01/2039 | | | | 7,079,000 | | | | 7,079,000 | |
| | | | |
| 14 | | Wells Fargo Advantage Money Market Fund | | Portfolio of Investments—July 31, 2012 (Unaudited) |
| | | | | | | | | | | | | | | | |
| Security Name | | Interest Rate | | | Maturity Date | | | Principal | | | Value | |
| | | | | | | | | | | | | | | | |
| | | | |
| Variable Rate Demand Notes § (continued) | | | | | | | | | | | | | | | | |
Parma OH Community General Hospital Association Series 2006-A (Health Revenue, PNC Bank NA LOC) | | | 0.15 | % | | | 11/01/2029 | | | $ | 1,000,000 | | | $ | 1,000,000 | |
Warren County OH Health Care Facilities Otterbein Homes Series 1998-B (Health Revenue, U.S. Bank NA LOC) | | | 0.15 | | | | 07/01/2023 | | | | 925,000 | | | | 925,000 | |
| | | | |
| | | | | | | | | | | | | | | 11,004,000 | |
| | | | | | | | | | | | | | | | |
| | | | |
Oklahoma : 0.07% | | | | | | | | | | | | | | | | |
| | | | |
| Variable Rate Demand Note §: 0.07% | | | | | | | | | | | | | | | | |
Oklahoma Turnpike Authority Series F (Transportation Revenue, JPMorgan Chase Bank SPA) | | | 0.17 | | | | 01/01/2028 | | | | 4,000,000 | | | | 4,000,000 | |
| | | | | | | | | | | | | | | | |
| | | | |
Oregon : 0.09% | | | | | | | | | | | | | | | | |
| | | | |
| Variable Rate Demand Note §: 0.09% | | | | | | | | | | | | | | | | |
Oregon State Department PFOTER (Miscellaneous Revenue, Bank of America NA LIQ) 144A | | | 0.50 | | | | 05/01/2035 | | | | 5,000,000 | | | | 5,000,000 | |
| | | | | | | | | | | | | | | | |
| | | | |
Pennsylvania : 1.73% | | | | | | | | | | | | | | | | |
| | | | |
| Variable Rate Demand Notes §: 1.73% | | | | | | | | | | | | | | | | |
Berks County PA Municipal Authority Royal Bank of Canada Municipal Products Incorporated Trust Certificates Series C-15 (Health Revenue, Royal Bank of Canada LOC) 144A | | | 0.15 | | | | 11/01/2012 | | | | 1,995,000 | | | | 1,995,000 | |
Doylestown PA Hospital Authority Series B (Health Revenue, PNC Bank NA LOC) | | | 0.15 | | | | 07/01/2037 | | | | 14,000,000 | | | | 14,000,000 | |
Montgomery County PA IDA Series 3238 (Health Revenue, FHA Insured, Morgan Stanley Bank LIQ) 144A | | | 0.23 | | | | 08/01/2030 | | | | 2,000,000 | | | | 2,000,000 | |
Montgomery County PA Lower Merion School District GO Series 2009 A (GO, State Street Bank & Trust Company LOC, State Aid Withholding Insured) | | | 0.14 | | | | 04/01/2027 | | | | 6,075,000 | | | | 6,075,000 | |
Pennsylvania HFA Series 88-C (Housing Revenue, GO of Agency Insured, PNC Bank NA SPA) | | | 0.17 | | | | 04/01/2037 | | | | 6,595,000 | | | | 6,595,000 | |
Pennsylvania HFA Series 94-B (Housing Revenue, GO of Agency Insured, PNC Bank NA SPA) | | | 0.17 | | | | 04/01/2027 | | | | 10,000,000 | | | | 10,000,000 | |
Pennsylvania HFA Series 95-C (Housing Revenue, JPMorgan Chase & Company SPA) | | | 0.20 | | | | 04/01/2026 | | | | 5,970,000 | | | | 5,970,000 | |
Pennsylvania Turnpike Commission Series 2011 C-1 Royal Bank of Canada Municipal Products Incorporated Trust Series E-22 (Miscellaneous Revenue, Royal Bank of Canada LOC, Royal Bank of Canada LIQ) 144A | | | 0.15 | | | | 12/01/2038 | | | | 19,745,000 | | | | 19,745,000 | |
Philadelphia PA Gas Works Series E (Utilities Revenue, PNC Bank NA LOC) | | | 0.15 | | | | 08/01/2031 | | | | 1,000,000 | | | | 1,000,000 | |
Philadelphia PA Series 2005 C-2 (Airport Revenue, Royal Bank of Canada LOC) | | | 0.15 | | | | 06/15/2025 | | | | 9,600,000 | | | | 9,600,000 | |
Pittsburgh & Allegheny County PA Sports & Exhibition Authority Series B (Miscellaneous Revenue, AGM Insured, PNC Bank NA SPA) | | | 0.47 | | | | 11/01/2039 | | | | 5,000,000 | | | | 5,000,000 | |
Puttable Floating Option Taxable Notes Series TNP-1003 (Education Revenue, Guaranteed Student Loans Insured, Bank of America NA LIQ) 144A | | | 0.75 | | | | 06/01/2047 | | | | 13,715,000 | | | | 13,715,000 | |
| | | | |
| | | | | | | | | | | | | | | 95,695,000 | |
| | | | | | | | | | | | | | | | |
| | | | |
Puerto Rico : 0.14% | | | | | | | | | | | | | | | | |
| | | | |
| Variable Rate Demand Note §: 0.14% | | | | | | | | | | | | | | | | |
Puerto Rico Sales Tax Financing Corporation Series 3036 (Tax Revenue, Morgan Stanley Bank LIQ) | | | 0.17 | | | | 08/01/2057 | | | | 8,000,000 | | | | 8,000,000 | |
| | | | | | | | | | | | | | | | |
| | | | | | |
| Portfolio of Investments—July 31, 2012 (Unaudited) | | Wells Fargo Advantage Money Market Fund | | | 15 | |
| | | | | | | | | | | | | | | | |
| Security Name | | Interest Rate | | | Maturity Date | | | Principal | | | Value | |
| | | | | | | | | | | | | | | | |
| | | | |
Rhode Island : 0.05% | | | | | | | | | | | | | | | | |
| | | | |
| Variable Rate Demand Note §: 0.05% | | | | | | | | | | | | | | | | |
Narragansett RI Bay Commission Series A (Water & Sewer Revenue, RBS Citizens Bank LOC) | | | 0.14 | % | | | 09/01/2034 | | | $ | 3,000,000 | | | $ | 3,000,000 | |
| | | | | | | | | | | | | | | | |
| | | | |
South Carolina : 0.32% | | | | | | | | | | | | | | | | |
| | | | |
| Other Municipal Debt : 0.32% | | | | | | | | | | | | | | | | |
South Carolina Public Service Authority Series AA (Utilities Revenue) | | | 0.19 | | | | 08/15/2012 | | | | 5,000,000 | | | | 5,000,000 | |
South Carolina Public Service Authority Series AA (Utilities Revenue) | | | 0.19 | | | | 08/21/2012 | | | | 1,000,000 | | | | 1,000,000 | |
South Carolina Public Service Authority Series AA (Utilities Revenue) | | | 0.19 | | | | 08/22/2012 | | | | 2,000,000 | | | | 2,000,000 | |
South Carolina Public Service Authority Series AA (Utilities Revenue) | | | 0.19 | | | | 08/27/2012 | | | | 2,000,000 | | | | 2,000,000 | |
South Carolina Public Service Authority Series CC (Utilities Revenue) | | | 0.18 | | | | 08/20/2012 | | | | 2,000,000 | | | | 2,000,000 | |
South Carolina Public Service Authority Series CC (Utilities Revenue) | | | 0.18 | | | | 08/23/2012 | | | | 3,000,000 | | | | 3,000,000 | |
York County SC PCR Natural Rural Utilities Cooperative Finance Corporation Guaranteed NC Electric Membership Corporation Project Series 200B-1
(Utilities Revenue) | | | 0.45 | | | | 09/04/2012 | | | | 1,000,000 | | | | 1,000,000 | |
York County SC PCR Natural Rural Utilities Cooperative Finance Corporation Guaranteed NC Electric Membership Corporation Project Series 200B-3
(Utilities Revenue) | | | 0.45 | | | | 09/04/2012 | | | | 2,000,000 | | | | 2,000,000 | |
| | | | |
| | | | | | | | | | | | | | | 18,000,000 | |
| | | | | | | | | | | | | | | | |
| | | | |
South Dakota : 0.04% | | | | | | | | | | | | | | | | |
| | | | |
| Variable Rate Demand Note §: 0.04% | | | | | | | | | | | | | | | | |
South Dakota Housing Development Authority Series C (Housing Revenue, FHLB SPA) | | | 0.16 | | | | 05/01/2037 | | | | 2,000,000 | | | | 2,000,000 | |
| | | | | | | | | | | | | | | | |
| | | | |
Tennessee : 0.69% | | | | | | | | | | | | | | | | |
| | | | |
| Variable Rate Demand Notes §: 0.69% | | | | | | | | | | | | | | | | |
Chattanooga TN Industrial Development Board Bluecross Corporation (IDR) | | | 0.26 | | | | 01/01/2028 | | | | 4,000,000 | | | | 4,000,000 | |
Clarksville TN Public Building Authority Tennessee Municipal Building Fund (Miscellaneous Revenue, Bank of America NA LOC) | | | 0.26 | | | | 11/01/2035 | | | | 6,625,000 | | | | 6,625,000 | |
JPMorgan Chase PUTTER Trust Series 4149 (Tax Revenue, JPMorgan Chase Bank LOC) 144A | | | 0.18 | | | | 10/01/2013 | | | | 3,000,000 | | | | 3,000,000 | |
Montgomery County TN Public Building Authority Adjusted Tennessee County Loan Pool (Miscellaneous Revenue, Bank of America NA LOC) | | | 0.26 | | | | 02/01/2036 | | | | 3,250,000 | | | | 3,250,000 | |
Montgomery County TN Public Building Authority Pooled Financing Revenue (Miscellaneous Revenue, Bank of America NA LOC) | | | 0.26 | | | | 07/01/2034 | | | | 18,470,000 | | | | 18,470,000 | |
Nashville & Davidson County TN Metropolitan Government Stewarts Ferry Apartments Project (IDR, FHLMC Insured, FHLMC LIQ) | | | 0.16 | | | | 01/01/2034 | | | | 1,000,000 | | | | 1,000,000 | |
Nashville & Davidson County TN Metropolitan Government Weatherly Ridge Apartments Project Series A (Housing Revenue, U.S. Bank NA LOC) | | | 0.18 | | | | 12/01/2041 | | | | 2,000,000 | | | | 2,000,000 | |
| | | | |
| | | | | | | | | | | | | | | 38,345,000 | |
| | | | | | | | | | | | | | | | |
| | | | |
Texas : 4.33% | | | | | | | | | | | | | | | | |
| | | | |
| Variable Rate Demand Notes §: 4.33% | | | | | | | | | | | | | | | | |
Austin TX Airport System Series A (Airport Revenue, State Street Bank & Trust Company LOC) | | | 0.17 | | | | 11/15/2017 | | | | 3,000,000 | | | | 3,000,000 | |
Bexar County TX Health Facilities El Centro Del Barrio Series A (Health Revenue, JPMorgan Chase & Company LOC) | | | 0.17 | | | | 12/01/2032 | | | | 9,830,000 | | | | 9,830,000 | |
Brazos River Authority Texas PCR Series D-2 (Utilities Revenue, Citibank NA LOC) | | | 0.20 | | | | 05/01/2033 | | | | 4,410,000 | | | | 4,410,000 | |
| | | | |
| 16 | | Wells Fargo Advantage Money Market Fund | | Portfolio of Investments—July 31, 2012 (Unaudited) |
| | | | | | | | | | | | | | | | |
| Security Name | | Interest Rate | | | Maturity Date | | | Principal | | | Value | |
| | | | | | | | | | | | | | | | |
| | | | |
| Variable Rate Demand Notes § (continued) | | | | | | | | | | | | | | | | |
Calhoun County TX Formosa Plastics Corporation Project Series B (IDR, Sumitomo Mitsui Banking Corporation LOC) 144A | | | 0.18 | % | | | 09/01/2041 | | | $ | 4,000,000 | | | $ | 4,000,000 | |
Harris County TX Cultural Education Facilities Finance Corporation Hermann Health Series D1 (Health Revenue, JPMorgan Chase & Company LOC) | | | 0.16 | | | | 06/01/2029 | | | | 7,000,000 | | | | 7,000,000 | |
Harris County TX Health Facilities Development Corporation Baylor Series A2 (Education Revenue, Bank of America NA LOC) | | | 0.18 | | | | 11/15/2047 | | | | 9,925,000 | | | | 9,925,000 | |
Houston TX Utilities Systems Authority Series 2010 B (Water & Sewer Revenue, Royal Bank of Canada LOC, Royal Bank of Canada LIQ) 144A | | | 0.15 | | | | 05/15/2034 | | | | 15,000,000 | | | | 15,000,000 | |
Mission TX Economic Development Solid Waste Disposal (Miscellaneous Revenue, Bank of America NA LOC) | | | 0.24 | | | | 04/01/2022 | | | | 2,000,000 | | | | 2,000,000 | |
North Texas Tollway Authority Revenue Series D (Transportation Revenue, JPMorgan Chase Bank LOC) | | | 0.17 | | | | 01/01/2049 | | | | 6,000,000 | | | | 6,000,000 | |
Pasadena TX Independent School District Series B (Tax Revenue, AGM Insured, Bank of America NA SPA) | | | 0.57 | | | | 02/01/2035 | | | | 13,000,000 | | | | 13,000,000 | |
Port Arthur TX Navigation District Environmental Facilities Motiva Enterprises Project Subseries 2009B (Resource Recovery Revenue) | | | 0.15 | | | | 12/01/2039 | | | | 2,000,000 | | | | 2,000,000 | |
Port Arthur TX Navigation District Environmental Facilities Motiva Enterprises Project Subseries 2009C (Resource Recovery Revenue) | | | 0.15 | | | | 12/01/2039 | | | | 3,000,000 | | | | 3,000,000 | |
Port Arthur TX Navigation District Environmental Facilities Motiva Enterprises Project Subseries 2010A (Resource Recovery Revenue) | | | 0.16 | | | | 04/01/2040 | | | | 5,000,000 | | | | 5,000,000 | |
Port Arthur TX Navigation District Environmental Facilities Motiva Enterprises Project Subseries 2010D (Resource Recovery Revenue) | | | 0.16 | | | | 11/01/2040 | | | | 8,000,000 | | | | 8,000,000 | |
Royal Bank of Canada Municipal Products Incorporated Trust Certificates Series E-18 (Miscellaneous Revenue, Royal Bank of Canada LOC, Royal Bank of Canada SPA) 144A | | | 0.15 | | | | 06/01/2032 | | | | 8,000,000 | | | | 8,000,000 | |
San Antonio TX Housing Finance Corporation PFOTER Rosemont at Pleasanton Apartments Project Series 2005 (Housing Revenue, FHLMC Insured, FHLMC LIQ) | | | 0.35 | | | | 07/01/2048 | | | | 7,000,000 | | | | 7,000,000 | |
Tarant County TX Housing Finance Corporation PFOTER Evergreen at Keller Apartments Project (Housing Revenue, FHLMC Insured, FHLMC LIQ) | | | 0.35 | | | | 02/01/2049 | | | | 3,970,000 | | | | 3,970,000 | |
Texas Municipal Gas Acquisition & Supply Corporation Series 2848 (Miscellaneous Revenue, Morgan Stanley Bank LIQ) | | | 0.45 | | | | 12/15/2026 | | | | 15,000,000 | | | | 15,000,000 | |
Texas Municipal Gas Acquisition & Supply Corporation Series 2849 (Miscellaneous Revenue, Morgan Stanley Bank LIQ) | | | 0.45 | | | | 12/15/2026 | | | | 5,000,000 | | | | 5,000,000 | |
Texas Taxable Product Development Program Series A (GO, National Australia Bank SPA) | | | 0.21 | | | | 06/01/2045 | | | | 4,480,000 | | | | 4,480,000 | |
Texas TRAN JPMorgan Chase PUTTER Trust Series 3942 (Miscellaneous Revenue, JPMorgan Chase Bank LIQ) 144A | | | 0.18 | | | | 08/30/2012 | | | | 26,000,000 | | | | 26,000,000 | |
Texas TRAN JPMorgan Chase PUTTER Trust Series 3945 (Miscellaneous Revenue, JPMorgan Chase Bank LIQ) 144A | | | 0.18 | | | | 08/30/2012 | | | | 12,000,000 | | | | 12,000,000 | |
Texas TRAN JPMorgan Chase PUTTER Trust Series 3946 (Miscellaneous Revenue, JPMorgan Chase Bank LIQ) 144A | | | 0.18 | | | | 08/30/2012 | | | | 12,870,000 | | | | 12,870,000 | |
Texas TRAN JPMorgan Chase PUTTER Trust Series 3953 (Miscellaneous Revenue, JPMorgan Chase Bank LIQ) 144A | | | 0.18 | | | | 08/30/2012 | | | | 15,885,000 | | | | 15,885,000 | |
Texas TRAN JPMorgan Chase PUTTER Trust Series 3964 (Miscellaneous Revenue, JPMorgan Chase Bank LIQ) 144A | | | 0.18 | | | | 08/30/2012 | | | | 15,000,000 | | | | 15,000,000 | |
Texas TRAN JPMorgan Chase PUTTER Trust Series 3984 (Miscellaneous Revenue, JPMorgan Chase Bank LIQ) 144A | | | 0.18 | | | | 08/30/2012 | | | | 19,000,000 | | | | 19,000,000 | |
Tyler TX Health Facilities Development Corporation Mother Frances Hospital Regional Health Care Center Project Series 1997 B (Health Revenue, Bank of America NA LOC) | | | 0.25 | | | | 07/01/2020 | | | | 3,500,000 | | | | 3,500,000 | |
| | | | |
| | | | | | | | | | | | | | | 239,870,000 | |
| | | | | | | | | | | | | | | | |
| | | | | | |
| Portfolio of Investments—July 31, 2012 (Unaudited) | | Wells Fargo Advantage Money Market Fund | | | 17 | |
| | | | | | | | | | | | | | | | |
| Security Name | | Interest Rate | | | Maturity Date | | | Principal | | | Value | |
| | | | | | | | | | | | | | | | |
| | | | |
Utah : 0.05% | | | | | | | | | | | | | | | | |
| | | | |
| Variable Rate Demand Note §: 0.05% | | | | | | | | | | | | | | | | |
Utah Board of Regents Series A (Education Revenue, Royal Bank of Canada LOC) | | | 0.17 | % | | | 11/01/2045 | | | $ | 2,768,000 | | | $ | 2,768,000 | |
| | | | | | | | | | | | | | | | |
| | | | |
Vermont : 0.07% | | | | | | | | | | | | | | | | |
| | | | |
| Variable Rate Demand Note §: 0.07% | | | | | | | | | | | | | | | | |
Vermont Educational & Health Buildings Financing Agency Norwich University Projects Series 2008 (Education Revenue, TD Bank NA LOC) | | | 0.14 | | | | 09/01/2038 | | | | 4,000,000 | | | | 4,000,000 | |
| | | | | | | | | | | | | | | | |
| | | | |
Virginia : 0.05% | | | | | | | | | | | | | | | | |
| | | | |
| Variable Rate Demand Note §: 0.05% | | | | | | | | | | | | | | | | |
Virginia State College Building Authority (Education Revenue) | | | 0.15 | | | | 08/01/2034 | | | | 3,000,000 | | | | 3,000,000 | |
| | | | | | | | | | | | | | | | |
| | | | |
Washington : 0.41% | | | | | | | | | | | | | | | | |
| | | | |
| Other Municipal Debt : 0.05% | | | | | | | | | | | | | | | | |
Port of Seattle (Port Authority Revenue) | | | 0.55 | | | | 08/16/2012 | | | | 3,000,000 | | | | 3,000,000 | |
| | | | | | | | | | | | | | | | |
| | | | |
| Variable Rate Demand Notes §: 0.36% | | | | | | | | | | | | | | | | |
King City WA JPMorgan Chase PUTTER Trust Series 4058 (GO, JPMorgan Chase Bank LIQ) 144A | | | 0.18 | | | | 02/28/2013 | | | | 3,000,000 | | | | 3,000,000 | |
Seattle WA Eclipse Funding Trust (Port Authority Revenue, U.S. Bank NA LOC) 144A | | | 0.13 | | | | 03/01/2035 | | | | 4,290,000 | | | | 4,290,000 | |
Washington HEFAR Whitman College Project (Education Revenue, Bank of America NA LIQ) | | | 0.28 | | | | 01/01/2038 | | | | 6,000,000 | | | | 6,000,000 | |
Washington Housing Finance Commission Series 1430-R (Housing Revenue, GNMA, FNMA Insured, Bank of America NA SPA) | | | 0.38 | | | | 06/01/2037 | | | | 2,000,000 | | | | 2,000,000 | |
Washington Housing Finance Commission Whisperwood Apartments Project Series A (Housing Revenue, FNMA Insured, FNMA LIQ) | | | 0.17 | | | | 05/15/2035 | | | | 4,650,000 | | | | 4,650,000 | |
| | | | |
| | | | | | | | | | | | | | | 19,940,000 | |
| | | | | | | | | | | | | | | | |
| | | | |
West Virginia : 0.24% | | | | | | | | | | | | | | | | |
| | | | |
| Variable Rate Demand Notes §: 0.24% | | | | | | | | | | | | | | | | |
Fayette County WV Solid Waste Disposal Facility Commission Georgia-Pacific Corporation Project Series 1995 (IDR, U.S. Bank NA LOC) | | | 0.18 | | | | 05/01/2018 | | | | 11,100,000 | | | | 11,100,000 | |
West Virginia EDA Morgantown Energy (IDR, Union Bank NA LOC) | | | 0.18 | | | | 04/01/2027 | | | | 2,000,000 | | | | 2,000,000 | |
| | | | |
| | | | | | | | | | | | | | | 13,100,000 | |
| | | | | | | | | | | | | | | | |
| | | | |
Wisconsin : 0.46% | | | | | | | | | | | | | | | | |
| | | | |
| Variable Rate Demand Notes §: 0.46% | | | | | | | | | | | | | | | | |
Wisconsin HEFA Hess Memorial Hospital Incorporated Series 2007 (Health Revenue, U.S. Bank NA LOC) | | | 0.15 | | | | 05/01/2024 | | | | 8,000,000 | | | | 8,000,000 | |
Wisconsin Housing & EDA Home Ownership Series D (Housing Revenue, FNMA LOC, GO of Authority Insured) | | | 0.19 | | | | 09/01/2035 | | | | 1,405,000 | | | | 1,405,000 | |
Wisconsin PFA Housing Project Series 2011 (Housing Revenue, Bank of America NA LOC) | | | 0.38 | | | | 01/01/2042 | | | | 13,780,000 | | | | 13,780,000 | |
Wisconsin Public Power PUTTER Series 1232 (Utilities Revenue, BHAC-CR, AMBAC Insured, JPMorgan Chase & Company LIQ) | | | 0.19 | | | | 07/01/2013 | | | | 2,215,000 | | | | 2,215,000 | |
| | | | |
| | | | | | | | | | | | | | | 25,400,000 | |
| | | | | | | | | | | | | | | | |
| | | | |
Total Municipal Obligations (Cost $1,288,949,423) | | | | | | | | | | | | | | | 1,288,949,423 | |
| | | | | | | | | | | | | | | | |
| | | | |
| 18 | | Wells Fargo Advantage Money Market Fund | | Portfolio of Investments—July 31, 2012 (Unaudited) |
| | | | | | | | | | | | | | | | |
| Security Name | | Interest Rate | | | Maturity Date | | | Principal | | | Value | |
| | | | | | | | | | | | | | | | |
| | | | |
| Other Instruments : 0.68% | | | | | | | | | | | | | | | | |
American Honda Finance Corporation 144A ± | | | 0.69 | % | | | 08/28/2012 | | | $ | 6,000,000 | | | $ | 6,002,007 | |
City of Austin TX Municipal Commercial Paper (z) | | | 0.19 | | | | 08/09/2012 | | | | 3,000,000 | | | | 2,999,873 | |
District of Columbia Multimodal Revenue Variable Rate Demand Note | | | 0.18 | | | | 08/16/2012 | | | | 2,000,000 | | | | 2,000,000 | |
GBG LLC Custody Receipts 144A ± | | | 0.17 | | | | 09/04/2012 | | | | 9,719,000 | | | | 9,719,000 | |
Oakland-Alameda County Series A-2 Other Commercial Paper | | | 0.23 | | | | 09/05/2012 | | | | 5,000,000 | | | | 5,000,000 | |
Puttable Floating Option Taxable Receipt Bonds 144A ±§ | | | 0.90 | | | | 05/15/2051 | | | | 8,105,000 | | | | 8,105,000 | |
University of Chicago Series A Municipal Commercial Paper (z) | | | 0.18 | | | | 08/15/2012 | | | | 4,000,000 | | | | 3,999,720 | |
| | | | |
Total Other Instruments (Cost $37,825,600) | | | | | | | | | | | | | | | 37,825,600 | |
| | | | | | | | | | | | | | | | |
| | | | |
Other Notes : 1.55% | | | | | | | | | | | | | | | | |
| | | | |
| Corporate Bonds and Notes : 1.55% | | | | | | | | | | | | | | | | |
ACTS Retirement Life Communities Incorporated ±§ | | | 0.26 | | | | 11/15/2029 | | | | 2,781,000 | | | | 2,781,000 | |
JPMorgan Chase & Company ± | | | 0.62 | | | | 11/01/2012 | | | | 13,000,000 | | | | 13,007,519 | |
JPMorgan Chase & Company ± | | | 0.97 | | | | 09/21/2012 | | | | 8,000,000 | | | | 8,005,560 | |
JPMorgan Chase & Company ± | | | 1.12 | | | | 02/26/2013 | | | | 5,000,000 | | | | 5,013,229 | |
JPMorgan Chase Bank NA ± | | | 0.37 | | | | 11/21/2012 | | | | 6,000,000 | | | | 6,001,337 | |
JPMorgan Chase Bank NA ± | | | 0.49 | | | | 11/16/2012 | | | | 2,000,000 | | | | 2,000,000 | |
JPMorgan Chase Bank NA ± | | | 0.53 | | | | 01/18/2013 | | | | 13,000,000 | | | | 12,998,796 | |
LTF Real Estate LLC 144A ±§ | | | 0.30 | | | | 06/01/2033 | | | | 15,000,000 | | | | 15,000,000 | |
Providence Health & Services ±§ | | | 0.25 | | | | 10/01/2042 | | | | 6,000,000 | | | | 6,000,000 | |
Toyota Motor Credit Corporation ± | | | 0.53 | | | | 07/19/2013 | | | | 15,000,000 | | | | 15,000,000 | |
| | | | |
Total Other Notes (Cost $85,807,441) | | | | | | | | | | | | | | | 85,807,441 | |
| | | | | | | | | | | | | | | | |
| | | | |
| Repurchase Agreements ^^: 10.47% | | | | | | | | | | | | | | | | |
Citigroup Global Markets, dated 07/31/2012, maturity value $80,000,400 (1) | | | 0.18 | | | | 08/01/2012 | | | | 80,000,000 | | | | 80,000,000 | |
Credit Suisse Securities, dated 07/31/2012, maturity value $95,000,475 (2) | | | 0.18 | | | | 08/01/2012 | | | | 95,000,000 | | | | 95,000,000 | |
GX Clarke & Company, dated 07/31/12, maturity value $20,000,150 (3) | | | 0.27 | | | | 08/01/2012 | | | | 20,000,000 | | | | 20,000,000 | |
JPMorgan Securities, dated 07/31/2012, maturity value $48,000,333 (4) | | | 0.25 | | | | 08/01/2012 | | | | 48,000,000 | | | | 48,000,000 | |
Merrill Lynch Pierce Fenner & Smith Incorporated, dated 07/31/2012, maturity value $104,000,549 (5) | | | 0.19 | | | | 08/01/2012 | | | | 104,000,000 | | | | 104,000,000 | |
Societe Generale, dated 07/31/2012, maturity value $177,381,585 (6) | | | 0.19 | | | | 08/01/2012 | | | | 177,380,649 | | | | 177,380,649 | |
Societe Generale, dated 07/31/2012, maturity value $56,000,358 (7) | | | 0.23 | | | | 08/01/2012 | | | | 56,000,000 | | | | 56,000,000 | |
| | | | |
Total Repurchase Agreements (Cost $580,380,649) | | | | | | | | | | | | | | | 580,380,649 | |
| | | | | | | | | | | | | | | | |
| | | | |
| Treasury Debt : 2.45% | | | | | | | | | | | | | | | | |
U.S. Treasury Bill (z) | | | 0.12 | | | | 08/23/2012 | | | | 62,000,000 | | | | 61,995,350 | |
U.S. Treasury Bill (z) | | | 0.14 | | | | 10/04/2012 | | | | 19,000,000 | | | | 18,995,237 | |
U.S. Treasury Bill (z) | | | 0.14 | | | | 08/30/2012 | | | | 36,000,000 | | | | 35,995,850 | |
U.S. Treasury Bill (z) | | | 0.15 | | | | 10/11/2012 | | | | 19,000,000 | | | | 18,994,567 | |
| | | | |
Total Treasury Debt (Cost $135,981,004) | | | | | | | | | | | | | | | 135,981,004 | |
| | | | | | | | | | | | | | | | |
| | | | | | | | |
| Total Investments in Securities | | | | | | | | |
| (Cost $5,548,835,118) * | | | 100.06 | % | | | 5,548,835,118 | |
Other Assets and Liabilities, Net | | | (0.06 | ) | | | (3,326,472 | ) |
| | | | | | | | |
| Total Net Assets | | | 100.00 | % | | $ | 5,545,508,646 | |
| | | | | | | | |
| | | | | | |
| Portfolio of Investments—July 31, 2012 (Unaudited) | | Wells Fargo Advantage Money Market Fund | | | 19 | |
| ± | Variable rate investment |
| 144A | Security that may be resold to “qualified institutional buyers” under Rule 144A or security offered pursuant to Section 4(2) of the Securities Act of 1933, as amended. |
| (z) | Zero coupon security. Rate represents yield to maturity at time of purchase. |
| § | These securities are subject to a demand feature which reduces the effective maturity. |
| (1) | U.S. government securities, 2.65% to 5.50%, 3/1/2017 to 7/1/2042, fair value including accrued interest is $82,400,000. |
| (2) | U.S. government securities, 2.50% to 7.00%, 8/1/2013 to 8/1/2042, fair value including accrued interest is $97,850,278. |
| (3) | U.S. government securities, 0.30% to 10.00%, 11/15/2012 to 6/1/2042, fair value including accrued interest is $20,510,610. |
| (4) | U.S. government securities, 2.50% to 6.00%, 5/1/2020 to 7/1/2042, fair value including accrued interest is $49,440,070. |
| (5) | U.S. government securities, 4.50%, 7/20/2041 to 8/20/2041, fair value including accrued interest is $107,120,000. |
| (6) | U.S. government securities, 0.00% to 6.91%, 12/12/2014 to 4/1/2050, fair value including accrued interest is $182,690,377. |
| (7) | U.S. government securities, 1.69% to 6.42%, 7/1/2017 to 5/1/2042, fair value including accrued interest is $57,680,000. |
| * | Cost for federal income tax purposes is substantially the same as for financial reporting purposes. |
| | | | | | |
| Portfolio of Investments—July 31, 2012 (Unaudited) | | Wells Fargo Advantage National Tax-Free Money Market Fund | | | 1 | |
| | | | | | | | | | | | | | | | |
| Security Name | | Interest Rate | | | Maturity Date | | | Principal | | | Value | |
| | | | | | | | | | | | | | | | |
| | | |
Municipal Obligations : 98.97% | | | | | | | | | | | | | |
| | | |
Alabama : 4.05% | | | | | | | | | | | | | |
| | | | |
| Variable Rate Demand Notes §: 4.05% | | | | | | | | | | | | | | | | |
Chatom AL Industrial Development Board Gulf Opportunity Zone Power South Energy Cooperative Projects Series 2011 (Utilities Revenue, National Rural Utilities Cooperative Finance Corporation LOC) | | | 0.30 | % | | | 08/01/2041 | | | $ | 7,900,000 | | | $ | 7,900,000 | |
Mobile AL Downtown RDA Gulf Opportunity Zone Austal USA LLC Project Series A (IDR, National Australia Bank LOC) | | | 0.15 | | | | 05/01/2041 | | | | 33,000,000 | | | | 33,000,000 | |
Mobile AL Downtown RDA Gulf Opportunity Zone Austal USA LLC Project Series B (IDR, National Australia Bank LOC) | | | 0.15 | | | | 05/01/2041 | | | | 30,770,000 | | | | 30,770,000 | |
Mobile AL Industrial Development Board Alabama Power Company Project Series C (IDR) | | | 0.19 | | | | 08/01/2017 | | | | 12,000,000 | | | | 12,000,000 | |
Mobile AL Industrial Development Board Project Series 2006 (IDR, Whitney National Bank LOC) | | | 0.20 | | | | 08/01/2031 | | | | 4,050,000 | | | | 4,050,000 | |
Tuscaloosa County AL IDA Gulf Opportunity Zone Hunt Refining Project Series 2008 C (IDR, JPMorgan Chase Bank LOC) | | | 0.21 | | | | 12/01/2027 | | | | 10,000,000 | | | | 10,000,000 | |
Tuscaloosa County AL IDA Gulf Opportunity Zone Hunt Refining Project Series 2011 G (IDR, Bank of Nova Scotia LOC) | | | 0.16 | | | | 04/01/2028 | | | | 20,000,000 | | | | 20,000,000 | |
Tuscaloosa County AL IDA Gulf Opportunity Zone Hunt Refining Project Series 2011 J (IDR, Bank of Nova Scotia LOC) | | | 0.16 | | | | 04/01/2028 | | | | 15,000,000 | | | | 15,000,000 | |
University of Alabama at Birmingham Hospital Series 2012 C (Hospital Revenue, PNB Bank NA LOC) | | | 0.20 | | | | 09/01/2042 | | | | 22,500,000 | | | | 22,500,000 | |
| | | | |
| | | | | | | | | | | | | | | 155,220,000 | |
| | | | | | | | | | | | | | | | |
| | | | |
Arizona : 2.19% | | | | | | | | | | | | | | | | |
| | | | |
| Other Municipal Debt : 0.26% | | | | | | | | | | | | | | | | |
Phoenix Civic Improvement Corporation Series 2012-A (Miscellaneous Revenue) | | | 0.17 | | | | 08/06/2012 | | | | 10,000,000 | | | | 10,000,000 | |
| | | | | | | | | | | | | | | | |
| | | | |
| Variable Rate Demand Notes §: 1.93% | | | | | | | | | | | | | | | | |
Arizona Health Facilities Authority Banner Health Series 2008 B (Health Revenue, Bank of Novia Scotia LOC) | | | 0.14 | | | | 01/01/2035 | | | | 28,510,000 | | | | 28,510,000 | |
Maricopa County AZ IDA Gran Victoria Housing LLC Project Series 2000 A (Housing Revenue, FNMA Insured, FNMA LIQ) | | | 0.16 | | | | 04/15/2030 | | | | 10,200,000 | | | | 10,200,000 | |
Mesa AZ Utility System Clipper Tax-Exempt Certificate Trust 2009-33 (Miscellaneous Revenue, State Street Bank & Trust Company LIQ) | | | 0.15 | | | | 07/01/2024 | | | | 35,055,000 | | | | 35,055,000 | |
| | | | |
| | | | | | | | | | | | | | | 73,765,000 | |
| | | | | | | | | | | | | | | | |
| | | | |
California : 8.04% | | | | | | | | | | | | | | | | |
| | | | |
| Other Municipal Debt : 0.42% | | | | | | | | | | | | | | | | |
Los Angeles County CA School Pooled Financing Program TRAN Series B-1 (Miscellaneous Revenue, GO of Participants Insured) | | | 2.00 | | | | 11/30/2012 | | | | 4,000,000 | | | | 4,023,052 | |
San Diego County CA School District TRAN Series 2012-13 B-2 (Education Revenue, GO of Participants Insured) | | | 2.00 | | | | 04/30/2013 | | | | 2,000,000 | | | | 2,025,273 | |
San Diego County CA School District TRAN Series B-1 (Miscellaneous Revenue, GO of Participants Insured) | | | 2.00 | | | | 01/31/2013 | | | | 10,000,000 | | | | 10,087,118 | |
| | | | |
| | | | | | | | | | | | | | | 16,135,443 | |
| | | | | | | | | | | | | | | | |
| | | | |
| 2 | | Wells Fargo Advantage National Tax-Free Money Market Fund | | Portfolio of Investments—July 31, 2012 (Unaudited) |
| | | | | | | | | | | | | | | | |
| Security Name | | Interest Rate | | | Maturity Date | | | Principal | | | Value | |
| | | | | | | | | | | | | | | | |
| | | | |
| Variable Rate Demand Notes §: 7.62% | | | | | | | | | | | | | | | | |
Bay Area Toll Authority California Toll Bridge Series A (Transportation Revenue, Sumitomo Mitsui Banking Corporation LOC) | | | 0.12 | % | | | 04/01/2045 | | | $ | 5,100,000 | | | $ | 5,100,000 | |
California CDA Gas Supply Series 2010 (Utilities Revenue, Royal Bank of Canada SPA) | | | 0.14 | | | | 11/01/2040 | | | | 101,480,000 | | | | 101,480,000 | |
California CDA Refunding MFHR PUTTER Series 2680 (Housing Revenue, JPMorgan Chase Bank LOC) | | | 0.23 | | | | 05/15/2018 | | | | 15,900,000 | | | | 15,900,000 | |
California HFFA St. Joseph Health System Series B (Health Revenue, U.S. Bank NA LOC) | | | 0.14 | | | | 07/01/2041 | | | | 10,000,000 | | | | 10,000,000 | |
California HFFA St. Joseph Health System Series C (Health Revenue, Northern Trust Company LOC) | | | 0.14 | | | | 07/01/2041 | | | | 7,200,000 | | | | 7,200,000 | |
California Infrastructure & Economic Development Bank Pacific Gas & Electric Company Series 2009 B (Utilities Revenue, Mizuho Corporate Bank LOC) | | | 0.14 | | | | 11/01/2026 | | | | 16,900,000 | | | | 16,900,000 | |
California Infrastructure & Economic Development Bank ROC RR-II-R-11527 (Transportation Revenue, AMBAC Insured) | | | 0.15 | | | | 07/01/2030 | | | | 9,900,000 | | | | 9,900,000 | |
California State GO Kindergarten University Public Education Facilities Series 2003 A-2 (GO, Bank of Montreal LOC) | | | 0.12 | | | | 05/01/2033 | | | | 4,350,000 | | | | 4,350,000 | |
California State GO Kindergarten University Public Education Facilities Series 2003-A (GO, Bank of Montreal LOC) | | | 0.11 | | | | 05/01/2033 | | | | 11,750,000 | | | | 11,750,000 | |
California State GO Kindergarten University Public Education Facilities Series 2005-A (GO, Royal Bank of Canada LOC) | | | 0.11 | | | | 05/01/2040 | | | | 4,900,000 | | | | 4,900,000 | |
Golden State CA Tobacco Securitization Corporation Tobacco Settlement ROC RR-II- R-11442 (Tobacco Revenue, AGC-ICC Insured, Citibank NA LIQ) | | | 0.60 | | | | 06/01/2035 | | | | 3,055,000 | | | | 3,055,000 | |
Kings County CA Housing Authority Edgewater Apartments Series 2001 A (Housing Revenue, FNMA Insured, FNMA LIQ) | | | 0.17 | | | | 02/15/2031 | | | | 7,310,000 | | | | 7,310,000 | |
Lancaster CA Redevelopment Agency MFHR 20th Street Apartments Project Series C (Housing Revenue, FNMA Insured, FNMA LIQ) | | | 0.14 | | | | 12/01/2026 | | | | 5,500,000 | | | | 5,500,000 | |
Oceanside CA MFHR Ace-Shadow Way Apartments Project Series 2009 (Housing Revenue, FHLMC LOC) | | | 0.14 | | | | 03/01/2049 | | | | 1,300,000 | | | | 1,300,000 | |
Sacramento County CA MUD JPMorgan Chase PUTTER Series 4071 (Utilities Revenue, BHAC-CR, FSA-CR, AMBAC Insured, JPMorgan Chase & Company LIQ) 144A | | | 0.18 | | | | 11/15/2013 | | | | 9,485,000 | | | | 9,485,000 | |
Sacramento County CA MUD Series L (Utilities Revenue, U.S.
Bank NA LOC) | | | 0.14 | | | | 08/15/2041 | | | | 1,900,000 | | | | 1,900,000 | |
Sacramento County CA River Pointe Housing Authority Apartments Series 2007 B (Housing Revenue, FNMA Insured, FNMA LOC) | | | 0.17 | | | | 08/15/2027 | | | | 10,000,000 | | | | 10,000,000 | |
San Diego CA Community College District GO Election of 2006 Series 2011 Royal Bank of Canada Municipal Products Incorporated Trust Certificates Series O-8 (GO, Royal Bank of Canada LIQ) 144A | | | 0.13 | | | | 08/01/2019 | | | | 900,000 | | | | 900,000 | |
Santa Clara Valley CA Transportation Authority Measure A Project Series C (Tax Revenue, Sumitomo Mitsui Banking Corporation SPA) | | | 0.13 | | | | 04/01/2036 | | | | 16,700,000 | | | | 16,700,000 | |
Sonoma County CA TAN JPMorgan Chase PUTTER Series 4000 (Miscellaneous Revenue, JPMorgan Chase Bank LIQ) 144A | | | 0.18 | | | | 10/25/2012 | | | | 38,795,000 | | | | 38,795,000 | |
Vacaville CA MFHR Quail Run Project Series A (Housing Revenue, FNMA Insured, FNMA LIQ) | | | 0.19 | | | | 07/15/2018 | | | | 7,100,000 | | | | 7,100,000 | |
Vacaville CA MFHR Sycamore Apartments Series A (Housing Revenue, FNMA Insured, FNMA LIQ) | | | 0.14 | | | | 05/15/2029 | | | | 2,350,000 | | | | 2,350,000 | |
| | | | |
| | | | | | | | | | | | | | | 291,875,000 | |
| | | | | | | | | | | | | | | | |
| | | | | | |
| Portfolio of Investments—July 31, 2012 (Unaudited) | | Wells Fargo Advantage National Tax-Free Money Market Fund | | | 3 | |
| | | | | | | | | | | | | | | | |
| Security Name | | Interest Rate | | | Maturity Date | | | Principal | | | Value | |
| | | | | | | | | | | | | | | | |
| | | | |
Colorado : 2.83% | | | | | | | | | | | | | | | | |
| | | | |
| Variable Rate Demand Notes §: 2.83% | | | | | | | | | | | | | | | | |
Aurora CO Centretech Metropolitan District Remarketed Series A (GO, U.S. Bank NA LOC) | | | 0.16 | % | | | 12/01/2028 | | | $ | 2,605,000 | | | $ | 2,605,000 | |
Aurora CO Centretech Metropolitan District Remarketed Series B (GO, U.S. Bank NA LOC) | | | 0.16 | | | | 12/01/2017 | | | | 2,765,000 | | | | 2,765,000 | |
Aurora CO Centretech Metropolitan District Series 1998 C (GO, U.S. Bank NA LOC) | | | 0.16 | | | | 12/01/2028 | | | | 3,015,000 | | | | 3,015,000 | |
Colorado ECFA Nature Conservancy Project Series 2012 (Miscellaneous Revenue) | | | 0.14 | | | | 07/01/2033 | | | | 39,880,000 | | | | 39,880,000 | |
Colorado ECFA Vail Valley Foundation Project Series 2007 (Miscellaneous Revenue, U.S. Bank NA LOC) | | | 0.16 | | | | 12/01/2037 | | | | 5,600,000 | | | | 5,600,000 | |
Colorado HFA Winridge Apartments Series 1998 (Housing Revenue, FNMA Insured, FNMA LIQ) | | | 0.16 | | | | 02/15/2028 | | | | 6,800,000 | | | | 6,800,000 | |
Commerce City CO Northern Infrastructure General Improvement District GO Series 2006 (GO, U.S. Bank NA LOC) | | | 0.16 | | | | 12/01/2028 | | | | 6,500,000 | | | | 6,500,000 | |
Commerce City CO Northern Infrastructure General Improvement District GO Series 2008 (GO, U.S. Bank NA LOC) | | | 0.16 | | | | 12/01/2038 | | | | 8,625,000 | | | | 8,625,000 | |
Denver CO City & County Cottonwood Creek Series 1989 A (Housing Revenue, FHLMC Insured, FHLMC LIQ) | | | 0.20 | | | | 04/15/2014 | | | | 7,050,000 | | | | 7,050,000 | |
Denver CO City & County Refunding MFHR Garden Court Community Project Series 2008 (Housing Revenue, FNMA Insured, FNMA LIQ) | | | 0.17 | | | | 12/15/2038 | | | | 7,945,000 | | | | 7,945,000 | |
Meridian Ranch CO Metropolitan District GO Series 2009
(GO, U.S. Bank NA LOC) | | | 0.16 | | | | 12/01/2038 | | | | 4,230,000 | | | | 4,230,000 | |
Mountain Village CO Housing Authority Facilities Apartments Project Series 2010 (Housing Revenue, U.S. Bank NA LOC) | | | 0.16 | | | | 11/01/2040 | | | | 6,350,000 | | | | 6,350,000 | |
Southeast Colorado Public Improvement Metropolitan District Series 2004 (GO, U.S. Bank NA LOC) | | | 0.16 | | | | 11/15/2034 | | | | 3,865,000 | | | | 3,865,000 | |
Southern Ute Indian Tribe Reservation Colorado
(Miscellaneous Revenue) 144A | | | 0.16 | | | | 04/01/2040 | | | | 3,000,000 | | | | 3,000,000 | |
| | | | |
| | | | | | | | | | | | | | | 108,230,000 | |
| | | | | | | | | | | | | | | | |
| | | | |
Delaware : 0.36% | | | | | | | | | | | | | | | | |
| | | | |
| Variable Rate Demand Notes §: 0.36% | | | | | | | | | | | | | | | | |
Delaware State EDA St. Andrews School Project Series 2002 (Education Revenue, TD Bank NA SPA) | | | 0.17 | | | | 09/01/2032 | | | | 10,000,000 | | | | 10,000,000 | |
Delaware State EDA YMCA Delaware Projects Series 2007 (Miscellaneous Revenue, PNC Bank NA LOC) | | | 0.16 | | | | 05/01/2036 | | | | 3,835,000 | | | | 3,835,000 | |
| | | | |
| | | | | | | | | | | | | | | 13,835,000 | |
| | | | | | | | | | | | | | | | |
| | | | |
District of Columbia : 0.22% | | | | | | | | | | | | | | | | |
| | | | |
| Variable Rate Demand Notes §: 0.22% | | | | | | | | | | | | | | | | |
District of Columbia Community Connection Real Estate Foundation Issue Series 2007-A (Miscellaneous Revenue) | | | 0.15 | | | | 07/01/2032 | | | | 3,600,000 | | | | 3,600,000 | |
District of Columbia Wesley Theological Seminary Issue Series 2008 A (Miscellaneous Revenue, PNC Bank NA LOC) | | | 0.17 | | | | 12/01/2048 | | | | 4,710,000 | | | | 4,710,000 | |
| | | | |
| | | | | | | | | | | | | | | 8,310,000 | |
| | | | | | | | | | | | | | | | |
| | | | |
| 4 | | Wells Fargo Advantage National Tax-Free Money Market Fund | | Portfolio of Investments—July 31, 2012 (Unaudited) |
| | | | | | | | | | | | | | | | |
| Security Name | | Interest Rate | | | Maturity Date | | | Principal | | | Value | |
| | | | | | | | | | | | | | | | |
| | | | |
Florida : 7.19% | | | | | | | | | | | | | | | | |
| | | | |
| Other Municipal Debt : 1.06% | | | | | | | | | | | | | | | | |
Hillsborough County FL Capital Improvement Program Series A (Miscellaneous Revenue) | | | 0.18 | % | | | 08/30/2012 | | | $ | 8,000,000 | | | $ | 8,000,000 | |
JEA Florida Electric System Series 2000 F-1 (Utilities Revenue) | | | 0.17 | | | | 08/16/2012 | | | | 11,000,000 | | | | 11,000,000 | |
JEA Florida Electric System Series 2000 F-2 (Utilities Revenue) | | | 0.18 | | | | 08/14/2012 | | | | 21,700,000 | | | | 21,700,000 | |
| | | | |
| | | | | | | | | | | | | | | 40,700,000 | |
| | | | | | | | | | | | | | | | |
| | | | |
Variable Rate Demand Notes §: 6.13% | | | | | | | | | | | | | | | | |
Alachua County FL HFA MFHR Santa Fe Apartments Project Series 2008 (Housing Revenue, FNMA LOC) | | | 0.16 | | | | 04/15/2041 | | | | 7,400,000 | | | | 7,400,000 | |
Brevard County FL HFA MFHR Shore View Apartments Project Series 1995 (Housing Revenue, Harris Trust & Savings Bank LOC) | | | 0.17 | | | | 02/01/2015 | | | | 2,200,000 | | | | 2,200,000 | |
Duval County FL HFA Sunbeam Road Apartments Project (Housing Revenue, U.S. Bank NA LOC) | | | 0.16 | | | | 07/01/2025 | | | | 3,750,000 | | | | 3,750,000 | |
Florida Gulf Coast University Finance Corporation Parking Project Series A (Education Revenue, Harris NA LOC) | | | 0.14 | | | | 02/01/2039 | | | | 7,665,000 | | | | 7,665,000 | |
Florida HFA Huntington Project 1985 Series GGG (Housing Revenue, FHLMC Insured, FHLMC LIQ) | | | 0.19 | | | | 12/01/2013 | | | | 7,100,000 | | | | 7,100,000 | |
Highlands County FL Health Facilities Authority Adventist Health System Sunbelt Obligated Group Series 2003 C (Health Revenue) | | | 0.13 | | | | 11/15/2021 | | | | 12,095,000 | | | | 12,095,000 | |
Highlands County FL Health Facilities Authority Adventist Health System Sunbelt Obligated Group Series 2006 C (Health Revenue, Bank of America NA LIQ) 144A | | | 0.27 | | | | 11/15/2036 | | | | 8,595,000 | | | | 8,595,000 | |
Jacksonville FL Electrical System Series 2000 A (Utilities Revenue, Bank of Montreal LOC) | | | 0.14 | | | | 10/01/2035 | | | | 17,315,000 | | | | 17,315,000 | |
Jacksonville FL HFA MFHR St. Augustine Apartments Project Series 2006 (Housing Revenue, FNMA Insured, FNMA LIQ) | | | 0.16 | | | | 07/15/2033 | | | | 3,300,000 | | | | 3,300,000 | |
Orange County FL HFFA Adventist Health System Sunbelt Obligated Group Series 1995 (Health Revenue) | | | 0.12 | | | | 11/15/2026 | | | | 44,705,000 | | | | 44,705,000 | |
Orange County FL HFFA Adventist Health Systems Sunbelt Obligated Group Series 1995 (Health Revenue, AMBAC Insured, Bank of America
NA LIQ) | | | 0.32 | | | | 11/15/2025 | | | | 31,960,000 | | | | 31,960,000 | |
Orlando & Orange County FL Expressway Authority Series 2003 C (Transportation Revenue, Bank of Montreal LOC) | | | 0.14 | | | | 07/01/2040 | | | | 20,000,000 | | | | 20,000,000 | |
Orlando & Orange County FL Expressway Authority Series 2003 C-4 (Transportation Revenue, TD Bank NA LOC, AGM Insured) | | | 0.13 | | | | 07/01/2025 | | | | 10,000,000 | | | | 10,000,000 | |
Orlando FL Utilities Commission Series A (Utilities Revenue) (i) | | | 0.26 | | | | 10/01/2027 | | | | 6,745,000 | | | | 6,745,000 | |
Palm Beach County FL Children’s Home Project Series 2008 (Miscellaneous Revenue, Bank of America NA LOC) | | | 0.33 | | | | 05/01/2038 | | | | 3,840,000 | | | | 3,840,000 | |
Palm Beach County FL Jupiter Medical Center Incorporated Series B (Health Revenue, TD Bank NA LOC) | | | 0.12 | | | | 08/01/2020 | | | | 5,540,000 | | | | 5,540,000 | |
Palm Beach County FL Norton Gallery and School of Art Incorporated Series 1995 (Education Revenue, Northern Trust Company LOC, GO of Institution Insured) | | | 0.22 | | | | 05/01/2025 | | | | 1,465,000 | | | | 1,465,000 | |
Palm Beach County FL Zoological Society Incorporated Project Series 2001 (Miscellaneous Revenue, Northern Trust Company LOC) | | | 0.16 | | | | 05/01/2031 | | | | 2,500,000 | | | | 2,500,000 | |
Pinellas County FL IDR Neighborly Care Network Project Series 2008 (Miscellaneous Revenue, Branch Banking & Trust LOC) | | | 0.17 | | | | 08/01/2028 | | | | 4,570,000 | | | | 4,570,000 | |
Polk County FL IDA HCFR Winter Haven Hospital Series B (Health Revenue, PNC Bank NA LOC) | | | 0.15 | | | | 09/01/2034 | | | | 5,170,000 | | | | 5,170,000 | |
Polk County FL IDA HCFR Winter Haven Hospital Series C (Health Revenue, PNC Bank NA LOC) | | | 0.15 | | | | 09/01/2036 | | | | 4,540,000 | | | | 4,540,000 | |
| | | | | | |
| Portfolio of Investments—July 31, 2012 (Unaudited) | | Wells Fargo Advantage National Tax-Free Money Market Fund | | | 5 | |
| | | | | | | | | | | | | | | | |
| Security Name | | Interest Rate | | | Maturity Date | | | Principal | | | Value | |
| | | | | | | | | | | | | | | | |
| | | | |
Variable Rate Demand Notes § (continued) | | | | | | | | | | | | | | | | |
Sarasota County FL Planned Parenthood Incorporated Project Series 2007 (Health Revenue, Harris NA LOC) | | | 0.18 | % | | | 10/01/2041 | | | $ | 4,290,000 | | | $ | 4,290,000 | |
Tampa FL Baycare Health System Series B (Health Revenue) | | | 0.25 | | | | 11/15/2033 | | | | 14,000,000 | | | | 14,000,000 | |
West Palm Beach FL Utilities Systems Series 2008C (Water & Sewer Revenue, Assured Guaranty Insured) | | | 0.31 | | | | 10/01/2038 | | | | 6,000,000 | | | | 6,000,000 | |
| | | | |
| | | | | | | | | | | | | | | 234,745,000 | |
| | | | | | | | | | | | | | | | |
| | | | |
Georgia : 2.25% | | | | | | | | | | | | | | | | |
| | | | |
| Variable Rate Demand Notes §: 2.25% | | | | | | | | | | | | | | | | |
Atlanta GA Airport Passenger Facility Charge & Subordinate Lien Term Series 2004 C (Airport Revenue, FSA Insured, Citibank NA LIQ) | | | 0.30 | | | | 01/01/2013 | | | | 12,650,000 | | | | 12,650,000 | |
Atlanta GA Development Authority Perkins Will Incorporated Project Series 2010 (IDR, Harris NA LOC) | | | 0.17 | | | | 11/01/2030 | | | | 9,330,000 | | | | 9,330,000 | |
Clipper Tax-Exempt Certified Trust Series 2007-10 (Miscellaneous Revenue, State Street Bank & Trust Company LIQ) | | | 0.18 | | | | 01/01/2016 | | | | 8,795,000 | | | | 8,795,000 | |
Fulton County GA Development Authority Shepherd Center Incorporated Project Series 2009 (Health Revenue, FHLB LOC) | | | 0.16 | | | | 09/01/2035 | | | | 13,055,000 | | | | 13,055,000 | |
Fulton County GA Development Authority The Lovett School Project Series 2008 (Education Revenue, FHLB LOC) | | | 0.16 | | | | 04/01/2033 | | | | 11,100,000 | | | | 11,100,000 | |
Gwinnett County GA Development Authority Goodwill North Georgia Incorporated Project Series 2009 (Miscellaneous Revenue, Branch Banking & Trust LOC) | | | 0.16 | | | | 10/01/2033 | | | | 5,000,000 | | | | 5,000,000 | |
Gwinnett County GA Hospital Authority Series A (Health Revenue,
FHLB LOC) | | | 0.16 | | | | 07/01/2036 | | | | 9,620,000 | | | | 9,620,000 | |
Gwinnett County GA School District PUTTER Series 2007-1011 (Education Revenue, GO of Authority Insured, Bank of America NA LIQ) | | | 0.27 | | | | 07/01/2041 | | | | 2,730,000 | | | | 2,730,000 | |
Private Colleges & Universities Authority of Georgia Mercer University Project Series 2006 A (Miscellaneous Revenue, Branch Banking &
Trust LOC) | | | 0.16 | | | | 10/01/2036 | | | | 7,655,000 | | | | 7,655,000 | |
Richmond County GA Development Authority MCG Health Incorporated Project Series B (Health Revenue, Branch Banking & Trust LOC) | | | 0.17 | | | | 07/01/2037 | | | | 6,150,000 | | | | 6,150,000 | |
| | | | |
| | | | | | | | | | | | | | | 86,085,000 | |
| | | | | | | | | | | | | | | | |
| | | | |
Hawaii : 0.26% | | | | | | | | | | | | | | | | |
| | | | |
| Variable Rate Demand Note §: 0.26% | | | | | | | | | | | | | | | | |
Hawaii State GO Bonds of 2007 Series Clipper Tax-Exempt Certified Trust Series 2009-62 (GO, State Street Bank & Trust Company LIQ) | | | 0.20 | | | | 04/01/2018 | | | | 9,995,000 | | | | 9,995,000 | |
| | | | | | | | | | | | | | | | |
| | | | |
Idaho : 0.51% | | | | | | | | | | | | | | | | |
| | | | |
| Variable Rate Demand Note §: 0.51% | | | | | | | | | | | | | | | | |
Jerome County ID Economic Development Corporation Davisco Foods International Project Series 2009 (IDR, Bank of Montreal LOC) | | | 0.17 | | | | 12/01/2029 | | | | 19,420,000 | | | | 19,420,000 | |
| | | | | | | | | | | | | | | | |
| | | | |
Illinois : 6.48% | | | | | | | | | | | | | | | | |
| | | | |
| Other Municipal Debt : 0.42% | | | | | | | | | | | | | | | | |
Illinois Finance Authority Loyola University of Chicago Finance Program (Education Revenue) | | | 0.16 | | | | 08/07/2012 | | | | 11,500,000 | | | | 11,500,000 | |
Illinois State Department of Employment Insurance Fund Series 2012 A (Miscellaneous Revenue) | | | 2.00 | | | | 06/15/2013 | | | | 4,500,000 | | | | 4,567,154 | |
| | | | |
| | | | | | | | | | | | | | | 16,067,154 | |
| | | | | | | | | | | | | | | | |
| | | | |
| 6 | | Wells Fargo Advantage National Tax-Free Money Market Fund | | Portfolio of Investments—July 31, 2012 (Unaudited) |
| | | | | | | | | | | | | | | | |
| Security Name | | Interest Rate | | | Maturity Date | | | Principal | | | Value | |
| | | | | | | | | | | | | | | | |
| | | | |
| Variable Rate Demand Notes §: 6.06% | | | | | | | | | | | | | | | | |
Aurora IL Economic Development Aurora University Series 2004 (Education Revenue, Harris Trust & Savings Bank LOC) | | | 0.16 | % | | | 03/01/2035 | | | $ | 4,225,000 | | | $ | 4,225,000 | |
Chicago IL O’Hare International Airport ROC RR-II-R-605PB (Airport Revenue, FSA-CR, FGIC Insured, Citibank NA LIQ) | | | 0.35 | | | | 01/01/2014 | | | | 10,370,000 | | | | 10,370,000 | |
Du Page & Will County IL Community School District #204 Indian Prairie School Building Series A Royal Bank of Canada Municipal Products Incorporated Trust Certificates Series 0-26 (GO, Royal Bank of Canada LIQ) 144A | | | 0.17 | | | | 06/30/2016 | | | | 5,765,000 | | | | 5,765,000 | |
Illinois Development Finance Authority Cook Communications Ministries Project Series 2002 (Miscellaneous Revenue, Bank of America NA LOC) | | | 0.50 | | | | 03/01/2017 | | | | 4,500,000 | | | | 4,500,000 | |
Illinois Development Finance Authority Lake Forest Academy Series 2000 (Education Revenue, Northern Trust Company LOC) | | | 0.16 | | | | 12/01/2024 | | | | 1,000,000 | | | | 1,000,000 | |
Illinois Development Finance Authority McCormick Theological Seminary Project Series 2001-B (Education Revenue, Northern Trust Company LOC) | | | 0.16 | | | | 06/01/2035 | | | | 22,435,000 | | | | 22,435,000 | |
Illinois Development Finance Authority Presbyterian Homes Two Arbor Lane Project Series 2001 (Health Revenue, Northern Trust Company LOC) | | | 0.16 | | | | 04/01/2035 | | | | 9,000,000 | | | | 9,000,000 | |
Illinois Development Finance Authority St. Ignatius College Series 1994 (Education Revenue, PNC Bank NA LOC) | | | 0.17 | | | | 06/01/2024 | | | | 6,400,000 | | | | 6,400,000 | |
Illinois Development Finance Authority Village of Oak Park Residence Corporation Project Series 2006 (Housing Revenue, PNC Bank NA LOC) | | | 0.17 | | | | 09/01/2046 | | | | 4,000,000 | | | | 4,000,000 | |
Illinois Development Finance Authority YMCA Metropolitan Chicago Project Series 2001 (Miscellaneous Revenue, Harris Trust & Savings Bank LOC) | | | 0.17 | | | | 06/01/2029 | | | | 19,300,000 | | | | 19,300,000 | |
Illinois Educational Facilities Authority Chicago Zoological Society Brookfield Zoo Project Series 1995-B (Miscellaneous Revenue) | | | 0.16 | | | | 12/15/2025 | | | | 5,000,000 | | | | 5,000,000 | |
Illinois Educational Facilities Authority Newberry Library Project Series 1988 (Miscellaneous Revenue, Northern Trust Company LOC) | | | 0.17 | | | | 03/01/2028 | | | | 2,600,000 | | | | 2,600,000 | |
Illinois Finance Authority Advocate Health Care Network Series 2008 A-1
(Health Revenue) | | | 0.22 | | | | 11/01/2030 | | | | 4,000,000 | | | | 4,000,000 | |
Illinois Finance Authority Advocate Health Care Network Series 2011-B
(Health Revenue) (i) | | | 0.27 | | | | 04/01/2051 | | | | 6,500,000 | | | | 6,500,000 | |
Illinois Finance Authority Children’s Museum Greater Chicago Incorporated Project Series 2004 (Miscellaneous Revenue, Northern Trust Company LOC) | | | 0.16 | | | | 07/01/2034 | | | | 2,600,000 | | | | 2,600,000 | |
Illinois Finance Authority Lake Forest County Day School Project Series 2005 (Education Revenue, Northern Trust Company LOC) | | | 0.16 | | | | 07/01/2035 | | | | 12,750,000 | | | | 12,750,000 | |
Illinois Finance Authority Presbyterian Homes Lake Forest Project Series 2006 (Health Revenue, Northern Trust Company LOC) | | | 0.16 | | | | 09/01/2024 | | | | 21,345,000 | | | | 21,345,000 | |
Illinois Finance Authority Richard H. Driehaus Museum Project Series 2005 (Miscellaneous Revenue, Northern Trust Company LOC) | | | 0.16 | | | | 02/01/2035 | | | | 10,100,000 | | | | 10,100,000 | |
Illinois Finance Authority The Catherine Cook School Project Series 2007 (Education Revenue, Northern Trust Company LOC) | | | 0.16 | | | | 01/01/2037 | | | | 5,820,000 | | | | 5,820,000 | |
Illinois State Finance Authority Hospital Sisters Services Series C (Health Revenue, AGM Insured, JPMorgan Chase Bank SPA) | | | 0.40 | | | | 03/15/2036 | | | | 45,000,000 | | | | 45,000,000 | |
Metropolitan Pier & Exposition Authority Illinois McCormack Expansion Project Series 2010B-2 Royal Bank of Canada Municipal Products Incorporated Trust Certificates Series 3219 (Port Authority Revenue, Morgan Stanley Bank LIQ) 144A | | | 0.23 | | | | 06/15/2050 | | | | 12,600,000 | | | | 12,600,000 | |
Metropolitan Pier & Exposition Authority Illinois McCormick Expansion Project Series 2011 Royal Bank of Canada Municipal Products Incorporated Trust Certificates Series 0-40 (Port Authority Revenue, Royal Bank of Canada LIQ) 144A | | | 0.15 | | | | 06/15/2020 | | | | 8,130,000 | | | | 8,130,000 | |
Warren County IL Monmouth College Project Series 2002 (Education Revenue, PNC Bank NA LOC) | | | 0.17 | | | | 12/01/2032 | | | | 8,815,000 | | | | 8,815,000 | |
| | | | |
| | | | | | | | | | | | | | | 232,255,000 | |
| | | | | | | | | | | | | | | | |
| | | | | | |
| Portfolio of Investments—July 31, 2012 (Unaudited) | | Wells Fargo Advantage National Tax-Free Money Market Fund | | | 7 | |
| | | | | | | | | | | | | | | | |
| Security Name | | Interest Rate | | | Maturity Date | | | Principal | | | Value | |
| | | | | | | | | | | | | | | | |
| | | | |
Indiana : 2.13% | | | | | | | | | | | | | | | | |
| | | | |
| Other Municipal Debt : 0.30% | | | | | | | | | | | | | | | | |
Indiana State Bond Bank Advance Funding Program Series 2012-A
(Miscellaneous Revenue) | | | 1.25 | % | | | 01/03/2013 | | | $ | 11,600,000 | | | $ | 11,643,980 | |
| | | | | | | | | | | | | | | | |
| | | | |
| Variable Rate Demand Notes §: 1.83% | | | | | | | | | | | | | | | | |
Clipper Tax-Exempt Certified Trust Series 2007-02 (Miscellaneous Revenue, State Street Bank & Trust Company LIQ) | | | 0.18 | | | | 07/01/2023 | | | | 26,140,000 | | | | 26,140,000 | |
Indiana Finance Authority Midwestern Disaster Relief Ohio Valley Electric Corporation Project Series C (Miscellaneous Revenue, Bank of Nova Scotia LOC) | | | 0.15 | | | | 06/01/2040 | | | | 5,500,000 | | | | 5,500,000 | |
Indiana Finance Authority Northshore Health Center Incorporated Project Series 2008 (Health Revenue, Harris NA LOC) | | | 0.17 | | | | 07/01/2038 | | | | 5,065,000 | | | | 5,065,000 | |
Indiana Finance Authority University Health Obligated Group Royal Bank of Canada Municipal Products Incorporated Trust Certificates Series 2011 E-23 (Miscellaneous Revenue, Royal Bank of Canada LOC, Royal Bank of Canada LIQ) 144A | | | 0.15 | | | | 03/01/2036 | | | | 10,000,000 | | | | 10,000,000 | |
Indiana State Finance Authority Ascension Health Senior Credit Group Series E-4 (Miscellaneous Revenue) | | | 0.14 | | | | 11/15/2036 | | | | 3,000,000 | | | | 3,000,000 | |
Indianapolis IN Canal Square Apartments Project Series 2003 (Housing Revenue, FHLMC Insured, FHLMC LIQ) | | | 0.15 | | | | 04/01/2033 | | | | 11,905,000 | | | | 11,905,000 | |
Indianapolis IN Industrial MFHR Washington Pointe Project Series 2009-A (Housing Revenue, Fleet National Bank LOC, FNMA LIQ) | | | 0.16 | | | | 04/15/2039 | | | | 8,365,000 | | | | 8,365,000 | |
| | | | |
| | | | | | | | | | | | | | | 69,975,000 | |
| | | | | | | | | | | | | | | | |
| | | | |
Iowa : 1.22% | | | | | | | | | | | | | | | | |
| | | | |
| Variable Rate Demand Notes §: 1.22% | | | | | | | | | | | | | | | | |
Iowa Finance Authority Midwestern Disaster Area Archer Daniels Midland Company Project Series 2011 (IDR) | | | 0.22 | | | | 12/01/2051 | | | | 13,000,000 | | | | 13,000,000 | |
Iowa Finance Authority Midwestern Disaster Area Chrisbro III Incorporated Project Series 2011 (IDR, Great Western Bank LOC) | | | 0.16 | | | | 08/01/2041 | | | | 5,000,000 | | | | 5,000,000 | |
Iowa Higher Education Loan Authority Private Colleges Ambrose University Project Series 2003 (Education Revenue, Northern Trust Company LOC) | | | 0.17 | | | | 04/01/2033 | | | | 11,230,000 | | | | 11,230,000 | |
Iowa Higher Education Loan Authority Private Colleges University of Dubuque Project Series 2004 (Education Revenue, Northern Trust Company LOC) | | | 0.17 | | | | 05/01/2029 | | | | 6,200,000 | | | | 6,200,000 | |
Iowa Higher Education Loan Authority Private Colleges University of Dubuque Project Series 2007 (Education Revenue, Northern Trust Company LOC) | | | 0.17 | | | | 04/01/2035 | | | | 11,265,000 | | | | 11,265,000 | |
| | | | |
| | | | | | | | | | | | | | | 46,695,000 | |
| | | | | | | | | | | | | | | | |
| | | | |
Kansas : 0.23% | | | | | | | | | | | | | | | | |
| | | | |
| Variable Rate Demand Note §: 0.23% | | | | | | | | | | | | | | | | |
Kansas Development Finance Authority Adventist Health Sunbelt Obligated Group Series 2009-C (Health Revenue, Royal Bank of Canada LIQ) 144A | | | 0.15 | | | | 11/15/2038 | | | | 9,000,000 | | | | 9,000,000 | |
| | | | | | | | | | | | | | | | |
| | | | |
Kentucky : 1.00% | | | | | | | | | | | | | | | | |
| | | | |
| Other Municipal Debt : 0.03% | | | | | | | | | | | | | | | | |
Kentucky Rural Water Finance Corporation Public Project Series 2012-A (Water & Sewer Revenue) | | | 1.25 | | | | 02/01/2013 | | | | 1,300,000 | | | | 1,304,869 | |
| | | | | | | | | | | | | | | | |
| | | | |
| 8 | | Wells Fargo Advantage National Tax-Free Money Market Fund | | Portfolio of Investments—July 31, 2012 (Unaudited) |
| | | | | | | | | | | | | | | | |
| Security Name | | Interest Rate | | | Maturity Date | | | Principal | | | Value | |
| | | | | | | | | | | | | | | | |
| | | | |
| Variable Rate Demand Notes §: 0.97% | | | | | | | | | | | | | | | | |
Fort Mitchell KY League of Cities Funding Trust Program Series 2002-A (Miscellaneous Revenue, U.S. Bank NA LOC) | | | 0.15 | % | | | 10/01/2032 | | | $ | 6,980,000 | | | $ | 6,980,000 | |
Kentucky EDFA Hospital Ashland Hospital Corporation King Daughter Medical Center Project Series 2008-B (Health Revenue, Branch Banking & Trust LOC) | | | 0.16 | | | | 01/01/2038 | | | | 15,000,000 | | | | 15,000,000 | |
Middletown KY Educational Building Revenue & Refunding Bonds Christian Academy of Louisville Project S (Miscellaneous Revenue, JPMorgan Chase Bank NA LOC) | | | 0.22 | | | | 07/01/2034 | | | | 2,555,000 | | | | 2,555,000 | |
Williamstown KY League of Cities Funding Trust Lease Series 2008-A (Miscellaneous Revenue, U.S. Bank NA LOC) | | | 0.15 | | | | 07/01/2038 | | | | 6,885,000 | | | | 6,885,000 | |
Williamstown KY League of Cities Funding Trust Lease Series 2008-B (Miscellaneous Revenue, U.S. Bank NA LOC) | | | 0.15 | | | | 12/01/2038 | | | | 5,570,000 | | | | 5,570,000 | |
| | | | |
| | | | | | | | | | | | | | | 36,990,000 | |
| | | | | | | | | | | | | | | | |
| | | | |
Louisiana : 2.99% | | | | | | | | | | | | | | | | |
| | | | |
| Variable Rate Demand Notes §: 2.99% | | | | | | | | | | | | | | | | |
Louisiana HFA The Reserve at Jefferson Crossing Series 2008 (Housing Revenue, FHLMC Insured, FHLMC LOC) | | | 0.22 | | | | 07/01/2040 | | | | 4,095,000 | | | | 4,095,000 | |
Louisiana HFA Woodward Wright Apartments Project Series 2003 (Housing Revenue, FHLMC Insured, FHLMC LIQ) | | | 0.15 | | | | 09/01/2033 | | | | 8,955,000 | | | | 8,955,000 | |
Louisiana Public Facilities Authority Christus Health Series 2009 B-1 (Health Revenue, Bank of New York Mellon LOC) | | | 0.12 | | | | 07/01/2047 | | | | 2,000,000 | | | | 2,000,000 | |
Louisiana Public Facilities Authority Christus Health Series 2009 B-3 (Health Revenue, Bank of New York Mellon LOC) | | | 0.12 | | | | 07/01/2047 | | | | 9,360,000 | | | | 9,360,000 | |
Louisiana State Series A-1 Royal Bank of Canada Municipal Products Incorporated Trust Certificates Series 0-31 (Tax Revenue, Royal Bank of Canada LIQ) 144A | | | 0.15 | | | | 05/01/2034 | | | | 1,750,000 | | | | 1,750,000 | |
St. James Parish LA Nucor Steel LLC Project Gulf Opportunity Zone Series 2010 A-1 (IDR) | | | 0.16 | | | | 11/01/2040 | | | | 36,300,000 | | | | 36,300,000 | |
St. James Parish LA Nucor Steel LLC Project Gulf Opportunity Zone Series 2010 B-1 (IDR) | | | 0.16 | | | | 11/01/2040 | | | | 52,000,000 | | | | 52,000,000 | |
| | | | |
| | | | | | | | | | | | | | | 114,460,000 | |
| | | | | | | | | | | | | | | | |
| | | | |
Maine : 0.22% | | | | | | | | | | | | | | | | |
| | | | |
| Variable Rate Demand Note §: 0.22% | | | | | | | | | | | | | | | | |
Maine Finance Authority Foxcroft Academy Issue Series 2008 (Education Revenue, TD Bank NA LOC) | | | 0.13 | | | | 06/01/2038 | | | | 8,300,000 | | | | 8,300,000 | |
| | | | | | | | | | | | | | | | |
| | | | |
Maryland : 3.06% | | | | | | | | | | | | | | | | |
| | | | |
| Other Municipal Debt : 0.43% | | | | | | | | | | | | | | | | |
Montgomery County MD Consolidated Public Improvement BAN Series 2010-A (Miscellaneous Revenue) | | | 0.16 | | | | 08/07/2012 | | | | 16,600,000 | | | | 16,600,000 | |
| | | | | | | | | | | | | | | | |
| | | | |
| Variable Rate Demand Notes §: 2.63% | | | | | | | | | | | | | | | | |
Baltimore County MD Maryvale Preparatory School Facilities Project Series 2005-A (Education Revenue, Manufacturer & Traders Bank LOC) | | | 0.20 | | | | 12/03/2035 | | | | 1,670,000 | | | | 1,670,000 | |
Maryland CDA Department of Housing & Community Development Series 2007-J (Housing Revenue, KBC Bank NV SPA) | | | 0.15 | | | | 09/01/2031 | | | | 13,495,000 | | | | 13,495,000 | |
Maryland CDA MFHR Hopkins Village Apartments Series 2008 F (Housing Revenue, FHLMC Insured, FHLMC LIQ) | | | 0.16 | | | | 11/01/2038 | | | | 3,000,000 | | | | 3,000,000 | |
| | | | | | |
| Portfolio of Investments—July 31, 2012 (Unaudited) | | Wells Fargo Advantage National Tax-Free Money Market Fund | | | 9 | |
| | | | | | | | | | | | | | | | |
| Security Name | | Interest Rate | | | Maturity Date | | | Principal | | | Value | |
| | | | | | | | | | | | | | | | |
| | | | |
| Variable Rate Demand Notes § (continued) | | | | | | | | | | | | | | | | |
Maryland Health & HEFA Stella Maris Issue Series 1997 (Health Revenue, Manufacturer & Traders Bank LOC) | | | 0.16 | % | | | 07/01/2021 | | | $ | 5,175,000 | | | $ | 5,175,000 | |
Maryland HEFA Johns Hopkins University Project Series 1003 (Education Revenue, Bank of America NA LIQ) | | | 0.27 | | | | 07/01/2033 | | | | 6,665,000 | | | | 6,665,000 | |
Maryland HEFA University of Maryland Medical System Series-D (Health Revenue, TD Bank NA LOC) | | | 0.14 | | | | 07/01/2041 | | | | 12,910,000 | | | | 12,910,000 | |
Maryland HEFA University of Maryland Medical System Series-E (Health Revenue, Bank of Montreal LOC) | | | 0.15 | | | | 07/01/2041 | | | | 10,000,000 | | | | 10,000,000 | |
Maryland CDA Residential Series 2007-F (Housing Revenue, PNC
Bank NA LOC) | | | 0.16 | | | | 09/01/2031 | | | | 36,020,000 | | | | 36,020,000 | |
Montgomery County MD EDA Brooke Grove Foundation Incorporated Series 1998 (Miscellaneous Revenue, Manufacturer & Traders Bank LOC) | | | 0.21 | | | | 01/01/2024 | | | | 6,725,000 | | | | 6,725,000 | |
Montgomery County MD Housing Opportunities Series 2002-C (Housing Revenue, FNMA LOC, GO of Commonwealth Insured) | | | 0.16 | | | | 11/01/2032 | | | | 5,000,000 | | | | 5,000,000 | |
| | | | |
| | | | | | | | | | | | | | | 100,660,000 | |
| | | | | | | | | | | | | | | | |
| | | | |
Massachusetts : 0.95% | | | | | | | | | | | | | | | | |
| | | | |
| Other Municipal Debt : 0.10% | | | | | | | | | | | | | | | | |
Massachusetts Port Authority Series 2012- A (Port Authority Revenue) | | | 0.18 | | | | 08/08/2012 | | | | 4,000,000 | | | | 4,000,000 | |
| | | | | | | | | | | | | | | | |
| | | | |
| Variable Rate Demand Notes §: 0.85% | | | | | | | | | | | | | | | | |
Massachusetts State College Building Authority Series 2011 (Education Revenue, State Guaranty Insured) (i) | | | 0.24 | | | | 11/01/2034 | | | | 7,045,000 | | | | 7,045,000 | |
Massachusetts State Development Finance Agency Cushing Academy Issue Series 2004 (Education Revenue, TD Bank NA LOC) | | | 0.14 | | | | 03/01/2034 | | | | 11,755,000 | | | | 11,755,000 | |
Massachusetts State Development Finance Agency Fay School Issue Series 2008 (Education Revenue, TD Bank NA LOC) | | | 0.13 | | | | 04/01/2038 | | | | 4,895,000 | | | | 4,895,000 | |
Massachusetts State Development Finance Agency Shady Hill School Issue Series 2008 (Miscellaneous Revenue, TD Bank NA LOC) | | | 0.14 | | | | 06/01/2038 | | | | 8,745,000 | | | | 8,745,000 | |
| | | | |
| | | | | | | | | | | | | | | 32,440,000 | |
| | | | | | | | | | | | | | | | |
| | | | |
Michigan : 1.60% | | | | | | | | | | | | | | | | |
| | | | |
| Other Municipal Debt : 0.87% | | | | | | | | | | | | | | | | |
Michigan State Hospital Finance Authority Trinity Health Credit Group Series 2008-C (Health Revenue) | | | 0.14 | | | | 08/07/2012 | | | | 13,600,000 | | | | 13,600,000 | |
Michigan State University Board of Trustees Series D (Education Revenue) | | | 0.18 | | | | 10/15/2012 | | | | 10,000,000 | | | | 10,000,000 | |
University of Michigan Series B (Education Revenue) | | | 0.14 | | | | 08/07/2012 | | | | 9,800,000 | | | | 9,800,000 | |
| | | | |
| | | | | | | | | | | | | | | 33,400,000 | |
| | | | | | | | | | | | | | | | |
| | | | |
| Variable Rate Demand Notes §: 0.73% | | | | | | | | | | | | | | | | |
Green Lake Township MI Economic Development Corporation Interlochen Center Arts Project Series 2004 (Miscellaneous Revenue, Harris NA LOC) | | | 0.17 | | | | 06/01/2034 | | | | 2,000,000 | | | | 2,000,000 | |
Michigan State Hospital Finance Authority Ascension Health Senior Credit Group Series 2010-6 (Health Revenue) (i) | | | 0.24 | | | | 11/15/2049 | | | | 3,465,000 | | | | 3,465,000 | |
Michigan State Hospital Finance Authority Ascension Health Senior Credit Group Series 2010-7 (Health Revenue) (i) | | | 0.24 | | | | 11/15/2049 | | | | 4,200,000 | | | | 4,200,000 | |
Michigan State Hospital Finance Authority Trinity Health Credit Group Series 2011 Royal Bank of Canada Municipal Products Incorporated Trust Certificates Series O-32 (Health Revenue, Royal Bank of Canada LIQ) 144A | | | 0.15 | | | | 06/01/2020 | | | | 2,000,000 | | | | 2,000,000 | |
| | | | |
| 10 | | Wells Fargo Advantage National Tax-Free Money Market Fund | | Portfolio of Investments—July 31, 2012 (Unaudited) |
| | | | | | | | | | | | | | | | |
| Security Name | | Interest Rate | | | Maturity Date | | | Principal | | | Value | |
| | | | | | | | | | | | | | | | |
| | | | |
| Variable Rate Demand Notes § (continued) | | | | | | | | | | | | | | | | |
Michigan State University Board of Trustees Series 2005
(Education Revenue, Bank of New York Mellon Trust SPA) | | | 0.15 | % | | | 02/15/2034 | | | $ | 5,600,000 | | | $ | 5,600,000 | |
University of Michigan Board of Regents GO Series 2012-A
(Education Revenue) | | | 0.12 | | | | 04/01/2036 | | | | 10,700,000 | | | | 10,700,000 | |
| | | | |
| | | | | | | | | | | | | | | 27,965,000 | |
| | | | | | | | | | | | | | | | |
| | | | |
Minnesota : 4.03% | | | | | | | | | | | | | | | | |
| | | | |
| Other Municipal Debt : 1.22% | | | | | | | | | | | | | | | | |
Hennepin County MN GO Series 2010-B (Tax Revenue) | | | 2.00 | | | | 12/01/2012 | | | | 1,000,000 | | | | 1,005,998 | |
Regents of the University of Minnesota Series 2005-A (Education Revenue) | | | 0.14 | | | | 08/07/2012 | | | | 13,900,000 | | | | 13,900,000 | |
Rochester MN HCFR Mayo Foundation Series 2000-A (Health Revenue) | | | 0.16 | | | | 08/21/2012 | | | | 31,600,000 | | | | 31,600,000 | |
| | | | |
| | | | | | | | | | | | | | | 46,505,998 | |
| | | | | | | | | | | | | | | | |
| | | | |
| Variable Rate Demand Notes §: 2.81% | | | | | | | | | | | | | | | | |
Arden Hills MN Northwestern College Project 2011 (Education Revenue, BMO Harris Bank NA LOC) | | | 0.17 | | | | 11/30/2030 | | | | 7,695,000 | | | | 7,695,000 | |
Bloomington MN Bristol Village Apartments Project Series 2002 A-1 (Housing Revenue, FNMA Insured, FNMA LIQ) | | | 0.16 | | | | 11/15/2032 | | | | 8,580,000 | | | | 8,580,000 | |
Bloomington MN Presbyterian Homes Project Series 2008 (Health Revenue, FHLMC Insured, FHLMC LIQ) | | | 0.17 | | | | 07/01/2038 | | | | 5,670,000 | | | | 5,670,000 | |
Burnsville MN Bridgeway Apartments Project Series 2003 (Housing Revenue, FNMA Insured, FNMA LIQ) | | | 0.17 | | | | 10/15/2033 | | | | 400,000 | | | | 400,000 | |
Crystal MN MFHR Crystal Apartments Limited Partnership Project Series 1997 (Housing Revenue, FHLMC Insured, FHLMC LIQ) | | | 0.17 | | | | 05/01/2027 | | | | 3,250,000 | | | | 3,250,000 | |
East Grand Forks MN Solid Waste Disposal American Crystal Sugar Company Project Series 2009 (Resource Recovery Revenue,
CoBank ACB LOC) | | | 0.16 | | | | 12/01/2021 | | | | 5,000,000 | | | | 5,000,000 | |
Eden Prairie MN Eden Glen Apartments Project Series 2001 (Housing Revenue, FNMA Insured, FNMA LIQ) | | | 0.17 | | | | 02/15/2031 | | | | 990,000 | | | | 990,000 | |
Eden Prairie MN Refunding MFHR Park At City West Apartments Project Series 2001 (Housing Revenue, FHLMC Insured, FHLMC LIQ) | | | 0.15 | | | | 09/01/2031 | | | | 300,000 | | | | 300,000 | |
Forest Lake MN Kilkenny Court Apartments Project Series 2008 (Housing Revenue, FNMA Insured, FNMA LIQ) | | | 0.16 | | | | 08/15/2038 | | | | 4,100,000 | | | | 4,100,000 | |
Inver Grove Heights MN Inver Grove Incorporated Project Series 2005 (Housing Revenue, FNMA Insured, FNMA LIQ) | | | 0.17 | | | | 05/15/2035 | | | | 9,935,000 | | | | 9,935,000 | |
Maple Grove MN MFHR Basswood Trails Apartment Project Series 2002 (Housing Revenue, FHLMC Insured, FHLMC LIQ) | | | 0.17 | | | | 03/01/2029 | | | | 1,620,000 | | | | 1,620,000 | |
Maplewood MN Educational Facilities Mounds Park Academy Project Series 2003 (Education Revenue, U.S. Bank NA LOC) | | | 0.17 | | | | 10/01/2023 | | | | 1,810,000 | | | | 1,810,000 | |
Minneapolis & St. Paul MN Metropolitan Airport Commission Morgan Stanley Series 3200 (Airport Revenue, Morgan Stanley Bank LIQ) 144A | | | 0.23 | | | | 01/01/2035 | | | | 6,000,000 | | | | 6,000,000 | |
Minnesota State HEFAR Concordia University Series P-1 (Education Revenue, U.S. Bank NA LOC) | | | 0.17 | | | | 04/01/2027 | | | | 2,255,000 | | | | 2,255,000 | |
Minnesota State HEFAR Hamline University Series 6-E1 (Education Revenue, Harris NA LOC) | | | 0.16 | | | | 10/01/2016 | | | | 2,505,000 | | | | 2,505,000 | |
Minnesota State HEFAR Hamline University Series 6-E2 (Education Revenue, Harris NA LOC) | | | 0.16 | | | | 10/01/2025 | | | | 3,285,000 | | | | 3,285,000 | |
Minnesota State HEFAR MacAlester College Series 3-Z (Education Revenue, GO of Institution Insured) | | | 0.21 | | | | 03/01/2024 | | | | 5,435,000 | | | | 5,435,000 | |
Minnesota State HEFAR MacAlester College Series 5-Q
(Education Revenue) | | | 0.20 | | | | 03/01/2033 | | | | 3,860,000 | | | | 3,860,000 | |
| | | | | | |
| Portfolio of Investments—July 31, 2012 (Unaudited) | | Wells Fargo Advantage National Tax-Free Money Market Fund | | | 11 | |
| | | | | | | | | | | | | | | | |
| Security Name | | Interest Rate | | | Maturity Date | | | Principal | | | Value | |
| | | | | | | | | | | | | | | | |
| | | | |
| Variable Rate Demand Notes § (continued) | | | | | | | | | | | | | | | | |
Minnesota State HEFAR Olaf College Series 5-M2 (Education Revenue, Harris NA LOC) | | | 0.17 | % | | | 10/01/2020 | | | $ | 1,745,000 | | | $ | 1,745,000 | |
Oak Park Heights MN Boutwells Landing Project Series 2005 (Housing Revenue, FHLMC Insured, FHLMC LIQ) | | | 0.17 | | | | 11/01/2035 | | | | 8,905,000 | | | | 8,905,000 | |
Pine City MN State Senior Housing Agency Lakeview Project Series 2006 (Housing Revenue, FNMA Insured, FNMA LIQ) | | | 0.17 | | | | 04/15/2036 | | | | 5,600,000 | | | | 5,600,000 | |
Plymouth MN Lancaster Village Apartments Project Series 2001 (Housing Revenue, FNMA Insured, FNMA LIQ) | | | 0.17 | | | | 09/15/2031 | | | | 2,865,000 | | | | 2,865,000 | |
Spring Lake Park MN Senior Housing Oak Crest Apartments Project
Series 2003 (Housing Revenue, FNMA Insured, FNMA LIQ) | | | 0.17 | | | | 02/15/2033 | | | | 1,085,000 | | | | 1,085,000 | |
St. Anthony MN Autumn Woods Housing Project Series 2002 (Housing Revenue, FNMA Insured, FNMA LIQ) | | | 0.17 | | | | 05/15/2032 | | | | 2,550,000 | | | | 2,550,000 | |
St. Louis Park MN Knollwood Place Apartment Project Series 2005 (Housing Revenue, FHLMC Insured, FHLMC LIQ) | | | 0.17 | | | | 10/01/2035 | | | | 11,300,000 | | | | 11,300,000 | |
St. Louis Park MN MFHR Parkshore Senior Campus Project Series 2004 (Housing Revenue, FHLMC Insured, FHLMC LIQ) | | | 0.17 | | | | 08/01/2034 | | | | 1,045,000 | | | | 1,045,000 | |
| | | | |
| | | | | | | | | | | | | | | 107,785,000 | |
| | | | | | | | | | | | | | | | |
| | | | |
Mississippi : 1.17% | | | | | | | | | | | | | | | | |
| | | | |
| Variable Rate Demand Notes §: 1.17% | | | | | | | | | | | | | | | | |
Mississippi State Series A Clipper Tax-Exempt Certificate Trust
Series 2009-60 (Miscellaneous Revenue, State Street Bank & Trust Company LIQ) | | | 0.20 | | | | 11/01/2018 | | | | 18,960,000 | | | | 18,960,000 | |
Perry County MS PCR Leaf River Forest Product Project Series 2002 (IDR, Bank of Nova Scotia LOC) | | | 0.15 | | | | 02/01/2022 | | | | 25,965,000 | | | | 25,965,000 | |
| | | | |
| | | | | | | | | | | | | | | 44,925,000 | |
| | | | | | | | | | | | | | | | |
| | | | |
Missouri : 1.93% | | | | | | | | | | | | | | | | |
| | | | |
| Other Municipal Debt : 0.33% | | | | | | | | | | | | | | | | |
University of Missouri Curators Series A (Education Revenue) | | | 0.15 | | | | 08/07/2012 | | | | 12,700,000 | | | | 12,700,000 | |
| | | | | | | | | | | | | | | | |
| | | | |
| Variable Rate Demand Notes §: 1.60% | | | | | | | | | | | | | | | | |
Independence MO IDA The Mansions Project Series 2005 (Housing Revenue, FHLMC Insured, FHLMC LIQ) | | | 0.15 | | | | 08/01/2035 | | | | 5,110,000 | | | | 5,110,000 | |
Kansas City MO IDA Ewing Marion Kauffman Foundation Series 1997-A (Miscellaneous Revenue) | | | 0.17 | | | | 04/01/2027 | | | | 1,905,000 | | | | 1,905,000 | |
Kansas City MO IDA Ewing Marion Kauffman Foundation Series 2001 (Miscellaneous Revenue) | | | 0.17 | | | | 04/01/2027 | | | | 250,000 | | | | 250,000 | |
Missouri Development Finance Board Various Ewing Marion Kauffman Foundation Project Series 2007-A (Miscellaneous Revenue) | | | 0.17 | | | | 06/01/2037 | | | | 9,525,000 | | | | 9,525,000 | |
Missouri HEFA Ascension Health Series C-1 (Health Revenue) | | | 0.14 | | | | 11/15/2039 | | | | 7,000,000 | | | | 7,000,000 | |
Missouri HEFA Ascension Health Series C-3 (Health Revenue) | | | 0.13 | | | | 11/15/2039 | | | | 11,000,000 | | | | 11,000,000 | |
Missouri HEFA Ascension Health Series C-4 (Health Revenue) | | | 0.13 | | | | 11/15/2026 | | | | 6,500,000 | | | | 6,500,000 | |
St. Louis County MO IDA Heatherbrook Gardens Apartment Project
Series 1992 (Housing Revenue, U.S. Bank NA LOC) | | | 0.34 | | | | 03/01/2022 | | | | 1,765,000 | | | | 1,765,000 | |
St. Louis County MO IDA The Pelican Cove Project Series 2004 (Housing Revenue, FNMA Insured, FNMA LIQ) | | | 0.15 | | | | 03/15/2034 | | | | 18,000,000 | | | | 18,000,000 | |
| | | | |
| | | | | | | | | | | | | | | 61,055,000 | |
| | | | | | | | | | | | | | | | |
| | | | |
| 12 | | Wells Fargo Advantage National Tax-Free Money Market Fund | | Portfolio of Investments—July 31, 2012 (Unaudited) |
| | | | | | | | | | | | | | | | |
| Security Name | | Interest Rate | | | Maturity Date | | | Principal | | | Value | |
| | | | | | | | | | | | | | | | |
| | | | |
Nebraska : 0.92% | | | | | | | | | | | | | | | | |
| | | | |
| Variable Rate Demand Note §: 0.92% | | | | | | | | | | | | | | | | |
Central Plains NE Nebraska Gas Project #2 Series 2009 (Utilities Revenue, Royal Bank of Canada SPA) | | | 0.15 | % | | | 08/01/2039 | | | $ | 35,325,000 | | | $ | 35,325,000 | |
| | | | | | | | | | | | | | | | |
| | | | |
Nevada : 1.15% | | | | | | | | | | | | | | | | |
| | | | |
| Variable Rate Demand Notes §: 1.15% | | | | | | | | | | | | | | | | |
Clark County NV Las Vegas McCarran International Airport Series 2010 F-2 (Airport Revenue, Union Bank NA LOC) | | | 0.16 | | | | 07/01/2022 | | | | 4,800,000 | | | | 4,800,000 | |
Reno NV Senior Lien Transportation Rail Access Corridor Project Series 2008-A (Tax Revenue, Bank of New York Mellon LOC) | | | 0.17 | | | | 06/01/2042 | | | | 39,345,000 | | | | 39,345,000 | |
| | | | |
| | | | | | | | | | | | | | | 44,145,000 | |
| | | | | | | | | | | | | | | | |
| | | | |
New Hampshire : 0.68% | | | | | | | | | | | | | | | | |
| | | | |
| Variable Rate Demand Notes §: 0.68% | | | | | | | | | | | | | | | | |
New Hampshire HEFA Frisbie Memorial Hospital Issue Series 2006 (Health Revenue, TD Bank NA LOC) | | | 0.15 | | | | 10/01/2036 | | | | 12,250,000 | | | | 12,250,000 | |
New Hampshire HEFA Tilton School Issue Series 2006 (Education Revenue, TD Bank NA LOC) | | | 0.13 | | | | 02/01/2036 | | | | 7,900,000 | | | | 7,900,000 | |
New Hampshire State HEFA FHA Healthcare Issue Series 2009 JPMorgan PUTTER Series 3648 (Health Revenue, JPMorgan Chase Bank LIQ) 144A | | | 0.25 | | | | 10/01/2017 | | | | 6,000,000 | | | | 6,000,000 | |
| | | | |
| | | | | | | | | | | | | | | 26,150,000 | |
| | | | | | | | | | | | | | | | |
| | | | |
New Jersey : 2.10% | | | | | | | | | | | | | | | | |
| | | | |
| Variable Rate Demand Notes §: 2.10% | | | | | | | | | | | | | | | | |
Burlington County NJ Bridge Lutheran Home Project Series 2005-A (Miscellaneous Revenue, Commerce Bank NA LOC) | | | 0.13 | | | | 12/01/2025 | | | | 935,000 | | | | 935,000 | |
New Jersey EDA Motor Vehicle Surcharges Series 2004-A (Miscellaneous Revenue, BHAC-CR, NATL-RE Insured, Bank of America NA LIQ) | | | 0.27 | | | | 07/01/2026 | | | | 2,190,000 | | | | 2,190,000 | |
New Jersey Educational Facilities Authority Defense Analyses Issue Series 2000-D (Miscellaneous Revenue, Branch Banking & Trust LOC, AMBAC Insured) | | | 0.16 | | | | 10/01/2030 | | | | 3,175,000 | | | | 3,175,000 | |
New Jersey Health Care Facilities Financing Authority Composite Program Fitness First Oradell LLC Project Series 2006 A-6 (Health Revenue, TD Bank NA LOC) | | | 0.13 | | | | 07/01/2031 | | | | 5,065,000 | | | | 5,065,000 | |
New Jersey HFFA Bayshore Community Hospital Project Series 2004 A-1 (Health Revenue, TD Bank NA LOC) | | | 0.13 | | | | 07/01/2014 | | | | 1,790,000 | | | | 1,790,000 | |
New Jersey TRAN Series A (Miscellaneous Revenue) (i) | | | 0.50 | | | | 06/27/2013 | | | | 16,400,000 | | | | 16,403,075 | |
New Jersey TTFA PUTTER Series 2009-70 (Transportation Revenue, State Street Bank & Trust Company LIQ) | | | 0.15 | | | | 12/15/2023 | | | | 50,725,000 | | | | 50,725,000 | |
| | | | |
| | | | | | | | | | | | | | | 80,283,075 | |
| | | | | | | | | | | | | | | | |
| | | | |
New York : 5.66% | | | | | | | | | | | | | | | | |
| | | | |
| Other Municipal Debt : 0.18% | | | | | | | | | | | | | | | | |
Metropolitan Transportation Authority New York BAN Series 2 Subseries A (Transportation Revenue) | | | 0.18 | | | | 10/04/2012 | | | | 7,000,000 | | | | 7,000,000 | |
| | | | | | | | | | | | | | | | |
| | | | |
| Variable Rate Demand Notes §: 5.48% | | | | | | | | | | | | | | | | |
Brookhaven NY IDAG Series 2001 (Housing Revenue, Capital One NA LOC) | | | 0.15 | | | | 11/01/2037 | | | | 3,750,000 | | | | 3,750,000 | |
Long Island Power Authority New York Series 2004 A JPMorgan Chase PUTTER Trust Series 4070 (Utilities Revenue, BHAC-CR, FSA-CR, AMBAC Insured, JPMorgan Chase & Company LIQ) 144A | | | 0.18 | | | | 03/01/2014 | | | | 5,400,000 | | | | 5,400,000 | |
| | | | | | |
| Portfolio of Investments—July 31, 2012 (Unaudited) | | Wells Fargo Advantage National Tax-Free Money Market Fund | | | 13 | |
| | | | | | | | | | | | | | | | |
| Security Name | | Interest Rate | | | Maturity Date | | | Principal | | | Value | |
| | | | | | | | | | | | | | | | |
| | | | |
| Variable Rate Demand Notes § (continued) | | | | | | | | | | | | | | | | |
Metropolitan Transportation Authority New York Series 2002-A ROC RR-II-R-11645 (Transportation Revenue, FSA Insured, Citibank NA LIQ) 144A | | | 0.30 | % | | | 11/15/2025 | | | $ | 7,280,000 | | | $ | 7,280,000 | |
Metropolitan Transportation Authority New York Series 2005-A ROC RR-II-R-594PB (Transportation Revenue, AGC-ICC, AMBAC Insured, Citibank NA LIQ) | | | 0.30 | | | | 11/15/2013 | | | | 15,000,000 | | | | 15,000,000 | |
Nassau County NY Local Economic Assistance Adults & Children with Learning & Developmental Disabilities Incorporated Project Series 2011-A (Miscellaneous Revenue, TD Bank NA LOC) | | | 0.15 | | | | 11/01/2041 | | | | 7,300,000 | | | | 7,300,000 | |
New York City NY GO Subseries B-3 (GO, TD Bank NA LOC) | | | 0.12 | | | | 09/01/2027 | | | | 20,200,000 | | | | 20,200,000 | |
New York City NY Housing Development Corporation Multi-Family Series C (Housing Revenue) | | | 0.27 | | | | 05/01/2045 | | | | 8,000,000 | | | | 8,000,000 | |
New York City NY Housing Development Corporation Multi-Family
Series H-2 (Housing Revenue) | | | 0.25 | | | | 05/01/2041 | | | | 3,500,000 | | | | 3,500,000 | |
New York Convention Center Development Corporation New York Hotel Unit Fee Secured Series 3095 (Tax Revenue, BHAC-CR AMBAC Insured, Morgan Stanley Bank LIQ) 144A | | | 0.23 | | | | 11/15/2044 | | | | 32,335,000 | | | | 32,335,000 | |
New York State Dormitory Authority Series 12 Clipper Tax-Exempt Certificate Trust Series 2009-35 (Miscellaneous Revenue, State Street Bank & Trust Company LIQ) | | | 0.18 | | | | 11/15/2026 | | | | 22,500,000 | | | | 22,500,000 | |
New York State Dormitory Authority Tax Exempt Certificate St. John’s University Series 2007-C (Miscellaneous Revenue, State Street Bank & Trust Company LIQ) | | | 0.15 | | | | 07/01/2025 | | | | 9,800,000 | | | | 9,800,000 | |
New York State HFA 388 Bridge Street Series 2012-A (Housing Revenue, Manufacturers & Traders Bank LOC) | | | 0.16 | | | | 05/01/2046 | | | | 17,000,000 | | | | 17,000,000 | |
New York State HFA 600 West 42nd Street Series 2009-A (Housing Revenue, FHLMC Insured, FHLMC LIQ) | | | 0.14 | | | | 05/15/2041 | | | | 46,175,000 | | | | 46,175,000 | |
Riverhead NY IDA Central Suffolk Hospital Project Series 2006-C (Hospital Revenue, Manufacturers & Traders Bank LOC) | | | 0.18 | | | | 07/01/2017 | | | | 4,270,000 | | | | 4,270,000 | |
Riverhead NY IDR Central Suffolk Hospital Project Series-A (Health Revenue, Manufacturers & Traders Bank LOC) | | | 0.18 | | | | 07/01/2031 | | | | 3,555,000 | | | | 3,555,000 | |
Riverhead NY IDR Central Suffolk Hospital Project Series-B (Health Revenue, Manufacturers & Traders Bank LOC) | | | 0.18 | | | | 07/01/2031 | | | | 3,570,000 | | | | 3,570,000 | |
| | | | |
| | | | | | | | | | | | | | | 209,635,000 | |
| | | | | | | | | | | | | | | | |
| | | | |
North Carolina : 2.37% | | | | | | | | | | | | | | | | |
| | | | |
| Variable Rate Demand Notes §: 2.37% | | | | | | | | | | | | | | | | |
New Hanover County NC New Hanover Regional Medical Center
Series 2008-B (Hospital Revenue, PNC Bank NA LOC) | | | 0.15 | | | | 10/01/2038 | | | | 9,640,000 | | | | 9,640,000 | |
North Carolina Capital Facilities Finance Agency Educational Campbell University Series 2009 (Education Revenue, Branch Banking & Trust LOC) | | | 0.17 | | | | 10/01/2034 | | | | 5,710,000 | | | | 5,710,000 | |
North Carolina Capital Facilities Finance Agency Educational Guilford College Project Series 2008 (Education Revenue, Branch Banking & Trust LOC) | | | 0.17 | | | | 05/01/2024 | | | | 3,185,000 | | | | 3,185,000 | |
North Carolina Capital Facilities Finance Agency Educational High Point University Project Series 2008 (Education Revenue, Branch Banking & Trust LOC) | | | 0.17 | | | | 05/01/2030 | | | | 2,690,000 | | | | 2,690,000 | |
North Carolina Capital Facilities Finance Agency Educational Hill Center Project (Education Revenue, Branch Banking & Trust LOC) | | | 0.17 | | | | 07/01/2028 | | | | 4,430,000 | | | | 4,430,000 | |
North Carolina Capital Facilities Finance Agency Educational Sterling Montessori Academy & Charter School Project Series 2010 (Education Revenue, Branch Banking & Trust LOC) | | | 0.14 | | | | 03/01/2031 | | | | 10,265,000 | | | | 10,265,000 | |
North Carolina Medical Care Commission HCFR Wake Forest University Health Sciences Series 2008-A (Health Revenue, Branch Banking & Trust NA LOC) | | | 0.15 | | | | 07/01/2034 | | | | 10,160,000 | | | | 10,160,000 | |
| | | | |
| 14 | | Wells Fargo Advantage National Tax-Free Money Market Fund | | Portfolio of Investments—July 31, 2012 (Unaudited) |
| | | | | | | | | | | | | | | | |
| Security Name | | Interest Rate | | | Maturity Date | | | Principal | | | Value | |
| | | | | | | | | | | | | | | | |
| | | | |
| Variable Rate Demand Notes § (continued) | | | | | | | | | | | | | | | | |
North Carolina Medical Care Commission HCFR Wake Forest University Health Sciences Series 2008-B (Education Revenue, Branch Banking & Trust LOC) | | | 0.15 | % | | | 07/01/2034 | | | $ | 14,505,000 | | | $ | 14,505,000 | |
North Carolina Medical Care Commission Wayne Memorial Hospital
Series 2009 (Health Revenue, Branch Banking & Trust LOC) | | | 0.16 | | | | 10/01/2036 | | | | 4,680,000 | | | | 4,680,000 | |
North Carolina Port Authority Facilities Series 2008 (Airport Revenue, Branch Banking & Trust LOC) | | | 0.17 | | | | 06/01/2036 | | | | 3,500,000 | | | | 3,500,000 | |
North Carolina State Educational Facilities Finance Agency Elon College Series 1997 (Education Revenue, TD Bank NA LOC) | | | 0.24 | | | | 01/01/2019 | | | | 7,555,000 | | | | 7,555,000 | |
Piedmont Triad NC Airport Authority Series 2008 A (Airport Revenue, Branch Banking & Trust LOC) | | | 0.14 | | | | 07/01/2032 | | | | 14,305,000 | | | | 14,305,000 | |
| | | | |
| | | | | | | | | | | | | | | 90,625,000 | |
| | | | | | | | | | | | | | | | |
| | | | |
North Dakota : 1.08% | | | | | | | | | | | | | | | | |
| | | | |
| Other Municipal Debt : 0.99% | | | | | | | | | | | | | | | | |
Mercer County ND PCR Basin Electric Power Cooperative Series 2009 -1 (Utilities Revenue) | | | 0.30 | | | | 08/07/2012 | | | | 35,000,000 | | | | 35,000,000 | |
North Dakota State Water Finance Corporation Public Projects Construction Series B-1 (Miscellaneous Revenue) | | | 0.37 | | | | 07/01/2013 | | | | 3,000,000 | | | | 3,000,000 | |
| | | | |
| | | | | | | | | | | | | | | 38,000,000 | |
| | | | | | | | | | | | | | | | |
| | | | |
| Variable Rate Demand Note §: 0.09% | | | | | | | | | | | | | | | | |
Richland County ND Recovery Zone Project Series 2010-C (Tax Revenue, CoBank ACB LOC) | | | 0.16 | | | | 11/01/2028 | | | | 3,500,000 | | | | 3,500,000 | |
| | | | | | | | | | | | | | | | |
| | | | |
Ohio : 0.76% | | | | | | | | | | | | | | | | |
| | | | |
| Variable Rate Demand Notes §: 0.76% | | | | | | | | | | | | | | | | |
Allen County OH Catholic Health Partners Series B (Health Revenue) | | | 0.14 | | | | 05/01/2036 | | | | 9,200,000 | | | | 9,200,000 | |
Butler County OH Capital Funding Low Cost Capital Series 2005-A (Miscellaneous Revenue, U.S. Bank NA LOC) | | | 0.16 | | | | 06/01/2035 | | | | 2,365,000 | | | | 2,365,000 | |
Columbus OH Regional Airport Authority Municipal Pooled Financing Program Series 2004-A (Airport Revenue, U.S. Bank NA LOC) | | | 0.16 | | | | 01/01/2030 | | | | 3,310,000 | | | | 3,310,000 | |
Ohio State HEFAR Xavier University Project Series 2000-B (Education Revenue, PNC Bank NA LOC) | | | 0.15 | | | | 11/01/2030 | | | | 9,300,000 | | | | 9,300,000 | |
Pike County OH HCFR Traditions Health Care Obligation Group Series 2007 (Health Revenue, U.S. Bank NA LOC) | | | 0.14 | | | | 06/01/2033 | | | | 2,100,000 | | | | 2,100,000 | |
Warren County OH Cincinnati Electricity Corporation Project Series 1985 (Miscellaneous Revenue, Bank of Nova Scotia LOC) | | | 0.36 | | | | 09/01/2015 | | | | 2,810,000 | | | | 2,810,308 | |
| | | | |
| | | | | | | | | | | | | | | 29,085,308 | |
| | | | | | | | | | | | | | | | |
| | | | |
Oklahoma : 0.26% | | | | | | | | | | | | | | | | |
| | | | |
| Variable Rate Demand Note §: 0.26% | | | | | | | | | | | | | | | | |
Oklahoma State Municipal Power Authority PUTTER Series 1880 (Utilities Revenue, AGC-ICC, FGIC Insured, JPMorgan Chase Bank LIQ) | | | 0.30 | | | | 01/01/2015 | | | | 10,090,000 | | | | 10,090,000 | |
| | | | | | | | | | | | | | | | |
| | | | |
Oregon : 0.22% | | | | | | | | | | | | | | | | |
| | | | |
| Variable Rate Demand Notes §: 0.22% | | | | | | | | | | | | | | | | |
Oregon State GO Veterans Welfare Series 90B (GO, Bank of Tokyo-Mitsubishi SPA) | | | 0.16 | | | | 12/01/2045 | | | | 6,485,000 | | | | 6,485,000 | |
Oregon State Health & Science University Series B-2 (Education Revenue, Union Bank NA LOC) | | | 0.15 | | | | 07/01/2042 | | | | 2,000,000 | | | | 2,000,000 | |
| | | | |
| | | | | | | | | | | | | | | 8,485,000 | |
| | | | | | | | | | | | | | | | |
| | | | | | |
| Portfolio of Investments—July 31, 2012 (Unaudited) | | Wells Fargo Advantage National Tax-Free Money Market Fund | | | 15 | |
| | | | | | | | | | | | | | | | |
| Security Name | | Interest Rate | | | Maturity Date | | | Principal | | | Value | |
| | | | | | | | | | | | | | | | |
| | | | |
Other : 1.50% | | | | | | | | | | | | | | | | |
| | | | |
| Variable Rate Demand Notes §: 1.50% | | | | | | | | | | | | | | | | |
Austin Trust Various States Certificates Series 2008-3506 (Health Revenue, Assured Guaranty Insured, Bank of America NA LIQ) | | | 0.40 | % | | | 08/15/2047 | | | $ | 23,375,000 | | | $ | 23,375,000 | |
Clipper Tax-Exempt Certificate Trust Series 2009-54 (Miscellaneous Revenue, State Street Bank & Trust Company LIQ) | | | 0.20 | | | | 02/15/2028 | | | | 15,000,000 | | | | 15,000,000 | |
Clipper Tax-Exempt Certified Trust Series 2004-05 (Miscellaneous Revenue, State Street Bank & Trust Company LIQ) | | | 0.20 | | | | 05/01/2014 | | | | 14,500,000 | | | | 14,500,000 | |
Clipper Tax-Exempt Certified Trust Series 2006-04 (Miscellaneous Revenue, State Street Bank & Trust Company LIQ) | | | 0.18 | | | | 05/01/2013 | | | | 4,420,000 | | | | 4,420,000 | |
| | | | |
| | | | | | | | | | | | | | | 57,295,000 | |
| | | | | | | | | | | | | | | | |
| | | | |
Pennsylvania : 7.34% | | | | | | | | | | | | | | | | |
| | | | |
| Variable Rate Demand Notes §: 7.34% | | | | | | | | | | | | | | | | |
Allegheny County PA Hospital Authority University of Pittsburg Medical Center Series 2010C Royal Bank of Canada Municipal Products Incorporated Trust Certificates Series E-29 (Health Revenue, Royal Bank of Canada LOC, Royal Bank of Canada LIQ) 144A | | | 0.15 | | | | 04/25/2014 | | | | 7,000,000 | | | | 7,000,000 | |
Allegheny County PA Hospital Development Authority University of Pittsburgh Medical Center Project Series 2007 B-2 (Health Revenue, Royal Bank of Canada LOC, Royal Bank of Canada LIQ) 144A | | | 0.15 | | | | 04/15/2039 | | | | 13,420,000 | | | | 13,420,000 | |
Allegheny County PA Hospital Development Authority University of Pittsburgh Medical Center Senior Community Incorporated Series 2003 (Health Revenue, FNMA Insured, FNMA LIQ) | | | 0.16 | | | | 07/15/2028 | | | | 8,605,000 | | | | 8,605,000 | |
Allegheny County PA IDA Longwood Oakmont Incorporated Series 2011-A (Health Revenue, PNC Bank NA LOC) | | | 0.15 | | | | 12/01/2041 | | | | 15,000,000 | | | | 15,000,000 | |
Allegheny County PA IDA Oakland Catholic High School Project Series 2012 (Education Revenue, PNC Bank NA LOC) | | | 0.17 | | | | 08/01/2032 | | | | 6,590,000 | | | | 6,590,000 | |
Allegheny County PA IDA United Jewish Federation Project Series A (Health Revenue, PNC Bank NA LOC) | | | 0.17 | | | | 10/01/2026 | | | | 1,313,000 | | | | 1,313,000 | |
Allegheny County PA IDA Watson Institute Friendship Academy Project Series 2010 (Education Revenue, PNC Bank NA LOC) | | | 0.17 | | | | 08/01/2040 | | | | 3,750,000 | | | | 3,750,000 | |
Beaver County PA IDA Electric Company Project Series 2005-A (Utilities Revenue, Bank of Nova Scotia LOC) | | | 0.17 | | | | 11/01/2020 | | | | 10,000,000 | | | | 10,000,000 | |
Beaver County PA IDA First Energy Generation Corporation Project
Series 2008-B (IDR, Bank of Nova Scotia LOC) | | | 0.15 | | | | 10/01/2047 | | | | 21,300,000 | | | | 21,300,000 | |
Beaver County PA IDA Metropolitan Edison Company Project Series 2005-A (Utilities Revenue, Bank of Nova Scotia LOC) | | | 0.17 | | | | 07/15/2021 | | | | 10,000,000 | | | | 10,000,000 | |
Berks County PA Municipal Authority Royal Bank of Canada Municipal Products Incorporated Trust Certificates Series C-15 (Health Revenue, Royal Bank of Canada LOC) 144A | | | 0.15 | | | | 11/01/2012 | | | | 5,485,000 | | | | 5,485,000 | |
Berks County PA The Reading Hospital & Medical Center Project
Series 2012-D Royal Bank of Canada Municipal Products Incorporated Trust Certificates Series E36 (Hospital Revenue, Royal Bank of Canada LOC) 144A | | | 0.15 | | | | 11/01/2035 | | | | 15,000,000 | | | | 15,000,000 | |
Bethlehem PA Area School District Authority Project Series 2010 Royal Bank of Canada Municipal Products Incorporated Trust Certificates Series 2011 E-31 (Miscellaneous Revenue, Royal Bank of Canada LOC, Royal Bank of Canada LIQ) 144A | | | 0.15 | | | | 05/01/2014 | | | | 6,000,000 | | | | 6,000,000 | |
Branch Banking & Trust Municipal Trust Series 2004 (Tax Revenue, Branch Banking & Trust LOC, Branch Banking & Trust LIQ) | | | 0.15 | | | | 01/04/2029 | | | | 6,895,000 | | | | 6,895,000 | |
| | | | |
| 16 | | Wells Fargo Advantage National Tax-Free Money Market Fund | | Portfolio of Investments—July 31, 2012 (Unaudited) |
| | | | | | | | | | | | | | | | |
| Security Name | | Interest Rate | | | Maturity Date | | | Principal | | | Value | |
| | | | | | | | | | | | | | | | |
| | | | |
| Variable Rate Demand Notes § (continued) | | | | | | | | | | | | | | | | |
Butler County PA General Authority North Allegheny School District Project
Series 2011-A (Miscellaneous Revenue, GO of District Insured, PNC Bank NA SPA) | | | 0.17 | % | | | 11/01/2021 | | | $ | 14,245,000 | | | $ | 14,245,000 | |
Butler County PA General Authority North Allegheny School District Project
Series 2011-B (Miscellaneous Revenue, GO of District Insured, PNC Bank NA SPA) | | | 0.17 | | | | 11/01/2022 | | | | 10,220,000 | | | | 10,220,000 | |
Central Bradford Progress Authority Robert Packer Hospital Royal Bank of Canada Municipal Products Incorporated Trust Certificates Series C-14 (Health Revenue, Royal Bank of Canada LOC, Royal Bank of Canada LIQ) 144A | | | 0.15 | | | | 12/01/2041 | | | | 4,000,000 | | | | 4,000,000 | |
Delaware County PA College Authority Eastern College Series A (Miscellaneous Revenue, TD Bank NA LOC) | | | 0.17 | | | | 10/01/2025 | | | | 4,100,000 | | | | 4,100,000 | |
Jackson Township PA IDA Stoneridge Retirement Living (Miscellaneous Revenue, PNC Bank NA LOC) | | | 0.17 | | | | 10/15/2042 | | | | 14,350,000 | | | | 14,350,000 | |
Lehigh County PA General Purpose Authority St. Luke’s Hospital Bethlehem PFOTER (Health Revenue, Bank of America NA LIQ) | | | 0.43 | | | | 08/15/2042 | | | | 18,140,000 | | | | 18,140,000 | |
Manheim Township PA School District Royal Bank of Canada Municipal Products Incorporated Trust Certificates Series E-28 (GO, Royal Bank of Canada LOC, Royal Bank of Canada LIQ) 144A | | | 0.15 | | | | 12/12/2014 | | | | 10,785,000 | | | | 10,785,000 | |
Mercer County PA GO Series 2011 (GO, AGM Insured, PNC Bank NA SPA) | | | 0.31 | | | | 10/01/2031 | | | | 12,805,000 | | | | 12,805,000 | |
Montgomery County PA Higher Education & Health Authority William Penn Charter School Series 2001 (Education Revenue, PNC Bank NA LOC) | | | 0.17 | | | | 09/15/2031 | | | | 4,830,000 | | | | 4,830,000 | |
North Pennsylvania Water Authority Series 2008 (Water & Sewer Revenue, U.S. Bank NA LOC) | | | 0.16 | | | | 11/01/2024 | | | | 7,000,000 | | | | 7,000,000 | |
Pennsylvania EDFA Philadelphia Area Independent School Business Officers Association Financing Program LaSalle College High School Project
Series 2000 J-1 (Education Revenue, PNC Bank NA LOC) | | | 0.17 | | | | 11/01/2030 | | | | 1,225,000 | | | | 1,225,000 | |
Pennsylvania HEFA Association of Independent Colleges & University of Pennsylvania Finance Program University of Scranton Project Series 1999 E-3 (Education Revenue, PNC Bank NA LOC) | | | 0.17 | | | | 11/01/2014 | | | | 6,350,000 | | | | 6,350,000 | |
Pennsylvania Housing Finance Agency Series 2004 (Miscellaneous Revenue, GO of Agency Insured) | | | 0.15 | | | | 01/01/2034 | | | | 7,640,000 | | | | 7,640,000 | |
Pennsylvania Public School Building Authority ROC RR-II-R-11396 (Lease Revenue, FSA State Aid Withholding Insured) | | | 0.29 | | | | 12/01/2023 | | | | 7,600,000 | | | | 7,600,000 | |
Pennsylvania State HEFAR St. Josephs University Series 2008-A (Education Revenue, TD Bank NA LOC) | | | 0.16 | | | | 07/15/2036 | | | | 7,900,000 | | | | 7,900,000 | |
Philadelphia PA IDR Chestnut Hill Academy Series 2005 (Education Revenue, PNC Bank NA LOC) | | | 0.17 | | | | 12/01/2035 | | | | 7,000,000 | | | | 7,000,000 | |
Philadelphia PA IDR Chestnut Hill Academy Series 2007 (Education Revenue, PNC Bank NA LOC) | | | 0.17 | | | | 12/01/2037 | | | | 7,400,000 | | | | 7,400,000 | |
Westmoreland County PA IDA Excela Health Project Series 2010-B (Health Revenue, PNC Bank NA LOC) | | | 0.17 | | | | 07/01/2030 | | | | 5,265,000 | | | | 5,265,000 | |
| | | | |
| | | | | | | | | | | | | | | 281,213,000 | |
| | | | | | | | | | | | | | | | |
| | | | |
Puerto Rico : 0.38% | | | | | | | | | | | | | | | | |
| | | | |
| Variable Rate Demand Notes §: 0.38% | | | | | | | | | | | | | | | | |
Puerto Rico Sales Tax Corporate Financing ROC RR-II-R-11760 (Tax Revenue, Citibank NA LIQ) 144A | | | 0.17 | | | | 12/01/2047 | | | | 6,000,000 | | | | 6,000,000 | |
Puerto Rico Sales Tax Corporate Financing ROC RR-II-R-11761 (Tax Revenue, Citibank NA LIQ) 144A | | | 0.17 | | | | 12/01/2047 | | | | 4,000,000 | | | | 4,000,000 | |
Puerto Rico Sales Tax Corporate Financing ROC RR-II-R-11779 (Tax Revenue, Citibank NA LIQ) 144A | | | 0.17 | | | | 12/01/2047 | | | | 4,700,000 | | | | 4,700,000 | |
| | | | |
| | | | | | | | | | | | | | | 14,700,000 | |
| | | | | | | | | | | | | | | | |
| | | | | | |
| Portfolio of Investments—July 31, 2012 (Unaudited) | | Wells Fargo Advantage National Tax-Free Money Market Fund | | | 17 | |
| | | | | | | | | | | | | | | | |
| Security Name | | Interest Rate | | | Maturity Date | | | Principal | | | Value | |
| | | | | | | | | | | | | | | | |
| | | | |
Rhode Island : 0.12% | | | | | | | | | | | | | | | | |
| | | | |
| Variable Rate Demand Note §: 0.12% | | | | | | | | | | | | | | | | |
Rhode Island State Health & Educational Building Corporation HEFAR Bryant University Issue Series 2008 (Education Revenue, TD Bank NA LOC) | | | 0.16 | % | | | 06/01/2035 | | | $ | 4,555,000 | | | $ | 4,555,000 | |
| | | | | | | | | | | | | | | | |
| | | | |
South Carolina : 1.27% | | | | | | | | | | | | | | | | |
| | | | |
| Other Municipal Debt : 0.68% | | | | | | | | | | | | | | | | |
York County SC PCR Natural Rural Utilities Cooperative Finance Corporation Guaranteed NC Electric Membership Corporation Project Series 200B-1 (Utilities Revenue) | | | 0.45 | | | | 09/04/2012 | | | | 9,700,000 | | | | 9,700,000 | |
York County SC PCR Natural Rural Utilities Cooperative Finance Corporation Guaranteed NC Electric Membership Corporation Project Series 200B-2 (Utilities Revenue) | | | 0.45 | | | | 09/04/2012 | | | | 13,300,000 | | | | 13,300,000 | |
York County SC PCR Natural Rural Utilities Cooperative Finance Corporation Guaranteed NC Electric Membership Corporation Project Series 200B-3 (Utilities Revenue) | | | 0.45 | | | | 09/04/2012 | | | | 2,900,000 | | | | 2,900,000 | |
| | | | |
| | | | | | | | | | | | | | | 25,900,000 | |
| | | | | | | | | | | | | | | | |
| | | | |
| Variable Rate Demand Notes §: 0.59% | | | | | | | | | | | | | | | | |
Piedmont Municipal Power Agency Series 2011-C (Utilities Revenue, TD Bank NA LOC) | | | 0.13 | | | | 01/01/2034 | | | | 5,000,000 | | | | 5,000,000 | |
South Carolina EDA AnMed Health Project Series C (Health Revenue, Branch Banking & Trust LOC) | | | 0.15 | | | | 02/01/2033 | | | | 9,965,000 | | | | 9,965,000 | |
South Carolina Housing Finance & Development Authority MFHR Brookside Crossing Apartments Series 2008 (Housing Revenue, FHLMC Insured, FHLMC LIQ) | | | 0.16 | | | | 06/01/2046 | | | | 4,680,000 | | | | 4,680,000 | |
South Carolina Jobs EDA Institutional Business & Home Safety Project Series 2009 (IDR, Branch Banking & Trust LOC) | | | 0.17 | | | | 11/01/2034 | | | | 3,000,000 | | | | 3,000,000 | |
| | | | |
| | | | | | | | | | | | | | | 22,645,000 | |
| | | | | | | | | | | | | | | | |
| | | | |
South Dakota : 0.29% | | | | | | | | | | | | | | | | |
| | | | |
| Variable Rate Demand Notes §: 0.29% | | | | | | | | | | | | | | | | |
South Dakota Housing Development Authority LaCrosse Investment Project Series 2001 (Housing Revenue, FNMA Insured, FNMA LIQ) | | | 0.16 | | | | 02/15/2031 | | | | 6,495,000 | | | | 6,495,000 | |
South Dakota State HEFA Sioux Valley Hospital & Health System
Series 2004-B (Health Revenue, U.S. Bank NA LOC) | | | 0.16 | | | | 11/01/2034 | | | | 4,630,000 | | | | 4,630,000 | |
| | | | |
| | | | | | | | | | | | | | | 11,125,000 | |
| | | | | | | | | | | | | | | | |
| | | | |
Tennessee : 1.65% | | | | | | | | | | | | | | | | |
| | | | |
| Other Municipal Debt : 0.06% | | | | | | | | | | | | | | | | |
Sevier County TN Public Building Authority Public Projects Construction Interim Loan Project Series B-3 (Miscellaneous Revenue) | | | 1.25 | | | | 04/01/2013 | | | | 2,100,000 | | | | 2,111,139 | |
| | | | | | | | | | | | | | | | |
| | | | |
| Variable Rate Demand Notes §: 1.59% | | | | | | | | | | | | | | | | |
Blount County TN Industrial Development Board Maryville Civic Arts Center Project Series 2009-A (Miscellaneous Revenue, Branch Banking & Trust LOC) | | | 0.17 | | | | 06/01/2036 | | | | 1,000,000 | | | | 1,000,000 | |
Blount County TN Public Building Authority GO Series E-5-B (Miscellaneous Revenue, Branch Banking & Trust LOC, Municipal Government
Guaranty Insured) | | | 0.17 | | | | 06/01/2042 | | | | 4,705,000 | | | | 4,705,000 | |
Blount County TN Public Building Authority Local Government Public Import Series E-1-A (Miscellaneous Revenue, Branch Banking & Trust LOC, County Guaranty Insured) | | | 0.17 | | | | 06/01/2037 | | | | 6,450,000 | | | | 6,450,000 | |
| | | | |
| 18 | | Wells Fargo Advantage National Tax-Free Money Market Fund | | Portfolio of Investments—July 31, 2012 (Unaudited) |
| | | | | | | | | | | | | | | | |
| Security Name | | Interest Rate | | | Maturity Date | | | Principal | | | Value | |
| | | | | | | | | | | | | | | | |
| | | | |
| Variable Rate Demand Notes § (continued) | | | | | | | | | | | | | | | | |
Chattanooga TN Electric Power Board Series 2008-A JPMorgan Chase PUTTER Series 4162 (Utilities Revenue, JPMorgan Chase Bank LIQ) 144A | | | 0.20 | % | | | 09/01/2016 | | | $ | 14,105,000 | | | $ | 14,105,000 | |
Clarksville TN Public Building Authority Metropolitan Government Nashville & Davidson County HEFA Lipscomb University Project Series 2009 (Education Revenue, FHLB LOC) | | | 0.16 | | | | 11/01/2028 | | | | 12,400,000 | | | | 12,400,000 | |
Johnson City TN Health & Educational Facilities Board Health Alliance Series 2011A (Health Revenue, U.S. Bank NA LOC) | | | 0.17 | | | | 07/01/2033 | | | | 22,375,000 | | | | 22,375,000 | |
| | | | |
| | | | | | | | | | | | | | | 61,035,000 | |
| | | | | | | | | | | | | | | | |
| | | | |
Texas : 8.30% | | | | | | | | | | | | | | | | |
| | | | |
| Variable Rate Demand Notes §: 8.30% | | | | | | | | | | | | | | | | |
Bexar County TX Housing Finance Corporation Palisades Park Apartments Project Series 2009 (Housing Revenue, FHLMC Insured, FHLMC LIQ) | | | 0.17 | | | | 09/01/2039 | | | | 4,000,000 | | | | 4,000,000 | |
Bexar County TX Housing Finance Corporation Vista Meadows Fredencksburg Place Apartments Project Series 2006 (Housing Revenue, FHLMC Insured, FHLMC LIQ) | | | 0.17 | | | | 09/01/2036 | | | | 12,235,000 | | | | 12,235,000 | |
Clipper Tax-Exempt Certified Trust Series 2007-44 (Miscellaneous Revenue, State Street Bank & Trust Company LIQ) | | | 0.20 | | | | 09/01/2014 | | | | 28,780,000 | | | | 28,780,000 | |
Collin County TX Housing Finance Corporation Huntington Apartments Project Series 1996 (Housing Revenue, Northern Trust Company LOC) | | | 0.15 | | | | 12/01/2015 | | | | 12,305,000 | | | | 12,305,000 | |
Dallas TX Waterworks & Sewer System Clipper Tax Exempt Certificate Trust 2009-52 (Miscellaneous Revenue, State Street Bank & Trust Company LIQ) | | | 0.20 | | | | 10/01/2018 | | | | 15,000,000 | | | | 15,000,000 | |
First Rio Grande Regional Water Authority Economic Development Corporation Rio Grande Valley Sugar (IDR, CoBank ACB LOC) | | | 0.16 | | | | 03/01/2032 | | | | 8,650,000 | | | | 8,650,000 | |
Galveston County TX Housing Finance Corporation Village By The Sea Apartments Project Series 2004 (Housing Revenue, FNMA Insured, FNMA LIQ) | | | 0.16 | | | | 02/15/2032 | | | | 5,090,000 | | | | 5,090,000 | |
Harris County TX Health Facilities Development Authority Hermann Healthcare Series A-1 Royal Bank of Canada Municipal Products Incorporated Trust Certificates Series E-27 (Health Revenue, Royal Bank of Canada LOC, Royal Bank of Canada LIQ) 144A | | | 0.15 | | | | 06/01/2027 | | | | 9,000,000 | | | | 9,000,000 | |
Harris County TX Cultural Education Facilities Finance Corporation Hermann Health Series D-3 (Health Revenue, Northern Trust Company LOC) | | | 0.15 | | | | 06/01/2029 | | | | 2,000,000 | | | | 2,000,000 | |
Harris County TX Industrial Development Corporation Deer Park Refining Limited Partnership Series 2004-A (Resource Recovery Revenue) | | | 0.17 | | | | 03/01/2023 | | | | 90,000 | | | | 90,000 | |
Panhandle Texas Regional Housing Finance Corporation Jason Avenue Residential Apartments Series 2008 (Housing Revenue, FHLMC LOC) | | | 0.15 | | | | 08/01/2041 | | | | 7,495,000 | | | | 7,495,000 | |
Port Arthur TX Navigation District Environmental Facilities Motiva Enterprises Project Subseries 2009A (Resource Recovery Revenue) | | | 0.16 | | | | 12/01/2039 | | | | 18,850,000 | | | | 18,850,000 | |
Port Arthur TX Navigation District Environmental Facilities Motiva Enterprises Project Subseries 2009C (Resource Recovery Revenue) | | | 0.15 | | | | 12/01/2039 | | | | 40,500,000 | | | | 40,500,000 | |
Port Arthur TX Navigation District Industrial Development Corporation Total Petrochemicals USA Incorporated Project Series 2011 (IDR) | | | 0.22 | | | | 06/01/2041 | | | | 45,000,000 | | | | 45,000,000 | |
Port Arthur TX Navigation District Industrial Development Corporation Total Petrochemicals USA Incorporated Project Series 2012 (IDR) | | | 0.22 | | | | 03/01/2042 | | | | 37,500,000 | | | | 37,500,000 | |
Port Arthur TX Navigation District of Jefferson County Total Petrochemicals USA Incorporated Project (Resource Recovery Revenue) | | | 0.22 | | | | 03/01/2039 | | | | 15,000,000 | | | | 15,000,000 | |
Port Arthur TX Navigation District of Jefferson County Total Petrochemicals USA Incorporated Project Series 2003-C (IDR) | | | 0.23 | | | | 04/01/2027 | | | | 2,000,000 | | | | 2,000,000 | |
Port Corpus Christi TX Solid Waste Disposal Flint Hills Resources Project Series 2002-B (Resource Recovery Revenue) | | | 0.18 | | | | 07/01/2029 | | | | 11,700,000 | | | | 11,700,000 | |
Texas Department Housing & Community Affairs Costa Ibiza Apartments Series 2008 (Housing Revenue, FHLMC Insured, FHLMC LOC) | | | 0.15 | | | | 08/01/2041 | | | | 13,450,000 | | | | 13,450,000 | |
| | | | | | |
| Portfolio of Investments—July 31, 2012 (Unaudited) | | Wells Fargo Advantage National Tax-Free Money Market Fund | | | 19 | |
| | | | | | | | | | | | | | | | |
| Security Name | | Interest Rate | | | Maturity Date | | | Principal | | | Value | |
| | | | | | | | | | | | | | | | |
| | | | |
| Variable Rate Demand Notes § (continued) | | | | | | | | | | | | | | | | |
Texas Municipal Gas Acquisition & Supply Corporation Series 2848 (Miscellaneous Revenue, Morgan Stanley Bank LIQ) | | | 0.45 | % | | | 12/15/2026 | | | $ | 16,224,981 | | | $ | 16,224,981 | |
Texas State GO Series 2012-A (Miscellaneous Revenue, State Street Bank & Trust Company LIQ) | | | 0.15 | | | | 12/01/2042 | | | | 4,335,000 | | | | 4,335,000 | |
Texas State Mobility Fund Series 2005-B (GO, Royal Bank of Canada SPA) | | | 0.18 | | | | 04/01/2030 | | | | 7,165,000 | | | | 7,165,000 | |
Tyler TX Health Facilities Development Corporation Mother Frances Hospital Regional Health Care Center Project Series 1997 B (Health Revenue, Bank of America NA LOC) | | | 0.25 | | | | 07/01/2020 | | | | 1,500,000 | | | | 1,500,000 | |
| | | | |
| | | | | | | | | | | | | | | 317,869,981 | |
| | | | | | | | | | | | | | | | |
| | | | |
Utah : 0.25% | | | | | | | | | | | | | | | | |
| | | | |
| Variable Rate Demand Note §: 0.25% | | | | | | | | | | | | | | | | |
West Jordan UT Multifamily Housing Broadmoor Village Apartments
Series 2004 (Housing Revenue, FHLMC Insured, FHLMC LIQ) | | | 0.19 | | | | 12/01/2034 | | | | 9,675,000 | | | | 9,675,000 | |
| | | | | | | | | | | | | | | | |
| | | | |
Vermont : 1.01% | | | | | | | | | | | | | | | | |
| | | | |
| Variable Rate Demand Notes §: 1.01% | | | | | | | | | | | | | | | | |
Vermont Educational & Health Buildings Financing Agency Brattleboro Memorial Hospital Project Series 2008-A (Health Revenue, TD Bank NA LOC) | | | 0.18 | | | | 10/01/2028 | | | | 2,065,000 | | | | 2,065,000 | |
Vermont Educational & Health Buildings Financing Agency Fletcher Allen Health Care Project Series 2008-A (Health Revenue, TD Bank NA LOC) | | | 0.15 | | | | 12/01/2030 | | | | 21,690,000 | | | | 21,690,000 | |
Vermont Educational & Health Buildings Financing Agency Landmark College Project Series 2008-A (Education Revenue, TD Bank NA LOC) | | | 0.18 | | | | 07/01/2033 | | | | 3,140,000 | | | | 3,140,000 | |
Vermont Educational & Health Buildings Financing Agency North County Hospital Project Series 2007-A (Health Revenue, TD Bank NA LOC) | | | 0.18 | | | | 10/01/2034 | | | | 10,025,000 | | | | 10,025,000 | |
Vermont Educational & Health Buildings Financing Agency Northeastern Vermont Regional Hospital Project Series 2004-A (Health Revenue, TD Bank NA LOC) | | | 0.18 | | | | 10/01/2029 | | | | 1,975,000 | | | | 1,975,000 | |
| | | | |
| | | | | | | | | | | | | | | 38,895,000 | |
| | | | | | | | | | | | | | | | |
| | | | |
Virginia : 0.72% | | | | | | | | | | | | | | | | |
| | | | |
| Variable Rate Demand Notes §: 0.72% | | | | | | | | | | | | | | | | |
Arlington County VA IDA Refunding MFHR Woodbury Park Apartments Project Series 2005-A (Housing Revenue, FHLMC Insured, FHLMC LIQ) | | | 0.16 | | | | 03/01/2035 | | | | 800,000 | | | | 800,000 | |
Fairfax County VA IDA Inova Health System Project Series 2010 A-17 (Miscellaneous Revenue) (i) | | | 0.27 | | | | 05/15/2039 | | | | 5,000,000 | | | | 5,000,000 | |
Fauquier County VA IDA Highland School Project Series 2008 (Education Revenue, Branch Banking & Trust LOC) | | | 0.17 | | | | 12/01/2033 | | | | 3,950,000 | | | | 3,950,000 | |
James City County VA IDA Chambrel Williamsburg Project Series 2002 (Housing Revenue, FNMA Insured, FNMA LIQ) | | | 0.15 | | | | 11/15/2032 | | | | 12,715,000 | | | | 12,715,000 | |
Norfolk VA EDA Sentara Healthcare Series 2010-B (Health Revenue) (i) | | | 0.27 | | | | 11/01/2034 | | | | 5,000,000 | | | | 5,000,000 | |
Stafford County VA Eclipse Funding Trust Project (Miscellaneous Revenue, U.S. Bank NA LOC) | | | 0.13 | | | | 08/01/2037 | | | | 15,000 | | | | 15,000 | |
Virginia Commonwealth University Health System Authority Series 2008-A (Health Revenue, Branch Banking & Trust LOC) | | | 0.16 | | | | 07/01/2037 | | | | 110,000 | | | | 110,000 | |
| | | | |
| | | | | | | | | | | | | | | 27,590,000 | |
| | | | | | | | | | | | | | | | |
| | | | |
Washington : 0.48% | | | | | | | | | | | | | | | | |
| | | | |
| Variable Rate Demand Notes §: 0.48% | | | | | | | | | | | | | | | | |
King County WA Housing Authority Summerfield Apartments Project for YWCA of Seattle-King County Series 2005 (Housing Revenue, U.S. Bank NA LOC) | | | 0.18 | | | | 09/01/2035 | | | | 1,630,000 | | | | 1,630,000 | |
| | | | |
| 20 | | Wells Fargo Advantage National Tax-Free Money Market Fund | | Portfolio of Investments—July 31, 2012 (Unaudited) |
| | | | | | | | | | | | | | | | |
| Security Name | | Interest Rate | | | Maturity Date | | | Principal | | | Value | |
| | | | | | | | | | | | | | | | |
| | | | |
| Variable Rate Demand Notes § (continued) | | | | | | | | | | | | | | | | |
King County WA Public Hospital District Limited Tax ROC RR-II-R-11412 (GO, Assured Guaranty Insured, Citibank NA LIQ) | | | 0.30 | % | | | 12/01/2015 | | | $ | 6,930,000 | | | $ | 6,930,000 | |
Washington State Housing Finance Commission Lake City Senior Apartments Project Series 2009 (Housing Revenue, FHLMC Insured, FHLMC LIQ) | | | 0.16 | | | | 07/01/2044 | | | | 4,250,000 | | | | 4,250,000 | |
Washington State Housing Finance Commission Nonprofit Revenue Tacoma Art Museum Project Series 2002 (Miscellaneous Revenue, Northern Trust Company LOC) | | | 0.16 | | | | 06/01/2032 | | | | 5,775,000 | | | | 5,775,000 | |
| | | | |
| | | | | | | | | | | | | | | 18,585,000 | |
| | | | | | | | | | | | | | | | |
| | | | |
West Virginia : 0.18% | | | | | | | | | | | | | | | | |
| | | | |
| Variable Rate Demand Note : 0.18% | | | | | | | | | | | | | | | | |
Kanawha County WV Kroger Company Series 2004 B (IDR, U.S. Bank NA LOC) | | | 0.22 | | | | 04/01/2013 | | | | 6,850,000 | | | | 6,850,000 | |
| | | | | | | | | | | | | | | | |
| | | | |
Wisconsin : 5.27% | | | | | | | | | | | | | | | | |
| | | | |
| Variable Rate Demand Notes §: 5.27% | | | | | | | | | | | | | | | | |
Appleton WI Recovery Zone Facilities Foremost Farms Project Series 2010 (IDR, CoBank ACB LOC) | | | 0.15 | | | | 05/01/2037 | | | | 30,000,000 | | | | 30,000,000 | |
Hull WI Welcome Dairy Incorporated Project Series 2010-B (IDR, Associated Bank NA LOC) | | | 0.16 | | | | 01/01/2027 | | | | 3,435,000 | | | | 3,435,000 | |
Milwaukee WI RDA University of Wisconsin Kenilworth Project Series 2005 (Education Revenue, U.S. Bank NA LOC) | | | 0.15 | | | | 09/01/2040 | | | | 7,550,000 | | | | 7,550,000 | |
Oneida Tribe of Indians of Wisconsin Health Facilities Series 2001 (Health Revenue, Bank of America NA LOC) | | | 0.31 | | | | 07/01/2016 | | | | 6,380,000 | | | | 6,380,000 | |
Public Finance Authority Wisconsin Midwestern Disaster Area Program Series 2011 (IDR, Farm Credit Services America LOC) | | | 0.16 | | | | 09/01/2036 | | | | 5,000,000 | | | | 5,000,000 | |
Wisconsin HEFA Aurora Health Care Incorporated Series 2012-C (Health Revenue, Bank of Montreal LOC) | | | 0.15 | | | | 07/15/2028 | | | | 36,500,000 | | | | 36,500,000 | |
Wisconsin HEFA Ministry Health Care Incorporated Series 2009-B (Health Revenue) | | | 0.16 | | | | 08/01/2022 | | | | 12,125,000 | | | | 12,125,000 | |
Wisconsin Housing & EDA Series 2011-A (Housing Revenue, PNC Bank NA SPA) | | | 0.16 | | | | 09/01/2043 | | | | 9,100,000 | | | | 9,100,000 | |
Wisconsin State Clipper Tax Exempt Certificate Trust Series 1 2009-36 (Miscellaneous Revenue, State Street Bank & Trust Company LIQ) | | | 0.20 | | | | 05/01/2020 | | | | 26,755,000 | | | | 26,755,000 | |
Wisconsin State Clipper Tax-Exempt Certificate Trust Series 1 2009-6 (Miscellaneous Revenue, State Street Bank & Trust Company LIQ) | | | 0.20 | | | | 05/01/2013 | | | | 25,000,000 | | | | 25,000,000 | |
Wisconsin State HEFA Meriter Retirement Services Series B (Health Revenue, U.S. Bank NA LOC) | | | 0.17 | | | | 03/01/2038 | | | | 6,035,000 | | | | 6,035,000 | |
Wisconsin State HEFA Sisters Services Incorporated Obligation Group Series 2007B-2 (Health Revenue, JPMorgan Chase Bank SPA) | | | 0.40 | | | | 03/15/2036 | | | | 21,000,000 | | | | 21,000,000 | |
Wisconsin State Housing & EDA Series 2012-A (Housing Revenue, GO of Authority Insured, FHLB LIQ) | | | 0.16 | | | | 05/01/2055 | | | | 5,000,000 | | | | 5,000,000 | |
Wisconsin State Housing & EDA Series 2012-B (Housing Revenue, GO of Authority Insured, FHLB LIQ) | | | 0.16 | | | | 05/01/2055 | | | | 8,000,000 | | | | 8,000,000 | |
| | | | |
| | | | | | | | | | | | | | | 201,880,000 | |
| | | | | | | | | | | | | | | | |
| | | | |
Wyoming : 0.10% | | | | | | | | | | | | | | | | |
| | | | |
| Variable Rate Demand Note §: 0.10% | | | | | | | | | | | | | | | | |
Wyoming Student Loan Corporation Series A-3 (Education Revenue, Royal Bank of Canada LOC) | | | 0.15 | | | | 12/01/2043 | | | | 3,850,000 | | | | 3,850,000 | |
| | | | | | | | | | | | | | | | |
| | | | |
Total Municipal Obligations (Cost $3,791,139,947) | | | | | | | | | | | | | | | 3,791,139,947 | |
| | | | | | | | | | | | | | | | |
| | | | | | |
| Portfolio of Investments—July 31, 2012 (Unaudited) | | Wells Fargo Advantage National Tax-Free Money Market Fund | | | 21 | |
| | | | | | | | |
| | | | | | Value | |
| | | | | | | | |
| Total Investments in Securities | | | | | | | | |
| (Cost $3,791,139,947) * | | | 98.97 | % | | $ | 3,791,139,947 | |
Other Assets and Liabilities, Net | | | 1.03 | | | | 39,342,556 | |
| | | | | | | | |
| Total Net Assets | | | 100.00 | % | | $ | 3,830,482,503 | |
| | | | | | | | |
| § | These securities are subject to a demand feature which reduces the effective maturity. |
| 144A | Security that may be resold to “qualified institutional buyers” under Rule 144A or security offered pursuant to Section 4(2) of the Securities Act of 1933, as amended. |
| * | Cost for federal income tax purposes is substantially the same as for financial reporting purposes. |
| ITEM 7. | DISCLOSURE OF PROXY VOTING POLICIES AND PROCEDURES FOR CLOSED-END MANAGEMENT INVESTMENT COMPANIES |
Not applicable.
| ITEM 8. | PORTFOLIO MANAGERS OF CLOSED-END MANAGEMENT INVESTMENT COMPANIES |
Not applicable.
| ITEM 9. | PURCHASES OF EQUITY SECURITIES BY CLOSED-END MANAGEMENT INVESTMENT COMPANY AND AFFILIATED PURCHASES |
Not applicable.
| ITEM 10. | SUBMISSION OF MATTERS TO A VOTE OF SECURITY HOLDERS |
The Governance Committee (the “Committee”) of the Board of Trustees of the registrant (the “Trust”) has adopted procedures by which a shareholder of any series of the Trust may submit properly a nominee recommendation for the Committee’s consideration.
The shareholder must submit any such recommendation (a “Shareholder Recommendation”) in writing to the Trust, to the attention of the Trust’s Secretary, at the address of the principal executive offices of the Trust.
The Shareholder Recommendation must be delivered to, or mailed and received at, the principal executive offices of the Trust not less than forty-five (45) calendar days nor more than seventy-five (75) calendar days prior to the date of the Committee meeting at which the nominee would be considered.
The Shareholder Recommendation must include: (i) a statement in writing setting forth (A) the name, age, date of birth, business address, residence address and nationality of the person recommended by the shareholder (the “candidate”); (B) the series (and, if applicable, class) and number of all shares of the Trust owned of record or beneficially by the candidate, as reported to such shareholder by the candidate; (C) any other information regarding the candidate called for with respect to director nominees by paragraphs (a), (d), (e) and (f) of Item 401 of Regulation S-K or paragraph (b) of Item 22 of Rule 14a-101 (Schedule 14A) under the Securities Exchange Act of 1934, as amended (the “Exchange Act”), adopted by the Securities and Exchange Commission (or the corresponding provisions of any regulation or rule subsequently adopted by the Securities and Exchange Commission or any successor agency applicable to the Trust); (D) any other information regarding the candidate that would be required to be disclosed if the candidate were a nominee in a proxy statement or other filing required to be made in connection with solicitation of proxies for election of directors pursuant to Section 14 of the Exchange Act and the rules and regulations promulgated thereunder; and (E) whether the recommending shareholder believes that the candidate is or will be an “interested person” of the Trust (as defined in the Investment Company Act of 1940, as amended) and, if not an “interested person,” information regarding the candidate that will be sufficient for the Trust to make such determination; (ii) the written and signed consent of the candidate to be named as a nominee and to serve as a Trustee if elected; (iii) the recommending shareholder’s name as it appears on the Trust’s books; (iv) the series (and, if applicable, class) and number of all shares of the Trust owned beneficially and of record by the recommending shareholder; and (v) a description of all arrangements or understandings between the recommending shareholder and the candidate and any other person or persons (including their names) pursuant to which the recommendation is being made by the recommending shareholder. In addition, the Committee may require the candidate to interview in person and furnish such other information as it may reasonably require or deem necessary to determine the eligibility of such candidate to serve as a Trustee of the Trust.
| ITEM 11. | CONTROLS AND PROCEDURES |
(a) The President and Treasurer have concluded that the Wells Fargo Funds Trust (the “Trust”) disclosure controls and procedures (as defined in Rule 30a-3(c) under the Investment Company Act of 1940) provide reasonable assurances that material information relating to the Trust is made known to them by the appropriate persons, based on their evaluation of these controls and procedures as of a date within 90 days of the filing of this report.
(b) There were no significant changes in the Trust’s internal controls over financial reporting (as defined in Rule 30a-3(d) under the Investment Company Act of 1940) that occurred during the second quarter of the period covered by this report that materially affected, or is reasonably likely to materially affect, the registrant’s internal control over financial reporting.
(a)(1) Not required in this filing.
(a)(2) Certification pursuant to Rule 30a-2(a) under the Investment Company Act of 1940 (17 CFR 270.30a-2(a)) is filed and attached hereto as Exhibit 99.CERT.
(a)(3) Not applicable.
(b) Certification pursuant to Rule 30a-2(b) under the Investment Company Act of 1940 (17 CFR 270.30a-2(b)) is filed and attached hereto as Exhibit 99.906CERT.
SIGNATURES
Pursuant to the requirements of the Securities Exchange Act of 1934 and the Investment Company Act of 1940, the registrant has duly caused this report to be signed on its behalf by the undersigned, thereunto duly authorized.
| | |
| Wells Fargo Funds Trust |
| |
| By: | | /s/ Karla M. Rabusch |
| | Karla M. Rabusch |
| | President |
| |
| Date: | | September 24, 2012 |
Pursuant to the requirements of the Securities Exchange Act of 1934 and the Investment Company Act of 1940, this report has been signed below by the following persons on behalf of the registrant and in the capacities and on the date indicated.
| | |
| By: | | /s/ Karla M. Rabusch |
| | Karla M. Rabusch |
| | President |
| |
| Date: | | September 24, 2012 |
| | |
| By: | | /s/ Nancy Wiser |
| | Nancy Wiser |
| | Treasurer |
| |
| Date: | | September 24, 2012 |