
UNITED STATES
SECURITIES AND EXCHANGE COMMISSION
Washington, D.C. 20549
FORM N-CSRS
CERTIFIED SHAREHOLDER REPORT OF REGISTERED
MANAGEMENT INVESTMENT COMPANIES
Investment Company Act file number: 811-09253
Wells Fargo Funds Trust
(Exact name of registrant as specified in charter)
525 Market St., San Francisco, CA 94105
(Address of principal executive offices) (Zip code)
C. David Messman
Wells Fargo Funds Management, LLC
525 Market St., San Francisco, CA 94105
(Name and address of agent for service)
Registrant’s telephone number, including area code: 800-222-8222
Date of fiscal year end: May 31, 2012
Date of reporting period: November 30, 2012
| ITEM 1. | REPORT TO SHAREHOLDERS |

Wells Fargo Advantage Allocation Funds

Semi-Annual Report
November 30, 2012
| n | | Wells Fargo Advantage Conservative Allocation Fund |
| n | | Wells Fargo Advantage Growth Balanced Fund |
| n | | Wells Fargo Advantage Moderate Balanced Fund |

Reduce clutter. Save trees.
Sign up for electronic delivery of prospectuses and shareholder reports at wellsfargo.com/advantagedelivery
Contents
The views expressed and any forward-looking statements are as of November 30, 2012, unless otherwise noted, and are those of the Fund managers and/or Wells Fargo Funds Management, LLC. Discussions of individual securities, or the markets generally, or any Wells Fargo Advantage Fund are not intended as individual recommendations. Future events or results may vary significantly from those expressed in any forward-looking statements; the views expressed are subject to change at any time in response to changing circumstances in the market. Wells Fargo Funds Management, LLC, disclaims any obligation to publicly update or revise any views expressed or forward-looking statements.
NOT FDIC INSURED ¡ NO BANK GUARANTEE ¡ MAY LOSE VALUE

Wells Fargo investment history
| | |
| 1932 | | Keystone creates one of the first mutual fund families. |
| 1971 | | Wells Fargo & Company introduces one of the first institutional index funds. |
| 1978 | | Wells Fargo applies Markowitz and Sharpe’s research on Modern Portfolio Theory to introduce one of the industry’s first tactical asset allocation models in institutional separately managed accounts. |
| 1984 | | Wells Fargo Stagecoach Funds launches its first asset allocation fund. |
| 1989 | | The Tactical Asset Allocation (TAA) Model is first applied to Wells Fargo’s asset allocation mutual funds. |
| 1994 | | Wells Fargo introduces the LifePath Funds, one of the first suites of target date funds (now the Wells Fargo Advantage Dow Jones Target Date FundsSM). |
| 1996 | | Evergreen Investments and Keystone Funds merge. |
| 1997 | | Wells Fargo launches the Wells Fargo Advantage WealthBuilder PortfoliosSM, a fund-of-funds suite of products that includes the use of quantitative models to shift assets among investment styles. |
| 1999 | | Norwest Advantage Funds and Stagecoach Funds are reorganized into Wells Fargo Funds after the merger of Norwest and Wells Fargo. |
| 2002 | | Evergreen Retail and Evergreen Institutional companies form the umbrella asset management company, Evergreen Investments. |
| 2005 | | The integration of Strong Funds with Wells Fargo Funds creates Wells Fargo Advantage Funds, resulting in one of the top 20 mutual fund companies in the United States. |
| 2006 | | Wells Fargo Advantage Funds relaunches the target date product line as Wells Fargo Advantage Dow Jones Target Date Funds. |
| 2010 | | The mergers and reorganizations of Evergreen and Wells Fargo Advantage mutual funds are completed, unifying the families under the brand of Wells Fargo Advantage Funds. |
Wells Fargo Advantage Funds®
Wells Fargo Advantage Funds skillfully guides institutions, financial advisors, and individuals through the investment terrain to help them reach their financial objectives. Everything we do on behalf of investors is backed by our unique combination of qualifications.
Strength
Our organization is built on the standards of integrity and service established by our parent company—Wells Fargo & Company—more than 150 years ago. And, because we’re part of a highly diversified financial enterprise, we offer the depth of resources to help investors succeed.
Expertise
Our multi-boutique model offers investors access to the independent thinking of premier investment managers that have been chosen for their time-tested strategies. While each team specializes in a specific investment strategy, collectively they provide investors a wide choice of distinct investment styles. Our dedication to investment excellence doesn’t end with our expertise in manager selection—risk management, analysis, and rigorous ongoing review seek to ensure each manager’s investment process remains consistent.
Partnership
Our collaborative approach is built around understanding the needs and goals of our clients. By adhering to core principles of sound judgment and steady guidance, we support you through every stage of the investment decision process.
Carefully consider the investment objectives, risks, charges, and expenses before investing. For a current prospectus and, if available, a summary prospectus, for Wells Fargo Advantage Funds, containing this and other information, visit wellsfargoadvantagefunds.com. Read it carefully before investing.
Wells Fargo Funds Management, LLC, a wholly owned subsidiary of Wells Fargo & Company, provides investment advisory and administrative services for Wells Fargo Advantage Funds. Other affiliates of Wells Fargo & Company provide subadvisory and other services for the Funds. The Funds are distributed by Wells Fargo Funds Distributor, LLC, Member FINRA/SIPC, an affiliate of Wells Fargo & Company.
“Dow Jones®” and “Dow Jones Target Date IndexesSM” are service marks of Dow Jones Trademark Holdings LLC (“Dow Jones”); have been licensed to CME Group Index Services LLC (“CME Indexes”); and have been sublicensed for use for certain purposes by Global Index Advisors, Inc., and Wells Fargo Funds Management, LLC. The Wells Fargo Advantage Dow Jones Target Date FundsSM, based on the Dow Jones Target Date Indexes, are not sponsored, endorsed, sold, or promoted by Dow Jones, CME Indexes, or their respective affiliates, and none of them makes any representation regarding the advisability of investing in such product(s).
NOT FDIC INSURED ¡ NO BANK GUARANTEE ¡ MAY LOSE VALUE
Not part of the semi-annual report.
Wells Fargo Advantage Funds offers more than 110 mutual funds across a wide range of asset classes, representing over $214 billion in assets under management, as of November 30, 2012.
| | | | |
| Equity funds | | | | |
Asia Pacific Fund | | Enterprise Fund† | | Opportunity Fund† |
C&B Large Cap Value Fund | | Equity Value Fund | | Precious Metals Fund |
C&B Mid Cap Value Fund | | Global Opportunities Fund | | Premier Large Company Growth Fund |
Capital Growth Fund | | Growth Fund | | Small Cap Opportunities Fund |
Common Stock Fund | | Index Fund | | Small Cap Value Fund |
Disciplined U.S. Core Fund | | International Equity Fund | | Small Company Growth Fund |
Discovery Fund† | �� | International Value Fund | | Small Company Value Fund |
Diversified Equity Fund | | Intrinsic Small Cap Value Fund | | Small/Mid Cap Core Fund |
Diversified International Fund | | Intrinsic Value Fund | | Small/Mid Cap Value Fund |
Diversified Small Cap Fund | | Intrinsic World Equity Fund | | Special Mid Cap Value Fund |
Emerging Growth Fund | | Large Cap Core Fund | | Special Small Cap Value Fund |
Emerging Markets Equity Fund | | Large Cap Growth Fund | | Specialized Technology Fund |
Emerging Markets Equity Income Fund | | Large Company Value Fund | | Traditional Small Cap Growth Fund |
Endeavor Select Fund† | | Omega Growth Fund | | Utility and Telecommunications Fund |
| Bond funds | | | | |
Adjustable Rate Government Fund | | Income Plus Fund | | Short Duration Government Bond Fund |
California Limited-Term Tax-Free Fund | | Inflation-Protected Bond Fund | | Short-Term Bond Fund |
California Tax-Free Fund | | Intermediate Tax/AMT-Free Fund | | Short-Term High Yield Bond Fund |
Colorado Tax-Free Fund | | International Bond Fund | | Short-Term Municipal Bond Fund |
Core Bond Fund | | Minnesota Tax-Free Fund | | Strategic Municipal Bond Fund |
Emerging Markets Local Bond Fund | | Municipal Bond Fund | | Ultra Short-Term Income Fund |
Government Securities Fund | | North Carolina Tax-Free Fund | | Ultra Short-Term Municipal Income Fund |
High Income Fund | | Pennsylvania Tax-Free Fund | | Wisconsin Tax-Free Fund |
High Yield Bond Fund | | | | |
| Asset allocation funds | | | | |
Absolute Return Fund | | WealthBuilder Equity Portfolio† | | Target 2020 Fund† |
Asset Allocation Fund | | WealthBuilder Growth Allocation Portfolio† | | Target 2025 Fund† |
Conservative Allocation Fund | | WealthBuilder Growth Balanced Portfolio† | | Target 2030 Fund† |
Diversified Capital Builder Fund | | WealthBuilder Moderate Balanced Portfolio† | | Target 2035 Fund† |
Diversified Income Builder Fund | | WealthBuilder Tactical Equity Portfolio† | | Target 2040 Fund† |
Growth Balanced Fund | | Target Today Fund† | | Target 2045 Fund† |
Index Asset Allocation Fund | | Target 2010 Fund† | | Target 2050 Fund† |
Moderate Balanced Fund | | Target 2015 Fund† | | Target 2055 Fund† |
WealthBuilder Conservative Allocation Portfolio† | | | | |
| Money market funds | | | | |
100% Treasury Money Market Fund | | Heritage Money Market Fund† | | National Tax-Free Money Market Fund |
California Municipal Money Market Fund | | Money Market Fund | | Prime Investment Money Market Fund |
Cash Investment Money Market Fund | | Municipal Cash Management Money Market Fund | | Treasury Plus Money Market Fund |
Government Money Market Fund | | Municipal Money Market Fund | | |
| Variable trust funds1 | | | | |
VT Discovery Fund† | | VT Intrinsic Value Fund | | VT Small Cap Growth Fund |
VT Index Asset Allocation Fund | | VT Omega Growth Fund | | VT Small Cap Value Fund |
VT International Equity Fund | | VT Opportunity Fund† | | VT Total Return Bond Fund |
An investment in a money market fund is not insured or guaranteed by the Federal Deposit Insurance Corporation or any other government agency. Although the Wells Fargo Advantage Money Market Funds seek to preserve the value of your investment at $1.00 per share, it is possible to lose money by investing in a money market fund.
| 1. | The variable trust funds are generally available only through insurance company variable contracts. |
| † | In this report, the Wells Fargo Advantage Discovery FundSM, Wells Fargo Advantage Endeavor Select FundSM, Wells Fargo Advantage Enterprise FundSM, Wells Fargo Advantage Opportunity FundSM, Wells Fargo Advantage WealthBuilder Conservative Allocation PortfolioSM, Wells Fargo Advantage WealthBuilder Equity PortfolioSM, Wells Fargo Advantage WealthBuilder Growth Allocation PortfolioSM, Wells Fargo Advantage WealthBuilder Growth Balanced PortfolioSM, Wells Fargo Advantage WealthBuilder Moderate Balanced PortfolioSM, Wells Fargo Advantage WealthBuilder Tactical Equity PortfolioSM, Wells Fargo Advantage Dow Jones Target Today FundSM, Wells Fargo Advantage Dow Jones Target 2010 FundSM, Wells Fargo Advantage Dow Jones Target 2015 FundSM, Wells Fargo Advantage Dow Jones Target 2020 FundSM, Wells Fargo Advantage Dow Jones Target 2025 FundSM, Wells Fargo Advantage Dow Jones Target 2030 FundSM, Wells Fargo Advantage Dow Jones Target 2035 FundSM, Wells Fargo Advantage Dow Jones Target 2040 FundSM, Wells Fargo Advantage Dow Jones Target 2045 FundSM, Wells Fargo Advantage Dow Jones Target 2050 FundSM, Wells Fargo Advantage Dow Jones Target 2055 FundSM, Wells Fargo Advantage Heritage Money Market FundSM, Wells Fargo Advantage VT Discovery FundSM, and Wells Fargo Advantage VT Opportunity FundSM are referred to as the Discovery Fund, Endeavor Select Fund, Enterprise Fund, Opportunity Fund, WealthBuilder Conservative Allocation Portfolio, WealthBuilder Equity Portfolio, WealthBuilder Growth Allocation Portfolio, WealthBuilder Growth Balanced Portfolio, WealthBuilder Moderate Balanced Portfolio, WealthBuilder Tactical Equity Portfolio, Target Today Fund, Target 2010 Fund, Target 2015 Fund, Target 2020 Fund, Target 2025 Fund, Target 2030 Fund, Target 2035 Fund, Target 2040 Fund, Target 2045 Fund, Target 2050 Fund, Target 2055 Fund, Heritage Money Market Fund, VT Discovery Fund, and VT Opportunity Fund, respectively. |
Not part of the semi-annual report.
| | | | |
| 2 | | Wells Fargo Advantage Allocation Funds | | Letter to shareholders (unaudited) |

Karla M. Rabusch
President
Wells Fargo Advantage Funds
Much of the period was marked by increased confidence that the U.S. economy was staging a fragile recovery, characterized by improvements in the U.S. housing sector and employment situation.
Dear Valued Shareholder:
We are pleased to offer you this semi-annual report for the Wells Fargo Advantage Allocation Funds for the six-month period that ended November 30, 2012. Much of the period was marked by increased confidence that the U.S. economy was staging a fragile recovery, characterized by improvements in the U.S. housing sector and employment situation. Some of this momentum was offset by continued concerns about the ongoing European sovereign debt crisis and the potential effects that U.S. fiscal and monetary policy decisions would have on the pace of economic growth. As measured by various Russell indexes, U.S. stocks across the market capitalization spectrum posted strong single-digit gains for the period. Major international indexes, by comparison, ended the period with double-digit returns in U.S. dollar terms. Across the fixed-income markets, total returns were positive over the six-month period, with investment-grade and high-yield bonds outperforming U.S. Treasury securities as investors continued to seek yield in the current low and steady interest-rate environment.
Macroeconomic optimism improved, but caution remains.
Early in the reporting period, economic numbers supported the case for a gradual recovery. Real gross domestic product (GDP) growth for the U.S. was positive in the first quarter of 2012, with GDP increasing by 2.0% on an annualized basis. However, the rate of GDP growth slowed in the second quarter, with data showing a 1.7% annualized growth rate. Just prior to the end of the six-month reporting period, the third-quarter preliminary GDP data was released, showing that U.S. economic growth accelerated to a 2.7% annualized rate, lending evidence that the U.S. economy may finally have reached a sustainable growth pattern. Further bolstering the U.S. economic picture, the U.S. unemployment rate continued to trend downward throughout the period, due in part to a decline in the number of people actively participating in the labor force. The U.S. housing sector also strengthened over the six-month period, with new housing activity and existing home sales trending higher.
While the U.S. economy, in particular, continued to show signs of life, there remained uncertainty during the period ahead of the U.S. presidential election and the possibility of a fiscal cliff, which included a series of automatic federal budget cuts and the expiration of several tax cut programs. The U.S. election was decided without incident and Washington was able to strike a compromise to avoid the full impact of the U.S. fiscal cliff, which provided some stability to the markets. Looking ahead, however, several other fiscal policy decisions will be made during the first few months of 2013 that potentially could impact market sentiment and the pace of U.S. economic growth.
Beyond the uncertainties facing the U.S. , the health of the eurozone continued to evolve during the period. By mid-June 2012, analysts were openly discussing the possibility of a crisis within the European banking system, a worry that remained near the forefront throughout most of the summer. In September and October 2012, however, the European Central Bank (ECB) and several key members of the eurozone, including France and Germany, announced their commitment to maintaining the integrity of the single currency. Despite the progress made across Europe in further addressing its ongoing debt issues, there remains a prolonged uncertainty about the eurozone and global economic growth.
Central banks continued to provide stimulus.
Throughout the reporting period, the Federal Reserve (Fed) kept its key interest rates effectively at zero in an effort to support the economy and financial system. In September 2012, the Fed responded to the stagnant U.S. labor market by announcing its third round of quantitative easing. However, the Fed surprised
| | | | | | |
| Letter to shareholders (unaudited) | | Wells Fargo Advantage Allocation Funds | | | 3 | |
some investors by including an open-ended program to purchase mortgage-backed securities until employment growth materially improves. Additionally, the Fed restated its intention to keep interest rates low through 2015. Through additional bond purchases and an exceptionally low federal funds rate, the Fed is aiming to support the U.S. economic expansion and provide a catalyst for stronger job growth.
At the beginning of the period, the ECB had a key rate of 1.00%, which it had lowered from its previous level of 1.25% in response to weakness in the southern European economies. In July 2012, the ECB again cut its main interest rate to a historic low of 0.75% in hopes of offering relief to the eurozone’s sluggish economy amid signs that inflationary pressures were fading.
We remain committed to our investment strategies, even as many variables are at work in the market.
The full effect of the credit crisis remains unknown. Elevated unemployment and debt defaults continue to pressure consumers and businesses alike. In our experience, strict adherence to time-tested investment strategies has its rewards. As a whole, Wells Fargo Advantage Funds represents investments across a range of asset classes and investment styles, giving you an opportunity to create a diversified investment portfolio. While diversification may not prevent losses in a downturn, we believe it helps manage risk.
Thank you for choosing to invest with Wells Fargo Advantage Funds. We appreciate your confidence in us and remain committed to helping you meet your financial needs. For current information about your fund investments, contact your investment professional, visit our website at wellsfargoadvantagefunds.com, or call us directly at 1-800-222-8222. We are available 24 hours a day, 7 days a week.
Sincerely,

Karla M. Rabusch
President
Wells Fargo Advantage Funds
The Fed restated its intention to keep interest rates low through 2015. Through additional bond purchases and an exceptionally low federal funds rate, the Fed is aiming to support the U.S. economic expansion and provide a catalyst for stronger job growth.
Notice to shareholders
At its November 6-7, 2012 meeting, the Board of Trustees unanimously approved the following modifications to certain Class A sales load waiver privileges, with each change becoming effective on July 1, 2013:
| | n | | Annuity payments received under an annuity option or from death proceeds will no longer qualify for net asset value (NAV) repurchase privileges. | |
| | n | | The ability to reinvest redemption proceeds at NAV will be reduced from 120 days to 90 days. | |
| | n | | NAV purchase privileges for certain types of “grandfathered” shareholders will be modified to remove the ability to purchase Class A shares at NAV, unless those shares are held directly with the Fund. | |
Please contact your investment professional or call us directly at 1-800-222-8222 if you have any questions on this Notice to Shareholders.
| | | | |
| 4 | | Wells Fargo Advantage Allocation Funds | | Performance highlights (unaudited) |
Wells Fargo Advantage Conservative Allocation Fund1
The Fund is closed to new investors2.
Investment objective
The Fund seeks total return, consisting primarily of current income.
Adviser
Wells Fargo Funds Management, LLC
Subadviser
Wells Capital Management Incorporated
Subadvisers for master portfolios
Artisan Partners Limited Partnership
Cooke & Bieler, L.P.
Galliard Capital Management, Inc.
Golden Capital Management, LLC
LSV Asset Management
Peregrine Capital Management, Inc.
Phocas Financial Corporation
SSgA Funds Management
Systematic Financial Management, L.P.
Wells Capital Management Incorporated
Portfolio managers
Doug Beath
Thomas C. Biwer, CFA
Petros Bocray, CFA, FRM
Christian L. Chan, CFA
Jeffrey P. Mellas, CAIA
Andrew Owen, CFA
Average annual total returns (%) as of November 30, 2012
| | | | | | | | | | | | | | | | | | | | | | |
| | | | | | | | Expense ratios3 (%) | |
| | | Inception date | | 1 year | | | 5 year | | | 10 year | | | Gross | | | Net4 | |
| Administrator Class (NVCBX) | | 11-11-94 | | | 8.40 | | | | 3.88 | | | | 4.80 | | | | 1.27 | | | | 0.85 | |
| Conservative Allocation Composite Index5 | | – | | | 6.17 | | | | 4.14 | | | | 5.15 | | | | – | | | | – | |
| Barclays U.S. Aggregate Bond Index6 | | – | | | 5.51 | | | | 6.04 | | | | 5.41 | | | | – | | | | – | |
| S&P 500 Index7 | | – | | | 16.13 | | | | 1.34 | | | | 6.36 | | | | – | | | | – | |
Figures quoted represent past performance, which is no guarantee of future results and do not reflect the deduction of taxes that a shareholder may pay on fund distributions or the redemption of fund shares. Investment return and principal value of an investment will fluctuate so that an investor’s shares, when redeemed, may be worth more or less than their original cost. Current performance may be lower or higher than the performance data quoted and assumes the reinvestment of dividends and capital gains. Current month-end performance is available on the Fund’s website, wellsfargoadvantagefunds.com.
Index returns do not include transaction costs associated with buying and selling securities, any mutual fund fees or expenses, or any taxes. It is not possible to invest directly in an index.
Administrator Class shares are sold without a front-end sales charge or contingent deferred sales charge.
Balanced funds may invest in stocks and bonds. Stock values fluctuate in response to the activities of individual companies and general market and economic conditions. Bond values fluctuate in response to the financial condition of individual issuers, general market and economic conditions, and changes in interest rates. In general, when interest rates rise, bond values fall and investors may lose principal value. The use of derivatives may reduce returns and/or increase volatility. Certain investment strategies tend to increase the total risk of an investment (relative to the broader market). The Fund is exposed to mortgage- and asset-backed securities risk. Consult the Fund’s prospectus for additional information on these and other risks.
Please see footnotes on page 5.
| | | | | | |
| Performance highlights (unaudited) | | Wells Fargo Advantage Allocation Funds | | | 5 | |
Wells Fargo Advantage Conservative Allocation Fund (continued)
| | | | |
| Ten largest long-term holdings8 (%) as of November 30, 2012 | |
FHLMC, 7.50% , 9-25-43 | | | 1.37 | |
FNMA, 6.25%, 5-25-42 | | | 1.05 | |
FNMA, 5.25%, 5-25-20 | | | 1.04 | |
FNMA, 3.50%, 9-1-32 | | | 0.97 | |
U.S. Treasury Bond, 0.75%, 2-15-42 | | | 0.96 | |
U.S. Treasury Bond, 4.25%, 11-15-40 | | | 0.86 | |
Structured Asset Securities Corporation Series 2007-RM1 Class A1, 0.48%, 5-25-47 | | | 0.82 | |
Household Home Equity Loan Trust 2005-2A1, 0.47%, 1-20-35 | | | 0.81 | |
FNMA, 5.50%, 2-1-36 | | | 0.74 | |
FHLMC, 7.00% , 3-25-43 | | | 0.73 | |
|
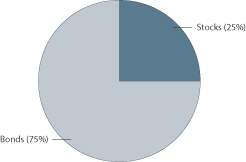
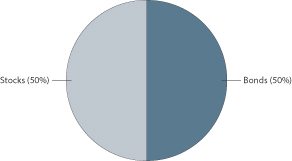
| Neutral target allocation9 as of November 30, 2012 |
|

|
|
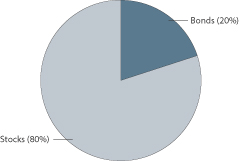
| Current target allocation9 as of November 30, 2012 |
|
|
| 1. | The Fund is a gateway blended fund that invests all of its assets in two or more master portfolios of the Wells Fargo Master Trust (the “Master Trust”) in varying proportions. References to the investment activities of the Fund are intended to refer to the investment activities of the master portfolios in which it invests. See Notes to Financial Statements for a discussion of the Master Trust. |
| 2. | Please see the Fund’s current Statement of Additional Information for further details. |
| 3. | Reflects the expense ratios as stated in the most recent prospectus. |
| 4. | The Adviser has committed through September 30, 2013, to waive fees and/or reimburse expenses to the extent necessary to cap the Fund’s Total Annual Fund Operating Expenses After Fee Waiver, excluding certain expenses, at the amounts shown. Brokerage commissions, stamp duty fees, interest, taxes, acquired fund fees and expenses, and extraordinary expenses are excluded from the cap. Fees from the underlying master portfolio(s) are included in the cap. Without this cap, the Fund’s returns would have been lower. |
| 5. | Source: Wells Fargo Funds Management, LLC. The Conservative Allocation Composite Index is weighted 55% in the Barclays U.S. Aggregate Bond Index (includes Treasury issues, agency issues, corporate bond issues, and mortgage-backed securities), 25% in the Barclays 9-12 Month U.S. Treasury Bond Index (an unmanaged index that includes aged U.S. Treasury bills, notes, and bonds with a remaining maturity from one up to but not including 12 months), 5% in the Russell 1000® Value Index (measures the performance of those Russell 1000 companies with lower price-to-book ratios and lower forecasted growth values), 5% in the S&P 500 Index, 5% in the Russell 1000® Growth Index (measures the performance of those Russell 1000 companies with higher price-to-book ratios and higher forecasted growth values), 3% in the MSCI EAFE Index (an unmanaged group of securities generally representative of the stock markets of Europe, Australia and the Far East), and 2% in the Russell 2000® Index (measures the performance of the 2,000 smallest companies in the Russell 3000® Index). You cannot invest directly in an index. |
| 6. | The Barclays U.S. Aggregate Bond Index is composed of the Barclays U.S. Government/Credit Index and the Barclays U.S. Mortgage-Backed Securities Index and includes U.S. Treasury issues, agency issues, corporate bond issues, and mortgage-backed securities. You cannot invest directly in an index. |
| 7. | The S&P 500 Index consists of 500 stocks chosen for market size, liquidity, and industry group representation. It is a market-value weighted index with each stock’s weight in the index proportionate to its market value. You cannot invest directly in an index. |
| 8. | The ten largest long-term holdings are calculated based on the value of the securities of the master portfolios allocable to the Fund divided by the total net assets of the Fund. Holdings are subject to change and may have changed since the date specified. |
| 9. | Portfolio allocations are subject to change. Cash and cash equivalents are not reflected in the calculations of portfolio allocations. Neutral target allocation is the target allocation of the Fund as stated in the Fund’s prospectus. Current target allocation is the current allocation of the Fund based on the Tactical Asset Allocation (TAA) Model as of the date specified and is subject to change. |
| | | | |
| 6 | | Wells Fargo Advantage Allocation Funds | | Performance highlights (unaudited) |
Wells Fargo Advantage Growth Balanced Fund1
Investment objective
The Fund seeks total return, consisting of capital appreciation and current income.
Adviser
Wells Fargo Funds Management, LLC
Subadviser
Wells Capital Management Incorporated
Subadvisers for master portfolios
Artisan Partners Limited Partnership
Cooke & Bieler, L.P.
Galliard Capital Management, Inc.
Golden Capital Management, LLC
LSV Asset Management
Peregrine Capital Management, Inc.
Phocas Financial Corporation
SSgA Funds Management
Systematic Financial Management, L.P.
Wells Capital Management Incorporated
Portfolio managers
Doug Beath
Thomas C. Biwer, CFA
Petros Bocray, CFA, FRM
Christian L. Chan, CFA
Jeffrey P. Mellas, CAIA
Andrew Owen, CFA
Average annual total returns (%) as of November 30, 2012
| | | | | | | | | | | | | | | | | | | | | | | | | | | | | | | | | | |
| | | | | Including sales charge | | | Excluding sales charge | | | Expense ratios2 (%) | |
| | | Inception date | | 1 year | | | 5 year | | | 10 year | | | 1 year | | | 5 year | | | 10 year | | | Gross | | | Net3 | |
| Class A (WFGBX) | | 10-14-98 | | | 6.10 | | | | (0.42 | ) | | | 4.52 | | | | 12.58 | | | | 0.76 | | | | 5.14 | | | | 1.36 | | | | 1.20 | |
| Class B (NVGRX)* | | 10-1-98 | | | 6.73 | | | | (0.40 | ) | | | 4.59 | | | | 11.73 | | | | 0.00 | | | | 4.59 | | | | 2.11 | | | | 1.95 | |
| Class C (WFGWX) | | 10-1-98 | | | 10.71 | | | | 0.00 | | | | 4.36 | | | | 11.71 | | | | 0.00 | | | | 4.36 | | | | 2.11 | | | | 1.95 | |
| Administrator Class (NVGBX) | | 11-11-94 | | | – | | | | – | | | | – | | | | 12.86 | | | | 1.01 | | | | 5.40 | | | | 1.20 | | | | 0.95 | |
| Growth Balanced Composite Index4 | | – | | | – | | | | – | | | | – | | | | 12.02 | | | | 3.05 | | | | 6.79 | | | | – | | | | – | |
| S&P 500 Index5 | | – | | | – | | | | – | | | | – | | | | 16.13 | | | | 1.34 | | | | 6.36 | | | | – | | | | – | |
| Barclays U.S. Aggregate Bond Index6 | | – | | | – | | | | – | | | | – | | | | 5.51 | | | | 6.04 | | | | 5.41 | | | | – | | | | – | |
| * | | Class B shares are closed to investment, except in connection with the reinvestment of any distributions and permitted exchanges. |
Figures quoted represent past performance, which is no guarantee of future results and do not reflect the deduction of taxes that a shareholder may pay on fund distributions or the redemption of fund shares. Investment return and principal value of an investment will fluctuate so that an investor’s shares, when redeemed, may be worth more or less than their original cost. Performance shown without sales charges would be lower if sales charges were reflected. Current performance may be lower or higher than the performance data quoted and assumes the reinvestment of dividends and capital gains. Current month-end performance is available on the Fund’s website, wellsfargoadvantagefunds.com.
Index returns do not include transaction costs associated with buying and selling securities, any mutual fund fees or expenses, or any taxes. It is not possible to invest directly in an index.
For Class A shares, the maximum front-end sales charge is 5.75%. For Class B shares, the maximum contingent deferred sales charge is 5.00%. For Class C shares, the maximum contingent deferred sales charge is 1.00%. Performance including sales charge assumes the sales charge for the corresponding time period. Administrator Class shares are sold without a front-end sales charge or contingent deferred sales charge.
Balanced funds may invest in stocks and bonds. Stock values fluctuate in response to the activities of individual companies and general market and economic conditions. Bond values fluctuate in response to the financial condition of individual issuers, general market and economic conditions, and changes in interest rates. In general, when interest rates rise, bond values fall and investors may lose principal value. The use of derivatives may reduce returns and/or increase volatility. Certain investment strategies tend to increase the total risk of an investment (relative to the broader market). The Fund is exposed to foreign investment risk, mortgage- and asset-backed securities risk, and smaller company securities risk. Consult the Fund’s prospectus for additional information on these and other risks.
Please see footnotes on page 7.
| | | | | | |
| Performance highlights (unaudited) | | Wells Fargo Advantage Allocation Funds | | | 7 | |
Wells Fargo Advantage Growth Balanced Fund (continued)
| | | | |
| Ten largest long-term holdings7 (%) as of November 30, 2012 | |
Apple Incorporated | | | 2.01 | |
Exxon Mobil Corporation | | | 1.02 | |
Google Incorporated Class A | | | 0.83 | |
eBay Incorporated | | | 0.67 | |
General Electric Company | | | 0.67 | |
Chevron Corporation | | | 0.66 | |
FNMA, 6.25%, 5-25-42 | | | 0.65 | |
JP Morgan Chase & Company | | | 0.65 | |
FNMA, 5.25%, 5-25-20 | | | 0.64 | |
FNMA, 3.50%, 9-1-32 | | | 0.60 | |
|
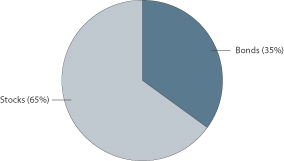
| Neutral target allocation8 as of November 30, 2012 |
|
|
|
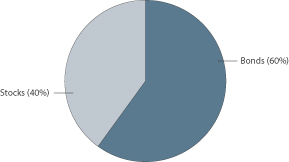
| Current target allocation8 as of November 30, 2012 |
|
|
| 1. | The Fund is a gateway blended fund that invests all of its assets in two or more master portfolios of the Wells Fargo Master Trust (the “Master Trust”) in varying proportions. References to the investment activities of the Fund are intended to refer to the investment activities of the master portfolios in which it invests. See Notes to Financial Statements for a discussion of the Master Trust. |
| 2. | Reflects the expense ratios as stated in the most recent prospectuses. |
| 3. | The Adviser has committed through September 30, 2013, to waive fees and/or reimburse expenses to the extent necessary to cap the Fund’s Total Annual Fund Operating Expenses After Fee Waiver, excluding certain expenses, at the amounts shown. Brokerage commissions, stamp duty fees, interest, taxes, acquired fund fees and expenses, and extraordinary expenses are excluded from the cap. Fees from the underlying master portfolio(s) are included in the cap. Without this cap, the Fund’s returns would have been lower. |
| 4. | Source: Wells Fargo Funds Management, LLC. The Growth Balanced Composite Index is weighted 35% in the Barclays U.S. Aggregate Bond Index (includes Treasury issues, agency issues, corporate bond issues, and mortgage-backed securities), 16.25% in the Russell 1000® Value Index (measures the performance of those Russell 1000 companies with lower price-to-book ratios and lower forecasted growth values), 16.25% in the S&P 500 Index, 16.25% in the Russell 1000® Growth Index (measures the performance of those Russell 1000 companies with higher price-to-book ratios and higher forecasted growth values), 9.75% in the MSCI EAFE Index (an unmanaged group of securities generally representative of the stock markets of Europe, Australasia, and the Far East), and 6.50% in the Russell 2000® Index (measures the performance of the 2,000 smallest companies in the Russell 3000® Index). You cannot invest directly in an index. |
| 5. | The S&P 500 Index consists of 500 stocks chosen for market size, liquidity, and industry group representation. It is a market-value weighted index with each stock’s weight in the index proportionate to its market value. You cannot invest directly in an index. |
| 6. | The Barclays U.S. Aggregate Bond Index is composed of the Barclays U.S. Government/Credit Index and the Barclays U.S. Mortgage-Backed Securities Index and includes U.S. Treasury issues, agency issues, corporate bond issues, and mortgage-backed securities. You cannot invest directly in an index. |
| 7. | The ten largest long-term holdings are calculated based on the value of the securities of the master portfolios allocable to the Fund divided by the total net assets of the Fund. Holdings are subject to change and may have changed since the date specified. |
| 8. | Portfolio allocations are subject to change. Cash and cash equivalents are not reflected in the calculations of portfolio allocations. Neutral target allocation is the target allocation of the Fund as stated in the Fund’s prospectus. Current target allocation is the current allocation of the Fund based on the Tactical Asset Allocation (TAA) Model as of the date specified and is subject to change. |
| | | | |
| 8 | | Wells Fargo Advantage Allocation Funds | | Performance highlights (unaudited) |
Wells Fargo Advantage Moderate Balanced Fund1
Investment objective
The Fund seeks total return, consisting of current income and capital appreciation.
Adviser
Wells Fargo Funds Management, LLC
Subadviser
Wells Capital Management Incorporated
Subadvisers for master portfolios
Artisan Partners Limited Partnership
Cooke & Bieler, L.P.
Galliard Capital Management, Inc.
Golden Capital Management, LLC
LSV Asset Management
Peregrine Capital Management, Inc.
Phocas Financial Corporation
SSgA Funds Management
Systematic Financial Management, L.P.
Wells Capital Management Incorporated
Portfolio managers
Doug Beath
Thomas C. Biwer, CFA
Petros Bocray, CFA, FRM
Christian L. Chan, CFA
Jeffrey P. Mellas, CAIA
Andrew Owen, CFA
Average annual total returns2 (%) as of November 30, 2012
| | | | | | | | | | | | | | | | | | | | | | | | | | | | | | | | | | |
| | | | | Including sales charge | | | Excluding sales charge | | | Expense ratios3 (%) | |
| | | Inception date | | 1 year | | | 5 year | | | 10 year | | | 1 year | | | 5 year | | | 10 year | | | Gross | | | Net4 | |
| Class A (WFMAX) | | 1-30-04 | | | 3.93 | | | | 1.08 | | | | 4.20 | | | | 10.27 | | | | 2.29 | | | | 4.82 | | | | 1.33 | | | | 1.15 | |
| Class B (WMOBX)* | | 1-30-04 | | | 4.44 | | | | 1.13 | | | | 4.27 | | | | 9.44 | | | | 1.51 | | | | 4.27 | | | | 2.08 | | | | 1.90 | |
| Class C (WFBCX) | | 1-30-04 | | | 8.43 | | | | 1.51 | | | | 4.03 | | | | 9.43 | | | | 1.51 | | | | 4.03 | | | | 2.08 | | | | 1.90 | |
| Administrator Class (NVMBX) | | 11-11-94 | | | – | | | | – | | | | – | | | | 10.49 | | | | 2.52 | | | | 5.07 | | | | 1.17 | | | | 0.90 | |
| Moderate Balanced Composite Index5 | | – | | | – | | | | – | | | | – | | | | 8.71 | | | | 3.71 | | | | 5.91 | | | | – | | | | – | |
| S&P 500 Index6 | | – | | | – | | | | – | | | | – | | | | 16.13 | | | | 1.34 | | | | 6.36 | | | | – | | | | – | |
| Barclays U.S. Aggregate Bond Index7 | | – | | | – | | | | – | | | | – | | | | 5.51 | | | | 6.04 | | | | 5.41 | | | | – | | | | – | |
| * | | Class B shares are closed to investment, except in connection with the reinvestment of any distributions and permitted exchanges. |
Figures quoted represent past performance, which is no guarantee of future results and do not reflect the deduction of taxes that a shareholder may pay on fund distributions or the redemption of fund shares. Investment return and principal value of an investment will fluctuate so that an investor’s shares, when redeemed, may be worth more or less than their original cost. Performance shown without sales charges would be lower if sales charges were reflected. Current performance may be lower or higher than the performance data quoted and assumes the reinvestment of dividends and capital gains. Current month-end performance is available on the Fund’s website, wellsfargoadvantagefunds.com.
Index returns do not include transaction costs associated with buying and selling securities, any mutual fund fees or expenses, or any taxes. It is not possible to invest directly in an index.
For Class A shares, the maximum front-end sales charge is 5.75%. For Class B shares, the maximum contingent deferred sales charge is 5.00%. For Class C shares, the maximum contingent deferred sales charge is 1.00%. Performance including sales charge assumes the sales charge for the corresponding time period. Administrator Class shares are sold without a front-end sales charge or contingent deferred sales charge.
Balanced funds may invest in stocks and bonds. Stock values fluctuate in response to the activities of individual companies and general market and economic conditions. Bond values fluctuate in response to the financial condition of individual issuers, general market and economic conditions, and changes in interest rates. In general, when interest rates rise, bond values fall and investors may lose principal value. The use of derivatives may reduce returns and/or increase volatility. Certain investment strategies tend to increase the total risk of an investment (relative to the broader market). The Fund is exposed to mortgage- and asset-backed securities risk. Consult the Fund’s prospectus for additional information on these and other risks.
Please see footnotes on page 9.
| | | | | | |
| Performance highlights (unaudited) | | Wells Fargo Advantage Allocation Funds | | | 9 | |
Wells Fargo Advantage Moderate Balanced Fund (continued)
| | | | |
| Ten largest long-term holdings8 (%) as of November 30, 2012 | |
Apple Incorporated | | | 1.24 | |
FHLMC, 7.50%, 9-25-43 | | | 0.93 | |
FNMA, 6.25%, 5-25-42 | | | 0.84 | |
FNMA, 5.25%, 5-25-20 | | | 0.83 | |
FNMA, 3.50%, 9-1-32 | | | 0.78 | |
TIPS, 0.75%, 02-15-42 | | | 0.77 | |
U.S. Treasury Bond, 4.25%, 11-15-40 | | | 0.69 | |
Exxon Mobil Corporation | | | 0.63 | |
FNMA, 5.50%, 2-1-36 | | | 0.60 | |
FNMA, 6.00%, 2-25-44 | | | 0.59 | |
| | |
| Neutral target allocation9 as of November 30, 2012 |
|
|
| | |
| Current target allocation9 as of November 30, 2012 |
|
|
| 1. | The Fund is a gateway blended fund that invests all of its assets in two or more master portfolios of the Wells Fargo Master Trust (the “Master Trust”) in varying proportions. References to the investment activities of the Fund are intended to refer to the investment activities of the master portfolios in which it invests. See Notes to Financial Statements for a discussion of the Master Trust. |
| 2. | Historical performance shown for Class A, Class B, and Class C shares prior to their inception reflects the performance of the Administrator Class shares, adjusted to reflect the higher expenses applicable to Class A, Class B, and Class C shares. |
| 3. | Reflects the expense ratios as stated in the most recent prospectuses. |
| 4. | The Adviser has committed through September 30, 2013, to waive fees and/or reimburse expenses to the extent necessary to cap the Fund’s Total Annual Fund Operating Expenses After Fee Waiver, excluding certain expenses, at the amounts shown. Brokerage commissions, stamp duty fees, interest, taxes, acquired fund fees and expenses, and extraordinary expenses are excluded from the cap. Fees from the underlying master portfolio(s) are included in the cap. Without this cap, the Fund’s returns would have been lower. |
| 5. | Source: Wells Fargo Funds Management, LLC. The Moderate Balanced Composite Index is weighted 45% in the Barclays U.S. Aggregate Bond Index (includes Treasury issues, agency issues, corporate bond issues, and mortgage-backed securities), 15% in the Barclays 9-12 Month U.S. Treasury Bond Index (an unmanaged index that includes aged U.S. Treasury bills, notes, and bonds with a remaining maturity from one up to but not including 12 months), 10% in the S&P 500 Index, 10% in the Russell 1000® Growth Index (measures the performance of those Russell 1000 companies with higher price-to-book ratios and higher forecasted growth values), 10% in the Russell 1000® Value Index (measures the performance of those Russell 1000 companies with lower price-to-book ratios and lower forecasted growth values), 6% in the MSCI EAFE Index (an unmanaged group of securities generally representative of the stock markets of Europe, Australasia, and the Far East), and 4% in the Russell 2000® Index (measures the performance of the 2,000 smallest companies in the Russell 3000® Index). You cannot invest directly in an index. |
| 6. | The S&P 500 Index consists of 500 stocks chosen for market size, liquidity, and industry group representation. It is a market-value weighted index with each stock’s weight in the index proportionate to its market value. You cannot invest directly in an index. |
| 7. | The Barclays U.S. Aggregate Bond Index is composed of the Barclays U.S. Government/Credit Index and the Barclays U.S. Mortgage-Backed Securities Index and includes U.S. Treasury issues, agency issues, corporate bond issues, and mortgage-backed securities. You cannot invest directly in an index. |
| 8. | The ten largest long-term holdings are calculated based on the value of the securities of the master portfolios allocable to the Fund divided by the total net assets of the Fund. Holdings are subject to change and may have changed since the date specified. |
| 9. | Portfolio allocations are subject to change. Cash and cash equivalents are not reflected in the calculations of portfolio allocations. Neutral target allocation is the target allocation of the Fund as stated in the Fund’s prospectus. Current target allocation is the current allocation of the Fund based on the Tactical Asset Allocation (TAA) Model as of the date specified and is subject to change. |
| | | | |
| 10 | | Wells Fargo Advantage Allocation Funds | | Fund expenses (unaudited) |
As a shareholder of the Fund, you incur two types of costs: (1) transaction costs, including sales charges (loads) on purchase payments and contingent deferred sales charges (if any) on redemptions and (2) ongoing costs, including management fees, distribution (12b-1) and/or shareholder service fees, and other Fund expenses. This example is intended to help you understand your ongoing costs (in dollars) of investing in the Fund and to compare these costs with the ongoing costs of investing in other mutual funds.
The example is based on an investment of $1,000 invested at the beginning of the six-month period and held for the entire period from June 1, 2012, to November 30, 2012.
Actual expenses
The “Actual” line of the table below provides information about actual account values and actual expenses. You may use the information in this line, together with the amount you invested, to estimate the expenses that you paid over the period. Simply divide your account value by $1,000 (for example, an $8,600 account value divided by $1,000 = 8.6), then multiply the result by the number in the “Actual” line under the heading entitled “Expenses paid during period” for your applicable class of shares to estimate the expenses you paid on your account during this period.
Hypothetical example for comparison purposes
The “Hypothetical” line of the table below provides information about hypothetical account values and hypothetical expenses based on the Fund’s actual expense ratio and an assumed rate of return of 5% per year before expenses, which is not the Fund’s actual return. The hypothetical account values and expenses may not be used to estimate the actual ending account balance or expenses you paid for the period. You may use this information to compare the ongoing costs of investing in the Fund and other funds. To do so, compare this 5% hypothetical example with the 5% hypothetical examples that appear in the shareholder reports of the other funds.
Please note that the expenses shown in the table are meant to highlight your ongoing costs only and do not reflect any transactional costs, such as sales charges (loads) and contingent deferred sales charges. Therefore, the “Hypothetical” line of the table is useful in comparing ongoing costs only and will not help you determine the relative total costs of owning different funds. In addition, if these transactional costs were included, your costs would have been higher.
| | | | | | | | | | | | | | | | |
| Wells Fargo Advantage Conservative Allocation Fund | | Beginning
account value
6-1-12 | | | Ending
account value
11-30-12 | | | Expenses
paid during
the period¹ | | | Net annual
expense ratio | |
| | | | |
Administrator Class | | | | | | | | | | | | | | | | |
Actual | | $ | 1,000.00 | | | $ | 1,046.22 | | | $ | 4.36 | | | | 0.85 | % |
Hypothetical (5% return before expenses) | | $ | 1,000.00 | | | $ | 1,020.81 | | | $ | 4.31 | | | | 0.85 | % |
| Wells Fargo Advantage Growth Balanced Fund | | | | | | | | | | | | |
Class A | | | | | | | | | | | | | | | | |
Actual | | $ | 1,000.00 | | | $ | 1,083.90 | | | $ | 6.27 | | | | 1.20 | % |
Hypothetical (5% return before expenses) | | $ | 1,000.00 | | | $ | 1,019.05 | | | $ | 6.07 | | | | 1.20 | % |
Class B | | | | | | | | | | | | | | | | |
Actual | | $ | 1,000.00 | | | $ | 1,079.44 | | | $ | 10.17 | | | | 1.95 | % |
Hypothetical (5% return before expenses) | | $ | 1,000.00 | | | $ | 1,015.29 | | | $ | 9.85 | | | | 1.95 | % |
Class C | | | | | | | | | | | | | | | | |
Actual | | $ | 1,000.00 | | | $ | 1,079.53 | | | $ | 10.17 | | | | 1.95 | % |
Hypothetical (5% return before expenses) | | $ | 1,000.00 | | | $ | 1,015.29 | | | $ | 9.85 | | | | 1.95 | % |
Administrator Class | | | | | | | | | | | | | | | | |
Actual | | $ | 1,000.00 | | | $ | 1,085.04 | | | $ | 4.97 | | | | 0.95 | % |
Hypothetical (5% return before expenses) | | $ | 1,000.00 | | | $ | 1,020.31 | | | $ | 4.81 | | | | 0.95 | % |
| Wells Fargo Advantage Moderate Balanced Fund | | | | | | | | | | | | |
Class A | | | | | | | | | | | | | | | | |
Actual | | $ | 1,000.00 | | | $ | 1,063.16 | | | $ | 5.95 | | | | 1.15 | % |
Hypothetical (5% return before expenses) | | $ | 1,000.00 | | | $ | 1,019.30 | | | $ | 5.82 | | | | 1.15 | % |
Class B | | | | | | | | | | | | | | | | |
Actual | | $ | 1,000.00 | | | $ | 1,058.86 | | | $ | 9.81 | | | | 1.90 | % |
Hypothetical (5% return before expenses) | | $ | 1,000.00 | | | $ | 1,015.54 | | | $ | 9.60 | | | | 1.90 | % |
Class C | | | | | | | | | | | | | | | | |
Actual | | $ | 1,000.00 | | | $ | 1,058.51 | | | $ | 9.80 | | | | 1.90 | % |
Hypothetical (5% return before expenses) | | $ | 1,000.00 | | | $ | 1,015.54 | | | $ | 9.60 | | | | 1.90 | % |
Administrator Class | | | | | | | | | | | | | | | | |
Actual | | $ | 1,000.00 | | | $ | 1,063.78 | | | $ | 4.66 | | | | 0.90 | % |
Hypothetical (5% return before expenses) | | $ | 1,000.00 | | | $ | 1,020.56 | | | $ | 4.56 | | | | 0.90 | % |
| 1. | Expenses paid is equal to the annualized expense ratio of each class multiplied by the average account value over the period, multiplied by the number of days in the most recent fiscal half-year divided by the number of days in the fiscal year (to reflect the one-half-year period). |
| | | | | | |
| Portfolio of investments—November 30, 2012 (unaudited) | | Wells Fargo Advantage Allocation Funds | | | 11 | |
CONSERVATIVE ALLOCATION FUND
| | | | | | | | | | | | | | | | | | |
| Security name | | | | | | | | | | | | | Value | |
| | | | | | | | | | | | | | | | | | |
| | | | | |
Investment Companies: 99.62% | | | | | | | | | | | | | | | | | | |
| | | | | |
| Affiliated Master Portfolios: 99.62% | | | | | | | | | | | | | | | | | | |
Wells Fargo Advantage C&B Large Cap Value Portfolio | | | | | | | | | | | | | | | | $ | 683,435 | |
Wells Fargo Advantage Core Bond Portfolio | | | | | | | | | | | | | | | | | 4,494,250 | |
Wells Fargo Advantage Diversified Large Cap Growth Portfolio | | | | | | | | | | | | | | | | | 2,083,455 | |
Wells Fargo Advantage Emerging Growth Portfolio | | | | | | | | | | | | | | | | | 207,540 | |
Wells Fargo Advantage Equity Value Portfolio | | | | | | | | | | | | | | | | | 688,494 | |
Wells Fargo Advantage Index Portfolio | | | | | | | | | | | | | | | | | 2,067,050 | |
Wells Fargo Advantage Inflation-Protected Bond Portfolio | | | | | | | | | | | | | | | | | 2,259,424 | |
Wells Fargo Advantage International Equity Portfolio | | | | | | | | | | | | | | | | | 312,744 | |
Wells Fargo Advantage International Growth Portfolio | | | | | | | | | | | | | | | | | 312,345 | |
Wells Fargo Advantage International Index Portfolio | | | | | | | | | | | | | | | | | 312,379 | |
Wells Fargo Advantage International Value Portfolio | | | | | | | | | | | | | | | | | 312,090 | |
Wells Fargo Advantage Large Company Value Portfolio | | | | | | | | | | | | | | | | | 684,325 | |
Wells Fargo Advantage Managed Fixed Income Portfolio | | | | | | | | | | | | | | | | | 15,731,789 | |
Wells Fargo Advantage Small Cap Value Portfolio | | | | | | | | | | | | | | | | | 204,223 | |
Wells Fargo Advantage Small Company Growth Portfolio | | | | | | | | | | | | | | | | | 208,135 | |
Wells Fargo Advantage Small Company Value Portfolio | | | | | | | | | | | | | | | | | 208,091 | |
Wells Fargo Advantage Stable Income Portfolio | | | | | | | | | | | | | | | | | 10,214,761 | |
| | | | | |
Total Investment Companies (Cost $40,018,822) | | | | | | | | | | | | | | | | | 40,984,530 | |
| | | | | | | | | | | | | | | | | | |
| | | | | |
| | | | | | | | | | | Principal | | | | |
| | | | | |
Other: 0.02% | | | | | | | | | | | | | | | | | | |
Gryphon Funding Limited, Pass-Through Entity (a)(i) | | | | | | | | | | | | $ | 21,810 | | | | 7,197 | |
| | | | | | | | | | | | | | | | | | |
| | | | | |
Total Other (Cost $5,191) | | | | | | | | | | | | | | | | | 7,197 | |
| | | | | | | | | | | | | | | | | | |
| | | | | |
| | | | | Yield | | | Maturity date | | | | | | | |
| Short-Term Investments: 0.40% | | | | | | | | | | | | | | | | | | |
| U.S. Treasury Securities: 0.40% | | | | | | | | | | | | | | | | | | |
U.S. Treasury Bill #(z) | | | | | 0.10 | % | | | 12-27-12 | | | | 165,000 | | | | 164,988 | |
| | | | | | | | | | | | | | | | | | |
| | | | | |
Total Short-Term Investments (Cost $164,982) | | | | | | | | | | | | | | | | | 164,988 | |
| | | | | | | | | | | | | | | | | | |
| | | | | | | | |
| Total investments in securities | | | | | | | | |
| (Cost $40,188,995) * | | | 100.04 | % | | | 41,156,715 | |
Other assets and liabilities, net | | | (0.04 | ) | | | (15,544 | ) |
| | | | | | | | |
| Total net assets | | | 100.00 | % | | $ | 41,141,171 | |
| | | | | | | | |
| (a) | Security is fair valued by the Management Valuation Team, and in certain instances by the Board of Trustees, in accordance with procedures approved by the Board of Trustees. |
| (#) | All or a portion of this security is segregated as collateral for investments in derivative instruments. |
| (z) | Zero coupon security. Rate represents yield to maturity at time of purchase. |
| * | Cost for federal income tax purposes is $41,592,501 and unrealized appreciation (depreciation) consists of: |
| | | | |
Gross unrealized appreciation | | $ | 967,720 | |
Gross unrealized depreciation | | | (1,403,506 | ) |
| | | | |
Net unrealized depreciation | | $ | (435,786 | ) |
The accompanying notes are an integral part of these financial statements.
| | | | |
| 12 | | Wells Fargo Advantage Allocation Funds | | Portfolio of investments—November 30, 2012 (unaudited) |
GROWTH BALANCED FUND
| | | | | | | | | | | | | | | | |
| Security name | | | | | | | | | | | Value | |
| | | | | | | | | | | | | | | | |
| | | | |
Investment Companies: 98.19% | | | | | | | | | | | | | | | | |
| | | | |
| Affiliated Master Portfolios: 98.19% | | | | | | | | | | | | | | | | |
Wells Fargo Advantage C&B Large Cap Value Portfolio | | | | | | | | | | | | | | $ | 11,984,973 | |
Wells Fargo Advantage Core Bond Portfolio | | | | | | | | | | | | | | | 15,446,877 | |
Wells Fargo Advantage Diversified Large Cap Growth Portfolio | | | | | | | | | | | | | | | 36,894,450 | |
Wells Fargo Advantage Emerging Growth Portfolio | | | | | | | | | | | | | | | 3,608,972 | |
Wells Fargo Advantage Equity Value Portfolio | | | | | | | | | | | | | | | 12,139,301 | |
Wells Fargo Advantage Index Portfolio | | | | | | | | | | | | | | | 36,493,309 | |
Wells Fargo Advantage Inflation-Protected Bond Portfolio | | | | | | | | | | | | | | | 7,762,010 | |
Wells Fargo Advantage International Equity Portfolio | | | | | | | | | | | | | | | 5,519,013 | |
Wells Fargo Advantage International Growth Portfolio | | | | | | | | | | | | | | | 5,537,933 | |
Wells Fargo Advantage International Index Portfolio | | | | | | | | | | | | | | | 5,535,868 | |
Wells Fargo Advantage International Value Portfolio | | | | | | | | | | | | | | | 5,501,509 | |
Wells Fargo Advantage Large Company Value Portfolio | | | | | | | | | | | | | | | 12,028,372 | |
Wells Fargo Advantage Managed Fixed Income Portfolio | | | | | | | | | | | | | | | 54,065,776 | |
Wells Fargo Advantage Small Cap Value Portfolio | | | | | | | | | | | | | | | 3,570,270 | |
Wells Fargo Advantage Small Company Growth Portfolio | | | | | | | | | | | | | | | 3,656,417 | |
Wells Fargo Advantage Small Company Value Portfolio | | | | | | | | | | | | | | | 3,673,609 | |
| | | | |
Total Investment Companies (Cost $205,299,853) | | | | | | | | | | | | | | | 223,418,659 | |
| | | | | | | | | | | | | | | | |
| | | | |
| | | | | | | | | Principal | | | | |
| Other: 0.03% | | | | | | | | | | | | | | | | |
Gryphon Funding Limited, Pass-Through Entity (a)(i) | | | | | | | | | | $ | 226,020 | | | | 74,587 | |
| | | | | | | | | | | | | | | | |
| | | | |
Total Other (Cost $53,798) | | | | | | | | | | | | | | | 74,587 | |
| | | | | | | | | | | | | | | | |
| | | | |
| | | Yield | | | Maturity date | | | | | | | |
| Short-Term Investments: 1.90% | | | | | | | | | | | | | | | | |
| U.S. Treasury Securities: 1.90% | | | | | | | | | | | | | | | | |
U.S. Treasury Bill #(z) | | | 0.10 | % | | | 12-27-12 | | | | 510,000 | | | | 509,963 | |
U.S. Treasury Bill #(z) | | | 0.13 | | | | 12-20-12 | | | | 3,815,000 | | | | 3,814,721 | |
| | | | |
Total Short-Term Investments (Cost $4,324,665) | | | | | | | | | | | | | | | 4,324,684 | |
| | | | | | | | | | | | | | | | |
| | | | | | | | |
| Total investments in securities | | | | | | | | |
| (Cost $209,678,316) * | | | 100.12 | % | | | 227,817,930 | |
Other assets and liabilities, net | | | (0.12 | ) | | | (265,315 | ) |
| | | | | | | | |
| Total net assets | | | 100.00 | % | | $ | 227,552,615 | |
| | | | | | | | |
| (a) | Security is fair valued by the Management Valuation Team, and in certain instances by the Board of Trustees, in accordance with procedures approved by the Board of Trustees. |
| # | All or a portion of this security is segregated as collateral for investments in derivative instruments. |
| (z) | Zero coupon security. Rate represents yield to maturity at time of purchase. |
| * | Cost for federal income tax purposes is $219,987,288 and unrealized appreciation (depreciation) consists of: |
| | | | |
Gross unrealized appreciation | | $ | 17,701,836 | |
Gross unrealized depreciation | | | (9,871,194 | ) |
| | | | |
Net unrealized appreciation | | $ | 7,830,642 | |
The accompanying notes are an integral part of these financial statements.
| | | | | | |
| Portfolio of investments—November 30, 2012 (unaudited) | | Wells Fargo Advantage Allocation Funds | | | 13 | |
MODERATE BALANCED FUND
| | | | | | | | | | | | | | | | | | |
| Security name | | | | | | | | | | | | | Value | |
| | | | | | | | | | | | | | | | | | |
| | | | | |
Investment Companies: 99.28% | | | | | | | | | | | | | | | | | | |
| | | | | |
| Affiliated Master Portfolios: 99.28% | | | | | | | | | | | | | | | | | | |
Wells Fargo Advantage C&B Large Cap Value Portfolio | | | | | | | | | | | | | | | | $ | 5,472,135 | |
Wells Fargo Advantage Core Bond Portfolio | | | | | | | | | | | | | | | | | 14,746,374 | |
Wells Fargo Advantage Diversified Large Cap Growth Portfolio | | | | | | | | | | | | | | | | | 16,669,689 | |
Wells Fargo Advantage Emerging Growth Portfolio | | | | | | | | | | | | | | | | | 1,661,614 | |
Wells Fargo Advantage Equity Value Portfolio | | | | | | | | | | | | | | | | | 5,507,309 | |
Wells Fargo Advantage Index Portfolio | | | | | | | | | | | | | | | | | 16,525,077 | |
Wells Fargo Advantage Inflation-Protected Bond Portfolio | | | | | | | | | | | | | | | | | 7,409,317 | |
Wells Fargo Advantage International Equity Portfolio | | | | | | | | | | | | | | | | | 2,503,831 | |
Wells Fargo Advantage International Growth Portfolio | | | | | | | | | | | | | | | | | 2,516,234 | |
Wells Fargo Advantage International Index Portfolio | | | | | | | | | | | | | | | | | 2,508,057 | |
Wells Fargo Advantage International Value Portfolio | | | | | | | | | | | | | | | | | 2,498,496 | |
Wells Fargo Advantage Large Company Value Portfolio | | | | | | | | | | | | | | | | | 5,485,329 | |
Wells Fargo Advantage Managed Fixed Income Portfolio | | | | | | | | | | | | | | | | | 51,613,850 | |
Wells Fargo Advantage Small Cap Value Portfolio | | | | | | | | | | | | | | | | | 1,642,215 | |
Wells Fargo Advantage Small Company Growth Portfolio | | | | | | | | | | | | | | | | | 1,665,094 | |
Wells Fargo Advantage Small Company Value Portfolio | | | | | | | | | | | | | | | | | 1,663,839 | |
Wells Fargo Advantage Stable Income Portfolio | | | | | | | | | | | | | | | | | 24,581,171 | |
| | | | | |
Total Investment Companies (Cost $155,797,718) | | | | | | | | | | | | | | | | | 164,669,631 | |
| | | | | | | | | | | | | | | | | | |
| | | | | |
| | | | | | | | | | | Principal | | | | |
| Other: 0.01% | | | | | | | | | | | | | | | | | | |
Gryphon Funding Limited, Pass-Through Entity (a)(i) | | | | | | | | | | | | $ | 41,040 | | | | 13,543 | |
| | | | | | | | | | | | | | | | | | |
| | | | | |
Total Other (Cost $9,768) | | | | | | | | | | | | | | | | | 13,543 | |
| | | | | | | | | | | | | | | | | | |
| | | | | |
| | | | | Yield | | | Maturity date | | | | | | | |
| Short-Term Investments: 1.05% | | | | | | | | | | | | | | | | | | |
| U.S. Treasury Securities: 1.05% | | | | | | | | | | | | | | | | | | |
U.S. Treasury Bill #(z) | | | | | 0.10 | % | | | 12-27-12 | | | | 1,740,000 | | | | 1,739,873 | |
| | | | | | | | | | | | | | | | | | |
| | | | | |
Total Short-Term Investments (Cost $1,739,809) | | | | | | | | | | | | | | | | | 1,739,873 | |
| | | | | | | | | | | | | | | | | | |
| | | | | | | | |
| Total investments in securities | | | | | | | | |
| (Cost $157,547,295) * | | | 100.34 | % | | | 166,423,047 | |
Other assets and liabilities, net | | | (0.34 | ) | | | (569,061 | ) |
| | | | | | | | |
| Total net assets | | | 100.00 | % | | $ | 165,853,986 | |
| | | | | | | | |
| (a) | Security is fair valued by the Management Valuation Team, and in certain instances by the Board of Trustees, in accordance with procedures approved by the Board of Trustees. |
| # | All or a portion of this security is segregated as collateral for investments in derivative instruments. |
| (z) | Zero coupon security. Rate represents yield to maturity at time of purchase. |
| * | Cost for federal income tax purposes is $160,197,210 and unrealized appreciation (depreciation) consists of: |
| | | | |
Gross unrealized appreciation | | $ | 6,527,408 | |
Gross unrealized depreciation | | | (301,571 | ) |
| | | | |
Net unrealized appreciation | | $ | 6,225,837 | |
The accompanying notes are an integral part of these financial statements.
| | | | |
| 14 | | Wells Fargo Advantage Allocation Funds | | Statements of assets and liabilities—November 30, 2012 (unaudited) |
| | | | | | | | | | | | |
| | | Conservative
Allocation Fund | | | Growth
Balanced Fund | | | Moderate
Balanced Fund | |
| | | |
Assets | | | | | | | | | | | | |
Investments | | | | | | | | | | | | |
In affiliated Master Portfolios, at value (see cost below) | | $ | 40,984,530 | | | $ | 223,418,659 | | | $ | 164,669,631 | |
In unaffiliated securities, at value (see cost below) | | | 172,185 | | | | 4,399,271 | | | | 1,753,416 | |
| | | | | | | | | | | | |
Total investments, at value (see cost below) | | | 41,156,715 | | | | 227,817,930 | | | | 166,423,047 | |
Cash | | | 39 | | | | 666 | | | | 324 | |
Receivable for Fund shares sold | | | 8,887 | | | | 119,503 | | | | 130,971 | |
Receivable from adviser | | | 9,714 | | | | 1,886 | | | | 0 | |
Prepaid expenses and other assets | | | 20,296 | | | | 35,457 | | | | 17,495 | |
| | | | | | | | | | | | |
Total assets | | | 41,195,651 | | | | 227,975,442 | | | | 166,571,837 | |
| | | | | | | | | | | | |
| | | |
Liabilities | | | | | | | | | | | | |
Payable for Fund shares redeemed | | | 10,122 | | | | 219,950 | | | | 599,969 | |
Payable for daily variation margin on open futures contracts | | | 3,981 | | | | 66,797 | | | | 32,534 | |
Advisory fee payable | | | 0 | | | | 0 | | | | 3,368 | |
Distribution fees payable | | | N/A | | | | 6,028 | | | | 2,135 | |
Due to related parties | | | 5,376 | | | | 38,514 | | | | 23,484 | |
Shareholder report expenses payable | | | 26,768 | | | | 35,784 | | | | 20,347 | |
Shareholder servicing fees payable | | | 7,912 | | | | 49,335 | | | | 36,014 | |
Accrued expenses and other liabilities | | | 321 | | | | 6,419 | | | | 0 | |
| | | | | | | | | | | | |
Total liabilities | | | 54,480 | | | | 422,827 | | | | 717,851 | |
| | | | | | | | | | | | |
Total net assets | | $ | 41,141,171 | | | $ | 227,552,615 | | | $ | 165,853,986 | |
| | | | | | | | | | | | |
| | | |
NET ASSETS CONSIST OF | | | | | | | | | | | | |
Paid-in capital | | $ | 64,644,620 | | | $ | 398,300,327 | | | $ | 168,422,889 | |
Undistributed net investment income | | | 703,912 | | | | 3,293,323 | | | | 2,792,507 | |
Accumulated net realized losses on investments | | | (25,160,399 | ) | | | (191,624,004 | ) | | | (13,967,153 | ) |
Net unrealized gains on investments | | | 953,038 | | | | 17,582,969 | | | | 8,605,743 | |
| | | | | | | | | | | | |
Total net assets | | $ | 41,141,171 | | | $ | 227,552,615 | | | $ | 165,853,986 | |
| | | | | | | | | | | | |
| | |
COMPUTATION OF NET ASSET VALUE AND OFFERING PRICE PER SHARE1 | | | | | | | | | |
Net assets – Class A | | | N/A | | | $ | 54,395,467 | | | $ | 10,281,355 | |
Shares outstanding – Class A | | | N/A | | | | 1,807,406 | | | | 513,363 | |
Net asset value per share – Class A | | | N/A | | | | $30.10 | | | | $20.03 | |
Maximum offering price per share – Class A2 | | | N/A | | | | $31.94 | | | | $21.25 | |
Net assets – Class B | | | N/A | | | $ | 1,359,678 | | | $ | 729,407 | |
Shares outstanding – Class B | | | N/A | | | | 50,799 | | | | 36,529 | |
Net asset value per share – Class B | | | N/A | | | | $26.77 | | | | $19.97 | |
Net assets – Class C | | | N/A | | | $ | 8,152,481 | | | $ | 2,641,236 | |
Shares outstanding – Class C | | | N/A | | | | 307,945 | | | | 133,919 | |
Net asset value per share – Class C | | | N/A | | | | $26.47 | | | | $19.72 | |
Net assets – Administrator Class | | $ | 41,141,171 | | | $ | 163,644,989 | | | $ | 152,201,988 | |
Shares outstanding – Administrator Class | | | 2,271,365 | | | | 6,049,292 | | | | 7,541,473 | |
Net asset value per share – Administrator Class | | | $18.11 | | | | $27.05 | | | | $20.18 | |
| | | |
Investments in affiliated Master Portfolios, at cost | | $ | 40,018,822 | | | $ | 205,299,853 | | | $ | 155,797,718 | |
| | | | | | | | | | | | |
Investments in unaffiliated securities, at cost | | $ | 170,173 | | | $ | 4,378,463 | | | $ | 1,749,577 | |
| | | | | | | | | | | | |
Total investments, at cost | | $ | 40,188,995 | | | $ | 209,678,316 | | | $ | 157,547,295 | |
| | | | | | | | | | | | |
| 1. | Each Fund has an unlimited number of authorized shares. |
| 2. | Maximum offering price is computed as 100/94.25 of net asset value. On investments of $50,000 or more, the offering price is reduced. |
The accompanying notes are an integral part of these financial statements.
| | | | | | |
| Statements of operations—six months ended November 30, 2012 (unaudited) | | Wells Fargo Advantage Allocation Funds | | | 15 | |
| | | | | | | | | | | | |
| | | Conservative
Allocation Fund | | | Growth
Balanced Fund | | | Moderate
Balanced Fund | |
| | | |
Investment income | | | | | | | | | | | | |
Interest allocated from affiliated Master Portfolios* | | $ | 473,958 | | | $ | 1,391,714 | | | $ | 1,531,267 | |
Dividends allocated from affiliated Master Portfolios** | | | 75,858 | | | | 1,456,212 | | | | 629,420 | |
Securities lending income allocated from affiliated Master Portfolios | | | 2,128 | | | | 28,748 | | | | 13,919 | |
Interest | | | 262 | | | | 3,734 | | | | 995 | |
Expenses allocated from affiliated Master Portfolios | | | (102,719 | ) | | | (651,973 | ) | | | (442,033 | ) |
Waivers allocated from affiliated Master Portfolios | | | 16,632 | | | | 47,569 | | | | 54,416 | |
| | | | | | | | | | | | |
Total investment income | | | 466,119 | | | | 2,276,004 | | | | 1,787,984 | |
| | | | | | | | | | | | |
| | | |
Expenses | | | | | | | | | | | | |
Advisory fee | | | 50,435 | | | | 302,573 | | | | 210,841 | |
Administration fees | | | | | | | | | | | | |
Fund level | | | 10,087 | | | | 60,514 | | | | 42,168 | |
Class A | | | N/A | | | | 69,607 | | | | 13,188 | |
Class B | | | N/A | | | | 2,035 | | | | 1,016 | |
Class C | | | N/A | | | | 10,392 | | | | 3,176 | |
Administrator Class | | | 20,174 | | | | 89,478 | | | | 77,652 | |
Shareholder servicing fees | | | | | | | | | | | | |
Class A | | | N/A | | | | 66,930 | | | | 12,680 | |
Class B | | | N/A | | | | 1,837 | | | | 977 | |
Class C | | | N/A | | | | 9,993 | | | | 3,054 | |
Administrator Class | | | 50,224 | | | | 223,149 | | | | 194,130 | |
Distribution fees | | | | | | | | | | | | |
Class B | | | N/A | | | | 5,870 | | | | 2,932 | |
Class C | | | N/A | | | | 29,978 | | | | 9,162 | |
Custody and accounting fees | | | 1,582 | | | | 5,051 | | | | 3,697 | |
Professional fees | | | 11,316 | | | | 8,136 | | | | 9,206 | |
Registration fees | | | 16,231 | | | | 29,772 | | | | 29,321 | |
Shareholder report expenses | | | 15,367 | | | | 32,847 | | | | 16,765 | |
Trustees’ fees and expenses | | | 6,011 | | | | 5,600 | | | | 5,704 | |
Other fees and expenses | | | 3,381 | | | | 6,058 | | | | 5,615 | |
| | | | | | | | | | | | |
Total expenses | | | 184,808 | | | | 959,820 | | | | 641,284 | |
Less: Fee waivers and/or expense reimbursements | | | (99,416 | ) | | | (299,731 | ) | | | (241,068 | ) |
| | | | | | | | | | | | |
Net expenses | | | 85,392 | | | | 660,089 | | | | 400,216 | |
| | | | | | | | | | | | |
Net investment income | | | 380,727 | | | | 1,615,915 | | | | 1,387,768 | |
| | | | | | | | | | | | |
| |
REALIZED AND UNREALIZED GAINS (LOSSES) ON INVESTMENTS | | | | | |
| | | |
Net realized gains (losses) on: | | | | | | | | | | | | |
Unaffiliated securities | | | 2,886 | | | | 31,107 | | | | 5,430 | |
Futures transactions | | | 82,686 | | | | 1,394,582 | | | | 724,368 | |
Securities transactions allocated from affiliated Master Portfolios | | | 753,496 | | | | 5,719,150 | | | | 3,484,793 | |
| | | | | | | | | | | | |
Net realized gains on investments | | | 839,068 | | | | 7,144,839 | | | | 4,214,591 | |
| | | | | | | | | | | | |
| | | |
Net change in unrealized gains (losses) on: | | | | | | | | | | | | |
Unaffiliated securities | | | (356 | ) | | | (3,597 | ) | | | (686 | ) |
Futures transactions | | | 69,165 | | | | 1,444,588 | | | | 611,338 | |
Securities transactions allocated from affiliated Master Portfolios | | | 484,348 | | | | 8,615,478 | | | | 3,876,080 | |
| | | | | | | | | | | | |
Net change in unrealized gains (losses) on investments | | | 553,157 | | | | 10,056,469 | | | | 4,486,732 | |
| | | | | | | | | | | | |
Net realized and unrealized gains (losses) on investments | | | 1,392,225 | | | | 17,201,308 | | | | 8,701,323 | |
| | | | | | | | | | | | |
Net increase in net assets resulting from operations | | $ | 1,772,952 | | | $ | 18,817,223 | | | $ | 10,089,091 | |
| | | | | | | | | | | | |
| | | |
* Net of foreign interest withholding taxes allocated from affiliated Master Portfolios in the amount of | | | $45 | | | | $174 | | | | $156 | |
** Net of foreign dividend withholding taxes allocated from affiliated Master Portfolios in the amount of | | | $1,122 | | | | $22,339 | | | | $9,559 | |
The accompanying notes are an integral part of these financial statements.
| | | | |
| 16 | | Wells Fargo Advantage Allocation Funds | | Statements of changes in net assets |
| | | | | | | | | | | | | | | | |
| | | Conservative Allocation Fund | |
| | | Six months ended November 30, 2012 (unaudited) | | | Year ended May 31, 2012 | |
| | | | |
Operations | | | | | | | | | | | | | | | | |
Net investment income | | | | | | $ | 380,727 | | | | | | | $ | 822,932 | |
Net realized gains on investments | | | | | | | 839,068 | | | | | | | | 595,598 | |
Net change in unrealized gains (losses) on investments | | | | | | | 553,157 | | | | | | | | (565,788 | ) |
| | | | | | | | | | | | | | | | |
Net increase in net assets resulting from operations | | | | | | | 1,772,952 | | | | | | | | 852,742 | |
| | | | | | | | | | | | | | | | |
| | | | |
Distributions to shareholders from | | | | | | | | | | | | | | | | |
Net investment income | | | | | | | | | | | | | | | | |
Administrator Class | | | | | | | 0 | | | | | | | | (493,074 | ) |
| | | | | | | | | | | | | | | | |
Total distributions to shareholders | | | | | | | 0 | | | | | | | | (493,074 | ) |
| | | | | | | | | | | | | | | | |
| | | | |
Capital share transactions | | | Shares | | | | | | | | Shares | | | | | |
Proceeds from shares sold | | | | | | | | | | | | | | | | |
Administrator Class | | | 284,048 | | | | 5,074,178 | | | | 436,655 | | | | 7,434,591 | |
Reinvestment of distributions | | | | | | | | | | | | | | | | |
Administrator Class | | | 0 | | | | 0 | | | | 29,056 | | | | 482,333 | |
Payment for shares redeemed | | | | | | | | | | | | | | | | |
Administrator Class | | | (254,146 | ) | | | (4,503,872 | ) | | | (368,142 | ) | | | (6,281,286 | ) |
| | | | | | | | | | | | | | | | |
Net increase in net assets resulting from capital share transactions | | | | | | | 570,306 | | | | | | | | 1,635,638 | |
| | | | | | | | | | | | | | | | |
Total increase in net assets | | | | | | | 2,343,258 | | | | | | | | 1,995,306 | |
| | | | | | | | | | | | | | | | |
| | | | |
Net assets | | | | | | | | | | | | | | | | |
Beginning of period | | | | | | | 38,797,913 | | | | | | | | 36,802,607 | |
| | | | | | | | | | | | | | | | |
End of period | | | | | | $ | 41,141,171 | | | | | | | $ | 38,797,913 | |
| | | | | | | | | | | | | | | | |
Undistributed net investment income | | | | | | $ | 703,912 | | | | | | | $ | 323,185 | |
| | | | | | | | | | | | | | | | |
The accompanying notes are an integral part of these financial statements.
| | | | | | |
| Statements of changes in net assets | | Wells Fargo Advantage Allocation Funds | | | 17 | |
| | | | | | | | | | | | | | | | |
| | | Growth Balanced Fund | |
| | | Six months ended November 30, 2012 (unaudited) | | | Year ended May 31, 2012 | |
| | | | |
Operations | | | | | | | | | | | | | | | | |
Net investment income | | | | | | $ | 1,615,915 | | | | | | | $ | 4,792,504 | |
Net realized gains (losses) on investments | | | | | | | 7,144,839 | | | | | | | | (3,024,099 | ) |
Net change in unrealized gains (losses) on investments | | | | | | | 10,056,469 | | | | | | | | (17,190,366 | ) |
| | | | | | | | | | | | | | | | |
Net increase (decrease) in net assets resulting from operations | | | | | | | 18,817,223 | | | | | | | | (15,421,961 | ) |
| | | | | | | | | | | | | | | | |
| | | | |
Distributions to shareholders from | | | | | | | | | | | | | | | | |
Net investment income | | | | | | | | | | | | | | | | |
Class A | | | | | | | 0 | | | | | | | | (422,013 | ) |
Class C | | | | | | | 0 | | | | | | | | (16,422 | ) |
Administrator Class | | | | | | | 0 | | | | | | | | (2,900,868 | ) |
| | | | | | | | | | | | | | | | |
Total distributions to shareholders | | | | | | | 0 | | | | | | | | (3,339,303 | ) |
| | | | | | | | | | | | | | | | |
| | | | |
Capital share transactions | | | Shares | | | | | | | | Shares | | | | | |
Proceeds from shares sold | | | | | | | | | | | | | | | | |
Class A | | | 175,806 | | | | 5,254,404 | | | | 145,577 | | | | 4,030,845 | |
Class B | | | 669 | | | | 18,048 | | | | 1,736 | | | | 35,305 | |
Class C | | | 20,684 | | | | 539,930 | | | | 44,762 | | | | 1,077,045 | |
Administrator Class | | | 310,772 | | | | 8,214,464 | | | | 1,126,437 | | | | 28,122,102 | |
| | | | | | | | | | | | | | | | |
| | | | | | | 14,026,846 | | | | | | | | 33,265,297 | |
| | | | | | | | | | | | | | | | |
Reinvestment of distributions | | | | | | | | | | | | | | | | |
Class A | | | 0 | | | | 0 | | | | 15,849 | | | | 409,066 | |
Class C | | | 0 | | | | 0 | | | | 672 | | | | 15,373 | |
Administrator Class | | | 0 | | | | 0 | | | | 123,784 | | | | 2,864,372 | |
| | | | | | | | | | | | | | | | |
| | | | | | | 0 | | | | | | | | 3,288,811 | |
| | | | | | | | | | | | | | | | |
Payment for shares redeemed | | | | | | | | | | | | | | | | |
Class A | | | (147,142 | ) | | | (4,340,290 | ) | | | (429,300 | ) | | | (11,917,248 | ) |
Class B | | | (18,604 | ) | | | (489,177 | ) | | | (92,082 | ) | | | (2,277,834 | ) |
Class C | | | (24,910 | ) | | | (647,869 | ) | | | (56,665 | ) | | | (1,367,347 | ) |
Administrator Class | | | (3,085,872 | ) | | | (78,598,137 | ) | | | (2,777,829 | ) | | | (69,226,884 | ) |
| | | | | | | | | | | | | | | | |
| | | | | | | (84,075,473 | ) | | | | | | | (84,789,313 | ) |
| | | | | | | | | | | | | | | | |
Net decrease in net assets resulting from capital share transactions | | | | | | | (70,048,627 | ) | | | | | | | (48,235,205 | ) |
| | | | | | | | | | | | | | | | |
Total decrease in net assets | | | | | | | (51,231,404 | ) | | | | | | | (66,996,469 | ) |
| | | | | | | | | | | | | | | | |
| | | | |
Net assets | | | | | | | | | | | | | | | | |
Beginning of period | | | | | | | 278,784,019 | | | | | | | | 345,780,488 | |
| | | | | | | | | | | | | | | | |
End of period | | | | | | $ | 227,552,615 | | | | | | | $ | 278,784,019 | |
| | | | | | | | | | | | | | | | |
Undistributed net investment income | | | | | | $ | 3,293,323 | | | | | | | $ | 1,677,408 | |
| | | | | | | | | | | | | | | | |
The accompanying notes are an integral part of these financial statements.
| | | | |
| 18 | | Wells Fargo Advantage Allocation Funds | | Statements of changes in net assets |
| | | | | | | | | | | | | | | | |
| | | Moderate Balanced Fund | |
| | | Six months ended November 30, 2012 (unaudited) | | | Year ended May 31, 2012 | |
| | | | |
Operations | | | | | | | | | | | | | | | | |
Net investment income | | | | | | $ | 1,387,768 | | | | | | | $ | 3,625,486 | |
Net realized gains on investments | | | | | | | 4,214,591 | | | | | | | | 1,000,535 | |
Net change in unrealized gains (losses) on investments | | | | | | | 4,486,732 | | | | | | | | (6,534,214 | ) |
| | | | | | | | | | | | | | | | |
Net increase (decrease) in net assets resulting from operations | | | | | | | 10,089,091 | | | | | | | | (1,908,193 | ) |
| | | | | | | | | | | | | | | | |
| | | | |
Distributions to shareholders from | | | | | | | | | | | | | | | | |
Net investment income | | | | | | | | | | | | | | | | |
Class A | | | | | | | 0 | | | | | | | | (298,350 | ) |
Class B | | | | | | | 0 | | | | | | | | (14,409 | ) |
Class C | | | | | | | 0 | | | | | | | | (65,722 | ) |
Administrator Class | | | | | | | 0 | | | | | | | | (5,867,825 | ) |
| | | | | | | | | | | | | | | | |
Total distributions to shareholders | | | | | | | 0 | | | | | | | | (6,246,306 | ) |
| | | | | | | | | | | | | | | | |
| | | | |
Capital share transactions | | | Shares | | | | | | | | Shares | | | | | |
Proceeds from shares sold | | | | | | | | | | | | | | | | |
Class A | | | 54,334 | | | | 1,069,982 | | | | 148,156 | | | | 2,821,610 | |
Class B | | | 3,037 | | | | 59,617 | | | | 15,027 | | | | 286,476 | |
Class C | | | 17,173 | | | | 334,859 | | | | 48,303 | | | | 904,849 | |
Administrator Class | | | 292,127 | | | | 5,809,968 | | | | 1,023,557 | | | | 19,512,929 | |
| | | | | | | | | | | | | | | | |
| | | | | | | 7,274,426 | | | | | | | | 23,525,864 | |
| | | | | | | | | | | | | | | | |
Reinvestment of distributions | | | | | | | | | | | | | | | | |
Class A | | | 0 | | | | 0 | | | | 16,021 | | | | 285,166 | |
Class B | | | 0 | | | | 0 | | | | 756 | | | | 13,518 | |
Class C | | | 0 | | | | 0 | | | | 3,054 | | | | 53,931 | |
Administrator Class | | | 0 | | | | 0 | | | | 317,421 | | | | 5,681,842 | |
| | | | | | | | | | | | | | | | |
| | | | | | | 0 | | | | | | | | 6,034,457 | |
| | | | | | | | | | | | | | | | |
Payment for shares redeemed | | | | | | | | | | | | | | | | |
Class A | | | (68,214 | ) | | | (1,330,692 | ) | | | (181,808 | ) | | | (3,450,859 | ) |
Class B | | | (9,316 | ) | | | (184,389 | ) | | | (28,981 | ) | | | (542,623 | ) |
Class C | | | (7,731 | ) | | | (150,991 | ) | | | (48,418 | ) | | | (909,830 | ) |
Administrator Class | | | (1,851,042 | ) | | | (35,491,083 | ) | | | (1,967,823 | ) | | | (37,322,420 | ) |
| | | | | | | | | | | | | | | | |
| | | | | | | (37,157,155 | ) | | | | | | | (42,225,732 | ) |
| | | | | | | | | | | | | | | | |
Net decrease in net assets resulting from capital share transactions | | | | | | | (29,882,729 | ) | | | | | | | (12,665,411 | ) |
| | | | | | | | | | | | | | | | |
Total decrease in net assets | | | | | | | (19,793,638 | ) | | | | | | | (20,819,910 | ) |
| | | | | | | | | | | | | | | | |
| | | | |
Net assets | | | | | | | | | | | | | | | | |
Beginning of period | | | | | | | 185,647,624 | | | | | | | | 206,467,534 | |
| | | | | | | | | | | | | | | | |
End of period | | | | | | $ | 165,853,986 | | | | | | | $ | 185,647,624 | |
| | | | | | | | | | | | | | | | |
Undistributed net investment income | | | | | | $ | 2,792,507 | | | | | | | $ | 1,404,739 | |
| | | | | | | | | | | | | | | | |
The accompanying notes are an integral part of these financial statements.
This page is intentionally left blank.
| | | | |
| 20 | | Wells Fargo Advantage Allocation Funds | | Financial highlights |
| | | | | | | | | | | | | | | | |
| | | | |
| | | Beginning
net asset
value per
share | | | Net
investment
income1 | | | Net realized
and unrealized
gains (losses)
on investments | | | Distributions
from net
investment
income | |
| | | | |
Conservative Allocation Fund | | | | | | | | | | | | | | | | |
Administrator Class | | | | | | | | | | | | | | | | |
June 1, 2012 to November 30, 2012 (unaudited) | | $ | 17.31 | | | | 0.17 | | | | 0.63 | | | | 0.00 | |
June 1, 2011 to May 31, 2012 | | $ | 17.17 | | | | 0.37 | | | | (0.01 | ) | | | (0.22 | ) |
October 1, 2010 to May 31, 20114 | | $ | 18.52 | | | | 0.29 | 5 | | | 0.95 | | | | (1.48 | ) |
October 1, 2009 to September 30, 2010 | | $ | 17.45 | | | | 1.15 | | | | 0.57 | | | | (0.65 | ) |
October 1, 2008 to September 30, 2009 | | $ | 17.77 | | | | 0.58 | | | | (0.05 | ) | | | (0.75 | ) |
October 1, 2007 to September 30, 2008 | | $ | 20.35 | | | | 0.73 | | | | (2.04 | ) | | | (0.72 | ) |
October 1, 2006 to September 30, 2007 | | $ | 19.74 | | | | 0.70 | | | | 0.84 | | | | (0.64 | ) |
| | | | |
Growth Balanced Fund | | | | | | | | | | | | | | | | |
Class A | | | | | | | | | | | | | | | | |
June 1, 2012 to November 30, 2012 (unaudited) | | $ | 27.77 | | | | 0.19 | | | | 2.14 | | | | 0.00 | |
June 1, 2011 to May 31, 2012 | | $ | 29.34 | | | | 0.39 | 5 | | | (1.73 | ) | | | (0.23 | ) |
October 1, 2010 to May 31, 20114 | | $ | 25.89 | | | | 0.23 | | | | 4.11 | | | | (0.89 | ) |
October 1, 2009 to September 30, 2010 | | $ | 24.12 | | | | 0.40 | 5 | | | 1.75 | | | | (0.38 | ) |
October 1, 2008 to September 30, 2009 | | $ | 25.63 | | | | 0.41 | 5 | | | (1.32 | ) | | | (0.52 | ) |
October 1, 2007 to September 30, 2008 | | $ | 36.21 | | | | 0.63 | 5 | | | (7.32 | ) | | | (0.63 | ) |
October 1, 2006 to September 30, 2007 | | $ | 33.51 | | | | 0.61 | | | | 4.40 | | | | (0.53 | ) |
Class B | | | | | | | | | | | | | | | | |
June 1, 2012 to November 30, 2012 (unaudited) | | $ | 24.80 | | | | 0.06 | 5 | | | 1.91 | | | | 0.00 | |
June 1, 2011 to May 31, 2012 | | $ | 26.17 | | | | 0.15 | 5 | | | (1.52 | ) | | | 0.00 | |
October 1, 2010 to May 31, 20114 | | $ | 23.07 | | | | 0.12 | 5 | | | 3.62 | | | | (0.64 | ) |
October 1, 2009 to September 30, 2010 | | $ | 21.46 | | | | 0.22 | 5 | | | 1.53 | | | | (0.14 | ) |
October 1, 2008 to September 30, 2009 | | $ | 22.70 | | | | 0.22 | 5 | | | (1.13 | ) | | | (0.25 | ) |
October 1, 2007 to September 30, 2008 | | $ | 32.51 | | | | 0.36 | 5 | | | (6.52 | ) | | | (0.39 | ) |
October 1, 2006 to September 30, 2007 | | $ | 30.29 | | | | 0.33 | | | | 3.95 | | | | (0.28 | ) |
Class C | | | | | | | | | | | | | | | | |
June 1, 2012 to November 30, 2012 (unaudited) | | $ | 24.52 | | | | 0.06 | 5 | | | 1.89 | | | | 0.00 | |
June 1, 2011 to May 31, 2012 | | $ | 25.94 | | | | 0.16 | 5 | | | (1.53 | ) | | | (0.05 | ) |
October 1, 2010 to May 31, 20114 | | $ | 22.93 | | | | 0.12 | 5 | | | 3.60 | | | | (0.71 | ) |
October 1, 2009 to September 30, 2010 | | $ | 21.42 | | | | 0.19 | 5 | | | 1.56 | | | | (0.24 | ) |
October 1, 2008 to September 30, 2009 | | $ | 22.77 | | | | 0.23 | 5 | | | (1.17 | ) | | | (0.33 | ) |
October 1, 2007 to September 30, 2008 | | $ | 32.60 | | | | 0.36 | 5 | | | (6.54 | ) | | | (0.39 | ) |
October 1, 2006 to September 30, 2007 | | $ | 30.37 | | | | 0.33 | | | | 3.97 | | | | (0.29 | ) |
Administrator Class | | | | | | | | | | | | | | | | |
June 1, 2012 to November 30, 2012 (unaudited) | | $ | 24.93 | | | | 0.41 | | | | 1.71 | | | | 0.00 | |
June 1, 2011 to May 31, 2012 | | $ | 26.39 | | | | 0.41 | 5 | | | (1.57 | ) | | | (0.30 | ) |
October 1, 2010 to May 31, 20114 | | $ | 23.39 | | | | 0.31 | 5 | | | 3.64 | | | | (0.95 | ) |
October 1, 2009 to September 30, 2010 | | $ | 21.81 | | | | 0.46 | 5 | | | 1.55 | | | | (0.43 | ) |
October 1, 2008 to September 30, 2009 | | $ | 23.29 | | | | 0.41 | 5 | | | (1.21 | ) | | | (0.60 | ) |
October 1, 2007 to September 30, 2008 | | $ | 33.29 | | | | 0.64 | 5 | | | (6.67 | ) | | | (0.71 | ) |
October 1, 2006 to September 30, 2007 | | $ | 30.98 | | | | 0.70 | | | | 3.99 | | | | (0.60 | ) |
Please see footnotes on page 22.
The accompanying notes are an integral part of these financial statements.
| | | | | | |
| Financial highlights | | Wells Fargo Advantage Allocation Funds | | | 21 | |
| | | | | | | | | | | | | | | | | | | | | | | | | | | | | | | | | | |
Distributions
from net
realized gains | | | Distributions
from tax basis
return of capital | | | Ending
net asset
value
per
share | | | Ratio to average net assets (annualized) | | | Total
return2 | | | Portfolio
turnover
rate3 | | | Net assets at
end of period
(000s omitted) | |
| | | | Net investment
income1 | | | Gross
expenses1 | | | Net
expenses1 | | | | |
| | | | | | | | |
| | | | | | | | | | | | | | | | | | | | | | | | | | | | | | | | | | | |
| | | | | | | | | | | | | | | | | | | | | | | | | | | | | | | | | | |
| | 0.00 | | | | 0.00 | | | $ | 18.11 | | | | 1.90 | % | | | 1.34 | % | | | 0.85 | % | | | 4.62 | % | | | 47 | % | | $ | 41,141 | |
| | 0.00 | | | | 0.00 | | | $ | 17.31 | | | | 2.18 | % | | | 1.28 | % | | | 0.85 | % | | | 2.17 | % | | | 124 | % | | $ | 38,798 | |
| | 0.00 | | | | (1.11 | ) | | $ | 17.17 | | | | 2.46 | % | | | 1.27 | % | | | 0.85 | % | | | 7.37 | % | | | 72 | % | | $ | 36,803 | |
| | 0.00 | | | | 0.00 | | | $ | 18.52 | | | | 1.44 | % | | | 1.13 | % | | | 0.85 | % | | | 10.12 | % | | | 112 | % | | $ | 39,740 | |
| | (0.10 | ) | | | 0.00 | | | $ | 17.45 | | | | 3.18 | % | | | 1.09 | % | | | 0.85 | % | | | 3.68 | % | | | 130 | % | | $ | 424,389 | |
| | (0.55 | ) | | | 0.00 | | | $ | 17.77 | | | | 3.80 | % | | | 1.06 | % | | | 0.85 | % | | | (6.85 | )% | | | 100 | % | | $ | 479,238 | |
| | (0.29 | ) | | | 0.00 | | | $ | 20.35 | | | | 3.75 | % | | | 1.05 | % | | | 0.85 | % | | | 8.05 | % | | | 91 | % | | $ | 615,216 | |
| | | | | | | | |
| | | | | | | | | | | | | | | | | | | | | | | | | | | | | | | | | | | |
| | | | | | | | | | | | | | | | | | | | | | | | | | | | | | | | | | |
| | 0.00 | | | | 0.00 | | | $ | 30.10 | | | | 1.19 | % | | | 1.38 | % | | | 1.20 | % | | | 8.39 | % | | | 38 | % | | $ | 54,395 | |
| | 0.00 | | | | 0.00 | | | $ | 27.77 | | | | 1.40 | % | | | 1.36 | % | | | 1.20 | % | | | (4.53 | )% | | | 107 | % | | $ | 49,403 | |
| | 0.00 | | | | 0.00 | | | $ | 29.34 | | | | 1.43 | % | | | 1.35 | % | | | 1.20 | % | | | 17.02 | % | | | 70 | % | | $ | 60,055 | |
| | 0.00 | | | | 0.00 | | | $ | 25.89 | | | | 1.61 | % | | | 1.38 | % | | | 1.20 | % | | | 9.00 | % | | | 94 | % | | $ | 55,284 | |
| | (0.08 | ) | | | 0.00 | | | $ | 24.12 | | | | 1.95 | % | | | 1.32 | % | | | 1.20 | % | | | (2.95 | )% | | | 105 | % | | $ | 55,318 | |
| | (3.26 | ) | | | 0.00 | | | $ | 25.63 | | | | 2.09 | % | | | 1.34 | % | | | 1.20 | % | | | (20.42 | )% | | | 80 | % | | $ | 55,626 | |
| | (1.78 | ) | | | 0.00 | | | $ | 36.21 | | | | 1.89 | % | | | 1.32 | % | | | 1.20 | % | | | 15.55 | % | | | 75 | % | | $ | 79,411 | |
| | | | | | | | | | | | | | | | | | | | | | | | | | | | | | | | | | |
| | 0.00 | | | | 0.00 | | | $ | 26.77 | | | | 0.42 | % | | | 2.11 | % | | | 1.95 | % | | | 7.94 | % | | | 38 | % | | $ | 1,360 | |
| | 0.00 | | | | 0.00 | | | $ | 24.80 | | | | 0.61 | % | | | 2.10 | % | | | 1.95 | % | | | (5.23 | )% | | | 107 | % | | $ | 1,704 | |
| | 0.00 | | | | 0.00 | | | $ | 26.17 | | | | 0.62 | % | | | 2.09 | % | | | 1.95 | % | | | 16.43 | % | | | 70 | % | | $ | 4,163 | |
| | 0.00 | | | | 0.00 | | | $ | 23.07 | | | | 0.96 | % | | | 2.12 | % | | | 1.95 | % | | | 8.19 | % | | | 94 | % | | $ | 6,924 | |
| | (0.08 | ) | | | 0.00 | | | $ | 21.46 | | | | 1.21 | % | | | 2.08 | % | | | 1.95 | % | | | (3.66 | )% | | | 105 | % | | $ | 13,869 | |
| | (3.26 | ) | | | 0.00 | | | $ | 22.70 | | | | 1.31 | % | | | 2.09 | % | | | 1.95 | % | | | (21.02 | )% | | | 80 | % | | $ | 31,892 | |
| | (1.78 | ) | | | 0.00 | | | $ | 32.51 | | | | 1.12 | % | | | 2.06 | % | | | 1.95 | % | | | 14.69 | % | | | 75 | % | | $ | 66,097 | |
| | | | | | | | | | | | | | | | | | | | | | | | | | | | | | | | | | |
| | 0.00 | | | | 0.00 | | | $ | 26.47 | | | | 0.44 | % | | | 2.13 | % | | | 1.95 | % | | | 7.95 | % | | | 38 | % | | $ | 8,152 | |
| | 0.00 | | | | 0.00 | | | $ | 24.52 | | | | 0.65 | % | | | 2.11 | % | | | 1.95 | % | | | (5.26 | )% | | | 107 | % | | $ | 7,656 | |
| | 0.00 | | | | 0.00 | | | $ | 25.94 | | | | 0.68 | % | | | 2.10 | % | | | 1.95 | % | | | 16.45 | % | | | 70 | % | | $ | 8,388 | |
| | 0.00 | | | | 0.00 | | | $ | 22.93 | | | | 0.84 | % | | | 2.12 | % | | | 1.95 | % | | | 8.20 | % | | | 94 | % | | $ | 7,665 | |
| | (0.08 | ) | | | 0.00 | | | $ | 21.42 | | | | 1.21 | % | | | 2.06 | % | | | 1.95 | % | | | (3.69 | )% | | | 105 | % | | $ | 7,738 | |
| | (3.26 | ) | | | 0.00 | | | $ | 22.77 | | | | 1.33 | % | | | 2.08 | % | | | 1.95 | % | | | (21.02 | )% | | | 80 | % | | $ | 9,588 | |
| | (1.78 | ) | | | 0.00 | | | $ | 32.60 | | | | 1.12 | % | | | 2.06 | % | | | 1.95 | % | | | 14.72 | % | | | 75 | % | | $ | 15,226 | |
| | | | | | | | | | | | | | | | | | | | | | | | | | | | | | | | | | |
| | 0.00 | | | | 0.00 | | | $ | 27.05 | | | | 1.43 | % | | | 1.22 | % | | | 0.95 | % | | | 8.50 | % | | | 38 | % | | $ | 163,645 | |
| | 0.00 | | | | 0.00 | | | $ | 24.93 | | | | 1.64 | % | | | 1.20 | % | | | 0.95 | % | | | (4.30 | )% | | | 107 | % | | $ | 220,021 | |
| | 0.00 | | | | 0.00 | | | $ | 26.39 | | | | 1.66 | % | | | 1.19 | % | | | 0.95 | % | | | 17.19 | % | | | 70 | % | | $ | 273,174 | |
| | 0.00 | | | | 0.00 | | | $ | 23.39 | | | | 2.04 | % | | | 1.19 | % | | | 0.95 | % | | | 9.32 | % | | | 94 | % | | $ | 287,073 | |
| | (0.08 | ) | | | 0.00 | | | $ | 21.81 | | | | 2.18 | % | | | 1.14 | % | | | 0.95 | % | | | (2.68 | )% | | | 105 | % | | $ | 861,399 | |
| | (3.26 | ) | | | 0.00 | | | $ | 23.29 | | | | 2.32 | % | | | 1.16 | % | | | 0.95 | % | | | (20.25 | )% | | | 80 | % | | $ | 1,161,210 | |
| | (1.78 | ) | | | 0.00 | | | $ | 33.29 | | | | 2.12 | % | | | 1.14 | % | | | 0.95 | % | | | 15.84 | % | | | 75 | % | | $ | 1,804,249 | |
Please see footnotes on page 22.
The accompanying notes are an integral part of these financial statements.
| | | | |
| 22 | | Wells Fargo Advantage Allocation Funds | | Financial highlights |
| | | | | | | | | | | | | | | | |
| | | | |
| | | Beginning
net asset
value per
share | | | Net
investment
income1 | | | Net realized
and unrealized
gains (losses)
on investments | | | Distributions
from net
investment
income | |
| | | | |
Moderate Balanced Fund | | | | | | | | | | | | | | | | |
Class A | | | | | | | | | | | | | | | | |
June 1, 2012 to November 30, 2012 (unaudited) | | $ | 18.84 | | | | 0.12 | | | | 1.07 | | | | 0.00 | |
June 1, 2011 to May 31, 2012 | | $ | 19.64 | | | | 0.32 | | | | (0.54 | ) | | | (0.58 | ) |
October 1, 2010 to May 31, 20114 | | $ | 17.97 | | | | 0.28 | | | | 1.80 | | | | (0.41 | ) |
October 1, 2009 to September 30, 2010 | | $ | 17.12 | | | | 0.38 | 5 | | | 1.03 | | | | (0.56 | ) |
October 1, 2008 to September 30, 2009 | | $ | 17.85 | | | | 0.38 | | | | (0.36 | ) | | | (0.57 | ) |
October 1, 2007 to September 30, 2008 | | $ | 22.76 | | | | 0.55 | | | | (3.34 | ) | | | (0.61 | ) |
October 1, 2006 to September 30, 2007 | | $ | 21.97 | | | | 0.65 | 5 | | | 1.73 | | | | (0.61 | ) |
Class B | | | | | | | | | | | | | | | | |
June 1, 2012 to November 30, 2012 (unaudited) | | $ | 18.86 | | | | 0.07 | 5 | | | 1.04 | | | | 0.00 | |
June 1, 2011 to May 31, 2012 | | $ | 19.58 | | | | 0.18 | 5 | | | (0.53 | ) | | | (0.37 | ) |
October 1, 2010 to May 31, 20114 | | $ | 17.85 | | | | 0.14 | 5 | | | 1.84 | | | | (0.25 | ) |
October 1, 2009 to September 30, 2010 | | $ | 16.99 | | | | 0.30 | | | | 0.97 | | | | (0.41 | ) |
October 1, 2008 to September 30, 2009 | | $ | 17.67 | | | | 0.26 | 5 | | | (0.34 | ) | | | (0.42 | ) |
October 1, 2007 to September 30, 2008 | | $ | 22.53 | | | | 0.42 | | | | (3.34 | ) | | | (0.43 | ) |
October 1, 2006 to September 30, 2007 | | $ | 21.76 | | | | 0.47 | 5 | | | 1.72 | | | | (0.44 | ) |
Class C | | | | | | | | | | | | | | | | |
June 1, 2012 to November 30, 2012 (unaudited) | | $ | 18.63 | | | | 0.07 | | | | 1.02 | | | | 0.00 | |
June 1, 2011 to May 31, 2012 | | $ | 19.45 | | | | 0.18 | 5 | | | (0.53 | ) | | | (0.47 | ) |
October 1, 2010 to May 31, 20114 | | $ | 17.77 | | | | 0.14 | 5 | | | 1.83 | | | | (0.29 | ) |
October 1, 2009 to September 30, 2010 | | $ | 16.96 | | | | 0.28 | 5 | | | 0.99 | | | | (0.46 | ) |
October 1, 2008 to September 30, 2009 | | $ | 17.64 | | | | 0.26 | 5 | | | (0.34 | ) | | | (0.42 | ) |
October 1, 2007 to September 30, 2008 | | $ | 22.52 | | | | 0.41 | | | | (3.33 | ) | | | (0.45 | ) |
October 1, 2006 to September 30, 2007 | | $ | 21.77 | | | | 0.47 | 5 | | | 1.72 | | | | (0.46 | ) |
Administrator Class | | | | | | | | | | | | | | | | |
June 1, 2012 to November 30, 2012 (unaudited) | | $ | 18.96 | | | | 0.22 | | | | 1.00 | | | | 0.00 | |
June 1, 2011 to May 31, 2012 | | $ | 19.77 | | | | 0.40 | | | | (0.58 | ) | | | (0.63 | ) |
October 1, 2010 to May 31, 20114 | | $ | 18.11 | | | | 0.29 | | | | 1.83 | | | | (0.46 | ) |
October 1, 2009 to September 30, 2010 | | $ | 17.23 | | | | 0.52 | 5 | | | 0.95 | | | | (0.59 | ) |
October 1, 2008 to September 30, 2009 | | $ | 17.98 | | | | 0.42 | 5 | | | (0.37 | ) | | | (0.62 | ) |
October 1, 2007 to September 30, 2008 | | $ | 22.90 | | | | 0.60 | | | | (3.36 | ) | | | (0.65 | ) |
October 1, 2006 to September 30, 2007 | | $ | 22.08 | | | | 0.67 | 5 | | | 1.77 | | | | (0.64 | ) |
| 1. | Includes net expenses allocated from the Master Portfolios in which the Fund invests. |
| 2. | Total return calculations do not include any sales charges. Returns for periods of less than one year are not annualized. |
| 3. | Portfolio turnover rate is calculated by aggregating the results of multiplying the Fund’s investment percentage in the respective Master Portfolio by the corresponding Master Portfolio’s portfolio turnover rate. |
| 4. | For the eight months ended May 31, 2011. The Fund changed its fiscal year end from September 30 to May 31, effective May 31, 2011. |
| 5. | Calculated based upon average shares outstanding |
The accompanying notes are an integral part of these financial statements.
| | | | | | |
| Financial highlights | | Wells Fargo Advantage Allocation Funds | | | 23 | |
| | | | | | | | | | | | | | | | | | | | | | | | | | | | | | |
Distributions
from net
realized gains | | | Ending
net asset
value
per
share | | | Ratio to average net assets (annualized) | | | Total
return2 | | | Portfolio
turnover
rate3 | | | Net assets at
end of period
(000s omitted) | |
| | | Net investment
income1 | | | Gross
expenses1 | | | Net
expenses1 | | | | |
| | | | | | | |
| | | | | | | | | | | | | | | | | | | | | | | | | | | | | | | |
| | | | | | | | | | | | | | | | | | | | | | | | | | | | | | |
| | 0.00 | | | $ | 20.03 | | | | 1.43 | % | | | 1.35 | % | | | 1.15 | % | | | 6.32 | % | | | 42 | % | | $ | 10,281 | |
| | 0.00 | | | $ | 18.84 | | | | 1.68 | % | | | 1.33 | % | | | 1.15 | % | | | (0.93 | )% | | | 115 | % | | $ | 9,935 | |
| | 0.00 | | | $ | 19.64 | | | | 1.89 | % | | | 1.34 | % | | | 1.15 | % | | | 11.72 | % | | | 70 | % | | $ | 10,702 | |
| | 0.00 | | | $ | 17.97 | | | | 2.42 | % | | | 1.37 | % | | | 1.15 | % | | | 8.41 | % | | | 103 | % | | $ | 7,992 | |
| | (0.18 | ) | | $ | 17.12 | | | | 2.47 | % | | | 1.31 | % | | | 1.15 | % | | | 0.94 | % | | | 116 | % | | $ | 8,669 | |
| | (1.51 | ) | | $ | 17.85 | | | | 2.88 | % | | | 1.31 | % | | | 1.15 | % | | | (13.39 | )% | | | 89 | % | | $ | 8,524 | |
| | (0.98 | ) | | $ | 22.76 | | | | 2.80 | % | | | 1.28 | % | | | 1.15 | % | | | 11.33 | % | | | 82 | % | | $ | 9,839 | |
| | | | | | | | | | | | | | | | | | | | | | | | | | | | | | |
| | 0.00 | | | $ | 19.97 | | | | 0.67 | % | | | 2.10 | % | | | 1.90 | % | | | 5.89 | % | | | 42 | % | | $ | 729 | |
| | 0.00 | | | $ | 18.86 | | | | 0.94 | % | | | 2.08 | % | | | 1.90 | % | | | (1.66 | )% | | | 115 | % | | $ | 807 | |
| | 0.00 | | | $ | 19.58 | | | | 1.11 | % | | | 2.09 | % | | | 1.90 | % | | | 11.16 | % | | | 70 | % | | $ | 1,097 | |
| | 0.00 | | | $ | 17.85 | | | | 1.65 | % | | | 2.12 | % | | | 1.90 | % | | | 7.58 | % | | | 103 | % | | $ | 1,257 | |
| | (0.18 | ) | | $ | 16.99 | | | | 1.72 | % | | | 2.06 | % | | | 1.90 | % | | | 0.19 | % | | | 116 | % | | $ | 1,720 | |
| | (1.51 | ) | | $ | 17.67 | | | | 2.13 | % | | | 2.06 | % | | | 1.90 | % | | | (14.06 | )% | | | 89 | % | | $ | 2,177 | |
| | (0.98 | ) | | $ | 22.53 | | | | 2.01 | % | | | 2.03 | % | | | 1.90 | % | | | 10.49 | % | | | 82 | % | | $ | 3,699 | |
| | | | | | | | | | | | | | | | | | | | | | | | | | | | | | |
| | 0.00 | | | $ | 19.72 | | | | 0.69 | % | | | 2.10 | % | | | 1.90 | % | | | 5.85 | % | | | 42 | % | | $ | 2,641 | |
| | 0.00 | | | $ | 18.63 | | | | 0.92 | % | | | 2.08 | % | | | 1.90 | % | | | (1.67 | )% | | | 115 | % | | $ | 2,319 | |
| | 0.00 | | | $ | 19.45 | | | | 1.16 | % | | | 2.09 | % | | | 1.90 | % | | | 11.17 | % | | | 70 | % | | $ | 2,364 | |
| | 0.00 | | | $ | 17.77 | | | | 1.59 | % | | | 2.12 | % | | | 1.90 | % | | | 7.58 | % | | | 103 | % | | $ | 1,726 | |
| | (0.18 | ) | | $ | 16.96 | | | | 1.72 | % | | | 2.05 | % | | | 1.90 | % | | | 0.21 | % | | | 116 | % | | $ | 1,445 | |
| | (1.51 | ) | | $ | 17.64 | | | | 2.13 | % | | | 2.05 | % | | | 1.90 | % | | | (14.05 | )% | | | 89 | % | | $ | 1,677 | |
| | (0.98 | ) | | $ | 22.52 | | | | 2.03 | % | | | 2.03 | % | | | 1.90 | % | | | 10.49 | % | | | 82 | % | | $ | 2,034 | |
| | | | | | | | | | | | | | | | | | | | | | | | | | | | | | |
| | 0.00 | | | $ | 20.18 | | | | 1.68 | % | | | 1.19 | % | | | 0.90 | % | | | 6.38 | % | | | 42 | % | | $ | 152,202 | |
| | 0.00 | | | $ | 18.96 | | | | 1.92 | % | | | 1.17 | % | | | 0.90 | % | | | (0.66 | )% | | | 115 | % | | $ | 172,587 | |
| | 0.00 | | | $ | 19.77 | | | | 2.14 | % | | | 1.18 | % | | | 0.90 | % | | | 11.93 | % | | | 70 | % | | $ | 192,305 | |
| | 0.00 | | | $ | 18.11 | | | | 3.06 | % | | | 1.18 | % | | | 0.90 | % | | | 8.65 | % | | | 103 | % | | $ | 176,179 | |
| | (0.18 | ) | | $ | 17.23 | | | | 2.72 | % | | | 1.13 | % | | | 0.90 | % | | | 1.14 | % | | | 116 | % | | $ | 330,340 | |
| | (1.51 | ) | | $ | 17.98 | | | | 3.13 | % | | | 1.13 | % | | | 0.90 | % | | | (13.17 | )% | | | 89 | % | | $ | 407,829 | |
| | (0.98 | ) | | $ | 22.90 | | | | 3.00 | % | | | 1.10 | % | | | 0.90 | % | | | 11.59 | % | | | 82 | % | | $ | 533,729 | |
The accompanying notes are an integral part of these financial statements.
| | | | |
| 24 | | Wells Fargo Advantage Allocation Funds | | Notes to financial statements (unaudited) |
1. ORGANIZATION
Wells Fargo Funds Trust (the “Trust”), a Delaware statutory trust organized on March 10, 1999, is an open-end management investment company registered under the Investment Company Act of 1940, as amended (the “1940 Act”). These financial statements report on the following funds: Wells Fargo Advantage Conservative Allocation Fund (“Conservative Allocation Fund”), Wells Fargo Advantage Growth Balanced Fund (“Growth Balanced Fund”), and Wells Fargo Advantage Moderate Balanced Fund (“Moderate Balanced Fund”) (each, a “Fund”, collectively, the “Funds”). Each Fund is a diversified series of the Trust.
The Funds each seek to achieve their investment objective by investing all investable assets in one or more separate diversified portfolios (each, a “Master Portfolio”, collectively, the “Master Portfolios”) of Wells Fargo Master Trust, a registered open-end management investment company. Each Master Portfolio directly acquires portfolio securities, and a Fund investing in a Master Portfolio acquires an indirect interest in those securities. Each Fund accounts for its investment in the Master Portfolios as partnership investments and records daily its share of the Master Portfolio’s income, expense and realized and unrealized gains and losses. The financial statements of the Master Portfolios for the six months ended November 30, 2012 are included in this report and should be read in conjunction with each Fund’s financial statements. As of November 30, 2012, the Funds own the following percentages of the Master Portfolios:
| | | | | | | | | | | | |
| | | Conservative
Allocation
Fund | | | Growth
Balanced
Fund | | | Moderate
Balanced
Fund | |
Wells Fargo Advantage C&B Large Cap Value Portfolio | | | 0 | %* | | | 4 | % | | | 2 | % |
Wells Fargo Advantage Core Bond Portfolio | | | 0 | * | | | 0 | * | | | 0 | * |
Wells Fargo Advantage Diversified Large Cap Growth Portfolio | | | 1 | | | | 25 | | | | 11 | |
Wells Fargo Advantage Emerging Growth Portfolio | | | 0 | * | | | 0 | * | | | 0 | * |
Wells Fargo Advantage Equity Value Portfolio | | | 0 | * | | | 1 | | | | 1 | |
Wells Fargo Advantage Index Portfolio | | | 0 | * | | | 1 | | | | 1 | |
Wells Fargo Advantage Inflation-Protected Bond Portfolio | | | 3 | | | | 10 | | | | 9 | |
Wells Fargo Advantage International Equity Portfolio | | | 1 | | | | 25 | | | | 11 | |
Wells Fargo Advantage International Growth Portfolio | | | 0 | * | | | 5 | | | | 2 | |
Wells Fargo Advantage International Index Portfolio | | | 1 | | | | 25 | | | | 11 | |
Wells Fargo Advantage International Value Portfolio | | | 0 | * | | | 2 | | | | 1 | |
Wells Fargo Advantage Large Company Value Portfolio | | | 1 | | | | 25 | | | | 11 | |
Wells Fargo Advantage Managed Fixed Income Portfolio | | | 13 | | | | 45 | | | | 43 | |
Wells Fargo Advantage Small Cap Value Portfolio | | | 1 | | | | 22 | | | | 10 | |
Wells Fargo Advantage Small Company Growth Portfolio | | | 0 | * | | | 3 | | | | 1 | |
Wells Fargo Advantage Small Company Value Portfolio | | | 0 | * | | | 2 | | | | 1 | |
Wells Fargo Advantage Stable Income Portfolio | | | 29 | | | | N/A | | | | 71 | |
| * | The amount invested is less than 1%. |
2. SIGNIFICANT ACCOUNTING POLICIES
The following significant accounting policies, which are consistently followed in the preparation of the financial statements of each Fund, are in conformity with U.S. generally accepted accounting principles which require management to make estimates and assumptions that affect the reported amounts of assets and liabilities, disclosure of contingent assets and liabilities at the date of the financial statements, and the reported amounts of revenues and expenses during the reporting period. Actual results could differ from those estimates.
Securities valuation
All investments are valued each business day as of the close of regular trading on the New York Stock Exchange (normally 4 p.m. Eastern Time).
Investments in the Master Portfolios are valued daily based on each Fund’s proportionate share of each Master Portfolio’s net assets, which are also valued daily. Securities held in the Master Portfolios are valued as discussed in the Notes to Financial Statements of the Master Portfolios, which are included elsewhere in this report.
| | | | | | |
| Notes to financial statements (unaudited) | | Wells Fargo Advantage Allocation Funds | | | 25 | |
Debt securities of sufficient credit quality acquired with maturities of 60 days or less generally are valued at amortized cost which approximates fair value. The amortized cost method involves valuing a security at its cost, plus accretion of discount or minus amortization of premium over the period until maturity.
Investments which are not valued using any of the methods discussed above are valued at their fair value, as determined by procedures established in good faith and approved by the Board of Trustees. The Board of Trustees has established a Valuation Committee comprised of the Trustees and has delegated to it the authority to take any actions regarding the valuation of portfolio securities that the Valuation Committee deems necessary or appropriate, including determining the fair value of portfolio securities, unless the determination has been delegated to the Management Valuation Team of Wells Fargo Funds Management, LLC (“Funds Management”). The Board of Trustees retains the authority to make or ratify any valuation decisions or approve any changes to the Valuation Procedures as it deems appropriate. On a quarterly basis, the Board of Trustees receives reports on any valuation actions taken by the Valuation Committee or the Management Valuation Team which may include items for ratification.
Valuations of fair valued securities are compared to the next actual sales price when available, or other appropriate market information to assess the continued appropriateness of the fair valuation methodology used. These securities are fair valued on a day-to-day basis, taking into consideration changes to appropriate market information and any significant changes to the input factors considered in the valuation process until there is a readily available price provided on the exchange or by an independent pricing service. Valuations received from an independent pricing service or broker quotes are periodically validated by comparisons to most recent trades and valuations provided by other independent pricing services in addition to the review of prices by the adviser and/or subadviser. Unobservable inputs used in determining fair valuations are identified based on the type of security, taking into consideration factors utilized by market participants in valuing the investment, knowledge about the issuer and the current market environment.
Futures contracts
Each Fund may be subject to interest rate risk and equity price risk in the normal course of pursuing its investment objectives. The Fund may buy and sell futures contracts in order to gain exposure to, or protect against, changes in security values and interest rates. The primary risks associated with the use of futures contracts are the imperfect correlation between changes in market values of securities held by the Fund and the prices of futures contracts, and the possibility of an illiquid market.
Futures contracts are valued based upon their quoted daily settlement prices when available. The aggregate principal amounts of the contracts are not recorded in the financial statements. Fluctuations in the value of the contracts are recorded in the Statements of Assets and Liabilities as an asset or liability and in the Statements of Operations as unrealized gains or losses until the contracts are closed, at which point they are recorded as net realized gains or losses on futures contracts. With futures contracts, there is minimal counterparty risk to the Fund since futures are exchange traded and the exchange’s clearinghouse, as counterparty to all exchange traded futures, guarantees the futures against default.
Security transactions and income recognition
Securities transactions are recorded on a trade date basis by the Fund and each Master Portfolio. Realized gains or losses are recorded on the basis of identified cost by the Fund and each Master Portfolio.
Interest income is accrued daily and bond discounts are accreted and premiums are amortized daily based on the effective interest method by the Fund and each Master Portfolio. To the extent debt obligations are placed on non-accrual status, any related interest income may be reduced by writing off interest receivables when the collection of all or a portion of interest has become doubtful based on consistently applied procedures. If the issuer subsequently resumes interest payments or when the collectability of interest is reasonably assured, the debt obligation is removed from non-accrual status.
Dividend income in each Master Portfolio is recognized on the ex-dividend date, except for certain dividends from foreign securities, which are recorded as soon as the Master Portfolio is informed of the ex-dividend date.
Dividend and interest income from foreign securities in each Master Portfolio is recorded net of foreign taxes withheld where recovery of such taxes is not assured.
| | | | |
| 26 | | Wells Fargo Advantage Allocation Funds | | Notes to financial statements (unaudited) |
Each Fund records on a daily basis its proportionate share of each Master Portfolio’s interest and dividend income, in addition to expenses, waivers, and realized and unrealized gains or losses.
Distributions to shareholders
Distributions to shareholders from net investment income and net realized gains, if any, are recorded on the ex-dividend date. Such distributions are determined in conformity with federal income tax regulations, which may differ in amount or character from net investment income and realized gains recognized for purposes of U.S. generally accepted accounting principles.
Federal and other taxes
Each Fund is treated as a separate entity for federal income tax purposes. Each Fund intends to continue to qualify as a regulated investment company by distributing substantially all of its investment company taxable income and any net realized capital gains (after reduction for capital loss carryforwards) sufficient to relieve it from all, or substantially all, federal income taxes. Accordingly, no provision for federal income taxes was required.
Each Fund’s income and federal excise tax returns and all financial records supporting those returns for the prior three fiscal years are subject to examination by the federal and Delaware revenue authorities. Management has analyzed each Fund’s tax positions taken on federal, state, and foreign tax returns for all open tax years and does not believe that there are any uncertain tax positions that require recognition of a tax liability.
At May 31, 2012, net capital loss carryforwards, which are available to offset future net realized capital gains, were as follows:
| | | | | | | | | | | | | | | | | | | | | | | | | | |
| | | Pre-enactment capital loss expiration* | | | | | Post-enactment capital losses** | |
| | | 2016 | | | 2017 | | | 2018 | | | 2019 | | | | | Short-term | | | Long-term | |
Conservative Allocation Fund | | $ | 0 | | | $ | 14,978,984 | | | $ | 6,065,292 | | | $ | 3,688,341 | | | | | $ | 0 | | | $ | 0 | |
Growth Balanced Fund | | | 18,749,350 | | | | 88,381,433 | | | | 82,578,227 | | | | 0 | | | | | | 5,465,588 | | | | 1,656,889 | |
Moderate Balanced Fund | | | 0 | | | | 8,053,054 | | | | 9,979,052 | | | | 0 | | | | | | 355,374 | | | | 0 | |
| * | Losses incured in taxable years beginning before December 22, 2010. |
| ** | Losses incured in taxable years which began after December 22, 2010 are carried forwad for an unlimited period. |
Class allocations
The separate classes of shares offered by each Fund differ principally in applicable sales charges, distribution, shareholder servicing, and administration fees. Shareholders of each class bear certain expenses that pertain to that particular class. All shareholders bear the common expenses of a Fund, earn income from the portfolio, and are allocated unrealized gains and losses pro rata based on the average daily net assets of each class, without distinction between share classes. Dividends are determined separately for each class based on income and expenses allocable to each class. Realized gains and losses are allocated to each class pro rata based upon the net assets of each class on the date realized. Differences in per share dividend rates generally result from the relative weightings of pro rata income and realized gain allocations and from differences in separate class expenses, including distribution, shareholder servicing, and administration fees.
3. FAIR VALUATION MEASUREMENTS
Fair value measurements of investments are determined within a framework that has established a fair value hierarchy based upon the various data inputs utilized in determining the value of each Fund’s investments. The three-level hierarchy gives the highest priority to unadjusted quoted prices in active markets for identical assets or liabilities (Level 1) and the lowest priority to significant unobservable inputs (Level 3). Each Fund’s investments are classified within the fair value hierarchy based on the lowest level of input that is significant to the fair value measurement. The inputs are summarized into three broad levels as follows:
| n | | Level 1 – quoted prices in active markets for identical securities |
| n | | Level 2 – other significant observable inputs (including quoted prices for similar securities, interest rates, prepayment speeds, credit risk, etc.) |
| n | | Level 3 – significant unobservable inputs (including the Fund’s own assumptions in determining the fair value of investments) |
The inputs or methodologies used for valuing investments in securities are not necessarily an indication of the risk associated with investing in those securities.
| | | | | | |
| Notes to financial statements (unaudited) | | Wells Fargo Advantage Allocation Funds | | | 27 | |
As of May 31, 2012, the inputs used in valuing investments in securities, which are carried at fair value, were as follows:
| | | | | | | | | | | | | | | | |
| Investments in securities | | Quoted prices
(Level 1) | | | Significant other
observable inputs
(Level 2) | | | Significant unobservable inputs
(Level 3) | | | Total | |
Conservative Allocation Fund | | | | | | | | | | | | | | | | |
| | | | |
Equity securities | | | | | | | | | | | | | | | | |
Investment companies | | $ | 0 | | | $ | 40,984,530 | | | $ | 0 | | | $ | 40,984,530 | |
| | | | |
Other | | | 0 | | | | 0 | | | | 7,197 | | | | 7,197 | |
| | | | |
Short-term investments | | | | | | | | | | | | | | | | |
U.S. Treasury securities | | | 164,988 | | | | 0 | | | | 0 | | | | 164,988 | |
| | | $ | 164,988 | | | $ | 40,984,530 | | | $ | 7,197 | | | $ | 41,156,715 | |
Growth Balanced Fund | | | | | | | | | | | | | | | | |
| | | | |
Equity securities | | | | | | | | | | | | | | | | |
Investment companies | | $ | 0 | | | $ | 223,418,659 | | | $ | 0 | | | $ | 223,418,659 | |
| | | | |
Other | | | 0 | | | | 0 | | | | 74,587 | | | | 74,587 | |
| | | | |
Short-term investments | | | | | | | | | | | | | | | | |
U.S. Treasury securities | | | 4,324,684 | | | | 0 | | | | 0 | | | | 4,324,684 | |
| | | $ | 4,324,684 | | | $ | 223,418,659 | | | $ | 74,587 | | | $ | 227,817,930 | |
Moderate Balanced Fund | | | | | | | | | | | | | | | | |
| | | | |
Equity securities | | | | | | | | | | | | | | | | |
Investment companies | | $ | 0 | | | $ | 164,669,631 | | | $ | 0 | | | $ | 164,669,631 | |
| | | | |
Other | | | 0 | | | | 0 | | | | 13,543 | | | | 13,543 | |
| | | | |
Short-term investments | | | | | | | | | | | | | | | | |
U.S. Treasury securities | | | 1,739,873 | | | | 0 | | | | 0 | | | | 1,739,873 | |
| | | $ | 1,739,873 | | | $ | 164,669,631 | | | $ | 13,543 | | | $ | 166,423,047 | |
Further details on the major security types listed above can be found in each Fund’s Portfolio of Investments.
As of November 30, 2012, the inputs used in valuing the Fund’s other financial instruments, which are carried at fair value, were as follows:
| | | | | | | | | | | | | | | | |
| Futures contracts+ | | Quoted prices
(Level 1) | | | Significant other
observable inputs
(Level 2) | | | Significant
unobservable inputs
(Level 3) | | | Total | |
Conservative Allocation Fund | | $ | (14,682 | ) | | $ | 0 | | | $ | 0 | | | $ | (14,682 | ) |
Growth Balanced Fund | | $ | (556,645 | ) | | $ | 0 | | | $ | 0 | | | $ | (556,645 | ) |
Moderate Balanced Fund | | $ | (270,009 | ) | | $ | 0 | | | $ | 0 | | | $ | (270,009 | ) |
| + | Futures contracts are presented at the unrealized gains or losses on the instruments. |
Transfers in and transfers out are recognized at the end of the reporting period. For the six months ended November 30, 2012, the Funds did not have any transfers into/out of Level 1 or Level 2.
4. TRANSACTIONS WITH AFFILIATES AND OTHER EXPENSES
Advisory fees
The Trust has entered into an advisory contract with Funds Management, an indirect wholly owned subsidiary of Wells Fargo & Company (“Wells Fargo”). The adviser is responsible for implementing investment policies and guidelines and for supervising the subadvisor who is responsible for day-to-day portfolio management of the Funds.
Funds Management is entitled to receive an annual advisory fee starting at 0.25% and declining to 0.19% as the average daily net assets of each Fund increases. Prior to October 1, 2012, Funds Management received an annual advisory fee of 0.25% of each Fund’s average daily net assets. For the six months ended November 30, 2012, the advisory fee was equivalent to an annual rate of 0.25% of each Fund’s average daily net assets.
| | | | |
| 28 | | Wells Fargo Advantage Allocation Funds | | Notes to financial statements (unaudited) |
Funds Management has retained the services of a subadviser to provide daily portfolio management to the Funds. The fee for subadvisory services is borne by Funds Management. Wells Capital Management Incorporated, an affiliate of Funds Management, is the subadviser to each Fund and is entitled to receive a fee from Funds Management at an annual rate starting at 0.10% and declining to 0.05% as the average daily net assets of each Fund increase.
Funds Management also serves as the adviser to each Master Portfolio and is entitled to receive a fee from each Master Portfolio for those services.
Administration and transfer agent fees
The Trust has entered into an administration agreement with Funds Management. Under this agreement, for providing administrative services, which includes paying fees and expenses for services provided by the transfer agent, sub-transfer agents, omnibus account servicers and record-keepers, Funds Management is entitled to receive from each Fund an annual fund level administration fee starting at 0.05% and declining to 0.03% as the average daily net assets of each Fund increase and a class level administration fee which is calculated based on the average daily net assets of each class as follows:
| | | | |
| | | Class level administration fee | |
Class A, Class B, Class C | | | 0.26 | % |
Administrator Class | | | 0.10 | |
Funds Management has contractually waived and/or reimbursed advisory and administration fees to the extent necessary to maintain certain net operating expense ratios for the Funds. Waiver of fees and/or reimbursement of expenses by Funds Management were made first from fund level expenses on a proportionate basis and then from class specific expenses. Funds Management has committed to waive fees and/or reimburse expenses to the extent necessary to cap each Fund’s expenses as follows:
| | | | | | | | | | | | | | | | | | |
| | | Expiration date | | Class A | | | Class B | | | Class C | | | Administrator Class | |
Conservative Allocation Fund | | September 30, 2013 | | | N/A | | | | N/A | | | | N/A | | | | 0.85 | % |
Growth Balanced Fund | | September 30, 2013 | | | 1.20 | % | | | 1.95 | % | | | 1.95 | % | | | 0.95 | % |
Moderate Balanced Fund | | September 30, 2013 | | | 1.15 | % | | | 1.90 | % | | | 1.90 | % | | | 0.90 | % |
Distribution fees
The Trust has adopted a Distribution Plan for Class B and Class C shares of the applicable Funds pursuant to Rule 12b-1 under the 1940 Act. Distribution fees are charged to the Class B and Class C shares and paid to Wells Fargo Funds Distributor, LLC, the principal underwriter of each Fund, at an annual rate of 0.75% of the average daily net assets of Class B and Class C shares.
For the six months ended November 30, 2012, Wells Fargo Funds Distributor, LLC received the following amounts in front-end sales charges and contingent deferred sales charges.
| | | | | | | | | | | | |
| | | Front-end
sales charges Class A | | | Contingent deferred sales charges | |
| | | | Class B | | | Class C | |
Growth Balanced Fund | | $ | 1,806 | | | $ | 79 | | | $ | 64 | |
Moderate Balanced Fund | | | 3,344 | | | | 162 | | | | 0 | |
Shareholder servicing fees
The Trust has entered into contracts with one or more shareholder servicing agents, whereby Class A, Class B, Class C, and Administrator Class of each applicable Fund is charged a fee at an annual rate of 0.25% of the average daily net assets of each respective class.
A portion of these total shareholder servicing fees were paid to affiliates of Wells Fargo.
| | | | | | |
| Notes to financial statements (unaudited) | | Wells Fargo Advantage Allocation Funds | | | 29 | |
5. INVESTMENT PORTFOLIO TRANSACTIONS
Purchases and sales of investments, excluding U.S. Government obligations (if any) and short-term securities, for the six months ended November 30, 2012 were as follows:
| | | | | | | | |
| | | Purchases at cost* | | | Sales proceeds* | |
Conservative Allocation Fund | | $ | 20,572,344 | | | $ | 24,428,636 | |
Growth Balanced Fund | | | 91,671,744 | | | | 120,453,707 | |
Moderate Balanced Fund | | | 74,800,822 | | | | 92,726,030 | |
| * | The Funds seek to achieve their investment objective by investing some or all of their investable assets in one or more Master Portfolios. Purchases and sales related to these investments have been calculated by aggregating the results of multiplying each Fund’s ownership percentage of the respective Master Portfolio by the corresponding Master Portfolio’s purchases and sales. Purchases and sales of unaffiliated securities in which the Funds invest are actual purchases and sale of those securities. |
6. DERIVATIVE TRANSACTIONS
During the six months ended November 30, 2012, the Funds entered into futures contracts to gain market exposure to certain asset classes consistent with an active asset allocation strategy.
At November 30, 2012, the Funds had long and short futures contracts outstanding as follows:
| | | | | | | | | | | | | | |
| | | Expiration date | | Contracts | | Type | | Contract value at
November 30, 2012 | | | Unrealized
losses | |
Conservative Allocation Fund | | 12-20-12 | | 6 Long | | S&P 500 Index | | $ | 2,121,600 | | | $ | (8,041 | ) |
| | 3-19-13 | | 13 Short | | 30-Year U.S. Treasury Bonds | | | 1,950,813 | | | | (6,641 | ) |
Growth Balanced Fund | | 12-20-12 | | 97 Long | | S&P 500 Index | | | 34,299,200 | | | | (442,604 | ) |
| | 3-19-13 | | 227 Short | | 30-Year U.S. Treasury Bonds | | | 34,064,188 | | | | (114,041 | ) |
Moderate Balanced Fund | | 12-20-12 | | 47 Long | | S&P 500 Index | | | 16,619,200 | | | | (214,457 | ) |
| | 3-19-13 | | 111 Short | | 30-Year U.S. Treasury Bonds | | | 16,656,938 | | | | (55,552 | ) |
The Funds had average notional amounts in futures contracts outstanding during the six months ended November 30, 2012 as follows:
| | | | | | | | |
| | | Long contracts | | | Short contracts | |
Conservative Allocation Fund | | $ | 1,741,417 | | | $ | 1,940,946 | |
Growth Balanced Fund | | | 36,086,585 | | | | 35,672,456 | |
Moderate Balanced Fund | | | 16,795,756 | | | | 16,548,348 | |
A summary of derivative instruments by primary risk exposure is outlined in the following tables.
The fair value of derivative instruments as of November 30, 2012 was as follows for Conservative Allocation Fund:
| | | | | | |
| | | Liability derivatives | |
| | | Balance sheet location | | Fair value | |
Interest rate contracts | | Net assets – Net unrealized gains on investments | | $ | 6,641 | * |
Equity contracts | | Net assets – Net unrealized gains on investments | | | 8,041 | * |
| | | | | $ | 14,682 | |
| * | Amount represents cumulative unrealized gains/losses on futures contracts. Only the variation margin as of November 30, 2012 is reported separately on the Statements of Assets and Liabilities. |
| | | | |
| 30 | | Wells Fargo Advantage Allocation Funds | | Notes to financial statements (unaudited) |
The effect of derivative instruments on the Statements of Operations for the six months ended November 30, 2012 was as follows for Conservative Allocation Fund:
| | | | | | | | |
| | | Amount of realized
gains (losses) on
derivatives | | | Change in unrealized
gains (losses) on
derivatives | |
Interest rate contracts | | $ | (41,183 | ) | | $ | 29,956 | |
Equity contracts | | | 123,869 | | | | 39,209 | |
| | | $ | 82,686 | | | $ | 69,165 | |
The fair value of derivative instruments as of November 30, 2012 was as follows for Growth Balanced Fund:
| | | | | | |
| | | Liability derivatives | |
| | | Balance sheet location | | Fair value | |
Interest rate contracts | | Net assets – Net unrealized gains on investments | | $ | 114,041 | * |
Equity contracts | | Net assets – Net unrealized gains on investments | | | 442,604 | * |
| | | | | $ | 556,645 | |
| * | Amount represents cumulative unrealized gains/losses on futures contracts. Only the variation margin as of November 30, 2012 is reported separately on the Statements of Assets and Liabilities. |
The effect of derivative instruments on the Statements of Operations for the six months ended November 30, 2012 was as follows for Growth Balanced Fund:
| | | | | | | | |
| | | Amount of realized
gains (losses) on
derivatives | | | Change in unrealized
gains (losses) on
derivatives | |
Interest rate contracts | | $ | (968,106 | ) | | $ | 677,016 | |
Equity contracts | | | 2,362,688 | | | | 767,572 | |
| | | $ | 1,394,582 | | | $ | 1,444,588 | |
The fair value of derivative instruments as of November 30, 2012 was as follows for Moderate Balanced Fund:
| | | | | | |
| | | Liability Derivatives | |
| | | Balance sheet location | | Fair value | |
Interest rate contracts | | Net assets – Net unrealized gains on investments | | $ | 55,552 | * |
Equity contracts | | Net assets – Net unrealized gains on investments | | | 214,457 | * |
| | | | | $ | 270,009 | |
| * | Amount represents cumulative unrealized gains/losses on futures contracts. Only the variation margin as of November 30, 2012 is reported separately on the Statements of Assets and Liabilities. |
The effect of derivative instruments on the Statements of Operations for the six months ended November 30, 2012 was as follows for Moderate Balanced Fund:
| | | | | | | | |
| | | Amount of realized
gains (losses) on
derivatives | | | Change in unrealized
gains (losses) on
derivatives | |
Interest rate contracts | | $ | (428,315 | ) | | $ | 296,342 | |
Equity contracts | | | 1,152,683 | | | | 314,996 | |
| | | $ | 724,368 | | | $ | 611,338 | |
| | | | | | |
| Notes to financial statements (unaudited) | | Wells Fargo Advantage Allocation Funds | | | 31 | |
8. BANK BORROWINGS
Each Fund and certain other funds in the Trust are party to a $25,000,000 revolving credit agreement with the Bank of New York Mellon, whereby the Funds are permitted to use bank borrowings for temporary or emergency purposes, such as to fund shareholder redemption requests. Interest under the credit agreement is charged to each Fund based on a borrowing rate equal to the higher of the Federal Funds rate in effect on that day plus 1.25% or the overnight LIBOR rate in effect on that day plus 1.25%. In addition, an annual commitment fee equal to 0.15% of the unused balance is allocated to each participating fund. For the six months ended November 30, 2012, the Funds paid the following amounts in commitment fees:
| | | | |
| | | Commitment Fee | |
Conservative Allocation Fund | | $ | 48 | |
Growth Balanced Fund | | | 439 | |
Moderate Balanced Fund | | | 218 | |
For the six months ended November 30, 2012, there were no borrowings by the Funds under the agreement.
9. INDEMNIFICATION
Under the Trust’s organizational documents, the officers and directors are indemnified against certain liabilities that may arise out of performance of their duties to the Trust. Additionally, in the normal course of business, the Trust may enter into contracts with service providers that contain a variety of indemnification clauses. The Trust’s maximum exposure under these arrangements is dependent on future claims that may be made against the Funds and, therefore, cannot be estimated.
10. NEW ACCOUNTING PRONOUNCEMENT
In December 2011, the Financial Accounting Standards Board (“FASB”) issued Accounting Standard Update (“ASU”) No. 2011-11, Disclosures about Offsetting Assets and Liabilities. ASU 2011-11, which amends FASB ASC Topic 210, Balance Sheet, creates new disclosure requirements which require entities to disclose both gross and net information for derivatives and other financial instruments that are either offset in the Statement of Assets and Liabilities or subject to an enforceable master netting arrangement or similar agreement. The disclosure requirements are effective for interim and annual reporting periods beginning on or after January 1, 2013. Management is currently assessing the potential impact, in addition to expanded financial statement disclosure, that may result from adopting this ASU.
11. FUND LIQUIDATION
At its November 6-7, 2012 meeting, the Board of Trustees unanimously approved the liquidation of Conservative Allocation Fund. The liquidation is expected to occur after the close of business on or around May 24, 2013. On the date of the liquidation, shareholders of Conservative Allocation Fund will receive a distribution of their account proceeds, including any accrued dividends, in complete redemption of their shares.
12. SUBSEQUENT DISTRIBUTIONS
On December 17, 2012, the Fund’s declared distributions from net investment income to shareholders of record on December 14, 2012. The per share amounts payable on December 18, 2012 were as follows:
| | | | | | | | | | | | |
| | | Conservative
Allocation
Fund | | | Growth Balanced Fund | | | Moderate Balanced Fund | |
Net investment income | | | | | | | | | | | | |
Class A | | | N/A | | | $ | 0.43926 | | | $ | 0.34144 | |
Class B | | | N/A | | | | 0.13070 | | | | 0.17202 | |
Class C | | | N/A | | | | 0.25480 | | | | 0.20048 | |
Administrator Class | | $ | 0.34782 | | | | 0.51115 | | | | 0.39070 | |
These distributions are not reflected in the accompanying financial statements.
| | | | |
| 32 | | Wells Fargo Advantage Allocation Funds | | Portfolio of investments—November 30, 2012 (unaudited) |
C&B LARGE CAP VALUE PORTFOLIO
| | | | | | | | | | | | |
| Security name | | | | | | Shares | | | Value | |
| | | | | | | | | | | | |
| | | | |
Common Stocks: 97.17% | | | | | | | | | | | | |
| | | | |
Consumer Discretionary: 16.12% | | | | | | | | | | | | |
| | | | |
| Hotels, Restaurants & Leisure: 5.87% | | | | | | | | | | | | |
Carnival Corporation « | | | | | | | 145,100 | | | $ | 5,609,566 | |
Darden Restaurants Incorporated « | | | | | | | 107,300 | | | | 5,674,024 | |
McDonald’s Corporation | | | | | | | 85,400 | | | | 7,433,216 | |
| | | | |
| | | | | | | | | | | 18,716,806 | |
| | | | | | | | | | | | |
| | | | |
| Household Durables: 3.33% | | | | | | | | | | | | |
NVR Incorporated † | | | | | | | 11,800 | | | | 10,618,112 | |
| | | | | | | | | | | | |
| | | | |
| Media: 3.44% | | | | | | | | | | | | |
Omnicom Group Incorporated « | | | | | | | 220,700 | | | | 10,977,618 | |
| | | | | | | | | | | | |
| | | | |
| Multiline Retail: 2.39% | | | | | | | | | | | | |
Kohl’s Corporation | | | | | | | 170,500 | | | | 7,612,825 | |
| | | | | | | | | | | | |
| | | | |
| Specialty Retail: 1.09% | | | | | | | | | | | | |
Best Buy Company Incorporated « | | | | | | | 265,000 | | | | 3,474,150 | |
| | | | | | | | | | | | |
| | | | |
Consumer Staples: 11.69% | | | | | | | | | | | | |
| | | | |
| Beverages: 3.19% | | | | | | | | | | | | |
Coca-Cola Enterprises Incorporated | | | | | | | 168,900 | | | | 5,266,302 | |
Diageo plc ADR « | | | | | | | 40,960 | | | | 4,897,587 | |
| | | | |
| | | | | | | | | | | 10,163,889 | |
| | | | | | | | | | | | |
| | | | |
| Household Products: 5.52% | | | | | | | | | | | | |
Colgate-Palmolive Company | | | | | | | 57,300 | | | | 6,217,050 | |
Henkel AG & Company KGaA ADR | | | | | | | 68,000 | | | | 4,607,741 | |
Procter & Gamble Company | | | | | | | 96,900 | | | | 6,766,527 | |
| | | | |
| | | | | | | | | | | 17,591,318 | |
| | | | | | | | | | | | |
| | | | |
| Personal Products: 1.03% | | | | | | | | | | | | |
Avon Products Incorporated | | | | | | | 235,500 | | | | 3,285,225 | |
| | | | | | | | | | | | |
| | | | |
| Tobacco: 1.95% | | | | | | | | | | | | |
Philip Morris International | | | | | | | 69,400 | | | | 6,237,672 | |
| | | | | | | | | | | | |
| | | | |
Energy: 6.28% | | | | | | | | | | | | |
| | | | |
| Oil, Gas & Consumable Fuels: 6.28% | | | | | | | | | | | | |
Chevron Corporation | | | | | | | 57,800 | | | | 6,108,882 | |
Devon Energy Corporation | | | | | | | 92,900 | | | | 4,800,143 | |
Exxon Mobil Corporation | | | | | | | 103,500 | | | | 9,122,490 | |
| | | | |
| | | | | | | | | | | 20,031,515 | |
| | | | | | | | | | | | |
| | | | |
Financials: 20.40% | | | | | | | | | | | | |
| | | | |
| Capital Markets: 5.06% | | | | | | | | | | | | |
Charles Schwab Corporation | | | | | | | 421,900 | | | | 5,526,890 | |
State Street Corporation | | | | | | | 238,900 | | | | 10,616,716 | |
| | | | |
| | | | | | | | | | | 16,143,606 | |
| | | | | | | | | | | | |
The accompanying notes are an integral part of these financial statements.
| | | | | | |
| Portfolio of investments—November 30, 2012 (unaudited) | | Wells Fargo Advantage Allocation Funds | | | 33 | |
C&B LARGE CAP VALUE PORTFOLIO
| | | | | | | | | | | | |
| Security name | | | | | | Shares | | | Value | |
| | | | | | | | | | | | |
| | | | |
| Commercial Banks: 1.58% | | | | | | | | | | | | |
PNC Financial Services Group Incorporated | | | | | | | 89,800 | | | $ | 5,041,372 | |
| | | | | | | | | | | | |
| | | | |
| Consumer Finance: 2.70% | | | | | | | | | | | | |
American Express Company | | | | | | | 153,800 | | | | 8,597,420 | |
| | | | | | | | | | | | |
| | | | |
| Diversified Financial Services: 6.48% | | | | | | | | | | | | |
Bank of America Corporation | | | | | | | 431,200 | | | | 4,251,632 | |
Berkshire Hathaway Incorporated Class B † | | | | | | | 72,700 | | | | 6,403,416 | |
JPMorgan Chase & Company | | | | | | | 243,300 | | | | 9,994,764 | |
| | | | |
| | | | | | | | | | | 20,649,812 | |
| | | | | | | | | | | | |
| | | | |
| Insurance: 4.58% | | | | | | | | | | | | |
Axis Capital Holdings Limited | | | | | | | 155,300 | | | | 5,586,141 | |
The Progressive Corporation « | | | | | | | 235,000 | | | | 4,993,750 | |
Willis Group Holdings plc « | | | | | | | 114,600 | | | | 4,020,168 | |
| | | | |
| | | | | | | | | | | 14,600,059 | |
| | | | | | | | | | | | |
| | | | |
Health Care: 11.44% | | | | | | | | | | | | |
| | | | |
| Health Care Equipment & Supplies: 4.06% | | | | | | | | | | | | |
Baxter International Incorporated | | | | | | | 103,400 | | | | 6,852,318 | |
Becton Dickinson & Company « | | | | | | | 79,700 | | | | 6,110,599 | |
| | | | |
| | | | | | | | | | | 12,962,917 | |
| | | | | | | | | | | | |
| | | | |
| Health Care Providers & Services: 4.30% | | | | | | | | | | | | |
Cardinal Health Incorporated | | | | | | | 151,600 | | | | 6,132,220 | |
Quest Diagnostics Incorporated « | | | | | | | 131,200 | | | | 7,580,736 | |
| | | | |
| | | | | | | | | | | 13,712,956 | |
| | | | | | | | | | | | |
| | | | |
| Pharmaceuticals: 3.08% | | | | | | | | | | | | |
Johnson & Johnson Services Incorporated « | | | | | | | 140,700 | | | | 9,811,011 | |
| | | | | | | | | | | | |
| | | | |
Industrials: 11.23% | | | | | | | | | | | | |
| | | | |
| Aerospace & Defense: 2.58% | | | | | | | | | | | | |
Raytheon Company | | | | | | | 143,900 | | | | 8,221,007 | |
| | | | | | | | | | | | |
| | | | |
| Air Freight & Logistics: 1.44% | | | | | | | | | | | | |
United Parcel Service Incorporated Class B | | | | | | | 62,700 | | | | 4,583,997 | |
| | | | | | | | | | | | |
| | | | |
| Commercial Services & Supplies: 2.05% | | | | | | | | | | | | |
Cintas Corporation « | | | | | | | 158,200 | | | | 6,555,808 | |
| | | | | | | | | | | | |
| | | | |
| Industrial Conglomerates: 2.67% | | | | | | | | | | | | |
3M Company | | | | | | | 93,500 | | | | 8,503,825 | |
| | | | | | | | | | | | |
| | | | |
| Machinery: 2.49% | | | | | | | | | | | | |
Illinois Tool Works Incorporated « | | | | | | | 128,800 | | | | 7,930,216 | |
| | | | | | | | | | | | |
The accompanying notes are an integral part of these financial statements.
| | | | |
| 34 | | Wells Fargo Advantage Allocation Funds | | Portfolio of investments—November 30, 2012 (unaudited) |
C&B LARGE CAP VALUE PORTFOLIO
| | | | | | | | | | | | | | |
| Security name | | | | | | | Shares | | | Value | |
| | | | | | | | | | | | | | |
| | | | |
Information Technology: 12.18% | | | | | | | | | | | | | | |
| | | | |
| Electronic Equipment, Instruments & Components: 4.96% | | | | | | | | | | | | | | |
Flextronics International Limited † | | | | | | | | | 948,400 | | | $ | 5,491,236 | |
Molex Incorporated Class A | | | | | | | | | 206,000 | | | | 4,472,260 | |
TE Connectivity Limited | | | | | | | | | 166,700 | | | | 5,866,173 | |
| | | | |
| | | | | | | | | | | | | 15,829,669 | |
| | | | | | | | | | | | | | |
| | | | |
| IT Services: 3.98% | | | | | | | | | | | | | | |
Fiserv Incorporated † | | | | | | | | | 84,600 | | | | 6,513,354 | |
Western Union Company | | | | | | | | | 489,600 | | | | 6,173,856 | |
| | | | |
| | | | | | | | | | | | | 12,687,210 | |
| | | | | | | | | | | | | | |
| | | | |
| Semiconductors & Semiconductor Equipment: 2.33% | | | | | | | | | | | | | | |
Lam Research Corporation † | | | | | | | | | 211,900 | | | | 7,441,928 | |
| | | | | | | | | | | | | | |
| | | | |
| Software: 0.91% | | | | | | | | | | | | | | |
Microsoft Corporation | | | | | | | | | 108,400 | | | | 2,885,608 | |
| | | | | | | | | | | | | | |
| | | | |
Materials: 3.84% | | | | | | | | | | | | | | |
| | | | |
| Containers & Packaging: 3.84% | | | | | | | | | | | | | | |
Ball Corporation « | | | | | | | | | 161,000 | | | | 7,195,090 | |
Rock-Tenn Company Class A | | | | | | | | | 77,700 | | | | 5,053,609 | |
| | | | |
| | | | | | | | | | | | | 12,248,699 | |
| | | | | | | | | | | | | | |
| | | | |
Telecommunication Services: 2.38% | | | | | | | | | | | | | | |
| | | | |
| Wireless Telecommunication Services: 2.38% | | | | | | | | | | | | | | |
Vodafone Group plc ADR | | | | | | | | | 294,200 | | | | 7,590,360 | |
| | | | | | | | | | | | | | |
| | | | |
Utilities: 1.61% | | | | | | | | | | | | | | |
| | | | |
| Electric Utilities: 1.61% | | | | | | | | | | | | | | |
Entergy Corporation | | | | | | | | | 80,600 | | | | 5,121,324 | |
| | | | | | | | | | | | | | |
| | | | |
Total Common Stocks (Cost $265,963,259) | | | | | | | | | | | | | 309,827,934 | |
| | | | | | | | | | | | | | |
| | | | |
| | | | | Dividend Yield | | | | | | | |
| | | | |
Preferred Stocks: 1.24% | | | | | | | | | | | | | | |
| | | | |
Consumer Staples: 1.24% | | | | | | | | | | | | | | |
| | | | |
| Household Products: 1.24% | | | | | | | | | | | | | | |
Henkel AG & Company KGaA ADR | | | | | 1.25 | % | | | 47,200 | | | | 3,944,178 | |
| | | | | | | | | | | | | | |
| | | | |
Total Preferred Stocks (Cost $1,744,375) | | | | | | | | | | | | | 3,944,178 | |
| | | | | | | | | | | | | | |
| | | | |
| | | | | | | | Principal | | | | |
| | | | |
Other: 0.15% | | | | | | | | | | | | | | |
Gryphon Funding Limited, Pass-Through Entity (a)(i)(v) | | | | | | | | $ | 1,421,993 | | | | 469,258 | |
| | | | | | | | | | | | | | |
| | | | |
Total Other (Cost $134,731) | | | | | | | | | | | | | 469,258 | |
| | | | | | | | | | | | | | |
The accompanying notes are an integral part of these financial statements.
| | | | | | |
| Portfolio of investments—November 30, 2012 (unaudited) | | Wells Fargo Advantage Allocation Funds | | | 35 | |
C&B LARGE CAP VALUE PORTFOLIO
| | | | | | | | | | | | | | |
| Security name | | | | Yield | | | Shares | | | Value | |
| | | | | | | | | | | | | | |
| | | | |
Short-Term Investments: 17.65% | | | | | | | | | | | | | | |
| | | | |
| Investment Companies: 17.65% | | | | | | | | | | | | | | |
Wells Fargo Advantage Cash Investment Money Market Fund, Select Class (l)(u) | | | | | 0.16 | % | | | 1,807,073 | | | $ | 1,807,073 | |
Wells Fargo Securities Lending Cash Investments, LLC (l)(u)(v)(r) | | | | | 0.21 | | | | 54,471,494 | | | | 54,471,494 | |
| | | | |
Total Short-Term Investments (Cost $56,278,567) | | | | | | | | | | | | | 56,278,567 | |
| | | | | | | | | | | | | | |
| | | | | | | | |
| Total investments in securities | | | | | | | | |
| (Cost $324,120,932) * | | | 116.21 | % | | | 370,519,937 | |
Other assets and liabilities, net | | | (16.21 | ) | | | (51,673,599 | ) |
| | | | | | | | |
| Total net assets | | | 100.00 | % | | $ | 318,846,338 | |
| | | | | | | | |
| « | All or a portion of this security is on loan. |
| † | Non-income-earning security |
| (a) | Security is fair valued by the Management Valuation Team, and in certain instances by the Board of Trustees, in accordance with procedures approved by the Board of Trustees. |
| (v) | Security represents investment of cash collateral received from securities on loan. |
| (l) | Investment in an affiliate |
| (u) | Rate shown is the 7-day annualized yield at period end. |
| (r) | The investment company is exempt from registration under Section 3(c)(7) of the Investment Company Act of 1940, as amended. |
| * | Cost for federal income tax purposes is $335,714,171 and unrealized appreciation (depreciation) consists of: |
| | | | |
Gross unrealized appreciation | | $ | 48,127,854 | |
Gross unrealized depreciation | | | (13,322,088 | ) |
| | | | |
Net unrealized appreciation | | $ | 34,805,766 | |
The accompanying notes are an integral part of these financial statements.
| | | | |
| 36 | | Wells Fargo Advantage Allocation Funds | | Portfolio of investments—November 30, 2012 (unaudited) |
DIVERSIFIED LARGE CAP GROWTH PORTFOLIO
| | | | | | | | | | | | |
| Security name | | | | | | Shares | | | Value | |
| | | | | | | | | | | | |
| | | | |
Common Stocks: 98.79% | | | | | | | | | | | | |
| | | | |
Consumer Discretionary: 21.27% | | | | | | | | | | | | |
| | | | |
| Auto Components: 0.10% | | | | | | | | | | | | |
BorgWarner Incorporated † | | | | | | | 2,200 | | | $ | 145,860 | |
| | | | | | | | | | | | |
| | | | |
| Distributors: 0.16% | | | | | | | | | | | | |
LKQ Corporation † | | | | | | | 11,100 | | | | 243,312 | |
| | | | | | | | | | | | |
| | | | |
| Hotels, Restaurants & Leisure: 4.08% | | | | | | | | | | | | |
Chipotle Mexican Grill Incorporated Ǡ | | | | | | | 4,350 | | | | 1,147,443 | |
Marriott International Incorporated Class A « | | | | | | | 18,400 | | | | 667,736 | |
McDonald’s Corporation | | | | | | | 12,690 | | | | 1,104,538 | |
Starbucks Corporation | | | | | | | 54,751 | | | | 2,839,934 | |
Wynn Resorts Limited | | | | | | | 2,800 | | | | 314,720 | |
| | | | |
| | | | | | | | | | | 6,074,371 | |
| | | | | | | | | | | | |
| | | | |
| Internet & Catalog Retail: 3.31% | | | | | | | | | | | | |
Amazon.com Incorporated Ǡ | | | | | | | 10,760 | | | | 2,712,058 | |
priceline.com Incorporated † | | | | | | | 3,345 | | | | 2,218,270 | |
| | | | |
| | | | | | | | | | | 4,930,328 | |
| | | | | | | | | | | | |
| | | | |
| Media: 1.33% | | | | | | | | | | | | |
CBS Corporation Class B | | | | | | | 24,330 | | | | 875,393 | |
Liberty Media Corporation Ǡ | | | | | | | 10,106 | | | | 1,111,559 | |
| | | | |
| | | | | | | | | | | 1,986,952 | |
| | | | | | | | | | | | |
| | | | |
| Multiline Retail: 3.95% | | | | | | | | | | | | |
Dollar General Corporation † | | | | | | | 49,121 | | | | 2,456,050 | |
Dollar Tree Incorporated † | | | | | | | 57,180 | | | | 2,386,693 | |
Nordstrom Incorporated | | | | | | | 19,300 | | | | 1,043,937 | |
| | | | |
| | | | | | | | | | | 5,886,680 | |
| | | | | | | | | | | | |
| | | | |
| Specialty Retail: 6.08% | | | | | | | | | | | | |
CarMax Incorporated Ǡ | | | | | | | 36,170 | | | | 1,311,524 | |
Dick’s Sporting Goods Incorporated « | | | | | | | 21,715 | | | | 1,140,255 | |
GNC Holdings Incorporated Class A | | | | | | | 20,500 | | | | 720,165 | |
Home Depot Incorporated | | | | | | | 13,810 | | | | 898,617 | |
Limited Brands Incorporated | | | | | | | 30,150 | | | | 1,572,323 | |
O’Reilly Automotive Incorporated † | | | | | | | 4,600 | | | | 432,768 | |
Ross Stores Incorporated | | | | | | | 8,900 | | | | 506,588 | |
TJX Companies Incorporated | | | | | | | 29,250 | | | | 1,296,945 | |
Tractor Supply Company « | | | | | | | 9,700 | | | | 869,314 | |
Ulta Salon Cosmetics & Fragrance Incorporated | | | | | | | 3,000 | | | | 300,840 | |
| | | | |
| | | | | | | | | | | 9,049,339 | |
| | | | | | | | | | | | |
| | | | |
| Textiles, Apparel & Luxury Goods: 2.26% | | | | | | | | | | | | |
lululemon athletica incorporated Ǡ | | | | | | | 23,330 | | | | 1,674,627 | |
Michael Kors Holdings Limited † | | | | | | | 10,305 | | | | 547,711 | |
Nike Incorporated Class B | | | | | | | 6,900 | | | | 672,612 | |
The accompanying notes are an integral part of these financial statements.
| | | | | | |
| Portfolio of investments—November 30, 2012 (unaudited) | | Wells Fargo Advantage Allocation Funds | | | 37 | |
DIVERSIFIED LARGE CAP GROWTH PORTFOLIO
| | | | | | | | | | | | |
| Security name | | | | | | Shares | | | Value | |
| | | | | | | | | | | | |
| | | | |
| Textiles, Apparel & Luxury Goods (continued) | | | | | | | | | | | | |
Under Armour Incorporated Class A Ǡ | | | | | | | 1,900 | | | $ | 98,477 | |
VF Corporation « | | | | | | | 2,300 | | | | 369,173 | |
| | | | |
| | | | | | | | | | | 3,362,600 | |
| | | | | | | | | | | | |
| | | | |
Consumer Staples: 6.57% | | | | | | | | | | | | |
| | | | |
| Beverages: 1.83% | | | | | | | | | | | | |
Anheuser-Busch Companies Incorporated ADR | | | | | | | 12,450 | | | | 1,095,227 | |
Monster Beverage Corporation † | | | | | | | 12,000 | | | | 624,600 | |
The Coca-Cola Company | | | | | | | 26,500 | | | | 1,004,880 | |
| | | | |
| | | | | | | | | | | 2,724,707 | |
| | | | | | | | | | | | |
| | | | |
| Food & Staples Retailing: 3.64% | | | | | | | | | | | | |
Costco Wholesale Corporation | | | | | | | 12,900 | | | | 1,341,471 | |
Walgreen Company « | | | | | | | 13,100 | | | | 444,221 | |
Whole Foods Market Incorporated | | | | | | | 38,930 | | | | 3,634,505 | |
| | | | |
| | | | | | | | | | | 5,420,197 | |
| | | | | | | | | | | | |
| | | | |
| Food Products: 0.79% | | | | | | | | | | | | |
Mead Johnson Nutrition Company | | | | | | | 4,400 | | | | 300,036 | |
The Hershey Company | | | | | | | 12,000 | | | | 879,240 | |
| | | | |
| | | | | | | | | | | 1,179,276 | |
| | | | | | | | | | | | |
| | | | |
| Personal Products: 0.31% | | | | | | | | | | | | |
Estee Lauder Companies Incorporated Class A | | | | | | | 7,900 | | | | 460,175 | |
| | | | | | | | | | | | |
| | | | |
Energy: 5.36% | | | | | | | | | | | | |
| | | | |
| Energy Equipment & Services: 1.46% | | | | | | | | | | | | |
National Oilwell Varco Incorporated | | | | | | | 13,735 | | | | 938,101 | |
Schlumberger Limited | | | | | | | 17,376 | | | | 1,244,469 | |
| | | | |
| | | | | | | | | | | 2,182,570 | |
| | | | | | | | | | | | |
| | | | |
| Oil, Gas & Consumable Fuels: 3.90% | | | | | | | | | | | | |
Concho Resources Incorporated † | | | | | | | 17,760 | | | | 1,425,418 | |
Continental Resources Incorporated Ǡ | | | | | | | 5,060 | | | | 347,622 | |
Energy XXI (Bermuda) Limited « | | | | | | | 9,800 | | | | 310,464 | |
Pioneer Natural Resources Company | | | | | | | 27,320 | | | | 2,923,240 | |
The Williams Companies Incorporated | | | | | | | 24,290 | | | | 797,684 | |
| | | | |
| | | | | | | | | | | 5,804,428 | |
| | | | | | | | | | | | |
| | | | |
Financials: 3.10% | | | | | | | | | | | | |
| | | | |
| Capital Markets: 1.51% | | | | | | | | | | | | |
Ameriprise Financial Incorporated | | | | | | | 22,630 | | | | 1,372,962 | |
TD Ameritrade Holding Corporation | | | | | | | 54,480 | | | | 882,576 | |
| | | | |
| | | | | | | | | | | 2,255,538 | |
| | | | | | | | | | | | |
| | | | |
| Consumer Finance: 1.59% | | | | | | | | | | | | |
American Express Company | | | | | | | 26,634 | | | | 1,488,841 | |
Capital One Financial Corporation | | | | | | | 12,620 | | | | 726,912 | |
Discover Financial Services | | | | | | | 3,700 | | | | 153,957 | |
| | | | |
| | | | | | | | | | | 2,369,710 | |
| | | | | | | | | | | | |
The accompanying notes are an integral part of these financial statements.
| | | | |
| 38 | | Wells Fargo Advantage Allocation Funds | | Portfolio of investments—November 30, 2012 (unaudited) |
DIVERSIFIED LARGE CAP GROWTH PORTFOLIO
| | | | | | | | | | | | |
| Security name | | | | | | Shares | | | Value | |
| | | | | | | | | | | | |
| | | | |
Health Care: 13.66% | | | | | | | | | | | | |
| | | | |
| Biotechnology: 5.20% | | | | | | | | | | | | |
Alexion Pharmaceuticals Incorporated † | | | | | | | 36,905 | | | $ | 3,543,618 | |
Biogen Idec Incorporated † | | | | | | | 6,000 | | | | 894,540 | |
BioMarin Pharmaceutical Incorporated † | | | | | | | 2,700 | | | | 131,220 | |
Celgene Corporation † | | | | | | | 10,700 | | | | 840,913 | |
Gilead Sciences Incorporated Ǡ | | | | | | | 28,180 | | | | 2,113,500 | |
Onyx Pharmaceuticals Incorporated Ǡ | | | | | | | 2,900 | | | | 218,863 | |
| | | | |
| | | | | | | | | | | 7,742,654 | |
| | | | | | | | | | | | |
| | | | |
| Health Care Equipment & Supplies: 2.17% | | | | | | | | | | | | |
Covidien plc | | | | | | | 12,900 | | | | 749,619 | |
Intuitive Surgical Incorporated Ǡ | | | | | | | 4,690 | | | | 2,481,010 | |
| | | | |
| | | | | | | | | | | 3,230,629 | |
| | | | | | | | | | | | |
| | | | |
| Health Care Providers & Services: 1.92% | | | | | | | | | | | | |
AmerisourceBergen Corporation « | | | | | | | 21,403 | | | | 903,635 | |
Catamaran Corporation † | | | | | | | 19,400 | | | | 944,586 | |
Express Scripts Holding Corporation † | | | | | | | 3,200 | | | | 172,320 | |
UnitedHealth Group Incorporated | | | | | | | 15,600 | | | | 848,484 | |
| | | | |
| | | | | | | | | | | 2,869,025 | |
| | | | | | | | | | | | |
| | | | |
| Health Care Technology: 1.22% | | | | | | | | | | | | |
Cerner Corporation Ǡ | | | | | | | 23,500 | | | | 1,814,670 | |
| | | | | | | | | | | | |
| | | | |
| Life Sciences Tools & Services: 0.44% | | | | | | | | | | | | |
Mettler-Toledo International Incorporated Ǡ | | | | | | | 3,480 | | | | 651,073 | |
| | | | | | | | | | | | |
| | | | |
| Pharmaceuticals: 2.71% | | | | | | | | | | | | |
Abbott Laboratories | | | | | | | 17,500 | | | | 1,137,500 | |
Allergan Incorporated | | | | | | | 17,140 | | | | 1,589,735 | |
Shire plc ADR | | | | | | | 13,570 | | | | 1,175,569 | |
Watson Pharmaceuticals Incorporated † | | | | | | | 1,500 | | | | 132,015 | |
| | | | |
| | | | | | | | | | | 4,034,819 | |
| | | | | | | | | | | | |
| | | | |
Industrials: 9.85% | | | | | | | | | | | | |
| | | | |
| Aerospace & Defense: 2.44% | | | | | | | | | | | | |
Precision Castparts Corporation | | | | | | | 13,037 | | | | 2,390,855 | |
United Technologies Corporation | | | | | | | 15,480 | | | | 1,240,103 | |
| | | | |
| | | | | | | | | | | 3,630,958 | |
| | | | | | | | | | | | |
| | | | |
| Air Freight & Logistics: 0.19% | | | | | | | | | | | | |
United Parcel Service Incorporated Class B | | | | | | | 3,900 | | | | 285,129 | |
| | | | | | | | | | | | |
| | | | |
| Industrial Conglomerates: 1.54% | | | | | | | | | | | | |
Danaher Corporation | | | | | | | 42,630 | | | | 2,300,741 | |
| | | | | | | | | | | | |
The accompanying notes are an integral part of these financial statements.
| | | | | | |
| Portfolio of investments—November 30, 2012 (unaudited) | | Wells Fargo Advantage Allocation Funds | | | 39 | |
DIVERSIFIED LARGE CAP GROWTH PORTFOLIO
| | | | | | | | | | | | |
| Security name | | | | | | Shares | | | Value | |
| | | | | | | | | | | | |
| | | | |
| Machinery: 1.09% | | | | | | | | | | | | |
Cummins Incorporated « | | | | | | | 9,249 | | | $ | 907,882 | |
Flowserve Corporation | | | | | | | 1,600 | | | | 221,680 | |
Joy Global Incorporated « | | | | | | | 8,719 | | | | 496,896 | |
| | | | |
| | | | | | | | | | | 1,626,458 | |
| | | | | | | | | | | | |
| | | | |
| Road & Rail: 3.99% | | | | | | | | | | | | |
Hertz Global Holdings Incorporated Ǡ | | | | | | | 64,660 | | | | 1,011,282 | |
Kansas City Southern Railway Company « | | | | | | | 17,880 | | | | 1,397,322 | |
Norfolk Southern Corporation | | | | | | | 5,300 | | | | 320,014 | |
Union Pacific Corporation | | | | | | | 26,149 | | | | 3,210,574 | |
| | | | |
| | | | | | | | | | | 5,939,192 | |
| | | | | | | | | | | | |
| | | | |
| Trading Companies & Distributors: 0.60% | | | | | | | | | | | | |
W.W. Grainger Incorporated | | | | | | | 4,600 | | | | 892,492 | |
| | | | | | | | | | | | |
| | | | |
Information Technology: 33.96% | | | | | | | | | | | | |
| | | | |
| Communications Equipment: 2.79% | | | | | | | | | | | | |
Cisco Systems Incorporated | | | | | | | 25,700 | | | | 485,987 | |
Palo Alto Networks Incorporated Ǡ | | | | | | | 2,433 | | | | 132,404 | |
QUALCOMM Incorporated | | | | | | | 55,700 | | | | 3,543,634 | |
| | | | |
| | | | | | | | | | | 4,162,025 | |
| | | | | | | | | | | | |
| | | | |
| Computers & Peripherals: 8.92% | | | | | | | | | | | | |
Apple Incorporated | | | | | | | 20,291 | | | | 11,875,916 | |
EMC Corporation † | | | | | | | 56,632 | | | | 1,405,606 | |
| | | | |
| | | | | | | | | | | 13,281,522 | |
| | | | | | | | | | | | |
| | | | |
| Internet Software & Services: 9.42% | | | | | | | | | | | | |
Akamai Technologies Incorporated † | | | | | | | 1,400 | | | | 51,268 | |
Baidu.com Incorporated ADR Ǡ | | | | | | | 4,171 | | | | 401,709 | |
eBay Incorporated † | | | | | | | 104,480 | | | | 5,518,634 | |
Facebook Incorporated † | | | | | | | 2,600 | | | | 72,800 | |
Google Incorporated Class A † | | | | | | | 7,594 | | | | 5,303,422 | |
LinkedIn Corporation † | | | | | | | 6,730 | | | | 727,782 | |
Mercadolibre Incorporated « | | | | | | | 5,300 | | | | 381,335 | |
Rackspace Hosting Incorporated Ǡ | | | | | | | 22,840 | | | | 1,578,701 | |
| | | | |
| | | | | | | | | | | 14,035,651 | |
| | | | | | | | | | | | |
| | | | |
| IT Services: 6.62% | | | | | | | | | | | | |
Accenture plc « | | | | | | | 8,600 | | | | 584,112 | |
Alliance Data Systems Corporation Ǡ | | | | | | | 5,600 | | | | 797,944 | |
Cognizant Technology Solutions Corporation Class A † | | | | | | | 42,750 | | | | 2,874,083 | |
MasterCard Incorporated Class A | | | | | | | 4,510 | | | | 2,203,947 | |
Teradata Corporation † | | | | | | | 7,400 | | | | 440,152 | |
Visa Incorporated Class A « | | | | | | | 19,770 | | | | 2,959,767 | |
| | | | |
| | | | | | | | | | | 9,860,005 | |
| | | | | | | | | | | | |
The accompanying notes are an integral part of these financial statements.
| | | | |
| 40 | | Wells Fargo Advantage Allocation Funds | | Portfolio of investments—November 30, 2012 (unaudited) |
DIVERSIFIED LARGE CAP GROWTH PORTFOLIO
| | | | | | | | | | | | | | |
| Security name | | | | | | | Shares | | | Value | |
| | | | | | | | | | | | | | |
| | | | |
| Semiconductors & Semiconductor Equipment: 2.25% | | | | | | | | | | | | | | |
Avago Technologies Limited | | | | | | | | | 11,500 | | | $ | 403,650 | |
Broadcom Corporation Class A | | | | | | | | | 24,796 | | | | 802,894 | |
Linear Technology Corporation | | | | | | | | | 5,600 | | | | 185,864 | |
Maxim Integrated Products Incorporated | | | | | | | | | 20,740 | | | | 605,401 | |
Microchip Technology Incorporated « | | | | | | | | | 44,440 | | | | 1,351,865 | |
| | | | |
| | | | | | | | | | | | | 3,349,674 | |
| | | | | | | | | | | | | | |
| | | | |
| Software: 3.96% | | | | | | | | | | | | | | |
Citrix Systems Incorporated † | | | | | | | | | 15,010 | | | | 918,012 | |
Fortinet Incorporated † | | | | | | | | | 28,100 | | | | 561,438 | |
Red Hat Incorporated † | | | | | | | | | 21,311 | | | | 1,052,763 | |
Salesforce.com Incorporated Ǡ | | | | | | | | | 11,281 | | | | 1,778,675 | |
VMware Incorporated Ǡ | | | | | | | | | 17,500 | | | | 1,591,625 | |
| | | | |
| | | | | | | | | | | | | 5,902,513 | |
| | | | | | | | | | | | | | |
| | | | |
Materials: 3.99% | | | | | | | | | | | | | | |
| | | | |
| Chemicals: 3.99% | | | | | | | | | | | | | | |
Airgas Incorporated | | | | | | | | | 3,200 | | | | 283,424 | |
Ecolab Incorporated | | | | | | | | | 10,600 | | | | 764,048 | |
Monsanto Company | | | | | | | | | 32,310 | | | | 2,959,270 | |
Praxair Incorporated | | | | | | | | | 18,050 | | | | 1,935,141 | |
| | | | |
| | | | | | | | | | | | | 5,941,883 | |
| | | | | | | | | | | | | | |
| | | | |
Telecommunication Services: 1.03% | | | | | | | | | | | | | | |
| | | | |
| Wireless Telecommunication Services: 1.03% | | | | | | | | | | | | | | |
Crown Castle International Corporation † | | | | | | | | | 22,660 | | | | 1,530,003 | |
| | | | | | | | | | | | | | |
| | | | |
Total Common Stocks (Cost $125,151,792) | | | | | | | | | | | | | 147,157,159 | |
| | | | | | | | | | | | | | |
| | | | |
| | | | | | | | Principal | | | | |
| | | | |
Other: 0.31% | | | | | | | | | | | | | | |
Gryphon Funding Limited, Pass-Through Entity (a)(i)(v) | | | | | | | | $ | 1,413,568 | | | | 466,478 | |
| | | | | | | | | | | | | | |
| | | | |
Total Other (Cost $133,933) | | | | | | | | | | | | | 466,478 | |
| | | | | | | | | | | | | | |
| | | | |
| | | | | Yield | | | Shares | | | | |
| Short-Term Investments: 21.55% | | | | | | | | | | | | | | |
| Investment Companies: 21.55% | | | | | | | | | | | | | | |
Wells Fargo Advantage Cash Investment Money Market Fund, Select Class (u)(l) | | | | | 0.16 | % | | | 1,362,764 | | | | 1,362,764 | |
Wells Fargo Securities Lending Cash Investments, LLC (v)(l)(u)(r) | | | | | 0.21 | | | | 30,742,017 | | | | 30,742,017 | |
| | | | |
Total Short-Term Investments (Cost $32,104,781) | | | | | | | | | | | | | 32,104,781 | |
| | | | | | | | | | | | | | |
| | | | | | | | |
| Total investments in securities | | | | | | | | |
| (Cost $157,390,506) * | | | 120.65 | % | | | 179,728,418 | |
Other assets and liabilities, net | | | (20.65 | ) | | | (30,765,249 | ) |
| | | | | | | | |
| Total net assets | | | 100.00 | % | | $ | 148,963,169 | |
| | | | | | | | |
The accompanying notes are an integral part of these financial statements.
| | | | | | |
| Portfolio of investments—November 30, 2012 (unaudited) | | Wells Fargo Advantage Allocation Funds | | | 41 | |
DIVERSIFIED LARGE CAP GROWTH PORTFOLIO
| † | Non-income-earning security |
| « | All or a portion of this security is on loan. |
| (a) | Security is fair valued by the Management Valuation Team, and in certain instances by the Board of Trustees, in accordance with procedures approved by the Board of Trustees. |
| (v) | Security represents investment of cash collateral received from securities on loan. |
| (l) | Investment in an affiliate |
| (u) | Rate shown is the 7-day annualized yield at period end. |
| (r) | The investment company is exempt from registration under Section 3(c)(7) of the Investment Company Act of 1940, as amended. |
| * | Cost for federal income tax purposes is $159,804,843 and unrealized appreciation (depreciation) consists of: |
| | | | |
Gross unrealized appreciation | | $ | 22,172,146 | |
Gross unrealized depreciation | | | (2,248,571 | ) |
| | | | |
Net unrealized appreciation | | $ | 19,923,575 | |
The accompanying notes are an integral part of these financial statements.
| | | | |
| 42 | | Wells Fargo Advantage Allocation Funds | | Portfolio of investments—November 30, 2012 (unaudited) |
EMERGING GROWTH PORTFOLIO
| | | | | | | | | | | | |
| Security name | | | | | | Shares | | | Value | |
| | | | | | | | | | | | |
| | | | |
Common Stocks: 98.15% | | | | | | | | | | | | |
| | | | |
Consumer Discretionary: 14.75% | | | | | | | | | | | | |
| | | | |
| Hotels, Restaurants & Leisure: 4.12% | | | | | | | | | | | | |
Ignite Restaurant Group Incorporated † | | | | | | | 335,164 | | | $ | 4,256,583 | |
Life Time Fitness Incorporated Ǡ | | | | | | | 531,670 | | | | 25,020,390 | |
SHFL entertainment Incorporated Ǡ | | | | | | | 645,017 | | | | 8,875,434 | |
| | | | |
| | | | | | | | | | | 38,152,407 | |
| | | | | | | | | | | | |
| | | | |
| Household Durables: 0.58% | | | | | | | | | | | | |
SodaStream International Limited Ǡ | | | | | | | 133,900 | | | | 5,339,932 | |
| | | | | | | | | | | | |
| | | | |
| Internet & Catalog Retail : 2.94% | | | | | | | | | | | | |
HomeAway Incorporated Ǡ | | | | | | | 571,345 | | | | 11,701,146 | |
Shutterfly Incorporated Ǡ | | | | | | | 574,685 | | | | 15,487,761 | |
| | | | |
| | | | | | | | | | | 27,188,907 | |
| | | | | | | | | | | | |
| | | | |
| Media: 1.72% | | | | | | | | | | | | |
IMAX Corporation Ǡ | | | | | | | 736,710 | | | | 15,949,772 | |
| | | | | | | | | | | | |
| | | | |
| Specialty Retail: 5.39% | | | | | | | | | | | | |
Asbury Automotive Group Incorporated † | | | | | | | 324,700 | | | | 9,802,693 | |
DSW Incorporated Class A « | | | | | | | 267,800 | | | | 18,218,434 | |
Hibbett Sports Incorporated Ǡ | | | | | | | 70,050 | | | | 3,764,487 | |
Vitamin Shoppe Incorporated Ǡ | | | | | | | 304,280 | | | | 18,031,633 | |
| | | | |
| | | | | | | | | | | 49,817,247 | |
| | | | | | | | | | | | |
| | | | |
Consumer Staples: 2.36% | | | | | | | | | | | | |
| | | | |
| Food & Staples Retailing: 2.36% | | | | | | | | | | | | |
The Fresh Market Incorporated Ǡ | | | | | | | 316,970 | | | | 16,428,555 | |
United Natural Foods Incorporated † | | | | | | | 104,100 | | | | 5,389,257 | |
| | | | |
| | | | | | | | | | | 21,817,812 | |
| | | | | | | | | | | | |
| | | | |
Energy: 6.17% | | | | | | | | | | | | |
| | | | |
| Energy Equipment & Services: 0.63% | | | | | | | | | | | | |
Forum Energy Technologies Incorporated Ǡ | | | | | | | 229,727 | | | | 5,798,309 | |
| | | | | | | | | | | | |
| | | | |
| Oil, Gas & Consumable Fuels: 5.54% | | | | | | | | | | | | |
Approach Resources Incorporated † | | | | | | | 689,070 | | | | 16,186,254 | |
Carrizo Oil & Gas Incorporated Ǡ | | | | | | | 163,445 | | | | 3,391,484 | |
Diamondback Energy Incorporated† | | | | | | | 233,357 | | | | 4,200,426 | |
Kodiak Oil & Gas Corporation Ǡ | | | | | | | 806,700 | | | | 6,921,486 | |
Laredo Petroleum Holdings Incorporated Ǡ | | | | | | | 498,531 | | | | 9,482,060 | |
Oasis Petroleum Incorporated Ǡ | | | | | | | 368,100 | | | | 11,123,982 | |
| | | | |
| | | | | | | | | | | 51,305,692 | |
| | | | | | | | | | | | |
| | | | |
Financials: 3.25% | | | | | | | | | | | | |
| | | | |
| Capital Markets: 2.79% | | | | | | | | | | | | |
Financial Engines Incorporated Ǡ | | | | | | | 985,130 | | | | 25,830,109 | |
| | | | | | | | | | | | |
The accompanying notes are an integral part of these financial statements.
| | | | | | |
| Portfolio of investments—November 30, 2012 (unaudited) | | Wells Fargo Advantage Allocation Funds | | | 43 | |
EMERGING GROWTH PORTFOLIO
| | | | | | | | | | | | |
| Security name | | | | | | Shares | | | Value | |
| | | | | | | | | | | | |
| | | | |
| Insurance: 0.46% | | | | | | | | | | | | |
eHealth Incorporated † | | | | | | | 166,000 | | | $ | 4,282,800 | |
| | | | | | | | | | | | |
| | | | |
Health Care: 19.99% | | | | | | | | | | | | |
| | | | |
| Biotechnology: 1.46% | | | | | | | | | | | | |
Cepheid Incorporated Ǡ | | | | | | | 154,100 | | | | 4,995,922 | |
Exact Sciences Corporation † | | | | | | | 265,420 | | | | 2,603,770 | |
Genomic Health Incorporated Ǡ | | | | | | | 100,800 | | | | 2,788,128 | |
Infinity Pharmaceuticals Incorporated Ǡ | | | | | | | 99,200 | | | | 2,514,720 | |
Raptor Pharmaceutical Corporation† | | | | | | | 105,200 | | | | 556,508 | |
| | | | |
| | | | | | | | | | | 13,459,048 | |
| | | | | | | | | | | | |
| | | | |
| Health Care Equipment & Supplies: 11.66% | | | | | | | | | | | | |
Abiomed Incorporated Ǡ | | | | | | | 230,600 | | | | 3,078,510 | |
Align Technology Incorporated Ǡ | | | | | | | 666,200 | | | | 18,247,218 | |
Cynosure Incorporated Class A † | | | | | | | 351,178 | | | | 7,908,529 | |
DexCom Incorporated Ǡ | | | | | | | 516,770 | | | | 6,759,352 | |
Endologix Incorporated † | | | | | | | 1,883,094 | | | | 27,606,158 | |
HeartWare International Incorporated Ǡ | | | | | | | 74,700 | | | | 6,148,557 | |
Masimo Corporation « | | | | | | | 423,450 | | | | 8,773,884 | |
Novadaq Technologies Incorporated † | | | | | | | 531,900 | | | | 4,701,996 | |
NxStage Medical Incorporated † | | | | | | | 1,145,560 | | | | 13,769,631 | |
Volcano Corporation Ǡ | | | | | | | 399,530 | | | | 10,891,188 | |
| | | | |
| | | | | | | | | | | 107,885,023 | |
| | | | | | | | | | | | |
| | | | |
| Health Care Providers & Services: 1.00% | | | | | | | | | | | | |
MWI Veterinary Supply Incorporated † | | | | | | | 82,800 | | | | 9,243,792 | |
| | | | | | | | | | | | |
| | | | |
| Health Care Technology: 0.55% | | | | | | | | | | | | |
Healthstream Incorporated † | | | | | | | 215,400 | | | | 5,109,288 | |
| | | | | | | | | | | | |
| | | | |
| Pharmaceuticals: 5.32% | | | | | | | | | | | | |
Akorn Incorporated Ǡ | | | | | | | 1,903,535 | | | | 25,678,687 | |
Impax Laboratories Incorporated † | | | | | | | 359,240 | | | | 7,306,942 | |
Jazz Pharmaceuticals plc Ǡ | | | | | | | 301,480 | | | | 16,243,742 | |
| | | | |
| | | | | | | | | | | 49,229,371 | |
| | | | | | | | | | | | |
| | | | |
Industrials: 16.37% | | | | | | | | | | | | |
| | | | |
| Commercial Services & Supplies: 1.61% | | | | | | | | | | | | |
InnerWorkings Incorporated Ǡ | | | | | | | 1,141,673 | | | | 14,853,166 | |
| | | | | | | | | | | | |
| | | | |
| Electrical Equipment: 0.85% | | | | | | | | | | | | |
Thermon Group Holdings Incorporated † | | | | | | | 319,147 | | | | 7,892,505 | |
| | | | | | | | | | | | |
| | | | |
| Machinery: 3.12% | | | | | | | | | | | | |
Chart Industries Incorporated Ǡ | | | | | | | 176,185 | | | | 10,655,669 | |
Proto Labs Incorporated † | | | | | | | 134,155 | | | | 4,893,974 | |
The Middleby Corporation Ǡ | | | | | | | 104,850 | | | | 13,356,842 | |
| | | | |
| | | | | | | | | | | 28,906,485 | |
| | | | | | | | | | | | |
The accompanying notes are an integral part of these financial statements.
| | | | |
| 44 | | Wells Fargo Advantage Allocation Funds | | Portfolio of investments—November 30, 2012 (unaudited) |
EMERGING GROWTH PORTFOLIO
| | | | | | | | | | | | |
| Security name | | | | | | Shares | | | Value | |
| | | | | | | | | | | | |
| | | | |
| Professional Services: 5.27% | | | | | | | | | | | | |
Advisory Board Company Ǡ | | | | | | | 316,900 | | | $ | 14,339,725 | |
Corporate Executive Board Company | | | | | | | 191,000 | | | | 8,174,800 | |
Mistras Group Incorporated † | | | | | | | 349,498 | | | | 7,580,612 | |
On Assignment Incorporated Ǡ | | | | | | | 934,013 | | | | 18,614,879 | |
| | | | |
| | | | | | | | | | | 48,710,016 | |
| | | | | | | | | | | | |
| | | | |
| Road & Rail: 2.95% | | | | | | | | | | | | |
Genesee & Wyoming Incorporated Ǡ | | | | | | | 374,110 | | | | 27,291,325 | |
| | | | | | | | | | | | |
| | | | |
| Trading Companies & Distributors: 2.57% | | | | | | | | | | | | |
DXP Enterprises Incorporated † | | | | | | | 359,016 | | | | 17,336,883 | |
Titan Machinery Incorporated Ǡ | | | | | | | 292,772 | | | | 6,481,972 | |
| | | | |
| | | | | | | | | | | 23,818,855 | |
| | | | | | | | | | | | |
| | | | |
Information Technology: 35.25% | | | | | | | | | | | | |
| | | | |
| Communications Equipment: 2.90% | | | | | | | | | | | | |
Aruba Networks Incorporated Ǡ | | | | | | | 115,530 | | | | 2,250,524 | |
Ixia † | | | | | | | 1,087,441 | | | | 16,333,364 | |
Procera Networks Incorporated Ǡ | | | | | | | 399,301 | | | | 8,245,566 | |
| | | | |
| | | | | | | | | | | 26,829,454 | |
| | | | | | | | | | | | |
| | | | |
| Computers & Peripherals: 0.47% | | | | | | | | | | | | |
Stratasys Incorporated Ǡ | | | | | | | 58,500 | | | | 4,384,575 | |
| | | | | | | | | | | | |
| | | | |
| Electronic Equipment, Instruments & Components: 1.70% | | | | | | | | | | | | |
OSI Systems Incorporated † | | | | | | | 256,000 | | | | 15,687,680 | |
| | | | | | | | | | | | |
| | | | |
| Internet Software & Services: 9.12% | | | | | | | | | | | | |
Brightcove Incorporated † | | | | | | | 1,067,315 | | | | 10,374,302 | |
Envestnet Incorporated † | | | | | | | 1,018,430 | | | | 14,156,177 | |
Liquidity Services Incorporated Ǡ | | | | | | | 314,500 | | | | 12,913,370 | |
LivePerson Incorporated † | | | | | | | 201,604 | | | | 2,659,157 | |
Mercadolibre Incorporated « | | | | | | | 163,930 | | | | 11,794,764 | |
OpenTable Incorporated Ǡ | | | | | | | 178,000 | | | | 7,990,420 | |
SciQuest Incorporated † | | | | | | | 923,018 | | | | 15,035,963 | |
SPS Commerce Incorporated † | | | | | | | 257,100 | | | | 9,476,706 | |
| | | | |
| | | | | | | | | | | 84,400,859 | |
| | | | | | | | | | | | |
| | | | |
| IT Services: 4.61% | | | | | | | | | | | | |
Gartner Incorporated † | | | | | | | 154,758 | | | | 7,409,813 | |
MarketAxess Holdings Incorporated « | | | | | | | 396,051 | | | | 12,222,134 | |
Maximus Incorporated | | | | | | | 110,200 | | | | 6,941,494 | |
ServiceSource International Incorporated Ǡ | | | | | | | 262,900 | | | | 1,348,677 | |
Wex Incorporated Ǡ | | | | | | | 205,221 | | | | 14,767,703 | |
| | | | |
| | | | | | | | | | | 42,689,821 | |
| | | | | | | | | | | | |
The accompanying notes are an integral part of these financial statements.
| | | | | | |
| Portfolio of investments—November 30, 2012 (unaudited) | | Wells Fargo Advantage Allocation Funds | | | 45 | |
EMERGING GROWTH PORTFOLIO
| | | | | | | | | | | | | | |
| Security name | | | | | | | Shares | | | Value | |
| | | | | | | | | | | | | | |
| | | | |
| Semiconductors & Semiconductor Equipment: 1.62% | | | | | | | | | | | | | | |
Cavium Incorporated Ǡ | | | | | | | | | 160,790 | | | $ | 5,664,632 | |
Entegris Incorporated † | | | | | | | | | 1,043,540 | | | | 9,350,118 | |
| | | | |
| | | | | | | | | | | | | 15,014,750 | |
| | | | | | | | | | | | | | |
| | | | |
| Software: 14.83% | | | | | | | | | | | | | | |
Allot Communications Limited Ǡ | | | | | | | | | 450,043 | | | | 9,828,939 | |
Aspen Technology Incorporated † | | | | | | | | | 142,500 | | | | 3,703,575 | |
Broadsoft Incorporated Ǡ | | | | | | | | | 556,673 | | | | 17,607,567 | |
Fleetmatics Group plc « † | | | | | | | | | 382,540 | | | | 8,331,721 | |
Fortinet Incorporated † | | | | | | | | | 592,200 | | | | 11,832,156 | |
Guidewire Software Incorporated † | | | | | | | | | 252,200 | | | | 7,540,780 | |
Imperva Incorporated Ǡ | | | | | | | | | 275,791 | | | | 8,483,331 | |
Infoblox Incorporated † | | | | | | | | | 186,100 | | | | 3,528,456 | |
PROS Holdings Incorporated † | | | | | | | | | 425,522 | | | | 7,544,505 | |
Solarwinds Incorporated † | | | | | | | | | 371,964 | | | | 20,841,143 | |
Sourcefire Incorporated Ǡ | | | | | | | | | 307,700 | | | | 15,148,071 | |
Synchronoss Technologies Incorporated Ǡ | | | | | | | | | 603,601 | | | | 11,021,754 | |
Ultimate Software Group Incorporated † | | | | | | | | | 124,670 | | | | 11,782,562 | |
| | | | |
| | | | | | | | | | | | | 137,194,560 | |
| | | | | | | | | | | | | | |
| | | | |
Materials: 0.01% | | | | | | | | | | | | | | |
| | | | |
| Chemicals: 0.01% | | | | | | | | | | | | | | |
Landec Corporation † | | | | | | | | | 6,189 | | | | 61,959 | |
| | | | | | | | | | | | | | |
| | | | |
Total Common Stocks (Cost $839,109,014) | | | | | | | | | | | | | 908,145,519 | |
| | | | | | | | | | | | | | |
| | | | |
Investment Companies: 0.35% | | | | | | | | | | | | | | |
iShares Russell 2000 Growth Index Fund « | | | | | | | | | 35,000 | | | | 3,272,850 | |
| | | | | | | | | | | | | | |
| | | | |
Total Investment Companies (Cost $3,354,397) | | | | | | | | | | | | | 3,272,850 | |
| | | | | | | | | | | | | | |
| | | | |
| | | | | | | | Principal | | | | |
| | | | |
Other: 0.16% | | | | | | | | | | | | | | |
Gryphon Funding Limited, Pass-Through Entity (a)(i)(v) | | | | | | | | $ | 4,359,499 | | | | 1,438,635 | |
| | | | | | | | | | | | | | |
| | | | |
Total Other (Cost $413,054) | | | | | | | | | | | | | 1,438,635 | |
| | | | | | | | | | | | | | |
| | | | |
| | | | | Yield | | | Shares | | | | |
| | | | |
Short-Term Investments: 32.65% | | | | | | | | | | | | | | |
| | | | |
| Investment Companies: 32.65% | | | | | | | | | | | | | | |
Wells Fargo Advantage Cash Investment Money Market Fund, Select Class (l)(u) | | | | | 0.16 | % | | | 14,554,639 | | | | 14,554,639 | |
Wells Fargo Securities Lending Cash Investments, LLC (v)(r)(l)(u) | | | | | 0.21 | | | | 287,604,201 | | | | 287,604,201 | |
| | | | |
Total Short-Term Investments (Cost $302,158,840) | | | | | | | | | | | | | 302,158,840 | |
| | | | | | | | | | | | | | |
| | | | | | | | |
| Total investments in securities | | | | | | | | |
| (Cost $1,145,035,305) * | | | 131.31 | % | | | 1,215,015,844 | |
Other assets and liabilities, net | | | (31.31 | ) | | | (289,724,512 | ) |
| | | | | | | | |
| Total net assets | | | 100.00 | % | | $ | 925,291,332 | |
| | | | | | | | |
The accompanying notes are an integral part of these financial statements.
| | | | |
| 46 | | Wells Fargo Advantage Allocation Funds | | Portfolio of investments—November 30, 2012 (unaudited) |
EMERGING GROWTH PORTFOLIO
| † | Non-income-earning security |
| « | All or a portion of this security is on loan. |
| (a) | Security is fair valued by the Management Valuation Team, and in certain instances by the Board of Trustees, in accordance with procedures approved by the Board of Trustees. |
| (v) | Security represents investment of cash collateral received from securities on loan. |
| (l) | Investment in an affiliate |
| (u) | Rate shown is the 7-day annualized yield at period end. |
| (r) | The investment company is exempt from registration under Section 3(c)(7) of the Investment Company Act of 1940, as amended. |
| * | Cost for federal income tax purposes is $1,148,971,009 and unrealized appreciation (depreciation) consists of: |
| | | | |
Gross unrealized appreciation | | $ | 117,856,874 | |
Gross unrealized depreciation | | | (51,812,039 | ) |
| | | | |
Net unrealized appreciation | | $ | 66,044,835 | |
The accompanying notes are an integral part of these financial statements.
| | | | | | |
| Portfolio of investments—November 30, 2012 (unaudited) | | Wells Fargo Advantage Allocation Funds | | | 47 | |
EQUITY VALUE PORTFOLIO
| | | | | | | | | | | | |
| Security name | | | | | | Shares | | | Value | |
| | | | | | | | | | | | |
| | | | |
Common Stocks: 98.74% | | | | | | | | | | | | |
| | | | |
Consumer Discretionary: 8.96% | | | | | | | | | | | | |
| | | | |
| Auto Components: 0.59% | | | | | | | | | | | | |
Delphi Automotive plc † | | | | | | | 152,300 | | | $ | 5,176,677 | |
| | | | | | | | | | | | |
| | | | |
| Household Durables: 0.62% | | | | | | | | | | | | |
Pulte Homes Incorporated † | | | | | | | 323,450 | | | | 5,437,195 | |
| | | | | | | | | | | | |
| | | | |
| Media: 1.32% | | | | | | | | | | | | |
Comcast Corporation Class A | | | | | | | 156,200 | | | | 5,807,516 | |
News Corporation Class A | | | | | | | 233,350 | | | | 5,749,744 | |
| | | | |
| | | | | | | | | | | 11,557,260 | |
| | | | | | | | | | | | |
| | | | |
| Multiline Retail: 2.00% | | | | | | | | | | | | |
Dollar General Corporation † | | | | | | | 163,650 | | | | 8,182,500 | |
Macy’s Incorporated | | | | | | | 240,800 | | | | 9,318,960 | |
| | | | |
| | | | | | | | | | | 17,501,460 | |
| | | | | | | | | | | | |
| | | | |
| Specialty Retail: 3.82% | | | | | | | | | | | | |
Bed Bath & Beyond Incorporated † | | | | | | | 105,300 | | | | 6,183,216 | |
Foot Locker Incorporated | | | | | | | 526,900 | | | | 18,884,089 | |
GNC Holdings Incorporated Class A | | | | | | | 236,050 | | | | 8,292,437 | |
| | | | |
| | | | | | | | | | | 33,359,742 | |
| | | | | | | | | | | | |
| | | | |
| Textiles, Apparel & Luxury Goods: 0.61% | | | | | | | | | | | | |
PVH Corporation | | | | | | | 46,650 | | | | 5,345,624 | |
| | | | | | | | | | | | |
| | | | |
Consumer Staples: 10.08% | | | | | | | | | | | | |
| | | | |
| Beverages: 1.51% | | | | | | | | | | | | |
Anheuser-Busch Companies Incorporated ADR « | | | | | | | 100,025 | | | | 8,799,199 | |
The Coca-Cola Company | | | | | | | 115,850 | | | | 4,393,032 | |
| | | | |
| | | | | | | | | | | 13,192,231 | |
| | | | | | | | | | | | |
| | | | |
| Food & Staples Retailing: 3.92% | | | | | | | | | | | | |
CVS Caremark Corporation | | | | | | | 406,300 | | | | 18,897,013 | |
Kroger Company | | | | | | | 166,750 | | | | 4,375,520 | |
Walgreen Company | | | | | | | 325,750 | | | | 11,046,183 | |
| | | | |
| | | | | | | | | | | 34,318,716 | |
| | | | | | | | | | | | |
| | | | |
| Food Products: 2.75% | | | | | | | | | | | | |
JM Smucker Company « | | | | | | | 79,850 | | | | 7,063,531 | |
Kraft Foods Group Incorporated † | | | | | | | 139,283 | | | | 6,298,377 | |
Mondelez International Incorporated Class A | | | | | | | 411,850 | | | | 10,662,797 | |
| | | | |
| | | | | | | | | | | 24,024,705 | |
| | | | | | | | | | | | |
| | | | |
| Household Products: 1.42% | | | | | | | | | | | | |
Procter & Gamble Company | | | | | | | 177,225 | | | | 12,375,622 | |
| | | | | | | | | | | | |
| | | | |
| Personal Products: 0.48% | | | | | | | | | | | | |
Herbalife Limited « | | | | | | | 91,800 | | | | 4,220,046 | |
| | | | | | | | | | | | |
The accompanying notes are an integral part of these financial statements.
| | | | |
| 48 | | Wells Fargo Advantage Allocation Funds | | Portfolio of investments—November 30, 2012 (unaudited) |
EQUITY VALUE PORTFOLIO
| | | | | | | | | | | | |
| Security name | | | | | | Shares | | | Value | |
| | | | | | | | | | | | |
| | | | |
Energy: 15.17% | | | | | | | | | | | | |
| | | | |
| Energy Equipment & Services: 2.16% | | | | | | | | | | | | |
Cameron International Corporation † | | | | | | | 130,500 | | | $ | 7,040,475 | |
National Oilwell Varco Incorporated | | | | | | | 105,300 | | | | 7,191,990 | |
Transocean Limited | | | | | | | 100,600 | | | | 4,647,720 | |
| | | | |
| | | | | | | | | | | 18,880,185 | |
| | | | | | | | | | | | |
| | | | |
| Oil, Gas & Consumable Fuels: 13.01% | | | | | | | | | | | | |
Anadarko Petroleum Corporation | | | | | | | 153,550 | | | | 11,238,325 | |
Apache Corporation « | | | | | | | 113,900 | | | | 8,780,551 | |
Chevron Corporation | | | | | | | 256,400 | | | | 27,098,916 | |
ConocoPhillips Company | | | | | | | 192,725 | | | | 10,973,762 | |
Devon Energy Corporation | | | | | | | 79,700 | | | | 4,118,099 | |
Exxon Mobil Corporation | | | | | | | 99,050 | | | | 8,730,267 | |
Hess Corporation | | | | | | | 178,350 | | | | 8,847,944 | |
HollyFrontier Corporation « | | | | | | | 147,125 | | | | 6,669,176 | |
Marathon Petroleum Corporation | | | | | | | 80,700 | | | | 4,804,878 | |
Peabody Energy Corporation | | | | | | | 280,300 | | | | 7,038,333 | |
Plains Exploration & Product Company †« | | | | | | | 194,150 | | | | 6,931,155 | |
Suncor Energy Incorporated « | | | | | | | 261,500 | | | | 8,527,515 | |
| | | | |
| | | | | | | | | | | 113,758,921 | |
| | | | | | | | | | | | |
| | | | |
Financials: 24.66% | | | | | | | | | | | | |
| | | | |
| Commercial Banks: 6.06% | | | | | | | | | | | | |
Fifth Third Bancorp | | | | | | | 928,500 | | | | 13,593,240 | |
KeyCorp | | | | | | | 461,100 | | | | 3,725,688 | |
PNC Financial Services Group Incorporated | | | | | | | 448,075 | | | | 25,154,931 | |
Regions Financial Corporation | | | | | | | 678,600 | | | | 4,526,262 | |
SunTrust Banks Incorporated | | | | | | | 220,300 | | | | 5,981,145 | |
| | | | |
| | | | | | | | | | | 52,981,266 | |
| | | | | | | | | | | | |
| | | | |
| Consumer Finance: 4.67% | | | | | | | | | | | | |
Capital One Financial Corporation | | | | | | | 243,600 | | | | 14,031,360 | |
Discover Financial Services | | | | | | | 644,400 | | | | 26,813,484 | |
| | | | |
| | | | | | | | | | | 40,844,844 | |
| | | | | | | | | | | | |
| | | | |
| Diversified Financial Services: 6.11% | | | | | | | | | | | | |
Bank of America Corporation | | | | | | | 1,380,000 | | | | 13,606,800 | |
Citigroup Incorporated | | | | | | | 428,100 | | | | 14,799,417 | |
JPMorgan Chase & Company | | | | | | | 608,800 | | | | 25,009,504 | |
| | | | |
| | | | | | | | | | | 53,415,721 | |
| | | | | | | | | | | | |
| | | | |
| Insurance: 7.08% | | | | | | | | | | | | |
AFLAC Incorporated « | | | | | | | 76,050 | | | | 4,029,890 | |
Allstate Corporation | | | | | | | 195,800 | | | | 7,925,984 | |
American International Group Incorporated † | | | | | | | 526,125 | | | | 17,430,521 | |
Fidelity National Title Group Incorporated | | | | | | | 184,150 | | | | 4,458,272 | |
Lincoln National Corporation | | | | | | | 394,150 | | | | 9,735,505 | |
MetLife Incorporated | | | | | | | 552,400 | | | | 18,334,156 | |
| | | | |
| | | | | | | | | | | 61,914,328 | |
| | | | | | | | | | | | |
The accompanying notes are an integral part of these financial statements.
| | | | | | |
| Portfolio of investments—November 30, 2012 (unaudited) | | Wells Fargo Advantage Allocation Funds | | | 49 | |
EQUITY VALUE PORTFOLIO
| | | | | | | | | | | | |
| Security name | | | | | | Shares | | | Value | |
| | | | | | | | | | | | |
| | | | |
| REITs: 0.74% | | | | | | | | | | | | |
Digital Realty Trust Incorporated | | | | | | | 101,125 | | | $ | 6,526,608 | |
| | | | | | | | | | | | |
| | | | |
Health Care: 14.12% | | | | | | | | | | | | |
| | | | |
| Biotechnology: 2.20% | | | | | | | | | | | | |
Amgen Incorporated | | | | | | | 115,125 | | | | 10,223,100 | |
Celgene Corporation † | | | | | | | 56,950 | | | | 4,475,701 | |
Gilead Sciences Incorporated †« | | | | | | | 59,950 | | | | 4,496,250 | |
| | | | |
| | | | | | | | | | | 19,195,051 | |
| | | | | | | | | | | | |
| | | | |
| Health Care Providers & Services: 2.06% | | | | | | | | | | | | |
Express Scripts Holding Corporation † | | | | | | | 70,500 | | | | 3,796,425 | |
UnitedHealth Group Incorporated | | | | | | | 261,800 | | | | 14,239,302 | |
| | | | |
| | | | | | | | | | | 18,035,727 | |
| | | | | | | | | | | | |
| | | | |
| Pharmaceuticals: 9.86% | | | | | | | | | | | | |
Abbott Laboratories | | | | | | | 189,725 | | | | 12,332,125 | |
AstraZeneca plc ADR « | | | | | | | 95,500 | | | | 4,540,070 | |
Bristol-Myers Squibb Company | | | | | | | 236,400 | | | | 7,713,732 | |
Eli Lilly & Company | | | | | | | 232,675 | | | | 11,410,382 | |
Johnson & Johnson Services Incorporated | | | | | | | 53,800 | | | | 3,751,474 | |
Merck & Company Incorporated | | | | | | | 383,200 | | | | 16,975,760 | |
Pfizer Incorporated | | | | | | | 1,180,400 | | | | 29,533,608 | |
| | | | |
| | | | | | | | | | | 86,257,151 | |
| | | | | | | | | | | | |
| | | | |
Industrials: 7.05% | | | | | | | | | | | | |
| | | | |
| Airlines: 0.39% | | | | | | | | | | | | |
Delta Air Lines Incorporated † | | | | | | | 337,000 | | | | 3,370,000 | |
| | | | | | | | | | | | |
| | | | |
| Industrial Conglomerates: 3.75% | | | | | | | | | | | | |
General Electric Company | | | | | | | 1,553,200 | | | | 32,819,116 | |
| | | | | | | | | | | | |
| | | | |
| Machinery: 1.84% | | | | | | | | | | | | |
Eaton Corporation « | | | | | | | 309,150 | | | | 16,125,264 | |
| | | | | | | | | | | | |
| | | | |
| Trading Companies & Distributors: 1.07% | | | | | | | | | | | | |
United Rentals Incorporated †« | | | | | | | 224,400 | | | | 9,319,332 | |
| | | | | | | | | | | | |
| | | | |
Information Technology: 8.17% | | | | | | | | | | | | |
| | | | |
| Communications Equipment: 2.70% | | | | | | | | | | | | |
Cisco Systems Incorporated | | | | | | | 997,000 | | | | 18,853,270 | |
QUALCOMM Incorporated | | | | | | | 75,100 | | | | 4,777,862 | |
| | | | |
| | | | | | | | | | | 23,631,132 | |
| | | | | | | | | | | | |
| | | | |
| Computers & Peripherals: 0.99% | | | | | | | | | | | | |
EMC Corporation † | | | | | | | 348,050 | | | | 8,638,601 | |
| | | | | | | | | | | | |
| | | | |
| Internet Software & Services: 0.50% | | | | | | | | | | | | |
Yahoo! Incorporated † | | | | | | | 234,600 | | | | 4,403,442 | |
| | | | | | | | | | | | |
The accompanying notes are an integral part of these financial statements.
| | | | |
| 50 | | Wells Fargo Advantage Allocation Funds | | Portfolio of investments—November 30, 2012 (unaudited) |
EQUITY VALUE PORTFOLIO
| | | | | | | | | | | | |
| Security name | | | | | | Shares | | | Value | |
| | | | | | | | | | | | |
| | | | |
| Semiconductors & Semiconductor Equipment: 2.81% | | | | | | | | | | | | |
Broadcom Corporation Class A | | | | | | | 361,800 | | | $ | 11,715,084 | |
NXP Semiconductors †« | | | | | | | 154,000 | | | | 3,769,920 | |
Skyworks Solutions Incorporated † | | | | | | | 402,000 | | | | 9,105,300 | |
| | | | |
| | | | | | | | | | | 24,590,304 | |
| | | | | | | | | | | | |
| | | | |
| Software: 1.17% | | | | | | | | | | | | |
Adobe Systems Incorporated † | | | | | | | 154,650 | | | | 5,352,437 | |
Microsoft Corporation | | | | | | | 183,500 | �� | | | 4,884,770 | |
| | | | |
| | | | | | | | | | | 10,237,207 | |
| | | | | | | | | | | | |
| | | | |
Materials: 3.59% | | | | | | | | | | | | |
| | | | |
| Chemicals: 2.09% | | | | | | | | | | | | |
CF Industries Holdings Incorporated | | | | | | | 18,910 | | | | 4,047,307 | |
LyondellBasell Industries NV Class A | | | | | | | 171,550 | | | | 8,531,182 | |
PPG Industries Incorporated | | | | | | | 45,775 | | | | 5,688,459 | |
| | | | |
| | | | | | | | | | | 18,266,948 | |
| | | | | | | | | | | | |
| | | | |
| Metals & Mining: 1.50% | | | | | | | | | | | | |
Freeport-McMoRan Copper & Gold Incorporated Class B | | | | | | | 336,200 | | | | 13,115,162 | |
| | | | | | | | | | | | |
| | | | |
Telecommunication Services: 3.70% | | | | | | | | | | | | |
| | | | |
| Diversified Telecommunication Services: 3.70% | | | | | | | | | | | | |
AT&T Incorporated | | | | | | | 658,450 | | | | 22,472,899 | |
Verizon Communications Incorporated | | | | | | | 224,600 | | | | 9,909,352 | |
| | | | |
| | | | | | | | | | | 32,382,251 | |
| | | | | | | | | | | | |
| | | | |
Utilities: 3.24% | | | | | | | | | | | | |
| | | | |
| Electric Utilities: 1.82% | | | | | | | | | | | | |
PPL Corporation | | | | | | | 542,500 | | | | 15,922,375 | |
| | | | | | | | | | | | |
| | | | |
| Gas Utilities: 0.65% | | | | | | | | | | | | |
Energen Corporation | | | | | | | 128,800 | | | | 5,735,464 | |
| | | | | | | | | | | | |
| | | | |
| Multi-Utilities: 0.77% | | | | | | | | | | | | |
NiSource Incorporated « | | | | | | | 277,450 | | | | 6,705,967 | |
| | | | | | | | | | | | |
| | | | |
Total Common Stocks (Cost $772,236,961) | | | | | | | | | | | 863,581,645 | |
| | | | | | | | | | | | |
| | | | | | | Principal | | | | |
| | | | |
Other: 0.05% | | | | | | | | | | | | |
Gryphon Funding Limited, Pass-Through Entity (i)(a)(v) | | | | | | $ | 1,175,007 | | | | 387,752 | |
| | | | | | | | | | | | |
| | | | |
Total Other (Cost $111,329) | | | | | | | | | | | 387,752 | |
| | | | | | | | | | | | |
The accompanying notes are an integral part of these financial statements.
| | | | | | |
| Portfolio of investments—November 30, 2012 (unaudited) | | Wells Fargo Advantage Allocation Funds | | | 51 | |
EQUITY VALUE PORTFOLIO
| | | | | | | | | | | | | | |
| Security name | | | | Yield | | | Shares | | | Value | |
| | | | | | | | | | | | | | |
| Short-Term Investments: 7.58% | | | | | | | | | | | | | | |
| | | | |
| Investment Companies: 7.58% | | | | | | | | | | | | | | |
Wells Fargo Advantage Cash Investment Money Market Fund, Select Class (l)(u) | | | | | 0.16 | % | | | 12,139,015 | | | $ | 12,139,015 | |
Wells Fargo Securities Lending Cash Investments, LLC (v)(l)(u)(r) | | | | | 0.21 | | | | 54,138,746 | | | | 54,138,746 | |
| | | | |
Total Short-Term Investments (Cost $66,277,761) | | | | | | | | | | | | | 66,277,761 | |
| | | | | | | | | | | | | | |
| | | | | | | | |
Total investments in securities
(Cost $838,626,051) * | | | 106.37 | % | | | 930,247,158 | |
Other assets and liabilities, net | | | (6.37 | ) | | | (55,678,493 | ) |
| | | | | | | | |
| Total net assets | | | 100.00 | % | | $ | 874,568,665 | |
| | | | | | | | |
| † | Non-income-earning security |
| « | All or a portion of this security is on loan. |
| (a) | Security is fair valued by the Management Valuation Team, and in certain instances by the Board of Trustees, in accordance with procedures approved by the Board of Trustees. |
| (v) | Security represents investment of cash collateral received from securities on loan. |
| (l) | Investment in an affiliate |
| (u) | Rate shown is the 7-day annualized yield at period end. |
| (r) | The investment company is exempt from registration under Section 3(c)(7) of the Investment Company Act of 1940, as amended. |
| * | Cost for federal income tax purposes is $843,914,887 and unrealized appreciation (depreciation) consists of: |
| | | | |
Gross unrealized appreciation | | $ | 100,987,042 | |
Gross unrealized depreciation | | | (14,654,771 | ) |
| | | | |
Net unrealized appreciation | | $ | 86,332,271 | |
The accompanying notes are an integral part of these financial statements.
| | | | |
| 52 | | Wells Fargo Advantage Allocation Funds | | Summary portfolio of investments—November 30, 2012 (unaudited) |
INDEX PORTFOLIO
The Summary Portfolio of Investments shows the 50 largest portfolio holdings in unaffiliated issuers and any holdings exceeding 1% of the total net assets as of the report date. The remaining securities held are grouped as “Other securities” in each category. You can request a complete schedule of portfolio holdings as of the report date, free of charge, by accessing the following website: http://a584.g.akamai.net/f/584/1326/1d/www.wellsfargoadvantagefunds.com/pdf/semi/holdings/index.pdf or by calling Wells Fargo Advantage Funds at 1-800-222-8222. This complete schedule, filed on the Form N-CSR, is also available on the SEC’s website at sec.gov.
| | | | | | | | | | | | | | | | |
| Security name | | | | | | Shares | | | Value | | | Percent of
net assets | |
| | | | | |
Common Stocks: 98.03% | | | | | | | | | | | | | | | | |
| | | | | |
Consumer Discretionary: 11.31% | | | | | | | | | | | | | | | | |
| | | | | |
| Auto Components: 0.23% | | | | | | | | | | | | | | | | |
Other securities | | | | | | | | | | $ | 5,729,071 | | | | 0.23 | % |
| | | | | | | | | | | | | | | | |
| | | | | |
| Automobiles: 0.42% | | | | | | | | | | | | | | | | |
Other securities | | | | | | | | | | | 10,557,255 | | | | 0.42 | |
| | | | | | | | | | | | | | | | |
| | | | | |
| Distributors: 0.08% | | | | | | | | | | | | | | | | |
Other securities | | | | | | | | | | | 1,960,185 | | | | 0.08 | |
| | | | | | | | | | | | | | | | |
| | | | | |
| Diversified Consumer Services: 0.05% | | | | | | | | | | | | | | | | |
Other securities | | | | | | | | | | | 1,325,069 | | | | 0.05 | |
| | | | | | | | | | | | | | | | |
| | | | | |
| Hotels, Restaurants & Leisure: 1.78% | | | | | | | | | | | | | | | | |
McDonald’s Corporation « | | | | | | | 195,803 | | | | 17,042,693 | | | | 0.68 | |
Other securities | | | | | | | | | | | 27,527,805 | | | | 1.10 | |
| | | | | |
| | | | | | | | | | | 44,570,498 | | | | 1.78 | |
| | | | | | | | | | | | | | | | |
| | | | | |
| Household Durables: 0.39% | | | | | | | | | | | | | | | | |
Other securities | | | | | | | | | | | 9,734,576 | | | | 0.39 | |
| | | | | | | | | | | | | | | | |
| | | | | |
| Internet & Catalog Retail: 1.07% | | | | | | | | | | | | | | | | |
Amazon.com Incorporated †† | | | | | | | 70,221 | | | | 17,699,203 | | | | 0.70 | |
Other securities | | | | | | | | | | | 9,234,158 | | | | 0.37 | |
| | | | | |
| | | | | | | | | | | 26,933,361 | | | | 1.07 | |
| | | | | | | | | | | | | | | | |
| | | | | |
| Leisure Equipment & Products: 0.13% | | | | | | | | | | | | | | | | |
Other securities | | | | | | | | | | | 3,348,591 | | | | 0.13 | |
| | | | | | | | | | | | | | | | |
| | | | | |
| Media: 3.49% | | | | | | | | | | | | | | | | |
Comcast Corporation Class A | | | | | | | 519,555 | | | | 19,317,055 | | | | 0.77 | |
Walt Disney Company | | | | | | | 348,387 | | | | 17,300,898 | | | | 0.69 | |
Other securities | | | | | | | | | | | 51,031,769 | | | | 2.03 | |
| | | | | |
| | | | | | | | | | | 87,649,722 | | | | 3.49 | |
| | | | | | | | | | | | | | | | |
| | | | | |
| Multiline Retail: 0.84% | | | | | | | | | | | | | | | | |
Other securities | | | | | | | | | | | 21,136,868 | | | | 0.84 | |
| | | | | | | | | | | | | | | | |
| | | | | |
| Specialty Retail: 2.27% | | | | | | | | | | | | | | | | |
Home Depot Incorporated | | | | | | | 292,694 | | | | 19,045,599 | | | | 0.76 | |
Other securities | | | | | | | | | | | 37,961,338 | | | | 1.51 | |
| | | | | |
| | | | | | | | | | | 57,006,937 | | | | 2.27 | |
| | | | | | | | | | | | | | | | |
| | | | | |
| Textiles, Apparel & Luxury Goods: 0.62% | | | | | | | | | | | | | | | | |
Other securities | | | | | | | | | | | 15,683,058 | | | | 0.62 | |
| | | | | | | | | | | | | | | | |
The accompanying notes are an integral part of these financial statements.
| | | | | | |
| Summary portfolio of investments—November 30, 2012 (unaudited) | | Wells Fargo Advantage Allocation Funds | | | 53 | |
INDEX PORTFOLIO
| | | | | | | | | | | | | | | | |
| Security name | | | | | | Shares | | | Value | | | Percent of
net assets | |
| | | | | | | | | | | | | | | | |
| | | | | |
Consumer Staples: 10.82% | | | | | | | | | | | | | | | | |
| | | | | |
| Beverages: 2.42% | | | | | | | | | | | | | | | | |
PepsiCo Incorporated | | | | | | | 302,176 | | | $ | 21,215,777 | | | | 0.84 | % |
The Coca-Cola Company | | | | | | | 751,744 | | | | 28,506,132 | | | | 1.14 | |
Other securities | | | | | | | | | | | 11,127,995 | | | | 0.44 | |
| | | | | |
| | | | | | | | | | | 60,849,904 | | | | 2.42 | |
| | | | | | | | | | | | | | | | |
| | | | | |
| Food & Staples Retailing: 2.38% | | | | | | | | | | | | | | | | |
CVS Caremark Corporation | | | | | | | 247,025 | | | | 11,489,133 | | | | 0.46 | |
Wal-Mart Stores Incorporated | | | | | | | 326,339 | | | | 23,502,935 | | | | 0.94 | |
Other securities | | | | | | | | | | | 24,661,725 | | | | 0.98 | |
| | | | | |
| | | | | | | | | | | 59,653,793 | | | | 2.38 | |
| | | | | | | | | | | | | | | | |
| | | | | |
| Food Products: 1.73% | | | | | | | | | | | | | | | | |
Other securities | | | | | | | | | | | 43,519,623 | | | | 1.73 | |
| | | | | | | | | | | | | | | | |
| | | | | |
| Household Products: 2.20% | | | | | | | | | | | | | | | | |
Procter & Gamble Company | | | | | | | 534,787 | | | | 37,344,176 | | | | 1.49 | |
Other securities | | | | | | | | | | | 17,884,105 | | | | 0.71 | |
| | | | | |
| | | | | | | | | | | 55,228,281 | | | | 2.20 | |
| | | | | | | | | | | | | | | | |
| | | | | |
| Personal Products: 0.15% | | | | | | | | | | | | | | | | |
Other securities | | | | | | | | | | | 3,885,456 | | | | 0.15 | |
| | | | | | | | | | | | | | | | |
| | | | | |
| Tobacco: 1.94% | | | | | | | | | | | | | | | | |
Altria Group Incorporated | | | | | | | 394,708 | | | | 13,345,077 | | | | 0.53 | |
Philip Morris International | | | | | | | 327,310 | | | | 29,418,623 | | | | 1.17 | |
Other securities | | | | | | | | | | | 5,856,785 | | | | 0.24 | |
| | | | | |
| | | | | | | | | | | 48,620,485 | | | | 1.94 | |
| | | | | | | | | | | | | | | | |
| | | | | |
Energy: 10.79% | | | | | | | | | | | | | | | | |
| | | | | |
| Energy Equipment & Services: 1.84% | | | | | | | | | | | | | | | | |
Schlumberger Limited | | | | | | | 257,664 | | | | 18,453,896 | | | | 0.73 | |
Other securities | | | | | | | | | | | 27,728,165 | | | | 1.11 | |
| | | | | |
| | | | | | | | | | | 46,182,061 | | | | 1.84 | |
| | | | | | | | | | | | | | | | |
| | | | | |
| Oil, Gas & Consumable Fuels: 8.95% | | | | | | | | | | | | | | | | |
Chevron Corporation | | | | | | | 380,981 | | | | 40,265,882 | | | | 1.60 | |
ConocoPhillips Company | | | | | | | 235,824 | | | | 13,427,819 | | | | 0.53 | |
Exxon Mobil Corporation | | | | | | | 896,260 | | | | 78,996,356 | | | | 3.15 | |
Occidental Petroleum Corporation | | | | | | | 157,264 | | | | 11,827,825 | | | | 0.47 | |
Other securities | | | | | | | | | | | 80,358,768 | | | | 3.20 | |
| | | | | |
| | | | | | | | | | | 224,876,650 | | | | 8.95 | |
| | | | | | | | | | | | | | | | |
| | | | | |
Financials: 14.67% | | | | | | | | | | | | | | | | |
| | | | | |
| Capital Markets: 1.87% | | | | | | | | | | | | | | | | |
Goldman Sachs Group Incorporated | | | | | | | 87,501 | | | | 10,306,743 | | | | 0.41 | |
Other securities | | | | | | | | | | | 36,626,864 | | | | 1.46 | |
| | | | | |
| | | | | | | | | | | 46,933,607 | | | | 1.87 | |
| | | | | | | | | | | | | | | | |
The accompanying notes are an integral part of these financial statements.
| | | | |
| 54 | | Wells Fargo Advantage Allocation Funds | | Summary portfolio of investments—November 30, 2012 (unaudited) |
INDEX PORTFOLIO
| | | | | | | | | | | | | | | | |
| Security name | | | | | | Shares | | | Value | | | Percent of
net assets | |
| | | | | | | | | | | | | | | | |
| | | | | |
| Commercial Banks: 2.68% | | | | | | | | | | | | | | | | |
US Bancorp | | | | | | | 368,003 | | | $ | 11,871,777 | | | | 0.47 | % |
Wells Fargo & Company (l) | | | | | | | 953,829 | | | | 31,485,895 | | | | 1.25 | |
Other securities | | | | | | | | | | | 23,951,235 | | | | 0.96 | |
| | | | | |
| | | | | | | | | | | 67,308,907 | | | | 2.68 | |
| | | | | | | | | | | | | | | | |
| | | | | |
| Consumer Finance: 0.91% | | | | | | | | | | | | | | | | |
American Express Company | | | | | | | 191,501 | | | | 10,704,906 | | | | 0.43 | |
Other securities | | | | | | | | | | | 12,166,382 | | | | 0.48 | |
| | | | | |
| | | | | | | | | | | 22,871,288 | | | | 0.91 | |
| | | | | | | | | | | | | | | | |
| | | | | |
| Diversified Financial Services: 4.44% | | | | | | | | | | | | | | | | |
Bank of America Corporation | | | | | | | 2,092,520 | | | | 20,632,247 | | | | 0.82 | |
Berkshire Hathaway Incorporated Class B † | | | | | | | 356,069 | | | | 31,362,558 | | | | 1.25 | |
Citigroup Incorporated | | | | | | | 569,389 | | | | 19,683,778 | | | | 0.78 | |
JPMorgan Chase & Company | | | | | | | 737,590 | | | | 30,300,197 | | | | 1.21 | |
Other securities | | | | | | | | | | | 9,499,035 | | | | 0.38 | |
| | | | | |
| | | | | | | | | | | 111,477,815 | | | | 4.44 | |
| | | | | | | | | | | | | | | | |
| | | | | |
| Insurance: 2.57% | | | | | | | | | | | | | | | | |
Other securities | | | | | | | | | | | 64,620,169 | | | | 2.57 | |
| | | | | | | | | | | | | | | | |
| | | | | |
| Real Estate Management & Development: 0.05% | | | | | | | | | | | | | | | | |
Other securities | | | | | | | | | | | 1,109,885 | | | | 0.05 | |
| | | | | | | | | | | | | | | | |
| | | | | |
| REITs: 2.09% | | | | | | | | | | | | | | | | |
Other securities | | | | | | | | | | | 52,517,665 | | | | 2.09 | |
| | | | | | | | | | | | | | | | |
| | | | | |
| Thrifts & Mortgage Finance: 0.06% | | | | | | | | | | | | | | | | |
Other securities | | | | | | | | | | | 1,575,260 | | | | 0.06 | |
| | | | | | | | | | | | | | | | |
| | | | | |
Health Care: 11.92% | | | | | | | | | | | | | | | | |
| | | | | |
| Biotechnology: 1.64% | | | | | | | | | | | | | | | | |
Amgen Incorporated | | | | | | | 149,657 | | | | 13,289,542 | | | | 0.53 | |
Gilead Sciences Incorporated Ǡ | | | | | | | 146,900 | | | | 11,017,500 | | | | 0.44 | |
Other securities | | | | | | | | | | | 17,024,622 | | | | 0.67 | |
| | | | | |
| | | | | | | | | | | 41,331,664 | | | | 1.64 | |
| | | | | | | | | | | | | | | | |
| | | | | |
| Health Care Equipment & Supplies: 1.75% | | | | | | | | | | | | | | | | |
Other securities | | | | | | | | | | | 43,997,456 | | | | 1.75 | |
| | | | | | | | | | | | | | | | |
| | | | | |
| Health Care Providers & Services: 1.87% | | | | | | | | | | | | | | | | |
UnitedHealth Group Incorporated | | | | | | | 200,517 | | | | 10,906,120 | | | | 0.44 | |
Other securities | | | | | | | | | | | 36,010,890 | | | | 1.43 | |
| | | | | |
| | | | | | | | | | | 46,917,010 | | | | 1.87 | |
| | | | | | | | | | | | | | | | |
| | | | | |
| Health Care Technology: 0.09% | | | | | | | | | | | | | | | | |
Other securities | | | | | | | | | | | 2,181,542 | | | | 0.09 | |
| | | | | | | | | | | | | | | | |
The accompanying notes are an integral part of these financial statements.
| | | | | | |
| Summary Portfolio of investments—November 30, 2012 (unaudited) | | Wells Fargo Advantage Allocation Funds | | | 55 | |
INDEX PORTFOLIO
| | | | | | | | | | | | | | | | |
| Security name | | | | | | Shares | | | Value | | | Percent of
net assets | |
| | | | | | | | | | | | | | | | |
| | | | | |
| Life Sciences Tools & Services: 0.43% | | | | | | | | | | | | | | | | |
Other securities | | | | | | | | | | $ | 10,921,272 | | | | 0.43 | % |
| | | | | | | | | | | | | | | | |
| | | | | |
| Pharmaceuticals: 6.14% | | | | | | | | | | | | | | | | |
Abbott Laboratories | | | | | | | 304,712 | | | | 19,806,280 | | | | 0.79 | |
Bristol-Myers Squibb Company | | | | | | | 326,009 | | | | 10,637,674 | | | | 0.42 | |
Johnson & Johnson Services Incorporated « | | | | | | | 535,324 | | | | 37,328,143 | | | | 1.49 | |
Merck & Company Incorporated | | | | | | | 591,359 | | | | 26,197,204 | | | | 1.04 | |
Pfizer Incorporated | | | | | | | 1,450,322 | | | | 36,287,056 | | | | 1.44 | |
Other securities | | | | | | | | | | | 23,916,732 | | | | 0.96 | |
| | | | | |
| | | | | | | | | | | 154,173,089 | | | | 6.14 | |
| | | | | | | | | | | | | | | | |
| | | | | |
Industrials: 9.75% | | | | | | | | | | | | | | | | |
| | | | | |
| Aerospace & Defense: 2.24% | | | | | | | | | | | | | | | | |
United Technologies Corporation | | | | | | | 162,875 | | | | 13,047,916 | | | | 0.52 | |
Other securities | | | | | | | | | | | 43,292,739 | | | | 1.72 | |
| | | | | |
| | | | | | | | | | | 56,340,655 | | | | 2.24 | |
| | | | | | | | | | | | | | | | |
| | | | | |
| Air Freight & Logistics: 0.75% | | | | | | | | | | | | | | | | |
Other securities | | | | | | | | | | | 18,745,997 | | | | 0.75 | |
| | | | | | | | | | | | | | | | |
| | | | | |
| Airlines: 0.05% | | | | | | | | | | | | | | | | |
Other securities | | | | | | | | | | | 1,374,979 | | | | 0.05 | |
| | | | | | | | | | | | | | | | |
| | | | | |
| Building Products: 0.05% | | | | | | | | | | | | | | | | |
Other securities | | | | | | | | | | | 1,175,956 | | | | 0.05 | |
| | | | | | | | | | | | | | | | |
| | | | | |
| Commercial Services & Supplies: 0.56% | | | | | | | | | | | | | | | | |
Other securities | | | | | | | | | | | 13,984,010 | | | | 0.56 | |
| | | | | | | | | | | | | | | | |
| | | | | |
| Construction & Engineering: 0.15% | | | | | | | | | | | | | | | | |
Other securities | | | | | | | | | | | 3,822,287 | | | | 0.15 | |
| | | | | | | | | | | | | | | | |
| | | | | |
| Electrical Equipment: 0.54% | | | | | | | | | | | | | | | | |
Other securities | | | | | | | | | | | 13,695,927 | | | | 0.54 | |
| | | | | | | | | | | | | | | | |
| | | | | |
| Industrial Conglomerates: 2.57% | | | | | | | | | | | | | | | | |
3M Company | | | | | | | 123,492 | | | | 11,231,597 | | | | 0.45 | |
General Electric Company | | | | | | | 2,050,171 | | | | 43,320,113 | | | | 1.73 | |
Other securities | | | | | | | | | | | 9,935,416 | | | | 0.39 | |
| | | | | |
| | | | | | | | | | | 64,487,126 | | | | 2.57 | |
| | | | | | | | | | | | | | | | |
| | | | | |
| Machinery: 1.88% | | | | | | | | | | | | | | | | |
Caterpillar Incorporated « | | | | | | | 126,843 | | | | 10,812,097 | | | | 0.43 | |
Other securities | | | | | | | | | | | 36,414,019 | | | | 1.45 | |
| | | | | |
| | | | | | | | | | | 47,226,116 | | | | 1.88 | |
| | | | | | | | | | | | | | | | |
| | | | | |
| Road & Rail: 0.78% | | | | | | | | | | | | | | | | |
Union Pacific Corporation | | | | | | | 91,959 | | | | 11,290,726 | | | | 0.45 | |
Other securities | | | | | | | | | | | 8,203,289 | | | | 0.33 | |
| | | | | |
| | | | | | | | | | | 19,494,015 | | | | 0.78 | |
| | | | | | | | | | | | | | | | |
The accompanying notes are an integral part of these financial statements.
| | | | |
| 56 | | Wells Fargo Advantage Allocation Funds | | Summary portfolio of investments—November 30, 2012 (unaudited) |
INDEX PORTFOLIO
| | | | | | | | | | | | | | | | |
| Security name | | | | | | Shares | | | Value | | | Percent of
net assets | |
| | | | | | | | | | | | | | | | |
| | | | | |
| Trading Companies & Distributors: 0.18% | | | | | | | | | | | | | | | | |
Other securities | | | | | | | | | | $ | 4,445,839 | | | | 0.18 | % |
| | | | | | | | | | | | | | | | |
| | | | | |
Information Technology: 18.81% | | | | | | | | | | | | | | | | |
| | | | | |
| Communications Equipment: 1.92% | | | | | | | | | | | | | | | | |
Cisco Systems Incorporated | | | | | | | 1,027,151 | | | | 19,423,425 | | | | 0.77 | |
QUALCOMM Incorporated | | | | | | | 330,733 | | | | 21,041,233 | | | | 0.84 | |
Other securities | | | | | | | | | | | 7,885,294 | | | | 0.31 | |
| | | | | |
| | | | | | | | | | | 48,349,952 | | | | 1.92 | |
| | | | | | | | | | | | | | | | |
| | | | | |
| Computers & Peripherals: 5.24% | | | | | | | | | | | | | | | | |
Apple Incorporated † | | | | | | | 182,013 | | | | 106,528,569 | | | | 4.24 | |
Other securities | | | | | | | | | | | 25,039,333 | | | | 1.00 | |
| | | | | |
| | | | | | | | | | | 131,567,902 | | | | 5.24 | |
| | | | | | | | | | | | | | | | |
| | | | | |
| Electronic Equipment, Instruments & Components: 0.41% | | | | | | | | | | | | | | | | |
Other securities | | | | | | | | | | | 10,387,903 | | | | 0.41 | |
| | | | | | | | | | | | | | | | |
| | | | | |
| Internet Software & Services: 2.15% | | | | | | | | | | | | | | | | |
eBay Incorporated † | | | | | | | 225,195 | | | | 11,894,800 | | | | 0.48 | |
Google Incorporated Class A † | | | | | | | 51,434 | | | | 35,919,963 | | | | 1.43 | |
Other securities | | | | | | | | | | | 6,096,363 | | | | 0.24 | |
| | | | | |
| | | | | | | | | | | 53,911,126 | | | | 2.15 | |
| | | | | | | | | | | | | | | | |
| | | | | |
| IT Services: 3.76% | | | | | | | | | | | | | | | | |
International Business Machines Corporation | | | | | | | 208,575 | | | | 39,643,850 | | | | 1.58 | |
Visa Incorporated Class A | | | | | | | 101,486 | | | | 15,193,469 | | | | 0.60 | |
Other securities | | | | | | | | | | | 39,510,048 | | | | 1.58 | |
| | | | | |
| | | | | | | | | | | 94,347,367 | | | | 3.76 | |
| | | | | | | | | | | | | | | | |
| | | | | |
| Office Electronics: 0.07% | | | | | | | | | | | | | | | | |
Other securities | | | | | | | | | | | 1,728,480 | | | | 0.07 | |
| | | | | | | | | | | | | | | | |
| | | | | |
| Semiconductors & Semiconductor Equipment: 1.88% | | | | | | | | | | | | | | | | |
Intel Corporation | | | | | | | 971,414 | | | | 19,010,572 | | | | 0.76 | |
Other securities | | | | | | | | | | | 28,213,753 | | | | 1.12 | |
| | | | | |
| | | | | | | | | | | 47,224,325 | | | | 1.88 | |
| | | | | | | | | | | | | | | | |
| | | | | |
| Software: 3.38% | | | | | | | | | | | | | | | | |
Microsoft Corporation | | | | | | | 1,464,995 | | | | 38,998,167 | | | | 1.55 | |
Oracle Corporation | | | | | | | 739,454 | | | | 23,736,473 | | | | 0.94 | |
Other securities | | | | | | | | | | | 22,078,184 | | | | 0.89 | |
| | | | | |
| | | | | | | | | | | 84,812,824 | | | | 3.38 | |
| | | | | | | | | | | | | | | | |
| | | | | |
Materials: 3.46% | | | | | | | | | | | | | | | | |
| | | | | |
| Chemicals: 2.38% | | | | | | | | | | | | | | | | |
Other securities | | | | | | | | | | | 59,792,868 | | | | 2.38 | |
| | | | | | | | | | | | | | | | |
| | | | | |
| Construction Materials: 0.05% | | | | | | | | | | | | | | | | |
Other securities | | | | | | | | | | | 1,327,552 | | | | 0.05 | |
| | | | | | | | | | | | | | | | |
The accompanying notes are an integral part of these financial statements.
| | | | | | |
| Summary portfolio of investments—November 30, 2012 (unaudited) | | Wells Fargo Advantage Allocation Funds | | | 57 | |
INDEX PORTFOLIO
| | | | | | | | | | | | | | | | |
| Security name | | | | | | Shares | | | Value | | | Percent of
net assets | |
| | | | | | | | | | | | | | | | |
| | | | | |
| Containers & Packaging: 0.13% | | | | | | | | | | | | | | | | |
Other securities | | | | | | | | | | $ | 3,292,559 | | | | 0.13 | % |
| | | | | | | | | | | | | | | | |
| | | | | |
| Metals & Mining: 0.73% | | | | | | | | | | | | | | | | |
Other securities | | | | | | | | | | | 18,188,548 | | | | 0.73 | |
| | | | | | | | | | | | | | | | |
| | | | | |
| Paper & Forest Products: 0.17% | | | | | | | | | | | | | | | | |
Other securities | | | | | | | | | | | 4,195,688 | | | | 0.17 | |
| | | | | | | | | | | | | | | | |
| | | | | |
Telecommunication Services: 3.07% | | | | | | | | | | | | | | | | |
| | | | | |
| Diversified Telecommunication Services: 2.76% | | | | | | | | | | | | | | | | |
AT&T Incorporated | | | | | | | 1,120,145 | | | | 38,230,549 | | | | 1.52 | |
Verizon Communications Incorporated | | | | | | | 553,156 | | | | 24,405,243 | | | | 0.97 | |
Other securities | | | | | | | | | | | 6,584,977 | | | | 0.27 | |
| | | | | |
| | | | | | | | | | | 69,220,769 | | | | 2.76 | |
| | | | | | | | | | | | | | | | |
| | | | | |
| Wireless Telecommunication Services: 0.31% | | | | | | | | | | | | | | | | |
Other securities | | | | | | | | | | | 7,833,705 | | | | 0.31 | |
| | | | | | | | | | | | | | | | |
| | | | | |
Utilities: 3.37% | | | | | | | | | | | | | | | | |
| | | | | |
| Electric Utilities: 1.99% | | | | | | | | | | | | | | | | |
Other securities | | | | | | | | | | | 50,113,792 | | | | 1.99 | |
| | | | | | | | | | | | | | | | |
| | | | | |
| Gas Utilities: 0.11% | | | | | | | | | | | | | | | | |
Other securities | | | | | | | | | | | 2,675,945 | | | | 0.11 | |
| | | | | | | | | | | | | | | | |
| | | | | |
| Independent Power Producers & Energy Traders: 0.09% | | | | | | | | | | | | | | | | |
Other securities | | | | | | | | | | | 2,219,690 | | | | 0.09 | |
| | | | | | | | | | | | | | | | |
| | | | | |
| Multi-Utilities: 1.18% | | | | | | | | | | | | | | | | |
Other securities | | | | | | | | | | | 29,693,241 | | | | 1.18 | |
| | | | | | | | | | | | | | | | |
| | | | | |
Total Common Stocks (Cost $1,927,101,077) | | | | | | | | | | | 2,462,065,216 | | | | 98.03 | |
| | | | | | | | | | | | | | | | |
| | | | | |
Investment Companies: 0.10% | | | | | | | | | | | | | | | | |
Other securities | | | | | | | | | | | 2,403,229 | | | | 0.10 | |
| | | | | | | | | | | | | | | | |
| | | | | |
Total Investment Companies (Cost $2,358,744) | | | | | | | | | | | 2,403,229 | | | | 0.10 | |
| | | | | | | | | | | | | | | | |
| | | | | |
| | | | | | | Principal | | | | | | | |
| | | | | |
Other: 0.05% | | | | | | | | | | | | | | | | |
Gryphon Funding Limited, Pass-Through Entity (a)(i)(v) | | | | | | $ | 4,147,337 | | | | 1,368,621 | | | | 0.05 | |
| | | | | | | | | | | | | | | | |
| | | | | |
Total Other (Cost $392,952) | | | | | | | | | | | 1,368,621 | | | | 0.05 | |
| | | | | | | | | | | | | | | | |
The accompanying notes are an integral part of these financial statements.
| | | | |
| 58 | | Wells Fargo Advantage Allocation Funds | | Summary portfolio of investments—November 30, 2012 (unaudited) |
INDEX PORTFOLIO
| | | | | | | | | | | | | | | | | | | | |
| Security name | | Yield | | | | | | Shares | | | Value | | | Percent of
net assets | |
| | | | | | | | | | | | | | | | | | | | |
| | | | | |
Short-Term Investments: 8.03% | | | | | | | | | | | | | | | | | | | | |
| | | | | |
| Investment Companies: 7.90% | | | | | | | | | | | | | | | | | | | | |
Wells Fargo Advantage Cash Investment Money Market Fund, Select Class (l)(u) | | | 0.16 | % | | | | | | | 39,179,893 | | | $ | 39,179,893 | | | | 1.56 | % |
Wells Fargo Securities Lending Cash Investments, LLC (v)(l)(u)(r) | | | 0.21 | | | | | | | | 159,290,071 | | | | 159,290,071 | | | | 6.34 | |
| | | | | |
| | | | | | | | | | | | | | | 198,469,964 | | | | 7.90 | |
| | | | | | | | | | | | | | | | | | | | |
| | | | | |
| | | Interest rate | | | Maturity date | | | Principal | | | | | | | |
| | | | | |
| U.S. Treasury Securities: 0.13% | | | | | | | | | | | | | | | | | | | | |
U.S. Treasury Bill #(z) | | | 0.05 | | | | 1-31-13 | | | $ | 2,000,000 | | | | 1,999,820 | | | | 0.08 | |
U.S. Treasury Bill #(z) | | | 0.08 | | | | 2-21-13 | | | | 500,000 | | | | 499,911 | | | | 0.02 | |
U.S. Treasury Bill #(z) | | | 0.09 | | | | 1-24-13 | | | | 750,000 | | | | 749,897 | | | | 0.03 | |
| | | | | |
| | | | | | | | | | | | | | | 3,249,628 | | | | 0.13 | |
| | | | | | | | | | | | | | | | | | | | |
| | | | | |
Total Short-Term Investments (Cost $201,719,510) | | | | | | | | | | | | | | | 201,719,592 | | | | 8.03 | |
| | | | | | | | | | | | | | | | | | | | |
Total investments in securities
(Cost $2,131,572,283) * | | | | | | | | | | | | | | | 2,667,556,658 | | | | 106.21 | |
Other assets and liabilities, net | | | | | | | | | | | | | | | (156,053,926 | ) | | | (6.21 | ) |
| | | | | | | | | | | | | | | | | | | | |
| Total net assets | | | | | | | | | | | | | | $ | 2,511,502,732 | | | | 100.00 | % |
| | | | | | | | | | | | | | | | | | | | |
| « | All or a portion of this security is on loan. |
| † | Non-income-earning security |
| (l) | Investment in an affiliate |
| (a) | Security is fair valued by the Management Valuation Team, and in certain instances by the Board of Trustees, in accordance with procedures approved by the Board of Trustees. |
| (v) | Security represents investment of cash collateral received from securities on loan. |
| (u) | Rate shown is the 7-day annualized yield at period end. |
| (r) | The investment company is exempt from registration under Section 3(c)(7) of the Investment Company Act of 1940, as amended. |
| # | All or a portion of this security is segregated as collateral for investments in derivative instruments. |
| (z) | Zero coupon security. Rate represents yield to maturity at time of purchase. |
| * | Cost for federal income tax purposes is $2,236,771,410 and unrealized appreciation (depreciation) consists of: |
| | | | |
Gross unrealized appreciation | | $ | 617,641,282 | |
Gross unrealized depreciation | | | (186,856,034 | ) |
| | | | |
Net unrealized appreciation | | $ | 430,785,248 | |
The accompanying notes are an integral part of these financial statements.
| | | | | | |
| Portfolio of investments—November 30, 2012 (unaudited) | | Wells Fargo Advantage Allocation Funds | | | 59 | |
INTERNATIONAL EQUITY PORTFOLIO
| | | | | | | | | | | | |
| Security name | | | | | | Shares | | | Value | |
| | | | | | | | | | | | |
| | | | |
Common Stocks: 98.39% | | | | | | | | | | | | |
| | | | |
| Argentina: 0.06% | | | | | | | | | | | | |
IRSA Inversiones y Representaciones SA ADR (Financials, Real Estate Management & Development) | | | | | | | 2,011 | | | $ | 14,338 | |
| | | | | | | | | | | | |
| | | | |
| Australia: 1.64% | | | | | | | | | | | | |
BHP Billiton Limited (Materials, Metals & Mining) | | | | | | | 10,199 | | | | 366,036 | |
| | | | | | | | | | | | |
| | | | |
| Brazil: 0.96% | | | | | | | | | | | | |
Cosan Limited Class A (Energy, Oil, Gas & Consumable Fuels) | | | | | | | 13,251 | | | | 214,666 | |
| | | | | | | | | | | | |
| | | | |
| Canada: 4.48% | | | | | | | | | | | | |
Barrick Gold Corporation (Materials, Metals & Mining) | | | | | | | 6,825 | | | | 236,970 | |
Cenovus Energy Incorporated (Energy, Oil, Gas & Consumable Fuels) « | | | | | | | 8,503 | | | | 283,575 | |
Suncor Energy Incorporated (Energy, Oil, Gas & Consumable Fuels) « | | | | | | | 4,222 | | | | 137,964 | |
Valeant Pharmaceuticals International Incorporated (Health Care, Pharmaceuticals) Ǡ | | | | | | | 6,202 | | | | 342,847 | |
| | | | |
| | | | | | | | | | | 1,001,356 | |
| | | | | | | | | | | | |
| | | | |
| China: 1.49% | | | | | | | | | | | | |
AutoNavi Holdings Limited ADR (Information Technology, Software) † | | | | | | | 3,871 | | | | 47,226 | |
Biostime International Holding Limited (Consumer Staples, Food Products) | | | | | | | 16,500 | | | | 49,925 | |
Industrial & Commercial Bank of China Class H (Financials, Commercial Banks) | | | | | | | 290,000 | | | | 195,698 | |
Shenguan Holdings Group Limited (Consumer Staples, Food Products) | | | | | | | 78,000 | | | | 39,653 | |
| | | | |
| | | | | | | | | | | 332,502 | |
| | | | | | | | | | | | |
| | | | |
| Finland: 1.72% | | | | | | | | | | | | |
Metso Oyj (Industrials, Machinery) | | | | | | | 10,222 | | | | 384,336 | |
| | | | | | | | | | | | |
| | | | |
| France: 1.84% | | | | | | | | | | | | |
Total SA (Energy, Oil, Gas & Consumable Fuels) | | | | | | | 8,218 | | | | 411,218 | |
| | | | | | | | | | | | |
| | | | |
| Germany: 8.29% | | | | | | | | | | | | |
Allianz AG (Financials, Insurance) | | | | | | | 2,614 | | | | 339,794 | |
Bayer AG (Health Care, Pharmaceuticals) | | | | | | | 3,940 | | | | 356,386 | |
Metro AG (Consumer Staples, Food & Staples Retailing) | | | | | | | 16,214 | | | | 454,006 | |
SAP AG (Information Technology, Software) | | | | | | | 1,917 | | | | 149,689 | |
Siemens AG (Industrials, Industrial Conglomerates) | | | | | | | 5,363 | | | | 553,106 | |
| | | | |
| | | | | | | | | | | 1,852,981 | |
| | | | | | | | | | | | |
| | | | |
| Hong Kong: 7.28% | | | | | | | | | | | | |
China Everbright Limited (Financials, Capital Markets) | | | | | | | 374,000 | | | | 539,511 | |
China Mobile Limited (Telecommunication Services, Wireless Telecommunication Services) | | | | | | | 34,000 | | | | 388,687 | |
Hengdeli Holdings Limited (Consumer Discretionary, Specialty Retail) | | | | | | | 1,027,951 | | | | 366,074 | |
Jardine Matheson Holdings Limited (Industrials, Industrial Conglomerates) | | | | | | | 5,600 | | | | 330,512 | |
Xtep International Holdings Limited (Consumer Discretionary, Textiles, Apparel & Luxury Goods) | | | | | | | 7,788 | | | | 3,095 | |
| | | | |
| | | | | | | | | | | 1,627,879 | |
| | | | | | | | | | | | |
| | | | |
| Italy: 4.46% | | | | | | | | | | | | |
ENI SpA (Energy, Oil, Gas & Consumable Fuels) | | | | | | | 19,955 | | | | 471,816 | |
Intesa Sanpaolo SpA (Financials, Commercial Banks) | | | | | | | 312,533 | | | | 525,966 | |
| | | | |
| | | | | | | | | | | 997,782 | |
| | | | | | | | | | | | |
The accompanying notes are an integral part of these financial statements.
| | | | |
| 60 | | Wells Fargo Advantage Allocation Funds | | Portfolio of investments—November 30, 2012 (unaudited) |
INTERNATIONAL EQUITY PORTFOLIO
| | | | | | | | | | | | |
| Security name | | | | | | Shares | | | Value | |
| | | | | | | | | | | | |
| | | | |
| Japan: 19.27% | | | | | | | | | | | | |
Asahi Glass Company Limited (Industrials, Building Products) | | | | | | | 53,000 | | | $ | 403,761 | |
Canon Incorporated (Information Technology, Office Electronics) | | | | | | | 15,600 | | | | 545,579 | |
Capcom Company Limited (Information Technology, Software) | | | | | | | 21,400 | | | | 402,378 | |
FamilyMart Company Limited (Consumer Staples, Food & Staples Retailing) | | | | | | | 7,200 | | | | 319,233 | |
Itochu Corporation (Industrials, Trading Companies & Distributors) | | | | | | | 37,100 | | | | 370,842 | |
Mitsubishi UFJ Financial Group Incorporated (Financials, Commercial Banks) | | | | | | | 88,200 | | | | 403,365 | |
Mitsui OSK Lines Limited (Industrials, Marine) | | | | | | | 185,000 | | | | 464,548 | |
Nitto Denko Corporation (Materials, Chemicals) | | | | | | | 6,646 | | | | 346,268 | |
Toyota Motor Corporation (Consumer Discretionary, Automobiles) | | | | | | | 13,700 | | | | 587,487 | |
USS Company Limited (Consumer Discretionary, Specialty Retail) | | | | | | | 2,700 | | | | 287,572 | |
Yamada Denki Company Limited (Consumer Discretionary, Specialty Retail) « | | | | | | | 4,940 | | | | 174,684 | |
| | | | |
| | | | | | | | | | | 4,305,717 | |
| | | | | | | | | | | | |
| | | | |
| Netherlands: 2.71% | | | | | | | | | | | | |
Akzo Nobel NV (Materials, Chemicals) | | | | | | | 10,587 | | | | 605,007 | |
| | | | | | | | | | | | |
| | | | |
| Norway: 3.56% | | | | | | | | | | | | |
Marine Harvest ASA (Consumer Staples, Food Products) † | | | | | | | 423,722 | | | | 370,278 | |
Statoil ASA (Energy, Oil, Gas & Consumable Fuels) | | | | | | | 17,361 | | | | 424,489 | |
| | | | |
| | | | | | | | | | | 794,767 | |
| | | | | | | | | | | | |
| | | | |
| Philippines: 1.23% | | | | | | | | | | | | |
Philippine Long Distance Telephone Company (Telecommunication Services, Wireless Telecommunication Services) | | | | | | | 4,350 | | | | 275,106 | |
| | | | | | | | | | | | |
| | | | |
| Russia: 1.60% | | | | | | | | | | | | |
Mobile Telesystems ADR (Telecommunication Services, Wireless Telecommunication Services) | | | | | | | 13,246 | | | | 230,878 | |
Sberbank of Russia (Financials, Commercial Banks) | | | | | | | 42,727 | | | | 125,617 | |
| | | | |
| | | | | | | | | | | 356,495 | |
| | | | | | | | | | | | |
| | | | |
| South Korea: 4.64% | | | | | | | | | | | | |
Hana Financial Group Incorporated (Financials, Commercial Banks) | | | | | | | 5,210 | | | | 161,662 | |
Samsung Electronics Company Limited GDR (Information Technology, Semiconductors & Semiconductor Equipment)144A | | | | | | | 719 | | | | 470,945 | |
SK Telecom Company Limited (Telecommunication Services, Wireless Telecommunication Services) | | | | | | | 2,908 | | | | 404,169 | |
| | | | |
| | | | | | | | | | | 1,036,776 | |
| | | | | | | | | | | | |
| | | | |
| Sweden: 1.46% | | | | | | | | | | | | |
Volvo AB Class B (Industrials, Machinery) | | | | | | | 23,056 | | | | 326,607 | |
| | | | | | | | | | | | |
| | | | |
| Switzerland: 10.73% | | | | | | | | | | | | |
ABB Limited (Industrials, Electrical Equipment) | | | | | | | 26,766 | | | | 521,629 | |
Compagnie Financiere Richemont SA (Consumer Discretionary, Textiles, Apparel & Luxury Goods) | | | | | | | 3,853 | | | | 297,072 | |
Novartis AG (Health Care, Pharmaceuticals) | | | | | | | 9,051 | | | | 560,133 | |
Swatch Group AG Class B (Consumer Discretionary, Textiles, Apparel & Luxury Goods) | | | | | | | 925 | | | | 446,779 | |
Zurich Financial Services AG (Financials, Insurance) | | | | | | | 2,241 | | | | 571,918 | |
| | | | |
| | | | | | | | | | | 2,397,531 | |
| | | | | | | | | | | | |
| | | | |
| Taiwan: 1.18% | | | | | | | | | | | | |
Taiwan Semiconductor Manufacturing Company Limited ADR (Information Technology, Semiconductors & Semiconductor Equipment) | | | | | | | 15,290 | | | | 264,058 | |
| | | | | | | | | | | | |
The accompanying notes are an integral part of these financial statements.
| | | | | | |
| Portfolio of investments—November 30, 2012 (unaudited) | | Wells Fargo Advantage Allocation Funds | | | 61 | |
INTERNATIONAL EQUITY PORTFOLIO
| | | | | | | | | | | | | | |
| Security name | | | | | | | Shares | | | Value | |
| | | | | | | | | | | | | | |
| | | | |
| United Kingdom: 16.54% | | | | | | | | | | | | | | |
BP plc (Energy, Oil, Gas & Consumable Fuels) | | | | | | | | | 72,681 | | | $ | 502,581 | |
Capita plc (Industrials, Professional Services) | | | | | | | | | 45,078 | | | | 550,691 | |
Chemring Group plc (Industrials, Aerospace & Defense) | | | | | | | | | 91,046 | | | | 358,985 | |
Debenhams plc (Consumer Discretionary, Multiline Retail) | | | | | | | | | 144,945 | | | | 273,792 | |
Man Group plc (Financials, Capital Markets) | | | | | | | | | 239,146 | | | | 294,258 | |
Reckitt Benckiser Group plc (Consumer Staples, Household Products) | | | | | | | | | 5,408 | | | | 340,079 | |
Smiths Group plc (Industrials, Industrial Conglomerates) | | | | | | | | | 24,767 | | | | 434,501 | |
Vodafone Group plc ADR (Telecommunication Services, Wireless Telecommunication Services) « | | | | | | | | | 16,672 | | | | 430,138 | |
Wolseley plc (Industrials, Trading Companies & Distributors) | | | | | | | | | 11,033 | | | | 512,089 | |
| | | | |
| | | | | | | | | | | | | 3,697,114 | |
| | | | | | | | | | | | | | |
| | | | |
| United States: 3.25% | | | | | | | | | | | | | | |
Bank of America Corporation (Financials, Diversified Financial Services) | | | | | | | | | 17,794 | | | | 175,449 | |
KKR & Company Limited Partnership (Financials, Capital Markets) | | | | | | | | | 12,547 | | | | 172,521 | |
QUALCOMM Incorporated (Information Technology, Communications Equipment) | | | | | | | | | 5,945 | | | | 378,219 | |
| | | | |
| | | | | | | | | | | | | 726,189 | |
| | | | | | | | | | | | | | |
| | | | |
Total Common Stocks (Cost $21,945,178) | | | | | | | | | | | | | 21,988,461 | |
| | | | | | | | | | | | | | |
| | | | |
| | | | | Yield | | | | | | | |
| Short-Term Investments: 6.28% | | | | | | | | | | | | | | |
| | | | |
| Investment Companies: 6.28% | | | | | | | | | | | | | | |
Wells Fargo Advantage Cash Investment Money Market Fund, Select Class (u)(l) | | | | | 0.16 | % | | | 327,352 | | | | 327,352 | |
Wells Fargo Securities Lending Cash Investments, LLC (l)(u)(v)(r) | | | | | 0.21 | | | | 1,076,691 | | | | 1,076,691 | |
| | | | |
Total Short-Term Investments (Cost $1,404,043) | | | | | | | | | | | | | 1,404,043 | |
| | | | | | | | | | | | | | |
| | | | | | | | |
| Total investments in securities | | | | | | | | |
| (Cost $23,349,221) * | | | 104.67 | % | | | 23,392,504 | |
Other assets and liabilities, net | | | (4.67 | ) | | | (1,043,530 | ) |
| | | | | | | | |
| Total net assets | | | 100.00 | % | | $ | 22,348,974 | |
| | | | | | | | |
| « | All or a portion of this security is on loan. |
| † | Non-income-earning security |
| 144A | Security that may be resold to “qualified institutional buyers” under Rule 144A or security offered pursuant to Section 4(2) of the Securities Act of 1933, as amended. |
| (l) | Investment in an affiliate |
| (u) | Rate shown is the 7-day annualized yield at period end. |
| (v) | Security represents investment of cash collateral received from securities on loan. |
| (r) | The investment company is exempt from registration under Section 3(c)(7) of the Investment Company Act of 1940, as amended. |
| * | Cost for federal income tax purposes is $23,452,164 and unrealized appreciation (depreciation) consists of: |
| | | | |
Gross unrealized appreciation | | $ | 1,346,020 | |
Gross unrealized depreciation | | | (1,405,680 | ) |
| | | | |
Net unrealized depreciation | | $ | (59,660 | ) |
The accompanying notes are an integral part of these financial statements.
| | | | |
| 62 | | Wells Fargo Advantage Allocation Funds | | Portfolio of investments—November 30, 2012 (unaudited) |
INTERNATIONAL EQUITY PORTFOLIO
The following table shows the percent of total long-term investments by sector as of November 30, 2012:
| | | | |
Industrials | | | 23.70 | % |
Financials | | | 16.01 | % |
Energy | | | 11.13 | % |
Consumer Discretionary | | | 11.08 | % |
Information Technology | | | 10.27 | % |
Telecommunication Services | | | 7.86 | % |
Consumer Staples | | | 7.15 | % |
Materials | | | 7.07 | % |
Health Care | | | 5.73 | % |
| | | | |
| | | 100.00 | % |
| | | | |
The accompanying notes are an integral part of these financial statements.
| | | | | | |
| Portfolio of investments—November 30, 2012 (unaudited) | | Wells Fargo Advantage Allocation Funds | | | 63 | |
INTERNATIONAL GROWTH PORTFOLIO
| | | | | | | | | | | | |
| Security name | | | | | | Shares | | | Value | |
| | | | | | | | | | | | |
| | | | |
Common Stocks: 97.11% | | | | | | | | | | | | |
| | | | |
| Australia: 0.46% | | | | | | | | | | | | |
Coca-Cola Amatil Limited (Consumer Staples, Beverages) | | | | | | | 20,004 | | | $ | 286,839 | |
Westfield Group (Financials, REITs) | | | | | | | 21,325 | | | | 231,895 | |
| | | | |
| | | | | | | | | | | 518,734 | |
| | | | | | | | | | | | |
| | | | |
| Belgium: 4.41% | | | | | | | | | | | | |
Anheuser-Busch InBev NV (Consumer Staples, Beverages) | | | | | | | 46,254 | | | | 4,053,891 | |
Telenet Group Holding NV (Telecommunication Services, Diversified Telecommunication Services) | | | | | | | 3,921 | | | | 179,093 | |
UCB SA (Health Care, Pharmaceuticals) | | | | | | | 12,217 | | | | 693,468 | |
| | | | |
| | | | | | | | | | | 4,926,452 | |
| | | | | | | | | | | | |
| | | | |
| Bermuda: 0.71% | | | | | | | | | | | | |
Hong Kong Land Holdings Limited (Financials, Real Estate Management & Development) | | | | | | | 120,966 | | | | 791,118 | |
| | | | | | | | | | | | |
| | | | |
| Canada: 4.19% | | | | | | | | | | | | |
Canadian Pacific Railway Limited (Industrials, Road & Rail) « | | | | | | | 50,104 | | | | 4,676,707 | |
| | | | | | | | | | | | |
| | | | |
| Cayman Islands: 5.52% | | | | | | | | | | | | |
Baidu.com Incorporated ADR (Information Technology, Internet Software & Services) Ǡ | | | | | | | 34,473 | | | | 3,320,095 | |
China Resources Land Limited (Financials, Real Estate Management & Development) | | | | | | | 542,500 | | | | 1,448,963 | |
Tencent Holdings Limited (Information Technology, Internet Software & Services) | | | | | | | 42,500 | | | | 1,388,480 | |
| | | | |
| | | | | | | | | | | 6,157,538 | |
| | | | | | | | | | | | |
| | | | |
| China: 0.91% | | | | | | | | | | | | |
China Construction Bank (Financials, Commercial Banks) | | | | | | | 1,332,000 | | | | 1,020,887 | |
| | | | | | | | | | | | |
| | | | |
| France: 8.48% | | | | | | | | | | | | |
Air Liquide SA (Materials, Chemicals) | | | | | | | 6,183 | | | | 755,159 | |
LVMH Moet Hennessy Louis Vuitton SA (Consumer Discretionary, Textiles, Apparel & Luxury Goods) « | | | | | | | 3,681 | | | | 645,810 | |
Pernod-Ricard SA (Consumer Staples, Beverages) | | | | | | | 20,327 | | | | 2,301,544 | |
Schneider Electric SA (Industrials, Electrical Equipment) | | | | | | | 26,850 | | | | 1,887,065 | |
Technip SA (Energy, Energy Equipment & Services) | | | | | | | 2,935 | | | | 340,945 | |
Unibail-Rodamco SA (Financials, Real Estate Management & Development) | | | | | | | 10,243 | | | | 2,403,872 | |
Zodiac Aerospace SA (Industrials, Aerospace & Defense) | | | | | | | 10,132 | | | | 1,131,920 | |
| | | | |
| | | | | | | | | | | 9,466,315 | |
| | | | | | | | | | | | |
| | | | |
| Germany: 15.75% | | | | | | | | | | | | |
Allianz AG (Financials, Insurance) | | | | | | | 6,314 | | | | 820,757 | |
Bayer AG (Health Care, Pharmaceuticals) | | | | | | | 19,649 | | | | 1,777,317 | |
Beiersdorf AG (Consumer Staples, Personal Products) | | | | | | | 24,166 | | | | 1,895,175 | |
Brenntag AG (Materials, Chemicals) | | | | | | | 13,684 | | | | 1,768,996 | |
Deutsche Post AG (Industrials, Air Freight & Logistics) | | | | | | | 96,274 | | | | 1,998,339 | |
Kabel Deutschland Holding AG (Consumer Discretionary, Media) | | | | | | | 14,861 | | | | 1,074,608 | |
Linde AG (Materials, Chemicals) | | | | | | | 28,103 | | | | 4,859,240 | |
Muenchener Rueckversicherungs-Gesellschaft AG (Financials, Insurance) | | | | | | | 19,801 | | | | 3,379,977 | |
| | | | |
| | | | | | | | | | | 17,574,409 | |
| | | | | | | | | | | | |
The accompanying notes are an integral part of these financial statements.
| | | | |
| 64 | | Wells Fargo Advantage Allocation Funds | | Portfolio of investments—November 30, 2012 (unaudited) |
INTERNATIONAL GROWTH PORTFOLIO
| | | | | | | | | | | | |
| Security name | | | | | | Shares | | | Value | |
| | | | | | | | | | | | |
| | | | |
| Hong Kong: 11.61% | | | | | | | | | | | | |
AIA Group Limited (Financials, Insurance) | | | | | | | 912,600 | | | $ | 3,550,217 | |
BOC Hong Kong Holdings Limited (Financials, Commercial Banks) | | | | | | | 154,088 | | | | 473,187 | |
China Mobile Limited (Telecommunication Services, Wireless Telecommunication Services) | | | | | | | 167,100 | | | | 1,910,281 | |
Hang Seng Bank Limited (Financials, Commercial Banks) | | | | | | | 82,451 | | | | 1,259,606 | |
Sands China Limited (Consumer Discretionary, Hotels, Restaurants & Leisure) | | | | | | | 352,113 | | | | 1,501,553 | |
Sino Land Company (Financials, Real Estate Management & Development) | | | | | | | 506,252 | | | | 914,496 | |
Sun Hung Kai Properties Limited (Financials, Real Estate Management & Development) | | | | | | | 141,742 | | | | 2,073,952 | |
Wynn Macau Limited (Consumer Discretionary, Hotels, Restaurants & Leisure) | | | | | | | 447,396 | | | | 1,278,654 | |
| | | | |
| | | | | | | | | | | 12,961,946 | |
| | | | | | | | | | | | |
| | | | |
| India: 0.46% | | | | | | | | | | | | |
Coal India Limited (Energy, Oil, Gas & Consumable Fuels) | | | | | | | 75,394 | | | | 508,055 | |
| | | | | | | | | | | | |
| | | | |
| Indonesia: 0.27% | | | | | | | | | | | | |
PT Bank Rakyat Indonesia Tbk (Financials, Commercial Banks) | | | | | | | 417,500 | | | | 306,809 | |
| | | | | | | | | | | | |
| | | | |
| Ireland: 2.75% | | | | | | | | | | | | |
Covidien plc (Health Care, Health Care Equipment & Supplies) « | | | | | | | 44,665 | | | | 2,595,483 | |
CRH plc (Materials, Construction Materials) | | | | | | | 25,767 | | | | 470,834 | |
| | | | |
| | | | | | | | | | | 3,066,317 | |
| | | | | | | | | | | | |
| | | | |
| Italy: 0.97% | | | | | | | | | | | | |
Fiat Industrial SpA (Consumer Discretionary, Auto Components) | | | | | | | 101,323 | | | | 1,083,196 | |
| | | | | | | | | | | | |
| | | | |
| Japan: 10.30% | | | | | | | | | | | | |
Bridgestone Corporation (Consumer Discretionary, Auto Components) | | | | | | | 25,740 | | | | 621,057 | |
Honda Motor Company Limited (Consumer Discretionary, Automobiles) | | | | | | | 107,500 | | | | 3,562,686 | |
Japan Tobacco Incorporated (Consumer Staples, Tobacco) | | | | | | | 163,300 | | | | 4,892,958 | |
Kao Corporation (Consumer Staples, Personal Products) | | | | | | | 26,900 | | | | 738,457 | |
NGK Insulators Limited (Industrials, Electrical Equipment) | | | | | | | 120,000 | | | | 1,283,921 | |
Nissan Motor Company Limited (Consumer Discretionary, Automobiles) | | | | | | | 40,900 | | | | 396,423 | |
| | | | |
| | | | | | | | | | | 11,495,502 | |
| | | | | | | | | | | | |
| | | | |
| Malaysia: 0.16% | | | | | | | | | | | | |
Astro Malaysia Holdings Bhd (Consumer Discretionary, Media) † | | | | | | | 188,000 | | | | 177,501 | |
| | | | | | | | | | | | |
| | | | |
| Mexico: 0.20% | | | | | | | | | | | | |
America Movil SAB de CV ADR (Telecommunication Services, Wireless Telecommunication Services) | | | | | | | 9,434 | | | | 222,548 | |
| | | | | | | | | | | | |
| | | | |
| Netherlands: 5.42% | | | | | | | | | | | | |
Akzo Nobel NV (Materials, Chemicals) | | | | | | | 9,393 | | | | 536,774 | |
Koninklijke Vopak NV (Industrials, Transportation Infrastructure) | | | | | | | 14,255 | | | | 1,053,221 | |
Unilever NV (Consumer Staples, Food Products) « | | | | | | | 106,845 | | | | 4,054,081 | |
Ziggo NV (Telecommunication Services, Diversified Telecommunication Services) | | | | | | | 12,765 | | | | 399,765 | |
| | | | |
| | | | | | | | | | | 6,043,841 | |
| | | | | | | | | | | | |
| | | | |
| Nigeria: 0.36% | | | | | | | | | | | | |
Nigerian Breweries plc (Consumer Staples, Beverages) | | | | | | | 449,279 | | | | 400,882 | |
| | | | | | | | | | | | |
| | | | |
| Singapore: 0.36% | | | | | | | | | | | | |
City Developments Limited (Financials, Real Estate Management & Development) | | | | | | | 42,427 | | | | 407,377 | |
| | | | | | | | | | | | |
The accompanying notes are an integral part of these financial statements.
| | | | | | |
| Portfolio of investments—November 30, 2012 (unaudited) | | Wells Fargo Advantage Allocation Funds | | | 65 | |
INTERNATIONAL GROWTH PORTFOLIO
| | | | | | | | | | | | | | |
| Security name | | | | | | | Shares | | | Value | |
| | | | | | | | | | | | | | |
| | | | |
| South Korea: 0.93% | | | | | | | | | | | | | | |
Samsung Electronics Company Limited (Information Technology, Semiconductors & Semiconductor Equipment) | | | | | | | | | 800 | | | $ | 1,038,740 | |
| | | | | | | | | | | | | | |
| | | | |
| Spain: 0.60% | | | | | | | | | | | | | | |
Grifols SA (Health Care, Biotechnology) † | | | | | | | | | 20,818 | | | | 665,906 | |
| | | | | | | | | | | | | | |
| | | | |
| Switzerland: 6.59% | | | | | | | | | | | | | | |
Actelion Limited (Health Care, Biotechnology) | | | | | | | | | 3,193 | | | | 158,151 | |
Givaudan SA (Materials, Chemicals) | | | | | | | | | 421 | | | | 422,726 | |
Nestle SA (Consumer Staples, Food Products) | | | | | | | | | 60,722 | | | | 3,974,090 | |
Roche Holdings AG (Health Care, Pharmaceuticals) | | | | | | | | | 6,397 | | | | 1,259,105 | |
Swatch Group AG Class B (Consumer Discretionary, Textiles, Apparel & Luxury Goods) | | | | | | | | | 1,642 | | | | 793,093 | |
UBS AG (Financials, Diversified Financial Services) | | | | | | | | | 47,706 | | | | 746,452 | |
| | | | |
| | | | | | | | | | | | | 7,353,617 | |
| | | | | | | | | | | | | | |
| | | | |
| United Kingdom: 12.58% | | | | | | | | | | | | | | |
British Land Company plc (Financials, REITs) | | | | | | | | | 45,246 | | | | 398,700 | |
Diageo plc (Consumer Staples, Beverages) | | | | | | | | | 21,136 | | | | 628,837 | |
HSBC Holdings plc (Financials, Commercial Banks) | | | | | | | | | 244,015 | | | | 2,493,081 | |
Imperial Tobacco Group plc (Consumer Staples, Tobacco) | | | | | | | | | 66,670 | | | | 2,667,180 | |
Intercontinental Hotels Group plc (Consumer Discretionary, Hotels, Restaurants & Leisure) | | | | | | | | | 16,779 | | | | 448,400 | |
Johnson Matthey plc (Materials, Chemicals) | | | | | | | | | 23,221 | | | | 892,513 | |
Land Securities Group plc (Financials, REITs) | | | | | | | | | 96,190 | | | | 1,245,216 | |
Meggitt plc (Industrials, Aerospace & Defense) | | | | | | | | | 93,247 | | | | 581,747 | |
Prudential plc (Financials, Insurance) | | | | | | | | | 37,180 | | | | 539,090 | |
Reckitt Benckiser Group plc (Consumer Staples, Household Products) | | | | | | | | | 1,242 | | | | 78,102 | |
Rolls Royce Holdings plc (Industrials, Aerospace & Defense) | | | | | | | | | 14,464 | | | | 206,360 | |
SABMiller plc (Consumer Staples, Beverages) | | | | | | | | | 54,661 | | | | 2,476,188 | |
WPP plc (Consumer Discretionary, Media) | | | | | | | | | 100,615 | | | | 1,379,875 | |
| | | | |
| | | | | | | | | | | | | 14,035,289 | |
| | | | | | | | | | | | | | |
| | | | |
| United States: 2.66% | | | | | | | | | | | | | | |
Liberty Global Incorporated Class A (Consumer Discretionary, Media) Ǡ | | | | | | | | | 11,065 | | | | 620,083 | |
Schlumberger Limited (Energy, Energy Equipment & Services) | | | | | | | | | 27,470 | | | | 1,967,401 | |
Virgin Media Incorporated (Consumer Discretionary, Media) « | | | | | | | | | 10,933 | | | | 384,514 | |
| | | | |
| | | | | | | | | | | | | 2,971,998 | |
| | | | | | | | | | | | | | |
| | | | |
| Virgin Islands (British): 0.46% | | | | | | | | | | | | | | |
Arcos Dorados Holdings Incorporated Class A (Consumer Discretionary, Hotels, Restaurants & Leisure) « | | | | | | | | | 41,894 | | | | 513,202 | |
| | | | | | | | | | | | | | |
| | | | |
Total Common Stocks (Cost $92,791,322) | | | | | | | | | | | | | 108,384,886 | |
| | | | | | | | | | | | | | |
| | | | |
| | | | | Dividend Yield | | | | | | | |
| | | | |
Preferred Stocks: 1.67% | | | | | | | | | | | | | | |
| | | | |
| Germany: 1.67% | | | | | | | | | | | | | | |
Henkel AG & Company KGaA ADR (Consumer Staples, Household Products) | | | | | 0.96 | % | | | 22,301 | | | | 1,863,480 | |
| | | | | | | | | | | | | | |
| | | | |
Total Preferred Stocks (Cost $1,577,687) | | | | | | | | | | | | | 1,863,480 | |
| | | | | | | | | | | | | | |
The accompanying notes are an integral part of these financial statements.
| | | | |
| 66 | | Wells Fargo Advantage Allocation Funds | | Portfolio of investments—November 30, 2012 (unaudited) |
INTERNATIONAL GROWTH PORTFOLIO
| | | | | | | | | | | | | | |
| Security name | | | | Yield | | | Shares | | | Value | |
| | | | | | | | | | | | | | |
| | | | |
Short-Term Investments: 7.23% | | | | | | | | | | | | | | |
| | | | |
| Investment Companies: 7.23% | | | | | | | | | | | | | | |
Wells Fargo Advantage Cash Investment Money Market Fund, Select Class (l)(u) | | | | | 0.16 | % | | | 1,084,659 | | | $ | 1,084,659 | |
Wells Fargo Securities Lending Cash Investments, LLC (r)(v)(l)(u) | | | | | 0.21 | | | | 6,985,505 | | | | 6,985,505 | |
| | | | |
Total Short-Term Investments (Cost $8,070,164) | | | | | | | | | | | | | 8,070,164 | |
| | | | | | | | | | | | | | |
| | | | | | | | |
| Total investments in securities | | | | | | | | |
| (Cost $102,439,173) * | | | 106.01 | % | | | 118,318,530 | |
Other assets and liabilities, net | | | (6.01 | ) | | | (6,711,662 | ) |
| | | | | | | | |
| Total net assets | | | 100.00 | % | | $ | 111,606,868 | |
| | | | | | | | |
| † | Non-income-earning security |
| « | All or a portion of this security is on loan. |
| (l) | Investment in an affiliate |
| (u) | Rate shown is the 7-day annualized yield at period end. |
| (r) | The investment company is exempt from registration under Section 3(c)(7) of the Investment Company Act of 1940, as amended. |
| (v) | Security represents investment of cash collateral received from securities on loan. |
| * | Cost for federal income tax purposes is $102,953,148 and unrealized appreciation (depreciation) consists of: |
| | | | |
Gross unrealized appreciation | | $ | 16,530,333 | |
Gross unrealized depreciation | | | (1,164,951 | ) |
| | | | |
Net unrealized appreciation | | $ | 15,365,382 | |
The following table shows the percent of total long-term investments by sector as of November 30, 2012:
| | | | |
Consumer Staples | | | 27.50 | % |
Financials | | | 22.24 | % |
Consumer Discretionary | | | 13.13 | % |
Industrials | | | 11.63 | % |
Materials | | | 8.80 | % |
Health Care | | | 6.48 | % |
Information Technology | | | 5.21 | % |
Energy | | | 2.55 | % |
Telecommunication Services | | | 2.46 | % |
| | | | |
| | | 100.00 | % |
| | | | |
The accompanying notes are an integral part of these financial statements.
| | | | | | |
| Summary portfolio of investments—November 30, 2012 (unaudited) | | Wells Fargo Advantage Allocation Funds | | | 67 | |
INTERNATIONAL INDEX PORTFOLIO
The Summary Portfolio of Investments shows the 50 largest portfolio holdings in unaffiliated issuers and any holdings exceeding 1% of the total net assets as of the report date. The remaining securities held are grouped as “Other securities” in each category. You can request a complete schedule of portfolio holdings as of the report date, free of charge, by accessing the following website: http://a584.g.akamai.net/f/584/1326/1d/www.wellsfargoadvantagefunds.com/pdf/semi/holdings/internationalindex.pdf or by calling Wells Fargo Advantage Funds at 1-800-222-8222. This complete schedule, filed on the Form N-CSR, is also available on the SEC’s website at sec.gov.
| | | | | | | | | | | | | | | | |
| Security name | | | | | | Shares | | | Value | | | Percent of
net assets | |
| | | | | |
Common Stocks: 98.26% | | | | | | | | | | | | | | | | |
| | | | | |
| Australia: 8.86% | | | | | | | | | | | | | | | | |
Australia & New Zealand Banking Group Limited (Financials, Commercial Banks) | | | | | | | 5,621 | | | $ | 142,898 | | | | 0.64 | % |
BHP Billiton Limited (Materials, Metals & Mining) | | | | | | | 6,732 | | | | 241,607 | | | | 1.08 | |
Commonwealth Bank of Australia (Financials, Commercial Banks) | | | | | | | 3,324 | | | | 207,060 | | | | 0.93 | |
National Australia Bank Limited (Financials, Commercial Banks) | | | | | | | 4,698 | | | | 119,139 | | | | 0.53 | |
Westpac Banking Corporation (Financials, Commercial Banks) | | | | | | | 6,378 | | | | 169,730 | | | | 0.76 | |
Other securities | | | | | | | | | | | 1,101,482 | | | | 4.92 | |
| | | | | |
| | | | | | | | | | | 1,981,916 | | | | 8.86 | |
| | | | | | | | | | | | | | | | |
| | | | | |
| Austria: 0.30% | | | | | | | | | | | | | | | | |
Other securities | | | | | | | | | | | 67,957 | | | | 0.30 | |
| | | | | | | | | | | | | | | | |
| | | | | |
| Belgium: 1.16% | | | | | | | | | | | | | | | | |
Anheuser-Busch InBev NV (Consumer Staples, Beverages) | | | | | | | 1,685 | | | | 147,680 | | | | 0.66 | |
Other securities | | | | | | | | | | | 112,318 | | | | 0.50 | |
| | | | | |
| | | | | | | | | | | 259,998 | | | | 1.16 | |
| | | | | | | | | | | | | | | | |
| | | | | |
| Denmark: 1.17% | | | | | | | | | | | | | | | | |
Novo Nordisk A/S Class B (Health Care, Pharmaceuticals) | | | | | | | 854 | | | | 135,626 | | | | 0.61 | |
Other securities | | | | | | | | | | | 126,283 | | | | 0.56 | |
| | | | | |
| | | | | | | | | | | 261,909 | | | | 1.17 | |
| | | | | | | | | | | | | | | | |
| | | | | |
| Finland: 0.79% | | | | | | | | | | | | | | | | |
Other securities | | | | | | | | | | | 176,560 | | | | 0.79 | |
| | | | | | | | | | | | | | | | |
| | | | | |
| France: 9.05% | | | | | | | | | | | | | | | | |
BNP Paribas SA (Financials, Commercial Banks) | | | | | | | 2,097 | | | | 117,122 | | | | 0.52 | |
LVMH Moet Hennessy Louis Vuitton SA (Consumer Discretionary, Textiles, Apparel & Luxury Goods) « | | | | | | | 531 | | | | 93,161 | | | | 0.42 | |
Sanofi-Aventis SA (Health Care, Pharmaceuticals) | | | | | | | 2,482 | | | | 221,632 | | | | 0.99 | |
Total SA (Energy, Oil, Gas & Consumable Fuels) | | | | | | | 4,441 | | | | 222,222 | | | | 0.99 | |
Other securities | | | | | | | | | | | 1,370,611 | | | | 6.13 | |
| | | | | |
| | | | | | | | | | | 2,024,748 | | | | 9.05 | |
| | | | | | | | | | | | | | | | |
| | | | | |
| Germany: 8.04% | | | | | | | | | | | | | | | | |
Allianz AG (Financials, Insurance) | | | | | | | 955 | | | | 124,141 | | | | 0.56 | |
BASF SE (Materials, Chemicals) | | | | | | | 1,924 | | | | 172,406 | | | | 0.77 | |
Bayer AG (Health Care, Pharmaceuticals) | | | | | | | 1,735 | | | | 156,936 | | | | 0.70 | |
Daimler AG (Consumer Discretionary, Automobiles) | | | | | | | 1,895 | | | | 93,603 | | | | 0.42 | |
Deutsche Bank AG (Financials, Commercial Banks) | | | | | | | 1,940 | | | | 85,633 | | | | 0.38 | |
SAP AG (Information Technology, Software) | | | | | | | 1,932 | | | | 150,860 | | | | 0.67 | |
Siemens AG (Industrials, Industrial Conglomerates) | | | | | | | 1,718 | | | | 177,184 | | | | 0.79 | |
Other securities | | | | | | | | | | | 837,128 | | | | 3.75 | |
| | | | | |
| | | | | | | | | | | 1,797,891 | | | | 8.04 | |
| | | | | | | | | | | | | | | | |
The accompanying notes are an integral part of these financial statements.
| | | | |
| 68 | | Wells Fargo Advantage Allocation Funds | | Summary portfolio of investments—November 30, 2012 (unaudited) |
INTERNATIONAL INDEX PORTFOLIO
| | | | | | | | | | | | | | | | |
| Security name | | | | | | Shares | | | Value | | | Percent of
net assets | |
| | | | | | | | | | | | | | | | |
| | | | | |
| Greece: 0.06% | | | | | | | | | | | | | | | | |
Other securities | | | | | | | | | | $ | 13,673 | | | | 0.06 | % |
| | | | | | | | | | | | | | | | |
| | | | | |
| Hong Kong: 3.23% | | | | | | | | | | | | | | | | |
AIA Group Limited (Financials, Insurance) | | | | | | | 22,600 | | | | 87,919 | | | | 0.39 | |
Other securities | | | | | | | | | | | 634,229 | | | | 2.84 | |
| | | | | |
| | | | | | | | | | | 722,148 | | | | 3.23 | |
| | | | | | | | | | | | | | | | |
| | | | | |
| Ireland: 0.29% | | | | | | | | | | | | | | | | |
Other securities | | | | | | | | | | | 65,673 | | | | 0.29 | |
| | | | | | | | | | | | | | | | |
| | | | | |
| Israel: 0.61% | | | | | | | | | | | | | | | | |
Other securities | | | | | | | | | | | 135,199 | | | | 0.61 | |
| | | | | | | | | | | | | | | | |
| | | | | |
| Italy: 2.16% | | | | | | | | | | | | | | | | |
ENI SpA (Energy, Oil, Gas & Consumable Fuels) | | | | | | | 5,328 | | | | 125,975 | | | | 0.56 | |
Other securities | | | | | | | | | | | 357,357 | | | | 1.60 | |
| | | | | |
| | | | | | | | | | | 483,332 | | | | 2.16 | |
| | | | | | | | | | | | | | | | |
| | | | | |
| Japan: 18.92% | | | | | | | | | | | | | | | | |
Honda Motor Company Limited (Consumer Discretionary, Automobiles) | | | | | | | 3,400 | | | | 112,680 | | | | 0.50 | |
Mitsubishi UFJ Financial Group Incorporated (Financials, Commercial Banks) | | | | | | | 26,670 | | | | 121,970 | | | | 0.55 | |
Sumitomo Mitsui Financial Group Incorporated (Financials, Commercial Banks) | | | | | | | 2,800 | | | | 90,146 | | | | 0.40 | |
Toyota Motor Corporation (Consumer Discretionary, Automobiles) « | | | | | | | 5,800 | | | | 248,717 | | | | 1.11 | |
Other securities | | | | | | | | | | | 3,657,217 | | | | 16.36 | |
| | | | | |
| | | | | | | | | | | 4,230,730 | | | | 18.92 | |
| | | | | | | | | | | | | | | | |
| | | | | |
| Luxembourg: 0.42% | | | | | | | | | | | | | | | | |
Other securities | | | | | | | | | | | 93,196 | | | | 0.42 | |
| | | | | | | | | | | | | | | | |
| | | | | |
| Netherlands: 2.80% | | | | | | | | | | | | | | | | |
Unilever NV (Consumer Staples, Food Products) | | | | | | | 3,412 | | | | 129,463 | | | | 0.58 | |
Other securities | | | | | | | | | | | 497,038 | | | | 2.22 | |
| | | | | |
| | | | | | | | | | | 626,501 | | | | 2.80 | |
| | | | | | | | | | | | | | | | |
| | | | | |
| New Zealand: 0.14% | | | | | | | | | | | | | | | | |
Other securities | | | | | | | | | | | 30,215 | | | | 0.14 | |
| | | | | | | | | | | | | | | | |
| | | | | |
| Norway: 0.89% | | | | | | | | | | | | | | | | |
Other securities | | | | | | | | | | | 197,747 | | | | 0.89 | |
| | | | | | | | | | | | | | | | |
| | | | | |
| Portugal: 0.17% | | | | | | | | | | | | | | | | |
Other securities | | | | | | | | | | | 38,251 | | | | 0.17 | |
| | | | | | | | | | | | | | | | |
| | | | | |
| Singapore: 1.83% | | | | | | | | | | | | | | | | |
Other securities | | | | | | | | | | | 409,754 | | | | 1.83 | |
| | | | | | | | | | | | | | | | |
| | | | | |
| Spain: 2.91% | | | | | | | | | | | | | | | | |
Banco Bilbao Vizcaya Argentaria SA (Financials, Commercial Banks) | | | | | | | 11,236 | | | | 95,335 | | | | 0.43 | |
Banco Santander Central Hispano SA (Financials, Commercial Banks) | | | | | | | 21,405 | | | | 164,636 | | | | 0.73 | |
Telefonica SA (Telecommunication Services, Diversified Telecommunication Services) † | | | | | | | 8,458 | | | | 110,991 | | | | 0.50 | |
The accompanying notes are an integral part of these financial statements.
| | | | | | |
| Summary portfolio of investments—November 30, 2012 (unaudited) | | Wells Fargo Advantage Allocation Funds | | | 69 | |
INTERNATIONAL INDEX PORTFOLIO
| | | | | | | | | | | | | | | | |
| Security name | | | | | | Shares | | | Value | | | Percent of
net assets | |
| | | | | | | | | | | | | | | | |
| | | | | |
| Spain: (continued) | | | | | | | | | | | | | | | | |
Other securities | | | | | | | | | | $ | 280,650 | | | | 1.25 | % |
| | | | | |
| | | | | | | | | | | 651,612 | | | | 2.91 | |
| | | | | | | | | | | | | | | | |
| | | | | |
| Sweden: 3.08% | | | | | | | | | | | | | | | | |
Other securities | | | | | | | | | | | 688,524 | | | | 3.08 | |
| | | | | | | | | | | | | | | | |
| | | | | |
| Switzerland: 8.73% | | | | | | | | | | | | | | | | |
ABB Limited (Industrials, Electrical Equipment) | | | | | | | 4,584 | | | | 89,335 | | | | 0.40 | |
Nestle SA (Consumer Staples, Food Products) | | | | | | | 6,744 | | | | 441,377 | | | | 1.97 | |
Novartis AG (Health Care, Pharmaceuticals) | | | | | | | 4,802 | | | | 297,178 | | | | 1.33 | |
Roche Holdings AG (Health Care, Pharmaceuticals) | | | | | | | 1,467 | | | | 288,746 | | | | 1.29 | |
UBS AG (Financials, Diversified Financial Services) † | | | | | | | 7,639 | | | | 119,527 | | | | 0.53 | |
Other securities | | | | | | | | | | | 715,210 | | | | 3.21 | |
| | | | | |
| | | | | | | | | | | 1,951,373 | | | | 8.73 | |
| | | | | | | | | | | | | | | | |
| | | | | |
| United Kingdom: 22.65% | | | | | | | | | | | | | | | | |
AstraZeneca plc (Health Care, Pharmaceuticals) | | | | | | | 2,608 | | | | 123,953 | | | | 0.55 | |
Barclays plc (Financials, Commercial Banks) | | | | | | | 24,305 | | | | 95,793 | | | | 0.43 | |
BG Group plc (Health Care, Health Care Providers & Services) | | | | | | | 7,126 | | | | 122,161 | | | | 0.55 | |
BHP Billiton plc (Materials, Metals & Mining) | | | | | | | 4,417 | | | | 138,845 | | | | 0.62 | |
BP plc (Energy, Oil, Gas & Consumable Fuels) | | | | | | | 39,722 | | | | 274,673 | | | | 1.23 | |
British American Tobacco plc (Consumer Staples, Tobacco) | | | | | | | 4,064 | | | | 213,175 | | | | 0.95 | |
Diageo plc (Consumer Staples, Beverages) | | | | | | | 5,256 | | | | 156,376 | | | | 0.70 | |
GlaxoSmithKline plc (Health Care, Pharmaceuticals) | | | | | | | 10,401 | | | | 222,381 | | | | 0.99 | |
HSBC Holdings plc (Financials, Commercial Banks) | | | | | | | 38,292 | | | | 391,226 | | | | 1.75 | |
Rio Tinto plc (Materials, Metals & Mining) | | | | | | | 2,803 | | | | 138,924 | | | | 0.62 | |
Royal Dutch Shell plc Class A (Energy, Oil, Gas & Consumable Fuels) | | | | | | | 7,716 | | | | 258,308 | | | | 1.15 | |
Royal Dutch Shell plc Class B (Energy, Oil, Gas & Consumable Fuels) | | | | | | | 5,520 | | | | 190,541 | | | | 0.85 | |
SABMiller plc (Consumer Staples, Beverages) | | | | | | | 1,998 | | | | 90,511 | | | | 0.40 | |
Standard Chartered plc (Financials, Commercial Banks) | | | | | | | 5,009 | | | | 116,766 | | | | 0.52 | |
Tesco plc (Consumer Staples, Food & Staples Retailing) | | | | | | | 16,814 | | | | 87,577 | | | | 0.39 | |
Unilever plc (Consumer Staples, Food Products) | | | | | | | 2,683 | | | | 103,295 | | | | 0.46 | |
Vodafone Group plc (Telecommunication Services, Wireless Telecommunication Services) | | | | | | | 103,024 | | | | 265,994 | | | | 1.19 | |
Other securities | | | | | | | | | | | 2,074,836 | | | | 9.30 | |
| | | | | |
| | | | | | | | | | | 5,065,335 | | | | 22.65 | |
| | | | | | | | | | | | | | | | |
| | | | | |
Total Common Stocks (Cost $20,230,067) | | | | | | | | | | | 21,974,242 | | | | 98.26 | |
| | | | | | | | | | | | | | | | |
| | | | | |
Preferred Stocks: 0.62% | | | | | | | | | | | | | | | | |
| | | | | |
| Germany: 0.62% | | | | | | | | | | | | | | | | |
Other securities | | | | | | | | | | | 138,423 | | | | 0.62 | |
| | | | | | | | | | | | | | | | |
| | | | | |
| United Kingdom: 0.00% | | | | | | | | | | | | | | | | |
Other securities | | | | | | | | | | | 489 | | | | 0.00 | |
| | | | | | | | | | | | | | | | |
| | | | | |
Total Preferred Stocks (Cost $95,903) | | | | | | | | | | | 138,912 | | | | 0.62 | |
| | | | | | | | | | | | | | | | |
| | | | | |
Rights: 0.02% | | | | | | | | | | | | | | | | |
| | | | | |
| Spain: 0.01% | | | | | | | | | | | | | | | | |
Other securities | | | | | | | | | | | 2,479 | | | | 0.01 | |
| | | | | | | | | | | | | | | | |
| | | | | |
| Switzerland: 0.00% | | | | | | | | | | | | | | | | |
Other securities | | | | | | | | | | | 120 | | | | 0.00 | |
| | | | | | | | | | | | | | | | |
The accompanying notes are an integral part of these financial statements.
| | | | |
| 70 | | Wells Fargo Advantage Allocation Funds | | Summary portfolio of investments—November 30, 2012 (unaudited) |
INTERNATIONAL INDEX PORTFOLIO
| | | | | | | | | | | | | | | | | | |
| Security name | | | | | | | | | | Value | | | Percent of
net assets | |
| | | | | | | | | | | | | | | | | | |
| | | | | |
| United Kingdom : 0.01% | | | | | | | | | | | | | | | | | | |
Other securities | | | | | | | | | | | | $ | 1,353 | | | | 0.01 | % |
| | | | | | | | | | | | | | | | | | |
| | | | | |
Total Rights (Cost $15,422) | | | | | | | | | | | | | 3,952 | | | | 0.02 | |
| | | | | | | | | | | | | | | | | | |
| | | | | |
| | | | | Yield | | | Shares | | | | | | | |
| | | | | |
Short-Term Investments: 2.02% | | | | | | | | | | | | | | | | | | |
| | | | | |
| Investment Companies: 2.02% | | | | | | | | | | | | | | | | | | |
Wells Fargo Securities Lending Cash Investment, LLC (u)(l)(v)(r) | | | | | 0.21 | % | | | 452,217 | | | | 452,217 | | | | 2.02 | |
| | | | | | | | | | | | | | | | | | |
| | | | | |
Total Short-Term Investments (Cost $452,217) | | | | | | | | | | | | | 452,217 | | | | 2.02 | |
| | | | | | | | | | | | | | | | | | |
| Total investments in securities | | | | | | | | | | | | | | | | | | |
| (Cost $20,793,609) * | | | | | | | | | | | | | 22,569,323 | | | | 100.92 | |
Other assets and liabilities, net | | | | | | | | | | | | | (206,172 | ) | | | (0.92 | ) |
| | | | | | | | | | | | | | | | | | |
| Total net assets | | | | | | | | | | | | $ | 22,363,151 | | | | 100.00 | % |
| | | | | | | | | | | | | | | | | | |
| † | Non-income-earning security |
| (u) | Rate shown is the 7-day annualized yield at period end. |
| (l) | Investment in an affiliate |
| « | All or a portion of this security is on loan. |
| (v) | Security represents investment of cash collateral received from securities on loan. |
| (r) | The investment company is exempt from registration under Section 3(c)(7) of the Investment Company Act of 1940, as amended. |
| * | Cost for federal income tax purposes is $21,165,061 and unrealized appreciation (depreciation) consists of: |
| | | | |
Gross unrealized appreciation | | $ | 2,838,297 | |
Gross unrealized depreciation | | | (1,434,035 | ) |
| | | | |
Net unrealized appreciation | | $ | 1,404,262 | |
The following table shows the percent of total long-term investments by sector as of November 30, 2012:
| | | | |
Financials | | | 24.55 | % |
Industrials | | | 12.27 | % |
Consumer Staples | | | 11.82 | % |
Consumer Discretionary | | | 11.03 | % |
Health Care | | | 10.53 | % |
Materials | | | 9.66 | % |
Energy | | | 7.40 | % |
Telecommunication Services | | | 4.63 | % |
Information Technology | | | 4.30 | % |
Utilities | | | 3.81 | % |
| | | | |
| | | 100.00 | % |
| | | | |
The accompanying notes are an integral part of these financial statements.
| | | | | | |
| Portfolio of investments—November 30, 2012 (unaudited) | | Wells Fargo Advantage Allocation Funds | | | 71 | |
INTERNATIONAL VALUE PORTFOLIO
| | | | | | | | | | | | |
| Security name | | | | | | Shares | | | Value | |
| | | | | | | | | | | | |
| | | | |
Common Stocks: 96.62% | | | | | | | | | | | | |
| | | | |
| Australia: 4.83% | | | | | | | | | | | | |
Arrium Limited (Materials, Metals & Mining) | | | | | | | 934,300 | | | $ | 799,529 | |
Bendigo Bank Limited (Financials, Commercial Banks) | | | | | | | 272,500 | | | | 2,297,797 | |
Boart Longyear Group (Energy, Energy Equipment & Services) | | | | | | | 199,991 | | | | 299,500 | |
Cabcharge Australia Limited (Industrials, Commercial Services & Supplies) | | | | | | | 207,386 | | | | 837,576 | |
Challenger Financial Services Group Limited (Financials, Diversified Financial Services) | | | | | | | 475,400 | | | | 1,652,104 | |
Downer EDI Limited (Industrials, Commercial Services & Supplies) † | | | | | | | 425,500 | | | | 1,567,502 | |
Goodman Fielder Limited (Consumer Staples, Food Products) † | | | | | | | 1,387,983 | | | | 970,494 | |
Lend Lease Corporation Limited (Financials, Real Estate Management & Development) | | | | | | | 273,769 | | | | 2,457,065 | |
Metcash Limited (Consumer Staples, Food & Staples Retailing) | | | | | | | 536,500 | | | | 1,920,427 | |
Mincor Resources NL (Materials, Metals & Mining) | | | | | | | 570,994 | | | | 622,704 | |
Myer Holdings Limited (Consumer Discretionary, Multiline Retail) « | | | | | | | 577,400 | | | | 1,307,586 | |
Sally Malay Mining Limited (Materials, Metals & Mining) | | | | | | | 368,800 | | | | 202,062 | |
Westpac Banking Corporation (Financials, Commercial Banks) | | | | | | | 91,800 | | | | 2,442,962 | |
| | | | |
| | | | | | | | | | | 17,377,308 | |
| | | | | | | | | | | | |
| | | | |
| Austria: 1.54% | | | | | | | | | | | | |
Erste Bank Der Oesterreichischen Sparkassen AG (Financials, Commercial Banks) † | | | | | | | 22,100 | | | | 650,004 | |
OMV AG (Energy, Oil, Gas & Consumable Fuels) | | | | | | | 41,100 | | | | 1,468,878 | |
RHI AG (Materials, Chemicals) | | | | | | | 63,021 | | | | 1,883,487 | |
Voestalpine AG (Materials, Metals & Mining) | | | | | | | 47,700 | | | | 1,540,050 | |
| | | | |
| | | | | | | | | | | 5,542,419 | |
| | | | | | | | | | | | |
| | | | |
| Belgium: 1.16% | | | | | | | | | | | | |
Delhaize Group SA (Consumer Staples, Food & Staples Retailing) | | | | | | | 39,400 | | | | 1,456,802 | |
KBC Groep NV (Financials, Commercial Banks) | | | | | | | 53,400 | | | | 1,608,796 | |
Tessenderlo Chemie NV (Materials, Chemicals) | | | | | | | 37,000 | | | | 1,117,836 | |
| | | | |
| | | | | | | | | | | 4,183,434 | |
| | | | | | | | | | | | |
| | | | |
| Brazil: 1.75% | | | | | | | | | | | | |
Banco do Brasil SA (Financials, Commercial Banks) | | | | | | | 130,500 | | | | 1,338,101 | |
Cia Saneamento Basico de Sau Paulo (Utilities, Water Utilities) | | | | | | | 84,400 | | | | 3,416,604 | |
Cia Saneamento Minas Gerais (Utilities, Water Utilities) | | | | | | | 72,400 | | | | 1,524,710 | |
| | | | |
| | | | | | | | | | | 6,279,415 | |
| | | | | | | | | | | | |
| | | | |
| Canada: 2.17% | | | | | | | | | | | | |
Magna International Incorporated Class A (Consumer Discretionary, Auto Components) « | | | | | | | 54,400 | | | | 2,538,320 | |
Metro Incorporated (Consumer Staples, Food & Staples Retailing) « | | | | | | | 48,400 | | | | 2,979,961 | |
WestJet Airlines Limited (Industrials, Airlines) | | | | | | | 120,000 | | | | 2,271,103 | |
| | | | |
| | | | | | | | | | | 7,789,384 | |
| | | | | | | | | | | | |
| | | | |
| China: 2.72% | | | | | | | | | | | | |
China BlueChemical Limited (Materials, Chemicals) | | | | | | | 1,984,000 | | | | 1,239,008 | |
China Communications Services Corporation Limited (Telecommunication Services, Diversified
Telecommunication Services) | | | | | | | 2,836,000 | | | | 1,595,438 | |
China Petroleum & Chemical Corporation (Energy, Oil, Gas & Consumable Fuels) | | | | | | | 4,705,000 | | | | 4,990,207 | |
China Railway Construction Corporation Limited (Industrials, Construction & Engineering) « | | | | | | | 1,747,500 | | | | 1,948,130 | |
| | | | |
| | | | | | | | | | | 9,772,783 | |
| | | | | | | | | | | | |
The accompanying notes are an integral part of these financial statements.
| | | | |
| 72 | | Wells Fargo Advantage Allocation Funds | | Portfolio of investments—November 30, 2012 (unaudited) |
INTERNATIONAL VALUE PORTFOLIO
| | | | | | | | | | | | |
| Security name | | | | | | Shares | | | Value | |
| | | | | | | | | | | | |
| | | | |
| Czech Republic: 0.53% | | | | | | | | | | | | |
CEZ AS (Utilities, Electric Utilities) | | | | | | | 57,500 | | | $ | 1,910,678 | |
| | | | | | | | | | | | |
| | | | |
| Denmark: 0.57% | | | | | | | | | | | | |
Danske Bank A/S (Financials, Commercial Banks) † | | | | | | | 45,600 | | | | 781,821 | |
H. Lundbeck A/S (Health Care, Pharmaceuticals) | | | | | | | 75,800 | | | | 1,267,231 | |
| | | | |
| | | | | | | | | | | 2,049,052 | |
| | | | | | | | | | | | |
| | | | |
| Finland: 0.44% | | | | | | | | | | | | |
TietoEnator Oyj (Information Technology, IT Services) | | | | | | | 82,700 | | | | 1,587,520 | |
| | | | | | | | | | | | |
| | | | |
| France: 7.70% | | | | | | | | | | | | |
AXA SA (Financials, Insurance) | | | | | | | 93,100 | | | | 1,529,862 | |
BNP Paribas SA (Financials, Commercial Banks) | | | | | | | 30,200 | | | | 1,686,735 | |
Credit Agricole SA (Financials, Commercial Banks) † | | | | | | | 219,328 | | | | 1,662,706 | |
Sanofi-Aventis SA (Health Care, Pharmaceuticals) | | | | | | | 88,338 | | | | 7,888,214 | |
SCOR SE (Financials, Insurance) | | | | | | | 109,700 | | | | 2,896,923 | |
Societe Generale SA (Financials, Diversified Financial Services) † | | | | | | | 39,000 | | | | 1,410,311 | |
Societe Television Francaise 1 SA (Consumer Discretionary, Media) | | | | | | | 133,100 | | | | 1,302,256 | |
Thales SA (Industrials, Aerospace & Defense) | | | | | | | 59,100 | | | | 2,125,634 | |
Total SA (Energy, Oil, Gas & Consumable Fuels) | | | | | | | 85,500 | | | | 4,278,308 | |
Vivendi SA (Consumer Discretionary, Media) | | | | | | | 134,746 | | | | 2,895,031 | |
| | | | |
| | | | | | | | | | | 27,675,980 | |
| | | | | | | | | | | | |
| | | | |
| Germany: 8.25% | | | | | | | | | | | | |
Allianz AG (Financials, Insurance) | | | | | | | 33,100 | | | | 4,302,671 | |
BASF SE (Materials, Chemicals) | | | | | | | 46,500 | | | | 4,166,770 | |
Daimler AG (Consumer Discretionary, Automobiles) | | | | | | | 69,300 | | | | 3,423,068 | |
Deutsche Bank AG (Financials, Commercial Banks) | | | | | | | 41,200 | | | | 1,818,597 | |
E.ON AG (Utilities, Multi-Utilities) | | | | | | | 52,800 | | | | 951,067 | |
Hannover Rueckversicherung AG (Financials, Insurance) | | | | | | | 31,000 | | | | 2,283,962 | |
Metro AG (Consumer Staples, Food & Staples Retailing) | | | | | | | 49,800 | | | | 1,394,443 | |
Muenchener Rueckversicherungs-Gesellschaft AG (Financials, Insurance) | | | | | | | 19,700 | | | | 3,362,737 | |
Norddeutsche Affinerie AG (Materials, Metals & Mining) | | | | | | | 25,900 | | | | 1,645,813 | |
RWE AG (Utilities, Multi-Utilities) | | | | | | | 40,900 | | | | 1,705,618 | |
Volkswagen AG (Consumer Discretionary, Automobiles) | | | | | | | 22,600 | | | | 4,596,979 | |
| | | | |
| | | | | | | | | | | 29,651,725 | |
| | | | | | | | | | | | |
| | | | |
| Hong Kong: 1.78% | | | | | | | | | | | | |
Guangdong Investment Limited (Utilities, Water Utilities) | | | | | | | 2,772,000 | | | | 2,253,310 | |
Johnson Electric Holdings Limited (Industrials, Electrical Equipment) | | | | | | | 1,133,500 | | | | 763,447 | |
Kingboard Laminates Holdings Limited (Information Technology, Electronic Equipment, Instruments & Components) | | | | | | | 2,204,000 | | | | 966,891 | |
Lonking Holdings Limited (Industrials, Machinery) « | | | | | | | 3,973,000 | | | | 907,359 | |
Yue Yuen Industrial Holdings Limited (Consumer Discretionary, Textiles, Apparel & Luxury Goods) | | | | | | | 429,500 | | | | 1,504,597 | |
| | | | |
| | | | | | | | | | | 6,395,604 | |
| | | | | | | | | | | | |
| | | | |
| India: 1.10% | | | | | | | | | | | | |
Tata Motors Limited ADR (Consumer Discretionary, Auto Components) « | | | | | | | 83,800 | | | | 2,100,866 | |
Tata Steel Limited GDR (Industrials, Machinery) | | | | | | | 245,900 | | | | 1,840,562 | |
| | | | |
| | | | | | | | | | | 3,941,428 | |
| | | | | | | | | | | | |
The accompanying notes are an integral part of these financial statements.
| | | | | | |
| Portfolio of investments—November 30, 2012 (unaudited) | | Wells Fargo Advantage Allocation Funds | | | 73 | |
INTERNATIONAL VALUE PORTFOLIO
| | | | | | | | | | | | |
| Security name | | | | | | Shares | | | Value | |
| | | | | | | | | | | | |
| | | | |
| Indonesia: 0.25% | | | | | | | | | | | | |
PT Japfa Comfeed Indonesia tbk (Consumer Staples, Food Products) | | | �� | | | | 1,621,000 | | | $ | 903,982 | |
| | | | | | | | | | | | |
| | | | |
| Ireland: 0.00% | | | | | | | | | | | | |
Allied Irish Banks plc (Financials, Commercial Banks) † | | | | | | | 79,300 | | | | 5,466 | |
Irish Life & Permanent Group Holdings plc (Financials, Insurance) † | | | | | | | 111,500 | | | | 2,900 | |
| | | | |
| | | | | | | | | | | 8,366 | |
| | | | | | | | | | | | |
| | | | |
| Israel: 1.20% | | | | | | | | | | | | |
Bank Hapoalim Limited (Financials, Commercial Banks) † | | | | | | | 542,900 | | | | 2,236,944 | |
Teva Pharmaceutical Industries Limited (Health Care, Pharmaceuticals) | | | | | | | 51,404 | | | | 2,088,389 | |
| | | | |
| | | | | | | | | | | 4,325,333 | |
| | | | | | | | | | | | |
| | | | |
| Italy: 1.61% | | | | | | | | | | | | |
Enel SpA (Utilities, Multi-Utilities) | | | | | | | 688,400 | | | | 2,608,902 | |
ENI SpA (Energy, Oil, Gas & Consumable Fuels) | | | | | | | 135,200 | | | | 3,196,671 | |
| | | | |
| | | | | | | | | | | 5,805,573 | |
| | | | | | | | | | | | |
| | | | |
| Japan: 18.96% | | | | | | | | | | | | |
Adeka Corporation (Materials, Chemicals) | | | | | | | 203,200 | | | | 1,624,417 | |
Aozora Bank Limited (Financials, Commercial Banks) | | | | | | | 588,000 | | | | 1,811,755 | |
Chiba Bank Limited (Financials, Commercial Banks) | | | | | | | 208,000 | | | | 1,241,414 | |
Edion Corporation (Consumer Discretionary, Specialty Retail) | | | | | | | 73,600 | | | | 287,490 | |
Eizo Nanao Corporation (Information Technology, Computers & Peripherals) | | | | | | | 63,300 | | | | 979,044 | |
Fukuoka Financial Group Incorporated (Financials, Commercial Banks) | | | | | | | 378,000 | | | | 1,490,265 | |
Hitachi Capital Corporation (Financials, Consumer Finance) | | | | | | | 57,700 | | | | 1,087,715 | |
Itochu Corporation (Industrials, Trading Companies & Distributors) | | | | | | | 168,000 | | | | 1,679,287 | |
JX Holdings Incorporated (Energy, Oil, Gas & Consumable Fuels) | | | | | | | 408,000 | | | | 2,177,716 | |
KDDI Corporation (Telecommunication Services, Wireless Telecommunication Services) | | | | | | | 60,000 | | | | 4,439,862 | |
Kyorin Company Limited (Health Care, Pharmaceuticals) | | | | | | | 99,000 | | | | 2,106,460 | |
Maeda Road Construction Company Limited (Industrials, Construction & Engineering) | | | | | | | 148,000 | | | | 2,009,001 | |
Marubeni Corporation (Industrials, Trading Companies & Distributors) | | | | | | | 516,000 | | | | 3,398,896 | |
Miraca Holdings Incorporated (Health Care, Health Care Providers & Services) | | | | | | | 25,700 | | | | 1,042,840 | |
Mitsubishi Corporation (Industrials, Trading Companies & Distributors) | | | | | | | 35,500 | | | | 672,233 | |
Mitsui & Company Limited (Industrials, Trading Companies & Distributors) | | | | | | | 54,300 | | | | 750,260 | |
Mizuho Financial Group Incorporated (Financials, Commercial Banks) | | | | | | | 1,831,300 | | | | 2,932,390 | |
Nichirei Corporation (Consumer Staples, Food Products) | | | | | | | 265,000 | | | | 1,436,950 | |
Nihon Kohden Corporation (Health Care, Health Care Equipment & Supplies) | | | | | | | 45,400 | | | | 1,489,743 | |
Nippon Electric Glass Company Limited (Information Technology, Electronic Equipment, Instruments & Components) | | | | | | | 107,000 | | | | 610,056 | |
Nippon Telegraph & Telephone Corporation (Telecommunication Services, Diversified Telecommunication Services) | | | | | | | 74,600 | | | | 3,334,761 | |
Nissan Motor Company Limited (Consumer Discretionary, Automobiles) | | | | | | | 151,400 | | | | 1,467,442 | |
Nissan Shatai Company Limited (Consumer Discretionary, Auto Components) | | | | | | | 8,700 | | | | 99,733 | |
NTT DoCoMo Incorporated (Telecommunication Services, Wireless Telecommunication Services) | | | | | | | 1,400 | | | | 2,019,288 | |
Otsuka Corporation (Information Technology, IT Services) | | | | | | | 32,800 | | | | 2,602,196 | |
Otsuka Holdings Company Limited (Health Care, Health Care Providers & Services) | | | | | | | 133,900 | | | | 3,974,687 | |
Rengo Company Limited (Materials, Containers & Packaging) | | | | | | | 208,000 | | | | 1,082,453 | |
Ryosan Company Limited (Information Technology, Electronic Equipment, Instruments & Components) | | | | | | | 16,200 | | | | 262,745 | |
Saizeriya Company Limited (Consumer Discretionary, Hotels, Restaurants & Leisure) | | | | | | | 44,900 | | | | 630,185 | |
Sankyu Incorporated (Industrials, Road & Rail) | | | | | | | 313,000 | | | | 1,275,769 | |
Sega Sammy Holdings Incorporated (Consumer Discretionary, Leisure Equipment & Products) | | | | | | | 80,800 | | | | 1,344,788 | |
The accompanying notes are an integral part of these financial statements.
| | | | |
| 74 | | Wells Fargo Advantage Allocation Funds | | Portfolio of investments—November 30, 2012 (unaudited) |
INTERNATIONAL VALUE PORTFOLIO
| | | | | | | | | | | | |
| Security name | | | | | | Shares | | | Value | |
| | | | | | | | | | | | |
| | | | |
| Japan: (continued) | | | | | | | | | | | | |
Shionogi & Company Limited (Health Care, Pharmaceuticals) | | | | | | | 113,100 | | | $ | 1,915,298 | |
Sojitz Corporation (Industrials, Trading Companies & Distributors) | | | | | | | 678,000 | | | | 855,365 | |
Sumitomo Corporation (Consumer Discretionary, Distributors) | | | | | | | 285,000 | | | | 3,536,787 | |
Sumitomo Mitsui Financial Group Incorporated (Financials, Commercial Banks) | | | | | | | 92,900 | | | | 2,990,921 | |
Sumitomo Mitsui Trust Holdings Incorporated (Financials, Commercial Banks) | | | | | | | 613,000 | | | | 1,859,040 | |
The Keiyo Bank Limited (Financials, Commercial Banks) | | | | | | | 62,000 | | | | 273,767 | |
Toshiba TEC Corporation (Information Technology, Office Electronics) | | | | | | | 234,000 | | | | 1,175,180 | |
Tsuruha Holdings Incorporated (Consumer Staples, Food & Staples Retailing) | | | | | | | 29,400 | | | | 2,214,763 | |
Yokohama Rubber Company Limited (Consumer Discretionary, Auto Components) | | | | | | | 297,000 | | | | 1,988,767 | |
| | | | |
| | | | | | | | | | | 68,171,729 | |
| | | | | | | | | | | | |
| | | | |
| Liechtenstein: 0.14% | | | | | | | | | | | | |
Verwaltungs-Und Privat-Bank AG (Financials, Capital Markets) | | | | | | | 7,800 | | | | 521,431 | |
| | | | | | | | | | | | |
| | | | |
| Netherlands: 2.57% | | | | | | | | | | | | |
Aegon NV (Financials, Insurance) | | | | | | | 151,800 | | | | 873,205 | |
ING Groep NV (Financials, Diversified Financial Services) † | | | | | | | 237,100 | | | | 2,130,772 | |
Koninklijke Ahold NV (Consumer Staples, Food & Staples Retailing) | | | | | | | 241,100 | | | | 3,059,119 | |
Koninklijke DSM NV (Consumer Staples, Food & Staples Retailing) | | | | | | | 52,700 | | | | 3,035,251 | |
Nutreco Holding NV (Consumer Staples, Food Products) | | | | | | | 1,740 | | | | 141,865 | |
| | | | |
| | | | | | | | | | | 9,240,212 | |
| | | | | | | | | | | | |
| | | | |
| Norway: 1.74% | | | | | | | | | | | | |
Atea ASA (Information Technology, IT Services) | | | | | | | 158,200 | | | | 1,717,607 | |
DnB Nor ASA (Financials, Commercial Banks) | | | | | | | 98,900 | | | | 1,231,787 | |
Statoil ASA (Energy, Oil, Gas & Consumable Fuels) | | | | | | | 61,700 | | | | 1,508,611 | |
Yara International ASA (Materials, Chemicals) | | | | | | | 35,800 | | | | 1,795,546 | |
| | | | |
| | | | | | | | | | | 6,253,551 | |
| | | | | | | | | | | | |
| | | | |
| Poland: 0.97% | | | | | | | | | | | | |
Asseco Poland SA (Information Technology, Software) | | | | | | | 101,800 | | | | 1,402,902 | |
KGHM Polska Miedz SA (Materials, Metals & Mining) « | | | | | | | 36,500 | | | | 2,069,698 | |
| | | | |
| | | | | | | | | | | 3,472,600 | |
| | | | | | | | | | | | |
| | | | |
| Portugal: 0.07% | | | | | | | | | | | | |
Banco BPI SA (Financials, Commercial Banks) † | | | | | | | 245,688 | | | | 258,180 | |
| | | | | | | | | | | | |
| | | | |
| Russia: 2.02% | | | | | | | | | | | | |
Gazprom Neft Sponsored ADR (Energy, Oil, Gas & Consumable Fuels) | | | | | | | 150,014 | | | | 3,438,321 | |
Gazprom Neft Sponsored ADR (Energy, Oil, Gas & Consumable Fuels) | | | | | | | 886 | | | | 20,164 | |
Lukoil ADR (Energy, Oil, Gas & Consumable Fuels) | | | | | | | 60,400 | | | | 3,789,242 | |
| | | | |
| | | | | | | | | | | 7,247,727 | |
| | | | | | | | | | | | |
| | | | |
| Singapore: 0.48% | | | | | | | | | | | | |
United Overseas Bank Limited (Financials, Commercial Banks) | | | | | | | 113,000 | | | | 1,733,049 | |
| | | | | | | | | | | | |
| | | | |
| South Africa: 0.44% | | | | | | | | | | | | |
Exxaro Resources Limited (Materials, Metals & Mining) | | | | | | | 91,400 | | | | 1,587,862 | |
| | | | | | | | | | | | |
The accompanying notes are an integral part of these financial statements.
| | | | | | |
| Portfolio of investments—November 30, 2012 (unaudited) | | Wells Fargo Advantage Allocation Funds | | | 75 | |
INTERNATIONAL VALUE PORTFOLIO
| | | | | | | | | | | | |
| Security name | | | | | | Shares | | | Value | |
| | | | | | | | | | | | |
| | | | |
| South Korea: 1.98% | | | | | | | | | | | | |
Industrial Bank of Korea (Financials, Commercial Banks) | | | | | | | 192,500 | | | $ | 2,044,374 | |
SK Telecom Company Limited (Telecommunication Services, Wireless Telecommunication Services) | | | | | | | 22,300 | | | | 3,099,367 | |
Woori Finance Holdings Company Limited (Financials, Commercial Banks) | | | | | | | 212,200 | | | | 1,989,038 | |
| | | | |
| | | | | | | | | | | 7,132,779 | |
| | | | | | | | | | | | |
| | | | |
| Spain: 2.23% | | | | | | | | | | | | |
Banco Bilbao Vizcaya Argentaria SA (Financials, Commercial Banks) | | | | | | | 185,200 | | | | 1,571,384 | |
Banco Espanol de Credito SA (Financials, Commercial Banks) « | | | | | | | 146,100 | | | | 533,739 | |
Banco Santander Central Hispano SA (Financials, Commercial Banks) | | | | | | | 337,200 | | | | 2,593,559 | |
Repsol YPF SA (Energy, Oil, Gas & Consumable Fuels) | | | | | | | 123,800 | | | | 2,626,044 | |
Telefonica SA (Telecommunication Services, Diversified Telecommunication Services) | | | | | | | 52,400 | | | | 687,622 | |
| | | | |
| | | | | | | | | | | 8,012,348 | |
| | | | | | | | | | | | |
| | | | |
| Sweden: 1.45% | | | | | | | | | | | | |
Boliden AB (Materials, Metals & Mining) | | | | | | | 169,300 | | | | 2,994,974 | |
Saab AB (Industrials, Aerospace & Defense) | | | | | | | 113,500 | | | | 2,209,150 | |
| | | | |
| | | | | | | | | | | 5,204,124 | |
| | | | | | | | | | | | |
| | | | |
| Switzerland: 5.43% | | | | | | | | | | | | |
Baloise Holding AG (Financials, Insurance) | | | | | | | 28,800 | | | | 2,416,316 | |
Credit Suisse Group AG (Financials, Capital Markets) | | | | | | | 141,700 | | | | 3,354,805 | |
Georg Fischer AG (Industrials, Machinery) | | | | | | | 3,000 | | | | 1,112,010 | |
Novartis AG (Health Care, Pharmaceuticals) | | | | | | | 40,400 | | | | 2,500,205 | |
Roche Holdings AG (Health Care, Pharmaceuticals) | | | | | | | 21,200 | | | | 4,172,742 | |
Swiss Re AG (Financials, Insurance) | | | | | | | 28,900 | | | | 2,081,661 | |
Zurich Financial Services AG (Financials, Insurance) | | | | | | | 15,200 | | | | 3,879,141 | |
| | | | |
| | | | | | | | | | | 19,516,880 | |
| | | | | | | | | | | | |
| | | | |
| Taiwan: 0.33% | | | | | | | | | | | | |
Powertech Technology Incorporated (Information Technology, Semiconductors &
Semiconductor Equipment) | | | | | | | 794,000 | | | | 1,176,489 | |
| | | | | | | | | | | | |
| | | | |
| Thailand: 0.56% | | | | | | | | | | | | |
Bangchak Petroleum plc (Energy, Oil, Gas & Consumable Fuels) | | | | | | | 2,188,900 | | | | 2,032,703 | |
| | | | | | | | | | | | |
| | | | |
| United Kingdom: 19.65% | | | | | | | | | | | | |
Amlin plc (Financials, Insurance) | | | | | | | 279,000 | | | | 1,727,208 | |
AstraZeneca plc (Health Care, Pharmaceuticals) | | | | | | | 140,400 | | | | 6,672,903 | |
Aviva plc (Financials, Insurance) | | | | | | | 314,900 | | | | 1,768,333 | |
BAE Systems plc (Industrials, Aerospace & Defense) | | | | | | | 684,100 | | | | 3,587,310 | |
Barclays plc (Financials, Commercial Banks) | | | | | | | 715,000 | | | | 2,818,023 | |
Bodycote plc (Industrials, Construction & Engineering) | | | | | | | 302,400 | | | | 1,999,007 | |
BP plc (Energy, Oil, Gas & Consumable Fuels) | | | | | | | 609,300 | | | | 4,213,238 | |
BT Group plc (Telecommunication Services, Diversified Telecommunication Services) | | | | | | | 1,124,900 | | | | 4,208,276 | |
Chemring Group plc (Industrials, Aerospace & Defense) | | | | | | | 221,686 | | | | 874,084 | |
Cookson Group plc (Utilities, Multi-Utilities) | | | | | | | 145,400 | | | | 1,428,000 | |
Firstgroup plc (Industrials, Road & Rail) | | | | | | | 254,700 | | | | 761,455 | |
GlaxoSmithKline plc (Health Care, Pharmaceuticals) | | | | | | | 57,700 | | | | 1,233,666 | |
Greene King plc (Consumer Discretionary, Hotels, Restaurants & Leisure) | | | | | | | 93,500 | | | | 916,783 | |
The accompanying notes are an integral part of these financial statements.
| | | | |
| 76 | | Wells Fargo Advantage Allocation Funds | | Portfolio of investments—November 30, 2012 (unaudited) |
INTERNATIONAL VALUE PORTFOLIO
| | | | | | | | | | | | | | |
| Security name | | | | | | | Shares | | | Value | |
| | | | | | | | | | | | | | |
| | | | |
| United Kingdom: (continued) | | | | | | | | | | | | | | |
Home Retail Group plc (Consumer Discretionary, Internet & Catalog Retail) « | | | | | | | | | 290,000 | | | $ | 518,985 | |
Inchcape plc (Consumer Discretionary, Distributors) | | | | | | | | | 319,200 | | | | 2,186,774 | |
J Sainsbury plc (Consumer Staples, Food & Staples Retailing) | | | | | | | | | 608,700 | | | | 3,329,432 | |
Kesa Electricals plc (Consumer Discretionary, Specialty Retail) | | | | | | | | | 679,100 | | | | 519,530 | |
Marks & Spencer Group plc (Consumer Discretionary, Multiline Retail) | | | | | | | | | 380,200 | | | | 2,379,292 | |
Marston’s plc (Consumer Discretionary, Hotels, Restaurants & Leisure) | | | | | | | | | 632,790 | | | | 1,269,309 | |
Old Mutual plc (Financials, Commercial Banks) | | | | | | | | | 982,800 | | | | 2,697,279 | |
Pace plc (Consumer Discretionary, Household Durables) | | | | | | | | | 374,800 | | | | 1,100,091 | |
Premier Foods plc (Consumer Staples, Food Products) † | | | | | | | | | 31,510 | | | | 48,338 | |
Royal & Sun Alliance Insurance Group plc (Financials, Insurance) | | | | | | | | | 443,900 | | | | 835,654 | |
Royal Dutch Shell plc Class A (Energy, Oil, Gas & Consumable Fuels) | | | | | | | | | 14,300 | | | | 479,267 | |
Royal Dutch Shell plc Class B (Energy, Oil, Gas & Consumable Fuels) | | | | | | | | | 264,000 | | | | 9,112,841 | |
Tesco plc (Consumer Staples, Food & Staples Retailing) | | | | | | | | | 655,700 | | | | 3,415,274 | |
Thomas Cook Group plc (Consumer Discretionary, Hotels, Restaurants & Leisure) † | | | | | | | | | 389,400 | | | | 162,208 | |
Tullett Prebon plc (Financials, Capital Markets) | | | | | | | | | 279,500 | | | | 1,016,061 | |
Vodafone Group plc (Telecommunication Services, Wireless Telecommunication Services) | | | | | | | | | 1,591,600 | | | | 4,109,298 | |
WH Smith plc (Consumer Discretionary, Specialty Retail) | | | | | | | | | 223,600 | | | | 2,328,561 | |
William Morrison Supermarkets plc (Consumer Staples, Food & Staples Retailing) | | | | | | | | | 679,700 | | | | 2,927,183 | |
| | | | |
| | | | | | | | | | | | | 70,643,663 | |
| | | | | | | | | | | | | | |
| | | | |
Total Common Stocks (Cost $388,485,305) | | | | | | | | | | | | | 347,405,311 | |
| | | | | | | | | | | | | | |
| | | | |
| | | | | Dividend yield | | | | | | | |
| | | | |
Preferred Stocks: 1.07% | | | | | | | | | | | | | | |
| | | | |
| Brazil: 1.07% | | | | | | | | | | | | | | |
Banco do Estado do Rio Grande do Sul SA (Financials, Commercial Banks) | | | | | 5.38 | % | | | 173,300 | | | | 1,229,515 | |
Cia Energetica de Minas Gerais (Energy, Oil, Gas & Consumable Fuels) | | | | | 10.30 | | | | 73,900 | | | | 887,782 | |
Companhia Vale do Rio Doce Class A (Materials, Metals & Mining) | | | | | 6.13 | | | | 100,100 | | | | 1,719,239 | |
| | | | |
Total Preferred Stocks (Cost $4,315,416) | | | | | | | | | | | | | 3,836,536 | |
| | | | | | | | | | | | | | |
| | | | |
| | | | | Yield | | | | | | | |
| | | | |
Short-Term Investments: 4.06% | | | | | | | | | | | | | | |
| | | | |
| Investment Companies: 4.06% | | | | | | | | | | | | | | |
Wells Fargo Advantage Cash Investment Money Market Fund, Select Class (l)(u) | | | | | 0.16 | | | | 1,479,062 | | | | 1,479,062 | |
Wells Fargo Securities Lending Cash Investments, LLC (l)(u)(r)(v) | | | | | 0.21 | | | | 13,117,922 | | | | 13,117,922 | |
| | | | |
Total Short-Term Investments (Cost $14,596,984) | | | | | | | | | | | | | 14,596,984 | |
| | | | | | | | | | | | | | |
| | | | | | | | |
| Total investments in securities | | | | | | | | |
| (Cost $407,397,705) * | | | 101.75 | % | | | 365,838,831 | |
Other assets and liabilities, net | | | (1.75 | ) | | | (6,275,930 | ) |
| | | | | | | | |
| Total net assets | | | 100.00 | % | | $ | 359,562,901 | |
| | | | | | | | |
The accompanying notes are an integral part of these financial statements.
| | | | | | |
| Portfolio of investments—November 30, 2012 (unaudited) | | Wells Fargo Advantage Allocation Funds | | | 77 | |
INTERNATIONAL VALUE PORTFOLIO
| † | Non-income-earning security |
| « | All or a portion of this security is on loan. |
| (l) | Investment in an affiliate |
| (r) | The investment company is exempt from registration under Section 3(c)(7) of the Investment Company Act of 1940, as amended. |
| (u) | Rate shown is the 7-day annualized yield at period end. |
| (v) | Security represents investment of cash collateral received from securities on loan. |
| * | Cost for federal income tax purposes is $408,276,608 and unrealized appreciation (depreciation) consists of: |
| | | | |
Gross unrealized appreciation | | $ | 29,807,775 | |
Gross unrealized depreciation | | | (72,245,552 | ) |
| | | | |
Net unrealized depreciation | | $ | (42,437,777 | ) |
The following table shows the percent of total long-term investments by sector as of Novemebr 30, 2012:
| | | | |
Financials | | | 25.46 | % |
Energy | | | 12.67 | % |
Consumer Discretionary | | | 11.51 | % |
Health Care | | | 10.35 | % |
Industrials | | | 9.52 | % |
Materials | | | 8.29 | % |
Consumer Staples | | | 7.46 | % |
Telecommunication Services | | | 6.69 | % |
Utilities | | | 4.50 | % |
Information Technology | | | 3.55 | % |
| | | | |
| | | 100.00 | % |
| | | | |
The accompanying notes are an integral part of these financial statements.
| | | | |
| 78 | | Wells Fargo Advantage Allocation Funds | | Portfolio of investments—November 30, 2012 (unaudited) |
LARGE COMPANY VALUE PORTFOLIO
| | | | | | | | | | | | |
| Security name | | | | | | Shares | | | Value | |
| | | | | | | | | | | | |
| | | | |
Common Stocks: 94.94% | | | | | | | | | | | | |
| | | | |
Consumer Discretionary: 8.50% | | | | | | | | | | | | |
| | | | |
| Household Durables: 2.65% | | | | | | | | | | | | |
Harman International Industries Incorporated | | | | | | | 10,524 | | | $ | 416,329 | |
Newell Rubbermaid Incorporated | | | | | | | 40,167 | | | | 876,042 | |
| | | | |
| | | | | | | | | | | 1,292,371 | |
| | | | | | | | | | | | |
| | | | |
| Media: 2.90% | | | | | | | | | | | | |
DIRECTV Group Incorporated † | | | | | | | 10,731 | | | | 533,331 | |
Omnicom Group Incorporated « | | | | | | | 6,408 | | | | 318,734 | |
Walt Disney Company | | | | | | | 11,402 | | | | 566,223 | |
| | | | |
| | | | | | | | | | | 1,418,288 | |
| | | | | | | | | | | | |
| | | | |
| Multiline Retail: 1.01% | | | | | | | | | | | | |
Target Corporation | | | | | | | 7,841 | | | | 495,002 | |
| | | | | | | | | | | | |
| | | | |
| Specialty Retail: 1.94% | | | | | | | | | | | | |
Home Depot Incorporated | | | | | | | 14,531 | | | | 945,532 | |
| | | | | | | | | | | | |
| | | | |
Consumer Staples: 6.03% | | | | | | | | | | | | |
| | | | |
| Beverages: 1.46% | | | | | | | | | | | | |
PepsiCo Incorporated | | | | | | | 10,171 | | | | 714,106 | |
| | | | | | | | | | | | |
| | | | |
| Food & Staples Retailing: 2.10% | | | | | | | | | | | | |
CVS Caremark Corporation | | | | | | | 22,063 | | | | 1,026,150 | |
| | | | | | | | | | | | |
| | | | |
| Household Products: 2.47% | | | | | | | | | | | | |
Procter & Gamble Company | | | | | | | 17,253 | | | | 1,204,777 | |
| | | | | | | | | | | | |
| | | | |
Energy: 14.62% | | | | | | | | | | | | |
| | | | |
| Energy Equipment & Services: 1.25% | | | | | | | | | | | | |
Noble Corporation | | | | | | | 17,691 | | | | 610,163 | |
| | | | | | | | | | | | |
| | | | |
| Oil, Gas & Consumable Fuels: 13.37% | | | | | | | | | | | | |
Apache Corporation « | | | | | | | 5,895 | | | | 454,446 | |
Chevron Corporation | | | | | | | 12,434 | | | | 1,314,149 | |
ConocoPhillips Company | | | | | | | 11,730 | | | | 667,906 | |
Devon Energy Corporation | | | | | | | 10,232 | | | | 528,687 | |
Exxon Mobil Corporation | | | | | | | 33,416 | | | | 2,945,286 | |
Whiting Petroleum Corporation † | | | | | | | 14,848 | | | | 622,725 | |
| | | | |
| | | | | | | | | | | 6,533,199 | |
| | | | | | | | | | | | |
| | | | |
Financials: 24.63% | | | | | | | | | | | | |
| | | | |
| Capital Markets: 2.04% | | | | | | | | | | | | |
Goldman Sachs Group Incorporated | | | | | | | 4,061 | | | | 478,345 | |
State Street Corporation | | | | | | | 11,653 | | | | 517,859 | |
| | | | |
| | | | | | | | | | | 996,204 | |
| | | | | | | | | | | | |
The accompanying notes are an integral part of these financial statements.
| | | | | | |
| Portfolio of investments—November 30, 2012 (unaudited) | | Wells Fargo Advantage Allocation Funds | | | 79 | |
LARGE COMPANY VALUE PORTFOLIO
| | | | | | | | | | | | |
| Security name | | | | | | Shares | | | Value | |
| | | | | | | | | | | | |
| | | | |
| Commercial Banks: 4.64% | | | | | | | | | | | | |
Comerica Incorporated | | | | | | | 25,495 | | | $ | 754,397 | |
First Republic Bank Corporation | | | | | | | 22,380 | | | | 756,892 | |
KeyCorp | | | | | | | 93,803 | | | | 757,928 | |
| | | | |
| | | | | | | | | | | 2,269,217 | |
| | | | | | | | | | | | |
| | | | |
| Consumer Finance: 2.65% | | | | | | | | | | | | |
Capital One Financial Corporation | | | | | | | 13,545 | | | | 780,192 | |
SLM Corporation | | | | | | | 31,026 | | | | 513,480 | |
| | | | |
| | | | | | | | | | | 1,293,672 | |
| | | | | | | | | | | | |
| | | | |
| Diversified Financial Services: 5.29% | | | | | | | | | | | | |
Bank of America Corporation | | | | | | | 65,495 | | | | 645,781 | |
Citigroup Incorporated | | | | | | | 17,911 | | | | 619,183 | |
JPMorgan Chase & Company | | | | | | | 32,137 | | | | 1,320,188 | |
| | | | |
| | | | | | | | | | | 2,585,152 | |
| | | | | | | | | | | | |
| | | | |
| Insurance: 6.52% | | | | | | | | | | | | |
ACE Limited | | | | | | | 12,234 | | | | 969,300 | |
American International Group Incorporated † | | | | | | | 14,489 | | | | 480,021 | |
MetLife Incorporated | | | | | | | 22,791 | | | | 756,433 | |
The Hartford Financial Services Group Incorporated | | | | | | | 22,174 | | | | 469,645 | |
The Travelers Companies Incorporated | | | | | | | 7,180 | | | | 508,488 | |
| | | | |
| | | | | | | | | | | 3,183,887 | |
| | | | | | | | | | | | |
| | | | |
| REITs: 3.49% | | | | | | | | | | | | |
American Campus Communities Incorporated | | | | | | | 15,542 | | | | 680,740 | |
Simon Property Group Incorporated | | | | | | | 6,720 | | | | 1,022,314 | |
| | | | |
| | | | | | | | | | | 1,703,054 | |
| | | | | | | | | | | | |
| | | | |
Health Care: 12.12% | | | | | | | | | | | | |
| | | | |
| Health Care Equipment & Supplies: 1.92% | | | | | | | | | | | | |
Medtronic Incorporated | | | | | | | 11,502 | | | | 484,349 | |
Stryker Corporation | | | | | | | 8,390 | | | | 454,402 | |
| | | | |
| | | | | | | | | | | 938,751 | |
| | | | | | | | | | | | |
| | | | |
| Health Care Providers & Services: 2.17% | | | | | | | | | | | | |
CIGNA Corporation | | | | | | | 20,305 | | | | 1,061,342 | |
| | | | | | | | | | | | |
| | | | |
| Pharmaceuticals: 8.03% | | | | | | | | | | | | |
Hospira Incorporated † | | | | | | | 20,237 | | | | 603,063 | |
Johnson & Johnson Services Incorporated « | | | | | | | 14,818 | | | | 1,033,259 | |
Merck & Company Incorporated | | | | | | | 13,716 | | | | 607,619 | |
Pfizer Incorporated | | | | | | | 50,571 | | | | 1,265,286 | |
Teva Pharmaceutical Industries Limited ADR | | | | | | | 10,166 | | | | 410,198 | |
| | | | |
| | | | | | | | | | | 3,919,425 | |
| | | | | | | | | | | | |
| | | | |
Industrials: 9.34% | | | | | | | | | | | | |
| | | | |
| Airlines: 0.95% | | | | | | | | | | | | |
Southwest Airlines Company | | | | | | | 48,721 | | | | 464,311 | |
| | | | | | | | | | | | |
The accompanying notes are an integral part of these financial statements.
| | | | |
| 80 | | Wells Fargo Advantage Allocation Funds | | Portfolio of investments—November 30, 2012 (unaudited) |
LARGE COMPANY VALUE PORTFOLIO
| | | | | | | | | | | | |
| Security name | | | | | | Shares | | | Value | |
| | | | | | | | | | | | |
| | | | |
| Commercial Services & Supplies: 1.17% | | | | | | | | | | | | |
Waste Management Incorporated | | | | | | | 17,589 | | | $ | 572,874 | |
| | | | | | | | | | | | |
| | | | |
| Construction & Engineering: 0.97% | | | | | | | | | | | | |
URS Corporation | | | | | | | 12,521 | | | | 471,791 | |
| | | | | | | | | | | | |
| | | | |
| Industrial Conglomerates: 3.68% | | | | | | | | | | | | |
General Electric Company | | | | | | | 85,137 | | | | 1,798,945 | |
| | | | | | | | | | | | |
| | | | |
| Machinery: 1.78% | | | | | | | | | | | | |
Dover Corporation | | | | | | | 5,534 | | | | 351,907 | |
Eaton Corporation « | | | | | | | 9,946 | | | | 518,783 | |
| | | | |
| | | | | | | | | | | 870,690 | |
| | | | | | | | | | | | |
| | | | |
| Road & Rail: 0.79% | | | | | | | | | | | | |
Norfolk Southern Corporation | | | | | | | 6,385 | | | | 385,526 | |
| | | | | | | | | | | | |
| | | | |
Information Technology: 7.47% | | | | | | | | | | | | |
| | | | |
| Communications Equipment: 1.72% | | | | | | | | | | | | |
Cisco Systems Incorporated | | | | | | | 44,277 | | | | 837,278 | |
| | | | | | | | | | | | |
| | | | |
| Computers & Peripherals: 2.28% | | | | | | | | | | | | |
Apple Incorporated | | | | | | | 866 | | | | 506,852 | |
EMC Corporation † | | | | | | | 17,483 | | | | 433,928 | |
Hewlett-Packard Company | | | | | | | 13,115 | | | | 170,364 | |
| | | | |
| | | | | | | | | | | 1,111,144 | |
| | | | | | | | | | | | |
| | | | |
| Internet Software & Services: 0.50% | | | | | | | | | | | | |
Google Incorporated Class A † | | | | | | | 349 | | | | 243,731 | |
| | | | | | | | | | | | |
| | | | |
| IT Services: 1.00% | | | | | | | | | | | | |
VeriFone Systems Incorporated Ǡ | | | | | | | 16,139 | | | | 490,464 | |
| | | | | | | | | | | | |
| | | | |
| Semiconductors & Semiconductor Equipment: 1.29% | | | | | | | | | | | | |
Maxim Integrated Products Incorporated | | | | | | | 21,615 | | | | 630,942 | |
| | | | | | | | | | | | |
| | | | |
| Software: 0.68% | | | | | | | | | | | | |
Symantec Corporation † | | | | | | | 17,807 | | | | 334,059 | |
| | | | | | | | | | | | |
| | | | |
Materials: 2.93% | | | | | | | | | | | | |
| | | | |
| Chemicals: 2.19% | | | | | | | | | | | | |
Ashland Incorporated | | | | | | | 9,786 | | | | 694,023 | |
Dow Chemical Company | | | | | | | 12,460 | | | | 376,167 | |
| | | | |
| | | | | | | | | | | 1,070,190 | |
| | | | | | | | | | | | |
| | | | |
| Metals & Mining: 0.74% | | | | | | | | | | | | |
Alcoa Incorporated « | | | | | | | 42,644 | | | | 358,636 | |
| | | | | | | | | | | | |
The accompanying notes are an integral part of these financial statements.
| | | | | | |
| Portfolio of investments—November 30, 2012 (unaudited) | | Wells Fargo Advantage Allocation Funds | | | 81 | |
LARGE COMPANY VALUE PORTFOLIO
| | | | | | | | | | | | | | |
| Security name | | | | | | | Shares | | | Value | |
| | | | | | | | | | | | | | |
| | | | |
Telecommunication Services: 2.79% | | | | | | | | | | | | | | |
| | | | |
| Diversified Telecommunication Services: 2.79% | | | | | | | | | | | | | | |
AT&T Incorporated | | | | | | | | | 30,104 | | | $ | 1,027,450 | |
Verizon Communications Incorporated | | | | | | | | | 7,650 | | | | 337,518 | |
| | | | |
| | | | | | | | | | | | | 1,364,968 | |
| | | | | | | | | | | | | | |
| | | | |
Utilities: 6.51% | | | | | | | | | | | | | | |
| | | | |
| Electric Utilities: 2.26% | | | | | | | | | | | | | | |
Duke Energy Corporation | | | | | | | | | 7,191 | | | | 458,930 | |
Entergy Corporation | | | | | | | | | 10,176 | | | | 646,583 | |
| | | | |
| | | | | | | | | | | | | 1,105,513 | |
| | | | | | | | | | | | | | |
| | | | |
| Multi-Utilities: 2.75% | | | | | | | | | | | | | | |
Dominion Resources Incorporated « | | | | | | | | | 12,533 | | | | 640,562 | |
NiSource Incorporated « | | | | | | | | | 29,017 | | | | 701,341 | |
| | | | |
| | | | | | | | | | | | | 1,341,903 | |
| | | | | | | | | | | | | | |
| | | | |
| Water Utilities: 1.50% | | | | | | | | | | | | | | |
American Water Works Company Incorporated | | | | | | | | | 19,159 | | | | 731,302 | |
| | | | | | | | | | | | | | |
| | | | |
Total Common Stocks (Cost $41,070,714) | | | | | | | | | | | | | 46,374,559 | |
| | | | | | | | | | | | | | |
| | | | |
| | | | | | | | Principal | | | | |
| | | | |
Other: 0.06% | | | | | | | | | | | | | | |
Gryphon Funding Limited, Pass-Through Entity (a)(i)(v) | | | | | | | | $ | 91,312 | | | | 30,133 | |
| | | | |
Total Other (Cost $8,652) | | | | | | | | | | | | | 30,133 | |
| | | | | | | | | | | | | | |
| | | | |
| | | Yield | | | | | Shares | | | | |
| | | | |
Short-Term Investments: 12.43% | | | | | | | | | | | | | | |
| | | | |
| Investment Companies: 12.43% | | | | | | | | | | | | | | |
Wells Fargo Advantage Cash Investment Money Market Fund, Select Class (l)(u) | | | 0.16 | % | | | | | 2,060,814 | | | | 2,060,814 | |
Wells Fargo Securities Lending Cash Investments, LLC (l)(r)(u)(v) | | | 0.21 | | | | | | 4,010,623 | | | | 4,010,623 | |
| | | | | | | | | | | | | | |
| | | | |
Total Short-Term Investments (Cost $6,071,437) | | | | | | | | | | | | | 6,071,437 | |
| | | | | | | | | | | | | | |
| | | | | | | | |
| Total investments in securities | | | | | | | | |
| (Cost $47,150,803)* | | | 107.43 | % | | | 52,476,129 | |
Other assets and liabilities, net | | | (7.43 | ) | | | (3,628,335 | ) |
| | | | | | | | |
| Total net assets | | | 100.00 | % | | $ | 48,847,794 | |
| | | | | | | | |
| † | Non-income-earning security |
| « | All or a portion of this security is on loan. |
| (a) | Security is fair valued by the Management Valuation Team, and in certain instances by the Board of Trustees, in accordance with procedures approved by the Board of Trustees. |
| (l) | Investment in an affiliate |
| (u) | Rate shown is the 7-day annualized yield at period end. |
| (v) | Security represents investment of cash collateral received from securities on loan. |
| (r) | The investment company is exempt from registration under Section 3(c)(7) of the Investment Company Act of 1940, as amended. |
| * | Cost for federal income tax purposes is $48,370,511 and unrealized appreciation (depreciation) consists of: |
| | | | |
Gross unrealized appreciation | | $ | 4,876,212 | |
Gross unrealized depreciation | | | (770,594 | ) |
| | | | |
Net unrealized appreciation | | $ | 4,105,618 | |
The accompanying notes are an integral part of these financial statements.
| | | | |
| 82 | | Wells Fargo Advantage Allocation Funds | | Portfolio of investments—November 30, 2012 (unaudited) |
SMALL CAP VALUE PORTFOLIO
| | | | | | | | | | | | |
| Security name | | | | | | Shares | | | Value | |
| | | | | | | | | | | | |
| | | | |
Common Stocks: 93.70% | | | | | | | | | | | | |
| | | | |
Consumer Discretionary: 7.35% | | | | | | | | | | | | |
| | | | |
| Auto Components: 1.45% | | | | | | | | | | | | |
Gentex Corporation | | | | | | | 13,508 | | | $ | 239,767 | |
| | | | | | | | | | | | |
| | | | |
| Diversified Consumer Services: 0.59% | | | | | | | | | | | | |
Cambium Learning Group Incorporated † | | | | | | | 19,495 | | | | 18,130 | |
Corinthian Colleges Incorporated † | | | | | | | 35,405 | | | | 78,599 | |
Voyager Expanded Learning Incorporated †(a)(i) | | | | | | | 58,950 | | | | 0 | |
| | | | |
| | | | | | | | | | | 96,729 | |
| | | | | | | | | | | | |
| | | | |
| Hotels, Restaurants & Leisure: 2.02% | | | | | | | | | | | | |
Century Casinos Incorporated † | | | | | | | 67,136 | | | | 177,910 | |
Empire Resorts Incorporated † | | | | | | | 13,855 | | | | 25,632 | |
Scientific Games Corporation Class A † | | | | | | | 15,475 | | | | 128,907 | |
| | | | |
| | | | | | | | | | | 332,449 | |
| | | | | | | | | | | | |
| | | | |
| Household Durables: 2.54% | | | | | | | | | | | | |
Cavco Industries Incorporated † | | | | | | | 5,150 | | | | 265,225 | |
KB Home Incorporated | | | | | | | 930 | | | | 13,355 | |
Nobility Homes Incorporated † | | | | | | | 21,085 | | | | 115,968 | |
Skyline Corporation † | | | | | | | 6,042 | | | | 24,772 | |
| | | | |
| | | | | | | | | | | 419,320 | |
| | | | | | | | | | | | |
| | | | |
| Media: 0.50% | | | | | | | | | | | | |
Outdoor Channel Holdings Incorporated | | | | | | | 11,145 | | | | 82,807 | |
| | | | | | | | | | | | |
| | | | |
| Specialty Retail: 0.25% | | | | | | | | | | | | |
rue21 Incorporated † | | | | | | | 1,413 | | | | 40,567 | |
| | | | | | | | | | | | |
| | | | |
Consumer Staples: 1.27% | | | | | | | | | | | | |
| | | | |
| Household Products: 0.45% | | | | | | | | | | | | |
WD-40 Company | | | | | | | 1,550 | | | | 73,222 | |
| | | | | | | | | | | | |
| | | | |
| Personal Products: 0.82% | | | | | | | | | | | | |
Prestige Brands Holdings Incorporated † | | | | | | | 6,264 | | | | 135,302 | |
| | | | | | | | | | | | |
| | | | |
Energy: 17.84% | | | | | | | | | | | | |
| | | | |
| Energy Equipment & Services: 7.79% | | | | | | | | | | | | |
Helix Energy Solutions Group Incorporated † | | | | | | | 9,433 | | | | 165,172 | |
Helmerich & Payne Incorporated | | | | | | | 1,245 | | | | 64,989 | |
ION Geophysical Corporation † | | | | | | | 27,715 | | | | 165,181 | |
Key Energy Services Incorporated † | | | | | | | 9,399 | | | | 62,879 | |
Matrix Service Company † | | | | | | | 20,824 | | | | 228,439 | |
Newpark Resources Incorporated † | | | | | | | 32,338 | | | | 252,236 | |
Oceaneering International Incorporated | | | | | | | 2,275 | | | | 119,847 | |
PHI Incorporated (non-voting) † | | | | | | | 2,718 | | | | 85,155 | |
PHI Incorporated (voting) † | | | | | | | 2,392 | | | | 71,880 | |
Willbros Group Incorporated † | | | | | | | 13,779 | | | | 69,308 | |
| | | | |
| | | | | | | | | | | 1,285,086 | |
| | | | | | | | | | | | |
The accompanying notes are an integral part of these financial statements.
| | | | | | |
| Portfolio of investments—November 30, 2012 (unaudited) | | Wells Fargo Advantage Allocation Funds | | | 83 | |
SMALL CAP VALUE PORTFOLIO
| | | | | | | | | | | | |
| Security name | | | | | | Shares | | | Value | |
| | | | | | | | | | | | |
| | | | |
| Oil, Gas & Consumable Fuels: 10.05% | | | | | | | | | | | | |
Clean Energy Fuels Corporation † | | | | | | | 2,865 | | | $ | 37,990 | |
Energy XXI (Bermuda) Limited | | | | | | | 845 | | | | 26,770 | |
Forest Oil Corporation † | | | | | | | 5,735 | | | | 36,532 | |
InterOil Corporation † | | | | | | | 15,940 | | | | 887,220 | |
McMoRan Exploration Company † | | | | | | | 33,174 | | | | 282,974 | |
PetroQuest Energy Incorporated † | | | | | | | 1,415 | | | | 7,542 | |
Range Resources Corporation | | | | | | | 4,160 | | | | 266,323 | |
Triangle Petroleum Corporation † | | | | | | | 17,763 | | | | 111,019 | |
| | | | |
| | | | | | | | | | | 1,656,370 | |
| | | | | | | | | | | | |
| | | | |
Financials: 18.62% | | | | | | | | | | | | |
| | | | |
| Capital Markets: 0.54% | | | | | | | | | | | | |
Artio Global Investors Incorporated | | | | | | | 39,225 | | | | 88,649 | |
| | | | | | | | | | | | |
| | | | |
| Commercial Banks: 4.53% | | | | | | | | | | | | |
1st United Bancorp Incorporated † | | | | | | | 12,625 | | | | 71,710 | |
Bancorp Incorporated † | | | | | | | 6,450 | | | | 75,207 | |
BBCN Bancorp Incorporated | | | | | | | 3,393 | | | | 38,612 | |
City National Corporation | | | | | | | 1,160 | | | | 56,480 | |
First Horizon National Corporation | | | | | | | 8,735 | | | | 82,633 | |
First Niagara Financial Group Incorporated | | | | | | | 18,858 | | | | 142,189 | |
IBERIABANK Corporation | | | | | | | 1,235 | | | | 60,206 | |
Pacific Premier Bancorp Incorporated † | | | | | | | 10,811 | | | | 112,867 | |
Park Sterling Corporation † | | | | | | | 4,160 | | | | 21,840 | |
Sterling Bancorp | | | | | | | 5,400 | | | | 50,220 | |
Univest Corporation of Pennsylvania | | | | | | | 2,039 | | | | 34,296 | |
| | | | |
| | | | | | | | | | | 746,260 | |
| | | | | | | | | | | | |
| | | | |
| Insurance: 3.18% | | | | | | | | | | | | |
Argo Group International Holdings Limited | | | | | | | 9,780 | | | | 324,598 | |
Hilltop Holdings Incorporated † | | | | | | | 8,436 | | | | 120,550 | |
Mercury General Corporation | | | | | | | 1,915 | | | | 79,702 | |
| | | | |
| | | | | | | | | | | 524,850 | |
| | | | | | | | | | | | |
| | | | |
| REITs: 10.26% | | | | | | | | | | | | |
Anworth Mortgage Asset Corporation | | | | | | | 12,250 | | | | 72,275 | |
Capstead Mortgage Corporation | | | | | | | 13,380 | | | | 162,433 | |
Chimera Investment Corporation | | | | | | | 192,610 | | | | 527,751 | |
Crexus Investment Corporation | | | | | | | 14,792 | | | | 184,752 | |
Hatteras Financial Corporation | | | | | | | 4,205 | | | | 112,105 | |
MFA Mortgage Investments Incorporated | | | | | | | 19,785 | | | | 166,392 | |
Origen Financial Incorporated | | | | | | | 58,585 | | | | 87,878 | |
Redwood Trust Incorporated | | | | | | | 9,121 | | | | 152,503 | |
UMH Properties Incorporated | | | | | | | 22,257 | | | | 225,463 | |
| | | | |
| | | | | | | | | | | 1,691,552 | |
| | | | | | | | | | | | |
| | | | |
| Thrifts & Mortgage Finance: 0.11% | | | | | | | | | | | | |
Northwest Bancshares Incorporated | | | | | | | 1,600 | | | | 19,088 | |
| | | | | | | | | | | | |
The accompanying notes are an integral part of these financial statements.
| | | | |
| 84 | | Wells Fargo Advantage Allocation Funds | | Portfolio of investments—November 30, 2012 (unaudited) |
SMALL CAP VALUE PORTFOLIO
| | | | | | | | | | | | |
| Security name | | | | | | Shares | | | Value | |
| | | | | | | | | | | | |
| | | | |
Health Care: 8.48% | | | | | | | | | | | | |
| | | | |
| Biotechnology: 1.67% | | | | | | | | | | | | |
Amarin Corporation plc ADR † | | | | | | | 7,205 | | | $ | 89,414 | |
Discovery Laboratories Incorporated † | | | | | | | 72,358 | | | | 155,570 | |
Infinity Pharmaceuticals Incorporated † | | | | | | | 1,190 | | | | 30,167 | |
| | | | |
| | | | | | | | | | | 275,151 | |
| | | | | | | | | | | | |
| | | | |
| Health Care Equipment & Supplies: 3.05% | | | | | | | | | | | | |
Allied Healthcare Products Incorporated † | | | | | | | 32,480 | | | | 82,824 | |
EnteroMedics Incorporated † | | | | | | | 29,132 | | | | 90,309 | |
OraSure Technologies Incorporated † | | | | | | | 42,774 | | | | 329,360 | |
| | | | |
| | | | | | | | | | | 502,493 | |
| | | | | | | | | | | | |
| | | | |
| Health Care Providers & Services: 2.11% | | | | | | | | | | | | |
Cross Country Healthcare Incorporated † | | | | | | | 15,182 | | | | 60,880 | |
Ensign Group Incorporated | | | | | | | 3,290 | | | | 84,849 | |
Gentiva Health Services Incorporated † | | | | | | | 11,258 | | | | 115,957 | |
Healthcare Services Group | | | | | | | 3,702 | | | | 87,071 | |
| | | | |
| | | | | | | | | | | 348,757 | |
| | | | | | | | | | | | |
| | | | |
| Health Care Technology: 1.38% | | | | | | | | | | | | |
Allscripts Healthcare Solutions Incorporated † | | | | | | | 10,963 | | | | 121,909 | |
Omnicell Incorporated † | | | | | | | 6,935 | | | | 105,897 | |
| | | | |
| | | | | | | | | | | 227,806 | |
| | | | | | | | | | | | |
| | | | |
| Life Sciences Tools & Services: 0.27% | | | | | | | | | | | | |
Nordion Incorporated | | | | | | | 6,660 | | | | 43,956 | |
| | | | | | | | | | | | |
| | | | |
Industrials: 14.50% | | | | | | | | | | | | |
| | | | |
| Air Freight & Logistics: 0.28% | | | | | | | | | | | | |
Pacer International Incorporated † | | | | | | | 13,342 | | | | 46,297 | |
| | | | | | | | | | | | |
| | | | |
| Airlines: 0.82% | | | | | | | | | | | | |
JetBlue Airways Corporation † | | | | | | | 26,186 | | | | 134,596 | |
| | | | | | | | | | | | |
| | | | |
| Building Products: 0.31% | | | | | | | | | | | | |
Patrick Industries Incorporated † | | | | | | | 2,910 | | | | 50,576 | |
| | | | | | | | | | | | |
| | | | |
| Commercial Services & Supplies: 4.40% | | | | | | | | | | | | |
ABM Industries Incorporated | | | | | | | 10,583 | | | | 201,924 | |
ACCO Brands Corporation † | | | | | | | 50,080 | | | | 337,539 | |
GEO Group Incorporated | | | | | | | 6,615 | | | | 186,543 | |
| | | | |
| | | | | | | | | | | 726,006 | |
| | | | | | | | | | | | |
| | | | |
| Construction & Engineering: 5.34% | | | | | | | | | | | | |
Chicago Bridge & Iron Company NV | | | | | | | 4,990 | | | | 202,744 | |
Integrated Electrical Services Incorporated † | | | | | | | 24,302 | | | | 110,574 | |
MYR Group Incorporated † | | | | | | | 9,020 | | | | 193,389 | |
Primoris Services Corporation | | | | | | | 19,401 | | | | 280,926 | |
Sterling Construction Company Incorporated † | | | | | | | 10,130 | | | | 93,500 | |
| | | | |
| | | | | | | | | | | 881,133 | |
| | | | | | | | | | | | |
The accompanying notes are an integral part of these financial statements.
| | | | | | |
| Portfolio of investments—November 30, 2012 (unaudited) | | Wells Fargo Advantage Allocation Funds | | | 85 | |
SMALL CAP VALUE PORTFOLIO
| | | | | | | | | | | | |
| Security name | | | | | | Shares | | | Value | |
| | | | | | | | | | | | |
| | | | |
| Electrical Equipment: 0.54% | | | | | | | | | | | | |
GrafTech International Limited † | | | | | | | 9,196 | | | $ | 89,201 | |
| | | | | | | | | | | | |
| | | | |
| Machinery: 1.56% | | | | | | | | | | | | |
Actuant Corporation Class A | | | | | | | 3,900 | | | | 112,203 | |
Hardinge Incorporated | | | | | | | 15,033 | | | | 144,166 | |
| | | | |
| | | | | | | | | | | 256,369 | |
| | | | | | | | | | | | |
| | | | |
| Professional Services: 1.25% | | | | | | | | | | | | |
Hill International Incorporated † | | | | | | | 59,307 | | | | 206,388 | |
| | | | | | | | | | | | |
| | | | |
Information Technology: 9.83% | | | | | | | | | | | | |
| | | | |
| Communications Equipment: 2.12% | | | | | | | | | | | | |
Brocade Communications Systems Incorporated † | | | | | | | 15,275 | | | | 86,762 | |
MRV Communications Incorporated | | | | | | | 12,340 | | | | 6,293 | |
Sandvine Corporation † | | | | | | | 154,135 | | | | 201,686 | |
Tellabs Incorporated | | | | | | | 15,400 | | | | 54,824 | |
| | | | |
| | | | | | | | | | | 349,565 | |
| | | | | | | | | | | | |
| | | | |
| Computers & Peripherals: 2.76% | | | | | | | | | | | | |
Cray Incorporated † | | | | | | | 15,350 | | | | 218,277 | |
Intermec Incorporated † | | | | | | | 21,234 | | | | 160,317 | |
Lexmark International Incorporated | | | | | | | 3,165 | | | | 77,004 | |
| | | | |
| | | | | | | | | | | 455,598 | |
| | | | | | | | | | | | |
| | | | |
| Electronic Equipment, Instruments & Components: 2.72% | | | | | | | | | | | | |
Coherent Incorporated † | | | | | | | 4,003 | | | | 185,139 | |
OSI Systems Incorporated † | | | | | | | 3,565 | | | | 218,463 | |
Power One Incorporated † | | | | | | | 10,590 | | | | 43,949 | |
| | | | |
| | | | | | | | | | | 447,551 | |
| | | | | | | | | | | | |
| | | | |
| IT Services: 1.64% | | | | | | | | | | | | |
Official Payments Holdings Incorporated † | | | | | | | 53,220 | | | | 270,890 | |
| | | | | | | | | | | | |
| | | | |
| Software: 0.59% | | | | | | | | | | | | |
Accelrys Incorporated † | | | | | | | 11,075 | | | | 97,571 | |
| | | | | | | | | | | | |
| | | | |
Materials: 14.60% | | | | | | | | | | | | |
| | | | |
| Containers & Packaging: 0.29% | | | | | | | | | | | | |
Intertape Polymer Group Incorporated | | | | | | | 5,810 | | | | 47,410 | |
| | | | | | | | | | | | |
| | | | |
| Metals & Mining: 13.92% | | | | | | | | | | | | |
Eldorado Gold Corporation | | | | | | | 7,915 | | | | 114,609 | |
Goldcorp Incorporated | | | | | | | 5,175 | | | | 200,273 | |
Great Basin Gold Limited †(a)(i) | | | | | | | 97,638 | | | | 0 | |
Randgold Resources Limited ADR | | | | | | | 8,133 | | | | 873,159 | |
Royal Gold Incorporated | | | | | | | 3,195 | | | | 258,028 | |
San Gold Corporation † | | | | | | | 32,830 | | | | 27,876 | |
Sandstorm Gold Limited † | | | | | | | 30,435 | | | | 373,180 | |
Sandstorm Metals & Energy Limited † | | | | | | | 253,515 | | | | 126,330 | |
Silver Standard Resources Incorporated † | | | | | | | 13,249 | | | | 178,862 | |
The accompanying notes are an integral part of these financial statements.
| | | | |
| 86 | | Wells Fargo Advantage Allocation Funds | | Portfolio of investments—November 30, 2012 (unaudited) |
SMALL CAP VALUE PORTFOLIO
| | | | | | | | | | | | | | | | |
| Security name | | | | | | | | Shares | | | Value | |
| | | | | | | | | | | | | | | | |
| | | | |
| Metals & Mining (continued) | | | | | | | | | | | | | | | | |
Steel Dynamics Incorporated | | | | | | | | | | | 3,003 | | | $ | 38,799 | |
United States Steel Corporation | | | | | | | | | | | 4,795 | | | | 103,380 | |
| | | | |
| | | | | | | | | | | | | | | 2,294,496 | |
| | | | | | | | | | | | | | | | |
| | | | |
| Paper & Forest Products: 0.39% | | | | | | | | | | | | | | | | |
Wausau Paper Corporation | | | | | | | | | | | 7,652 | | | | 64,200 | |
| | | | | | | | | | | | | | | | |
| | | | |
Telecommunication Services: 1.21% | | | | | | | | | | | | | | | | |
| | | | |
| Diversified Telecommunication Services: 1.21% | | | | | | | | | | | | | | | | |
Cincinnati Bell Incorporated † | | | | | | | | | | | 37,395 | | | | 199,318 | |
| | | | | | | | | | | | | | | | |
| | | | |
Total Common Stocks (Cost $10,521,497) | | | | | | | | | | | | | | | 15,447,346 | |
| | | | | | | | | | | | | | | | |
| | | | |
| Investment Companies: 2.21% | | | | | | | | | | | | | | | | |
KBW Regional Banking ETF | | | | | | | | | | | 1,036 | | | | 28,573 | |
Market Vectors Junior Gold Miners ETF | | | | | | | | | | | 15,534 | | | | 334,913 | |
| | | | |
Total Investment Companies (Cost $364,703) | | | | | | | | | | | | | | | 363,486 | |
| | | | | | | | | | | | | | | | |
| | | | | | Expiration date | | | | | | | |
| | | | |
Warrants: 0.26% | | | | | | | | | | | | | | | | |
| | | | |
Health Care: 0.26% | | | | | | | | | | | | | | | | |
| | | | |
| Health Care Equipment & Supplies: 0.26% | | | | | | | | | | | | | | | | |
EnteroMedics Incorporated †(a)(i) | | | | | | | 5-14-16 | | | | 9,104 | | | | 14,348 | |
Enteromedics Incorporated †(a)(i) | | | | | | | 9-28-16 | | | | 16,376 | | | | 28,925 | |
| | | | |
Total Warrants (Cost $0) | | | | | | | | | | | | | | | 43,273 | |
| | | | | | | | | | | | | | | | |
| | | Yield | | | | | | | | | | |
| | | | |
Short-Term Investments: 3.69% | | | | | | | | | | | | | | | | |
| | | | |
| Investment Companies: 3.69% | | | | | | | | | | | | | | | | |
Wells Fargo Advantage Cash Investment Money Market Fund, Select Class (l)(u) | | | 0.16 | % | | | | | | | 608,030 | | | | 608,030 | |
| | | | | | | | | | | | | | | | |
| | | | |
Total Short-Term Investments (Cost $608,030) | | | | | | | | | | | | | | | 608,030 | |
| | | | | | | | | | | | | | | | |
| | | | | | | | |
Total investments in securities (Cost $11,494,230)* | | | 99.86 | % | | | 16,462,135 | |
Other assets and liabilities, net | | | 0.14 | | | | 23,384 | |
| | | | | | | | |
| Total net assets | | | 100.00 | % | | $ | 16,485,519 | |
| | | | | | | | |
| † | Non-income-earning security |
| (a) | Security is fair valued by the Management Valuation Team, and in certain instances by the Board of Trustees, in accordance with procedures approved by the Board of Trustees. |
| (l) | Investment in an affiliate |
| (u) | Rate shown is the 7-day annualized yield at period end. |
| * | Cost for federal income tax purposes is $12,488,601 and unrealized appreciation (depreciation) consists of: |
| | | | |
Gross unrealized appreciation | | $ | 4,695,713 | |
Gross unrealized depreciation | | | (722,179 | ) |
| | | | |
Net unrealized appreciation | | $ | 3,973,534 | |
The accompanying notes are an integral part of these financial statements.
| | | | | | |
| Portfolio of investments—November 30, 2012 (unaudited) | | Wells Fargo Advantage Allocation Funds | | | 87 | |
SMALL COMPANY GROWTH PORTFOLIO
| | | | | | | | | | | | |
| Security name | | | | | | Shares | | | Value | |
| | | | | | | | | | | | |
| | | | |
Common Stocks: 96.31% | | | | | | | | | | | | |
| | | | |
Consumer Discretionary: 14.27% | | | | | | | | | | | | |
| | | | |
| Hotels, Restaurants & Leisure: 1.32% | | | | | | | | | | | | |
Caribou Coffee Company Incorporated †« | | | | | | | 40,190 | | | $ | 484,290 | |
Ryman Hospitality Properties Incorporated « | | | | | | | 38,190 | | | | 1,268,672 | |
| | | | |
| | | | | | | | | | | 1,752,962 | |
| | | | | | | | | | | | |
| | | | |
| Household Durables: 1.06% | | | | | | | | | | | | |
Ethan Allen Interiors Incorporated « | | | | | | | 48,180 | | | | 1,397,702 | |
| | | | | | | | | | | | |
| | | | |
| Leisure Equipment & Products: 0.75% | | | | | | | | | | | | |
Brunswick Corporation | | | | | | | 38,490 | | | | 991,887 | |
| | | | | | | | | | | | |
| | | | |
| Media: 2.85% | | | | | | | | | | | | |
Arbitron Incorporated « | | | | | | | 34,430 | | | | 1,252,219 | |
IMAX Corporation † | | | | | | | 54,040 | | | | 1,169,966 | |
Lions Gate Entertainment Corporation † | | | | | | | 82,880 | | | | 1,357,574 | |
| | | | |
| | | | | | | | | | | 3,779,759 | |
| | | | | | | | | | | | |
| | | | |
| Specialty Retail: 6.76% | | | | | | | | | | | | |
Cabela’s Incorporated †« | | | | | | | 23,000 | | | | 1,098,710 | |
Chico’s FAS Incorporated | | | | | | | 44,600 | | | | 831,790 | |
Dick’s Sporting Goods Incorporated « | | | | | | | 27,650 | | | | 1,451,902 | |
Finish Line Incorporated | | | | | | | 60,820 | | | | 1,254,717 | |
GNC Holdings Incorporated Class A | | | | | | | 39,630 | | | | 1,392,202 | |
Mattress Firm Holding Corporation †« | | | | | | | 33,110 | | | | 947,277 | |
rue21 Incorporated †« | | | | | | | 20,820 | | | | 597,742 | |
Sonic Automotive Incorporated « | | | | | | | 70,140 | | | | 1,384,564 | |
| | | | |
| | | | | | | | | | | 8,958,904 | |
| | | | | | | | | | | | |
| | | | |
| Textiles, Apparel & Luxury Goods: 1.53% | | | | | | | | | | | | |
Hanesbrands Incorporated †« | | | | | | | 56,130 | | | | 2,026,293 | |
| | | | | | | | | | | | |
| | | | |
Energy: 5.86% | | | | | | | | | | | | |
| | | | |
| Energy Equipment & Services: 2.14% | | | | | | | | | | | | |
Geospace Technologies Corporation †« | | | | | | | 12,940 | | | | 985,640 | |
McDermott International Incorporated †« | | | | | | | 104,570 | | | | 1,101,122 | |
Pacific Drilling SA † | | | | | | | 79,390 | | | | 754,205 | |
| | | | |
| | | | | | | | | | | 2,840,967 | |
| | | | | | | | | | | | |
| | | | |
| Oil, Gas & Consumable Fuels: 3.72% | | | | | | | | | | | | |
Energy XXI (Bermuda) Limited « | | | | | | | 47,650 | | | | 1,509,552 | |
GasLog Limited « | | | | | | | 66,100 | | | | 812,369 | |
Gulfport Energy Corporation † | | | | | | | 34,830 | | | | 1,324,933 | |
Rosetta Resources Incorporated † | | | | | | | 28,470 | | | | 1,279,442 | |
| | | | |
| | | | | | | | | | | 4,926,296 | |
| | | | | | | | | | | | |
The accompanying notes are an integral part of these financial statements.
| | | | |
| 88 | | Wells Fargo Advantage Allocation Funds | | Portfolio of investments—November 30, 2012 (unaudited) |
SMALL COMPANY GROWTH PORTFOLIO
| | | | | | | | | | | | |
| Security name | | | | | | Shares | | | Value | |
| | | | | | | | | | | | |
| | | | |
Financials: 10.83% | | | | | | | | | | | | |
| | | | |
| Capital Markets: 5.14% | | | | | | | | | | | | |
Evercore Partners Incorporated Class A | | | | | | | 55,400 | | | $ | 1,521,838 | |
LPL Financial Holdings Incorporated | | | | | | | 46,470 | | | | 1,301,625 | |
Medley Capital Corporation | | | | | | | 72,660 | | | | 990,356 | |
New Mountain Finance Corporation | | | | | | | 57,055 | | | | 866,095 | |
Stifel Financial Corporation †« | | | | | | | 40,650 | | | | 1,236,573 | |
Walter Investment Management †« | | | | | | | 21,010 | | | | 888,303 | |
| | | | |
| | | | | | | | | | | 6,804,790 | |
| | | | | | | | | | | | |
| | | | |
| Commercial Banks: 3.22% | | | | | | | | | | | | |
Capital Bank Financial Corporation Class A † | | | | | | | 50,480 | | | | 871,285 | |
CapitalSource Incorporated | | | | | | | 150,450 | | | | 1,211,123 | |
Signature Bank †« | | | | | | | 12,900 | | | | 905,064 | |
SVB Financial Group † | | | | | | | 23,190 | | | | 1,280,552 | |
| | | | |
| | | | | | | | | | | 4,268,024 | |
| | | | | | | | | | | | |
| | | | |
| Consumer Finance: 0.81% | | | | | | | | | | | | |
DFC Global Corporation †« | | | | | | | 61,940 | | | | 1,080,853 | |
| | | | | | | | | | | | |
| | | | |
| Insurance: 1.08% | | | | | | | | | | | | |
Argo Group International Holdings Limited | | | | | | | 43,140 | | | | 1,431,817 | |
| | | | | | | | | | | | |
| | | | |
| Real Estate Management & Development: 0.58% | | | | | | | | | | | | |
Zillow Incorporated Class A †« | | | | | | | 27,740 | | | | 763,405 | |
| | | | | | | | | | | | |
| | | | |
Health Care: 16.57% | | | | | | | | | | | | |
| | | | |
| Biotechnology: 2.80% | | | | | | | | | | | | |
Alnylam Pharmaceuticals Incorporated †« | | | | | | | 60,720 | | | | 1,030,418 | |
Curis Incorporated †« | | | | | | | 117,330 | | | | 393,056 | |
Exelixis Incorporated †« | | | | | | | 177,140 | | | | 866,215 | |
InterMune Incorporated †« | | | | | | | 83,460 | | | | 764,494 | |
Seattle Genetics Incorporated †« | | | | | | | 26,120 | | | | 661,097 | |
| | | | |
| | | | | | | | | | | 3,715,280 | |
| | | | | | | | | | | | |
| | | | |
| Health Care Equipment & Supplies: 5.43% | | | | | | | | | | | | |
Cerus Corporation †« | | | | | | | 269,260 | | | | 869,710 | |
DexCom Incorporated †« | | | | | | | 81,970 | | | | 1,072,168 | |
Endologix Incorporated †« | | | | | | | 61,351 | | | | 899,406 | |
Insulet Corporation †« | | | | | | | 56,190 | | | | 1,233,371 | |
Natus Medical Incorporated † | | | | | | | 78,730 | | | | 891,224 | |
Spectranetics Corporation † | | | | | | | 66,300 | | | | 954,720 | |
Thoratec Corporation † | | | | | | | 34,110 | | | | 1,268,892 | |
| | | | |
| | | | | | | | | | | 7,189,491 | |
| | | | | | | | | | | | |
| | | | |
| Health Care Providers & Services: 3.09% | | | | | | | | | | | | |
Capital Senior Living Corporation † | | | | | | | 67,950 | | | | 1,210,190 | |
Ensign Group Incorporated | | | �� | | | | 51,780 | | | | 1,335,406 | |
Team Health Holdings Incorporated † | | | | | | | 55,170 | | | | 1,544,208 | |
| | | | |
| | | | | | | | | | | 4,089,804 | |
| | | | | | | | | | | | |
The accompanying notes are an integral part of these financial statements.
| | | | | | |
| Portfolio of investments—November 30, 2012 (unaudited) | | Wells Fargo Advantage Allocation Funds | | | 89 | |
SMALL COMPANY GROWTH PORTFOLIO
| | | | | | | | | | | | |
| Security name | | | | | | Shares | | | Value | |
| | | | | | | | | | | | |
| | | | |
| Health Care Technology: 3.13% | | | | | | | | | | | | |
Medidata Solutions Incorporated † | | | | | | | 22,610 | | | $ | 904,400 | |
Omnicell Incorporated † | | | | | | | 108,350 | | | | 1,654,505 | |
Vocera Communications Incorporated †« | | | | | | | 64,720 | | | | 1,591,465 | |
| | | | |
| | | | | | | | | | | 4,150,370 | |
| | | | | | | | | | | | |
| | | | |
| Life Sciences Tools & Services: 1.59% | | | | | | | | | | | | |
Fluidigm Corporation †« | | | | | | | 52,190 | | | | 743,186 | |
ICON plc ADR † | | | | | | | 49,520 | | | | 1,366,257 | |
| | | | |
| | | | | | | | | | | 2,109,443 | |
| | | | | | | | | | | | |
| | | | |
| Pharmaceuticals: 0.53% | | | | | | | | | | | | |
MAP Pharmaceuticals Incorporated †« | | | | | | | 43,910 | | | | 699,925 | |
| | | | | | | | | | | | |
| | | | |
Industrials: 20.00% | | | | | | | | | | | | |
| | | | |
| Aerospace & Defense: 0.70% | | | | | | | | | | | | |
Esterline Technologies Corporation † | | | | | | | 15,250 | | | | 932,385 | |
| | | | | | | | | | | | |
| | | | |
| Air Freight & Logistics: 1.06% | | | | | | | | | | | | |
Hub Group Incorporated Class A † | | | | | | | 43,170 | | | | 1,397,413 | |
| | | | | | | | | | | | |
| | | | |
| Airlines: 0.89% | | | | | | | | | | | | |
Spirit Airlines Incorporated † | | | | | | | 70,200 | | | | 1,177,956 | |
| | | | | | | | | | | | |
| | | | |
| Building Products: 2.02% | | | | | | | | | | | | |
AO Smith Corporation « | | | | | | | 25,070 | | | | 1,578,157 | |
Apogee Enterprises Incorporated | | | | | | | 48,120 | | | | 1,102,910 | |
| | | | |
| | | | | | | | | | | 2,681,067 | |
| | | | | | | | | | | | |
| | | | |
| Commercial Services & Supplies: 2.37% | | | | | | | | | | | | |
ACCO Brands Corporation † | | | | | | | 155,030 | | | | 1,044,902 | |
Copart Incorporated † | | | | | | | 32,942 | | | | 995,178 | |
Encore Capital Group Incorporated †« | | | | | | | 41,125 | | | | 1,093,103 | |
| | | | |
| | | | | | | | | | | 3,133,183 | |
| | | | | | | | | | | | |
| | | | |
| Construction & Engineering: 1.76% | | | | | | | | | | | | |
Great Lakes Dredge & Dock Company | | | | | | | 152,510 | | | | 1,346,663 | |
Tutor Prini Corporation † | | | | | | | 76,200 | | | | 979,932 | |
| | | | |
| | | | | | | | | | | 2,326,595 | |
| | | | | | | | | | | | |
| | | | |
| Electrical Equipment: 0.70% | | | | | | | | | | | | |
Sensata Technologies Holdings NV † | | | | | | | 30,120 | | | | 929,503 | |
| | | | | | | | | | | | |
| | | | |
| Machinery: 2.55% | | | | | | | | | | | | |
Actuant Corporation Class A | | | | | | | 37,220 | | | | 1,070,819 | |
Colfax Corporation †« | | | | | | | 24,490 | | | | 954,865 | |
Wabash National Corporation †« | | | | | | | 167,290 | | | | 1,353,376 | |
| | | | |
| | | | | | | | | | | 3,379,060 | |
| | | | | | | | | | | | |
The accompanying notes are an integral part of these financial statements.
| | | | |
| 90 | | Wells Fargo Advantage Allocation Funds | | Portfolio of investments—November 30, 2012 (unaudited) |
SMALL COMPANY GROWTH PORTFOLIO
| | | | | | | | | | | | |
| Security name | | | | | | Shares | | | Value | |
| | | | | | | | | | | | |
| | | | |
| Professional Services: 2.33% | | | | | | | | | | | | |
Insperity Incorporated | | | | | | | 46,230 | | | $ | 1,396,146 | |
On Assignment Incorporated †« | | | | | | | 84,980 | | | | 1,693,651 | |
| | | | |
| | | | | | | | | | | 3,089,797 | |
| | | | | | | | | | | | |
| | | | |
| Road & Rail: 2.47% | | | | | | | | | | | | |
Genesee & Wyoming Incorporated † | | | | | | | 13,710 | | | | 1,000,145 | |
Hertz Global Holdings Incorporated †« | | | | | | | 66,480 | | | | 1,039,747 | |
Swift Transportation Company †« | | | | | | | 87,690 | | | | 741,857 | |
Werner Enterprises Incorporated « | | | | | | | 22,450 | | | | 486,941 | |
| | | | |
| | | | | | | | | | | 3,268,690 | |
| | | | | | | | | | | | |
| | | | |
| Trading Companies & Distributors: 3.15% | | | | | | | | | | | | |
Aceto Corporation « | | | | | | | 79,750 | | | | 795,108 | |
Beacon Roofing Supply Incorporated † | | | | | | | 42,770 | | | | 1,319,027 | |
MSC Industrial Direct Company | | | | | | | 13,090 | | | | 951,119 | |
United Rentals Incorporated † | | | | | | | 26,800 | | | | 1,113,004 | |
| | | | |
| | | | | | | | | | | 4,178,258 | |
| | | | | | | | | | | | |
| | | | |
Information Technology: 24.11% | | | | | | | | | | | | |
| | | | |
| Communications Equipment: 3.14% | | | | | | | | | | | | |
Aruba Networks Incorporated †« | | | | | | | 34,120 | | | | 664,658 | |
Infinera Corporation †« | | | | | | | 121,250 | | | | 676,575 | |
Palo Alto Networks Incorporated † | | | | | | | 3,940 | | | | 214,415 | |
Procera Networks Incorporated †« | | | | | | | 37,280 | | | | 769,832 | |
Riverbed Technology Incorporated † | | | | | | | 65,920 | | | | 1,179,968 | |
Ruckus Wireless Incorporation † | | | | | | | 48,850 | | | | 646,774 | |
| | | | |
| | | | | | | | | | | 4,152,222 | |
| | | | | | | | | | | | |
| | | | |
| Computers & Peripherals: 0.76% | | | | | | | | | | | | |
Fusion-io Incorporated †« | | | | | | | 43,340 | | | | 1,011,122 | |
| | | | | | | | | | | | |
| | | | |
| Electronic Equipment, Instruments & Components: 1.91% | | | | | | | | | | | | |
InvenSense Incorporated † | | | | | | | 82,860 | | | | 832,743 | |
OSI Systems Incorporated † | | | | | | | 27,710 | | | | 1,698,069 | |
| | | | |
| | | | | | | | | | | 2,530,812 | |
| | | | | | | | | | | | |
| | | | |
| Internet Software & Services: 3.40% | | | | | | | | | | | | |
Bankrate Incorporated †« | | | | | | | 50,440 | | | | 606,793 | |
Millennial Media Incorporation † | | | | | | | 30,160 | | | | 414,700 | |
Perficient Incorporated † | | | | | | | 79,860 | | | | 869,675 | |
ValueClick Incorporated †« | | | | | | | 70,130 | | | | 1,323,353 | |
Vocus Incorporated † | | | | | | | 75,720 | | | | 1,291,783 | |
| | | | |
| | | | | | | | | | | 4,506,304 | |
| | | | | | | | | | | | |
| | | | |
| IT Services: 2.09% | | | | | | | | | | | | |
Fleetcor Technologies Incorporated † | | | | | | | 25,930 | | | | 1,353,287 | |
Interxion Holding NV † | | | | | | | 65,190 | | | | 1,415,275 | |
| | | | |
| | | | | | | | | | | 2,768,562 | |
| | | | | | | | | | | | |
The accompanying notes are an integral part of these financial statements.
| | | | | | |
| Portfolio of investments—November 30, 2012 (unaudited) | | Wells Fargo Advantage Allocation Funds | | | 91 | |
SMALL COMPANY GROWTH PORTFOLIO
| | | | | | | | | | | | |
| Security name | | | | | | Shares | | | Value | |
| | | | | | | | | | | | |
| | | | |
| Semiconductors & Semiconductor Equipment: 3.99% | | | | | | | | | | | | |
Cirrus Logic Incorporated † | | | | | | | 59,300 | | | $ | 1,857,276 | |
Microsemi Corporation †« | | | | | | | 58,110 | | | | 1,112,225 | |
Peregrine Semiconductor Corporation † | | | | | | | 23,620 | | | | 399,887 | |
PMC-Sierra Incorporated †« | | | | | | | 141,210 | | | | 727,232 | |
Semtech Corporation †« | | | | | | | 43,550 | | | | 1,191,093 | |
| | | | |
| | | | | | | | | | | 5,287,713 | |
| | | | | | | | | | | | |
| | | | |
| Software: 8.82% | | | | | | | | | | | | |
Bottomline Technologies Incorporated †« | | | | | | | 46,640 | | | | 1,143,146 | |
Broadsoft Incorporated † | | | | | | | 20,720 | | | | 655,374 | |
Cadence Design Systems Incorporated †« | | | | | | | 126,050 | | | | 1,604,617 | |
Concur Technologies Incorporated †« | | | | | | | 12,962 | | | | 851,733 | |
Parametric Technology Corporation † | | | | | | | 62,990 | | | | 1,274,918 | |
Realpage Incorporated †« | | | | | | | 45,600 | | | | 902,424 | |
Sourcefire Incorporated †« | | | | | | | 16,410 | | | | 807,864 | |
SS&C Technologies Holdings † | | | | | | | 81,920 | | | | 1,932,486 | |
Synchronoss Technologies Incorporated †« | | | | | | | 31,830 | | | | 581,216 | |
Tangoe Incorporated †« | | | | | | | 78,710 | | | | 1,026,378 | |
Ultimate Software Group Incorporated †« | | | | | | | 9,620 | | | | 909,186 | |
| | | | |
| | | | | | | | | | | 11,689,342 | |
| | | | | | | | | | | | |
| | | | |
Materials: 4.67% | | | | | | | | | | | | |
| | | | |
| Chemicals: 2.09% | | | | | | | | | | | | |
Calgon Carbon Corporation †« | | | | | | | 86,290 | | | | 1,168,367 | |
LSB Industries Incorporated † | | | | | | | 21,870 | | | | 731,114 | |
Methanex Corporation | | | | | | | 28,710 | | | | 868,190 | |
| | | | |
| | | | | | | | | | | 2,767,671 | |
| | | | | | | | | | | | |
| | | | |
| Containers & Packaging: 0.91% | | | | | | | | | | | | |
Berry Plastics Group Incorporated † | | | | | | | 80,620 | | | | 1,202,044 | |
| | | | | | | | | | | | |
| | | | |
| Metals & Mining: 0.70% | | | | | | | | | | | | |
Steel Dynamics Incorporated | | | | | | | 71,270 | | | | 920,808 | |
| | | | | | | | | | | | |
| | | | |
| Paper & Forest Products: 0.97% | | | | | | | | | | | | |
Schweitzer Manduit International Incorporated | | | | | | | 34,470 | | | | 1,291,591 | |
| | | | | | | | | | | | |
| | | | |
Total Common Stocks (Cost $110,568,344) | | | | | | | | | | | 127,600,070 | |
| | | | | | | | | | | | |
| | | | |
| | | | | | | Principal | | | | |
| Other: 0.42% | | | | | | | | | | | | |
Gryphon Funding Limited, Pass-Through Entity (a)(i)(v) | | | | | | $ | 1,699,722 | | | | 560,908 | |
| | | | |
Total Other (Cost $161,045) | | | | | | | | | | | 560,908 | |
| | | | | | | | | | | | |
The accompanying notes are an integral part of these financial statements.
| | | | |
| 92 | | Wells Fargo Advantage Allocation Funds | | Portfolio of investments—November 30, 2012 (unaudited) |
SMALL COMPANY GROWTH PORTFOLIO
| | | | | | | | | | | | | | |
| Security name | | | | Yield | | | Principal | | | Value | |
| | | | | | | | | | | | | | |
| | | | |
Short-Term Investments : 31.34% | | | | | | | | | | | | | | |
| | | | |
| Investment Companies : 31.34% | | | | | | | | | | | | | | |
Wells Fargo Advantage Cash Investment Money Market Fund, Select Class (l)(u) | | | | | 0.16 | % | | $ | 3,370,315 | | | $ | 3,370,315 | |
Wells Fargo Securities Lending Cash Investments, LLC (v)(l)(u)(r) | | | | | 0.21 | | | | 38,146,194 | | | | 38,146,194 | |
| | | | |
Total Short-Term Investments (Cost $41,516,509) | | | | | | | | | | | | | 41,516,509 | |
| | | | | | | | | | | | | | |
| | | | | | | | |
| Total investments in securities | | | | | | | | |
| (Cost $152,245,898)* | | | 128.07 | % | | | 169,677,487 | |
Other assets and liabilities, net | | | (28.07 | ) | | | (37,187,655 | ) |
| | | | | | | | |
| Total net assets | | | 100.00 | % | | $ | 132,489,832 | |
| | | | | | | | |
| † | Non-income-earning security |
| « | All or a portion of this security is on loan. |
| (a) | Security is fair valued by the Management Valuation Team, and in certain instances by the Board of Trustees, in accordance with procedures approved by the Board of Trustees. |
| (v) | Security represents investment of cash collateral received from securities on loan. |
| (l) | Investment in an affiliate. |
| (u) | Rate shown is the 7-day annualized yield at period end. |
| (r) | The investment company is exempt from registration under Section 3(c)(7) of the Investment Company Act of 1940, as amended. |
| * | Cost for federal income tax purposes is $154,864,840 and unrealized appreciation (depreciation) consists of: |
| | | | |
Gross unrealized appreciation | | $ | 20,184,873 | |
Gross unrealized depreciation | | | (5,372,226 | ) |
| | | | |
Net unrealized appreciation | | $ | 14,812,647 | |
The accompanying notes are an integral part of these financial statements.
| | | | | | |
| Portfolio of investments—November 30, 2012 (unaudited) | | Wells Fargo Advantage Allocation Funds | | | 93 | |
SMALL COMPANY VALUE PORTFOLIO
| | | | | | | | | | | | |
| Security name | | | | | | Shares | | | Value | |
| | | | | | | | | | | | |
| | | | |
Common Stocks: 97.73% | | | | | | | | | | | | |
| | | | |
Consumer Discretionary: 15.31% | | | | | | | | | | | | |
| | | | |
| Auto Components: 0.97% | | | | | | | | | | | | |
Dana Holding Corporation | | | | | | | 116,600 | | | $ | 1,653,388 | |
| | | | | | | | | | | | |
| | | | |
| Automobiles: 0.87% | | | | | | | | | | | | |
Thor Industries Incorporated « | | | | | | | 38,990 | | | | 1,471,483 | |
| | | | | | | | | | | | |
| | | | |
| Distributors: 0.88% | | | | | | | | | | | | |
Core Mark Holding Company Incorporated | | | | | | | 32,780 | | | | 1,499,685 | |
| | | | | | | | | | | | |
| | | | |
| Hotels, Restaurants & Leisure: 4.50% | | | | | | | | | | | | |
Ameristar Casinos Incorporated | | | | | | | 118,920 | | | | 2,366,508 | |
Bob Evans Farms Incorporated | | | | | | | 36,740 | | | | 1,384,731 | |
Isle of Capri Casinos Incorporated † | | | | | | | 200,130 | | | | 982,638 | |
Ruby Tuesday Incorporated Ǡ | | | | | | | 243,960 | | | | 1,905,328 | |
WMS Industries Incorporated Ǡ | | | | | | | 60,630 | | | | 1,024,647 | |
| | | | |
| | | | | | | | | | | 7,663,852 | |
| | | | | | | | | | | | |
| | | | |
| Leisure Equipment & Products: 0.68% | | | | | | | | | | | | |
Arctic Cat Incorporated Ǡ | | | | | | | 30,800 | | | | 1,159,004 | |
| | | | | | | | | | | | |
| | | | |
| Media: 1.71% | | | | | | | | | | | | |
Cinemark Holdings Incorporated « | | | | | | | 68,330 | | | | 1,858,576 | |
National Cinemedia Incorporated | | | | | | | 73,470 | | | | 1,050,621 | |
| | | | |
| | | | | | | | | | | 2,909,197 | |
| | | | | | | | | | | | |
| | | | |
| Specialty Retail: 4.17% | | | | | | | | | | | | |
Aeropostale Incorporated † | | | | | | | 159,200 | | | | 2,198,552 | |
Asbury Automotive Group Incorporated Ǡ | | | | | | | 63,060 | | | | 1,903,781 | |
Bebe Stores Incorporated | | | | | | | 115,220 | | | | 433,227 | |
Rent-A-Center Incorporated | | | | | | | 48,880 | | | | 1,699,069 | |
Zumiez Incorporated † | | | | | | | 42,100 | | | | 864,658 | |
| | | | |
| | | | | | | | | | | 7,099,287 | |
| | | | | | | | | | | | |
| | | | |
| Textiles, Apparel & Luxury Goods: 1.53% | | | | | | | | | | | | |
G-III Apparel Group Limited Ǡ | | | | | | | 49,600 | | | | 1,887,280 | |
Hanesbrands Incorporated † | | | | | | | 19,680 | | | | 710,448 | |
| | | | |
| | | | | | | | | | | 2,597,728 | |
| | | | | | | | | | | | |
| | | | |
Consumer Staples: 1.18% | | | | | | | | | | | | |
| | | | |
| Food Products: 1.18% | | | | | | | | | | | | |
Post Holdings Incorporated † | | | | | | | 58,520 | | | | 2,015,429 | |
| | | | | | | | | | | | |
| | | | |
Energy: 6.43% | | | | | | | | | | | | |
| | | | |
| Energy Equipment & Services: 2.36% | | | | | | | | | | | | |
Hercules Offshore Incorporated Ǡ | | | | | | | 471,330 | | | | 2,432,063 | |
Hornbeck Offshore † | | | | | | | 44,040 | | | | 1,584,119 | |
| | | | |
| | | | | | | | | | | 4,016,182 | |
| | | | | | | | | | | | |
The accompanying notes are an integral part of these financial statements.
| | | | |
| 94 | | Wells Fargo Advantage Allocation Funds | | Portfolio of investments—November 30, 2012 (unaudited) |
SMALL COMPANY VALUE PORTFOLIO
| | | | | | | | | | | | |
| Security name | | | | | | Shares | | | Value | |
| | | | | | | | | | | | |
| | | | |
| Oil, Gas & Consumable Fuels: 4.07% | | | | | | | | | | | | |
Berry Petroleum Company Class A « | | | | | | | 42,260 | | | $ | 1,314,709 | |
Magnum Hunter Resources Corporation Ǡ | | | | | | | 570,600 | | | | 2,299,518 | |
Rex Energy Corporation Ǡ | | | | | | | 128,800 | | | | 1,693,720 | |
Sanchez Energy Corporation Ǡ | | | | | | | 88,800 | | | | 1,622,376 | |
| | | | |
| | | | | | | | | | | 6,930,323 | |
| | | | | | | | | | | | |
| | | | |
Financials: 33.28% | | | | | | | | | | | | |
| | | | |
| Capital Markets: 2.25% | | | | | | | | | | | | |
Greenhill & Company Incorporated « | | | | | | | 45,840 | | | | 2,178,317 | |
Stifel Financial Corporation Ǡ | | | | | | | 54,470 | | | | 1,656,977 | |
| | | | |
| | | | | | | | | | | 3,835,294 | |
| | | | | | | | | | | | |
| | | | |
| Commercial Banks: 11.83% | | | | | | | | | | | | |
Associated Banc-Corp « | | | | | | | 131,010 | | | | 1,683,479 | |
Banner Corporation | | | | | | | 47,700 | | | | 1,433,385 | |
City National Corporation « | | | | | | | 37,500 | | | | 1,825,875 | |
FirstMerit Corporation « | | | | | | | 108,600 | | | | 1,529,088 | |
Home Bancshares Incorporated « | | | | | | | 65,560 | | | | 2,173,970 | |
Pacwest Bancorp « | | | | | | | 77,360 | | | | 1,927,038 | |
SVB Financial Group † | | | | | | | 35,330 | | | | 1,950,923 | |
Umpqua Holdings Corporation « | | | | | | | 133,910 | | | | 1,561,391 | |
Webster Financial Corporation « | | | | | | | 84,000 | | | | 1,748,880 | |
Western Alliance Bancorp Ǡ | | | | | | | 224,300 | | | | 2,278,888 | |
Wintrust Financial Corporation « | | | | | | | 54,860 | | | | 2,018,299 | |
| | | | |
| | | | | | | | | | | 20,131,216 | |
| | | | | | | | | | | | |
| | | | |
| Insurance: 7.14% | | | | | | | | | | | | |
Amtrust Financial Services Incorporated « | | | | | | | 73,177 | | | | 2,108,961 | |
CNO Financial Group Incorporated « | | | | | | | 216,900 | | | | 1,973,790 | |
Employers Holdings Incorporated | | | | | | | 128,520 | | | | 2,453,447 | |
Meadowbrook Insurance Group Incorporated | | | | | | | 94,580 | | | | 525,865 | |
Primerica Incorporated | | | | | | | 60,200 | | | | 1,723,526 | |
Selective Insurance Group Incorporated « | | | | | | | 91,330 | | | | 1,706,044 | |
United Fire Group Incorporated | | | | | | | 79,760 | | | | 1,653,425 | |
| | | | |
| | | | | | | | | | | 12,145,058 | |
| | | | | | | | | | | | |
| | | | |
| Real Estate Management & Development: 0.64% | | | | | | | | | | | | |
Alexander & Baldwin Incorporated † | | | | | | | 36,700 | | | | 1,095,862 | |
| | | | | | | | | | | | |
| | | | |
| REITs: 9.31% | | | | | | | | | | | | |
Ashford Hospitality Trust | | | | | | | 183,800 | | | | 1,663,390 | |
Associated Estates Realty Corporation | | | | | | | 90,670 | | | | 1,371,837 | |
Campus Crest Communities Incorporated | | | | | | | 155,150 | | | | 1,774,916 | |
Cousins Properties Incorporated | | | | | | | 215,649 | | | | 1,770,478 | |
LaSalle Hotel Properties | | | | | | | 61,320 | | | | 1,478,425 | |
Pebblebrook Hotel Trust | | | | | | | 75,620 | | | | 1,576,677 | |
Redwood Trust Incorporated « | | | | | | | 116,070 | | | | 1,940,690 | |
Sabra Health Care REIT Incorporated « | | | | | | | 113,923 | | | | 2,472,129 | |
Sunstone Hotel Investors Incorporated † | | | | | | | 173,600 | | | | 1,791,552 | |
| | | | |
| | | | | | | | | | | 15,840,094 | |
| | | | | | | | | | | | |
The accompanying notes are an integral part of these financial statements.
| | | | | | |
| Portfolio of investments—November 30, 2012 (unaudited) | | Wells Fargo Advantage Allocation Funds | | | 95 | |
SMALL COMPANY VALUE PORTFOLIO
| | | | | | | | | | | | |
| Security name | | | | | | Shares | | | Value | |
| | | | | | | | | | | | |
| | | | |
| Thrifts & Mortgage Finance: 2.11% | | | | | | | | | | | | |
BankUnited Incorporated « | | | | | | | 80,200 | | | $ | 1,884,700 | |
Washington Federal Incorporated « | | | | | | | 106,410 | | | | 1,710,009 | |
| | | | |
| | | | | | | | | | | 3,594,709 | |
| | | | | | | | | | | | |
| | | | |
Health Care: 3.89% | | | | | | | | | | | | |
| | | | |
| Health Care Equipment & Supplies: 1.20% | | | | | | | | | | | | |
Alere Incorporated † | | | | | | | 110,100 | | | | 2,036,850 | |
| | | | | | | | | | | | |
| | | | |
| Health Care Providers & Services: 1.59% | | | | | | | | | | | | |
Ensign Group Incorporated | | | | | | | 42,050 | | | | 1,084,470 | |
Lifepoint Hospitals Incorporated † | | | | | | | 45,280 | | | | 1,629,174 | |
| | | | |
| | | | | | | | | | | 2,713,644 | |
| | | | | | | | | | | | |
| | | | |
| Health Care Technology: 1.10% | | | | | | | | | | | | |
Medassets Incorporated † | | | | | | | 115,850 | | | | 1,865,185 | |
| | | | | | | | | | | | |
| | | | |
Industrials: 14.86% | | | | | | | | | | | | |
| | | | |
| Aerospace & Defense: 1.77% | | | | | | | | | | | | |
AAR Corporation « | | | | | | | 107,200 | | | | 1,646,592 | |
Huntington Ingalls Industries Incorporated | | | | | | | 33,400 | | | | 1,364,390 | |
| | | | |
| | | | | | | | | | | 3,010,982 | |
| | | | | | | | | | | | |
| | | | |
| Air Freight & Logistics: 1.35% | | | | | | | | | | | | |
Air Transport Services Group † | | | | | | | 204,870 | | | | 776,457 | |
Atlas Air Worldwide Holdings Incorporated † | | | | | | | 35,100 | | | | 1,519,128 | |
| | | | |
| | | | | | | | | | | 2,295,585 | |
| | | | | | | | | | | | |
| | | | |
| Commercial Services & Supplies: 0.81% | | | | | | | | | | | | |
Portfolio Recovery Associates Incorporated Ǡ | | | | | | | 13,950 | | | | 1,378,539 | |
| | | | | | | | | | | | |
| | | | |
| Construction & Engineering: 2.15% | | | | | | | | | | | | |
Great Lakes Dredge & Dock Company « | | | | | | | 250,690 | | | | 2,213,593 | |
Tutor Prini Corporation † | | | | | | | 111,880 | | | | 1,438,777 | |
| | | | |
| | | | | | | | | | | 3,652,370 | |
| | | | | | | | | | | | |
| | | | |
| Electrical Equipment: 0.57% | | | | | | | | | | | | |
GrafTech International Limited Ǡ | | | | | | | 100,340 | | | | 973,298 | |
| | | | | | | | | | | | |
| | | | |
| Machinery: 3.79% | | | | | | | | | | | | |
Briggs & Stratton Corporation « | | | | | | | 82,980 | | | | 1,683,664 | |
Kadant Incorporated † | | | | | | | 57,280 | | | | 1,389,040 | |
Titan International Incorporated « | | | | | | | 85,070 | | | | 1,729,473 | |
Wabash National Corporation Ǡ | | | | | | | 203,970 | | | | 1,650,117 | |
| | | | |
| | | | | | | | | | | 6,452,294 | |
| | | | | | | | | | | | |
| | | | |
| Marine: 0.58% | | | | | | | | | | | | |
Matson Incorporated « | | | | | | | 43,100 | | | | 991,300 | |
| | | | | | | | | | | | |
The accompanying notes are an integral part of these financial statements.
| | | | |
| 96 | | Wells Fargo Advantage Allocation Funds | | Portfolio of investments—November 30, 2012 (unaudited) |
SMALL COMPANY VALUE PORTFOLIO
| | | | | | | | | | | | |
| Security name | | | | | | Shares | | | Value | |
| | | | | | | | | | | | |
| | | | |
| Professional Services: 1.01% | | | | | | | | | | | | |
FTI Consulting Incorporated Ǡ | | | | | | | 55,670 | | | $ | 1,720,760 | |
| | | | | | | | | | | | |
| | | | |
| Road & Rail: 1.86% | | | | | | | | | | | | |
Con-way Incorporated | | | | | | | 45,000 | | | | 1,264,050 | |
Ryder System Incorporated | | | | | | | 40,550 | | | | 1,908,689 | |
| | | | |
| | | | | | | | | | | 3,172,739 | |
| | | | | | | | | | | | |
| | | | |
| Trading Companies & Distributors: 0.97% | | | | | | | | | | | | |
Titan Machinery Incorporated Ǡ | | | | | | | 74,550 | | | | 1,650,537 | |
| | | | | | | | | | | | |
| | | | |
Information Technology: 13.79% | | | | | | | | | | | | |
| | | | |
| Communications Equipment: 0.88% | | | | | | | | | | | | |
Black Box Corporation « | | | | | | | 60,970 | | | | 1,502,911 | |
| | | | | | | | | | | | |
| | | | |
| Computers & Peripherals: 1.27% | | | | | | | | | | | | |
Lexmark International Incorporated « | | | | | | | 45,780 | | | | 1,113,827 | |
QLogic Corporation † | | | | | | | 111,060 | | | | 1,052,849 | |
| | | | |
| | | | | | | | | | | 2,166,676 | |
| | | | | | | | | | | | |
| | | | |
| Electronic Equipment, Instruments & Components: 4.48% | �� | | | | | | | | | | | |
Aeroflex Holding Corporation † | | | | | | | 200,970 | | | | 1,302,286 | |
Benchmark Electronics Incorporated † | | | | | | | 101,830 | | | | 1,582,438 | |
Multi-Fineline Electronix Incorporated Ǡ | | | | | | | 66,450 | | | | 1,135,631 | |
Sanmina Corporation † | | | | | | | 203,380 | | | | 1,915,840 | |
Synnex Corporation Ǡ | | | | | | | 51,100 | | | | 1,687,322 | |
| | | | |
| | | | | | | | | | | 7,623,517 | |
| | | | | | | | | | | | |
| | | | |
| Internet Software & Services: 1.12% | | | | | | | | | | | | |
EarthLink Incorporated | | | | | | | 289,200 | | | | 1,908,720 | |
| | | | | | | | | | | | |
| | | | |
| IT Services: 0.96% | | | | | | | | | | | | |
TNS Incorporated † | | | | | | | 111,480 | | | | 1,627,608 | |
| | | | | | | | | | | | |
| | | | |
| Semiconductors & Semiconductor Equipment: 4.76% | | | | | | | | | | | | |
Integrated Silicon Solution Incorporated Ǡ | | | | | | | 142,990 | | | | 1,252,592 | |
Kulicke & Soffa Industries Incorporated † | | | | | | | 219,570 | | | | 2,509,685 | |
MagnaChip Semiconductor Corporation † | | | | | | | 116,950 | | | | 1,473,570 | |
Omnivision Technologies Incorporated Ǡ | | | | | | | 93,000 | | | | 1,404,300 | |
Photronics Incorporated Ǡ | | | | | | | 284,500 | | | | 1,465,175 | |
| | | | |
| | | | | | | | | | | 8,105,322 | |
| | | | | | | | | | | | |
| | | | |
| Software: 0.32% | | | | | | | | | | | | |
EPIQ Systems Incorporated | | | | | | | 45,090 | | | | 540,629 | |
| | | | | | | | | | | | |
| | | | |
Materials: 5.47% | | | | | | | | | | | | |
| | | | |
| Chemicals: 2.95% | | | | | | | | | | | | |
Cytec Industries Incorporated « | | | | | | | 26,715 | | | | 1,833,718 | |
Kraton Performance Polymers Incorporated Ǡ | | | | | | | 86,040 | | | | 2,021,080 | |
Zep Incorporated « | | | | | | | 94,200 | | | | 1,168,080 | |
| | | | |
| | | | | | | | | | | 5,022,878 | |
| | | | | | | | | | | | |
The accompanying notes are an integral part of these financial statements.
| | | | | | |
| Portfolio of investments—November 30, 2012 (unaudited) | | Wells Fargo Advantage Allocation Funds | | | 97 | |
SMALL COMPANY VALUE PORTFOLIO
| | | | | | | | | | | | | | |
| Security name | | | | | | | Shares | | | Value | |
| | | | | | | | | | | | | | |
| | | | |
| Metals & Mining: 2.52% | | | | | | | | | | | | | | |
A.M. Castle & Company Ǡ | | | | | | | | | 67,290 | | | $ | 858,620 | |
Horsehead Holding Corporation Ǡ | | | | | | | | | 154,600 | | | | 1,437,780 | |
Suncoke Energy Incorporated † | | | | | | | | | 122,600 | | | | 1,992,250 | |
| | | | |
| | | | | | | | | | | | | 4,288,650 | |
| | | | | | | | | | | | | | |
| | | | |
Telecommunication Services: 0.90% | | | | | | | | | | | | | | |
| | | | |
| Diversified Telecommunication Services: 0.90% | | | | | | | | | | | | | | |
Iridium Communications Incorporated Ǡ | | | | | | | | | 247,380 | | | | 1,526,335 | |
| | | | | | | | | | | | | | |
| | | | |
Utilities: 2.62% | | | | | | | | | | | | | | |
| | | | |
| Electric Utilities: 2.62% | | | | | | | | | | | | | | |
Great Plains Energy Incorporated | | | | | | | | | 90,880 | | | | 1,840,320 | |
PNM Resources Incorporated « | | | | | | | | | 40,180 | | | | 849,003 | |
Portland General Electric Company | | | | | | | | | 65,580 | | | | 1,772,623 | |
| | | | |
| | | | | | | | | | | | | 4,461,946 | |
| | | | | | | | | | | | | | |
| | | | |
Total Common Stocks (Cost $154,073,059) | | | | | | | | | | | | | 166,347,066 | |
| | | | | | | | | | | | | | |
| | | | |
| | | | | | | | Principal | | | | |
| | | | |
Other: 0.23% | | | | | | | | | | | | | | |
Gryphon Funding Limited, Pass-Through Entity (i)(a)(v) | | | | | | | | $ | 1,189,987 | | | | 392,696 | |
| | | | |
Total Other (Cost $112,749) | | | | | | | | | | | | | 392,696 | |
| | | | | | | | | | | | | | |
| | | | |
| | | Yield | | | | | Shares | | | | |
| | | | |
Short-Term Investments: 35.35% | | | | | | | | | | | | | | |
| | | | |
| Investment Companies: 35.35% | | | | | | | | | | | | | | |
Wells Fargo Advantage Cash Investment Money Market Fund, Select Class (l)(u) | | | 0.16 | % | | | | | 4,320,665 | | | | 4,320,665 | |
Wells Fargo Securities Lending Cash Investments, LLC (v)(l)(u)(r) | | | 0.21 | | | | | | 55,859,005 | | | | 55,859,005 | |
| | | | |
Total Short-Term Investments (Cost $60,179,670) | | | | | | | | | | | | | 60,179,670 | |
| | | | | | | | | | | | | | |
| | | | | | | | |
| Total investments in securities | | | | | | | | |
| (Cost $214,365,478) * | | | 133.31 | % | | | 226,919,432 | |
Other assets and liabilities, net | | | (33.31 | ) | | | (56,698,903 | ) |
| | | | | | | | |
| Total net assets | | | 100.00 | % | | $ | 170,220,529 | |
| | | | | | | | |
| « | All or a portion of this security is on loan. |
| † | Non-income-earning security |
| (a) | Security is fair valued by the Management Valuation Team, and in certain instances by the Board of Trustees, in accordance with procedures approved by the Board of Trustees. |
| (v) | Security represents investment of cash collateral received from securities on loan. |
| (l) | Investment in an affiliate |
| (u) | Rate shown is the 7-day annualized yield at period end. |
| (r) | The investment company is exempt from registration under Section 3(c)(7) of the Investment Company Act of 1940, as amended. |
| * | Cost for federal income tax purposes is $218,409,880 and unrealized appreciation (depreciation) consists of: |
| | | | |
Gross unrealized appreciation | | $ | 17,537,664 | |
Gross unrealized depreciation | | | (9,028,112 | ) |
| | | | |
Net unrealized appreciation | | $ | 8,509,552 | |
The accompanying notes are an integral part of these financial statements.
| | | | |
| 98 | | Wells Fargo Advantage Allocation Funds | | Summary portfolio of investments—November 30, 2012 (unaudited) |
CORE BOND PORTFOLIO
The Summary Portfolio of Investments shows the 50 largest portfolio holdings in unaffiliated issuers and any holdings exceeding 1% of the total net assets as of the report date. The remaining securities held are grouped as “Other securities” in each category. You can request a complete schedule of portfolio holdings as of the report date, free of charge, by accessing the following website:
http://a584.g.akamai.net/f/584/1326/1d/www.wellsfargoadvantagefunds.com/pdf/semi/holdings/corebond.pdf or by calling Wells Fargo Advantage Funds at 1-800-222-8222. This complete schedule, filed on the Form N-CSR, is also available on the SEC’s website at sec.gov.
| | | | | | | | | | | | | | | | | | | | |
| Security name | | Interest rate | | | Maturity date | | | Principal | | | Value | | | Percent of
net assets | |
| | | | | | | | | | | | | | | | | | | | |
| | | | | |
Agency Securities : 35.58% | | | | | | | | | | | | | | | | | | | | |
FHLMC %% | | | 2.50 | % | | | 1-1-27 | | | $ | 55,900,000 | | | $ | 58,162,200 | | | | 1.58 | % |
FHLMC %% | | | 2.50 | | | | 12-1-27 | | | | 15,600,000 | | | | 16,255,683 | | | | 0.44 | |
FHLMC | | | 0.95-7.50 | | | | 8 -1-17 to 3-25-44 | | | | 149,965,229 | | | | 165,468,694 | | | | 4.48 | |
FHLMC | | | 4.00 | | | | 4-1-42 | | | | 19,448,472 | | | | 21,592,492 | | | | 0.59 | |
FHLMC | | | 4.00 | | | | 6-1-42 | | | | 40,071,200 | | | | 44,488,690 | | | | 1.21 | |
FHLMC | | | 5.00 | | | | 8-1-39 | | | | 26,643,876 | | | | 29,586,002 | | | | 0.80 | |
FHLMC | | | 5.00 | | | | 8-1-41 | | | | 26,486,600 | | | | 29,750,719 | | | | 0.81 | |
FNMA | | | 2.31-7.50 | | | | 9-1-16 to 12-25-42 | | | | 255,262,346 | | | | 282,516,800 | | | | 7.70 | |
FNMA %% | | | 2.50 | | | | 1-1-27 | | | | 71,100,000 | | | | 74,199,512 | | | | 2.01 | |
FNMA %% | | | 2.50 | | | | 2-1-27 | | | | 140,900,000 | | | | 146,800,180 | | | | 3.99 | |
FNMA %% | | | 3.00 | | | | 1-1-42 | | | | 29,200,000 | | | | 30,637,189 | | | | 0.83 | |
FNMA %% | | | 3.00 | | | | 2-1-42 | | | | 29,100,000 | | | | 30,464,064 | | | | 0.83 | |
FNMA | | | 4.00 | | | | 8-1-42 | | | | 37,752,178 | | | | 42,065,025 | | | | 1.14 | |
FNMA | | | 4.00 | | | | 9-1-42 | | | | 75,452,702 | | | | 84,072,496 | | | | 2.28 | |
FNMA | | | 4.00 | | | | 10-1-42 | | | | 31,430,452 | | | | 35,021,099 | | | | 0.95 | |
FNMA | | | 4.00 | | | | 11-1-42 | | | | 15,643,291 | | | | 17,430,396 | | | | 0.47 | |
FNMA | | | 5.00 | | | | 4-1-40 | | | | 18,132,263 | | | | 19,743,525 | | | | 0.54 | |
FNMA | | | 5.00 | | | | 7-1-41 | | | | 26,850,609 | | | | 30,436,484 | | | | 0.83 | |
FNMA | | | 6.00 | | | | 3-1-34 | | | | 48,865,760 | | | | 54,659,750 | | | | 1.48 | |
FNMA Series 2010-M03 Class A3 ± | | | 4.33 | | | | 3-25-20 | | | | 20,018,000 | | | | 23,324,333 | | | | 0.63 | |
FNMA Series 2011-53 Class TN | | | 4.00 | | | | 6-25-41 | | | | 32,997,904 | | | | 34,797,577 | | | | 0.94 | |
GNMA | | | 3.00-11.50 | | | | 5-15-13 to 1-20-42 | | | | 18,804,474 | | | | 20,533,302 | | | | 0.54 | |
GNMA | | | 6.00 | | | | 1-15-40 | | | | 16,569,548 | | | | 18,596,211 | | | | 0.51 | |
| | | | | | | | | | | | | | | | | | | | |
| | | | | |
Total Agency Securities (Cost $1,282,483,964) | | | | | | | | | | | | | | | 1,310,602,423 | | | | 35.58 | |
| | | | | | | | | | | | | | | | | | | | |
| | | | | |
Asset-Backed Securities: 14.12% | | | | | | | | | | | | | | | | | | | | |
Ally Auto Receivables Trust | | | 0.48-2.23 | | | | 3 -17-14 to 9-15-19 | | | | 51,531,576 | | | | 52,154,763 | | | | 1.41 | |
American Express Credit Account Master Trust Series 2012-4 Class A ± | | | 0.45 | | | | 5-15-20 | | | | 16,856,000 | | | | 16,889,543 | | | | 0.46 | |
Chase Issuance Trust Series 2008-A13 Class A13 ± | | | 1.89 | | | | 9-15-15 | | | | 12,439,000 | | | | 12,589,114 | | | | 0.34 | |
Chase Issuance Trust Series 2011-A2 Class A2 ± | | | 0.30 | | | | 5-15-15 | | | | 24,987,000 | | | | 25,001,967 | | | | 0.68 | |
Chase Issuance Trust Series 2012-A6 Class A ± | | | 0.34 | | | | 8-15-17 | | | | 51,409,000 | | | | 51,451,207 | | | | 1.40 | |
Ford Credit Floorplan Master Trust Series 2012-4 Class A2 ± | | | 0.56 | | | | 9-15-16 | | | | 16,254,000 | | | | 16,254,000 | | | | 0.44 | |
Nelnet Student Loan Trust | | | 0.32-0.81 | | | | 11 -27-18 to 3-23-37 | | | | 48,847,951 | | | | 46,489,043 | | | | 1.27 | |
Nelnet Student Loan Trust Series 2006-1 Class A4 ± | | | 0.40 | | | | 11-23-22 | | | | 17,969,158 | | | | 17,915,933 | | | | 0.49 | |
Nelnet Student Loan Trust Series 2006-2 Class A4 ± | | | 0.40 | | | | 10-26-26 | | | | 17,854,312 | | | | 17,833,012 | | | | 0.48 | |
Nelnet Student Loan Trust Series 2007-2A Class A3L ± 144A | | | 0.72 | | | | 3-25-26 | | | | 19,677,000 | | | | 19,141,294 | | | | 0.52 | |
SLM Student Loan Trust | | | 0.32-3.74 | | | | 7 -25-17 to 6-15-45 | | | | 128,226,165 | | | | 129,140,684 | | | | 3.50 | |
SLM Student Loan Trust Series 2012-E Class A1 ± 144A | | | 0.96 | | | | 10-16-23 | | | | 16,551,000 | | | | 16,551,033 | | | | 0.45 | |
Other securities | | | | | | | | | | | | | | | 98,648,281 | | | | 2.68 | |
| | | | | | | | | | | | | | | | | | | | |
| | | | |
Total Asset-Backed Securities (Cost $517,566,890) | | | | | | | | | | | | 520,059,874 | | | | 14.12 | |
| | | | | | | | | | | | | | | | | | | | |
The accompanying notes are an integral part of these financial statements.
| | | | | | |
| Summary portfolio of investments—November 30, 2012 (unaudited) | | Wells Fargo Advantage Allocation Funds | | | 99 | |
CORE BOND PORTFOLIO
| | | | | | | | | | | | | | |
| Security name | | | | | | | | Value | | | Percent of
net assets | |
| | | | | | | | | | | | | | |
| | | | | |
Corporate Bonds and Notes: 19.28% | | | | | | | | | | | | | | |
| | | | | |
Consumer Discretionary: 1.97% | | | | | | | | | | | | | | |
| | | | | |
| Auto Components: 0.29% | | | | | | | | | | | | | | |
Other securities | | | | | | | | $ | 10,563,107 | | | | 0.29 | % |
| | | | | | | | | | | | | | |
| | | | | |
| Automobiles: 0.47% | | | | | | | | | | | | | | |
Other securities | | | | | | | | | 17,456,401 | | | | 0.47 | |
| | | | | | | | | | | | | | |
| | | | | |
| Diversified Consumer Services: 0.09% | | | | | | | | | | | | | | |
Other securities | | | | | | | | | 3,244,315 | | | | 0.09 | |
| | | | | | | | | | | | | | |
| | | | | |
| Hotels, Restaurants & Leisure: 0.20% | | | | | | | | | | | | | | |
Other securities | | | | | | | | | 7,174,097 | | | | 0.20 | |
| | | | | | | | | | | | | | |
| | | | | |
| Internet & Catalog Retail: 0.08% | | | | | | | | | | | | | | |
Other securities | | | | | | | | | 2,858,374 | | | | 0.08 | |
| | | | | | | | | | | | | | |
| | | | | |
| Media: 0.63% | | | | | | | | | | | | | | |
Other securities | | | | | | | | | 23,377,172 | | | | 0.63 | |
| | | | | | | | | | | | | | |
| | | | | |
| Specialty Retail: 0.21% | | | | | | | | | | | | | | |
Other securities | | | | | | | | | 7,858,168 | | | | 0.21 | |
| | | | | | | | | | | | | | |
| | | | | |
Consumer Staples: 1.88% | | | | | | | | | | | | | | |
| | | | | |
| Beverages: 1.12% | | | | | | | | | | | | | | |
Other securities | | | | | | | | | 41,411,242 | | | | 1.12 | |
| | | | | | | | | | | | | | |
| | | | | |
| Food & Staples Retailing: 0.07% | | | | | | | | | | | | | | |
Other securities | | | | | | | | | 2,454,759 | | | | 0.07 | |
| | | | | | | | | | | | | | |
| | | | | |
| Food Products: 0.55% | | | | | | | | | | | | | | |
Other securities | | | | | | | | | 20,274,203 | | | | 0.55 | |
| | | | | | | | | | | | | | |
| | | | | |
| Tobacco: 0.14% | | | | | | | | | | | | | | |
Other securities | | | | | | | | | 5,255,873 | | | | 0.14 | |
| | | | | | | | | | | | | | |
| | | | | |
Energy: 1.84% | | | | | | | | | | | | | | |
| | | | | |
| Energy Equipment & Services: 0.05% | | | | | | | | | | | | | | |
Other securities | | | | | | | | | 1,745,164 | | | | 0.05 | |
| | | | | | | | | | | | | | |
| | | | | |
| Oil, Gas & Consumable Fuels: 1.79% | | | | | | | | | | | | | | |
Other securities | | | | | | | | | 66,100,909 | | | | 1.79 | |
| | | | | | | | | | | | | | |
| | | | | |
Financials: 8.62% | | | | | | | | | | | | | | |
| | | | | |
| Capital Markets: 0.91% | | | | | | | | | | | | | | |
Other securities | | | | | | | | | 33,436,604 | | | | 0.91 | |
| | | | | | | | | | | | | | |
| | | | | |
| Commercial Banks: 0.68% | | | | | | | | | | | | | | |
Other securities | | | | | | | | | 24,922,033 | | | | 0.68 | |
| | | | | | | | | | | | | | |
The accompanying notes are an integral part of these financial statements.
| | | | |
| 100 | | Wells Fargo Advantage Allocation Funds | | Summary portfolio of investments—November 30, 2012 (unaudited) |
CORE BOND PORTFOLIO
| | | | | | | | | | | | | | | | | | | | |
| Security name | | Interest rate | | | Maturity date | | | Principal | | | Value | | | Percent of
net assets | |
| | | | | | | | | | | | | | | | | | | | |
| | | | | |
| Consumer Finance: 0.80% | | | | | | | | | | | | | | | | | | | | |
Other securities | | | | | | | | | | | | | | $ | 29,657,992 | | | | 0.80 | % |
| | | | | | | | | | | | | | | | | | | | |
| | | | | |
| Diversified Financial Services: 3.79% | | | | | | | | | | | | | | | | | | | | |
JPMorgan Chase & Company | | | 1.10-5.40 | % | | | 6 -1-14 to 1-6-42 | | | $ | 24,818,000 | | | | 25,966,701 | | | | 0.70 | |
Other securities | | | | | | | | | | | | | | | 113,525,839 | | | | 3.09 | |
| | | | | |
| | | | | | | | | | | | | | | 139,492,540 | | | | 3.79 | |
| | | | | | | | | | | | | | | | | | | | |
| | | | | |
| Insurance: 1.45% | | | | | | | | | | | | | | | | | | | | |
MetLife Global Funding I ±144A | | | 0.73 | | | | 3-19-14 | | | | 19,510,000 | | | | 19,527,949 | | | | 0.53 | |
Other securities | | | | | | | | | | | | | | | 34,034,806 | | | | 0.92 | |
| | | | | |
| | | | | | | | | | | | | | | 53,562,755 | | | | 1.45 | |
| | | | | | | | | | | | | | | | | | | | |
| | | | | |
| REITs: 0.99% | | | | | | | | | | | | | | | | | | | | |
Other securities | | | | | | | | | | | | | | | 36,482,119 | | | | 0.99 | |
| | | | | | | | | | | | | | | | | | | | |
| | | | | |
Health Care: 2.00% | | | | | | | | | | | | | | | | | | | | |
| | | | | |
| Biotechnology: 0.49% | | | | | | | | | | | | | | | | | | | | |
Other securities | | | | | | | | | | | | | | | 18,054,187 | | | | 0.49 | |
| | | | | | | | | | | | | | | | | | | | |
| | | | | |
| Health Care Equipment & Supplies: 0.11% | | | | | | | | | | | | | | | | | | | | |
Other securities | | | | | | | | | | | | | | | 4,175,391 | | | | 0.11 | |
| | | | | | | | | | | | | | | | | | | | |
| | | | | |
| Health Care Providers & Services: 0.73% | | | | | | | | | | | | | | | | | | | | |
Other securities | | | | | | | | | | | | | | | 26,678,612 | | | | 0.73 | |
| | | | | | | | | | | | | | | | | | | | |
| | | | | |
| Life Sciences Tools & Services: 0.09% | | | | | | | | | | | | | | | | | | | | |
Other securities | | | | | | | | | | | | | | | 3,267,290 | | | | 0.09 | |
| | | | | | | | | | | | | | | | | | | | |
| | | | | |
| Pharmaceuticals: 0.58% | | | | | | | | | | | | | | | | | | | | |
Other securities | | | | | | | | | | | | | | | 21,304,437 | | | | 0.58 | |
| | | | | | | | | | | | | | | | | | | | |
| | | | | |
Industrials: 0.24% | | | | | | | | | | | | | | | | | | | | |
| | | | | |
| Building Products: 0.07% | | | | | | | | | | | | | | | | | | | | |
Other securities | | | | | | | | | | | | | | | 2,735,265 | | | | 0.07 | |
| | | | | | | | | | | | | | | | | | | | |
| | | | | |
| Road & Rail: 0.17% | | | | | | | | | | | | | | | | | | | | |
Other securities | | | | | | | | | | | | | | | 6,172,984 | | | | 0.17 | |
| | | | | | | | | | | | | | | | | | | | |
| | | | | |
| Information Technology: 0.24% | | | | | | | | | | | | | | | | | | | | |
| | | | | |
| Software: 0.24% | | | | | | | | | | | | | | | | | | | | |
Other securities | | | | | | | | | | | | | | | 8,950,538 | | | | 0.24 | |
| | | | | | | | | | | | | | | | | | | | |
| | | | | |
Materials: 0.08% | | | | | | | | | | | | | | | | | | | | |
| | | | | |
| Chemicals: 0.08% | | | | | | | | | | | | | | | | | | | | |
Other securities | | | | | | | | | | | | | | | 2,886,900 | | | | 0.08 | |
| | | | | | | | | | | | | | | | | | | | |
| | | | | |
Telecommunication Services: 0.61% | | | | | | | | | | | | | | | | | | | | |
| | | | | |
| Diversified Telecommunication Services: 0.39% | | | | | | | | | | | | | | | | | | | | |
Other securities | | | | | | | | | | | | | | | 14,275,369 | | | | 0.39 | |
| | | | | | | | | | | | | | | | | | | | |
The accompanying notes are an integral part of these financial statements.
| | | | | | |
| Summary portfolio of investments—November 30, 2012 (unaudited) | | Wells Fargo Advantage Allocation Funds | | | 101 | |
CORE BOND PORTFOLIO
| | | | | | | | | | | | | | | | | | | | |
| Security name | | Interest rate | | | Maturity date | | | Principal | | | Value | | | Percent of
net assets | |
| | | | | | | | | | | | | | | | | | | | |
| | | | | |
| Wireless Telecommunication Services: 0.22% | | | | | | | | | | | | | | | | | | | | |
Other securities | | | | | | | | | | | | | | $ | 8,055,498 | | | | 0.22 | % |
| | | | | | | | | | | | | | | | | | | | |
| | | | | |
Utilities: 1.80% | | | | | | | | | | | | | | | | | | | | |
| | | | | |
| Electric Utilities: 1.23% | | | | | | | | | | | | | | | | | | | | |
Other securities | | | | | | | | | | | | | | | 45,281,531 | | | | 1.23 | |
| | | | | | | | | | | | | | | | | | | | |
| | | | | |
| Gas Utilities: 0.22% | | | | | | | | | | | | | | | | | | | | |
Other securities | | | | | | | | | | | | | | | 7,973,024 | | | | 0.22 | |
| | | | | | | | | | | | | | | | | | | | |
| | | | | |
| Multi-Utilities: 0.35% | | | | | | | | | | | | | | | | | | | | |
Other securities | | | | | | | | | | | | | | | 12,857,305 | | | | 0.35 | |
| | | | | | | | | | | | | | | | | | | | |
| | | | |
Total Corporate Bonds and Notes (Cost $686,653,690) | | | | | | | | | | | | 709,996,158 | | | | 19.28 | |
| | | | | | | | | | | | | | | | | | | | |
| | | | | |
Municipal Obligations: 1.10% | | | | | | | | | | | | | | | | | | | | |
| | | | | |
| California: 0.27% | | | | | | | | | | | | | | | | | | | | |
Other securities | | | | | | | | | | | | | | | 9,872,117 | | | | 0.27 | |
| | | | | | | | | | | | | | | | | | | | |
| | | | | |
| Illinois: 0.18% | | | | | | | | | | | | | | | | | | | | |
Other securities | | | | | | | | | | | | | | | 6,569,672 | | | | 0.18 | |
| | | | | | | | | | | | | | | | | | | | |
| | | | | |
| Nevada: 0.14% | �� | | | | | | | | | | | | | | | | | | | |
Other securities | | | | | | | | | | | | | | | 5,217,670 | | | | 0.14 | |
| | | | | | | | | | | | | | | | | | | | |
| | | | | |
| New Jersey: 0.18% | | | | | | | | | | | | | | | | | | | | |
Other securities | | | | | | | | | | | | | | | 6,744,657 | | | | 0.18 | |
| | | | | | | | | | | | | | | | | | | | |
| | | | | |
| New York: 0.14% | | | | | | | | | | | | | | | | | | | | |
Other securities | | | | | | | | | | | | | | | 5,004,321 | | | | 0.14 | |
| | | | | | | | | | | | | | | | | | | | |
| | | | | |
| Ohio: 0.04% | | | | | | | | | | | | | | | | | | | | |
Other securities | | | | | | | | | | | | | | | 1,528,135 | | | | 0.04 | |
| | | | | | | | | | | | | | | | | | | | |
| | | | | |
| Texas: 0.15% | | | | | | | | | | | | | | | | | | | | |
Other securities | | | | | | | | | | | | | | | 5,702,696 | | | | 0.15 | |
| | | | | | | | | | | | | | | | | | | | |
| | | | | |
Total Municipal Obligations (Cost $33,047,469) | | | | | | | | | | | | | | | 40,639,268 | | | | 1.10 | |
| | | | | | | | | | | | | | | | | | | | |
| | | | | |
Non-Agency Mortgage Backed Securities: 6.73% | | | | | | | | | | | | | | | | | | | | |
Credit Suisse Mortgage Capital Certificates Series 2006-C5 Class A3 | | | 5.31 | % | | | 12-15-39 | | | $ | 18,499,000 | | | | 21,011,904 | | | | 0.57 | |
Discover Master Owners Trust Series 2011 Class A1 ± | | | 0.56 | | | | 8-15-16 | | | | 17,801,000 | | | | 17,858,800 | | | | 0.48 | |
Greenwich Capital Commercial Funding Corporation Series 2005-GG5 Class A5 ± | | | 5.22 | | | | 4-10-37 | | | | 15,359,000 | | | | 16,966,473 | | | | 0.46 | |
JPMorgan Chase Commercial Mortgage Securities Corporation | | | 2.38-6.85 | | | | 8 -5-32 to 2-15-51 | | | | 30,199,607 | | | | 32,968,591 | | | | 0.90 | |
Other securities | | | | | | | | | | | | | | | 159,032,509 | | | | 4.32 | |
| | | | | | | | | | | | | | | | | | | | |
| | | | |
Total Non-Agency Mortgage Backed Securities (Cost $240,765,820) | | | | | | | | | | | | 247,838,277 | | | | 6.73 | |
| | | | | | | | | | | | | | | | | | | | |
The accompanying notes are an integral part of these financial statements.
| | | | |
| 102 | | Wells Fargo Advantage Allocation Funds | | Summary portfolio of investments—November 30, 2012 (unaudited) |
CORE BOND PORTFOLIO
| | | | | | | | | | | | | | | | | | | | |
| Security name | | Interest rate | | | Maturity date | | | Principal | | | Value | | | Percent of
net assets | |
| | | | | | | | | | | | | | | | | | | | |
| | | | | |
U.S. Treasury Securities: 21.73% | | | | | | | | | | | | | | | | | | | | |
U.S. Treasury Bond | | | 2.75 | % | | | 8-15-42 | | | $ | 23,980,000 | | | $ | 23,721,472 | | | | 0.64 | % |
U.S. Treasury Bond | | | 2.75-4.38 | | | | 5 -15-41 to 11-15-42 | | | | 7,774,000 | | | | 8,453,121 | | | | 0.23 | |
U.S. Treasury Bond | | | 3.00 | | | | 5-15-42 | | | | 33,898,000 | | | | 35,349,241 | | | | 0.96 | |
U.S. Treasury Bond | | | 4.50 | | | | 5-15-38 | | | | 21,059,000 | | | | 28,383,573 | | | | 0.77 | |
U.S. Treasury Note | | | 0.25 | | | | 1-31-14 | | | | 49,574,000 | | | | 49,591,450 | | | | 1.35 | |
U.S. Treasury Note « | | | 0.25 | | | | 10-31-14 | | | | 42,151,000 | | | | 42,151,000 | | | | 1.14 | |
U.S. Treasury Note ## | | | 0.25 | | | | 1-15-15 | | | | 54,004,000 | | | | 53,970,248 | | | | 1.47 | |
U.S. Treasury Note ## | | | 0.25 | | | | 9-15-15 | | | | 48,394,000 | | | | 48,303,261 | | | | 1.31 | |
U.S. Treasury Note ## | | | 0.25 | | | | 10-15-15 | | | | 65,318,000 | | | | 65,185,339 | | | | 1.77 | |
U.S. Treasury Note « | | | 0.38 | | | | 4-15-15 | | | | 46,998,000 | | | | 47,089,787 | | | | 1.28 | |
U.S. Treasury Note ## | | | 0.38 | | | | 11-15-15 | | | | 129,905,000 | | | | 130,097,779 | | | | 3.53 | |
U.S. Treasury Note | | | 0.63-1.25 | | | | 9 -30-17 to 10-31-19 | | | | 9,739,000 | | | | 9,871,175 | | | | 0.27 | |
U.S. Treasury Note | | | 0.75 | | | | 6-30-17 | | | | 16,089,000 | | | | 16,231,034 | | | | 0.44 | |
U.S. Treasury Note « | | | 0.75 | | | | 10-31-17 | | | | 33,541,000 | | | | 33,771,594 | | | | 0.92 | |
U.S. Treasury Note | | | 1.25 | | | | 3-15-14 | | | | 26,548,000 | | | | 26,892,301 | | | | 0.73 | |
U.S. Treasury Note | | | 1.63 | | | | 11-15-22 | | | | 20,419,000 | | | | 20,434,947 | | | | 0.56 | |
U.S. Treasury Note | | | 1.75 | | | | 3-31-14 | | | | 29,411,000 | | | | 29,999,220 | | | | 0.81 | |
U.S. Treasury Note « | | | 2.38 | | | | 2-28-15 | | | | 37,816,000 | | | | 39,579,776 | | | | 1.07 | |
U.S. Treasury Note ## | | | 3.00 | | | | 9-30-16 | | | | 83,341,000 | | | | 91,427,661 | | | | 2.48 | |
| | | | | | | | | | | | | | | | | | | | |
| | | | | |
Total U.S. Treasury Securities (Cost $797,651,278) | | | | | | | | | | | | | | | 800,503,979 | | | | 21.73 | |
| | | | | | | | | | | | | | | | | | | | |
| | | | | |
Yankee Corporate Bonds and Notes: 7.33% | | | | | | | | | | | | | | | | | | | | |
| | | | | |
Consumer Discretionary: 0.27% | | | | | | | | | | | | | | | | | | | | |
| | | | | |
| Media: 0.09% | | | | | | | | | | | | | | | | | | | | |
Other securities | | | | | | | | | | | | | | | 3,347,964 | | | | 0.09 | |
| | | | | | | | | | | | | | | | | | | | |
| | | | | |
| Textiles, Apparel & Luxury Goods: 0.18% | | | | | | | | | | | | | | | | | | | | |
Other securities | | | | | | | | | | | | | | | 6,686,774 | | | | 0.18 | |
| | | | | | | | | | | | | | | | | | | | |
| | | | | |
Consumer Staples: 0.18% | | | | | | | | | | | | | | | | | | | | |
| | | | | |
| Beverages: 0.18% | | | | | | | | | | | | | | | | | | | | |
Other securities | | | | | | | | | | | | | | | 6,492,030 | | | | 0.18 | |
| | | | | | | | | | | | | | | | | | | | |
| | | | | |
Energy: 2.04% | | | | | | | | | | | | | | | | | | | | |
| | | | | |
| Oil, Gas & Consumable Fuels: 2.04% | | | | | | | | | | | | | | | | | | | | |
Other securities | | | | | | | | | | | | | | | 75,174,615 | | | | 2.04 | |
| | | | | | | | | | | | | | | | | | | | |
| | | | | |
Financials: 3.08% | | | | | | | | | | | | | | | | | | | | |
| | | | | |
| Commercial Banks: 2.52% | | | | | | | | | | | | | | | | | | | | |
Royal Bank of Scotland Group plc | | | 2.55 | | | | 9-18-15 | | | | 16,058,000 | | | | 16,430,321 | | | | 0.45 | |
Other securities | | | | | | | | | | | | | | | 76,241,186 | | | | 2.07 | |
| | | | | | | | | | | | | | | | | | | | |
| | | | | |
| | | | | | | | | | | | | | | 92,671,507 | | | | 2.52 | |
| | | | | | | | | | | | | | | | | | | | |
| | | | | |
| Real Estate Management & Development: 0.06% | | | | | | | | | | | | | | | | | | | | |
Other securities | | | | | | | | | | | | | | | 2,041,544 | | | | 0.06 | |
| | | | | | | | | | | | | | | | | | | | |
The accompanying notes are an integral part of these financial statements.
| | | | | | |
| Summary portfolio of investments—November 30, 2012 (unaudited) | | Wells Fargo Advantage Allocation Funds | | | 103 | |
CORE BOND PORTFOLIO
| | | | | | | | | | | | | | | | | | |
| Security name | | | | | | | Principal | | | Value | | | Percent of
net assets | |
| | | | | | | | | | | | | | | | | | |
| | | | | |
| Thrifts & Mortgage Finance: 0.50% | | | | | | | | | | | | | | | | | | |
Other securities | | | | | | | | | | | | $ | 18,592,236 | | | | 0.50 | % |
| | | | | | | | | | | | | | | | | | |
| | | | | |
Health Care: 0.10% | | | | | | | | | | | | | | | | | | |
| | | | | |
| Pharmaceuticals: 0.10% | | | | | | | | | | | | | | | | | | |
Other securities | | | | | | | | | | | | | 3,803,376 | | | | 0.10 | |
| | | | | | | | | | | | | | | | | | |
| | | | | |
Information Technology: 0.07% | | | | | | | | | | | | | | | | | | |
| | | | | |
| Internet Software & Services: 0.07% | | | | | | | | | | | | | | | | | | |
Other securities | | | | | | | | | | | | | 2,497,847 | | | | 0.07 | |
| | | | | | | | | | | | | | | | | | |
| | | | | |
Materials: 0.69% | | | | | | | | | | | | | | | | | | |
| | | | | |
| Metals & Mining: 0.69% | | | | | | | | | | | | | | | | | | |
Other securities | | | | | | | | | | | | | 25,459,531 | | | | 0.69 | |
| | | | | | | | | | | | | | | | | | |
| | | | | |
Telecommunication Services: 0.86% | | | | | | | | | | | | | | | | | | |
| | | | | |
| Diversified Telecommunication Services: 0.35% | | | | | | | | | | | | | | | | | | |
Other securities | | | | | | | | | | | | | 12,862,416 | | | | 0.35 | |
| | | | | | | | | | | | | | | | | | |
| | | | | |
| Wireless Telecommunication Services: 0.51% | | | | | | | | | | | | | | | | | | |
Other securities | | | | | | | | | | | | | 18,797,639 | | | | 0.51 | |
| | | | | | | | | | | | | | | | | | |
| | | | | |
Utilities: 0.04% | | | | | | | | | | | | | | | | | | |
| | | | | |
| Electric Utilities: 0.04% | | | | | | | | | | | | | | | | | | |
Other securities | | | | | | | | | | | | | 1,495,813 | | | | 0.04 | |
| | | | | | | | | | | | | | | | | | |
| | | | | |
Total Yankee Corporate Bonds and Notes (Cost $262,833,270) | | | | | | | | | | | | | 269,923,292 | | | | 7.33 | |
| | | | | | | | | | | | | | | | | | |
| | | | | |
Yankee Government Bonds: 1.14% | | | | | | | | | | | | | | | | | | |
Other securities | | | | | | | | | | | | | 42,082,254 | | | | 1.14 | |
| | | | | | | | | | | | | | | | | | |
| | | | | |
Total Yankee Government Bonds (Cost $40,721,279) | | | | | | | | | | | | | 42,082,254 | | | | 1.14 | |
| | | | | | | | | | | | | | | | | | |
| | | | | |
Other: 0.03% | | | | | | | | | | | | | | | | | | |
Gryphon Funding Limited, Pass-Through Entity (a)(i)(v) | | | | | | | | $ | 3,436,964 | | | | 1,134,198 | | | | 0.03 | |
| | | | | | | | | | | | | | | | | | |
| | | | | |
Total Other (Cost $325,645) | | | | | | | | | | | | | 1,134,198 | | | | 0.03 | |
| | | | | | | | | | | | | | | | | | |
| | | | | |
| | | Yield | | | | | Shares | | | | | | | |
| | | | | |
Short-Term Investments: 7.66% | | | | | | | | | | | | | | | | | | |
| | | | | |
| Investment Companies: 7.66% | | | | | | | | | | | | | | | | | | |
Wells Fargo Advantage Cash Investment Money Market Fund,
Select Class (l)(u)# | | | 0.16 | % | | | | | 201,172,161 | | | | 201,172,161 | | | | 5.46 | |
Wells Fargo Securities Lending Cash Investments, LLC (l)(u)(v)(r) | | | 0.21 | | | | | | 80,871,705 | | | | 80,871,705 | | | | 2.20 | |
| | | | | | | | | | | | | | | | | | |
| | | | | |
Total Short-Term Investments (Cost $282,043,866) | | | | | | | | | | | | | 282,043,866 | | | | 7.66 | |
| | | | | | | | | | | | | | | | | | |
| | | | | |
| Total investments in securities | | | | | | | | | | | | | | | | | | |
| (Cost $4,144,093,171) * | | | | | | | | | | | | | 4,224,823,589 | | | | 114.70 | |
Other assets and liabilities, net | | | | | | | | | | | | | (541,582,748 | ) | | | (14.70 | ) |
| | | | | | | | | | | | | | | | | | |
| | | | | |
Total net assets | | | | | | | | | | | | $ | 3,683,240,841 | | | | 100.00 | % |
| | | | | | | | | | | | | | | | | | |
The accompanying notes are an integral part of these financial statements.
| | | | |
| 104 | | Wells Fargo Advantage Allocation Funds | | Summary portfolio of investments—November 30, 2012 (unaudited) |
CORE BOND PORTFOLIO
| %% | Security issued on a when-issued basis |
| ## | All or a portion of this security has been segregated for when-issued securities. |
| ± | Variable rate investment |
| (a) | Security is fair valued by the Management Valuation Team, and in certain instances by the Board of Trustees, in accordance with procedures approved by the Board of Trustees. |
| 144A | Security that may be resold to “qualified institutional buyers” under Rule 144A or security offered pursuant to Section 4(2) of the Securities Act of 1933, as amended. |
| « | All or a portion of this security is on loan. |
| (v) | Security represents investment of cash collateral received from securities on loan. |
| (l) | Investment in an affiliate |
| (u) | Rate shown is the 7-day annualized yield at period end. |
| # | All or a portion of this security is segregated as collateral for investments in derivative instruments. |
| (r) | The investment company is exempt from registration under Section 3(c)(7) of the Investment Company Act of 1940, as amended. |
| * | Cost for federal income tax purposes is $4,149,567,914 and unrealized appreciation (depreciation) consists of: |
| | | | |
Gross unrealized appreciation | | $ | 77,428,474 | |
Gross unrealized depreciation | | | (2,172,799 | ) |
| | | | |
Net unrealized appreciation | | $ | 75,255,675 | |
The accompanying notes are an integral part of these financial statements.
| | | | | | |
| Portfolio of investments—November 30, 2012 (unaudited) | | Wells Fargo Advantage Allocation Funds | | | 105 | |
INFLATION-PROTECTED BOND PORTFOLIO
| | | | | | | | | | | | | | | | |
| Security name | | Interest rate | | | Maturity date | | | Principal | | | Value | |
| | | | | | | | | | | | | | | | |
| | | | |
U.S. Treasury Securities: 98.67% | | | | | | | | | | | | | | | | |
TIPS | | | 0.13 | % | | | 4-15-16 | | | $ | 3,616,842 | | | $ | 3,809,833 | |
TIPS | | | 0.13 | | | | 4-15-17 | | | | 1,355,017 | | | | 1,453,362 | |
TIPS | | | 0.13 | | | | 1-15-22 | | | | 3,215,448 | | | | 3,523,427 | |
TIPS | | | 0.13 | | | | 7-15-22 | | | | 2,671,647 | | | | 2,928,584 | |
TIPS | | | 0.50 | | | | 4-15-15 | | | | 1,943,378 | | | | 2,025,668 | |
TIPS | | | 0.63 | | | | 7-15-21 | | | | 3,747,492 | | | | 4,290,293 | |
TIPS | | | 0.75 | | | | 2-15-42 | | | | 1,761,435 | | | | 1,962,762 | |
TIPS | | | 1.13 | | | | 1-15-21 | | | | 3,422,080 | | | | 4,043,670 | |
TIPS | | | 1.25 | | | | 4-15-14 | | | | 1,880,682 | | | | 1,937,250 | |
TIPS | | | 1.25 | | | | 7-15-20 | | | | 3,071,798 | | | | 3,666,000 | |
TIPS | | | 1.38 | | | | 7-15-18 | | | | 1,963,773 | | | | 2,294,239 | |
TIPS « | | | 1.38 | | | | 1-15-20 | | | | 1,910,129 | | | | 2,275,888 | |
TIPS | | | 1.63 | | | | 1-15-15 | | | | 2,120,808 | | | | 2,250,707 | |
TIPS | | | 1.63 | | | | 1-15-18 | | | | 1,192,936 | | | | 1,388,651 | |
TIPS | | | 1.75 | | | | 1-15-28 | | | | 1,331,007 | | | | 1,739,980 | |
TIPS | | | 1.88 | | | | 7-15-15 | | | | 1,844,004 | | | | 2,009,100 | |
TIPS | | | 1.88 | | | | 7-15-19 | | | | 1,712,357 | | | | 2,094,827 | |
TIPS | | | 2.00 | | | | 1-15-14 | | | | 1,778,351 | | | | 1,835,870 | |
TIPS | | | 2.00 | | | | 7-15-14 | | | | 2,455,260 | | | | 2,588,382 | |
TIPS | | | 2.00 | | | | 1-15-16 | | | | 2,075,302 | | | | 2,304,397 | |
TIPS | | | 2.00 | | | | 1-15-26 | | | | 2,168,574 | | | | 2,866,922 | |
TIPS | | | 2.13 | | | | 1-15-19 | | | | 1,675,979 | | | | 2,045,217 | |
TIPS | | | 2.13 | | | | 2-15-40 | | | | 974,264 | | | | 1,450,588 | |
TIPS | | | 2.13 | | | | 2-15-41 | | | | 2,007,692 | | | | 3,011,068 | |
TIPS | | | 2.38 | | | | 1-15-17 | | | | 2,294,940 | | | | 2,675,397 | |
TIPS | | | 2.38 | | | | 1-15-25 | | | | 2,768,306 | | | | 3,768,140 | |
TIPS | | | 2.38 | | | | 1-15-27 | | | | 1,181,894 | | | | 1,644,402 | |
TIPS | | | 2.50 | | | | 7-15-16 | | | | 2,429,181 | | | | 2,796,405 | |
TIPS | | | 2.50 | | | | 1-15-29 | | | | 1,455,030 | | | | 2,098,085 | |
TIPS | | | 2.63 | | | | 7-15-17 | | | | 580,585 | | | | 697,791 | |
TIPS | | | 3.38 | | | | 4-15-32 | | | | 638,808 | | | | 1,066,710 | |
TIPS | | | 3.63 | | | | 4-15-28 | | | | 1,817,014 | | | | 2,910,205 | |
TIPS | | | 3.88 | | | | 4-15-29 | | | | 1,485,039 | | | | 2,486,510 | |
| | | | |
Total U.S. Treasury Securities (Cost $69,617,657) | | | | | | | | | | | | | | | 79,940,330 | |
| | | | | | | | | | | | | | | | |
| | | | |
Other: 0.22% | | | | | | | | | | | | | | | | |
Gryphon Funding Limited, Pass-Through Entity (i)(a)(v) | | | | | | | | | | | 548,184 | | | | 180,901 | |
| | | | |
Total Other (Cost $51,939) | | | | | | | | | | | | | | | 180,901 | |
| | | | | | | | | | | | | | | | |
| | | | |
| Short-Term Investments: 2.99% | | Yield | | | | | | Shares | | | | |
| | | | |
| Investment Companies: 2.99% | | | | | | | | | | | | | | | | |
Wells Fargo Advantage Government Money Market Fund, Institutional Class (l)(u) | | | 0.01 | | | | | | | | 643,913 | | | | 643,913 | |
Wells Fargo Securities Lending Cash Investments, LLC (v)(l)(u)(r) | | | 0.21 | | | | | | | | 1,778,061 | | | | 1,778,061 | |
| | | | |
Total Short-Term Investments (Cost $2,421,974) | | | | | | | | | | | | | | | 2,421,974 | |
| | | | | | | | | | | | | | | | |
| | | | | | | | |
| Total investments in securities | | | | | | | | |
| (Cost $72,091,570)* | | | 101.88 | % | | | 82,543,205 | |
Other assets and liabilities, net | | | (1.88 | ) | | | (1,523,384 | ) |
| | | | | | | | |
| Total net assets | | | 100.00 | % | | $ | 81,019,821 | |
| | | | | | | | |
The accompanying notes are an integral part of these financial statements.
| | | | |
| 106 | | Wells Fargo Advantage Allocation Funds | | Portfolio of investments—November 30, 2012 (unaudited) |
INFLATION-PROTECTED BOND PORTFOLIO
| « | All or a portion of this security is on loan. |
| (a) | Security is fair valued by the Management Valuation Team, and in certain instances by the Board of Trustees, in accordance with procedures approved by the Board of Trustees. |
| (l) | Investment in an affiliate |
| (u) | Rate shown is the 7-day annualized yield at period end. |
| (v) | Security represents investment of cash collateral received from securities on loan. |
| (r) | The investment company is exempt from registration under Section 3(c)(7) of the Investment Company Act of 1940, as amended. |
| * | Cost for federal income tax purposes is $72,446,513 and unrealized appreciation (depreciation) consists of: |
| | | | |
Gross unrealized appreciation | | $ | 10,096,692 | |
Gross unrealized depreciation | | | 0 | |
| | | | |
Net unrealized appreciation | | $ | 10,096,692 | |
The accompanying notes are an integral part of these financial statements.
| | | | | | |
| Portfolio of investments—November 30, 2012 (unaudited) | | Wells Fargo Advantage Allocation Funds | | | 107 | |
MANAGED FIXED INCOME PORTFOLIO
| | | | | | | | | | | | | | | | |
| Security name | | Interest rate | | | Maturity date | | | Principal | | | Value | |
| | | | | | | | | | | | | | | | |
| | | | |
Agency Securities: 33.32% | | | | | | | | | | | | | | | | |
FHLMC | | | 3.50 | % | | | 9-1-32 | | | $ | 1,435,184 | | | $ | 1,566,144 | |
FHLMC Multifamily Structured Pass-Through Securities Series K701 ± | | | 3.88 | | | | 11-25-17 | | | | 1,200,000 | | | | 1,354,064 | |
FHLMC Structured Pass-Through Securities Series T-20 Class A6 | | | 7.42 | | | | 9-25-29 | | | | 258,320 | | | | 272,593 | |
FHLMC Structured Pass-Through Securities Series T-58 Class 4A | | | 7.50 | | | | 9-25-43 | | | | 1,570,734 | | | | 1,869,106 | |
FNMA %% | | | 2.50 | | | | 12-1-27 | | | | 1,200,000 | | | | 1,254,187 | |
FNMA | | | 3.50 | | | | 9-1-32 | | | | 2,846,686 | | | | 3,090,434 | |
FNMA | | | 3.50 | | | | 10-1-32 | | | | 1,267,926 | | | | 1,376,492 | |
FNMA | | | 3.50 | | | | 11-1-42 | | | | 475,000 | | | | 508,547 | |
FNMA | | | 3.50 | | | | 11-1-42 | | | | 800,000 | | | | 856,500 | |
FNMA %% | | | 3.50 | | | | 12-1-42 | | | | 925,000 | | | | 987,293 | |
FNMA | | | 5.00 | | | | 9-1-33 | | | | 817,742 | | | | 891,430 | |
FNMA | | | 5.50 | | | | 2-1-36 | | | | 2,202,063 | | | | 2,364,956 | |
FNMA Grantor Trust Series 2002-T4 Class A2 | | | 7.00 | | | | 12-25-41 | | | | 340,534 | | | | 385,299 | |
FNMA Grantor Trust Series 2004-T2 Class 1A1 | | | 6.00 | | | | 11-25-43 | | | | 1,449,589 | | | | 1,633,806 | |
FNMA Grantor Trust Series 2004-T3 Class A1 | | | 6.00 | | | | 2-25-44 | | | | 2,069,320 | | | | 2,321,936 | |
FNMA Series 2002-90 Class A2 | | | 6.50 | | | | 11-25-42 | | | | 675,633 | | | | 783,203 | |
FNMA Series 2003-86 Class PT | | | 4.50 | | | | 9-25-18 | | | | 849,238 | | | | 911,241 | |
FNMA Series 2003-97 Class CA | | | 5.00 | | | | 10-25-18 | | | | 1,511,093 | | | | 1,633,813 | |
FNMA Series 2003-W4 Class 3A ± | | | 6.83 | | | | 10-25-42 | | | | 571,628 | | | | 673,635 | |
FNMA Series 2004-W1 Class 2A2 | | | 7.00 | | | | 12-25-33 | | | | 320,507 | | | | 387,097 | |
FNMA Series 2006-M2 Class A2F ± | | | 5.26 | | | | 5-25-20 | | | | 2,879,210 | | | | 3,289,969 | |
FNMA Whole Loan Series 2002-W4 Class A4 | | | 6.25 | | | | 5-25-42 | | | | 2,942,617 | | | | 3,344,620 | |
FNMA Whole Loan Series 2004-W11 Class 1A3 | | | 7.00 | | | | 5-25-44 | | | | 1,736,158 | | | | 1,963,046 | |
FNMA Whole Loan Series 2004-W8 Class 3A | | | 7.50 | | | | 6-25-44 | | | | 809,284 | | | | 957,472 | |
GNMA | | | 6.50 | | | | 10-15-23 | | | | 75,986 | | | | 87,363 | |
GNMA | | | 6.50 | | | | 11-15-23 | | | | 28,908 | | | | 33,280 | |
GNMA | | | 6.50 | | | | 11-15-23 | | | | 38,876 | | | | 44,696 | |
GNMA | | | 6.50 | | | | 12-15-23 | | | | 42,846 | | | | 49,180 | |
GNMA | | | 6.50 | | | | 1-15-24 | | | | 80,873 | | | | 93,660 | |
GNMA | | | 7.00 | | | | 8-15-27 | | | | 181,081 | | | | 213,723 | |
SBA Participation Certificates Series 2003-P10A Class 1 | | | 4.52 | | | | 2-10-13 | | | | 24,920 | | | | 25,115 | |
SBA Participation Certificates Series 2006-20B Class 1 | | | 5.35 | | | | 2-1-26 | | | | 1,405,442 | | | | 1,606,936 | |
SBA Participation Certificates Series 2006-20H Class 1 | | | 5.70 | | | | 8-1-26 | | | | 682,082 | | | | 787,183 | |
SBA Participation Certificates Series 2007-20J Class 1 | | | 5.57 | | | | 10-1-27 | | | | 1,281,206 | | | | 1,490,703 | |
U.S. Department of Housing & Urban Development Series 04-A | | | 5.08 | | | | 8-1-13 | | | | 1,300,000 | | | | 1,341,800 | |
| | | | |
Total Agency Securities (Cost $37,581,500) | | | | | | | | | | | | | | | 40,450,522 | |
| | | | | | | | | | | | | | | | |
| | | | |
Asset-Backed Securities: 4.96% | | | | | | | | | | | | | | | | |
Countrywide Asset Backed Certificates Series 2007-S2 Class A6 ± | | | 5.78 | | | | 5-25-37 | | | | 842,884 | | | | 710,625 | |
GMAC Mortgage Corporation Loan Trust Series 2005-HE1 Class A1VN ± | | | 0.43 | | | | 8-25-35 | | | | 228,129 | | | | 157,956 | |
Green Tree Financial Corporation Series 1997-7 Class A8 ± | | | 6.86 | | | | 7-15-28 | | | | 303,532 | | | | 316,449 | |
GSAMP Trust Series 2005-SEA1 Class A ±144A | | | 0.55 | | | | 1-25-35 | | | | 124,939 | | | | 122,187 | |
HFC Home Equity Loan Asset Backed Certificates Series 2005-2 Class A1 ± | | | 0.48 | | | | 1-20-35 | | | | 1,466,051 | | | | 1,424,946 | |
KeyCorp Student Loan Trust Series 1999-B Class CTFS ± | | | 1.03 | | | | 11-25-36 | | | | 1,800,000 | | | | 1,447,076 | |
RAAC Series 2007-RP4 Class A ±144A | | | 0.56 | | | | 11-25-46 | | | | 1,594,569 | | | | 888,070 | |
Wachovia Asset Securitization Incorporated Series 2007-HE2A Class A ±144A | | | 0.34 | | | | 7-25-37 | | | | 1,174,373 | | | | 953,121 | |
| | | | |
Total Asset-Backed Securities (Cost $7,525,413) | | | | | | | | | | | | | | | 6,020,430 | |
| | | | | | | | | | | | | | | | |
The accompanying notes are an integral part of these financial statements.
| | | | |
| 108 | | Wells Fargo Advantage Allocation Funds | | Portfolio of investments—November 30, 2012 (unaudited) |
MANAGED FIXED INCOME PORTFOLIO
| | | | | | | | | | | | | | | | |
| Security name | | Interest rate | | | Maturity date | | | Principal | | | Value | |
| | | | | | | | | | | | | | | | |
| | | | |
Corporate Bonds and Notes: 28.35% | | | | | | | | | | | | | | | | |
| | | | |
Consumer Discretionary: 2.72% | | | | | | | | | | | | | | | | |
| | | | |
| Diversified Consumer Services: 1.94% | | | | | | | | | | | | | | | | |
Dartmouth College | | | 4.75 | % | | | 6-1-19 | | | $ | 600,000 | | | $ | 708,750 | |
Massachusetts Institute of Technology | | | 7.25 | | | | 11-2-96 | | | | 500,000 | | | | 848,180 | |
Pepperdine University | | | 5.45 | | | | 8-1-19 | | | | 600,000 | | | | 731,304 | |
Stewart Enterprises Incorporated | | | 6.50 | | | | 4-15-19 | | | | 60,000 | | | | 64,500 | |
| | | | |
| | | | | | | | | | | | | | | 2,352,734 | |
| | | | | | | | | | | | | | | | |
| | | | |
| Media: 0.78% | | | | | | | | | | | | | | | | |
DIRECTV Holdings LLC | | | 2.40 | | | | 3-15-17 | | | | 400,000 | | | | 409,867 | |
Pearson Dollar Finance Two plc 144A | | | 6.25 | | | | 5-6-18 | | | | 325,000 | | | | 395,289 | |
Time Warner Incorporated | | | 3.40 | | | | 6-15-22 | | | | 140,000 | | | | 146,075 | |
| | | | |
| | | | | | | | | | | | | | | 951,231 | |
| | | | | | | | | | | | | | | | |
| | | | |
Consumer Staples: 2.69% | | | | | | | | | | | | | | | | |
| | | | |
| Food & Staples Retailing: 0.95% | | | | | | | | | | | | | | | | |
SABMiller Holdings Incorporated 144A | | | 3.75 | | | | 1-15-22 | | | | 500,000 | | | | 542,311 | |
Wal-Mart Stores Incorporated | | | 5.80 | | | | 2-15-18 | | | | 500,000 | | | | 617,240 | |
| | | | |
| | | | | | | | | | | | | | | 1,159,551 | |
| | | | | | | | | | | | | | | | |
| | | | |
| Food Products: 1.36% | | | | | | | | | | | | | | | | |
Cargill Incorporated 144A | | | 4.31 | | | | 5-14-21 | | | | 419,000 | | | | 464,644 | |
Kellogg Company | | | 4.00 | | | | 12-15-20 | | | | 500,000 | | | | 562,136 | |
Kraft Foods Incorporated 144A | | | 3.50 | | | | 6-6-22 | | | | 300,000 | | | | 320,101 | |
McCormick & Company Incorporated | | | 5.75 | | | | 12-15-17 | | | | 250,000 | | | | 301,162 | |
| | | | |
| | | | | | | | | | | | | | | 1,648,043 | |
| | | | | | | | | | | | | | | | |
| | | | |
| Household Products: 0.38% | | | | | | | | | | | | | | | | |
Procter & Gamble Company | | | 1.45 | | | | 8-15-16 | | | | 450,000 | | | | 461,156 | |
| | | | | | | | | | | | | | | | |
| | | | |
Energy: 1.48% | | | | | | | | | | | | | | | | |
| | | | |
| Oil, Gas & Consumable Fuels: 1.48% | | | | | | | | | | | | | | | | |
Apache Corporation | | | 3.25 | | | | 4-15-22 | | | | 250,000 | | | | 266,960 | |
Devon Energy Corporation | | | 1.88 | | | | 5-15-17 | | | | 300,000 | | | | 306,931 | |
EQT Corporation | | | 8.13 | | | | 6-1-19 | | | | 650,000 | | | | 811,766 | |
Phillips 66 144A | | | 2.95 | | | | 5-1-17 | | | | 390,000 | | | | 415,599 | |
| | | | |
| | | | | | | | | | | | | | | 1,801,256 | |
| | | | | | | | | | | | | | | | |
| | | | |
Financials: 13.76% | | | | | | | | | | | | | | | | |
| | | | |
| Capital Markets: 1.41% | | | | | | | | | | | | | | | | |
Bank of New York Mellon Corporation | | | 2.30 | | | | 7-28-16 | | | | 250,000 | | | | 262,088 | |
Charles Schwab Corporation | | | 6.38 | | | | 9-1-17 | | | | 500,000 | | | | 604,507 | |
Goldman Sachs Capital II ± | | | 1.08 | | | | 6-1-43 | | | | 115,000 | | | | 89,246 | |
Goldman Sachs Group Incorporated | | | 5.75 | | | | 1-24-22 | | | | 200,000 | | | | 237,224 | |
Morgan Stanley | | | 4.10 | | | | 1-26-15 | | | | 500,000 | | | | 519,714 | |
| | | | |
| | | | | | | | | | | | | | | 1,712,779 | |
| | | | | | | | | | | | | | | | |
The accompanying notes are an integral part of these financial statements.
| | | | | | |
| Portfolio of investments—November 30, 2012 (unaudited) | | Wells Fargo Advantage Allocation Funds | | | 109 | |
MANAGED FIXED INCOME PORTFOLIO
| | | | | | | | | | | | | | | | |
| Security name | | Interest rate | | | Maturity date | | | Principal | | | Value | |
| | | | | | | | | | | | | | | | |
| | | | |
| Commercial Banks: 5.62% | | | | | | | | | | | | | | | | |
Chase Capital VI ± | | | 0.94 | % | | | 8-1-28 | | | $ | 1,000,000 | | | $ | 782,199 | |
Colonial Bank NA (s) | | | 6.38 | | | | 12-1-15 | | | | 1,978,000 | | | | 198 | |
CoreStates Capital Trust II ±144A | | | 0.99 | | | | 1-15-27 | | | | 750,000 | | | | 619,601 | |
HSBC Capital Funding LP ±144A | | | 4.61 | | | | 12-31-49 | | | | 600,000 | | | | 595,358 | |
Manufacturers & Traders Trust Company ± | | | 5.59 | | | | 12-28-20 | | | | 758,000 | | | | 755,800 | |
National Capital Commerce Incorporated ± | | | 1.34 | | | | 4-1-27 | | | | 400,000 | | | | 302,288 | |
National City Bank ± | | | 0.78 | | | | 6-7-17 | | | | 500,000 | | | | 488,397 | |
NTC Capital Trust Series A ± | | | 0.86 | | | | 1-15-27 | | | | 450,000 | | | | 378,379 | |
Regions Financial Corporation | | | 5.75 | | | | 6-15-15 | | | | 760,000 | | | | 820,800 | |
TCF National Bank ± | | | 2.02 | | | | 6-15-14 | | | | 1,375,000 | | | | 1,375,785 | |
UBS Preferred Funding Trust V Series 1 ± | | | 6.24 | | | | 5-29-49 | | | | 700,000 | | | | 708,750 | |
| | | | |
| | | | | | | | | | | | | | | 6,827,555 | |
| | | | | | | | | | | | | | | | |
| | | | |
| Diversified Financial Services: 2.70% | | | | | | | | | | | | | | | | |
ABB Treasury Center USA Incorporated 144A | | | 4.00 | | | | 6-15-21 | | | | 510,000 | | | | 569,713 | |
Citigroup Incorporated | | | 6.13 | | | | 11-21-17 | | | | 435,000 | | | | 516,897 | |
Deutsche Bank Capital Funding Trust VII ±144A« | | | 5.63 | | | | 12-31-49 | | | | 500,000 | | | | 465,625 | |
General Electric Capital Corporation ± | | | 0.69 | | | | 5-5-26 | | | | 450,000 | | | | 392,192 | |
Toll Road Investors Partnership II LP 144A¤ | | | 0.00 | | | | 2-15-15 | | | | 1,500,000 | | | | 1,329,410 | |
| | | | |
| | | | | | | | | | | | | | | 3,273,837 | |
| | | | | | | | | | | | | | | | |
| | | | |
| Insurance: 1.61% | | | | | | | | | | | | | | | | |
Metropolitan Life Global Funding I 144A | | | 5.13 | | | | 6-10-14 | | | | 475,000 | | | | 506,597 | |
Minnesota Life Insurance Company 144A | | | 8.25 | | | | 9-15-25 | | | | 650,000 | | | | 842,154 | |
NLV Financial Corporation 144A | | | 7.50 | | | | 8-15-33 | | | | 565,000 | | | | 608,238 | |
| | | | |
| | | | | | | | | | | | | | | 1,956,989 | |
| | | | | | | | | | | | | | | | |
| | | | |
| REITs: 2.42% | | | | | | | | | | | | | | | | |
Boston Properties LP | | | 3.70 | | | | 11-15-18 | | | | 180,000 | | | | 195,303 | |
Duke Realty LP | | | 6.75 | | | | 3-15-20 | | | | 250,000 | | | | 302,394 | |
ERP Operation LP | | | 4.63 | | | | 12-15-21 | | | | 470,000 | | | | 529,882 | |
Liberty Property LP | | | 6.63 | | | | 10-1-17 | | | | 400,000 | | | | 481,400 | |
Potlatch Corporation | | | 7.50 | | | | 11-1-19 | | | | 160,000 | | | | 172,800 | |
Realty Income Corporation | | | 5.50 | | | | 11-15-15 | | | | 400,000 | | | | 445,007 | |
Simon Property Group LP | | | 2.15 | | | | 9-15-17 | | | | 500,000 | | | | 517,333 | |
UDR Incorporated | | | 4.63 | | | | 1-10-22 | | | | 260,000 | | | | 288,226 | |
| | | | |
| | | | | | | | | | | | | | | 2,932,345 | |
| | | | | | | | | | | | | | | | |
| | | | |
Health Care: 0.52% | | | | | | | | | | | | | | | | |
| | | | |
| Health Care Providers & Services: 0.52% | | | | | | | | | | | | | | | | |
Roche Holdings Incorporated 144A | | | 6.00 | | | | 3-1-19 | | | | 500,000 | | | | 628,225 | |
| | | | | | | | | | | | | | | | |
| | | | |
Industrials: 3.23% | | | | | | | | | | | | | | | | |
| | | | |
| Aerospace & Defense: 1.06% | | | | | | | | | | | | | | | | |
BAE Systems plc 144A | | | 4.75 | | | | 10-11-21 | | | | 470,000 | | | | 530,924 | |
Lockheed Martin Corporation | | | 4.25 | | | | 11-15-19 | | | | 500,000 | | | | 568,941 | |
United Technologies Corporation | | | 3.10 | | | | 6-1-22 | | | | 180,000 | | | | 193,549 | |
| | | | |
| | | | | | | | | | | | | | | 1,293,414 | |
| | | | | | | | | | | | | | | | |
The accompanying notes are an integral part of these financial statements.
| | | | |
| 110 | | Wells Fargo Advantage Allocation Funds | | Portfolio of investments—November 30, 2012 (unaudited) |
MANAGED FIXED INCOME PORTFOLIO
| | | | | | | | | | | | | | | | |
| Security name | | Interest rate | | | Maturity date | | | Principal | | | Value | |
| | | | | | | | | | | | | | | | |
| | | | |
| Commercial Services & Supplies: 0.31% | | | | | | | | | | | | | | | | |
Black & Decker « | | | 5.75 | % | | | 11-15-16 | | | $ | 325,000 | | | $ | 377,463 | |
| | | | | | | | | | | | | | | | |
| | | | |
| Machinery: 0.43% | | | | | | | | | | | | | | | | |
Caterpillar Incorporated | | | 1.50 | | | | 6-26-17 | | | | 170,000 | | | | 173,030 | |
Deere & Company | | | 2.60 | | | | 6-8-22 | | | | 340,000 | | | | 347,439 | |
| | | | |
| | | | | | | | | | | | | | | 520,469 | |
| | | | | | | | | | | | | | | | |
| | | | |
| Road & Rail: 1.08% | | | | | | | | | | | | | | | | |
Burlington Northern Santa Fe LLC | | | 5.65 | | | | 5-1-17 | | | | 200,000 | | | | 237,717 | |
Ryder System Incorporated Series MTN | | | 3.15 | | | | 3-2-15 | | | | 565,000 | | | | 584,529 | |
Union Pacific Corporation | | | 2.95 | | | | 1-15-23 | | | | 250,000 | | | | 259,866 | |
Union Pacific Corporation | | | 7.88 | | | | 1-15-19 | | | | 171,000 | | | | 223,960 | |
| | | | |
| | | | | | | | | | | | | | | 1,306,072 | |
| | | | | | | | | | | | | | | | |
| | | | |
| Transportation Infrastructure: 0.35% | | | | | | | | | | | | | | | | |
Vessel Management Service | | | 3.43 | | | | 8-15-36 | | | | 408,000 | | | | 424,854 | |
| | | | | | | | | | | | | | | | |
| | | | |
Information Technology: 0.67% | | | | | | | | | | | | | | | | |
| | | | |
| Electronic Equipment, Instruments & Components: 0.24% | | | | | | | | | | | | | | | | |
Jabil Circuit Incorporated | | | 8.25 | | | | 3-15-18 | | | | 250,000 | | | | 293,750 | |
| | | | | | | | | | | | | | | | |
| | | | |
| IT Services: 0.43% | | | | | | | | | | | | | | | | |
Fiserv Incorporated | | | 3.13 | | | | 10-1-15 | | | | 500,000 | | | | 524,859 | |
| | | | | | | | | | | | | | | | |
| | | | |
Materials: 1.44% | | | | | | | | | | | | | | | | |
| | | | |
| Chemicals: 0.67% | | | | | | | | | | | | | | | | |
Valspar Corporation | | | 5.10 | | | | 8-1-15 | | | | 750,000 | | | | 813,392 | |
| | | | | | | | | | | | | | | | |
| | | | |
| Metals & Mining: 0.77% | | | | | | | | | | | | | | | | |
International Steel Group | | | 6.50 | | | | 4-15-14 | | | | 100,000 | | | | 104,288 | |
Rio Tinto Finance USA Limited | | | 3.75 | | | | 9-20-21 | | | | 370,000 | | | | 400,333 | |
Steel Dynamics Incorporated | | | 6.75 | | | | 4-1-15 | | | | 185,000 | | | | 188,238 | |
Teck Resources Limited Company | | | 3.00 | | | | 3-1-19 | | | | 240,000 | | | | 244,061 | |
| | | | |
| | | | | | | | | | | | | | | 936,920 | |
| | | | | | | | | | | | | | | | |
| | | | |
Telecommunication Services: 0.28% | | | | | | | | | | | | | | | | |
| | | | |
| Diversified Telecommunication Services: 0.28% | | | | | | | | | | | | | | | | |
AT&T Incorporated | | | 1.60 | | | | 2-15-17 | | | | 330,000 | | | | 335,409 | |
| | | | | | | | | | | | | | | | |
| | | | |
Utilities: 1.56% | | | | | | | | | | | | | | | | |
| | | | |
| Electric Utilities: 1.56% | | | | | | | | | | | | | | | | |
Carolina Power & Light Company | | | 2.80 | | | | 5-15-22 | | | | 400,000 | | | | 415,645 | |
Connecticut Light & Power | | | 5.38 | | | | 3-1-17 | | | | 250,000 | | | | 287,879 | |
Great River Energy 144A | | | 5.83 | | | | 7-1-17 | | | | 676,324 | | | | 727,914 | |
Otter Tail Corporation | | | 9.00 | | | | 12-15-16 | | | | 350,000 | | | | 409,500 | |
Wisconsin Electric Power Company | | | 2.95 | | | | 9-15-21 | | | | 50,000 | | | | 52,707 | |
| | | | |
| | | | | | | | | | | | | | | 1,893,645 | |
| | | | | | | | | | | | | | | | |
| | | | |
Total Corporate Bonds and Notes (Cost $33,973,510) | | | | | | | | | | | | | | | 34,425,948 | |
| | | | | | | | | | | | | | | | |
The accompanying notes are an integral part of these financial statements.
| | | | | | |
| Portfolio of investments—November 30, 2012 (unaudited) | | Wells Fargo Advantage Allocation Funds | | | 111 | |
MANAGED FIXED INCOME PORTFOLIO
| | | | | | | | | | | | | | | | |
| Security name | | Interest rate | | | Maturity date | | | Principal | | | Value | |
| | | | | | | | | | | | | | | | |
| | | | |
Municipal Obligations: 9.25% | | | | | | | | | | | | | | | | |
| | | | |
| Arizona: 0.81% | | | | | | | | | | | | | | | | |
Maricopa County AZ Elementary School District #28 Kyrene Elementary (Tax Revenue) | | | 5.38 | % | | | 7-1-19 | | | $ | 800,000 | | | $ | 985,240 | |
| | | | | | | | | | | | | | | | |
| | | | |
| California: 0.23% | | | | | | | | | | | | | | | | |
California State Build America Bonds Taxable Various Purpose (GO) | | | 7.50 | | | | 4-1-34 | | | | 200,000 | | | | 278,628 | |
| | | | | | | | | | | | | | | | |
| | | | |
| Connecticut: 0.15% | | | | | | | | | | | | | | | | |
Connecticut State Taxable Series B (GO) | | | 2.20 | | | | 10-15-20 | | | | 175,000 | | | | 178,448 | |
| | | | | | | | | | | | | | | | |
| | | | |
| Georgia: 0.53% | | | | | | | | | | | | | | | | |
Cherokee County GA School System Build America Bonds (Tax Revenue, State Aid Withholding Insured) | | | 5.87 | | | | 8-1-28 | | | | 500,000 | | | | 638,225 | |
| | | | | | | | | | | | | | | | |
| | | | |
| Indiana: 0.47% | | | | | | | | | | | | | | | | |
Indiana State Housing & CDA Series A-2 (Housing Revenue, GNMA/FNMA Insured) | | | 5.51 | | | | 1-1-39 | | | | 540,000 | | | | 566,325 | |
| | | | | | | | | | | | | | | | |
| | | | |
| Kentucky: 0.32% | | | | | | | | | | | | | | | | |
Kentucky Housing Corporation Series D (Housing Revenue) | | | 5.75 | | | | 7-1-37 | | | | 375,000 | | | | 387,270 | |
| | | | | | | | | | | | | | | | |
| | | | |
| Maryland: 0.25% | | | | | | | | | | | | | | | | |
Baltimore County MD Taxable (GO) | | | 3.57 | | | | 8-1-32 | | | | 300,000 | | | | 304,695 | |
| | | | | | | | | | | | | | | | |
| | | | |
| Massachusetts: 0.85% | | | | | | | | | | | | | | | | |
Boston MA Taxable Series C Qualified School Construction Bonds (Tax Revenue) | | | 4.40 | | | | 4-1-26 | | | | 400,000 | | | | 464,696 | |
Massachusetts State Build America Bonds Series D (Tax Revenue) | | | 4.50 | | | | 8-1-31 | | | | 500,000 | | | | 573,290 | |
| | | | |
| | | | | | | | | | | | | | | 1,037,986 | |
| | | | | | | | | | | | | | | | |
| | | | |
| Minnesota: 0.28% | | | | | | | | | | | | | | | | |
Minnesota State Housing Finance Agency Series H (Housing Revenue) | | | 5.85 | | | | 7-1-36 | | | | 335,000 | | | | 335,821 | |
| | | | | | | | | | | | | | | | |
| | | | |
| Missouri: 0.51% | | | | | | | | | | | | | | | | |
Missouri Higher Education Loan Authority Notes Class A-1 (Education Revenue) ± | | | 1.16 | | | | 8-27-29 | | | | 614,695 | | | | 615,764 | |
| | | | | | | | | | | | | | | | |
| | | | |
| New Hampshire: 0.59% | | | | | | | | | | | | | | | | |
New Hampshire HFA SFMR Series D (Housing Revenue) | | | 5.53 | | | | 7-1-37 | | | | 690,000 | | | | 711,770 | |
| | | | | | | | | | | | | | | | |
| | | | |
| New Jersey: 1.07% | | | | | | | | | | | | | | | | |
Hudson County NJ Improvement Authority Facilities (Lease Revenue, FSA Insured) | | | 7.40 | | | | 12-1-25 | | | | 1,030,000 | | | | 1,305,783 | |
| | | | | | | | | | | | | | | | |
| | | | |
| North Carolina: 0.56% | | | | | | | | | | | | | | | | |
Duke University North Carolina Series A (Education Revenue, GO of University Insured) | | | 5.85 | | | | 4-1-37 | | | | 500,000 | | | | 686,335 | |
| | | | | | | | | | | | | | | | |
| | | | |
| Ohio: 0.61% | | | | | | | | | | | | | | | | |
Ohio State Housing Finance Agency Series O (Housing Revenue, GNMA/FNMA Insured) | | | 5.47 | | | | 9-1-25 | | | | 705,000 | | | | 738,650 | |
| | | | | | | | | | | | | | | | |
| | | | |
| Texas: 0.75% | | | | | | | | | | | | | | | | |
Clear Creek TX Independent School District Taxable Refunding Series B (GO) | | | 3.40 | | | | 2-15-22 | | | | 375,000 | | | | 407,100 | |
Harris County TX Taxable Refunding Permanent Improvement Series B (GO) | | | 2.12 | | | | 10-1-21 | | | | 500,000 | | | | 499,715 | |
| | | | |
| | | | | | | | | | | | | | | 906,815 | |
| | | | | | | | | | | | | | | | |
The accompanying notes are an integral part of these financial statements.
| | | | |
| 112 | | Wells Fargo Advantage Allocation Funds | | Portfolio of investments—November 30, 2012 (unaudited) |
MANAGED FIXED INCOME PORTFOLIO
| | | | | | | | | | | | | | | | |
| Security name | | Interest rate | | | Maturity date | | | Principal | | | Value | |
| | | | | | | | | | | | | | | | |
| | | | |
| Washington: 0.23% | | | | | | | | | | | | | | | | |
King County WA Build America Bonds Recovery Zone Economic Development Taxable Series C (GO) | | | 5.03 | % | | | 12-1-23 | | | $ | 230,000 | | | $ | 282,194 | |
| | | | | | | | | | | | | | | | |
| | | | |
| West Virginia: 0.43% | | | | | | | | | | | | | | | | |
Ohio County WV Special District Excise Tax Series A (Tax Revenue) | | | 8.25 | | | | 3-1-35 | | | | 500,000 | | | | 525,540 | |
| | | | | | | | | | | | | | | | |
| | | | |
| Wisconsin: 0.61% | | | | | | | | | | | | | | | | |
Wisconsin Housing & EDA Home Ownership Revenue Series F (Housing Revenue, GO of Authority Insured) | | | 5.73 | | | | 9-1-37 | | | | 740,000 | | | | 741,265 | |
| | | | | | | | | | | | | | | | |
| | | | |
Total Municipal Obligations (Cost $10,259,810) | | | | | | | | | | | | | | | 11,226,754 | |
| | | | | | | | | | | | | | | | |
| | | | |
Non-Agency Mortgage Backed Securities: 15.01% | | | | | | | | | | | | | | | | |
Countrywide Alternative Loan Trust Series 2005-27 Class 3A1 ± | | | 1.54 | | | | 8-25-35 | | | | 977,480 | | | | 690,697 | |
Countrywide Home Loans Series 2005-R3 Class AF ±144A | | | 0.61 | | | | 9-25-35 | | | | 1,484,542 | | | | 1,245,814 | |
Countrywide Home Loans Series 2006-OA5 Class 1A1 ± | | | 0.41 | | | | 4-25-46 | | | | 1,478,182 | | | | 1,045,482 | |
Credit Suisse First Boston Mortgage Securities Corporation Series 2004-AR5
Class 10A1 ± | | | 2.74 | | | | 6-25-34 | | | | 970,525 | | | | 958,033 | |
Credit Suisse Mortgage Capital Certification Series 2007-C1 Class AAB | | | 5.34 | | | | 2-15-40 | | | | 1,747,848 | | | | 1,831,683 | |
Harborview Mortgage Loan Trust Series 2004-11 Class 3A2A ± | | | 0.55 | | | | 1-19-35 | | | | 39,101 | | | | 30,388 | |
JPMorgan Chase Commercial Mortgage Securities Corporation Series 2006-LDP7 Class ASB ± | | | 6.06 | | | | 4-15-45 | | | | 1,678,530 | | | | 1,777,652 | |
LF Rothschild Mortgage Trust Series 2 Class Z | | | 9.95 | | | | 8-1-17 | | | | 13,282 | | | | 14,344 | |
Merrill Lynch Mortgage Trust Series 2006-C2 Class A2 ± | | | 5.76 | | | | 8-12-43 | | | | 1,141,578 | | | | 1,186,905 | |
Nomura Asset Acceptance Corporation Series 2004-R2 Class A1 ±144A | | | 6.50 | | | | 10-25-34 | | | | 1,497,011 | | | | 1,511,741 | |
Sequoia Mortgage Trust Series 10 Class 1A ± | | | 1.01 | | | | 10-20-27 | | | | 631,858 | | | | 626,790 | |
Structured Asset Securities Corporation Series 2007-RM1 Class A1 ±144A(a) | | | 0.49 | | | | 5-25-47 | | | | 2,640,880 | | | | 1,475,724 | |
Wachovia Bank Commercial Mortgage Trust Series 2005-C16 Class A4 ± | | | 4.85 | | | | 10-15-41 | | | | 1,475,000 | | | | 1,584,358 | |
Washington Mutual Commercial Mortgage Securities Trust Series 2007-SL3 Class A1 ±144A | | | 6.11 | | | | 3-23-45 | | | | 1,353,520 | | | | 1,368,314 | |
Washington Mutual Mortgage Pass-Through Certificates Series 2005-AR6
Class 2A1A ± | | | 0.44 | | | | 4-25-45 | | | | 760,497 | | | | 714,323 | |
Washington Mutual Mortgage Pass-Through Certificates Series 2006-AR3
Class A1A ± | | | 1.15 | | | | 2-25-46 | | | | 1,718,016 | | | | 1,540,669 | |
Washington Mutual Mortgage Pass-Through Certificates Series 2006-AR4
Class DA ± | | | 1.13 | | | | 6-25-46 | | | | 1,308,440 | | | | 623,907 | |
| | | | |
Total Non-Agency Mortgage Backed Securities (Cost $20,990,584) | | | | | | | | | | | | | | | 18,226,824 | |
| | | | | | | | | | | | | | | | |
| | | | |
Term Loans: 0.29% | | | | | | | | | | | | | | | | |
RMK Acquisition Corporation (Aramark) 1st Lien | | | 2.09 | | | | 1-27-14 | | | | 26,337 | | | | 26,266 | |
RMK Acquisition Corporation (Aramark) 1st Lien | | | 2.24 | | | | 1-27-14 | | | | 326,927 | | | | 326,050 | |
| | | | |
Total Term Loans (Cost $353,264) | | | | | | | | | | | | | | | 352,316 | |
| | | | | | | | | | | | | | | | |
| | | | |
U.S. Treasury Securities: 5.84% | | | | | | | | | | | | | | | | |
TIPS | | | 0.75 | | | | 2-15-42 | | | | 2,355,085 | | | | 2,624,264 | |
U.S. Treasury Bond | | | 2.75 | | | | 8-15-42 | | | | 1,275,000 | | | | 1,261,254 | |
U.S. Treasury Bond | | | 3.88 | | | | 8-15-40 | | | | 375,000 | | | | 460,488 | |
U.S. Treasury Bond | | | 4.25 | | | | 11-15-40 | | | | 2,105,000 | | | | 2,745,381 | |
| | | | |
Total U.S. Treasury Securities (Cost $5,926,839) | | | | | | | | | | | | | | | 7,091,387 | |
| | | | | | | | | | | | | | | | |
The accompanying notes are an integral part of these financial statements.
| | | | | | |
| Portfolio of investments—November 30, 2012 (unaudited) | | Wells Fargo Advantage Allocation Funds | | | 113 | |
MANAGED FIXED INCOME PORTFOLIO
| | | | | | | | | | | | | | | | |
| Security name | | Interest rate | | | Maturity date | | | Principal | | | Value | |
| | | | | | | | | | | | | | | | |
| | | | |
Yankee Corporate Bonds and Notes: 1.39% | | | | | | | | | | | | | | | | |
| | | | |
Energy: 0.35% | | | | | | | | | | | | | | | | |
| | | | |
| Energy Equipment & Services: 0.35% | | | | | | | | | | | | | | | | |
Ensco plc | | | 4.70 | % | | | 3-15-21 | | | $ | 200,000 | | | $ | 227,483 | |
Weatherford International Limited | | | 4.50 | | | | 4-15-22 | | | | 190,000 | | | | 194,335 | |
| | | | |
| | | | | | | | | | | | | | | 421,818 | |
| | | | | | | | | | | | | | | | |
| | | | |
Financials: 1.04% | | | | | | | | | | | | | | | | |
| | | | |
| Commercial Banks: 0.56% | | | | | | | | | | | | | | | | |
Rabobank Nederland NV ±144A | | | 11.00 | | | | 12-29-49 | | | | 500,000 | | | | 677,750 | |
| | | | | | | | | | | | | | | | |
| | | | |
| Diversified Financial Services: 0.48% | | | | | | | | | | | | | | | | |
Siemens Financieringsmaatschappij NV 144A | | | 5.75 | | | | 10-17-16 | | | | 500,000 | | | | 586,554 | |
| | | | | | | | | | | | | | | | |
| | | | |
Total Yankee Corporate Bonds and Notes (Cost $1,542,053) | | | | | | | | | | | | | | | 1,686,122 | |
| | | | | | | | | | | | | | | | |
| | | | |
Other: 0.07% | | | | | | | | | | | | | | | | |
Gryphon Funding Limited, Pass-Through Entity (a)(i)(v) | | | | | | | | | | | 266,898 | | | | 88,076 | |
| | | | |
Total Other (Cost $25,288) | | | | | | | | | | | | | | | 88,076 | |
| | | | | | | | | | | | | | | | |
| | | | |
| | | Yield | | | | | | Shares | | | | |
| | | | |
Short-Term Investments: 3.73% | | | | | | | | | | | | | | | | |
| | | | |
| Investment Companies: 3.73% | | | | | | | | | | | | | | | | |
Wells Fargo Advantage Cash Investment Money Market Fund, Select Class (l)(u)## | | | 0.16 | | | | | | | | 3,955,122 | | | | 3,955,122 | |
Wells Fargo Securities Lending Cash Investments, LLC (v)(l)(u)(r) | | | 0.21 | | | | | | | | 574,087 | | | | 574,087 | |
| | | | |
Total Short-Term Investments (Cost $4,529,209) | | | | | | | | | | | | | | | 4,529,209 | |
| | | | | | | | | | | | | | | | |
| | | | | | | | |
Total investments in securities (Cost $122,707,470)* | | | 102.21 | % | | | 124,097,588 | |
Other assets and liabilities, net | | | (2.21 | ) | | | (2,686,173 | ) |
| | | | | | | | |
| Total net assets | | | 100.00 | % | | $ | 121,411,415 | |
| | | | | | | | |
| ± | Variable rate investment |
| %% | Security issued on a when-issued basis. |
| 144A | Security that may be resold to “qualified institutional buyers” under Rule 144A or security offered pursuant to Section 4(2) of the Securities Act of 1933, as amended. |
| (s) | Security is currently in default with regards to scheduled interest and/or principal payments. The Fund has stopped accruing interest on this security. |
| « | All or a portion of this security is on loan. |
| ¤ | Security issued in zero coupon form with no periodic interest payments. |
| (a) | Security is fair valued by the Management Valuation Team, and in certain instances by the Board of Trustees, in accordance with procedures approved by the Board of Trustees. |
| (v) | Security represents investment of cash collateral received from securities on loan. |
| (l) | Investment in an affiliate |
| (u) | Rate shown is the 7-day annualized yield at period end. |
| ## | All or a portion of this security has been segregated for when-issued securities. |
| (r) | The investment company is exempt from registration under Section 3(c)(7) of the Investment Company Act of 1940, as amended. |
| * | Cost for federal income tax purposes is $123,243,398 and unrealized appreciation (depreciation) consists of: |
| | | | |
Gross unrealized appreciation | | $ | 8,023,568 | |
Gross unrealized depreciation | | | (7,169,378 | ) |
| | | | |
Net unrealized appreciation | | $ | 854,190 | |
The accompanying notes are an integral part of these financial statements.
| | | | |
| 114 | | Wells Fargo Advantage Allocation Funds | | Portfolio of investments—November 30, 2012 (unaudited) |
STABLE INCOME PORTFOLIO
| | | | | | | | | | | | | | | | |
| Security name | | Interest rate | | | Maturity date | | | Principal | | | Value | |
| | | | | | | | | | | | | | | | |
| | | | |
Agency Securities: 36.16% | | | | | | | | | | | | | | | | |
FHLMC | | | 6.00 | % | | | 7-1-17 | | | $ | 102,313 | | | $ | 111,246 | |
FHLMC | | | 7.50 | | | | 7-17-17 | | | | 97,035 | | | | 96,955 | |
FHLMC Series T-54 Class 4A ± | | | 3.11 | | | | 2-25-43 | | | | 632,657 | | | | 639,009 | |
FHLMC Structured Pass-Through Securities Series T-54 Class 3A | | | 7.00 | | | | 2-25-43 | | | | 556,996 | | | | 668,550 | |
FHLMC Structured Pass-Through Securities Series T-55 Class 1A2 | | | 7.00 | | | | 3-25-43 | | | | 900,888 | | | | 1,026,472 | |
FHLMC Structured Pass-Through Securities Series T-57 Class 1A2 | | | 7.00 | | | | 7-25-43 | | | | 741,790 | | | | 855,536 | |
FHLMC Structured Pass-Through Securities Series T-58 Class 4A | | | 7.50 | | | | 9-25-43 | | | | 922,806 | | | | 1,098,100 | |
FHLMC Structured Pass-Through Securities Series T-63 Class 1A1 ± | | | 1.35 | | | | 2-25-45 | | | | 562,305 | | | | 546,181 | |
FNMA ± | | | 1.35 | | | | 10-1-34 | | | | 372,678 | | | | 378,944 | |
FNMA ± | | | 1.35 | | | | 4-1-44 | | | | 253,542 | | | | 257,784 | |
FNMA ± | | | 1.35 | | | | 10-1-44 | | | | 381,725 | | | | 388,272 | |
FNMA ± | | | 1.74 | | | | 4-1-37 | | | | 304,357 | | | | 316,756 | |
FNMA ± | | | 1.78 | | | | 9-1-33 | | | | 232,859 | | | | 241,085 | |
FNMA ± | | | 1.82 | | | | 10-1-33 | | | | 599,892 | | | | 625,461 | |
FNMA ± | | | 2.31 | | | | 6-1-33 | | | | 456,444 | | | | 483,844 | |
FNMA ± | | | 2.34 | | | | 4-1-34 | | | | 506,094 | | | | 529,781 | |
FNMA ± | | | 2.38 | | | | 12-1-33 | | | | 365,727 | | | | 386,082 | |
FNMA ± | | | 2.38 | | | | 1-1-36 | | | | 319,810 | | | | 337,876 | |
FNMA ± | | | 2.41 | | | | 6-1-33 | | | | 314,107 | | | | 333,546 | |
FNMA ± | | | 2.54 | | | | 8-1-35 | | | | 434,784 | | | | 458,058 | |
FNMA ± | | | 2.62 | | | | 7-1-35 | | | | 331,725 | | | | 352,720 | |
FNMA ± | | | 3.00 | | | | 7-1-17 | | | | 35,427 | | | | 36,365 | |
FNMA | | | 5.50 | | | | 2-1-17 | | | | 191,400 | | | | 205,878 | |
FNMA | | | 6.50 | | | | 12-1-15 | | | | 51,275 | | | | 53,400 | |
FNMA Series 2002-90 Class A2 | | | 6.50 | | | | 11-25-42 | | | | 206,535 | | | | 239,418 | |
FNMA Series 2002-T12 Class A3 | | | 7.50 | | | | 5-25-42 | | | | 194,158 | | | | 231,154 | |
FNMA Series 2003-W4 Class 3A ± | | | 6.83 | | | | 10-25-42 | | | | 477,627 | | | | 562,860 | |
FNMA Series 2004-W2 Class 2A2 | | | 7.00 | | | | 2-25-44 | | | | 385,504 | | | | 444,850 | |
FNMA Series 2007-88 Class HC ± | | | 3.02 | | | | 9-25-37 | | | | 425,184 | | | | 427,413 | |
FNMA Whole Loan Series 2002-W10 Class A6 | | | 7.50 | | | | 8-25-42 | | | | 205,047 | | | | 246,700 | |
| | | | |
Total Agency Securities (Cost $11,830,664) | | | | | | | | | | | | | | | 12,580,296 | |
| | | | | | | | | | | | | | | | |
| | | | |
Asset-Backed Securities: 15.09% | | | | | | | | | | | | | | | | |
Ally Auto Receivables Trust Series 2011-2 Class A3 | | | 1.18 | | | | 4-15-15 | | | | 159,090 | | | | 159,697 | |
Ally Auto Receivables Trust Series 2011-4 Class A2 | | | 0.65 | | | | 3-17-14 | | | | 14,659 | | | | 14,665 | |
Ally Auto Receivables Trust Series 2011-5 Class A3 | | | 0.99 | | | | 11-16-15 | | | | 125,000 | | | | 125,791 | |
Ally Auto Receivables Trust Series 2012-5 Class A2 | | | 0.45 | | | | 7-15-15 | | | | 225,000 | | | | 224,947 | |
AmeriCredit Automobile Receivables Trust Series 2011-3 Class A2 | | | 0.84 | | | | 11-10-14 | | | | 39,622 | | | | 39,652 | |
AmeriCredit Automobile Receivables Trust Series 2011-4 Class A2 | | | 0.92 | | | | 3-9-15 | | | | 47,847 | | | | 47,914 | |
AmeriCredit Automobile Receivables Trust Series 2011-5 Class A2 | | | 1.19 | | | | 8-8-15 | | | | 73,907 | | | | 74,175 | |
AmeriCredit Automobile Receivables Trust Series 2012-4 Class A3 | | | 0.67 | | | | 6-8-17 | | | | 175,000 | | | | 175,106 | |
BMW Vehicle Owner Trust Series 2011-A Class A2 | | | 0.63 | | | | 2-25-14 | | | | 23,184 | | | | 23,195 | |
CNH Equipment Trust Series 2011-B Class A2 | | | 0.71 | | | | 12-15-14 | | | | 67,639 | | | | 67,701 | |
Ford Credit Auto Owner Trust Series 2011-B Class A3 | | | 0.84 | | | | 6-15-15 | | | | 100,000 | | | | 100,298 | |
GE Equipment Mid Ticket LLC Series 2011-1 Class A2 | | | 0.72 | | | | 5-22-14 | | | | 98,361 | | | | 98,423 | |
GE Equipment Small Ticket LLC Series 2011-2A Class A2 144A | | | 1.14 | | | | 6-23-14 | | | | 86,752 | | | | 86,911 | |
GE Equipment Small Ticket LLC Series 2012-A Class A2 144A | | | 0.85 | | | | 11-21-14 | | | | 175,000 | | | | 175,347 | |
GSAMP Trust Series 2005-SEA2 Class A1 ± | | | 0.56 | | | | 1-25-45 | | | | 512,801 | | | | 467,941 | |
GSMPS Mortgage Loan Trust Series 2005-RP2 Class 1AF ±144A | | | 0.56 | | | | 3-25-35 | | | | 362,992 | | | | 303,976 | |
GSMPS Mortgage Loan Trust Series 2005-RP3 Class 1AF ±144A | | | 0.56 | | | | 9-25-35 | | | | 380,855 | | | | 318,966 | |
The accompanying notes are an integral part of these financial statements.
| | | | | | |
| Portfolio of investments—November 30, 2012 (unaudited) | | Wells Fargo Advantage Allocation Funds | | | 115 | |
STABLE INCOME PORTFOLIO
| | | | | | | | | | | | | | | | |
| Security name | | Interest rate | | | Maturity date | | | Principal | | | Value | |
| | | | | | | | | | | | | | | | |
| | | | |
Asset-Backed Securities (continued) | | | | | | | | | | | | | | | | |
HFC Home Equity Loan Asset Backed Certificates Series 2005-2 Class A1 ± | | | 0.48 | % | | | 1-20-35 | | | $ | 516,783 | | | $ | 502,293 | |
Honda Auto Receivables Owner Trust Series 2011-3 Class A2 | | | 0.67 | | | | 4-21-14 | | | | 78,757 | | | | 78,845 | |
Honda Auto Receivables Owner Trust Series 2012-4 Class A2 | | | 0.40 | | | | 4-20-15 | | | | 275,000 | | | | 275,007 | |
Honda Auto Receivables Owner Trust Series 2012-4 Class A3 | | | 0.52 | | | | 8-18-16 | | | | 100,000 | | | | 100,042 | |
Household Home Equity Loan Trust Series 2006-1 Class A1 ± | | | 0.37 | | | | 1-20-36 | | | | 730,274 | | | | 719,336 | |
Huntington Auto Trust Series 2011-1A Class A3 144A | | | 1.01 | | | | 1-15-16 | | | | 175,000 | | | | 175,889 | |
Mercedes-Benz Auto Lease Trust Series 2011-B Class A2 144A | | | 0.90 | | | | 1-15-14 | | | | 78,204 | | | | 78,283 | |
Mercedes-Benz Auto Receivables Series 2011-1 Class A3 | | | 0.85 | | | | 3-16-15 | | | | 125,000 | | | | 125,326 | |
Morgan Stanley Dean Witter & Company Corporation Heloc Trust Series 2003-2 Class A ± | | | 0.73 | | | | 4-25-16 | | | | 28,486 | | | | 28,229 | |
Santander Drive Auto Receivables Trust Series 2011-4 Class A2 | | | 1.37 | | | | 3-16-15 | | | | 102,661 | | | | 103,044 | |
SBI Heloc Trust Series 2005-HE1 Class 1A ±144A | | | 0.40 | | | | 11-25-35 | | | | 310,922 | | | | 288,186 | |
Volkswagen Auto Lease Trust Series 2011-A Class A2 | | | 1.00 | | | | 2-20-14 | | | | 46,424 | | | | 46,501 | |
World Omni Auto Receivables Trust 2012-B Class A2 | | | 0.43 | | | | 11-16-15 | | | | 225,000 | | | | 224,953 | |
| | | | |
Total Asset-Backed Securities (Cost $5,459,545) | | | | | | | | | | | | | | | 5,250,639 | |
| | | | | | | | | | | | | | | | |
| | | | |
Corporate Bonds and Notes: 22.80% | | | | | | | | | | | | | | | | |
| | | | |
Consumer Discretionary: 1.38% | | | | | | | | | | | | | | | | |
| | | | |
| Automobiles: 0.44% | | | | | | | | | | | | | | | | |
Daimler Finance North America LLC 144A | | | 1.88 | | | | 9-15-14 | | | | 150,000 | | | | 152,173 | |
| | | | | | | | | | | | | | | | |
| | | | |
| Diversified Consumer Services: 0.66% | | | | | | | | | | | | | | | | |
University of Notre Dame | | | 4.14 | | | | 9-1-13 | | | | 225,000 | | | | 230,675 | |
| | | | | | | | | | | | | | | | |
| | | | |
| Media: 0.28% | | | | | | | | | | | | | | | | |
Time Warner Cable Incorporated | | | 6.20 | | | | 7-1-13 | | | | 95,000 | | | | 98,006 | |
| | | | | | | | | | | | | | | | |
| | | | |
Consumer Staples: 4.81% | | | | | | | | | | | | | | | | |
| | | | |
| Beverages: 2.31% | | | | | | | | | | | | | | | | |
Anheuser-Busch Companies Incorporated | | | 4.38 | | | | 1-15-13 | | | | 200,000 | | | | 200,739 | |
Brown Forman Corporation | | | 5.00 | | | | 2-1-14 | | | | 210,000 | | | | 220,999 | |
Coca Cola Company | | | 0.75 | | | | 3-13-15 | | | | 100,000 | | | | 100,791 | |
Coca Cola Enterprises | | | 1.13 | | | | 11-12-13 | | | | 150,000 | | | | 150,678 | |
Miller Brewing Corporation 144A | | | 5.50 | | | | 8-15-13 | | | | 125,000 | | | | 128,963 | |
| | | | |
| | | | | | | | | | | | | | | 802,170 | |
| | | | | | | | | | | | | | | | |
| | | | |
| Food & Staples Retailing: 0.58% | | | | | | | | | | | | | | | | |
Sysco Corporation | | | 4.20 | | | | 2-12-13 | | | | 200,000 | | | | 201,363 | |
| | | | | | | | | | | | | | | | |
| | | | |
| Food Products: 1.92% | | | | | | | | | | | | | | | | |
Campbell Soup Company | | | 3.38 | | | | 8-15-14 | | | | 250,000 | | | | 261,677 | |
General Mills Incorporated | | | 5.20 | | | | 3-17-15 | | | | 150,000 | | | | 165,356 | |
Kellogg Company Series B | | | 4.25 | | | | 3-6-13 | | | | 140,000 | | | | 141,342 | |
Kraft Foods Group Incorporated 144A | | | 1.63 | | | | 6-4-15 | | | | 100,000 | | | | 101,553 | |
| | | | |
| | | | | | | | | | | | | | | 669,928 | |
| | | | | | | | | | | | | | | | |
| | | | |
Energy: 0.85% | | | | | | | | | | | | | | | | |
| | | | |
| Oil, Gas & Consumable Fuels: 0.85% | | | | | | | | | | | | | | | | |
Chevron Corporation | | | 3.95 | | | | 3-3-14 | | | | 125,000 | | | | 130,263 | |
ConocoPhillips Australia | | | 5.50 | | | | 4-15-13 | | | | 125,000 | | | | 127,228 | |
Devon Energy Corporation | | | 5.63 | | | | 1-15-14 | | | | 35,000 | | | | 36,945 | |
| | | | |
| | | | | | | | | | | | | | | 294,436 | |
| | | | | | | | | | | | | | | | |
The accompanying notes are an integral part of these financial statements.
| | | | |
| 116 | | Wells Fargo Advantage Allocation Funds | | Portfolio of investments—November 30, 2012 (unaudited) |
STABLE INCOME PORTFOLIO
| | | | | | | | | | | | | | | | |
| Security name | | Interest rate | | | Maturity date | | | Principal | | | Value | |
| | | | | | | | | | | | | | | | |
| | | | |
Financials: 9.87% | | | | | | | | | | | | | | | | |
| | | | |
| Capital Markets: 0.55% | | | | | | | | | | | | | | | | |
Goldman Sachs Group Incorporated | | | 5.25 | % | | | 4-1-13 | | | $ | 190,000 | | | $ | 192,737 | |
| | | | | | | | | | | | | | | | |
| | | | |
| Commercial Banks: 2.35% | | | | | | | | | | | | | | | | |
AMEX Centurion Bank | | | 1.00 | | | | 9-23-13 | | | | 245,000 | | | | 245,927 | |
Bank of Montreal ± | | | 0.78 | | | | 4-29-14 | | | | 125,000 | | | | 125,603 | |
Branch Banking & Trust Company ± | | | 0.72 | | | | 9-13-16 | | | | 250,000 | | | | 245,756 | |
HSBC Bank plc 144A | | | 1.63 | | | | 8-12-13 | | | | 200,000 | | | | 201,579 | |
| | | | |
| | | | | | | | | | | | | | | 818,865 | |
| | | | | | | | | | | | | | | | |
| | | | |
| Consumer Finance: 3.64% | | | | | | | | | | | | | | | | |
BMW Bank of North America | | | 1.00 | | | | 7-18-14 | | | | 245,000 | | | | 245,482 | |
Caterpillar Financial Services Corporation « | | | 2.00 | | | | 4-5-13 | | | | 150,000 | | | | 150,837 | |
John Deere Capital Corporation | | | 1.88 | | | | 6-17-13 | | | | 300,000 | | | | 302,455 | |
National Credit Union Administration ± | | | 0.23 | | | | 6-12-13 | | | | 275,000 | | | | 274,986 | |
Toyota Motor Credit Corporation | | | 1.00 | | | | 2-17-15 | | | | 125,000 | | | | 126,091 | |
Unilever Capital Corporation | | | 3.65 | | | | 2-15-14 | | | | 160,000 | | | | 165,798 | |
| | | | |
| | | | | | | | | | | | | | | 1,265,649 | |
| | | | | | | | | | | | | | | | |
| | | | |
| Diversified Financial Services: 2.87% | | | | | | | | | | | | | | | | |
American Express | | | 5.88 | | | | 5-2-13 | | | | 125,000 | | | | 127,750 | |
Bank of America Corporation | | | 4.90 | | | | 5-1-13 | | | | 175,000 | | | | 177,927 | |
Citigroup Incorporated | | | 6.50 | | | | 8-19-13 | | | | 150,000 | | | | 155,938 | |
JPMorgan Chase & Company | | | 4.65 | | | | 6-1-14 | | | | 175,000 | | | | 184,818 | |
New York Life Global Funding 144A | | | 4.65 | | | | 5-9-13 | | | | 120,000 | | | | 122,218 | |
Pacific Life Global Funding 144A | | | 5.15 | | | | 4-15-13 | | | | 100,000 | | | | 101,690 | |
WMC Finance USA Limited | | | 5.13 | | | | 5-15-13 | | | | 125,000 | | | | 127,585 | |
| | | | |
| | | | | | | | | | | | | | | 997,926 | |
| | | | | | | | | | | | | | | | |
| | | | |
| REITs: 0.46% | | | | | | | | | | | | | | | | |
ERP Operating LP | | | 5.25 | | | | 9-15-14 | | | | 150,000 | | | | 160,789 | |
| | | | | | | | | | | | | | | | |
| | | | |
Health Care: 0.46% | | | | | | | | | | | | | | | | |
| | | | |
| Pharmaceuticals: 0.46% | | | | | | | | | | | | | | | | |
Abbvie Incorporated 144A | | | 1.20 | | | | 11-6-15 | | | | 90,000 | | | | 90,402 | |
Sanofi-Aventis US LLC | | | 1.20 | | | | 9-30-14 | | | | 70,000 | | | | 70,850 | |
| | | | |
| | | | | | | | | | | | | | | 161,252 | |
| | | | | | | | | | | | | | | | |
| | | | |
Industrials: 1.92% | | | | | | | | | | | | | | | | |
| | | | |
| Aerospace & Defense: 0.54% | | | | | | | | | | | | | | | | |
Northrop Grumman Corporation | | | 3.70 | | | | 8-1-14 | | | | 180,000 | | | | 188,872 | |
| | | | | | | | | | | | | | | | |
| | | | |
| Building Products: 0.30% | | | | | | | | | | | | | | | | |
Ingersoll-Rand Global Holding Company Limited | | | 6.00 | | | | 8-15-13 | | | | 100,000 | | | | 103,771 | |
| | | | | | | | | | | | | | | | |
| | | | |
| Electrical Equipment: 0.62% | | | | | | | | | | | | | | | | |
General Electric Company | | | 0.85 | | | | 10-9-15 | | | | 60,000 | | | | 60,024 | |
General Electric Company | | | 5.00 | | | | 2-1-13 | | | | 155,000 | | | | 156,117 | |
| | | | |
| | | | | | | | | | | | | | | 216,141 | |
| | | | | | | | | | | | | | | | |
The accompanying notes are an integral part of these financial statements.
| | | | | | |
| Portfolio of investments—November 30, 2012 (unaudited) | | Wells Fargo Advantage Allocation Funds | | | 117 | |
STABLE INCOME PORTFOLIO
| | | | | | | | | | | | | | | | |
| Security name | | Interest rate | | | Maturity date | | | Principal | | | Value | |
| | | | | | | | | | | | | | | | |
| | | | |
| Road & Rail: 0.46% | | | | | | | | | | | | | | | | |
Union Pacific Corporation | | | 5.38 | % | | | 5-1-14 | | | $ | 150,000 | | | $ | 159,528 | |
| | | | | | | | | | | | | | | | |
| | | | |
Materials: 0.38% | | | | | | | | | | | | | | | | |
| | | | |
| Metals & Mining: 0.38% | | | | | | | | | | | | | | | | |
Alcan Incorporated | | | 5.20 | | | | 1-15-14 | | | | 125,000 | | | | 130,928 | |
| | | | | | | | | | | | | | | | |
| | | | |
Telecommunication Services: 0.98% | | | | | | | | | | | | | | | | |
| | | | |
| Diversified Telecommunication Services: 0.98% | | | | | | | | | | | | | | | | |
Verizon Communications Incorporated | | | 5.25 | | | | 4-15-13 | | | | 200,000 | | | | 203,465 | |
Verizon Wireless Corporation | | | 5.55 | | | | 2-1-14 | | | | 130,000 | | | | 136,870 | |
| | | | |
| | | | | | | | | | | | | | | 340,335 | |
| | | | | | | | | | | | | | | | |
| | | | |
Utilities: 2.15% | | | | | | | | | | | | | | | | |
| | | | |
| Electric Utilities: 1.76% | | | | | | | | | | | | | | | | |
Monongahela Power Company 144A | | | 7.95 | | | | 12-15-13 | | | | 85,000 | | | | 91,065 | |
Public Service Electric & Gas Company | | | 5.38 | | | | 9-1-13 | | | | 200,000 | | | | 207,198 | |
Union Electric Company | | | 4.65 | | | | 10-1-13 | | | | 150,000 | | | | 153,984 | |
Wisconsin Electric Power Company | | | 6.00 | | | | 4-1-14 | | | | 150,000 | | | | 160,754 | |
| | | | |
| | | | | | | | | | | | | | | 613,001 | |
| | | | | | | | | | | | | | | | |
| | | | |
| Gas Utilities: 0.39% | | | | | | | | | | | | | | | | |
Atmos Energy Corporation | | | 4.95 | | | | 10-15-14 | | | | 125,000 | | | | 134,442 | |
| | | | | | | | | | | | | | | | |
| | | | |
Total Corporate Bonds and Notes (Cost $7,905,948) | | | | | | | | | | | | | | | 7,932,987 | |
| | | | | | | | | | | | | | | | |
| | | | |
Loan Participation: 1.11% | | | | | | | | | | | | | | | | |
United States Department of Agriculture Loan (a) | | | 0.98 | | | | 6-25-16 | | | | 270,316 | | | | 270,883 | |
United States Department of Agriculture Loan (a) | | | 5.37 | | | | 9-8-19 | | | | 116,910 | | | | 116,197 | |
| | | | |
Total Loan Participation (Cost $385,364) | | | | | | | | | | | | | | | 387,080 | |
| | | | | | | | | | | | | | | | |
| | | | |
Municipal Obligations: 3.52% | | | | | | | | | | | | | | | | |
| | | | |
| Arkansas: 0.36% | | | | | | | | | | | | | | | | |
Arkansas State (GO) | | | 1.50 | | | | 7-1-13 | | | | 125,000 | | | | 125,701 | |
| | | | | | | | | | | | | | | | |
| | | | |
| California: 0.14% | | | | | | | | | | | | | | | | |
University of California Revenues Series AA-2 (Education Revenue) | | | 0.89 | | | | 7-1-13 | | | | 50,000 | | | | 50,123 | |
| | | | | | | | | | | | | | | | |
| | | | |
| Colorado: 0.30% | | | | | | | | | | | | | | | | |
Colorado State Build America Building Excellent Schools Series E (GO) | | | 3.73 | | | | 3-15-15 | | | | 100,000 | | | | 105,766 | |
| | | | | | | | | | | | | | | | |
| | | | |
| Illinois: 0.59% | | | | | | | | | | | | | | | | |
Cook County Ill School District #135 Series A (Education Revenue) | | | 4.75 | | | | 5-1-14 | | | | 100,000 | | | | 101,268 | |
Illinois State (GO) | | | 4.07 | | | | 1-1-14 | | | | 100,000 | | | | 103,264 | |
| | | | |
| | | | | | | | | | | | | | | 204,532 | |
| | | | | | | | | | | | | | | | |
| | | | |
| Maryland: 0.43% | | | | | | | | | | | | | | | | |
Frederick MD Series A (GO) | | | 2.00 | | | | 12-1-12 | | | | 150,000 | | | | 150,006 | |
| | | | | | | | | | | | | | | | |
The accompanying notes are an integral part of these financial statements.
| | | | |
| 118 | | Wells Fargo Advantage Allocation Funds | | Portfolio of investments—November 30, 2012 (unaudited) |
STABLE INCOME PORTFOLIO
| | | | | | | | | | | | | | | | |
| Security name | | Interest rate | | | Maturity date | | | Principal | | | Value | |
| | | | | | | | | | | | | | | | |
| | | | |
| Texas: 1.34% | | | | | | | | | | | | | | | | |
Brazos TX Higher Education Authority Incorporated Series 2011-2 Class A1 (Education Revenue) ± | | | 0.87 | % | | | 1-27-20 | | | $ | 48,857 | | | $ | 49,030 | |
Brazos TX Higher Education Authority Incorporated Series 2005-1 (GO) ± | | | 0.55 | | | | 12-26-18 | | | | 157,320 | | | | 157,029 | |
El Paso TX (GO) | | | 5.72 | | | | 8-15-13 | | | | 150,000 | | | | 155,571 | |
Galveston County TX Build America Bond (GO) | | | 3.01 | | | | 2-1-14 | | | | 100,000 | | | | 102,665 | |
| | | | |
| | | | | | | | | | | | | | | 464,295 | |
| | | | | | | | | | | | | | | | |
| | | | |
| Wisconsin: 0.36% | | | | | | | | | | | | | | | | |
Outagamie County WI Build America Bond (GO) | | | 2.50 | | | | 4-1-13 | | | | 125,000 | | | | 125,804 | |
| | | | | | | | | | | | | | | | |
| | | | |
Total Municipal Obligations (Cost $1,223,788) | | | | | | | | | | | | | | | 1,226,227 | |
| | | | | | | | | | | | | | | | |
| | | | |
Non-Agency Mortgage Backed Securities: 10.16% | | | | | | | | | | | | | | | | |
Bank of America Commercial Mortgage Incorporated Series 2005-1 Class A3 | | | 4.88 | | | | 11-10-42 | | | | 69,425 | | | | 69,391 | |
Bear Stearns Commercial Mortgage Securities Series 2005-PWR9 Class A2 | | | 4.74 | | | | 9-11-42 | | | | 157,872 | | | | 161,329 | |
CNH Equipment Trust Series 2012-C Class A3 | | | 0.57 | | | | 12-15-17 | | | | 175,000 | | | | 175,092 | |
| | | | | | | | | | | | | | | | |
Countrywide Home Loans Series 2004-R1 Class 1AF ±144A | | | 0.61 | | | | 11-25-34 | | | | 308,776 | | | | 259,995 | |
GE Capital Commercial Mortgage Corporation Series 2005-C3 Class A4 ± | | | 5.05 | | | | 7-10-45 | | | | 277,873 | | | | 277,881 | |
GE Dealer Floorplan Master Note Trust Series 2012-4 Class A ± | | | 0.65 | | | | 10-20-17 | | | | 175,000 | | | | 175,407 | |
GE Equipment Series 2012-1 Class A3 | | | 0.60 | | | | 5-23-16 | | | | 150,000 | | | | 150,169 | |
GE Equipment Series 2012-2 Class A2 | | | 0.47 | | | | 4-24-15 | | | | 225,000 | | | | 225,002 | |
GSMPS Mortgage Loan Trust Series 2004-4 Class 1AF ±144A | | | 0.61 | | | | 6-25-34 | | | | 312,519 | | | | 267,264 | |
JPMorgan Chase Commercial Mortgage Series 2010-C2 Class A1 144A | | | 2.75 | | | | 11-15-43 | | | | 154,184 | | | | 161,362 | |
SLMA Series 2012-7 Class A1 ± | | | 0.37 | | | | 2-27-17 | | | | 175,000 | | | | 174,932 | |
Structured Asset Securities Corporation Series 2004-NP2 Class A ±144A | | | 0.56 | | | | 6-25-34 | | | | 322,698 | | | | 286,371 | |
Structured Asset Securities Corporation Series 2006-RF3 Class 1A1 144A | | | 6.00 | | | | 10-25-36 | | | | 243,887 | | | | 241,578 | |
Structured Asset Securities Corporation Series 2006-RM1 Class A1 ±144A(a) | | | 0.46 | | | | 8-25-46 | | | | 322,474 | | | | 180,199 | |
Structured Asset Securities Corporation Series 2007-RM1 Class A1 ±144A(a) | | | 0.49 | | | | 5-25-47 | | | | 886,581 | | | | 495,422 | |
Washington Mutual Mortgage Pass-Through Certificates Series 2005-AR6 Class 2A1A ± | | | 0.44 | | | | 4-25-45 | | | | 250,204 | | | | 235,012 | |
| | | | |
Total Non-Agency Mortgage Backed Securities (Cost $4,206,156) | | | | | | | | | | | | | | | 3,536,406 | |
| | | | | | | | | | | | | | | | |
| | | | |
Yankee Corporate Bonds and Notes: 2.49% | | | | | | | | | | | | | | | | |
| | | | |
Consumer Discretionary: 0.52% | | | | | | | | | | | | | | | | |
| | | | |
| Media: 0.52% | | | | | | | | | | | | | | | | |
Thomson Reuters Corporation | | | 5.95 | | | | 7-15-13 | | | | 175,000 | | | | 180,615 | |
| | | | | | | | | | | | | | | | |
| | | | |
Energy: 0.53% | | | | | | | | | | | | | | | | |
| | | | |
| Oil, Gas & Consumable Fuels: 0.53% | | | | | | | | | | | | | | | | |
Shell International Finance BV | | | 4.00 | | | | 3-21-14 | | | | 175,000 | | | | 182,845 | |
| | | | | | | | | | | | | | | | |
| | | | |
Financials: 0.72% | | | | | | | | | | | | | | | | |
| | | | |
| Commercial Banks: 0.29% | | | | | | | | | | | | | | | | |
Royal Bank of Canada | | | 0.80 | | | | 10-30-15 | | | | 100,000 | | | | 99,988 | |
| | | | | | | | | | | | | | | | |
| | | | |
| Diversified Financial Services: 0.43% | | | | | | | | | | | | | | | | |
Diageo Capital plc | | | 5.20 | | | | 1-30-13 | | | | 150,000 | | | | 151,107 | |
| | | | | | | | | | | | | | | | |
The accompanying notes are an integral part of these financial statements.
| | | | | | |
| Portfolio of investments—November 30, 2012 (unaudited) | | Wells Fargo Advantage Allocation Funds | | | 119 | |
STABLE INCOME PORTFOLIO
| | | | | | | | | | | | | | | | |
| Security name | | Interest rate | | | Maturity date | | | Principal | | | Value | |
| | | | | | | | | | | | | | | | |
| | | | |
Health Care: 0.72% | | | | | | | | | | | | | | | | |
| | | | |
| Health Care Equipment & Supplies: 0.72% | | | | | | | | | | | | | | | | |
Covidien International Finance SA | | | 1.88 | % | | | 6-15-13 | | | $ | 250,000 | | | $ | 251,809 | |
| | | | | | | | | | | | | | | | |
| | | | |
Total Yankee Corporate Bonds and Notes (Cost $864,389) | | | | | | | | | | | | | | | 866,364 | |
| | | | | | | | | | | | | | | | |
| | | | |
Other: 0.11% | | | | | | | | | | | | | | | | |
Gryphon Funding Limited, Pass-Through Entity (v)(a)(i) | | | | | | | | | | | 119,260 | | | | 39,356 | |
| | | | |
Total Other (Cost $11,300) | | | | | | | | | | | | | | | 39,356 | |
| | | | | | | | | | | | | | | | |
| | | | |
| | | Yield | | | | | | Shares | | | | |
| Short-Term Investments: 8.48% | | | | | | | | | | | | | | | | |
| | | | |
| Investment Companies: 8.48% | | | | | | | | | | | | | | | | |
Wells Fargo Advantage Cash Investment Money Market Fund, Select Class (l)(u) | | | 0.16 | | | | | | | | 2,857,608 | | | | 2,857,608 | |
| | | | | | | | | | | | | | | | |
Wells Fargo Securities Lending Cash Investments, LLC (v)(l)(u)(r) | | | 0.21 | | | | | | | | 91,700 | | | | 91,700 | |
| | | | |
Total Short-Term Investments (Cost $2,949,308) | | | | | | | | | | | | | | | 2,949,308 | |
| | | | | | | | | | | | | | | | |
| | | | | | | | |
Total investments in securities
(Cost $34,836,462)* | | | 99.92 | % | | | 34,768,663 | |
Other assets and liabilities, net | | | 0.08 | | | | 27,269 | |
| | | | | | | | |
| Total net assets | | | 100.00 | % | | $ | 34,795,932 | |
| | | | | | | | |
| ± | Variable rate investment |
| 144A | Security that may be resold to “qualified institutional buyers” under Rule 144A or security offered pursuant to Section 4(2) of the Securities Act of 1933, as amended. |
| « | All or a portion of this security is on loan. |
| (a) | Security is fair valued by the Management Valuation Team, and in certain instances by the Board of Trustees, in accordance with procedures approved by the Board of Trustees. |
| (v) | Security represents investment of cash collateral received from securities on loan. |
| (l) | Investment in an affiliate |
| (u) | Rate shown is the 7-day annualized yield at period end. |
| (r) | The investment company is exempt from registration under Section 3(c)(7) of the Investment Company Act of 1940, as amended. |
| * | Cost for federal income tax purposes is $35,037,092 and unrealized appreciation (depreciation) consists of: |
| | | | |
Gross unrealized appreciation | | $ | 659,460 | |
Gross unrealized depreciation | | | (927,889 | ) |
| | | | |
Net unrealized depreciation | | $ | (268,429 | ) |
The accompanying notes are an integral part of these financial statements.
| | | | |
| 120 | | Wells Fargo Advantage Allocation Funds | | Statements of assets and liabilities—November 30, 2012 (unaudited) |
| | | | | | | | |
| | | C&B Large Cap
Value Portfolio | | | Diversified Large
Cap Growth
Portfolio | |
| | |
Assets | | | | | | | | |
Investments | | | | | | | | |
In unaffiliated securities (including securities on loan), at value (see cost below) | | $ | 314,241,370 | | | $ | 147,623,637 | |
In affiliated securities, at value (see cost below) | | | 56,278,567 | | | | 32,104,781 | |
| | | | | | | | |
Total investments, at value (see cost below) | | | 370,519,937 | | | | 179,728,418 | |
Segregated cash | | | 0 | | | | 0 | |
Foreign currency, at value (see cost below) | | | 0 | | | | 0 | |
Receivable for investments sold | | | 2,574,193 | | | | 304,302 | |
Receivable for dividends | | | 880,848 | | | | 141,469 | |
Receivable for securities lending income | | | 5,066 | | | | 2,773 | |
Prepaid expenses and other assets | | | 3,633 | | | | 2,878 | |
| | | | | | | | |
Total assets | | | 373,983,677 | | | | 180,179,840 | |
| | | | | | | | |
| | |
Liabilities | | | | | | | | |
Payable for investments purchased | | | 341,243 | | | | 304,171 | |
Payable upon receipt of securities loaned | | | 54,606,225 | | | | 30,875,950 | |
Payable for daily variation margin on open futures contracts | | | 0 | | | | 0 | |
Due to custodian bank | | | 0 | | | | 0 | |
Advisory fee payable | | | 172,277 | | | | 9,890 | |
Shareholder report expenses payable | | | 6,073 | | | | 16,239 | |
Custodian and accounting fees payable | | | 7,970 | | | | 5,346 | |
Professional fees payable | | | 3,025 | | | | 4,504 | |
Accrued expenses and other liabilities | | | 526 | | | | 571 | |
| | | | | | | | |
Total liabilities | | | 55,137,339 | | | | 31,216,671 | |
| | | | | | | | |
Total net assets | | $ | 318,846,338 | | | $ | 148,963,169 | |
| | | | | | | | |
| | |
Investments in unaffiliated securities, at cost | | $ | 267,842,365 | | | $ | 125,285,725 | |
| | | | | | | | |
Investments in affiliated securities, at cost | | $ | 56,278,567 | | | $ | 32,104,781 | |
| | | | | | | | |
Total investments, at cost | | $ | 324,120,932 | | | $ | 157,390,506 | |
| | | | | | | | |
Securities on loan, at value | | $ | 53,355,470 | | | $ | 30,222,297 | |
| | | | | | | | |
Foreign currency, at cost | | $ | 0 | �� | | $ | 0 | |
| | | | | | | | |
The accompanying notes are an integral part of these financial statements.
| | | | | | |
| Statements of assets and liabilities—November 30, 2012 (unaudited) | | Wells Fargo Advantage Allocation Funds | | | 121 | |
| | | | | | | | | | | | | | | | | | | | | | |
Emerging Growth
Portfolio | | | Equity Value
Portfolio | | | Index Portfolio | | | International
Equity Portfolio | | | International
Growth Portfolio | | | International Index
Portfolio | |
| | | | | |
| | | | | | | | | | | | | | | | | | | | | | |
| | | | | | | | | | | | | | | | | | | | | | |
| $ | 912,857,004 | | | $ | 863,969,397 | | | $ | 2,437,600,799 | | | $ | 21,988,461 | | | $ | 110,248,366 | | | $ | 22,117,106 | |
| | 302,158,840 | | | | 66,277,761 | | | | 229,955,859 | | | | 1,404,043 | | | | 8,070,164 | | | | 452,217 | |
| | | | | | | | | | | | | | | | | | | | | | |
| | 1,215,015,844 | | | | 930,247,158 | | | | 2,667,556,658 | | | | 23,392,504 | | | | 118,318,530 | | | | 22,569,323 | |
| | 0 | | | | 0 | | | | 0 | | | | 0 | | | | 0 | | | | 56,719 | |
| | 0 | | | | 0 | | | | 0 | | | | 31,369 | | | | 79,767 | | | | 122,441 | |
| | 6,609,167 | | | | 3,896,665 | | | | 228,975 | | | | 369,648 | | | | 777,960 | | | | 192,076 | |
| | 425,881 | | | | 2,368,567 | | | | 6,750,079 | | | | 34,290 | | | | 185,276 | | | | 83,879 | |
| | 67,960 | | | | 32,604 | | | | 35,543 | | | | 62 | | | | 8,287 | | | | 872 | |
| | 19,566 | | | | 10,694 | | | | 24,257 | | | | 1,352 | | | | 3,749 | | | | 1,631 | |
| | | | | | | | | | | | | | | | | | | | | | |
| | 1,222,138,418 | | | | 936,555,688 | | | | 2,674,595,512 | | | | 23,829,225 | | | | 119,373,569 | | | | 23,026,941 | |
| | | | | | | | | | | | | | | | | | | | | | |
| | | | | |
| | | | | | | | | | | | | | | | | | | | | | |
| | 8,163,459 | | | | 7,207,793 | | | | 3,160,896 | | | | 375,737 | | | | 682,524 | | | | 125,572 | |
| | 288,017,255 | | | | 54,250,075 | | | | 159,683,023 | | | | 1,076,691 | | | | 6,985,505 | | | | 452,217 | |
| | 0 | | | | 0 | | | | 46,445 | | | | 0 | | | | 0 | | | | 725 | |
| | 0 | | | | 0 | | | | 0 | | | | 0 | | | | 0 | | | | 18,080 | |
| | 633,423 | | | | 491,179 | | | | 151,498 | | | | 12,547 | | | | 80,384 | | | | 5,651 | |
| | 6,475 | | | | 15,548 | | | | 2,884 | | | | 8,278 | | | | 2,287 | | | | 986 | |
| | 26,474 | | | | 12,835 | | | | 48,034 | | | | 5,174 | | | | 15,217 | | | | 43,743 | |
| | 0 | | | | 4,740 | | | | 0 | | | | 798 | | | | 784 | | | | 13,853 | |
| | 0 | | | | 4,853 | | | | 0 | | | | 1,026 | | | | 0 | | | | 2,963 | |
| | | | | | | | | | | | | | | | | | | | | | |
| | 296,847,086 | | | | 61,987,023 | | | | 163,092,780 | | | | 1,480,251 | | | | 7,766,701 | | | | 663,790 | |
| | | | | | | | | | | | | | | | | | | | | | |
| $ | 925,291,332 | | | $ | 874,568,665 | | | $ | 2,511,502,732 | | | $ | 22,348,974 | | | $ | 111,606,868 | | | $ | 22,363,151 | |
| | | | | | | | | | | | | | | | | | | | | | |
| | | | | |
| $ | 842,876,465 | | | $ | 772,348,290 | | | $ | 1,896,543,848 | | | $ | 21,945,178 | | | $ | 94,369,009 | | | $ | 20,341,392 | |
| | | | | | | | | | | | | | | | | | | | | | |
| $ | 302,158,840 | | | $ | 66,277,761 | | | $ | 235,028,435 | | | $ | 1,404,043 | | | $ | 8,070,164 | | | $ | 452,217 | |
| | | | | | | | | | | | | | | | | | | | | | |
| $ | 1,145,035,305 | | | $ | 838,626,051 | | | $ | 2,131,572,283 | | | $ | 23,349,221 | | | $ | 102,439,173 | | | $ | 20,793,609 | |
| | | | | | | | | | | | | | | | | | | | | | |
| $ | 281,093,012 | | | $ | 53,033,429 | | | $ | 159,264,483 | | | $ | 1,047,799 | | | $ | 6,818,375 | | | $ | 429,599 | |
| | | | | | | | | | | | | | | | | | | | | | |
| $ | 0 | | | $ | 0 | | | $ | 0 | | | $ | 31,427 | | | $ | 80,082 | | | $ | 121,310 | |
| | | | | | | | | | | | | | | | | | | | | | |
The accompanying notes are an integral part of these financial statements.
| | | | |
| 122 | | Wells Fargo Advantage Allocation Funds | | Statements of assets and liabilities—November 30, 2012 (unaudited) |
| | | | | | | | |
| | | International Value
Portfolio | | | Large Company
Value Portfolio | |
| | |
Assets | | | | | | | | |
Investments | | | | | | | | |
In unaffiliated securities (including securities on loan), at value (see cost below) | | $ | 351,241,847 | | | $ | 46,404,692 | |
In affiliated securities, at value (see cost below) | | | 14,596,984 | | | | 6,071,437 | |
| | | | | | | | |
Total investments, at value (see cost below) | | | 365,838,831 | | | | 52,476,129 | |
Foreign currency, at value (see cost below) | | | 5,519,698 | | | | 0 | |
Receivable for investments sold | | | 336,991 | | | | 262,353 | |
Receivable for dividends | | | 1,338,768 | | | | 158,260 | |
Receivable for securities lending income | | | 9,636 | | | | 670 | |
Prepaid expenses and other assets | | | 9,946 | | | | 2,165 | |
| | | | | | | | |
Total assets | | | 373,053,870 | | | | 52,899,577 | |
| | | | | | | | |
| | |
Liabilities | | | | | | | | |
Payable for investments purchased | | | 70,004 | | | | 0 | |
Payable upon receipt of securities loaned | | | 13,117,922 | | | | 4,019,275 | |
Advisory fee payable | | | 263,355 | | | | 10,741 | |
Shareholder report expenses payable | | | 7,889 | | | | 7,718 | |
Custodian and accounting fees payable | | | 27,010 | | | | 9,921 | |
Professional fees payable | | | 4,789 | | | | 4,128 | |
| | | | | | | | |
Total liabilities | | | 13,490,969 | | | | 4,051,783 | |
| | | | | | | | |
Total net assets | | $ | 359,562,901 | | | $ | 48,847,794 | |
| | | | | | | | |
| | |
Investments in unaffiliated securities, at cost | | $ | 392,800,721 | | | $ | 41,079,366 | |
| | | | | | | | |
Investments in affiliated securities, at cost | | $ | 14,596,984 | | | $ | 6,071,437 | |
| | | | | | | | |
Total investments, at cost | | $ | 407,397,705 | | | $ | 47,150,803 | |
| | | | | | | | |
Securities on loan, at value | | $ | 12,488,034 | | | $ | 3,928,660 | |
| | | | | | | | |
Foreign currency, at cost | | $ | 5,524,646 | | | $ | 0 | |
| | | | | | | | |
The accompanying notes are an integral part of these financial statements.
| | | | | | |
| Statements of assets and liabilities—November 30, 2012 (unaudited) | | Wells Fargo Advantage Allocation Funds | | | 123 | |
| | | | | | | | | | |
Small Cap Value
Portfolio | | | Small Company
Growth Portfolio | | | Small Company
Value Portfolio | |
| | |
| | | | | | | | | | |
| | | | | | | | | | |
| $ | 15,854,105 | | | $ | 128,160,978 | | | $ | 166,739,762 | |
| | 608,030 | | | | 41,516,509 | | | | 60,179,670 | |
| | | | | | | | | | |
| | 16,462,135 | | | | 169,677,487 | | | | 226,919,432 | |
| | 0 | | | | 0 | | | | 0 | |
| | 35,061 | | | | 1,202,228 | | | | 2,456,204 | |
| | 11,770 | | | | 373,812 | | | | 199,873 | |
| | 0 | | | | 7,791 | | | | 9,997 | |
| | 2,507 | | | | 4,005 | | | | 5,949 | |
| | | | | | | | | | |
| | 16,511,473 | | | | 171,265,323 | | | | 229,591,455 | |
| | | | | | | | | | |
| | |
| | | | | | | | | | |
| | 4,222 | | | | 371,731 | | | | 3,275,203 | |
| | 0 | | | | 38,307,239 | | | | 55,971,754 | |
| | 6,285 | | | | 77,448 | | | | 110,560 | |
| | 9,128 | | | | 10,116 | | | | 5,193 | |
| | 3,330 | | | | 5,365 | | | | 8,216 | |
| | 2,989 | | | | 3,592 | | | | 0 | |
| | | | | | | | | | |
| | 25,954 | | | | 38,775,491 | | | | 59,370,926 | |
| | | | | | | | | | |
| $ | 16,485,519 | | | $ | 132,489,832 | | | $ | 170,220,529 | |
| | | | | | | | | | |
| | |
| $ | 10,886,200 | | | $ | 110,729,389 | | | $ | 154,185,808 | |
| | | | | | | | | | |
| $ | 608,030 | | | $ | 41,516,509 | | | $ | 60,179,670 | |
| | | | | | | | | | |
| $ | 11,494,230 | | | $ | 152,245,898 | | | $ | 214,365,478 | |
| | | | | | | | | | |
| $ | 0 | | | $ | 37,261,537 | | | $ | 54,329,713 | |
| | | | | | | | | | |
| $ | 0 | | | $ | 0 | | | $ | 0 | |
| | | | | | | | | | |
The accompanying notes are an integral part of these financial statements.
| | | | |
| 124 | | Wells Fargo Advantage Allocation Funds | | Statements of assets and liabilities—November 30, 2012 (unaudited) |
| | | | | | | | |
| | | Core Bond Portfolio | | | Inflation-Protected
Bond Portfolio | |
| | |
Assets | | | | | | | | |
Investments | | | | | | | | |
In unaffiliated securities (including securities on loan), at value (see cost below) | | $ | 3,942,779,723 | | | $ | 80,121,231 | |
In affiliated securities, at value (see cost below) | | | 282,043,866 | | | | 2,421,974 | |
| | | | | | | | |
Total investments, at value (see cost below) | | | 4,224,823,589 | | | | 82,543,205 | |
Segregated cash | | | 0 | | | | 0 | |
Receivable for investments sold | | | 748,510,282 | | | | 0 | |
Principal paydown receivable | | | 106 | | | | 0 | |
Receivable for interest | | | 16,945,446 | | | | 342,975 | |
Receivable for securities lending income | | | 979 | | | | 0 | |
Premiums paid on credit default swap transactions | | | 688,002 | | | | 0 | |
Unrealized gains on credit default swap transactions | | | 85,825 | | | | 0 | |
Prepaid expenses and other assets | | | 22,449 | | | | 1,255 | |
| | | | | | | | |
Total assets | | | 4,991,076,678 | | | | 82,887,435 | |
| | | | | | | | |
| | |
Liabilities | | | | | | | | |
Payable for investments purchased | | | 1,224,692,741 | | | | 0 | |
Unrealized losses on credit default swap transactions | | | 613,082 | | | | 0 | |
Premiums received on credit default swap transactions | | | 114,158 | | | | 0 | |
Payable upon receipt of securities loaned | | | 81,197,350 | | | | 1,830,000 | |
Payable for daily variation margin on open futures contracts | | | 0 | | | | 0 | |
Advisory fee payable | | | 1,092,278 | | | | 25,555 | |
Shareholder report expenses payable | | | 8,414 | | | | 4,767 | |
Professional fees payable | | | 32,092 | | | | 3,901 | |
Accrued expenses and other liabilities | | | 85,722 | | | | 3,391 | |
| | | | | | | | |
Total liabilities | | | 1,307,835,837 | | | | 1,867,614 | |
| | | | | | | | |
Total net assets | | $ | 3,683,240,841 | | | $ | 81,019,821 | |
| | | | | | | | |
| | |
Investments in unaffiliated securities, at cost | | $ | 3,862,049,305 | | | $ | 69,669,596 | |
| | | | | | | | |
Investments in affiliated securities, at cost | | $ | 282,043,866 | | | $ | 2,421,974 | |
| | | | | | | | |
Total investments, at cost | | $ | 4,144,093,171 | | | $ | 72,091,570 | |
| | | | | | | | |
Securities on loan, at value | | $ | 79,589,138 | | | $ | 1,791,605 | |
| | | | | | | | |
The accompanying notes are an integral part of these financial statements.
| | | | | | |
| Statements of assets and liabilities—November 30, 2012 (unaudited) | | Wells Fargo Advantage Allocation Funds | | | 125 | |
| | | | | | |
Managed Fixed
Income Portfolio | | | Stable Income
Portfolio | |
| |
| | | | | | |
| | | | | | |
| $ | 119,568,379 | | | $ | 31,819,355 | |
| | 4,529,209 | | | | 2,949,308 | |
| | | | | | |
| | 124,097,588 | | | | 34,768,663 | |
| | 0 | | | | 11,000 | |
| | 1,295,286 | | | | 0 | |
| | 0 | | | | 0 | |
| | 880,837 | | | | 142,574 | |
| | 0 | | | | 0 | |
| | 0 | | | | 0 | |
| | 0 | | | | 0 | |
| | 0 | | | | 2,052 | |
| | | | | | |
| | 126,273,711 | | | | 34,924,289 | |
| | | | | | |
| |
| | | | | | |
| | 4,202,060 | | | | 0 | |
| | 0 | | | | 0 | |
| | 0 | | | | 0 | |
| | 599,375 | | | | 103,000 | |
| | 0 | | | | 1,719 | |
| | 34,004 | | | | 6,097 | |
| | 7,465 | | | | 6,529 | |
| | 15,025 | | | | 7,914 | |
| | 4,367 | | | | 3,098 | |
| | | | | | |
| | 4,862,296 | | | | 128,357 | |
| | | | | | |
| $ | 121,411,415 | | | $ | 34,795,932 | |
| | | | | | |
| |
| $ | 118,178,261 | | | $ | 31,887,154 | |
| | | | | | |
| $ | 4,529,209 | | | $ | 2,949,308 | |
| | | | | | |
| $ | 122,707,470 | | | $ | 34,836,462 | |
| | | | | | |
| $ | 586,949 | | | $ | 100,869 | |
| | | | | | |
The accompanying notes are an integral part of these financial statements.
| | | | |
| 126 | | Wells Fargo Advantage Allocation Funds | | Statements of operations—six months ended November 30, 2012 (unaudited) |
| | | | | | | | |
| | | C&B Large Cap
Value Portfolio | | | Diversified Large
Cap Growth
Portfolio | |
| | |
Investment income | | | | | | | | |
Dividends * | | $ | 4,422,672 | | | $ | 723,968 | |
Securities lending income, net | | | 34,742 | | | | 21,799 | |
Income from affiliated securities | | | 3,892 | | | | 2,864 | |
Interest | | | 0 | | | | 0 | |
| | | | | | | | |
Total investment income | | | 4,461,306 | | | | 748,631 | |
| | | | | | | | |
| | |
Expenses | | | | | | | | |
Advisory fee | | | 1,085,831 | | | | 500,408 | |
Custody and accounting fees | | | 12,834 | | | | 12,168 | |
Professional fees | | | 15,723 | | | | 17,412 | |
Shareholder report expenses | | | 3,215 | | | | 6,096 | |
Trustees’ fees and expenses | | | 5,639 | | | | 5,330 | |
Other fees and expenses | | | 5,962 | | | | 3,858 | |
| | | | | | | | |
Total expenses | | | 1,129,204 | | | | 545,272 | |
Less: Fee waivers and/or expense reimbursements | | | 0 | | | | (66,296 | ) |
| | | | | | | | |
Net expenses | | | 1,129,204 | | | | 478,976 | |
| | | | | | | | |
Net investment income (loss) | | | 3,332,102 | | | | 269,655 | |
| | | | | | | | |
| | |
REALIZED AND UNREALIZED GAINS (LOSSES) ON INVESTMENTS | | | | | | | | |
| | |
Net realized gains (losses) on: | | | | | | | | |
Unaffiliated securities | | | 8,138,075 | | | | 5,955,510 | |
Affiliated securities | | | 0 | | | | 0 | |
Futures transactions | | | 0 | | | | 0 | |
| | | | | | | | |
Net realized gain (losses) on investments | | | 8,138,075 | | | | 5,955,510 | |
| | | | | | | | |
| | |
Net change in unrealized gains (losses) on: | | | | | | | | |
Unaffiliated securities | | | 10,511,841 | | | | 4,673,812 | |
Affiliated securities | | | 0 | | | | 0 | |
Futures transactions | | | 0 | | | | 0 | |
| | | | | | | | |
Net change in unrealized gains (losses) on investments | | | 10,511,841 | | | | 4,673,812 | |
| | | | | | | | |
Net realized and unrealized gains (losses) on investments | | | 18,649,916 | | | | 10,629,322 | |
| | | | | | | | |
Net increase in net assets resulting from operations | | $ | 21,982,018 | | | $ | 10,898,977 | |
| | | | | | | | |
| | |
* Net of foreign dividend withholding taxes in the amount of | | | $10,951 | | | | $0 | |
The accompanying notes are an integral part of these financial statements.
| | | | | | |
| Statements of operations—six months ended November 30, 2012 (unaudited) | | Wells Fargo Advantage Allocation Funds | | | 127 | |
| | | | | | | | | | | | | | | | | | | | | | |
Emerging Growth
Portfolio | | | Equity Value
Portfolio | | | Index Portfolio | | | International
Equity Portfolio | | | International
Growth Portfolio | | | International Index
Portfolio | |
| | | | | |
| | | | | | | | | | | | | | | | | | | | | | |
| $ | 1,234,732 | | | $ | 11,626,547 | | | $ | 28,674,889 | | | $ | 278,824 | | | $ | 992,353 | | | $ | 286,318 | |
| | 630,528 | | | | 100,517 | | | | 189,295 | | | | 16,031 | | | | 26,343 | | | | 9,673 | |
| | 20,389 | | | | 9,963 | | | | 23,948 | | | | 553 | | | | 1,270 | | | | 97 | |
| | 0 | | | | 0 | | | | 1,227 | | | | 0 | | | | 0 | | | | 62 | |
| | | | | | | | | | | | | | | | | | | | | | |
| | 1,885,649 | | | | 11,737,027 | | | | 28,889,359 | | | | 295,408 | | | | 1,019,966 | | | | 296,150 | |
| | | | | | | | | | | | | | | | | | | | | | |
| | | | | |
| | | | | | | | | | | | | | | | | | | | | | |
| | 4,001,516 | | | | 3,207,890 | | | | 1,073,585 | | | | 97,880 | | | | 480,743 | | | | 40,547 | |
| | 26,807 | | | | 34,090 | | | | 72,106 | | | | 21,609 | | | | 52,951 | | | | 46,864 | |
| | 14,967 | | | | 13,792 | | | | 14,861 | | | | 21,852 | | | | 22,052 | | | | 19,795 | |
| | 44 | | | | 8,854 | | | | 2,860 | | | | 3,049 | | | | 1,158 | | | | 500 | |
| | 5,554 | | | | 4,586 | | | | 5,937 | | | | 6,364 | | | | 6,209 | | | | 6,000 | |
| | 10,356 | | | | 11,497 | | | | 30,989 | | | | 10,592 | | | | 8,316 | | | | 13,300 | |
| | | | | | | | | | | | | | | | | | | | | | |
| | 4,059,244 | | | | 3,280,709 | | | | 1,200,338 | | | | 161,346 | | | | 571,429 | | | | 127,006 | |
| | 0 | | | | 0 | | | | 0 | | | | (3,681 | ) | | | 0 | | | | (82,550 | ) |
| | | | | | | | | | | | | | | | | | | | | | |
| | 4,059,244 | | | | 3,280,709 | | | | 1,200,338 | | | | 157,665 | | | | 571,429 | | | | 44,456 | |
| | | | | | | | | | | | | | | | | | | | | | |
| | (2,173,595 | ) | | | 8,456,318 | | | | 27,689,021 | | | | 137,743 | | | | 448,537 | | | | 251,694 | |
| | | | | | | | | | | | | | | | | | | | | | |
| | | | | |
| | | | | | | | | | | | | | | | | | | | | | |
| | | | | |
| | | | | | | | | | | | | | | | | | | | | | |
| | (797,899 | ) | | | 58,679,308 | | | | 16,762,715 | | | | (1,002,622 | ) | | | 1,430,375 | | | | 73,839 | |
| | 0 | | | | 0 | | | | 99,964 | | | | 0 | | | | 0 | | | | 0 | |
| | 0 | | | | 0 | | | | 1,203,623 | | | | 0 | | | | 0 | | | | (630 | ) |
| | | | | | | | | | | | | | | | | | | | | | |
| | (797,899 | ) | | | 58,679,308 | | | | 18,066,302 | | | | (1,002,622 | ) | | | 1,430,375 | | | | 73,209 | |
| | | | | | | | | | | | | | | | | | | | | | |
| | | | | |
| | | | | | | | | | | | | | | | | | | | | | |
| | 18,194,585 | | | | 40,745,358 | | | | 169,262,372 | | | | 3,765,667 | | | | 15,357,500 | | | | 3,385,228 | |
| | 0 | | | | 0 | | | | 1,030,931 | | | | 0 | | | | 0 | | | | 0 | |
| | 0 | | | | 0 | | | | 1,852,223 | | | | 0 | | | | 0 | | | | 90,369 | |
| | | | | | | | | | | | | | | | | | | | | | |
| | 18,194,585 | | | | 40,745,358 | | | | 172,145,526 | | | | 3,765,667 | | | | 15,357,500 | | | | 3,475,597 | |
| | | | | | | | | | | | | | | | | | | | | | |
| | 17,396,686 | | | | 99,424,666 | | | | 190,211,828 | | | | 2,763,045 | | | | 16,787,875 | | | | 3,548,806 | |
| | | | | | | | | | | | | | | | | | | | | | |
| $ | 15,223,091 | | | $ | 107,880,984 | | | $ | 217,900,849 | | | $ | 2,900,788 | | | $ | 17,236,412 | | | $ | 3,800,500 | |
| | | | | | | | | | | | | | | | | | | | | | |
| | | | | |
| | $4,308 | | | | $120,580 | | | | $31,372 | | | | $24,092 | | | | $63,091 | | | | $16,393 | |
The accompanying notes are an integral part of these financial statements.
| | | | |
| 128 | | Wells Fargo Advantage Allocation Funds | | Statements of operations—six months ended November 30, 2012 (unaudited) |
| | | | | | | | |
| | | International Value
Portfolio | | | Large Company
Value Portfolio | |
| | |
Investment income | | | | | | | | |
Dividends * | | $ | 4,477,633 | | | $ | 681,081 | |
Securities lending income, net | | | 171,830 | | | | 2,540 | |
Income from affiliated securities | | | 3,669 | | | | 1,064 | |
Interest | | | 1,948 | | | | 0 | |
| | | | | | | | |
Total investment income | | | 4,655,080 | | | | 684,685 | |
| | | | | | | | |
| | |
Expenses | | | | | | | | |
Advisory fee | | | 1,395,246 | | | | 167,310 | |
Custody and accounting fees | | | 39,889 | | | | 7,114 | |
Professional fees | | | 17,769 | | | | 17,791 | |
Shareholder report expenses | | | 3,868 | | | | 3,191 | |
Trustees’ fees and expenses | | | 6,320 | | | | 5,898 | |
Other fees and expenses | | | 15,542 | | | | 2,018 | |
| | | | | | | | |
Total expenses | | | 1,478,634 | | | | 203,322 | |
Less: Fee waivers and/or expense reimbursements | | | 0 | | | | (13,258 | ) |
| | | | | | | | |
Net expenses | | | 1,478,634 | | | | 190,064 | |
| | | | | | | | |
Net investment income | | | 3,176,446 | | | | 494,621 | |
| | | | | | | | |
| | |
REALIZED AND UNREALIZED GAINS (LOSSES) ON INVESTMENTS | | | | | | | | |
Net realized gain (losses) on investments | | | (2,196,456 | ) | | | 2,105,222 | |
Net change in unrealized gains (losses) on investments | | | 48,749,844 | | | | 1,500,178 | |
| | | | | | | | |
Net realized and unrealized gains (losses) on investments | | | 46,553,388 | | | | 3,605,400 | |
| | | | | | | | |
Net increase in net assets resulting from operations | | $ | 49,729,834 | | | $ | 4,100,021 | |
| | | | | | | | |
| | |
* Net of foreign dividend withholding taxes in the amount of | | | $292,144 | | | | $1,111 | |
The accompanying notes are an integral part of these financial statements.
| | | | | | |
| Statements of operations—six months ended November 30, 2012 (unaudited) | | Wells Fargo Advantage Allocation Funds | | | 129 | |
| | | | | | | | | | |
Small Cap Value
Portfolio | | | Small Company
Growth Portfolio | | | Small Company
Value Portfolio | |
| | |
| | | | | | | | | | |
| $ | 324,069 | | | $ | 668,169 | | | $ | 1,382,218 | |
| | 0 | | | | 20,958 | | | | 70,872 | |
| | 2,116 | | | | 4,396 | | | | 4,200 | |
| | 0 | | | | 0 | | | | 0 | |
| | | | | | | | | | |
| | 326,185 | | | | 693,523 | | | | 1,457,290 | |
| | | | | | | | | | |
| | |
| | | | | | | | | | |
| | 169,336 | | | | 640,815 | | | | 797,538 | |
| | 7,680 | | | | 11,501 | | | | 13,518 | |
| | 16,530 | | | | 16,856 | | | | 16,580 | |
| | 3,186 | | | | 4,098 | | | | 2,146 | |
| | 6,251 | | | | 6,233 | | | | 6,066 | |
| | 2,821 | | | | 6,061 | | | | 6,190 | |
| | | | | | | | | | |
| | 205,804 | | | | 685,564 | | | | 842,038 | |
| | (12,041 | ) | | | (79 | ) | | | 0 | |
| | | | | | | | | | |
| | 193,763 | | | | 685,485 | | | | 842,038 | |
| | | | | | | | | | |
| | 132,422 | | | | 8,038 | | | | 615,252 | |
| | | | | | | | | | |
| | |
| | | | | | | | | | |
| | 3,788,147 | | | | 5,166,264 | | | | 5,485,956 | |
| | 1,495,116 | | | | 6,566,887 | | | | 7,055,601 | |
| | | | | | | | | | |
| | 5,283,263 | | | | 11,733,151 | | | | 12,541,557 | |
| | | | | | | | | | |
| $ | 5,415,685 | | | $ | 11,741,189 | | | $ | 13,156,809 | |
| | | | | | | | | | |
| | |
| | $1,499 | | | | $2,217 | | | | $0 | |
The accompanying notes are an integral part of these financial statements.
| | | | |
| 130 | | Wells Fargo Advantage Allocation Funds | | Statements of operations—six months ended November 30, 2012 (unaudited) |
| | | | | | | | |
| | | Core Bond
Portfolio | | | Inflation-Protected
Bond Portfolio | |
| | |
Investment income | | | | | | | | |
Interest* | | $ | 42,261,155 | | | $ | 971,179 | |
Income from affiliated securities | | | 141,561 | | | | 38 | |
Securities lending income, net | | | 48,519 | | | | 4,719 | |
| | | | | | | | |
Total investment income | | | 42,451,235 | | | | 975,936 | |
| | | | | | | | |
| | |
Expenses | | | | | | | | |
Advisory fee | | | 7,031,048 | | | | 166,149 | |
Custody and accounting fees | | | 118,909 | | | | 5,404 | |
Professional fees | | | 29,310 | | | | 16,963 | |
Shareholder report expenses | | | 8,503 | | | | 936 | |
Trustees’ fees and expenses | | | 6,233 | | | | 5,855 | |
Other fees and expenses | | | 29,242 | | | | 4,419 | |
| | | | | | | | |
Total expenses | | | 7,223,245 | | | | 199,726 | |
Less: Fee waivers and/or expense reimbursements | | | (281,318 | ) | | | (17,545 | ) |
| | | | | | | | |
Net expenses | | | 6,941,927 | | | | 182,181 | |
| | | | | | | | |
Net investment income | | | 35,509,308 | | | | 793,755 | |
| | | | | | | | |
| | |
REALIZED AND UNREALIZED GAINS (LOSSES) ON INVESTMENTS | | | | | | | | |
| | |
Net realized gains (losses) on: | | | | | | | | |
Unaffiliated securities | | | 108,340,648 | | | | 1,936,141 | |
Futures transactions | | | 0 | | | | 0 | |
Credit default swap transactions | | | (40,717 | ) | | | 0 | |
TBA sale commitments | | | (355,719 | ) | | | 0 | |
| | | | | | | | |
Net realized gains on investments | | | 107,944,212 | | | | 1,936,141 | |
| | | | | | | | |
| | |
Net change in unrealized gains (losses) on: | | | | | | | | |
Unaffiliated securities | | | (13,631,453 | ) | | | (559,251 | ) |
Futures transactions | | | 0 | | | | 0 | |
Credit default swap transactions | | | (418,505 | ) | | | 0 | |
TBA sale commitments | | | 293,360 | | | | 0 | |
| | | | | | | | |
Net change in unrealized gains (losses) on investments | | | (13,756,598 | ) | | | (559,251 | ) |
| | | | | | | | |
Net realized and unrealized gains (losses) on investments | | | 94,187,614 | | | | 1,376,890 | |
| | | | | | | | |
Net increase in net assets resulting from operations | | $ | 129,696,922 | | | $ | 2,170,645 | |
| | | | | | | | |
| | |
* Net of foreign interest withholding taxes in the amount of | | | $41,842 | | | | $0 | |
The accompanying notes are an integral part of these financial statements.
| | | | | | |
| Statements of operations—six months ended November 30, 2012 (unaudited) | | Wells Fargo Advantage Allocation Funds | | | 131 | |
| | | | | | |
Managed Fixed
Income Portfolio | | | Stable Income
Portfolio | |
| |
| | | | | | |
| $ | 2,458,646 | | | $ | 353,613 | |
| | 3,973 | | | | 1,868 | |
| | 2,110 | | | | 1,160 | |
| | | | | | |
| | 2,464,729 | | | | 356,641 | |
| | | | | | |
| |
| | | | | | |
| | 252,679 | | | | 67,229 | |
| | 6,936 | | | | 4,852 | |
| | 19,997 | | | | 20,623 | |
| | 3,511 | | | | 897 | |
| | 6,234 | | | | 5,364 | |
| | 4,339 | | | | 2,963 | |
| | | | | | |
| | 293,696 | | | | 101,928 | |
| | (48,092 | ) | | | (30,724 | ) |
| | | | | | |
| | 245,604 | | | | 71,204 | |
| | | | | | |
| | 2,219,125 | | | | 285,437 | |
| | | | | | |
| |
| | | | | | |
| |
| | | | | | |
| | 2,984,770 | | | | 112,829 | |
| | 0 | | | | (16,098 | ) |
| | 0 | | | | 0 | |
| | 7,748 | | | | 0 | |
| | | | | | |
| | 2,992,518 | | | | 96,731 | |
| | | | | | |
| |
| | | | | | |
| | (105,767 | ) | | | 253,738 | |
| | 0 | | | | (4,063 | ) |
| | 0 | | | | 0 | |
| | 0 | | | | 0 | |
| | | | | | |
| | (105,767 | ) | | | 249,675 | |
| | | | | | |
| | 2,886,751 | | | | 346,406 | |
| | | | | | |
| $ | 5,105,876 | | | $ | 631,843 | |
| | | | | | |
| |
| | $0 | | | | $0 | |
The accompanying notes are an integral part of these financial statements.
| | | | |
| 132 | | Wells Fargo Advantage Allocation Funds | | Statements of changes in net assets |
| | | | | | | | |
| | | C&B Large Cap Value Portfolio | |
| | | Six months ended
November 30, 2012
(Unaudited) | | | Year ended
May 31, 2012 | |
| | |
Operations | | | | | | | | |
Net investment income | | $ | 3,332,102 | | | $ | 6,573,718 | |
Net realized gains on investments | | | 8,138,075 | | | | 15,269,192 | |
Net change in unrealized gains (losses) on investments | | | 10,511,841 | | | | (40,212,230 | ) |
| | | | | | | | |
Net increase (decrease) in net assets resulting from operations | | | 21,982,018 | | | | (18,369,320 | ) |
| | | | | | | | |
| | |
Capital share transactions | | | | | | | | |
Transactions in investors’ beneficial interests | | | | | | | | |
Contributions | | | 3,176,458 | | | | 14,806,365 | |
Withdrawals | | | (31,235,254 | ) | | | (95,014,836 | ) |
| | | | | | | | |
Net decrease in net assets resulting from capital share transactions | | | (28,058,796 | ) | | | (80,208,471 | ) |
| | | | | | | | |
Total decrease in net assets | | | (6,076,778 | ) | | | (98,577,791 | ) |
| | | | | | | | |
| | |
Net assets | | | | | | | | |
Beginning of period | | | 324,923,116 | | | | 423,500,907 | |
| | | | | | | | |
End of period | | $ | 318,846,338 | | | $ | 324,923,116 | |
| | | | | | | | |
The accompanying notes are an integral part of these financial statements.
| | | | | | |
| Statements of changes in net assets | | Wells Fargo Advantage Allocation Funds | | | 133 | |
| | | | | | | | |
| | | Diversified Large Cap Growth Portfolio | |
| | | Six months ended
November 30, 2012
(unaudited) | | | Year ended
May 31, 2012 | |
| | |
Operations | | | | | | | | |
Net investment income | | $ | 269,655 | | | $ | 425,590 | |
Net realized gains on investments | | | 5,955,510 | | | | 5,356,234 | |
Net change in unrealized gains (losses) on investments | | | 4,673,812 | | | | (3,329,475 | ) |
| | | | | | | | |
Net increase in net assets resulting from operations | | | 10,898,977 | | | | 2,452,349 | |
| | | | | | | | |
| | |
Capital share transactions | | | | | | | | |
Transactions in investors’ beneficial interests | | | | | | | | |
Contributions | | | 3,076,744 | | | | 7,386,835 | |
Withdrawals | | | (23,170,833 | ) | | | (52,938,016 | ) |
| | | | | | | | |
Net decrease in net assets resulting from capital share transactions | | | (20,094,089 | ) | | | (45,551,181 | ) |
| | | | | | | | |
Total decrease in net assets | | | (9,195,112 | ) | | | (43,098,832 | ) |
| | | | | | | | |
| | |
Net assets | | | | | | | | |
Beginning of period | | | 158,158,281 | | | | 201,257,113 | |
| | | | | | | | |
End of period | | $ | 148,963,169 | | | $ | 158,158,281 | |
| | | | | | | | |
The accompanying notes are an integral part of these financial statements.
| | | | |
| 134 | | Wells Fargo Advantage Allocation Funds | | Statements of changes in net assets |
| | | | | | | | |
| | | Emerging Growth Portfolio | |
| | | Six months ended November 30, 2012
(Unaudited) | | | Year ended
May 31, 2012 | |
| | |
Operations | | | | | | | | |
Net investment loss | | $ | (2,173,595 | ) | | $ | (4,480,439 | ) |
Net realized gains (losses) on investments | | | (797,899 | ) | | | 45,606,364 | |
Net change in unrealized gains (losses) on investments | | | 18,194,585 | | | | 106,939,881 | |
| | | | | | | | |
Net increase in net assets resulting from operations | | | 15,223,091 | | | | 148,065,806 | |
| | | | | | | | |
| | |
Capital share transactions | | | | | | | | |
Transactions in investors’ beneficial interests | | | | | | | | |
Contributions | | | 27,508,922 | | | | 1,103,202,835 | |
Withdrawals | | | (116,332,787 | ) | | | (336,929,676 | ) |
| | | | | | | | |
Net increase (decrease) in net assets resulting from capital share transactions | | | (88,823,865 | ) | | | 766,273,159 | |
| | | | | | | | |
Total increase (decrease) in net assets | | | (73,600,774 | ) | | | 914,338,965 | |
| | | | | | | | |
| | |
Net assets | | | | | | | | |
Beginning of period | | | 998,892,106 | | | | 84,553,141 | |
| | | | | | | | |
End of period | | $ | 925,291,332 | | | $ | 998,892,106 | |
| | | | | | | | |
The accompanying notes are an integral part of these financial statements.
| | | | | | |
| Statements of changes in net assets | | Wells Fargo Advantage Allocation Funds | | | 135 | |
| | | | | | | | |
| | | Equity Value Portfolio | |
| | | Six months ended November 30, 2012
(Unaudited) | | | Year ended
May 31, 2012 | |
| | |
Operations | | | | | | | | |
Net investment income | | $ | 8,456,318 | | | $ | 14,011,353 | |
Net realized gains on investments | | | 58,679,308 | | | | 23,330,597 | |
Net change in unrealized gains (losses) on investments | | | 40,745,358 | | | | (18,260,356 | ) |
| | | | | | | | |
Net increase in net assets resulting from operations | | | 107,880,984 | | | | 19,081,594 | |
| | | | | | | | |
| | |
Capital share transactions | | | | | | | | |
Transactions in investors’ beneficial interests | | | | | | | | |
Contributions | | | 3,778,099 | | | | 698,898,834 | |
Withdrawals | | | (231,323,662 | ) | | | (145,361,854 | ) |
| | | | | | | | |
Net increase (decrease) in net assets resulting from capital share transactions | | | (227,545,563 | ) | | | 553,536,980 | |
| | | | | | | | |
Total increase (decrease) in net assets | | | (119,664,579 | ) | | | 572,618,574 | |
| | | | | | | | |
| | |
Net assets | | | | | | | | |
Beginning of period | | | 994,233,244 | | | | 421,614,670 | |
| | | | | | | | |
End of period | | $ | 874,568,665 | | | $ | 994,233,244 | |
| | | | | | | | |
The accompanying notes are an integral part of these financial statements.
| | | | |
| 136 | | Wells Fargo Advantage Allocation Funds | | Statements of changes in net assets |
| | | | | | | | |
| | | Index Portfolio | |
| | | Six months ended
November 30, 2012
(Unaudited) | | | Year ended
May 31, 2012 | |
| | |
Operations | | | | | | | | |
Net investment income | | $ | 27,689,021 | | | $ | 50,245,701 | |
Net realized gains on investments | | | 18,066,302 | | | | 44,324,406 | |
Net change in unrealized gains (losses) on investments | | | 172,145,526 | | | | (109,116,550 | ) |
| | | | | | | | |
Net increase (decrease) in net assets resulting from operations | | | 217,900,849 | | | | (14,546,443 | ) |
| | | | | | | | |
| | |
Capital share transactions | | | | | | | | |
Transactions in investors’ beneficial interests | | | | | | | | |
Contributions | | | 42,591,618 | | | | 170,958,274 | |
Withdrawals | | | (132,488,463 | ) | | | (304,471,072 | ) |
| | | | | | | | |
Net decrease in net assets resulting from capital share transactions | | | (89,896,845 | ) | | | (133,512,798 | ) |
| | | | | | | | |
Total increase (decrease) in net assets | | | 128,004,004 | | | | (148,059,241 | ) |
| | | | | | | | |
| | |
Net assets | | | | | | | | |
Beginning of period | | | 2,383,498,728 | | | | 2,531,557,969 | |
| | | | | | | | |
End of period | | $ | 2,511,502,732 | | | $ | 2,383,498,728 | |
| | | | | | | | |
The accompanying notes are an integral part of these financial statements.
| | | | | | |
| Statements of changes in net assets | | Wells Fargo Advantage Allocation Funds | | | 137 | |
| | | | | | | | |
| | | International Equity Portfolio | |
| | | Six months ended
November 30, 2012
(unaudited) | | | Year ended
May 31, 2012 | |
| | |
Operations | | | | | | | | |
Net investment income | | $ | 137,743 | | | $ | 464,140 | |
Net realized gains (losses) on investments | | | (1,002,622 | ) | | | 906,587 | |
Net change in unrealized gains (losses) on investments | | | 3,765,667 | | | | (7,789,823 | ) |
| | | | | | | | |
Net increase (decrease) in net assets resulting from operations | | | 2,900,788 | | | | (6,419,096 | ) |
| | | | | | | | |
| | |
Capital share transactions | | | | | | | | |
Transactions in investors’ beneficial interests | | | | | | | | |
Contributions | | | 701,829 | | | | 3,501,335 | |
Withdrawals | | | (4,319,848 | ) | | | (3,989,591 | ) |
| | | | | | | | |
Net decrease in net assets resulting from capital share transactions | | | (3,618,019 | ) | | | (488,256 | ) |
| | | | | | | | |
Total decrease in net assets | | | (717,231 | ) | | | (6,907,352 | ) |
| | | | | | | | |
| | |
Net assets | | | | | | | | |
Beginning of period | | | 23,066,205 | | | | 29,973,557 | |
| | | | | | | | |
End of period | | $ | 22,348,974 | | | $ | 23,066,205 | |
| | | | | | | | |
The accompanying notes are an integral part of these financial statements.
| | | | |
| 138 | | Wells Fargo Advantage Allocation Funds | | Statements of changes in net assets |
| | | | | | | | |
| | | International Growth Portfolio | |
| | | Six months ended
November 30, 2012
(Unaudited) | | | Year ended
May 31, 2012 | |
| | |
Operations | | | | | | | | |
Net investment income | | $ | 448,537 | | | $ | 2,321,731 | |
Net realized gains on investments | | | 1,430,375 | | | | 5,754,758 | |
Net change in unrealized gains (losses) on investments | | | 15,357,500 | | | | (18,816,975 | ) |
| | | | | | | | |
Net increase (decrease) in net assets resulting from operations | | | 17,236,412 | | | | (10,740,486 | ) |
| | | | | | | | |
| | |
Capital share transactions | | | | | | | | |
Transactions in investors’ beneficial interests | | | | | | | | |
Contributions | | | 1,582,502 | | | | 19,315,418 | |
Withdrawals | | | (15,733,513 | ) | | | (28,198,788 | ) |
| | | | | | | | |
Net decrease in net assets resulting from capital share transactions | | | (14,151,011 | ) | | | (8,883,370 | ) |
| | | | | | | | |
Total increase (decrease) in net assets | | | 3,085,401 | | | | (19,623,856 | ) |
| | | | | | | | |
| | |
Net assets | | | | | | | | |
Beginning of period | | | 108,521,467 | | | | 128,145,323 | |
| | | | | | | | |
End of period | | $ | 111,606,868 | | | $ | 108,521,467 | |
| | | | | | | | |
The accompanying notes are an integral part of these financial statements.
| | | | | | |
| Statements of changes in net assets | | Wells Fargo Advantage Allocation Funds | | | 139 | |
| | | | | | | | |
| | | International Index Portfolio | |
| | | Six months ended
November 30, 2012
(unaudited) | | | Year ended
May 31, 2012 | |
| | |
Operations | | | | | | | | |
Net investment income | | $ | 251,694 | | | $ | 985,385 | |
Net realized gains (losses) on investments | | | 73,209 | | | | (722,501 | ) |
Net change in unrealized gains (losses) on investments | | | 3,475,597 | | | | (6,151,041 | ) |
| | | | | | | | |
Net increase (decrease) in net assets resulting from operations | | | 3,800,500 | | | | (5,888,157 | ) |
| | | | | | | | |
| | |
Capital share transactions | | | | | | | | |
Transactions in investors’ beneficial interests | | | | | | | | |
Contributions | | | 391,968 | | | | 3,459,407 | |
Withdrawals | | | (5,095,751 | ) | | | (4,306,369 | ) |
| | | | | | | | |
Net decrease in net assets resulting from capital share transactions | | | (4,703,783 | ) | | | (846,962 | ) |
| | | | | | | | |
Total decrease in net assets | | | (903,283 | ) | | | (6,735,119 | ) |
| | | | | | | | |
| | |
Net assets | | | | | | | | |
Beginning of period | | | 23,266,434 | | | | 30,001,553 | |
| | | | | | | | |
End of period | | $ | 22,363,151 | | | $ | 23,266,434 | |
| | | | | | | | |
The accompanying notes are an integral part of these financial statements.
| | | | |
| 140 | | Wells Fargo Advantage Allocation Funds | | Statements of changes in net assets |
| | | | | | | | |
| | | International Value Portfolio | |
| | | Six months ended
November 30, 2012
(unaudited) | | | Year ended
May 31, 2012 | |
| | |
Operations | | | | | | | | |
Net investment income | | $ | 3,176,446 | | | $ | 10,731,272 | |
Net realized losses on investments | | | (2,196,456 | ) | | | (2,485,463 | ) |
Net change in unrealized gains (losses) on investments | | | 48,749,844 | | | | (82,848,290 | ) |
| | | | | | | | |
Net increase (decrease) in net assets resulting from operations | | | 49,729,834 | | | | (74,602,481 | ) |
| | | | | | | | |
| | |
Capital share transactions | | | | | | | | |
Transactions in investors’ beneficial interests | | | | | | | | |
Contributions | | | 40,144,436 | | | | 24,184,061 | |
Withdrawals | | | (19,602,749 | ) | | | (12,254,871 | ) |
| | | | | | | | |
Net increase in net assets resulting from capital share transactions | | | 20,541,687 | | | | 11,929,190 | |
| | | | | | | | |
Total increase (decrease) in net assets | | | 70,271,521 | | | | (62,673,291 | ) |
| | | | | | | | |
| | |
Net assets | | | | | | | | |
Beginning of period | | | 289,291,380 | | | | 351,964,671 | |
| | | | | | | | |
End of period | | $ | 359,562,901 | | | $ | 289,291,380 | |
| | | | | | | | |
The accompanying notes are an integral part of these financial statements.
| | | | | | |
| Statements of changes in net assets | | Wells Fargo Advantage Allocation Funds | | | 141 | |
| | | | | | | | |
| | | Large Company Value Portfolio | |
| | | Six months ended
November 30, 2012
(unaudited) | | | Year ended
May 31, 2012 | |
| | |
Operations | | | | | | | | |
Net investment income | | $ | 494,621 | | | $ | 975,071 | |
Net realized gains on investments | | | 2,105,222 | | | | 1,843,881 | |
Net change in unrealized gains (losses) on investments | | | 1,500,178 | | | | (6,856,974 | ) |
| | | | | | | | |
Net increase (decrease) in net assets resulting from operations | | | 4,100,021 | | | | (4,038,022 | ) |
| | | | | | | | |
| | |
Capital share transactions | | | | | | | | |
Transactions in investors’ beneficial interests | | | | | | | | |
Contributions | | | 652,885 | | | | 1,638,219 | |
Withdrawals | | | (8,785,261 | ) | | | (11,556,144 | ) |
| | | | | | | | |
Net decrease in net assets resulting from capital share transactions | | | (8,132,376 | ) | | | (9,917,925 | ) |
| | | | | | | | |
Total decrease in net assets | | | (4,032,355 | ) | | | (13,955,947 | ) |
| | | | | | | | |
| | |
Net assets | | | | | | | | |
Beginning of period | | | 52,880,149 | | | | 66,836,096 | |
| | | | | | | | |
End of period | | $ | 48,847,794 | | | $ | 52,880,149 | |
| | | | | | | | |
The accompanying notes are an integral part of these financial statements.
| | | | |
| 142 | | Wells Fargo Advantage Allocation Funds | | Statements of changes in net assets |
| | | | | | | | |
| | | Small Cap Value Portfolio | |
| | | Six months ended
November 30, 2012
(unaudited) | | | Year ended
May 31, 2012 | |
| | |
Operations | | | | | | | | |
Net investment income | | $ | 132,422 | | | $ | 492,526 | |
Net realized gains (losses) on investments | | | 3,788,147 | | | | (320,184 | ) |
Net change in unrealized gains (losses) on investments | | | 1,495,116 | | | | (4,255,368 | ) |
| | | | | | | | |
Net increase (decrease) in net assets resulting from operations | | | 5,415,685 | | | | (4,083,026 | ) |
| | | | | | | | |
| | |
Capital share transactions | | | | | | | | |
Transactions in investors’ beneficial interests | | | | | | | | |
Contributions | | | 570,705 | | | | 6,335,077 | |
Withdrawals | | | (37,608,679 | ) | | | (9,458,467 | ) |
| | | | | | | | |
Net decrease in net assets resulting from capital share transactions | | | (37,037,974 | ) | | | (3,123,390 | ) |
| | | | | | | | |
Total decrease in net assets | | | (31,622,289 | ) | | | (7,206,416 | ) |
| | | | | | | | |
| | |
Net assets | | | | | | | | |
Beginning of period | | | 48,107,808 | | | | 55,314,224 | |
| | | | | | | | |
End of period | | $ | 16,485,519 | | | $ | 48,107,808 | |
| | | | | | | | |
The accompanying notes are an integral part of these financial statements.
| | | | | | |
| Statements of changes in net assets | | Wells Fargo Advantage Allocation Funds | | | 143 | |
| | | | | | | | |
| | | Small Company Growth Portfolio | |
| | | Six months ended
November 30, 2012
(unaudited) | | | Year ended
May 31, 2012 | |
| | |
Operations | | | | | | | | |
Net investment income (loss) | | $ | 8,038 | | | $ | (317,924 | ) |
Net realized gains on investments | | | 5,166,264 | | | | 43,682,880 | |
Net change in unrealized gains (losses) on investments | | | 6,566,887 | | | | (74,305,951 | ) |
| | | | | | | | |
Net increase (decrease) in net assets resulting from operations | | | 11,741,189 | | | | (30,940,995 | ) |
| | | | | | | | |
| | |
Capital share transactions | | | | | | | | |
Transactions in investors’ beneficial interests | | | | | | | | |
Contributions | | | 5,021,405 | | | | 13,211,256 | |
Withdrawals | | | (47,232,223 | ) | | | (154,050,686 | ) |
| | | | | | | | |
Net decrease in net assets resulting from capital share transactions | | | (42,210,818 | ) | | | (140,839,430 | ) |
| | | | | | | | |
Total decrease in net assets | | | (30,469,629 | ) | | | (171,780,425 | ) |
| | | | | | | | |
| | |
Net assets | | | | | | | | |
Beginning of period | | | 162,959,461 | | | | 334,739,886 | |
| | | | | | | | |
End of period | | $ | 132,489,832 | | | $ | 162,959,461 | |
| | | | | | | | |
The accompanying notes are an integral part of these financial statements.
| | | | |
| 144 | | Wells Fargo Advantage Allocation Funds | | Statements of changes in net assets |
| | | | | | | | |
| | | Small Company Value Portfolio | |
| | | Six months ended
November 30, 2012
(unaudited) | | | Year ended
May 31, 2012 | |
| | |
Operations | | | | | | | | |
Net investment income | | $ | 615,252 | | | $ | 1,415,963 | |
Net realized gains on investments | | | 5,485,956 | | | | 19,382,594 | |
Net change in unrealized gains (losses) on investments | | | 7,055,601 | | | | (37,231,687 | ) |
| | | | | | | | |
Net increase (decrease) in net assets resulting from operations | | | 13,156,809 | | | | (16,433,130 | ) |
| | | | | | | | |
| | |
Capital share transactions | | | | | | | | |
Transactions in investors’ beneficial interests | | | | | | | | |
Contributions | | | 9,312,841 | | | | 25,377,194 | |
Withdrawals | | | (51,511,547 | ) | | | (46,438,479 | ) |
| | | | | | | | |
Net decrease in net assets resulting from capital share transactions | | | (42,198,706 | ) | | | (21,061,285 | ) |
| | | | | | | | |
Total decrease in net assets | | | (29,041,897 | ) | | | (37,494,415 | ) |
| | | | | | | | |
| | |
Net assets | | | | | | | | |
Beginning of period | | | 199,262,426 | | | | 236,756,841 | |
| | | | | | | | |
End of period | | $ | 170,220,529 | | | $ | 199,262,426 | |
| | | | | | | | |
The accompanying notes are an integral part of these financial statements.
| | | | | | |
| Statements of changes in net assets | | Wells Fargo Advantage Allocation Funds | | | 145 | |
| | | | | | | | |
| | | Core Bond Portfolio | |
| | | Six months ended
November 30, 2012
(unaudited) | | | Year ended
May 31, 2012 | |
| | |
Operations | | | | | | | | |
Net investment income | | $ | 35,509,308 | | | $ | 81,191,274 | |
Net realized gains on investments | | | 107,944,212 | | | | 164,577,584 | |
Net change in unrealized gains (losses) on investments | | | (13,756,598 | ) | | | 29,875,554 | |
| | | | | | | | |
Net increase in net assets resulting from operations | | | 129,696,922 | | | | 275,644,412 | |
| | | | | | | | |
| | |
Capital share transactions | | | | | | | | |
Transactions in investors’ beneficial interests | | | | | | | | |
Contributions | | | 504,049,062 | | | | 686,049,279 | |
Withdrawals | | | (764,041,287 | ) | | | (443,191,494 | ) |
| | | | | | | | |
Net increase (decrease) in net assets resulting from capital share transactions | | | (259,992,225 | ) | | | 242,857,785 | |
| | | | | | | | |
Total increase (decrease) in net assets | | | (130,295,303 | ) | | | 518,502,197 | |
| | | | | | | | |
| | |
Net assets | | | | | | | | |
Beginning of period | | | 3,813,536,144 | | | | 3,295,033,947 | |
| | | | | | | | |
End of period | | $ | 3,683,240,841 | | | $ | 3,813,536,144 | |
| | | | | | | | |
The accompanying notes are an integral part of these financial statements.
| | | | |
| 146 | | Wells Fargo Advantage Allocation Funds | | Statements of changes in net assets |
| | | | | | | | |
| | | Inflation-Protected Bond Portfolio | |
| | | Six months ended
November 30, 2012
(unaudited) | | | Year ended
May 31, 2012 | |
| | |
Operations | | | | | | | | |
Net investment income | | $ | 793,755 | | | $ | 2,680,432 | |
Net realized gains on investments | | | 1,936,141 | | | | 5,557,478 | |
Net change in unrealized gains (losses) on investments | | | (559,251 | ) | | | 3,311,880 | |
| | | | | | | | |
Net increase in net assets resulting from operations | | | 2,170,645 | | | | 11,549,790 | |
| | | | | | | | |
| | |
Capital share transactions | | | | | | | | |
Transactions in investors’ beneficial interests | | | | | | | | |
Contributions | | | 8,593,093 | | | | 21,266,199 | |
Withdrawals | | | (13,193,227 | ) | | | (54,247,708 | ) |
| | | | | | | | |
Net decrease in net assets resulting from capital share transactions | | | (4,600,134 | ) | | | (32,981,509 | ) |
| | | | | | | | |
Total decrease in net assets | | | (2,429,489 | ) | | | (21,431,719 | ) |
| | | | | | | | |
| | |
Net assets | | | | | | | | |
Beginning of period | | | 83,449,310 | | | | 104,881,029 | |
| | | | | | | | |
End of period | | $ | 81,019,821 | | | $ | 83,449,310 | |
| | | | | | | | |
The accompanying notes are an integral part of these financial statements.
| | | | | | |
| Statements of changes in net assets | | Wells Fargo Advantage Allocation Funds | | | 147 | |
| | | | | | | | |
| | | Managed Fixed Income Portfolio | |
| | | Six months ended
November 30, 2012
(unaudited) | | | Year ended
May 31, 2012 | |
| | |
Operations | | | | | | | | |
Net investment income | | $ | 2,219,125 | | | $ | 5,660,417 | |
Net realized gains on investments | | | 2,992,518 | | | | 2,120,364 | |
Net change in unrealized gains (losses) on investments | | | (105,767 | ) | | | 2,573,185 | |
| | | | | | | | |
Net increase in net assets resulting from operations | | | 5,105,876 | | | | 10,353,966 | |
| | | | | | | | |
| | |
Capital share transactions | | | | | | | | |
Transactions in investors’ beneficial interests | | | | | | | | |
Contributions | | | 15,433,971 | | | | 55,876,275 | |
Withdrawals | | | (41,031,727 | ) | | | (84,676,792 | ) |
| | | | | | | | |
Net decrease in net assets resulting from capital share transactions | | | (25,597,756 | ) | | | (28,800,517 | ) |
| | | | | | | | |
Total decrease in net assets | | | (20,491,880 | ) | | | (18,446,551 | ) |
| | | | | | | | |
| | |
Net assets | | | | | | | | |
Beginning of period | | | 141,903,295 | | | | 160,349,846 | |
| | | | | | | | |
End of period | | $ | 121,411,415 | | | $ | 141,903,295 | |
| | | | | | | | |
The accompanying notes are an integral part of these financial statements.
| | | | |
| 148 | | Wells Fargo Advantage Allocation Funds | | Statements of changes in net assets |
| | | | | | | | |
| | | Stable Income Portfolio | |
| | | Six months ended November 30, 2012
(unaudited) | | | Year ended May 31, 2012 | |
| | |
Operations | | | | | | | | |
Net investment income | | $ | 285,437 | | | $ | 666,108 | |
Net realized gains (losses) on investments | | | 96,731 | | | | (60,837 | ) |
Net change in unrealized gains on investments | | | 249,675 | | | | 21,566 | |
| | | | | | | | |
Net increase in net assets resulting from operations | | | 631,843 | | | | 626,837 | |
| | | | | | | | |
| | |
Capital share transactions | | | | | | | | |
Transactions in investors’ beneficial interests | | | | | | | | |
Contributions | | | 2,902,589 | | | | 6,568,824 | |
Withdrawals | | | (6,479,139 | ) | | | (8,980,294 | ) |
| | | | | | | | |
Net decrease in net assets resulting from capital share transactions | | | (3,576,550 | ) | | | (2,411,470 | ) |
| | | | | | | | |
Total decrease in net assets | | | (2,944,707 | ) | | | (1,784,633 | ) |
| | | | | | | | |
| | |
Net assets | | | | | | | | |
Beginning of period | | | 37,740,639 | | | | 39,525,272 | |
| | | | | | | | |
End of period | | $ | 34,795,932 | | | $ | 37,740,639 | |
| | | | | | | | |
The accompanying notes are an integral part of these financial statements.
| | | | | | |
| Financial highlights | | Wells Fargo Advantage Allocation Funds | | | 149 | |
| | | | | | | | | | | | | | | | | | | | |
| | | Ratio to average net assets (annualized) | | | Total
return1 | | | Portfolio turnover rate | |
| | | Net investment
income (loss) | | | Gross
expenses | | | Net
expenses | | | |
| | | | | |
C&B Large Cap Value Portfolio | | | | | | | | | | | | | | | | | | | | |
June 1, 2012 to November 30, 2012 (unaudited) | | | 1.99 | % | | | 0.68 | % | | | 0.68 | % | | | 6.87 | % | | | 6 | % |
June 1, 2011 to May 31, 2012 | | | 1.81 | % | | | 0.68 | % | | | 0.68 | % | | | (4.61 | )% | | | 21 | % |
October 1, 2010 to May 31, 20112 | | | 1.27 | % | | | 0.67 | % | | | 0.67 | % | | | 18.08 | % | | | 17 | % |
October 1, 2009 to September 30, 2010 | | | 1.40 | % | | | 0.70 | % | | | 0.68 | % | | | 7.49 | % | | | 13 | % |
October 1, 2008 to September 30, 2009 | | | 2.19 | % | | | 0.73 | % | | | 0.64 | % | | | (5.53 | )% | | | 28 | % |
October 1, 2007 to September 30, 2008 | | | 1.71 | % | | | 0.73 | % | | | 0.68 | % | | | (20.18 | )% | | | 21 | % |
October 1, 2006 to September 30, 2007 | | | 1.48 | % | | | 0.74 | % | | | 0.68 | % | | | 11.88 | % | | | 24 | % |
| | | | | |
Diversified Large Cap Growth Portfolio | | | | | | | | | | | | | | | | | | | | |
June 1, 2012 to November 30, 2012 (unaudited) | | | 0.35 | % | | | 0.71 | % | | | 0.62 | % | | | 7.50 | % | | | 29 | % |
June 1, 2011 to May 31, 2012 | | | 0.24 | % | | | 0.71 | % | | | 0.62 | % | | | 1.26 | % | | | 79 | % |
October 1, 2010 to May 31, 20112,3 | | | 0.40 | % | | | 0.69 | % | | | 0.62 | % | | | 22.78 | % | | | 101 | % |
October 1, 2009 to September 30, 20103 | | | 0.66 | % | | | 0.70 | % | | | 0.62 | % | | | 7.51 | % | | | 11 | % |
October 1, 2008 to September 30, 20093 | | | 0.97 | % | | | 0.70 | % | | | 0.62 | % | | | 3.31 | % | | | 13 | % |
October 1, 2007 to September 30, 20083 | | | 0.48 | % | | | 0.68 | % | | | 0.67 | % | | | (22.59 | )% | | | 7 | % |
October 1, 2006 to September 30, 20073 | | | 0.46 | % | | | 0.70 | % | | | 0.68 | % | | | 17.80 | % | | | 10 | % |
| | | | | |
Emerging Growth Portfolio | | | | | | | | | | | | | | | | | | | | |
June 1, 2012 to November 30, 2012 (unaudited) | | | (0.43 | )% | | | 0.80 | % | | | 0.80 | % | | | 1.25 | % | | | 32 | % |
June 1, 2011 to May 31, 2012 | | | (0.57 | )% | | | 0.80 | % | | | 0.80 | % | | | (4.83 | )% | | | 75 | % |
October 1, 2010 to May 31, 20112 | | | (0.77 | )% | | | 0.94 | % | | | 0.91 | % | | | 37.91 | % | | | 59 | % |
October 1, 2009 to September 30, 2010 | | | (0.66 | )% | | | 1.02 | % | | | 0.94 | % | | | 20.49 | % | | | 97 | % |
October 1, 2008 to September 30, 2009 | | | (0.53 | )% | | | 0.94 | % | | | 0.91 | % | | | (5.70 | )% | | | 147 | % |
October 1, 2007 to September 30, 2008 | | | (0.49 | )% | | | 0.93 | % | | | 0.92 | % | | | (30.95 | )% | | | 191 | % |
January 31, 20074 to September 30, 2007 | | | (0.54 | )% | | | 1.01 | % | | | 0.99 | % | | | 24.40 | % | | | 125 | % |
| | | | | |
Equity Value Portfolio | | | | | | | | | | | | | | | | | | | | |
June 1, 2012 to November 30, 2012 (unaudited) | | | 1.68 | % | | | 0.65 | % | | | 0.65 | % | | | 11.12 | % | | | 42 | % |
June 1, 2011 to May 31, 2012 | | | 1.58 | % | | | 0.65 | % | | | 0.65 | % | | | (10.22 | )% | | | 103 | % |
October 1, 2010 to May 31, 20112 | | | 0.79 | % | | | 0.68 | % | | | 0.68 | % | | | 20.88 | % | | | 90 | % |
October 1, 2009 to September 30, 2010 | | | 0.87 | % | | | 0.71 | % | | | 0.69 | % | | | 9.75 | % | | | 122 | % |
October 1, 2008 to September 30, 2009 | | | 1.89 | % | | | 0.73 | % | | | 0.69 | % | | | (7.21 | )% | | | 142 | % |
October 1, 2007 to September 30, 2008 | | | 1.68 | % | | | 0.74 | % | | | 0.70 | % | | | (27.44 | )% | | | 152 | % |
October 1, 2006 to September 30, 2007 | | | 1.29 | % | | | 0.77 | % | | | 0.69 | % | | | 20.21 | % | | | 108 | % |
| | | | | |
Index Portfolio | | | | | | | | | | | | | | | | | | | | |
June 1, 2012 to November 30, 2012 (unaudited) | | | 2.19 | % | | | 0.10 | % | | | 0.10 | % | | | 9.30 | % | | | 2 | % |
June 1, 2011 to May 31, 2012 | | | 2.09 | % | | | 0.10 | % | | | 0.10 | % | | | (0.52 | )% | | | 9 | % |
October 1, 2010 to May 31, 20112 | | | 1.93 | % | | | 0.10 | % | | | 0.10 | % | | | 19.39 | % | | | 3 | % |
October 1, 2009 to September 30, 2010 | | | 2.01 | % | | | 0.10 | % | | | 0.10 | % | | | 9.97 | % | | | 22 | % |
October 1, 2008 to September 30, 2009 | | | 2.61 | % | | | 0.12 | % | | | 0.10 | % | | | (7.00 | )% | | | 10 | % |
October 1, 2007 to September 30, 2008 | | | 2.07 | % | | | 0.11 | % | | | 0.11 | % | | | (22.28 | )% | | | 5 | % |
October 1, 2006 to September 30, 2007 | | | 1.86 | % | | | 0.11 | % | | | 0.10 | % | | | 16.35 | % | | | 8 | % |
| | | | | |
International Equity Portfolio | | | | | | | | | | | | | | | | | | | | |
June 1, 2012 to November 30, 2012 (unaudited) | | | 1.20 | % | | | 1.40 | % | | | 1.37 | % | | | 13.61 | % | | | 24 | % |
June 1, 2011 to May 31, 2012 | | | 1.79 | % | | | 1.26 | % | | | 1.21 | % | | | (22.13 | )% | | | 141 | % |
October 1, 2010 to May 31, 20112 | | | 1.34 | % | | | 1.18 | % | | | 1.18 | % | | | 14.83 | % | | | 35 | % |
October 1, 2009 to September 30, 2010 | | | 0.61 | % | | | 1.31 | % | | | 1.28 | % | | | 6.57 | % | | | 105 | % |
October 1, 2008 to September 30, 2009 | | | 1.77 | % | | | 1.23 | % | | | 1.15 | % | | | (10.14 | )% | | | 212 | % |
October 1, 2007 to September 30, 2008 | | | 1.60 | % | | | 1.14 | % | | | 1.12 | % | | | (31.42 | )% | | | 55 | % |
October 1, 2006 to September 30, 2007 | | | 1.27 | % | | | 1.09 | % | | | 1.08 | % | | | 23.70 | % | | | 66 | % |
Please see footnotes on page 151.
The accompanying notes are an integral part of these financial statements.
| | | | |
| 150 | | Wells Fargo Advantage Allocation Funds | | Financial highlights |
| | | | | | | | | | | | | | | | | | | | |
| | | Ratio to average net assets (annualized) | | | Total
return1 | | | Portfolio turnover rate | |
| | | Net investment
income (loss) | | | Gross
expenses | | | Net
expenses | | | |
| | | | | |
International Growth Portfolio | | | | | | | | | | | | | | | | | | | | |
June 1, 2012 to November 30, 2012 (unaudited) | | | 0.79 | % | | | 1.01 | % | | | 1.01 | % | | | 16.75 | % | | | 21 | % |
June 1, 2011 to May 31, 2012 | | | 2.04 | % | | | 0.97 | % | | | 0.90 | % | | | (9.44 | )% | | | 69 | % |
October 1, 2010 to May 31, 20112 | | | 1.62 | % | | | 1.10 | % | | | 1.10 | % | | | 14.50 | % | | | 53 | % |
October 1, 2009 to September 30, 2010 | | | 0.89 | % | | | 1.42 | % | | | 1.20 | % | | | 3.25 | % | | | 89 | % |
October 1, 2008 to September 30, 2009 | | | 1.71 | % | | | 1.14 | % | | | 1.11 | % | | | 6.23 | % | | | 95 | % |
October 1, 2007 to September 30, 2008 | | | 1.17 | % | | | 1.08 | % | | | 1.05 | % | | | (28.68 | )% | | | 57 | % |
October 1, 2006 to September 30, 2007 | | | 1.09 | % | | | 1.06 | % | | | 1.03 | % | | | 27.40 | % | | | 73 | % |
| | | | | |
International Index Portfolio | | | | | | | | | | | | | | | | | | | | |
June 1, 2012 to November 30, 2012 (unaudited) | | | 2.17 | % | | | 1.10 | % | | | 0.38 | % | | | 18.07 | % | | | 2 | % |
June 1, 2011 to May 31, 2012 | | | 3.81 | % | | | 0.83 | % | | | 0.37 | % | | | (20.52 | )% | | | 45 | % |
October 1, 2010 to May 31, 20112 | | | 3.09 | % | | | 0.48 | % | | | 0.48 | % | | | 13.78 | % | | | 3 | % |
October 1, 2009 to September 30, 2010 | | | 2.17 | % | | | 0.77 | % | | | 0.65 | % | | | 2.47 | % | | | 20 | % |
October 1, 2008 to September 30, 2009 | | | 2.86 | % | | | 0.55 | % | | | 0.46 | % | | | 1.65 | % | | | 13 | % |
October 1, 2007 to September 30, 2008 | | | 2.84 | % | | | 0.51 | % | | | 0.50 | % | | | (29.67 | )% | | | 14 | % |
October 1, 2006 to September 30, 2007 | | | 2.15 | % | | | 0.49 | % | | | 0.49 | % | | | 24.52 | % | | | 3 | % |
| | | | | |
International Value Portfolio | | | | | | | | | | | | | | | | | | | | |
June 1, 2012 to November 30, 2012 (unaudited) | | | 1.94 | % | | | 0.90 | % | | | 0.90 | % | | | 17.08 | % | | | 9 | % |
June 1, 2011 to May 31, 2012 | | | 3.44 | % | | | 0.91 | % | | | 0.85 | % | | | (21.07 | )% | | | 9 | % |
October 1, 2010 to May 31, 20112 | | | 3.14 | % | | | 0.94 | % | | | 0.94 | % | | | 14.00 | % | | | 16 | % |
October 1, 2009 to September 30, 2010 | | | 2.41 | % | | | 1.20 | % | | | 1.06 | % | | | 0.92 | % | | | 27 | % |
October 1, 2008 to September 30, 2009 | | | 2.72 | % | | | 1.08 | % | | | 1.03 | % | | | 5.26 | % | | | 41 | % |
October 1, 2007 to September 30, 2008 | | | 3.68 | % | | | 1.07 | % | | | 1.01 | % | | | (34.21 | )% | | | 23 | % |
October 1, 2006 to September 30, 2007 | | | 2.47 | % | | | 1.07 | % | | | 1.03 | % | | | 21.91 | % | | | 19 | % |
| | | | | |
Large Company Value Portfolio | | | | | | | | | | | | | | | | | | | | |
June 1, 2012 to November 30, 2012 (unaudited) | | | 1.92 | % | | | 0.79 | % | | | 0.74 | % | | | 8.38 | % | | | 32 | % |
June 1, 2011 to May 31, 2012 | | | 1.67 | % | | | 0.77 | % | | | 0.74 | % | | | (6.06 | )% | | | 104 | % |
October 1, 2010 to May 31, 20112 | | | 1.58 | % | | | 0.78 | % | | | 0.74 | % | | | 21.46 | % | | | 38 | % |
October 1, 2009 to September 30, 2010 | | | 1.73 | % | | | 0.73 | % | | | 0.72 | % | | | 7.02 | % | | | 46 | % |
October 1, 2008 to September 30, 2009 | | | 2.69 | % | | | 0.75 | % | | | 0.69 | % | | | (9.66 | )% | | | 11 | % |
October 1, 2007 to September 30, 2008 | | | 2.16 | % | | | 0.75 | % | | | 0.57 | % | | | (23.18 | )% | | | 8 | % |
October 1, 2006 to September 30, 2007 | | | 1.91 | % | | | 0.76 | % | | | 0.57 | % | | | 15.91 | % | | | 16 | % |
| | | | | |
Small Cap Value Portfolio | | | | | | | | | | | | | | | | | | | | |
June 1, 2012 to November 30, 2012 (unaudited) | | | 0.63 | % | | | 0.97 | % | | | 0.92 | % | | | 10.41 | % | | | 20 | % |
June 1, 2011 to May 31, 2012 | | | 1.02 | % | | | 0.95 | % | | | 0.91 | % | | | (7.94 | )% | | | 33 | % |
October 1, 2010 to May 31, 20112 | | | 0.47 | % | | | 0.95 | % | | | 0.91 | % | | | 13.14 | % | | | 57 | % |
October 1, 2009 to September 30, 2010 | | | 0.66 | % | | | 0.94 | % | | | 0.91 | % | | | 9.60 | % | | | 38 | % |
October 1, 2008 to September 30, 2009 | | | 1.31 | % | | | 0.91 | % | | | 0.74 | % | | | (8.76 | )% | | | 50 | % |
October 1, 2007 to September 30, 2008 | | | 0.80 | % | | | 0.91 | % | | | 0.83 | % | | | (16.47 | )% | | | 46 | % |
October 1, 2006 to September 30, 2007 | | | 0.30 | % | | | 0.93 | % | | | 0.92 | % | | | 8.65 | % | | | 64 | % |
| | | | | |
Small Company Growth Portfolio | | | | | | | | | | | | | | | | | | | | |
June 1, 2012 to November 30, 2012 (unaudited) | | | 0.01 | % | | | 0.86 | % | | | 0.86 | % | | | 7.71 | % | | | 48 | % |
June 1, 2011 to May 31, 2012 | | | (0.12 | )% | | | 0.83 | % | | | 0.83 | % | | | (10.75 | )% | | | 107 | % |
October 1, 2010 to May 31, 20112 | | | (0.42 | )% | | | 0.83 | % | | | 0.83 | % | | | 39.64 | % | | | 70 | % |
October 1, 2009 to September 30, 2010 | | | (0.48 | )% | | | 0.87 | % | | | 0.86 | % | | | 15.25 | % | | | 129 | % |
October 1, 2008 to September 30, 2009 | | | (0.53 | )% | | | 0.89 | % | | | 0.87 | % | | | 1.75 | % | | | 169 | % |
October 1, 2007 to September 30, 2008 | | | (0.53 | )% | | | 0.89 | % | | | 0.89 | % | | | (27.50 | )% | | | 150 | % |
October 1, 2006 to September 30, 2007 | | | (0.46 | )% | | | 0.90 | % | | | 0.90 | % | | | 17.74 | % | | | 138 | % |
Please see footnotes on page 151.
The accompanying notes are an integral part of these financial statements.
| | | | | | |
| Financial highlights | | Wells Fargo Advantage Allocation Funds | | | 151 | |
| | | | | | | | | | | | | | | | | | | | |
| | | Ratio to average net assets (annualized) | | | Total
return1 | | | Portfolio turnover rate | |
| | | Net investment
income | | | Gross
expenses | | | Net
expenses | | | |
| | | | | |
Small Company Value Portfolio | | | | | | | | | | | | | | | | | | | | |
June 1, 2012 to November 30, 2012 (unaudited) | | | 0.62 | % | | | 0.84 | % | | | 0.84 | % | | | 6.95 | % | | | 34 | % |
June 1, 2011 to May 31, 2012 | | | 0.69 | % | | | 0.84 | % | | | 0.84 | % | | | (7.17 | )% | | | 60 | % |
October 1, 2010 to May 31, 20112 | | | 1.60 | % | | | 0.84 | % | | | 0.84 | % | | | 26.72 | % | | | 47 | % |
October 1, 2009 to September 30, 2010 | | | 0.31 | % | | | 0.89 | % | | | 0.89 | % | | | 16.38 | % | | | 60 | % |
October 1, 2008 to September 30, 2009 | | | 1.16 | % | | | 0.90 | % | | | 0.88 | % | | | (6.28 | )% | | | 99 | % |
October 1, 2007 to September 30, 2008 | | | 1.02 | % | | | 0.90 | % | | | 0.89 | % | | | (22.01 | )% | | | 82 | % |
October 1, 2006 to September 30, 2007 | | | 0.53 | % | | | 0.93 | % | | | 0.92 | % | | | 6.53 | % | | | 69 | % |
| | | | | |
Core Bond Portfolio | | | | | | | | | | | | | | | | | | | | |
June 1, 2012 to November 30, 2012 (unaudited) | | | 1.79 | % | | | 0.36 | % | | | 0.35 | % | | | 3.35 | % | | | 270 | % |
June 1, 2011 to May 31, 2012 | | | 2.33 | % | | | 0.37 | % | | | 0.35 | % | | | 8.20 | % | | | 803 | % |
June 1, 2010 to May 31, 2011 | | | 2.99 | % | | | 0.37 | % | | | 0.35 | % | | | 7.02 | % | | | 789 | % |
June 1, 2009 to May 31, 2010 | | | 3.78 | % | | | 0.38 | % | | | 0.34 | % | | | 10.87 | % | | | 638 | % |
June 1, 2008 to May 31, 2009 | | | 4.92 | % | | | 0.40 | % | | | 0.39 | % | | | 6.58 | % | | | 633 | % |
June 1, 2007 to May 31, 2008 | | | 5.05 | % | | | 0.42 | % | | | 0.40 | % | | | 6.72 | % | | | 572 | % |
| | | | | |
Inflation-Protected Bond Portfolio | | | | | | | | | | | | | | | | | | | | |
June 1, 2012 to November 30, 2012 (unaudited) | | | 1.91 | % | | | 0.48 | % | | | 0.44 | % | | | 2.69 | % | | | 9 | % |
June 1, 2011 to May 31, 2012 | | | 3.00 | % | | | 0.48 | % | | | 0.44 | % | | | 12.62 | % | | | 23 | % |
June 1, 2010 to May 31, 2011 | | | 3.25 | % | | | 0.44 | % | | | 0.43 | % | | | 8.19 | % | | | 19 | % |
June 1, 2009 to May 31, 2010 | | | 3.53 | % | | | 0.45 | % | | | 0.44 | % | | | 8.28 | % | | | 31 | % |
June 1, 2008 to May 31, 2009 | | | 1.70 | % | | | 0.45 | % | | | 0.37 | % | | | (1.33 | )% | | | 53 | % |
June 1, 2007 to May 31, 2008 | | | 5.78 | % | | | 0.48 | % | | | 0.40 | % | | | 12.78 | % | | | 40 | % |
| | | | | |
Managed Fixed Income Portfolio | | | | | | | | | | | | | | | | | | | | |
June 1, 2012 to November 30, 2012 (unaudited) | | | 3.52 | % | | | 0.46 | % | | | 0.39 | % | | | 4.09 | % | | | 26 | % |
June 1, 2011 to May 31, 2012 | | | 3.83 | % | | | 0.46 | % | | | 0.39 | % | | | 6.97 | % | | | 51 | % |
June 1, 2010 to May 31, 2011 | | | 3.97 | % | | | 0.45 | % | | | 0.39 | % | | | 8.84 | % | | | 104 | % |
June 1, 2009 to May 31, 2010 | | | 3.64 | % | | | 0.42 | % | | | 0.38 | % | | | 14.58 | % | | | 59 | % |
June 1, 2008 to May 31, 2009 | | | 5.09 | % | | | 0.43 | % | | | 0.34 | % | | | (1.72 | )% | | | 132 | % |
June 1, 2007 to May 31, 2008 | | | 5.23 | % | | | 0.46 | % | | | 0.30 | % | | | 4.24 | % | | | 32 | % |
| | | | | |
Stable Income Portfolio | | | | | | | | | | | | | | | | | | | | |
June 1, 2012 to November 30, 2012 (unaudited) | | | 1.63 | % | | | 0.58 | % | | | 0.41 | % | | | 1.85 | % | | | 13 | % |
June 1, 2011 to May 31, 2012 | | | 1.76 | % | | | 0.59 | % | | | 0.41 | % | | | 1.71 | % | | | 11 | % |
June 1, 2010 to May 31, 2011 | | | 2.02 | % | | | 0.54 | % | | | 0.40 | % | | | 2.97 | % | | | 14 | % |
June 1, 2009 to May 31, 2010 | | | 1.90 | % | | | 0.43 | % | | | 0.40 | % | | | 9.94 | % | | | 10 | % |
June 1, 2008 to May 31, 2009 | | | 3.74 | % | | | 0.43 | % | | | 0.42 | % | | | (2.73 | )% | | | 7 | % |
June 1, 2007 to May 31, 2008 | | | 4.67 | % | | | 0.47 | % | | | 0.33 | % | | | 0.78 | % | | | 22 | % |
| 1. | Returns for periods of less than one year are not annualized. |
| 2. | For the eight months ended May 31, 2011. The Portfolio changed its fiscal year end from September 30 to May 31, effective May 31, 2011. |
| 3. | After the close of business on January 28, 2011, the Diversified Large Cap Growth Portfolio acquired the net assets of Wells Fargo Advantage Disciplined Growth Portfolio, Wells Fargo Advantage Large Cap Appreciation Portfolio, and Wells Fargo Advantage Large Company Growth Portfolio. Wells Fargo Advantage Large Company Growth Portfolio became the accounting and performance survivor in the transaction. The information for the periods prior to January 31, 2011 is that of the Wells Fargo Advantage Large Company Growth Portfolio. |
| 4. | Commencement of operations. |
The accompanying notes are an integral part of these financial statements.
| | | | |
| 152 | | Wells Fargo Advantage Allocation Funds | | Notes to financial statements (unaudited) |
1. ORGANIZATION
Wells Fargo Master Trust (the “Trust”), a Delaware statutory trust organized on March 10, 1999, is an open-end management investment company registered under the Investment Company Act of 1940, as amended (the “1940 Act”). These financial statements report on the following funds: Wells Fargo Advantage C&B Large Cap Value Portfolio (“C&B Large Cap Value Portfolio”), Wells Fargo Advantage Diversified Large Cap Growth Portfolio (“Diversified Large Cap Growth Portfolio”), Wells Fargo Advantage Emerging Growth Portfolio (“Emerging Growth Portfolio”), Wells Fargo Advantage Equity Value Portfolio (“Equity Value Portfolio”), Wells Fargo Advantage Index Portfolio (“Index Portfolio”), Wells Fargo Advantage International Equity Portfolio (“International Equity Portfolio”), Wells Fargo Advantage International Growth Portfolio (“International Growth Portfolio”), Wells Fargo Advantage International Index Portfolio (“International Index Portfolio”), Wells Fargo Advantage International Value Portfolio (“International Value Portfolio”), Wells Fargo Advantage Large Company Value Portfolio (“Large Company Value Portfolio”), Wells Fargo Advantage Small Cap Value Portfolio (“Small Cap Value Portfolio”), Wells Fargo Advantage Small Company Growth Portfolio (“Small Company Growth Portfolio”), Wells Fargo Advantage Small Company Value Portfolio (“Small Company Value Portfolio”), Wells Fargo Advantage Core Bond Portfolio (“Core Bond Portfolio” ) (formerly, Wells Fargo Advantage Total Return Bond Portfolio), Wells Fargo Advantage Inflation-Protected Bond Portfolio (“Inflation-Protected Bond Portfolio”), Wells Fargo Advantage Managed Fixed Income Portfolio (“Managed Fixed Income Portfolio”) and Wells Fargo Advantage Stable Income Portfolio (“Stable Income Portfolio”) (each, a “Portfolio”, collectively, the “Portfolios”). Each Portfolio is a diversified series of the Trust.
The Portfolios, which are master portfolios in a master/feeder structure, offer their shares to multiple feeder funds and other master portfolios rather than directly to the public.
2. SIGNIFICANT ACCOUNTING POLICIES
The following significant accounting policies, which are consistently followed in the preparation of the financial statements of each Portfolio, are in conformity with U.S. generally accepted accounting principles which require management to make estimates and assumptions that affect the reported amounts of assets and liabilities, disclosure of contingent assets and liabilities at the date of the financial statements, and the reported amounts of revenues and expenses during the reporting period. Actual results could differ from those estimates.
Securities valuation
All investments are valued each business day as of the close of regular trading on the New York Stock Exchange (normally 4 p.m. Eastern Time).
Equity securities that are listed on a foreign or domestic exchange, except for The Nasdaq Stock Market, Inc. (“Nasdaq”), are valued at the official closing price or, if none, the last sales price. Securities listed on Nasdaq are valued at the Nasdaq Official Closing Price (“NOCP”). If no NOCP is available, securities are valued at the last prior sales price. If no sales price is shown on the Nasdaq, the bid price will be used. If no sale occurs on the primary exchange or market for the security that day or if no sale occurs and no bid price is shown on Nasdaq, the prior day’s price will be deemed “stale” and fair values will be determined in accordance with the Portfolios’ Valuation Procedures.
Securities denominated in foreign currencies are translated into U.S. dollars using the rates of exchange in effect on the day of valuation at a time specified by the Management Valuation Team of Wells Fargo Funds Management, LLC (“Funds Management”).
Many securities markets and exchanges outside the U.S. close prior to the close of the New York Stock Exchange and therefore may not fully reflect trading or events that occur after the close of the principal exchange in which the foreign securities are traded, but before the close of the New York Stock Exchange. If such trading or events are expected to materially affect the value of such securities, then fair value pricing procedures approved by the Board of Trustees are applied. These procedures take into account multiple factors including movements in U.S. securities markets after foreign exchanges close. Foreign securities that are fair valued under these procedures are categorized as Level 2 and the application of these procedures may result in transfers between Level 1 and Level 2. Depending on market activity, such fair valuations may be frequent. Such fair value pricing may result in NAVs that are higher or lower than NAVs based on the last reported sales price or latest quoted bid price. On November 30, 2012, fair value pricing was not used in pricing foreign securities.
Debt securities of sufficient credit quality acquired with maturities of 60 days or less generally are valued at amortized cost which approximates fair value. The amortized cost method involves valuing a security at its cost, plus accretion of discount or minus amortization of premium over the period until maturity.
| | | | | | |
| Notes to financial statements (unaudited) | | Wells Fargo Advantage Allocation Funds | | | 153 | |
Investments in registered open-end investment companies are valued at net asset value. Non-registered investment companies are fair valued at net asset value.
Investments which are not valued using any of the methods discussed above are valued at their fair value, as determined by procedures established in good faith and approved by the Board of Trustees. The Board of Trustees has established a Valuation Committee comprised of the Trustees and has delegated to it the authority to take any actions regarding the valuation of portfolio securities that the Valuation Committee deems necessary or appropriate, including determining the fair value of portfolio securities, unless the determination has been delegated to the Management Valuation Team of Wells Fargo Funds Management, LLC (“Fund Management”). The Board of Trustees retains the authority to make or ratify any valuation decisions or approve any changes to the Valuation Procedures as it deems appropriate. On a quarterly basis, the Board of Trustees receives reports on any valuation actions taken by the Valuation Committee or the Management Valuation Team which may include items for ratification.
Valuations of fair valued securities are compared to the next actual sales price when available, or other appropriate market information to assess the continued appropriateness of the fair valuation methodology used. These securities are fair valued on a day-to-day basis, taking into consideration changes to appropriate market information and any significant changes to the input factors considered in the valuation process until there is a readily available price provided on the exchange or by an independent pricing service. Valuations received from an independent pricing service or broker quotes are periodically validated by comparisons to most recent trades and valuations provided by other independent pricing services in addition to the review of prices by the adviser and/or subadviser. Unobservable inputs used in determining fair valuations are identified based on the type of security, taking into consideration factors utilized by market participants in valuing the investment, knowledge about the issuer and the current market environment.
Foreign currency translation
The accounting records of the Portfolios are maintained in U.S. dollars. Assets, including investment securities, and liabilities denominated in foreign currency are translated into U.S. dollars at the rates of exchange at a time specified by the Management Valuation Team on the date of valuation. Purchases and sales of securities, and income and expenses are converted at the rate of exchange on the respective dates of such transactions. Reported net realized foreign exchange gains or losses arise from sales of foreign currencies, currency gains or losses realized between the trade and settlement dates on securities transactions, and the difference between the amounts of dividends, interest and foreign withholding taxes recorded and the U.S. dollar equivalent of the amounts actually paid or received. Net unrealized foreign exchange gains and losses arise from changes in the fair value of assets and liabilities other than investments in securities resulting in changes in exchange rates.
The changes in net assets arising from changes in exchange rates and the changes in net assets resulting from changes in market prices of securities are not separately presented. Such changes are recorded with net realized and unrealized gains or losses from investments. Gains and losses from certain foreign currency transactions are treated as ordinary income for U.S. federal income tax purposes.
Forward foreign currency contracts
Certain Portfolios may be subject to foreign currency exchange rate risk in the normal course of pursuing its investment objectives. A forward foreign currency contract is an agreement between two parties to purchase or sell a specific currency for an agreed-upon price at a future date. The Portfolio enters into forward foreign currency contracts to facilitate transactions in foreign-denominated securities and to attempt to minimize the risk to the Portfolio from adverse changes in the relationship between currencies. Forward foreign currency contracts are recorded at the forward rate and marked-to-market daily. When the contracts are closed, realized gains and losses arising from such transactions are recorded as realized gains or losses on forward foreign currency contract transactions. The Portfolio could be exposed to risks if the counterparties to the contracts are unable to meet the terms of their contracts or if the value of the foreign currency changes unfavorably. The Portfolio’s maximum risk of loss from counterparty credit risk is the unrealized gains or losses on the contracts. This risk is mitigated by having a master netting arrangement between the Portfolio and the counterparty.
Security loans
The Portfolios may lend their securities from time to time in order to earn additional income in the form of fees or interest on securities received as collateral or the investment of any cash received as collateral. The Portfolios continue to receive interest or dividends on the securities loaned. The Portfolios receive collateral in the form of cash or securities with a value at least equal to the value of the securities on loan. The value of the loaned securities is determined at the close of each business day and any additional required collateral is delivered to the Portfolios on the next business day. In a securities lending transaction, the net asset value of the Portfolios will be affected by an increase or decrease in the value of the securities loaned and by an increase or decrease in the value of the instrument in which collateral is invested. The
| | | | |
| 154 | | Wells Fargo Advantage Allocation Funds | | Notes to financial statements (unaudited) |
amount of securities lending activity undertaken by the Portfolios fluctuate from time to time, In the event of default or bankruptcy by the borrower, the Portfolios may be prevented from recovering the loaned securities or gaining access to the collateral or may experience delays or costs in doing so. In addition, the investment of any cash collateral received may lose all or part of its value. The Portfolios have the right under the lending agreement to recover the securities from the borrower on demand.
The Portfolios lend their securities through an unaffiliated securities lending agent. Cash collateral received in connection with its securities lending transactions is invested in Wells Fargo Securities Lending Cash Investments, LLC (the “Cash Collateral Fund”). The Cash Collateral Fund is exempt from registration under Section 3(c)(7) of the 1940 Act and is managed by Funds Management and is subadvised by Wells Capital Management Incorporated (“WellsCap”). Funds Management receives an advisory fee starting at 0.05% and declining to 0.01% as the average daily net assets of the Cash Collateral Fund increase. All of the fees received by Funds Management are paid to WellsCap for its services as subadviser. The Cash Collateral Fund seeks to provide a positive return compared to the daily Fed Funds Open rate by investing in high-quality, U.S. dollar-denominated short-term money market instruments. Cash Collateral Fund investments are fair valued based upon the amortized cost valuation technique. Income earned from investment in the Cash Collateral Fund is included in securities lending income on the Statements of Operations.
When-issued transactions
Each Portfolio may purchase securities on a forward commitment or ‘when-issued’ basis. A Portfolio records a when-issued transaction on the trade date and will segregate assets in an amount at least equal in value to the Portfolio’s commitment to purchase when-issued securities. Securities purchased on a when-issued basis are marked-to-market daily and the Portfolio begins earning interest on the settlement date. Losses may arise due to changes in the market value of the underlying securities or if the counterparty does not perform under the contract.
Term loans
Each Portfolio may invest in term loans. The Portfolio begins earning interest when the loans are funded. The loans pay interest at rates which are periodically reset by reference to a base lending rate plus a spread. The Portfolio assumes the credit risk of the borrower and there could be potential loss to the Portfolio in the event of default by the borrower.
Futures contracts
Certain Portfolios may be subject to interest rate risk and equity price risk in the normal course of pursuing its investment objectives. The Portfolio may buy and sell futures contracts in order to gain exposure to, or protect against, changes in security values and interest rates. The primary risks associated with the use of futures contracts are the imperfect correlation between changes in market values of securities held by the Portfolio and the prices of futures contracts, and the possibility of an illiquid market.
Futures contracts are valued based upon their quoted daily settlement prices when available. The aggregate principal amounts of the contracts are not recorded in the financial statements. Fluctuations in the value of the contracts are recorded in the Statements of Assets and Liabilities as an asset or liability and in the Statements of Operations as unrealized gains or losses until the contracts are closed, at which point they are recorded as net realized gains or losses on futures contracts. With futures contracts, there is minimal counterparty risk to the Portfolio since futures are exchange traded and the exchange’s clearinghouse, as counterparty to all exchange traded futures, guarantees the futures against default.
TBA sale commitments
A Portfolio may enter into To Be Announced (“TBA”) sale commitments to hedge its portfolio positions or to sell mortgage-backed securities it owns under delayed delivery arrangements. Proceeds of TBA sale commitments are not received until the contractual settlement date. During the time a TBA sale commitment is outstanding, equivalent deliverable securities or offsetting TBA purchase commitments, which are deliverable on or before the sale commitment date, are held as “cover” for the transaction. Unsettled TBA sale commitments are valued at the current market value of the underlying securities, generally according to the procedures described under “Securities valuation”. The contract is marked-to-market daily and the change in market value is recorded by the Portfolio as an unrealized gain or loss. If the TBA sale commitment is closed through the acquisition of an offsetting purchase commitment, the Portfolio realizes a gain or loss. If the Portfolio delivers securities under the commitment, the Portfolio realizes a gain or a loss from the sale of the securities based upon the unit price established at the date the commitment was entered into.
Inflation-indexed bonds and TIPS
Certain Portfolios may invest in inflation-indexed bonds, including Treasury inflation-protected securities (TIPS). Inflation-indexed bonds are fixed income securities whose principal value is periodically adjusted according to the rate of inflation. If the index measuring inflation falls, the principal value of inflation-indexed bonds (other than municipal inflation
| | | | | | |
| Notes to financial statements (unaudited) | | Wells Fargo Advantage Allocation Funds | | | 155 | |
indexed bonds and certain corporate inflation-indexed bonds) will be adjusted downward, and consequently the interest payable on these securities (calculated with respect to a smaller principal amount) will be reduced. Repayment of the original bond principal upon maturity (as adjusted for inflation) is guaranteed in the case of U.S. Treasury inflation-indexed bonds. For bonds that do not provide a similar guarantee, the adjusted principal value of the bond repaid at maturity may be less than the original principal. The value of inflation-indexed bonds is expected to change in response to changes in real interest rates. Real interest rates are tied to the relationship between nominal interest rates and the rate of inflation. If nominal interest rates increase at a faster rate than inflation, real interest rates may rise, leading to a decrease in value of inflation-indexed bonds. Inflation-indexed bonds, including TIPS, decline in value when real interest rates rise. In certain interest rate environments, such as when real interest rates are rising faster than nominal interest rates, inflation-indexed bonds may experience greater losses than other fixed income securities with similar durations.
Credit default swaps
Certain Portfolios may be subject to credit risk in the normal course of pursuing its investment objectives. The Portfolio may enter into credit default swap contracts for hedging or speculative purposes to provide or receive a measure of protection against default on a referenced entity, obligation or index or for investment gains. Credit default swaps involve an exchange of a stream of payments for protection against the loss in value of an underlying security or index. Under the terms of the swap, one party acts as a guarantor (referred to as the seller of protection) and receives a periodic stream of payments, provided that there is no credit event, from another party (referred to as the buyer of protection) that is a fixed percentage applied to a notional principal amount over the term of the swap. An index credit default swap references all the names in the index, and if a credit event is triggered, the credit event is settled based on that name’s weight in the index. A credit event includes bankruptcy, failure to pay, obligation default, obligation acceleration, repudiation/moratorium, and restructuring. The Portfolio may enter into credit default swaps as either the seller of protection or the buyer of protection. As the seller of protection, the Portfolio is subject to investment exposure on the notional amount of the swap and has assumed the risk of default of the underlying security or index. As the buyer of protection, the Portfolio could be exposed to risks if the seller of the protection defaults on its obligation to perform, or if there are unfavorable changes in the fluctuation of interest rates. The maximum potential amount of future payments (undiscounted) that the Portfolio as the seller of protection could be required to make under the credit default swap contract would be an amount equal to the notional amount of the swap contract. The Portfolio’s maximum risk of loss from counterparty risk, either as the protection seller or as the protection buyer, is the fair value of the contract. This risk is mitigated by having a master netting arrangement between the Portfolio and the counterparty and by having the counterparty post collateral to cover the Portfolio’s exposure to the counterparty.
If the Portfolio is the seller of protection and a credit event occurs, as defined under the terms of that particular swap agreement, the Portfolio will pay to the buyer of protection the notional amount of the swap and take delivery of the referenced obligation or underlying securities comprising the referenced index. If the Portfolio is the buyer of protection and a credit event occurs, as defined under the terms of that particular swap agreement, the Portfolio will receive from the seller of protection the notional amount of the swap and deliver the referenced obligation or underlying securities comprising the referenced index.
Any premiums paid or received on the transactions are recorded as an asset or liability on the Statements of Assets and Liabilities and amortized. The value of the swap contract is marked-to-market daily based on quotations from an independent pricing service or market makers and any change in value is recorded as an unrealized gain or loss. Periodic payments made or received are recorded as realized gains or losses. In addition, payments received or made as a result of a credit event or termination of the contract are recognized as realized gains or losses.
Certain credit default swap contracts entered into by the Portfolio provide for conditions that result in events of default or termination that enable the counterparty to the agreement to cause an early termination of the transactions under those agreements. Any election by the counterparty to terminate early may impact the amounts reported on the financial statements.
Mortgage dollar roll transactions
The Portfolios may engage in mortgage dollar roll transactions with respect to mortgage-backed securities issued by Government National Mortgage Association (GNMA), Federal National Mortgage Association (FNMA) and Federal Home Loan Mortgage Corporation (FHLMC). In a mortgage dollar roll transaction, a Portfolio sells a mortgage-backed security to a financial institution, such as a bank or broker-dealer and simultaneously agrees to repurchase a substantially similar security from the institution at a later date at an agreed upon price. The mortgage-backed securities that are repurchased will bear the same interest rate as those sold, but generally will be collateralized by different pools of mortgages with different pre-payment histories. During the roll period, a Portfolio foregoes principal and interest paid on the securities. A Portfolio is compensated by the difference between the current sales price and
| | | | |
| 156 | | Wells Fargo Advantage Allocation Funds | | Notes to financial statements (unaudited) |
the forward price for the future purchase as well as by the earnings on the cash proceeds of the initial sale. Mortgage dollar rolls may be renewed without physical delivery of the securities subject to the contract. The Portfolios account for TBA dollar roll transactions as purchases and sales.
Security transactions and income recognition
Securities transactions are recorded on a trade date basis. Realized gains or losses are recorded on the basis of identified cost.
Interest income is accrued daily and bond discounts are accreted and premiums are amortized daily based on the effective interest method. To the extent debt obligations are placed on non-accrual status, any related interest income may be reduced by writing off interest receivables when the collection of all or a portion of interest has become doubtful based on consistently applied procedures. If the issuer subsequently resumes interest payments or when the collectability of interest is reasonably assured, the debt obligation is removed from non-accrual status.
Dividend income is recognized on the ex-dividend date, except for certain dividends from foreign securities, which are recorded as soon as the Portfolio is informed of the ex-dividend date. Dividend income from foreign securities is recorded net of foreign taxes withheld where recovery of such taxes is not assured.
Federal and other taxes
Each Portfolio is treated as a separate entity for federal income tax purposes. The Portfolios are not required to pay federal income taxes on their net investment income and net capital gain as they are treated as partnerships for federal income tax purposes. All interest, dividends, gains and losses of a Portfolio are deemed to have been “passed through” to the interestholders in proportion to their holdings of the Portfolio regardless of whether such interest, dividends and gains have been distributed by the Portfolio.
Each Portfolio’s income and federal excise tax returns and all financial records supporting those returns for the prior three fiscal years are subject to examination by the federal and Delaware revenue authorities. Management has analyzed each Portfolio’s tax positions taken on federal, state, and foreign tax returns for all open tax years and does not believe that there are any uncertain tax positions that require recognition of a tax liability.
3. FAIR VALUATION MEASUREMENTS
Fair value measurements of investments are determined within a framework that has established a fair value hierarchy based upon the various data inputs utilized in determining the value of each Portfolio’s investments. The three-level hierarchy gives the highest priority to unadjusted quoted prices in active markets for identical assets or liabilities (Level 1) and the lowest priority to significant unobservable inputs (Level 3). Each Portfolio’s investments are classified within the fair value hierarchy based on the lowest level of input that is significant to the fair value measurement. The inputs are summarized into three broad levels as follows:
| n | | Level 1 – quoted prices in active markets for identical securities |
| n | | Level 2 – other significant observable inputs (including quoted prices for similar securities, interest rates, prepayment speeds, credit risk, etc.) |
| n | | Level 3 – significant unobservable inputs (including each Portfolio’s own assumptions in determining the fair value of investments) |
The inputs or methodologies used for valuing investments in securities are not necessarily an indication of the risk associated with investing in those securities.
| | | | | | |
| Notes to financial statements (unaudited) | | Wells Fargo Advantage Allocation Funds | | | 157 | |
As of November 30, 2012, the inputs used in valuing investments in securities, which were carried at fair value, were as follows:
| | | | | | | | | | | | | | | | |
| Investments in securities | | Quoted prices (Level 1) | | | Significant other observable inputs (Level 2) | | | Significant unobservable inputs (Level 3) | | | Total | |
C&B Large Cap Value Portfolio | | | | | | | | | | | | | | | | |
| | | | |
Equity securities | | | | | | | | | | | | | | | | |
Common stocks | | $ | 305,220,193 | | | $ | 4,607,741 | | | $ | 0 | | | $ | 309,827,934 | |
Preferred stocks | | | 0 | | | | 3,944,178 | | | | 0 | | | | 3,944,178 | |
| | | | |
Other | | | 0 | | | | 0 | | | | 469,258 | | | | 469,258 | |
| | | | |
Short-term investments | | | | | | | | | | | | | | | | |
Investment companies | | | 1,807,073 | | | | 54,471,494 | | | | 0 | | | | 56,278,567 | |
Total | | $ | 307,027,266 | | | $ | 63,023,413 | | | $ | 469,258 | | | $ | 370,519,937 | |
Diversified Large Cap Growth Portfolio | | | | | | | | | | | | | | | | |
| | | | |
Equity securities | | | | | | | | | | | | | | | | |
Common stocks | | $ | 147,157,159 | | | $ | 0 | | | $ | 0 | | | $ | 147,157,159 | |
| | | | |
Other | | | 0 | | | | 0 | | | | 466,478 | | | | 466,478 | |
| | | | |
Short-term investments | | | | | | | | | | | | | | | | |
Investment companies | | | 1,362,764 | | | | 30,742,017 | | | | 0 | | | | 32,104,781 | |
Total | | $ | 148,519,923 | | | $ | 30,742,017 | | | $ | 466,478 | | | $ | 179,728,418 | |
Emerging Growth Portfolio | | | | | | | | | | | | | | | | |
| | | | |
Equity securities | | | | | | | | | | | | | | | | |
Common stocks | | $ | 908,145,519 | | | $ | 0 | | | $ | 0 | | | $ | 908,145,519 | |
Investment companies | | | 3,272,850 | | | | 0 | | | | 0 | | | | 3,272,850 | |
| | | | |
Other | | | 0 | | | | 0 | | | | 1,438,635 | | | | 1,438,635 | |
| | | | |
Short-term investments | | | | | | | | | | | | | | | | |
Investment companies | | | 14,554,639 | | | | 287,604,201 | | | | 0 | | | | 302,158,840 | |
Total | | $ | 925,973,008 | | | $ | 287,604,201 | | | $ | 1,438,635 | | | $ | 1,215,015,844 | |
Equity Value Portfolio | | | | | | | | | | | | | | | | |
| | | | |
Equity securities | | | | | | | | | | | | | | | | |
Common stocks | | $ | 863,581,645 | | | $ | 0 | | | $ | 0 | | | $ | 863,581,645 | |
| | | | |
Other | | | 0 | | | | 0 | | | | 387,752 | | | | 387,752 | |
| | | | |
Short-term investments | | | | | | | | | | | | | | | | |
Investment companies | | | 12,139,015 | | | | 54,138,746 | | | | 0 | | | | 66,277,761 | |
Total | | $ | 875,720,660 | | | $ | 54,138,746 | | | $ | 387,752 | | | $ | 930,247,158 | |
Index Portfolio | | | | | | | | | | | | | | | | |
| | | | |
Equity securities | | | | | | | | | | | | | | | | |
Common stocks | | $ | 2,462,065,216 | | | $ | 0 | | | $ | 0 | | | $ | 2,462,065,216 | |
Investment companies | | | 2,403,229 | | | | 0 | | | | 0 | | | | 2,403,229 | |
| | | | |
Other | | | 0 | | | | 0 | | | | 1,368,621 | | | | 1,368,621 | |
| | | | |
Short-term investments | | | | | | | | | | | | | | | | |
Investment companies | | | 39,179,893 | | | | 159,290,071 | | | | 0 | | | | 198,469,964 | |
U.S. Treasury securities | | | 3,249,628 | | | | 0 | | | | 0 | | | | 3,249,628 | |
Total | | $ | 2,506,897,966 | | | $ | 159,290,071 | | | $ | 1,368,621 | | | $ | 2,667,556,658 | |
International Equity Portfolio | | | | | | | | | | | | | | | | |
| | | | |
Equity securities | | | | | | | | | | | | | | | | |
Common stocks | | $ | 21,988,461 | | | $ | 0 | | | $ | 0 | | | $ | 21,988,461 | |
| | | | |
Short-term investments | | | | | | | | | | | | | | | | |
Investment companies | | | 327,352 | | | | 1,076,691 | | | | 0 | | | | 1,404,043 | |
Total | | $ | 22,315,813 | | | $ | 1,076,691 | | | $ | 0 | | | $ | 23,392,504 | |
| | | | |
| 158 | | Wells Fargo Advantage Allocation Funds | | Notes to financial statements (unaudited) |
| | | | | | | | | | | | | | | | |
| Investments in securities | | Quoted prices (Level 1) | | | Significant other observable inputs (Level 2) | | | Significant unobservable inputs (Level 3) | | | Total | |
International Growth Portfolio | | | | | | | | | | | | | | | | |
| | | | |
Equity securities | | | | | | | | | | | | | | | | |
Common stocks | | $ | 108,384,886 | | | $ | 0 | | | $ | 0 | | | $ | 108,384,886 | |
Preferred stocks | | | 1,863,480 | | | | 0 | | | | 0 | | | | 1,863,480 | |
| | | | |
Short-term investments | | | | | | | | | | | | | | | | |
Investment companies | | | 1,084,659 | | | | 6,985,505 | | | | 0 | | | | 8,070,164 | |
Total | | $ | 111,333,025 | | | $ | 6,985,505 | | | $ | 0 | | | $ | 118,318,530 | |
International Index Portfolio | | | | | | | | | | | | | | | | |
| | | | |
Equity securities | | | | | | | | | | | | | | | | |
Common stocks | | $ | 21,966,323 | | | $ | 7,919 | | | $ | 0 | | | $ | 21,974,242 | |
Preferred stocks | | | 138,423 | | | | 489 | | | | 0 | | | | 138,912 | |
Rights | | | 0 | | | | 3,952 | | | | 0 | | | | 3,952 | |
| | | | |
Short-term investments | | | | | | | | | | | | | | | | |
Investment companies | | | 0 | | | | 452,217 | | | | 0 | | | | 452,217 | |
Total | | $ | 22,104,746 | | | $ | 464,577 | | | $ | 0 | | | $ | 22,569,323 | |
International Value Portfolio | | | | | | | | | | | | | | | | |
| | | | |
Equity securities | | | | | | | | | | | | | | | | |
Common stocks | | $ | 343,595,905 | | | $ | 3,809,406 | | | $ | 0 | | | $ | 347,405,311 | |
Preferred stocks | | | 3,836,536 | | | | 0 | | | | 0 | | | | 3,836,536 | |
| | | | |
Short-term investments | | | | | | | | | | | | | | | | |
Investment companies | | | 1,479,062 | | | | 13,117,922 | | | | 0 | | | | 14,596,984 | |
Total | | $ | 348,911,503 | | | $ | 16,927,328 | | | $ | 0 | | | $ | 365,838,831 | |
Large Company Value Portfolio | | | | | | | | | | | | | | | | |
| | | | |
Equity securities | | | | | | | | | | | | | | | | |
Common stocks | | $ | 46,374,559 | | | $ | 0 | | | $ | 0 | | | $ | 46,374,559 | |
| | | | |
Other | | | 0 | | | | 0 | | | | 30,133 | | | | 30,133 | |
| | | | |
Short-term investments | | | | | | | | | | | | | | | | |
Investment companies | | | 2,060,814 | | | | 4,010,623 | | | | 0 | | | | 6,071,437 | |
Total | | $ | 48,435,373 | | | $ | 4,010,623 | | | $ | 30,133 | | | $ | 52,476,129 | |
Small Cap Value Portfolio | | | | | | | | | | | | | | | | |
| | | | |
Equity securities | | | | | | | | | | | | | | | | |
Common stocks | | $ | 15,447,346 | | | $ | 0 | | | $ | 0 | | | $ | 15,447,346 | |
Investment companies | | | 363,486 | | | | 0 | | | | 0 | | | | 363,486 | |
Warrants | | | 0 | | | | 43,273 | | | | 0 | | | | 43,273 | |
| | | | |
Short-term investments | | | | | | | | | | | | | | | | |
Investment companies | | | 608,030 | | | | 0 | | | | 0 | | | | 608,030 | |
Total | | $ | 16,418,862 | | | $ | 43,273 | | | $ | 0 | | | $ | 16,462,135 | |
Small Company Growth Portfolio | | | | | | | | | | | | | | | | |
| | | | |
Equity securities | | | | | | | | | | | | | | | | |
Common stocks | | $ | 127,600,070 | | | $ | 0 | | | $ | 0 | | | $ | 127,600,070 | |
| | | | |
Other | | | 0 | | | | 0 | | | | 560,908 | | | | 560,908 | |
| | | | |
Short-term investments | | | | | | | | | | | | | | | | |
Investment companies | | | 3,370,315 | | | | 38,146,194 | | | | 0 | | | | 41,516,509 | |
Total | | $ | 130,970,385 | | | $ | 38,146,194 | | | $ | 560,908 | | | $ | 169,677,487 | |
| | | | | | |
| Notes to financial statements (unaudited) | | Wells Fargo Advantage Allocation Funds | | | 159 | |
| | | | | | | | | | | | | | | | |
| Investments in securities | | Quoted prices (Level 1) | | | Significant other observable inputs (Level 2) | | | Significant unobservable inputs (Level 3) | | | Total | |
Small Company Value Portfolio | | | | | | | | | | | | | | | | |
| | | | |
Equity securities | | | | | | | | | | | | | | | | |
Common stocks | | $ | 166,347,066 | | | $ | 0 | | | $ | 0 | | | $ | 166,347,066 | |
| | | | |
Other | | | 0 | | | | 0 | | | | 392,696 | | | | 392,696 | |
| | | | |
Short-term investments | | | | | | | | | | | | | | | | |
Investment companies | | | 4,320,665 | | | | 55,859,005 | | | | 0 | | | | 60,179,670 | |
Total | | $ | 170,667,731 | | | $ | 55,859,005 | | | $ | 392,696 | | | $ | 226,919,432 | |
Core Bond Portfolio | | | | | | | | | | | | | | | | |
| | | | |
Agency securities | | $ | 0 | | | $ | 1,310,602,423 | | | $ | 0 | | | $ | 1,310,602,423 | |
| | | | |
Asset-backed securities | | | 0 | | | | 520,059,874 | | | | 0 | | | | 520,059,874 | |
| | | | |
Corporate bonds and notes | | | 0 | | | | 709,996,158 | | | | 0 | | | | 709,996,158 | |
| | | | |
Municipal obligations | | | 0 | | | | 40,639,268 | | | | 0 | | | | 40,639,268 | |
| | | | |
Non-agency mortgage backed securities | | | 0 | | | | 247,838,277 | | | | 0 | | | | 247,838,277 | |
| | | | |
U.S. Treasury securities | | | 800,503,979 | | | | 0 | | | | 0 | | | | 800,503,979 | |
| | | | |
Yankee corporate bonds and notes | | | 0 | | | | 269,923,292 | | | | 0 | | | | 269,923,292 | |
| | | | |
Yankee government bonds | | | 0 | | | | 42,082,254 | | | | 0 | | | | 42,082,254 | |
| | | | |
Other | | | 0 | | | | 0 | | | | 1,134,198 | | | | 1,134,198 | |
| | | | |
Short-term investments | | | | | | | | | | | | | | | | |
Investment companies | | | 201,172,161 | | | | 80,871,705 | | | | 0 | | | | 282,043,866 | |
Total | | $ | 1,001,676,140 | | | $ | 3,222,013,251 | | | $ | 1,134,198 | | | $ | 4,224,823,589 | |
Inflation-Protected Bond Portfolio | | | | | | | | | | | | | | | | |
| | | | |
U.S. Treasury securities | | $ | 79,940,330 | | | $ | 0 | | | $ | 0 | | | $ | 79,940,330 | |
| | | | |
Other | | | 0 | | | | 0 | | | | 180,901 | | | | 180,901 | |
| | | | |
Short-term investments | | | | | | | | | | | | | | | | |
Investment companies | | | 643,913 | | | | 1,778,061 | | | | 0 | | | | 2,421,974 | |
Total | | $ | 80,584,243 | | | $ | 1,778,061 | | | $ | 180,901 | | | $ | 82,543,205 | |
Managed Fixed Income Portfolio | | | | | | | | | | | | | | | | |
| | | | |
Agency securities | | $ | 0 | | | $ | 40,450,522 | | | $ | 0 | | | $ | 40,450,522 | |
| | | | |
Asset-backed securities | | | 0 | | | | 6,020,430 | | | | 0 | | | | 6,020,430 | |
| | | | |
Corporate bonds and notes | | | 0 | | | | 34,425,948 | | | | 0 | | | | 34,425,948 | |
| | | | |
Municipal obligations | | | 0 | | | | 11,226,754 | | | | 0 | | | | 11,226,754 | |
| | | | |
Non-agency mortgage backed securities | | | 0 | | | | 16,751,100 | | | | 1,475,724 | | | | 18,226,824 | |
| | | | |
Term loans | | | 0 | | | | 352,316 | | | | 0 | | | | 352,316 | |
| | | | |
U.S. Treasury securities | | | 7,091,387 | | | | 0 | | | | 0 | | | | 7,091,387 | |
| | | | |
Yankee corporate bonds and notes | | | 0 | | | | 1,686,122 | | | | 0 | | | | 1,686,122 | |
| | | | |
Other | | | 0 | | | | 0 | | | | 88,076 | | | | 88,076 | |
| | | | |
Short-term investments | | | | | | | | | | | | | | | | |
Investment companies | | | 3,955,122 | | | | 574,087 | | | | 0 | | | | 4,529,209 | |
Total | | $ | 11,046,509 | | | $ | 111,487,279 | | | $ | 1,563,800 | | | $ | 124,097,588 | |
| | | | |
| 160 | | Wells Fargo Advantage Allocation Funds | | Notes to financial statements (unaudited) |
| | | | | | | | | | | | | | | | |
| Investments in securities | | Quoted prices (Level 1) | | | Significant other observable inputs (Level 2) | | | Significant unobservable inputs (Level 3) | | | Total | |
Stable Income Portfolio | | | | | | | | | | | | | | | | |
| | | | |
Agency securities | | $ | 0 | | | $ | 12,580,296 | | | $ | 0 | | | $ | 12,580,296 | |
| | | | |
Asset-backed securities | | | 0 | | | | 5,250,639 | | | | 0 | | | | 5,250,639 | |
| | | | |
Corporate bonds and notes | | | 0 | | | | 7,932,987 | | | | 0 | | | | 7,932,987 | |
| | | | |
Loan participation | | | 0 | | | | 0 | | | | 387,080 | | | | 387,080 | |
| | | | |
Municipal obligations | | | 0 | | | | 1,226,227 | | | | 0 | | | | 1,226,227 | |
| | | | |
Non-agency mortgage backed securities | | | 0 | | | | 2,860,786 | | | | 675,620 | | | | 3,536,406 | |
| | | | |
Yankee corporate bonds and notes | | | 0 | | | | 866,364 | | | | 0 | | | | 866,364 | |
| | | | |
Other | | | 0 | | | | 0 | | | | 39,356 | | | | 39,356 | |
| | | | |
Short-term investments | | | | | | | | | | | | | | | | |
Investment companies | | | 2,857,608 | | | | 91,700 | | | | 0 | | | | 2,949,308 | |
Total | | $ | 2,857,608 | | | $ | 30,808,999 | | | $ | 1,102,056 | | | $ | 34,768,663 | |
Further details on the major security types listed above can be found in each Portfolio of Investments or Summary Portfolio of Investments.
As of November 30, 2012, the inputs used in valuing each Portfolio’s other financial instruments, which are carried at fair value, were as follows:
| | | | | | | | | | | | | | | | |
| Other financial instruments | | Quoted prices (Level 1) | | | Significant other observable inputs (Level 2) | | | Significant unobservable inputs (Level 3) | | | Total | |
Futures contracts+ | | | | | | | | | | | | | | | | |
Index Portfolio | | $ | (205,915 | ) | | $ | 0 | | | $ | 0 | | | $ | (205,915 | ) |
International Index Portfolio | | | (725 | ) | | | 0 | | | | 0 | | | | (725 | ) |
Stable Income Portfolio | | | (4,278 | ) | | | 0 | | | | 0 | | | | (4,278 | ) |
Credit default swaps* | | | | | | | | | | | | | | | | |
Core Bond Portfolio | | | 0 | | | | 46,587 | | | | 0 | | | | 46,587 | |
| + | Futures contracts are presented at the unrealized gains or losses on the instruments. |
| * | The value of swap contracts consists of unrealized gains or losses and premiums paid/received on swap contracts as reflected on the Statements of Assets and Liabilities. |
Transfers in and transfers out are recognized at the end of the reporting period. For the six months ended November 30, 2012, the Portfolios did not have any transfers into/out of Level 1 or Level 2.
The following is a reconciliation of investments in which significant unobservable inputs (Level 3) were used in determining value for Managed Fixed Income Portfolio:
| | | | | | | | | | | | |
| | | Managed Fixed Income Portfolio | |
| | | Non-agency
mortgage
backed
securities | | | Other | | | Total | |
Balance as of May 31, 2012 | | $ | 1,350,195 | | | $ | 375,000 | | | $ | 1,725,195 | |
Accrued discounts (premiums) | | | 0 | | | | 0 | | | | 0 | |
Realized gains (losses) | | | 0 | | | | 238,580 | | | | 238,580 | |
Change in unrealized gains (losses) | | | 196,429 | | | | (205,973 | ) | | | (9,544 | ) |
Purchases | | | 0 | | | | 0 | | | | 0 | |
Sales | | | (70,900 | ) | | | (319,531 | ) | | | (390,431 | ) |
Transfers into Level 3 | | | 0 | | | | 0 | | | | 0 | |
Transfers out of Level 3 | | | 0 | | | | 0 | | | | 0 | |
Balance as of November 30, 2012 | | $ | 1,475,724 | | | $ | 88,076 | | | $ | 1,563,800 | |
Change in unrealized gains (losses) relating to securities still held at November 30, 2012 | | $ | 160,830 | | | $ | 16,013 | | | $ | 176,843 | |
| | | | | | |
| Notes to financial statements (unaudited) | | Wells Fargo Advantage Allocation Funds | | | 161 | |
The following table summarizes quantitative information about the Managed Fixed Income Portfolio’s Level 3 inputs as of November 30, 2012:
| | | | | | | | | | | | | | |
| Security types | | Fair value at
November 30,
2012 | | | Valuation
technique(s) | | Significant
unobservable
input(s) | | Weighted average | | Range | | Impact to
valuation
from an increase in
input* |
Non-agency mortgage backed securities | | $ | 1,475,724 | | | Adjusted broker quote | | Single broker quote | | N/A | | N/A | | Increase |
| | | | | | | | | Option adjusted spread (OAS) | | 831 basis points | | 831 basis points | | Decrease |
Other | | $ | 88,076 | | | Liquidity discount | | Discounts for the specific qualities of a security | | 12% | | 10% to 50% | | Decrease |
| * | Unless otherwise noted, this column represents the directional change in the fair value of the Level 3 investments that would result from an increase to the corresponding unobservable input. A decrease to the unobservable input would have the opposite effect. Significant increases and decreases in these inputs in isolation could result in significantly higher or lower fair value measurements. |
The following is a reconciliation of investments in which significant unobservable inputs (Level 3) were used in determining value for Stable Income Portfolio:
| | | | | | | | | | | | | | | | |
| | | Stable Income Portfolio | |
| | | Loan
participation | | | Non-agency
mortgage
backed
securities | | | Other | | | Total | |
Balance as of May 31, 2012 | | $ | 423,589 | | | $ | 629,312 | | | $ | 167,564 | | | $ | 1,220,465 | |
Accrued discounts (premiums) | | | 49 | | | | 0 | | | | 0 | | | | 49 | |
Realized gains (losses) | | | (13 | ) | | | 0 | | | | 106,606 | | | | 106,593 | |
Change in unrealized gains (losses) | | | 6,151 | | | | 101,326 | | | | (92,036 | ) | | | 15,441 | |
Purchases | | | 0 | | | | 0 | | | | 0 | | | | 0 | |
Sales | | | (42,696 | ) | | | (55,018 | ) | | | (142,778 | ) | | | (240,492 | ) |
Transfers into Level 3 | | | 0 | | | | 0 | | | | 0 | | | | 0 | |
Transfers out of Level 3 | | | 0 | | | | 0 | | | | 0 | | | | 0 | |
Balance as of November 30, 2012 | | $ | 387,080 | | | $ | 675,620 | | | $ | 39,356 | | | $ | 1,102,056 | |
Change in unrealized gains (losses) relating to securities still held at November 30, 2012 | | $ | 7,156 | | | $ | 5,580 | | | $ | 19,639 | | | $ | 32,375 | |
The following table summarizes quantitative information about the Stable Income Portfolio’s Level 3 inputs as of November 30, 2012:
| | | | | | | | | | | | | | |
| Security types | | Fair value at
November 30,
2012 | | | Valuation
technique(s) | | Significant
unobservable
input(s) | | Weighted average | | Range | | Impact to
valuation
from
an increase in
input* |
Loan participation | | $ | 387,080 | | | Adjusted broker quote | | Single broker quote | | N/A | | N/A | | Increase |
| | | | | | | | | Option adjusted spread (OAS) | | 175 basis points | | 20 to 538 basis points | | Decrease |
Non-agency mortgage backed securities | | $ | 675,620 | | | Adjusted broker quote | | Single broker quote | | N/A | | N/A | | Increase |
| | | | | | | | | Option adjusted spread (OAS) | | 832 basis points | | 831 to 833 basis points | | Decrease |
Other | | $ | 39,356 | | | Liquidity discount | | Discounts for the specific qualities of a security | | 12% | | 10% to 50% | | Decrease |
| * | Unless otherwise noted, this column represents the directional change in the fair value of the Level 3 investments that would result from an increase to the corresponding unobservable input. A decrease to the unobservable input would have the opposite effect. Significant increases and decreases in these inputs in isolation could result in significantly higher or lower fair value measurements. |
| | | | |
| 162 | | Wells Fargo Advantage Allocation Funds | | Notes to financial statements (unaudited) |
4. TRANSACTIONS WITH AFFILIATES AND OTHER EXPENSES
Advisory fees
The Trust has entered into an advisory contract with Funds Management, an indirect wholly owned subsidiary of Wells Fargo & Company (“Wells Fargo”). The adviser is responsible for implementing investment policies and guidelines and for supervising the subadvisers, who are responsible for day-to-day portfolio management of the Portfolios.
Funds Management has retained the services of certain subadvisers to provide daily portfolio management to the Portfolios. Funds Management has engaged WellsCap (an affiliate of Funds Management), Peregrine Capital Management, Inc. (an affiliate of Funds Management), Artisan Partners Limited Partnership, Cooke & Bieler, L.P., Galliard Capital Management, Inc. (an affiliate of Funds Management), LSV Asset Management, SSgA Funds Management, Inc., Systematic Financial Management, L.P., Golden Capital Management, LLC (an affiliate of Funds Management) and Phocas Financial Corporation as subadvisers.
Pursuant to the contract, Funds Management is entitled to receive an annual advisory fee which is calculated based on the average daily net assets of each Portfolio. The fees for subadvisory services are borne by Funds Management. The subadvisers are each entitled to receive from Funds Management an annual subadvisory fee which is calculated based on the average daily net assets of each Portfolio.
| | | | | | | | | | | | | | | | | | | | | | | | |
| | | Advisory fee | | Effective rate for
the six
months ended November 30, 2012 | | | Subadviser | | Subadvisory Fee | |
| | | starting at | | | declining to | | | | starting at | | | declining to | |
C&B Large Cap Value Portfolio | | | 0.65 | % | | | 0.55 | % | | | | | 0.65 | % | | Cooke & Bieler, L.P. | | | 0.45 | % | | | 0.30 | % |
Diversified Large Cap Growth Portfolio | | | 0.65 | | | | 0.55 | | | | | | 0.65 | | | WellsCap | | | 0.35 | | | | 0.15 | |
Emerging Growth Portfolio | | | 0.80 | | | | 0.70 | | | | | | 0.79 | | | WellsCap | | | 0.55 | | | | 0.40 | |
Equity Value Portfolio | | | 0.65 | | | | 0.55 | | | | | | 0.64 | | | Systematic Financial Management, L.P. | | | 0.30 | | | | 0.10 | |
Index Portfolio | | | 0.10 | | | | 0.05 | | | | | | 0.09 | | | Golden Capital Management, LLC | | | 0.05 | | | | 0.02 | |
International Equity Portfolio | | | 0.85 | | | | 0.70 | | | | | | 0.85 | | | WellsCap | | | 0.45 | | | | 0.40 | |
International Growth Portfolio | | | 0.85 | | | | 0.70 | | | | | | 0.85 | | | Artisan Partners Limited Partnership | | | 0.80 | | | | 0.50 | |
International Index Portfolio | | | 0.35 | | | | 0.30 | | | | | | 0.35 | | | SSgA Funds Management | | | 0.08 | | | | 0.06 | |
International Value Portfolio | | | 0.85 | | | | 0.70 | | | | | | 0.85 | | | LSV Asset Management | | | 0.35 | | | | 0.30 | |
Large Company Value Portfolio | | | 0.65 | | | | 0.55 | | | | | | 0.65 | | | Phocas Financial Corporation | | | 0.29 | | | | 0.20 | |
Small Cap Value Portfolio | | | 0.80 | | | | 0.70 | | | | | | 0.80 | | | WellsCap | | | 0.55 | | | | 0.40 | |
Small Company Growth Portfolio | | | 0.80 | | | | 0.70 | | | | | | 0.80 | | | Peregrine Capital Management, Inc. | | | 0.90 | | | | 0.55 | |
Small Company Value Portfolio | | | 0.80 | | | | 0.70 | % | | | | | 0.80 | | | Peregrine Capital Management, Inc. | | | * | | | | * | |
Core Bond Portfolio | | | 0.40 | | | | 0.30 | | | | | | 0.35 | | | WellsCap | | | 0.20 | | | | 0.10 | |
Inflation-Protected Bond Portfolio | | | 0.40 | | | | 0.30 | | | | | | 0.40 | | | WellsCap | | | 0.20 | | | | 0.10 | |
Managed Fixed Income Portfolio | | | 0.40 | | | | 0.30 | | | | | | 0.40 | | | Galliard Capital Management, Inc. | | | 0.20 | | | | 0.10 | |
Stable Income Portfolio | | | 0.35 | ** | | | 0.25 | ** | | | | | 0.38 | | | Galliard Capital Management, Inc. | | | 0.15 | | | | 0.05 | |
| * | For Small Company Value Portfolio, the subadvisory fee starts at 0.50% and increases to 0.75% as its average net assets increase. |
| ** | Prior to October 1, 2012, Stable Income Portfolio paid Funds Management an advisory fee which started at 0.40% and declined to 0.30% as average daily net assets increased. |
Funds Management has voluntarily waived and/or reimbursed advisory fees to the extent necessary to maintain certain net operating expense ratios for the Portfolios.
| | | | | | |
| Notes to financial statements (unaudited) | | Wells Fargo Advantage Allocation Funds | | | 163 | |
5. INVESTMENT PORTFOLIO TRANSACTIONS
Purchases and sales of investments, excluding short-term securities, for the six months ended November 30, 2012 were as follows:
| | | | | | | | | | | | | | | | |
| | | Purchases at Cost | | | Sales proceeds | |
| | | U.S. Government | | | Non-U.S. Government | | | U.S. Government | | | Non-U.S. Government | |
C&B Large Cap Value Portfolio | | $ | 0 | | | $ | 18,698,560 | | | $ | 0 | | | $ | 42,273,724 | |
Diversified Large Cap Growth Portfolio | | | 0 | | | | 42,349,741 | | | | 0 | | | | 52,786,863 | |
Emerging Growth Portfolio | | | 0 | | | | 316,181,528 | | | | 0 | | | | 394,757,830 | |
Equity Value Portfolio | | | 0 | | | | 404,791,661 | | | | 0 | | | | 620,737,271 | |
Index Portfolio | | | 0 | | | | 58,926,423 | | | | 0 | | | | 111,509,451 | |
International Equity Portfolio | | | 0 | | | | 5,139,346 | | | | 0 | | | | 6,737,313 | |
International Growth Portfolio | | | 0 | | | | 22,489,806 | | | | 0 | | | | 32,106,881 | |
International Index Portfolio | | | 0 | | | | 347,750 | | | | 0 | | | | 4,319,702 | |
International Value Portfolio | | | 0 | | | | 56,665,560 | | | | 0 | | | | 28,672,875 | |
Large Company Value Portfolio | | | 0 | | | | 15,805,760 | | | | 0 | | | | 23,403,212 | |
Small Cap Value Portfolio | | | 0 | | | | 7,639,744 | | | | 0 | | | | 42,453,635 | |
Small Company Growth Portfolio | | | 0 | | | | 71,583,294 | | | | 0 | | | | 113,667,326 | |
Small Company Value Portfolio | | | 0 | | | | 63,865,400 | | | | 0 | | | | 102,780,561 | |
Core Bond Portfolio | | | 8,799,558,293 | | | | 2,102,279,294 | | | | 9,103,894,325 | | | | 1,844,969,083 | |
Inflation-Protected Bond Portfolio | | | 7,008,666 | | | | 0 | | | | 11,030,377 | | | | 0 | |
Managed Fixed Income Portfolio | | | 27,645,136 | | | | 4,110,948 | | | | 31,055,695 | | | | 18,265,365 | |
Stable Income Portfolio | | | 0 | | | | 4,066,720 | | | | 476,521 | | | | 4,446,977 | |
6. DERIVATIVE TRANSACTIONS
During the six months ended November 30, 2012, Index Portfolio and International Index Portfolio used uninvested cash to enter into futures contracts to gain market exposure. During the six months ended November 30, 2012, Stable Income Portfolio entered into futures contracts to speculate on interest rates and to help shorten or lengthen the duration of the portfolio.
At November 30, 2012, the Portfolios had long and short futures contracts outstanding as follows:
| | | | | | | | | | | | | | | | |
| | | Expiration date | | Contracts | | Type | | Contract value at
November 30, 2012 | | | Unrealized losses | |
Index Portfolio | | 12-20-12 | | 133 Long | | S&P 500 Index | | | | $ | 47,028,800 | | | $ | (205,915 | ) |
International Index Portfolio | | 12-21-12 | | 5 Long | | MSCI EAFE E-Mini Index | | | | | 389,825 | | | | (725 | ) |
Stable Income Portfolio | | 3-28-13 | | 20 Short | | 5-Year U.S. Treasury Notes | | | | | 2,494,375 | | | | (4,728 | ) |
The receivable and payable for daily variation margin on open futures contracts reflected in the Statements of Assets and Liabilities only represents the current day’s variation margin.
As of November 30, 2012, International Index Portfolio and Stable Income Portfolio had segregated $56,719 and $11,000, respectively, as cash collateral for open futures contracts.
| | | | |
| 164 | | Wells Fargo Advantage Allocation Funds | | Notes to financial statements (unaudited) |
The Portfolios had average notional amounts in futures contracts outstanding during the year ended November 30, 2012 as follows:
| | | | |
| | | Long contracts | | Short contracts |
Index Portfolio | | $37,388,819 | | $0 |
International Index Portfolio | | 478,653 | | 0 |
Stable Income Portfolio | | 0 | | 2,496,761 |
Core Bond Portfolio entered into credit default swap contracts as a substitute for taking a position in the underlying security or basket of securities or to potentially enhance the Portfolio’s total return.
At November 30, 2012, Core Bond Portfolio had the following credit default swap contracts outstanding:
Credit default swaps on debt obligations – Buy protection
| | | | | | | | | | | | | | | | | | | | | | | | | | | | |
Expiration date | | Counterparty | | Reference debt obligation | | Rating of
reference
debt
obligation* | | | Notional
amount | | | Fixed
payments
made | | | Value | | | Upfront
premiums
paid/
(received) | | | Unrealized
losses | |
| 12-20-16 | | Citibank | | Prudential Financial Incorporated, 4.50%,
7-15-13 | | | A | | | $ | 5,000,000 | | | | 1.00 | % | | $ | 74,385 | | | $ | 286,257 | | | $ | (211,872 | ) |
| 6-20-17 | | Citibank | | Mondelez International Incorporated, 6.50%,
8-11-17 | | | BBB- | | | | 5,000,000 | | | | 1.00 | | | | (158,755 | ) | | | (114,158 | ) | | | (44,597 | ) |
Credit default swaps on debt obligations – Sell protection
| | | | | | | | | | | | | | | | | | | | | | | | | | | | |
| Expiration date | | Counterparty | | Reference debt obligation | | Rating of
reference
debt
obligation* | | | Notional
amount | | | Fixed
payments
received | | | Value | | | Upfront
premiums
paid | | | Unrealized
gains | |
| 3-20-17 | | Citibank | | Coca-Cola Company,
5.35%, 11-15-17 | | | AA- | | | $ | 10,000,000 | | | | 1.00 | % | | $ | 293,701 | | | $ | 207,876 | | | $ | 85,825 | |
| * | Reflects the ratings of a nationally recognized ratings agency at period end. The credit rating serves as an indicator of the current status of the payment/performance risk of the credit derivative. A rating of D would most likely indicate a trigger event of default has occurred although circumstances including bankruptcy, failure to pay, obligation default, obligation acceleration, repudiation/moratorium and restructuring may also cause a credit event to take place. |
Credit default swaps on an index – Buy protection
| | | | | | | | | | | | | | | | | | | | | | | | |
| Expiration date | | Counterparty | | Reference index | | Notional
amount | | | Fixed
payments
made | | | Value | | | Upfront
premiums
paid | | | Unrealized
losses | |
| 12-20-16 | | Barclays | | Markit CDX North America Investment Grade 17 Index | | $ | 5,000,000 | | | | 1.00 | % | | $ | (54,248 | ) | | $ | 78,997 | | | $ | (133,245 | ) |
| 12-20-16 | | Barclays | | Markit CDX North America Investment Grade 17 Index | | | 5,000,000 | | | | 1.00 | | | | (54,248 | ) | | | 39,548 | | | | (93,796 | ) |
| 12-20-16 | | Citibank | | Markit CDX North America Investment Grade 17 Index | | | 5,000,000 | | | | 1.00 | | | | (54,248 | ) | | | 75,324 | | | | (129,572 | ) |
Core Bond Portfolio had an average notional balance on credit default swaps of $38,770,492 during the six months ended November 30, 2012.
Core Bond Portfolio's credit default swap contracts may contain provisions for early termination in the event the net assets of the Portfolio declines below specific levels identified by the counterparty. If these levels are triggered, the counterparty may terminate the transaction and seek payment or request full collateralization of the credit default swap transactions in net liability positions. On November 30, 2012, the aggregate fair value of credit default swap contracts with net asset contingent features that were in a liability positions amounted to $613,082 for Core Bond Portfolio.
The fair value, realized gains or losses and change in unrealized gains or losses on derivative instruments are reflected in the appropriate financial statements.
| | | | | | |
| Notes to financial statements (unaudited) | | Wells Fargo Advantage Allocation Funds | | | 165 | |
7. INDEMNIFICATION
Under the Trust’s organizational documents, the officers and directors are indemnified against certain liabilities that may arise out of performance of their duties to the Trust. Additionally, in the normal course of business, the Trust may enter into contracts with service providers that contain a variety of indemnification clauses. The Trust’s maximum exposure under these arrangements is dependent on future claims that may be made against the Portfolios and, therefore, cannot be estimated.
8. NEW ACCOUNTING PRONOUNCEMENT
In December 2011, the Financial Accounting Standards Board (“FASB”) issued Accounting Standard Update (“ASU”) No. 2011-11, Disclosures about Offsetting Assets and Liabilities. ASU 2011-11, which amends FASB ASC Topic 210, Balance Sheet, creates new disclosure requirements which require entities to disclose both gross and net information for derivatives and other financial instruments that are either offset in the Statement of Assets and Liabilities or subject to an enforceable master netting arrangement or similar agreement. The disclosure requirements are effective for interim and annual reporting periods beginning on or after January 1, 2013. Management is currently assessing the potential impact, in addition to expanded financial statement disclosure, that may result from adopting this ASU.
| | | | |
| 166 | | Wells Fargo Advantage Allocation Funds | | Other information (unaudited) |
PROXY VOTING INFORMATION
A description of the policies and procedures used to determine how to vote proxies relating to portfolio securities is available without charge, upon request, by calling 1-800-222-8222, visiting our website at wellsfargoadvantagefunds.com, or visiting the SEC website at sec.gov. Information regarding how the proxies related to portfolio securities were voted during the most recent 12-month period ended June 30 is available without charge on the website at wellsfargoadvantagefunds.com or by visiting the SEC website at sec.gov.
PORTFOLIO HOLDINGS INFORMATION
The complete portfolio holdings for the Funds are publicly available on the website (wellsfargoadvantagefunds.com) on a monthly, 30-day or more delayed basis. In addition, top ten holdings information is publicly available on the website on a monthly, seven-day or more delayed basis. Each Fund and Portfolio files its complete schedule of portfolio holdings with the SEC for the first and third quarters of each fiscal year on Form N-Q, which is available without charge by visiting the SEC website at sec.gov. In addition, each Fund’s and Portfolio’s Form N-Q may be reviewed and copied at the SEC’s Public Reference Room in Washington, DC, and at regional offices in New York City, at 233 Broadway, and in Chicago, at 175 West Jackson Boulevard, Suite 900. Information about the Public Reference Room may be obtained by calling 1-800-SEC-0330.
| | | | | | |
| Other information (unaudited) | | Wells Fargo Advantage Allocation Funds | | | 167 | |
BOARD OF TRUSTEES AND OFFICERS
Each of the Trustees and Officers listed in the table below acts in identical capacities for the Wells Fargo Advantage family of funds, which consists of 138 funds1 comprising the Wells Fargo Funds Trust, Wells Fargo Variable Trust, Wells Fargo Master Trust and four closed-end funds (collectively the “Fund Complex”). This table should be read in conjunction with the Prospectus and the Statement of Additional Information2. All of the Trustees are also Members of the Audit and Governance Committees of each Trust in the Fund Complex. The mailing address of each Trustee and Officer is 525 Market Street, 12th Floor, San Francisco, CA 94105. Each Trustee and Officer serves an indefinite term, however, each Trustee serves such term until reaching the mandatory retirement age established by the Trustees.
Independent Trustees
| | | | | | |
Name and year of birth | | Position held and length of service* | | Principal occupations during past five years | | Other directorships during
past five years |
Peter G. Gordon
(Born 1942) | | Trustee, since 1998; Chairman, since 2005 | | Co-Founder, Retired Chairman, President and CEO of Crystal Geyser Water Company. Trustee Emeritus, Colby College | | Asset Allocation Trust |
Isaiah Harris, Jr.
(Born 1952) | | Trustee, since 2009 | | Retired. Prior thereto, President and CEO of BellSouth Advertising and Publishing Corp. from 2005 to 2007. Emeritus member of the Iowa State University Foundation Board of Governors. Emeritus Member of the Advisory Board of Iowa State University School of Business. Mr. Harris is a certified public accountant. | | CIGNA Corporation; Deluxe Corporation; Asset Allocation Trust |
Judith M. Johnson
(Born 1949) | | Trustee, since 2008; Audit Committee Chairman, since 2008 | | Retired. Prior thereto, Chief Executive Officer and Chief Investment Officer of Minneapolis Employees Retirement Fund from 1996 to 2008. Ms. Johnson is an attorney, certified public accountant and a certified managerial accountant. | | Asset Allocation Trust |
Leroy Keith, Jr.
(Born 1939) | | Trustee, since 2010 | | Chairman, Bloc Global Services (development and construction). Trustee of the Evergreen Funds from 1983 to 2010. Former Managing Director, Almanac Capital Management (commodities firm), former Partner, Stonington Partners, Inc. (private equity fund), former Director, Obagi Medical Products Co. and former Director, Lincoln Educational Services. | | Trustee, Virtus Fund Complex (consisting of 40 portfolios as of 12/31/11); Asset Allocation Trust |
David F. Larcker
(Born 1950) | | Trustee, since 2009 | | James Irvin Miller Professor of Accounting at the Graduate School of Business, Stanford University, Director of Corporate Governance Research Program and Senior Faculty of The Rock Center for Corporate Governance since 2006. From 2005 to 2008, Professor of Accounting at the Graduate School of Business, Stanford University. | | Asset Allocation Trust |
Olivia S. Mitchell
(Born 1953) | | Trustee, since 2006 | | International Foundation of Employee Benefit Plans Professor, Wharton School of the University of Pennsylvania since 1993. Director of Wharton’s Pension Research Council and Boettner Center on Pensions & Retirement Research, and Research Associate at the National Bureau of Economic Research. | | Asset Allocation Trust |
Timothy J. Penny
(Born 1951) | | Trustee, since 1996 | | President and CEO of Southern Minnesota Initiative Foundation, a non-profit organization, since 2007 and Senior Fellow at the Humphrey Institute Policy Forum at the University of Minnesota since 1995. Member of the Board of Trustees of NorthStar Education Finance, Inc., a non-profit organization, since 2007. | | Asset Allocation Trust |
| | | | |
| 168 | | Wells Fargo Advantage Allocation Funds | | Other information (unaudited) |
| | | | | | |
Name and year of birth | | Position held and length of service* | | Principal occupations during past five years | | Other directorships during
past five years |
Michael S. Scofield
(Born 1943) | | Trustee, since 2010 | | Served on the Investment Company Institute’s Board of Governors and Executive Committee from 2008-2011 as well the Governing Council of the Independent Directors Council from 2006-2011 and the Independent Directors Council Executive Committee from 2008-2011. Chairman of the IDC from 2008-2010. Institutional Investor (Fund Directions) Trustee of Year in 2007. Trustee of the Evergreen Funds (and its predecessors) from 1984 to 2010. Chairman of the Evergreen Funds from 2000-2010. Former Trustee of the Mentor Funds. Retired Attorney, Law Offices of Michael S. Scofield. | | Asset Allocation Trust |
Donald C. Willeke
(Born 1940) | | Trustee, since 1996 | | Principal of the law firm of Willeke & Daniels. General Counsel of the Minneapolis Employees Retirement Fund from 1984 until its consolidation into the Minnesota Public Employees Retirement Association on June 30, 2010. Director, General Counsel, and Vice Chair of The Tree Trust (non-profit corporation). Director and General Counsel of The American Chestnut Foundation (non-profit corporation). | | Asset Allocation Trust |
| * | Length of service dates reflect the Trustee’s commencement of service with the Trust’s predecessor entities, where applicable. |
Officers
| | | | | | |
Name and year of birth | | Position held and
length of service | | Principal occupations during past five years | | |
Karla M. Rabusch
(Born 1959) | | President, since 2003 | | Executive Vice President of Wells Fargo Bank, N.A. and President of Wells Fargo Funds Management, LLC since 2003. | | |
Jeremy DePalma1
(Born 1974) | | Treasurer, since 2012; Assistant Treasurer, since 2009 | | Senior Vice President of Wells Fargo Funds Management, LLC since 2009. Senior Vice President of Evergreen Investment Management Company, LLC from 2008 to 2010. Vice President, Evergreen Investment Services, Inc. from 2004 to 2007. Head of the Fund Reporting and Control Team within Fund Administration from 2005 to 2010. | | |
Nancy Wiser1
(Born 1967) | | Treasurer, since 2012 | | Executive Vice President of Wells Fargo Funds Management, LLC since 2011. Chief Operating Officer and Chief Compliance Officer at LightBox Capital Management LLC, from 2008 to 2011. Owned and operated a consulting business providing services to various hedge funds including acting as Chief Operating Officer and Chief Compliance Officer for a hedge fund from 2007 to 2008. Chief Operating Officer and Chief Compliance Officer of GMN Capital LLC from 2006 to 2007. | | |
C. David Messman
(Born 1960) | | Secretary, since 2000; Chief Legal Officer, since 2003 | | Senior Vice President and Secretary of Wells Fargo Funds Management, LLC since 2001. Vice President and Managing Counsel of Wells Fargo Bank, N.A. since 1996. | | |
Debra Ann Early
(Born 1964) | | Chief Compliance Officer, since 2007 | | Chief Compliance Officer of Wells Fargo Funds Management, LLC since 2007. Chief Compliance Officer of Parnassus Investments from 2005 to 2007. Chief Financial Officer of Parnassus Investments from 2004 to 2007. | | |
David Berardi
(Born 1975) | | Assistant Treasurer, since 2009 | | Vice President of Wells Fargo Funds Management, LLC since 2009. Vice President of Evergreen Investment Management Company, LLC from 2008 to 2010. Assistant Vice President of Evergreen Investment Services, Inc. from 2004 to 2008. Manager of Fund Reporting and Control for Evergreen Investment Management Company, LLC from 2004 to 2010. | | |
| 1. | Jeremy DePalma acts as Treasurer of Conservative Allocation Fund, Growth Balanced Fund, Moderate Balanced Fund, International Equity Portfolio, International Growth Portfolio, International Index Portfolio and International Value Portfolio and Assistant Treasurer of the remaining funds in this shareholder report. In addition, Jeremy DePalma acts as Treasurer of 54 other funds and Assistant Treasurer of 64 other funds in the Fund Complex. Nancy Wiser serves as Treasurer of the remaining funds in this shareholder report as well as 64 other funds in the Fund Complex. |
| 2. | The Statement of Additional Information includes additional information about the Trustees and is available, without charge, upon request, by calling
1-800-222-8222 or by visiting the website at wellsfargoadvantagefunds.com. |
| | | | | | |
| List of abbreviations | | Wells Fargo Advantage Allocation Funds | | | 169 | |
The following is a list of common abbreviations for terms and entities that may have appeared in this report.
| ACB | — Agricultural Credit Bank |
| ADR | — American depositary receipt |
| ADS | — American depositary shares |
| AGC-ICC | — Assured Guaranty Corporation - Insured Custody Certificates |
| AGM | — Assured Guaranty Municipal |
| AMBAC | — American Municipal Bond Assurance Corporation |
| AMT | — Alternative minimum tax |
| BAN | — Bond anticipation notes |
| BHAC | — Berkshire Hathaway Assurance Corporation |
| CAB | — Capital appreciation bond |
| CCAB | — Convertible capital appreciation bond |
| CDA | — Community Development Authority |
| CDO | — Collateralized debt obligation |
| COP | — Certificate of participation |
| DRIVER | — Derivative inverse tax-exempt receipts |
| DW&P | — Department of Water & Power |
| DWR | — Department of Water Resources |
| ECFA | — Educational & Cultural Facilities Authority |
| EDA | — Economic Development Authority |
| EDFA | — Economic Development Finance Authority |
| ETF | — Exchange-traded fund |
| FDIC | — Federal Deposit Insurance Corporation |
| FFCB | — Federal Farm Credit Banks |
| FGIC | — Financial Guaranty Insurance Corporation |
| FGLMC | — Federal Government Loan Mortgage Corporation |
| FHA | — Federal Housing Administration |
| FHLB | — Federal Home Loan Bank |
| FHLMC | — Federal Home Loan Mortgage Corporation |
| FICO | — The Financing Corporation |
| FNMA | — Federal National Mortgage Association |
| GDR | — Global depositary receipt |
| GNMA | — Government National Mortgage Association |
| HCFR | — Healthcare facilities revenue |
| HEFA | — Health & Educational Facilities Authority |
| HEFAR | — Higher education facilities authority revenue |
| HFA | — Housing Finance Authority |
| HFFA | — Health Facilities Financing Authority |
| IBC | — Insured bond certificate |
| IDA | — Industrial Development Authority |
| IDAG | — Industrial Development Agency |
| IDR | — Industrial development revenue |
| KRW | — Republic of Korea won |
| LIBOR | — London Interbank Offered Rate |
| LLC | — Limited liability company |
| LLP | — Limited liability partnership |
| MBIA | — Municipal Bond Insurance Association |
| MFHR | — Multifamily housing revenue |
| MSTR | — Municipal securities trust receipts |
| MUD | — Municipal Utility District |
| NATL-RE | — National Public Finance Guarantee Corporation |
| PCFA | — Pollution Control Financing Authority |
| PCL | — Public Company Limited |
| PCR | — Pollution control revenue |
| PFA | — Public Finance Authority |
| PFFA | — Public Facilities Financing Authority |
| PFOTER | — Puttable floating option tax-exempt receipts |
| plc | — Public limited company |
| PUTTER | — Puttable tax-exempt receipts |
| R&D | — Research & development |
| RDA | — Redevelopment Authority |
| RDFA | — Redevelopment Finance Authority |
| REIT | — Real estate investment trust |
| ROC | — Reset option certificates |
| SAVRS | — Select auction variable rate securities |
| SBA | — Small Business Authority |
| SFHR | — Single-family housing revenue |
| SFMR | — Single-family mortgage revenue |
| SPA | — Standby purchase agreement |
| SPDR | — Standard & Poor’s Depositary Receipts |
| STRIPS | — Separate trading of registered interest and principal securities |
| TAN | — Tax anticipation notes |
| TIPS | — Treasury inflation-protected securities |
| TRAN | — Tax revenue anticipation notes |
| TCR | — Transferable custody receipts |
| TTFA | — Transportation Trust Fund Authority |
| TVA | — Tennessee Valley Authority |
| XLCA | — XL Capital Assurance |
This page is intentionally left blank.


For more information
More information about Wells Fargo Advantage Funds is available free upon request. To obtain literature, please write, email, visit the Fund’s website, or call:
Wells Fargo Advantage Funds
P.O. Box 8266
Boston, MA 02266-8266
Email: wfaf@wellsfargo.com
Website: wellsfargoadvantagefunds.com
Individual investors: 1-800-222-8222
Retail investment professionals: 1-888-877-9275
Institutional investment professionals: 1-866-765-0778
This report and the financial statements contained herein are submitted for the general information of the shareholders of Wells Fargo Advantage Funds. If this report is used for promotional purposes, distribution of the report must be accompanied or preceded by a current prospectus. For a current prospectus and, if available, a summary prospectus containing more complete information, including charges and expenses, call 1-800-222-8222 or visit the Fund’s website at wellsfargoadvantagefunds.com. Please consider the investment objectives, risks, charges, and expenses of the investment carefully before investing. This and other information about Wells Fargo Advantage Funds can be found in the current prospectus. Read the prospectus carefully before you invest or send money.
Wells Fargo Funds Management, LLC, a wholly owned subsidiary of Wells Fargo & Company, provides investment advisory and administrative services for Wells Fargo Advantage Funds. Other affiliates of Wells Fargo & Company provide subadvisory and other services for the Funds. The Funds are distributed by Wells Fargo Funds Distributor, LLC, Member FINRA/SIPC, an affiliate of Wells Fargo & Company.
NOT FDIC INSURED ¡ NO BANK GUARANTEE ¡ MAY LOSE VALUE
© 2013 Wells Fargo Funds Management, LLC. All rights reserved.
| | |
 | | 213709 01-13 SAAFNLD/SAR109 11-12 |

Wells Fargo Advantage Equity Gateway Funds

Semi-Annual Report
November 30, 2012
| n | | Wells Fargo Advantage C&B Large Cap Value Fund |
| n | | Wells Fargo Advantage Diversified Equity Fund |
| n | | Wells Fargo Advantage Diversified Small Cap Fund |
| n | | Wells Fargo Advantage Emerging Growth Fund |
| n | | Wells Fargo Advantage Equity Value Fund |
| n | | Wells Fargo Advantage Index Fund |
| n | | Wells Fargo Advantage International Value Fund |
| n | | Wells Fargo Advantage Small Company Growth Fund |
| n | | Wells Fargo Advantage Small Company Value Fund |

Reduce clutter. Save trees.
Sign up for electronic delivery of prospectuses and shareholder reports at wellsfargo.com/advantagedelivery
Contents
The views expressed and any forward-looking statements are as of November 30, 2012, unless otherwise noted, and are those of the Fund managers and/or Wells Fargo Funds Management, LLC. Discussions of individual securities, or the markets generally, or any Wells Fargo Advantage Fund are not intended as individual recommendations. Future events or results may vary significantly from those expressed in any forward-looking statements; the views expressed are subject to change at any time in response to changing circumstances in the market. Wells Fargo Funds Management, LLC, disclaims any obligation to publicly update or revise any views expressed or forward-looking statements.
NOT FDIC INSURED ¡ NO BANK GUARANTEE ¡ MAY LOSE VALUE

Wells Fargo investment history
| | |
| 1932 | | Keystone creates one of the first mutual fund families. |
| 1971 | | Wells Fargo & Company introduces one of the first institutional index funds. |
| 1978 | | Wells Fargo applies Markowitz and Sharpe’s research on Modern Portfolio Theory to introduce one of the industry’s first tactical asset allocation models in institutional separately managed accounts. |
| 1984 | | Wells Fargo Stagecoach Funds launches its first asset allocation fund. |
| 1989 | | The Tactical Asset Allocation (TAA) Model is first applied to Wells Fargo’s asset allocation mutual funds. |
| 1994 | | Wells Fargo introduces the LifePath Funds, one of the first suites of target date funds (now the Wells Fargo Advantage Dow Jones Target Date FundsSM). |
| 1996 | | Evergreen Investments and Keystone Funds merge. |
| 1997 | | Wells Fargo launches the Wells Fargo Advantage WealthBuilder PortfoliosSM, a fund-of-funds suite of products that includes the use of quantitative models to shift assets among investment styles. |
| 1999 | | Norwest Advantage Funds and Stagecoach Funds are reorganized into Wells Fargo Funds after the merger of Norwest and Wells Fargo. |
| 2002 | | Evergreen Retail and Evergreen Institutional companies form the umbrella asset management company, Evergreen Investments. |
| 2005 | | The integration of Strong Funds with Wells Fargo Funds creates Wells Fargo Advantage Funds, resulting in one of the top 20 mutual fund companies in the United States. |
| 2006 | | Wells Fargo Advantage Funds relaunches the target date product line as Wells Fargo Advantage Dow Jones Target Date Funds. |
| 2010 | | The mergers and reorganizations of Evergreen and Wells Fargo Advantage mutual funds are completed, unifying the families under the brand of Wells Fargo Advantage Funds. |
Wells Fargo Advantage Funds®
Wells Fargo Advantage Funds skillfully guides institutions, financial advisors, and individuals through the investment terrain to help them reach their financial objectives. Everything we do on behalf of investors is backed by our unique combination of qualifications.
Strength
Our organization is built on the standards of integrity and service established by our parent company—Wells Fargo & Company—more than 150 years ago. And, because we’re part of a highly diversified financial enterprise, we offer the depth of resources to help investors succeed.
Expertise
Our multi-boutique model offers investors access to the independent thinking of premier investment managers that have been chosen for their time-tested strategies. While each team specializes in a specific investment strategy, collectively they provide investors a wide choice of distinct investment styles. Our dedication to investment excellence doesn’t end with our expertise in manager selection—risk management, analysis, and rigorous ongoing review seek to ensure each manager’s investment process remains consistent.
Partnership
Our collaborative approach is built around understanding the needs and goals of our clients. By adhering to core principles of sound judgment and steady guidance, we support you through every stage of the investment decision process.
Carefully consider the investment objectives, risks, charges, and expenses before investing. For a current prospectus and, if available, a summary prospectus, for Wells Fargo Advantage Funds, containing this and other information, visit wellsfargoadvantagefunds.com. Read it carefully before investing.
Wells Fargo Funds Management, LLC, a wholly owned subsidiary of Wells Fargo & Company, provides investment advisory and administrative services for Wells Fargo Advantage Funds. Other affiliates of Wells Fargo & Company provide subadvisory and other services for the Funds. The Funds are distributed by Wells Fargo Funds Distributor, LLC, Member FINRA/SIPC, an affiliate of Wells Fargo & Company.
“Dow Jones®” and “Dow Jones Target Date IndexesSM” are service marks of Dow Jones Trademark Holdings LLC (“Dow Jones”); have been licensed to CME Group Index Services LLC (“CME Indexes”); and have been sublicensed for use for certain purposes by Global Index Advisors, Inc., and Wells Fargo Funds Management, LLC. The Wells Fargo Advantage Dow Jones Target Date FundsSM, based on the Dow Jones Target Date Indexes, are not sponsored, endorsed, sold, or promoted by Dow Jones, CME Indexes, or their respective affiliates, and none of them makes any representation regarding the advisability of investing in such product(s).
NOT FDIC INSURED ¡ NO BANK GUARANTEE ¡ MAY LOSE VALUE
Not part of the semi-annual report.
Wells Fargo Advantage Funds offers more than 110 mutual funds across a wide range of asset classes, representing over $214 billion in assets under management, as of November 30, 2012.
| | | | |
| Equity funds | | | | |
Asia Pacific Fund | | Enterprise Fund† | | Opportunity Fund† |
C&B Large Cap Value Fund | | Equity Value Fund | | Precious Metals Fund |
C&B Mid Cap Value Fund | | Global Opportunities Fund | | Premier Large Company Growth Fund |
Capital Growth Fund | | Growth Fund | | Small Cap Opportunities Fund |
Common Stock Fund | | Index Fund | | Small Cap Value Fund |
Disciplined U.S. Core Fund | | International Equity Fund | | Small Company Growth Fund |
Discovery Fund† | | International Value Fund | | Small Company Value Fund |
Diversified Equity Fund | | Intrinsic Small Cap Value Fund | | Small/Mid Cap Core Fund |
Diversified International Fund | | Intrinsic Value Fund | | Small/Mid Cap Value Fund |
Diversified Small Cap Fund | | Intrinsic World Equity Fund | | Special Mid Cap Value Fund |
Emerging Growth Fund | | Large Cap Core Fund | | Special Small Cap Value Fund |
Emerging Markets Equity Fund | | Large Cap Growth Fund | | Specialized Technology Fund |
Emerging Markets Equity Income Fund | | Large Company Value Fund | | Traditional Small Cap Growth Fund |
Endeavor Select Fund† | | Omega Growth Fund | | Utility and Telecommunications Fund |
| Bond funds | | | | |
Adjustable Rate Government Fund | | Income Plus Fund | | Short Duration Government Bond Fund |
California Limited-Term Tax-Free Fund | | Inflation-Protected Bond Fund | | Short-Term Bond Fund |
California Tax-Free Fund | | Intermediate Tax/AMT-Free Fund | | Short-Term High Yield Bond Fund |
Colorado Tax-Free Fund | | International Bond Fund | | Short-Term Municipal Bond Fund |
Core Bond Fund | | Minnesota Tax-Free Fund | | Strategic Municipal Bond Fund |
Emerging Markets Local Bond Fund | | Municipal Bond Fund | | Ultra Short-Term Income Fund |
Government Securities Fund | | North Carolina Tax-Free Fund | | Ultra Short-Term Municipal Income Fund |
High Income Fund | | Pennsylvania Tax-Free Fund | | Wisconsin Tax-Free Fund |
High Yield Bond Fund | | | | |
| Asset allocation funds | | | | |
Absolute Return Fund | | WealthBuilder Equity Portfolio† | | Target 2020 Fund† |
Asset Allocation Fund | | WealthBuilder Growth Allocation Portfolio† | | Target 2025 Fund† |
Conservative Allocation Fund | | WealthBuilder Growth Balanced Portfolio† | | Target 2030 Fund† |
Diversified Capital Builder Fund | | WealthBuilder Moderate Balanced Portfolio† | | Target 2035 Fund† |
Diversified Income Builder Fund | | WealthBuilder Tactical Equity Portfolio† | | Target 2040 Fund† |
Growth Balanced Fund | | Target Today Fund† | | Target 2045 Fund† |
Index Asset Allocation Fund | | Target 2010 Fund† | | Target 2050 Fund† |
Moderate Balanced Fund | | Target 2015 Fund† | | Target 2055 Fund† |
WealthBuilder Conservative Allocation Portfolio† | | | | |
| Money market funds | | | | |
100% Treasury Money Market Fund | | Heritage Money Market Fund† | | National Tax-Free Money Market Fund |
California Municipal Money Market Fund | | Money Market Fund | | Prime Investment Money Market Fund |
Cash Investment Money Market Fund | | Municipal Cash Management Money Market Fund | | Treasury Plus Money Market Fund |
Government Money Market Fund | | Municipal Money Market Fund | | |
| Variable trust funds1 | | | | |
VT Discovery Fund† | | VT Intrinsic Value Fund | | VT Small Cap Growth Fund |
VT Index Asset Allocation Fund | | VT Omega Growth Fund | | VT Small Cap Value Fund |
VT International Equity Fund | | VT Opportunity Fund† | | VT Total Return Bond Fund |
An investment in a money market fund is not insured or guaranteed by the Federal Deposit Insurance Corporation or any other government agency. Although the Wells Fargo Advantage Money Market Funds seek to preserve the value of your investment at $1.00 per share, it is possible to lose money by investing in a money market fund.
| 1. | The variable trust funds are generally available only through insurance company variable contracts. |
| † | In this report, the Wells Fargo Advantage Discovery FundSM, Wells Fargo Advantage Endeavor Select FundSM, Wells Fargo Advantage Enterprise FundSM, Wells Fargo Advantage Opportunity FundSM, Wells Fargo Advantage WealthBuilder Conservative Allocation PortfolioSM, Wells Fargo Advantage WealthBuilder Equity PortfolioSM, Wells Fargo Advantage WealthBuilder Growth Allocation PortfolioSM, Wells Fargo Advantage WealthBuilder Growth Balanced PortfolioSM, Wells Fargo Advantage WealthBuilder Moderate Balanced PortfolioSM, Wells Fargo Advantage WealthBuilder Tactical Equity PortfolioSM, Wells Fargo Advantage Dow Jones Target Today FundSM, Wells Fargo Advantage Dow Jones Target 2010 FundSM, Wells Fargo Advantage Dow Jones Target 2015 FundSM, Wells Fargo Advantage Dow Jones Target 2020 FundSM, Wells Fargo Advantage Dow Jones Target 2025 FundSM, Wells Fargo Advantage Dow Jones Target 2030 FundSM, Wells Fargo Advantage Dow Jones Target 2035 FundSM, Wells Fargo Advantage Dow Jones Target 2040 FundSM, Wells Fargo Advantage Dow Jones Target 2045 FundSM, Wells Fargo Advantage Dow Jones Target 2050 FundSM, Wells Fargo Advantage Dow Jones Target 2055 FundSM, Wells Fargo Advantage Heritage Money Market FundSM, Wells Fargo Advantage VT Discovery FundSM, and Wells Fargo Advantage VT Opportunity FundSM are referred to as the Discovery Fund, Endeavor Select Fund, Enterprise Fund, Opportunity Fund, WealthBuilder Conservative Allocation Portfolio, WealthBuilder Equity Portfolio, WealthBuilder Growth Allocation Portfolio, WealthBuilder Growth Balanced Portfolio, WealthBuilder Moderate Balanced Portfolio, WealthBuilder Tactical Equity Portfolio, Target Today Fund, Target 2010 Fund, Target 2015 Fund, Target 2020 Fund, Target 2025 Fund, Target 2030 Fund, Target 2035 Fund, Target 2040 Fund, Target 2045 Fund, Target 2050 Fund, Target 2055 Fund, Heritage Money Market Fund, VT Discovery Fund, and VT Opportunity Fund, respectively. |
Not part of the semi-annual report.
| | | | |
| 2 | | Wells Fargo Advantage Equity Gateway Funds | | Letter to shareholders (unaudited) |

Karla M. Rabusch
President
Wells Fargo Advantage Funds
Entering the period, concerns about the eurozone sovereign debt situation held center stage as investors again worried that Greece would default on its debt.
Aggressive central bank actions helped support stock prices, as did relatively solid economic data.
Dear Valued Shareholder:
We’re pleased to offer you this semi-annual report for the Wells Fargo Advantage Equity Gateway Funds for the six-month period that ended November 30, 2012. Much of the period was marked by continued concerns about the possible effects that the ongoing European sovereign debt crisis would have on the global economy. However, relatively solid economic data in the U.S. and efforts by European authorities to address the sovereign debt issue alleviated investor fears and supported global stock markets. Judging by various indexes, foreign developed market stocks outperformed U.S. large-cap stocks. Within the U.S., value stocks outperformed growth stocks, partly because of strong performance from financials, and small-cap stocks modestly underperformed large-cap stocks.
The period was dominated by worries that ongoing debt problems in the eurozone would affect global economic growth.
Entering the period, concerns about the eurozone sovereign debt situation held center stage as investors again worried that Greece would default on its debt. Because many eurozone banks owned Greek debt and many U.S. banks had financial ties to eurozone banks, investors worried about the effects of such an event on the global financial system and economy. The Greek government came to an agreement with its creditors in March 2012, allowing it to write down the principal on most of its bonds in exchange for increased financial austerity. Yet, ongoing weakness in the Greek economy made it difficult for the country to meet its austerity targets. Even more worrisome, in May 2012, Spain nationalized Bankia, its fourth-largest bank, after it suffered heavy losses from property loans. The move refocused investor attention to Spain’s weak economy and depressed property sector, and Spanish bond prices declined.
In September 2012, however, the European Central Bank (ECB) announced that it would purchase an unlimited amount of one- to three-year sovereign debt from countries that had applied for a formal bailout through either the European Financial Stability Facility or the European Stability Mechanism. The central bank’s commitment helped calm investor worries, as did similarly aggressive action by the U.S. Federal Reserve (Fed). In another positive sign, in late November 2012, finance ministers from the 17-country eurozone and the International Monetary Fund struck a deal aimed at reducing Greece’s debt by the year 2020.
Central banks continued to provide stimulus.
Major central banks, including the Fed and the ECB, continued to inject liquidity into the banks and the markets through various quantitative easing policies. Throughout the reporting period, the Federal Open Market Committee (FOMC) kept its key interest rates effectively at zero in order to support the economy and financial system. In response to signs of a sluggish economy, after its September 2012 meeting, the FOMC announced its intention to keep interest rates low until at least mid-2015. The Fed also announced open-ended purchases of $40 billion per month in mortgage-backed securities in an effort to support the housing market.
At the beginning of the period, the ECB had a key rate of 1.00%, which it had twice lowered from its previous levels in response to weakness in the southern European economies. A third cut in July 2012 put its key rate at a historic low of 0.75%.
Stock markets posted solid gains in an eventful period.
Aggressive central bank actions helped support stock prices, as did relatively solid economic data. The U.S. reported favorable gross domestic product (GDP) growth numbers over the reporting period, with the growth rate improving from 1.3% (annualized) in the second quarter of 2012 to 2.7% (annualized) in the third quarter of 2012. A continued high unemployment rate was the main negative piece of U.S. economic data. Although the unemployment rate improved from
| | | | | | |
| Letter to shareholders (unaudited) | | Wells Fargo Advantage Equity Gateway Funds | | | 3 | |
8.2% in June 2012 to 7.7% in November 2012, part of the improvement could be attributed to a decline in the labor force. (People are only counted as unemployed if they are officially looking for work.)
European economic data remained mixed. Southern European countries such as Greece, Italy, and Spain continued to grapple with high debt levels, government austerity programs aimed at paying down the debt, and slower economic growth. Since southern European countries are a source of demand for exporters, export-driven economies such as Germany were affected by southern Europe’s weakness. However, Germany achieved positive GDP growth in the second and third quarters of 2012 as its exporters successfully diversified into markets outside of the European Union. France and the United Kingdom were able to generate positive GDP growth in the third quarter after declines in the second quarter.
We remain committed to our investment strategies, even as many variables are at work in the market.
The full effect of the European credit crisis remains unknown. Elevated unemployment and debt defaults continue to pressure consumers and businesses alike. In our experience, strict adherence to time-tested investment strategies has its rewards. As a whole, Wells Fargo Advantage Funds represents investments across a range of asset classes and investment styles, giving you an opportunity to create a diversified investment portfolio. While diversification may not prevent losses in a downturn, we believe it helps manage risk.
Thank you for choosing to invest with Wells Fargo Advantage Funds. We appreciate your confidence in us and remain committed to helping you meet your financial needs. For current information about your fund investments, contact your investment professional, visit our website at wellsfargoadvantagefunds.com, or call us directly at 1-800-222-8222. We are available 24 hours a day, 7 days a week.
Sincerely,

Karla M. Rabusch
President
Wells Fargo Advantage Funds
Notice to shareholders
At its November 6-7, 2012 meeting, the Board of Trustees unanimously approved the following modifications to certain Class A sales load waiver privileges, with each change becoming effective on July 1, 2013:
| | n | | Annuity payments received under an annuity option or from death proceeds will no longer qualify for net asset value (NAV) repurchase privileges. | |
| | n | | The ability to reinvest redemption proceeds at NAV will be reduced from 120 days to 90 days. | |
| | n | | NAV purchase privileges for certain types of “grandfathered” shareholders will be modified to remove the ability to purchase Class A shares at NAV, unless those shares are held directly with the Fund. | |
Please contact your investment professional or call us directly at 1-800-222-8222 if you have any questions on this Notice to Shareholders.
| | | | |
| 4 | | Wells Fargo Advantage Equity Gateway Funds | | Performance highlights (unaudited) |
Wells Fargo Advantage C&B Large Cap Value Fund1
Investment objective
The Fund seeks maximum long-term total return (current income and capital appreciation), consistent with minimizing risk to principal.
Adviser
Wells Fargo Funds Management, LLC
Subadviser for master portfolio
Cooke & Bieler, L.P.
Portfolio managers
Daren C. Heitman, CFA
Steve Lyons, CFA
Michael M. Meyers, CFA
Edward W. O’Connor, CFA
R. James O’Neil, CFA
Mehul Trivedi, CFA
William Weber, CFA
Average annual total returns2 (%) as of November 30, 2012
| | | | | | | | | | | | | | | | | | | | | | | | | | | | | | | | | | |
| | | | | Including sales charge | | | Excluding sales charge | | | Expense ratios3 (%) | |
| | | Inception date | | 1 year | | | 5 year | | | 10 year | | | 1 year | | | 5 year | | | 10 year | | | Gross | | | Net4 | |
| Class A (CBEAX) | | 7-26-04 | | | 3.81 | | | | (1.65 | ) | | | 4.92 | | | | 10.19 | | | | (0.47 | ) | | | 5.55 | | | | 1.30 | | | | 1.15 | |
| Class B (CBEBX)* | | 7-26-04 | | | 4.37 | | | | (1.62 | ) | | | 5.02 | | | | 9.37 | | | | (1.20 | ) | | | 5.02 | | | | 2.05 | | | | 1.90 | |
| Class C (CBECX) | | 7-26-04 | | | 8.34 | | | | (1.20 | ) | | | 4.78 | | | | 9.34 | | | | (1.20 | ) | | | 4.78 | | | | 2.05 | | | | 1.90 | |
| Administrator Class (CBLLX) | | 7-26-04 | | | – | | | | – | | | | – | | | | 10.42 | | | | (0.27 | ) | | | 5.74 | | | | 1.14 | | | | 0.95 | |
| Institutional Class (CBLSX) | | 7-26-04 | | | – | | | | – | | | | – | | | | 10.69 | | | | (0.01 | ) | | | 5.99 | | | | 0.87 | | | | 0.70 | |
| Investor Class (CBEQX) | | 5-15-90 | | | – | | | | – | | | | – | | | | 10.12 | | | | (0.49 | ) | | | 5.54 | | | | 1.36 | | | | 1.20 | |
| Russell 1000® Value Index5 | | – | | | – | | | | – | | | | – | | | | 17.45 | | | | (0.01 | ) | | | 6.69 | | | | – | | | | – | |
| * | | Class B shares are closed to investment, except in connection with the reinvestment of any distributions and permitted exchanges. |
Figures quoted represent past performance, which is no guarantee of future results and do not reflect the deduction of taxes that a shareholder may pay on fund distributions or the redemption of fund shares. Investment return and principal value of an investment will fluctuate so that an investor’s shares, when redeemed, may be worth more or less than their original cost. Performance shown without sales charges would be lower if sales charges were reflected. Current performance may be lower or higher than the performance data quoted and assumes the reinvestment of dividends and capital gains. Current month-end performance is available on the Fund’s website, wellsfargoadvantagefunds.com.
Index returns do not include transaction costs associated with buying and selling securities, any mutual fund fees or expenses, or any taxes. It is not possible to invest directly in an index.
For Class A shares, the maximum front-end sales charge is 5.75%. For Class B shares, the maximum contingent deferred sales charge is 5.00%. For Class C shares, the maximum contingent deferred sales charge is 1.00%. Performance including sales charge assumes the sales charge for the corresponding time period. Administrator Class, Institutional Class, and Investor Class shares are sold without a front-end sales charge or contingent deferred sales charge.
Stock values fluctuate in response to the activities of individual companies and general market and economic conditions. Consult the Fund’s prospectus for additional information on these and other risks.
Please see footnotes on page 5.
| | | | | | |
| Performance highlights (unaudited) | | Wells Fargo Advantage Equity Gateway Funds | | | 5 | |
Wells Fargo Advantage C&B Large Cap Value Fund (continued)
| | | | |
| Ten largest equity holdings6 (%) as of November 30, 2012 | |
Omnicom Group Incorporated | | | 4.06 | |
NVR Incorporated | | | 3.93 | |
State Street Corporation | | | 3.93 | |
JPMorgan Chase & Company | | | 3.70 | |
Johnson & Johnson Services Incorporated | | | 3.63 | |
Exxon Mobil Corporation | | | 3.38 | |
American Express Company | | | 3.18 | |
3M Company | | | 3.15 | |
Raytheon Company | | | 3.04 | |
Illinois Tool Works Incorporated | | | 2.94 | |
| | |
| Sector distribution7 as of November 30, 2012 |
|
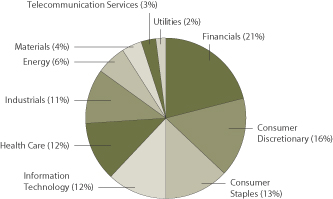
|
| 1. | The Fund is a gateway feeder fund that invests all of its assets in a single master portfolio of the Wells Fargo Master Trust (the “Master Trust”) with a substantially similar investment objective and substantially similar investment strategies. References to the investment activities of the Fund are intended to refer to the investment activities of the master portfolio in which it invests. See Notes to Financial Statements for a discussion of the Master Trust. |
| 2. | Effective June 20, 2008, Class D was renamed Investor Class and modified to assume the features and attributes of the Investor Class. Historical performance shown for Class A, Class B and Class C shares prior to their inception reflects the performance of the Investor Class shares, adjusted to reflect the higher expenses applicable to Class A, Class B and Class C shares. Historical performance shown for the Administrator and Institutional Class shares prior to their inception reflects the performance of the Investor Class shares, and includes the higher expenses applicable to the Investor Class shares. If these expenses had not been included, returns would be higher. |
| 3. | Reflects the expense ratios as stated in the most recent prospectuses. |
| 4. | The Adviser has committed through September 30, 2013, to waive fees and/or reimburse expenses to the extent necessary to cap the Fund’s Total Annual Fund Operating Expenses After Fee Waiver, excluding certain expenses, at the amounts shown. Brokerage commissions, stamp duty fees, interest, taxes, acquired fund fees and expenses, and extraordinary expenses are excluded from the cap. Fees from the underlying master portfolio(s) are included in the cap. Without this cap, the Fund’s returns would have been lower. |
| 5. | The Russell 1000® Value Index measures the performance of those Russell 1000 companies with lower price-to-book ratios and lower forecasted growth values. You cannot invest directly in an index. |
| 6. | The ten largest equity holdings are calculated based on the value of the securities of the master portfolio allocable to the Fund divided by the total net assets of the Fund. Holdings are subject to change and may have changed since the date specified. |
| 7. | Sector distribution is subject to change and represents the sector distribution of the master portfolio which is calculated based on total long-term investment of the master portfolio. |
| | | | |
| 6 | | Wells Fargo Advantage Equity Gateway Funds | | Performance highlights (unaudited) |
Wells Fargo Advantage Diversified Equity Fund1
Investment objective
The Fund seeks long-term capital appreciation.
Adviser
Wells Fargo Funds Management, LLC
Subadvisers for master portfolios
Artisan Partners Limited Partnership
Cooke & Bieler, L.P.
Golden Capital Management, LLC
LSV Asset Management
Peregrine Capital Management, Inc.
Phocas Financial Corporation
SSgA Funds Management
Systematic Financial Management, L.P.
Wells Capital Management Incorporated
Portfolio managers
Thomas C. Biwer, CFA
Christian L. Chan, CFA
Andrew Owen, CFA
Average annual total returns (%) as of November 30, 2012
| | | | | | | | | | | | | | | | | | | | | | | | | | | | | | | | | | |
| | | | | Including sales charge | | | Excluding sales charge | | | Expense ratios2 (%) | |
| | | Inception date | | 1 year | | | 5 year | | | 10 year | | | 1 year | | | 5 year | | | 10 year | | | Gross | | | Net3 | |
| Class A (NVDAX) | | 5-2-96 | | | 6.80 | | | | (1.69 | ) | | | 4.82 | | | | 13.31 | | | | (0.52 | ) | | | 5.44 | | | | 1.41 | | | | 1.25 | |
| Class B (NVDBX)* | | 5-6-96 | | | 7.45 | | | | (1.69 | ) | | | 4.89 | | | | 12.45 | | | | (1.27 | ) | | | 4.89 | | | | 2.16 | | | | 2.00 | |
| Class C (WFDEX) | | 10-1-98 | | | 11.48 | | | | (1.27 | ) | | | 4.64 | | | | 12.48 | | | | (1.27 | ) | | | 4.64 | | | | 2.16 | | | | 2.00 | |
| Administrator Class (NVDEX) | | 11-11-94 | | | – | | | | – | | | | – | | | | 13.60 | | | | (0.27 | ) | | | 5.70 | | | | 1.25 | | | | 1.00 | |
| Diversified Equity Composite Index4 | | – | | | – | | | | – | | | | – | | | | 15.39 | | | | 0.76 | | | | 7.05 | | | | – | | | | – | |
| S&P 500 Index5 | | – | | | – | | | | – | | | | – | | | | 16.13 | | | | 1.34 | | | | 6.36 | | | | – | | | | – | |
| * | | Class B shares are closed to investment, except in connection with the reinvestment of any distributions and permitted exchanges. |
Figures quoted represent past performance, which is no guarantee of future results and do not reflect the deduction of taxes that a shareholder may pay on fund distributions or the redemption of fund shares. Investment return and principal value of an investment will fluctuate so that an investor’s shares, when redeemed, may be worth more or less than their original cost. Performance shown without sales charges would be lower if sales charges were reflected. Current performance may be lower or higher than the performance data quoted and assumes the reinvestment of dividends and capital gains. Current month-end performance is available on the Fund’s website, wellsfargoadvantagefunds.com.
Index returns do not include transaction costs associated with buying and selling securities, any mutual fund fees or expenses, or any taxes. It is not possible to invest directly in an index.
For Class A shares, the maximum front-end sales charge is 5.75%. For Class B shares, the maximum contingent deferred sales charge is 5.00%. For Class C shares, the maximum contingent deferred sales charge is 1.00%. Performance including sales charge assumes the sales charge for the corresponding time period. Administrator Class shares are sold without a front-end sales charge or contingent deferred sales charge.
Stock values fluctuate in response to the activities of individual companies and general market and economic conditions. The use of derivatives may reduce returns and/or increase volatility. Certain investment strategies tend to increase the total risk of an investment (relative to the broader market). The Fund is exposed to foreign investment risk and smaller company securities risk. Consult the Fund’s prospectus for additional information on these and other risks.
Please see footnotes on page 7.
| | | | | | |
| Performance highlights (unaudited) | | Wells Fargo Advantage Equity Gateway Funds | | | 7 | |
Wells Fargo Advantage Diversified Equity Fund (continued)
| | | | |
| Ten largest equity holdings6 (%) as of November 30, 2012 | |
Apple Incorporated | | | 3.17 | |
Exxon Mobil Corporation | | | 1.61 | |
Google Incorporated Class A | | | 1.30 | |
eBay Incorporated | | | 1.06 | |
General Electric Company | | | 1.05 | |
Chevron Corporation | | | 1.04 | |
JPMorgan Chase & Company | | | 1.03 | |
Qualcomm Incorporated | | | 0.92 | |
Procter & Gamble Company | | | 0.87 | |
Pfizer Incorporated | | | 0.86 | |
| | |
| Sector distribution7 as of November 30, 2012 |
|
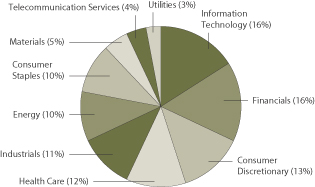
|
| 1. | The Fund is a gateway blended fund that invests all of its assets in two or more master portfolios of the Wells Fargo Master Trust (the “Master Trust”) in varying proportions. References to the investment activities of the Fund are intended to refer to the investment activities of the master portfolios in which it invests. See Notes to Financial Statements for a discussion of the Master Trust. |
| 2. | Reflects the expense ratios as stated in the most recent prospectuses. |
| 3. | The Adviser has committed through September 30, 2013, to waive fees and/or reimburse expenses to the extent necessary to cap the Fund’s Total Annual Fund Operating Expenses After Fee Waiver, excluding certain expenses, at the amounts shown. Brokerage commissions, stamp duty fees, interest, taxes, acquired fund fees and expenses, and extraordinary expenses are excluded from the cap. Fees from the underlying master portfolio(s) are included in the cap. Without this cap, the Fund’s returns would have been lower. |
| 4. | Source: Wells Fargo Funds Management, LLC. The Diversified Equity Composite Index is weighted 25% in the Russell 1000® Value Index (measures the performance of those Russell 1000 companies with lower price-to-book ratios and lower forecasted growth values), 25% in the S&P 500 Index, 25% in the Russell 1000® Growth Index (measures the performance of those Russell 1000 companies with higher price-to-book ratios and higher forecasted growth values), 15% in theMSCI EAFE Index (an unmanaged group of securities generally representative of the stock markets of Europe, Australasia and the Far East), and 10% in the Russell 2000® Index (measures the performance of the 2,000 smallest companies in the Russell 3000® Index). You cannot invest directly in an index. |
| 5. | The S&P 500 Index consists of 500 stocks chosen for market size, liquidity, and industry group representation. It is a market-value weighted index with each stock’sweight in the index proportionate to its market value. You cannot invest directly in an index. |
| 6. | The ten largest equity holdings are calculated based on the value of the securities of the master portfolios allocable to the Fund divided by the total net assets of the Fund. Holdings are subject to change and may have changed since the date specified. |
| 7. | Sector distribution is subject to change and represents the aggregate sector distribution of the master portfolios which is calculated based on total long-term investment of the master portfolios. |
| | | | |
| 8 | | Wells Fargo Advantage Equity Gateway Funds | | Performance highlights (unaudited) |
Wells Fargo Advantage Diversified Small Cap Fund1
Investment objective
The Fund seeks long-term capital appreciation.
Adviser
Wells Fargo Funds Management, LLC
Subadvisers for master portfolios
Peregrine Capital Management, Inc.
Wells Capital Management Incorporated
Portfolio managers
Thomas C. Biwer, CFA
Christian L. Chan, CFA
Andrew Owen, CFA
Average annual total returns (%) as of November 30, 2012
| | | | | | | | | | | | | | | | | | | | | | |
| | | | | | | | Expense ratios2 (%) | |
| | | Inception date | | 1 year | | | 5 year | | | 10 year | | | Gross | | | Net3 | |
| Administrator Class (NVDSX) | | 12-31-97 | | | 11.76 | | | | 2.18 | | | | 8.33 | | | | 1.54 | | | | 1.00 | |
| Russell 2000® Index4 | | – | | | 13.09 | | | | 2.82 | | | | 8.71 | | | | – | | | | – | |
Figures quoted represent past performance, which is no guarantee of future results and do not reflect the deduction of taxes that a shareholder may pay on fund distributions or the redemption of fund shares. Investment return and principal value of an investment will fluctuate so that an investor’s shares, when redeemed, may be worth more or less than their original cost. Current performance may be lower or higher than the performance data quoted and assumes the reinvestment of dividends and capital gains. Current month-end performance is available on the Fund’s website, wellsfargoadvantagefunds.com.
Index returns do not include transaction costs associated with buying and selling securities, any mutual fund fees or expenses, or any taxes. It is not possible to invest directly in an index.
Administrator Class shares are sold without a front-end sales charge or contingent deferred sales charge.
Stock values fluctuate in response to the activities of individual companies and general market and economic conditions. Smaller company stocks tend to be more volatile and less liquid than those of larger companies. The use of derivatives may reduce returns and/or increase volatility. Certain investment strategies tend to increase the total risk of an investment (relative to the broader market). The Fund is exposed to foreign investment risk. Consult the Fund’s prospectus for additional information on these and other risks.
Please see footnotes on page 9.
| | | | | | |
| Performance highlights (unaudited) | | Wells Fargo Advantage Equity Gateway Funds | | | 9 | |
Wells Fargo Advantage Diversified Small Cap Fund (continued)
| | | | |
| Ten largest equity holdings5 (%) as of November 30, 2012 | |
Interoil Corporation | | | 1.33 | |
Randgold Resources Limited ADR | | | 1.31 | |
OSI Systems Incorporated | | | 1.05 | |
Genesee & Wyoming Incorporated | | | 0.88 | |
Endologix Incorporated | | | 0.87 | |
On Assignment Incorporated | | | 0.79 | |
Chimera Investment Corporation | | | 0.79 | |
Hanesbrands Incorporated | | | 0.77 | |
Argo Group International Holdings Limited | | | 0.76 | |
Acco Brands Corporation | | | 0.70 | |
| | |
| Sector distribution6 as of November 30, 2012 |
|
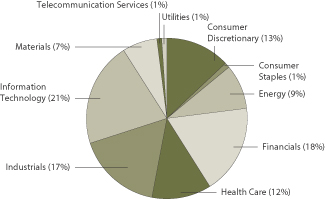
|
| 1. | The Fund is a gateway blended fund that invests all of its assets in two or more master portfolios of the Wells Fargo Master Trust (the “Master Trust”) in varying proportions. References to the investment activities of the Fund are intended to refer to the investment activities of the master portfolios in which it invests. See Notes to Financial Statements for a discussion of the Master Trust. |
| 2. | Reflects the expense ratios as stated in the most recent prospectus. |
| 3. | The Adviser has committed through September 30, 2013, to waive fees and/or reimburse expenses to the extent necessary to cap the Fund’s Total Annual Fund Operating Expenses After Fee Waiver, excluding certain expenses, at the amounts shown. Brokerage commissions, stamp duty fees, interest, taxes, acquired fund fees and expenses, and extraordinary expenses are excluded from the cap. Fees from the underlying master portfolio(s) are included in the cap. Without this cap, the Fund’s returns would have been lower. |
| 4. | Russell 2000® Index measures the performance of the 2,000 smallest companies in the Russell 3000® Index, which represents approximately 8% of the total market capitalization of the Russell 3000® Index. You cannot invest directly in an index. |
| 5. | The ten largest equity holdings are calculated based on the value of the securities of the master portfolios allocable to the Fund divided by the total net assets of the Fund. Holdings are subject to change and may have changed since the date specified. |
| 6. | Sector distribution is subject to change and represents the aggregate sector distribution of the master portfolios which is calculated based on total long-term investment of the master portfolios. |
| | | | |
| 10 | | Wells Fargo Advantage Equity Gateway Funds | | Performance highlights (unaudited) |
Wells Fargo Advantage Emerging Growth Fund1
The Fund is closed to new investors2.
Investment objective
The Fund seeks long-term capital appreciation.
Adviser
Wells Fargo Funds Management, LLC
Subadviser for master portfolio
Wells Capital Management Incorporated
Portfolio managers
Joseph M. Eberhardy, CFA, CPA
Thomas C. Ognar, CFA
Bruce C. Olson, CFA
Average annual total returns3 (%) as of November 30, 2012
| | | | | | | | | | | | | | | | | | | | | | | | | | | | | | | | | | |
| | | | | Including sales charge | | | Excluding sales charge | | | Expense ratios4 (%) | |
| | | Inception date | | 1 year | | | 5 year | | | Since inception | | | 1 year | | | 5 year | | | Since inception | | | Gross | | | Net5 | |
| Class A (WEMAX) | | 3-31-08 | | | (1.43 | ) | | | (0.73 | ) | | | 3.03 | | | | 4.58 | | | | 0.44 | | | | 4.08 | | | | 1.42 | | | | 1.37 | |
| Class C (WEMCX) | | 3-31-08 | | | 2.76 | | | | (0.30 | ) | | | 3.31 | | | | 3.76 | | | | (0.30 | ) | | | 3.31 | | | | 2.17 | | | | 2.12 | |
| Administrator Class (WFGDX) | | 1-31-07 | | | – | | | | – | | | | – | | | | 4.87 | | | | 0.70 | | | | 4.34 | | | | 1.26 | | | | 1.20 | |
| Institutional Class (WEMIX) | | 3-31-08 | | | – | | | | – | | | | – | | | | 5.15 | | | | 0.95 | | | | 4.56 | | | | 0.99 | | | | 0.90 | |
| Investor Class (WFGTX) | | 1-31-07 | | | – | | | | – | | | | – | | | | 4.51 | | | | 0.43 | | | | 4.07 | | | | 1.48 | | | | 1.43 | |
| Russell 2000® Growth Index6 | | – | | | – | | | | – | | | | – | | | | 11.13 | | | | 3.03 | | | | 3.36 | | | | – | | | | – | |
Figures quoted represent past performance, which is no guarantee of future results and do not reflect the deduction of taxes that a shareholder may pay on fund distributions or the redemption of fund shares. Investment return and principal value of an investment will fluctuate so that an investor’s shares, when redeemed, may be worth more or less than their original cost. Performance shown without sales charges would be lower if sales charges were reflected. Current performance may be lower or higher than the performance data quoted and assumes the reinvestment of dividends and capital gains. Current month-end performance is available on the Fund’s website, wellsfargoadvantagefunds.com.
Index returns do not include transaction costs associated with buying and selling securities, any mutual fund fees or expenses, or any taxes. It is not possible to invest directly in an index.
For Class A shares, the maximum front-end sales charge is 5.75%. For Class C shares, the maximum contingent deferred sales charge is 1.00%. Performance including sales charge assumes the sales charge for the corresponding time period. Administrator Class, Institutional Class, and Investor Class shares are sold without a front-end sales charge or contingent deferred sales charge.
Stock values fluctuate in response to the activities of individual companies and general market and economic conditions. Smaller company stocks tend to be more volatile and less liquid than those of larger companies. Certain investment strategies tend to increase the total risk of an investment (relative to the broader market). The Fund is exposed to foreign investment risk. Consult the Fund’s prospectus for additional information on these and other risks.
Please see footnotes on page 11.
| | | | | | |
| Performance highlights (unaudited) | | Wells Fargo Advantage Equity Gateway Funds | | | 11 | |
Wells Fargo Advantage Emerging Growth Fund (continued)
| | | | |
| Ten largest equity holdings7 (%) as of November 30, 2012 | |
Endologix Incorporated | | | 3.32 | |
Genesee & Wyoming Incorporated | | | 3.28 | |
Financial Engines Incorporated | | | 3.10 | |
Akorn Incorporated | | | 3.09 | |
Life Time Fitness Incorporated | | | 3.01 | |
Solarwinds Incorporated | | | 2.50 | |
On Assignment Incorporated | | | 2.24 | |
Align Technology Incorporated | | | 2.19 | |
DSW Incorporated Class A | | | 2.19 | |
Vitamin Shoppe Incorporated | | | 2.17 | |
|
| Sector distribution8 as of November 30, 2012 |
|
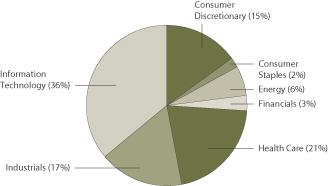
|
| 1. | The Fund is a gateway feeder fund that invests all of its assets in a single master portfolio of the Wells Fargo Master Trust (the “Master Trust”) with a substantially similar investment objective and substantially similar investment strategies. References to the investment activities of the Fund are intended to refer to the investment activities of the master portfolio in which it invests. See Notes to Financial Statements for a discussion of the Master Trust. |
| 2. | Please see the Fund’s current Statement of Additional Information for further details. |
| 3. | Historical performance shown for Class C shares prior to their inception reflects the performance of the Investor Class shares, adjusted to reflect the higher expenses applicable to Class C shares. Historical performance shown for Class A shares prior to their inception reflects the performance of the Investor Class shares, and includes the higher expenses applicable to the Investor Class shares. If these expenses had not been included, returns would be higher. Historical performance shown for the Institutional Class shares prior to their inception reflects the performance of the Administrator Class shares, and includes the higher expenses applicable to the Administrator Class shares. If these expenses had not been included, returns would be higher. |
| 4. | Reflects the expense ratios as stated in the most recent prospectuses. |
| 5. | The Adviser has committed through September 30, 2013, to waive fees and/or reimburse expenses to the extent necessary to cap the Fund’s Total Annual Fund Operating Expenses After Fee Waiver, excluding certain expenses, at the amounts shown. Brokerage commissions, stamp duty fees, interest, taxes, acquired fund fees and expenses, and extraordinary expenses are excluded from the cap. Fees from the underlying master portfolio(s) are included in the cap. Without this cap, the Fund’s returns would have been lower. |
| 6. | The Russell 2000® Growth Index measures the performance of those Russell 2000® companies with higher price-to-book ratios and higher forecasted growth values. You cannot invest directly in an index. |
| 7. | The ten largest equity holdings are calculated based on the value of the securities of the master portfolio allocable to the Fund divided by the total net assets of the Fund. Holdings are subject to change and may have changed since the date specified. |
| 8. | Sector distribution is subject to change and represents the sector distribution of the master portfolio which is calculated based on total long-term investment of the master portfolio. |
| | | | |
| 12 | | Wells Fargo Advantage Equity Gateway Funds | | Performance highlights (unaudited) |
Wells Fargo Advantage Equity Value Fund1
Investment objective
The Fund seeks long-term capital appreciation.
Adviser
Wells Fargo Funds Management, LLC
Subadviser for master portfolio
Systematic Financial Management, L.P.
Portfolio managers
D. Kevin McCreesh, CFA
Ronald M. Mushock, CFA
Average annual total returns2 (%) as of November 30, 2012
| | | | | | | | | | | | | | | | | | | | | | | | | | | | | | | | | | |
| | | | | Including sales charge | | | Excluding sales charge | | | Expense ratios3 (%) | |
| | | Inception date | | 1 year | | | 5 year | | | Since inception | | | 1 year | | | 5 year | | | Since inception | | | Gross | | | Net4 | |
| Class A (WLVAX) | | 8-29-03 | | | 8.44 | | | | (3.35 | ) | | | 4.54 | | | | 15.05 | | | | (2.20 | ) | | | 5.21 | | | | 1.25 | | | | 1.24 | |
| Class B (WLVBX)* | | 8-29-03 | | | 9.21 | | | | (3.35 | ) | | | 4.63 | | | | 14.21 | | | | (2.90 | ) | | | 4.63 | | | | 2.00 | | | | 1.99 | |
| Class C (WLVCX) | | 8-29-03 | | | 13.20 | | | | (2.94 | ) | | | 4.42 | | | | 14.20 | | | | (2.94 | ) | | | 4.42 | | | | 2.00 | | | | 1.99 | |
| Class R (WLVRX) | | 8-26-11 | | | – | | | | – | | | | – | | | | 14.77 | | | | (2.39 | ) | | | 4.99 | | | | 1.50 | | | | 1.49 | |
| Administrator Class (WLVIX) | | 8-29-03 | | | – | | | | – | | | | – | | | | 15.33 | | | | (1.92 | ) | | | 5.50 | | | | 1.09 | | | | 1.00 | |
| Institutional Class (WLVSX) | | 8-31-06 | | | – | | | | – | | | | – | | | | 15.25 | | | | (1.75 | ) | | | 5.63 | | | | 0.82 | | | | 0.75 | |
| Russell 1000® Value Index5 | | – | | | – | | | | – | | | | – | | | | 17.45 | | | | (0.01 | ) | | | 6.14 | | | | – | | | | – | |
| * | | Class B shares are closed to investment, except in connection with the reinvestment of any distributions and permitted exchanges. |
Figures quoted represent past performance, which is no guarantee of future results and do not reflect the deduction of taxes that a shareholder may pay on fund distributions or the redemption of fund shares. Investment return and principal value of an investment will fluctuate so that an investor’s shares, when redeemed, may be worth more or less than their original cost. Performance shown without sales charges would be lower if sales charges were reflected. Current performance may be lower or higher than the performance data quoted and assumes the reinvestment of dividends and capital gains. Current month-end performance is available on the Fund’s website, wellsfargoadvantagefunds.com.
Index returns do not include transaction costs associated with buying and selling securities, any mutual fund fees or expenses, or any taxes. It is not possible to invest directly in an index.
For Class A shares, the maximum front-end sales charge is 5.75%. For Class B shares, the maximum contingent deferred sales charge is 5.00%. For Class C shares, the maximum contingent deferred sales charge is 1.00%. Performance including sales charge assumes the sales charge for the corresponding time period. Class R, Administrator Class, and Institutional Class shares are sold without a front-end sales charge or contingent deferred sales charge.
Stock values fluctuate in response to the activities of individual companies and general market and economic conditions. Consult the Fund’s prospectus for additional information on these and other risks.
Please see footnotes on page 13.
| | | | | | |
| Performance highlights (unaudited) | | Wells Fargo Advantage Equity Gateway Funds | | | 13 | |
Wells Fargo Advantage Equity Value Fund (continued)
| | | | |
| Ten largest equity holdings6 (%) as of November 30, 2012 | |
General Electric Company | | | 4.63 | |
Pfizer Incorporated | | | 4.17 | |
Chevron Corporation | | | 3.82 | |
Discover Financial Services | | | 3.78 | |
PNC Financial Services Group Incorporated | | | 3.55 | |
JPMorgan Chase & Company | | | 3.53 | |
AT&T Incorporated | | | 3.17 | |
CVS Caremark Corporation | | | 2.67 | |
Foot Locker Incorporated | | | 2.66 | |
Cisco Systems Incorporated | | | 2.66 | |
|
| Sector distribution7 as of November 30, 2012 |
|
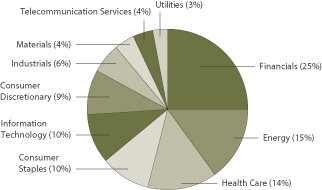
|
| 1. | The Fund is a gateway feeder fund that invests all of its assets in a single master portfolio of the Wells Fargo Master Trust (the “Master Trust”) with a substantially similar investment objective and substantially similar investment strategies. References to the investment activities of the Fund are intended to refer to the investment activities of the master portfolio in which it invests. See Notes to Financial Statements for a discussion of the Master Trust. |
| 2. | Historical performance shown for Class R shares prior to their inception reflects the performance of the Administrator Class shares, adjusted to reflect the higher expenses applicable to Class R shares. Historical performance shown for the Institutional Class shares prior to their inception reflects the performance of the Administrator Class shares, and includes the higher expenses applicable to the Administrator Class shares. If these expenses had not been included, returns would be higher. |
| 3. | Reflects the expense ratios as stated in the most recent prospectuses. |
| 4. | The Adviser has committed through September 30, 2013, to waive fees and/or reimburse expenses to the extent necessary to cap the Fund’s Total Annual Fund Operating Expenses After Fee Waiver, excluding certain expenses, at the amounts shown. Brokerage commissions, stamp duty fees, interest, taxes, acquired fund fees and expenses, and extraordinary expenses are excluded from the cap. Fees from the underlying master portfolio(s) are included in the cap. Without this cap, the Fund’s returns would have been lower. |
| 5. | The Russell 1000® Value Index measures the performance of those Russell 1000 companies with lower price-to-book ratios and lower forecasted growth values. You cannot invest directly in an index. |
| 6. | The ten largest equity holdings are calculated based on the value of the securities of the master portfolio allocable to the Fund divided by the total net assets of the Fund. Holdings are subject to change and may have changed since the date specified. |
| 7. | Sector distribution is subject to change and represents the sector distribution of the master portfolio which is calculated based on total long-term investment of the master portfolio. |
| | | | |
| 14 | | Wells Fargo Advantage Equity Gateway Funds | | Performance highlights (unaudited) |
Wells Fargo Advantage Index Fund1
Investment objective
The Fund seeks to replicate the total return of S&P 500 Index, before fees and expenses.
Adviser
Wells Fargo Funds Management, LLC
Subadviser for master portfolio
Golden Capital Management, LLC
Portfolio managers
Weidong Li, CFA
Brad Ursillo, CFA
Average annual total returns2 (%) as of November 30, 2012
| | | | | | | | | | | | | | | | | | | | | | | | | | | | | | | | | | |
| | | | | Including sales charge | | | Excluding sales charge | | | Expense ratios3 (%) | |
| | | Inception date | | 1 year | | | 5 year | | | 10 year | | | 1 year | | | 5 year | | | 10 year | | | Gross | | | Net4 | |
| Class A (WFILX)* | | 11-4-98 | | | 8.84 | | | | (0.36 | ) | | | 5.16 | | | | 15.48 | | | | 0.82 | | | | 5.78 | | | | 0.69 | | | | 0.56 | |
| Class B (WFIMX)* | | 11-3-98 | | | 9.64 | | | | (0.23 | ) | | | 5.22 | | | | 14.64 | | | | 0.07 | | | | 5.22 | | | | 1.44 | | | | 1.31 | |
| Class C (WFINX)* | | 4-30-99 | | | 13.62 | | | | 0.07 | | | | 4.99 | | | | 14.62 | | | | 0.07 | | | | 4.99 | | | | 1.44 | | | | 1.31 | |
| Administrator Class (WFIOX) | | 2-14-85 | | | – | | | | – | | | | – | | | | 15.85 | | | | 1.10 | | | | 6.06 | | | | 0.38 | | | | 0.25 | |
| Investor Class (WFIRX) | | 7-16-10 | | | – | | | | – | | | | – | | | | 15.61 | | | | 0.86 | | | | 5.83 | | | | 0.75 | | | | 0.45 | |
| S&P 500 Index5 | | – | | | – | | | | – | | | | – | | | | 16.13 | | | | 1.34 | | | | 6.36 | | | | – | | | | – | |
| * | | Class A, B, and C are closed to new investors. |
Figures quoted represent past performance, which is no guarantee of future results and do not reflect the deduction of taxes that a shareholder may pay on fund distributions or the redemption of fund shares. Investment return and principal value of an investment will fluctuate so that an investor’s shares, when redeemed, may be worth more or less than their original cost. Performance shown without sales charges would be lower if sales charges were reflected. Current performance may be lower or higher than the performance data quoted and assumes the reinvestment of dividends and capital gains. Current month-end performance is available on the Fund’s website, wellsfargoadvantagefunds.com.
Index returns do not include transaction costs associated with buying and selling securities, any mutual fund fees or expenses, or any taxes. It is not possible to invest directly in an index.
For Class A shares, the maximum front-end sales charge is 5.75%. For Class B shares, the maximum contingent deferred sales charge is 5.00%. For Class C shares, the maximum contingent deferred sales charge is 1.00%. Performance including sales charge assumes the sales charge for the corresponding time period. Administrator Class and Investor Class shares are sold without a front-end sales charge or contingent deferred sales charge.
Stock values fluctuate in response to the activities of individual companies and general market and economic conditions. The use of derivatives may reduce returns and/or increase volatility. Consult the Fund’s prospectus for additional information on these and other risks.
Please see footnotes on page 15.
| | | | | | |
| Performance highlights (unaudited) | | Wells Fargo Advantage Equity Gateway Funds | | | 15 | |
Wells Fargo Advantage Index Fund (continued)
| | | | |
| Ten largest equity holdings6 (%) as of November 30, 2012 | |
Apple Incorporated | | | 4.25 | |
Exxon Mobil Corporation | | | 3.15 | |
General Electric Company | | | 1.73 | |
Chevron Corporation | | | 1.60 | |
International Business Machines Corporation | | | 1.58 | |
Microsoft Corporation | | | 1.55 | |
AT&T Incorporated | | | 1.52 | |
Procter & Gamble Company | | | 1.49 | |
Johnson & Johnson Services Incorporated | | | 1.49 | |
Pfizer Incorporated | | | 1.45 | |
|
| Sector distribution7 as of November 30, 2012 |
|
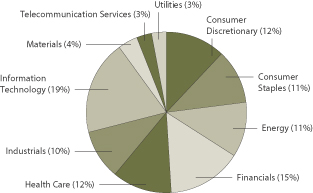
|
| 1. | The Fund is a gateway feeder fund that invests all of its assets in a single master portfolio of the Wells Fargo Master Trust (the “Master Trust”) with a substantially similar investment objective and substantially similar investment strategies. References to the investment activities of the Fund are intended to refer to the investment activities of the master portfolio in which it invests. See Notes to Financial Statements for a discussion of the Master Trust. |
| 2. | Historical performance shown for the Investor Class shares prior to their inception reflects the performance of the Administrator Class shares, adjusted to reflect the higher expenses applicable to the Investor Class. Historical performance shown for all classes of the Fund prior to July 19, 2010 is based on the performance of the Fund’s predecessor, Evergreen Equity Index Fund. |
| 3. | Reflects the expense ratios as stated in the most recent prospectuses. |
| 4. | The Adviser has committed through September 30, 2013, to waive fees and/or reimburse expenses to the extent necessary to cap the Fund’s Total Annual Fund Operating Expenses After Fee Waiver, excluding certain expenses, at the amounts shown. Brokerage commissions, stamp duty fees, interest, taxes, acquired fund fees and expenses, and extraordinary expenses are excluded from the cap. Fees from the underlying master portfolio(s) are included in the cap. Without this cap, the Fund’s returns would have been lower. |
| 5. | The S&P 500 Index consists of 500 stocks chosen for market size, liquidity, and industry group representation. It is a market-value weighted index with each stock’s weight in the index proportionate to its market value. You cannot invest directly in an index. |
| 6. | The ten largest equity holdings are calculated based on the value of the securities of the master portfolio allocable to the Fund divided by the total net assets of the Fund. Holdings are subject to change and may have changed since the date specified. |
| 7. | Sector distribution is subject to change and represents the sector distribution of the master portfolio which is calculated based on total long-term investment of the master portfolio. |
| | | | |
| 16 | | Wells Fargo Advantage Equity Gateway Funds | | Performance highlights (unaudited) |
Wells Fargo Advantage International Value Fund1
Investment objective
The Fund seeks long-term capital appreciation.
Adviser
Wells Fargo Funds Management, LLC
Subadviser for master portfolio
LSV Asset Management
Portfolio managers
Josef Lakonishok
Puneed Mansharamani, CFA
Menno Vermeulen, CFA
Average annual total returns2 (%) as of November 30, 2012
| | | | | | | | | | | | | | | | | | | | | | | | | | | | | | | | | | |
| | | | | Including sales charge | | | Excluding sales charge | | | Expense ratios3 (%) | |
| | | Inception date | | 1 year | | | 5 year | | | Since inception | | | 1 year | | | 5 year | | | Since inception | | | Gross | | | Net4 | |
| Class A (WFFAX) | | 10-31-03 | | | 3.88 | | | | (6.84 | ) | | | 4.12 | | | | 10.22 | | | | (5.73 | ) | | | 4.81 | | | | 1.52 | | | | 1.50 | |
| Class B (WFVBX)* | | 4-8-05 | | | 4.39 | | | | (6.99 | ) | | | 4.18 | | | | 9.39 | | | | (6.46 | ) | | | 4.18 | | | | 2.27 | | | | 2.25 | |
| Class C (WFVCX) | | 4-8-05 | | | 8.37 | | | | (6.46 | ) | | | 4.00 | | | | 9.37 | | | | (6.46 | ) | | | 4.00 | | | | 2.27 | | | | 2.25 | |
| Administrator Class (WFVDX) | | 4-8-05 | | | – | | | | – | | | | – | | | | 10.39 | | | | (5.54 | ) | | | 4.99 | | | | 1.36 | | | | 1.25 | |
| Institutional Class (WFVIX) | | 8-31-06 | | | – | | | | – | | | | – | | | | 10.66 | | | | (5.35 | ) | | | 5.13 | | | | 1.09 | | | | 1.05 | |
| MSCI EAFE Value Index (Net)5 | | – | | | – | | | | – | | | | – | | | | 12.45 | | | | (5.55 | ) | | | 5.82 | | | | – | | | | – | |
| * | | Class B shares are closed to investment, except in connection with the reinvestment of any distributions and permitted exchanges. |
Figures quoted represent past performance, which is no guarantee of future results and do not reflect the deduction of taxes that a shareholder may pay on fund distributions or the redemption of fund shares. Investment return and principal value of an investment will fluctuate so that an investor’s shares, when redeemed, may be worth more or less than their original cost. Performance shown without sales charges would be lower if sales charges were reflected. Current performance may be lower or higher than the performance data quoted and assumes the reinvestment of dividends and capital gains. Current month-end performance is available on the Fund’s website, wellsfargoadvantagefunds.com.
Index returns do not include transaction costs associated with buying and selling securities, any mutual fund fees or expenses, or any taxes. It is not possible to invest directly in an index.
For Class A shares, the maximum front-end sales charge is 5.75%. For Class B shares, the maximum contingent deferred sales charge is 5.00%. For Class C shares, the maximum contingent deferred sales charge is 1.00%. Performance including sales charge assumes the sales charge for the corresponding time period. Administrator Class and Institutional Class shares are sold without a front-end sales charge or contingent deferred sales charge.
Stock values fluctuate in response to the activities of individual companies and general market and economic conditions. Foreign investments are especially volatile and can rise or fall dramatically due to differences in the political and economic conditions of the host country. These risks are generally intensified in emerging markets. The use of derivatives may reduce returns and/or increase volatility. Certain investment strategies tend to increase the total risk of an investment (relative to the broader market). The Fund is exposed to smaller company securities risk. Consult the Fund’s prospectus for additional information on these and other risks.
Please see footnotes on page 17.
| | | | | | |
| Performance highlights (unaudited) | | Wells Fargo Advantage Equity Gateway Funds | | | 17 | |
Wells Fargo Advantage International Value Fund (continued)
| | | | |
| Ten largest equity holdings6 (%) as of November 30, 2012 | |
Royal Dutch Shell plc Class B | | | 2.70 | |
Sanofi-Aventis SA | | | 2.34 | |
AstraZeneca plc | | | 1.98 | |
China Petroleum & Chemical Corporation | | | 1.48 | |
Volkswagen AG | | | 1.36 | |
KDDI Corporation | | | 1.32 | |
Allianz AG | | | 1.28 | |
Total SA | | | 1.27 | |
BP plc | | | 1.25 | |
BT Group plc | | | 1.25 | |
|
| Sector distribution7 as of November 30, 2012 |
|
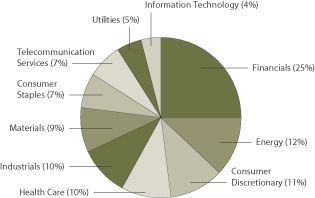
|
| 1. | The Fund is a gateway feeder fund that invests all of its assets in a single master portfolio of the Wells Fargo Master Trust (the “Master Trust”) with a substantially similar investment objective and substantially similar investment strategies. References to the investment activities of the Fund are intended to refer to the investment activities of the master portfolio in which it invests. See Notes to Financial Statements for a discussion of the Master Trust. |
| 2. | Historical performance shown for Class B and Class C shares prior to their inception reflects the performance of Class A shares, adjusted to reflect the higher expenses applicable to Class B and C shares. Historical performance shown for the Institutional Class shares prior to their inception reflects the performance of the Administrator Class shares, and includes the higher expenses applicable to the Administrator Class shares. If these expenses had not been included, returns would be higher. Historical performance shown for the Administrator Class shares prior to their inception reflects the performance of the Class A shares, and includes the higher expenses applicable to the Class A shares. If these expenses had not been included, returns would be higher. |
| 3. | Reflects the expense ratios as stated in the most recent prospectuses. |
| 4. | The Adviser has committed through September 30, 2013, to waive fees and/or reimburse expenses to the extent necessary to cap the Fund’s Total Annual Fund Operating Expenses After Fee Waiver, excluding certain expenses, at the amounts shown. Brokerage commissions, stamp duty fees, interest, taxes, acquired fund fees and expenses, and extraordinary expenses are excluded from the cap. Fees from the underlying master portfolio(s) are included in the cap. Without this cap, the Fund’s returns would have been lower. |
| 5. | The Morgan Stanley Capital International Europe, Australasia, and Far East Value Index (Net) (MSCI EAFE Value Index (Net)) is an unmanaged market capitalization index designed to measure the performance of value securities within developed equity markets, excluding the United States & Canada. Source: MSCI. MSCI makes no express or implied warranties or representations and shall have no liability whatsoever with respect to any MSCI data contained herein. The MSCI data may not be further redistributed or used as a basis for other indexes or any securities or financial products. This report is not approved, reviewed or produced by MSCI. You cannot invest directly in an index. |
| 6. | The ten largest equity holdings are calculated based on the value of the securities of the master portfolio allocable to the Fund divided by the total net assets of the Fund. Holdings are subject to change and may have changed since the date specified. |
| 7. | Sector distribution is subject to change and represents the sector distribution of the master portfolio which is calculated based on total long-term investment of the master portfolio. |
| | | | |
| 18 | | Wells Fargo Advantage Equity Gateway Funds | | Performance highlights (unaudited) |
Wells Fargo Advantage Small Company Growth Fund1
Investment objective
The Fund seeks long-term capital appreciation.
Adviser
Wells Fargo Funds Management, LLC
Subadviser for master portfolio
Peregrine Capital Management, Inc.
Portfolio managers
William A. Grierson, CFA
Daniel J. Hagen, CFA
Robert B. Mersky, CFA
James P. Ross, CFA
Paul E. von Kuster, CFA
Average annual total returns2 (%) as of November 30, 2012
| | | | | | | | | | | | | | | | | | | | | | | | | | | | | | | | | | |
| | | | | Including sales charge | | | Excluding sales charge | | | Expense ratios3 (%) | |
| | | Inception date | | 1 year | | | 5 year | | | 10 year | | | 1 year | | | 5 year | | | 10 year | | | Gross | | | Net4 | |
| Class A (WFSAX) | | 1-30-04 | | | 5.66 | | | | 1.73 | | | | 7.75 | | | | 12.11 | | | | 2.95 | | | | 8.39 | | | | 1.45 | | | | 1.45 | |
| Class B (WFSBX)* | | 1-30-04 | | | 6.28 | | | | 1.81 | | | | 7.83 | | | | 11.28 | | | | 2.18 | | | | 7.83 | | | | 2.20 | | | | 2.20 | |
| Class C (WSMCX) | | 1-30-04 | | | 10.28 | | | | 2.20 | | | | 7.67 | | | | 11.28 | | | | 2.20 | | | | 7.67 | | | | 2.20 | | | | 2.20 | |
| Administrator Class (NVSCX) | | 11-11-94 | | | – | | | | – | | | | – | | | | 12.40 | | | | 3.22 | | | | 8.67 | | | | 1.29 | | | | 1.20 | |
| Institutional Class (WSCGX) | | 3-31-08 | | | – | | | | – | | | | – | | | | 12.68 | | | | 3.44 | | | | 8.79 | | | | 1.02 | | | | 0.95 | |
| Russell 2000® Growth Index5 | | – | | | – | | | | – | | | | – | | | | 11.13 | | | | 3.03 | | | | 8.71 | | | | – | | | | – | |
| * | | Class B shares are closed to investment, except in connection with the reinvestment of any distributions and permitted exchanges. |
Figures quoted represent past performance, which is no guarantee of future results and do not reflect the deduction of taxes that a shareholder may pay on fund distributions or the redemption of fund shares. Investment return and principal value of an investment will fluctuate so that an investor’s shares, when redeemed, may be worth more or less than their original cost. Performance shown without sales charges would be lower if sales charges were reflected. Current performance may be lower or higher than the performance data quoted and assumes the reinvestment of dividends and capital gains. Current month-end performance is available on the Fund’s website, wellsfargoadvantagefunds.com.
Index returns do not include transaction costs associated with buying and selling securities, any mutual fund fees or expenses, or any taxes. It is not possible to invest directly in an index.
For Class A shares, the maximum front-end sales charge is 5.75%. For Class B shares, the maximum contingent deferred sales charge is 5.00%. For Class C shares, the maximum contingent deferred sales charge is 1.00%. Performance including sales charge assumes the sales charge for the corresponding time period. Administrator Class and Institutional Class shares are sold without a front-end sales charge or contingent deferred sales charge.
Stock values fluctuate in response to the activities of individual companies and general market and economic conditions. Smaller-company stocks tend to be more volatile and less liquid than those of larger companies. Certain investment strategies tend to increase the total risk of an investment (relative to the broader market). The Fund is exposed to foreign investment risk. Consult the Fund’s prospectus for additional information on these and other risks.
Please see footnotes on page 19.
| | | | | | |
| Performance highlights (unaudited) | | Wells Fargo Advantage Equity Gateway Funds | | | 19 | |
Wells Fargo Advantage Small Company Growth Fund (continued)
| | | | |
| Ten largest equity holdings6 (%) as of November 30, 2012 | |
Hanesbrands Incorporated | | | 1.53 | |
SS&C Technologies Holdings | | | 1.46 | |
Cirrus Logic Incorporated | | | 1.40 | |
OSI Systems Incorporated | | | 1.28 | |
On Assignment Incorporated | | | 1.28 | |
Omnicell Incorporated | | | 1.25 | |
Cadence Design Systems Incorporated | | | 1.21 | |
Vocera Communications Incorporarted | | | 1.20 | |
Smith (A.O.) Corporation | | | 1.19 | |
Team Health Holdings LLC | | | 1.17 | |
| | | | | | |
| Sector distribution7 as of November 30, 2012 |
|
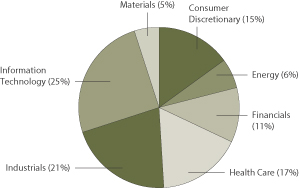
|
| 1. | The Fund is a gateway feeder fund that invests all of its assets in a single master portfolio of the Wells Fargo Master Trust (the “Master Trust”) with a substantially similar investment objective and substantially similar investment strategies. References to the investment activities of the Fund are intended to refer to the investment activities of the master portfolio in which it invests. See Notes to Financial Statements for a discussion of the Master Trust. |
| 2. | Historical performance shown for Class A, Class B, and Class C shares prior to their inception reflects the performance of the Administrator Class shares, adjusted to reflect the higher expenses applicable to Class A, Class B, and Class C shares. Historical performance shown for the Institutional Class shares prior to their inception reflects the performance of the Administrator Class shares, and includes the higher expenses applicable to the Administrator Class shares. If these expenses had not been included, returns would be higher. |
| 3. | Reflects the expense ratios as stated in the most recent prospectuses. |
| 4. | The Adviser has committed through September 30, 2013, to waive fees and/or reimburse expenses to the extent necessary to cap the Fund’s Total Annual Fund Operating Expenses After Fee Waiver, excluding certain expenses, at the amounts shown. Brokerage commissions, stamp duty fees, interest, taxes, acquired fund fees and expenses, and extraordinary expenses are excluded from the cap. Fees from the underlying master portfolio(s) are included in the cap. Without this cap, the Fund’s returns would have been lower. |
| 5. | The Russell 2000® Growth Index measures the performance shown of those Russell 2000 companies with higher price-to-book ratios and higher forecasted growth values. You cannot invest directly in an index. |
| 6. | The ten largest equity holdings are calculated based on the value of the securities of the master portfolio allocable to the Fund divided by the total net assets of the Fund. Holdings are subject to change and may have changed since the date specified. |
| 7. | Sector distribution is subject to change and represents the sector distribution of the master portfolio which is calculated based on total long-term investment of the master portfolio. |
| | | | |
| 20 | | Wells Fargo Advantage Equity Gateway Funds | | Performance highlights (unaudited) |
Wells Fargo Advantage Small Company Value Fund1
Investment objective
The Fund seeks long-term capital appreciation.
Adviser
Wells Fargo Funds Management, LLC
Subadviser for master portfolio
Peregrine Capital Management, Inc.
Portfolio managers
Jason R. Ballsrud, CFA
Tasso H. Coin, Jr., CFA
Douglas G. Pugh, CFA
Average annual total returns2 (%) as of November 30, 2012
| | | | | | | | | | | | | | | | | | | | | | | | | | | | | | | | | | |
| | | | | Including sales charge | | | Excluding sales charge | | | Expense ratios3 (%) | |
| | | Inception date | | 1 year | | | 5 year | | | 10 year | | | 1 year | | | 5 year | | | 10 year | | | Gross | | | Net4 | |
| Class A (SCVAX) | | 1-31-02 | | | 6.09 | | | | 2.09 | | | | 7.45 | | | | 12.56 | | | | 3.30 | | | | 8.09 | | | | 1.50 | | | | 1.45 | |
| Class B (SCVBX)* | | 1-31-02 | | | 6.81 | | | | 2.22 | | | | 7.55 | | | | 11.81 | | | | 2.59 | | | | 7.55 | | | | 2.25 | | | | 2.20 | |
| Class C (SCVFX) | | 8-30-02 | | | 10.73 | | | | 2.59 | | | | 7.32 | | | | 11.73 | | | | 2.59 | | | | 7.32 | | | | 2.25 | | | | 2.20 | |
| Administrator Class (SCVIX) | | 1-31-02 | | | – | | | | – | | | | – | | | | 12.83 | | | | 3.62 | | | | 8.38 | | | | 1.34 | | | | 1.20 | |
| Institutional Class (SCVNX) | | 7-30-10 | | | – | | | | – | | | | – | | | | 13.06 | | | | 3.71 | | | | 8.43 | | | | 1.07 | | | | 1.00 | |
| Russell 2000® Value Index5 | | – | | | – | | | | – | | | | – | | | | 15.05 | | | | 2.52 | | | | 8.58 | | | | – | | | | – | |
| * | | Class B shares are closed to investment, except in connection with the reinvestment of any distributions and permitted exchanges. |
Figures quoted represent past performance, which is no guarantee of future results and do not reflect the deduction of taxes that a shareholder may pay on fund distributions or the redemption of fund shares. Investment return and principal value of an investment will fluctuate so that an investor’s shares, when redeemed, may be worth more or less than their original cost. Performance shown without sales charges would be lower if sales charges were reflected. Current performance may be lower or higher than the performance data quoted and assumes the reinvestment of dividends and capital gains. Current month-end performance is available on the Fund’s website, wellsfargoadvantagefunds.com.
Index returns do not include transaction costs associated with buying and selling securities, any mutual fund fees or expenses, or any taxes. It is not possible to invest directly in an index.
For Class A shares, the maximum front-end sales charge is 5.75%. For Class B shares, the maximum contingent deferred sales charge is 5.00%. For Class C shares, the maximum contingent deferred sales charge is 1.00%. Performance including sales charge assumes the sales charge for the corresponding time period. Administrator Class and Institutional Class shares are sold without a front-end sales charge or contingent deferred sales charge.
Stock values fluctuate in response to the activities of individual companies and general market and economic conditions. Smaller-company stocks tend to be more volatile and less liquid than those of larger companies. Certain investment strategies tend to increase the total risk of an investment (relative to the broader market). The Fund is exposed to foreign investment risk. Consult the Fund’s prospectus for additional information on these and other risks.
Please see footnotes on page 21.
| | | | | | |
| Performance highlights (unaudited) | | Wells Fargo Advantage Equity Gateway Funds | | | 21 | |
Wells Fargo Advantage Small Company Value Fund (continued)
| | | | |
| Ten largest equity holdings6 (%) as of November 30, 2012 | |
Kulicke & Soffa Industries Incorporated | | | 1.48 | |
Sabra Health Care REIT Incorporated | | | 1.45 | |
Employers Holdings Incorporated | | | 1.44 | |
Hercules Offshore Incorporated | | | 1.43 | |
Ameristar Casinos Incorporated | | | 1.39 | |
Magnum Hunter Resources Corporation | | | 1.35 | |
Western Alliance Bancorp | | | 1.34 | |
Great Lakes Dredge & Dock Company | | | 1.30 | |
Aeropostale Incorporated | | | 1.29 | |
Greenhill & Company Incorporated | | | 1.28 | |
| | | | | | |
| Sector distribution7 as of November 30, 2012 |
|
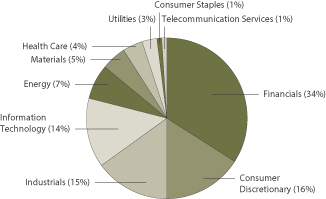
|
| 1. | The Fund is a gateway feeder fund that invests all of its assets in a single master portfolio of the Wells Fargo Master Trust (the “Master Trust”) with a substantially similar investment objective and substantially similar investment strategies. References to the investment activities of the Fund are intended to refer to the investment activities of the master portfolio in which it invests. See Notes to Financial Statements for a discussion of the Master Trust. |
| 2. | Historical performance shown for the Institutional Class shares prior to their inception reflects the performance of the Administrator Class shares and includes the higher expenses applicable to the Administrator Class shares. If these expenses had not been included, returns would be higher. Historical performance shown for Class C shares prior to their inception reflects the performance of the Class B shares. Historical performance shown for Class A, Class B, and Administrator Class shares prior to their inception reflects the performance of the Wells Fargo Advantage Small Company Value Portfolio, a master portfolio in which the Fund invests, adjusted to reflect Class A , Class B and Administrator Class expenses. |
| 3. | Reflects the expense ratios as stated in the most recent prospectuses. |
| 4. | The Adviser has committed through September 30, 2013, to waive fees and/or reimburse expenses to the extent necessary to cap the Fund’s Total Annual Fund Operating Expenses After Fee Waiver, excluding certain expenses, at the amounts shown. Brokerage commissions, stamp duty fees, interest, taxes, acquired fund fees and expenses, and extraordinary expenses are excluded from the cap. Fees from the underlying master portfolio(s) are included in the cap. Without this cap, the Fund’s returns would have been lower. |
| 5. | The Russell 2000® Value Index measures the performance of those Russell 2000® companies with lower price-to- book ratios and lower forecasted growth values. You cannot invest directly in an index. |
| 6. | The ten largest equity holdings are calculated based on the value of the securities of the master portfolio allocable to the Fund divided by the total net assets of the Fund. Holdings are subject to change and may have changed since the date specified. |
| 7. | Sector distribution is subject to change and represents the sector distribution of the master portfolio which is calculated based on total long-term investment of the master portfolio. |
| | | | |
| 22 | | Wells Fargo Advantage Equity Gateway Funds | | Fund expenses (unaudited) |
As a shareholder of the Fund, you incur two types of costs: (1) transaction costs, including sales charges (loads) on purchase payments and contingent deferred sales charges (if any) on redemptions and (2) ongoing costs, including management fees, distribution (12b-1) and/or shareholder service fees, and other Fund expenses. This example is intended to help you understand your ongoing costs (in dollars) of investing in the Fund and to compare these costs with the ongoing costs of investing in other mutual funds.
The example is based on an investment of $1,000 invested at the beginning of the six-month period and held for the entire period from June 1, 2012, to November 30, 2012.
Actual expenses
The “Actual” line of the table below provides information about actual account values and actual expenses. You may use the information in this line, together with the amount you invested, to estimate the expenses that you paid over the period. Simply divide your account value by $1,000 (for example, an $8,600 account value divided by $1,000 = 8.6), then multiply the result by the number in the “Actual” line under the heading entitled “Expenses paid during period” for your applicable class of shares to estimate the expenses you paid on your account during this period.
Hypothetical example for comparison purposes
The “Hypothetical” line of the table below provides information about hypothetical account values and hypothetical expenses based on the Fund’s actual expense ratio and an assumed rate of return of 5% per year before expenses, which is not the Fund’s actual return. The hypothetical account values and expenses may not be used to estimate the actual ending account balance or expenses you paid for the period. You may use this information to compare the ongoing costs of investing in the Fund and other funds. To do so, compare this 5% hypothetical example with the 5% hypothetical examples that appear in the shareholder reports of the other funds.
Please note that the expenses shown in the table are meant to highlight your ongoing costs only and do not reflect any transactional costs, such as sales charges (loads) and contingent deferred sales charges. Therefore, the “Hypothetical” line of the table is useful in comparing ongoing costs only and will not help you determine the relative total costs of owning different funds. In addition, if these transactional costs were included, your costs would have been higher.
| | | | | | | | | | | | | | | | |
| Wells Fargo Advantage C&B Large Cap Value Fund | | Beginning account value
6-1-12 | | | Ending
account value
11-30-12 | | | Expenses
paid during
the period¹ | | | Net annual
expense ratio | |
Class A | | | | | | | | | | | | | | | | |
Actual | | $ | 1,000.00 | | | $ | 1,066.42 | | | $ | 5.96 | | | | 1.15 | % |
Hypothetical (5% return before expenses) | | $ | 1,000.00 | | | $ | 1,019.30 | | | $ | 5.82 | | | | 1.15 | % |
Class B | | | | | | | | | | | | | | | | |
Actual | | $ | 1,000.00 | | | $ | 1,062.50 | | | $ | 9.82 | | | | 1.90 | % |
Hypothetical (5% return before expenses) | | $ | 1,000.00 | | | $ | 1,015.54 | | | $ | 9.60 | | | | 1.90 | % |
Class C | | | | | | | | | | | | | | | | |
Actual | | $ | 1,000.00 | | | $ | 1,061.65 | | | $ | 9.82 | | | | 1.90 | % |
Hypothetical (5% return before expenses) | | $ | 1,000.00 | | | $ | 1,015.54 | | | $ | 9.60 | | | | 1.90 | % |
Administrator Class | | | | | | | | | | | | | | | | |
Actual | | $ | 1,000.00 | | | $ | 1,067.65 | | | $ | 4.92 | | | | 0.95 | % |
Hypothetical (5% return before expenses) | | $ | 1,000.00 | | | $ | 1,020.31 | | | $ | 4.81 | | | | 0.95 | % |
Institutional Class | | | | | | | | | | | | | | | | |
Actual | | $ | 1,000.00 | | | $ | 1,068.63 | | | $ | 3.63 | | | | 0.70 | % |
Hypothetical (5% return before expenses) | | $ | 1,000.00 | | | $ | 1,021.56 | | | $ | 3.55 | | | | 0.70 | % |
Investor Class | | | | | | | | | | | | | | | | |
Actual | | $ | 1,000.00 | | | $ | 1,065.11 | | | $ | 6.21 | | | | 1.20 | % |
Hypothetical (5% return before expenses) | | $ | 1,000.00 | | | $ | 1,019.05 | | | $ | 6.07 | | | | 1.20 | % |
Please see footnote on page 25.
| | | | | | |
| Fund expenses (unaudited) | | Wells Fargo Advantage Equity Gateway Funds | | | 23 | |
| | | | | | | | | | | | | | | | |
| Wells Fargo Advantage Diversified Equity Fund | | Beginning account value
6-1-12 | | | Ending
account value
11-30-12 | | | Expenses
paid during
the period¹ | | | Net annual
expense ratio | |
Class A | | | | | | | | | | | | | | | | |
Actual | | $ | 1,000.00 | | | $ | 1,091.26 | | | $ | 6.55 | | | | 1.25 | % |
Hypothetical (5% return before expenses) | | $ | 1,000.00 | | | $ | 1,018.80 | | | $ | 6.33 | | | | 1.25 | % |
Class B | | | | | | | | | | | | | | | | |
Actual | | $ | 1,000.00 | | | $ | 1,087.03 | | | $ | 10.46 | | | | 2.00 | % |
Hypothetical (5% return before expenses) | | $ | 1,000.00 | | | $ | 1,015.04 | | | $ | 10.10 | | | | 2.00 | % |
Class C | | | | | | | | | | | | | | | | |
Actual | | $ | 1,000.00 | | | $ | 1,087.22 | | | $ | 10.46 | | | | 2.00 | % |
Hypothetical (5% return before expenses) | | $ | 1,000.00 | | | $ | 1,015.04 | | | $ | 10.10 | | | | 2.00 | % |
Administrator Class | | | | | | | | | | | | | | | | |
Actual | | $ | 1,000.00 | | | $ | 1,092.65 | | | $ | 5.25 | | | | 1.00 | % |
Hypothetical (5% return before expenses) | | $ | 1,000.00 | | | $ | 1,020.05 | | | $ | 5.06 | | | | 1.00 | % |
| Wells Fargo Advantage Diversified Small Cap Fund | | | | | | | | | | | | |
Administrator Class | | | | | | | | | | | | | | | | |
Actual | | $ | 1,000.00 | | | $ | 1,079.24 | | | $ | 5.21 | | | | 1.00 | % |
Hypothetical (5% return before expenses) | | $ | 1,000.00 | | | $ | 1,020.05 | | | $ | 5.06 | | | | 1.00 | % |
| Wells Fargo Advantage Emerging Growth Fund | | | | | | | | | | | | |
Class A | | | | | | | | | | | | | | | | |
Actual | | $ | 1,000.00 | | | $ | 1,009.65 | | | $ | 6.90 | | | | 1.37 | % |
Hypothetical (5% return before expenses) | | $ | 1,000.00 | | | $ | 1,018.20 | | | $ | 6.93 | | | | 1.37 | % |
Class C | | | | | | | | | | | | | | | | |
Actual | | $ | 1,000.00 | | | $ | 1,005.80 | | | $ | 10.66 | | | | 2.12 | % |
Hypothetical (5% return before expenses) | | $ | 1,000.00 | | | $ | 1,014.44 | | | $ | 10.71 | | | | 2.12 | % |
Administrator Class | | | | | | | | | | | | | | | | |
Actual | | $ | 1,000.00 | | | $ | 1,011.15 | | | $ | 6.05 | | | | 1.20 | % |
Hypothetical (5% return before expenses) | | $ | 1,000.00 | | | $ | 1,019.05 | | | $ | 6.07 | | | | 1.20 | % |
Institutional Class | | | | | | | | | | | | | | | | |
Actual | | $ | 1,000.00 | | | $ | 1,012.60 | | | $ | 4.54 | | | | 0.90 | % |
Hypothetical (5% return before expenses) | | $ | 1,000.00 | | | $ | 1,020.56 | | | $ | 4.56 | | | | 0.90 | % |
Investor Class | | | | | | | | | | | | | | | | |
Actual | | $ | 1,000.00 | | | $ | 1,009.69 | | | $ | 7.25 | | | | 1.44 | % |
Hypothetical (5% return before expenses) | | $ | 1,000.00 | | | $ | 1,017.85 | | | $ | 7.28 | | | | 1.44 | % |
| Wells Fargo Advantage Equity Value Fund | | | | | | | | | | | | |
Class A | | | | | | | | | | | | | | | | |
Actual | | $ | 1,000.00 | | | $ | 1,107.26 | | | $ | 6.55 | | | | 1.24 | % |
Hypothetical (5% return before expenses) | | $ | 1,000.00 | | | $ | 1,018.85 | | | $ | 6.28 | | | | 1.24 | % |
Class B | | | | | | | | | | | | | | | | |
Actual | | $ | 1,000.00 | | | $ | 1,103.59 | | | $ | 10.39 | | | | 1.97 | % |
Hypothetical (5% return before expenses) | | $ | 1,000.00 | | | $ | 1,015.19 | | | $ | 9.95 | | | | 1.97 | % |
Class C | | | | | | | | | | | | | | | | |
Actual | | $ | 1,000.00 | | | $ | 1,102.80 | | | $ | 10.49 | | | | 1.99 | % |
Hypothetical (5% return before expenses) | | $ | 1,000.00 | | | $ | 1,015.09 | | | $ | 10.05 | | | | 1.99 | % |
Class R | | | | | | | | | | | | | | | | |
Actual | | $ | 1,000.00 | | | $ | 1,106.18 | | | $ | 7.81 | | | | 1.48 | % |
Hypothetical (5% return before expenses) | | $ | 1,000.00 | | | $ | 1,017.65 | | | $ | 7.49 | | | | 1.48 | % |
Administrator Class | | | | | | | | | | | | | | | | |
Actual | | $ | 1,000.00 | | | $ | 1,109.18 | | | $ | 5.29 | | | | 1.00 | % |
Hypothetical (5% return before expenses) | | $ | 1,000.00 | | | $ | 1,020.05 | | | $ | 5.06 | | | | 1.00 | % |
Institutional Class | | | | | | | | | | | | | | | | |
Actual | | $ | 1,000.00 | | | $ | 1,107.51 | | | $ | 3.96 | | | | 0.75 | % |
Hypothetical (5% return before expenses) | | $ | 1,000.00 | | | $ | 1,021.31 | | | $ | 3.80 | | | | 0.75 | % |
Please see footnote on page 25.
| | | | |
| 24 | | Wells Fargo Advantage Equity Gateway Funds | | Fund expenses (unaudited) |
| | | | | | | | | | | | | | | | |
| Wells Fargo Advantage Index Fund | | Beginning account value
6-1-12 | | | Ending
account value
11-30-12 | | | Expenses
paid during
the period¹ | | | Net annual
expense ratio | |
Class A | | | | | | | | | | | | | | | | |
Actual | | $ | 1,000.00 | | | $ | 1,090.40 | | | $ | 2.93 | | | | 0.56 | % |
Hypothetical (5% return before expenses) | | $ | 1,000.00 | | | $ | 1,022.26 | | | $ | 2.84 | | | | 0.56 | % |
Class B | | | | | | | | | | | | | | | | |
Actual | | $ | 1,000.00 | | | $ | 1,086.23 | | | $ | 6.85 | | | | 1.31 | % |
Hypothetical (5% return before expenses) | | $ | 1,000.00 | | | $ | 1,018.50 | | | $ | 6.63 | | | | 1.31 | % |
Class C | | | | | | | | | | | | | | | | |
Actual | | $ | 1,000.00 | | | $ | 1,086.24 | | | $ | 6.85 | | | | 1.31 | % |
Hypothetical (5% return before expenses) | | $ | 1,000.00 | | | $ | 1,018.50 | | | $ | 6.63 | | | | 1.31 | % |
Administrator Class | | | | | | | | | | | | | | | | |
Actual | | $ | 1,000.00 | | | $ | 1,092.09 | | | $ | 1.31 | | | | 0.25 | % |
Hypothetical (5% return before expenses) | | $ | 1,000.00 | | | $ | 1,023.82 | | | $ | 1.27 | | | | 0.25 | % |
Investor Class | | | | | | | | | | | | | | | | |
Actual | | $ | 1,000.00 | | | $ | 1,091.03 | | | $ | 2.36 | | | | 0.45 | % |
Hypothetical (5% return before expenses) | | $ | 1,000.00 | | | $ | 1,022.81 | | | $ | 2.28 | | | | 0.45 | % |
| Wells Fargo Advantage International Value Fund | | | | | | | | | | | | |
Class A | | | | | | | | | | | | | | | | |
Actual | | $ | 1,000.00 | | | $ | 1,167.29 | | | $ | 8.15 | | | | 1.50 | % |
Hypothetical (5% return before expenses) | | $ | 1,000.00 | | | $ | 1,017.55 | | | $ | 7.59 | | | | 1.50 | % |
Class B | | | | | | | | | | | | | | | | |
Actual | | $ | 1,000.00 | | | $ | 1,163.21 | | | $ | 12.20 | | | | 2.25 | % |
Hypothetical (5% return before expenses) | | $ | 1,000.00 | | | $ | 1,013.79 | | | $ | 11.36 | | | | 2.25 | % |
Class C | | | | | | | | | | | | | | | | |
Actual | | $ | 1,000.00 | | | $ | 1,163.32 | | | $ | 12.20 | | | | 2.25 | % |
Hypothetical (5% return before expenses) | | $ | 1,000.00 | | | $ | 1,013.79 | | | $ | 11.36 | | | | 2.25 | % |
Administrator Class | | | | | | | | | | | | | | | | |
Actual | | $ | 1,000.00 | | | $ | 1,168.40 | | | $ | 6.79 | | | | 1.25 | % |
Hypothetical (5% return before expenses) | | $ | 1,000.00 | | | $ | 1,018.80 | | | $ | 6.33 | | | | 1.25 | % |
Institutional Class | | | | | | | | | | | | | | | | |
Actual | | $ | 1,000.00 | | | $ | 1,170.13 | | | $ | 5.71 | | | | 1.05 | % |
Hypothetical (5% return before expenses) | | $ | 1,000.00 | | | $ | 1,019.80 | | | $ | 5.32 | | | | 1.05 | % |
| Wells Fargo Advantage Small Company Growth Fund | | | | | | | | | | | | |
Class A | | | | | | | | | | | | | | | | |
Actual | | $ | 1,000.00 | | | $ | 1,073.61 | | | $ | 7.54 | | | | 1.45 | % |
Hypothetical (5% return before expenses) | | $ | 1,000.00 | | | $ | 1,017.80 | | | $ | 7.33 | | | | 1.45 | % |
Class B | | | | | | | | | | | | | | | | |
Actual | | $ | 1,000.00 | | | $ | 1,069.82 | | | $ | 11.42 | | | | 2.20 | % |
Hypothetical (5% return before expenses) | | $ | 1,000.00 | | | $ | 1,014.04 | | | $ | 11.11 | | | | 2.20 | % |
Class C | | | | | | | | | | | | | | | | |
Actual | | $ | 1,000.00 | | | $ | 1,069.43 | | | $ | 11.41 | | | | 2.20 | % |
Hypothetical (5% return before expenses) | | $ | 1,000.00 | | | $ | 1,014.04 | | | $ | 11.11 | | | | 2.20 | % |
Administrator Class | | | | | | | | | | | | | | | | |
Actual | | $ | 1,000.00 | | | $ | 1,075.09 | | | $ | 6.24 | | | | 1.20 | % |
Hypothetical (5% return before expenses) | | $ | 1,000.00 | | | $ | 1,019.05 | | | $ | 6.07 | | | | 1.20 | % |
Institutional Class | | | | | | | | | | | | | | | | |
Actual | | $ | 1,000.00 | | | $ | 1,076.61 | | | $ | 4.95 | | | | 0.95 | % |
Hypothetical (5% return before expenses) | | $ | 1,000.00 | | | $ | 1,020.31 | | | $ | 4.81 | | | | 0.95 | % |
Please see footnote on page 25.
| | | | | | |
| Fund expenses (unaudited) | | Wells Fargo Advantage Equity Gateway Funds | | | 25 | |
| | | | | | | | | | | | | | | | |
| Wells Fargo Advantage Small Company Value Fund | | Beginning account value
6-1-12 | | | Ending
account value
11-30-12 | | | Expenses
paid during
the period¹ | | | Net annual
expense ratio | |
Class A | | | | | | | | | | | | | | | | |
Actual | | $ | 1,000.00 | | | $ | 1,065.30 | | | $ | 7.51 | | | | 1.45 | % |
Hypothetical (5% return before expenses) | | $ | 1,000.00 | | | $ | 1,017.80 | | | $ | 7.33 | | | | 1.45 | % |
Class B | | | | | | | | | | | | | | | | |
Actual | | $ | 1,000.00 | | | $ | 1,062.24 | | | $ | 11.37 | | | | 2.20 | % |
Hypothetical (5% return before expenses) | | $ | 1,000.00 | | | $ | 1,014.04 | | | $ | 11.11 | | | | 2.20 | % |
Class C | | | | | | | | | | | | | | | | |
Actual | | $ | 1,000.00 | | | $ | 1,062.50 | | | $ | 11.37 | | | | 2.20 | % |
Hypothetical (5% return before expenses) | | $ | 1,000.00 | | | $ | 1,014.04 | | | $ | 11.11 | | | | 2.20 | % |
Administrator Class | | | | | | | | | | | | | | | | |
Actual | | $ | 1,000.00 | | | $ | 1,067.21 | | | $ | 6.22 | | | | 1.20 | % |
Hypothetical (5% return before expenses) | | $ | 1,000.00 | | | $ | 1,019.05 | | | $ | 6.07 | | | | 1.20 | % |
Institutional Class | | | | | | | | | | | | | | | | |
Actual | | $ | 1,000.00 | | | $ | 1,068.61 | | | $ | 5.19 | | | | 1.00 | % |
Hypothetical (5% return before expenses) | | $ | 1,000.00 | | | $ | 1,020.05 | | | $ | 5.06 | | | | 1.00 | % |
| 1. | Expenses paid is equal to the annualized expense ratio of each class multiplied by the average account value over the period, multiplied by the number of days in the most recent fiscal half-year divided by the number of days in the fiscal year (to reflect the one-half-year period). |
| | | | |
| 26 | | Wells Fargo Advantage Equity Gateway Funds | | Portfolio of investments—November 30, 2012 (unaudited) |
C&B LARGE CAP VALUE FUND
| | | | | | | | | | |
| Security name | | | | | | | | Value | |
| | | | | | | | | | |
| | | | |
Investment Companies: 100.03% | | | | | | | | | | |
| | | | |
| Affiliated Master Portfolio: 100.03% | | | | | | | | | | |
Wells Fargo Advantage C&B Large Cap Value Portfolio | | | | | | | | $ | 270,152,234 | |
| | | | | | | | | | |
| | | | |
Total Investment Companies (Cost $230,266,757) | | | | | | | | | 270,152,234 | |
| | | | | | | | | | |
| | | | | | | | |
| Total investments in securities | | | | | | | | |
| (Cost $230,266,757)* | | | 100.03 | % | | | 270,152,234 | |
Other assets and liabilities, net | | | (0.03 | ) | | | (94,292 | ) |
| | | | | | | | |
| Total net assets | | | 100.00 | % | | $ | 270,057,942 | |
| | | | | | | | |
| * | Cost for federal income tax purposes is substantially the same as for financial reporting purposes. |
The accompanying notes are an integral part of these financial statements.
| | | | | | |
| Portfolio of investments—November 30, 2012 (unaudited) | | Wells Fargo Advantage Equity Gateway Funds | | | 27 | |
DIVERSIFIED EQUITY FUND
| | | | | | | | | | | | |
| Security name | | | | | | | | | Value | |
| | | | | | | | | | | | |
| | | | |
Investment Companies: 100.33% | | | | | | | | | | | | |
| | | | |
| Affiliated Master Portfolios: 100.33% | | | | | | | | | | | | |
Wells Fargo Advantage C&B Large Cap Value Portfolio | | | | | | | | | | $ | 30,553,064 | |
Wells Fargo Advantage Diversified Large Cap Growth Portfolio | | | | | | | | | | | 93,315,716 | |
Wells Fargo Advantage Emerging Growth Portfolio | | | | | | | | | | | 9,037,854 | |
Wells Fargo Advantage Equity Value Portfolio | | | | | | | | | | | 30,919,269 | |
Wells Fargo Advantage Index Portfolio | | | | | | | | | | | 92,822,697 | |
Wells Fargo Advantage International Equity Portfolio | | | | | | | | | | | 14,013,387 | |
Wells Fargo Advantage International Growth Portfolio | | | | | | | | | | | 14,014,470 | |
Wells Fargo Advantage International Index Portfolio | | | | | | | | | | | 14,006,623 | |
Wells Fargo Advantage International Value Portfolio | | | | | | | | | | | 13,969,802 | |
Wells Fargo Advantage Large Company Value Portfolio | | | | | | | | | | | 30,649,767 | |
Wells Fargo Advantage Small Cap Value Portfolio | | | | | | | | | | | 8,991,777 | |
Wells Fargo Advantage Small Company Growth Portfolio | | | | | | | | | | | 9,267,834 | |
Wells Fargo Advantage Small Company Value Portfolio | | | | | | | | | | | 9,310,606 | |
| | | | |
Total Investment Companies (Cost $330,369,013) | | | | | | | | | | | 370,872,866 | |
| | | | | | | | | | | | |
| | | | |
| | | | | | | Principal | | | | |
| Other: 0.03% | | | | | | | | | | | | |
Gryphon Funding Limited, Pass-Through Entity (a)(i) | | | | | | $ | 340,800 | | | | 112,464 | |
| | | | | | | | | | | | |
| | | | |
Total Other (Cost $81,118) | | | | | | | | | | | 112,464 | |
| | | | | | | | | | | | |
| | | | | | | | |
| Total investments in securities | | | | | | | | |
| (Cost $330,450,131)* | | | 100.36 | % | | | 370,985,330 | |
Other assets and liabilities, net | | | (0.36 | ) | | | (1,313,762 | ) |
| | | | | | | | |
| Total net assets | | | 100.00 | % | | $ | 369,671,568 | |
| | | | | | | | |
| (a) | Security is fair valued by the Management Valuation Team, and in certain instances by the Board of Trustees, in accordance with procedures approved by the Board of Trustees. |
| * | Cost for federal income tax purposes is $316,737,893 and unrealized appreciation (depreciation) consists of: |
| | | | |
Gross unrealized appreciation | | $ | 59,971,069 | |
Gross unrealized depreciation | | | (5,723,632 | ) |
| | | | |
Net unrealized appreciation | | $ | 54,247,437 | |
The accompanying notes are an integral part of these financial statements.
| | | | |
| 28 | | Wells Fargo Advantage Equity Gateway Funds | | Portfolio of investments—November 30, 2012 (unaudited) |
DIVERSIFIED SMALL CAP FUND
| | | | | | | | | | | | |
| Security name | | | | | | | | | Value | |
| | | | | | | | | | | | |
| | | | |
Investment Companies: 98.06% | | | | | | | | | | | | |
| | | | |
| Affiliated Master Portfolios: 98.06% | | | | | | | | | | | | |
Wells Fargo Advantage Emerging Growth Portfolio | | | | | | | | | | $ | 1,981,900 | |
Wells Fargo Advantage Small Cap Value Portfolio | | | | | | | | | | | 2,077,034 | |
Wells Fargo Advantage Small Company Growth Portfolio | | | | | | | | | | | 2,112,539 | |
Wells Fargo Advantage Small Company Value Portfolio | | | | | | | | | | | 2,090,156 | |
| | | | |
Total Investment Companies (Cost $7,056,689) | | | | | | | | | | | 8,261,629 | |
| | | | | | | | | | | | |
| | | | |
| | | | | | | Principal | | | | |
| | | | |
Other: 2.56% | | | | | | | | | | | | |
Gryphon Funding Limited, Pass-Through Entity (a)(i) | | | | | | $ | 652,590 | | | | 215,355 | |
| | | | | | | | | | | | |
| | | | |
Total Other (Cost $155,332) | | | | | | | | | | | 215,355 | |
| | | | | | | | | | | | |
| | | | | | | | |
| Total investments in securities | | | | | | | | |
| (Cost $7,212,021)* | | | 100.62 | % | | | 8,476,984 | |
Other assets and liabilities, net | | | (0.62 | ) | | | (52,077 | ) |
| | | | | | | | |
| Total net assets | | | 100.00 | % | | $ | 8,424,907 | |
| | | | | | | | |
| (a) | Security is fair valued by the Management Valuation Team, and in certain instances by the Board of Trustees, in accordance with procedures approved by the Board of Trustees. |
| * | Cost for federal income tax purposes is $10,166,658 and unrealized appreciation (depreciation) consists of: |
| | | | |
Gross unrealized appreciation | | $ | 0 | |
Gross unrealized depreciation | | | (1,689,674 | ) |
| | | | |
Net unrealized depreciation | | $ | (1,689,674 | ) |
The accompanying notes are an integral part of these financial statements.
| | | | | | |
| Portfolio of investments—November 30, 2012 (unaudited) | | Wells Fargo Advantage Equity Gateway Funds | | | 29 | |
EMERGING GROWTH FUND
| | | | | | | | | | |
| Security name | | | | | | | | Value | |
| | | | | | | | | | |
| | | | |
Investment Companies: 100.45% | | | | | | | | | | |
| | | | |
| Affiliated Master Portfolio: 100.45% | | | | | | | | | | |
Wells Fargo Advantage Emerging Growth Portfolio | | | | | | | | $ | 835,943,825 | |
| | | | | | | | | | |
| | | | |
Total Investment Companies (Cost $779,560,162) | | | | | | | | | 835,943,825 | |
| | | | | | | | | | |
| | | | | | | | |
| Total investments in securities | | | | | | | | |
| (Cost $779,560,162)* | | | 100.45 | % | | | 835,943,825 | |
Other assets and liabilities, net | | | (0.45 | ) | | | (3,727,595 | ) |
| | | | | | | | |
| Total net assets | | | 100.00 | % | | $ | 832,216,230 | |
| | | | | | | | |
| * | Cost for federal income tax purposes is substantially the same as for financial reporting purposes. |
The accompanying notes are an integral part of these financial statements.
| | | | |
| 30 | | Wells Fargo Advantage Equity Gateway Funds | | Portfolio of investments—November 30, 2012 (unaudited) |
EQUITY VALUE FUND
| | | | | | | | | | |
| Security name | | | | | | | | Value | |
| | | | | | | | | | |
| | | | |
Investment Companies: 100.14% | | | | | | | | | | |
| | | | |
| Affiliated Master Portfolio: 100.14% | | | | | | | | | | |
Wells Fargo Advantage Equity Value Portfolio | | | | | | | | $ | 709,688,154 | |
| | | | | | | | | | |
| | | | |
Total Investment Companies (Cost $631,426,184) | | | | | | | | | 709,688,154 | |
| | | | | | | | | | |
| | | | | | | | |
| Total investments in securities | | | | | | | | |
| (Cost $631,426,184)* | | | 100.14 | % | | | 709,688,154 | |
Other assets and liabilities, net | | | (0.14 | ) | | | (971,573 | ) |
| | | | | | | | |
| Total net assets | | | 100.00 | % | | $ | 708,716,581 | |
| | | | | | | | |
| * | Cost for federal income tax purposes is substantially the same as for financial reporting purposes. |
The accompanying notes are an integral part of these financial statements.
| | | | | | |
| Portfolio of investments—November 30, 2012 (unaudited) | | Wells Fargo Advantage Equity Gateway Funds | | | 31 | |
INDEX FUND
| | | | | | | | | | |
| Security name | | | | | | | | Value | |
| | | | | | | | | | |
| | | | |
Investment Companies: 100.09% | | | | | | | | | | |
| | | | |
| Affiliated Master Portfolio: 100.09% | | | | | | | | | | |
Wells Fargo Advantage Index Portfolio | | | | | | | | $ | 2,363,594,599 | |
| | | | | | | | | | |
| | | | |
Total Investment Companies (Cost $1,642,294,272) | | | | | | | | | 2,363,594,599 | |
| | | | | | | | | | |
| | | | | | | | |
| Total investments in securities | | | | | | | | |
| (Cost $1,642,294,272)* | | | 100.09 | % | | | 2,363,594,599 | |
Other assets and liabilities, net | | | (0.09 | ) | | | (2,043,432 | ) |
| | | | | | | | |
| Total net assets | | | 100.00 | % | | $ | 2,361,551,167 | |
| | | | | | | | |
| * | Cost for federal income tax purposes is substantially the same as for financial reporting purposes. |
The accompanying notes are an integral part of these financial statements.
| | | | |
| 32 | | Wells Fargo Advantage Equity Gateway Funds | | Portfolio of investments—November 30, 2012 (unaudited) |
INTERNATIONAL VALUE FUND
| | | | | | | | | | |
| Security name | | | | | | | | Value | |
| | | | | | | | | | |
| | | | |
Investment Companies: 99.99% | | | | | | | | | | |
| | | | |
| Affiliated Master Portfolio: 99.99% | | | | | | | | | | |
Wells Fargo Advantage International Value Portfolio | | | | | | | | $ | 337,281,007 | |
| | | | | | | | | | |
| | | | |
Total Investment Companies (Cost $373,707,390) | | | | | | | | | 337,281,007 | |
| | | | | | | | | | |
| | | | | | | | |
| Total investments in securities | | | | | | | | |
| (Cost $373,707,390)* | | | 99.99 | % | | | 337,281,007 | |
Other assets and liabilities, net | | | 0.01 | | | | 27,339 | |
| | | | | | | | |
| Total net assets | | | 100.00 | % | | $ | 337,308,346 | |
| | | | | | | | |
| * | Cost for federal income tax purposes is substantially the same as for financial reporting purposes. |
The accompanying notes are an integral part of these financial statements.
| | | | | | |
| Portfolio of investments—November 30, 2012 (unaudited) | | Wells Fargo Advantage Equity Gateway Funds | | | 33 | |
SMALL COMPANY GROWTH FUND
| | | | | | | | | | |
| Security name | | | | | | | | Value | |
| | | | | | | | | | |
| | | | |
Investment Companies: 100.00% | | | | | | | | | | |
| | | | |
| Affiliated Master Portfolio: 100.00% | | | | | | | | | | |
Wells Fargo Advantage Small Company Growth Portfolio | | | | | | | | $ | 115,579,813 | |
| | | | | | | | | | |
| | | | |
Total Investment Companies (Cost $140,529,017) | | | | | | | | | 115,579,813 | |
| | | | | | | | | | |
| | | | | | | | |
| Total investments in securities | | | | | | | | |
| (Cost $140,529,017)* | | | 100.00 | % | | | 115,579,813 | |
Other assets and liabilities, net | | | 0.00 | | | | 5,676 | |
| | | | | | | | |
| Total net assets | | | 100.00 | % | | $ | 115,585,489 | |
| | | | | | | | |
| * | Cost for federal income tax purposes is substantially the same as for financial reporting purposes. |
The accompanying notes are an integral part of these financial statements.
| | | | |
| 34 | | Wells Fargo Advantage Equity Gateway Funds | | Portfolio of investments—November 30, 2012 (unaudited) |
SMALL COMPANY VALUE FUND
| | | | | | | | | | |
| Security name | | | | | | | | Value | |
| | | | | | | | | | |
| | | | |
Investment Companies: 100.05% | | | | | | | | | | |
| | | | |
| Affiliated Master Portfolio: 100.05% | | | | | | | | | | |
Wells Fargo Advantage Small Company Value Portfolio | | | | | | | | $ | 79,196,282 | |
| | | | | | | | | | |
| | | | |
Total Investment Companies (Cost $74,727,373) | | | | | | | | | 79,196,282 | |
| | | | | | | | | | |
| | | | | | | | |
| Total investments in securities | | | | | | | | |
| (Cost $74,727,373)* | | | 100.05 | % | | | 79,196,282 | |
Other assets and liabilities, net | | | (0.05 | ) | | | (39,662 | ) |
| | | | | | | | |
| Total net assets | | | 100.00 | % | | $ | 79,156,620 | |
| | | | | | | | |
| * | Cost for federal income tax purposes is substantially the same as for financial reporting purposes. |
The accompanying notes are an integral part of these financial statements.
This page is intentionally left blank.
| | | | |
| 36 | | Wells Fargo Advantage Equity Gateway Funds | | Statements of assets and liabilities—November 30, 2012 (unaudited) |
| | | | | | | | |
| | | C&B Large Cap
Value Fund | | | Diversified
Equity Fund | |
| | |
Assets | | | | | | | | |
Investments | | | | | | | | |
In affiliated Master Portfolio(s), at value (see cost below) | | $ | 270,152,234 | | | $ | 370,872,866 | |
In unaffiliated securities, at value (see cost below) | | | 0 | | | | 112,464 | |
| | | | | | | | |
Total investments, at value (see cost below) | | | 270,152,234 | | | | 370,985,330 | |
Receivable for Fund shares sold | | | 238,443 | | | | 265,135 | |
Receivable from administrator | | | 39,710 | | | | 0 | |
Prepaid expenses and other assets | | | 20,113 | | | | 15,819 | |
| | | | | | | | |
Total assets | | | 270,450,500 | | | | 371,266,284 | |
| | | | | | | | |
| | |
Liabilities | | | | | | | | |
Payable for Fund shares redeemed | | | 268,977 | | | | 1,289,303 | |
Advisory fee payable | | | N/A | | | | 103,755 | |
Distribution fees payable | | | 4,561 | | | | 12,015 | |
Due to other related parties | | | 49,449 | | | | 80,692 | |
Shareholder report expenses payable | | | 26,176 | | | | 25,793 | |
Shareholder servicing fees payable | | | 37,218 | | | | 78,589 | |
Accrued expenses and other liabilities | | | 6,177 | | | | 4,569 | |
| | | | | | | | |
Total liabilities | | | 392,558 | | | | 1,594,716 | |
| | | | | | | | |
Total net assets | | $ | 270,057,942 | | | $ | 369,671,568 | |
| | | | | | | | |
| | |
NET ASSETS CONSIST OF | | | | | | | | |
Paid-in capital | | $ | 321,629,446 | | | $ | 318,737,168 | |
Undistributed net investment income (loss) | | | 3,984,838 | | | | 2,619,467 | |
Accumulated net realized gains (losses) on investments | | | (95,441,819 | ) | | | 7,779,734 | |
Net unrealized gains (losses) on investments | | | 39,885,477 | | | | 40,535,199 | |
| | | | | | | | |
Total net assets | | $ | 270,057,942 | | | $ | 369,671,568 | |
| | | | | | | | |
| | |
COMPUTATION OF NET ASSET VALUE AND OFFERING PRICE PER SHARE1 | | | | | | | | |
Net assets – Class A | | $ | 20,937,078 | | | $ | 71,820,370 | |
Shares outstanding – Class A | | | 2,413,851 | | | | 2,523,963 | |
Net asset value per share – Class A | | | $8.67 | | | | $28.46 | |
Maximum offering price per share – Class A2 | | | $9.20 | | | | $30.20 | |
Net assets – Class B | | $ | 1,493,674 | | | $ | 2,499,316 | |
Shares outstanding – Class B | | | 172,329 | | | | 94,387 | |
Net asset value per share – Class B | | | $8.67 | | | | $26.48 | |
Net assets – Class C | | $ | 5,417,727 | | | $ | 2,640,931 | |
Shares outstanding – Class C | | | 629,096 | | | | 97,644 | |
Net asset value per share – Class C | | | $8.61 | | | | $27.05 | |
Net assets – Class R | | | N/A | | | | N/A | |
Shares outstanding – Class R | | | N/A | | | | N/A | |
Net asset value per share – Class R | | | N/A | | | | N/A | |
Net assets – Administrator Class | | $ | 84,202,225 | | | $ | 292,710,951 | |
Shares outstanding – Administrator Class | | | 9,700,646 | | | | 10,257,581 | |
Net asset value per share – Administrator Class | | | $8.68 | | | | $28.54 | |
Net assets – Institutional Class | | $ | 98,677,878 | | | | N/A | |
Shares outstanding – Institutional Class | | | 11,315,593 | | | | N/A | |
Net asset value per share – Institutional Class | | | $8.72 | | | | N/A | |
Net assets – Investor Class | | $ | 59,329,360 | | | | N/A | |
Shares outstanding – Investor Class | | | 6,839,859 | | | | N/A | |
Net asset value per share – Investor Class | | | $8.67 | | | | N/A | |
| | |
Investments in affiliated Master Portfolio(s), at cost | | $ | 230,266,757 | | | $ | 330,369,013 | |
| | | | | | | | |
Investments in unaffiliated securities, at cost | | $ | 0 | | | $ | 81,118 | |
| | | | | | | | |
Total investments, at cost | | $ | 230,266,757 | | | $ | 330,450,131 | |
| | | | | | | | |
| 1. | Each Fund has an unlimited number of authorized shares. |
| 2. | Maximum offering price is computed as 100/94.25 of net asset value. On investments of $50,000 or more, the offering price is reduced. |
The accompanying notes are an integral part of these financial statements.
| | | | | | |
| Statements of assets and liabilities—November 30, 2012 (unaudited) | | Wells Fargo Advantage Equity Gateway Funds | | | 37 | |
| | | | | | | | | | | | | | | | | | | | | | | | | | |
Diversified Small
Cap Fund | | | Emerging
Growth Fund | | | Equity
Value Fund | | | Index Fund | | | International
Value Fund | | | Small Company
Growth Fund | | | Small Company
Value Fund | |
| | | | | | |
| | | | | | | | | | | | | | | | | | | | | | | | | | | |
| | | | | | | | | | | | | | | | | | | | | | | | | | | |
| $ | 8,261,629 | | | $ | 835,943,825 | | | $ | 709,688,154 | | | $ | 2,363,594,599 | | | $ | 337,281,007 | | | $ | 115,579,813 | | | $ | 79,196,282 | |
| | 215,355 | | | | 0 | | | | 0 | | | | 0 | | | | 0 | | | | 0 | | | | 0 | |
| | | | | | | | | | | | | | | | | | | | | | | | | | |
| | 8,476,984 | | | | 835,943,825 | | | | 709,688,154 | | | | 2,363,594,599 | | | | 337,281,007 | | | | 115,579,813 | | | | 79,196,282 | |
| | 4,497 | | | | 1,058,331 | | | | 63,279 | | | | 3,021,938 | | | | 807,670 | | | | 64,285 | | | | 72,176 | |
| | 0 | | | | 44,580 | | | | 40,508 | | | | 237,672 | | | | 21,188 | | | | 18,630 | | | | 12,213 | |
| | 17,903 | | | | 115,378 | | | | 111,622 | | | | 34,691 | | | | 26,037 | | | | 14,791 | | | | 32,344 | |
| | | | | | | | | | | | | | | | | | | | | | | | | | |
| | 8,499,384 | | | | 837,162,114 | | | | 709,903,563 | | | | 2,366,888,900 | | | | 338,135,902 | | | | 115,677,519 | | | | 79,313,015 | |
| | | | | | | | | | | | | | | | | | | | | | | | | | |
| | | | | | |
| | | | | | | | | | | | | | | | | | | | | | | | | | | |
| | 10,033 | | | | 4,697,575 | | | | 677,851 | | | | 4,534,308 | | | | 684,293 | | | | 29,151 | | | | 100,196 | |
| | 38,688 | | | | N/A | | | | N/A | | | | N/A | | | | N/A | | | | N/A | | | | N/A | |
| | N/A | | | | 3,026 | | | | 8,305 | | | | 46,791 | | | | 383 | | | | 1,207 | | | | 1,148 | |
| | 1,383 | | | | 119,331 | | | | 127,368 | | | | 380,308 | | | | 44,392 | | | | 15,875 | | | | 12,984 | |
| | 22,295 | | | | 48,320 | | | | 42,446 | | | | 51,765 | | | | 26,054 | | | | 20,818 | | | | 24,189 | |
| | 1,829 | | | | 67,576 | | | | 150,120 | | | | 276,784 | | | | 67,589 | | | | 22,360 | | | | 16,690 | |
| | 249 | | | | 10,056 | | | | 180,892 | | | | 47,777 | | | | 4,845 | | | | 2,619 | | | | 1,188 | |
| | | | | | | | | | | | | | | | | | | | | | | | | | |
| | 74,477 | | | | 4,945,884 | | | | 1,186,982 | | | | 5,337,733 | | | | 827,556 | | | | 92,030 | | | | 156,395 | |
| | | | | | | | | | | | | | | | | | | | | | | | | | |
| $ | 8,424,907 | | | $ | 832,216,230 | | | $ | 708,716,581 | | | $ | 2,361,551,167 | | | $ | 337,308,346 | | | $ | 115,585,489 | | | $ | 79,156,620 | |
| | | | | | | | | | | | | | | | | | | | | | | | | | |
| | | | | | |
| | | | | | | | | | | | | | | | | | | | | | | | | | | |
| $ | 97,729,189 | | | $ | 753,727,137 | | | $ | 690,020,785 | | | $ | 1,638,960,987 | | | $ | 422,844,998 | | | $ | 143,680,360 | | | $ | 184,316,625 | |
| | (4,553 | ) | | | (6,182,568 | ) | | | 9,951,001 | | | | 40,728,986 | | | | 7,793,407 | | | | (302,262 | ) | | | 139,448 | |
| | (90,564,692 | ) | | | 28,287,998 | | | | (69,517,175 | ) | | | (39,439,133 | ) | | | (56,903,676 | ) | | | (2,843,405 | ) | | | (109,768,362 | ) |
| | 1,264,963 | | | | 56,383,663 | | | | 78,261,970 | | | | 721,300,327 | | | | (36,426,383 | ) | | | (24,949,204 | ) | | | 4,468,909 | |
| | | | | | | | | | | | | | | | | | | | | | | | | | |
| $ | 8,424,907 | | | $ | 832,216,230 | | | $ | 708,716,581 | | | $ | 2,361,551,167 | | | $ | 337,308,346 | | | $ | 115,585,489 | | | $ | 79,156,620 | |
| | | | | | | | | | | | | | | | | | | | | | | | | | |
| | | | | | |
| | | | | | | | | | | | | | | | | | | | | | | | | | | |
| | N/A | | | $ | 116,974,939 | | | $ | 252,852,401 | | | $ | 361,790,702 | | | $ | 5,531,665 | | | $ | 6,381,163 | | | $ | 18,589,257 | |
| | N/A | | | | 9,313,078 | | | | 18,418,245 | | | | 7,497,854 | | | | 445,504 | | | | 226,724 | | | | 1,324,534 | |
| | N/A | | | | $12.56 | | | | $13.73 | | | | $48.25 | | | | $12.42 | | | | $28.15 | | | | $14.03 | |
| | N/A | | | | $13.33 | | | | $14.57 | | | | $51.19 | | | | $13.18 | | | | $29.87 | | | | $14.89 | |
| | N/A | | | | N/A | | | $ | 2,757,799 | | | $ | 6,819,676 | | | $ | 79,812 | | | $ | 149,130 | | | $ | 215,623 | |
| | N/A | | | | N/A | | | | 203,871 | | | | 141,000 | | | | 6,475 | | | | 5,726 | | | | 16,631 | |
| | N/A | | | | N/A | | | | $13.53 | | | | $48.37 | | | | $12.33 | | | | $26.04 | | | | $12.97 | |
| | N/A | | | $ | 4,585,179 | | | $ | 10,424,427 | | | $ | 64,645,944 | | | $ | 522,191 | | | $ | 1,722,311 | | | $ | 1,606,105 | |
| | N/A | | | | 377,898 | | | | 777,275 | | | | 1,340,018 | | | | 42,889 | | | | 65,389 | | | | 124,324 | |
| | N/A | | | | $12.13 | | | | $13.41 | | | | $48.24 | | | | $12.18 | | | | $26.34 | | | | $12.92 | |
| | N/A | | | | N/A | | | $ | 217,886 | | | | N/A | | | | N/A | | | | N/A | | | | N/A | |
| | N/A | | | | N/A | | | | 15,613 | | | | N/A | | | | N/A | | | | N/A | | | | N/A | |
| | N/A | | | | N/A | | | | $13.96 | | | | N/A | | | | N/A | | | | N/A | | | | N/A | |
| $ | 8,424,907 | | | $ | 177,079,625 | | | $ | 432,166,859 | | | $ | 1,799,453,563 | | | $ | 329,382,735 | | | $ | 95,354,098 | | | $ | 57,343,505 | |
| | 618,559 | | | | 13,947,939 | | | | 30,820,474 | | | | 37,008,221 | | | | 26,670,395 | | | | 3,297,603 | | | | 4,013,694 | |
| | $13.62 | | | | $12.70 | | | | $14.02 | | | | $48.62 | | | | $12.35 | | | | $28.92 | | | | $14.29 | |
| | N/A | | | $ | 499,014,620 | | | $ | 10,297,209 | | | | N/A | | | $ | 1,791,943 | | | $ | 11,978,787 | | | $ | 1,402,130 | |
| | N/A | | | | 38,819,678 | | | | 734,725 | | | | N/A | | | | 144,729 | | | | 409,908 | | | | 97,830 | |
| | N/A | | | | $12.85 | | | | $14.02 | | | | N/A | | | | $12.38 | | | | $29.22 | | | | $14.33 | |
| | N/A | | | $ | 34,561,867 | | | | N/A | | | $ | 128,841,282 | | | | N/A | | | | N/A | | | | N/A | |
| | N/A | | | | 2,763,031 | | | | N/A | | | | 2,660,976 | | | | N/A | | | | N/A | | | | N/A | |
| | N/A | | | | $12.51 | | | | N/A | | | | $48.42 | | | | N/A | | | | N/A | | | | N/A | |
| | | | | | |
| $ | 7,056,689 | | | $ | 779,560,162 | | | $ | 631,426,184 | | | $ | 1,642,294,272 | | | $ | 373,707,390 | | | $ | 140,529,017 | | | $ | 74,727,373 | |
| | | | | | | | | | | | | | | | | | | | | | | | | | |
| $ | 155,332 | | | $ | 0 | | | $ | 0 | | | $ | 0 | | | $ | 0 | | | $ | 0 | | | $ | 0 | |
| | | | | | | | | | | | | | | | | | | | | | | | | | |
| $ | 7,212,021 | | | $ | 779,560,162 | | | $ | 631,426,184 | | | $ | 1,642,294,272 | | | $ | 373,707,390 | | | $ | 140,529,017 | | | $ | 74,727,373 | |
| | | | | | | | | | | | | | | | | | | | | | | | | | |
The accompanying notes are an integral part of these financial statements.
| | | | |
| 38 | | Wells Fargo Advantage Equity Gateway Funds | | Statements of operations—six months ended November 30, 2012 (unaudited) |
| | | | | | | | |
| | | C&B Large Cap
Value Fund | | | Diversified
Equity Fund | |
| | |
Investment income | | | | | | | | |
Dividends allocated from affiliated Master Portfolio(s)* | | $ | 3,745,244 | | | $ | 3,669,453 | |
Interest allocated from affiliated Master Portfolio(s) | | | 0 | | | | 3,067 | |
Securities lending income allocated from affiliated Master Portfolio(s) | | | 29,389 | | | | 67,119 | |
Interest | | | 0 | | | | 3,028 | |
Expenses allocated from affiliated Master Portfolio(s) | | | (955,457 | ) | | | (1,169,488 | ) |
Waivers allocated from affiliated Master Portfolio(s) | | | 0 | | | | 56,530 | |
| | | | | | | | |
Total investment income (loss) | | | 2,819,176 | | | | 2,629,709 | |
| | | | | | | | |
| | |
Expenses | | | | | | | | |
Advisory fee | | | N/A | | | | 484,156 | |
Administration fees | | | | | | | | |
Fund level | | | 70,664 | | | | 96,831 | |
Class A | | | 28,632 | | | | 100,035 | |
Class B | | | 2,491 | | | | 3,574 | |
Class C | | | 7,396 | | | | 3,421 | |
Class R | | | N/A | | | | N/A | |
Administrator Class | | | 43,582 | | | | 152,498 | |
Institutional Class | | | 40,500 | | | | N/A | |
Investor Class | | | 103,377 | | | | N/A | |
Shareholder servicing fees | | | | | | | | |
Class A | | | 27,531 | | | | 96,187 | |
Class B | | | 2,395 | | | | 3,436 | |
Class C | | | 7,112 | | | | 3,289 | |
Class R | | | N/A | | | | N/A | |
Administrator Class | | | 106,075 | | | | 380,715 | |
Investor Class | | | 80,763 | | | | N/A | |
Distribution fees | | | | | | | | |
Class B | | | 7,185 | | | | 10,308 | |
Class C | | | 21,335 | | | | 9,867 | |
Class R | | | N/A | | | | N/A | |
Custody and accounting fees | | | 5,890 | | | | 8,255 | |
Professional fees | | | 10,190 | | | | 9,999 | |
Registration fees | | | 27,293 | | | | 17,468 | |
Shareholder report expenses | | | 28,148 | | | | 24,078 | |
Trustees’ fees and expenses | | | 6,077 | | | | 6,185 | |
Other fees and expenses | | | 8,843 | | | | 8,192 | |
| | | | | | | | |
Total expenses | | | 635,479 | | | | 1,418,494 | |
Less: Fee waivers and/or expense reimbursements | | | (235,972 | ) | | | (471,740 | ) |
| | | | | | | | |
Net expenses | | | 399,507 | | | | 946,754 | |
| | | | | | | | |
Net investment income (loss) | | | 2,419,669 | | | | 1,682,955 | |
| | | | | | | | |
| | |
REALIZED AND UNREALIZED GAINS (LOSSES) ON INVESTMENTS | | | | | | | | |
| | |
Net realized gains (losses) on: | | | | | | | | |
Securities transactions allocated from affiliated Master Portfolio(s) | | | 6,888,101 | | | | 9,299,506 | |
Unaffiliated securities | | | 0 | | | | 45,094 | |
| | | | | | | | |
Net realized gain (losses) on investments | | | 6,888,101 | | | | 9,344,600 | |
| | | | | | | | |
| | |
Net change in unrealized gains (losses) on: | | | | | | | | |
Securities transactions allocated from affiliated Master Portfolio(s) | | | 8,890,777 | | | | 23,018,652 | |
Unaffiliated securities | | | 0 | | | | (5,537 | ) |
| | | | | | | | |
Net change in unrealized gains (losses) on investments | | | 8,890,777 | | | | 23,013,115 | |
| | | | | | | | |
Net realized and unrealized gains (losses) on investments | | | 15,778,878 | | | | 32,357,715 | |
| | | | | | | | |
Net increase in net assets resulting from operations | | $ | 18,198,547 | | | $ | 34,040,670 | |
| | | | | | | | |
| | |
* Net of foreign dividend withholding taxes allocated from affiliated Master Portfolio(s) in the amount of | | | $9,286 | | | | $54,109 | |
The accompanying notes are an integral part of these financial statements.
| | | | | | |
| Statements of operations—six months ended November 30, 2012 (unaudited) | | Wells Fargo Advantage Equity Gateway Funds | | | 39 | |
| | | | | | | | | | | | | | | | | | | | | | | | | | |
Diversified Small
Cap Fund | | | Emerging Growth
Fund | | | Equity
Value Fund | | | Index Fund | | | International
Value Fund | | | Small Company
Growth Fund | | | Small Company
Value Fund | |
| | | | | | |
| | | | | | | | | | | | | | | | | | | | | | | | | | | |
| $ | 469,338 | | | $ | 1,117,962 | | | $ | 9,662,656 | | | $ | 26,951,122 | | | $ | 4,161,892 | | | $ | 541,500 | | | $ | 584,038 | |
| | 0 | | | | 0 | | | | 0 | | | | 1,152 | | | | 1,803 | | | | 0 | | | | 0 | |
| | 29,074 | | | | 558,186 | | | | 83,190 | | | | 177,702 | | | | 159,301 | | | | 16,195 | | | | 29,539 | |
| | 4,406 | | | | 0 | | | | 0 | | | | 0 | | | | 0 | | | | 0 | | | | 0 | |
| | (452,062 | ) | | | (3,598,319 | ) | | | (2,728,035 | ) | | | (1,126,931 | ) | | | (1,374,618 | ) | | | (507,846 | ) | | | (351,622 | ) |
| | 5,324 | | | | 0 | | | | 0 | | | | 0 | | | | 0 | | | | 69 | | | | 0 | |
| | | | | | | | | | | | | | | | | | | | | | | | | | |
| | 56,080 | | | | (1,922,171 | ) | | | 7,017,811 | | | | 26,003,045 | | | | 2,948,378 | | | | 49,918 | | | | 261,955 | |
| | | | | | | | | | | | | | | | | | | | | | | | | | |
| | | | | | |
| | | | | | | | | | | | | | | | | | | | | | | | | | | |
| | 131,162 | | | | N/A | | | | N/A | | | | N/A | | | | N/A | | | | N/A | | | | N/A | |
| | | | | | | | | | | | | | | | | | | | | | | | | | |
| | 26,232 | | | | 225,356 | | | | 208,884 | | | | 592,710 | | | | 76,378 | | | | 29,565 | | | | 20,762 | |
| | N/A | | | | 164,386 | | | | 335,050 | | | | 479,352 | | | | 7,159 | | | | 8,671 | | | | 24,717 | |
| | N/A | | | | N/A | | | | 4,117 | | | | 10,272 | | | | 130 | | | | 231 | | | | 430 | |
| | N/A | | | | 6,665 | | | | 13,046 | | | | 87,451 | | | | 656 | | | | 2,216 | | | | 1,995 | |
| | N/A | | | | N/A | | | | 269 | | | | N/A | | | | N/A | | | | N/A | | | | N/A | |
| | 52,465 | | | | 94,499 | | | | 236,851 | | | | 898,784 | | | | 148,842 | | | | 49,401 | | | | 30,479 | |
| | N/A | | | | 217,504 | | | | 36,278 | | | | N/A | | | | 686 | | | | 4,363 | | | | 485 | |
| | N/A | | | | 59,342 | | | | N/A | | | | 206,989 | | | | N/A | | | | N/A | | | | N/A | |
| | | | | | | | | | | | | | | | | | | | | | | | | | |
| | N/A | | | | 158,063 | | | | 322,162 | | | | 460,914 | | | | 6,883 | | | | 8,337 | | | | 23,766 | |
| | N/A | | | | N/A | | | | 3,751 | | | | 9,669 | | | | 125 | | | | 222 | | | | 414 | |
| | N/A | | | | 6,409 | | | | 12,544 | | | | 84,088 | | | | 630 | | | | 2,131 | | | | 1,918 | |
| | N/A | | | | N/A | | | | 259 | | | | N/A | | | | N/A | | | | N/A | | | | N/A | |
| | 131,162 | | | | 229,700 | | | | 587,201 | | | | 898,784 | | | | 356,938 | | | | 122,930 | | | | 75,911 | |
| | N/A | | | | 46,361 | | | | N/A | | | | 159,821 | | | | N/A | | | | N/A | | | | N/A | |
| | | | | | | | | | | | | | | | | | | | | | | | | | |
| | N/A | | | | N/A | | | | 11,875 | | | | 29,630 | | | | 376 | | | | 665 | | | | 1,241 | |
| | N/A | | | | 19,227 | | | | 37,632 | | | | 252,264 | | | | 1,891 | | | | 6,393 | | | | 5,754 | |
| | N/A | | | | N/A | | | | 259 | | | | N/A | | | | N/A | | | | N/A | | | | N/A | |
| | 2,203 | | | | 17,723 | | | | 16,547 | | | | 45,358 | | | | 5,728 | | | | 2,978 | | | | 2,416 | |
| | 9,586 | | | | 9,642 | | | | 6,627 | | | | 9,199 | | | | 9,864 | | | | 11,641 | | | | 9,835 | |
| | 14,371 | | | | 45,987 | | | | 31,019 | | | | 20,233 | | | | 28,481 | | | | 27,461 | | | | 21,978 | |
| | 12,326 | | | | 57,902 | | | | 33,999 | | | | 58,796 | | | | 22,903 | | | | 17,639 | | | | 18,058 | |
| | 6,249 | | | | 6,235 | | | | 13,923 | | | | 4,626 | | | | 6,373 | | | | 6,055 | | | | 5,679 | |
| | 5,039 | | | | 9,239 | | | | 13,505 | | | | 54,896 | | | | 7,843 | | | | 7,644 | | | | 3,563 | |
| | | | | | | | | | | | | | | | | | | | | | | | | | |
| | 390,795 | | | | 1,374,240 | | | | 1,925,798 | | | | 4,363,836 | | | | 681,886 | | | | 308,543 | | | | 249,401 | |
| | (312,886 | ) | | | (204,691 | ) | | | (218,703 | ) | | | (1,427,830 | ) | | | (138,909 | ) | | | (102,645 | ) | | | (70,858 | ) |
| | | | | | | | | | | | | | | | | | | | | | | | | | |
| | 77,909 | | | | 1,169,549 | | | | 1,707,095 | | | | 2,936,006 | | | | 542,977 | | | | 205,898 | | | | 178,543 | |
| | | | | | | | | | | | | | | | | | | | | | | | | | |
| | (21,829 | ) | | | (3,091,720 | ) | | | 5,310,716 | | | | 23,067,039 | | | | 2,405,401 | | | | (155,980 | ) | | | 83,412 | |
| | | | | | | | | | | | | | | | | | | | | | | | | | |
| | | | | | |
| | | | | | | | | | | | | | | | | | | | | | | | | | |
| | | | | | |
| | | | | | | | | | | | | | | | | | | | | | | | | | |
| | 13,172,819 | | | | (590,170 | ) | | | 48,700,797 | | | | 17,022,762 | | | | (2,058,765 | ) | | | 3,584,370 | | | | 2,223,728 | |
| | 86,350 | | | | 0 | | | | 0 | | | | 0 | | | | 0 | | | | 0 | | | | 0 | |
| | | | | | | | | | | | | | | | | | | | | | | | | | |
| | 13,259,169 | | | | (590,170 | ) | | | 48,700,797 | | | | 17,022,762 | | | | (2,058,765 | ) | | | 3,584,370 | | | | 2,223,728 | |
| | | | | | | | | | | | | | | | | | | | | | | | | | |
| | | | | | |
| | | | | | | | | | | | | | | | | | | | | | | | | | |
| | (4,854,312 | ) | | | 15,702,234 | | | | 34,588,636 | | | | 161,440,212 | | | | 45,226,313 | | | | 4,881,267 | | | | 3,134,090 | |
| | (10,603 | ) | | | 0 | | | | 0 | | | | 0 | | | | 0 | | | | 0 | | | | 0 | |
| | | | | | | | | | | | | | | | | | | | | | | | | | |
| | (4,864,915 | ) | | | 15,702,234 | | | | 34,588,636 | | | | 161,440,212 | | | | 45,226,313 | | | | 4,881,267 | | | | 3,134,090 | |
| | | | | | | | | | | | | | | | | | | | | | | | | | |
| | 8,394,254 | | | | 15,112,064 | | | | 83,289,433 | | | | 178,462,974 | | | | 43,167,548 | | | | 8,465,637 | | | | 5,357,818 | |
| | | | | | | | | | | | | | | | | | | | | | | | | | |
| $ | 8,372,425 | | | $ | 12,020,344 | | | $ | 88,600,149 | | | $ | 201,530,013 | | | $ | 45,572,949 | | | $ | 8,309,657 | | | $ | 5,441,230 | |
| | | | | | | | | | | | | | | | | | | | | | | | | | |
| | | | | | |
| | $1,543 | | | | $3,795 | | | | $98,758 | | | | $29,534 | | | | $270,657 | | | | $1,590 | | | | $0 | |
The accompanying notes are an integral part of these financial statements.
| | | | |
| 40 | | Wells Fargo Advantage Equity Gateway Funds | | Statements of changes in net assets |
| | | | | | | | | | | | | | | | |
| | | C&B Large Cap Value Fund | |
| | | Six months ended
November 30, 2012
(unaudited) | | | Year ended
May 31, 2012 | |
| | | | |
Operations | | | | | | | | | | | | | | | | |
Net investment income | | | | | | $ | 2,419,669 | | | | | | | $ | 4,628,412 | |
Net realized gains on investments | | | | | | | 6,888,101 | | | | | | | | 13,080,626 | |
Net change in unrealized gains (losses) on investments | | | | | | | 8,890,777 | | | | | | | | (33,798,938 | ) |
| | | | | | | | | | | | | | | | |
Net increase (decrease) in net assets resulting from operations | | | | | | | 18,198,547 | | | | | | | | (16,089,900 | ) |
| | | | | | | | | | | | | | | | |
| | | | |
Distributions to shareholders from | | | | | | | | | | | | | | | | |
Net investment income | | | | | | | | | | | | | | | | |
Class A | | | | | | | 0 | | | | | | | | (292,696 | ) |
Class B | | | | | | | 0 | | | | | | | | (6,224 | ) |
Class C | | | | | | | 0 | | | | | | | | (32,368 | ) |
Administrator Class | | | | | | | 0 | | | | | | | | (1,381,293 | ) |
Institutional Class | | | | | | | 0 | | | | | | | | (1,982,940 | ) |
Investor Class | | | | | | | 0 | | | | | | | | (887,945 | ) |
| | | | | | | | | | | | | | | | |
Total distributions to shareholders | | | | | | | 0 | | | | | | | | (4,583,466 | ) |
| | | | | | | | | | | | | | | | |
| | | | |
Capital share transactions | | | Shares | | | | | | | | Shares | | | | | |
Proceeds from shares sold | | | | | | | | | | | | | | | | |
Class A | | | 136,532 | | | | 1,164,032 | | | | 433,401 | | | | 3,517,933 | |
Class B | | | 871 | | | | 7,516 | | | | 10,231 | | | | 80,248 | |
Class C | | | 7,888 | | | | 65,921 | | | | 69,724 | | | | 560,806 | |
Administrator Class | | | 496,719 | | | | 4,220,386 | | | | 1,258,023 | | | | 10,207,182 | |
Institutional Class | | | 882,652 | | | | 7,669,929 | | | | 3,922,319 | | | | 31,688,900 | |
Investor Class | | | 145,443 | | | | 1,249,026 | | | | 405,602 | | | | 3,330,023 | |
| | | | | | | | | | | | | | | | |
| | | | | | | 14,376,810 | | | | | | | | 49,385,092 | |
| | | | | | | | | | | | | | | | |
Reinvestment of distributions | | | | | | | | | | | | | | | | |
Class A | | | 0 | | | | 0 | | | | 36,201 | | | | 275,488 | |
Class B | | | 0 | | | | 0 | | | | 761 | | | | 5,820 | |
Class C | | | 0 | | | | 0 | | | | 4,094 | | | | 31,154 | |
Administrator Class | | | 0 | | | | 0 | | | | 178,687 | | | | 1,358,021 | |
Institutional Class | | | 0 | | | | 0 | | | | 55,707 | | | | 423,932 | |
Investor Class | | | 0 | | | | 0 | | | | 113,397 | | | | 862,951 | |
| | | | | | | | | | | | | | | | |
| | | | | | | 0 | | | | | | | | 2,957,366 | |
| | | | | | | | | | | | | | | | |
Payment for shares redeemed | | | | | | | | | | | | | | | | |
Class A | | | (350,880 | ) | | | (3,018,482 | ) | | | (821,372 | ) | | | (6,653,796 | ) |
Class B | | | (124,911 | ) | | | (1,065,957 | ) | | | (475,890 | ) | | | (3,865,355 | ) |
Class C | | | (60,148 | ) | | | (516,066 | ) | | | (206,244 | ) | | | (1,675,421 | ) |
Administrator Class | | | (879,055 | ) | | | (7,643,877 | ) | | | (5,225,519 | ) | | | (43,464,298 | ) |
Institutional Class | | | (1,411,773 | ) | | | (12,181,405 | ) | | | (4,745,204 | ) | | | (39,601,216 | ) |
Investor Class | | | (1,171,567 | ) | | | (10,072,547 | ) | | | (2,613,948 | ) | | | (21,290,843 | ) |
| | | | | | | | | | | | | | | | |
| | | | | | | (34,498,334 | ) | | | | | | | (116,550,929 | ) |
| | | | | | | | | | | | | | | | |
Net decrease in net assets resulting from capital share transactions | | | | | | | (20,121,524 | ) | | | | | | | (64,208,471 | ) |
| | | | | | | | | | | | | | | | |
Total decrease in net assets | | | | | | | (1,922,977 | ) | | | | | | | (84,881,837 | ) |
| | | | | | | | | | | | | | | | |
| | | | |
Net assets | | | | | | | | | | | | | | | | |
Beginning of period | | | | | | | 271,980,919 | | | | | | | | 356,862,756 | |
| | | | | | | | | | | | | | | | |
End of period | | | | | | $ | 270,057,942 | | | | | | | $ | 271,980,919 | |
| | | | | | | | | | | | | | | | |
Undistributed net investment income | | | | | | $ | 3,984,838 | | | | | | | $ | 1,565,169 | |
| | | | | | | | | | | | | | | | |
The accompanying notes are an integral part of these financial statements.
| | | | | | |
| Statements of changes in net assets | | Wells Fargo Advantage Equity Gateway Funds | | | 41 | |
| | | | | | | | | | | | | | | | |
| | | Diversified Equity Fund | |
| | | Six months ended
November 30, 2012
(unaudited) | | | Year ended
May 31, 2012 | |
| | | | |
Operations | | | | | | | | | | | | | | | | |
Net investment income | | | | | | $ | 1,682,955 | | | | | | | $ | 3,880,905 | |
Net realized gains on investments | | | | | | | 9,344,600 | | | | | | | | 11,508,675 | |
Net change in unrealized gains (losses) on investments | | | | | | | 23,013,115 | | | | | | | | (42,595,734 | ) |
| | | | | | | | | | | | | | | | |
Net increase (decrease) in net assets resulting from operations | | | | | | | 34,040,670 | | | | | | | | (27,206,154 | ) |
| | | | | | | | | | | | | | | | |
| | | | |
Distributions to shareholders from | | | | | | | | | | | | | | | | |
Net investment income | | | | | | | | | | | | | | | | |
Class A | | | | | | | 0 | | | | | | | | (564,328 | ) |
Administrator Class | | | | | | | 0 | | | | | | | | (3,455,179 | ) |
Net realized gains | | | | | | | | | | | | | | | | |
Class A | | | | | | | 0 | | | | | | | �� | (4,644,661 | ) |
Class B | | | | | | | 0 | | | | | | | | (242,683 | ) |
Class C | | | | | | | 0 | | | | | | | | (173,896 | ) |
Administrator Class | | | | | | | 0 | | | | | | | | (18,945,293 | ) |
| | | | | | | | | | | | | | | | |
Total distributions to shareholders | | | | | | | 0 | | | | | | | | (28,026,040 | ) |
| | | | | | | | | | | | | | | | |
| | | | |
Capital share transactions | | | Shares | | | | | | | | Shares | | | | | |
Proceeds from shares sold | | | | | | | | | | | | | | | | |
Class A | | | 33,006 | | | | 913,738 | | | | 126,223 | | | | 3,412,852 | |
Class B | | | 1,486 | | | | 39,629 | | | | 6,021 | | | | 153,778 | |
Class C | | | 3,491 | | | | 92,257 | | | | 5,173 | | | | 133,063 | |
Administrator Class | | | 413,349 | | | | 11,474,905 | | | | 1,266,983 | | | | 34,202,533 | |
| | | | | | | | | | | | | | | | |
| | | | | | | 12,520,529 | | | | | | | | 37,902,226 | |
| | | | | | | | | | | | | | | | |
Reinvestment of distributions | | | | | | | | | | | | | | | | |
Class A | | | 0 | | | | 0 | | | | 190,800 | | | | 4,745,499 | |
Class B | | | 0 | | | | 0 | | | | 10,336 | | | | 240,202 | |
Class C | | | 0 | | | | 0 | | | | 7,010 | | | | 166,426 | |
Administrator Class | | | 0 | | | | 0 | | | | 887,024 | | | | 22,103,551 | |
| | | | | | | | | | | | | | | | |
| | | | | | | 0 | | | | | | | | 27,255,678 | |
| | | | | | | | | | | | | | | | |
Payment for shares redeemed | | | | | | | | | | | | | | | | |
Class A | | | (414,088 | ) | | | (11,674,085 | ) | | | (627,874 | ) | | | (17,076,597 | ) |
Class B | | | (27,066 | ) | | | (694,143 | ) | | | (102,845 | ) | | | (2,603,804 | ) |
Class C | | | (6,308 | ) | | | (167,992 | ) | | | (30,723 | ) | | | (786,561 | ) |
Administrator Class | | | (1,408,888 | ) | | | (39,421,275 | ) | | | (3,876,812 | ) | | | (105,488,897 | ) |
| | | | | | | | | | | | | | | | |
| | | | | | | (51,957,495 | ) | | | | | | | (125,955,859 | ) |
| | | | | | | | | | | | | | | | |
Net decrease in net assets resulting from capital share transactions | | | | | | | (39,436,966 | ) | | | | | | | (60,797,955 | ) |
| | | | | | | | | | | | | | | | |
Total decrease in net assets | | | | | | | (5,396,296 | ) | | | | | | | (116,030,149 | ) |
| | | | | | | | | | | | | | | | |
| | | | |
Net assets | | | | | | | | | | | | | | | | |
Beginning of period | | | | | | | 375,067,864 | | | | | | | | 491,098,013 | |
| | | | | | | | | | | | | | | | |
End of period | | | | | | $ | 369,671,568 | | | | | | | $ | 375,067,864 | |
| | | | | | | | | | | | | | | | |
Undistributed net investment income | | | | | | $ | 2,619,467 | | | | | | | $ | 936,512 | |
| | | | | | | | | | | | | | | | |
The accompanying notes are an integral part of these financial statements.
| | | | |
| 42 | | Wells Fargo Advantage Equity Gateway Funds | | Statements of changes in net assets |
| | | | | | | | | | | | | | | | |
| | | Diversified Small Cap Fund | |
| | | Six months ended November 30, 2012 (unaudited) | | | Year ended
May 31, 2012 | |
| | | | |
Operations | | | | | | | | | | | | | | | | |
Net investment income (loss) | | | | | | $ | (21,829 | ) | | | | | | $ | 124,940 | |
Net realized gains on investments | | | | | | | 13,259,169 | | | | | | | | 4,807,970 | |
Net change in unrealized gains (losses) on investments | | | | | | | (4,864,915 | ) | | | | | | | (16,077,938 | ) |
| | | | | | | | | | | | | | | | |
Net increase (decrease) in net assets resulting from operations | | | | | | | 8,372,425 | | | | | | | | (11,145,028 | ) |
| | | | | | | | | | | | | | | | |
| | | | |
Distributions to shareholders from | | | | | | | | | | | | | | | | |
Net investment income | | | | | | | | | | | | | | | | |
Administrator Class | | | | | | | 0 | | | | | | | | (216,410 | ) |
| | | | | | | | | | | | | | | | |
Total distributions to shareholders | | | | | | | 0 | | | | | | | | (216,410 | ) |
| | | | | | | | | | | | | | | | |
| | | | |
Capital share transactions | | | Shares | | | | | | | | Shares | | | | | |
Proceeds from shares sold | | | | | | | | | | | | | | | | |
Administrator Class | | | 268,513 | | | | 3,478,053 | | | | 1,108,461 | | | | 13,013,030 | |
Reinvestment of distributions | | | | | | | | | | | | | | | | |
Administrator Class | | | 0 | | | | 0 | | | | 18,572 | | | | 215,433 | |
Payment for shares redeemed | | | | | | | | | | | | | | | | |
Administrator Class | | | (9,733,169 | ) | | | (130,629,406 | ) | | | (1,411,644 | ) | | | (17,323,454 | ) |
| | | | | | | | | | | | | | | | |
Net decrease in net assets resulting from capital share transactions | | | | | | | (127,151,353 | ) | | | | | | | (4,094,991 | ) |
| | | | | | | | | | | | | | | | |
Total decrease in net assets | | | | | | | (118,778,928 | ) | | | | | | | (15,456,429 | ) |
| | | | | | | | | | | | | | | | |
| | | | |
Net assets | | | | | | | | | | | | | | | | |
Beginning of period | | | | | | | 127,203,835 | | | | | | | | 142,660,264 | |
| | | | | | | | | | | | | | | | |
End of period | | | | | | $ | 8,424,907 | | | | | | | $ | 127,203,835 | |
| | | | | | | | | | | | | | | | |
Undistributed net investment income (loss) | | | | | | $ | (4,553 | ) | | | | | | $ | 17,276 | |
| | | | | | | | | | | | | | | | |
The accompanying notes are an integral part of these financial statements.
| | | | | | |
| Statements of changes in net assets | | Wells Fargo Advantage Equity Gateway Funds | | | 43 | |
| | | | | | | | | | | | | | | | |
| | | Emerging Growth Fund | |
| | | Six months ended November 30, 2012 (unaudited) | | | Year ended
May 31, 2012 | |
| | | | |
Operations | | | | | | | | | | | | | | | | |
Net investment loss | | | | | | $ | (3,091,720 | ) | | | | | | $ | (5,911,048 | ) |
Net realized gains (losses) on investments | | | | | | | (590,170 | ) | | | | | | | 40,351,452 | |
Net change in unrealized gains (losses) on investments | | | | | | | 15,702,234 | | | | | | | | 104,256,142 | |
| | | | | | | | | | | | | | | | |
Net increase in net assets resulting from operations | | | | | | | 12,020,344 | | | | | | | | 138,696,546 | |
| | | | | | | | | | | | | | | | |
| | | | |
Capital share transactions | | | Shares | | | | | | | | Shares | | | | | |
Proceeds from shares sold | | | | | | | | | | | | | | | | |
Class A | | | 379,997 | | | | 4,853,248 | | | | 886,582 | | | | 10,934,602 | |
Class C | | | 700 | | | | 8,673 | | | | 18,274 | | | | 218,681 | |
Administrator Class | | | 1,264,864 | | | | 16,291,380 | | | | 4,179,572 | | | | 51,726,772 | |
Institutional Class | | | 4,746,949 | | | | 61,420,560 | | | | 16,317,662 | | | | 217,091,861 | |
Investor Class | | | 79,383 | | | | 1,012,180 | | | | 386,768 | | | | 4,740,555 | |
| | | | | | | | | | | | | | | | |
| | | | | | | 83,586,041 | | | | | | | | 284,712,471 | |
| | | | | | | | | | | | | | | | |
Payment for shares redeemed | | | | | | | | | | | | | | | | |
Class A | | | (1,124,510 | ) | | | (14,365,939 | ) | | | (2,167,171 | ) | | | (26,499,021 | ) |
Class C | | | (46,752 | ) | | | (578,272 | ) | | | (52,832 | ) | | | (627,123 | ) |
Administrator Class | | | (2,102,472 | ) | | | (27,165,073 | ) | | | (17,202,302 | ) | | | (223,702,329 | ) |
Institutional Class | | | (7,411,501 | ) | | | (97,258,946 | ) | | | (25,543,242 | ) | | | (297,918,651 | ) |
Investor Class | | | (279,137 | ) | | | (3,572,489 | ) | | | (961,161 | ) | | | (11,634,099 | ) |
| | | | | | | | | | | | | | | | |
| | | | | | | (142,940,719 | ) | | | | | | | (560,381,223 | ) |
| | | | | | | | | | | | | | | | |
Net asset value of shares issued in acquisition | | | | | | | | | | | | | | | | |
Class A | | | 0 | | | | 0 | | | | 11,077,174 | | | | 117,959,886 | |
Class C | | | 0 | | | | 0 | | | | 418,236 | | | | 4,343,192 | |
Administrator Class | | | 0 | | | | 0 | | | | 27,663,401 | | | | 297,017,673 | |
Institutional Class | | | 0 | | | | 0 | | | | 50,096,690 | | | | 542,690,418 | |
Investor Class | | | 0 | | | | 0 | | | | 2,342,029 | | | | 24,859,283 | |
| | | | | | | | | | | | | | | | |
| | | | | | | 0 | | | | | | | | 986,870,452 | |
| | | | | | | | | | | | | | | | |
Net increase (decrease) in net assets resulting from capital share transactions | | | | | | | (59,354,678 | ) | | | | | | | 711,201,700 | |
| | | | | | | | | | | | | | | | |
Total increase (decrease) in net assets | | | | | | | (47,334,334 | ) | | | | | | | 849,898,246 | |
| | | | | | | | | | | | | | | | |
| | | | |
Net assets | | | | | | | | | | | | | | | | |
Beginning of period | | | | | | | 879,550,564 | | | | | | | | 29,652,318 | |
| | | | | | | | | | | | | | | | |
End of period | | | | | | $ | 832,216,230 | | | | | | | $ | 879,550,564 | |
| | | | | | | | | | | | | | | | |
Undistributed net investment loss | | | | | | $ | (6,182,568 | ) | | | | | | $ | (3,090,848 | ) |
| | | | | | | | | | | | | | | | |
The accompanying notes are an integral part of these financial statements.
| | | | |
| 44 | | Wells Fargo Advantage Equity Gateway Funds | | Statements of changes in net assets |
| | | | | | | | | | | | | | | | |
| | | Equity Value Fund | |
| | | Six months ended November 30, 2012 (unaudited) | | | Year ended
May 31, 2012 | |
| | | | |
Operations | | | | | | | | | | | | | | | | |
Net investment income | | | | | | $ | 5,310,716 | | | | | | | $ | 8,565,255 | |
Net realized gains on investments | | | | | | | 48,700,797 | | | | | | | | 24,587,564 | |
Net change in unrealized gains (losses) on investments | | | | | | | 34,588,636 | | | | | | | | 2,413,915 | |
| | | | | | | | | | | | | | | | |
Net increase in net assets resulting from operations | | | | | | | 88,600,149 | | | | | | | | 35,566,734 | |
| | | | | | | | | | | | | | | | |
| | | | |
Distributions to shareholders from | | | | | | | | | | | | | | | | |
Net investment income | | | | | | | | | | | | | | | | |
Class A | | | | | | | 0 | | | | | | | | (1,130,340 | ) |
Class B | | | | | | | 0 | | | | | | | | (5,348 | ) |
Class C | | | | | | | 0 | | | | | | | | (13,979 | ) |
Class R | | | | | | | 0 | | | | | | | | (601 | )1 |
Administrator Class | | | | | | | 0 | | | | | | | | (2,485,631 | ) |
Institutional Class | | | | | | | 0 | | | | | | | | (577,442 | ) |
| | | | | | | | | | | | | | | | |
Total distributions to shareholders | | | | | | | 0 | | | | | | | | (4,213,341 | ) |
| | | | | | | | | | | | | | | | |
| | | | |
Capital share transactions | | | Shares | | | | | | | | Shares | | | | | |
Proceeds from shares sold | | | | | | | | | | | | | | | | |
Class A | | | 186,000 | | | | 2,472,794 | | | | 352,381 | | | | 4,334,398 | |
Class B | | | 886 | | | | 12,793 | | | | 7,990 | | | | 96,995 | |
Class C | | | 59,597 | | | | 787,115 | | | | 31,242 | | | | 376,839 | |
Class R | | | 1,329 | | | | 18,106 | | | | 2,315 | 1 | | | 29,568 | 1 |
Administrator Class | | | 183,228 | | | | 2,462,014 | | | | 2,245,413 | | | | 27,731,113 | |
Institutional Class | | | 584,692 | | | | 8,086,653 | | | | 2,264,667 | | | | 29,821,640 | |
| | | | | | | | | | | | | | | | |
| | | | | | | 13,839,475 | | | | | | | | 62,390,553 | |
| | | | | | | | | | | | | | | | |
Reinvestment of distributions | | | | | | | | | | | | | | | | |
Class A | | | 0 | | | | 0 | | | | 90,689 | | | | 1,030,227 | |
Class B | | | 0 | | | | 0 | | | | 446 | | | | 5,022 | |
Class C | | | 0 | | | | 0 | | | | 1,103 | | | | 12,318 | |
Class R | | | 0 | | | | 0 | | | | 52 | 1 | | | 601 | 1 |
Administrator Class | | | 0 | | | | 0 | | | | 200,255 | | | | 2,316,951 | |
Institutional Class | | | 0 | | | | 0 | | | | 47,023 | | | | 544,056 | |
| | | | | | | | | | | | | | | | |
| | | | | | | 0 | | | | | | | | 3,909,175 | |
| | | | | | | | | | | | | | | | |
Payment for shares redeemed | | | | | | | | | | | | | | | | |
Class A | | | (1,511,454 | ) | | | (20,153,297 | ) | | | (2,881,957 | ) | | | (35,647,765 | ) |
Class B | | | (79,878 | ) | | | (1,040,923 | ) | | | (281,766 | ) | | | (3,462,282 | ) |
Class C | | | (70,325 | ) | | | (912,111 | ) | | | (155,739 | ) | | | (1,891,108 | ) |
Class R | | | (274 | ) | | | (3,696 | ) | | | (1,371 | )1 | | | (17,851 | )1 |
Administrator Class | | | (5,950,674 | ) | | | (83,512,856 | ) | | | (7,179,486 | ) | | | (94,319,457 | ) |
Institutional Class | | | (8,393,621 | ) | | | (116,831,582 | ) | | | (827,707 | ) | | | (10,469,850 | ) |
| | | | | | | | | | | | | | | | |
| | | | | | | (222,454,465 | ) | | | | | | | (145,808,313 | ) |
| | | | | | | | | | | | | | | | |
Net asset value of shares issued in acquisition | | | | | | | | | | | | | | | | |
Class A | | | 0 | | | | 0 | | | | 21,814,122 | | | | 250,264,317 | |
Class B | | | 0 | | | | 0 | | | | 528,686 | | | | 6,010,463 | |
Class C | | | 0 | | | | 0 | | | | 837,120 | | | | 9,440,709 | |
Class R | | | 0 | | | | 0 | | | | 13,562 | 1 | | | 158,516 | 1 |
Administrator Class | | | 0 | | | | 0 | | | | 32,642,221 | | | | 381,531,465 | |
Institutional Class | | | 0 | | | | 0 | | | | 246,860 | | | | 2,886,122 | |
| | | | | | | | | | | | | | | | |
| | | | | | | 0 | | | | | | | | 650,291,592 | |
| | | | | | | | | | | | | | | | |
Net increase (decrease) in net assets resulting from capital share transactions | | | | | | | (208,614,990 | ) | | | | | | | 570,783,007 | |
| | | | | | | | | | | | | | | | |
Total increase (decrease) in net assets | | | | | | | (120,014,841 | ) | | | | | | | 602,136,400 | |
| | | | | | | | | | | | | | | | |
| | | | |
Net assets | | | | | | | | | | | | | | | | |
Beginning of period | | | | | | | 828,731,422 | | | | | | | | 226,595,022 | |
| | | | | | | | | | | | | | | | |
End of period | | | | | | $ | 708,716,581 | | | | | | | $ | 828,731,422 | |
| | | | | | | | | | | | | | | | |
Undistributed net investment income | | | | | | $ | 9,951,001 | | | | | | | $ | 4,640,285 | |
| | | | | | | | | | | | | | | | |
| 1. | Class commenced operations on August 26, 2011. |
The accompanying notes are an integral part of these financial statements.
| | | | | | |
| Statements of changes in net assets | | Wells Fargo Advantage Equity Gateway Funds | | | 45 | |
| | | | | | | | | | | | | | | | |
| | | Index Fund | |
| | | Six months ended November 30, 2012 (unaudited) | | | Year ended
May 31, 2012 | |
| | | | |
Operations | | | | | | | | | | | | | | | | |
Net investment income | | | | | | $ | 23,067,039 | | | | | | | $ | 40,945,093 | |
Net realized gains on investments | | | | | | | 17,022,762 | | | | | | | | 43,926,540 | |
Net change in unrealized gains (losses) on investments | | | | | | | 161,440,212 | | | | | | | | (102,843,901 | ) |
| | | | | | | | | | | | | | | | |
Net increase (decrease) in net assets resulting from operations | | | | | | | 201,530,013 | | | | | | | | (17,972,268 | ) |
| | | | | | | | | | | | | | | | |
| | | | |
Distributions to shareholders from | | | | | | | | | | | | | | | | |
Net investment income | | | | | | | | | | | | | | | | |
Class A | | | | | | | 0 | | | | | | | | (5,301,167 | ) |
Class B | | | | | | | 0 | | | | | | | | (41,929 | ) |
Class C | | | | | | | 0 | | | | | | | | (464,102 | ) |
Administrator Class | | | | | | | 0 | | | | | | | | (30,293,768 | ) |
Investor Class | | | | | | | 0 | | | | | | | | (1,958,066 | ) |
Net realized gains | | | | | | | | | | | | | | | | |
Class A | | | | | | | 0 | | | | | | | | (12,806,346 | ) |
Class B | | | | | | | 0 | | | | | | | | (475,962 | ) |
Class C | | | | | | | 0 | | | | | | | | (2,557,821 | ) |
Administrator Class | | | | | | | 0 | | | | | | | | (60,574,568 | ) |
Investor Class | | | | | | | 0 | | | | | | | | (4,408,676 | ) |
| | | | | | | | | | | | | | | | |
Total distributions to shareholders | | | | | | | 0 | | | | | | | | (118,882,405 | ) |
| | | | | | | | | | | | | | | | |
| | | | |
Capital share transactions | | | Shares | | | | | | | | Shares | | | | | |
Proceeds from shares sold | | | | | | | | | | | | | | | | |
Class A | | | 195,387 | | | | 9,149,055 | | | | 543,742 | | | | 23,916,443 | |
Class B | | | 1,359 | | | | 64,847 | | | | 1,328 | | | | 57,250 | |
Class C | | | 11,001 | | | | 523,293 | | | | 50,816 | | | | 2,185,866 | |
Administrator Class | | | 3,021,381 | | | | 144,212,504 | | | | 9,251,631 | | | | 414,203,602 | |
Investor Class | | | 181,428 | | | | 8,576,876 | | | | 379,485 | | | | 16,779,861 | |
| | | | | | | | | | | | | | | | |
| | | | | | | 162,526,575 | | | | | | | | 457,143,022 | |
| | | | | | | | | | | | | | | | |
Reinvestment of distributions | | | | | | | | | | | | | | | | |
Class A | | | 0 | | | | 0 | | | | 421,841 | | | | 17,547,943 | |
Class B | | | 0 | | | | 0 | | | | 11,307 | | | | 473,676 | |
Class C | | | 0 | | | | 0 | | | | 40,929 | | | | 1,711,720 | |
Administrator Class | | | 0 | | | | 0 | | | | 2,063,894 | | | | 86,303,099 | |
Investor Class | | | 0 | | | | 0 | | | | 150,317 | | | | 6,269,111 | |
| | | | | | | | | | | | | | | | |
| | | | | | | 0 | | | | | | | | 112,305,549 | |
| | | | | | | | | | | | | | | | |
Payment for shares redeemed | | | | | | | | | | | | | | | | |
Class A | | | (547,847 | ) | | | (25,885,056 | ) | | | (1,343,292 | ) | | | (59,070,121 | ) |
Class B | | | (59,532 | ) | | | (2,799,990 | ) | | | (234,705 | ) | | | (10,445,441 | ) |
Class C | | | (140,006 | ) | | | (6,573,235 | ) | | | (335,716 | ) | | | (14,831,172 | ) |
Administrator Class | | | (3,810,535 | ) | | | (181,042,491 | ) | | | (9,543,143 | ) | | | (426,332,845 | ) |
Investor Class | | | (201,292 | ) | | | (9,618,107 | ) | | | (621,360 | ) | | | (28,086,423 | ) |
| | | | | | | | | | | | | | | | |
| | | | | | | (225,918,879 | ) | | | | | | | (538,766,002 | ) |
| | | | | | | | | | | | | | | | |
Net increase (decrease) in net assets resulting from capital share transactions | | | | | | | (63,392,304 | ) | | | | | | | 30,682,569 | |
| | | | | | | | | | | | | | | | |
Total increase (decrease) in net assets | | | | | | | 138,137,709 | | | | | | | | (106,172,104 | ) |
| | | | | | | | | | | | | | | | |
| | | | |
Net assets | | | | | | | | | | | | | | | | |
Beginning of period | | | | | | | 2,223,413,458 | | | | | | | | 2,329,585,562 | |
| | | | | | | | | | | | | | | | |
End of period | | | | | | $ | 2,361,551,167 | | | | | | | $ | 2,223,413,458 | |
| | | | | | | | | | | | | | | | |
Undistributed net investment income | | | | | | $ | 40,728,986 | | | | | | | $ | 17,661,947 | |
| | | | | | | | | | | | | | | | |
The accompanying notes are an integral part of these financial statements.
| | | | |
| 46 | | Wells Fargo Advantage Equity Gateway Funds | | Statements of changes in net assets |
| | | | | | | | | | | | | | | | |
| | | International Value Fund | |
| | | Six months ended November 30, 2012 (unaudited) | | | Year ended May 31, 2012 | |
| | | | |
Operations | | | | | | | | | | | | | | | | |
Net investment income | | | | | | $ | 2,405,401 | | | | | | | $ | 8,692,340 | |
Net realized losses on investments | | | | | | | (2,058,765 | ) | | | | | | | (2,118,816 | ) |
Net change in unrealized gains (losses) on investments | | | | | | | 45,226,313 | | | | | | | | (76,243,206 | ) |
| | | | | | | | | | | | | | | | |
Net increase (decrease) in net assets resulting from operations | | | | | | | 45,572,949 | | | | | | | | (69,669,682 | ) |
| | | | | | | | | | | | | | | | |
| | | | |
Distributions to shareholders from | | | | | | | | | | | | | | | | |
Net investment income | | | | | | | | | | | | | | | | |
Class A | | | | | | | 0 | | | | | | | | (159,931 | ) |
Class B | | | | | | | 0 | | | | | | | | (3,309 | ) |
Class C | | | | | | | 0 | | | | | | | | (11,851 | ) |
Administrator Class | | | | | | | 0 | | | | | | | | (9,257,461 | ) |
Institutional Class | | | | | | | 0 | | | | | | | | (62,017 | ) |
| | | | | | | | | | | | | | | | |
Total distributions to shareholders | | | | | | | 0 | | | | | | | | (9,494,569 | ) |
| | | | | | | | | | | | | | | | |
| | | | |
Capital share transactions | | | Shares | | | | | | | | Shares | | | | | |
Proceeds from shares sold | | | | | | | | | | | | | | | | |
Class A | | | 96,506 | | | | 1,080,678 | | | | 261,053 | | | | 3,156,917 | |
Class B | | | 0 | | | | 0 | | | | 2,330 | | | | 27,194 | |
Class C | | | 7,456 | | | | 85,935 | | | | 3,792 | | | | 43,981 | |
Administrator Class | | | 5,259,516 | | | | 62,434,818 | | | | 5,252,282 | | | | 62,246,706 | |
Institutional Class | | | 5,265 | | | | 61,122 | | | | 26,189 | | | | 295,672 | |
| | | | | | | | | | | | | | | | |
| | | | | | | 63,662,553 | | | | | | | | 65,770,470 | |
| | | | | | | | | | | | | | | | |
Reinvestment of distributions | | | | | | | | | | | | | | | | |
Class A | | | 0 | | | | 0 | | | | 14,553 | | | | 155,713 | |
Class B | | | 0 | | | | 0 | | | | 309 | | | | 3,303 | |
Class C | | | 0 | | | | 0 | | | | 979 | | | | 10,348 | |
Administrator Class | | | 0 | | | | 0 | | | | 869,418 | | | | 9,233,223 | |
Institutional Class | | | 0 | | | | 0 | | | | 5,276 | | | | 56,037 | |
| | | | | | | | | | | | | | | | |
| | | | | | | 0 | | | | | | | | 9,458,624 | |
| | | | | | | | | | | | | | | | |
Payment for shares redeemed | | | | | | | | | | | | | | | | |
Class A | | | (96,791 | ) | | | (1,130,407 | ) | | | (272,574 | ) | | | (3,355,353 | ) |
Class B | | | (3,945 | ) | | | (46,221 | ) | | | (6,141 | ) | | | (72,479 | ) |
Class C | | | (6,720 | ) | | | (78,856 | ) | | | (10,858 | ) | | | (132,205 | ) |
Administrator Class | | | (3,189,623 | ) | | | (37,406,774 | ) | | | (3,988,541 | ) | | | (47,811,761 | ) |
Institutional Class | | | (2,740 | ) | | | (32,524 | ) | | | (17,869 | ) | | | (217,819 | ) |
| | | | | | | | | | | | | | | | |
| | | | | | | (38,694,782 | ) | | | | | | | (51,589,617 | ) |
| | | | | | | | | | | | | | | | |
Net increase in net assets resulting from capital share transactions | | | | | | | 24,967,771 | | | | | | | | 23,639,477 | |
| | | | | | | | | | | | | | | | |
Total increase (decrease) in net assets | | | | | | | 70,540,720 | | | | | | | | (55,524,774 | ) |
| | | | | | | | | | | | | | | | |
| | | | |
Net assets | | | | | | | | | | | | | | | | |
Beginning of period | | | | | | | 266,767,626 | | | | | | | | 322,292,400 | |
| | | | | | | | | | | | | | | | |
End of period | | | | | | $ | 337,308,346 | | | | | | | $ | 266,767,626 | |
| | | | | | | | | | | | | | | | |
Undistributed net investment income | | | | | | $ | 7,793,407 | | | | | | | $ | 5,388,006 | |
| | | | | | | | | | | | | | | | |
The accompanying notes are an integral part of these financial statements.
| | | | | | |
| Statements of changes in net assets | | Wells Fargo Advantage Equity Gateway Funds | | | 47 | |
| | | | | | | | | | | | | | | | |
| | | Small Company Growth Fund | |
| | | Six months ended
November 30, 2012
(unaudited) | | | Year ended
May 31, 2012 | |
| | | | |
Operations | | | | | | | | | | | | | | | | |
Net investment loss | | | | | | $ | (155,980 | ) | | | | | | $ | (880,467 | ) |
Net realized gains on investments | | | | | | | 3,584,370 | | | | | | | | 36,216,616 | |
Net change in unrealized gains (losses) on investments | | | | | | | 4,881,267 | | | | | | | | (61,097,083 | ) |
| | | | | | | | | | | | | | | | |
Net increase (decrease) in net assets resulting from operations | | | | | | | 8,309,657 | | | | | | | | (25,760,934 | ) |
| | | | | | | | | | | | | | | | |
| | | | |
Capital share transactions | | | Shares | | | | | | | | Shares | | | | | |
Proceeds from shares sold | | | | | | | | | | | | | | | | |
Class A | | | 10,917 | | | | 300,114 | | | | 127,647 | | | | 3,392,917 | |
Class B | | | 401 | | | | 10,048 | | | | 2,911 | | | | 75,940 | |
Class C | | | 4,031 | | | | 105,582 | | | | 26,977 | | | | 667,387 | |
Administrator Class | | | 92,017 | | | | 2,583,535 | | | | 318,715 | | | | 8,837,386 | |
Institutional Class | | | 90,752 | | | | 2,657,375 | | | | 127,929 | | | | 3,485,874 | |
| | | | | | | | | | | | | | | | |
| | | | | | | 5,656,654 | | | | | | | | 16,459,504 | |
| | | | | | | | | | | | | | | | |
Payment for shares redeemed | | | | | | | | | | | | | | | | |
Class A | | | (30,258 | ) | | | (834,767 | ) | | | (125,485 | ) | | | (3,233,412 | ) |
Class B | | | (2,601 | ) | | | (66,960 | ) | | | (8,749 | ) | | | (219,495 | ) |
Class C | | | (4,755 | ) | | | (121,753 | ) | | | (22,995 | ) | | | (558,244 | ) |
Administrator Class | | | (429,661 | ) | | | (12,007,796 | ) | | | (2,570,914 | ) | | | (69,080,269 | ) |
Institutional Class | | | (37,818 | ) | | | (1,088,635 | ) | | | (2,784,026 | ) | | | (80,827,337 | ) |
| | | | | | | | | | | | | | | | |
| | | | | | | (14,119,911 | ) | | | | | | | (153,918,757 | ) |
| | | | | | | | | | | | | | | | |
Net decrease in net assets resulting from capital share transactions | | | | | | | (8,463,257 | ) | | | | | | | (137,459,253 | ) |
| | | | | | | | | | | | | | | | |
Total decrease in net assets | | | | | | | (153,600 | ) | | | | | | | (163,220,187 | ) |
| | | | | | | | | | | | | | | | |
| | | | |
Net assets | | | | | | | | | | | | | | | | |
Beginning of period | | | | | | | 115,739,089 | | | | | | | | 278,959,276 | |
| | | | | | | | | | | | | | | | |
End of period | | | | | | $ | 115,585,489 | | | | | | | $ | 115,739,089 | |
| | | | | | | | | | | | | | | | |
Undistributed net investment loss | | | | | | $ | (302,262 | ) | | | | | | $ | (146,282 | ) |
| | | | | | | | | | | | | | | | |
The accompanying notes are an integral part of these financial statements.
| | | | |
| 48 | | Wells Fargo Advantage Equity Gateway Funds | | Statements of changes in net assets |
| | | | | | | | | | | | | | | | |
| | | Small Company Value Fund | |
| | | Six months ended November 30, 2012 (unaudited) | | | Year ended May 31, 2012 | |
| | | | |
Operations | | | | | | | | | | | | | | | | |
Net investment income | | | | | | $ | 83,412 | | | | | | | $ | 194,805 | |
Net realized gains on investments | | | | | | | 2,223,728 | | | | | | | | 14,101,747 | |
Net change in unrealized gains (losses) on investments | | | | | | | 3,134,090 | | | | | | | | (21,587,931 | ) |
| | | | | | | | | | | | | | | | |
Net increase (decrease) in net assets resulting from operations | | | | | | | 5,441,230 | | | | | | | | (7,291,379 | ) |
| | | | | | | | | | | | | | | | |
| | | | |
Distributions to shareholders from | | | | | | | | | | | | | | | | |
Net investment income | | | | | | | | | | | | | | | | |
Class A | | | | | | | 0 | | | | | | | | (166,336 | ) |
Class C | | | | | | | 0 | | | | | | | | (6,205 | ) |
Administrator Class | | | | | | | 0 | | | | | | | | (624,190 | ) |
Institutional Class | | | | | | | 0 | | | | | | | | (140 | ) |
| | | | | | | | | | | | | | | | |
Total distributions to shareholders | | | | | | | 0 | | | | | | | | (796,871 | ) |
| | | | | | | | | | | | | | | | |
| | | | |
Capital share transactions | | | Shares | | | | | | | | Shares | | | | | |
Proceeds from shares sold | | | | | | | | | | | | | | | | |
Class A | | | 94,351 | | | | 1,297,547 | | | | 339,519 | | | | 4,389,540 | |
Class B | | | 0 | | | | 0 | | | | 1,911 | | | | 23,079 | |
Class C | | | 12,751 | | | | 157,474 | | | | 19,545 | | | | 248,255 | |
Administrator Class | | | 205,365 | | | | 2,871,734 | | | | 1,000,492 | | | | 12,810,750 | |
Institutional Class | | | 111,828 | | | | 1,499,199 | | | | 3,764 | | | | 54,850 | |
| | | | | | | | | | | | | | | | |
| | | | | | | 5,825,954 | | | | | | | | 17,526,474 | |
| | | | | | | | | | | | | | | | |
Reinvestment of distributions | | | | | | | | | | | | | | | | |
Class A | | | 0 | | | | 0 | | | | 12,716 | | | | 150,934 | |
Class C | | | 0 | | | | 0 | | | | 518 | | | | 5,702 | |
Administrator Class | | | 0 | | | | 0 | | | | 51,542 | | | | 621,597 | |
Institutional Class | | | 0 | | | | 0 | | | | 12 | | | | 140 | |
| | | | | | | | | | | | | | | | |
| | | | | | | 0 | | | | | | | | 778,373 | |
| | | | | | | | | | | | | | | | |
Payment for shares redeemed | | | | | | | | | | | | | | | | |
Class A | | | (182,674 | ) | | | (2,508,208 | ) | | | (764,879 | ) | | | (9,935,900 | ) |
Class B | | | (24,329 | ) | | | (307,033 | ) | | | (61,749 | ) | | | (752,696 | ) |
Class C | | | (16,395 | ) | | | (204,817 | ) | | | (53,737 | ) | | | (644,773 | ) |
Administrator Class | | | (698,077 | ) | | | (9,888,407 | ) | | | (1,341,981 | ) | | | (17,572,346 | ) |
Institutional Class | | | (18,657 | ) | | | (259,469 | ) | | | (194 | ) | | | (2,756 | ) |
| | | | | | | | | | | | | | | | |
| | | | | | | (13,167,934 | ) | | | | | | | (28,908,471 | ) |
| | | | | | | | | | | | | | | | |
Net decrease in net assets resulting from capital share transactions | | | | | | | (7,341,980 | ) | | | | | | | (10,603,624 | ) |
| | | | | | | | | | | | | | | | |
Total decrease in net assets | | | | | | | (1,900,750 | ) | | | | | | | (18,691,874 | ) |
| | | | | | | | | | | | | | | | |
| | | | |
Net assets | | | | | | | | | | | | | | | | |
Beginning of period | | | | | | | 81,057,370 | | | | | | | | 99,749,244 | |
| | | | | | | | | | | | | | | | |
End of period | | | | | | $ | 79,156,620 | | | | | | | $ | 81,057,370 | |
| | | | | | | | | | | | | | | | |
Undistributed net investment income | | | | | | $ | 139,448 | | | | | | | $ | 56,036 | |
| | | | | | | | | | | | | | | | |
The accompanying notes are an integral part of these financial statements.
This page is intentionally left blank.
| | | | |
| 50 | | Wells Fargo Advantage Equity Gateway Funds | | Financial highlights |
| | | | | | | | | | | | | | | | | | | | |
| | | Beginning
net asset
value per
share | | | Net
investment
income1 | | |
Net realized
and unrealized
gains (losses)
on investments | | | Distributions
from net
investment
income | | | Distributions
from net
realized gains | |
| | | | | |
C&B Large Cap Value Fund | | | | | | | | | | | | | | | | | | | | |
Class A | | | | | | | | | | | | | | | | | | | | |
June 1, 2012 to November 30, 2012 (unaudited) | | $ | 8.13 | | | | 0.07 | | | | 0.47 | | | | 0.00 | | | | 0.00 | |
June 1, 2011 to May 31, 2012 | | $ | 8.70 | | | | 0.12 | | | | (0.58 | ) | | | (0.11 | ) | | | 0.00 | |
October 1, 2010 to May 31, 20114 | | $ | 7.48 | | | | 0.06 | | | | 1.26 | | | | (0.10 | ) | | | 0.00 | |
October 1, 2009 to September 30, 2010 | | $ | 7.06 | | | | 0.08 | | | | 0.42 | | | | (0.08 | ) | | | 0.00 | |
October 1, 2008 to September 30, 2009 | | $ | 7.69 | | | | 0.10 | 5 | | | (0.60 | ) | | | (0.13 | ) | | | (0.00 | )6 |
October 1, 2007 to September 30, 2008 | | $ | 10.19 | | | | 0.11 | 5 | | | (2.12 | ) | | | (0.09 | ) | | | (0.40 | ) |
October 1, 2006 to September 30, 2007 | | $ | 9.67 | | | | 0.09 | 5 | | | 0.98 | | | | (0.11 | ) | | | (0.44 | ) |
Class B | | | | | | | | | | | | | | | | | | | | |
June 1, 2012 to November 30, 2012 (unaudited) | | $ | 8.16 | | | | 0.03 | 5 | | | 0.48 | | | | 0.00 | | | | 0.00 | |
June 1, 2011 to May 31, 2012 | | $ | 8.68 | | | | 0.05 | 5 | | | (0.56 | ) | | | (0.01 | ) | | | 0.00 | |
October 1, 2010 to May 31, 20114 | | $ | 7.44 | | | | 0.01 | | | | 1.26 | | | | (0.03 | ) | | | 0.00 | |
October 1, 2009 to September 30, 2010 | | $ | 7.02 | | | | 0.03 | | | | 0.42 | | | | (0.03 | ) | | | 0.00 | |
October 1, 2008 to September 30, 2009 | | $ | 7.61 | | | | 0.05 | 5 | | | (0.58 | ) | | | (0.06 | ) | | | (0.00 | )6 |
October 1, 2007 to September 30, 2008 | | $ | 10.08 | | | | 0.04 | 5 | | | (2.11 | ) | | | 0.00 | | | | (0.40 | ) |
October 1, 2006 to September 30, 2007 | | $ | 9.58 | | | | 0.02 | 5 | | | 0.96 | | | | (0.04 | ) | | | (0.44 | ) |
Class C | | | | | | | | | | | | | | | | | | | | |
June 1, 2012 to November 30, 2012 (unaudited) | | $ | 8.11 | | | | 0.04 | | | | 0.46 | | | | 0.00 | | | | 0.00 | |
June 1, 2011 to May 31, 2012 | | $ | 8.66 | | | | 0.05 | | | | (0.56 | ) | | | (0.04 | ) | | | 0.00 | |
October 1, 2010 to May 31, 20114 | | $ | 7.43 | | | | 0.00 | 6 | | | 1.27 | | | | (0.04 | ) | | | 0.00 | |
October 1, 2009 to September 30, 2010 | | $ | 7.02 | | | | 0.02 | | | | 0.42 | | | | (0.03 | ) | | | 0.00 | |
October 1, 2008 to September 30, 2009 | | $ | 7.60 | | | | 0.05 | 5 | | | (0.57 | ) | | | (0.06 | ) | | | (0.00 | )6 |
October 1, 2007 to September 30, 2008 | | $ | 10.08 | | | | 0.04 | 5 | | | (2.11 | ) | | | (0.01 | ) | | | (0.40 | ) |
October 1, 2006 to September 30, 2007 | | $ | 9.58 | | | | 0.02 | 5 | | | 0.96 | | | | (0.04 | ) | | | (0.44 | ) |
Administrator Class | | | | | | | | | | | | | | | | | | | | |
June 1, 2012 to November 30, 2012 (unaudited) | | $ | 8.13 | | | | 0.08 | | | | 0.47 | | | | 0.00 | | | | 0.00 | |
June 1, 2011 to May 31, 2012 | | $ | 8.69 | | | | 0.13 | 5 | | | (0.56 | ) | | | (0.13 | ) | | | 0.00 | |
October 1, 2010 to May 31, 20114 | | $ | 7.47 | | | | 0.05 | 5 | | | 1.28 | | | | (0.11 | ) | | | 0.00 | |
October 1, 2009 to September 30, 2010 | | $ | 7.06 | | | | 0.08 | 5 | | | 0.42 | | | | (0.09 | ) | | | 0.00 | |
October 1, 2008 to September 30, 2009 | | $ | 7.70 | | | | 0.11 | 5 | | | (0.60 | ) | | | (0.15 | ) | | | (0.00 | )6 |
October 1, 2007 to September 30, 2008 | | $ | 10.22 | | | | 0.13 | 5 | | | (2.13 | ) | | | (0.12 | ) | | | (0.40 | ) |
October 1, 2006 to September 30, 2007 | | $ | 9.69 | | | | 0.12 | 5 | | | 0.98 | | | | (0.13 | ) | | | (0.44 | ) |
Institutional Class | | | | | | | | | | | | | | | | | | | | |
June 1, 2012 to November 30, 2012 (unaudited) | | $ | 8.16 | | | | 0.09 | | | | 0.47 | | | | 0.00 | | | | 0.00 | |
June 1, 2011 to May 31, 2012 | | $ | 8.73 | | | | 0.14 | | | | (0.56 | ) | | | (0.15 | ) | | | 0.00 | |
October 1, 2010 to May 31, 20114 | | $ | 7.51 | | | | 0.07 | | | | 1.28 | | | | (0.13 | ) | | | 0.00 | |
October 1, 2009 to September 30, 2010 | | $ | 7.09 | | | | 0.11 | 5 | | | 0.42 | | | | (0.11 | ) | | | 0.00 | |
October 1, 2008 to September 30, 2009 | | $ | 7.75 | | | | 0.12 | 5 | | | (0.61 | ) | | | (0.17 | ) | | | (0.00 | )6 |
October 1, 2007 to September 30, 2008 | | $ | 10.27 | | | | 0.15 | 5 | | | (2.13 | ) | | | (0.14 | ) | | | (0.40 | ) |
October 1, 2006 to September 30, 2007 | | $ | 9.74 | | | | 0.15 | 5 | | | 0.97 | | | | (0.15 | ) | | | (0.44 | ) |
Investor Class | | | | | | | | | | | | | | | | | | | | |
June 1, 2012 to November 30, 2012 (unaudited) | | $ | 8.14 | | | | 0.06 | | | | 0.47 | | | | 0.00 | | | | 0.00 | |
June 1, 2011 to May 31, 2012 | | $ | 8.70 | | | | 0.10 | | | | (0.56 | ) | | | (0.10 | ) | | | 0.00 | |
October 1, 2010 to May 31, 20114 | | $ | 7.46 | | | | 0.04 | | | | 1.28 | | | | (0.08 | ) | | | 0.00 | |
October 1, 2009 to September 30, 2010 | | $ | 7.04 | | | | 0.06 | | | | 0.44 | | | | (0.08 | ) | | | 0.00 | |
October 1, 2008 to September 30, 2009 | | $ | 7.68 | | | | 0.09 | 5 | | | (0.59 | ) | | | (0.14 | ) | | | (0.00 | )6 |
October 1, 2007 to September 30, 20087 | | $ | 10.19 | | | | 0.11 | 5 | | | (2.13 | ) | | | (0.09 | ) | | | (0.40 | ) |
October 1, 2006 to September 30, 2007 | | $ | 9.67 | | | | 0.10 | 5 | | | 0.97 | | | | (0.11 | ) | | | (0.44 | ) |
Please see footnotes on page 62.
The accompanying notes are an integral part of these financial statements.
| | | | | | |
| Financial highlights | | Wells Fargo Advantage Equity Gateway Funds | | | 51 | |
| | | | | | | | | | | | | | | | | | | | | | | | | | |
Ending
net asset
value
per
share | | | Ratio to average net assets (annualized) | | | Total
return2 | | | Portfolio
turnover
rate3 | | | Net assets at
end of period
(000s omitted) | |
| | Net investment
income1 | | | Gross
expenses1 | | | Net
expenses1 | | | | |
| | | | | | |
| | | | | | | | | | | | | | | | | | | | | | | | | | | |
| | | | | | | | | | | | | | | | | | | | | | | | | | |
| $ | 8.67 | | | | 1.52 | % | | | 1.30 | % | | | 1.15 | % | | | 6.64 | % | | | 6 | % | | $ | 20,937 | |
| $ | 8.13 | | | | 1.33 | % | | | 1.30 | % | | | 1.15 | % | | | (5.23 | )% | | | 21 | % | | $ | 21,380 | |
| $ | 8.70 | | | | 0.78 | % | | | 1.31 | % | | | 1.15 | % | | | 17.73 | % | | | 17 | % | | $ | 25,912 | |
| $ | 7.48 | | | | 0.96 | % | | | 1.32 | % | | | 1.15 | % | | | 7.14 | % | | | 13 | % | | $ | 31,038 | |
| $ | 7.06 | | | | 1.66 | % | | | 1.30 | % | | | 1.15 | % | | | (6.05 | )% | | | 28 | % | | $ | 33,784 | |
| $ | 7.69 | | | | 1.20 | % | | | 1.32 | % | | | 1.19 | % | | | (20.51 | )% | | | 21 | % | | $ | 40,157 | |
| $ | 10.19 | | | | 0.94 | % | | | 1.30 | % | | | 1.20 | % | | | 11.20 | % | | | 24 | % | | $ | 72,865 | |
| | | | | | | | | | | | | | | | | | | | | | | | | | |
| $ | 8.67 | | | | 0.77 | % | | | 2.04 | % | | | 1.90 | % | | | 6.25 | % | | | 6 | % | | $ | 1,494 | |
| $ | 8.16 | | | | 0.61 | % | | | 2.05 | % | | | 1.90 | % | | | (5.84 | )% | | | 21 | % | | $ | 2,418 | |
| $ | 8.68 | | | | 0.04 | % | | | 2.06 | % | | | 1.90 | % | | | 17.15 | % | | | 17 | % | | $ | 6,607 | |
| $ | 7.44 | | | | 0.20 | % | | | 2.07 | % | | | 1.90 | % | | | 6.36 | % | | | 13 | % | | $ | 6,951 | |
| $ | 7.02 | | | | 0.91 | % | | | 2.04 | % | | | 1.90 | % | | | (6.73 | )% | | | 28 | % | | $ | 8,773 | |
| $ | 7.61 | | | | 0.43 | % | | | 2.07 | % | | | 1.94 | % | | | (21.19 | )% | | | 21 | % | | $ | 13,461 | |
| $ | 10.08 | | | | 0.18 | % | | | 2.05 | % | | | 1.95 | % | | | 10.33 | % | | | 24 | % | | $ | 25,029 | |
| | | | | | | | | | | | | | | | | | | | | | | | | | |
| $ | 8.61 | | | | 0.77 | % | | | 2.05 | % | | | 1.90 | % | | | 6.17 | % | | | 6 | % | | $ | 5,418 | |
| $ | 8.11 | | | | 0.58 | % | | | 2.05 | % | | | 1.90 | % | | | (5.81 | )% | | | 21 | % | | $ | 5,524 | |
| $ | 8.66 | | | | 0.05 | % | | | 2.07 | % | | | 1.90 | % | | | 17.15 | % | | | 17 | % | | $ | 7,046 | |
| $ | 7.43 | | | | 0.21 | % | | | 2.07 | % | | | 1.90 | % | | | 6.29 | % | | | 13 | % | | $ | 6,607 | |
| $ | 7.02 | | | | 0.90 | % | | | 2.04 | % | | | 1.90 | % | | | (6.62 | )% | | | 28 | % | | $ | 6,852 | |
| $ | 7.60 | | | | 0.44 | % | | | 2.06 | % | | | 1.94 | % | | | (21.21 | )% | | | 21 | % | | $ | 9,424 | |
| $ | 10.08 | | | | 0.19 | % | | | 2.05 | % | | | 1.95 | % | | | 10.34 | % | | | 24 | % | | $ | 16,926 | |
| | | | | | | | | | | | | | | | | | | | | | | | | | |
| $ | 8.68 | | | | 1.72 | % | | | 1.13 | % | | | 0.95 | % | | | 6.77 | % | | | 6 | % | | $ | 84,202 | |
| $ | 8.13 | | | | 1.54 | % | | | 1.13 | % | | | 0.95 | % | | | (4.90 | )% | | | 21 | % | | $ | 81,999 | |
| $ | 8.69 | | | | 1.00 | % | | | 1.15 | % | | | 0.95 | % | | | 17.74 | % | | | 17 | % | | $ | 120,613 | |
| $ | 7.47 | | | | 1.13 | % | | | 1.13 | % | | | 0.95 | % | | | 7.33 | % | | | 13 | % | | $ | 114,664 | |
| $ | 7.06 | | | | 1.89 | % | | | 1.11 | % | | | 0.95 | % | | | (5.83 | )% | | | 28 | % | | $ | 222,489 | |
| $ | 7.70 | | | | 1.43 | % | | | 1.13 | % | | | 0.95 | % | | | (20.42 | )% | | | 21 | % | | $ | 260,883 | |
| $ | 10.22 | | | | 1.23 | % | | | 1.12 | % | | | 0.95 | % | | | 11.52 | % | | | 24 | % | | $ | 590,511 | |
| | | | | | | | | | | | | | | | | | | | | | | | | | |
| $ | 8.72 | | | | 1.97 | % | | | 0.87 | % | | | 0.70 | % | | | 6.86 | % | | | 6 | % | | $ | 98,678 | |
| $ | 8.16 | | | | 1.78 | % | | | 0.87 | % | | | 0.70 | % | | | (4.72 | )% | | | 21 | % | | $ | 96,653 | |
| $ | 8.73 | | | | 1.25 | % | | | 0.88 | % | | | 0.70 | % | | | 18.16 | % | | | 17 | % | | $ | 110,061 | |
| $ | 7.51 | | | | 1.48 | % | | | 0.88 | % | | | 0.70 | % | | | 7.51 | % | | | 13 | % | | $ | 95,466 | |
| $ | 7.09 | | | | 2.11 | % | | | 0.85 | % | | | 0.70 | % | | | (5.62 | )% | | | 28 | % | | $ | 26,582 | |
| $ | 7.75 | | | | 1.68 | % | | | 0.87 | % | | | 0.70 | % | | | (20.10 | )% | | | 21 | % | | $ | 27,494 | |
| $ | 10.27 | | | | 1.45 | % | | | 0.85 | % | | | 0.70 | % | | | 11.69 | % | | | 24 | % | | $ | 57,189 | |
| | | | | | | | | | | | | | | | | | | | | | | | | | |
| $ | 8.67 | | | | 1.47 | % | | | 1.36 | % | | | 1.20 | % | | | 6.51 | % | | | 6 | % | | $ | 59,329 | |
| $ | 8.14 | | | | 1.29 | % | | | 1.37 | % | | | 1.20 | % | | | (5.17 | )% | | | 21 | % | | $ | 64,007 | |
| $ | 8.70 | | | | 0.75 | % | | | 1.39 | % | | | 1.20 | % | | | 17.77 | % | | | 17 | % | | $ | 86,624 | |
| $ | 7.46 | | | | 0.87 | % | | | 1.41 | % | | | 1.20 | % | | | 7.15 | % | | | 13 | % | | $ | 85,256 | |
| $ | 7.04 | | | | 1.62 | % | | | 1.40 | % | | | 1.20 | % | | | (6.06 | )% | | | 28 | % | | $ | 199,654 | |
| $ | 7.68 | | | | 1.20 | % | | | 1.35 | % | | | 1.20 | % | | | (20.59 | )% | | | 21 | % | | $ | 153,917 | |
| $ | 10.19 | | �� | | 0.95 | % | | | 1.30 | % | | | 1.20 | % | | | 11.20 | % | | | 24 | % | | $ | 222,142 | |
Please see footnotes on page 62.
The accompanying notes are an integral part of these financial statements.
| | | | |
| 52 | | Wells Fargo Advantage Equity Gateway Funds | | Financial highlights |
| | | | | | | | | | | | | | | | | | | | |
| | | Beginning
net asset
value per
share | | | Net
investment
income (loss)1 | | |
Net realized
and unrealized
gains (losses)
on investments | | | Distributions
from net
investment
income | | | Distributions
from net
realized gains | |
| | | | | |
Diversified Equity Fund | | | | | | | | | | | | | | | | | | | | |
Class A | | | | | | | | | | | | | | | | | | | | |
June 1, 2012 to November 30, 2012 (unaudited) | | $ | 26.08 | | | | 0.10 | 5 | | | 2.28 | | | | 0.00 | | | | 0.00 | |
June 1, 2011 to May 31, 2012 | | $ | 29.71 | | | | 0.15 | | | | (2.01 | ) | | | (0.18 | ) | | | (1.59 | ) |
October 1, 2010 to May 31, 20114 | | $ | 24.89 | | | | 0.12 | | | | 4.85 | | | | (0.15 | ) | | | 0.00 | |
October 1, 2009 to September 30, 2010 | | $ | 23.41 | | | | 0.18 | | | | 1.66 | | | | (0.36 | ) | | | 0.00 | |
October 1, 2008 to September 30, 2009 | | $ | 27.70 | | | | 0.23 | 5 | | | (2.30 | ) | | | (0.26 | ) | | | (1.96 | ) |
October 1, 2007 to September 30, 2008 | | $ | 42.92 | | | | 0.27 | 5 | | | (9.47 | ) | | | (0.25 | ) | | | (5.77 | ) |
October 1, 2006 to September 30, 2007 | | $ | 40.36 | | | | 0.23 | 5 | | | 6.33 | | | | (0.21 | ) | | | (3.79 | ) |
Class B | | | | | | | | | | | | | | | | | | | | |
June 1, 2012 to November 30, 2012 (unaudited) | | $ | 24.36 | | | | (0.01 | )5 | | | 2.13 | | | | 0.00 | | | | 0.00 | |
June 1, 2011 to May 31, 2012 | | $ | 27.87 | | | | (0.01 | )5 | | | (1.91 | ) | | | 0.00 | | | | (1.59 | ) |
October 1, 2010 to May 31, 20114 | | $ | 23.35 | | | | (0.05 | )5 | | | 4.57 | | | | 0.00 | | | | 0.00 | |
October 1, 2009 to September 30, 2010 | | $ | 21.96 | | | | (0.01 | )5 | | | 1.57 | | | | (0.17 | ) | | | 0.00 | |
October 1, 2008 to September 30, 2009 | | $ | 26.00 | | | | 0.08 | 5 | | | (2.16 | ) | | | 0.00 | | | | (1.96 | ) |
October 1, 2007 to September 30, 2008 | | $ | 40.68 | | | | 0.01 | 5 | | | (8.92 | ) | | | 0.00 | | | | (5.77 | ) |
October 1, 2006 to September 30, 2007 | | $ | 38.53 | | | | (0.08 | )5 | | | 6.02 | | | | 0.00 | | | | (3.79 | ) |
Class C | | | | | | | | | | | | | | | | | | | | |
June 1, 2012 to November 30, 2012 (unaudited) | | $ | 24.88 | | | | (0.01 | )5 | | | 2.18 | | | | 0.00 | | | | 0.00 | |
June 1, 2011 to May 31, 2012 | | $ | 28.43 | | | | (0.59 | ) | | | (1.37 | ) | | | 0.00 | | | | (1.59 | ) |
October 1, 2010 to May 31, 20114 | | $ | 23.81 | | | | (0.04 | )5 | | | 4.66 | | | | 0.00 | | | | 0.00 | |
October 1, 2009 to September 30, 2010 | | $ | 22.43 | | | | (0.01 | )5 | | | 1.60 | | | | (0.21 | ) | | | 0.00 | |
October 1, 2008 to September 30, 2009 | | $ | 26.53 | | | | 0.08 | 5 | | | (2.20 | ) | | | (0.02 | ) | | | (1.96 | ) |
October 1, 2007 to September 30, 2008 | | $ | 41.38 | | | | 0.02 | 5 | | | (9.10 | ) | | | 0.00 | | | | (5.77 | ) |
October 1, 2006 to September 30, 2007 | | $ | 39.13 | | | | (0.07 | )5 | | | 6.11 | | | | 0.00 | | | | (3.79 | ) |
Administrator Class | | | | | | | | | | | | | | | | | | | | |
June 1, 2012 to November 30, 2012 (unaudited) | | $ | 26.12 | | | | 0.13 | 5 | | | 2.29 | | | | 0.00 | | | | 0.00 | |
June 1, 2011 to May 31, 2012 | | $ | 29.78 | | | | 0.33 | | | | (2.13 | ) | | | (0.27 | ) | | | (1.59 | ) |
October 1, 2010 to May 31, 20114 | | $ | 24.98 | | | | 0.14 | 5 | | | 4.89 | | | | (0.23 | ) | | | 0.00 | |
October 1, 2009 to September 30, 2010 | | $ | 23.47 | | | | 0.20 | 5 | | | 1.70 | | | | (0.39 | ) | | | 0.00 | |
October 1, 2008 to September 30, 2009 | | $ | 27.79 | | | | 0.28 | 5 | | | (2.32 | ) | | | (0.32 | ) | | | (1.96 | ) |
October 1, 2007 to September 30, 2008 | | $ | 43.03 | | | | 0.36 | 5 | | | (9.49 | ) | | | (0.34 | ) | | | (5.77 | ) |
October 1, 2006 to September 30, 2007 | | $ | 40.46 | | | | 0.33 | 5 | | | 6.33 | | | | (0.30 | ) | | | (3.79 | ) |
| | | | | |
Diversified Small Cap Fund | | | | | | | | | | | | | | | | | | | | |
Administrator Class | | | | | | | | | | | | | | | | | | | | |
June 1, 2012 to November 30, 2012 (unaudited) | | $ | 12.62 | | | | (0.01 | ) | | | 1.01 | | | | 0.00 | | | | 0.00 | |
June 1, 2011 to May 31, 2012 | | $ | 13.76 | | | | 0.01 | | | | (1.13 | ) | | | (0.02 | ) | | | 0.00 | |
October 1, 2010 to May 31, 20114 | | $ | 10.87 | | | | 0.00 | 6 | | | 2.90 | | | | (0.01 | ) | | | 0.00 | |
October 1, 2009 to September 30, 2010 | | $ | 9.67 | | | | 0.10 | | | | 1.20 | | | | (0.10 | ) | | | 0.00 | |
October 1, 2008 to September 30, 2009 | | $ | 10.40 | | | | 0.03 | 5 | | | (0.76 | ) | | | (0.00 | )5 | | | 0.00 | |
October 1, 2007 to September 30, 2008 | | $ | 14.89 | | | | 0.01 | | | | (2.85 | ) | | | 0.00 | | | | (1.62 | ) |
October 1, 2006 to September 30, 2007 | | $ | 14.66 | | | | (0.03 | ) | | | 1.96 | | | | 0.00 | | | | (1.70 | ) |
| | | | | |
Emerging Growth Fund | | | | | | | | | | | | | | | | | | | | |
Class A | | | | | | | | | | | | | | | | | | | | |
June 1, 2012 to November 30, 2012 (unaudited) | | $ | 12.44 | | | | (0.07 | ) | | | 0.19 | | | | 0.00 | | | | 0.00 | |
June 1, 2011 to May 31, 2012 | | $ | 13.12 | | | | (0.14 | )5 | | | (0.54 | ) | | | 0.00 | | | | 0.00 | |
October 1, 2010 to May 31, 20114 | | $ | 9.50 | | | | (0.11 | )5 | | | 3.73 | | | | 0.00 | | | | 0.00 | |
October 1, 2009 to September 30, 2010 | | $ | 7.93 | | | | (0.12 | )5 | | | 1.69 | | | | 0.00 | | | | 0.00 | |
October 1, 2008 to September 30, 2009 | | $ | 8.51 | | | | (0.07 | )5 | | | (0.51 | ) | | | 0.00 | | | | 0.00 | |
March 31, 20088 to September 30, 2008 | | $ | 9.43 | | | | (0.05 | ) | | | (0.87 | ) | | | 0.00 | | | | 0.00 | |
Please see footnotes on page 62.
The accompanying notes are an integral part of these financial statements.
| | | | | | |
| Financial highlights | | Wells Fargo Advantage Equity Gateway Funds | | | 53 | |
| | | | | | | | | | | | | | | | | | | | | | | | | | | | | | |
Distributions
from tax
basis return
of capital | | | Ending
net asset
value
per
share | | | Ratio to average net assets (annualized) | | | Total
return2 | | | Portfolio
turnover
rate3 | | | Net assets at
end of period
(000s omitted) | |
| | | Net investment
income (loss)1 | | | Gross
expenses1 | | | Net
expenses1 | | | | |
| | | | | | | |
| | | | | | | | | | | | | | | | | | | | | | | | | | | | | | | |
| | | | | | | | | | | | | | | | | | | | | | | | | | | | | | |
| | 0.00 | | | $ | 28.46 | | | | 0.68 | % | | | 1.42 | % | | | 1.25 | % | | | 9.13 | % | | | 20 | % | | $ | 71,820 | |
| | 0.00 | | | $ | 26.08 | | | | 0.74 | % | | | 1.41 | % | | | 1.25 | % | | | (5.91 | )% | | | 57 | % | | $ | 75,751 | |
| | 0.00 | | | $ | 29.71 | | | | 0.59 | % | | | 1.40 | % | | | 1.25 | % | | | 20.04 | % | | | 48 | % | | $ | 95,532 | |
| | 0.00 | | | $ | 24.89 | | | | 0.71 | % | | | 1.48 | % | | | 1.25 | % | | | 7.90 | % | | | 44 | % | | $ | 85,735 | |
| | 0.00 | | | $ | 23.41 | | | | 1.16 | % | | | 1.43 | % | | | 1.25 | % | | | (5.33 | )% | | | 48 | % | | $ | 85,504 | |
| | 0.00 | | | $ | 27.70 | | | | 0.81 | % | | | 1.42 | % | | | 1.25 | % | | | (24.44 | )% | | | 37 | % | | $ | 90,444 | |
| | 0.00 | | | $ | 42.92 | | | | 0.57 | % | | | 1.43 | % | | | 1.25 | % | | | 17.16 | % | | | 36 | % | | $ | 131,810 | |
| | | | | | | | | | | | | | | | | | | | | | | | | | | | | | |
| | 0.00 | | | $ | 26.48 | | | | (0.08 | )% | | | 2.17 | % | | | 2.00 | % | | | 8.70 | % | | | 20 | % | | $ | 2,499 | |
| | 0.00 | | | $ | 24.36 | | | | (0.05 | )% | | | 2.16 | % | | | 2.00 | % | | | (6.61 | )% | | | 57 | % | | $ | 2,922 | |
| | 0.00 | | | $ | 27.87 | | | | (0.20 | )% | | | 2.15 | % | | | 2.00 | % | | | 19.36 | % | | | 48 | % | | $ | 5,754 | |
| | 0.00 | | | $ | 23.35 | | | | (0.04 | )% | | | 2.23 | % | | | 2.00 | % | | | 7.15 | % | | | 44 | % | | $ | 7,825 | |
| | 0.00 | | | $ | 21.96 | | | | 0.43 | % | | | 2.18 | % | | | 1.99 | % | | | (6.03 | )% | | | 48 | % | | $ | 10,839 | |
| | 0.00 | | | $ | 26.00 | | | | 0.03 | % | | | 2.17 | % | | | 2.00 | % | | | (25.01 | )% | | | 37 | % | | $ | 19,054 | |
| | 0.00 | | | $ | 40.68 | | | | (0.19 | )% | | | 2.18 | % | | | 2.00 | % | | | 16.24 | % | | | 36 | % | | $ | 41,273 | |
| | | | | | | | | | | | | | | | | | | | | | | | | | | | | | |
| | 0.00 | | | $ | 27.05 | | | | (0.06 | )% | | | 2.17 | % | | | 2.00 | % | | | 8.72 | % | | | 20 | % | | $ | 2,641 | |
| | 0.00 | | | $ | 24.88 | | | | (0.02 | )% | | | 2.16 | % | | | 2.00 | % | | | (6.62 | )% | | | 57 | % | | $ | 2,499 | |
| | 0.00 | | | $ | 28.43 | | | | (0.17 | )% | | | 2.15 | % | | | 2.00 | % | | | 19.40 | % | | | 48 | % | | $ | 3,383 | |
| | 0.00 | | | $ | 23.81 | | | | (0.05 | )% | | | 2.23 | % | | | 2.00 | % | | | 7.10 | % | | | 44 | % | | $ | 3,280 | |
| | 0.00 | | | $ | 22.43 | | | | 0.41 | % | | | 2.17 | % | | | 2.00 | % | | | (6.02 | )% | | | 48 | % | | $ | 2,958 | |
| | 0.00 | | | $ | 26.53 | | | | 0.05 | % | | | 2.15 | % | | | 2.00 | % | | | (25.00 | )% | | | 37 | % | | $ | 3,491 | |
| | 0.00 | | | $ | 41.38 | | | | (0.18 | )% | | | 2.18 | % | | | 2.00 | % | | | 16.25 | % | | | 36 | % | | $ | 6,504 | |
| | | | | | | | | | | | | | | | | | | | | | | | | | | | | | |
| | 0.00 | | | $ | 28.54 | | | | 0.93 | % | | | 1.26 | % | | | 1.00 | % | | | 9.26 | % | | | 20 | % | | $ | 292,711 | |
| | 0.00 | | | $ | 26.12 | | | | 0.99 | % | | | 1.25 | % | | | 1.00 | % | | | (5.67 | )% | | | 57 | % | | $ | 293,895 | |
| | 0.00 | | | $ | 29.78 | | | | 0.84 | % | | | 1.24 | % | | | 1.00 | % | | | 20.22 | % | | | 48 | % | | $ | 386,429 | |
| | 0.00 | | | $ | 24.98 | | | | 0.83 | % | | | 1.29 | % | | | 1.00 | % | | | 8.18 | % | | | 44 | % | | $ | 359,109 | |
| | 0.00 | | | $ | 23.47 | | | | 1.41 | % | | | 1.25 | % | | | 1.00 | % | | | (5.09 | )% | | | 48 | % | | $ | 596,298 | |
| | 0.00 | | | $ | 27.79 | | | | 1.05 | % | | | 1.24 | % | | | 1.00 | % | | | (24.24 | )% | | | 37 | % | | $ | 678,818 | |
| | 0.00 | | | $ | 43.03 | | | | 0.81 | % | | | 1.25 | % | | | 1.00 | % | | | 17.41 | % | | | 36 | % | | $ | 1,084,181 | |
| | | | | | | |
| | | | | | | | | | | | | | | | | | | | | | | | | | | | | | | |
| | | | | | | | | | | | | | | | | | | | | | | | | | | | | | |
| | 0.00 | | | $ | 13.62 | | | | (0.04 | )% | | | 1.60 | % | | | 1.00 | % | | | 7.92 | % | | | 34 | % | | $ | 8,425 | |
| | 0.00 | | | $ | 12.62 | | | | 0.10 | % | | | 1.54 | % | | | 1.00 | % | | | (8.11 | )% | | | 69 | % | | $ | 127,204 | |
| | 0.00 | | | $ | 13.76 | | | | 0.05 | % | | | 1.43 | % | | | 1.00 | % | | | 26.66 | % | | | 58 | % | | $ | 142,660 | |
| | 0.00 | | | $ | 10.87 | | | | (0.01 | )% | | | 1.43 | % | | | 1.00 | % | | | 13.58 | % | | | 58 | % | | $ | 119,100 | |
| | 0.00 | | | $ | 9.67 | | | | 0.36 | % | | | 1.32 | % | | | 1.00 | % | | | (7.00 | )% | | | 61 | % | | $ | 515,569 | |
| | (0.03 | ) | | $ | 10.40 | | | | 0.06 | % | | | 1.30 | % | | | 1.14 | % | | | (20.61 | )% | | | 56 | % | | $ | 569,169 | |
| | 0.00 | | | $ | 14.89 | | | | (0.21 | )% | | | 1.36 | % | | | 1.20 | % | | | 13.75 | % | | | 67 | % | | $ | 757,352 | |
| | | | | | | |
| | | | | | | | | | | | | | | | | | | | | | | | | | | | | | | |
| | | | | | | | | | | | | | | | | | | | | | | | | | | | | | |
| | 0.00 | | | $ | 12.56 | | | | (1.00 | )% | | | 1.39 | % | | | 1.37 | % | | | 0.96 | % | | | 32 | % | | $ | 116,975 | |
| | 0.00 | | | $ | 12.44 | | | | (1.13 | )% | | | 1.41 | % | | | 1.37 | % | | | (5.18 | )% | | | 75 | % | | $ | 125,113 | |
| | 0.00 | | | $ | 13.12 | | | | (1.32 | )% | | | 3.03 | % | | | 1.45 | % | | | 38.11 | % | | | 59 | % | | $ | 3,425 | |
| | 0.00 | | | $ | 9.50 | | | | (1.17 | )% | | | 4.65 | % | | | 1.46 | % | | | 19.80 | % | | | 97 | % | | $ | 142 | |
| | 0.00 | | | $ | 7.93 | | | | (1.09 | )% | | | 8.23 | % | | | 1.45 | % | | | (6.82 | )% | | | 147 | % | | $ | 44 | |
| | 0.00 | | | $ | 8.51 | | | | (1.05 | )% | | | 4.16 | % | | | 1.45 | % | | | (9.76 | )% | | | 191 | % | | $ | 14 | |
Please see footnotes on page 62.
The accompanying notes are an integral part of these financial statements.
| | | | |
| 54 | | Wells Fargo Advantage Equity Gateway Funds | | Financial highlights |
| | | | | | | | | | | | | | | | | | | | |
| | | Beginning
net asset
value per
share | | | Net
investment
income (loss)1 | | |
Net realized
and unrealized
gains (losses)
on investments | | | Distributions
from net
investment
income | | | Distributions
from net
realized gains | |
| | | | | |
Emerging Growth Fund (continued) | | | | | | | | | | | | | | | | | | | | |
Class C | | | | | | | | | | | | | | | | | | | | |
June 1, 2012 to November 30, 2012 (unaudited) | | $ | 12.06 | | | | (0.14 | ) | | | 0.21 | | | | 0.00 | | | | 0.00 | |
June 1, 2011 to May 31, 2012 | | $ | 12.81 | | | | (0.23 | )5 | | | (0.52 | ) | | | 0.00 | | | | 0.00 | |
October 1, 2010 to May 31, 20114 | | $ | 9.32 | | | | (0.16 | )5 | | | 3.65 | | | | 0.00 | | | | 0.00 | |
October 1, 2009 to September 30, 2010 | | $ | 7.85 | | | | (0.16 | )5 | | | 1.63 | | | | 0.00 | | | | 0.00 | |
October 1, 2008 to September 30, 2009 | | $ | 8.48 | | | | (0.12 | )5 | | | (0.51 | ) | | | 0.00 | | | | 0.00 | |
March 31, 20088 to September 30, 2008 | | $ | 9.43 | | | | (0.09 | )5 | | | (0.86 | ) | | | 0.00 | | | | 0.00 | |
Administrator Class | | | | | | | | | | | | | | | | | | | | |
June 1, 2012 to November 30, 2012 (unaudited) | | $ | 12.56 | | | | (0.06 | ) | | | 0.20 | | | | 0.00 | | | | 0.00 | |
June 1, 2011 to May 31, 2012 | | $ | 13.22 | | | | (0.12 | )5 | | | (0.54 | ) | | | 0.00 | | | | 0.00 | |
October 1, 2010 to May 31, 20114 | | $ | 9.56 | | | | (0.09 | )5 | | | 3.75 | | | | 0.00 | | | | 0.00 | |
October 1, 2009 to September 30, 2010 | | $ | 8.08 | | | | (0.01 | ) | | | 1.49 | | | | 0.00 | | | | 0.00 | |
October 1, 2008 to September 30, 2009 | | $ | 8.53 | | | | (0.05 | )5 | | | (0.40 | ) | | | 0.00 | | | | 0.00 | |
October 1, 2007 to September 30, 2008 | | $ | 12.40 | | | | (0.07 | ) | | | (3.70 | ) | | | 0.00 | | | | (0.06 | ) |
January 31, 20078 to September 30, 2007 | | $ | 10.00 | | | | (0.06 | ) | | | 2.46 | | | | 0.00 | | | | 0.00 | |
Institutional Class | | | | | | | | | | | | | | | | | | | | |
June 1, 2012 to November 30, 2012 (unaudited) | | $ | 12.70 | | | | (0.04 | ) | | | 0.19 | | | | 0.00 | | | | 0.00 | |
June 1, 2011 to May 31, 2012 | | $ | 13.33 | | | | (0.08 | )5 | | | (0.55 | ) | | | 0.00 | | | | 0.00 | |
October 1, 2010 to May 31, 20114 | | $ | 9.62 | | | | (0.07 | )5 | | | 3.78 | | | | 0.00 | | | | 0.00 | |
October 1, 2009 to September 30, 2010 | | $ | 8.00 | | | | (0.07 | ) | | | 1.69 | | | | 0.00 | | | | 0.00 | |
October 1, 2008 to September 30, 2009 | | $ | 8.53 | | | | (0.04 | )5 | | | (0.49 | ) | | | 0.00 | | | | 0.00 | |
March 31, 20088 to September 30, 2008 | | $ | 9.43 | | | | (0.03 | ) | | | (0.87 | ) | | | 0.00 | | | | 0.00 | |
Investor Class | | | | | | | | | | | | | | | | | | | | |
June 1, 2012 to November 30, 2012 (unaudited) | | $ | 12.39 | | | | (0.08 | ) | | | 0.20 | | | | 0.00 | | | | 0.00 | |
June 1, 2011 to May 31, 2012 | | $ | 13.07 | | | | (0.15 | )5 | | | (0.53 | ) | | | 0.00 | | | | 0.00 | |
October 1, 2010 to May 31, 20114 | | $ | 9.47 | | | | (0.11 | )5 | | | 3.71 | | | | 0.00 | | | | 0.00 | |
October 1, 2009 to September 30, 2010 | | $ | 7.91 | | | | (0.09 | ) | | | 1.65 | | | | 0.00 | | | | 0.00 | |
October 1, 2008 to September 30, 2009 | | $ | 8.49 | | | | (0.07 | )5 | | | (0.51 | ) | | | 0.00 | | | | 0.00 | |
October 1, 2007 to September 30, 2008 | | $ | 12.38 | | | | (0.13 | ) | | | (3.66 | ) | | | 0.00 | | | | (0.06 | ) |
January 31, 20078 to September 30, 2007 | | $ | 10.00 | | | | (0.05 | ) | | | 2.43 | | | | 0.00 | | | | 0.00 | |
| | | | | |
Equity Value Fund | | | | | | | | | | | | | | | | | | | | |
Class A | | | | | | | | | | | | | | | | | | | | |
June 1, 2012 to November 30, 2012 (unaudited) | | $ | 12.40 | | | | 0.08 | | | | 1.25 | | | | 0.00 | | | | 0.00 | |
June 1, 2011 to May 31, 2012 | | $ | 13.95 | | | | 0.13 | 5 | | | (1.63 | ) | | | (0.05 | ) | | | 0.00 | |
October 1, 2010 to May 31, 20114 | | $ | 11.62 | | | | 0.02 | | | | 2.35 | | | | (0.04 | ) | | | 0.00 | |
October 1, 2009 to September 30, 2010 | | $ | 10.76 | | | | 0.04 | | | | 0.92 | | | | (0.10 | ) | | | 0.00 | |
October 1, 2008 to September 30, 2009 | | $ | 11.79 | | | | 0.12 | 5 | | | (1.03 | ) | | | (0.12 | ) | | | (0.00 | )6 |
October 1, 2007 to September 30, 2008 | | $ | 17.53 | | | | 0.17 | 5 | | | (4.62 | ) | | | (0.12 | ) | | | (1.17 | ) |
October 1, 2006 to September 30, 2007 | | $ | 15.12 | | | | 0.12 | 5 | | | 2.77 | | | | (0.10 | ) | | | (0.38 | ) |
Class B | | | | | | | | | | | | | | | | | | | | |
June 1, 2012 to November 30, 2012 (unaudited) | | $ | 12.26 | | | | 0.02 | 5 | | | 1.25 | | | | 0.00 | | | | 0.00 | |
June 1, 2011 to May 31, 2012 | | $ | 13.85 | | | | 0.04 | 5 | | | (1.62 | ) | | | (0.01 | ) | | | 0.00 | |
October 1, 2010 to May 31, 20114 | | $ | 11.56 | | | | (0.05 | )5 | | | 2.34 | | | | 0.00 | | | | 0.00 | |
October 1, 2009 to September 30, 2010 | | $ | 10.67 | | | | (0.05 | )5 | | | 0.94 | | | | 0.00 | | | | 0.00 | |
October 1, 2008 to September 30, 2009 | | $ | 11.63 | | | | 0.06 | 5 | | | (1.02 | ) | | | 0.00 | | | | (0.00 | )6 |
October 1, 2007 to September 30, 2008 | | $ | 17.31 | | | | 0.06 | 5 | | | (4.57 | ) | | | 0.00 | | | | (1.17 | ) |
October 1, 2006 to September 30, 2007 | | $ | 14.95 | | | | 0.00 | 5,6 | | | 2.74 | | | | 0.00 | | | | (0.38 | ) |
Please see footnotes on page 62.
The accompanying notes are an integral part of these financial statements.
| | | | | | |
| Financial highlights | | Wells Fargo Advantage Equity Gateway Funds | | | 55 | |
| | | | | | | | | | | | | | | | | | | | | | | | | | | | | | |
Distributions
from tax
basis return
of capital | | | Ending
net asset
value
per
share | | | Ratio to average net assets (annualized) | | | Total
return2 | | | Portfolio
turnover
rate3 | | | Net assets at
end of period
(000s omitted) | |
| | | Net investment
income (loss)1 | | | Gross
expenses1 | | | Net
expenses1 | | | | |
| | | | | | | |
| | | | | | | | | | | | | | | | | | | | | | | | | | | | | | | |
| | | | | | | | | | | | | | | | | | | | | | | | | | | | | | |
| | 0.00 | | | $ | 12.13 | | | | (1.76 | )% | | | 2.14 | % | | | 2.12 | % | | | 0.58 | % | | | 32 | % | | $ | 4,585 | |
| | 0.00 | | | $ | 12.06 | | | | (1.89 | )% | | | 2.17 | % | | | 2.12 | % | | | (5.85 | )% | | | 75 | % | | $ | 5,114 | |
| | 0.00 | | | $ | 12.81 | | | | (2.05 | )% | | | 3.83 | % | | | 2.20 | % | | | 37.30 | % | | | 59 | % | | $ | 516 | |
| | 0.00 | | | $ | 9.32 | | | | (1.93 | )% | | | 5.40 | % | | | 2.22 | % | | | 18.85 | % | | | 97 | % | | $ | 58 | |
| | 0.00 | | | $ | 7.85 | | | | (1.84 | )% | | | 7.93 | % | | | 2.20 | % | | | (7.43 | )% | | | 147 | % | | $ | 8 | |
| | 0.00 | | | $ | 8.48 | | | | (1.82 | )% | | | 4.85 | % | | | 2.20 | % | | | (10.07 | )% | | | 191 | % | | $ | 9 | |
| | | | | | | | | | | | | | | | | | | | | | | | | | | | | | |
| | 0.00 | | | $ | 12.70 | | | | (0.83 | )% | | | 1.22 | % | | | 1.20 | % | | | 1.11 | % | | | 32 | % | | $ | 177,080 | |
| | 0.00 | | | $ | 12.56 | | | | (0.95 | )% | | | 1.22 | % | | | 1.19 | % | | | (4.99 | )% | | | 75 | % | | $ | 185,744 | |
| | 0.00 | | | $ | 13.22 | | | | (1.08 | )% | | | 2.41 | % | | | 1.20 | % | | | 38.28 | % | | | 59 | % | | $ | 1,915 | |
| | 0.00 | | | $ | 9.56 | | | | (0.78 | )% | | | 4.54 | % | | | 1.20 | % | | | 19.95 | % | | | 97 | % | | $ | 51 | |
| | 0.00 | | | $ | 8.08 | | | | (0.79 | )% | | | 6.89 | % | | | 1.20 | % | | | (5.28 | )% | | | 147 | % | | $ | 17 | |
| | (0.04 | ) | | $ | 8.53 | | | | (0.76 | )% | | | 3.87 | % | | | 1.20 | % | | | (30.63 | )% | | | 191 | % | | $ | 59 | |
| | 0.00 | | | $ | 12.40 | | | | (0.80 | )% | | | 10.20 | % | | | 1.20 | % | | | 24.00 | % | | | 125 | % | | $ | 18 | |
| | | | | | | | | | | | | | | | | | | | | | | | | | | | | | |
| | 0.00 | | | $ | 12.85 | | | | (0.53 | )% | | | 0.96 | % | | | 0.90 | % | | | 1.26 | % | | | 32 | % | | $ | 499,015 | |
| | 0.00 | | | $ | 12.70 | | | | (0.67 | )% | | | 0.98 | % | | | 0.90 | % | | | (4.73 | )% | | | 75 | % | | $ | 526,865 | |
| | 0.00 | | | $ | 13.33 | | | | (0.82 | )% | | | 1.98 | % | | | 0.95 | % | | | 38.57 | % | | | 59 | % | | $ | 8,170 | |
| | 0.00 | | | $ | 9.62 | | | | (0.67 | )% | | | 4.32 | % | | | 0.95 | % | | | 20.40 | % | | | 97 | % | | $ | 10 | |
| | 0.00 | | | $ | 8.00 | | | | (0.58 | )% | | | 6.74 | % | | | 0.95 | % | | | (6.33 | )% | | | 147 | % | | $ | 8 | |
| | 0.00 | | | $ | 8.53 | | | | (0.56 | )% | | | 3.64 | % | | | 0.95 | % | | | (9.54 | )% | | | 191 | % | | $ | 9 | |
| | | | | | | | | | | | | | | | | | | | | | | | | | | | | | |
| | 0.00 | | | $ | 12.51 | | | | (1.07 | )% | | | 1.45 | % | | | 1.44 | % | | | 0.97 | % | | | 32 | % | | $ | 34,562 | |
| | 0.00 | | | $ | 12.39 | | | | (1.21 | )% | | | 1.52 | % | | | 1.45 | % | | | (5.20 | )% | | | 75 | % | | $ | 36,715 | |
| | 0.00 | | | $ | 13.07 | | | | (1.35 | )% | | | 3.20 | % | | | 1.49 | % | | | 38.01 | % | | | 59 | % | | $ | 15,626 | |
| | 0.00 | | | $ | 9.47 | | | | (1.22 | )% | | | 4.85 | % | | | 1.50 | % | | | 19.72 | % | | | 97 | % | | $ | 3,705 | |
| | 0.00 | | | $ | 7.91 | | | | (1.11 | )% | | | 7.23 | % | | | 1.49 | % | | | (6.83 | )% | | | 147 | % | | $ | 2,862 | |
| | (0.04 | ) | | $ | 8.49 | | | | (1.05 | )% | | | 3.92 | % | | | 1.49 | % | | | (30.84 | )% | | | 191 | % | | $ | 3,665 | |
| | 0.00 | | | $ | 12.38 | | | | (1.12 | )% | | | 5.86 | % | | | 1.49 | % | | | 23.80 | % | | | 125 | % | | $ | 3,242 | |
| | | | | | | |
| | | | | | | | | | | | | | | | | | | | | | | | | | | | | | | |
| | | | | | | | | | | | | | | | | | | | | | | | | | | | | | |
| | 0.00 | | | $ | 13.73 | | | | 1.12 | % | | | 1.24 | % | | | 1.24 | % | | | 10.73 | % | | | 42 | % | | $ | 252,852 | |
| | 0.00 | | | $ | 12.40 | | | | 1.06 | % | | | 1.24 | % | | | 1.24 | % | | | (10.69 | )% | | | 103 | % | | $ | 244,744 | |
| | 0.00 | | | $ | 13.95 | | | | 0.22 | % | | | 1.32 | % | | | 1.25 | % | | | 20.39 | % | | | 90 | % | | $ | 5,141 | |
| | 0.00 | | | $ | 11.62 | | | | 0.32 | % | | | 1.31 | % | | | 1.25 | % | | | 9.07 | % | | | 122 | % | | $ | 4,428 | |
| | 0.00 | | | $ | 10.76 | | | | 1.28 | % | | | 1.37 | % | | | 1.25 | % | | | (7.48 | )% | | | 142 | % | | $ | 4,408 | |
| | 0.00 | | | $ | 11.79 | | | | 1.14 | % | | | 1.36 | % | | | 1.25 | % | | | (27.24 | )% | | | 152 | % | | $ | 4,868 | |
| | 0.00 | | | $ | 17.53 | | | | 0.73 | % | | | 1.35 | % | | | 1.25 | % | | | 19.50 | % | | | 108 | % | | $ | 5,714 | |
| | | | | | | | | | | | | | | | | | | | | | | | | | | | | | |
| | 0.00 | | | $ | 13.53 | | | | 0.36 | % | | | 1.98 | % | | | 1.97 | % | | | 10.36 | % | | | 42 | % | | $ | 2,758 | |
| | 0.00 | | | $ | 12.26 | | | | 0.29 | % | | | 1.99 | % | | | 1.99 | % | | | (11.38 | )% | | | 103 | % | | $ | 3,468 | |
| | 0.00 | | | $ | 13.85 | | | | (0.55 | )% | | | 2.07 | % | | | 2.00 | % | | | 19.81 | % | | | 90 | % | | $ | 381 | |
| | 0.00 | | | $ | 11.56 | | | | (0.44 | )% | | | 2.08 | % | | | 2.00 | % | | | 8.34 | % | | | 122 | % | | $ | 506 | |
| | 0.00 | | | $ | 10.67 | | | | 0.66 | % | | | 2.13 | % | | | 2.00 | % | | | (8.25 | )% | | | 142 | % | | $ | 724 | |
| | 0.00 | | | $ | 11.63 | | | | 0.39 | % | | | 2.11 | % | | | 2.00 | % | | | (27.77 | )% | | | 152 | % | | $ | 1,502 | |
| | 0.00 | | | $ | 17.31 | | | | (0.01 | )% | | | 2.10 | % | | | 2.00 | % | | | 18.61 | % | | | 108 | % | | $ | 3,077 | |
Please see footnotes on page 62.
The accompanying notes are an integral part of these financial statements.
| | | | |
| 56 | | Wells Fargo Advantage Equity Gateway Funds | | Financial highlights |
| | | | | | | | | | | | | | | | | | | | |
| | | Beginning
net asset
value per
share | | | Net
investment
income (loss)1 | | |
Net realized
and unrealized
gains (losses)
on investments | | | Distributions
from net
investment
income | | | Distributions
from net
realized gains | |
| | | | | |
Equity Value Fund (continued) | | | | | | | | | | | | | | | | | | | | |
Class C | | | | | | | | | | | | | | | | | | | | |
June 1, 2012 to November 30, 2012 (unaudited) | | $ | 12.16 | | | | 0.02 | | | | 1.23 | | | | 0.00 | | | | 0.00 | |
June 1, 2011 to May 31, 2012 | | $ | 13.74 | | | | 0.05 | | | | (1.61 | ) | | | (0.02 | ) | | | 0.00 | |
October 1, 2010 to May 31, 20114 | | $ | 11.47 | | | | (0.04 | ) | | | 2.31 | | | | 0.00 | | | | 0.00 | |
October 1, 2009 to September 30, 2010 | | $ | 10.63 | | | | (0.04 | ) | | | 0.90 | | | | (0.02 | ) | | | 0.00 | |
October 1, 2008 to September 30, 2009 | | $ | 11.61 | | | | 0.06 | 5 | | | (1.02 | ) | | | (0.02 | ) | | | (0.00 | )6 |
October 1, 2007 to September 30, 2008 | | $ | 17.29 | | | | 0.05 | 5 | | | (4.56 | ) | | | 0.00 | | | | (1.17 | ) |
October 1, 2006 to September 30, 2007 | | $ | 14.95 | | | | 0.00 | 5, 6 | | | 2.74 | | | | (0.02 | ) | | | (0.38 | ) |
Class R | | | | | | | | | | | | | | | | | | | | |
June 1, 2012 to November 30, 2012 (unaudited) | | $ | 12.62 | | | | 0.06 | 5 | | | 1.28 | | | | 0.00 | | | | 0.00 | |
August 26, 20118 to May 31, 2012 | | $ | 11.69 | | | | 0.08 | 5 | | | 0.89 | | | | (0.04 | ) | | | 0.00 | |
Administrator Class | | | | | | | | | | | | | | | | | | | | |
June 1, 2012 to November 30, 2012 (unaudited) | | $ | 12.65 | | | | 0.09 | 5 | | | 1.28 | | | | 0.00 | | | | 0.00 | |
June 1, 2011 to May 31, 2012 | | $ | 14.21 | | | | 0.16 | 5 | | | (1.66 | ) | | | (0.06 | ) | | | 0.00 | |
October 1, 2010 to May 31, 20114 | | $ | 11.84 | | | | 0.05 | | | | 2.39 | | | | (0.07 | ) | | | 0.00 | |
October 1, 2009 to September 30, 2010 | | $ | 10.94 | | | | 0.06 | 5 | | | 0.96 | | | | (0.12 | ) | | | 0.00 | |
October 1, 2008 to September 30, 2009 | | $ | 12.01 | | | | 0.15 | 5 | | | (1.06 | ) | | | (0.16 | ) | | | (0.00 | )6 |
October 1, 2007 to September 30, 2008 | | $ | 17.82 | | | | 0.20 | 5 | | | (4.70 | ) | | | (0.14 | ) | | | (1.17 | ) |
October 1, 2006 to September 30, 2007 | | $ | 15.36 | | | | 0.16 | 5 | | | 2.82 | | | | (0.14 | ) | | | (0.38 | ) |
Institutional Class | | | | | | | | | | | | | | | | | | | | |
June 1, 2012 to November 30, 2012 (unaudited) | | $ | 12.65 | | | | 0.10 | | | | 1.27 | | | | 0.00 | | | | 0.00 | |
June 1, 2011 to May 31, 2012 | | $ | 14.20 | | | | 0.17 | | | | (1.64 | ) | | | (0.08 | ) | | | 0.00 | |
October 1, 2010 to May 31, 20114 | | $ | 11.84 | | | | 0.06 | 5 | | | 2.40 | | | | (0.10 | ) | | | 0.00 | |
October 1, 2009 to September 30, 2010 | | $ | 10.95 | | | | 0.09 | | | | 0.95 | | | | (0.15 | ) | | | 0.00 | |
October 1, 2008 to September 30, 2009 | | $ | 12.03 | | | | 0.17 | 5 | | | (1.06 | ) | | | (0.19 | ) | | | (0.00 | )6 |
October 1, 2007 to September 30, 2008 | | $ | 17.84 | | | | 0.24 | 5 | | | (4.70 | ) | | | (0.18 | ) | | | (1.17 | ) |
October 1, 2006 to September 30, 2007 | | $ | 15.36 | | | | 0.19 | 5 | | | 2.82 | | | | (0.15 | ) | | | (0.38 | ) |
| | | | | |
Index Fund | | | | | | | | | | | | | | | | | | | | |
Class A | | | | | | | | | | | | | | | | | | | | |
June 1, 2012 to November 30, 2012 (unaudited) | | $ | 44.25 | | | | 0.41 | 5 | | | 3.59 | | | | 0.00 | | | | 0.00 | |
June 1, 2011 to May 31, 2012 | | $ | 47.17 | | | | 0.73 | | | | (1.35 | ) | | | (0.65 | ) | | | (1.65 | ) |
August 1, 2010 to May 31, 20119 | | $ | 40.42 | | | | 0.56 | | | | 8.77 | | | | (0.70 | ) | | | (1.88 | ) |
August 1, 2009 to July 31, 201010 | | $ | 41.72 | | | | 0.64 | | | | 4.89 | | | | (0.63 | ) | | | (6.20 | ) |
August 1, 2008 to July 31, 200910 | | $ | 56.53 | | | | 0.91 | | | | (12.80 | ) | | | (0.91 | ) | | | (2.01 | ) |
August 1, 2007 to July 31, 200810 | | $ | 65.01 | | | | 1.04 | | | | (8.50 | ) | | | (1.02 | ) | | | 0.00 | |
August 1, 2006 to July 31, 200710 | | $ | 57.04 | | | | 0.86 | | | | 7.96 | | | | (0.85 | ) | | | 0.00 | |
Class B | | | | | | | | | | | | | | | | | | | | |
June 1, 2012 to November 30, 2012 (unaudited) | | $ | 44.53 | | | | 0.23 | 5 | | | 3.61 | | | | 0.00 | | | | 0.00 | |
June 1, 2011 to May 31, 2012 | | $ | 47.23 | | | | 0.38 | 5 | | | (1.29 | ) | | | (0.14 | ) | | | (1.65 | ) |
August 1, 2010 to May 31, 20119 | | $ | 40.32 | | | | 0.29 | 5 | | | 8.76 | | | | (0.26 | ) | | | (1.88 | ) |
August 1, 2009 to July 31, 201010 | | $ | 41.63 | | | | 0.28 | | | | 4.88 | | | | (0.27 | ) | | | (6.20 | ) |
August 1, 2008 to July 31, 200910 | | $ | 56.42 | | | | 0.63 | 5 | | | (12.82 | ) | | | (0.59 | ) | | | (2.01 | ) |
August 1, 2007 to July 31, 200810 | | $ | 64.86 | | | | 0.57 | 5 | | | (8.48 | ) | | | (0.53 | ) | | | 0.00 | |
August 1, 2006 to July 31, 200710 | | $ | 56.90 | | | | 0.41 | 5 | | | 7.91 | | | | (0.36 | ) | | | 0.00 | |
Class C | | | | | | | | | | | | | | | | | | | | |
June 1, 2012 to November 30, 2012 (unaudited) | | $ | 44.41 | | | | 0.23 | 5 | | | 3.60 | | | | 0.00 | | | | 0.00 | |
June 1, 2011 to May 31, 2012 | | $ | 47.27 | | | | 0.39 | 5 | | | (1.31 | ) | | | (0.29 | ) | | | (1.65 | ) |
August 1, 2010 to May 31, 20119 | | $ | 40.32 | | | | 0.27 | | | | 8.78 | | | | (0.22 | ) | | | (1.88 | ) |
August 1, 2009 to July 31, 201010 | | $ | 41.62 | | | | 0.30 | | | | 4.88 | | | | (0.28 | ) | | | (6.20 | ) |
August 1, 2008 to July 31, 200910 | | $ | 56.36 | | | | 0.59 | | | | (12.76 | ) | | | (0.56 | ) | | | (2.01 | ) |
August 1, 2007 to July 31, 200810 | | $ | 64.80 | | | | 0.55 | | | | (8.44 | ) | | | (0.55 | ) | | | 0.00 | |
August 1, 2006 to July 31, 200710 | | $ | 56.87 | | | | 0.40 | 5 | | | 7.90 | | | | (0.37 | ) | | | 0.00 | |
Please see footnotes on page 62.
The accompanying notes are an integral part of these financial statements.
| | | | | | |
| Financial highlights | | Wells Fargo Advantage Equity Gateway Funds | | | 57 | |
| | | | | | | | | | | | | | | | | | | | | | | | | | |
Ending
net asset
value
per
share | | | Ratio to average net assets (annualized) | | | Total
return2 | | | Portfolio
turnover
rate3 | | | Net assets at
end of period
(000s omitted) | |
| | Net investment
income (loss)1 | | | Gross
expenses1 | | | Net
expenses1 | | | | |
| | | | | | |
| | | | | | | | | | | | | | | | | | | | | | | | | | | |
| | | | | | | | | | | | | | | | | | | | | | | | | | |
| $ | 13.41 | | | | 0.37 | % | | | 1.99 | % | | | 1.99 | % | | | 10.28 | % | | | 42 | % | | $ | 10,424 | |
| $ | 12.16 | | | | 0.29 | % | | | 1.99 | % | | | 1.99 | % | | | (11.37 | )% | | | 103 | % | | $ | 9,579 | |
| $ | 13.74 | | | | (0.52 | )% | | | 2.08 | % | | | 2.00 | % | | | 19.79 | % | | | 90 | % | | $ | 1,021 | |
| $ | 11.47 | | | | (0.45 | )% | | | 2.08 | % | | | 2.00 | % | | | 8.09 | % | | | 122 | % | | $ | 606 | |
| $ | 10.63 | | | | 0.63 | % | | | 2.13 | % | | | 2.00 | % | | | (8.18 | )% | | | 142 | % | | $ | 647 | |
| $ | 11.61 | | | | 0.38 | % | | | 2.10 | % | | | 2.00 | % | | | (27.80 | )% | | | 152 | % | | $ | 997 | |
| $ | 17.29 | | | | (0.01 | )% | | | 2.10 | % | | | 2.00 | % | | | 18.60 | % | | | 108 | % | | $ | 974 | |
| | | | | | | | | | | | | | | | | | | | | | | | | | |
| $ | 13.96 | | | | 0.88 | % | | | 1.49 | % | | | 1.48 | % | | | 10.62 | % | | | 42 | % | | $ | 218 | |
| $ | 12.62 | | | | 0.82 | % | | | 1.49 | % | | | 1.49 | % | | | 8.37 | % | | | 103 | % | | $ | 184 | |
| | | | | | | | | | | | | | | | | | | | | | | | | | |
| $ | 14.02 | | | | 1.34 | % | | | 1.08 | % | | | 1.00 | % | | | 10.92 | % | | | 42 | % | | $ | 432,167 | |
| $ | 12.65 | | | | 1.25 | % | | | 1.08 | % | | | 1.00 | % | | | (10.58 | )% | | | 103 | % | | $ | 462,670 | |
| $ | 14.21 | | | | 0.47 | % | | | 1.16 | % | | | 1.00 | % | | | 20.62 | % | | | 90 | % | | $ | 123,303 | |
| $ | 11.84 | | | | 0.56 | % | | | 1.14 | % | | | 1.00 | % | | | 9.40 | % | | | 122 | % | | $ | 121,656 | |
| $ | 10.94 | | | | 1.58 | % | | | 1.19 | % | | | 1.00 | % | | | (7.24 | )% | | | 142 | % | | $ | 156,382 | |
| $ | 12.01 | | | | 1.37 | % | | | 1.16 | % | | | 1.00 | % | | | (27.05 | )% | | | 152 | % | | $ | 183,379 | |
| $ | 17.82 | | | | 0.98 | % | | | 1.17 | % | | | 1.00 | % | | | 19.80 | % | | | 108 | % | | $ | 85,370 | |
| | | | | | | | | | | | | | | | | | | | | | | | | | |
| $ | 14.02 | | | | 1.47 | % | | | 0.81 | % | | | 0.75 | % | | | 10.75 | % | | | 42 | % | | $ | 10,297 | |
| $ | 12.65 | | | | 1.40 | % | | | 0.82 | % | | | 0.75 | % | | | (10.30 | )% | | | 103 | % | | $ | 108,087 | |
| $ | 14.20 | | | | 0.72 | % | | | 0.90 | % | | | 0.75 | % | | | 20.84 | % | | | 90 | % | | $ | 96,750 | |
| $ | 11.84 | | | | 0.82 | % | | | 0.88 | % | | | 0.75 | % | | | 9.65 | % | | | 122 | % | | $ | 73,445 | |
| $ | 10.95 | | | | 1.82 | % | | | 0.93 | % | | | 0.75 | % | | | (7.13 | )% | | | 142 | % | | $ | 60,014 | |
| $ | 12.03 | | | | 1.63 | % | | | 0.91 | % | | | 0.75 | % | | | (26.84 | )% | | | 152 | % | | $ | 64,824 | |
| $ | 17.84 | | | | 1.13 | % | | | 0.90 | % | | | 0.75 | % | | | 20.01 | % | | | 108 | % | | $ | 62,639 | |
| | | | | | |
| | | | | | | | | | | | | | | | | | | | | | | | | | | |
| | | | | | | | | | | | | | | | | | | | | | | | | | |
| $ | 48.25 | | | | 1.73 | % | | | 0.67 | % | | | 0.56 | % | | | 9.04 | % | | | 2 | % | | $ | 361,791 | |
| $ | 44.25 | | | | 1.63 | % | | | 0.68 | % | | | 0.56 | % | | | (0.95 | )% | | | 9 | % | | $ | 347,412 | |
| $ | 47.17 | | | | 1.53 | % | | | 0.67 | % | | | 0.56 | % | | | 23.66 | % | | | 3 | % | | $ | 388,113 | |
| $ | 40.42 | | | | 1.49 | % | | | 1.00 | % | | | 0.60 | % | | | 13.29 | % | | | 7 | % | | $ | 358,953 | |
| $ | 41.72 | | | | 2.22 | % | | | 1.05 | % | | | 0.52 | % | | | (20.30 | )% | | | 6 | % | | $ | 172,687 | |
| $ | 56.53 | | | | 1.64 | % | | | 0.90 | % | | | 0.50 | % | | | (11.60 | )% | | | 7 | % | | $ | 262,336 | |
| $ | 65.01 | | | | 1.35 | % | | | 0.88 | % | | | 0.57 | % | | | 15.51 | % | | | 14 | % | | $ | 366,413 | |
| | | | | | | | | | | | | | | | | | | | | | | | | | |
| $ | 48.37 | | | | 0.94 | % | | | 1.42 | % | | | 1.31 | % | | | 8.62 | % | | | 2 | % | | $ | 6,820 | |
| $ | 44.53 | | | | 0.85 | % | | | 1.43 | % | | | 1.31 | % | | | (1.68 | )% | | | 9 | % | | $ | 8,869 | |
| $ | 47.23 | | | | 0.78 | % | | | 1.42 | % | | | 1.31 | % | | | 22.90 | % | | | 3 | % | | $ | 19,894 | |
| $ | 40.32 | | | | 0.69 | % | | | 1.76 | % | | | 1.35 | % | | | 12.44 | % | | | 7 | % | | $ | 26,295 | |
| $ | 41.63 | | | | 1.51 | % | | | 1.79 | % | | | 1.26 | % | | | (20.91 | )% | | | 6 | % | | $ | 28,008 | |
| $ | 56.42 | | | | 0.89 | % | | | 1.66 | % | | | 1.26 | % | | | (12.26 | )% | | | 7 | % | | $ | 68,025 | |
| $ | 64.86 | | | | 0.65 | % | | | 1.63 | % | | | 1.32 | % | | | 14.65 | % | | | 14 | % | | $ | 113,488 | |
| | | | | | | | | | | | | | | | | | | | | | | | | | |
| $ | 48.24 | | | | 0.97 | % | | | 1.42 | % | | | 1.31 | % | | | 8.62 | % | | | 2 | % | | $ | 64,646 | |
| $ | 44.41 | | | | 0.87 | % | | | 1.43 | % | | | 1.31 | % | | | (1.67 | )% | | | 9 | % | | $ | 65,245 | |
| $ | 47.27 | | | | 0.78 | % | | | 1.42 | % | | | 1.31 | % | | | 22.89 | % | | | 3 | % | | $ | 80,981 | |
| $ | 40.32 | | | | 0.68 | % | | | 1.76 | % | | | 1.35 | % | | | 12.44 | % | | | 7 | % | | $ | 81,848 | |
| $ | 41.62 | | | | 1.48 | % | | | 1.80 | % | | | 1.27 | % | | | (20.91 | )% | | | 6 | % | | $ | 89,159 | |
| $ | 56.36 | | | | 0.89 | % | | | 1.65 | % | | | 1.25 | % | | | (12.25 | )% | | | 7 | % | | $ | 137,044 | |
| $ | 64.80 | | | | 0.63 | % | | | 1.63 | % | | | 1.32 | % | | | 14.63 | % | | | 14 | % | | $ | 175,657 | |
Please see footnotes on page 62.
The accompanying notes are an integral part of these financial statements.
| | | | |
| 58 | | Wells Fargo Advantage Equity Gateway Funds | | Financial highlights |
| | | | | | | | | | | | | | | | | | | | |
| | | Beginning
net asset
value per
share | | | Net
investment
income1 | | |
Net realized
and unrealized
gains (losses) on investments | | | Distributions
from net
investment
income | | | Distributions from net realized gains | |
| | | | | |
Index Fund (continued) | | | | | | | | | | | | | | | | | | | | |
Administrator Class | | | | | | | | | | | | | | | | | | | | |
June 1, 2012 to November 30, 2012 (unaudited) | | $ | 44.52 | | | | 0.50 | | | | 3.60 | | | | 0.00 | | | | 0.00 | |
June 1, 2011 to May 31, 2012 | | $ | 47.45 | | | | 0.83 | | | | (1.32 | ) | | | (0.79 | ) | | | (1.65 | ) |
August 1, 2010 to May 31, 20119 | | $ | 40.56 | | | | 0.67 | | | | 8.82 | | | | (0.72 | ) | | | (1.88 | ) |
August 1, 2009 to July 31, 201010 | | $ | 41.88 | | | | 0.87 | 5 | | | 4.76 | | | | (0.75 | ) | | | (6.20 | ) |
August 1, 2008 to July 31, 200910 | | $ | 56.88 | | | | 1.02 | 5 | | | (12.90 | ) | | | (1.11 | ) | | | (2.01 | ) |
August 1, 2007 to July 31, 200810 | | $ | 65.42 | | | | 1.20 | 5 | | | (8.54 | ) | | | (1.20 | ) | | | 0.00 | |
August 1, 2006 to July 31, 200710 | | $ | 57.40 | | | | 1.02 | | | | 8.01 | | | | (1.01 | ) | | | 0.00 | |
Investor Class | | | | | | | | | | | | | | | | | | | | |
June 1, 2012 to November 30, 2012 (unaudited) | | $ | 44.38 | | | | 0.45 | | | | 3.59 | | | | 0.00 | | | | 0.00 | |
June 1, 2011 to May 31, 2012 | | $ | 47.30 | | | | 0.77 | | | | (1.33 | ) | | | (0.71 | ) | | | (1.65 | ) |
August 1, 2010 to May 31, 20119 | | $ | 40.48 | | | | 0.60 | | | | 8.80 | | | | (0.70 | ) | | | (1.88 | ) |
July 16, 20108,11 to July 31, 2010 | | $ | 39.19 | | | | 0.03 | | | | 1.26 | | | | 0.00 | | | | 0.00 | |
| | | | | |
International Value Fund | | | | | | | | | | | | | | | | | | | | |
Class A | | | | | | | | | | | | | | | | | | | | |
June 1, 2012 to November 30, 2012 (unaudited) | | $ | 10.64 | | | | 0.08 | | | | 1.70 | | | | 0.00 | | | | 0.00 | |
June 1, 2011 to May 31, 2012 | | $ | 14.03 | | | | 0.34 | | | | (3.36 | ) | | | (0.37 | ) | | | 0.00 | |
October 1, 2010 to May 31, 20114 | | $ | 12.58 | | | | 0.22 | 5 | | | 1.46 | | | | (0.23 | ) | | | 0.00 | |
October 1, 2009 to September 30, 2010 | | $ | 12.67 | | | | 0.23 | 5 | | | (0.17 | ) | | | (0.15 | ) | | | 0.00 | |
October 1, 2008 to September 30, 2009 | | $ | 12.66 | | | | 0.23 | 5 | | | 0.22 | | | | (0.44 | ) | | | 0.00 | |
October 1, 2007 to September 30, 2008 | | $ | 20.21 | | | | 0.51 | 5 | | | (7.24 | ) | | | (0.36 | ) | | | (0.46 | ) |
October 1, 2006 to September 30, 2007 | | $ | 16.75 | | | | 0.48 | 5 | | | 3.07 | | | | (0.08 | ) | | | (0.01 | ) |
Class B | | | | | | | | | | | | | | | | | | | | |
June 1, 2012 to November 30, 2012 (unaudited) | | $ | 10.60 | | | | 0.04 | 5 | | | 1.69 | | | | 0.00 | | | | 0.00 | |
June 1, 2011 to May 31, 2012 | | $ | 13.94 | | | | 0.21 | 5 | | | (3.29 | ) | | | (0.26 | ) | | | 0.00 | |
October 1, 2010 to May 31, 20114 | | $ | 12.42 | | | | 0.11 | 5 | | | 1.49 | | | | (0.08 | ) | | | 0.00 | |
October 1, 2009 to September 30, 2010 | | $ | 12.57 | | | | 0.12 | 5 | | | (0.14 | ) | | | (0.13 | ) | | | 0.00 | |
October 1, 2008 to September 30, 2009 | | $ | 12.42 | | | | 0.14 | 5 | | | 0.25 | | | | (0.24 | ) | | | 0.00 | |
October 1, 2007 to September 30, 2008 | | $ | 19.82 | | | | 0.38 | 5 | | | (7.11 | ) | | | (0.21 | ) | | | (0.46 | ) |
October 1, 2006 to September 30, 2007 | | $ | 16.55 | | | | 0.27 | 5 | | | 3.09 | | | | (0.08 | ) | | | (0.01 | ) |
Class C | | | | | | | | | | | | | | | | | | | | |
June 1, 2012 to November 30, 2012 (unaudited) | | $ | 10.47 | | | | 0.03 | | | | 1.68 | | | | 0.00 | | | | 0.00 | |
June 1, 2011 to May 31, 2012 | | $ | 13.79 | | | | 0.23 | 5 | | | (3.28 | ) | | | (0.27 | ) | | | 0.00 | |
October 1, 2010 to May 31, 20114 | | $ | 12.33 | | | | 0.15 | 5 | | | 1.44 | | | | (0.13 | ) | | | 0.00 | |
October 1, 2009 to September 30, 2010 | | $ | 12.51 | | | | 0.15 | | | | (0.18 | ) | | | (0.15 | ) | | | 0.00 | |
October 1, 2008 to September 30, 2009 | | $ | 12.44 | | | | 0.15 | 5 | | | 0.23 | | | | (0.31 | ) | | | 0.00 | |
October 1, 2007 to September 30, 2008 | | $ | 19.90 | | | | 0.38 | 5 | | | (7.13 | ) | | | (0.25 | ) | | | (0.46 | ) |
October 1, 2006 to September 30, 2007 | | $ | 16.54 | | | | 0.30 | 5 | | | 3.07 | | | | 0.00 | | | | (0.01 | ) |
Administrator Class | | | | | | | | | | | | | | | | | | | | |
June 1, 2012 to November 30, 2012 (unaudited) | | $ | 10.57 | | | | 0.09 | | | | 1.69 | | | | 0.00 | | | | 0.00 | |
June 1, 2011 to May 31, 2012 | | $ | 13.95 | | | | 0.35 | | | | (3.33 | ) | | | (0.40 | ) | | | 0.00 | |
October 1, 2010 to May 31, 20114 | | $ | 12.52 | | | | 0.24 | 5 | | | 1.46 | | | | (0.27 | ) | | | 0.00 | |
October 1, 2009 to September 30, 2010 | | $ | 12.68 | | | | 0.25 | | | | (0.15 | ) | | | (0.26 | ) | | | 0.00 | |
October 1, 2008 to September 30, 2009 | | $ | 12.69 | | | | 0.25 | 5 | | | 0.20 | | | | (0.46 | ) | | | 0.00 | |
October 1, 2007 to September 30, 2008 | | $ | 20.23 | | | | 0.58 | 5 | | | (7.27 | ) | | | (0.39 | ) | | | (0.46 | ) |
October 1, 2006 to September 30, 2007 | | $ | 16.65 | | | | 0.44 | 5 | | | 3.15 | | | | 0.00 | | | | (0.01 | ) |
Please see footnotes on page 62.
The accompanying notes are an integral part of these financial statements.
| | | | | | |
| Financial highlights | | Wells Fargo Advantage Equity Gateway Funds | | | 59 | |
| | | | | | | | | | | | | | | | | | | | | | | | | | |
Ending
net asset
value
per
share | | | Ratio to average net assets (annualized) | | | Total
return2 | | | Portfolio
turnover
rate3 | | | Net assets at
end of period
(000s omitted) | |
| | Net investment
income1 | | | Gross
expenses1 | | | Net
expenses1 | | | | |
| | | | | | |
| | | | | | | | | | | | | | | | | | | | | | | | | | | |
| | | | | | | | | | | | | | | | | | | | | | | | | | |
| $ | 48.62 | | | | 2.04 | % | | | 0.36 | % | | | 0.25 | % | | | 9.21 | % | | | 2 | % | | $ | 1,799,454 | |
| $ | 44.52 | | | | 1.94 | % | | | 0.37 | % | | | 0.25 | % | | | (0.63 | )% | | | 9 | % | | $ | 1,682,905 | |
| $ | 47.45 | | | | 1.84 | % | | | 0.37 | % | | | 0.25 | % | | | 23.98 | % | | | 3 | % | | $ | 1,709,455 | |
| $ | 40.56 | | | | 1.94 | % | | | 0.63 | % | | | 0.31 | % | | | 13.55 | % | | | 7 | % | | $ | 1,404,098 | |
| $ | 41.88 | | | | 2.49 | % | | | 0.80 | % | | | 0.27 | % | | | (20.09 | )% | | | 6 | % | | $ | 115,745 | |
| $ | 56.88 | | | | 1.89 | % | | | 0.65 | % | | | 0.25 | % | | | (11.37 | )% | | | 7 | % | | $ | 212,661 | |
| $ | 65.42 | | | | 1.62 | % | | | 0.63 | % | | | 0.32 | % | | | 15.80 | % | | | 14 | % | | $ | 340,321 | |
| | | | | | | | | | | | | | | | | | | | | | | | | | |
| $ | 48.42 | | | | 1.84 | % | | | 0.73 | % | | | 0.45 | % | | | 9.10 | % | | | 2 | % | | $ | 128,841 | |
| $ | 44.38 | | | | 1.74 | % | | | 0.75 | % | | | 0.45 | % | | | (0.82 | )% | | | 9 | % | | $ | 118,982 | |
| $ | 47.30 | | | | 1.64 | % | | | 0.74 | % | | | 0.45 | % | | | 23.78 | % | | | 3 | % | | $ | 131,141 | |
| $ | 40.48 | | | | 2.13 | % | | | 0.79 | % | | | 0.45 | % | | | 3.29 | % | | | 7 | % | | $ | 111,126 | |
| | | | | | |
| | | | | | | | | | | | | | | | | | | | | | | | | | | |
| | | | | | | | | | | | | | | | | | | | | | | | | | |
| $ | 12.42 | | | | 1.38 | % | | | 1.51 | % | | | 1.50 | % | | | 16.73 | % | | | 9 | % | | $ | 5,532 | |
| $ | 10.64 | | | | 2.81 | % | | | 1.46 | % | | | 1.46 | % | | | (21.53 | )% | | | 9 | % | | $ | 4,742 | |
| $ | 14.03 | | | | 2.41 | % | | | 1.55 | % | | | 1.47 | % | | | 13.55 | % | | | 16 | % | | $ | 6,213 | |
| $ | 12.58 | | | | 1.92 | % | | | 1.69 | % | | | 1.46 | % | | | 0.52 | % | | | 27 | % | | $ | 6,792 | |
| $ | 12.67 | | | | 2.28 | % | | | 1.68 | % | | | 1.50 | % | | | 4.82 | % | | | 41 | % | | $ | 8,769 | |
| $ | 12.66 | | | | 3.04 | % | | | 1.74 | % | | | 1.50 | % | | | (34.48 | )% | | | 23 | % | | $ | 16,903 | |
| $ | 20.21 | | | | 2.45 | % | | | 1.64 | % | | | 1.50 | % | | | 21.20 | % | | | 19 | % | | $ | 25,445 | |
| | | | | | | | | | | | | | | | | | | | | | | | | | |
| $ | 12.33 | | | | 0.61 | % | | | 2.26 | % | | | 2.25 | % | | | 16.32 | % | | | 9 | % | | $ | 80 | |
| $ | 10.60 | | | | 1.79 | % | | | 2.21 | % | | | 2.21 | % | | | (22.15 | )% | | | 9 | % | | $ | 110 | |
| $ | 13.94 | | | | 1.28 | % | | | 2.32 | % | | | 2.22 | % | | | 12.97 | % | | | 16 | % | | $ | 194 | |
| $ | 12.42 | | | | 0.99 | % | | | 2.44 | % | | | 2.21 | % | | | (0.16 | )% | | | 27 | % | | $ | 339 | |
| $ | 12.57 | | | | 1.39 | % | | | 2.44 | % | | | 2.25 | % | | | 3.82 | % | | | 41 | % | | $ | 581 | |
| $ | 12.42 | | | | 2.24 | % | | | 2.49 | % | | | 2.25 | % | | | (34.97 | )% | | | 23 | % | | $ | 951 | |
| $ | 19.82 | | | | 1.43 | % | | | 2.40 | % | | | 2.25 | % | | | 20.32 | % | | | 19 | % | | $ | 2,512 | |
| | | | | | | | | | | | | | | | | | | | | | | | | | |
| $ | 12.18 | | | | 0.63 | % | | | 2.26 | % | | | 2.25 | % | | | 16.33 | % | | | 9 | % | | $ | 522 | |
| $ | 10.47 | | | | 1.96 | % | | | 2.21 | % | | | 2.21 | % | | | (22.14 | )% | | | 9 | % | | $ | 441 | |
| $ | 13.79 | | | | 1.75 | % | | | 2.30 | % | | | 2.22 | % | | | 13.00 | % | | | 16 | % | | $ | 665 | |
| $ | 12.33 | | | | 1.11 | % | | | 2.45 | % | | | 2.21 | % | | | (0.21 | )% | | | 27 | % | | $ | 665 | |
| $ | 12.51 | | | | 1.56 | % | | | 2.43 | % | | | 2.25 | % | | | 3.90 | % | | | 41 | % | | $ | 791 | |
| $ | 12.44 | | | | 2.29 | % | | | 2.46 | % | | | 2.25 | % | | | (34.99 | )% | | | 23 | % | | $ | 799 | |
| $ | 19.90 | | | | 1.54 | % | | | 2.40 | % | | | 2.25 | % | | | 20.36 | % | | | 19 | % | | $ | 1,305 | |
| | | | | | | | | | | | | | | | | | | | | | | | | | |
| $ | 12.35 | | | | 1.58 | % | | | 1.34 | % | | | 1.25 | % | | | 16.84 | % | | | 9 | % | | $ | 329,383 | |
| $ | 10.57 | | | | 3.04 | % | | | 1.29 | % | | | 1.25 | % | | | (21.37 | )% | | | 9 | % | | $ | 259,969 | |
| $ | 13.95 | | | | 2.84 | % | | | 1.38 | % | | | 1.25 | % | | | 13.73 | % | | | 16 | % | | $ | 313,423 | |
| $ | 12.52 | | | | 2.26 | % | | | 1.53 | % | | | 1.21 | % | | | 0.80 | % | | | 27 | % | | $ | 259,768 | |
| $ | 12.68 | | | | 2.50 | % | | | 1.50 | % | | | 1.25 | % | | | 4.89 | % | | | 41 | % | | $ | 231,537 | |
| $ | 12.69 | | | | 3.50 | % | | | 1.56 | % | | | 1.25 | % | | | (34.30 | )% | | | 23 | % | | $ | 206,603 | |
| $ | 20.23 | | | | 2.29 | % | | | 1.47 | % | | | 1.25 | % | | | 21.55 | % | | | 19 | % | | $ | 263,305 | |
Please see footnotes on page 62.
The accompanying notes are an integral part of these financial statements.
| | | | |
| 60 | | Wells Fargo Advantage Equity Gateway Funds | | Financial highlights |
| | | | | | | | | | | | | | | | | | | | |
| | | Beginning
net asset
value per
share | | | Net
investment
income (loss)1 | | |
Net realized
and unrealized
gains (losses) on
investments | | | Distributions
from net
investment
income | | | Distributions
from net
realized gains | |
| | | | | |
International Value Fund (continued) | | | | | | | | | | | | | | | | | | | | |
Institutional Class | | | | | | | | | | | | | | | | | | | | |
June 1, 2012 to November 30, 2012 (unaudited) | | $ | 10.58 | | | | 0.11 | | | | 1.69 | | | | 0.00 | | | | 0.00 | |
June 1, 2011 to May 31, 2012 | | $ | 13.98 | | | | 0.36 | | | | (3.33 | ) | | | (0.43 | ) | | | 0.00 | |
October 1, 2010 to May 31, 20114 | | $ | 12.58 | | | | 0.28 | | | | 1.44 | | | | (0.32 | ) | | | 0.00 | |
October 1, 2009 to September 30, 2010 | | $ | 12.71 | | | | 0.32 | | | | (0.20 | ) | | | (0.25 | ) | | | 0.00 | |
October 1, 2008 to September 30, 2009 | | $ | 12.72 | | | | 0.28 | 5 | | | 0.20 | | | | (0.49 | ) | | | 0.00 | |
October 1, 2007 to September 30, 2008 | | $ | 20.28 | | | | 0.62 | 5 | | | (7.31 | ) | | | (0.41 | ) | | | (0.46 | ) |
October 1, 2006 to September 30, 2007 | | $ | 16.67 | | | | 0.46 | 5 | | | 3.16 | | | | 0.00 | | | | (0.01 | ) |
| | | | | |
Small Company Growth Fund | | | | | | | | | | | | | | | | | | | | |
Class A | | | | | | | | | | | | | | | | | | | | |
June 1, 2012 to November 30, 2012 (unaudited) | | $ | 26.21 | | | | (0.07 | )5 | | | 2.01 | | | | 0.00 | | | | 0.00 | |
June 1, 2011 to May 31, 2012 | | $ | 29.53 | | | | (0.18 | )5 | | | (3.14 | ) | | | 0.00 | | | | 0.00 | |
October 1, 2010 to May 31, 20114 | | $ | 21.23 | | | | (0.15 | ) | | | 8.45 | | | | 0.00 | | | | 0.00 | |
October 1, 2009 to September 30, 2010 | | $ | 18.56 | | | | (0.21 | )5 | | | 2.88 | | | | 0.00 | | | | 0.00 | |
October 1, 2008 to September 30, 2009 | | $ | 18.38 | | | | (0.17 | )5 | | | 0.35 | | | | 0.00 | | | | 0.00 | |
October 1, 2007 to September 30, 2008 | | $ | 30.20 | | | | (0.24 | )5 | | | (7.24 | ) | | | 0.00 | | | | (4.17 | ) |
October 1, 2006 to September 30, 2007 | | $ | 30.50 | | | | (0.29 | )5 | | | 5.04 | | | | 0.00 | | | | (5.05 | ) |
Class B | | | | | | | | | | | | | | | | | | | | |
June 1, 2012 to November 30, 2012 (unaudited) | | $ | 24.35 | | | | (0.17 | )5 | | | 1.86 | | | | 0.00 | | | | 0.00 | |
June 1, 2011 to May 31, 2012 | | $ | 27.63 | | | | (0.37 | )5 | | | (2.91 | ) | | | 0.00 | | | | 0.00 | |
October 1, 2010 to May 31, 20114 | | $ | 19.97 | | | | (0.29 | )5 | | | 7.95 | | | | 0.00 | | | | 0.00 | |
October 1, 2009 to September 30, 2010 | | $ | 17.58 | | | | (0.34 | )5 | | | 2.73 | | | | 0.00 | | | | 0.00 | |
October 1, 2008 to September 30, 2009 | | $ | 17.55 | | | | (0.25 | )5 | | | 0.28 | | | | 0.00 | | | | 0.00 | |
October 1, 2007 to September 30, 2008 | | $ | 29.24 | | | | (0.40 | )5 | | | (6.95 | ) | | | 0.00 | | | | (4.17 | ) |
October 1, 2006 to September 30, 2007 | | $ | 29.87 | | | | (0.50 | )5 | | | 4.92 | | | | 0.00 | | | | (5.05 | ) |
Class C | | | | | | | | | | | | | | | | | | | | |
June 1, 2012 to November 30, 2012 (unaudited) | | $ | 24.62 | | | | (0.17 | ) | | | 1.89 | | | | 0.00 | | | | 0.00 | |
June 1, 2011 to May 31, 2012 | | $ | 27.95 | | | | (0.36 | )5 | | | (2.97 | ) | | | 0.00 | | | | 0.00 | |
October 1, 2010 to May 31, 20114 | | $ | 20.19 | | | | (0.30 | )5 | | | 8.06 | | | | 0.00 | | | | 0.00 | |
October 1, 2009 to September 30, 2010 | | $ | 17.77 | | | | (0.34 | )5 | | | 2.76 | | | | 0.00 | | | | 0.00 | |
October 1, 2008 to September 30, 2009 | | $ | 17.73 | | | | (0.26 | )5 | | | 0.30 | | | | 0.00 | | | | 0.00 | |
October 1, 2007 to September 30, 2008 | | $ | 29.49 | | | | (0.39 | )5 | | | (7.03 | ) | | | 0.00 | | | | (4.17 | ) |
October 1, 2006 to September 30, 2007 | | $ | 30.08 | | | | (0.50 | )5 | | | 4.96 | | | | 0.00 | | | | (5.05 | ) |
Administrator Class | | | | | | | | | | | | | | | | | | | | |
June 1, 2012 to November 30, 2012 (unaudited) | | $ | 26.90 | | | | (0.04 | )5 | | | 2.06 | | | | 0.00 | | | | 0.00 | |
June 1, 2011 to May 31, 2012 | | $ | 30.22 | | | | (0.13 | )5 | | | (3.19 | ) | | | 0.00 | | | | 0.00 | |
October 1, 2010 to May 31, 20114 | | $ | 21.70 | | | | (0.14 | )5 | | | 8.66 | | | | 0.00 | | | | 0.00 | |
October 1, 2009 to September 30, 2010 | | $ | 18.90 | | | | (0.16 | )5 | | | 2.96 | | | | 0.00 | | | | 0.00 | |
October 1, 2008 to September 30, 2009 | | $ | 18.68 | | | | (0.12 | )5 | | | 0.34 | | | | 0.00 | | | | 0.00 | |
October 1, 2007 to September 30, 2008 | | $ | 30.54 | | | | (0.19 | )5 | | | (7.33 | ) | | | 0.00 | | | | (4.17 | ) |
October 1, 2006 to September 30, 2007 | | $ | 30.73 | | | | (0.22 | )5 | | | 5.08 | | | | 0.00 | | | | (5.05 | ) |
Institutional Class | | | | | | | | | | | | | | | | | | | | |
June 1, 2012 to November 30, 2012 (unaudited) | | $ | 27.15 | | | | 0.01 | 5 | | | 2.06 | | | | 0.00 | | | | 0.00 | |
June 1, 2011 to May 31, 2012 | | $ | 30.44 | | | | (0.07 | )5 | | | (3.22 | ) | | | 0.00 | | | | 0.00 | |
October 1, 2010 to May 31, 20114 | | $ | 21.81 | | | | (0.12 | )5 | | | 8.75 | | | | 0.00 | | | | 0.00 | |
October 1, 2009 to September 30, 2010 | | $ | 18.94 | | | | (0.05 | )5 | | | 2.92 | | | | 0.00 | | | | 0.00 | |
October 1, 2008 to September 30, 2009 | | $ | 18.70 | | | | (0.08 | )5 | | | 0.32 | | | | 0.00 | | | | 0.00 | |
March 31, 20088 to September 30, 2008 | | $ | 20.18 | | | | (0.05 | )5 | | | (1.43 | ) | | | 0.00 | | | | 0.00 | |
Please see footnotes on page 62.
The accompanying notes are an integral part of these financial statements.
| | | | | | |
| Financial highlights | | Wells Fargo Advantage Equity Gateway Funds | | | 61 | |
| | | | | | | | | | | | | | | | | | | | | | | | | | | | | | |
Distributions from tax
basis return
of capital | | | Ending
net asset
value
per
share | | | Ratio to average net assets (annualized) | | | Total
return2 | | | Portfolio
turnover
rate3 | | | Net assets at
end of period
(000s omitted) | |
| | | Net investment
income (loss)1 | | | Gross
expenses1 | | | Net
expenses1 | | | | |
| | | | | | | |
| | | | | | | | | | | | | | | | | | | | | | | | | | | | | | | |
| | | | | | | | | | | | | | | | | | | | | | | | | | | | | | |
| | 0.00 | | | $ | 12.38 | | | | 1.82 | % | | | 1.08 | % | | | 1.05 | % | | | 17.01 | % | | | 9 | % | | $ | 1,792 | |
| | 0.00 | | | $ | 10.58 | | | | 3.20 | % | | | 1.03 | % | | | 1.03 | % | | | (21.26 | )% | | | 9 | % | | $ | 1,505 | |
| | 0.00 | | | $ | 13.98 | | | | 3.04 | % | | | 1.11 | % | | | 1.03 | % | | | 13.92 | % | | | 16 | % | | $ | 1,797 | |
| | 0.00 | | | $ | 12.58 | | | | 2.51 | % | | | 1.08 | % | | | 1.01 | % | | | 1.01 | % | | | 27 | % | | $ | 1,518 | |
| | 0.00 | | | $ | 12.71 | | | | 2.79 | % | | | 1.23 | % | | | 1.05 | % | | | 5.15 | % | | | 41 | % | | $ | 1,766 | |
| | 0.00 | | | $ | 12.72 | | | | 3.83 | % | | | 1.29 | % | | | 1.05 | % | | | (34.22 | )% | | | 23 | % | | $ | 786 | |
| | 0.00 | | | $ | 20.28 | | | | 2.40 | % | | | 1.20 | % | | | 1.05 | % | | | 21.70 | % | | | 19 | % | | $ | 12 | |
| | | | | | | |
| | | | | | | | | | | | | | | | | | | | | | | | | | | | | | | |
| | | | | | | | | | | | | | | | | | | | | | | | | | | | | | |
| | 0.00 | | | $ | 28.15 | | | | (0.51 | )% | | | 1.54 | % | | | 1.45 | % | | | 7.36 | % | | | 48 | % | | $ | 6,381 | |
| | 0.00 | | | $ | 26.21 | | | | (0.70 | )% | | | 1.46 | % | | | 1.44 | % | | | (11.18 | )% | | | 107 | % | | $ | 6,450 | |
| | 0.00 | | | $ | 29.53 | | | | (1.04 | )% | | | 1.45 | % | | | 1.44 | % | | | 39.11 | % | | | 70 | % | | $ | 7,201 | |
| | 0.00 | | | $ | 21.23 | | | | (1.05 | )% | | | 1.50 | % | | | 1.45 | % | | | 14.39 | % | | | 129 | % | | $ | 4,042 | |
| | 0.00 | | | $ | 18.56 | | | | (1.13 | )% | | | 1.54 | % | | | 1.44 | % | | | 0.92 | % | | | 169 | % | | $ | 2,408 | |
| | (0.17 | ) | | $ | 18.38 | | | | (1.09 | )% | | | 1.53 | % | | | 1.45 | % | | | (27.91 | )% | | | 150 | % | | $ | 2,109 | |
| | 0.00 | | | $ | 30.20 | | | | (1.00 | )% | | | 1.52 | % | | | 1.45 | % | | | 17.07 | % | | | 138 | % | | $ | 3,270 | |
| | | | | | | | | | | | | | | | | | | | | | | | | | | | | | |
| | 0.00 | | | $ | 26.04 | | | | (1.33 | )% | | | 2.29 | % | | | 2.20 | % | | | 6.98 | % | | | 48 | % | | $ | 149 | |
| | 0.00 | | | $ | 24.35 | | | | (1.48 | )% | | | 2.21 | % | | | 2.19 | % | | | (11.87 | )% | | | 107 | % | | $ | 193 | |
| | 0.00 | | | $ | 27.63 | | | | (1.78 | )% | | | 2.19 | % | | | 2.19 | % | | | 38.43 | % | | | 70 | % | | $ | 380 | |
| | 0.00 | | | $ | 19.97 | | | | (1.83 | )% | | | 2.24 | % | | | 2.20 | % | | | 13.54 | % | | | 129 | % | | $ | 251 | |
| | 0.00 | | | $ | 17.58 | | | | (1.85 | )% | | | 2.29 | % | | | 2.19 | % | | | 0.17 | % | | | 169 | % | | $ | 312 | |
| | (0.17 | ) | | $ | 17.55 | | | | (1.85 | )% | | | 2.28 | % | | | 2.20 | % | | | (28.45 | )% | | | 150 | % | | $ | 344 | |
| | 0.00 | | | $ | 29.24 | | | | (1.76 | )% | | | 2.27 | % | | | 2.20 | % | | | 16.22 | % | | | 138 | % | | $ | 750 | |
| | | | | | | | | | | | | | | | | | | | | | | | | | | | | | |
| | 0.00 | | | $ | 26.34 | | | | (1.24 | )% | | | 2.29 | % | | | 2.20 | % | | | 6.94 | % | | | 48 | % | | $ | 1,722 | |
| | 0.00 | | | $ | 24.62 | | | | (1.45 | )% | | | 2.22 | % | | | 2.19 | % | | | (11.85 | )% | | | 107 | % | | $ | 1,628 | |
| | 0.00 | | | $ | 27.95 | | | | (1.80 | )% | | | 2.20 | % | | | 2.19 | % | | | 38.39 | % | | | 70 | % | | $ | 1,736 | |
| | 0.00 | | | $ | 20.19 | | | | (1.81 | )% | | | 2.24 | % | | | 2.20 | % | | | 13.62 | % | | | 129 | % | | $ | 820 | |
| | 0.00 | | | $ | 17.77 | | | | (1.87 | )% | | | 2.29 | % | | | 2.19 | % | | | 0.23 | % | | | 169 | % | | $ | 605 | |
| | (0.17 | ) | | $ | 17.73 | | | | (1.85 | )% | | | 2.23 | % | | | 2.20 | % | | | (28.44 | )% | | | 150 | % | | $ | 231 | |
| | 0.00 | | | $ | 29.49 | | | | (1.74 | )% | | | 2.27 | % | | | 2.20 | % | | | 16.24 | % | | | 138 | % | | $ | 324 | |
| | | | | | | | | | | | | | | | | | | | | | | | | | | | | | |
| | 0.00 | | | $ | 28.92 | | | | (0.26 | )% | | | 1.38 | % | | | 1.20 | % | | | 7.51 | % | | | 48 | % | | $ | 95,354 | |
| | 0.00 | | | $ | 26.90 | | | | (0.48 | )% | | | 1.30 | % | | | 1.20 | % | | | (10.99 | )% | | | 107 | % | | $ | 97,776 | |
| | 0.00 | | | $ | 30.22 | | | | (0.78 | )% | | | 1.28 | % | | | 1.20 | % | | | 39.33 | % | | | 70 | % | | $ | 177,938 | |
| | 0.00 | | | $ | 21.70 | | | | (0.82 | )% | | | 1.32 | % | | | 1.20 | % | | | 14.76 | % | | | 129 | % | | $ | 237,761 | |
| | 0.00 | | | $ | 18.90 | | | | (0.85 | )% | | | 1.35 | % | | | 1.19 | % | | | 1.18 | % | | | 169 | % | | $ | 229,380 | |
| | (0.17 | ) | | $ | 18.68 | | | | (0.84 | )% | | | 1.34 | % | | | 1.20 | % | | | (27.70 | )% | | | 150 | % | | $ | 242,802 | |
| | 0.00 | | | $ | 30.54 | | | | (0.75 | )% | | | 1.34 | % | | | 1.20 | % | | | 17.34 | % | | | 138 | % | | $ | 487,994 | |
| | | | | | | | | | | | | | | | | | | | | | | | | | | | | | |
| | 0.00 | | | $ | 29.22 | | | | 0.03 | % | | | 1.12 | % | | | 0.95 | % | | | 7.66 | % | | | 48 | % | | $ | 11,979 | |
| | 0.00 | | | $ | 27.15 | | | | (0.27 | )% | | | 1.03 | % | | | 0.95 | % | | | (10.78 | )% | | | 107 | % | | $ | 9,692 | |
| | 0.00 | | | $ | 30.44 | | | | (0.61 | )% | | | 1.01 | % | | | 0.95 | % | | | 39.59 | % | | | 70 | % | | $ | 91,704 | |
| | 0.00 | | | $ | 21.81 | | | | (0.25 | )% | | | 1.05 | % | | | 0.95 | % | | | 14.98 | % | | | 129 | % | | $ | 1,175 | |
| | 0.00 | | | $ | 18.94 | | | | (0.57 | )% | | | 1.09 | % | | | 0.95 | % | | | 1.39 | % | | | 169 | % | | $ | 9 | |
| | 0.00 | | | $ | 18.70 | | | | (0.59 | )% | | | 1.08 | % | | | 0.95 | % | | | (7.33 | )% | | | 150 | % | | $ | 54,827 | |
Please see footnotes on page 62.
The accompanying notes are an integral part of these financial statements.
| | | | |
| 62 | | Wells Fargo Advantage Equity Gateway Funds | | Financial highlights |
| | | | | | | | | | | | | | | | | | | | |
| | | Beginning
net asset
value per
share | | | Net
investment
income (loss)1 | | |
Net realized
and unrealized
gains (losses)
on investments | | | Distributions
from net
investment
income | | | Distributions
from net
realized
gains | |
| | | | | |
Small Company Value Fund | | | | | | | | | | | | | | | | | | | | |
Class A | | | | | | | | | | | | | | | | | | | | |
June 1, 2012 to November 30, 2012 (unaudited) | | $ | 13.17 | | | | 0.00 | 6 | | | 0.86 | | | | 0.00 | | | | 0.00 | |
June 1, 2011 to May 31, 2012 | | $ | 14.36 | | | | 0.03 | | | | (1.11 | ) | | | (0.11 | ) | | | 0.00 | |
October 1, 2010 to May 31, 20114 | | $ | 11.38 | | | | 0.11 | | | | 2.87 | | | | 0.00 | | | | 0.00 | |
October 1, 2009 to September 30, 2010 | | $ | 9.84 | | | | (0.02 | ) | | | 1.56 | | | | 0.00 | | | | 0.00 | |
October 1, 2008 to September 30, 2009 | | $ | 10.55 | | | | 0.04 | 5 | | | (0.71 | ) | | | (0.04 | ) | | | 0.00 | |
October 1, 2007 to September 30, 2008 | | $ | 15.35 | | | | 0.05 | 5 | | | (3.36 | ) | | | 0.00 | | | | (1.49 | ) |
October 1, 2006 to September 30, 2007 | | $ | 15.55 | | | | 0.00 | 5,6 | | | 0.96 | | | | 0.00 | | | | (1.16 | ) |
Class B | | | | | | | | | | | | | | | | | | | | |
June 1, 2012 to November 30, 2012 (unaudited) | | $ | 12.21 | | | | (0.05 | )5 | | | 0.81 | | | | 0.00 | | | | 0.00 | |
June 1, 2011 to May 31, 2012 | | $ | 13.30 | | | | (0.08 | )5 | | | (1.01 | ) | | | 0.00 | | | | 0.00 | |
October 1, 2010 to May 31, 20114 | | $ | 10.59 | | | | 0.04 | 5 | | | 2.67 | | | | 0.00 | | | | 0.00 | |
October 1, 2009 to September 30, 2010 | | $ | 9.20 | | | | (0.10 | )5 | | | 1.49 | | | | 0.00 | | | | 0.00 | |
October 1, 2008 to September 30, 2009 | | $ | 9.89 | | | | (0.01 | )5 | | | (0.68 | ) | | | 0.00 | | | | 0.00 | |
October 1, 2007 to September 30, 2008 | | $ | 14.59 | | | | (0.04 | )5 | | | (3.17 | ) | | | 0.00 | | | | (1.49 | ) |
October 1, 2006 to September 30, 2007 | | $ | 14.94 | | | | (0.12 | )5 | | | 0.93 | | | | 0.00 | | | | (1.16 | ) |
Class C | | | | | | | | | | | | | | | | | | | | |
June 1, 2012 to November 30, 2012 (unaudited) | | $ | 12.16 | | | | (0.04 | )5 | | | 0.80 | | | | 0.00 | | | | 0.00 | |
June 1, 2011 to May 31, 2012 | | $ | 13.30 | | | | (0.08 | )5 | | | (1.02 | ) | | | (0.04 | ) | | | 0.00 | |
October 1, 2010 to May 31, 20114 | | $ | 10.59 | | | | 0.02 | 5 | | | 2.69 | | | | 0.00 | | | | 0.00 | |
October 1, 2009 to September 30, 2010 | | $ | 9.20 | | | | (0.09 | )5 | | | 1.48 | | | | 0.00 | | | | 0.00 | |
October 1, 2008 to September 30, 2009 | | $ | 9.89 | | | | (0.02 | )5 | | | (0.67 | ) | | | 0.00 | | | | 0.00 | |
October 1, 2007 to September 30, 2008 | | $ | 14.59 | | | | (0.04 | )5 | | | (3.17 | ) | | | 0.00 | | | | (1.49 | ) |
October 1, 2006 to September 30, 2007 | | $ | 14.94 | | | | (0.12 | )5 | | | 0.93 | | | | 0.00 | | | | (1.16 | ) |
Administrator Class | | | | | | | | | | | | | | | | | | | | |
June 1, 2012 to November 30, 2012 (unaudited) | | $ | 13.39 | | | | 0.02 | 5 | | | 0.88 | | | | 0.00 | | | | 0.00 | |
June 1, 2011 to May 31, 2012 | | $ | 14.60 | | | | 0.06 | | | | (1.13 | ) | | | (0.14 | ) | | | 0.00 | |
October 1, 2010 to May 31, 20114 | | $ | 11.55 | | | | 0.12 | 5 | | | 2.93 | | | | 0.00 | | | | 0.00 | |
October 1, 2009 to September 30, 2010 | | $ | 9.94 | | | | (0.02 | ) | | | 1.63 | | | | 0.00 | | | | 0.00 | |
October 1, 2008 to September 30, 2009 | | $ | 10.69 | | | | 0.06 | 5 | | | (0.74 | ) | | | (0.07 | ) | | | 0.00 | |
October 1, 2007 to September 30, 2008 | | $ | 15.54 | | | | 0.08 | 5 | | | (3.39 | ) | | | (0.05 | ) | | | (1.49 | ) |
October 1, 2006 to September 30, 2007 | | $ | 15.69 | | | | 0.04 | 5 | | | 0.98 | | | | (0.01 | ) | | | (1.16 | ) |
Institutional Class | | | | | | | | | | | | | | | | | | | | |
June 1, 2012 to November 30, 2012 (unaudited) | | $ | 13.41 | | | | 0.04 | 5 | | | 0.88 | | | | 0.00 | | | | 0.00 | |
June 1, 2011 to May 31, 2012 | | $ | 14.63 | | | | 0.11 | | | | (1.17 | ) | | | (0.16 | ) | | | 0.00 | |
October 1, 2010 to May 31, 20114 | | $ | 11.55 | | | | 0.13 | 5 | | | 2.95 | | | | 0.00 | | | | 0.00 | |
July 30, 20108 to September 30, 2010 | | $ | 11.26 | | | | 0.02 | | | | 0.27 | | | | 0.00 | | | | 0.00 | |
| 1. | Includes net expenses allocated from Master Portfolios in which the Fund invests. |
| 2. | Total return calculations do not include any sales charges. Returns for periods of less than one year are not annualized. |
| 3. | Portfolio turnover rate is calculated by aggregating the results of multiplying the Fund’s investment percentage in the respective Master Portfolio by the corresponding Master Portfolio’s portfolio turnover rate. |
| 4. | For the eight months ended May 31, 2011. The Fund changed its fiscal year end from September 30 to May 31, effective May 31, 2011. |
| 5. | Calculated based upon average shares outstanding |
| 6. | Amount is less than $0.005. |
| 7. | On June 20, 2008, Class D was renamed Investor Class. |
| 8. | Commencement of class operations |
| 9. | For the ten months ended May 31, 2011. The Fund changed its fiscal year end from July 31 to May 31, effective May 31, 2011. |
| 10. | After the close of business on July 16, 2010, the Fund acquired the net assets of Evergreen Equity Index Fund which became the accounting and performance survivor in the transaction. The information for the periods prior to July 16, 2010 is that of Evergreen Equity Index Fund. The per share information has been adjusted to give effect to this transaction. |
| 11. | Investor Class of Evergreen Equity Index Fund, the accounting and performance survivor, did not exist prior to the reorganization. As a result, accounting and performance information for Investor Class commenced operation on July 16, 2010. |
The accompanying notes are an integral part of these financial statements.
| | | | | | |
| Financial highlights | | Wells Fargo Advantage Equity Gateway Funds | | | 63 | |
| | | | | | | | | | | | | | | | | | | | | | | | | | |
Ending
net asset
value
per
share | | | Ratio to average net assets (annualized) | | | Total
return2 | | | Portfolio
turnover
rate3 | | | Net assets at
end of period
(000s omitted) | |
| | Net investment
income (loss)1 | | | Gross
expenses1 | | | Net
expenses1 | | | | |
| | | | | | |
| | | | | | | | | | | | | | | | | | | | | | | | | | | |
| | | | | | | | | | | | | | | | | | | | | | | | | | |
| $ | 14.03 | | | | 0.02 | % | | | 1.55 | % | | | 1.45 | % | | | 6.53 | % | | | 34 | % | | $ | 18,589 | |
| $ | 13.17 | | | | 0.08 | % | | | 1.50 | % | | | 1.45 | % | | | (7.44 | )% | | | 60 | % | | $ | 18,605 | |
| $ | 14.36 | | | | 1.07 | % | | | 1.49 | % | | | 1.42 | % | | | 26.19 | % | | | 47 | % | | $ | 26,222 | |
| $ | 11.38 | | | | (0.21 | )% | | | 1.65 | % | | | 1.45 | % | | | 15.53 | % | | | 60 | % | | $ | 22,492 | |
| $ | 9.84 | | | | 0.55 | % | | | 1.55 | % | | | 1.45 | % | | | (6.14 | )% | | | 99 | % | | $ | 20,202 | |
| $ | 10.55 | | | | 0.42 | % | | | 1.52 | % | | | 1.45 | % | | | (22.58 | )% | | | 82 | % | | $ | 34,964 | |
| $ | 15.35 | | | | (0.02 | )% | | | 1.55 | % | | | 1.45 | % | | | 5.95 | % | | | 69 | % | | $ | 66,379 | |
| | | | | | | | | | | | | | | | | | | | | | | | | | |
| $ | 12.97 | | | | (0.72 | )% | | | 2.30 | % | | | 2.20 | % | | | 6.22 | % | | | 34 | % | | $ | 216 | |
| $ | 12.21 | | | | (0.67 | )% | | | 2.25 | % | | | 2.20 | % | | | (8.20 | )% | | | 60 | % | | $ | 500 | |
| $ | 13.30 | | | | 0.45 | % | | | 2.25 | % | | | 2.17 | % | | | 25.59 | % | | | 47 | % | | $ | 1,340 | |
| $ | 10.59 | | | | (0.99 | )% | | | 2.40 | % | | | 2.20 | % | | | 14.98 | % | | | 60 | % | | $ | 2,079 | |
| $ | 9.20 | | | | (0.20 | )% | | | 2.30 | % | | | 2.20 | % | | | (6.88 | )% | | | 99 | % | | $ | 2,792 | |
| $ | 9.89 | | | | (0.33 | )% | | | 2.31 | % | | | 2.20 | % | | | (23.16 | )% | | | 82 | % | | $ | 5,086 | |
| $ | 14.59 | | | | (0.77 | )% | | | 2.30 | % | | | 2.20 | % | | | 5.15 | % | | | 69 | % | | $ | 10,413 | |
| | | | | | | | | | | | | | | | | | | | | | | | | | |
| $ | 12.92 | | | | (0.70 | )% | | | 2.32 | % | | | 2.20 | % | | | 6.25 | % | | | 34 | % | | $ | 1,606 | |
| $ | 12.16 | | | | (0.68 | )% | | | 2.25 | % | | | 2.20 | % | | | (8.20 | )% | | | 60 | % | | $ | 1,557 | |
| $ | 13.30 | | | | 0.29 | % | | | 2.24 | % | | | 2.17 | % | | | 25.59 | % | | | 47 | % | | $ | 2,150 | |
| $ | 10.59 | | | | (0.94 | )% | | | 2.40 | % | | | 2.20 | % | | | 14.98 | % | | | 60 | % | | $ | 1,763 | |
| $ | 9.20 | | | | (0.26 | )% | | | 2.30 | % | | | 2.20 | % | | | (6.88 | )% | | | 99 | % | | $ | 1,437 | |
| $ | 9.89 | | | | (0.33 | )% | | | 2.30 | % | | | 2.20 | % | | | (23.15 | )% | | | 82 | % | | $ | 1,728 | |
| $ | 14.59 | | | | (0.77 | )% | | | 2.30 | % | | | 2.20 | % | | | 5.15 | % | | | 69 | % | | $ | 3,754 | |
| | | | | | | | | | | | | | | | | | | | | | | | | | |
| $ | 14.29 | | | | 0.28 | % | | | 1.39 | % | | | 1.20 | % | | | 6.72 | % | | | 34 | % | | $ | 57,344 | |
| $ | 13.39 | | | | 0.32 | % | | | 1.33 | % | | | 1.20 | % | | | (7.24 | )% | | | 60 | % | | $ | 60,333 | |
| $ | 14.60 | | | | 1.34 | % | | | 1.33 | % | | | 1.20 | % | | | 26.41 | % | | | 47 | % | | $ | 70,022 | |
| $ | 11.55 | | | | (0.05 | )% | | | 1.47 | % | | | 1.20 | % | | | 16.20 | % | | | 60 | % | | $ | 60,081 | |
| $ | 9.94 | | | | 0.85 | % | | | 1.37 | % | | | 1.20 | % | | | (6.06 | )% | | | 99 | % | | $ | 124,072 | |
| $ | 10.69 | | | | 0.71 | % | | | 1.38 | % | | | 1.20 | % | | | (22.33 | )% | | | 82 | % | | $ | 252,275 | |
| $ | 15.54 | | | | 0.26 | % | | | 1.37 | % | | | 1.20 | % | | | 6.28 | % | | | 69 | % | | $ | 327,372 | |
| | | | | | | | | | | | | | | | | | | | | | | | | | |
| $ | 14.33 | | | | 0.49 | % | | | 1.13 | % | | | 1.00 | % | | | 6.86 | % | | | 34 | % | | $ | 1,402 | |
| $ | 13.41 | | | | 0.59 | % | | | 1.05 | % | | | 1.00 | % | | | (7.14 | )% | | | 60 | % | | $ | 62 | |
| $ | 14.63 | | | | 1.42 | % | | | 1.02 | % | | | 0.96 | % | | | 26.67 | % | | | 47 | % | | $ | 16 | |
| $ | 11.55 | | | | 1.02 | % | | | 1.15 | % | | | 1.00 | % | | | 2.58 | % | | | 60 | % | | $ | 10 | |
The accompanying notes are an integral part of these financial statements.
| | | | |
| 64 | | Wells Fargo Advantage Equity Gateway Funds | | Notes to financial statements (unaudited) |
1. ORGANIZATION
Wells Fargo Funds Trust (the “Trust”), a Delaware statutory trust organized on March 10, 1999, is an open-end management investment company registered under the Investment Company Act of 1940, as amended (the “1940 Act”). These financial statements report on the following funds: Wells Fargo Advantage C&B Large Cap Value Fund (“C&B Large Cap Value Fund”), Wells Fargo Advantage Diversified Equity Fund (“Diversified Equity Fund”), Wells Fargo Advantage Diversified Small Cap Fund (“Diversified Small Cap Fund”), Wells Fargo Advantage Emerging Growth Fund (“Emerging Growth Fund”), Wells Fargo Advantage Equity Value Fund (“Equity Value Fund”), Wells Fargo Advantage Index Fund (“Index Fund”), Wells Fargo Advantage International Value Fund (“International Value Fund”), Wells Fargo Advantage Small Company Growth Fund (“Small Company Growth Fund”) and Wells Fargo Advantage Small Company Value Fund (“Small Company Value Fund” ) (each, a “Fund”, collectively, the “Funds”). Each Fund is a diversified series of the Trust.
The Funds each seek to achieve their investment objective by investing all investable assets in one or more separate diversified portfolios (each, a “Master Portfolio”, collectively, the “Master Portfolios”) of Wells Fargo Master Trust, a registered open-end management investment company. Each Master Portfolio directly acquires portfolio securities, and a Fund investing in a Master Portfolio acquires an indirect interest in those securities. Each Fund accounts for its investment in the Master Portfolios as partnership investments and records daily its share of the Master Portfolio’s income, expense and realized and unrealized gains and losses. The financial statements of the Master Portfolios for the six months ended November 30, 2012 are included in this report and should be read in conjunction with each Fund’s financial statements. As of November 30, 2012, the Funds own the following percentages of the Master Portfolio(s):
| | | | | | | | | | | | | | | | | | | | | | | | | | | | | | | | | | | | |
| | | C&B
Large Cap
Value
Fund | | | Diversified
Equity
Fund | | | Diversified
Small Cap
Fund | | | Emerging
Growth
Fund | | | Equity
Value
Fund | | | Index
Fund | | | International
Value Fund | | | Small
Company
Growth
Fund | | | Small
Company
Value
Fund | |
Wells Fargo Advantage C&B Large Cap Value Portfolio | | | 85 | % | | | 10 | % | | | N/A | | | | N/A | | | | N/A | | | | N/A | | | | N/A | | | | N/A | | | | N/A | |
Wells Fargo Advantage Diversified Large Cap Growth Portfolio | | | N/A | | | | 63 | % | | | N/A | | | | N/A | | | | N/A | | | | N/A | | | | N/A | | | | N/A | | | | N/A | |
Wells Fargo Advantage Emerging Growth Portfolio | | | N/A | | | | 1 | % | | | 0 | %* | | | 90 | % | | | N/A | | | | N/A | | | | N/A | | | | N/A | | | | N/A | |
Wells Fargo Advantage Equity Value Portfolio | | | N/A | | | | 4 | % | | | N/A | | | | N/A | | | | 81 | % | | | N/A | | | | N/A | | | | N/A | | | | N/A | |
Wells Fargo Advantage Index Portfolio | | | N/A | | | | 4 | % | | | N/A | | | | N/A | | | | N/A | | | | 94 | % | | | N/A | | | | N/A | | | | N/A | |
Wells Fargo Advantage International Equity Portfolio | | | N/A | | | | 63 | % | | | N/A | | | | N/A | | | | N/A | | | | N/A | | | | N/A | | | | N/A | | | | N/A | |
Wells Fargo Advantage International Growth Portfolio | | | N/A | | | | 13 | % | | | N/A | | | | N/A | | | | N/A | | | | N/A | | | | N/A | | | | N/A | | | | N/A | |
Wells Fargo Advantage International Index Portfolio | | | N/A | | | | 63 | % | | | N/A | | | | N/A | | | | N/A | | | | N/A | | | | N/A | | | | N/A | | | | N/A | |
Wells Fargo Advantage International Value Portfolio | | | N/A | | | | 4 | % | | | N/A | | | | N/A | | | | N/A | | | | N/A | | | | 94 | % | | | N/A | | | | N/A | |
Wells Fargo Advantage Large Company Value Portfolio | | | N/A | | | | 63 | % | | | N/A | | | | N/A | | | | N/A | | | | N/A | | | | N/A | | | | N/A | | | | N/A | |
Wells Fargo Advantage Small Cap Value Portfolio | | | N/A | | | | 55 | % | | | 13 | % | | | N/A | | | | N/A | | | | N/A | | | | N/A | | | | N/A | | | | N/A | |
Wells Fargo Advantage Small Company Growth Portfolio | | | N/A | | | | 7 | % | | | 2 | % | | | N/A | | | | N/A | | | | N/A | | | | N/A | | | | 87 | % | | | N/A | |
Wells Fargo Advantage Small Company Value Portfolio | | | N/A | | | | 5 | % | | | 1 | % | | | N/A | | | | N/A | | | | N/A | | | | N/A | | | | N/A | | | | 47 | % |
| * | The amount invested is less than 1%. |
2. SIGNIFICANT ACCOUNTING POLICIES
The following significant accounting policies, which are consistently followed in the preparation of the financial statements of each Fund, are in conformity with U.S. generally accepted accounting principles which require management to make estimates and assumptions that affect the reported amounts of assets and liabilities, disclosure of contingent assets and liabilities at the date of the financial statements, and the reported amounts of revenues and expenses during the reporting period. Actual results could differ from those estimates.
| | | | | | |
| Notes to financial statements (unaudited) | | Wells Fargo Advantage Equity Gateway Funds | | | 65 | |
Securities valuation
All investments are valued each business day as of the close of regular trading on the New York Stock Exchange (normally 4 p.m. Eastern Time).
Investments in the Master Portfolios are valued daily based on each Fund’s proportionate share of each Master Portfolio’s net assets, which are also valued daily. Securities held in the Master Portfolios are valued as discussed in the Notes to Financial Statements of the Master Portfolios, which are included elsewhere in this report.
Investments which are not valued using any of the methods discussed above are valued at their fair value, as determined by procedures established in good faith and approved by the Board of Trustees. The Board of Trustees has established a Valuation Committee comprised of the Trustees and has delegated to it the authority to take any actions regarding the valuation of portfolio securities that the Valuation Committee deems necessary or appropriate, including determining the fair value of portfolio securities, unless the determination has been delegated to the Management Valuation Team of Wells Fargo Funds Management, LLC (“Funds Management”). The Board of Trustees retains the authority to make or ratify any valuation decisions or approve any changes to the Valuation Procedures as it deems appropriate. On a quarterly basis, the Board of Trustees receives reports on any valuation actions taken by the Valuation Committee or the Management Valuation Team which may include items for ratification.
Valuations of fair valued securities are compared to the next actual sales price when available, or other appropriate market information to assess the continued appropriateness of the fair valuation methodology used. These securities are fair valued on a day-to-day basis, taking into consideration changes to appropriate market information and any significant changes to the input factors considered in the valuation process until there is a readily available price provided on the exchange or by an independent pricing service. Valuations received from an independent pricing service or broker quotes are periodically validated by comparisons to most recent trades and valuations provided by other independent pricing services in addition to the review of prices by the adviser and/or subadviser. Unobservable inputs used in determining fair valuations are identified based on the type of security, taking into consideration factors utilized by market participants in valuing the investment, knowledge about the issuer and the current market environment.
Security transactions and income recognition
Securities transactions are recorded on a trade date basis by the Funds and each Master Portfolio. Realized gains or losses are recorded on the basis of identified cost by the Funds and each Master Portfolio.
Interest income is accrued daily and bond discounts are accreted and premiums are amortized daily based on the effective interest method by the Funds and each Master Portfolio. To the extent debt obligations are placed on non-accrual status, any related interest income may be reduced by writing off interest receivables when the collection of all or a portion of interest has become doubtful based on consistently applied procedures. If the issuer subsequently resumes interest payments or when the collectability of interest is reasonably assured, the debt obligation is removed from non-accrual status.
Dividend income in each Master Portfolio is recognized on the ex-dividend date, except for certain dividends from foreign securities, which are recorded as soon as the Master Portfolio is informed of the ex-dividend date. Dividend income from foreign securities in each Master Portfolio is recorded net of foreign taxes withheld where recovery of such taxes is not assured.
Each Fund records on a daily basis its proportionate share of each Master Portfolio’s interest and dividend income, in addition to expenses, waiver, and realized and unrealized gains or losses.
Distributions to shareholders
Distributions to shareholders from net investment income and net realized gains, if any, are recorded on the ex-dividend date. Such distributions are determined in conformity with federal income tax regulations, which may differ in amount or character from net investment income and realized gains recognized for purposes of U.S. generally accepted accounting principles.
Federal and other taxes
Each Fund is treated as a separate entity for federal income tax purposes. Each Fund intends to continue to qualify as a regulated investment company by distributing substantially all of its investment company taxable income and any net realized capital gains (after reduction for capital loss carryforwards) sufficient to relieve it from all, or substantially all, federal income taxes. Accordingly, no provision for federal income taxes was required.
Each Fund’s income and federal excise tax returns and all financial records supporting those returns for the prior three fiscal years are subject to examination by the federal and Delaware revenue authorities. Management has analyzed each Fund’s tax positions taken on federal, state, and foreign tax returns for all open tax years and does not believe that there are any uncertain tax positions that require recognition of a tax liability.
| | | | |
| 66 | | Wells Fargo Advantage Equity Gateway Funds | | Notes to financial statements (unaudited) |
As of May 31, 2012, net capital loss carryforwards, which are available to offset future net realized capital gains, were as follows:
| | | | | | | | | | | | | | | | | | | | | | | | | | | | |
| | | Pre-enactment capital loss expiration* | | | Post-enactment capital losses** | |
| | | 2014 | | | 2015 | | | 2016 | | | 2017 | | | 2018 | | | 2019 | | | Short-term | |
C&B Large Cap Value Fund | | $ | 0 | | | $ | 0 | | | $ | 0 | | | $ | 24,866,936 | | | $ | 52,060,627 | | | $ | 16,296,879 | | | $ | 0 | |
Diversified Small Cap Fund | | | 0 | | | | 0 | | | | 0 | | | | 19,125,538 | | | | 82,177,516 | | | | 0 | | | | 0 | |
Equity Value Fund | | | 8,897,495 | | | | 3,137,764 | | | | 45,723,944 | | | | 25,647,183 | | | | 30,379,874 | | | | 0 | | | | 223,158 | |
International Value Fund | | | 0 | | | | 0 | | | | 0 | | | | 6,753,262 | | | | 39,532,291 | | | | 4,561,591 | | | | 0 | |
Small Company Growth Fund | | | 0 | | | | 0 | | | | 0 | | | | 0 | | | | 6,084,657 | | | | 0 | | | | 0 | |
Small Company Value Fund | | | 0 | | | | 0 | | | | 0 | | | | 23,708,588 | | | | 80,412,918 | | | | 0 | | | | 0 | |
| * | Losses incurred in taxable years beginning before December 22, 2010. |
| ** | Losses incurred in taxable years which began after December 22, 2010 are carried forward for an unlimited period. |
As of May 31, 2012, International Value Fund had $3,329,024 of current year deferred post-October capital losses which will be recognized on the first day of the current fiscal year.
Class allocations
The separate classes of shares offered by each Fund differ principally in applicable sales charges, distribution, shareholder servicing, and administration fees. Shareholders of each class bear certain expenses that pertain to that particular class. All shareholders bear the common expenses of a Fund, earn income from the portfolio, and are allocated unrealized gains and losses pro rata based on the average daily net assets of each class, without distinction between share classes. Dividends are determined separately for each class based on income and expenses allocable to each class. Realized gains and losses are allocated to each class pro rata based upon the net assets of each class on the date realized. Differences in per share dividend rates generally result from the relative weightings of pro rata income and realized gain allocations and from differences in separate class expenses, including distribution, shareholder servicing, and administration fees.
3. FAIR VALUATION MEASUREMENTS
Fair value measurements of investments are determined within a framework that has established a fair value hierarchy based upon the various data inputs utilized in determining the value of each Fund’s investments. The three-level hierarchy gives the highest priority to unadjusted quoted prices in active markets for identical assets or liabilities (Level 1) and the lowest priority to significant unobservable inputs (Level 3). Each Fund’s investments are classified within the fair value hierarchy based on the lowest level of input that is significant to the fair value measurement. The inputs are summarized into three broad levels as follows:
| n | | Level 1 – quoted prices in active markets for identical securities |
| n | | Level 2 – other significant observable inputs (including quoted prices for similar securities, interest rates, prepayment speeds, credit risk, etc.) |
| n | | Level 3 – significant unobservable inputs (including the Fund’s own assumptions in determining the fair value of investments) |
The inputs or methodologies used for valuing investments in securities are not necessarily an indication of the risk associated with investing in those securities.
At November 30, 2012, investments for each Fund (except for Diversified Equity Fund and Diversified Small Cap Fund) were only in an affiliated Master Portfolio which was carried at fair value and designated as Level 2 inputs.
| | | | | | |
| Notes to financial statements (unaudited) | | Wells Fargo Advantage Equity Gateway Funds | | | 67 | |
As of November 30, 2012, the inputs used in valuing investments in securities of Diversified Equity Fund and Diversified Small Cap Fund, which are carried at fair value, were as follows:
| | | | | | | | | | | | | | | | |
| Investments in securities | | Quoted prices
(Level 1) | | | Significant other
observable inputs
(Level 2) | | | Significant
unobservable inputs
(Level 3) | | | Total | |
Diversified Equity Fund | | | | | | | | | | | | | | | | |
| | | | |
Equity securities | | | | | | | | | | | | | | | | |
Investment companies | | $ | 0 | | | $ | 370,872,866 | | | $ | 0 | | | $ | 370,872,866 | |
| | | | |
Other | | | 0 | | | | 0 | | | | 112,464 | | | | 112,464 | |
Total | | $ | 0 | | | $ | 370,872,866 | | | | 112,464 | | | $ | 370,985,330 | |
Diversified Small Cap Fund | | | | | | | | | | | | | | | | |
| | | | |
Equity securities | | | | | | | | | | | | | | | | |
Investment companies | | $ | 0 | | | $ | 8,261,629 | | | $ | 0 | | | $ | 8,261,629 | |
| | | | |
Other | | | 0 | | | | 0 | | | | 215,355 | | | | 215,355 | |
Total | | $ | 0 | | | $ | 8,261,629 | | | $ | 215,355 | | | $ | 8,476,984 | |
Further details can be found in the each Fund’s Portfolio of Investments.
Transfers in and transfers out are recognized at the end of the reporting period. For the six months ended November 30, 2012, the Funds did not have any transfers into/out of Level 1 or Level 2.
The following is a reconciliation of assets in which significant unobservable inputs (Level 3) were used in determining fair value for Diversified Small Cap Fund:
| | | | |
| | | Other | |
Balance as of May 31, 2012 | | $ | 493,308 | |
Accrued discounts (premiums) | | | 0 | |
Realized gains (losses) | | | 86,350 | |
Change in unrealized gains (losses) | | | (10,603 | ) |
Purchases | | | 0 | |
Sales | | | (353,700 | ) |
Transfers into Level 3 | | | 0 | |
Transfers out of Level 3 | | | 0 | |
Balance as of November 30, 2012 | | $ | 215,355 | |
Change in unrealized gains (losses) relating to securities still held at November 30, 2012 | | $ | 39,155 | |
The following table summarizes quantitative information about Diversified Small Cap Fund’s Level 3 inputs as of November 30, 2012:
| | | | | | | | | | | | | | | | |
Security
type | | Fair value at
November 30,
2012 | | Valuation technique(s) | | Significant unobservable
input(s) | | Weighted
average | | | Range | | Impact to
valuation from
an increase in
input* | |
| Other | | $215,355 | | Liquidity discount | | Discounts for the specific
qualities of a security | | | 12 | % | | 10% to 50% | | | Decrease | |
| * | Unless otherwise noted, this column represents the directional change in the fair value of the Level 3 investments that would result from an increase to the corresponding unobservable input. A decrease to the unobservable input would have the opposite effect. Significant increases and decreases in these inputs in isolation could result in significantly higher or lower fair value measurements. |
4. TRANSACTIONS WITH AFFILIATES AND OTHER EXPENSES
Advisory fees
The Trust has entered into an advisory contract with Funds Management, an indirect wholly owned subsidiary of Wells Fargo & Company (“Wells Fargo”). The adviser is responsible for implementing investment policies and guidelines of the Funds.
| | | | |
| 68 | | Wells Fargo Advantage Equity Gateway Funds | | Notes to financial statements (unaudited) |
For each Fund (except Diversified Equity Fund and Diversified Small Cap Fund), Funds Management does not currently receive an advisory fee since each Fund (except Diversified Equity Fund and Diversified Small Cap Fund) invests all of its assets in a single Master Portfolio.
For Diversified Equity Fund and Diversified Small Cap Fund, Funds Management is the adviser and is entitled to receive an advisory fee for providing such advisory services, including the determination of the asset allocations of each Fund’s investments in the various affiliated Master Portfolios. Funds Management is entitled to receive an annual advisory fee starting at 0.25% and declining to 0.19% as the average daily net assets of each Fund increases. Prior to October 1, 2012, Funds Management received an annual advisory fee of 0.25% of each respective Fund’s average daily net assets. For the six months ended November 30, 2012, the advisory fee was equivalent to an annual rate of 0.25% of the average daily net assets of Diversified Equity Fund and Diversified Small Cap Fund.
Funds Management also serves as the adviser to each Master Portfolio and is entitled to receive a fee from each Master Portfolio for those services.
Administration and transfer agent fees
The Trust has entered into an administration agreement with Funds Management. Under this agreement, for providing administrative services, which includes paying fees and expenses for services provided by the transfer agent, sub-transfer agents, omnibus account servicers and record-keepers, Funds Management is entitled to receive from each Fund an annual fund level administration fee starting at 0.05% and declining to 0.03% as the average daily net assets of each Fund increase and a class level administration fee which is calculated based on the average daily net assets of each class as follows:
| | | | |
| | | Class level
administration
fee | |
Class A, Class B, Class C, Class R | | | 0.26 | % |
Administrator Class | | | 0.10 | |
Institutional Class | | | 0.08 | |
Investor Class | | | 0.32 | |
Funds Management has contractually waived and/or reimbursed advisory and/or administration fees to the extent necessary to maintain certain net operating expense ratios for the Funds. Waiver of fees and/or reimbursement of expenses by Funds Management were made first from fund level expenses on a proportionate basis and then from class specific expenses. Funds Management has committed to waive fees and/or reimburse expenses to the extent necessary to cap each Fund’s expenses as follows:
| | | | | | | | | | | | | | | | | | | | | | | | | | | | | | |
| | | Expiration date | | Class A | | | Class B | | | Class C | | | Class R | | | Administrator
Class | | | Institutional
Class | | | Investor
Class | |
C&B Large Cap Value Fund | | September 30, 2013 | | | 1.15 | % | | | 1.90 | % | | | 1.90 | % | | | N/A | | | | 0.95 | % | | | 0.70 | % | | | 1.20 | % |
Diversified Equity Fund | | September 30, 2013 | | | 1.25 | | | | 2.00 | | | | 2.00 | | | | N/A | | | | 1.00 | | | | N/A | | | | N/A | |
Diversified Small Cap Fund | | September 30, 2013 | | | N/A | | | | N/A | | | | N/A | | | | N/A | | | | 1.00 | | | | N/A | | | | N/A | |
Emerging Growth Fund | | September 30, 2013 | | | 1.37 | | | | N/A | | | | 2.12 | | | | N/A | | | | 1.20 | | | | 0.90 | | | | 1.43 | |
Equity Value Fund | | September 30, 2013 | | | 1.24 | | | | 1.99 | | | | 1.99 | | | | 1.49 | % | | | 1.00 | | | | 0.75 | | | | NA | |
Index Fund | | September 30, 2013 | | | 0.56 | | | | 1.31 | | | | 1.31 | | | | N/A | | | | 0.25 | | | | N/A | | | | 0.45 | |
International Value Fund | | September 30, 2013 | | | 1.50 | | | | 2.25 | | | | 2.25 | | | | N/A | | | | 1.25 | | | | 1.05 | | | | N/A | |
Small Company Growth Fund | | September 30, 2013 | | | 1.45 | | | | 2.20 | | | | 2.20 | | | | N/A | | | | 1.20 | | | | 0.95 | | | | N/A | |
Small Company Value Fund | | September 30, 2013 | | | 1.45 | | | | 2.20 | | | | 2.20 | | | | N/A | | | | 1.20 | | | | 1.00 | | | | N/A | |
Distribution fees
The Trust has adopted a Distribution Plan for Class B, Class C and Class R shares of the applicable Funds pursuant to Rule 12b-1 under the 1940 Act. Distribution fees are charged to the Class B, Class C and Class R shares and paid to Wells Fargo Funds Distributor, LLC, the principal underwriter of each Fund, at an annual rate of 0.75% of the average daily net assets of Class B and Class C shares and 0.25% of the average daily net assets of Class R shares.
For the six months ended November 30, 2012, Wells Fargo Funds Distributor, LLC received the following amounts in front-end sales charges and contingent deferred sales charges.
| | | | | | |
| Notes to financial statements (unaudited) | | Wells Fargo Advantage Equity Gateway Funds | | | 69 | |
| | | | | | | | | | | | |
| | | Front-end
sales charges Class A | | | Contingent deferred sales charges | |
| | | | Class B | | | Class C | |
C&B Large Cap Value Fund | | $ | 974 | | | $ | 176 | | | $ | 0 | |
Diversified Equity Fund | | | 2,129 | | | | 201 | | | | 9 | |
Emerging Growth Fund | | | 419 | | | | N/A | | | | 140 | |
Equity Value Fund | | | 1,346 | | | | 129 | | | | 0 | |
Index Fund | | | 1,775 | | | | 213 | | | | 1,290 | |
International Value Fund | | | 386 | | | | 0 | | | | 0 | |
Small Company Growth Fund | | | 193 | | | | 0 | | | | 65 | |
Small Company Value Fund | | | 298 | | | | 0 | | | | 10 | |
Shareholder servicing fees
The Trust has entered into contracts with one or more shareholder servicing agents, whereby Class A, Class B, Class C, Class R, Administrator Class and Investor Class of each applicable Fund is charged a fee at an annual rate of 0.25% of the average daily net assets of each respective class. Administrator Class of Index Fund is charged a fee at an annual rate of 0.10% of its average daily net assets.
A portion of these total shareholder servicing fees were paid to affiliates of Wells Fargo.
5. INVESTMENT PORTFOLIO TRANSACTIONS
Purchases and sales of investments, excluding U.S. Government obligations (if any) and short-term securities, for the six months ended November 30, 2012 were as follows:
| | | | | | | | |
| | | Purchases at cost* | | | Sales proceeds* | |
C&B Large Cap Value Fund | | $ | 15,842,947 | | | $ | 35,817,751 | |
Diversified Equity Fund | | | 78,949,092 | | | | 130,529,644 | |
Diversified Small Cap Fund | | | 3,565,378 | | | | 9,268,804 | |
Emerging Growth Fund | | | 285,650,570 | | | | 356,639,427 | |
Equity Value Fund | | | 328,477,178 | | | | 503,711,035 | |
Index Fund | | | 55,456,112 | | | | 104,942,405 | |
International Value Fund | | | 53,154,030 | | | | 26,896,034 | |
Small Company Growth Fund | | | 62,446,933 | | | | 99,159,672 | |
Small Company Value Fund | | | 29,713,820 | | | | 47,819,369 | |
| * | Each Fund seeks to achieve their investment objective by investing some or all of their investable assets in one or more Master Portfolios. Purchases and sales related to these investments have been calculated by aggregating the results of multiplying each Fund’s ownership percentage of the respective Master Portfolio by the corresponding Master Portfolio’s purchases and sales. Purchases and sales of unaffiliated securities in which the Funds invest are actual purchases and sale of those securities. |
6. ACQUISITIONS
After the close of business on August 26, 2011, Emerging Growth Fund acquired the net assets of Wells Fargo Advantage Small Cap Growth Fund. The purpose of the transaction was to combine two funds with similar investment objectives and strategies. Wells Fargo Advantage Small Cap Growth Fund transferred all of its portfolio securities to Wells Fargo Advantage Emerging Growth Portfolio (a master portfolio in which Emerging Growth Fund invests all of its assets) in exchange for interests in Wells Fargo Advantage Emerging Growth Portfolio. Immediately thereafter, Wells Fargo Advantage Small Cap Growth Fund transferred all of its equity interests in Wells Fargo Advantage Emerging Growth Portfolio to Emerging Growth Fund in exchange for shares of Emerging Growth Fund. Shareholders holding Class A, Class B, Class C, Administrator Class, Institutional Class and Investor Class shares of Wells Fargo Advantage Small Cap Growth Fund received Class A, Class A, Class C, Administrator Class, Institutional Class and Investor Class shares, respectively, of Emerging Growth Fund in the reorganization. The acquisition was accomplished by a tax-free exchange of all of the shares of Wells Fargo Advantage Small Cap Growth Fund for 91,597,530 shares of Emerging Growth Fund valued at $986,870,452 at an exchange ratio of 0.92, 0.84, 0.86, 0.93, 0.95 and 0.91 for Class A, Class A, Class C, Administrator Class, Institutional Class and Investor Class shares, respectively. The investment portfolio of Wells Fargo Advantage Small Cap Growth Fund with a fair value of $983,123,142, identified cost of $1,049,145,570 and unrealized losses of $66,022,428 at August 26, 2011 were the principal assets acquired by Emerging Growth Fund. The aggregate net assets of Wells Fargo Advantage Small Cap Growth Fund and Emerging
| | | | |
| 70 | | Wells Fargo Advantage Equity Gateway Funds | | Notes to financial statements (unaudited) |
Growth Fund immediately prior to the acquisition were $986,870,452 and $21,206,634, respectively. The aggregate net assets of Emerging Growth Fund immediately after the acquisition were $1,008,077,086. For financial reporting purposes, assets received and shares issued by Emerging Growth Fund were recorded at fair value; however, the cost basis of the investments received from Wells Fargo Advantage Small Cap Growth Fund was carried forward to align ongoing reporting Emerging Growth Fund’s realized and unrealized gains and losses with amounts distributable to shareholders for tax purposes.
Assuming the acquisition had been completed June 1, 2011, the beginning of the annual reporting period for Emerging Growth Fund, the pro forma results of operations for the year ended May 31, 2012 would have been:
| | | | |
Net investment loss | | $ | (13,409,990 | ) |
Net realized and unrealized gains (losses) on investments | | $ | (28,375,166 | ) |
Net decrease in net assets resulting from operations | | $ | (31,785,156 | ) |
After the close of business on August 26, 2011, Equity Value Fund acquired the net assets of Wells Fargo Advantage Classic Value Fund. The purpose of the transaction was to combine two funds with similar investment objectives and strategies. Wells Fargo Advantage Classic Value Fund transferred all of its portfolio securities to Wells Fargo Advantage Equity Value Portfolio (a master portfolio in which Equity Value Fund invests all of its assets) in exchange for interests in Wells Fargo Advantage Equity Value Portfolio. Immediately thereafter, Wells Fargo Advantage Classic Value Fund transferred all of its equity interests in Wells Fargo Advantage Equity Value Portfolio to Equity Value Fund in exchange for shares of Equity Value Fund. Shareholders holding Class A, Class B, Class C, Class R, Administrator Class and Institutional Class shares of Wells Fargo Advantage Classic Value Fund received Class A, Class B, Class C, Class R, Administrator Class and Institutional Class shares, respectively, of Equity Value Fund in the reorganization. The acquisition was accomplished by a tax-free exchange of all of the shares of Wells Fargo Advantage Classic Value Fund for 56,082,571 shares of Equity Value Fund valued at $650,291,592 at an exchange ratio of 1.54, 1.54, 1.55, 1.52, 1.51 and 1.51 for Class A, Class B, Class C, Class R, Administrator Class and Institutional Class shares, respectively. The investment portfolio of Wells Fargo Advantage Classic Value Fund with a fair value of $650,311,693, identified cost of $637,997,519 and unrealized gains of $12,314,174 at August 26, 2011were the principal assets acquired by Equity Value Fund. The aggregate net assets of Wells Fargo Advantage Classic Value Fund and Equity Value Fund immediately prior to the acquisition were $650,291,592 and $185,796,293, respectively. The aggregate net assets of Equity Value Fund immediately after the acquisition were $836,087,885. For financial reporting purposes, assets received and shares issued by Equity Value Fund were recorded at fair value; however, the cost basis of the investments received from Wells Fargo Advantage Classic Value Fund was carried forward to align ongoing reporting Equity Value Fund’s realized and unrealized gains and losses with amounts distributable to shareholders for tax purposes.
Assuming the acquisition had been completed June 1, 2011, the beginning of the annual reporting period for Equity Value Fund, the pro forma results of operations for the year ended May 31, 2012 would have been:
| | | | |
Net investment income | | $ | 14,743,176 | |
Net realized and unrealized gains (losses) on investments | | $ | (109,080,239 | ) |
Net decrease in net assets resulting from operations | | $ | (94,337,063 | ) |
7. CAPITAL SHARES
As a result of the transfer of assets from Funds Management, former program manager of the 529 college savings plans for the State of Wisconsin, to a new program manager, certain Funds redeemed assets on October 26, 2012. These amounts are reflected in the Statements of Changes in Net Assets for the six months ended November 30, 2012.
| | | | | | | | | | |
| | | Class | | Assets redeemed | | | % of Fund | |
Diversified Small Cap Fund | | Administrator Class | | $ | 113,775,651 | | | | 93.11 | % |
Equity Value Fund | | Institutional Class | | | 91,418,213 | | | | 11.37 | |
8. BANK BORROWINGS
The Trust (excluding Diversified Equity Fund, the money market funds and certain other funds in the Trust) and Wells Fargo Variable Trust are parties to a $150,000,000 revolving credit agreement with State Street Bank and Trust Company. Diversified Equity Fund and certain other funds in the Trust are parties to a $25,000,000 revolving credit agreement with Bank of New York Mellon. Under each agreement, the Funds are permitted to use bank borrowings for temporary or emergency purposes, such as to fund shareholder redemption requests. Interest under each credit agreement is charged to each Fund based on a borrowing rate equal to the higher of the Federal Funds rate in effect on that day plus 1.25% or the overnight LIBOR rate in effect on that day plus 1.25%. In addition, the applicable Funds pay an annual commitment
| | | | | | |
| Notes to financial statements (unaudited) | | Wells Fargo Advantage Equity Gateway Funds | | | 71 | |
fee equal to 0.10% under the credit agreement with State Street Bank and Trust Company and an annual commitment fee equal 0.15% under the credit agreement with Bank of New York Mellon. The annual commitment fee applied on the unused balance is allocated to each participating fund. For the six months ended November 30, 2012, the Funds paid the following in commitment fees:
| | | | |
| | | Commitment fee | |
C&B Large Cap Value Fund | | $ | 254 | |
Diversified Equity Fund | | | 646 | |
Diversified Small Cap Fund | | | 142 | |
Emerging Growth Fund | | | 805 | |
Equity Value Fund | | | 768 | |
Index Fund | | | 2,038 | |
International Value Fund | | | 315 | |
Small Company Growth Fund | | | 148 | |
Small Company Value Fund | | | 93 | |
For the six months ended November 30, 2012, there were no borrowings by the Funds under the agreements.
9. INDEMNIFICATION
Under the Trust’s organizational documents, the officers and directors are indemnified against certain liabilities that may arise out of performance of their duties to the Trust. Additionally, in the normal course of business, the Trust may enter into contracts with service providers that contain a variety of indemnification clauses. The Trust’s maximum exposure under these arrangements is dependent on future claims that may be made against the Funds and, therefore, cannot be estimated.
10. NEW ACCOUNTING PRONOUNCEMENT
In December 2011, the Financial Accounting Standards Board (“FASB”) issued Accounting Standard Update (“ASU”) No. 2011-11, Disclosures about Offsetting Assets and Liabilities. ASU 2011-11, which amends FASB ASC Topic 210, Balance Sheet, creates new disclosure requirements which require entities to disclose both gross and net information for derivatives and other financial instruments that are either offset in the Statement of Assets and Liabilities or subject to an enforceable master netting arrangement or similar agreement. The disclosure requirements are effective for interim and annual reporting periods beginning on or after January 1, 2013. Management is currently assessing the potential impact, in addition to expanded financial statement disclosure, that may result from adopting this ASU.
11. SUBSEQUENT DISTRIBUTIONS
On December 10, 2012, the following Funds declared distributions from short-term capital gains and long-term capital gains to shareholders of record on December 7, 2012. The per share amounts payable on December 11, 2012 were as follows:
| | | | | | | | | | | | | | | | |
| | | Diversified
Equity
Fund | | | Emerging
Growth Fund | | | Equity
Value
Fund | | | Index
Fund | |
Short-term capital gains | | | | | | | | | | | | | | | | |
Class A | | $ | 0.11227 | | | $ | 0.00000 | | | $ | 0.00000 | | | $ | 0.07590 | |
Class B | | | 0.11227 | | | | N/A | | | | 0.00000 | | | | 0.07590 | |
Class C | | | 0.11227 | | | | 0.00000 | | | | 0.00000 | | | | 0.07590 | |
Class R | | | N/A | | | | N/A | | | | 0.00000 | | | | N/A | |
Administrator Class | | | 0.11227 | | | | 0.00000 | | | | 0.00000 | | | | 0.07590 | |
Institutional Class | | | N/A | | | | 0.00000 | | | | 0.00000 | | | | N/A | |
Investor Class | | | N/A | | | | 0.00000 | | | | N/A | | | | 0.07590 | |
Long-term capital gains | | | | | | | | | | | | | | | | |
Class A | | $ | 1.44805 | | | $ | 0.67894 | | | $ | 0.32270 | | | $ | 0.86238 | |
Class B | | | 1.44805 | | | | N/A | | | | 0.32270 | | | | 0.86238 | |
Class C | | | 1.44805 | | | | 0.67894 | | | | 0.32270 | | | | 0.86238 | |
Class R | | | N/A | | | | N/A | | | | 0.32270 | | | | N/A | |
Administrator Class | | | 1.44805 | | | | 0.67894 | | | | 0.32270 | | | | 0.86238 | |
Institutional Class | | | N/A | | | | 0.67894 | | | | 0.32270 | �� | | | N/A | |
Investor Class | | | N/A | | | | 0.67894 | | | | N/A | | | | 0.86238 | |
| | | | |
| 72 | | Wells Fargo Advantage Equity Gateway Funds | | Notes to financial statements (unaudited) |
On December 17, 2012, the following Funds declared distributions from net investment income to shareholders of record on December 14, 2012. The per share amounts payable on December 18, 2012 were as follows:
| | | | | | | | | | | | | | | | | | | | | | | | | | | | | | | | |
| | | C&B Large
Cap Value
Fund | | | Diversified
Equity
Fund | | | Diversified
Small Cap
Fund | | | Equity
Value
Fund | | | Index
Fund | | | International
Value
Fund | | | Small
Company
Growth
Fund | | | Small
Company
Value
Fund | |
Net investment income | | | | | | | | | | | | | | | | | | | | | | | | | | | | | |
Class A | | $ | 0.12853 | | | $ | 0.23769 | | | | N/A | | | $ | 0.18523 | | | $ | 0.82566 | | | $ | 0.26268 | | | $ | 0.00000 | | | $ | 0.00000 | |
Class B | | | 0.00000 | | | | 0.00000 | | | | N/A | | | | 0.02913 | | | | 0.26632 | | | | 0.09873 | | | | 0.00000 | | | | 0.00000 | |
Class C | | | 0.06018 | | | | 0.05360 | | | | N/A | | | | 0.09404 | | | | 0.44154 | | | | 0.17596 | | | | 0.00000 | | | | 0.00000 | |
Class R | | | N/A | | | | N/A | | | | N/A | | | | 0.16203 | | | | N/A | | | | N/A | | | | N/A | | | | N/A | |
Administrator Class | | | 0.14734 | | | | 0.31090 | | | $ | 0.04628 | | | | 0.21344 | | | | 0.97421 | | | | 0.29425 | | | | 0.06486 | | | | 0.01294 | |
Institutional Class | | | 0.17020 | | | | N/A | | | | N/A | | | | 0.22958 | | | | N/A | | | | 0.31730 | | | | 0.14373 | | | | 0.04591 | |
Investor Class | | | 0.12180 | | | | N/A | | | | N/A | | | | N/A | | | | 0.88027 | | | | N/A | | | | NA | | | | N/A | |
These distributions are not reflected in the accompanying financial statements.
12. REORGANIZATIONS
At a regular meeting of the Board of Trustees held on November 6-7, 2012, the Trustees of Diversified Small Cap Fund approved a Plan of Reorganization (the “Plan”). Under the Plan, Wells Fargo Advantage Small Company Growth Fund will acquire the assets and assume the liabilities of the Diversified Small Cap Fund in exchange for shares of Wells Fargo Advantage Small Company Growth Fund.
In addition, the Trustees of Equity Value Fund also approved a Plan for Wells Fargo Advantage Intrinsic Value Fund to acquire the assets and assume the liabilities of Equity Value Fund in exchange for shares of Wells Fargo Advantage Intrinsic Value Fund.
A special meeting of shareholders of each Fund will be held on February 22, 2013 to consider and vote on each Plan. On December 26, 2012, materials for these meetings were mailed to shareholders of record on November 30, 2012. If approved, each merger is scheduled to take place on or about March 1, 2013.
| | | | | | |
| Portfolio of investments—November 30, 2012 (unaudited) | | Wells Fargo Advantage Equity Gateway Funds | | | 73 | |
C&B LARGE CAP VALUE PORTFOLIO
| | | | | | | | | | | | |
| Security name | | | | | | Shares | | | Value | |
| | | | | | | | | | | | |
| | | | |
Common Stocks: 97.17% | | | | | | | | | | | | |
| | | | |
Consumer Discretionary: 16.12% | | | | | | | | | | | | |
| | | | |
| Hotels, Restaurants & Leisure: 5.87% | | | | | | | | | | | | |
Carnival Corporation « | | | | | | | 145,100 | | | $ | 5,609,566 | |
Darden Restaurants Incorporated « | | | | | | | 107,300 | | | | 5,674,024 | |
McDonald’s Corporation | | | | | | | 85,400 | | | | 7,433,216 | |
| | | | |
| | | | | | | | | | | 18,716,806 | |
| | | | | | | | | | | | |
| | | | |
| Household Durables: 3.33% | | | | | | | | | | | | |
NVR Incorporated † | | | | | | | 11,800 | | | | 10,618,112 | |
| | | | | | | | | | | | |
| | | | |
| Media: 3.44% | | | | | | | | | | | | |
Omnicom Group Incorporated « | | | | | | | 220,700 | | | | 10,977,618 | |
| | | | | | | | | | | | |
| | | | |
| Multiline Retail: 2.39% | | | | | | | | | | | | |
Kohl’s Corporation | | | | | | | 170,500 | | | | 7,612,825 | |
| | | | | | | | | | | | |
| | | | |
| Specialty Retail: 1.09% | | | | | | | | | | | | |
Best Buy Company Incorporated « | | | | | | | 265,000 | | | | 3,474,150 | |
| | | | | | | | | | | | |
| | | | |
Consumer Staples: 11.69% | | | | | | | | | | | | |
| | | | |
| Beverages: 3.19% | | | | | | | | | | | | |
Coca-Cola Enterprises Incorporated | | | | | | | 168,900 | | | | 5,266,302 | |
Diageo plc ADR « | | | | | | | 40,960 | | | | 4,897,587 | |
| | | | |
| | | | | | | | | | | 10,163,889 | |
| | | | | | | | | | | | |
| | | | |
| Household Products: 5.52% | | | | | | | | | | | | |
Colgate-Palmolive Company | | | | | | | 57,300 | | | | 6,217,050 | |
Henkel AG & Company KGaA ADR | | | | | | | 68,000 | | | | 4,607,741 | |
Procter & Gamble Company | | | | | | | 96,900 | | | | 6,766,527 | |
| | | | |
| | | | | | | | | | | 17,591,318 | |
| | | | | | | | | | | | |
| | | | |
| Personal Products: 1.03% | | | | | | | | | | | | |
Avon Products Incorporated | | | | | | | 235,500 | | | | 3,285,225 | |
| | | | | | | | | | | | |
| | | | |
| Tobacco: 1.95% | | | | | | | | | | | | |
Philip Morris International | | | | | | | 69,400 | | | | 6,237,672 | |
| | | | | | | | | | | | |
| | | | |
Energy: 6.28% | | | | | | | | | | | | |
| | | | |
| Oil, Gas & Consumable Fuels: 6.28% | | | | | | | | | | | | |
Chevron Corporation | | | | | | | 57,800 | | | | 6,108,882 | |
Devon Energy Corporation | | | | | | | 92,900 | | | | 4,800,143 | |
Exxon Mobil Corporation | | | | | | | 103,500 | | | | 9,122,490 | |
| | | | |
| | | | | | | | | | | 20,031,515 | |
| | | | | | | | | | | | |
| | | | |
Financials: 20.40% | | | | | | | | | | | | |
| | | | |
| Capital Markets: 5.06% | | | | | | | | | | | | |
Charles Schwab Corporation | | | | | | | 421,900 | | | | 5,526,890 | |
State Street Corporation | | | | | | | 238,900 | | | | 10,616,716 | |
| | | | |
| | | | | | | | | | | 16,143,606 | |
| | | | | | | | | | | | |
The accompanying notes are an integral part of these financial statements.
| | | | |
| 74 | | Wells Fargo Advantage Equity Gateway Funds | | Portfolio of investments—November 30, 2012 (unaudited) |
C&B LARGE CAP VALUE PORTFOLIO
| | | | | | | | | | | | |
| Security name | | | | | | Shares | | | Value | |
| | | | | | | | | | | | |
| | | | |
| Commercial Banks: 1.58% | | | | | | | | | | | | |
PNC Financial Services Group Incorporated | | | | | | | 89,800 | | | $ | 5,041,372 | |
| | | | | | | | | | | | |
| | | | |
| Consumer Finance: 2.70% | | | | | | | | | | | | |
American Express Company | | | | | | | 153,800 | | | | 8,597,420 | |
| | | | | | | | | | | | |
| | | | |
| Diversified Financial Services: 6.48% | | | | | | | | | | | | |
Bank of America Corporation | | | | | | | 431,200 | | | | 4,251,632 | |
Berkshire Hathaway Incorporated Class B † | | | | | | | 72,700 | | | | 6,403,416 | |
JPMorgan Chase & Company | | | | | | | 243,300 | | | | 9,994,764 | |
| | | | |
| | | | | | | | | | | 20,649,812 | |
| | | | | | | | | | | | |
| | | | |
| Insurance: 4.58% | | | | | | | | | | | | |
Axis Capital Holdings Limited | | | | | | | 155,300 | | | | 5,586,141 | |
The Progressive Corporation « | | | | | | | 235,000 | | | | 4,993,750 | |
Willis Group Holdings plc « | | | | | | | 114,600 | | | | 4,020,168 | |
| | | | |
| | | | | | | | | | | 14,600,059 | |
| | | | | | | | | | | | |
| | | | |
Health Care: 11.44% | | | | | | | | | | | | |
| | | | |
| Health Care Equipment & Supplies: 4.06% | | | | | | | | | | | | |
Baxter International Incorporated | | | | | | | 103,400 | | | | 6,852,318 | |
Becton Dickinson & Company « | | | | | | | 79,700 | | | | 6,110,599 | |
| | | | |
| | | | | | | | | | | 12,962,917 | |
| | | | | | | | | | | | |
| | | | |
| Health Care Providers & Services: 4.30% | | | | | | | | | | | | |
Cardinal Health Incorporated | | | | | | | 151,600 | | | | 6,132,220 | |
Quest Diagnostics Incorporated « | | | | | | | 131,200 | | | | 7,580,736 | |
| | | | |
| | | | | | | | | | | 13,712,956 | |
| | | | | | | | | | | | |
| | | | |
| Pharmaceuticals: 3.08% | | | | | | | | | | | | |
Johnson & Johnson Services Incorporated « | | | | | | | 140,700 | | | | 9,811,011 | |
| | | | | | | | | | | | |
| | | | |
Industrials: 11.23% | | | | | | | | | | | | |
| | | | |
| Aerospace & Defense: 2.58% | | | | | | | | | | | | |
Raytheon Company | | | | | | | 143,900 | | | | 8,221,007 | |
| | | | | | | | | | | | |
| | | | |
| Air Freight & Logistics: 1.44% | | | | | | | | | | | | |
United Parcel Service Incorporated Class B | | | | | | | 62,700 | | | | 4,583,997 | |
| | | | | | | | | | | | |
| | | | |
| Commercial Services & Supplies: 2.05% | | | | | | | | | | | | |
Cintas Corporation « | | | | | | | 158,200 | | | | 6,555,808 | |
| | | | | | | | | | | | |
| | | | |
| Industrial Conglomerates: 2.67% | | | | | | | | | | | | |
3M Company | | | | | | | 93,500 | | | | 8,503,825 | |
| | | | | | | | | | | | |
| | | | |
| Machinery: 2.49% | | | | | | | | | | | | |
Illinois Tool Works Incorporated « | | | | | | | 128,800 | | | | 7,930,216 | |
| | | | | | | | | | | | |
The accompanying notes are an integral part of these financial statements.
| | | | | | |
| Portfolio of investments—November 30, 2012 (unaudited) | | Wells Fargo Advantage Equity Gateway Funds | | | 75 | |
C&B LARGE CAP VALUE PORTFOLIO
| | | | | | | | | | | | | | |
| Security name | | | | | | | Shares | | | Value | |
| | | | | | | | | | | | | | |
| | | | |
Information Technology: 12.18% | | | | | | | | | | | | | | |
| | | | |
| Electronic Equipment, Instruments & Components: 4.96% | | | | | | | | | | | | | | |
Flextronics International Limited † | | | | | | | | | 948,400 | | | $ | 5,491,236 | |
Molex Incorporated Class A | | | | | | | | | 206,000 | | | | 4,472,260 | |
TE Connectivity Limited | | | | | | | | | 166,700 | | | | 5,866,173 | |
| | | | |
| | | | | | | | | | | | | 15,829,669 | |
| | | | | | | | | | | | | | |
| | | | |
| IT Services: 3.98% | | | | | | | | | | | | | | |
Fiserv Incorporated † | | | | | | | | | 84,600 | | | | 6,513,354 | |
Western Union Company | | | | | | | | | 489,600 | | | | 6,173,856 | |
| | | | |
| | | | | | | | | | | | | 12,687,210 | |
| | | | | | | | | | | | | | |
| | | | |
| Semiconductors & Semiconductor Equipment: 2.33% | | | | | | | | | | | | | | |
Lam Research Corporation † | | | | | | | | | 211,900 | | | | 7,441,928 | |
| | | | | | | | | | | | | | |
| | | | |
| Software: 0.91% | | | | | | | | | | | | | | |
Microsoft Corporation | | | | | | | | | 108,400 | | | | 2,885,608 | |
| | | | | | | | | | | | | | |
| | | | |
Materials: 3.84% | | | | | | | | | | | | | | |
| | | | |
| Containers & Packaging: 3.84% | | | | | | | | | | | | | | |
Ball Corporation « | | | | | | | | | 161,000 | | | | 7,195,090 | |
Rock-Tenn Company Class A | | | | | | | | | 77,700 | | | | 5,053,609 | |
| | | | |
| | | | | | | | | | | | | 12,248,699 | |
| | | | | | | | | | | | | | |
| | | | |
Telecommunication Services: 2.38% | | | | | | | | | | | | | | |
| | | | |
| Wireless Telecommunication Services: 2.38% | | | | | | | | | | | | | | |
Vodafone Group plc ADR | | | | | | | | | 294,200 | | | | 7,590,360 | |
| | | | | | | | | | | | | | |
| | | | |
Utilities: 1.61% | | | | | | | | | | | | | | |
| | | | |
| Electric Utilities: 1.61% | | | | | | | | | | | | | | |
Entergy Corporation | | | | | | | | | 80,600 | | | | 5,121,324 | |
| | | | | | | | | | | | | | |
| | | | |
Total Common Stocks (Cost $265,963,259) | | | | | | | | | | | | | 309,827,934 | |
| | | | | | | | | | | | | | |
| | | | |
| | | | | Dividend Yield | | | | | | | |
| | | | |
Preferred Stocks: 1.24% | | | | | | | | | | | | | | |
| | | | |
Consumer Staples: 1.24% | | | | | | | | | | | | | | |
| | | | |
| Household Products: 1.24% | | | | | | | | | | | | | | |
Henkel AG & Company KGaA ADR | | | | | 1.25 | % | | | 47,200 | | | | 3,944,178 | |
| | | | | | | | | | | | | | |
| | | | |
Total Preferred Stocks (Cost $1,744,375) | | | | | | | | | | | | | 3,944,178 | |
| | | | | | | | | | | | | | |
| | | | |
| | | | | | | | Principal | | | | |
| | | | |
Other: 0.15% | | | | | | | | | | | | | | |
Gryphon Funding Limited, Pass-Through Entity (a)(i)(v) | | | | | | | | $ | 1,421,993 | | | | 469,258 | |
| | | | | | | | | | | | | | |
| | | | |
Total Other (Cost $134,731) | | | | | | | | | | | | | 469,258 | |
| | | | | | | | | | | | | | |
The accompanying notes are an integral part of these financial statements.
| | | | |
| 76 | | Wells Fargo Advantage Equity Gateway Funds | | Portfolio of investments—November 30, 2012 (unaudited) |
C&B LARGE CAP VALUE PORTFOLIO
| | | | | | | | | | | | | | |
| Security name | | | | Yield | | | Shares | | | Value | |
| | | | | | | | | | | | | | |
| | | | |
Short-Term Investments: 17.65% | | | | | | | | | | | | | | |
| | | | |
| Investment Companies: 17.65% | | | | | | | | | | | | | | |
Wells Fargo Advantage Cash Investment Money Market Fund, Select Class (l)(u) | | | | | 0.16 | % | | | 1,807,073 | | | $ | 1,807,073 | |
Wells Fargo Securities Lending Cash Investments, LLC (l)(u)(v)(r) | | | | | 0.21 | | | | 54,471,494 | | | | 54,471,494 | |
| | | | |
Total Short-Term Investments (Cost $56,278,567) | | | | | | | | | | | | | 56,278,567 | |
| | | | | | | | | | | | | | |
| | | | | | | | |
| Total investments in securities | | | | | | | | |
| (Cost $324,120,932) * | | | 116.21 | % | | | 370,519,937 | |
Other assets and liabilities, net | | | (16.21 | ) | | | (51,673,599 | ) |
| | | | | | | | |
| Total net assets | | | 100.00 | % | | $ | 318,846,338 | |
| | | | | | | | |
| « | All or a portion of this security is on loan. |
| † | Non-income-earning security |
| (a) | Security is fair valued by the Management Valuation Team, and in certain instances by the Board of Trustees, in accordance with procedures approved by the Board of Trustees. |
| (v) | Security represents investment of cash collateral received from securities on loan. |
| (l) | Investment in an affiliate |
| (u) | Rate shown is the 7-day annualized yield at period end. |
| (r) | The investment company is exempt from registration under Section 3(c)(7) of the Investment Company Act of 1940, as amended. |
| * | Cost for federal income tax purposes is $335,714,171 and unrealized appreciation (depreciation) consists of: |
| | | | |
Gross unrealized appreciation | | $ | 48,127,854 | |
Gross unrealized depreciation | | | (13,322,088 | ) |
| | | | |
Net unrealized appreciation | | $ | 34,805,766 | |
The accompanying notes are an integral part of these financial statements.
| | | | | | |
| Portfolio of investments—November 30, 2012 (unaudited) | | Wells Fargo Advantage Equity Gateway Funds | | | 77 | |
DIVERSIFIED LARGE CAP GROWTH PORTFOLIO
| | | | | | | | | | | | |
| Security name | | | | | | Shares | | | Value | |
| | | | | | | | | | | | |
| | | | |
Common Stocks: 98.79% | | | | | | | | | | | | |
| | | | |
Consumer Discretionary: 21.27% | | | | | | | | | | | | |
| | | | |
| Auto Components: 0.10% | | | | | | | | | | | | |
BorgWarner Incorporated † | | | | | | | 2,200 | | | $ | 145,860 | |
| | | | | | | | | | | | |
| | | | |
| Distributors: 0.16% | | | | | | | | | | | | |
LKQ Corporation † | | | | | | | 11,100 | | | | 243,312 | |
| | | | | | | | | | | | |
| | | | |
| Hotels, Restaurants & Leisure: 4.08% | | | | | | | | | | | | |
Chipotle Mexican Grill Incorporated Ǡ | | | | | | | 4,350 | | | | 1,147,443 | |
Marriott International Incorporated Class A « | | | | | | | 18,400 | | | | 667,736 | |
McDonald’s Corporation | | | | | | | 12,690 | | | | 1,104,538 | |
Starbucks Corporation | | | | | | | 54,751 | | | | 2,839,934 | |
Wynn Resorts Limited | | | | | | | 2,800 | | | | 314,720 | |
| | | | |
| | | | | | | | | | | 6,074,371 | |
| | | | | | | | | | | | |
| | | | |
| Internet & Catalog Retail: 3.31% | | | | | | | | | | | | |
Amazon.com Incorporated Ǡ | | | | | | | 10,760 | | | | 2,712,058 | |
priceline.com Incorporated † | | | | | | | 3,345 | | | | 2,218,270 | |
| | | | |
| | | | | | | | | | | 4,930,328 | |
| | | | | | | | | | | | |
| | | | |
| Media: 1.33% | | | | | | | | | | | | |
CBS Corporation Class B | | | | | | | 24,330 | | | | 875,393 | |
Liberty Media Corporation Ǡ | | | | | | | 10,106 | | | | 1,111,559 | |
| | | | |
| | | | | | | | | | | 1,986,952 | |
| | | | | | | | | | | | |
| | | | |
| Multiline Retail: 3.95% | | | | | | | | | | | | |
Dollar General Corporation † | | | | | | | 49,121 | | | | 2,456,050 | |
Dollar Tree Incorporated † | | | | | | | 57,180 | | | | 2,386,693 | |
Nordstrom Incorporated | | | | | | | 19,300 | | | | 1,043,937 | |
| | | | |
| | | | | | | | | | | 5,886,680 | |
| | | | | | | | | | | | |
| | | | |
| Specialty Retail: 6.08% | | | | | | | | | | | | |
CarMax Incorporated Ǡ | | | | | | | 36,170 | | | | 1,311,524 | |
Dick’s Sporting Goods Incorporated « | | | | | | | 21,715 | | | | 1,140,255 | |
GNC Holdings Incorporated Class A | | | | | | | 20,500 | | | | 720,165 | |
Home Depot Incorporated | | | | | | | 13,810 | | | | 898,617 | |
Limited Brands Incorporated | | | | | | | 30,150 | | | | 1,572,323 | |
O’Reilly Automotive Incorporated † | | | | | | | 4,600 | | | | 432,768 | |
Ross Stores Incorporated | | | | | | | 8,900 | | | | 506,588 | |
TJX Companies Incorporated | | | | | | | 29,250 | | | | 1,296,945 | |
Tractor Supply Company « | | | | | | | 9,700 | | | | 869,314 | |
Ulta Salon Cosmetics & Fragrance Incorporated | | | | | | | 3,000 | | | | 300,840 | |
| | | | |
| | | | | | | | | | | 9,049,339 | |
| | | | | | | | | | | | |
| | | | |
| Textiles, Apparel & Luxury Goods: 2.26% | | | | | | | | | | | | |
lululemon athletica incorporated Ǡ | | | | | | | 23,330 | | | | 1,674,627 | |
Michael Kors Holdings Limited † | | | | | | | 10,305 | | | | 547,711 | |
Nike Incorporated Class B | | | | | | | 6,900 | | | | 672,612 | |
The accompanying notes are an integral part of these financial statements.
| | | | |
| 78 | | Wells Fargo Advantage Equity Gateway Funds | | Portfolio of investments—November 30, 2012 (unaudited) |
DIVERSIFIED LARGE CAP GROWTH PORTFOLIO
| | | | | | | | | | | | |
| Security name | | | | | | Shares | | | Value | |
| | | | | | | | | | | | |
| | | | |
| Textiles, Apparel & Luxury Goods (continued) | | | | | | | | | | | | |
Under Armour Incorporated Class A Ǡ | | | | | | | 1,900 | | | $ | 98,477 | |
VF Corporation « | | | | | | | 2,300 | | | | 369,173 | |
| | | | |
| | | | | | | | | | | 3,362,600 | |
| | | | | | | | | | | | |
| | | | |
Consumer Staples: 6.57% | | | | | | | | | | | | |
| | | | |
| Beverages: 1.83% | | | | | | | | | | | | |
Anheuser-Busch Companies Incorporated ADR | | | | | | | 12,450 | | | | 1,095,227 | |
Monster Beverage Corporation † | | | | | | | 12,000 | | | | 624,600 | |
The Coca-Cola Company | | | | | | | 26,500 | | | | 1,004,880 | |
| | | | |
| | | | | | | | | | | 2,724,707 | |
| | | | | | | | | | | | |
| | | | |
| Food & Staples Retailing: 3.64% | | | | | | | | | | | | |
Costco Wholesale Corporation | | | | | | | 12,900 | | | | 1,341,471 | |
Walgreen Company « | | | | | | | 13,100 | | | | 444,221 | |
Whole Foods Market Incorporated | | | | | | | 38,930 | | | | 3,634,505 | |
| | | | |
| | | | | | | | | | | 5,420,197 | |
| | | | | | | | | | | | |
| | | | |
| Food Products: 0.79% | | | | | | | | | | | | |
Mead Johnson Nutrition Company | | | | | | | 4,400 | | | | 300,036 | |
The Hershey Company | | | | | | | 12,000 | | | | 879,240 | |
| | | | |
| | | | | | | | | | | 1,179,276 | |
| | | | | | | | | | | | |
| | | | |
| Personal Products: 0.31% | | | | | | | | | | | | |
Estee Lauder Companies Incorporated Class A | | | | | | | 7,900 | | | | 460,175 | |
| | | | | | | | | | | | |
| | | | |
Energy: 5.36% | | | | | | | | | | | | |
| | | | |
| Energy Equipment & Services: 1.46% | | | | | | | | | | | | |
National Oilwell Varco Incorporated | | | | | | | 13,735 | | | | 938,101 | |
Schlumberger Limited | | | | | | | 17,376 | | | | 1,244,469 | |
| | | | |
| | | | | | | | | | | 2,182,570 | |
| | | | | | | | | | | | |
| | | | |
| Oil, Gas & Consumable Fuels: 3.90% | | | | | | | | | | | | |
Concho Resources Incorporated † | | | | | | | 17,760 | | | | 1,425,418 | |
Continental Resources Incorporated Ǡ | | | | | | | 5,060 | | | | 347,622 | |
Energy XXI (Bermuda) Limited « | | | | | | | 9,800 | | | | 310,464 | |
Pioneer Natural Resources Company | | | | | | | 27,320 | | | | 2,923,240 | |
The Williams Companies Incorporated | | | | | | | 24,290 | | | | 797,684 | |
| | | | |
| | | | | | | | | | | 5,804,428 | |
| | | | | | | | | | | | |
| | | | |
Financials: 3.10% | | | | | | | | | | | | |
| | | | |
| Capital Markets: 1.51% | | | | | | | | | | | | |
Ameriprise Financial Incorporated | | | | | | | 22,630 | | | | 1,372,962 | |
TD Ameritrade Holding Corporation | | | | | | | 54,480 | | | | 882,576 | |
| | | | |
| | | | | | | | | | | 2,255,538 | |
| | | | | | | | | | | | |
| | | | |
| Consumer Finance: 1.59% | | | | | | | | | | | | |
American Express Company | | | | | | | 26,634 | | | | 1,488,841 | |
Capital One Financial Corporation | | | | | | | 12,620 | | | | 726,912 | |
Discover Financial Services | | | | | | | 3,700 | | | | 153,957 | |
| | | | |
| | | | | | | | | | | 2,369,710 | |
| | | | | | | | | | | | |
The accompanying notes are an integral part of these financial statements.
| | | | | | |
| Portfolio of investments—November 30, 2012 (unaudited) | | Wells Fargo Advantage Equity Gateway Funds | | | 79 | |
DIVERSIFIED LARGE CAP GROWTH PORTFOLIO
| | | | | | | | | | | | |
| Security name | | | | | | Shares | | | Value | |
| | | | | | | | | | | | |
| | | | |
Health Care: 13.66% | | | | | | | | | | | | |
| | | | |
| Biotechnology: 5.20% | | | | | | | | | | | | |
Alexion Pharmaceuticals Incorporated † | | | | | | | 36,905 | | | $ | 3,543,618 | |
Biogen Idec Incorporated † | | | | | | | 6,000 | | | | 894,540 | |
BioMarin Pharmaceutical Incorporated † | | | | | | | 2,700 | | | | 131,220 | |
Celgene Corporation † | | | | | | | 10,700 | | | | 840,913 | |
Gilead Sciences Incorporated Ǡ | | | | | | | 28,180 | | | | 2,113,500 | |
Onyx Pharmaceuticals Incorporated Ǡ | | | | | | | 2,900 | | | | 218,863 | |
| | | | |
| | | | | | | | | | | 7,742,654 | |
| | | | | | | | | | | | |
| | | | |
| Health Care Equipment & Supplies: 2.17% | | | | | | | | | | | | |
Covidien plc | | | | | | | 12,900 | | | | 749,619 | |
Intuitive Surgical Incorporated Ǡ | | | | | | | 4,690 | | | | 2,481,010 | |
| | | | |
| | | | | | | | | | | 3,230,629 | |
| | | | | | | | | | | | |
| | | | |
| Health Care Providers & Services: 1.92% | | | | | | | | | | | | |
AmerisourceBergen Corporation « | | | | | | | 21,403 | | | | 903,635 | |
Catamaran Corporation † | | | | | | | 19,400 | | | | 944,586 | |
Express Scripts Holding Corporation † | | | | | | | 3,200 | | | | 172,320 | |
UnitedHealth Group Incorporated | | | | | | | 15,600 | | | | 848,484 | |
| | | | |
| | | | | | | | | | | 2,869,025 | |
| | | | | | | | | | | | |
| | | | |
| Health Care Technology: 1.22% | | | | | | | | | | | | |
Cerner Corporation Ǡ | | | | | | | 23,500 | | | | 1,814,670 | |
| | | | | | | | | | | | |
| | | | |
| Life Sciences Tools & Services: 0.44% | | | | | | | | | | | | |
Mettler-Toledo International Incorporated Ǡ | | | | | | | 3,480 | | | | 651,073 | |
| | | | | | | | | | | | |
| | | | |
| Pharmaceuticals: 2.71% | | | | | | | | | | | | |
Abbott Laboratories | | | | | | | 17,500 | | | | 1,137,500 | |
Allergan Incorporated | | | | | | | 17,140 | | | | 1,589,735 | |
Shire plc ADR | | | | | | | 13,570 | | | | 1,175,569 | |
Watson Pharmaceuticals Incorporated † | | | | | | | 1,500 | | | | 132,015 | |
| | | | |
| | | | | | | | | | | 4,034,819 | |
| | | | | | | | | | | | |
| | | | |
Industrials: 9.85% | | | | | | | | | | | | |
| | | | |
| Aerospace & Defense: 2.44% | | | | | | | | | | | | |
Precision Castparts Corporation | | | | | | | 13,037 | | | | 2,390,855 | |
United Technologies Corporation | | | | | | | 15,480 | | | | 1,240,103 | |
| | | | |
| | | | | | | | | | | 3,630,958 | |
| | | | | | | | | | | | |
| | | | |
| Air Freight & Logistics: 0.19% | | | | | | | | | | | | |
United Parcel Service Incorporated Class B | | | | | | | 3,900 | | | | 285,129 | |
| | | | | | | | | | | | |
| | | | |
| Industrial Conglomerates: 1.54% | | | | | | | | | | | | |
Danaher Corporation | | | | | | | 42,630 | | | | 2,300,741 | |
| | | | | | | | | | | | |
The accompanying notes are an integral part of these financial statements.
| | | | |
| 80 | | Wells Fargo Advantage Equity Gateway Funds | | Portfolio of investments—November 30, 2012 (unaudited) |
DIVERSIFIED LARGE CAP GROWTH PORTFOLIO
| | | | | | | | | | | | |
| Security name | | | | | | Shares | | | Value | |
| | | | | | | | | | | | |
| | | | |
| Machinery: 1.09% | | | | | | | | | | | | |
Cummins Incorporated « | | | | | | | 9,249 | | | $ | 907,882 | |
Flowserve Corporation | | | | | | | 1,600 | | | | 221,680 | |
Joy Global Incorporated « | | | | | | | 8,719 | | | | 496,896 | |
| | | | |
| | | | | | | | | | | 1,626,458 | |
| | | | | | | | | | | | |
| | | | |
| Road & Rail: 3.99% | | | | | | | | | | | | |
Hertz Global Holdings Incorporated Ǡ | | | | | | | 64,660 | | | | 1,011,282 | |
Kansas City Southern Railway Company « | | | | | | | 17,880 | | | | 1,397,322 | |
Norfolk Southern Corporation | | | | | | | 5,300 | | | | 320,014 | |
Union Pacific Corporation | | | | | | | 26,149 | | | | 3,210,574 | |
| | | | |
| | | | | | | | | | | 5,939,192 | |
| | | | | | | | | | | | |
| | | | |
| Trading Companies & Distributors: 0.60% | | | | | | | | | | | | |
W.W. Grainger Incorporated | | | | | | | 4,600 | | | | 892,492 | |
| | | | | | | | | | | | |
| | | | |
Information Technology: 33.96% | | | | | | | | | | | | |
| | | | |
| Communications Equipment: 2.79% | | | | | | | | | | | | |
Cisco Systems Incorporated | | | | | | | 25,700 | | | | 485,987 | |
Palo Alto Networks Incorporated Ǡ | | | | | | | 2,433 | | | | 132,404 | |
QUALCOMM Incorporated | | | | | | | 55,700 | | | | 3,543,634 | |
| | | | |
| | | | | | | | | | | 4,162,025 | |
| | | | | | | | | | | | |
| | | | |
| Computers & Peripherals: 8.92% | | | | | | | | | | | | |
Apple Incorporated | | | | | | | 20,291 | | | | 11,875,916 | |
EMC Corporation † | | | | | | | 56,632 | | | | 1,405,606 | |
| | | | |
| | | | | | | | | | | 13,281,522 | |
| | | | | | | | | | | | |
| | | | |
| Internet Software & Services: 9.42% | | | | | | | | | | | | |
Akamai Technologies Incorporated † | | | | | | | 1,400 | | | | 51,268 | |
Baidu.com Incorporated ADR Ǡ | | | | | | | 4,171 | | | | 401,709 | |
eBay Incorporated † | | | | | | | 104,480 | | | | 5,518,634 | |
Facebook Incorporated † | | | | | | | 2,600 | | | | 72,800 | |
Google Incorporated Class A † | | | | | | | 7,594 | | | | 5,303,422 | |
LinkedIn Corporation † | | | | | | | 6,730 | | | | 727,782 | |
Mercadolibre Incorporated « | | | | | | | 5,300 | | | | 381,335 | |
Rackspace Hosting Incorporated Ǡ | | | | | | | 22,840 | | | | 1,578,701 | |
| | | | |
| | | | | | | | | | | 14,035,651 | |
| | | | | | | | | | | | |
| | | | |
| IT Services: 6.62% | | | | | | | | | | | | |
Accenture plc « | | | | | | | 8,600 | | | | 584,112 | |
Alliance Data Systems Corporation Ǡ | | | | | | | 5,600 | | | | 797,944 | |
Cognizant Technology Solutions Corporation Class A † | | | | | | | 42,750 | | | | 2,874,083 | |
MasterCard Incorporated Class A | | | | | | | 4,510 | | | | 2,203,947 | |
Teradata Corporation † | | | | | | | 7,400 | | | | 440,152 | |
Visa Incorporated Class A « | | | | | | | 19,770 | | | | 2,959,767 | |
| | | | |
| | | | | | | | | | | 9,860,005 | |
| | | | | | | | | | | | |
The accompanying notes are an integral part of these financial statements.
| | | | | | |
| Portfolio of investments—November 30, 2012 (unaudited) | | Wells Fargo Advantage Equity Gateway Funds | | | 81 | |
DIVERSIFIED LARGE CAP GROWTH PORTFOLIO
| | | | | | | | | | | | | | |
| Security name | | | | | | | Shares | | | Value | |
| | | | | | | | | | | | | | |
| | | | |
| Semiconductors & Semiconductor Equipment: 2.25% | | | | | | | | | | | | | | |
Avago Technologies Limited | | | | | | | | | 11,500 | | | $ | 403,650 | |
Broadcom Corporation Class A | | | | | | | | | 24,796 | | | | 802,894 | |
Linear Technology Corporation | | | | | | | | | 5,600 | | | | 185,864 | |
Maxim Integrated Products Incorporated | | | | | | | | | 20,740 | | | | 605,401 | |
Microchip Technology Incorporated « | | | | | | | | | 44,440 | | | | 1,351,865 | |
| | | | |
| | | | | | | | | | | | | 3,349,674 | |
| | | | | | | | | | | | | | |
| | | | |
| Software: 3.96% | | | | | | | | | | | | | | |
Citrix Systems Incorporated † | | | | | | | | | 15,010 | | | | 918,012 | |
Fortinet Incorporated † | | | | | | | | | 28,100 | | | | 561,438 | |
Red Hat Incorporated † | | | | | | | | | 21,311 | | | | 1,052,763 | |
Salesforce.com Incorporated Ǡ | | | | | | | | | 11,281 | | | | 1,778,675 | |
VMware Incorporated Ǡ | | | | | | | | | 17,500 | | | | 1,591,625 | |
| | | | |
| | | | | | | | | | | | | 5,902,513 | |
| | | | | | | | | | | | | | |
| | | | |
Materials: 3.99% | | | | | | | | | | | | | | |
| | | | |
| Chemicals: 3.99% | | | | | | | | | | | | | | |
Airgas Incorporated | | | | | | | | | 3,200 | | | | 283,424 | |
Ecolab Incorporated | | | | | | | | | 10,600 | | | | 764,048 | |
Monsanto Company | | | | | | | | | 32,310 | | | | 2,959,270 | |
Praxair Incorporated | | | | | | | | | 18,050 | | | | 1,935,141 | |
| | | | |
| | | | | | | | | | | | | 5,941,883 | |
| | | | | | | | | | | | | | |
| | | | |
Telecommunication Services: 1.03% | | | | | | | | | | | | | | |
| | | | |
| Wireless Telecommunication Services: 1.03% | | | | | | | | | | | | | | |
Crown Castle International Corporation † | | | | | | | | | 22,660 | | | | 1,530,003 | |
| | | | | | | | | | | | | | |
| | | | |
Total Common Stocks (Cost $125,151,792) | | | | | | | | | | | | | 147,157,159 | |
| | | | | | | | | | | | | | |
| | | | |
| | | | | | | | Principal | | | | |
| | | | |
Other: 0.31% | | | | | | | | | | | | | | |
Gryphon Funding Limited, Pass-Through Entity (a)(i)(v) | | | | | | | | $ | 1,413,568 | | | | 466,478 | |
| | | | | | | | | | | | | | |
| | | | |
Total Other (Cost $133,933) | | | | | | | | | | | | | 466,478 | |
| | | | | | | | | | | | | | |
| | | | |
| | | | | Yield | | | Shares | | | | |
| Short-Term Investments: 21.55% | | | | | | | | | | | | | | |
| Investment Companies: 21.55% | | | | | | | | | | | | | | |
Wells Fargo Advantage Cash Investment Money Market Fund, Select Class (u)(l) | | | | | 0.16 | % | | | 1,362,764 | | | | 1,362,764 | |
Wells Fargo Securities Lending Cash Investments, LLC (v)(l)(u)(r) | | | | | 0.21 | | | | 30,742,017 | | | | 30,742,017 | |
| | | | |
Total Short-Term Investments (Cost $32,104,781) | | | | | | | | | | | | | 32,104,781 | |
| | | | | | | | | | | | | | |
| | | | | | | | |
| Total investments in securities | | | | | | | | |
| (Cost $157,390,506) * | | | 120.65 | % | | | 179,728,418 | |
Other assets and liabilities, net | | | (20.65 | ) | | | (30,765,249 | ) |
| | | | | | | | |
| Total net assets | | | 100.00 | % | | $ | 148,963,169 | |
| | | | | | | | |
The accompanying notes are an integral part of these financial statements.
| | | | |
| 82 | | Wells Fargo Advantage Equity Gateway Funds | | Portfolio of investments—November 30, 2012 (unaudited) |
DIVERSIFIED LARGE CAP GROWTH PORTFOLIO
| † | Non-income-earning security |
| « | All or a portion of this security is on loan. |
| (a) | Security is fair valued by the Management Valuation Team, and in certain instances by the Board of Trustees, in accordance with procedures approved by the Board of Trustees. |
| (v) | Security represents investment of cash collateral received from securities on loan. |
| (l) | Investment in an affiliate |
| (u) | Rate shown is the 7-day annualized yield at period end. |
| (r) | The investment company is exempt from registration under Section 3(c)(7) of the Investment Company Act of 1940, as amended. |
| * | Cost for federal income tax purposes is $159,804,843 and unrealized appreciation (depreciation) consists of: |
| | | | |
Gross unrealized appreciation | | $ | 22,172,146 | |
Gross unrealized depreciation | | | (2,248,571 | ) |
| | | | |
Net unrealized appreciation | | $ | 19,923,575 | |
The accompanying notes are an integral part of these financial statements.
| | | | | | |
| Portfolio of investments—November 30, 2012 (unaudited) | | Wells Fargo Advantage Equity Gateway Funds | | | 83 | |
EMERGING GROWTH PORTFOLIO
| | | | | | | | | | | | |
| Security name | | | | | | Shares | | | Value | |
| | | | | | | | | | | | |
| | | | |
Common Stocks: 98.15% | | | | | | | | | | | | |
| | | | |
Consumer Discretionary: 14.75% | | | | | | | | | | | | |
| | | | |
| Hotels, Restaurants & Leisure: 4.12% | | | | | | | | | | | | |
Ignite Restaurant Group Incorporated † | | | | | | | 335,164 | | | $ | 4,256,583 | |
Life Time Fitness Incorporated Ǡ | | | | | | | 531,670 | | | | 25,020,390 | |
SHFL entertainment Incorporated Ǡ | | | | | | | 645,017 | | | | 8,875,434 | |
| | | | |
| | | | | | | | | | | 38,152,407 | |
| | | | | | | | | | | | |
| | | | |
| Household Durables: 0.58% | | | | | | | | | | | | |
SodaStream International Limited Ǡ | | | | | | | 133,900 | | | | 5,339,932 | |
| | | | | | | | | | | | |
| | | | |
| Internet & Catalog Retail : 2.94% | | | | | | | | | | | | |
HomeAway Incorporated Ǡ | | | | | | | 571,345 | | | | 11,701,146 | |
Shutterfly Incorporated Ǡ | | | | | | | 574,685 | | | | 15,487,761 | |
| | | | |
| | | | | | | | | | | 27,188,907 | |
| | | | | | | | | | | | |
| | | | |
| Media: 1.72% | | | | | | | | | | | | |
IMAX Corporation Ǡ | | | | | | | 736,710 | | | | 15,949,772 | |
| | | | | | | | | | | | |
| | | | |
| Specialty Retail: 5.39% | | | | | | | | | | | | |
Asbury Automotive Group Incorporated † | | | | | | | 324,700 | | | | 9,802,693 | |
DSW Incorporated Class A « | | | | | | | 267,800 | | | | 18,218,434 | |
Hibbett Sports Incorporated Ǡ | | | | | | | 70,050 | | | | 3,764,487 | |
Vitamin Shoppe Incorporated Ǡ | | | | | | | 304,280 | | | | 18,031,633 | |
| | | | |
| | | | | | | | | | | 49,817,247 | |
| | | | | | | | | | | | |
| | | | |
Consumer Staples: 2.36% | | | | | | | | | | | | |
| | | | |
| Food & Staples Retailing: 2.36% | | | | | | | | | | | | |
The Fresh Market Incorporated Ǡ | | | | | | | 316,970 | | | | 16,428,555 | |
United Natural Foods Incorporated † | | | | | | | 104,100 | | | | 5,389,257 | |
| | | | |
| | | | | | | | | | | 21,817,812 | |
| | | | | | | | | | | | |
| | | | |
Energy: 6.17% | | | | | | | | | | | | |
| | | | |
| Energy Equipment & Services: 0.63% | | | | | | | | | | | | |
Forum Energy Technologies Incorporated Ǡ | | | | | | | 229,727 | | | | 5,798,309 | |
| | | | | | | | | | | | |
| | | | |
| Oil, Gas & Consumable Fuels: 5.54% | | | | | | | | | | | | |
Approach Resources Incorporated † | | | | | | | 689,070 | | | | 16,186,254 | |
Carrizo Oil & Gas Incorporated Ǡ | | | | | | | 163,445 | | | | 3,391,484 | |
Diamondback Energy Incorporated† | | | | | | | 233,357 | | | | 4,200,426 | |
Kodiak Oil & Gas Corporation Ǡ | | | | | | | 806,700 | | | | 6,921,486 | |
Laredo Petroleum Holdings Incorporated Ǡ | | | | | | | 498,531 | | | | 9,482,060 | |
Oasis Petroleum Incorporated Ǡ | | | | | | | 368,100 | | | | 11,123,982 | |
| | | | |
| | | | | | | | | | | 51,305,692 | |
| | | | | | | | | | | | |
| | | | |
Financials: 3.25% | | | | | | | | | | | | |
| | | | |
| Capital Markets: 2.79% | | | | | | | | | | | | |
Financial Engines Incorporated Ǡ | | | | | | | 985,130 | | | | 25,830,109 | |
| | | | | | | | | | | | |
The accompanying notes are an integral part of these financial statements.
| | | | |
| 84 | | Wells Fargo Advantage Equity Gateway Funds | | Portfolio of investments—November 30, 2012 (unaudited) |
EMERGING GROWTH PORTFOLIO
| | | | | | | | | | | | |
| Security name | | | | | | Shares | | | Value | |
| | | | | | | | | | | | |
| | | | |
| Insurance: 0.46% | | | | | | | | | | | | |
eHealth Incorporated † | | | | | | | 166,000 | | | $ | 4,282,800 | |
| | | | | | | | | | | | |
| | | | |
Health Care: 19.99% | | | | | | | | | | | | |
| | | | |
| Biotechnology: 1.46% | | | | | | | | | | | | |
Cepheid Incorporated Ǡ | | | | | | | 154,100 | | | | 4,995,922 | |
Exact Sciences Corporation † | | | | | | | 265,420 | | | | 2,603,770 | |
Genomic Health Incorporated Ǡ | | | | | | | 100,800 | | | | 2,788,128 | |
Infinity Pharmaceuticals Incorporated Ǡ | | | | | | | 99,200 | | | | 2,514,720 | |
Raptor Pharmaceutical Corporation† | | | | | | | 105,200 | | | | 556,508 | |
| | | | |
| | | | | | | | | | | 13,459,048 | |
| | | | | | | | | | | | |
| | | | |
| Health Care Equipment & Supplies: 11.66% | | | | | | | | | | | | |
Abiomed Incorporated Ǡ | | | | | | | 230,600 | | | | 3,078,510 | |
Align Technology Incorporated Ǡ | | | | | | | 666,200 | | | | 18,247,218 | |
Cynosure Incorporated Class A † | | | | | | | 351,178 | | | | 7,908,529 | |
DexCom Incorporated Ǡ | | | | | | | 516,770 | | | | 6,759,352 | |
Endologix Incorporated † | | | | | | | 1,883,094 | | | | 27,606,158 | |
HeartWare International Incorporated Ǡ | | | | | | | 74,700 | | | | 6,148,557 | |
Masimo Corporation « | | | | | | | 423,450 | | | | 8,773,884 | |
Novadaq Technologies Incorporated † | | | | | | | 531,900 | | | | 4,701,996 | |
NxStage Medical Incorporated † | | | | | | | 1,145,560 | | | | 13,769,631 | |
Volcano Corporation Ǡ | | | | | | | 399,530 | | | | 10,891,188 | |
| | | | |
| | | | | | | | | | | 107,885,023 | |
| | | | | | | | | | | | |
| | | | |
| Health Care Providers & Services: 1.00% | | | | | | | | | | | | |
MWI Veterinary Supply Incorporated † | | | | | | | 82,800 | | | | 9,243,792 | |
| | | | | | | | | | | | |
| | | | |
| Health Care Technology: 0.55% | | | | | | | | | | | | |
Healthstream Incorporated † | | | | | | | 215,400 | | | | 5,109,288 | |
| | | | | | | | | | | | |
| | | | |
| Pharmaceuticals: 5.32% | | | | | | | | | | | | |
Akorn Incorporated Ǡ | | | | | | | 1,903,535 | | | | 25,678,687 | |
Impax Laboratories Incorporated † | | | | | | | 359,240 | | | | 7,306,942 | |
Jazz Pharmaceuticals plc Ǡ | | | | | | | 301,480 | | | | 16,243,742 | |
| | | | |
| | | | | | | | | | | 49,229,371 | |
| | | | | | | | | | | | |
| | | | |
Industrials: 16.37% | | | | | | | | | | | | |
| | | | |
| Commercial Services & Supplies: 1.61% | | | | | | | | | | | | |
InnerWorkings Incorporated Ǡ | | | | | | | 1,141,673 | | | | 14,853,166 | |
| | | | | | | | | | | | |
| | | | |
| Electrical Equipment: 0.85% | | | | | | | | | | | | |
Thermon Group Holdings Incorporated † | | | | | | | 319,147 | | | | 7,892,505 | |
| | | | | | | | | | | | |
| | | | |
| Machinery: 3.12% | | | | | | | | | | | | |
Chart Industries Incorporated Ǡ | | | | | | | 176,185 | | | | 10,655,669 | |
Proto Labs Incorporated † | | | | | | | 134,155 | | | | 4,893,974 | |
The Middleby Corporation Ǡ | | | | | | | 104,850 | | | | 13,356,842 | |
| | | | |
| | | | | | | | | | | 28,906,485 | |
| | | | | | | | | | | | |
The accompanying notes are an integral part of these financial statements.
| | | | | | |
| Portfolio of investments—November 30, 2012 (unaudited) | | Wells Fargo Advantage Equity Gateway Funds | | | 85 | |
EMERGING GROWTH PORTFOLIO
| | | | | | | | | | | | |
| Security name | | | | | | Shares | | | Value | |
| | | | | | | | | | | | |
| | | | |
| Professional Services: 5.27% | | | | | | | | | | | | |
Advisory Board Company Ǡ | | | | | | | 316,900 | | | $ | 14,339,725 | |
Corporate Executive Board Company | | | | | | | 191,000 | | | | 8,174,800 | |
Mistras Group Incorporated † | | | | | | | 349,498 | | | | 7,580,612 | |
On Assignment Incorporated Ǡ | | | | | | | 934,013 | | | | 18,614,879 | |
| | | | |
| | | | | | | | | | | 48,710,016 | |
| | | | | | | | | | | | |
| | | | |
| Road & Rail: 2.95% | | | | | | | | | | | | |
Genesee & Wyoming Incorporated Ǡ | | | | | | | 374,110 | | | | 27,291,325 | |
| | | | | | | | | | | | |
| | | | |
| Trading Companies & Distributors: 2.57% | | | | | | | | | | | | |
DXP Enterprises Incorporated † | | | | | | | 359,016 | | | | 17,336,883 | |
Titan Machinery Incorporated Ǡ | | | | | | | 292,772 | | | | 6,481,972 | |
| | | | |
| | | | | | | | | | | 23,818,855 | |
| | | | | | | | | | | | |
| | | | |
Information Technology: 35.25% | | | | | | | | | | | | |
| | | | |
| Communications Equipment: 2.90% | | | | | | | | | | | | |
Aruba Networks Incorporated Ǡ | | | | | | | 115,530 | | | | 2,250,524 | |
Ixia † | | | | | | | 1,087,441 | | | | 16,333,364 | |
Procera Networks Incorporated Ǡ | | | | | | | 399,301 | | | | 8,245,566 | |
| | | | |
| | | | | | | | | | | 26,829,454 | |
| | | | | | | | | | | | |
| | | | |
| Computers & Peripherals: 0.47% | | | | | | | | | | | | |
Stratasys Incorporated Ǡ | | | | | | | 58,500 | | | | 4,384,575 | |
| | | | | | | | | | | | |
| | | | |
| Electronic Equipment, Instruments & Components: 1.70% | | | | | | | | | | | | |
OSI Systems Incorporated † | | | | | | | 256,000 | | | | 15,687,680 | |
| | | | | | | | | | | | |
| | | | |
| Internet Software & Services: 9.12% | | | | | | | | | | | | |
Brightcove Incorporated † | | | | | | | 1,067,315 | | | | 10,374,302 | |
Envestnet Incorporated † | | | | | | | 1,018,430 | | | | 14,156,177 | |
Liquidity Services Incorporated Ǡ | | | | | | | 314,500 | | | | 12,913,370 | |
LivePerson Incorporated † | | | | | | | 201,604 | | | | 2,659,157 | |
Mercadolibre Incorporated « | | | | | | | 163,930 | | | | 11,794,764 | |
OpenTable Incorporated Ǡ | | | | | | | 178,000 | | | | 7,990,420 | |
SciQuest Incorporated † | | | | | | | 923,018 | | | | 15,035,963 | |
SPS Commerce Incorporated † | | | | | | | 257,100 | | | | 9,476,706 | |
| | | | |
| | | | | | | | | | | 84,400,859 | |
| | | | | | | | | | | | |
| | | | |
| IT Services: 4.61% | | | | | | | | | | | | |
Gartner Incorporated † | | | | | | | 154,758 | | | | 7,409,813 | |
MarketAxess Holdings Incorporated « | | | | | | | 396,051 | | | | 12,222,134 | |
Maximus Incorporated | | | | | | | 110,200 | | | | 6,941,494 | |
ServiceSource International Incorporated Ǡ | | | | | | | 262,900 | | | | 1,348,677 | |
Wex Incorporated Ǡ | | | | | | | 205,221 | | | | 14,767,703 | |
| | | | |
| | | | | | | | | | | 42,689,821 | |
| | | | | | | | | | | | |
The accompanying notes are an integral part of these financial statements.
| | | | |
| 86 | | Wells Fargo Advantage Equity Gateway Funds | | Portfolio of investments—November 30, 2012 (unaudited) |
EMERGING GROWTH PORTFOLIO
| | | | | | | | | | | | | | |
| Security name | | | | | | | Shares | | | Value | |
| | | | | | | | | | | | | | |
| | | | |
| Semiconductors & Semiconductor Equipment: 1.62% | | | | | | | | | | | | | | |
Cavium Incorporated Ǡ | | | | | | | | | 160,790 | | | $ | 5,664,632 | |
Entegris Incorporated † | | | | | | | | | 1,043,540 | | | | 9,350,118 | |
| | | | |
| | | | | | | | | | | | | 15,014,750 | |
| | | | | | | | | | | | | | |
| | | | |
| Software: 14.83% | | | | | | | | | | | | | | |
Allot Communications Limited Ǡ | | | | | | | | | 450,043 | | | | 9,828,939 | |
Aspen Technology Incorporated † | | | | | | | | | 142,500 | | | | 3,703,575 | |
Broadsoft Incorporated Ǡ | | | | | | | | | 556,673 | | | | 17,607,567 | |
Fleetmatics Group plc « † | | | | | | | | | 382,540 | | | | 8,331,721 | |
Fortinet Incorporated † | | | | | | | | | 592,200 | | | | 11,832,156 | |
Guidewire Software Incorporated † | | | | | | | | | 252,200 | | | | 7,540,780 | |
Imperva Incorporated Ǡ | | | | | | | | | 275,791 | | | | 8,483,331 | |
Infoblox Incorporated † | | | | | | | | | 186,100 | | | | 3,528,456 | |
PROS Holdings Incorporated † | | | | | | | | | 425,522 | | | | 7,544,505 | |
Solarwinds Incorporated † | | | | | | | | | 371,964 | | | | 20,841,143 | |
Sourcefire Incorporated Ǡ | | | | | | | | | 307,700 | | | | 15,148,071 | |
Synchronoss Technologies Incorporated Ǡ | | | | | | | | | 603,601 | | | | 11,021,754 | |
Ultimate Software Group Incorporated † | | | | | | | | | 124,670 | | | | 11,782,562 | |
| | | | |
| | | | | | | | | | | | | 137,194,560 | |
| | | | | | | | | | | | | | |
| | | | |
Materials: 0.01% | | | | | | | | | | | | | | |
| | | | |
| Chemicals: 0.01% | | | | | | | | | | | | | | |
Landec Corporation † | | | | | | | | | 6,189 | | | | 61,959 | |
| | | | | | | | | | | | | | |
| | | | |
Total Common Stocks (Cost $839,109,014) | | | | | | | | | | | | | 908,145,519 | |
| | | | | | | | | | | | | | |
| | | | |
Investment Companies: 0.35% | | | | | | | | | | | | | | |
iShares Russell 2000 Growth Index Fund « | | | | | | | | | 35,000 | | | | 3,272,850 | |
| | | | | | | | | | | | | | |
| | | | |
Total Investment Companies (Cost $3,354,397) | | | | | | | | | | | | | 3,272,850 | |
| | | | | | | | | | | | | | |
| | | | |
| | | | | | | | Principal | | | | |
| | | | |
Other: 0.16% | | | | | | | | | | | | | | |
Gryphon Funding Limited, Pass-Through Entity (a)(i)(v) | | | | | | | | $ | 4,359,499 | | | | 1,438,635 | |
| | | | | | | | | | | | | | |
| | | | |
Total Other (Cost $413,054) | | | | | | | | | | | | | 1,438,635 | |
| | | | | | | | | | | | | | |
| | | | |
| | | | | Yield | | | Shares | | | | |
| | | | |
Short-Term Investments: 32.65% | | | | | | | | | | | | | | |
| | | | |
| Investment Companies: 32.65% | | | | | | | | | | | | | | |
Wells Fargo Advantage Cash Investment Money Market Fund, Select Class (l)(u) | | | | | 0.16 | % | | | 14,554,639 | | | | 14,554,639 | |
Wells Fargo Securities Lending Cash Investments, LLC (v)(r)(l)(u) | | | | | 0.21 | | | | 287,604,201 | | | | 287,604,201 | |
| | | | |
Total Short-Term Investments (Cost $302,158,840) | | | | | | | | | | | | | 302,158,840 | |
| | | | | | | | | | | | | | |
| | | | | | | | |
| Total investments in securities | | | | | | | | |
| (Cost $1,145,035,305) * | | | 131.31 | % | | | 1,215,015,844 | |
Other assets and liabilities, net | | | (31.31 | ) | | | (289,724,512 | ) |
| | | | | | | | |
| Total net assets | | | 100.00 | % | | $ | 925,291,332 | |
| | | | | | | | |
The accompanying notes are an integral part of these financial statements.
| | | | | | |
| Portfolio of investments—November 30, 2012 (unaudited) | | Wells Fargo Advantage Equity Gateway Funds | | | 87 | |
EMERGING GROWTH PORTFOLIO
| † | Non-income-earning security |
| « | All or a portion of this security is on loan. |
| (a) | Security is fair valued by the Management Valuation Team, and in certain instances by the Board of Trustees, in accordance with procedures approved by the Board of Trustees. |
| (v) | Security represents investment of cash collateral received from securities on loan. |
| (l) | Investment in an affiliate |
| (u) | Rate shown is the 7-day annualized yield at period end. |
| (r) | The investment company is exempt from registration under Section 3(c)(7) of the Investment Company Act of 1940, as amended. |
| * | Cost for federal income tax purposes is $1,148,971,009 and unrealized appreciation (depreciation) consists of: |
| | | | |
Gross unrealized appreciation | | $ | 117,856,874 | |
Gross unrealized depreciation | | | (51,812,039 | ) |
| | | | |
Net unrealized appreciation | | $ | 66,044,835 | |
The accompanying notes are an integral part of these financial statements.
| | | | |
| 88 | | Wells Fargo Advantage Equity Gateway Funds | | Portfolio of investments—November 30, 2012 (unaudited) |
EQUITY VALUE PORTFOLIO
| | | | | | | | | | | | |
| Security name | | | | | | Shares | | | Value | |
| | | | | | | | | | | | |
| | | | |
Common Stocks: 98.74% | | | | | | | | | | | | |
| | | | |
Consumer Discretionary: 8.96% | | | | | | | | | | | | |
| | | | |
| Auto Components: 0.59% | | | | | | | | | | | | |
Delphi Automotive plc † | | | | | | | 152,300 | | | $ | 5,176,677 | |
| | | | | | | | | | | | |
| | | | |
| Household Durables: 0.62% | | | | | | | | | | | | |
Pulte Homes Incorporated † | | | | | | | 323,450 | | | | 5,437,195 | |
| | | | | | | | | | | | |
| | | | |
| Media: 1.32% | | | | | | | | | | | | |
Comcast Corporation Class A | | | | | | | 156,200 | | | | 5,807,516 | |
News Corporation Class A | | | | | | | 233,350 | | | | 5,749,744 | |
| | | | |
| | | | | | | | | | | 11,557,260 | |
| | | | | | | | | | | | |
| | | | |
| Multiline Retail: 2.00% | | | | | | | | | | | | |
Dollar General Corporation † | | | | | | | 163,650 | | | | 8,182,500 | |
Macy’s Incorporated | | | | | | | 240,800 | | | | 9,318,960 | |
| | | | |
| | | | | | | | | | | 17,501,460 | |
| | | | | | | | | | | | |
| | | | |
| Specialty Retail: 3.82% | | | | | | | | | | | | |
Bed Bath & Beyond Incorporated † | | | | | | | 105,300 | | | | 6,183,216 | |
Foot Locker Incorporated | | | | | | | 526,900 | | | | 18,884,089 | |
GNC Holdings Incorporated Class A | | | | | | | 236,050 | | | | 8,292,437 | |
| | | | |
| | | | | | | | | | | 33,359,742 | |
| | | | | | | | | | | | |
| | | | |
| Textiles, Apparel & Luxury Goods: 0.61% | | | | | | | | | | | | |
PVH Corporation | | | | | | | 46,650 | | | | 5,345,624 | |
| | | | | | | | | | | | |
| | | | |
Consumer Staples: 10.08% | | | | | | | | | | | | |
| | | | |
| Beverages: 1.51% | | | | | | | | | | | | |
Anheuser-Busch Companies Incorporated ADR « | | | | | | | 100,025 | | | | 8,799,199 | |
The Coca-Cola Company | | | | | | | 115,850 | | | | 4,393,032 | |
| | | | |
| | | | | | | | | | | 13,192,231 | |
| | | | | | | | | | | | |
| | | | |
| Food & Staples Retailing: 3.92% | | | | | | | | | | | | |
CVS Caremark Corporation | | | | | | | 406,300 | | | | 18,897,013 | |
Kroger Company | | | | | | | 166,750 | | | | 4,375,520 | |
Walgreen Company | | | | | | | 325,750 | | | | 11,046,183 | |
| | | | |
| | | | | | | | | | | 34,318,716 | |
| | | | | | | | | | | | |
| | | | |
| Food Products: 2.75% | | | | | | | | | | | | |
JM Smucker Company « | | | | | | | 79,850 | | | | 7,063,531 | |
Kraft Foods Group Incorporated † | | | | | | | 139,283 | | | | 6,298,377 | |
Mondelez International Incorporated Class A | | | | | | | 411,850 | | | | 10,662,797 | |
| | | | |
| | | | | | | | | | | 24,024,705 | |
| | | | | | | | | | | | |
| | | | |
| Household Products: 1.42% | | | | | | | | | | | | |
Procter & Gamble Company | | | | | | | 177,225 | | | | 12,375,622 | |
| | | | | | | | | | | | |
| | | | |
| Personal Products: 0.48% | | | | | | | | | | | | |
Herbalife Limited « | | | | | | | 91,800 | | | | 4,220,046 | |
| | | | | | | | | | | | |
The accompanying notes are an integral part of these financial statements.
| | | | | | |
| Portfolio of investments—November 30, 2012 (unaudited) | | Wells Fargo Advantage Equity Gateway Funds | | | 89 | |
EQUITY VALUE PORTFOLIO
| | | | | | | | | | | | |
| Security name | | | | | | Shares | | | Value | |
| | | | | | | | | | | | |
| | | | |
Energy: 15.17% | | | | | | | | | | | | |
| | | | |
| Energy Equipment & Services: 2.16% | | | | | | | | | | | | |
Cameron International Corporation † | | | | | | | 130,500 | | | $ | 7,040,475 | |
National Oilwell Varco Incorporated | | | | | | | 105,300 | | | | 7,191,990 | |
Transocean Limited | | | | | | | 100,600 | | | | 4,647,720 | |
| | | | |
| | | | | | | | | | | 18,880,185 | |
| | | | | | | | | | | | |
| | | | |
| Oil, Gas & Consumable Fuels: 13.01% | | | | | | | | | | | | |
Anadarko Petroleum Corporation | | | | | | | 153,550 | | | | 11,238,325 | |
Apache Corporation « | | | | | | | 113,900 | | | | 8,780,551 | |
Chevron Corporation | | | | | | | 256,400 | | | | 27,098,916 | |
ConocoPhillips Company | | | | | | | 192,725 | | | | 10,973,762 | |
Devon Energy Corporation | | | | | | | 79,700 | | | | 4,118,099 | |
Exxon Mobil Corporation | | | | | | | 99,050 | | | | 8,730,267 | |
Hess Corporation | | | | | | | 178,350 | | | | 8,847,944 | |
HollyFrontier Corporation « | | | | | | | 147,125 | | | | 6,669,176 | |
Marathon Petroleum Corporation | | | | | | | 80,700 | | | | 4,804,878 | |
Peabody Energy Corporation | | | | | | | 280,300 | | | | 7,038,333 | |
Plains Exploration & Product Company †« | | | | | | | 194,150 | | | | 6,931,155 | |
Suncor Energy Incorporated « | | | | | | | 261,500 | | | | 8,527,515 | |
| | | | |
| | | | | | | | | | | 113,758,921 | |
| | | | | | | | | | | | |
| | | | |
Financials: 24.66% | | | | | | | | | | | | |
| | | | |
| Commercial Banks: 6.06% | | | | | | | | | | | | |
Fifth Third Bancorp | | | | | | | 928,500 | | | | 13,593,240 | |
KeyCorp | | | | | | | 461,100 | | | | 3,725,688 | |
PNC Financial Services Group Incorporated | | | | | | | 448,075 | | | | 25,154,931 | |
Regions Financial Corporation | | | | | | | 678,600 | | | | 4,526,262 | |
SunTrust Banks Incorporated | | | | | | | 220,300 | | | | 5,981,145 | |
| | | | |
| | | | | | | | | | | 52,981,266 | |
| | | | | | | | | | | | |
| | | | |
| Consumer Finance: 4.67% | | | | | | | | | | | | |
Capital One Financial Corporation | | | | | | | 243,600 | | | | 14,031,360 | |
Discover Financial Services | | | | | | | 644,400 | | | | 26,813,484 | |
| | | | |
| | | | | | | | | | | 40,844,844 | |
| | | | | | | | | | | | |
| | | | |
| Diversified Financial Services: 6.11% | | | | | | | | | | | | |
Bank of America Corporation | | | | | | | 1,380,000 | | | | 13,606,800 | |
Citigroup Incorporated | | | | | | | 428,100 | | | | 14,799,417 | |
JPMorgan Chase & Company | | | | | | | 608,800 | | | | 25,009,504 | |
| | | | |
| | | | | | | | | | | 53,415,721 | |
| | | | | | | | | | | | |
| | | | |
| Insurance: 7.08% | | | | | | | | | | | | |
AFLAC Incorporated « | | | | | | | 76,050 | | | | 4,029,890 | |
Allstate Corporation | | | | | | | 195,800 | | | | 7,925,984 | |
American International Group Incorporated † | | | | | | | 526,125 | | | | 17,430,521 | |
Fidelity National Title Group Incorporated | | | | | | | 184,150 | | | | 4,458,272 | |
Lincoln National Corporation | | | | | | | 394,150 | | | | 9,735,505 | |
MetLife Incorporated | | | | | | | 552,400 | | | | 18,334,156 | |
| | | | |
| | | | | | | | | | | 61,914,328 | |
| | | | | | | | | | | | |
The accompanying notes are an integral part of these financial statements.
| | | | |
| 90 | | Wells Fargo Advantage Equity Gateway Funds | | Portfolio of investments—November 30, 2012 (unaudited) |
EQUITY VALUE PORTFOLIO
| | | | | | | | | | | | |
| Security name | | | | | | Shares | | | Value | |
| | | | | | | | | | | | |
| | | | |
| REITs: 0.74% | | | | | | | | | | | | |
Digital Realty Trust Incorporated | | | | | | | 101,125 | | | $ | 6,526,608 | |
| | | | | | | | | | | | |
| | | | |
Health Care: 14.12% | | | | | | | | | | | | |
| | | | |
| Biotechnology: 2.20% | | | | | | | | | | | | |
Amgen Incorporated | | | | | | | 115,125 | | | | 10,223,100 | |
Celgene Corporation † | | | | | | | 56,950 | | | | 4,475,701 | |
Gilead Sciences Incorporated †« | | | | | | | 59,950 | | | | 4,496,250 | |
| | | | |
| | | | | | | | | | | 19,195,051 | |
| | | | | | | | | | | | |
| | | | |
| Health Care Providers & Services: 2.06% | | | | | | | | | | | | |
Express Scripts Holding Corporation † | | | | | | | 70,500 | | | | 3,796,425 | |
UnitedHealth Group Incorporated | | | | | | | 261,800 | | | | 14,239,302 | |
| | | | |
| | | | | | | | | | | 18,035,727 | |
| | | | | | | | | | | | |
| | | | |
| Pharmaceuticals: 9.86% | | | | | | | | | | | | |
Abbott Laboratories | | | | | | | 189,725 | | | | 12,332,125 | |
AstraZeneca plc ADR « | | | | | | | 95,500 | | | | 4,540,070 | |
Bristol-Myers Squibb Company | | | | | | | 236,400 | | | | 7,713,732 | |
Eli Lilly & Company | | | | | | | 232,675 | | | | 11,410,382 | |
Johnson & Johnson Services Incorporated | | | | | | | 53,800 | | | | 3,751,474 | |
Merck & Company Incorporated | | | | | | | 383,200 | | | | 16,975,760 | |
Pfizer Incorporated | | | | | | | 1,180,400 | | | | 29,533,608 | |
| | | | |
| | | | | | | | | | | 86,257,151 | |
| | | | | | | | | | | | |
| | | | |
Industrials: 7.05% | | | | | | | | | | | | |
| | | | |
| Airlines: 0.39% | | | | | | | | | | | | |
Delta Air Lines Incorporated † | | | | | | | 337,000 | | | | 3,370,000 | |
| | | | | | | | | | | | |
| | | | |
| Industrial Conglomerates: 3.75% | | | | | | | | | | | | |
General Electric Company | | | | | | | 1,553,200 | | | | 32,819,116 | |
| | | | | | | | | | | | |
| | | | |
| Machinery: 1.84% | | | | | | | | | | | | |
Eaton Corporation « | | | | | | | 309,150 | | | | 16,125,264 | |
| | | | | | | | | | | | |
| | | | |
| Trading Companies & Distributors: 1.07% | | | | | | | | | | | | |
United Rentals Incorporated †« | | | | | | | 224,400 | | | | 9,319,332 | |
| | | | | | | | | | | | |
| | | | |
Information Technology: 8.17% | | | | | | | | | | | | |
| | | | |
| Communications Equipment: 2.70% | | | | | | | | | | | | |
Cisco Systems Incorporated | | | | | | | 997,000 | | | | 18,853,270 | |
QUALCOMM Incorporated | | | | | | | 75,100 | | | | 4,777,862 | |
| | | | |
| | | | | | | | | | | 23,631,132 | |
| | | | | | | | | | | | |
| | | | |
| Computers & Peripherals: 0.99% | | | | | | | | | | | | |
EMC Corporation † | | | | | | | 348,050 | | | | 8,638,601 | |
| | | | | | | | | | | | |
| | | | |
| Internet Software & Services: 0.50% | | | | | | | | | | | | |
Yahoo! Incorporated † | | | | | | | 234,600 | | | | 4,403,442 | |
| | | | | | | | | | | | |
The accompanying notes are an integral part of these financial statements.
| | | | | | |
| Portfolio of investments—November 30, 2012 (unaudited) | | Wells Fargo Advantage Equity Gateway Funds | | | 91 | |
EQUITY VALUE PORTFOLIO
| | | | | | | | | | | | |
| Security name | | | | | | Shares | | | Value | |
| | | | | | | | | | | | |
| | | | |
| Semiconductors & Semiconductor Equipment: 2.81% | | | | | | | | | | | | |
Broadcom Corporation Class A | | | | | | | 361,800 | | | $ | 11,715,084 | |
NXP Semiconductors †« | | | | | | | 154,000 | | | | 3,769,920 | |
Skyworks Solutions Incorporated † | | | | | | | 402,000 | | | | 9,105,300 | |
| | | | |
| | | | | | | | | | | 24,590,304 | |
| | | | | | | | | | | | |
| | | | |
| Software: 1.17% | | | | | | | | | | | | |
Adobe Systems Incorporated † | | | | | | | 154,650 | | | | 5,352,437 | |
Microsoft Corporation | | | | | | | 183,500 | | | | 4,884,770 | |
| | | | |
| | | | | | | | | | | 10,237,207 | |
| | | | | | | | | | | | |
| | | | |
Materials: 3.59% | | | | | | | | | | | | |
| | | | |
| Chemicals: 2.09% | | | | | | | | | | | | |
CF Industries Holdings Incorporated | | | | | | | 18,910 | | | | 4,047,307 | |
LyondellBasell Industries NV Class A | | | | | | | 171,550 | | | | 8,531,182 | |
PPG Industries Incorporated | | | | | | | 45,775 | | | | 5,688,459 | |
| | | | |
| | | | | | | | | | | 18,266,948 | |
| | | | | | | | | | | | |
| | | | |
| Metals & Mining: 1.50% | | | | | | | | | | | | |
Freeport-McMoRan Copper & Gold Incorporated Class B | | | | | | | 336,200 | | | | 13,115,162 | |
| | | | | | | | | | | | |
| | | | |
Telecommunication Services: 3.70% | | | | | | | | | | | | |
| | | | |
| Diversified Telecommunication Services: 3.70% | | | | | | | | | | | | |
AT&T Incorporated | | | | | | | 658,450 | | | | 22,472,899 | |
Verizon Communications Incorporated | | | | | | | 224,600 | | | | 9,909,352 | |
| | | | |
| | | | | | | | | | | 32,382,251 | |
| | | | | | | | | | | | |
| | | | |
Utilities: 3.24% | | | | | | | | | | | | |
| | | | |
| Electric Utilities: 1.82% | | | | | | | | | | | | |
PPL Corporation | | | | | | | 542,500 | | | | 15,922,375 | |
| | | | | | | | | | | | |
| | | | |
| Gas Utilities: 0.65% | | | | | | | | | | | | |
Energen Corporation | | | | | | | 128,800 | | | | 5,735,464 | |
| | | | | | | | | | | | |
| | | | |
| Multi-Utilities: 0.77% | | | | | | | | | | | | |
NiSource Incorporated « | | | | | | | 277,450 | | | | 6,705,967 | |
| | | | | | | | | | | | |
| | | | |
Total Common Stocks (Cost $772,236,961) | | | | | | | | | | | 863,581,645 | |
| | | | | | | | | | | | |
| | | | | | | Principal | | | | |
| | | | |
Other: 0.05% | | | | | | | | | | | | |
Gryphon Funding Limited, Pass-Through Entity (i)(a)(v) | | | | | | $ | 1,175,007 | | | | 387,752 | |
| | | | | | | | | | | | |
| | | | |
Total Other (Cost $111,329) | | | | | | | | | | | 387,752 | |
| | | | | | | | | | | | |
The accompanying notes are an integral part of these financial statements.
| | | | |
| 92 | | Wells Fargo Advantage Equity Gateway Funds | | Portfolio of investments—November 30, 2012 (unaudited) |
EQUITY VALUE PORTFOLIO
| | | | | | | | | | | | | | |
| Security name | | | | Yield | | | Shares | | | Value | |
| | | | | | | | | | | | | | |
| Short-Term Investments: 7.58% | | | | | | | | | | | | | | |
| | | | |
| Investment Companies: 7.58% | | | | | | | | | | | | | | |
Wells Fargo Advantage Cash Investment Money Market Fund, Select Class (l)(u) | | | | | 0.16 | % | | | 12,139,015 | | | $ | 12,139,015 | |
Wells Fargo Securities Lending Cash Investments, LLC (v)(l)(u)(r) | | | | | 0.21 | | | | 54,138,746 | | | | 54,138,746 | |
| | | | |
Total Short-Term Investments (Cost $66,277,761) | | | | | | | | | | | | | 66,277,761 | |
| | | | | | | | | | | | | | |
| | | | | | | | |
Total investments in securities
(Cost $838,626,051) * | | | 106.37 | % | | | 930,247,158 | |
Other assets and liabilities, net | | | (6.37 | ) | | | (55,678,493 | ) |
| | | | | | | | |
| Total net assets | | | 100.00 | % | | $ | 874,568,665 | |
| | | | | | | | |
| † | Non-income-earning security |
| « | All or a portion of this security is on loan. |
| (a) | Security is fair valued by the Management Valuation Team, and in certain instances by the Board of Trustees, in accordance with procedures approved by the Board of Trustees. |
| (v) | Security represents investment of cash collateral received from securities on loan. |
| (l) | Investment in an affiliate |
| (u) | Rate shown is the 7-day annualized yield at period end. |
| (r) | The investment company is exempt from registration under Section 3(c)(7) of the Investment Company Act of 1940, as amended. |
| * | Cost for federal income tax purposes is $843,914,887 and unrealized appreciation (depreciation) consists of: |
| | | | |
Gross unrealized appreciation | | $ | 100,987,042 | |
Gross unrealized depreciation | | | (14,654,771 | ) |
| | | | |
Net unrealized appreciation | | $ | 86,332,271 | |
The accompanying notes are an integral part of these financial statements.
| | | | | | |
| Summary portfolio of investments—November 30, 2012 (unaudited) | | Wells Fargo Advantage Equity Gateway Funds | | | 93 | |
INDEX PORTFOLIO
The Summary Portfolio of Investments shows the 50 largest portfolio holdings in unaffiliated issuers and any holdings exceeding 1% of the total net assets as of the report date. The remaining securities held are grouped as “Other securities” in each category. You can request a complete schedule of portfolio holdings as of the report date, free of charge, by accessing the following website: http://a584.g.akamai.net/f/584/1326/1d/www.wellsfargoadvantagefunds.com/pdf/semi/holdings/index.pdf or by calling Wells Fargo Advantage Funds at 1-800-222-8222. This complete schedule, filed on the Form N-CSR, is also available on the SEC’s website at sec.gov.
| | | | | | | | | | | | | | | | |
| Security name | | | | | | Shares | | | Value | | | Percent of
net assets | |
| | | | | |
Common Stocks: 98.03% | | | | | | | | | | | | | | | | |
| | | | | |
Consumer Discretionary: 11.31% | | | | | | | | | | | | | | | | |
| | | | | |
| Auto Components: 0.23% | | | | | | | | | | | | | | | | |
Other securities | | | | | | | | | | $ | 5,729,071 | | | | 0.23 | % |
| | | | | | | | | | | | | | | | |
| | | | | |
| Automobiles: 0.42% | | | | | | | | | | | | | | | | |
Other securities | | | | | | | | | | | 10,557,255 | | | | 0.42 | |
| | | | | | | | | | | | | | | | |
| | | | | |
| Distributors: 0.08% | | | | | | | | | | | | | | | | |
Other securities | | | | | | | | | | | 1,960,185 | | | | 0.08 | |
| | | | | | | | | | | | | | | | |
| | | | | |
| Diversified Consumer Services: 0.05% | | | | | | | | | | | | | | | | |
Other securities | | | | | | | | | | | 1,325,069 | | | | 0.05 | |
| | | | | | | | | | | | | | | | |
| | | | | |
| Hotels, Restaurants & Leisure: 1.78% | | | | | | | | | | | | | | | | |
McDonald’s Corporation « | | | | | | | 195,803 | | | | 17,042,693 | | | | 0.68 | |
Other securities | | | | | | | | | | | 27,527,805 | | | | 1.10 | |
| | | | | |
| | | | | | | | | | | 44,570,498 | | | | 1.78 | |
| | | | | | | | | | | | | | | | |
| | | | | |
| Household Durables: 0.39% | | | | | | | | | | | | | | | | |
Other securities | | | | | | | | | | | 9,734,576 | | | | 0.39 | |
| | | | | | | | | | | | | | | | |
| | | | | |
| Internet & Catalog Retail: 1.07% | | | | | | | | | | | | | | | | |
Amazon.com Incorporated †† | | | | | | | 70,221 | | | | 17,699,203 | | | | 0.70 | |
Other securities | | | | | | | | | | | 9,234,158 | | | | 0.37 | |
| | | | | |
| | | | | | | | | | | 26,933,361 | | | | 1.07 | |
| | | | | | | | | | | | | | | | |
| | | | | |
| Leisure Equipment & Products: 0.13% | | | | | | | | | | | | | | | | |
Other securities | | | | | | | | | | | 3,348,591 | | | | 0.13 | |
| | | | | | | | | | | | | | | | |
| | | | | |
| Media: 3.49% | | | | | | | | | | | | | | | | |
Comcast Corporation Class A | | | | | | | 519,555 | | | | 19,317,055 | | | | 0.77 | |
Walt Disney Company | | | | | | | 348,387 | | | | 17,300,898 | | | | 0.69 | |
Other securities | | | | | | | | | | | 51,031,769 | | | | 2.03 | |
| | | | | |
| | | | | | | | | | | 87,649,722 | | | | 3.49 | |
| | | | | | | | | | | | | | | | |
| | | | | |
| Multiline Retail: 0.84% | | | | | | | | | | | | | | | | |
Other securities | | | | | | | | | | | 21,136,868 | | | | 0.84 | |
| | | | | | | | | | | | | | | | |
| | | | | |
| Specialty Retail: 2.27% | | | | | | | | | | | | | | | | |
Home Depot Incorporated | | | | | | | 292,694 | | | | 19,045,599 | | | | 0.76 | |
Other securities | | | | | | | | | | | 37,961,338 | | | | 1.51 | |
| | | | | |
| | | | | | | | | | | 57,006,937 | | | | 2.27 | |
| | | | | | | | | | | | | | | | |
| | | | | |
| Textiles, Apparel & Luxury Goods: 0.62% | | | | | | | | | | | | | | | | |
Other securities | | | | | | | | | | | 15,683,058 | | | | 0.62 | |
| | | | | | | | | | | | | | | | |
The accompanying notes are an integral part of these financial statements.
| | | | |
| 94 | | Wells Fargo Advantage Equity Gateway Funds | | Summary portfolio of investments—November 30, 2012 (unaudited) |
INDEX PORTFOLIO
| | | | | | | | | | | | | | | | |
| Security name | | | | | | Shares | | | Value | | | Percent of
net assets | |
| | | | | | | | | | | | | | | | |
| | | | | |
Consumer Staples: 10.82% | | | | | | | | | | | | | | | | |
| | | | | |
| Beverages: 2.42% | | | | | | | | | | | | | | | | |
PepsiCo Incorporated | | | | | | | 302,176 | | | $ | 21,215,777 | | | | 0.84 | % |
The Coca-Cola Company | | | | | | | 751,744 | | | | 28,506,132 | | | | 1.14 | |
Other securities | | | | | | | | | | | 11,127,995 | | | | 0.44 | |
| | | | | |
| | | | | | | | | | | 60,849,904 | | | | 2.42 | |
| | | | | | | | | | | | | | | | |
| | | | | |
| Food & Staples Retailing: 2.38% | | | | | | | | | | | | | | | | |
CVS Caremark Corporation | | | | | | | 247,025 | | | | 11,489,133 | | | | 0.46 | |
Wal-Mart Stores Incorporated | | | | | | | 326,339 | | | | 23,502,935 | | | | 0.94 | |
Other securities | | | | | | | | | | | 24,661,725 | | | | 0.98 | |
| | | | | |
| | | | | | | | | | | 59,653,793 | | | | 2.38 | |
| | | | | | | | | | | | | | | | |
| | | | | |
| Food Products: 1.73% | | | | | | | | | | | | | | | | |
Other securities | | | | | | | | | | | 43,519,623 | | | | 1.73 | |
| | | | | | | | | | | | | | | | |
| | | | | |
| Household Products: 2.20% | | | | | | | | | | | | | | | | |
Procter & Gamble Company | | | | | | | 534,787 | | | | 37,344,176 | | | | 1.49 | |
Other securities | | | | | | | | | | | 17,884,105 | | | | 0.71 | |
| | | | | |
| | | | | | | | | | | 55,228,281 | | | | 2.20 | |
| | | | | | | | | | | | | | | | |
| | | | | |
| Personal Products: 0.15% | | | | | | | | | | | | | | | | |
Other securities | | | | | | | | | | | 3,885,456 | | | | 0.15 | |
| | | | | | | | | | | | | | | | |
| | | | | |
| Tobacco: 1.94% | | | | | | | | | | | | | | | | |
Altria Group Incorporated | | | | | | | 394,708 | | | | 13,345,077 | | | | 0.53 | |
Philip Morris International | | | | | | | 327,310 | | | | 29,418,623 | | | | 1.17 | |
Other securities | | | | | | | | | | | 5,856,785 | | | | 0.24 | |
| | | | | |
| | | | | | | | | | | 48,620,485 | | | | 1.94 | |
| | | | | | | | | | | | | | | | |
| | | | | |
Energy: 10.79% | | | | | | | | | | | | | | | | |
| | | | | |
| Energy Equipment & Services: 1.84% | | | | | | | | | | | | | | | | |
Schlumberger Limited | | | | | | | 257,664 | | | | 18,453,896 | | | | 0.73 | |
Other securities | | | | | | | | | | | 27,728,165 | | | | 1.11 | |
| | | | | |
| | | | | | | | | | | 46,182,061 | | | | 1.84 | |
| | | | | | | | | | | | | | | | |
| | | | | |
| Oil, Gas & Consumable Fuels: 8.95% | | | | | | | | | | | | | | | | |
Chevron Corporation | | | | | | | 380,981 | | | | 40,265,882 | | | | 1.60 | |
ConocoPhillips Company | | | | | | | 235,824 | | | | 13,427,819 | | | | 0.53 | |
Exxon Mobil Corporation | | | | | | | 896,260 | | | | 78,996,356 | | | | 3.15 | |
Occidental Petroleum Corporation | | | | | | | 157,264 | | | | 11,827,825 | | | | 0.47 | |
Other securities | | | | | | | | | | | 80,358,768 | | | | 3.20 | |
| | | | | |
| | | | | | | | | | | 224,876,650 | | | | 8.95 | |
| | | | | | | | | | | | | | | | |
| | | | | |
Financials: 14.67% | | | | | | | | | | | | | | | | |
| | | | | |
| Capital Markets: 1.87% | | | | | | | | | | | | | | | | |
Goldman Sachs Group Incorporated | | | | | | | 87,501 | | | | 10,306,743 | | | | 0.41 | |
Other securities | | | | | | | | | | | 36,626,864 | | | | 1.46 | |
| | | | | |
| | | | | | | | | | | 46,933,607 | | | | 1.87 | |
| | | | | | | | | | | | | | | | |
The accompanying notes are an integral part of these financial statements.
| | | | | | |
| Summary portfolio of investments—November 30, 2012 (unaudited) | | Wells Fargo Advantage Equity Gateway Funds | | | 95 | |
INDEX PORTFOLIO
| | | | | | | | | | | | | | | | |
| Security name | | | | | | Shares | | | Value | | | Percent of
net assets | |
| | | | | | | | | | | | | | | | |
| | | | | |
| Commercial Banks: 2.68% | | | | | | | | | | | | | | | | |
US Bancorp | | | | | | | 368,003 | | | $ | 11,871,777 | | | | 0.47 | % |
Wells Fargo & Company (l) | | | | | | | 953,829 | | | | 31,485,895 | | | | 1.25 | |
Other securities | | | | | | | | | | | 23,951,235 | | | | 0.96 | |
| | | | | |
| | | | | | | | | | | 67,308,907 | | | | 2.68 | |
| | | | | | | | | | | | | | | | |
| | | | | |
| Consumer Finance: 0.91% | | | | | | | | | | | | | | | | |
American Express Company | | | | | | | 191,501 | | | | 10,704,906 | | | | 0.43 | |
Other securities | | | | | | | | | | | 12,166,382 | | | | 0.48 | |
| | | | | |
| | | | | | | | | | | 22,871,288 | | | | 0.91 | |
| | | | | | | | | | | | | | | | |
| | | | | |
| Diversified Financial Services: 4.44% | | | | | | | | | | | | | | | | |
Bank of America Corporation | | | | | | | 2,092,520 | | | | 20,632,247 | | | | 0.82 | |
Berkshire Hathaway Incorporated Class B † | | | | | | | 356,069 | | | | 31,362,558 | | | | 1.25 | |
Citigroup Incorporated | | | | | | | 569,389 | | | | 19,683,778 | | | | 0.78 | |
JPMorgan Chase & Company | | | | | | | 737,590 | | | | 30,300,197 | | | | 1.21 | |
Other securities | | | | | | | | | | | 9,499,035 | | | | 0.38 | |
| | | | | |
| | | | | | | | | | | 111,477,815 | | | | 4.44 | |
| | | | | | | | | | | | | | | | |
| | | | | |
| Insurance: 2.57% | | | | | | | | | | | | | | | | |
Other securities | | | | | | | | | | | 64,620,169 | | | | 2.57 | |
| | | | | | | | | | | | | | | | |
| | | | | |
| Real Estate Management & Development: 0.05% | | | | | | | | | | | | | | | | |
Other securities | | | | | | | | | | | 1,109,885 | | | | 0.05 | |
| | | | | | | | | | | | | | | | |
| | | | | |
| REITs: 2.09% | | | | | | | | | | | | | | | | |
Other securities | | | | | | | | | | | 52,517,665 | | | | 2.09 | |
| | | | | | | | | | | | | | | | |
| | | | | |
| Thrifts & Mortgage Finance: 0.06% | | | | | | | | | | | | | | | | |
Other securities | | | | | | | | | | | 1,575,260 | | | | 0.06 | |
| | | | | | | | | | | | | | | | |
| | | | | |
Health Care: 11.92% | | | | | | | | | | | | | | | | |
| | | | | |
| Biotechnology: 1.64% | | | | | | | | | | | | | | | | |
Amgen Incorporated | | | | | | | 149,657 | | | | 13,289,542 | | | | 0.53 | |
Gilead Sciences Incorporated Ǡ | | | | | | | 146,900 | | | | 11,017,500 | | | | 0.44 | |
Other securities | | | | | | | | | | | 17,024,622 | | | | 0.67 | |
| | | | | |
| | | | | | | | | | | 41,331,664 | | | | 1.64 | |
| | | | | | | | | | | | | | | | |
| | | | | |
| Health Care Equipment & Supplies: 1.75% | | | | | | | | | | | | | | | | |
Other securities | | | | | | | | | | | 43,997,456 | | | | 1.75 | |
| | | | | | | | | | | | | | | | |
| | | | | |
| Health Care Providers & Services: 1.87% | | | | | | | | | | | | | | | | |
UnitedHealth Group Incorporated | | | | | | | 200,517 | | | | 10,906,120 | | | | 0.44 | |
Other securities | | | | | | | | | | | 36,010,890 | | | | 1.43 | |
| | | | | |
| | | | | | | | | | | 46,917,010 | | | | 1.87 | |
| | | | | | | | | | | | | | | | |
| | | | | |
| Health Care Technology: 0.09% | | | | | | | | | | | | | | | | |
Other securities | | | | | | | | | | | 2,181,542 | | | | 0.09 | |
| | | | | | | | | | | | | | | | |
The accompanying notes are an integral part of these financial statements.
| | | | |
| 96 | | Wells Fargo Advantage Equity Gateway Funds | | Summary portfolio of investments—November 30, 2012 (unaudited) |
INDEX PORTFOLIO
| | | | | | | | | | | | | | | | |
| Security name | | | | | | Shares | | | Value | | | Percent of
net assets | |
| | | | | | | | | | | | | | | | |
| | | | | |
| Life Sciences Tools & Services: 0.43% | | | | | | | | | | | | | | | | |
Other securities | | | | | | | | | | $ | 10,921,272 | | | | 0.43 | % |
| | | | | | | | | | | | | | | | |
| | | | | |
| Pharmaceuticals: 6.14% | | | | | | | | | | | | | | | | |
Abbott Laboratories | | | | | | | 304,712 | | | | 19,806,280 | | | | 0.79 | |
Bristol-Myers Squibb Company | | | | | | | 326,009 | | | | 10,637,674 | | | | 0.42 | |
Johnson & Johnson Services Incorporated « | | | | | | | 535,324 | | | | 37,328,143 | | | | 1.49 | |
Merck & Company Incorporated | | | | | | | 591,359 | | | | 26,197,204 | | | | 1.04 | |
Pfizer Incorporated | | | | | | | 1,450,322 | | | | 36,287,056 | | | | 1.44 | |
Other securities | | | | | | | | | | | 23,916,732 | | | | 0.96 | |
| | | | | |
| | | | | | | | | | | 154,173,089 | | | | 6.14 | |
| | | | | | | | | | | | | | | | |
| | | | | |
Industrials: 9.75% | | | | | | | | | | | | | | | | |
| | | | | |
| Aerospace & Defense: 2.24% | | | | | | | | | | | | | | | | |
United Technologies Corporation | | | | | | | 162,875 | | | | 13,047,916 | | | | 0.52 | |
Other securities | | | | | | | | | | | 43,292,739 | | | | 1.72 | |
| | | | | |
| | | | | | | | | | | 56,340,655 | | | | 2.24 | |
| | | | | | | | | | | | | | | | |
| | | | | |
| Air Freight & Logistics: 0.75% | | | | | | | | | | | | | | | | |
Other securities | | | | | | | | | | | 18,745,997 | | | | 0.75 | |
| | | | | | | | | | | | | | | | |
| | | | | |
| Airlines: 0.05% | | | | | | | | | | | | | | | | |
Other securities | | | | | | | | | | | 1,374,979 | | | | 0.05 | |
| | | | | | | | | | | | | | | | |
| | | | | |
| Building Products: 0.05% | | | | | | | | | | | | | | | | |
Other securities | | | | | | | | | | | 1,175,956 | | | | 0.05 | |
| | | | | | | | | | | | | | | | |
| | | | | |
| Commercial Services & Supplies: 0.56% | | | | | | | | | | | | | | | | |
Other securities | | | | | | | | | | | 13,984,010 | | | | 0.56 | |
| | | | | | | | | | | | | | | | |
| | | | | |
| Construction & Engineering: 0.15% | | | | | | | | | | | | | | | | |
Other securities | | | | | | | | | | | 3,822,287 | | | | 0.15 | |
| | | | | | | | | | | | | | | | |
| | | | | |
| Electrical Equipment: 0.54% | | | | | | | | | | | | | | | | |
Other securities | | | | | | | | | | | 13,695,927 | | | | 0.54 | |
| | | | | | | | | | | | | | | | |
| | | | | |
| Industrial Conglomerates: 2.57% | | | | | | | | | | | | | | | | |
3M Company | | | | | | | 123,492 | | | | 11,231,597 | | | | 0.45 | |
General Electric Company | | | | | | | 2,050,171 | | | | 43,320,113 | | | | 1.73 | |
Other securities | | | | | | | | | | | 9,935,416 | | | | 0.39 | |
| | | | | |
| | | | | | | | | | | 64,487,126 | | | | 2.57 | |
| | | | | | | | | | | | | | | | |
| | | | | |
| Machinery: 1.88% | | | | | | | | | | | | | | | | |
Caterpillar Incorporated « | | | | | | | 126,843 | | | | 10,812,097 | | | | 0.43 | |
Other securities | | | | | | | | | | | 36,414,019 | | | | 1.45 | |
| | | | | |
| | | | | | | | | | | 47,226,116 | | | | 1.88 | |
| | | | | | | | | | | | | | | | |
| | | | | |
| Road & Rail: 0.78% | | | | | | | | | | | | | | | | |
Union Pacific Corporation | | | | | | | 91,959 | | | | 11,290,726 | | | | 0.45 | |
Other securities | | | | | | | | | | | 8,203,289 | | | | 0.33 | |
| | | | | |
| | | | | | | | | | | 19,494,015 | | | | 0.78 | |
| | | | | | | | | | | | | | | | |
The accompanying notes are an integral part of these financial statements.
| | | | | | |
| Summary portfolio of investments—November 30, 2012 (unaudited) | | Wells Fargo Advantage Equity Gateway Funds | | | 97 | |
INDEX PORTFOLIO
| | | | | | | | | | | | | | | | |
| Security name | | | | | | Shares | | | Value | | | Percent of
net assets | |
| | | | | | | | | | | | | | | | |
| | | | | |
| Trading Companies & Distributors: 0.18% | | | | | | | | | | | | | | | | |
Other securities | | | | | | | | | | $ | 4,445,839 | | | | 0.18 | % |
| | | | | | | | | | | | | | | | |
| | | | | |
Information Technology: 18.81% | | | | | | | | | | | | | | | | |
| | | | | |
| Communications Equipment: 1.92% | | | | | | | | | | | | | | | | |
Cisco Systems Incorporated | | | | | | | 1,027,151 | | | | 19,423,425 | | | | 0.77 | |
QUALCOMM Incorporated | | | | | | | 330,733 | | | | 21,041,233 | | | | 0.84 | |
Other securities | | | | | | | | | | | 7,885,294 | | | | 0.31 | |
| | | | | |
| | | | | | | | | | | 48,349,952 | | | | 1.92 | |
| | | | | | | | | | | | | | | | |
| | | | | |
| Computers & Peripherals: 5.24% | | | | | | | | | | | | | | | | |
Apple Incorporated † | | | | | | | 182,013 | | | | 106,528,569 | | | | 4.24 | |
Other securities | | | | | | | | | | | 25,039,333 | | | | 1.00 | |
| | | | | |
| | | | | | | | | | | 131,567,902 | | | | 5.24 | |
| | | | | | | | | | | | | | | | |
| | | | | |
| Electronic Equipment, Instruments & Components: 0.41% | | | | | | | | | | | | | | | | |
Other securities | | | | | | | | | | | 10,387,903 | | | | 0.41 | |
| | | | | | | | | | | | | | | | |
| | | | | |
| Internet Software & Services: 2.15% | | | | | | | | | | | | | | | | |
eBay Incorporated † | | | | | | | 225,195 | | | | 11,894,800 | | | | 0.48 | |
Google Incorporated Class A † | | | | | | | 51,434 | | | | 35,919,963 | | | | 1.43 | |
Other securities | | | | | | | | | | | 6,096,363 | | | | 0.24 | |
| | | | | |
| | | | | | | | | | | 53,911,126 | | | | 2.15 | |
| | | | | | | | | | | | | | | | |
| | | | | |
| IT Services: 3.76% | | | | | | | | | | | | | | | | |
International Business Machines Corporation | | | | | | | 208,575 | | | | 39,643,850 | | | | 1.58 | |
Visa Incorporated Class A | | | | | | | 101,486 | | | | 15,193,469 | | | | 0.60 | |
Other securities | | | | | | | | | | | 39,510,048 | | | | 1.58 | |
| | | | | |
| | | | | | | | | | | 94,347,367 | | | | 3.76 | |
| | | | | | | | | | | | | | | | |
| | | | | |
| Office Electronics: 0.07% | | | | | | | | | | | | | | | | |
Other securities | | | | | | | | | | | 1,728,480 | | | | 0.07 | |
| | | | | | | | | | | | | | | | |
| | | | | |
| Semiconductors & Semiconductor Equipment: 1.88% | | | | | | | | | | | | | | | | |
Intel Corporation | | | | | | | 971,414 | | | | 19,010,572 | | | | 0.76 | |
Other securities | | | | | | | | | | | 28,213,753 | | | | 1.12 | |
| | | | | |
| | | | | | | | | | | 47,224,325 | | | | 1.88 | |
| | | | | | | | | | | | | | | | |
| | | | | |
| Software: 3.38% | | | | | | | | | | | | | | | | |
Microsoft Corporation | | | | | | | 1,464,995 | | | | 38,998,167 | | | | 1.55 | |
Oracle Corporation | | | | | | | 739,454 | | | | 23,736,473 | | | | 0.94 | |
Other securities | | | | | | | | | | | 22,078,184 | | | | 0.89 | |
| | | | | |
| | | | | | | | | | | 84,812,824 | | | | 3.38 | |
| | | | | | | | | | | | | | | | |
| | | | | |
Materials: 3.46% | | | | | | | | | | | | | | | | |
| | | | | |
| Chemicals: 2.38% | | | | | | | | | | | | | | | | |
Other securities | | | | | | | | | | | 59,792,868 | | | | 2.38 | |
| | | | | | | | | | | | | | | | |
| | | | | |
| Construction Materials: 0.05% | | | | | | | | | | | | | | | | |
Other securities | | | | | | | | | | | 1,327,552 | | | | 0.05 | |
| | | | | | | | | | | | | | | | |
The accompanying notes are an integral part of these financial statements.
| | | | |
| 98 | | Wells Fargo Advantage Equity Gateway Funds | | Summary portfolio of investments—November 30, 2012 (unaudited) |
INDEX PORTFOLIO
| | | | | | | | | | | | | | | | |
| Security name | | | | | | Shares | | | Value | | | Percent of
net assets | |
| | | | | | | | | | | | | | | | |
| | | | | |
| Containers & Packaging: 0.13% | | | | | | | | | | | | | | | | |
Other securities | | | | | | | | | | $ | 3,292,559 | | | | 0.13 | % |
| | | | | | | | | | | | | | | | |
| | | | | |
| Metals & Mining: 0.73% | | | | | | | | | | | | | | | | |
Other securities | | | | | | | | | | | 18,188,548 | | | | 0.73 | |
| | | | | | | | | | | | | | | | |
| | | | | |
| Paper & Forest Products: 0.17% | | | | | | | | | | | | | | | | |
Other securities | | | | | | | | | | | 4,195,688 | | | | 0.17 | |
| | | | | | | | | | | | | | | | |
| | | | | |
Telecommunication Services: 3.07% | | | | | | | | | | | | | | | | |
| | | | | |
| Diversified Telecommunication Services: 2.76% | | | | | | | | | | | | | | | | |
AT&T Incorporated | | | | | | | 1,120,145 | | | | 38,230,549 | | | | 1.52 | |
Verizon Communications Incorporated | | | | | | | 553,156 | | | | 24,405,243 | | | | 0.97 | |
Other securities | | | | | | | | | | | 6,584,977 | | | | 0.27 | |
| | | | | |
| | | | | | | | | | | 69,220,769 | | | | 2.76 | |
| | | | | | | | | | | | | | | | |
| | | | | |
| Wireless Telecommunication Services: 0.31% | | | | | | | | | | | | | | | | |
Other securities | | | | | | | | | | | 7,833,705 | | | | 0.31 | |
| | | | | | | | | | | | | | | | |
| | | | | |
Utilities: 3.37% | | | | | | | | | | | | | | | | |
| | | | | |
| Electric Utilities: 1.99% | | | | | | | | | | | | | | | | |
Other securities | | | | | | | | | | | 50,113,792 | | | | 1.99 | |
| | | | | | | | | | | | | | | | |
| | | | | |
| Gas Utilities: 0.11% | | | | | | | | | | | | | | | | |
Other securities | | | | | | | | | | | 2,675,945 | | | | 0.11 | |
| | | | | | | | | | | | | | | | |
| | | | | |
| Independent Power Producers & Energy Traders: 0.09% | | | | | | | | | | | | | | | | |
Other securities | | | | | | | | | | | 2,219,690 | | | | 0.09 | |
| | | | | | | | | | | | | | | | |
| | | | | |
| Multi-Utilities: 1.18% | | | | | | | | | | | | | | | | |
Other securities | | | | | | | | | | | 29,693,241 | | | | 1.18 | |
| | | | | | | | | | | | | | | | |
| | | | | |
Total Common Stocks (Cost $1,927,101,077) | | | | | | | | | | | 2,462,065,216 | | | | 98.03 | |
| | | | | | | | | | | | | | | | |
| | | | | |
Investment Companies: 0.10% | | | | | | | | | | | | | | | | |
Other securities | | | | | | | | | | | 2,403,229 | | | | 0.10 | |
| | | | | | | | | | | | | | | | |
| | | | | |
Total Investment Companies (Cost $2,358,744) | | | | | | | | | | | 2,403,229 | | | | 0.10 | |
| | | | | | | | | | | | | | | | |
| | | | | |
| | | | | | | Principal | | | | | | | |
| | | | | |
Other: 0.05% | | | | | | | | | | | | | | | | |
Gryphon Funding Limited, Pass-Through Entity (a)(i)(v) | | | | | | $ | 4,147,337 | | | | 1,368,621 | | | | 0.05 | |
| | | | | | | | | | | | | | | | |
| | | | | |
Total Other (Cost $392,952) | | | | | | | | | | | 1,368,621 | | | | 0.05 | |
| | | | | | | | | | | | | | | | |
The accompanying notes are an integral part of these financial statements.
| | | | | | |
| Summary portfolio of investments—November 30, 2012 (unaudited) | | Wells Fargo Advantage Equity Gateway Funds | | | 99 | |
INDEX PORTFOLIO
| | | | | | | | | | | | | | | | | | | | |
| Security name | | Yield | | | | | | Shares | | | Value | | | Percent of
net assets | |
| | | | | | | | | | | | | | | | | | | | |
| | | | | |
Short-Term Investments: 8.03% | | | | | | | | | | | | | | | | | | | | |
| | | | | |
| Investment Companies: 7.90% | | | | | | | | | | | | | | | | | | | | |
Wells Fargo Advantage Cash Investment Money Market Fund, Select Class (l)(u) | | | 0.16 | % | | | | | | | 39,179,893 | | | $ | 39,179,893 | | | | 1.56 | % |
Wells Fargo Securities Lending Cash Investments, LLC (v)(l)(u)(r) | | | 0.21 | | | | | | | | 159,290,071 | | | | 159,290,071 | | | | 6.34 | |
| | | | | |
| | | | | | | | | | | | | | | 198,469,964 | | | | 7.90 | |
| | | | | | | | | | | | | | | | | | | | |
| | | | | |
| | | Interest rate | | | Maturity date | | | Principal | | | | | | | |
| | | | | |
| U.S. Treasury Securities: 0.13% | | | | | | | | | | | | | | | | | | | | |
U.S. Treasury Bill #(z) | | | 0.05 | | | | 1-31-13 | | | $ | 2,000,000 | | | | 1,999,820 | | | | 0.08 | |
U.S. Treasury Bill #(z) | | | 0.08 | | | | 2-21-13 | | | | 500,000 | | | | 499,911 | | | | 0.02 | |
U.S. Treasury Bill #(z) | | | 0.09 | | | | 1-24-13 | | | | 750,000 | | | | 749,897 | | | | 0.03 | |
| | | | | |
| | | | | | | | | | | | | | | 3,249,628 | | | | 0.13 | |
| | | | | | | | | | | | | | | | | | | | |
| | | | | |
Total Short-Term Investments (Cost $201,719,510) | | | | | | | | | | | | | | | 201,719,592 | | | | 8.03 | |
| | | | | | | | | | | | | | | | | | | | |
Total investments in securities
(Cost $2,131,572,283) * | | | | | | | | | | | | | | | 2,667,556,658 | | | | 106.21 | |
Other assets and liabilities, net | | | | | | | | | | | | | | | (156,053,926 | ) | | | (6.21 | ) |
| | | | | | | | | | | | | | | | | | | | |
| Total net assets | | | | | | | | | | | | | | $ | 2,511,502,732 | | | | 100.00 | % |
| | | | | | | | | | | | | | | | | | | | |
| « | All or a portion of this security is on loan. |
| † | Non-income-earning security |
| (l) | Investment in an affiliate |
| (a) | Security is fair valued by the Management Valuation Team, and in certain instances by the Board of Trustees, in accordance with procedures approved by the Board of Trustees. |
| (v) | Security represents investment of cash collateral received from securities on loan. |
| (u) | Rate shown is the 7-day annualized yield at period end. |
| (r) | The investment company is exempt from registration under Section 3(c)(7) of the Investment Company Act of 1940, as amended. |
| # | All or a portion of this security is segregated as collateral for investments in derivative instruments. |
| (z) | Zero coupon security. Rate represents yield to maturity at time of purchase. |
| * | Cost for federal income tax purposes is $2,236,771,410 and unrealized appreciation (depreciation) consists of: |
| | | | |
Gross unrealized appreciation | | $ | 617,641,282 | |
Gross unrealized depreciation | | | (186,856,034 | ) |
| | | | |
Net unrealized appreciation | | $ | 430,785,248 | |
The accompanying notes are an integral part of these financial statements.
| | | | |
| 100 | | Wells Fargo Advantage Equity Gateway Funds | | Portfolio of investments—November 30, 2012 (unaudited) |
INTERNATIONAL EQUITY PORTFOLIO
| | | | | | | | | | | | |
| Security name | | | | | | Shares | | | Value | |
| | | | | | | | | | | | |
| | | | |
Common Stocks: 98.39% | | | | | | | | | | | | |
| | | | |
| Argentina: 0.06% | | | | | | | | | | | | |
IRSA Inversiones y Representaciones SA ADR (Financials, Real Estate Management & Development) | | | | | | | 2,011 | | | $ | 14,338 | |
| | | | | | | | | | | | |
| | | | |
| Australia: 1.64% | | | | | | | | | | | | |
BHP Billiton Limited (Materials, Metals & Mining) | | | | | | | 10,199 | | | | 366,036 | |
| | | | | | | | | | | | |
| | | | |
| Brazil: 0.96% | | | | | | | | | | | | |
Cosan Limited Class A (Energy, Oil, Gas & Consumable Fuels) | | | | | | | 13,251 | | | | 214,666 | |
| | | | | | | | | | | | |
| | | | |
| Canada: 4.48% | | | | | | | | | | | | |
Barrick Gold Corporation (Materials, Metals & Mining) | | | | | | | 6,825 | | | | 236,970 | |
Cenovus Energy Incorporated (Energy, Oil, Gas & Consumable Fuels) « | | | | | | | 8,503 | | | | 283,575 | |
Suncor Energy Incorporated (Energy, Oil, Gas & Consumable Fuels) « | | | | | | | 4,222 | | | | 137,964 | |
Valeant Pharmaceuticals International Incorporated (Health Care, Pharmaceuticals) Ǡ | | | | | | | 6,202 | | | | 342,847 | |
| | | | |
| | | | | | | | | | | 1,001,356 | |
| | | | | | | | | | | | |
| | | | |
| China: 1.49% | | | | | | | | | | | | |
AutoNavi Holdings Limited ADR (Information Technology, Software) † | | | | | | | 3,871 | | | | 47,226 | |
Biostime International Holding Limited (Consumer Staples, Food Products) | | | | | | | 16,500 | | | | 49,925 | |
Industrial & Commercial Bank of China Class H (Financials, Commercial Banks) | | | | | | | 290,000 | | | | 195,698 | |
Shenguan Holdings Group Limited (Consumer Staples, Food Products) | | | | | | | 78,000 | | | | 39,653 | |
| | | | |
| | | | | | | | | | | 332,502 | |
| | | | | | | | | | | | |
| | | | |
| Finland: 1.72% | | | | | | | | | | | | |
Metso Oyj (Industrials, Machinery) | | | | | | | 10,222 | | | | 384,336 | |
| | | | | | | | | | | | |
| | | | |
| France: 1.84% | | | | | | | | | | | | |
Total SA (Energy, Oil, Gas & Consumable Fuels) | | | | | | | 8,218 | | | | 411,218 | |
| | | | | | | | | | | | |
| | | | |
| Germany: 8.29% | | | | | | | | | | | | |
Allianz AG (Financials, Insurance) | | | | | | | 2,614 | | | | 339,794 | |
Bayer AG (Health Care, Pharmaceuticals) | | | | | | | 3,940 | | | | 356,386 | |
Metro AG (Consumer Staples, Food & Staples Retailing) | | | | | | | 16,214 | | | | 454,006 | |
SAP AG (Information Technology, Software) | | | | | | | 1,917 | | | | 149,689 | |
Siemens AG (Industrials, Industrial Conglomerates) | | | | | | | 5,363 | | | | 553,106 | |
| | | | |
| | | | | | | | | | | 1,852,981 | |
| | | | | | | | | | | | |
| | | | |
| Hong Kong: 7.28% | | | | | | | | | | | | |
China Everbright Limited (Financials, Capital Markets) | | | | | | | 374,000 | | | | 539,511 | |
China Mobile Limited (Telecommunication Services, Wireless Telecommunication Services) | | | | | | | 34,000 | | | | 388,687 | |
Hengdeli Holdings Limited (Consumer Discretionary, Specialty Retail) | | | | | | | 1,027,951 | | | | 366,074 | |
Jardine Matheson Holdings Limited (Industrials, Industrial Conglomerates) | | | | | | | 5,600 | | | | 330,512 | |
Xtep International Holdings Limited (Consumer Discretionary, Textiles, Apparel & Luxury Goods) | | | | | | | 7,788 | | | | 3,095 | |
| | | | |
| | | | | | | | | | | 1,627,879 | |
| | | | | | | | | | | | |
| | | | |
| Italy: 4.46% | | | | | | | | | | | | |
ENI SpA (Energy, Oil, Gas & Consumable Fuels) | | | | | | | 19,955 | | | | 471,816 | |
Intesa Sanpaolo SpA (Financials, Commercial Banks) | | | | | | | 312,533 | | | | 525,966 | |
| | | | |
| | | | | | | | | | | 997,782 | |
| | | | | | | | | | | | |
The accompanying notes are an integral part of these financial statements.
| | | | | | |
| Portfolio of investments—November 30, 2012 (unaudited) | | Wells Fargo Advantage Equity Gateway Funds | | | 101 | |
INTERNATIONAL EQUITY PORTFOLIO
| | | | | | | | | | | | |
| Security name | | | | | | Shares | | | Value | |
| | | | | | | | | | | | |
| | | | |
| Japan: 19.27% | | | | | | | | | | | | |
Asahi Glass Company Limited (Industrials, Building Products) | | | | | | | 53,000 | | | $ | 403,761 | |
Canon Incorporated (Information Technology, Office Electronics) | | | | | | | 15,600 | | | | 545,579 | |
Capcom Company Limited (Information Technology, Software) | | | | | | | 21,400 | | | | 402,378 | |
FamilyMart Company Limited (Consumer Staples, Food & Staples Retailing) | | | | | | | 7,200 | | | | 319,233 | |
Itochu Corporation (Industrials, Trading Companies & Distributors) | | | | | | | 37,100 | | | | 370,842 | |
Mitsubishi UFJ Financial Group Incorporated (Financials, Commercial Banks) | | | | | | | 88,200 | | | | 403,365 | |
Mitsui OSK Lines Limited (Industrials, Marine) | | | | | | | 185,000 | | | | 464,548 | |
Nitto Denko Corporation (Materials, Chemicals) | | | | | | | 6,646 | | | | 346,268 | |
Toyota Motor Corporation (Consumer Discretionary, Automobiles) | | | | | | | 13,700 | | | | 587,487 | |
USS Company Limited (Consumer Discretionary, Specialty Retail) | | | | | | | 2,700 | | | | 287,572 | |
Yamada Denki Company Limited (Consumer Discretionary, Specialty Retail) « | | | | | | | 4,940 | | | | 174,684 | |
| | | | |
| | | | | | | | | | | 4,305,717 | |
| | | | | | | | | | | | |
| | | | |
| Netherlands: 2.71% | | | | | | | | | | | | |
Akzo Nobel NV (Materials, Chemicals) | | | | | | | 10,587 | | | | 605,007 | |
| | | | | | | | | | | | |
| | | | |
| Norway: 3.56% | | | | | | | | | | | | |
Marine Harvest ASA (Consumer Staples, Food Products) † | | | | | | | 423,722 | | | | 370,278 | |
Statoil ASA (Energy, Oil, Gas & Consumable Fuels) | | | | | | | 17,361 | | | | 424,489 | |
| | | | |
| | | | | | | | | | | 794,767 | |
| | | | | | | | | | | | |
| | | | |
| Philippines: 1.23% | | | | | | | | | | | | |
Philippine Long Distance Telephone Company (Telecommunication Services, Wireless Telecommunication Services) | | | | | | | 4,350 | | | | 275,106 | |
| | | | | | | | | | | | |
| | | | |
| Russia: 1.60% | | | | | | | | | | | | |
Mobile Telesystems ADR (Telecommunication Services, Wireless Telecommunication Services) | | | | | | | 13,246 | | | | 230,878 | |
Sberbank of Russia (Financials, Commercial Banks) | | | | | | | 42,727 | | | | 125,617 | |
| | | | |
| | | | | | | | | | | 356,495 | |
| | | | | | | | | | | | |
| | | | |
| South Korea: 4.64% | | | | | | | | | | | | |
Hana Financial Group Incorporated (Financials, Commercial Banks) | | | | | | | 5,210 | | | | 161,662 | |
Samsung Electronics Company Limited GDR (Information Technology, Semiconductors & Semiconductor Equipment)144A | | | | | | | 719 | | | | 470,945 | |
SK Telecom Company Limited (Telecommunication Services, Wireless Telecommunication Services) | | | | | | | 2,908 | | | | 404,169 | |
| | | | |
| | | | | | | | | | | 1,036,776 | |
| | | | | | | | | | | | |
| | | | |
| Sweden: 1.46% | | | | | | | | | | | | |
Volvo AB Class B (Industrials, Machinery) | | | | | | | 23,056 | | | | 326,607 | |
| | | | | | | | | | | | |
| | | | |
| Switzerland: 10.73% | | | | | | | | | | | | |
ABB Limited (Industrials, Electrical Equipment) | | | | | | | 26,766 | | | | 521,629 | |
Compagnie Financiere Richemont SA (Consumer Discretionary, Textiles, Apparel & Luxury Goods) | | | | | | | 3,853 | | | | 297,072 | |
Novartis AG (Health Care, Pharmaceuticals) | | | | | | | 9,051 | | | | 560,133 | |
Swatch Group AG Class B (Consumer Discretionary, Textiles, Apparel & Luxury Goods) | | | | | | | 925 | | | | 446,779 | |
Zurich Financial Services AG (Financials, Insurance) | | | | | | | 2,241 | | | | 571,918 | |
| | | | |
| | | | | | | | | | | 2,397,531 | |
| | | | | | | | | | | | |
| | | | |
| Taiwan: 1.18% | | | | | | | | | | | | |
Taiwan Semiconductor Manufacturing Company Limited ADR (Information Technology, Semiconductors & Semiconductor Equipment) | | | | | | | 15,290 | | | | 264,058 | |
| | | | | | | | | | | | |
The accompanying notes are an integral part of these financial statements.
| | | | |
| 102 | | Wells Fargo Advantage Equity Gateway Funds | | Portfolio of investments—November 30, 2012 (unaudited) |
INTERNATIONAL EQUITY PORTFOLIO
| | | | | | | | | | | | | | |
| Security name | | | | | | | Shares | | | Value | |
| | | | | | | | | | | | | | |
| | | | |
| United Kingdom: 16.54% | | | | | | | | | | | | | | |
BP plc (Energy, Oil, Gas & Consumable Fuels) | | | | | | | | | 72,681 | | | $ | 502,581 | |
Capita plc (Industrials, Professional Services) | | | | | | | | | 45,078 | | | | 550,691 | |
Chemring Group plc (Industrials, Aerospace & Defense) | | | | | | | | | 91,046 | | | | 358,985 | |
Debenhams plc (Consumer Discretionary, Multiline Retail) | | | | | | | | | 144,945 | | | | 273,792 | |
Man Group plc (Financials, Capital Markets) | | | | | | | | | 239,146 | | | | 294,258 | |
Reckitt Benckiser Group plc (Consumer Staples, Household Products) | | | | | | | | | 5,408 | | | | 340,079 | |
Smiths Group plc (Industrials, Industrial Conglomerates) | | | | | | | | | 24,767 | | | | 434,501 | |
Vodafone Group plc ADR (Telecommunication Services, Wireless Telecommunication Services) « | | | | | | | | | 16,672 | | | | 430,138 | |
Wolseley plc (Industrials, Trading Companies & Distributors) | | | | | | | | | 11,033 | | | | 512,089 | |
| | | | |
| | | | | | | | | | | | | 3,697,114 | |
| | | | | | | | | | | | | | |
| | | | |
| United States: 3.25% | | | | | | | | | | | | | | |
Bank of America Corporation (Financials, Diversified Financial Services) | | | | | | | | | 17,794 | | | | 175,449 | |
KKR & Company Limited Partnership (Financials, Capital Markets) | | | | | | | | | 12,547 | | | | 172,521 | |
QUALCOMM Incorporated (Information Technology, Communications Equipment) | | | | | | | | | 5,945 | | | | 378,219 | |
| | | | |
| | | | | | | | | | | | | 726,189 | |
| | | | | | | | | | | | | | |
| | | | |
Total Common Stocks (Cost $21,945,178) | | | | | | | | | | | | | 21,988,461 | |
| | | | | | | | | | | | | | |
| | | | |
| | | | | Yield | | | | | | | |
| Short-Term Investments: 6.28% | | | | | | | | | | | | | | |
| | | | |
| Investment Companies: 6.28% | | | | | | | | | | | | | | |
Wells Fargo Advantage Cash Investment Money Market Fund, Select Class (u)(l) | | | | | 0.16 | % | | | 327,352 | | | | 327,352 | |
Wells Fargo Securities Lending Cash Investments, LLC (l)(u)(v)(r) | | | | | 0.21 | | | | 1,076,691 | | | | 1,076,691 | |
| | | | |
Total Short-Term Investments (Cost $1,404,043) | | | | | | | | | | | | | 1,404,043 | |
| | | | | | | | | | | | | | |
| | | | | | | | |
| Total investments in securities | | | | | | | | |
| (Cost $23,349,221) * | | | 104.67 | % | | | 23,392,504 | |
Other assets and liabilities, net | | | (4.67 | ) | | | (1,043,530 | ) |
| | | | | | | | |
| Total net assets | | | 100.00 | % | | $ | 22,348,974 | |
| | | | | | | | |
| « | All or a portion of this security is on loan. |
| † | Non-income-earning security |
| 144A | Security that may be resold to “qualified institutional buyers” under Rule 144A or security offered pursuant to Section 4(2) of the Securities Act of 1933, as amended. |
| (l) | Investment in an affiliate |
| (u) | Rate shown is the 7-day annualized yield at period end. |
| (v) | Security represents investment of cash collateral received from securities on loan. |
| (r) | The investment company is exempt from registration under Section 3(c)(7) of the Investment Company Act of 1940, as amended. |
| * | Cost for federal income tax purposes is $23,452,164 and unrealized appreciation (depreciation) consists of: |
| | | | |
Gross unrealized appreciation | | $ | 1,346,020 | |
Gross unrealized depreciation | | | (1,405,680 | ) |
| | | | |
Net unrealized depreciation | | $ | (59,660 | ) |
The accompanying notes are an integral part of these financial statements.
| | | | | | |
| Portfolio of investments—November 30, 2012 (unaudited) | | Wells Fargo Advantage Equity Gateway Funds | | | 103 | |
INTERNATIONAL EQUITY PORTFOLIO
The following table shows the percent of total long-term investments by sector as of November 30, 2012:
| | | | |
Industrials | | | 23.70 | % |
Financials | | | 16.01 | % |
Energy | | | 11.13 | % |
Consumer Discretionary | | | 11.08 | % |
Information Technology | | | 10.27 | % |
Telecommunication Services | | | 7.86 | % |
Consumer Staples | | | 7.15 | % |
Materials | | | 7.07 | % |
Health Care | | | 5.73 | % |
| | | | |
| | | 100.00 | % |
| | | | |
The accompanying notes are an integral part of these financial statements.
| | | | |
| 104 | | Wells Fargo Advantage Equity Gateway Funds | | Portfolio of investments—November 30, 2012 (unaudited) |
INTERNATIONAL GROWTH PORTFOLIO
| | | | | | | | | | | | |
| Security name | | | | | | Shares | | | Value | |
| | | | | | | | | | | | |
| | | | |
Common Stocks: 97.11% | | | | | | | | | | | | |
| | | | |
| Australia: 0.46% | | | | | | | | | | | | |
Coca-Cola Amatil Limited (Consumer Staples, Beverages) | | | | | | | 20,004 | | | $ | 286,839 | |
Westfield Group (Financials, REITs) | | | | | | | 21,325 | | | | 231,895 | |
| | | | |
| | | | | | | | | | | 518,734 | |
| | | | | | | | | | | | |
| | | | |
| Belgium: 4.41% | | | | | | | | | | | | |
Anheuser-Busch InBev NV (Consumer Staples, Beverages) | | | | | | | 46,254 | | | | 4,053,891 | |
Telenet Group Holding NV (Telecommunication Services, Diversified Telecommunication Services) | | | | | | | 3,921 | | | | 179,093 | |
UCB SA (Health Care, Pharmaceuticals) | | | | | | | 12,217 | | | | 693,468 | |
| | | | |
| | | | | | | | | | | 4,926,452 | |
| | | | | | | | | | | | |
| | | | |
| Bermuda: 0.71% | | | | | | | | | | | | |
Hong Kong Land Holdings Limited (Financials, Real Estate Management & Development) | | | | | | | 120,966 | | | | 791,118 | |
| | | | | | | | | | | | |
| | | | |
| Canada: 4.19% | | | | | | | | | | | | |
Canadian Pacific Railway Limited (Industrials, Road & Rail) « | | | | | | | 50,104 | | | | 4,676,707 | |
| | | | | | | | | | | | |
| | | | |
| Cayman Islands: 5.52% | | | | | | | | | | | | |
Baidu.com Incorporated ADR (Information Technology, Internet Software & Services) Ǡ | | | | | | | 34,473 | | | | 3,320,095 | |
China Resources Land Limited (Financials, Real Estate Management & Development) | | | | | | | 542,500 | | | | 1,448,963 | |
Tencent Holdings Limited (Information Technology, Internet Software & Services) | | | | | | | 42,500 | | | | 1,388,480 | |
| | | | |
| | | | | | | | | | | 6,157,538 | |
| | | | | | | | | | | | |
| | | | |
| China: 0.91% | | | | | | | | | | | | |
China Construction Bank (Financials, Commercial Banks) | | | | | | | 1,332,000 | | | | 1,020,887 | |
| | | | | | | | | | | | |
| | | | |
| France: 8.48% | | | | | | | | | | | | |
Air Liquide SA (Materials, Chemicals) | | | | | | | 6,183 | | | | 755,159 | |
LVMH Moet Hennessy Louis Vuitton SA (Consumer Discretionary, Textiles, Apparel & Luxury Goods) « | | | | | | | 3,681 | | | | 645,810 | |
Pernod-Ricard SA (Consumer Staples, Beverages) | | | | | | | 20,327 | | | | 2,301,544 | |
Schneider Electric SA (Industrials, Electrical Equipment) | | | | | | | 26,850 | | | | 1,887,065 | |
Technip SA (Energy, Energy Equipment & Services) | | | | | | | 2,935 | | | | 340,945 | |
Unibail-Rodamco SA (Financials, Real Estate Management & Development) | | | | | | | 10,243 | | | | 2,403,872 | |
Zodiac Aerospace SA (Industrials, Aerospace & Defense) | | | | | | | 10,132 | | | | 1,131,920 | |
| | | | |
| | | | | | | | | | | 9,466,315 | |
| | | | | | | | | | | | |
| | | | |
| Germany: 15.75% | | | | | | | | | | | | |
Allianz AG (Financials, Insurance) | | | | | | | 6,314 | | | | 820,757 | |
Bayer AG (Health Care, Pharmaceuticals) | | | | | | | 19,649 | | | | 1,777,317 | |
Beiersdorf AG (Consumer Staples, Personal Products) | | | | | | | 24,166 | | | | 1,895,175 | |
Brenntag AG (Materials, Chemicals) | | | | | | | 13,684 | | | | 1,768,996 | |
Deutsche Post AG (Industrials, Air Freight & Logistics) | | | | | | | 96,274 | | | | 1,998,339 | |
Kabel Deutschland Holding AG (Consumer Discretionary, Media) | | | | | | | 14,861 | | | | 1,074,608 | |
Linde AG (Materials, Chemicals) | | | | | | | 28,103 | | | | 4,859,240 | |
Muenchener Rueckversicherungs-Gesellschaft AG (Financials, Insurance) | | | | | | | 19,801 | | | | 3,379,977 | |
| | | | |
| | | | | | | | | | | 17,574,409 | |
| | | | | | | | | | | | |
The accompanying notes are an integral part of these financial statements.
| | | | | | |
| Portfolio of investments—November 30, 2012 (unaudited) | | Wells Fargo Advantage Equity Gateway Funds | | | 105 | |
INTERNATIONAL GROWTH PORTFOLIO
| | | | | | | | | | | | |
| Security name | | | | | | Shares | | | Value | |
| | | | | | | | | | | | |
| | | | |
| Hong Kong: 11.61% | | | | | | | | | | | | |
AIA Group Limited (Financials, Insurance) | | | | | | | 912,600 | | | $ | 3,550,217 | |
BOC Hong Kong Holdings Limited (Financials, Commercial Banks) | | | | | | | 154,088 | | | | 473,187 | |
China Mobile Limited (Telecommunication Services, Wireless Telecommunication Services) | | | | | | | 167,100 | | | | 1,910,281 | |
Hang Seng Bank Limited (Financials, Commercial Banks) | | | | | | | 82,451 | | | | 1,259,606 | |
Sands China Limited (Consumer Discretionary, Hotels, Restaurants & Leisure) | | | | | | | 352,113 | | | | 1,501,553 | |
Sino Land Company (Financials, Real Estate Management & Development) | | | | | | | 506,252 | | | | 914,496 | |
Sun Hung Kai Properties Limited (Financials, Real Estate Management & Development) | | | | | | | 141,742 | | | | 2,073,952 | |
Wynn Macau Limited (Consumer Discretionary, Hotels, Restaurants & Leisure) | | | | | | | 447,396 | | | | 1,278,654 | |
| | | | |
| | | | | | | | | | | 12,961,946 | |
| | | | | | | | | | | | |
| | | | |
| India: 0.46% | | | | | | | | | | | | |
Coal India Limited (Energy, Oil, Gas & Consumable Fuels) | | | | | | | 75,394 | | | | 508,055 | |
| | | | | | | | | | | | |
| | | | |
| Indonesia: 0.27% | | | | | | | | | | | | |
PT Bank Rakyat Indonesia Tbk (Financials, Commercial Banks) | | | | | | | 417,500 | | | | 306,809 | |
| | | | | | | | | | | | |
| | | | |
| Ireland: 2.75% | | | | | | | | | | | | |
Covidien plc (Health Care, Health Care Equipment & Supplies) « | | | | | | | 44,665 | | | | 2,595,483 | |
CRH plc (Materials, Construction Materials) | | | | | | | 25,767 | | | | 470,834 | |
| | | | |
| | | | | | | | | | | 3,066,317 | |
| | | | | | | | | | | | |
| | | | |
| Italy: 0.97% | | | | | | | | | | | | |
Fiat Industrial SpA (Consumer Discretionary, Auto Components) | | | | | | | 101,323 | | | | 1,083,196 | |
| | | | | | | | | | | | |
| | | | |
| Japan: 10.30% | | | | | | | | | | | | |
Bridgestone Corporation (Consumer Discretionary, Auto Components) | | | | | | | 25,740 | | | | 621,057 | |
Honda Motor Company Limited (Consumer Discretionary, Automobiles) | | | | | | | 107,500 | | | | 3,562,686 | |
Japan Tobacco Incorporated (Consumer Staples, Tobacco) | | | | | | | 163,300 | | | | 4,892,958 | |
Kao Corporation (Consumer Staples, Personal Products) | | | | | | | 26,900 | | | | 738,457 | |
NGK Insulators Limited (Industrials, Electrical Equipment) | | | | | | | 120,000 | | | | 1,283,921 | |
Nissan Motor Company Limited (Consumer Discretionary, Automobiles) | | | | | | | 40,900 | | | | 396,423 | |
| | | | |
| | | | | | | | | | | 11,495,502 | |
| | | | | | | | | | | | |
| | | | |
| Malaysia: 0.16% | | | | | | | | | | | | |
Astro Malaysia Holdings Bhd (Consumer Discretionary, Media) † | | | | | | | 188,000 | | | | 177,501 | |
| | | | | | | | | | | | |
| | | | |
| Mexico: 0.20% | | | | | | | | | | | | |
America Movil SAB de CV ADR (Telecommunication Services, Wireless Telecommunication Services) | | | | | | | 9,434 | | | | 222,548 | |
| | | | | | | | | | | | |
| | | | |
| Netherlands: 5.42% | | | | | | | | | | | | |
Akzo Nobel NV (Materials, Chemicals) | | | | | | | 9,393 | | | | 536,774 | |
Koninklijke Vopak NV (Industrials, Transportation Infrastructure) | | | | | | | 14,255 | | | | 1,053,221 | |
Unilever NV (Consumer Staples, Food Products) « | | | | | | | 106,845 | | | | 4,054,081 | |
Ziggo NV (Telecommunication Services, Diversified Telecommunication Services) | | | | | | | 12,765 | | | | 399,765 | |
| | | | |
| | | | | | | | | | | 6,043,841 | |
| | | | | | | | | | | | |
| | | | |
| Nigeria: 0.36% | | | | | | | | | | | | |
Nigerian Breweries plc (Consumer Staples, Beverages) | | | | | | | 449,279 | | | | 400,882 | |
| | | | | | | | | | | | |
| | | | |
| Singapore: 0.36% | | | | | | | | | | | | |
City Developments Limited (Financials, Real Estate Management & Development) | | | | | | | 42,427 | | | | 407,377 | |
| | | | | | | | | | | | |
The accompanying notes are an integral part of these financial statements.
| | | | |
| 106 | | Wells Fargo Advantage Equity Gateway Funds | | Portfolio of investments—November 30, 2012 (unaudited) |
INTERNATIONAL GROWTH PORTFOLIO
| | | | | | | | | | | | | | |
| Security name | | | | | | | Shares | | | Value | |
| | | | | | | | | | | | | | |
| | | | |
| South Korea: 0.93% | | | | | | | | | | | | | | |
Samsung Electronics Company Limited (Information Technology, Semiconductors & Semiconductor Equipment) | | | | | | | | | 800 | | | $ | 1,038,740 | |
| | | | | | | | | | | | | | |
| | | | |
| Spain: 0.60% | | | | | | | | | | | | | | |
Grifols SA (Health Care, Biotechnology) † | | | | | | | | | 20,818 | | | | 665,906 | |
| | | | | | | | | | | | | | |
| | | | |
| Switzerland: 6.59% | | | | | | | | | | | | | | |
Actelion Limited (Health Care, Biotechnology) | | | | | | | | | 3,193 | | | | 158,151 | |
Givaudan SA (Materials, Chemicals) | | | | | | | | | 421 | | | | 422,726 | |
Nestle SA (Consumer Staples, Food Products) | | | | | | | | | 60,722 | | | | 3,974,090 | |
Roche Holdings AG (Health Care, Pharmaceuticals) | | | | | | | | | 6,397 | | | | 1,259,105 | |
Swatch Group AG Class B (Consumer Discretionary, Textiles, Apparel & Luxury Goods) | | | | | | | | | 1,642 | | | | 793,093 | |
UBS AG (Financials, Diversified Financial Services) | | | | | | | | | 47,706 | | | | 746,452 | |
| | | | |
| | | | | | | | | | | | | 7,353,617 | |
| | | | | | | | | | | | | | |
| | | | |
| United Kingdom: 12.58% | | | | | | | | | | | | | | |
British Land Company plc (Financials, REITs) | | | | | | | | | 45,246 | | | | 398,700 | |
Diageo plc (Consumer Staples, Beverages) | | | | | | | | | 21,136 | | | | 628,837 | |
HSBC Holdings plc (Financials, Commercial Banks) | | | | | | | | | 244,015 | | | | 2,493,081 | |
Imperial Tobacco Group plc (Consumer Staples, Tobacco) | | | | | | | | | 66,670 | | | | 2,667,180 | |
Intercontinental Hotels Group plc (Consumer Discretionary, Hotels, Restaurants & Leisure) | | | | | | | | | 16,779 | | | | 448,400 | |
Johnson Matthey plc (Materials, Chemicals) | | | | | | | | | 23,221 | | | | 892,513 | |
Land Securities Group plc (Financials, REITs) | | | | | | | | | 96,190 | | | | 1,245,216 | |
Meggitt plc (Industrials, Aerospace & Defense) | | | | | | | | | 93,247 | | | | 581,747 | |
Prudential plc (Financials, Insurance) | | | | | | | | | 37,180 | | | | 539,090 | |
Reckitt Benckiser Group plc (Consumer Staples, Household Products) | | | | | | | | | 1,242 | | | | 78,102 | |
Rolls Royce Holdings plc (Industrials, Aerospace & Defense) | | | | | | | | | 14,464 | | | | 206,360 | |
SABMiller plc (Consumer Staples, Beverages) | | | | | | | | | 54,661 | | | | 2,476,188 | |
WPP plc (Consumer Discretionary, Media) | | | | | | | | | 100,615 | | | | 1,379,875 | |
| | | | |
| | | | | | | | | | | | | 14,035,289 | |
| | | | | | | | | | | | | | |
| | | | |
| United States: 2.66% | | | | | | | | | | | | | | |
Liberty Global Incorporated Class A (Consumer Discretionary, Media) Ǡ | | | | | | | | | 11,065 | | | | 620,083 | |
Schlumberger Limited (Energy, Energy Equipment & Services) | | | | | | | | | 27,470 | | | | 1,967,401 | |
Virgin Media Incorporated (Consumer Discretionary, Media) « | | | | | | | | | 10,933 | | | | 384,514 | |
| | | | |
| | | | | | | | | | | | | 2,971,998 | |
| | | | | | | | | | | | | | |
| | | | |
| Virgin Islands (British): 0.46% | | | | | | | | | | | | | | |
Arcos Dorados Holdings Incorporated Class A (Consumer Discretionary, Hotels, Restaurants & Leisure) « | | | | | | | | | 41,894 | | | | 513,202 | |
| | | | | | | | | | | | | | |
| | | | |
Total Common Stocks (Cost $92,791,322) | | | | | | | | | | | | | 108,384,886 | |
| | | | | | | | | | | | | | |
| | | | |
| | | | | Dividend Yield | | | | | | | |
| | | | |
Preferred Stocks: 1.67% | | | | | | | | | | | | | | |
| | | | |
| Germany: 1.67% | | | | | | | | | | | | | | |
Henkel AG & Company KGaA ADR (Consumer Staples, Household Products) | | | | | 0.96 | % | | | 22,301 | | | | 1,863,480 | |
| | | | | | | | | | | | | | |
| | | | |
Total Preferred Stocks (Cost $1,577,687) | | | | | | | | | | | | | 1,863,480 | |
| | | | | | | | | | | | | | |
The accompanying notes are an integral part of these financial statements.
| | | | | | |
| Portfolio of investments—November 30, 2012 (unaudited) | | Wells Fargo Advantage Equity Gateway Funds | | | 107 | |
INTERNATIONAL GROWTH PORTFOLIO
| | | | | | | | | | | | | | |
| Security name | | | | Yield | | | Shares | | | Value | |
| | | | | | | | | | | | | | |
| | | | |
Short-Term Investments: 7.23% | | | | | | | | | | | | | | |
| | | | |
| Investment Companies: 7.23% | | | | | | | | | | | | | | |
Wells Fargo Advantage Cash Investment Money Market Fund, Select Class (l)(u) | | | | | 0.16 | % | | | 1,084,659 | | | $ | 1,084,659 | |
Wells Fargo Securities Lending Cash Investments, LLC (r)(v)(l)(u) | | | | | 0.21 | | | | 6,985,505 | | | | 6,985,505 | |
| | | | |
Total Short-Term Investments (Cost $8,070,164) | | | | | | | | | | | | | 8,070,164 | |
| | | | | | | | | | | | | | |
| | | | | | | | |
| Total investments in securities | | | | | | | | |
| (Cost $102,439,173) * | | | 106.01 | % | | | 118,318,530 | |
Other assets and liabilities, net | | | (6.01 | ) | | | (6,711,662 | ) |
| | | | | | | | |
| Total net assets | | | 100.00 | % | | $ | 111,606,868 | |
| | | | | | | | |
| † | Non-income-earning security |
| « | All or a portion of this security is on loan. |
| (l) | Investment in an affiliate |
| (u) | Rate shown is the 7-day annualized yield at period end. |
| (r) | The investment company is exempt from registration under Section 3(c)(7) of the Investment Company Act of 1940, as amended. |
| (v) | Security represents investment of cash collateral received from securities on loan. |
| * | Cost for federal income tax purposes is $102,953,148 and unrealized appreciation (depreciation) consists of: |
| | | | |
Gross unrealized appreciation | | $ | 16,530,333 | |
Gross unrealized depreciation | | | (1,164,951 | ) |
| | | | |
Net unrealized appreciation | | $ | 15,365,382 | |
The following table shows the percent of total long-term investments by sector as of November 30, 2012:
| | | | |
Consumer Staples | | | 27.50 | % |
Financials | | | 22.24 | % |
Consumer Discretionary | | | 13.13 | % |
Industrials | | | 11.63 | % |
Materials | | | 8.80 | % |
Health Care | | | 6.48 | % |
Information Technology | | | 5.21 | % |
Energy | | | 2.55 | % |
Telecommunication Services | | | 2.46 | % |
| | | | |
| | | 100.00 | % |
| | | | |
The accompanying notes are an integral part of these financial statements.
| | | | |
| 108 | | Wells Fargo Advantage Equity Gateway Funds | | Summary portfolio of investments—November 30, 2012 (unaudited) |
INTERNATIONAL INDEX PORTFOLIO
The Summary Portfolio of Investments shows the 50 largest portfolio holdings in unaffiliated issuers and any holdings exceeding 1% of the total net assets as of the report date. The remaining securities held are grouped as “Other securities” in each category. You can request a complete schedule of portfolio holdings as of the report date, free of charge, by accessing the following website: http://a584.g.akamai.net/f/584/1326/1d/www.wellsfargoadvantagefunds.com/pdf/semi/holdings/internationalindex.pdf or by calling Wells Fargo Advantage Funds at 1-800-222-8222. This complete schedule, filed on the Form N-CSR, is also available on the SEC’s website at sec.gov.
| | | | | | | | | | | | | | | | |
| Security name | | | | | | Shares | | | Value | | | Percent of
net assets | |
| | | | | |
Common Stocks: 98.26% | | | | | | | | | | | | | | | | |
| | | | | |
| Australia: 8.86% | | | | | | | | | | | | | | | | |
Australia & New Zealand Banking Group Limited (Financials, Commercial Banks) | | | | | | | 5,621 | | | $ | 142,898 | | | | 0.64 | % |
BHP Billiton Limited (Materials, Metals & Mining) | | | | | | | 6,732 | | | | 241,607 | | | | 1.08 | |
Commonwealth Bank of Australia (Financials, Commercial Banks) | | | | | | | 3,324 | | | | 207,060 | | | | 0.93 | |
National Australia Bank Limited (Financials, Commercial Banks) | | | | | | | 4,698 | | | | 119,139 | | | | 0.53 | |
Westpac Banking Corporation (Financials, Commercial Banks) | | | | | | | 6,378 | | | | 169,730 | | | | 0.76 | |
Other securities | | | | | | | | | | | 1,101,482 | | | | 4.92 | |
| | | | | |
| | | | | | | | | | | 1,981,916 | | | | 8.86 | |
| | | | | | | | | | | | | �� | | | |
| | | | | |
| Austria: 0.30% | | | | | | | | | | | | | | | | |
Other securities | | | | | | | | | | | 67,957 | | | | 0.30 | |
| | | | | | | | | | | | | | | | |
| | | | | |
| Belgium: 1.16% | | | | | | | | | | | | | | | | |
Anheuser-Busch InBev NV (Consumer Staples, Beverages) | | | | | | | 1,685 | | | | 147,680 | | | | 0.66 | |
Other securities | | | | | | | | | | | 112,318 | | | | 0.50 | |
| | | | | |
| | | | | | | | | | | 259,998 | | | | 1.16 | |
| | | | | | | | | | | | | | | | |
| | | | | |
| Denmark: 1.17% | | | | | | | | | | | | | | | | |
Novo Nordisk A/S Class B (Health Care, Pharmaceuticals) | | | | | | | 854 | | | | 135,626 | | | | 0.61 | |
Other securities | | | | | | | | | | | 126,283 | | | | 0.56 | |
| | | | | |
| | | | | | | | | | | 261,909 | | | | 1.17 | |
| | | | | | | | | | | | | | | | |
| | | | | |
| Finland: 0.79% | | | | | | | | | | | | | | | | |
Other securities | | | | | | | | | | | 176,560 | | | | 0.79 | |
| | | | | | | | | | | | | | | | |
| | | | | |
| France: 9.05% | | | | | | | | | | | | | | | | |
BNP Paribas SA (Financials, Commercial Banks) | | | | | | | 2,097 | | | | 117,122 | | | | 0.52 | |
LVMH Moet Hennessy Louis Vuitton SA (Consumer Discretionary, Textiles, Apparel & Luxury Goods) « | | | | | | | 531 | | | | 93,161 | | | | 0.42 | |
Sanofi-Aventis SA (Health Care, Pharmaceuticals) | | | | | | | 2,482 | | | | 221,632 | | | | 0.99 | |
Total SA (Energy, Oil, Gas & Consumable Fuels) | | | | | | | 4,441 | | | | 222,222 | | | | 0.99 | |
Other securities | | | | | | | | | | | 1,370,611 | | | | 6.13 | |
| | | | | |
| | | | | | | | | | | 2,024,748 | | | | 9.05 | |
| | | | | | | | | | | | | | | | |
| | | | | |
| Germany: 8.04% | | | | | | | | | | | | | | | | |
Allianz AG (Financials, Insurance) | | | | | | | 955 | | | | 124,141 | | | | 0.56 | |
BASF SE (Materials, Chemicals) | | | | | | | 1,924 | | | | 172,406 | | | | 0.77 | |
Bayer AG (Health Care, Pharmaceuticals) | | | | | | | 1,735 | | | | 156,936 | | | | 0.70 | |
Daimler AG (Consumer Discretionary, Automobiles) | | | | | | | 1,895 | | | | 93,603 | | | | 0.42 | |
Deutsche Bank AG (Financials, Commercial Banks) | | | | | | | 1,940 | | | | 85,633 | | | | 0.38 | |
SAP AG (Information Technology, Software) | | | | | | | 1,932 | | | | 150,860 | | | | 0.67 | |
Siemens AG (Industrials, Industrial Conglomerates) | | | | | | | 1,718 | | | | 177,184 | | | | 0.79 | |
Other securities | | | | | | | | | | | 837,128 | | | | 3.75 | |
| | | | | |
| | | | | | | | | | | 1,797,891 | | | | 8.04 | |
| | | | | | | | | | | | | | | | |
The accompanying notes are an integral part of these financial statements.
| | | | | | |
| Summary portfolio of investments—November 30, 2012 (unaudited) | | Wells Fargo Advantage Equity Gateway Funds | | | 109 | |
INTERNATIONAL INDEX PORTFOLIO
| | | | | | | | | | | | | | | | |
| Security name | | | | | | Shares | | | Value | | | Percent of
net assets | |
| | | | | | | | | | | | | | | | |
| | | | | |
| Greece: 0.06% | | | | | | | | | | | | | | | | |
Other securities | | | | | | | | | | $ | 13,673 | | | | 0.06 | % |
| | | | | | | | | | | | | | | | |
| | | | | |
| Hong Kong: 3.23% | | | | | | | | | | | | | | | | |
AIA Group Limited (Financials, Insurance) | | | | | | | 22,600 | | | | 87,919 | | | | 0.39 | |
Other securities | | | | | | | | | | | 634,229 | | | | 2.84 | |
| | | | | |
| | | | | | | | | | | 722,148 | | | | 3.23 | |
| | | | | | | | | | | | | | | | |
| | | | | |
| Ireland: 0.29% | | | | | | | | | | | | | | | | |
Other securities | | | | | | | | | | | 65,673 | | | | 0.29 | |
| | | | | | | | | | | | | | | | |
| | | | | |
| Israel: 0.61% | | | | | | | | | | | | | | | | |
Other securities | | | | | | | | | | | 135,199 | | | | 0.61 | |
| | | | | | | | | | | | | | | | |
| | | | | |
| Italy: 2.16% | | | | | | | | | | | | | | | | |
ENI SpA (Energy, Oil, Gas & Consumable Fuels) | | | | | | | 5,328 | | | | 125,975 | | | | 0.56 | |
Other securities | | | | | | | | | | | 357,357 | | | | 1.60 | |
| | | | | |
| | | | | | | | | | | 483,332 | | | | 2.16 | |
| | | | | | | | | | | | | | | | |
| | | | | |
| Japan: 18.92% | | | | | | | | | | | | | | | | |
Honda Motor Company Limited (Consumer Discretionary, Automobiles) | | | | | | | 3,400 | | | | 112,680 | | | | 0.50 | |
Mitsubishi UFJ Financial Group Incorporated (Financials, Commercial Banks) | | | | | | | 26,670 | | | | 121,970 | | | | 0.55 | |
Sumitomo Mitsui Financial Group Incorporated (Financials, Commercial Banks) | | | | | | | 2,800 | | | | 90,146 | | | | 0.40 | |
Toyota Motor Corporation (Consumer Discretionary, Automobiles) « | | | | | | | 5,800 | | | | 248,717 | | | | 1.11 | |
Other securities | | | | | | | | | | | 3,657,217 | | | | 16.36 | |
| | | | | |
| | | | | | | | | | | 4,230,730 | | | | 18.92 | |
| | | | | | | | | | | | | | | | |
| | | | | |
| Luxembourg: 0.42% | | | | | | | | | | | | | | | | |
Other securities | | | | | | | | | | | 93,196 | | | | 0.42 | |
| | | | | | | | | | | | | | | | |
| | | | | |
| Netherlands: 2.80% | | | | | | | | | | | | | | | | |
Unilever NV (Consumer Staples, Food Products) | | | | | | | 3,412 | | | | 129,463 | | | | 0.58 | |
Other securities | | | | | | | | | | | 497,038 | | | | 2.22 | |
| | | | | |
| | | | | | | | | | | 626,501 | | | | 2.80 | |
| | | | | | | | | | | | | | | | |
| | | | | |
| New Zealand: 0.14% | | | | | | | | | | | | | | | | |
Other securities | | | | | | | | | | | 30,215 | | | | 0.14 | |
| | | | | | | | | | | | | | | | |
| | | | | |
| Norway: 0.89% | | | | | | | | | | | | | | | | |
Other securities | | | | | | | | | | | 197,747 | | | | 0.89 | |
| | | | | | | | | | | | | | | | |
| | | | | |
| Portugal: 0.17% | | | | | | | | | | | | | | | | |
Other securities | | | | | | | | | | | 38,251 | | | | 0.17 | |
| | | | | | | | | | | | | | | | |
| | | | | |
| Singapore: 1.83% | | | | | | | | | | | | | | | | |
Other securities | | | | | | | | | | | 409,754 | | | | 1.83 | |
| | | | | | | | | | | | | | | | |
| | | | | |
| Spain: 2.91% | | | | | | | | | | | | | | | | |
Banco Bilbao Vizcaya Argentaria SA (Financials, Commercial Banks) | | | | | | | 11,236 | | | | 95,335 | | | | 0.43 | |
Banco Santander Central Hispano SA (Financials, Commercial Banks) | | | | | | | 21,405 | | | | 164,636 | | | | 0.73 | |
Telefonica SA (Telecommunication Services, Diversified Telecommunication Services) † | | | | | | | 8,458 | | | | 110,991 | | | | 0.50 | |
The accompanying notes are an integral part of these financial statements.
| | | | |
| 110 | | Wells Fargo Advantage Equity Gateway Funds | | Summary portfolio of investments—November 30, 2012 (unaudited) |
INTERNATIONAL INDEX PORTFOLIO
| | | | | | | | | | | | | | | | |
| Security name | | | | | | Shares | | | Value | | | Percent of
net assets | |
| | | | | | | | | | | | | | | | |
| | | | | |
| Spain: (continued) | | | | | | | | | | | | | | | | |
Other securities | | | | | | | | | | $ | 280,650 | | | | 1.25 | % |
| | | | | |
| | | | | | | | | | | 651,612 | | | | 2.91 | |
| | | | | | | | | | | | | | | | |
| | | | | |
| Sweden: 3.08% | | | | | | | | | | | | | | | | |
Other securities | | | | | | | | | | | 688,524 | | | | 3.08 | |
| | | | | | | | | | | | | | | | |
| | | | | |
| Switzerland: 8.73% | | | | | | | | | | | | | | | | |
ABB Limited (Industrials, Electrical Equipment) | | | | | | | 4,584 | | | | 89,335 | | | | 0.40 | |
Nestle SA (Consumer Staples, Food Products) | | | | | | | 6,744 | | | | 441,377 | | | | 1.97 | |
Novartis AG (Health Care, Pharmaceuticals) | | | | | | | 4,802 | | | | 297,178 | | | | 1.33 | |
Roche Holdings AG (Health Care, Pharmaceuticals) | | | | | | | 1,467 | | | | 288,746 | | | | 1.29 | |
UBS AG (Financials, Diversified Financial Services) † | | | | | | | 7,639 | | | | 119,527 | | | | 0.53 | |
Other securities | | | | | | | | | | | 715,210 | | | | 3.21 | |
| | | | | |
| | | | | | | | | | | 1,951,373 | | | | 8.73 | |
| | | | | | | | | | | | | | | | |
| | | | | |
| United Kingdom: 22.65% | | | | | | | | | | | | | | | | |
AstraZeneca plc (Health Care, Pharmaceuticals) | | | | | | | 2,608 | | | | 123,953 | | | | 0.55 | |
Barclays plc (Financials, Commercial Banks) | | | | | | | 24,305 | | | | 95,793 | | | | 0.43 | |
BG Group plc (Health Care, Health Care Providers & Services) | | | | | | | 7,126 | | | | 122,161 | | | | 0.55 | |
BHP Billiton plc (Materials, Metals & Mining) | | | | | | | 4,417 | | | | 138,845 | | | | 0.62 | |
BP plc (Energy, Oil, Gas & Consumable Fuels) | | | | | | | 39,722 | | | | 274,673 | | | | 1.23 | |
British American Tobacco plc (Consumer Staples, Tobacco) | | | | | | | 4,064 | | | | 213,175 | | | | 0.95 | |
Diageo plc (Consumer Staples, Beverages) | | | | | | | 5,256 | | | | 156,376 | | | | 0.70 | |
GlaxoSmithKline plc (Health Care, Pharmaceuticals) | | | | | | | 10,401 | | | | 222,381 | | | | 0.99 | |
HSBC Holdings plc (Financials, Commercial Banks) | | | | | | | 38,292 | | | | 391,226 | | | | 1.75 | |
Rio Tinto plc (Materials, Metals & Mining) | | | | | | | 2,803 | | | | 138,924 | | | | 0.62 | |
Royal Dutch Shell plc Class A (Energy, Oil, Gas & Consumable Fuels) | | | | | | | 7,716 | | | | 258,308 | | | | 1.15 | |
Royal Dutch Shell plc Class B (Energy, Oil, Gas & Consumable Fuels) | | | | | | | 5,520 | | | | 190,541 | | | | 0.85 | |
SABMiller plc (Consumer Staples, Beverages) | | | | | | | 1,998 | | | | 90,511 | | | | 0.40 | |
Standard Chartered plc (Financials, Commercial Banks) | | | | | | | 5,009 | | | | 116,766 | | | | 0.52 | |
Tesco plc (Consumer Staples, Food & Staples Retailing) | | | | | | | 16,814 | | | | 87,577 | | | | 0.39 | |
Unilever plc (Consumer Staples, Food Products) | | | | | | | 2,683 | | | | 103,295 | | | | 0.46 | |
Vodafone Group plc (Telecommunication Services, Wireless Telecommunication Services) | | | | | | | 103,024 | | | | 265,994 | | | | 1.19 | |
Other securities | | | | | | | | | | | 2,074,836 | | | | 9.30 | |
| | | | | |
| | | | | | | | | | | 5,065,335 | | | | 22.65 | |
| | | | | | | | | | | | | | | | |
| | | | | |
Total Common Stocks (Cost $20,230,067) | | | | | | | | | | | 21,974,242 | | | | 98.26 | |
| | | | | | | | | | | | | | | | |
| | | | | |
Preferred Stocks: 0.62% | | | | | | | | | | | | | | | | |
| | | | | |
| Germany: 0.62% | | | | | | | | | | | | | | | | |
Other securities | | | | | | | | | | | 138,423 | | | | 0.62 | |
| | | | | | | | | | | | | | | | |
| | | | | |
| United Kingdom: 0.00% | | | | | | | | | | | | | | | | |
Other securities | | | | | | | | | | | 489 | | | | 0.00 | |
| | | | | | | | | | | | | | | | |
| | | | | |
Total Preferred Stocks (Cost $95,903) | | | | | | | | | | | 138,912 | | | | 0.62 | |
| | | | | | | | | | | | | | | | |
| | | | | |
Rights: 0.02% | | | | | | | | | | | | | | | | |
| | | | | |
| Spain: 0.01% | | | | | | | | | | | | | | | | |
Other securities | | | | | | | | | | | 2,479 | | | | 0.01 | |
| | | | | | | | | | | | | | | | |
| | | | | |
| Switzerland: 0.00% | | | | | | | | | | | | | | | | |
Other securities | | | | | | | | | | | 120 | | | | 0.00 | |
| | | | | | | | | | | | | | | | |
The accompanying notes are an integral part of these financial statements.
| | | | | | |
| Summary portfolio of investments—November 30, 2012 (unaudited) | | Wells Fargo Advantage Equity Gateway Funds | | | 111 | |
INTERNATIONAL INDEX PORTFOLIO
| | | | | | | | | | | | | | | | | | |
| Security name | | | | | | | | | | Value | | | Percent of
net assets | |
| | | | | | | | | | | | | | | | | | |
| | | | | |
| United Kingdom : 0.01% | | | | | | | | | | | | | | | | | | |
Other securities | | | | | | | | | | | | $ | 1,353 | | | | 0.01 | % |
| | | | | | | | | | | | | | | | | | |
| | | | | |
Total Rights (Cost $15,422) | | | | | | | | | | | | | 3,952 | | | | 0.02 | |
| | | | | | | | | | | | | | | | | | |
| | | | | |
| | | | | Yield | | | Shares | | | | | | | |
| | | | | |
Short-Term Investments: 2.02% | | | | | | | | | | | | | | | | | | |
| | | | | |
| Investment Companies: 2.02% | | | | | | | | | | | | | | | | | | |
Wells Fargo Securities Lending Cash Investment, LLC (u)(l)(v)(r) | | | | | 0.21 | % | | | 452,217 | | | | 452,217 | | | | 2.02 | |
| | | | | | | | | | | | | | | | | | |
| | | | | |
Total Short-Term Investments (Cost $452,217) | | | | | | | | | | | | | 452,217 | | | | 2.02 | |
| | | | | | | | | | | | | | | | | | |
| Total investments in securities | | | | | | | | | | | | | | | | | | |
| (Cost $20,793,609) * | | | | | | | | | | | | | 22,569,323 | | | | 100.92 | |
Other assets and liabilities, net | | | | | | | | | | | | | (206,172 | ) | | | (0.92 | ) |
| | | | | | | | | | | | | | | | | | |
| Total net assets | | | | | | | | | | | | $ | 22,363,151 | | | | 100.00 | % |
| | | | | | | | | | | | | | | | | | |
| † | Non-income-earning security |
| (u) | Rate shown is the 7-day annualized yield at period end. |
| (l) | Investment in an affiliate |
| « | All or a portion of this security is on loan. |
| (v) | Security represents investment of cash collateral received from securities on loan. |
| (r) | The investment company is exempt from registration under Section 3(c)(7) of the Investment Company Act of 1940, as amended. |
| * | Cost for federal income tax purposes is $21,165,061 and unrealized appreciation (depreciation) consists of: |
| | | | |
Gross unrealized appreciation | | $ | 2,838,297 | |
Gross unrealized depreciation | | | (1,434,035 | ) |
| | | | |
Net unrealized appreciation | | $ | 1,404,262 | |
The following table shows the percent of total long-term investments by sector as of November 30, 2012:
| | | | |
Financials | | | 24.55 | % |
Industrials | | | 12.27 | % |
Consumer Staples | | | 11.82 | % |
Consumer Discretionary | | | 11.03 | % |
Health Care | | | 10.53 | % |
Materials | | | 9.66 | % |
Energy | | | 7.40 | % |
Telecommunication Services | | | 4.63 | % |
Information Technology | | | 4.30 | % |
Utilities | | | 3.81 | % |
| | | | |
| | | 100.00 | % |
| | | | |
The accompanying notes are an integral part of these financial statements.
| | | | |
| 112 | | Wells Fargo Advantage Equity Gateway Funds | | Portfolio of investments—November 30, 2012 (unaudited) |
INTERNATIONAL VALUE PORTFOLIO
| | | | | | | | | | | | |
| Security name | | | | | | Shares | | | Value | |
| | | | | | | | | | | | |
| | | | |
Common Stocks: 96.62% | | | | | | | | | | | | |
| | | | |
| Australia: 4.83% | | | | | | | | | | | | |
Arrium Limited (Materials, Metals & Mining) | | | | | | | 934,300 | | | $ | 799,529 | |
Bendigo Bank Limited (Financials, Commercial Banks) | | | | | | | 272,500 | | | | 2,297,797 | |
Boart Longyear Group (Energy, Energy Equipment & Services) | | | | | | | 199,991 | | | | 299,500 | |
Cabcharge Australia Limited (Industrials, Commercial Services & Supplies) | | | | | | | 207,386 | | | | 837,576 | |
Challenger Financial Services Group Limited (Financials, Diversified Financial Services) | | | | | | | 475,400 | | | | 1,652,104 | |
Downer EDI Limited (Industrials, Commercial Services & Supplies) † | | | | | | | 425,500 | | | | 1,567,502 | |
Goodman Fielder Limited (Consumer Staples, Food Products) † | | | | | | | 1,387,983 | | | | 970,494 | |
Lend Lease Corporation Limited (Financials, Real Estate Management & Development) | | | | | | | 273,769 | | | | 2,457,065 | |
Metcash Limited (Consumer Staples, Food & Staples Retailing) | | | | | | | 536,500 | | | | 1,920,427 | |
Mincor Resources NL (Materials, Metals & Mining) | | | | | | | 570,994 | | | | 622,704 | |
Myer Holdings Limited (Consumer Discretionary, Multiline Retail) « | | | | | | | 577,400 | | | | 1,307,586 | |
Sally Malay Mining Limited (Materials, Metals & Mining) | | | | | | | 368,800 | | | | 202,062 | |
Westpac Banking Corporation (Financials, Commercial Banks) | | | | | | | 91,800 | | | | 2,442,962 | |
| | | | |
| | | | | | | | | | | 17,377,308 | |
| | | | | | | | | | | | |
| | | | |
| Austria: 1.54% | | | | | | | | | | | | |
Erste Bank Der Oesterreichischen Sparkassen AG (Financials, Commercial Banks) † | | | | | | | 22,100 | | | | 650,004 | |
OMV AG (Energy, Oil, Gas & Consumable Fuels) | | | | | | | 41,100 | | | | 1,468,878 | |
RHI AG (Materials, Chemicals) | | | | | | | 63,021 | | | | 1,883,487 | |
Voestalpine AG (Materials, Metals & Mining) | | | | | | | 47,700 | | | | 1,540,050 | |
| | | | |
| | | | | | | | | | | 5,542,419 | |
| | | | | | | | | | | | |
| | | | |
| Belgium: 1.16% | | | | | | | | | | | | |
Delhaize Group SA (Consumer Staples, Food & Staples Retailing) | | | | | | | 39,400 | | | | 1,456,802 | |
KBC Groep NV (Financials, Commercial Banks) | | | | | | | 53,400 | | | | 1,608,796 | |
Tessenderlo Chemie NV (Materials, Chemicals) | | | | | | | 37,000 | | | | 1,117,836 | |
| | | | |
| | | | | | | | | | | 4,183,434 | |
| | | | | | | | | | | | |
| | | | |
| Brazil: 1.75% | | | | | | | | | | | | |
Banco do Brasil SA (Financials, Commercial Banks) | | | | | | | 130,500 | | | | 1,338,101 | |
Cia Saneamento Basico de Sau Paulo (Utilities, Water Utilities) | | | | | | | 84,400 | | | | 3,416,604 | |
Cia Saneamento Minas Gerais (Utilities, Water Utilities) | | | | | | | 72,400 | | | | 1,524,710 | |
| | | | |
| | | | | | | | | | | 6,279,415 | |
| | | | | | | | | | | | |
| | | | |
| Canada: 2.17% | | | | | | | | | | | | |
Magna International Incorporated Class A (Consumer Discretionary, Auto Components) « | | | | | | | 54,400 | | | | 2,538,320 | |
Metro Incorporated (Consumer Staples, Food & Staples Retailing) « | | | | | | | 48,400 | | | | 2,979,961 | |
WestJet Airlines Limited (Industrials, Airlines) | | | | | | | 120,000 | | | | 2,271,103 | |
| | | | |
| | | | | | | | | | | 7,789,384 | |
| | | | | | | | | | | | |
| | | | |
| China: 2.72% | | | | | | | | | | | | |
China BlueChemical Limited (Materials, Chemicals) | | | | | | | 1,984,000 | | | | 1,239,008 | |
China Communications Services Corporation Limited (Telecommunication Services, Diversified
Telecommunication Services) | | | | | | | 2,836,000 | | | | 1,595,438 | |
China Petroleum & Chemical Corporation (Energy, Oil, Gas & Consumable Fuels) | | | | | | | 4,705,000 | | | | 4,990,207 | |
China Railway Construction Corporation Limited (Industrials, Construction & Engineering) « | | | | | | | 1,747,500 | | | | 1,948,130 | |
| | | | |
| | | | | | | | | | | 9,772,783 | |
| | | | | | | | | | | | |
The accompanying notes are an integral part of these financial statements.
| | | | | | |
| Portfolio of investments—November 30, 2012 (unaudited) | | Wells Fargo Advantage Equity Gateway Funds | | | 113 | |
INTERNATIONAL VALUE PORTFOLIO
| | | | | | | | | | | | |
| Security name | | | | | | Shares | | | Value | |
| | | | | | | | | | | | |
| | | | |
| Czech Republic: 0.53% | | | | | | | | | | | | |
CEZ AS (Utilities, Electric Utilities) | | | | | | | 57,500 | | | $ | 1,910,678 | |
| | | | | | | | | | | | |
| | | | |
| Denmark: 0.57% | | | | | | | | | | | | |
Danske Bank A/S (Financials, Commercial Banks) † | | | | | | | 45,600 | | | | 781,821 | |
H. Lundbeck A/S (Health Care, Pharmaceuticals) | | | | | | | 75,800 | | | | 1,267,231 | |
| | | | |
| | | | | | | | | | | 2,049,052 | |
| | | | | | | | | | | | |
| | | | |
| Finland: 0.44% | | | | | | | | | | | | |
TietoEnator Oyj (Information Technology, IT Services) | | | | | | | 82,700 | | | | 1,587,520 | |
| | | | | | | | | | | | |
| | | | |
| France: 7.70% | | | | | | | | | | | | |
AXA SA (Financials, Insurance) | | | | | | | 93,100 | | | | 1,529,862 | |
BNP Paribas SA (Financials, Commercial Banks) | | | | | | | 30,200 | | | | 1,686,735 | |
Credit Agricole SA (Financials, Commercial Banks) † | | | | | | | 219,328 | | | | 1,662,706 | |
Sanofi-Aventis SA (Health Care, Pharmaceuticals) | | | | | | | 88,338 | | | | 7,888,214 | |
SCOR SE (Financials, Insurance) | | | | | | | 109,700 | | | | 2,896,923 | |
Societe Generale SA (Financials, Diversified Financial Services) † | | | | | | | 39,000 | | | | 1,410,311 | |
Societe Television Francaise 1 SA (Consumer Discretionary, Media) | | | | | | | 133,100 | | | | 1,302,256 | |
Thales SA (Industrials, Aerospace & Defense) | | | | | | | 59,100 | | | | 2,125,634 | |
Total SA (Energy, Oil, Gas & Consumable Fuels) | | | | | | | 85,500 | | | | 4,278,308 | |
Vivendi SA (Consumer Discretionary, Media) | | | | | | | 134,746 | | | | 2,895,031 | |
| | | | |
| | | | | | | | | | | 27,675,980 | |
| | | | | | | | | | | | |
| | | | |
| Germany: 8.25% | | | | | | | | | | | | |
Allianz AG (Financials, Insurance) | | | | | | | 33,100 | | | | 4,302,671 | |
BASF SE (Materials, Chemicals) | | | | | | | 46,500 | | | | 4,166,770 | |
Daimler AG (Consumer Discretionary, Automobiles) | | | | | | | 69,300 | | | | 3,423,068 | |
Deutsche Bank AG (Financials, Commercial Banks) | | | | | | | 41,200 | | | | 1,818,597 | |
E.ON AG (Utilities, Multi-Utilities) | | | | | | | 52,800 | | | | 951,067 | |
Hannover Rueckversicherung AG (Financials, Insurance) | | | | | | | 31,000 | | | | 2,283,962 | |
Metro AG (Consumer Staples, Food & Staples Retailing) | | | | | | | 49,800 | | | | 1,394,443 | |
Muenchener Rueckversicherungs-Gesellschaft AG (Financials, Insurance) | | | | | | | 19,700 | | | | 3,362,737 | |
Norddeutsche Affinerie AG (Materials, Metals & Mining) | | | | | | | 25,900 | | | | 1,645,813 | |
RWE AG (Utilities, Multi-Utilities) | | | | | | | 40,900 | | | | 1,705,618 | |
Volkswagen AG (Consumer Discretionary, Automobiles) | | | | | | | 22,600 | | | | 4,596,979 | |
| | | | |
| | | | | | | | | | | 29,651,725 | |
| | | | | | | | | | | | |
| | | | |
| Hong Kong: 1.78% | | | | | | | | | | | | |
Guangdong Investment Limited (Utilities, Water Utilities) | | | | | | | 2,772,000 | | | | 2,253,310 | |
Johnson Electric Holdings Limited (Industrials, Electrical Equipment) | | | | | | | 1,133,500 | | | | 763,447 | |
Kingboard Laminates Holdings Limited (Information Technology, Electronic Equipment, Instruments & Components) | | | | | | | 2,204,000 | | | | 966,891 | |
Lonking Holdings Limited (Industrials, Machinery) « | | | | | | | 3,973,000 | | | | 907,359 | |
Yue Yuen Industrial Holdings Limited (Consumer Discretionary, Textiles, Apparel & Luxury Goods) | | | | | | | 429,500 | | | | 1,504,597 | |
| | | | |
| | | | | | | | | | | 6,395,604 | |
| | | | | | | | | | | | |
| | | | |
| India: 1.10% | | | | | | | | | | | | |
Tata Motors Limited ADR (Consumer Discretionary, Auto Components) « | | | | | | | 83,800 | | | | 2,100,866 | |
Tata Steel Limited GDR (Industrials, Machinery) | | | | | | | 245,900 | | | | 1,840,562 | |
| | | | |
| | | | | | | | | | | 3,941,428 | |
| | | | | | | | | | | | |
The accompanying notes are an integral part of these financial statements.
| | | | |
| 114 | | Wells Fargo Advantage Equity Gateway Funds | | Portfolio of investments—November 30, 2012 (unaudited) |
INTERNATIONAL VALUE PORTFOLIO
| | | | | | | | | | | | |
| Security name | | | | | | Shares | | | Value | |
| | | | | | | | | | | | |
| | | | |
| Indonesia: 0.25% | | | | | | | | | | | | |
PT Japfa Comfeed Indonesia tbk (Consumer Staples, Food Products) | | | | | | | 1,621,000 | | | $ | 903,982 | |
| | | | | | | | | | | | |
| | | | |
| Ireland: 0.00% | | | | | | | | | | | | |
Allied Irish Banks plc (Financials, Commercial Banks) † | | | | | | | 79,300 | | | | 5,466 | |
Irish Life & Permanent Group Holdings plc (Financials, Insurance) † | | | | | | | 111,500 | | | | 2,900 | |
| | | | |
| | | | | | | | | | | 8,366 | |
| | | | | | | | | | | | |
| | | | |
| Israel: 1.20% | | | | | | | | | | | | |
Bank Hapoalim Limited (Financials, Commercial Banks) † | | | | | | | 542,900 | | | | 2,236,944 | |
Teva Pharmaceutical Industries Limited (Health Care, Pharmaceuticals) | | | | | | | 51,404 | | | | 2,088,389 | |
| | | | |
| | | | | | | | | | | 4,325,333 | |
| | | | | | | | | | | | |
| | | | |
| Italy: 1.61% | | | | | | | | | | | | |
Enel SpA (Utilities, Multi-Utilities) | | | | | | | 688,400 | | | | 2,608,902 | |
ENI SpA (Energy, Oil, Gas & Consumable Fuels) | | | | | | | 135,200 | | | | 3,196,671 | |
| | | | |
| | | | | | | | | | | 5,805,573 | |
| | | | | | | | | | | | |
| | | | |
| Japan: 18.96% | | | | | | | | | | | | |
Adeka Corporation (Materials, Chemicals) | | | | | | | 203,200 | | | | 1,624,417 | |
Aozora Bank Limited (Financials, Commercial Banks) | | | | | | | 588,000 | | | | 1,811,755 | |
Chiba Bank Limited (Financials, Commercial Banks) | | | | | | | 208,000 | | | | 1,241,414 | |
Edion Corporation (Consumer Discretionary, Specialty Retail) | | | | | | | 73,600 | | | | 287,490 | |
Eizo Nanao Corporation (Information Technology, Computers & Peripherals) | | | | | | | 63,300 | | | | 979,044 | |
Fukuoka Financial Group Incorporated (Financials, Commercial Banks) | | | | | | | 378,000 | | | | 1,490,265 | |
Hitachi Capital Corporation (Financials, Consumer Finance) | | | | | | | 57,700 | | | | 1,087,715 | |
Itochu Corporation (Industrials, Trading Companies & Distributors) | | | | | | | 168,000 | | | | 1,679,287 | |
JX Holdings Incorporated (Energy, Oil, Gas & Consumable Fuels) | | | | | | | 408,000 | | | | 2,177,716 | |
KDDI Corporation (Telecommunication Services, Wireless Telecommunication Services) | | | | | | | 60,000 | | | | 4,439,862 | |
Kyorin Company Limited (Health Care, Pharmaceuticals) | | | | | | | 99,000 | | | | 2,106,460 | |
Maeda Road Construction Company Limited (Industrials, Construction & Engineering) | | | | | | | 148,000 | | | | 2,009,001 | |
Marubeni Corporation (Industrials, Trading Companies & Distributors) | | | | | | | 516,000 | | | | 3,398,896 | |
Miraca Holdings Incorporated (Health Care, Health Care Providers & Services) | | | | | | | 25,700 | | | | 1,042,840 | |
Mitsubishi Corporation (Industrials, Trading Companies & Distributors) | | | | | | | 35,500 | | | | 672,233 | |
Mitsui & Company Limited (Industrials, Trading Companies & Distributors) | | | | | | | 54,300 | | | | 750,260 | |
Mizuho Financial Group Incorporated (Financials, Commercial Banks) | | | | | | | 1,831,300 | | | | 2,932,390 | |
Nichirei Corporation (Consumer Staples, Food Products) | | | | | | | 265,000 | | | | 1,436,950 | |
Nihon Kohden Corporation (Health Care, Health Care Equipment & Supplies) | | | | | | | 45,400 | | | | 1,489,743 | |
Nippon Electric Glass Company Limited (Information Technology, Electronic Equipment, Instruments & Components) | | | | | | | 107,000 | | | | 610,056 | |
Nippon Telegraph & Telephone Corporation (Telecommunication Services, Diversified Telecommunication Services) | | | | | | | 74,600 | | | | 3,334,761 | |
Nissan Motor Company Limited (Consumer Discretionary, Automobiles) | | | | | | | 151,400 | | | | 1,467,442 | |
Nissan Shatai Company Limited (Consumer Discretionary, Auto Components) | | | | | | | 8,700 | | | | 99,733 | |
NTT DoCoMo Incorporated (Telecommunication Services, Wireless Telecommunication Services) | | | | | | | 1,400 | | | | 2,019,288 | |
Otsuka Corporation (Information Technology, IT Services) | | | | | | | 32,800 | | | | 2,602,196 | |
Otsuka Holdings Company Limited (Health Care, Health Care Providers & Services) | | | | | | | 133,900 | | | | 3,974,687 | |
Rengo Company Limited (Materials, Containers & Packaging) | | | | | | | 208,000 | | | | 1,082,453 | |
Ryosan Company Limited (Information Technology, Electronic Equipment, Instruments & Components) | | | | | | | 16,200 | | | | 262,745 | |
Saizeriya Company Limited (Consumer Discretionary, Hotels, Restaurants & Leisure) | | | | | | | 44,900 | | | | 630,185 | |
Sankyu Incorporated (Industrials, Road & Rail) | | | | | | | 313,000 | | | | 1,275,769 | |
Sega Sammy Holdings Incorporated (Consumer Discretionary, Leisure Equipment & Products) | | | | | | | 80,800 | | | | 1,344,788 | |
The accompanying notes are an integral part of these financial statements.
| | | | | | |
| Portfolio of investments—November 30, 2012 (unaudited) | | Wells Fargo Advantage Equity Gateway Funds | | | 115 | |
INTERNATIONAL VALUE PORTFOLIO
| | | | | | | | | | | | |
| Security name | | | | | | Shares | | | Value | |
| | | | | | | | | | | | |
| | | | |
| Japan: (continued) | | | | | | | | | | | | |
Shionogi & Company Limited (Health Care, Pharmaceuticals) | | | | | | | 113,100 | | | $ | 1,915,298 | |
Sojitz Corporation (Industrials, Trading Companies & Distributors) | | | | | | | 678,000 | | | | 855,365 | |
Sumitomo Corporation (Consumer Discretionary, Distributors) | | | | | | | 285,000 | | | | 3,536,787 | |
Sumitomo Mitsui Financial Group Incorporated (Financials, Commercial Banks) | | | | | | | 92,900 | | | | 2,990,921 | |
Sumitomo Mitsui Trust Holdings Incorporated (Financials, Commercial Banks) | | | | | | | 613,000 | | | | 1,859,040 | |
The Keiyo Bank Limited (Financials, Commercial Banks) | | | | | | | 62,000 | | | | 273,767 | |
Toshiba TEC Corporation (Information Technology, Office Electronics) | | | | | | | 234,000 | | | | 1,175,180 | |
Tsuruha Holdings Incorporated (Consumer Staples, Food & Staples Retailing) | | | | | | | 29,400 | | | | 2,214,763 | |
Yokohama Rubber Company Limited (Consumer Discretionary, Auto Components) | | | | | | | 297,000 | | | | 1,988,767 | |
| | | | |
| | | | | | | | | | | 68,171,729 | |
| | | | | | | | | | | | |
| | | | |
| Liechtenstein: 0.14% | | | | | | | | | | | | |
Verwaltungs-Und Privat-Bank AG (Financials, Capital Markets) | | | | | | | 7,800 | | | | 521,431 | |
| | | | | | | | | | | | |
| | | | |
| Netherlands: 2.57% | | | | | | | | | | | | |
Aegon NV (Financials, Insurance) | | | | | | | 151,800 | | | | 873,205 | |
ING Groep NV (Financials, Diversified Financial Services) † | | | | | | | 237,100 | | | | 2,130,772 | |
Koninklijke Ahold NV (Consumer Staples, Food & Staples Retailing) | | | | | | | 241,100 | | | | 3,059,119 | |
Koninklijke DSM NV (Consumer Staples, Food & Staples Retailing) | | | | | | | 52,700 | | | | 3,035,251 | |
Nutreco Holding NV (Consumer Staples, Food Products) | | | | | | | 1,740 | | | | 141,865 | |
| | | | |
| | | | | | | | | | | 9,240,212 | |
| | | | | | | | | | | | |
| | | | |
| Norway: 1.74% | | | | | | | | | | | | |
Atea ASA (Information Technology, IT Services) | | | | | | | 158,200 | | | | 1,717,607 | |
DnB Nor ASA (Financials, Commercial Banks) | | | | | | | 98,900 | | | | 1,231,787 | |
Statoil ASA (Energy, Oil, Gas & Consumable Fuels) | | | | | | | 61,700 | | | | 1,508,611 | |
Yara International ASA (Materials, Chemicals) | | | | | | | 35,800 | | | | 1,795,546 | |
| | | | |
| | | | | | | | | | | 6,253,551 | |
| | | | | | | | | | | | |
| | | | |
| Poland: 0.97% | | | | | | | | | | | | |
Asseco Poland SA (Information Technology, Software) | | | | | | | 101,800 | | | | 1,402,902 | |
KGHM Polska Miedz SA (Materials, Metals & Mining) « | | | | | | | 36,500 | | | | 2,069,698 | |
| | | | |
| | | | | | | | | | | 3,472,600 | |
| | | | | | | | | | | | |
| | | | |
| Portugal: 0.07% | | | | | | | | | | | | |
Banco BPI SA (Financials, Commercial Banks) † | | | | | | | 245,688 | | | | 258,180 | |
| | | | | | | | | | | | |
| | | | |
| Russia: 2.02% | | | | | | | | | | | | |
Gazprom Neft Sponsored ADR (Energy, Oil, Gas & Consumable Fuels) | | | | | | | 150,014 | | | | 3,438,321 | |
Gazprom Neft Sponsored ADR (Energy, Oil, Gas & Consumable Fuels) | | | | | | | 886 | | | | 20,164 | |
Lukoil ADR (Energy, Oil, Gas & Consumable Fuels) | | | | | | | 60,400 | | | | 3,789,242 | |
| | | | |
| | | | | | | | | | | 7,247,727 | |
| | | | | | | | | | | | |
| | | | |
| Singapore: 0.48% | | | | | | | | | | | | |
United Overseas Bank Limited (Financials, Commercial Banks) | | | | | | | 113,000 | | | | 1,733,049 | |
| | | | | | | | | | | | |
| | | | |
| South Africa: 0.44% | | | | | | | | | | | | |
Exxaro Resources Limited (Materials, Metals & Mining) | | | | | | | 91,400 | | | | 1,587,862 | |
| | | | | | | | | | | | |
The accompanying notes are an integral part of these financial statements.
| | | | |
| 116 | | Wells Fargo Advantage Equity Gateway Funds | | Portfolio of investments—November 30, 2012 (unaudited) |
INTERNATIONAL VALUE PORTFOLIO
| | | | | | | | | | | | |
| Security name | | | | | | Shares | | | Value | |
| | | | | | | | | | | | |
| | | | |
| South Korea: 1.98% | | | | | | | | | | | | |
Industrial Bank of Korea (Financials, Commercial Banks) | | | | | | | 192,500 | | | $ | 2,044,374 | |
SK Telecom Company Limited (Telecommunication Services, Wireless Telecommunication Services) | | | | | | | 22,300 | | | | 3,099,367 | |
Woori Finance Holdings Company Limited (Financials, Commercial Banks) | | | | | | | 212,200 | | | | 1,989,038 | |
| | | | |
| | | | | | | | | | | 7,132,779 | |
| | | | | | | | | | | | |
| | | | |
| Spain: 2.23% | | | | | | | | | | | | |
Banco Bilbao Vizcaya Argentaria SA (Financials, Commercial Banks) | | | | | | | 185,200 | | | | 1,571,384 | |
Banco Espanol de Credito SA (Financials, Commercial Banks) « | | | | | | | 146,100 | | | | 533,739 | |
Banco Santander Central Hispano SA (Financials, Commercial Banks) | | | | | | | 337,200 | | | | 2,593,559 | |
Repsol YPF SA (Energy, Oil, Gas & Consumable Fuels) | | | | | | | 123,800 | | | | 2,626,044 | |
Telefonica SA (Telecommunication Services, Diversified Telecommunication Services) | | | | | | | 52,400 | | | | 687,622 | |
| | | | |
| | | | | | | | | | | 8,012,348 | |
| | | | | | | | | | | | |
| | | | |
| Sweden: 1.45% | | | | | | | | | | | | |
Boliden AB (Materials, Metals & Mining) | | | | | | | 169,300 | | | | 2,994,974 | |
Saab AB (Industrials, Aerospace & Defense) | | | | | | | 113,500 | | | | 2,209,150 | |
| | | | |
| | | | | | | | | | | 5,204,124 | |
| | | | | | | | | | | | |
| | | | |
| Switzerland: 5.43% | | | | | | | | | | | | |
Baloise Holding AG (Financials, Insurance) | | | | | | | 28,800 | | | | 2,416,316 | |
Credit Suisse Group AG (Financials, Capital Markets) | | | | | | | 141,700 | | | | 3,354,805 | |
Georg Fischer AG (Industrials, Machinery) | | | | | | | 3,000 | | | | 1,112,010 | |
Novartis AG (Health Care, Pharmaceuticals) | | | | | | | 40,400 | | | | 2,500,205 | |
Roche Holdings AG (Health Care, Pharmaceuticals) | | | | | | | 21,200 | | | | 4,172,742 | |
Swiss Re AG (Financials, Insurance) | | | | | | | 28,900 | | | | 2,081,661 | |
Zurich Financial Services AG (Financials, Insurance) | | | | | | | 15,200 | | | | 3,879,141 | |
| | | | |
| | | | | | | | | | | 19,516,880 | |
| | | | | | | | | | | | |
| | | | |
| Taiwan: 0.33% | | | | | | | | | | | | |
Powertech Technology Incorporated (Information Technology, Semiconductors &
Semiconductor Equipment) | | | | | | | 794,000 | | | | 1,176,489 | |
| | | | | | | | | | | | |
| | | | |
| Thailand: 0.56% | | | | | | | | | | | | |
Bangchak Petroleum plc (Energy, Oil, Gas & Consumable Fuels) | | | | | | | 2,188,900 | | | | 2,032,703 | |
| | | | | | | | | | | | |
| | | | |
| United Kingdom: 19.65% | | | | | | | | | | | | |
Amlin plc (Financials, Insurance) | | | | | | | 279,000 | | | | 1,727,208 | |
AstraZeneca plc (Health Care, Pharmaceuticals) | | | | | | | 140,400 | | | | 6,672,903 | |
Aviva plc (Financials, Insurance) | | | | | | | 314,900 | | | | 1,768,333 | |
BAE Systems plc (Industrials, Aerospace & Defense) | | | | | | | 684,100 | | | | 3,587,310 | |
Barclays plc (Financials, Commercial Banks) | | | | | | | 715,000 | | | | 2,818,023 | |
Bodycote plc (Industrials, Construction & Engineering) | | | | | | | 302,400 | | | | 1,999,007 | |
BP plc (Energy, Oil, Gas & Consumable Fuels) | | | | | | | 609,300 | | | | 4,213,238 | |
BT Group plc (Telecommunication Services, Diversified Telecommunication Services) | | | | | | | 1,124,900 | | | | 4,208,276 | |
Chemring Group plc (Industrials, Aerospace & Defense) | | | | | | | 221,686 | | | | 874,084 | |
Cookson Group plc (Utilities, Multi-Utilities) | | | | | | | 145,400 | | | | 1,428,000 | |
Firstgroup plc (Industrials, Road & Rail) | | | | | | | 254,700 | | | | 761,455 | |
GlaxoSmithKline plc (Health Care, Pharmaceuticals) | | | | | | | 57,700 | | | | 1,233,666 | |
Greene King plc (Consumer Discretionary, Hotels, Restaurants & Leisure) | | | | | | | 93,500 | | | | 916,783 | |
The accompanying notes are an integral part of these financial statements.
| | | | | | |
| Portfolio of investments—November 30, 2012 (unaudited) | | Wells Fargo Advantage Equity Gateway Funds | | | 117 | |
INTERNATIONAL VALUE PORTFOLIO
| | | | | | | | | | | | | | |
| Security name | | | | | | | Shares | | | Value | |
| | | | | | | | | | | | | | |
| | | | |
| United Kingdom: (continued) | | | | | | | | | | | | | | |
Home Retail Group plc (Consumer Discretionary, Internet & Catalog Retail) « | | | | | | | | | 290,000 | | | $ | 518,985 | |
Inchcape plc (Consumer Discretionary, Distributors) | | | | | | | | | 319,200 | | | | 2,186,774 | |
J Sainsbury plc (Consumer Staples, Food & Staples Retailing) | | | | | | | | | 608,700 | | | | 3,329,432 | |
Kesa Electricals plc (Consumer Discretionary, Specialty Retail) | | | | | | | | | 679,100 | | | | 519,530 | |
Marks & Spencer Group plc (Consumer Discretionary, Multiline Retail) | | | | | | | | | 380,200 | | | | 2,379,292 | |
Marston’s plc (Consumer Discretionary, Hotels, Restaurants & Leisure) | | | | | | | | | 632,790 | | | | 1,269,309 | |
Old Mutual plc (Financials, Commercial Banks) | | | | | | | | | 982,800 | | | | 2,697,279 | |
Pace plc (Consumer Discretionary, Household Durables) | | | | | | | | | 374,800 | | | | 1,100,091 | |
Premier Foods plc (Consumer Staples, Food Products) † | | | | | | | | | 31,510 | | | | 48,338 | |
Royal & Sun Alliance Insurance Group plc (Financials, Insurance) | | | | | | | | | 443,900 | | | | 835,654 | |
Royal Dutch Shell plc Class A (Energy, Oil, Gas & Consumable Fuels) | | | | | | | | | 14,300 | | | | 479,267 | |
Royal Dutch Shell plc Class B (Energy, Oil, Gas & Consumable Fuels) | | | | | | | | | 264,000 | | | | 9,112,841 | |
Tesco plc (Consumer Staples, Food & Staples Retailing) | | | | | | | | | 655,700 | | | | 3,415,274 | |
Thomas Cook Group plc (Consumer Discretionary, Hotels, Restaurants & Leisure) † | | | | | | | | | 389,400 | | | | 162,208 | |
Tullett Prebon plc (Financials, Capital Markets) | | | | | | | | | 279,500 | | | | 1,016,061 | |
Vodafone Group plc (Telecommunication Services, Wireless Telecommunication Services) | | | | | | | | | 1,591,600 | | | | 4,109,298 | |
WH Smith plc (Consumer Discretionary, Specialty Retail) | | | | | | | | | 223,600 | | | | 2,328,561 | |
William Morrison Supermarkets plc (Consumer Staples, Food & Staples Retailing) | | | | | | | | | 679,700 | | | | 2,927,183 | |
| | | | |
| | | | | | | | | | | | | 70,643,663 | |
| | | | | | | | | | | | | | |
| | | | |
Total Common Stocks (Cost $388,485,305) | | | | | | | | | | | | | 347,405,311 | |
| | | | | | | | | | | | | | |
| | | | |
| | | | | Dividend yield | | | | | | | |
| | | | |
Preferred Stocks: 1.07% | | | | | | | | | | | | | | |
| | | | |
| Brazil: 1.07% | | | | | | | | | | | | | | |
Banco do Estado do Rio Grande do Sul SA (Financials, Commercial Banks) | | | | | 5.38 | % | | | 173,300 | | | | 1,229,515 | |
Cia Energetica de Minas Gerais (Energy, Oil, Gas & Consumable Fuels) | | | | | 10.30 | | | | 73,900 | | | | 887,782 | |
Companhia Vale do Rio Doce Class A (Materials, Metals & Mining) | | | | | 6.13 | | | | 100,100 | | | | 1,719,239 | |
| | | | |
Total Preferred Stocks (Cost $4,315,416) | | | | | | | | | | | | | 3,836,536 | |
| | | | | | | | | | | | | | |
| | | | |
| | | | | Yield | | | | | | | |
| | | | |
Short-Term Investments: 4.06% | | | | | | | | | | | | | | |
| | | | |
| Investment Companies: 4.06% | | | | | | | | | | | | | | |
Wells Fargo Advantage Cash Investment Money Market Fund, Select Class (l)(u) | | | | | 0.16 | | | | 1,479,062 | | | | 1,479,062 | |
Wells Fargo Securities Lending Cash Investments, LLC (l)(u)(r)(v) | | | | | 0.21 | | | | 13,117,922 | | | | 13,117,922 | |
| | | | |
Total Short-Term Investments (Cost $14,596,984) | | | | | | | | | | | | | 14,596,984 | |
| | | | | | | | | | | | | | |
| | | | | | | | |
| Total investments in securities | | | | | | | | |
| (Cost $407,397,705) * | | | 101.75 | % | | | 365,838,831 | |
Other assets and liabilities, net | | | (1.75 | ) | | | (6,275,930 | ) |
| | | | | | | | |
| Total net assets | | | 100.00 | % | | $ | 359,562,901 | |
| | | | | | | | |
The accompanying notes are an integral part of these financial statements.
| | | | |
| 118 | | Wells Fargo Advantage Equity Gateway Funds | | Portfolio of investments—November 30, 2012 (unaudited) |
INTERNATIONAL VALUE PORTFOLIO
| † | Non-income-earning security |
| « | All or a portion of this security is on loan. |
| (l) | Investment in an affiliate |
| (r) | The investment company is exempt from registration under Section 3(c)(7) of the Investment Company Act of 1940, as amended. |
| (u) | Rate shown is the 7-day annualized yield at period end. |
| (v) | Security represents investment of cash collateral received from securities on loan. |
| * | Cost for federal income tax purposes is $408,276,608 and unrealized appreciation (depreciation) consists of: |
| | | | |
Gross unrealized appreciation | | $ | 29,807,775 | |
Gross unrealized depreciation | | | (72,245,552 | ) |
| | | | |
Net unrealized depreciation | | $ | (42,437,777 | ) |
The following table shows the percent of total long-term investments by sector as of Novemebr 30, 2012:
| | | | |
Financials | | | 25.46 | % |
Energy | | | 12.67 | % |
Consumer Discretionary | | | 11.51 | % |
Health Care | | | 10.35 | % |
Industrials | | | 9.52 | % |
Materials | | | 8.29 | % |
Consumer Staples | | | 7.46 | % |
Telecommunication Services | | | 6.69 | % |
Utilities | | | 4.50 | % |
Information Technology | | | 3.55 | % |
| | | | |
| | | 100.00 | % |
| | | | |
The accompanying notes are an integral part of these financial statements.
| | | | | | |
| Portfolio of investments—November 30, 2012 (unaudited) | | Wells Fargo Advantage Equity Gateway Funds | | | 119 | |
LARGE COMPANY VALUE PORTFOLIO
| | | | | | | | | | | | |
| Security name | | | | | | Shares | | | Value | |
| | | | | | | | | | | | |
| | | | |
Common Stocks: 94.94% | | | | | | | | | | | | |
| | | | |
Consumer Discretionary: 8.50% | | | | | | | | | | | | |
| | | | |
| Household Durables: 2.65% | | | | | | | | | | | | |
Harman International Industries Incorporated | | | | | | | 10,524 | | | $ | 416,329 | |
Newell Rubbermaid Incorporated | | | | | | | 40,167 | | | | 876,042 | |
| | | | |
| | | | | | | | | | | 1,292,371 | |
| | | | | | | | | | | | |
| | | | |
| Media: 2.90% | | | | | | | | | | | | |
DIRECTV Group Incorporated † | | | | | | | 10,731 | | | | 533,331 | |
Omnicom Group Incorporated « | | | | | | | 6,408 | | | | 318,734 | |
Walt Disney Company | | | | | | | 11,402 | | | | 566,223 | |
| | | | |
| | | | | | | | | | | 1,418,288 | |
| | | | | | | | | | | | |
| | | | |
| Multiline Retail: 1.01% | | | | | | | | | | | | |
Target Corporation | | | | | | | 7,841 | | | | 495,002 | |
| | | | | | | | | | | | |
| | | | |
| Specialty Retail: 1.94% | | | | | | | | | | | | |
Home Depot Incorporated | | | | | | | 14,531 | | | | 945,532 | |
| | | | | | | | | | | | |
| | | | |
Consumer Staples: 6.03% | | | | | | | | | | | | |
| | | | |
| Beverages: 1.46% | | | | | | | | | | | | |
PepsiCo Incorporated | | | | | | | 10,171 | | | | 714,106 | |
| | | | | | | | | | | | |
| | | | |
| Food & Staples Retailing: 2.10% | | | | | | | | | | | | |
CVS Caremark Corporation | | | | | | | 22,063 | | | | 1,026,150 | |
| | | | | | | | | | | | |
| | | | |
| Household Products: 2.47% | | | | | | | | | | | | |
Procter & Gamble Company | | | | | | | 17,253 | | | | 1,204,777 | |
| | | | | | | | | | | | |
| | | | |
Energy: 14.62% | | | | | | | | | | | | |
| | | | |
| Energy Equipment & Services: 1.25% | | | | | | | | | | | | |
Noble Corporation | | | | | | | 17,691 | | | | 610,163 | |
| | | | | | | | | | | | |
| | | | |
| Oil, Gas & Consumable Fuels: 13.37% | | | | | | | | | | | | |
Apache Corporation « | | | | | | | 5,895 | | | | 454,446 | |
Chevron Corporation | | | | | | | 12,434 | | | | 1,314,149 | |
ConocoPhillips Company | | | | | | | 11,730 | | | | 667,906 | |
Devon Energy Corporation | | | | | | | 10,232 | | | | 528,687 | |
Exxon Mobil Corporation | | | | | | | 33,416 | | | | 2,945,286 | |
Whiting Petroleum Corporation † | | | | | | | 14,848 | | | | 622,725 | |
| | | | |
| | | | | | | | | | | 6,533,199 | |
| | | | | | | | | | | | |
| | | | |
Financials: 24.63% | | | | | | | | | | | | |
| | | | |
| Capital Markets: 2.04% | | | | | | | | | | | | |
Goldman Sachs Group Incorporated | | | | | | | 4,061 | | | | 478,345 | |
State Street Corporation | | | | | | | 11,653 | | | | 517,859 | |
| | | | |
| | | | | | | | | | | 996,204 | |
| | | | | | | | | | | | |
The accompanying notes are an integral part of these financial statements.
| | | | |
| 120 | | Wells Fargo Advantage Equity Gateway Funds | | Portfolio of investments—November 30, 2012 (unaudited) |
LARGE COMPANY VALUE PORTFOLIO
| | | | | | | | | | | | |
| Security name | | | | | | Shares | | | Value | |
| | | | | | | | | | | | |
| | | | |
| Commercial Banks: 4.64% | | | | | | | | | | | | |
Comerica Incorporated | | | | | | | 25,495 | | | $ | 754,397 | |
First Republic Bank Corporation | | | | | | | 22,380 | | | | 756,892 | |
KeyCorp | | | | | | | 93,803 | | | | 757,928 | |
| | | | |
| | | | | | | | | | | 2,269,217 | |
| | | | | | | | | | | | |
| | | | |
| Consumer Finance: 2.65% | | | | | | | | | | | | |
Capital One Financial Corporation | | | | | | | 13,545 | | | | 780,192 | |
SLM Corporation | | | | | | | 31,026 | | | | 513,480 | |
| | | | |
| | | | | | | | | | | 1,293,672 | |
| | | | | | | | | | | | |
| | | | |
| Diversified Financial Services: 5.29% | | | | | | | | | | | | |
Bank of America Corporation | | | | | | | 65,495 | | | | 645,781 | |
Citigroup Incorporated | | | | | | | 17,911 | | | | 619,183 | |
JPMorgan Chase & Company | | | | | | | 32,137 | | | | 1,320,188 | |
| | | | |
| | | | | | | | | | | 2,585,152 | |
| | | | | | | | | | | | |
| | | | |
| Insurance: 6.52% | | | | | | | | | | | | |
ACE Limited | | | | | | | 12,234 | | | | 969,300 | |
American International Group Incorporated † | | | | | | | 14,489 | | | | 480,021 | |
MetLife Incorporated | | | | | | | 22,791 | | | | 756,433 | |
The Hartford Financial Services Group Incorporated | | | | | | | 22,174 | | | | 469,645 | |
The Travelers Companies Incorporated | | | | | | | 7,180 | | | | 508,488 | |
| | | | |
| | | | | | | | | | | 3,183,887 | |
| | | | | | | | | | | | |
| | | | |
| REITs: 3.49% | | | | | | | | | | | | |
American Campus Communities Incorporated | | | | | | | 15,542 | | | | 680,740 | |
Simon Property Group Incorporated | | | | | | | 6,720 | | | | 1,022,314 | |
| | | | |
| | | | | | | | | | | 1,703,054 | |
| | | | | | | | | | | | |
| | | | |
Health Care: 12.12% | | | | | | | | | | | | |
| | | | |
| Health Care Equipment & Supplies: 1.92% | | | | | | | | | | | | |
Medtronic Incorporated | | | | | | | 11,502 | | | | 484,349 | |
Stryker Corporation | | | | | | | 8,390 | | | | 454,402 | |
| | | | |
| | | | | | | | | | | 938,751 | |
| | | | | | | | | | | | |
| | | | |
| Health Care Providers & Services: 2.17% | | | | | | | | | | | | |
CIGNA Corporation | | | | | | | 20,305 | | | | 1,061,342 | |
| | | | | | | | | | | | |
| | | | |
| Pharmaceuticals: 8.03% | | | | | | | | | | | | |
Hospira Incorporated † | | | | | | | 20,237 | | | | 603,063 | |
Johnson & Johnson Services Incorporated « | | | | | | | 14,818 | | | | 1,033,259 | |
Merck & Company Incorporated | | | | | | | 13,716 | | | | 607,619 | |
Pfizer Incorporated | | | | | | | 50,571 | | | | 1,265,286 | |
Teva Pharmaceutical Industries Limited ADR | | | | | | | 10,166 | | | | 410,198 | |
| | | | |
| | | | | | | | | | | 3,919,425 | |
| | | | | | | | | | | | |
| | | | |
Industrials: 9.34% | | | | | | | | | | | | |
| | | | |
| Airlines: 0.95% | | | | | | | | | | | | |
Southwest Airlines Company | | | | | | | 48,721 | | | | 464,311 | |
| | | | | | | | | | | | |
The accompanying notes are an integral part of these financial statements.
| | | | | | |
| Portfolio of investments—November 30, 2012 (unaudited) | | Wells Fargo Advantage Equity Gateway Funds | | | 121 | |
LARGE COMPANY VALUE PORTFOLIO
| | | | | | | | | | | | |
| Security name | | | | | | Shares | | | Value | |
| | | | | | | | | | | | |
| | | | |
| Commercial Services & Supplies: 1.17% | | | | | | | | | | | | |
Waste Management Incorporated | | | | | | | 17,589 | | | $ | 572,874 | |
| | | | | | | | | | | | |
| | | | |
| Construction & Engineering: 0.97% | | | | | | | | | | | | |
URS Corporation | | | | | | | 12,521 | | | | 471,791 | |
| | | | | | | | | | | | |
| | | | |
| Industrial Conglomerates: 3.68% | | | | | | | | | | | | |
General Electric Company | | | | | | | 85,137 | | | | 1,798,945 | |
| | | | | | | | | | | | |
| | | | |
| Machinery: 1.78% | | | | | | | | | | | | |
Dover Corporation | | | | | | | 5,534 | | | | 351,907 | |
Eaton Corporation « | | | | | | | 9,946 | | | | 518,783 | |
| | | | |
| | | | | | | | | | | 870,690 | |
| | | | | | | | | | | | |
| | | | |
| Road & Rail: 0.79% | | | | | | | | | | | | |
Norfolk Southern Corporation | | | | | | | 6,385 | | | | 385,526 | |
| | | | | | | | | | | | |
| | | | |
Information Technology: 7.47% | | | | | | | | | | | | |
| | | | |
| Communications Equipment: 1.72% | | | | | | | | | | | | |
Cisco Systems Incorporated | | | | | | | 44,277 | | | | 837,278 | |
| | | | | | | | | | | | |
| | | | |
| Computers & Peripherals: 2.28% | | | | | | | | | | | | |
Apple Incorporated | | | | | | | 866 | | | | 506,852 | |
EMC Corporation † | | | | | | | 17,483 | | | | 433,928 | |
Hewlett-Packard Company | | | | | | | 13,115 | | | | 170,364 | |
| | | | |
| | | | | | | | | | | 1,111,144 | |
| | | | | | | | | | | | |
| | | | |
| Internet Software & Services: 0.50% | | | | | | | | | | | | |
Google Incorporated Class A † | | | | | | | 349 | | | | 243,731 | |
| | | | | | | | | | | | |
| | | | |
| IT Services: 1.00% | | | | | | | | | | | | |
VeriFone Systems Incorporated Ǡ | | | | | | | 16,139 | | | | 490,464 | |
| | | | | | | | | | | | |
| | | | |
| Semiconductors & Semiconductor Equipment: 1.29% | | | | | | | | | | | | |
Maxim Integrated Products Incorporated | | | | | | | 21,615 | | | | 630,942 | |
| | | | | | | | | | | | |
| | | | |
| Software: 0.68% | | | | | | | | | | | | |
Symantec Corporation † | | | | | | | 17,807 | | | | 334,059 | |
| | | | | | | | | | | | |
| | | | |
Materials: 2.93% | | | | | | | | | | | | |
| | | | |
| Chemicals: 2.19% | | | | | | | | | | | | |
Ashland Incorporated | | | | | | | 9,786 | | | | 694,023 | |
Dow Chemical Company | | | | | | | 12,460 | | | | 376,167 | |
| | | | |
| | | | | | | | | | | 1,070,190 | |
| | | | | | | | | | | | |
| | | | |
| Metals & Mining: 0.74% | | | | | | | | | | | | |
Alcoa Incorporated « | | | | | | | 42,644 | | | | 358,636 | |
| | | | | | | | | | | | |
The accompanying notes are an integral part of these financial statements.
| | | | |
| 122 | | Wells Fargo Advantage Equity Gateway Funds | | Portfolio of investments—November 30, 2012 (unaudited) |
LARGE COMPANY VALUE PORTFOLIO
| | | | | | | | | | | | | | |
| Security name | | | | | | | Shares | | | Value | |
| | | | | | | | | | | | | | |
| | | | |
Telecommunication Services: 2.79% | | | | | | | | | | | | | | |
| | | | |
| Diversified Telecommunication Services: 2.79% | | | | | | | | | | | | | | |
AT&T Incorporated | | | | | | | | | 30,104 | | | $ | 1,027,450 | |
Verizon Communications Incorporated | | | | | | | | | 7,650 | | | | 337,518 | |
| | | | |
| | | | | | | | | | | | | 1,364,968 | |
| | | | | | | | | | | | | | |
| | | | |
Utilities: 6.51% | | | | | | | | | | | | | | |
| | | | |
| Electric Utilities: 2.26% | | | | | | | | | | | | | | |
Duke Energy Corporation | | | | | | | | | 7,191 | | | | 458,930 | |
Entergy Corporation | | | | | | | | | 10,176 | | | | 646,583 | |
| | | | |
| | | | | | | | | | | | | 1,105,513 | |
| | | | | | | | | | | | | | |
| | | | |
| Multi-Utilities: 2.75% | | | | | | | | | | | | | | |
Dominion Resources Incorporated « | | | | | | | | | 12,533 | | | | 640,562 | |
NiSource Incorporated « | | | | | | | | | 29,017 | | | | 701,341 | |
| | | | |
| | | | | | | | | | | | | 1,341,903 | |
| | | | | | | | | | | | | | |
| | | | |
| Water Utilities: 1.50% | | | | | | | | | | | | | | |
American Water Works Company Incorporated | | | | | | | | | 19,159 | | | | 731,302 | |
| | | | | | | | | | | | | | |
| | | | |
Total Common Stocks (Cost $41,070,714) | | | | | | | | | | | | | 46,374,559 | |
| | | | | | | | | | | | | | |
| | | | |
| | | | | | | | Principal | | | | |
| | | | |
Other: 0.06% | | | | | | | | | | | | | | |
Gryphon Funding Limited, Pass-Through Entity (a)(i)(v) | | | | | | | | $ | 91,312 | | | | 30,133 | |
| | | | |
Total Other (Cost $8,652) | | | | | | | | | | | | | 30,133 | |
| | | | | | | | | | | | | | |
| | | | |
| | | Yield | | | | | Shares | | | | |
| | | | |
Short-Term Investments: 12.43% | | | | | | | | | | | | | | |
| | | | |
| Investment Companies: 12.43% | | | | | | | | | | | | | | |
Wells Fargo Advantage Cash Investment Money Market Fund, Select Class (l)(u) | | | 0.16 | % | | | | | 2,060,814 | | | | 2,060,814 | |
Wells Fargo Securities Lending Cash Investments, LLC (l)(r)(u)(v) | | | 0.21 | | | | | | 4,010,623 | | | | 4,010,623 | |
| | | | | | | | | | | | | | |
| | | | |
Total Short-Term Investments (Cost $6,071,437) | | | | | | | | | | | | | 6,071,437 | |
| | | | | | | | | | | | | | |
| | | | | | | | |
| Total investments in securities | | | | | | | | |
| (Cost $47,150,803)* | | | 107.43 | % | | | 52,476,129 | |
Other assets and liabilities, net | | | (7.43 | ) | | | (3,628,335 | ) |
| | | | | | | | |
| Total net assets | | | 100.00 | % | | $ | 48,847,794 | |
| | | | | | | | |
| † | Non-income-earning security |
| « | All or a portion of this security is on loan. |
| (a) | Security is fair valued by the Management Valuation Team, and in certain instances by the Board of Trustees, in accordance with procedures approved by the Board of Trustees. |
| (l) | Investment in an affiliate |
| (u) | Rate shown is the 7-day annualized yield at period end. |
| (v) | Security represents investment of cash collateral received from securities on loan. |
| (r) | The investment company is exempt from registration under Section 3(c)(7) of the Investment Company Act of 1940, as amended. |
| * | Cost for federal income tax purposes is $48,370,511 and unrealized appreciation (depreciation) consists of: |
| | | | |
Gross unrealized appreciation | | $ | 4,876,212 | |
Gross unrealized depreciation | | | (770,594 | ) |
| | | | |
Net unrealized appreciation | | $ | 4,105,618 | |
The accompanying notes are an integral part of these financial statements.
| | | | | | |
| Portfolio of investments—November 30, 2012 (unaudited) | | Wells Fargo Advantage Equity Gateway Funds | | | 123 | |
SMALL CAP VALUE PORTFOLIO
| | | | | | | | | | | | |
| Security name | | | | | | Shares | | | Value | |
| | | | | | | | | | | | |
| | | | |
Common Stocks: 93.70% | | | | | | | | | | | | |
| | | | |
Consumer Discretionary: 7.35% | | | | | | | | | | | | |
| | | | |
| Auto Components: 1.45% | | | | | | | | | | | | |
Gentex Corporation | | | | | | | 13,508 | | | $ | 239,767 | |
| | | | | | | | | | | | |
| | | | |
| Diversified Consumer Services: 0.59% | | | | | | | | | | | | |
Cambium Learning Group Incorporated † | | | | | | | 19,495 | | | | 18,130 | |
Corinthian Colleges Incorporated † | | | | | | | 35,405 | | | | 78,599 | |
Voyager Expanded Learning Incorporated †(a)(i) | | | | | | | 58,950 | | | | 0 | |
| | | | |
| | | | | | | | | | | 96,729 | |
| | | | | | | | | | | | |
| | | | |
| Hotels, Restaurants & Leisure: 2.02% | | | | | | | | | | | | |
Century Casinos Incorporated † | | | | | | | 67,136 | | | | 177,910 | |
Empire Resorts Incorporated † | | | | | | | 13,855 | | | | 25,632 | |
Scientific Games Corporation Class A † | | | | | | | 15,475 | | | | 128,907 | |
| | | | |
| | | | | | | | | | | 332,449 | |
| | | | | | | | | | | | |
| | | | |
| Household Durables: 2.54% | | | | | | | | | | | | |
Cavco Industries Incorporated † | | | | | | | 5,150 | | | | 265,225 | |
KB Home Incorporated | | | | | | | 930 | | | | 13,355 | |
Nobility Homes Incorporated † | | | | | | | 21,085 | | | | 115,968 | |
Skyline Corporation † | | | | | | | 6,042 | | | | 24,772 | |
| | | | |
| | | | | | | | | | | 419,320 | |
| | | | | | | | | | | | |
| | | | |
| Media: 0.50% | | | | | | | | | | | | |
Outdoor Channel Holdings Incorporated | | | | | | | 11,145 | | | | 82,807 | |
| | | | | | | | | | | | |
| | | | |
| Specialty Retail: 0.25% | | | | | | | | | | | | |
rue21 Incorporated † | | | | | | | 1,413 | | | | 40,567 | |
| | | | | | | | | | | | |
| | | | |
Consumer Staples: 1.27% | | | | | | | | | | | | |
| | | | |
| Household Products: 0.45% | | | | | | | | | | | | |
WD-40 Company | | | | | | | 1,550 | | | | 73,222 | |
| | | | | | | | | | | | |
| | | | |
| Personal Products: 0.82% | | | | | | | | | | | | |
Prestige Brands Holdings Incorporated † | | | | | | | 6,264 | | | | 135,302 | |
| | | | | | | | | | | | |
| | | | |
Energy: 17.84% | | | | | | | | | | | | |
| | | | |
| Energy Equipment & Services: 7.79% | | | | | | | | | | | | |
Helix Energy Solutions Group Incorporated † | | | | | | | 9,433 | | | | 165,172 | |
Helmerich & Payne Incorporated | | | | | | | 1,245 | | | | 64,989 | |
ION Geophysical Corporation † | | | | | | | 27,715 | | | | 165,181 | |
Key Energy Services Incorporated † | | | | | | | 9,399 | | | | 62,879 | |
Matrix Service Company † | | | | | | | 20,824 | | | | 228,439 | |
Newpark Resources Incorporated † | | | | | | | 32,338 | | | | 252,236 | |
Oceaneering International Incorporated | | | | | | | 2,275 | | | | 119,847 | |
PHI Incorporated (non-voting) † | | | | | | | 2,718 | | | | 85,155 | |
PHI Incorporated (voting) † | | | | | | | 2,392 | | | | 71,880 | |
Willbros Group Incorporated † | | | | | | | 13,779 | | | | 69,308 | |
| | | | |
| | | | | | | | | | | 1,285,086 | |
| | | | | | | | | | | | |
The accompanying notes are an integral part of these financial statements.
| | | | |
| 124 | | Wells Fargo Advantage Equity Gateway Funds | | Portfolio of investments—November 30, 2012 (unaudited) |
SMALL CAP VALUE PORTFOLIO
| | | | | | | | | | | | |
| Security name | | | | | | Shares | | | Value | |
| | | | | | | | | | | | |
| | | | |
| Oil, Gas & Consumable Fuels: 10.05% | | | | | | | | | | | | |
Clean Energy Fuels Corporation † | | | | | | | 2,865 | | | $ | 37,990 | |
Energy XXI (Bermuda) Limited | | | | | | | 845 | | | | 26,770 | |
Forest Oil Corporation † | | | | | | | 5,735 | | | | 36,532 | |
InterOil Corporation † | | | | | | | 15,940 | | | | 887,220 | |
McMoRan Exploration Company † | | | | | | | 33,174 | | | | 282,974 | |
PetroQuest Energy Incorporated † | | | | | | | 1,415 | | | | 7,542 | |
Range Resources Corporation | | | | | | | 4,160 | | | | 266,323 | |
Triangle Petroleum Corporation † | | | | | | | 17,763 | | | | 111,019 | |
| | | | |
| | | | | | | | | | | 1,656,370 | |
| | | | | | | | | | | | |
| | | | |
Financials: 18.62% | | | | | | | | | | | | |
| | | | |
| Capital Markets: 0.54% | | | | | | | | | | | | |
Artio Global Investors Incorporated | | | | | | | 39,225 | | | | 88,649 | |
| | | | | | | | | | | | |
| | | | |
| Commercial Banks: 4.53% | | | | | | | | | | | | |
1st United Bancorp Incorporated † | | | | | | | 12,625 | | | | 71,710 | |
Bancorp Incorporated † | | | | | | | 6,450 | | | | 75,207 | |
BBCN Bancorp Incorporated | | | | | | | 3,393 | | | | 38,612 | |
City National Corporation | | | | | | | 1,160 | | | | 56,480 | |
First Horizon National Corporation | | | | | | | 8,735 | | | | 82,633 | |
First Niagara Financial Group Incorporated | | | | | | | 18,858 | | | | 142,189 | |
IBERIABANK Corporation | | | | | | | 1,235 | | | | 60,206 | |
Pacific Premier Bancorp Incorporated † | | | | | | | 10,811 | | | | 112,867 | |
Park Sterling Corporation † | | | | | | | 4,160 | | | | 21,840 | |
Sterling Bancorp | | | | | | | 5,400 | | | | 50,220 | |
Univest Corporation of Pennsylvania | | | | | | | 2,039 | | | | 34,296 | |
| | | | |
| | | | | | | | | | | 746,260 | |
| | | | | | | | | | | | |
| | | | |
| Insurance: 3.18% | | | | | | | | | | | | |
Argo Group International Holdings Limited | | | | | | | 9,780 | | | | 324,598 | |
Hilltop Holdings Incorporated † | | | | | | | 8,436 | | | | 120,550 | |
Mercury General Corporation | | | | | | | 1,915 | | | | 79,702 | |
| | | | |
| | | | | | | | | | | 524,850 | |
| | | | | | | | | | | | |
| | | | |
| REITs: 10.26% | | | | | | | | | | | | |
Anworth Mortgage Asset Corporation | | | | | | | 12,250 | | | | 72,275 | |
Capstead Mortgage Corporation | | | | | | | 13,380 | | | | 162,433 | |
Chimera Investment Corporation | | | | | | | 192,610 | | | | 527,751 | |
Crexus Investment Corporation | | | | | | | 14,792 | | | | 184,752 | |
Hatteras Financial Corporation | | | | | | | 4,205 | | | | 112,105 | |
MFA Mortgage Investments Incorporated | | | | | | | 19,785 | | | | 166,392 | |
Origen Financial Incorporated | | | | | | | 58,585 | | | | 87,878 | |
Redwood Trust Incorporated | | | | | | | 9,121 | | | | 152,503 | |
UMH Properties Incorporated | | | | | | | 22,257 | | | | 225,463 | |
| | | | |
| | | | | | | | | | | 1,691,552 | |
| | | | | | | | | | | | |
| | | | |
| Thrifts & Mortgage Finance: 0.11% | | | | | | | | | | | | |
Northwest Bancshares Incorporated | | | | | | | 1,600 | | | | 19,088 | |
| | | | | | | | | | | | |
The accompanying notes are an integral part of these financial statements.
| | | | | | |
| Portfolio of investments—November 30, 2012 (unaudited) | | Wells Fargo Advantage Equity Gateway Funds | | | 125 | |
SMALL CAP VALUE PORTFOLIO
| | | | | | | | | | | | |
| Security name | | | | | | Shares | | | Value | |
| | | | | | | | | | | | |
| | | | |
Health Care: 8.48% | | | | | | | | | | | | |
| | | | |
| Biotechnology: 1.67% | | | | | | | | | | | | |
Amarin Corporation plc ADR † | | | | | | | 7,205 | | | $ | 89,414 | |
Discovery Laboratories Incorporated † | | | | | | | 72,358 | | | | 155,570 | |
Infinity Pharmaceuticals Incorporated † | | | | | | | 1,190 | | | | 30,167 | |
| | | | |
| | | | | | | | | | | 275,151 | |
| | | | | | | | | | | | |
| | | | |
| Health Care Equipment & Supplies: 3.05% | | | | | | | | | | | | |
Allied Healthcare Products Incorporated † | | | | | | | 32,480 | | | | 82,824 | |
EnteroMedics Incorporated † | | | | | | | 29,132 | | | | 90,309 | |
OraSure Technologies Incorporated † | | | | | | | 42,774 | | | | 329,360 | |
| | | | |
| | | | | | | | | | | 502,493 | |
| | | | | | | | | | | | |
| | | | |
| Health Care Providers & Services: 2.11% | | | | | | | | | | | | |
Cross Country Healthcare Incorporated † | | | | | | | 15,182 | | | | 60,880 | |
Ensign Group Incorporated | | | | | | | 3,290 | | | | 84,849 | |
Gentiva Health Services Incorporated † | | | | | | | 11,258 | | | | 115,957 | |
Healthcare Services Group | | | | | | | 3,702 | | | | 87,071 | |
| | | | |
| | | | | | | | | | | 348,757 | |
| | | | | | | | | | | | |
| | | | |
| Health Care Technology: 1.38% | | | | | | | | | | | | |
Allscripts Healthcare Solutions Incorporated † | | | | | | | 10,963 | | | | 121,909 | |
Omnicell Incorporated † | | | | | | | 6,935 | | | | 105,897 | |
| | | | |
| | | | | | | | | | | 227,806 | |
| | | | | | | | | | | | |
| | | | |
| Life Sciences Tools & Services: 0.27% | | | | | | | | | | | | |
Nordion Incorporated | | | | | | | 6,660 | | | | 43,956 | |
| | | | | | | | | | | | |
| | | | |
Industrials: 14.50% | | | | | | | | | | | | |
| | | | |
| Air Freight & Logistics: 0.28% | | | | | | | | | | | | |
Pacer International Incorporated † | | | | | | | 13,342 | | | | 46,297 | |
| | | | | | | | | | | | |
| | | | |
| Airlines: 0.82% | | | | | | | | | | | | |
JetBlue Airways Corporation † | | | | | | | 26,186 | | | | 134,596 | |
| | | | | | | | | | | | |
| | | | |
| Building Products: 0.31% | | | | | | | | | | | | |
Patrick Industries Incorporated † | | | | | | | 2,910 | | | | 50,576 | |
| | | | | | | | | | | | |
| | | | |
| Commercial Services & Supplies: 4.40% | | | | | | | | | | | | |
ABM Industries Incorporated | | | | | | | 10,583 | | | | 201,924 | |
ACCO Brands Corporation † | | | | | | | 50,080 | | | | 337,539 | |
GEO Group Incorporated | | | | | | | 6,615 | | | | 186,543 | |
| | | | |
| | | | | | | | | | | 726,006 | |
| | | | | | | | | | | | |
| | | | |
| Construction & Engineering: 5.34% | | | | | | | | | | | | |
Chicago Bridge & Iron Company NV | | | | | | | 4,990 | | | | 202,744 | |
Integrated Electrical Services Incorporated † | | | | | | | 24,302 | | | | 110,574 | |
MYR Group Incorporated † | | | | | | | 9,020 | | | | 193,389 | |
Primoris Services Corporation | | | | | | | 19,401 | | | | 280,926 | |
Sterling Construction Company Incorporated † | | | | | | | 10,130 | | | | 93,500 | |
| | | | |
| | | | | | | | | | | 881,133 | |
| | | | | | | | | | | | |
The accompanying notes are an integral part of these financial statements.
| | | | |
| 126 | | Wells Fargo Advantage Equity Gateway Funds | | Portfolio of investments—November 30, 2012 (unaudited) |
SMALL CAP VALUE PORTFOLIO
| | | | | | | | | | | | |
| Security name | | | | | | Shares | | | Value | |
| | | | | | | | | | | | |
| | | | |
| Electrical Equipment: 0.54% | | | | | | | | | | | | |
GrafTech International Limited † | | | | | | | 9,196 | | | $ | 89,201 | |
| | | | | | | | | | | | |
| | | | |
| Machinery: 1.56% | | | | | | | | | | | | |
Actuant Corporation Class A | | | | | | | 3,900 | | | | 112,203 | |
Hardinge Incorporated | | | | | | | 15,033 | | | | 144,166 | |
| | | | |
| | | | | | | | | | | 256,369 | |
| | | | | | | | | | | | |
| | | | |
| Professional Services: 1.25% | | | | | | | | | | | | |
Hill International Incorporated † | | | | | | | 59,307 | | | | 206,388 | |
| | | | | | | | | | | | |
| | | | |
Information Technology: 9.83% | | | | | | | | | | | | |
| | | | |
| Communications Equipment: 2.12% | | | | | | | | | | | | |
Brocade Communications Systems Incorporated † | | | | | | | 15,275 | | | | 86,762 | |
MRV Communications Incorporated | | | | | | | 12,340 | | | | 6,293 | |
Sandvine Corporation † | | | | | | | 154,135 | | | | 201,686 | |
Tellabs Incorporated | | | | | | | 15,400 | | | | 54,824 | |
| | | | |
| | | | | | | | | | | 349,565 | |
| | | | | | | | | | | | |
| | | | |
| Computers & Peripherals: 2.76% | | | | | | | | | | | | |
Cray Incorporated † | | | | | | | 15,350 | | | | 218,277 | |
Intermec Incorporated † | | | | | | | 21,234 | | | | 160,317 | |
Lexmark International Incorporated | | | | | | | 3,165 | | | | 77,004 | |
| | | | |
| | | | | | | | | | | 455,598 | |
| | | | | | | | | | | | |
| | | | |
| Electronic Equipment, Instruments & Components: 2.72% | | | | | | | | | | | | |
Coherent Incorporated † | | | | | | | 4,003 | | | | 185,139 | |
OSI Systems Incorporated † | | | | | | | 3,565 | | | | 218,463 | |
Power One Incorporated † | | | | | | | 10,590 | | | | 43,949 | |
| | | | |
| | | | | | | | | | | 447,551 | |
| | | | | | | | | | | | |
| | | | |
| IT Services: 1.64% | | | | | | | | | | | | |
Official Payments Holdings Incorporated † | | | | | | | 53,220 | | | | 270,890 | |
| | | | | | | | | | | | |
| | | | |
| Software: 0.59% | | | | | | | | | | | | |
Accelrys Incorporated † | | | | | | | 11,075 | | | | 97,571 | |
| | | | | | | | | | | | |
| | | | |
Materials: 14.60% | | | | | | | | | | | | |
| | | | |
| Containers & Packaging: 0.29% | | | | | | | | | | | | |
Intertape Polymer Group Incorporated | | | | | | | 5,810 | | | | 47,410 | |
| | | | | | | | | | | | |
| | | | |
| Metals & Mining: 13.92% | | | | | | | | | | | | |
Eldorado Gold Corporation | | | | | | | 7,915 | | | | 114,609 | |
Goldcorp Incorporated | | | | | | | 5,175 | | | | 200,273 | |
Great Basin Gold Limited †(a)(i) | | | | | | | 97,638 | | | | 0 | |
Randgold Resources Limited ADR | | | | | | | 8,133 | | | | 873,159 | |
Royal Gold Incorporated | | | | | | | 3,195 | | | | 258,028 | |
San Gold Corporation † | | | | | | | 32,830 | | | | 27,876 | |
Sandstorm Gold Limited † | | | | | | | 30,435 | | | | 373,180 | |
Sandstorm Metals & Energy Limited † | | | | | | | 253,515 | | | | 126,330 | |
Silver Standard Resources Incorporated † | | | | | | | 13,249 | | | | 178,862 | |
The accompanying notes are an integral part of these financial statements.
| | | | | | |
| Portfolio of investments—November 30, 2012 (unaudited) | | Wells Fargo Advantage Equity Gateway Funds | | | 127 | |
SMALL CAP VALUE PORTFOLIO
| | | | | | | | | | | | | | | | |
| Security name | | | | | | | | Shares | | | Value | |
| | | | | | | | | | | | | | | | |
| | | | |
| Metals & Mining (continued) | | | | | | | | | | | | | | | | |
Steel Dynamics Incorporated | | | | | | | | | | | 3,003 | | | $ | 38,799 | |
United States Steel Corporation | | | | | | | | | | | 4,795 | | | | 103,380 | |
| | | | |
| | | | | | | | | | | | | | | 2,294,496 | |
| | | | | | | | | | | | | | | | |
| | | | |
| Paper & Forest Products: 0.39% | | | | | | | | | | | | | | | | |
Wausau Paper Corporation | | | | | | | | | | | 7,652 | | | | 64,200 | |
| | | | | | | | | | | | | | | | |
| | | | |
Telecommunication Services: 1.21% | | | | | | | | | | | | | | | | |
| | | | |
| Diversified Telecommunication Services: 1.21% | | | | | | | | | | | | | | | | |
Cincinnati Bell Incorporated † | | | | | | | | | | | 37,395 | | | | 199,318 | |
| | | | | | | | | | | | | | | | |
| | | | |
Total Common Stocks (Cost $10,521,497) | | | | | | | | | | | | | | | 15,447,346 | |
| | | | | | | | | | | | | | | | |
| | | | |
| Investment Companies: 2.21% | | | | | | | | | | | | | | | | |
KBW Regional Banking ETF | | | | | | | | | | | 1,036 | | | | 28,573 | |
Market Vectors Junior Gold Miners ETF | | | | | | | | | | | 15,534 | | | | 334,913 | |
| | | | |
Total Investment Companies (Cost $364,703) | | | | | | | | | | | | | | | 363,486 | |
| | | | | | | | | | | | | | | | |
| | | | | | Expiration date | | | | | | | |
| | | | |
Warrants: 0.26% | | | | | | | | | | | | | | | | |
| | | | |
Health Care: 0.26% | | | | | | | | | | | | | | | | |
| | | | |
| Health Care Equipment & Supplies: 0.26% | | | | | | | | | | | | | | | | |
EnteroMedics Incorporated †(a)(i) | | | | | | | 5-14-16 | | | | 9,104 | | | | 14,348 | |
Enteromedics Incorporated †(a)(i) | | | | | | | 9-28-16 | | | | 16,376 | | | | 28,925 | |
| | | | |
Total Warrants (Cost $0) | | | | | | | | | | | | | | | 43,273 | |
| | | | | | | | | | | | | | | | |
| | | Yield | | | | | | | | | | |
| | | | |
Short-Term Investments: 3.69% | | | | | | | | | | | | | | | | |
| | | | |
| Investment Companies: 3.69% | | | | | | | | | | | | | | | | |
Wells Fargo Advantage Cash Investment Money Market Fund, Select Class (l)(u) | | | 0.16 | % | | | | | | | 608,030 | | | | 608,030 | |
| | | | | | | | | | | | | | | | |
| | | | |
Total Short-Term Investments (Cost $608,030) | | | | | | | | | | | | | | | 608,030 | |
| | | | | | | | | | | | | | | | |
| | | | | | | | |
Total investments in securities (Cost $11,494,230)* | | | 99.86 | % | | | 16,462,135 | |
Other assets and liabilities, net | | | 0.14 | | | | 23,384 | |
| | | | | | | | |
| Total net assets | | | 100.00 | % | | $ | 16,485,519 | |
| | | | | | | | |
| † | Non-income-earning security |
| (a) | Security is fair valued by the Management Valuation Team, and in certain instances by the Board of Trustees, in accordance with procedures approved by the Board of Trustees. |
| (l) | Investment in an affiliate |
| (u) | Rate shown is the 7-day annualized yield at period end. |
| * | Cost for federal income tax purposes is $12,488,601 and unrealized appreciation (depreciation) consists of: |
| | | | |
Gross unrealized appreciation | | $ | 4,695,713 | |
Gross unrealized depreciation | | | (722,179 | ) |
| | | | |
Net unrealized appreciation | | $ | 3,973,534 | |
The accompanying notes are an integral part of these financial statements.
| | | | |
| 128 | | Wells Fargo Advantage Equity Gateway Funds | | Portfolio of investments—November 30, 2012 (unaudited) |
SMALL COMPANY GROWTH PORTFOLIO
| | | | | | | | | | | | |
| Security name | | | | | | Shares | | | Value | |
| | | | | | | | | | | | |
| | | | |
Common Stocks: 96.31% | | | | | | | | | | | | |
| | | | |
Consumer Discretionary: 14.27% | | | | | | | | | | | | |
| | | | |
| Hotels, Restaurants & Leisure: 1.32% | | | | | | | | | | | | |
Caribou Coffee Company Incorporated †« | | | | | | | 40,190 | | | $ | 484,290 | |
Ryman Hospitality Properties Incorporated « | | | | | | | 38,190 | | | | 1,268,672 | |
| | | | |
| | | | | | | | | | | 1,752,962 | |
| | | | | | | | | | | | |
| | | | |
| Household Durables: 1.06% | | | | | | | | | | | | |
Ethan Allen Interiors Incorporated « | | | | | | | 48,180 | | | | 1,397,702 | |
| | | | | | | | | | | | |
| | | | |
| Leisure Equipment & Products: 0.75% | | | | | | | | | | | | |
Brunswick Corporation | | | | | | | 38,490 | | | | 991,887 | |
| | | | | | | | | | | | |
| | | | |
| Media: 2.85% | | | | | | | | | | | | |
Arbitron Incorporated « | | | | | | | 34,430 | | | | 1,252,219 | |
IMAX Corporation † | | | | | | | 54,040 | | | | 1,169,966 | |
Lions Gate Entertainment Corporation † | | | | | | | 82,880 | | | | 1,357,574 | |
| | | | |
| | | | | | | | | | | 3,779,759 | |
| | | | | | | | | | | | |
| | | | |
| Specialty Retail: 6.76% | | | | | | | | | | | | |
Cabela’s Incorporated †« | | | | | | | 23,000 | | | | 1,098,710 | |
Chico’s FAS Incorporated | | | | | | | 44,600 | | | | 831,790 | |
Dick’s Sporting Goods Incorporated « | | | | | | | 27,650 | | | | 1,451,902 | |
Finish Line Incorporated | | | | | | | 60,820 | | | | 1,254,717 | |
GNC Holdings Incorporated Class A | | | | | | | 39,630 | | | | 1,392,202 | |
Mattress Firm Holding Corporation †« | | | | | | | 33,110 | | | | 947,277 | |
rue21 Incorporated †« | | | | | | | 20,820 | | | | 597,742 | |
Sonic Automotive Incorporated « | | | | | | | 70,140 | | | | 1,384,564 | |
| | | | |
| | | | | | | | | | | 8,958,904 | |
| | | | | | | | | | | | |
| | | | |
| Textiles, Apparel & Luxury Goods: 1.53% | | | | | | | | | | | | |
Hanesbrands Incorporated †« | | | | | | | 56,130 | | | | 2,026,293 | |
| | | | | | | | | | | | |
| | | | |
Energy: 5.86% | | | | | | | | | | | | |
| | | | |
| Energy Equipment & Services: 2.14% | | | | | | | | | | | | |
Geospace Technologies Corporation †« | | | | | | | 12,940 | | | | 985,640 | |
McDermott International Incorporated †« | | | | | | | 104,570 | | | | 1,101,122 | |
Pacific Drilling SA † | | | | | | | 79,390 | | | | 754,205 | |
| | | | |
| | | | | | | | | | | 2,840,967 | |
| | | | | | | | | | | | |
| | | | |
| Oil, Gas & Consumable Fuels: 3.72% | | | | | | | | | | | | |
Energy XXI (Bermuda) Limited « | | | | | | | 47,650 | | | | 1,509,552 | |
GasLog Limited « | | | | | | | 66,100 | | | | 812,369 | |
Gulfport Energy Corporation † | | | | | | | 34,830 | | | | 1,324,933 | |
Rosetta Resources Incorporated † | | | | | | | 28,470 | | | | 1,279,442 | |
| | | | |
| | | | | | | | | | | 4,926,296 | |
| | | | | | | | | | | | |
The accompanying notes are an integral part of these financial statements.
| | | | | | |
| Portfolio of investments—November 30, 2012 (unaudited) | | Wells Fargo Advantage Equity Gateway Funds | | | 129 | |
SMALL COMPANY GROWTH PORTFOLIO
| | | | | | | | | | | | |
| Security name | | | | | | Shares | | | Value | |
| | | | | | | | | | | | |
| | | | |
Financials: 10.83% | | | | | | | | | | | | |
| | | | |
| Capital Markets: 5.14% | | | | | | | | | | | | |
Evercore Partners Incorporated Class A | | | | | | | 55,400 | | | $ | 1,521,838 | |
LPL Financial Holdings Incorporated | | | | | | | 46,470 | | | | 1,301,625 | |
Medley Capital Corporation | | | | | | | 72,660 | | | | 990,356 | |
New Mountain Finance Corporation | | | | | | | 57,055 | | | | 866,095 | |
Stifel Financial Corporation †« | | | | | | | 40,650 | | | | 1,236,573 | |
Walter Investment Management †« | | | | | | | 21,010 | | | | 888,303 | |
| | | | |
| | | | | | | | | | | 6,804,790 | |
| | | | | | | | | | | | |
| | | | |
| Commercial Banks: 3.22% | | | | | | | | | | | | |
Capital Bank Financial Corporation Class A † | | | | | | | 50,480 | | | | 871,285 | |
CapitalSource Incorporated | | | | | | | 150,450 | | | | 1,211,123 | |
Signature Bank †« | | | | | | | 12,900 | | | | 905,064 | |
SVB Financial Group † | | | | | | | 23,190 | | | | 1,280,552 | |
| | | | |
| | | | | | | | | | | 4,268,024 | |
| | | | | | | | | | | | |
| | | | |
| Consumer Finance: 0.81% | | | | | | | | | | | | |
DFC Global Corporation †« | | | | | | | 61,940 | | | | 1,080,853 | |
| | | | | | | | | | | | |
| | | | |
| Insurance: 1.08% | | | | | | | | | | | | |
Argo Group International Holdings Limited | | | | | | | 43,140 | | | | 1,431,817 | |
| | | | | | | | | | | | |
| | | | |
| Real Estate Management & Development: 0.58% | | | | | | | | | | | | |
Zillow Incorporated Class A †« | | | | | | | 27,740 | | | | 763,405 | |
| | | | | | | | | | | | |
| | | | |
Health Care: 16.57% | | | | | | | | | | | | |
| | | | |
| Biotechnology: 2.80% | | | | | | | | | | | | |
Alnylam Pharmaceuticals Incorporated †« | | | | | | | 60,720 | | | | 1,030,418 | |
Curis Incorporated †« | | | | | | | 117,330 | | | | 393,056 | |
Exelixis Incorporated †« | | | | | | | 177,140 | | | | 866,215 | |
InterMune Incorporated †« | | | | | | | 83,460 | | | | 764,494 | |
Seattle Genetics Incorporated †« | | | | | | | 26,120 | | | | 661,097 | |
| | | | |
| | | | | | | | | | | 3,715,280 | |
| | | | | | | | | | | | |
| | | | |
| Health Care Equipment & Supplies: 5.43% | | | | | | | | | | | | |
Cerus Corporation †« | | | | | | | 269,260 | | | | 869,710 | |
DexCom Incorporated †« | | | | | | | 81,970 | | | | 1,072,168 | |
Endologix Incorporated †« | | | | | | | 61,351 | | | | 899,406 | |
Insulet Corporation †« | | | | | | | 56,190 | | | | 1,233,371 | |
Natus Medical Incorporated † | | | | | | | 78,730 | | | | 891,224 | |
Spectranetics Corporation † | | | | | | | 66,300 | | | | 954,720 | |
Thoratec Corporation † | | | | | | | 34,110 | | | | 1,268,892 | |
| | | | |
| | | | | | | | | | | 7,189,491 | |
| | | | | | | | | | | | |
| | | | |
| Health Care Providers & Services: 3.09% | | | | | | | | | | | | |
Capital Senior Living Corporation † | | | | | | | 67,950 | | | | 1,210,190 | |
Ensign Group Incorporated | | | | | | | 51,780 | | | | 1,335,406 | |
Team Health Holdings Incorporated † | | | | | | | 55,170 | | | | 1,544,208 | |
| | | | |
| | | | | | | | | | | 4,089,804 | |
| | | | | | | | | | | | |
The accompanying notes are an integral part of these financial statements.
| | | | |
| 130 | | Wells Fargo Advantage Equity Gateway Funds | | Portfolio of investments—November 30, 2012 (unaudited) |
SMALL COMPANY GROWTH PORTFOLIO
| | | | | | | | | | | | |
| Security name | | | | | | Shares | | | Value | |
| | | | | | | | | | | | |
| | | | |
| Health Care Technology: 3.13% | | | | | | | | | | | | |
Medidata Solutions Incorporated † | | | | | | | 22,610 | | | $ | 904,400 | |
Omnicell Incorporated † | | | | | | | 108,350 | | | | 1,654,505 | |
Vocera Communications Incorporated †« | | | | | | | 64,720 | | | | 1,591,465 | |
| | | | |
| | | | | | | | | | | 4,150,370 | |
| | | | | | | | | | | | |
| | | | |
| Life Sciences Tools & Services: 1.59% | | | | | | | | | | | | |
Fluidigm Corporation †« | | | | | | | 52,190 | | | | 743,186 | |
ICON plc ADR † | | | | | | | 49,520 | | | | 1,366,257 | |
| | | | |
| | | | | | | | | | | 2,109,443 | |
| | | | | | | | | | | | |
| | | | |
| Pharmaceuticals: 0.53% | | | | | | | | | | | | |
MAP Pharmaceuticals Incorporated †« | | | | | | | 43,910 | | | | 699,925 | |
| | | | | | | | | | | | |
| | | | |
Industrials: 20.00% | | | | | | | | | | | | |
| | | | |
| Aerospace & Defense: 0.70% | | | | | | | | | | | | |
Esterline Technologies Corporation † | | | | | | | 15,250 | | | | 932,385 | |
| | | | | | | | | | | | |
| | | | |
| Air Freight & Logistics: 1.06% | | | | | | | | | | | | |
Hub Group Incorporated Class A † | | | | | | | 43,170 | | | | 1,397,413 | |
| | | | | | | | | | | | |
| | | | |
| Airlines: 0.89% | | | | | | | | | | | | |
Spirit Airlines Incorporated † | | | | | | | 70,200 | | | | 1,177,956 | |
| | | | | | | | | | | | |
| | | | |
| Building Products: 2.02% | | | | | | | | | | | | |
AO Smith Corporation « | | | | | | | 25,070 | | | | 1,578,157 | |
Apogee Enterprises Incorporated | | | | | | | 48,120 | | | | 1,102,910 | |
| | | | |
| | | | | | | | | | | 2,681,067 | |
| | | | | | | | | | | | |
| | | | |
| Commercial Services & Supplies: 2.37% | | | | | | | | | | | | |
ACCO Brands Corporation † | | | | | | | 155,030 | | | | 1,044,902 | |
Copart Incorporated † | | | | | | | 32,942 | | | | 995,178 | |
Encore Capital Group Incorporated †« | | | | | | | 41,125 | | | | 1,093,103 | |
| | | | |
| | | | | | | | | | | 3,133,183 | |
| | | | | | | | | | | | |
| | | | |
| Construction & Engineering: 1.76% | | | | | | | | | | | | |
Great Lakes Dredge & Dock Company | | | | | | | 152,510 | | | | 1,346,663 | |
Tutor Prini Corporation † | | | | | | | 76,200 | | | | 979,932 | |
| | | | |
| | | | | | | | | | | 2,326,595 | |
| | | | | | | | | | | | |
| | | | |
| Electrical Equipment: 0.70% | | | | | | | | | | | | |
Sensata Technologies Holdings NV † | | | | | | | 30,120 | | | | 929,503 | |
| | | | | | | | | | | | |
| | | | |
| Machinery: 2.55% | | | | | | | | | | | | |
Actuant Corporation Class A | | | | | | | 37,220 | | | | 1,070,819 | |
Colfax Corporation †« | | | | | | | 24,490 | | | | 954,865 | |
Wabash National Corporation †« | | | | | | | 167,290 | | | | 1,353,376 | |
| | | | |
| | | | | | | | | | | 3,379,060 | |
| | | | | | | | | | | | |
The accompanying notes are an integral part of these financial statements.
| | | | | | |
| Portfolio of investments—November 30, 2012 (unaudited) | | Wells Fargo Advantage Equity Gateway Funds | | | 131 | |
SMALL COMPANY GROWTH PORTFOLIO
| | | | | | | | | | | | |
| Security name | | | | | | Shares | | | Value | |
| | | | | | | | | | | | |
| | | | |
| Professional Services: 2.33% | | | | | | | | | | | | |
Insperity Incorporated | | | | | | | 46,230 | | | $ | 1,396,146 | |
On Assignment Incorporated †« | | | | | | | 84,980 | | | | 1,693,651 | |
| | | | |
| | | | | | | | | | | 3,089,797 | |
| | | | | | | | | | | | |
| | | | |
| Road & Rail: 2.47% | | | | | | | | | | | | |
Genesee & Wyoming Incorporated † | | | | | | | 13,710 | | | | 1,000,145 | |
Hertz Global Holdings Incorporated †« | | | | | | | 66,480 | | | | 1,039,747 | |
Swift Transportation Company †« | | | | | | | 87,690 | | | | 741,857 | |
Werner Enterprises Incorporated « | | | | | | | 22,450 | | | | 486,941 | |
| | | | |
| | | | | | | | | | | 3,268,690 | |
| | | | | | | | | | | | |
| | | | |
| Trading Companies & Distributors: 3.15% | | | | | | | | | | | | |
Aceto Corporation « | | | | | | | 79,750 | | | | 795,108 | |
Beacon Roofing Supply Incorporated † | | | | | | | 42,770 | | | | 1,319,027 | |
MSC Industrial Direct Company | | | | | | | 13,090 | | | | 951,119 | |
United Rentals Incorporated † | | | | | | | 26,800 | | | | 1,113,004 | |
| | | | |
| | | | | | | | | | | 4,178,258 | |
| | | | | | | | | | | | |
| | | | |
Information Technology: 24.11% | | | | | | | | | | | | |
| | | | |
| Communications Equipment: 3.14% | | | | | | | | | | | | |
Aruba Networks Incorporated †« | | | | | | | 34,120 | | | | 664,658 | |
Infinera Corporation †« | | | | | | | 121,250 | | | | 676,575 | |
Palo Alto Networks Incorporated † | | | | | | | 3,940 | | | | 214,415 | |
Procera Networks Incorporated †« | | | | | | | 37,280 | | | | 769,832 | |
Riverbed Technology Incorporated † | | | | | | | 65,920 | | | | 1,179,968 | |
Ruckus Wireless Incorporation † | | | | | | | 48,850 | | | | 646,774 | |
| | | | |
| | | | | | | | | | | 4,152,222 | |
| | | | | | | | | | | | |
| | | | |
| Computers & Peripherals: 0.76% | | | | | | | | | | | | |
Fusion-io Incorporated †« | | | | | | | 43,340 | | | | 1,011,122 | |
| | | | | | | | | | | | |
| | | | |
| Electronic Equipment, Instruments & Components: 1.91% | | | | | | | | | | | | |
InvenSense Incorporated † | | | | | | | 82,860 | | | | 832,743 | |
OSI Systems Incorporated † | | | | | | | 27,710 | | | | 1,698,069 | |
| | | | |
| | | | | | | | | | | 2,530,812 | |
| | | | | | | | | | | | |
| | | | |
| Internet Software & Services: 3.40% | | | | | | | | | | | | |
Bankrate Incorporated †« | | | | | | | 50,440 | | | | 606,793 | |
Millennial Media Incorporation † | | | | | | | 30,160 | | | | 414,700 | |
Perficient Incorporated † | | | | | | | 79,860 | | | | 869,675 | |
ValueClick Incorporated †« | | | | | | | 70,130 | | | | 1,323,353 | |
Vocus Incorporated † | | | | | | | 75,720 | | | | 1,291,783 | |
| | | | |
| | | | | | | | | | | 4,506,304 | |
| | | | | | | | | | | | |
| | | | |
| IT Services: 2.09% | | | | | | | | | | | | |
Fleetcor Technologies Incorporated † | | | | | | | 25,930 | | | | 1,353,287 | |
Interxion Holding NV † | | | | | | | 65,190 | | | | 1,415,275 | |
| | | | |
| | | | | | | | | | | 2,768,562 | |
| | | | | | | | | | | | |
The accompanying notes are an integral part of these financial statements.
| | | | |
| 132 | | Wells Fargo Advantage Equity Gateway Funds | | Portfolio of investments—November 30, 2012 (unaudited) |
SMALL COMPANY GROWTH PORTFOLIO
| | | | | | | | | | | | |
| Security name | | | | | | Shares | | | Value | |
| | | | | | | | | | | | |
| | | | |
| Semiconductors & Semiconductor Equipment: 3.99% | | | | | | | | | | | | |
Cirrus Logic Incorporated † | | | | | | | 59,300 | | | $ | 1,857,276 | |
Microsemi Corporation †« | | | | | | | 58,110 | | | | 1,112,225 | |
Peregrine Semiconductor Corporation † | | | | | | | 23,620 | | | | 399,887 | |
PMC-Sierra Incorporated †« | | | | | | | 141,210 | | | | 727,232 | |
Semtech Corporation †« | | | | | | | 43,550 | | | | 1,191,093 | |
| | | | |
| | | | | | | | | | | 5,287,713 | |
| | | | | | | | | | | | |
| | | | |
| Software: 8.82% | | | | | | | | | | | | |
Bottomline Technologies Incorporated †« | | | | | | | 46,640 | | | | 1,143,146 | |
Broadsoft Incorporated † | | | | | | | 20,720 | | | | 655,374 | |
Cadence Design Systems Incorporated †« | | | | | | | 126,050 | | | | 1,604,617 | |
Concur Technologies Incorporated †« | | | | | | | 12,962 | | | | 851,733 | |
Parametric Technology Corporation † | | | | | | | 62,990 | | | | 1,274,918 | |
Realpage Incorporated †« | | | | | | | 45,600 | | | | 902,424 | |
Sourcefire Incorporated †« | | | | | | | 16,410 | | | | 807,864 | |
SS&C Technologies Holdings † | | | | | | | 81,920 | | | | 1,932,486 | |
Synchronoss Technologies Incorporated †« | | | | | | | 31,830 | | | | 581,216 | |
Tangoe Incorporated †« | | | | | | | 78,710 | | | | 1,026,378 | |
Ultimate Software Group Incorporated †« | | | | | | | 9,620 | | | | 909,186 | |
| | | | |
| | | | | | | | | | | 11,689,342 | |
| | | | | | | | | | | | |
| | | | |
Materials: 4.67% | | | | | | | | | | | | |
| | | | |
| Chemicals: 2.09% | | | | | | | | | | | | |
Calgon Carbon Corporation †« | | | | | | | 86,290 | | | | 1,168,367 | |
LSB Industries Incorporated † | | | | | | | 21,870 | | | | 731,114 | |
Methanex Corporation | | | | | | | 28,710 | | | | 868,190 | |
| | | | |
| | | | | | | | | | | 2,767,671 | |
| | | | | | | | | | | | |
| | | | |
| Containers & Packaging: 0.91% | | | | | | | | | | | | |
Berry Plastics Group Incorporated † | | | | | | | 80,620 | | | | 1,202,044 | |
| | | | | | | | | | | | |
| | | | |
| Metals & Mining: 0.70% | | | | | | | | | | | | |
Steel Dynamics Incorporated | | | | | | | 71,270 | | | | 920,808 | |
| | | | | | | | | | | | |
| | | | |
| Paper & Forest Products: 0.97% | | | | | | | | | | | | |
Schweitzer Manduit International Incorporated | | | | | | | 34,470 | | | | 1,291,591 | |
| | | | | | | | | | | | |
| | | | |
Total Common Stocks (Cost $110,568,344) | | | | | | | | | | | 127,600,070 | |
| | | | | | | | | | | | |
| | | | |
| | | | | | | Principal | | | | |
| Other: 0.42% | | | | | | | | | | | | |
Gryphon Funding Limited, Pass-Through Entity (a)(i)(v) | | | | | | $ | 1,699,722 | | | | 560,908 | |
| | | | |
Total Other (Cost $161,045) | | | | | | | | | | | 560,908 | |
| | | | | | | | | | | | |
The accompanying notes are an integral part of these financial statements.
| | | | | | |
| Portfolio of investments—November 30, 2012 (unaudited) | | Wells Fargo Advantage Equity Gateway Funds | | | 133 | |
SMALL COMPANY GROWTH PORTFOLIO
| | | | | | | | | | | | | | |
| Security name | | | | Yield | | | Principal | | | Value | |
| | | | | | | | | | | | | | |
| | | | |
Short-Term Investments : 31.34% | | | | | | | | | | | | | | |
| | | | |
| Investment Companies : 31.34% | | | | | | | | | | | | | | |
Wells Fargo Advantage Cash Investment Money Market Fund, Select Class (l)(u) | | | | | 0.16 | % | | $ | 3,370,315 | | | $ | 3,370,315 | |
Wells Fargo Securities Lending Cash Investments, LLC (v)(l)(u)(r) | | | | | 0.21 | | | | 38,146,194 | | | | 38,146,194 | |
| | | | |
Total Short-Term Investments (Cost $41,516,509) | | | | | | | | | | | | | 41,516,509 | |
| | | | | | | | | | | | | | |
| | | | | | | | |
| Total investments in securities | | | | | | | | |
| (Cost $152,245,898)* | | | 128.07 | % | | | 169,677,487 | |
Other assets and liabilities, net | | | (28.07 | ) | | | (37,187,655 | ) |
| | | | | | | | |
| Total net assets | | | 100.00 | % | | $ | 132,489,832 | |
| | | | | | | | |
| ��� | Non-income-earning security |
| « | All or a portion of this security is on loan. |
| (a) | Security is fair valued by the Management Valuation Team, and in certain instances by the Board of Trustees, in accordance with procedures approved by the Board of Trustees. |
| (v) | Security represents investment of cash collateral received from securities on loan. |
| (l) | Investment in an affiliate. |
| (u) | Rate shown is the 7-day annualized yield at period end. |
| (r) | The investment company is exempt from registration under Section 3(c)(7) of the Investment Company Act of 1940, as amended. |
| * | Cost for federal income tax purposes is $154,864,840 and unrealized appreciation (depreciation) consists of: |
| | | | |
Gross unrealized appreciation | | $ | 20,184,873 | |
Gross unrealized depreciation | | | (5,372,226 | ) |
| | | | |
Net unrealized appreciation | | $ | 14,812,647 | |
The accompanying notes are an integral part of these financial statements.
| | | | |
| 134 | | Wells Fargo Advantage Equity Gateway Funds | | Portfolio of investments—November 30, 2012 (unaudited) |
SMALL COMPANY VALUE PORTFOLIO
| | | | | | | | | | | | |
| Security name | | | | | | Shares | | | Value | |
| | | | | | | | | | | | |
| | | | |
Common Stocks: 97.73% | | | | | | | | | | | | |
| | | | |
Consumer Discretionary: 15.31% | | | | | | | | | | | | |
| | | | |
| Auto Components: 0.97% | | | | | | | | | | | | |
Dana Holding Corporation | | | | | | | 116,600 | | | $ | 1,653,388 | |
| | | | | | | | | | | | |
| | | | |
| Automobiles: 0.87% | | | | | | | | | | | | |
Thor Industries Incorporated « | | | | | | | 38,990 | | | | 1,471,483 | |
| | | | | | | | | | | | |
| | | | |
| Distributors: 0.88% | | | | | | | | | | | | |
Core Mark Holding Company Incorporated | | | | | | | 32,780 | | | | 1,499,685 | |
| | | | | | | | | | | | |
| | | | |
| Hotels, Restaurants & Leisure: 4.50% | | | | | | | | | | | | |
Ameristar Casinos Incorporated | | | | | | | 118,920 | | | | 2,366,508 | |
Bob Evans Farms Incorporated | | | | | | | 36,740 | | | | 1,384,731 | |
Isle of Capri Casinos Incorporated † | | | | | | | 200,130 | | | | 982,638 | |
Ruby Tuesday Incorporated Ǡ | | | | | | | 243,960 | | | | 1,905,328 | |
WMS Industries Incorporated Ǡ | | | | | | | 60,630 | | | | 1,024,647 | |
| | | | |
| | | | | | | | | | | 7,663,852 | |
| | | | | | | | | | | | |
| | | | |
| Leisure Equipment & Products: 0.68% | | | | | | | | | | | | |
Arctic Cat Incorporated Ǡ | | | | | | | 30,800 | | | | 1,159,004 | |
| | | | | | | | | | | | |
| | | | |
| Media: 1.71% | | | | | | | | | | | | |
Cinemark Holdings Incorporated « | | | | | | | 68,330 | | | | 1,858,576 | |
National Cinemedia Incorporated | | | | | | | 73,470 | | | | 1,050,621 | |
| | | | |
| | | | | | | | | | | 2,909,197 | |
| | | | | | | | | | | | |
| | | | |
| Specialty Retail: 4.17% | | | | | | | | | | | | |
Aeropostale Incorporated † | | | | | | | 159,200 | | | | 2,198,552 | |
Asbury Automotive Group Incorporated Ǡ | | | | | | | 63,060 | | | | 1,903,781 | |
Bebe Stores Incorporated | | | | | | | 115,220 | | | | 433,227 | |
Rent-A-Center Incorporated | | | | | | | 48,880 | | | | 1,699,069 | |
Zumiez Incorporated † | | | | | | | 42,100 | | | | 864,658 | |
| | | | |
| | | | | | | | | | | 7,099,287 | |
| | | | | | | | | | | | |
| | | | |
| Textiles, Apparel & Luxury Goods: 1.53% | | | | | | | | | | | | |
G-III Apparel Group Limited Ǡ | | | | | | | 49,600 | | | | 1,887,280 | |
Hanesbrands Incorporated † | | | | | | | 19,680 | | | | 710,448 | |
| | | | |
| | | | | | | | | | | 2,597,728 | |
| | | | | | | | | | | | |
| | | | |
Consumer Staples: 1.18% | | | | | | | | | | | | |
| | | | |
| Food Products: 1.18% | | | | | | | | | | | | |
Post Holdings Incorporated † | | | | | | | 58,520 | | | | 2,015,429 | |
| | | | | | | | | | | | |
| | | | |
Energy: 6.43% | | | | | | | | | | | | |
| | | | |
| Energy Equipment & Services: 2.36% | | | | | | | | | | | | |
Hercules Offshore Incorporated Ǡ | | | | | | | 471,330 | | | | 2,432,063 | |
Hornbeck Offshore † | | | | | | | 44,040 | | | | 1,584,119 | |
| | | | |
| | | | | | | | | | | 4,016,182 | |
| | | | | | | | | | | | |
The accompanying notes are an integral part of these financial statements.
| | | | | | |
| Portfolio of investments—November 30, 2012 (unaudited) | | Wells Fargo Advantage Equity Gateway Funds | | | 135 | |
SMALL COMPANY VALUE PORTFOLIO
| | | | | | | | | | | | |
| Security name | | | | | | Shares | | | Value | |
| | | | | | | | | | | | |
| | | | |
| Oil, Gas & Consumable Fuels: 4.07% | | | | | | | | | | | | |
Berry Petroleum Company Class A « | | | | | | | 42,260 | | | $ | 1,314,709 | |
Magnum Hunter Resources Corporation Ǡ | | | | | | | 570,600 | | | | 2,299,518 | |
Rex Energy Corporation Ǡ | | | | | | | 128,800 | | | | 1,693,720 | |
Sanchez Energy Corporation Ǡ | | | | | | | 88,800 | | | | 1,622,376 | |
| | | | |
| | | | | | | | | | | 6,930,323 | |
| | | | | | | | | | | | |
| | | | |
Financials: 33.28% | | | | | | | | | | | | |
| | | | |
| Capital Markets: 2.25% | | | | | | | | | | | | |
Greenhill & Company Incorporated « | | | | | | | 45,840 | | | | 2,178,317 | |
Stifel Financial Corporation Ǡ | | | | | | | 54,470 | | | | 1,656,977 | |
| | | | |
| | | | | | | | | | | 3,835,294 | |
| | | | | | | | | | | | |
| | | | |
| Commercial Banks: 11.83% | | | | | | | | | | | | |
Associated Banc-Corp « | | | | | | | 131,010 | | | | 1,683,479 | |
Banner Corporation | | | | | | | 47,700 | | | | 1,433,385 | |
City National Corporation « | | | | | | | 37,500 | | | | 1,825,875 | |
FirstMerit Corporation « | | | | | | | 108,600 | | | | 1,529,088 | |
Home Bancshares Incorporated « | | | | | | | 65,560 | | | | 2,173,970 | |
Pacwest Bancorp « | | | | | | | 77,360 | | | | 1,927,038 | |
SVB Financial Group † | | | | | | | 35,330 | | | | 1,950,923 | |
Umpqua Holdings Corporation « | | | | | | | 133,910 | | | | 1,561,391 | |
Webster Financial Corporation « | | | | | | | 84,000 | | | | 1,748,880 | |
Western Alliance Bancorp Ǡ | | | | | | | 224,300 | | | | 2,278,888 | |
Wintrust Financial Corporation « | | | | | | | 54,860 | | | | 2,018,299 | |
| | | | |
| | | | | | | | | | | 20,131,216 | |
| | | | | | | | | | | | |
| | | | |
| Insurance: 7.14% | | | | | | | | | | | | |
Amtrust Financial Services Incorporated « | | | | | | | 73,177 | | | | 2,108,961 | |
CNO Financial Group Incorporated « | | | | | | | 216,900 | | | | 1,973,790 | |
Employers Holdings Incorporated | | | | | | | 128,520 | | | | 2,453,447 | |
Meadowbrook Insurance Group Incorporated | | | | | | | 94,580 | | | | 525,865 | |
Primerica Incorporated | | | | | | | 60,200 | | | | 1,723,526 | |
Selective Insurance Group Incorporated « | | | | | | | 91,330 | | | | 1,706,044 | |
United Fire Group Incorporated | | | | | | | 79,760 | | | | 1,653,425 | |
| | | | |
| | | | | | | | | | | 12,145,058 | |
| | | | | | | | | | | | |
| | | | |
| Real Estate Management & Development: 0.64% | | | | | | | | | | | | |
Alexander & Baldwin Incorporated † | | | | | | | 36,700 | | | | 1,095,862 | |
| | | | | | | | | | | | |
| | | | |
| REITs: 9.31% | | | | | | | | | | | | |
Ashford Hospitality Trust | | | | | | | 183,800 | | | | 1,663,390 | |
Associated Estates Realty Corporation | | | | | | | 90,670 | | | | 1,371,837 | |
Campus Crest Communities Incorporated | | | | | | | 155,150 | | | | 1,774,916 | |
Cousins Properties Incorporated | | | | | | | 215,649 | | | | 1,770,478 | |
LaSalle Hotel Properties | | | | | | | 61,320 | | | | 1,478,425 | |
Pebblebrook Hotel Trust | | | | | | | 75,620 | | | | 1,576,677 | |
Redwood Trust Incorporated « | | | | | | | 116,070 | | | | 1,940,690 | |
Sabra Health Care REIT Incorporated « | | | | | | | 113,923 | | | | 2,472,129 | |
Sunstone Hotel Investors Incorporated † | | | | | | | 173,600 | | | | 1,791,552 | |
| | | | |
| | | | | | | | | | | 15,840,094 | |
| | | | | | | | | | | | |
The accompanying notes are an integral part of these financial statements.
| | | | |
| 136 | | Wells Fargo Advantage Equity Gateway Funds | | Portfolio of investments—November 30, 2012 (unaudited) |
SMALL COMPANY VALUE PORTFOLIO
| | | | | | | | | | | | |
| Security name | | | | | | Shares | | | Value | |
| | | | | | | | | | | | |
| | | | |
| Thrifts & Mortgage Finance: 2.11% | | | | | | | | | | | | |
BankUnited Incorporated « | | | | | | | 80,200 | | | $ | 1,884,700 | |
Washington Federal Incorporated « | | | | | | | 106,410 | | | | 1,710,009 | |
| | | | |
| | | | | | | | | | | 3,594,709 | |
| | | | | | | | | | | | |
| | | | |
Health Care: 3.89% | | | | | | | | | | | | |
| | | | |
| Health Care Equipment & Supplies: 1.20% | | | | | | | | | | | | |
Alere Incorporated † | | | | | | | 110,100 | | | | 2,036,850 | |
| | | | | | | | | | | | |
| | | | |
| Health Care Providers & Services: 1.59% | | | | | | | | | | | | |
Ensign Group Incorporated | | | | | | | 42,050 | | | | 1,084,470 | |
Lifepoint Hospitals Incorporated † | | | | | | | 45,280 | | | | 1,629,174 | |
| | | | |
| | | | | | | | | | | 2,713,644 | |
| | | | | | | | | | | | |
| | | | |
| Health Care Technology: 1.10% | | | | | | | | | | | | |
Medassets Incorporated † | | | | | | | 115,850 | | | | 1,865,185 | |
| | | | | | | | | | | | |
| | | | |
Industrials: 14.86% | | | | | | | | | | | | |
| | | | |
| Aerospace & Defense: 1.77% | | | | | | | | | | | | |
AAR Corporation « | | | | | | | 107,200 | | | | 1,646,592 | |
Huntington Ingalls Industries Incorporated | | | | | | | 33,400 | | | | 1,364,390 | |
| | | | |
| | | | | | | | | | | 3,010,982 | |
| | | | | | | | | | | | |
| | | | |
| Air Freight & Logistics: 1.35% | | | | | | | | | | | | |
Air Transport Services Group † | | | | | | | 204,870 | | | | 776,457 | |
Atlas Air Worldwide Holdings Incorporated † | | | | | | | 35,100 | | | | 1,519,128 | |
| | | | |
| | | | | | | | | | | 2,295,585 | |
| | | | | | | | | | | | |
| | | | |
| Commercial Services & Supplies: 0.81% | | | | | | | | | | | | |
Portfolio Recovery Associates Incorporated Ǡ | | | | | | | 13,950 | | | | 1,378,539 | |
| | | | | | | | | | | | |
| | | | |
| Construction & Engineering: 2.15% | | | | | | | | | | | | |
Great Lakes Dredge & Dock Company « | | | | | | | 250,690 | | | | 2,213,593 | |
Tutor Prini Corporation † | | | | | | | 111,880 | | | | 1,438,777 | |
| | | | |
| | | | | | | | | | | 3,652,370 | |
| | | | | | | | | | | | |
| | | | |
| Electrical Equipment: 0.57% | | | | | | | | | | | | |
GrafTech International Limited Ǡ | | | | | | | 100,340 | | | | 973,298 | |
| | | | | | | | | | | | |
| | | | |
| Machinery: 3.79% | | | | | | | | | | | | |
Briggs & Stratton Corporation « | | | | | | | 82,980 | | | | 1,683,664 | |
Kadant Incorporated † | | | | | | | 57,280 | | | | 1,389,040 | |
Titan International Incorporated « | | | | | | | 85,070 | | | | 1,729,473 | |
Wabash National Corporation Ǡ | | | | | | | 203,970 | | | | 1,650,117 | |
| | | | |
| | | | | | | | | | | 6,452,294 | |
| | | | | | | | | | | | |
| | | | |
| Marine: 0.58% | | | | | | | | | | | | |
Matson Incorporated « | | | | | | | 43,100 | | | | 991,300 | |
| | | | | | | | | | | | |
The accompanying notes are an integral part of these financial statements.
| | | | | | |
| Portfolio of investments—November 30, 2012 (unaudited) | | Wells Fargo Advantage Equity Gateway Funds | | | 137 | |
SMALL COMPANY VALUE PORTFOLIO
| | | | | | | | | | | | |
| Security name | | | | | | Shares | | | Value | |
| | | | | | | | | | | | |
| | | | |
| Professional Services: 1.01% | | | | | | | | | | | | |
FTI Consulting Incorporated Ǡ | | | | | | | 55,670 | | | $ | 1,720,760 | |
| | | | | | | | | | | | |
| | | | |
| Road & Rail: 1.86% | | | | | | | | | | | | |
Con-way Incorporated | | | | | | | 45,000 | | | | 1,264,050 | |
Ryder System Incorporated | | | | | | | 40,550 | | | | 1,908,689 | |
| | | | |
| | | | | | | | | | | 3,172,739 | |
| | | | | | | | | | | | |
| | | | |
| Trading Companies & Distributors: 0.97% | | | | | | | | | | | | |
Titan Machinery Incorporated Ǡ | | | | | | | 74,550 | | | | 1,650,537 | |
| | | | | | | | | | | | |
| | | | |
Information Technology: 13.79% | | | | | | | | | | | | |
| | | | |
| Communications Equipment: 0.88% | | | | | | | | | | | | |
Black Box Corporation « | | | | | | | 60,970 | | | | 1,502,911 | |
| | | | | | | | | | | | |
| | | | |
| Computers & Peripherals: 1.27% | | | | | | | | | | | | |
Lexmark International Incorporated « | | | | | | | 45,780 | | | | 1,113,827 | |
QLogic Corporation † | | | | | | | 111,060 | | | | 1,052,849 | |
| | | | |
| | | | | | | | | | | 2,166,676 | |
| | | | | | | | | | | | |
| | | | |
| Electronic Equipment, Instruments & Components: 4.48% | | | | | | | | | | | | |
Aeroflex Holding Corporation † | | | | | | | 200,970 | | | | 1,302,286 | |
Benchmark Electronics Incorporated † | | | | | | | 101,830 | | | | 1,582,438 | |
Multi-Fineline Electronix Incorporated Ǡ | | | | | | | 66,450 | | | | 1,135,631 | |
Sanmina Corporation † | | | | | | | 203,380 | | | | 1,915,840 | |
Synnex Corporation Ǡ | | | | | | | 51,100 | | | | 1,687,322 | |
| | | | |
| | | | | | | | | | | 7,623,517 | |
| | | | | | | | | | | | |
| | | | |
| Internet Software & Services: 1.12% | | | | | | | | | | | | |
EarthLink Incorporated | | | | | | | 289,200 | | | | 1,908,720 | |
| | | | | | | | | | | | |
| | | | |
| IT Services: 0.96% | | | | | | | | | | | | |
TNS Incorporated † | | | | | | | 111,480 | | | | 1,627,608 | |
| | | | | | | | | | | | |
| | | | |
| Semiconductors & Semiconductor Equipment: 4.76% | | | | | | | | | | | | |
Integrated Silicon Solution Incorporated Ǡ | | | | | | | 142,990 | | | | 1,252,592 | |
Kulicke & Soffa Industries Incorporated † | | | | | | | 219,570 | | | | 2,509,685 | |
MagnaChip Semiconductor Corporation † | | | | | | | 116,950 | | | | 1,473,570 | |
Omnivision Technologies Incorporated Ǡ | | | | | | | 93,000 | | | | 1,404,300 | |
Photronics Incorporated Ǡ | | | | | | | 284,500 | | | | 1,465,175 | |
| | | | |
| | | | | | | | | | | 8,105,322 | |
| | | | | | | | | | | | |
| | | | |
| Software: 0.32% | | | | | | | | | | | | |
EPIQ Systems Incorporated | | | | | | | 45,090 | | | | 540,629 | |
| | | | | | | | | | | | |
| | | | |
Materials: 5.47% | | | | | | | | | | | | |
| | | | |
| Chemicals: 2.95% | | | | | | | | | | | | |
Cytec Industries Incorporated « | | | | | | | 26,715 | | | | 1,833,718 | |
Kraton Performance Polymers Incorporated Ǡ | | | | | | | 86,040 | | | | 2,021,080 | |
Zep Incorporated « | | | | | | | 94,200 | | | | 1,168,080 | |
| | | | |
| | | | | | | | | | | 5,022,878 | |
| | | | | | | | | | | | |
The accompanying notes are an integral part of these financial statements.
| | | | |
| 138 | | Wells Fargo Advantage Equity Gateway Funds | | Portfolio of investments—November 30, 2012 (unaudited) |
SMALL COMPANY VALUE PORTFOLIO
| | | | | | | | | | | | | | |
| Security name | | | | | | | Shares | | | Value | |
| | | | | | | | | | | | | | |
| | | | |
| Metals & Mining: 2.52% | | | | | | | | | | | | | | |
A.M. Castle & Company Ǡ | | | | | | | | | 67,290 | | | $ | 858,620 | |
Horsehead Holding Corporation Ǡ | | | | | | | | | 154,600 | | | | 1,437,780 | |
Suncoke Energy Incorporated † | | | | | | | | | 122,600 | | | | 1,992,250 | |
| | | | |
| | | | | | | | | | | | | 4,288,650 | |
| | | | | | | | | | | | | | |
| | | | |
Telecommunication Services: 0.90% | | | | | | | | | | | | | | |
| | | | |
| Diversified Telecommunication Services: 0.90% | | | | | | | | | | | | | | |
Iridium Communications Incorporated Ǡ | | | | | | | | | 247,380 | | | | 1,526,335 | |
| | | | | | | | | | | | | | |
| | | | |
Utilities: 2.62% | | | | | | | | | | | | | | |
| | | | |
| Electric Utilities: 2.62% | | | | | | | | | | | | | | |
Great Plains Energy Incorporated | | | | | | | | | 90,880 | | | | 1,840,320 | |
PNM Resources Incorporated « | | | | | | | | | 40,180 | | | | 849,003 | |
Portland General Electric Company | | | | | | | | | 65,580 | | | | 1,772,623 | |
| | | | |
| | | | | | | | | | | | | 4,461,946 | |
| | | | | | | | | | | | | | |
| | | | |
Total Common Stocks (Cost $154,073,059) | | | | | | | | | | | | | 166,347,066 | |
| | | | | | | | | | | | | | |
| | | | |
| | | | | | | | Principal | | | | |
| | | | |
Other: 0.23% | | | | | | | | | | | | | | |
Gryphon Funding Limited, Pass-Through Entity (i)(a)(v) | | | | | | | | $ | 1,189,987 | | | | 392,696 | |
| | | | |
Total Other (Cost $112,749) | | | | | | | | | | | | | 392,696 | |
| | | | | | | | | | | | | | |
| | | | |
| | | Yield | | | | | Shares | | | | |
| | | | |
Short-Term Investments: 35.35% | | | | | | | | | | | | | | |
| | | | |
| Investment Companies: 35.35% | | | | | | | | | | | | | | |
Wells Fargo Advantage Cash Investment Money Market Fund, Select Class (l)(u) | | | 0.16 | % | | | | | 4,320,665 | | | | 4,320,665 | |
Wells Fargo Securities Lending Cash Investments, LLC (v)(l)(u)(r) | | | 0.21 | | | | | | 55,859,005 | | | | 55,859,005 | |
| | | | |
Total Short-Term Investments (Cost $60,179,670) | | | | | | | | | | | | | 60,179,670 | |
| | | | | | | | | | | | | | |
| | | | | | | | |
| Total investments in securities | | | | | | | | |
| (Cost $214,365,478) * | | | 133.31 | % | | | 226,919,432 | |
Other assets and liabilities, net | | | (33.31 | ) | | | (56,698,903 | ) |
| | | | | | | | |
| Total net assets | | | 100.00 | % | | $ | 170,220,529 | |
| | | | | | | | |
| « | All or a portion of this security is on loan. |
| † | Non-income-earning security |
| (a) | Security is fair valued by the Management Valuation Team, and in certain instances by the Board of Trustees, in accordance with procedures approved by the Board of Trustees. |
| (v) | Security represents investment of cash collateral received from securities on loan. |
| (l) | Investment in an affiliate |
| (u) | Rate shown is the 7-day annualized yield at period end. |
| (r) | The investment company is exempt from registration under Section 3(c)(7) of the Investment Company Act of 1940, as amended. |
| * | Cost for federal income tax purposes is $218,409,880 and unrealized appreciation (depreciation) consists of: |
| | | | |
Gross unrealized appreciation | | $ | 17,537,664 | |
Gross unrealized depreciation | | | (9,028,112 | ) |
| | | | |
Net unrealized appreciation | | $ | 8,509,552 | |
The accompanying notes are an integral part of these financial statements.
This page is intentionally left blank.
| | | | |
| 140 | | Wells Fargo Advantage Equity Gateway Funds | | Statements of assets and liabilities—November 30, 2012 (unaudited) |
| | | | | | | | |
| | | C&B Large Cap
Value Portfolio | | | Diversified Large
Cap Growth
Portfolio | |
| | |
Assets | | | | | | | | |
Investments | | | | | | | | |
In unaffiliated securities (including securities on loan), at value (see cost below) | | $ | 314,241,370 | | | $ | 147,623,637 | |
In affiliated securities, at value (see cost below) | | | 56,278,567 | | | | 32,104,781 | |
| | | | | | | | |
Total investments, at value (see cost below) | | | 370,519,937 | | | | 179,728,418 | |
Segregated cash | | | 0 | | | | 0 | |
Foreign currency, at value (see cost below) | | | 0 | | | | 0 | |
Receivable for investments sold | | | 2,574,193 | | | | 304,302 | |
Receivable for dividends | | | 880,848 | | | | 141,469 | |
Receivable for securities lending income | | | 5,066 | | | | 2,773 | |
Prepaid expenses and other assets | | | 3,633 | | | | 2,878 | |
| | | | | | | | |
Total assets | | | 373,983,677 | | | | 180,179,840 | |
| | | | | | | | |
| | |
Liabilities | | | | | | | | |
Payable for investments purchased | | | 341,243 | | | | 304,171 | |
Payable upon receipt of securities loaned | | | 54,606,225 | | | | 30,875,950 | |
Payable for daily variation margin on open futures contracts | | | 0 | | | | 0 | |
Due to custodian bank | | | 0 | | | | 0 | |
Advisory fee payable | | | 172,277 | | | | 9,890 | |
Shareholder report expenses payable | | | 6,073 | | | | 16,239 | |
Custodian and accounting fees payable | | | 7,970 | | | | 5,346 | |
Professional fees payable | | | 3,025 | | | | 4,504 | |
Accrued expenses and other liabilities | | | 526 | | | | 571 | |
| | | | | | | | |
Total liabilities | | | 55,137,339 | | | | 31,216,671 | |
| | | | | | | | |
Total net assets | | $ | 318,846,338 | | | $ | 148,963,169 | |
| | | | | | | | |
| | |
Investments in unaffiliated securities, at cost | | $ | 267,842,365 | | | $ | 125,285,725 | |
| | | | | | | | |
Investments in affiliated securities, at cost | | $ | 56,278,567 | | | $ | 32,104,781 | |
| | | | | | | | |
Total investments, at cost | | $ | 324,120,932 | | | $ | 157,390,506 | |
| | | | | | | | |
Securities on loan, at value | | $ | 53,355,470 | | | $ | 30,222,297 | |
| | | | | | | | |
Foreign currency, at cost | | $ | 0 | | | $ | 0 | |
| | | | | | | | |
The accompanying notes are an integral part of these financial statements.
| | | | | | |
| Statements of assets and liabilities—November 30, 2012 (unaudited) | | Wells Fargo Advantage Equity Gateway Funds | | | 141 | |
| | | | | | | | | | | | | | | | | | | | | | |
Emerging Growth
Portfolio | | | Equity Value
Portfolio | | | Index Portfolio | | | International
Equity Portfolio | | | International
Growth Portfolio | | | International Index
Portfolio | |
| | | | | |
| | | | | | | | | | | | | | | | | | | | | | |
| | | | | | | | | | | | | | | | | | | | | | |
| $ | 912,857,004 | | | $ | 863,969,397 | | | $ | 2,437,600,799 | | | $ | 21,988,461 | | | $ | 110,248,366 | | | $ | 22,117,106 | |
| | 302,158,840 | | | | 66,277,761 | | | | 229,955,859 | | | | 1,404,043 | | | | 8,070,164 | | | | 452,217 | |
| | | | | | | | | | | | | | | | | | | | | | |
| | 1,215,015,844 | | | | 930,247,158 | | | | 2,667,556,658 | | | | 23,392,504 | | | | 118,318,530 | | | | 22,569,323 | |
| | 0 | | | | 0 | | | | 0 | | | | 0 | | | | 0 | | | | 56,719 | |
| | 0 | | | | 0 | | | | 0 | | | | 31,369 | | | | 79,767 | | | | 122,441 | |
| | 6,609,167 | | | | 3,896,665 | | | | 228,975 | | | | 369,648 | | | | 777,960 | | | | 192,076 | |
| | 425,881 | | | | 2,368,567 | | | | 6,750,079 | | | | 34,290 | | | | 185,276 | | | | 83,879 | |
| | 67,960 | | | | 32,604 | | | | 35,543 | | | | 62 | | | | 8,287 | | | | 872 | |
| | 19,566 | | | | 10,694 | | | | 24,257 | | | | 1,352 | | | | 3,749 | | | | 1,631 | |
| | | | | | | | | | | | | | | | | | | | | | |
| | 1,222,138,418 | | | | 936,555,688 | | | | 2,674,595,512 | | | | 23,829,225 | | | | 119,373,569 | | | | 23,026,941 | |
| | | | | | | | | | | | | | | | | | | | | | |
| | | | | |
| | | | | | | | | | | | | | | | | | | | | | |
| | 8,163,459 | | | | 7,207,793 | | | | 3,160,896 | | | | 375,737 | | | | 682,524 | | | | 125,572 | |
| | 288,017,255 | | | | 54,250,075 | | | | 159,683,023 | | | | 1,076,691 | | | | 6,985,505 | | | | 452,217 | |
| | 0 | | | | 0 | | | | 46,445 | | | | 0 | | | | 0 | | | | 725 | |
| | 0 | | | | 0 | | | | 0 | | | | 0 | | | | 0 | | | | 18,080 | |
| | 633,423 | | | | 491,179 | | | | 151,498 | | | | 12,547 | | | | 80,384 | | | | 5,651 | |
| | 6,475 | | | | 15,548 | | | | 2,884 | | | | 8,278 | | | | 2,287 | | | | 986 | |
| | 26,474 | | | | 12,835 | | | | 48,034 | | | | 5,174 | | | | 15,217 | | | | 43,743 | |
| | 0 | | | | 4,740 | | | | 0 | | | | 798 | | | | 784 | | | | 13,853 | |
| | 0 | | | | 4,853 | | | | 0 | | | | 1,026 | | | | 0 | | | | 2,963 | |
| | | | | | | | | | | | | | | | | | | | | | |
| | 296,847,086 | | | | 61,987,023 | | | | 163,092,780 | | | | 1,480,251 | | | | 7,766,701 | | | | 663,790 | |
| | | | | | | | | | | | | | | | | | | | | | |
| $ | 925,291,332 | | | $ | 874,568,665 | | | $ | 2,511,502,732 | | | $ | 22,348,974 | | | $ | 111,606,868 | | | $ | 22,363,151 | |
| | | | | | | | | | | | | | | | | | | | | | |
| | | | | |
| $ | 842,876,465 | | | $ | 772,348,290 | | | $ | 1,896,543,848 | | | $ | 21,945,178 | | | $ | 94,369,009 | | | $ | 20,341,392 | |
| | | | | | | | | | | | | | | | | | | | | | |
| $ | 302,158,840 | | | $ | 66,277,761 | | | $ | 235,028,435 | | | $ | 1,404,043 | | | $ | 8,070,164 | | | $ | 452,217 | |
| | | | | | | | | | | | | | | | | | | | | | |
| $ | 1,145,035,305 | | | $ | 838,626,051 | | | $ | 2,131,572,283 | | | $ | 23,349,221 | | | $ | 102,439,173 | | | $ | 20,793,609 | |
| | | | | | | | | | | | | | | | | | | | | | |
| $ | 281,093,012 | | | $ | 53,033,429 | | | $ | 159,264,483 | | | $ | 1,047,799 | | | $ | 6,818,375 | | | $ | 429,599 | |
| | | | | | | | | | | | | | | | | | | | | | |
| $ | 0 | | | $ | 0 | | | $ | 0 | | | $ | 31,427 | | | $ | 80,082 | | | $ | 121,310 | |
| | | | | | | | | | | | | | | | | | | | | | |
The accompanying notes are an integral part of these financial statements.
| | | | |
| 142 | | Wells Fargo Advantage Equity Gateway Funds | | Statements of assets and liabilities—November 30, 2012 (unaudited) |
| | | | | | | | |
| | | International Value
Portfolio | | | Large Company
Value Portfolio | |
| | |
Assets | | | | | | | | |
Investments | | | | | | | | |
In unaffiliated securities (including securities on loan), at value (see cost below) | | $ | 351,241,847 | | | $ | 46,404,692 | |
In affiliated securities, at value (see cost below) | | | 14,596,984 | | | | 6,071,437 | |
| | | | | | | | |
Total investments, at value (see cost below) | | | 365,838,831 | | | | 52,476,129 | |
Foreign currency, at value (see cost below) | | | 5,519,698 | | | | 0 | |
Receivable for investments sold | | | 336,991 | | | | 262,353 | |
Receivable for dividends | | | 1,338,768 | | | | 158,260 | |
Receivable for securities lending income | | | 9,636 | | | | 670 | |
Prepaid expenses and other assets | | | 9,946 | | | | 2,165 | |
| | | | | | | | |
Total assets | | | 373,053,870 | | | | 52,899,577 | |
| | | | | | | | |
| | |
Liabilities | | | | | | | | |
Payable for investments purchased | | | 70,004 | | | | 0 | |
Payable upon receipt of securities loaned | | | 13,117,922 | | | | 4,019,275 | |
Advisory fee payable | | | 263,355 | | | | 10,741 | |
Shareholder report expenses payable | | | 7,889 | | | | 7,718 | |
Custodian and accounting fees payable | | | 27,010 | | | | 9,921 | |
Professional fees payable | | | 4,789 | | | | 4,128 | |
| | | | | | | | |
Total liabilities | | | 13,490,969 | | | | 4,051,783 | |
| | | | | | | | |
Total net assets | | $ | 359,562,901 | | | $ | 48,847,794 | |
| | | | | | | | |
| | |
Investments in unaffiliated securities, at cost | | $ | 392,800,721 | | | $ | 41,079,366 | |
| | | | | | | | |
Investments in affiliated securities, at cost | | $ | 14,596,984 | | | $ | 6,071,437 | |
| | | | | | | | |
Total investments, at cost | | $ | 407,397,705 | | | $ | 47,150,803 | |
| | | | | | | | |
Securities on loan, at value | | $ | 12,488,034 | | | $ | 3,928,660 | |
| | | | | | | | |
Foreign currency, at cost | | $ | 5,524,646 | | | $ | 0 | |
| | | | | | | | |
The accompanying notes are an integral part of these financial statements.
| | | | | | |
| Statements of assets and liabilities—November 30, 2012 (unaudited) | | Wells Fargo Advantage Equity Gateway Funds | | | 143 | |
| | | | | | | | | | |
Small Cap Value
Portfolio | | | Small Company
Growth Portfolio | | | Small Company
Value Portfolio | |
| | |
| | | | | | | | | | |
| | | | | | | | | | |
| $ | 15,854,105 | | | $ | 128,160,978 | | | $ | 166,739,762 | |
| | 608,030 | | | | 41,516,509 | | | | 60,179,670 | |
| | | | | | | | | | |
| | 16,462,135 | | | | 169,677,487 | | | | 226,919,432 | |
| | 0 | | | | 0 | | | | 0 | |
| | 35,061 | | | | 1,202,228 | | | | 2,456,204 | |
| | 11,770 | | | | 373,812 | | | | 199,873 | |
| | 0 | | | | 7,791 | | | | 9,997 | |
| | 2,507 | | | | 4,005 | | | | 5,949 | |
| | | | | | | | | | |
| | 16,511,473 | | | | 171,265,323 | | | | 229,591,455 | |
| | | | | | | | | | |
| | |
| | | | | | | | | | |
| | 4,222 | | | | 371,731 | | | | 3,275,203 | |
| | 0 | | | | 38,307,239 | | | | 55,971,754 | |
| | 6,285 | | | | 77,448 | | | | 110,560 | |
| | 9,128 | | | | 10,116 | | | | 5,193 | |
| | 3,330 | | | | 5,365 | | | | 8,216 | |
| | 2,989 | | | | 3,592 | | | | 0 | |
| | | | | | | | | | |
| | 25,954 | | | | 38,775,491 | | | | 59,370,926 | |
| | | | | | | | | | |
| $ | 16,485,519 | | | $ | 132,489,832 | | | $ | 170,220,529 | |
| | | | | | | | | | |
| | |
| $ | 10,886,200 | | | $ | 110,729,389 | | | $ | 154,185,808 | |
| | | | | | | | | | |
| $ | 608,030 | | | $ | 41,516,509 | | | $ | 60,179,670 | |
| | | | | | | | | | |
| $ | 11,494,230 | | | $ | 152,245,898 | | | $ | 214,365,478 | |
| | | | | | | | | | |
| $ | 0 | | | $ | 37,261,537 | | | $ | 54,329,713 | |
| | | | | | | | | | |
| $ | 0 | | | $ | 0 | | | $ | 0 | |
| | | | | | | | | | |
The accompanying notes are an integral part of these financial statements.
| | | | |
| 144 | | Wells Fargo Advantage Equity Gateway Funds | | Statements of operations—six months ended November 30, 2012 (unaudited) |
| | | | | | | | |
| | | C&B Large Cap
Value Portfolio | | | Diversified Large
Cap Growth
Portfolio | |
| | |
Investment income | | | | | | | | |
Dividends * | | $ | 4,422,672 | | | $ | 723,968 | |
Securities lending income, net | | | 34,742 | | | | 21,799 | |
Income from affiliated securities | | | 3,892 | | | | 2,864 | |
Interest | | | 0 | | | | 0 | |
| | | | | | | | |
Total investment income | | | 4,461,306 | | | | 748,631 | |
| | | | | | | | |
| | |
Expenses | | | | | | | | |
Advisory fee | | | 1,085,831 | | | | 500,408 | |
Custody and accounting fees | | | 12,834 | | | | 12,168 | |
Professional fees | | | 15,723 | | | | 17,412 | |
Shareholder report expenses | | | 3,215 | | | | 6,096 | |
Trustees’ fees and expenses | | | 5,639 | | | | 5,330 | |
Other fees and expenses | | | 5,962 | | | | 3,858 | |
| | | | | | | | |
Total expenses | | | 1,129,204 | | | | 545,272 | |
Less: Fee waivers and/or expense reimbursements | | | 0 | | | | (66,296 | ) |
| | | | | | | | |
Net expenses | | | 1,129,204 | | | | 478,976 | |
| | | | | | | | |
Net investment income (loss) | | | 3,332,102 | | | | 269,655 | |
| | | | | | | | |
| | |
REALIZED AND UNREALIZED GAINS (LOSSES) ON INVESTMENTS | | | | | | | | |
| | |
Net realized gains (losses) on: | | | | | | | | |
Unaffiliated securities | | | 8,138,075 | | | | 5,955,510 | |
Affiliated securities | | | 0 | | | | 0 | |
Futures transactions | | | 0 | | | | 0 | |
| | | | | | | | |
Net realized gain (losses) on investments | | | 8,138,075 | | | | 5,955,510 | |
| | | | | | | | |
| | |
Net change in unrealized gains (losses) on: | | | | | | | | |
Unaffiliated securities | | | 10,511,841 | | | | 4,673,812 | |
Affiliated securities | | | 0 | | | | 0 | |
Futures transactions | | | 0 | | | | 0 | |
| | | | | | | | |
Net change in unrealized gains (losses) on investments | | | 10,511,841 | | | | 4,673,812 | |
| | | | | | | | |
Net realized and unrealized gains (losses) on investments | | | 18,649,916 | | | | 10,629,322 | |
| | | | | | | | |
Net increase in net assets resulting from operations | | $ | 21,982,018 | | | $ | 10,898,977 | |
| | | | | | | | |
| | |
* Net of foreign dividend withholding taxes in the amount of | | | $10,951 | | | | $0 | |
The accompanying notes are an integral part of these financial statements.
| | | | | | |
| Statements of operations—six months ended November 30, 2012 (unaudited) | | Wells Fargo Advantage Equity Gateway Funds | | | 145 | |
| | | | | | | | | | | | | | | | | | | | | | |
Emerging Growth
Portfolio | | | Equity Value
Portfolio | | | Index Portfolio | | | International
Equity Portfolio | | | International
Growth Portfolio | | | International Index
Portfolio | |
| | | | | |
| | | | | | | | | | | | | | | | | | | | | | |
| $ | 1,234,732 | | | $ | 11,626,547 | | | $ | 28,674,889 | | | $ | 278,824 | | | $ | 992,353 | | | $ | 286,318 | |
| | 630,528 | | | | 100,517 | | | | 189,295 | | | | 16,031 | | | | 26,343 | | | | 9,673 | |
| | 20,389 | | | | 9,963 | | | | 23,948 | | | | 553 | | | | 1,270 | | | | 97 | |
| | 0 | | | | 0 | | | | 1,227 | | | | 0 | | | | 0 | | | | 62 | |
| | | | | | | | | | | | | | | | | | | | | | |
| | 1,885,649 | | | | 11,737,027 | | | | 28,889,359 | | | | 295,408 | | | | 1,019,966 | | | | 296,150 | |
| | | | | | | | | | | | | | | | | | | | | | |
| | | | | |
| | | | | | | | | | | | | | | | | | | | | | |
| | 4,001,516 | | | | 3,207,890 | | | | 1,073,585 | | | | 97,880 | | | | 480,743 | | | | 40,547 | |
| | 26,807 | | | | 34,090 | | | | 72,106 | | | | 21,609 | | | | 52,951 | | | | 46,864 | |
| | 14,967 | | | | 13,792 | | | | 14,861 | | | | 21,852 | | | | 22,052 | | | | 19,795 | |
| | 44 | | | | 8,854 | | | | 2,860 | | | | 3,049 | | | | 1,158 | | | | 500 | |
| | 5,554 | | | | 4,586 | | | | 5,937 | | | | 6,364 | | | | 6,209 | | | | 6,000 | |
| | 10,356 | | | | 11,497 | | | | 30,989 | | | | 10,592 | | | | 8,316 | | | | 13,300 | |
| | | | | | | | | | | | | | | | | | | | | | |
| | 4,059,244 | | | | 3,280,709 | | | | 1,200,338 | | | | 161,346 | | | | 571,429 | | | | 127,006 | |
| | 0 | | | | 0 | | | | 0 | | | | (3,681 | ) | | | 0 | | | | (82,550 | ) |
| | | | | | | | | | | | | | | | | | | | | | |
| | 4,059,244 | | | | 3,280,709 | | | | 1,200,338 | | | | 157,665 | | | | 571,429 | | | | 44,456 | |
| | | | | | | | | | | | | | | | | | | | | | |
| | (2,173,595 | ) | | | 8,456,318 | | | | 27,689,021 | | | | 137,743 | | | | 448,537 | | | | 251,694 | |
| | | | | | | | | | | | | | | | | | | | | | |
| | | | | |
| | | | | | | | | | | | | | | | | | | | | | |
| | | | | |
| | | | | | | | | | | | | | | | | | | | | | |
| | (797,899 | ) | | | 58,679,308 | | | | 16,762,715 | | | | (1,002,622 | ) | | | 1,430,375 | | | | 73,839 | |
| | 0 | | | | 0 | | | | 99,964 | | | | 0 | | | | 0 | | | | 0 | |
| | 0 | | | | 0 | | | | 1,203,623 | | | | 0 | | | | 0 | | | | (630 | ) |
| | | | | | | | | | | | | | | | | | | | | | |
| | (797,899 | ) | | | 58,679,308 | | | | 18,066,302 | | | | (1,002,622 | ) | | | 1,430,375 | | | | 73,209 | |
| | | | | | | | | | | | | | | | | | | | | | |
| | | | | |
| | | | | | | | | | | | | | | | | | | | | | |
| | 18,194,585 | | | | 40,745,358 | | | | 169,262,372 | | | | 3,765,667 | | | | 15,357,500 | | | | 3,385,228 | |
| | 0 | | | | 0 | | | | 1,030,931 | | | | 0 | | | | 0 | | | | 0 | |
| | 0 | | | | 0 | | | | 1,852,223 | | | | 0 | | | | 0 | | | | 90,369 | |
| | | | | | | | | | | | | | | | | | | | | | |
| | 18,194,585 | | | | 40,745,358 | | | | 172,145,526 | | | | 3,765,667 | | | | 15,357,500 | | | | 3,475,597 | |
| | | | | | | | | | | | | | | | | | | | | | |
| | 17,396,686 | | | | 99,424,666 | | | | 190,211,828 | | | | 2,763,045 | | | | 16,787,875 | | | | 3,548,806 | |
| | | | | | | | | | | | | | | | | | | | | | |
| $ | 15,223,091 | | | $ | 107,880,984 | | | $ | 217,900,849 | | | $ | 2,900,788 | | | $ | 17,236,412 | | | $ | 3,800,500 | |
| | | | | | | | | | | | | | | | | | | | | | |
| | | | | |
| | $4,308 | | | | $120,580 | | | | $31,372 | | | | $24,092 | | | | $63,091 | | | | $16,393 | |
The accompanying notes are an integral part of these financial statements.
| | | | |
| 146 | | Wells Fargo Advantage Equity Gateway Funds | | Statements of operations—six months ended November 30, 2012 (unaudited) |
| | | | | | | | |
| | | International Value
Portfolio | | | Large Company
Value Portfolio | |
| | |
Investment income | | | | | | | | |
Dividends * | | $ | 4,477,633 | | | $ | 681,081 | |
Securities lending income, net | | | 171,830 | | | | 2,540 | |
Income from affiliated securities | | | 3,669 | | | | 1,064 | |
Interest | | | 1,948 | | | | 0 | |
| | | | | | | | |
Total investment income | | | 4,655,080 | | | | 684,685 | |
| | | | | | | | |
| | |
Expenses | | | | | | | | |
Advisory fee | | | 1,395,246 | | | | 167,310 | |
Custody and accounting fees | | | 39,889 | | | | 7,114 | |
Professional fees | | | 17,769 | | | | 17,791 | |
Shareholder report expenses | | | 3,868 | | | | 3,191 | |
Trustees’ fees and expenses | | | 6,320 | | | | 5,898 | |
Other fees and expenses | | | 15,542 | | | | 2,018 | |
| | | | | | | | |
Total expenses | | | 1,478,634 | | | | 203,322 | |
Less: Fee waivers and/or expense reimbursements | | | 0 | | | | (13,258 | ) |
| | | | | | | | |
Net expenses | | | 1,478,634 | | | | 190,064 | |
| | | | | | | | |
Net investment income | | | 3,176,446 | | | | 494,621 | |
| | | | | | | | |
| | |
REALIZED AND UNREALIZED GAINS (LOSSES) ON INVESTMENTS | | | | | | | | |
Net realized gain (losses) on investments | | | (2,196,456 | ) | | | 2,105,222 | |
Net change in unrealized gains (losses) on investments | | | 48,749,844 | | | | 1,500,178 | |
| | | | | | | | |
Net realized and unrealized gains (losses) on investments | | | 46,553,388 | | | | 3,605,400 | |
| | | | | | | | |
Net increase in net assets resulting from operations | | $ | 49,729,834 | | | $ | 4,100,021 | |
| | | | | | | | |
| | |
* Net of foreign dividend withholding taxes in the amount of | | | $292,144 | | | | $1,111 | |
The accompanying notes are an integral part of these financial statements.
| | | | | | |
| Statements of operations—six months ended November 30, 2012 (unaudited) | | Wells Fargo Advantage Equity Gateway Funds | | | 147 | |
| | | | | | | | | | |
Small Cap Value
Portfolio | | | Small Company
Growth Portfolio | | | Small Company
Value Portfolio | |
| | |
| | | | | | | | | | |
| $ | 324,069 | | | $ | 668,169 | | | $ | 1,382,218 | |
| | 0 | | | | 20,958 | | | | 70,872 | |
| | 2,116 | | | | 4,396 | | | | 4,200 | |
| | 0 | | | | 0 | | | | 0 | |
| | | | | | | | | | |
| | 326,185 | | | | 693,523 | | | | 1,457,290 | |
| | | | | | | | | | |
| | |
| | | | | | | | | | |
| | 169,336 | | | | 640,815 | | | | 797,538 | |
| | 7,680 | | | | 11,501 | | | | 13,518 | |
| | 16,530 | | | | 16,856 | | | | 16,580 | |
| | 3,186 | | | | 4,098 | | | | 2,146 | |
| | 6,251 | | | | 6,233 | | | | 6,066 | |
| | 2,821 | | | | 6,061 | | | | 6,190 | |
| | | | | | | | | | |
| | 205,804 | | | | 685,564 | | | | 842,038 | |
| | (12,041 | ) | | | (79 | ) | | | 0 | |
| | | | | | | | | | |
| | 193,763 | | | | 685,485 | | | | 842,038 | |
| | | | | | | | | | |
| | 132,422 | | | | 8,038 | | | | 615,252 | |
| | | | | | | | | | |
| | |
| | | | | | | | | | |
| | 3,788,147 | | | | 5,166,264 | | | | 5,485,956 | |
| | 1,495,116 | | | | 6,566,887 | | | | 7,055,601 | |
| | | | | | | | | | |
| | 5,283,263 | | | | 11,733,151 | | | | 12,541,557 | |
| | | | | | | | | | |
| $ | 5,415,685 | | | $ | 11,741,189 | | | $ | 13,156,809 | |
| | | | | | | | | | |
| | |
| | $1,499 | | | | $2,217 | | | | $0 | |
The accompanying notes are an integral part of these financial statements.
| | | | |
| 148 | | Wells Fargo Advantage Equity Gateway Funds | | Statements of changes in net assets |
| | | | | | | | |
| | | C&B Large Cap Value Portfolio | |
| | | Six months ended
November 30, 2012
(Unaudited) | | | Year ended
May 31, 2012 | |
| | |
Operations | | | | | | | | |
Net investment income | | $ | 3,332,102 | | | $ | 6,573,718 | |
Net realized gains on investments | | | 8,138,075 | | | | 15,269,192 | |
Net change in unrealized gains (losses) on investments | | | 10,511,841 | | | | (40,212,230 | ) |
| | | | | | | | |
Net increase (decrease) in net assets resulting from operations | | | 21,982,018 | | | | (18,369,320 | ) |
| | | | | | | | |
| | |
Capital share transactions | | | | | | | | |
Transactions in investors’ beneficial interests | | | | | | | | |
Contributions | | | 3,176,458 | | | | 14,806,365 | |
Withdrawals | | | (31,235,254 | ) | | | (95,014,836 | ) |
| | | | | | | | |
Net decrease in net assets resulting from capital share transactions | | | (28,058,796 | ) | | | (80,208,471 | ) |
| | | | | | | | |
Total decrease in net assets | | | (6,076,778 | ) | | | (98,577,791 | ) |
| | | | | | | | |
| | |
Net assets | | | | | | | | |
Beginning of period | | | 324,923,116 | | | | 423,500,907 | |
| | | | | | | | |
End of period | | $ | 318,846,338 | | | $ | 324,923,116 | |
| | | | | | | | |
The accompanying notes are an integral part of these financial statements.
| | | | | | |
| Statements of changes in net assets | | Wells Fargo Advantage Equity Gateway Funds | | | 149 | |
| | | | | | | | |
| | | Diversified Large Cap Growth Portfolio | |
| | | Six months ended
November 30, 2012
(unaudited) | | | Year ended
May 31, 2012 | |
| | |
Operations | | | | | | | | |
Net investment income | | $ | 269,655 | | | $ | 425,590 | |
Net realized gains on investments | | | 5,955,510 | | | | 5,356,234 | |
Net change in unrealized gains (losses) on investments | | | 4,673,812 | | | | (3,329,475 | ) |
| | | | | | | | |
Net increase in net assets resulting from operations | | | 10,898,977 | | | | 2,452,349 | |
| | | | | | | | |
| | |
Capital share transactions | | | | | | | | |
Transactions in investors’ beneficial interests | | | | | | | | |
Contributions | | | 3,076,744 | | | | 7,386,835 | |
Withdrawals | | | (23,170,833 | ) | | | (52,938,016 | ) |
| | | | | | | | |
Net decrease in net assets resulting from capital share transactions | | | (20,094,089 | ) | | | (45,551,181 | ) |
| | | | | | | | |
Total decrease in net assets | | | (9,195,112 | ) | | | (43,098,832 | ) |
| | | | | | | | |
| | |
Net assets | | | | | | | | |
Beginning of period | | | 158,158,281 | | | | 201,257,113 | |
| | | | | | | | |
End of period | | $ | 148,963,169 | | | $ | 158,158,281 | |
| | | | | | | | |
The accompanying notes are an integral part of these financial statements.
| | | | |
| 150 | | Wells Fargo Advantage Equity Gateway Funds | | Statements of changes in net assets |
| | | | | | | | |
| | | Emerging Growth Portfolio | |
| | | Six months ended November 30, 2012
(Unaudited) | | | Year ended
May 31, 2012 | |
| | |
Operations | | | | | | | | |
Net investment loss | | $ | (2,173,595 | ) | | $ | (4,480,439 | ) |
Net realized gains (losses) on investments | | | (797,899 | ) | | | 45,606,364 | |
Net change in unrealized gains (losses) on investments | | | 18,194,585 | | | | 106,939,881 | |
| | | | | | | | |
Net increase in net assets resulting from operations | | | 15,223,091 | | | | 148,065,806 | |
| | | | | | | | |
| | |
Capital share transactions | | | | | | | | |
Transactions in investors’ beneficial interests | | | | | | | | |
Contributions | | | 27,508,922 | | | | 1,103,202,835 | |
Withdrawals | | | (116,332,787 | ) | | | (336,929,676 | ) |
| | | | | | | | |
Net increase (decrease) in net assets resulting from capital share transactions | | | (88,823,865 | ) | | | 766,273,159 | |
| | | | | | | | |
Total increase (decrease) in net assets | | | (73,600,774 | ) | | | 914,338,965 | |
| | | | | | | | |
| | |
Net assets | | | | | | | | |
Beginning of period | | | 998,892,106 | | | | 84,553,141 | |
| | | | | | | | |
End of period | | $ | 925,291,332 | | | $ | 998,892,106 | |
| | | | | | | | |
The accompanying notes are an integral part of these financial statements.
| | | | | | |
| Statements of changes in net assets | | Wells Fargo Advantage Equity Gateway Funds | | | 151 | |
| | | | | | | | |
| | | Equity Value Portfolio | |
| | | Six months ended November 30, 2012
(Unaudited) | | | Year ended
May 31, 2012 | |
| | |
Operations | | | | | | | | |
Net investment income | | $ | 8,456,318 | | | $ | 14,011,353 | |
Net realized gains on investments | | | 58,679,308 | | | | 23,330,597 | |
Net change in unrealized gains (losses) on investments | | | 40,745,358 | | | | (18,260,356 | ) |
| | | | | | | | |
Net increase in net assets resulting from operations | | | 107,880,984 | | | | 19,081,594 | |
| | | | | | | | |
| | |
Capital share transactions | | | | | | | | |
Transactions in investors’ beneficial interests | | | | | | | | |
Contributions | | | 3,778,099 | | | | 698,898,834 | |
Withdrawals | | | (231,323,662 | ) | | | (145,361,854 | ) |
| | | | | | | | |
Net increase (decrease) in net assets resulting from capital share transactions | | | (227,545,563 | ) | | | 553,536,980 | |
| | | | | | | | |
Total increase (decrease) in net assets | | | (119,664,579 | ) | | | 572,618,574 | |
| | | | | | | | |
| | |
Net assets | | | | | | | | |
Beginning of period | | | 994,233,244 | | | | 421,614,670 | |
| | | | | | | | |
End of period | | $ | 874,568,665 | | | $ | 994,233,244 | |
| | | | | | | | |
The accompanying notes are an integral part of these financial statements.
| | | | |
| 152 | | Wells Fargo Advantage Equity Gateway Funds | | Statements of changes in net assets |
| | | | | | | | |
| | | Index Portfolio | |
| | | Six months ended
November 30, 2012
(Unaudited) | | | Year ended
May 31, 2012 | |
| | |
Operations | | | | | | | | |
Net investment income | | $ | 27,689,021 | | | $ | 50,245,701 | |
Net realized gains on investments | | | 18,066,302 | | | | 44,324,406 | |
Net change in unrealized gains (losses) on investments | | | 172,145,526 | | | | (109,116,550 | ) |
| | | | | | | | |
Net increase (decrease) in net assets resulting from operations | | | 217,900,849 | | | | (14,546,443 | ) |
| | | | | | | | |
| | |
Capital share transactions | | | | | | | | |
Transactions in investors’ beneficial interests | | | | | | | | |
Contributions | | | 42,591,618 | | | | 170,958,274 | |
Withdrawals | | | (132,488,463 | ) | | | (304,471,072 | ) |
| | | | | | | | |
Net decrease in net assets resulting from capital share transactions | | | (89,896,845 | ) | | | (133,512,798 | ) |
| | | | | | | | |
Total increase (decrease) in net assets | | | 128,004,004 | | | | (148,059,241 | ) |
| | | | | | | | |
| | |
Net assets | | | | | | | | |
Beginning of period | | | 2,383,498,728 | | | | 2,531,557,969 | |
| | | | | | | | |
End of period | | $ | 2,511,502,732 | | | $ | 2,383,498,728 | |
| | | | | | | | |
The accompanying notes are an integral part of these financial statements.
| | | | | | |
| Statements of changes in net assets | | Wells Fargo Advantage Equity Gateway Funds | | | 153 | |
| | | | | | | | |
| | | International Equity Portfolio | |
| | | Six months ended
November 30, 2012
(unaudited) | | | Year ended
May 31, 2012 | |
| | |
Operations | | | | | | | | |
Net investment income | | $ | 137,743 | | | $ | 464,140 | |
Net realized gains (losses) on investments | | | (1,002,622 | ) | | | 906,587 | |
Net change in unrealized gains (losses) on investments | | | 3,765,667 | | | | (7,789,823 | ) |
| | | | | | | | |
Net increase (decrease) in net assets resulting from operations | | | 2,900,788 | | | | (6,419,096 | ) |
| | | | | | | | |
| | |
Capital share transactions | | | | | | | | |
Transactions in investors’ beneficial interests | | | | | | | | |
Contributions | | | 701,829 | | | | 3,501,335 | |
Withdrawals | | | (4,319,848 | ) | | | (3,989,591 | ) |
| | | | | | | | |
Net decrease in net assets resulting from capital share transactions | | | (3,618,019 | ) | | | (488,256 | ) |
| | | | | | | | |
Total decrease in net assets | | | (717,231 | ) | | | (6,907,352 | ) |
| | | | | | | | |
| | |
Net assets | | | | | | | | |
Beginning of period | | | 23,066,205 | | | | 29,973,557 | |
| | | | | | | | |
End of period | | $ | 22,348,974 | | | $ | 23,066,205 | |
| | | | | | | | |
The accompanying notes are an integral part of these financial statements.
| | | | |
| 154 | | Wells Fargo Advantage Equity Gateway Funds | | Statements of changes in net assets |
| | | | | | | | |
| | | International Growth Portfolio | |
| | | Six months ended
November 30, 2012
(Unaudited) | | | Year ended
May 31, 2012 | |
| | |
Operations | | | | | | | | |
Net investment income | | $ | 448,537 | | | $ | 2,321,731 | |
Net realized gains on investments | | | 1,430,375 | | | | 5,754,758 | |
Net change in unrealized gains (losses) on investments | | | 15,357,500 | | | | (18,816,975 | ) |
| | | | | | | | |
Net increase (decrease) in net assets resulting from operations | | | 17,236,412 | | | | (10,740,486 | ) |
| | | | | | | | |
| | |
Capital share transactions | | | | | | | | |
Transactions in investors’ beneficial interests | | | | | | | | |
Contributions | | | 1,582,502 | | | | 19,315,418 | |
Withdrawals | | | (15,733,513 | ) | | | (28,198,788 | ) |
| | | | | | | | |
Net decrease in net assets resulting from capital share transactions | | | (14,151,011 | ) | | | (8,883,370 | ) |
| | | | | | | | |
Total increase (decrease) in net assets | | | 3,085,401 | | | | (19,623,856 | ) |
| | | | | | | | |
| | |
Net assets | | | | | | | | |
Beginning of period | | | 108,521,467 | | | | 128,145,323 | |
| | | | | | | | |
End of period | | $ | 111,606,868 | | | $ | 108,521,467 | |
| | | | | | | | |
The accompanying notes are an integral part of these financial statements.
| | | | | | |
| Statements of changes in net assets | | Wells Fargo Advantage Equity Gateway Funds | | | 155 | |
| | | | | | | | |
| | | International Index Portfolio | |
| | | Six months ended
November 30, 2012
(unaudited) | | | Year ended
May 31, 2012 | |
| | |
Operations | | | | | | | | |
Net investment income | | $ | 251,694 | | | $ | 985,385 | |
Net realized gains (losses) on investments | | | 73,209 | | | | (722,501 | ) |
Net change in unrealized gains (losses) on investments | | | 3,475,597 | | | | (6,151,041 | ) |
| | | | | | | | |
Net increase (decrease) in net assets resulting from operations | | | 3,800,500 | | | | (5,888,157 | ) |
| | | | | | | | |
| | |
Capital share transactions | | | | | | | | |
Transactions in investors’ beneficial interests | | | | | | | | |
Contributions | | | 391,968 | | | | 3,459,407 | |
Withdrawals | | | (5,095,751 | ) | | | (4,306,369 | ) |
| | | | | | | | |
Net decrease in net assets resulting from capital share transactions | | | (4,703,783 | ) | | | (846,962 | ) |
| | | | | | | | |
Total decrease in net assets | | | (903,283 | ) | | | (6,735,119 | ) |
| | | | | | | | |
| | |
Net assets | | | | | | | | |
Beginning of period | | | 23,266,434 | | | | 30,001,553 | |
| | | | | | | | |
End of period | | $ | 22,363,151 | | | $ | 23,266,434 | |
| | | | | | | | |
The accompanying notes are an integral part of these financial statements.
| | | | |
| 156 | | Wells Fargo Advantage Equity Gateway Funds | | Statements of changes in net assets |
| | | | | | | | |
| | | International Value Portfolio | |
| | | Six months ended
November 30, 2012
(unaudited) | | | Year ended
May 31, 2012 | |
| | |
Operations | | | | | | | | |
Net investment income | | $ | 3,176,446 | | | $ | 10,731,272 | |
Net realized losses on investments | | | (2,196,456 | ) | | | (2,485,463 | ) |
Net change in unrealized gains (losses) on investments | | | 48,749,844 | | | | (82,848,290 | ) |
| | | | | | | | |
Net increase (decrease) in net assets resulting from operations | | | 49,729,834 | | | | (74,602,481 | ) |
| | | | | | | | |
| | |
Capital share transactions | | | | | | | | |
Transactions in investors’ beneficial interests | | | | | | | | |
Contributions | | | 40,144,436 | | | | 24,184,061 | |
Withdrawals | | | (19,602,749 | ) | | | (12,254,871 | ) |
| | | | | | | | |
Net increase in net assets resulting from capital share transactions | | | 20,541,687 | | | | 11,929,190 | |
| | | | | | | | |
Total increase (decrease) in net assets | | | 70,271,521 | | | | (62,673,291 | ) |
| | | | | | | | |
| | |
Net assets | | | | | | | | |
Beginning of period | | | 289,291,380 | | | | 351,964,671 | |
| | | | | | | | |
End of period | | $ | 359,562,901 | | | $ | 289,291,380 | |
| | | | | | | | |
The accompanying notes are an integral part of these financial statements.
| | | | | | |
| Statements of changes in net assets | | Wells Fargo Advantage Equity Gateway Funds | | | 157 | |
| | | | | | | | |
| | | Large Company Value Portfolio | |
| | | Six months ended
November 30, 2012
(unaudited) | | | Year ended
May 31, 2012 | |
| | |
Operations | | | | | | | | |
Net investment income | | $ | 494,621 | | | $ | 975,071 | |
Net realized gains on investments | | | 2,105,222 | | | | 1,843,881 | |
Net change in unrealized gains (losses) on investments | | | 1,500,178 | | | | (6,856,974 | ) |
| | | | | | | | |
Net increase (decrease) in net assets resulting from operations | | | 4,100,021 | | | | (4,038,022 | ) |
| | | | | | | | |
| | |
Capital share transactions | | | | | | | | |
Transactions in investors’ beneficial interests | | | | | | | | |
Contributions | | | 652,885 | | | | 1,638,219 | |
Withdrawals | | | (8,785,261 | ) | | | (11,556,144 | ) |
| | | | | | | | |
Net decrease in net assets resulting from capital share transactions | | | (8,132,376 | ) | | | (9,917,925 | ) |
| | | | | | | | |
Total decrease in net assets | | | (4,032,355 | ) | | | (13,955,947 | ) |
| | | | | | | | |
| | |
Net assets | | | | | | | | |
Beginning of period | | | 52,880,149 | | | | 66,836,096 | |
| | | | | | | | |
End of period | | $ | 48,847,794 | | | $ | 52,880,149 | |
| | | | | | | | |
The accompanying notes are an integral part of these financial statements.
| | | | |
| 158 | | Wells Fargo Advantage Equity Gateway Funds | | Statements of changes in net assets |
| | | | | | | | |
| | | Small Cap Value Portfolio | |
| | | Six months ended
November 30, 2012
(unaudited) | | | Year ended
May 31, 2012 | |
| | |
Operations | | | | | | | | |
Net investment income | | $ | 132,422 | | | $ | 492,526 | |
Net realized gains (losses) on investments | | | 3,788,147 | | | | (320,184 | ) |
Net change in unrealized gains (losses) on investments | | | 1,495,116 | | | | (4,255,368 | ) |
| | | | | | | | |
Net increase (decrease) in net assets resulting from operations | | | 5,415,685 | | | | (4,083,026 | ) |
| | | | | | | | |
| | |
Capital share transactions | | | | | | | | |
Transactions in investors’ beneficial interests | | | | | | | | |
Contributions | | | 570,705 | | | | 6,335,077 | |
Withdrawals | | | (37,608,679 | ) | | | (9,458,467 | ) |
| | | | | | | | |
Net decrease in net assets resulting from capital share transactions | | | (37,037,974 | ) | | | (3,123,390 | ) |
| | | | | | | | |
Total decrease in net assets | | | (31,622,289 | ) | | | (7,206,416 | ) |
| | | | | | | | |
| | |
Net assets | | | | | | | | |
Beginning of period | | | 48,107,808 | | | | 55,314,224 | |
| | | | | | | | |
End of period | | $ | 16,485,519 | | | $ | 48,107,808 | |
| | | | | | | | |
The accompanying notes are an integral part of these financial statements.
| | | | | | |
| Statements of changes in net assets | | Wells Fargo Advantage Equity Gateway Funds | | | 159 | |
| | | | | | | | |
| | | Small Company Growth Portfolio | |
| | | Six months ended
November 30, 2012
(unaudited) | | | Year ended
May 31, 2012 | |
| | |
Operations | | | | | | | | |
Net investment income (loss) | | $ | 8,038 | | | $ | (317,924 | ) |
Net realized gains on investments | | | 5,166,264 | | | | 43,682,880 | |
Net change in unrealized gains (losses) on investments | | | 6,566,887 | | | | (74,305,951 | ) |
| | | | | | | | |
Net increase (decrease) in net assets resulting from operations | | | 11,741,189 | | | | (30,940,995 | ) |
| | | | | | | | |
| | |
Capital share transactions | | | | | | | | |
Transactions in investors’ beneficial interests | | | | | | | | |
Contributions | | | 5,021,405 | | | | 13,211,256 | |
Withdrawals | | | (47,232,223 | ) | | | (154,050,686 | ) |
| | | | | | | | |
Net decrease in net assets resulting from capital share transactions | | | (42,210,818 | ) | | | (140,839,430 | ) |
| | | | | | | | |
Total decrease in net assets | | | (30,469,629 | ) | | | (171,780,425 | ) |
| | | | | | | | |
| | |
Net assets | | | | | | | | |
Beginning of period | | | 162,959,461 | | | | 334,739,886 | |
| | | | | | | | |
End of period | | $ | 132,489,832 | | | $ | 162,959,461 | |
| | | | | | | | |
The accompanying notes are an integral part of these financial statements.
| | | | |
| 160 | | Wells Fargo Advantage Equity Gateway Funds | | Statements of changes in net assets |
| | | | | | | | |
| | | Small Company Value Portfolio | |
| | | Six months ended
November 30, 2012
(unaudited) | | | Year ended
May 31, 2012 | |
| | |
Operations | | | | | | | | |
Net investment income | | $ | 615,252 | | | $ | 1,415,963 | |
Net realized gains on investments | | | 5,485,956 | | | | 19,382,594 | |
Net change in unrealized gains (losses) on investments | | | 7,055,601 | | | | (37,231,687 | ) |
| | | | | | | | |
Net increase (decrease) in net assets resulting from operations | | | 13,156,809 | | | | (16,433,130 | ) |
| | | | | | | | |
| | |
Capital share transactions | | | | | | | | |
Transactions in investors’ beneficial interests | | | | | | | | |
Contributions | | | 9,312,841 | | | | 25,377,194 | |
Withdrawals | | | (51,511,547 | ) | | | (46,438,479 | ) |
| | | | | | | | |
Net decrease in net assets resulting from capital share transactions | | | (42,198,706 | ) | | | (21,061,285 | ) |
| | | | | | | | |
Total decrease in net assets | | | (29,041,897 | ) | | | (37,494,415 | ) |
| | | | | | | | |
| | |
Net assets | | | | | | | | |
Beginning of period | | | 199,262,426 | | | | 236,756,841 | |
| | | | | | | | |
End of period | | $ | 170,220,529 | | | $ | 199,262,426 | |
| | | | | | | | |
The accompanying notes are an integral part of these financial statements.
| | | | | | |
| Financial highlights | | Wells Fargo Advantage Equity Gateway Funds | | | 161 | |
| | | | | | | | | | | | | | | | | | | | |
| | | Ratio to average net assets (annualized) | | | Total
return1 | | | Portfolio turnover rate | |
| | | Net investment
income (loss) | | | Gross
expenses | | | Net
expenses | | | |
| | | | | |
C&B Large Cap Value Portfolio | | | | | | | | | | | | | | | | | | | | |
June 1, 2012 to November 30, 2012 (unaudited) | | | 1.99 | % | | | 0.68 | % | | | 0.68 | % | | | 6.87 | % | | | 6 | % |
June 1, 2011 to May 31, 2012 | | | 1.81 | % | | | 0.68 | % | | | 0.68 | % | | | (4.61 | )% | | | 21 | % |
October 1, 2010 to May 31, 20112 | | | 1.27 | % | | | 0.67 | % | | | 0.67 | % | | | 18.08 | % | | | 17 | % |
October 1, 2009 to September 30, 2010 | | | 1.40 | % | | | 0.70 | % | | | 0.68 | % | | | 7.49 | % | | | 13 | % |
October 1, 2008 to September 30, 2009 | | | 2.19 | % | | | 0.73 | % | | | 0.64 | % | | | (5.53 | )% | | | 28 | % |
October 1, 2007 to September 30, 2008 | | | 1.71 | % | | | 0.73 | % | | | 0.68 | % | | | (20.18 | )% | | | 21 | % |
October 1, 2006 to September 30, 2007 | | | 1.48 | % | | | 0.74 | % | | | 0.68 | % | | | 11.88 | % | | | 24 | % |
| | | | | |
Diversified Large Cap Growth Portfolio | | | | | | | | | | | | | | | | | | | | |
June 1, 2012 to November 30, 2012 (unaudited) | | | 0.35 | % | | | 0.71 | % | | | 0.62 | % | | | 7.50 | % | | | 29 | % |
June 1, 2011 to May 31, 2012 | | | 0.24 | % | | | 0.71 | % | | | 0.62 | % | | | 1.26 | % | | | 79 | % |
October 1, 2010 to May 31, 20112,3 | | | 0.40 | % | | | 0.69 | % | | | 0.62 | % | | | 22.78 | % | | | 101 | % |
October 1, 2009 to September 30, 20103 | | | 0.66 | % | | | 0.70 | % | | | 0.62 | % | | | 7.51 | % | | | 11 | % |
October 1, 2008 to September 30, 20093 | | | 0.97 | % | | | 0.70 | % | | | 0.62 | % | | | 3.31 | % | | | 13 | % |
October 1, 2007 to September 30, 20083 | | | 0.48 | % | | | 0.68 | % | | | 0.67 | % | | | (22.59 | )% | | | 7 | % |
October 1, 2006 to September 30, 20073 | | | 0.46 | % | | | 0.70 | % | | | 0.68 | % | | | 17.80 | % | | | 10 | % |
| | | | | |
Emerging Growth Portfolio | | | | | | | | | | | | | | | | | | | | |
June 1, 2012 to November 30, 2012 (unaudited) | | | (0.43 | )% | | | 0.80 | % | | | 0.80 | % | | | 1.25 | % | | | 32 | % |
June 1, 2011 to May 31, 2012 | | | (0.57 | )% | | | 0.80 | % | | | 0.80 | % | | | (4.83 | )% | | | 75 | % |
October 1, 2010 to May 31, 20112 | | | (0.77 | )% | | | 0.94 | % | | | 0.91 | % | | | 37.91 | % | | | 59 | % |
October 1, 2009 to September 30, 2010 | | | (0.66 | )% | | | 1.02 | % | | | 0.94 | % | | | 20.49 | % | | | 97 | % |
October 1, 2008 to September 30, 2009 | | | (0.53 | )% | | | 0.94 | % | | | 0.91 | % | | | (5.70 | )% | | | 147 | % |
October 1, 2007 to September 30, 2008 | | | (0.49 | )% | | | 0.93 | % | | | 0.92 | % | | | (30.95 | )% | | | 191 | % |
January 31, 20074 to September 30, 2007 | | | (0.54 | )% | | | 1.01 | % | | | 0.99 | % | | | 24.40 | % | | | 125 | % |
| | | | | |
Equity Value Portfolio | | | | | | | | | | | | | | | | | | | | |
June 1, 2012 to November 30, 2012 (unaudited) | | | 1.68 | % | | | 0.65 | % | | | 0.65 | % | | | 11.12 | % | | | 42 | % |
June 1, 2011 to May 31, 2012 | | | 1.58 | % | | | 0.65 | % | | | 0.65 | % | | | (10.22 | )% | | | 103 | % |
October 1, 2010 to May 31, 20112 | | | 0.79 | % | | | 0.68 | % | | | 0.68 | % | | | 20.88 | % | | | 90 | % |
October 1, 2009 to September 30, 2010 | | | 0.87 | % | | | 0.71 | % | | | 0.69 | % | | | 9.75 | % | | | 122 | % |
October 1, 2008 to September 30, 2009 | | | 1.89 | % | | | 0.73 | % | | | 0.69 | % | | | (7.21 | )% | | | 142 | % |
October 1, 2007 to September 30, 2008 | | | 1.68 | % | | | 0.74 | % | | | 0.70 | % | | | (27.44 | )% | | | 152 | % |
October 1, 2006 to September 30, 2007 | | | 1.29 | % | | | 0.77 | % | | | 0.69 | % | | | 20.21 | % | | | 108 | % |
| | | | | |
Index Portfolio | | | | | | | | | | | | | | | | | | | | |
June 1, 2012 to November 30, 2012 (unaudited) | | | 2.19 | % | | | 0.10 | % | | | 0.10 | % | | | 9.30 | % | | | 2 | % |
June 1, 2011 to May 31, 2012 | | | 2.09 | % | | | 0.10 | % | | | 0.10 | % | | | (0.52 | )% | | | 9 | % |
October 1, 2010 to May 31, 20112 | | | 1.93 | % | | | 0.10 | % | | | 0.10 | % | | | 19.39 | % | | | 3 | % |
October 1, 2009 to September 30, 2010 | | | 2.01 | % | | | 0.10 | % | | | 0.10 | % | | | 9.97 | % | | | 22 | % |
October 1, 2008 to September 30, 2009 | | | 2.61 | % | | | 0.12 | % | | | 0.10 | % | | | (7.00 | )% | | | 10 | % |
October 1, 2007 to September 30, 2008 | | | 2.07 | % | | | 0.11 | % | | | 0.11 | % | | | (22.28 | )% | | | 5 | % |
October 1, 2006 to September 30, 2007 | | | 1.86 | % | | | 0.11 | % | | | 0.10 | % | | | 16.35 | % | | | 8 | % |
| | | | | |
International Equity Portfolio | | | | | | | | | | | | | | | | | | | | |
June 1, 2012 to November 30, 2012 (unaudited) | | | 1.20 | % | | | 1.40 | % | | | 1.37 | % | | | 13.61 | % | | | 24 | % |
June 1, 2011 to May 31, 2012 | | | 1.79 | % | | | 1.26 | % | | | 1.21 | % | | | (22.13 | )% | | | 141 | % |
October 1, 2010 to May 31, 20112 | | | 1.34 | % | | | 1.18 | % | | | 1.18 | % | | | 14.83 | % | | | 35 | % |
October 1, 2009 to September 30, 2010 | | | 0.61 | % | | | 1.31 | % | | | 1.28 | % | | | 6.57 | % | | | 105 | % |
October 1, 2008 to September 30, 2009 | | | 1.77 | % | | | 1.23 | % | | | 1.15 | % | | | (10.14 | )% | | | 212 | % |
October 1, 2007 to September 30, 2008 | | | 1.60 | % | | | 1.14 | % | | | 1.12 | % | | | (31.42 | )% | | | 55 | % |
October 1, 2006 to September 30, 2007 | | | 1.27 | % | | | 1.09 | % | | | 1.08 | % | | | 23.70 | % | | | 66 | % |
Please see footnotes on page 163
The accompanying notes are an integral part of these financial statements.
| | | | |
| 162 | | Wells Fargo Advantage Equity Gateway Funds | | Financial highlights |
| | | | | | | | | | | | | | | | | | | | |
| | | Ratio to average net assets (annualized) | | | Total
return1 | | | Portfolio turnover rate | |
| | | Net investment
income (loss) | | | Gross
expenses | | | Net
expenses | | | |
| | | | | |
International Growth Portfolio | | | | | | | | | | | | | | | | | | | | |
June 1, 2012 to November 30, 2012 (unaudited) | | | 0.79 | % | | | 1.01 | % | | | 1.01 | % | | | 16.75 | % | | | 21 | % |
June 1, 2011 to May 31, 2012 | | | 2.04 | % | | | 0.97 | % | | | 0.90 | % | | | (9.44 | )% | | | 69 | % |
October 1, 2010 to May 31, 20112 | | | 1.62 | % | | | 1.10 | % | | | 1.10 | % | | | 14.50 | % | | | 53 | % |
October 1, 2009 to September 30, 2010 | | | 0.89 | % | | | 1.42 | % | | | 1.20 | % | | | 3.25 | % | | | 89 | % |
October 1, 2008 to September 30, 2009 | | | 1.71 | % | | | 1.14 | % | | | 1.11 | % | | | 6.23 | % | | | 95 | % |
October 1, 2007 to September 30, 2008 | | | 1.17 | % | | | 1.08 | % | | | 1.05 | % | | | (28.68 | )% | | | 57 | % |
October 1, 2006 to September 30, 2007 | | | 1.09 | % | | | 1.06 | % | | | 1.03 | % | | | 27.40 | % | | | 73 | % |
| | | | | |
International Index Portfolio | | | | | | | | | | | | | | | | | | | | |
June 1, 2012 to November 30, 2012 (unaudited) | | | 2.17 | % | | | 1.10 | % | | | 0.38 | % | | | 18.07 | % | | | 2 | % |
June 1, 2011 to May 31, 2012 | | | 3.81 | % | | | 0.83 | % | | | 0.37 | % | | | (20.52 | )% | | | 45 | % |
October 1, 2010 to May 31, 20112 | | | 3.09 | % | | | 0.48 | % | | | 0.48 | % | | | 13.78 | % | | | 3 | % |
October 1, 2009 to September 30, 2010 | | | 2.17 | % | | | 0.77 | % | | | 0.65 | % | | | 2.47 | % | | | 20 | % |
October 1, 2008 to September 30, 2009 | | | 2.86 | % | | | 0.55 | % | | | 0.46 | % | | | 1.65 | % | | | 13 | % |
October 1, 2007 to September 30, 2008 | | | 2.84 | % | | | 0.51 | % | | | 0.50 | % | | | (29.67 | )% | | | 14 | % |
October 1, 2006 to September 30, 2007 | | | 2.15 | % | | | 0.49 | % | | | 0.49 | % | | | 24.52 | % | | | 3 | % |
| | | | | |
International Value Portfolio | | | | | | | | | | | | | | | | | | | | |
June 1, 2012 to November 30, 2012 (unaudited) | | | 1.94 | % | | | 0.90 | % | | | 0.90 | % | | | 17.08 | % | | | 9 | % |
June 1, 2011 to May 31, 2012 | | | 3.44 | % | | | 0.91 | % | | | 0.85 | % | | | (21.07 | )% | | | 9 | % |
October 1, 2010 to May 31, 20112 | | | 3.14 | % | | | 0.94 | % | | | 0.94 | % | | | 14.00 | % | | | 16 | % |
October 1, 2009 to September 30, 2010 | | | 2.41 | % | | | 1.20 | % | | | 1.06 | % | | | 0.92 | % | | | 27 | % |
October 1, 2008 to September 30, 2009 | | | 2.72 | % | | | 1.08 | % | | | 1.03 | % | | | 5.26 | % | | | 41 | % |
October 1, 2007 to September 30, 2008 | | | 3.68 | % | | | 1.07 | % | | | 1.01 | % | | | (34.21 | )% | | | 23 | % |
October 1, 2006 to September 30, 2007 | | | 2.47 | % | | | 1.07 | % | | | 1.03 | % | | | 21.91 | % | | | 19 | % |
| | | | | |
Large Company Value Portfolio | | | | | | | | | | | | | | | | | | | | |
June 1, 2012 to November 30, 2012 (unaudited) | | | 1.92 | % | | | 0.79 | % | | | 0.74 | % | | | 8.38 | % | | | 32 | % |
June 1, 2011 to May 31, 2012 | | | 1.67 | % | | | 0.77 | % | | | 0.74 | % | | | (6.06 | )% | | | 104 | % |
October 1, 2010 to May 31, 20112 | | | 1.58 | % | | | 0.78 | % | | | 0.74 | % | | | 21.46 | % | | | 38 | % |
October 1, 2009 to September 30, 2010 | | | 1.73 | % | | | 0.73 | % | | | 0.72 | % | | | 7.02 | % | | | 46 | % |
October 1, 2008 to September 30, 2009 | | | 2.69 | % | | | 0.75 | % | | | 0.69 | % | | | (9.66 | )% | | | 11 | % |
October 1, 2007 to September 30, 2008 | | | 2.16 | % | | | 0.75 | % | | | 0.57 | % | | | (23.18 | )% | | | 8 | % |
October 1, 2006 to September 30, 2007 | | | 1.91 | % | | | 0.76 | % | | | 0.57 | % | | | 15.91 | % | | | 16 | % |
| | | | | |
Small Cap Value Portfolio | | | | | | | | | | | | | | | | | | | | |
June 1, 2012 to November 30, 2012 (unaudited) | | | 0.63 | % | | | 0.97 | % | | | 0.92 | % | | | 10.41 | % | | | 20 | % |
June 1, 2011 to May 31, 2012 | | | 1.02 | % | | | 0.95 | % | | | 0.91 | % | | | (7.94 | )% | | | 33 | % |
October 1, 2010 to May 31, 20112 | | | 0.47 | % | | | 0.95 | % | | | 0.91 | % | | | 13.14 | % | | | 57 | % |
October 1, 2009 to September 30, 2010 | | | 0.66 | % | | | 0.94 | % | | | 0.91 | % | | | 9.60 | % | | | 38 | % |
October 1, 2008 to September 30, 2009 | | | 1.31 | % | | | 0.91 | % | | | 0.74 | % | | | (8.76 | )% | | | 50 | % |
October 1, 2007 to September 30, 2008 | | | 0.80 | % | | | 0.91 | % | | | 0.83 | % | | | (16.47 | )% | | | 46 | % |
October 1, 2006 to September 30, 2007 | | | 0.30 | % | | | 0.93 | % | | | 0.92 | % | | | 8.65 | % | | | 64 | % |
| | | | | |
Small Company Growth Portfolio | | | | | | | | | | | | | | | | | | | | |
June 1, 2012 to November 30, 2012 (unaudited) | | | 0.01 | % | | | 0.86 | % | | | 0.86 | % | | | 7.71 | % | | | 48 | % |
June 1, 2011 to May 31, 2012 | | | (0.12 | )% | | | 0.83 | % | | | 0.83 | % | | | (10.75 | )% | | | 107 | % |
October 1, 2010 to May 31, 20112 | | | (0.42 | )% | | | 0.83 | % | | | 0.83 | % | | | 39.64 | % | | | 70 | % |
October 1, 2009 to September 30, 2010 | | | (0.48 | )% | | | 0.87 | % | | | 0.86 | % | | | 15.25 | % | | | 129 | % |
October 1, 2008 to September 30, 2009 | | | (0.53 | )% | | | 0.89 | % | | | 0.87 | % | | | 1.75 | % | | | 169 | % |
October 1, 2007 to September 30, 2008 | | | (0.53 | )% | | | 0.89 | % | | | 0.89 | % | | | (27.50 | )% | | | 150 | % |
October 1, 2006 to September 30, 2007 | | | (0.46 | )% | | | 0.90 | % | | | 0.90 | % | | | 17.74 | % | | | 138 | % |
Please see footnotes on page 163.
The accompanying notes are an integral part of these financial statements.
| | | | | | |
| Financial highlights | | Wells Fargo Advantage Equity Gateway Funds | | | 163 | |
| | | | | | | | | | | | | | | | | | | | |
| | | Ratio to average net assets (annualized) | | | Total
return1 | | | Portfolio turnover rate | |
| | | Net investment
income | | | Gross
expenses | | | Net
expenses | | | |
| | | | | |
Small Company Value Portfolio | | | | | | | | | | | | | | | | | | | | |
June 1, 2012 to November 30, 2012 (unaudited) | | | 0.62 | % | | | 0.84 | % | | | 0.84 | % | | | 6.95 | % | | | 34 | % |
June 1, 2011 to May 31, 2012 | | | 0.69 | % | | | 0.84 | % | | | 0.84 | % | | | (7.17 | )% | | | 60 | % |
October 1, 2010 to May 31, 20112 | | | 1.60 | % | | | 0.84 | % | | | 0.84 | % | | | 26.72 | % | | | 47 | % |
October 1, 2009 to September 30, 2010 | | | 0.31 | % | | | 0.89 | % | | | 0.89 | % | | | 16.38 | % | | | 60 | % |
October 1, 2008 to September 30, 2009 | | | 1.16 | % | | | 0.90 | % | | | 0.88 | % | | | (6.28 | )% | | | 99 | % |
October 1, 2007 to September 30, 2008 | | | 1.02 | % | | | 0.90 | % | | | 0.89 | % | | | (22.01 | )% | | | 82 | % |
October 1, 2006 to September 30, 2007 | | | 0.53 | % | | | 0.93 | % | | | 0.92 | % | | | 6.53 | % | | | 69 | % |
| 1. | Returns for periods of less than one year are not annualized. |
| 2. | For the eight months ended May 31, 2011. The Portfolio changed its fiscal year end from September 30 to May 31, effective May 31, 2011. |
| 3. | After the close of business on January 28, 2011, the Diversified Large Cap Growth Portfolio acquired the net assets of Wells Fargo Advantage Disciplined Growth Portfolio, Wells Fargo Advantage Large Cap Appreciation Portfolio, and Wells Fargo Advantage Large Company Growth Portfolio. Wells Fargo Advantage Large Company Growth Portfolio became the accounting and performance survivor in the transaction. The information for the periods prior to January 31, 2011 is that of the Wells Fargo Advantage Large Company Growth Portfolio. |
| 4. | Commencement of operations. |
The accompanying notes are an integral part of these financial statements.
| | | | |
| 164 | | Wells Fargo Advantage Equity Gateway Funds | | Notes to financial statements (unaudited) |
1. ORGANIZATION
Wells Fargo Master Trust (the “Trust”), a Delaware statutory trust organized on March 10, 1999, is an open-end management investment company registered under the Investment Company Act of 1940, as amended (the “1940 Act”). These financial statements report on the following funds: Wells Fargo Advantage C&B Large Cap Value Portfolio (“C&B Large Cap Value Portfolio”), Wells Fargo Advantage Diversified Large Cap Growth Portfolio (“Diversified Large Cap Growth Portfolio”), Wells Fargo Advantage Emerging Growth Portfolio (“Emerging Growth Portfolio”), Wells Fargo Advantage Equity Value Portfolio (“Equity Value Portfolio”), Wells Fargo Advantage Index Portfolio (“Index Portfolio”), Wells Fargo Advantage International Equity Portfolio (“International Equity Portfolio”), Wells Fargo Advantage International Growth Portfolio (“International Growth Portfolio”), Wells Fargo Advantage International Index Portfolio (“International Index Portfolio”), Wells Fargo Advantage International Value Portfolio (“International Value Portfolio”), Wells Fargo Advantage Large Company Value Portfolio (“Large Company Value Portfolio”), Wells Fargo Advantage Small Cap Value Portfolio (“Small Cap Value Portfolio”), Wells Fargo Advantage Small Company Growth Portfolio (“Small Company Growth Portfolio”) and Wells Fargo Advantage Small Company Value Portfolio (“Small Company Value Portfolio”) (each, a “Portfolio”, collectively, the “Portfolios”). Each Portfolio is a diversified series of the Trust.
The Portfolios, which are master portfolios in a master/feeder structure, offer their shares to multiple feeder funds and other master portfolios rather than directly to the public.
2. SIGNIFICANT ACCOUNTING POLICIES
The following significant accounting policies, which are consistently followed in the preparation of the financial statements of each Portfolio, are in conformity with U.S. generally accepted accounting principles which require management to make estimates and assumptions that affect the reported amounts of assets and liabilities, disclosure of contingent assets and liabilities at the date of the financial statements, and the reported amounts of revenues and expenses during the reporting period. Actual results could differ from those estimates.
Securities valuation
All investments are valued each business day as of the close of regular trading on the New York Stock Exchange (normally 4 p.m. Eastern Time).
Equity securities that are listed on a foreign or domestic exchange, except for The Nasdaq Stock Market, Inc. (“Nasdaq”), are valued at the official closing price or, if none, the last sales price. Securities listed on Nasdaq are valued at the Nasdaq Official Closing Price (“NOCP”). If no NOCP is available, securities are valued at the last prior sales price. If no sales price is shown on the Nasdaq, the bid price will be used. If no sale occurs on the primary exchange or market for the security that day or if no sale occurs and no bid price is shown on Nasdaq, the prior day’s price will be deemed “stale” and fair values will be determined in accordance with the Portfolios’ Valuation Procedures.
Securities denominated in foreign currencies are translated into U.S. dollars using the rates of exchange in effect on the day of valuation at a time specified by the Management Valuation Team of Wells Fargo Funds Management, LLC (“Funds Management”).
Many securities markets and exchanges outside the U.S. close prior to the close of the New York Stock Exchange and therefore may not fully reflect trading or events that occur after the close of the principal exchange in which the foreign securities are traded, but before the close of the New York Stock Exchange. If such trading or events are expected to materially affect the value of such securities, then fair value pricing procedures approved by the Board of Trustees are applied. These procedures take into account multiple factors including movements in U.S. securities markets after foreign exchanges close. Foreign securities that are fair valued under these procedures are categorized as Level 2 and the application of these procedures may result in transfers between Level 1 and Level 2. Depending on market activity, such fair valuations may be frequent. Such fair value pricing may result in NAVs that are higher or lower than NAVs based on the last reported sales price or latest quoted bid price. On November 30, 2012, fair value pricing was not used in pricing foreign securities.
Debt securities of sufficient credit quality acquired with maturities of 60 days or less generally are valued at amortized cost which approximates fair value. The amortized cost method involves valuing a security at its cost, plus accretion of discount or minus amortization of premium over the period until maturity.
Investments in registered open-end investment companies are valued at net asset value. Non-registered investment companies are fair valued at net asset value.
| | | | | | |
| Notes to financial statements (unaudited) | | Wells Fargo Advantage Equity Gateway Funds | | | 165 | |
Investments which are not valued using any of the methods discussed above are valued at their fair value, as determined by procedures established in good faith and approved by the Board of Trustees. The Board of Trustees has established a Valuation Committee comprised of the Trustees and has delegated to it the authority to take any actions regarding the valuation of portfolio securities that the Valuation Committee deems necessary or appropriate, including determining the fair value of portfolio securities, unless the determination has been delegated to the Management Valuation Team. The Board of Trustees retains the authority to make or ratify any valuation decisions or approve any changes to the Valuation Procedures as it deems appropriate. On a quarterly basis, the Board of Trustees receives reports on any valuation actions taken by the Valuation Committee or the Management Valuation Team which may include items for ratification.
Valuations of fair valued securities are compared to the next actual sales price when available, or other appropriate market information to assess the continued appropriateness of the fair valuation methodology used. These securities are fair valued on a day-to-day basis, taking into consideration changes to appropriate market information and any significant changes to the input factors considered in the valuation process until there is a readily available price provided on the exchange or by an independent pricing service. Valuations received from an independent pricing service or broker quotes are periodically validated by comparisons to most recent trades and valuations provided by other independent pricing services in addition to the review of prices by the adviser and/or subadviser. Unobservable inputs used in determining fair valuations are identified based on the type of security, taking into consideration factors utilized by market participants in valuing the investment, knowledge about the issuer and the current market environment.
Foreign currency translation
The accounting records of the Portfolios are maintained in U.S. dollars. Assets, including investment securities, and liabilities denominated in foreign currency are translated into U.S. dollars at the rates of exchange at a time specified by the Management Valuation Team on the date of valuation. Purchases and sales of securities, and income and expenses are converted at the rate of exchange on the respective dates of such transactions. Reported net realized foreign exchange gains or losses arise from sales of foreign currencies, currency gains or losses realized between the trade and settlement dates on securities transactions, and the difference between the amounts of dividends, interest and foreign withholding taxes recorded and the U.S. dollar equivalent of the amounts actually paid or received. Net unrealized foreign exchange gains and losses arise from changes in the fair value of assets and liabilities other than investments in securities resulting in changes in exchange rates.
The changes in net assets arising from changes in exchange rates and the changes in net assets resulting from changes in market prices of securities are not separately presented. Such changes are recorded with net realized and unrealized gains or losses from investments. Gains and losses from certain foreign currency transactions are treated as ordinary income for U.S. federal income tax purposes.
Forward foreign currency contracts
Certain Portfolios may be subject to foreign currency exchange rate risk in the normal course of pursuing its investment objectives. A forward foreign currency contract is an agreement between two parties to purchase or sell a specific currency for an agreed-upon price at a future date. The Portfolio enters into forward foreign currency contracts to facilitate transactions in foreign-denominated securities and to attempt to minimize the risk to the Portfolio from adverse changes in the relationship between currencies. Forward foreign currency contracts are recorded at the forward rate and marked-to-market daily. When the contracts are closed, realized gains and losses arising from such transactions are recorded as realized gains or losses on forward foreign currency contract transactions. The Portfolio could be exposed to risks if the counterparties to the contracts are unable to meet the terms of their contracts or if the value of the foreign currency changes unfavorably. The Portfolio’s maximum risk of loss from counterparty credit risk is the unrealized gains or losses on the contracts. This risk is mitigated by having a master netting arrangement between the Portfolio and the counterparty.
Security loans
The Portfolios may lend their securities from time to time in order to earn additional income in the form of fees or interest on securities received as collateral or the investment of any cash received as collateral. The Portfolios continue to receive interest or dividends on the securities loaned. The Portfolios receive collateral in the form of cash or securities with a value at least equal to the value of the securities on loan. The value of the loaned securities is determined at the close of each business day and any additional required collateral is delivered to the Portfolios on the next business day. In a securities lending transaction, the net asset value of the Portfolios will be affected by an increase or decrease in the value of the securities loaned and by an increase or decrease in the value of the instrument in which collateral is invested. The amount of securities lending activity undertaken by the Portfolios fluctuate from time to time, In the event of default or bankruptcy by the borrower, the Portfolios may be prevented from recovering the loaned securities or gaining access to the collateral or
| | | | |
| 166 | | Wells Fargo Advantage Equity Gateway Funds | | Notes to financial statements (unaudited) |
may experience delays or costs in doing so. In addition, the investment of any cash collateral received may lose all or part of its value. The Portfolios have the right under the lending agreement to recover the securities from the borrower on demand.
The Portfolios lend their securities through an unaffiliated securities lending agent. Cash collateral received in connection with its securities lending transactions is invested in Wells Fargo Securities Lending Cash Investments, LLC (the “Cash Collateral Fund”). The Cash Collateral Fund is exempt from registration under Section 3(c)(7) of the 1940 Act and is managed by Funds Management and is subadvised by Wells Capital Management Incorporated (“WellsCap”). Funds Management receives an advisory fee starting at 0.05% and declining to 0.01% as the average daily net assets of the Cash Collateral Fund increase. All of the fees received by Funds Management are paid to WellsCap for its services as subadviser. The Cash Collateral Fund seeks to provide a positive return compared to the daily Fed Funds Open rate by investing in high-quality, U.S. dollar-denominated short-term money market instruments. Cash Collateral Fund investments are fair valued based upon the amortized cost valuation technique. Income earned from investment in the Cash Collateral Fund is included in securities lending income on the Statements of Operations.
Futures contracts
Certain Portfolios may be subject to equity price risk in the normal course of pursuing its investment objectives. The Portfolio may buy and sell futures contracts in order to gain exposure to, or protect against, changes in security values and interest rates. The primary risks associated with the use of futures contracts are the imperfect correlation between changes in market values of securities held by the Portfolio and the prices of futures contracts, and the possibility of an illiquid market.
Futures contracts are valued based upon their quoted daily settlement prices when available. The aggregate principal amounts of the contracts are not recorded in the financial statements. Fluctuations in the value of the contracts are recorded in the Statements of Assets and Liabilities as an asset or liability and in the Statements of Operations as unrealized gains or losses until the contracts are closed, at which point they are recorded as net realized gains or losses on futures contracts. With futures contracts, there is minimal counterparty risk to the Portfolio since futures are exchange traded and the exchange’s clearinghouse, as counterparty to all exchange traded futures, guarantees the futures against default.
Security transactions and income recognition
Securities transactions are recorded on a trade date basis. Realized gains or losses are recorded on the basis of identified cost.
Interest income is accrued daily and bond discounts are accreted and premiums are amortized daily based on the effective interest method. To the extent debt obligations are placed on non-accrual status, any related interest income may be reduced by writing off interest receivables when the collection of all or a portion of interest has become doubtful based on consistently applied procedures. If the issuer subsequently resumes interest payments or when the collectability of interest is reasonably assured, the debt obligation is removed from non-accrual status.
Dividend income is recognized on the ex-dividend date, except for certain dividends from foreign securities, which are recorded as soon as the Portfolio is informed of the ex-dividend date. Dividend income from foreign securities is recorded net of foreign taxes withheld where recovery of such taxes is not assured.
Federal and other taxes
Each Portfolio is treated as a separate entity for federal income tax purposes. The Portfolios are not required to pay federal income taxes on their net investment income and net capital gain as they are treated as partnerships for federal income tax purposes. All interest, dividends, gains and losses of a Portfolio are deemed to have been “passed through” to the interestholders in proportion to their holdings of the Portfolio regardless of whether such interest, dividends and gains have been distributed by the Portfolio.
Each Portfolio’s income and federal excise tax returns and all financial records supporting those returns for the prior three fiscal years are subject to examination by the federal and Delaware revenue authorities. Management has analyzed each Portfolio’s tax positions taken on federal, state, and foreign tax returns for all open tax years and does not believe that there are any uncertain tax positions that require recognition of a tax liability.
3. FAIR VALUATION MEASUREMENTS
Fair value measurements of investments are determined within a framework that has established a fair value hierarchy based upon the various data inputs utilized in determining the value of each Portfolio’s investments. The three-level hierarchy gives the highest priority to unadjusted quoted prices in active markets for identical assets or liabilities (Level 1) and the lowest priority to significant unobservable inputs (Level 3). Each Portfolio’s investments are classified within the
| | | | | | |
| Notes to financial statements (unaudited) | | Wells Fargo Advantage Equity Gateway Funds | | | 167 | |
fair value hierarchy based on the lowest level of input that is significant to the fair value measurement. The inputs are summarized into three broad levels as follows:
| n | | Level 1 – quoted prices in active markets for identical securities |
| n | | Level 2 – other significant observable inputs (including quoted prices for similar securities, interest rates, prepayment speeds, credit risk, etc.) |
| n | | Level 3 – significant unobservable inputs (including each Portfolio’s own assumptions in determining the fair value of investments) |
The inputs or methodologies used for valuing securities are not necessarily an indication of the risk associated with investing in those securities.
As of November 30, 2012, the inputs used in valuing investments in securities, which were carried at fair value, were as follows:
| | | | | | | | | | | | | | | | |
| Investments in Securities | | Quoted prices (Level 1) | | | Significant other
observable inputs
(Level 2) | | | Significant
unobservable inputs
(Level 3) | | | Total | |
C&B Large Cap Value Portfolio | | | | | | | | | | | | | | | | |
| | | | |
Equity securities | | | | | | | | | | | | | | | | |
Common stocks | | $ | 305,220,193 | | | $ | 4,607,741 | | | $ | 0 | | | $ | 309,827,934 | |
Preferred stocks | | | 0 | | | | 3,944,178 | | | | 0 | | | | 3,944,178 | |
| | | | |
Other | | | 0 | | | | 0 | | | | 469,258 | | | | 469,258 | |
| | | | |
Short-term investments | | | | | | | | | | | | | | | | |
Investment companies | | | 1,807,073 | | | | 54,471,494 | | | | 0 | | | | 56,278,567 | |
Total | | $ | 307,027,266 | | | $ | 63,023,413 | | | $ | 469,258 | | | $ | 370,519,937 | |
Diversified Large Cap Growth Portfolio | | | | | | | | | | | | | | | | |
| | | | |
Equity securities | | | | | | | | | | | | | | | | |
Common stocks | | $ | 147,157,159 | | | $ | 0 | | | $ | 0 | | | $ | 147,157,159 | |
| | | | |
Other | | | 0 | | | | 0 | | | | 466,478 | | | | 466,478 | |
| | | | |
Short-term investments | | | | | | | | | | | | | | | | |
Investment companies | | | 1,362,764 | | | | 30,742,017 | | | | 0 | | | | 32,104,781 | |
Total | | $ | 148,519,923 | | | $ | 30,742,017 | | | $ | 466,478 | | | $ | 179,728,418 | |
Emerging Growth Portfolio | | | | | | | | | | | | | | | | |
| | | | |
Equity securities | | | | | | | | | | | | | | | | |
Common stocks | | $ | 908,145,519 | | | $ | 0 | | | $ | 0 | | | $ | 908,145,519 | |
Investment companies | | | 3,272,850 | | | | 0 | | | | 0 | | | | 3,272,850 | |
| | | | |
Other | | | 0 | | | | 0 | | | | 1,438,635 | | | | 1,438,635 | |
| | | | |
Short-term investments | | | | | | | | | | | | | | | | |
Investment companies | | | 14,554,639 | | | | 287,604,201 | | | | 0 | | | | 302,158,840 | |
Total | | $ | 925,973,008 | | | $ | 287,604,201 | | | $ | 1,438,635 | | | $ | 1,215,015,844 | |
Equity Value Portfolio | | | | | | | | | | | | | | | | |
| | | | |
Equity securities | | | | | | | | | | | | | | | | |
Common stocks | | $ | 863,581,645 | | | $ | 0 | | | $ | 0 | | | $ | 863,581,645 | |
| | | | |
Other | | | 0 | | | | 0 | | | | 387,752 | | | | 387,752 | |
| | | | |
Short-term investments | | | | | | | | | | | | | | | | |
Investment companies | | | 12,139,015 | | | | 54,138,746 | | | | 0 | | | | 66,277,761 | |
Total | | $ | 875,720,660 | | | $ | 54,138,746 | | | $ | 387,752 | | | $ | 930,247,158 | |
| | | | |
| 168 | | Wells Fargo Advantage Equity Gateway Funds | | Notes to financial statements (unaudited) |
| | | | | | | | | | | | | | | | |
| Investments in Securities | | Quoted prices (Level 1) | | | Significant other
observable inputs
(Level 2) | | | Significant
unobservable inputs
(Level 3) | | | Total | |
Index Portfolio | | | | | | | | | | | | | | | | |
| | | | |
Equity securities | | | | | | | | | | | | | | | | |
Common stocks | | $ | 2,462,065,216 | | | $ | 0 | | | $ | 0 | | | $ | 2,462,065,216 | |
Investment companies | | | 2,403,229 | | | | 0 | | | | 0 | | | | 2,403,229 | |
| | | | |
Other | | | 0 | | | | 0 | | | | 1,368,621 | | | | 1,368,621 | |
| | | | |
Short-term investments | | | | | | | | | | | | | | | | |
Investment companies | | | 39,179,893 | | | | 159,290,071 | | | | 0 | | | | 198,469,964 | |
U.S. Treasury securities | | | 3,249,628 | | | | 0 | | | | 0 | | | | 3,249,628 | |
Total | | $ | 2,506,897,966 | | | $ | 159,290,071 | | | $ | 1,368,621 | | | $ | 2,667,556,658 | |
International Equity Portfolio | | | | | | | | | | | | | | | | |
| | | | |
Equity securities | | | | | | | | | | | | | | | | |
Common stocks | | $ | 21,988,461 | | | $ | 0 | | | $ | 0 | | | $ | 21,988,461 | |
| | | | |
Short-term investments | | | | | | | | | | | | | | | | |
Investment companies | | | 327,352 | | | | 1,076,691 | | | | 0 | | | | 1,404,043 | |
Total | | $ | 22,315,813 | | | $ | 1,076,691 | | | $ | 0 | | | $ | 23,392,504 | |
International Growth Portfolio | | | | | | | | | | | | | | | | |
| | | | |
Equity securities | | | | | | | | | | | | | | | | |
Common stocks | | $ | 108,384,886 | | | $ | 0 | | | $ | 0 | | | $ | 108,384,886 | |
Preferred stocks | | | 1,863,480 | | | | 0 | | | | 0 | | | | 1,863,480 | |
| | | | |
Short-term investments | | | | | | | | | | | | | | | | |
Investment companies | | | 1,084,659 | | | | 6,985,505 | | | | 0 | | | | 8,070,164 | |
Total | | $ | 111,333,025 | | | $ | 6,985,505 | | | $ | 0 | | | $ | 118,318,530 | |
International Index Portfolio | | | | | | | | | | | | | | | | |
| | | | |
Equity securities | | | | | | | | | | | | | | | | |
Common stocks | | $ | 21,966,323 | | | $ | 7,919 | | | $ | 0 | | | $ | 21,974,242 | |
Preferred stocks | | | 138,423 | | | | 489 | | | | 0 | | | | 138,912 | |
Rights | | | 0 | | | | 3,952 | | | | 0 | | | | 3,952 | |
| | | | |
Short-term investments | | | | | | | | | | | | | | | | |
Investment companies | | | 0 | | | | 452,217 | | | | 0 | | | | 452,217 | |
Total | | $ | 22,104,746 | | | $ | 464,577 | | | $ | 0 | | | $ | 22,569,323 | |
International Value Portfolio | | | | | | | | | | | | | | | | |
| | | | |
Equity securities | | | | | | | | | | | | | | | | |
Common stocks | | $ | 343,595,905 | | | $ | 3,809,406 | | | $ | 0 | | | $ | 347,405,311 | |
Preferred stocks | | | 3,836,536 | | | | 0 | | | | 0 | | | | 3,836,536 | |
| | | | |
Short-term investments | | | | | | | | | | | | | | | | |
Investment companies | | | 1,479,062 | | | | 13,117,922 | | | | 0 | | | | 14,596,984 | |
Total | | $ | 348,911,503 | | | $ | 16,927,328 | | | $ | 0 | | | $ | 365,838,831 | |
Large Company Value Portfolio | | | | | | | | | | | | | | | | |
| | | | |
Equity securities | | | | | | | | | | | | | | | | |
Common stocks | | $ | 46,374,559 | | | $ | 0 | | | $ | 0 | | | $ | 46,374,559 | |
| | | | |
Other | | | 0 | | | | 0 | | | | 30,133 | | | | 30,133 | |
| | | | |
Short-term investments | | | | | | | | | | | | | | | | |
Investment companies | | | 2,060,814 | | | | 4,010,623 | | | | 0 | | | | 6,071,437 | |
Total | | $ | 48,435,373 | | | $ | 4,010,623 | | | $ | 30,133 | | | $ | 52,476,129 | |
| | | | | | |
| Notes to financial statements (unaudited) | | Wells Fargo Advantage Equity Gateway Funds | | | 169 | |
| | | | | | | | | | | | | | | | |
| Investments in Securities | | Quoted prices (Level 1) | | | Significant other
observable inputs
(Level 2) | | | Significant
unobservable inputs
(Level 3) | | | Total | |
Small Cap Value Portfolio | | | | | | | | | | | | | | | | |
| | | | |
Equity securities | | | | | | | | | | | | | | | | |
Common stocks | | $ | 15,447,346 | | | $ | 0 | | | $ | 0 | | | $ | 15,447,346 | |
Investment companies | | | 363,486 | | | | 0 | | | | 0 | | | | 363,486 | |
Warrants | | | 0 | | | | 43,273 | | | | 0 | | | | 43,273 | |
| | | | |
Short-term investments | | | | | | | | | | | | | | | | |
Investment companies | | | 608,030 | | | | 0 | | | | 0 | | | | 608,030 | |
Total | | $ | 16,418,862 | | | $ | 43,273 | | | $ | 0 | | | $ | 16,462,135 | |
Small Company Growth Portfolio | | | | | | | | | | | | | | | | |
| | | | |
Equity securities | | | | | | | | | | | | | | | | |
Common stocks | | $ | 127,600,070 | | | $ | 0 | | | $ | 0 | | | $ | 127,600,070 | |
| | | | |
Other | | | 0 | | | | 0 | | | | 560,908 | | | | 560,908 | |
| | | | |
Short-term investments | | | | | | | | | | | | | | | | |
Investment companies | | | 3,370,315 | | | | 38,146,194 | | | | 0 | | | | 41,516,509 | |
Total | | $ | 130,970,385 | | | $ | 38,146,194 | | | $ | 560,908 | | | $ | 169,677,487 | |
Small Company Value Portfolio | | | | | | | | | | | | | | | | |
| | | | |
Equity securities | | | | | | | | | | | | | | | | |
Common stocks | | $ | 166,347,066 | | | $ | 0 | | | $ | 0 | | | $ | 166,347,066 | |
| | | | |
Other | | | 0 | | | | 0 | | | | 392,696 | | | | 392,696 | |
| | | | |
Short-term investments | | | | | | | | | | | | | | | | |
Investment companies | | | 4,320,665 | | | | 55,859,005 | | | | 0 | | | | 60,179,670 | |
Total | | $ | 170,667,731 | | | $ | 55,859,005 | | | $ | 392,696 | | | $ | 226,919,432 | |
Further details on the major security types listed above can be found in each Portfolio of Investments or Summary Portfolio of Investments.
As of November 30, 2012, the inputs used in valuing each Portfolio’s other financial instruments, which are carried at fair value, were as follows:
| | | | | | | | | | | | | | | | |
| Futures Contracts+ | | Quoted Prices
(Level 1) | | | Significant Other
Observable Inputs
(Level 2) | | | Significant
Unobservable Inputs
(Level 3) | | | Total | |
Index Portfolio | | $ | (205,915 | ) | | $ | 0 | | | $ | 0 | | | $ | (205,915 | ) |
International Index Portfolio | | | (725 | ) | | | 0 | | | | 0 | | | | (725 | ) |
| + | Futures contracts are presented at the unrealized gains or losses on the instruments. |
Transfers in and transfers out are recognized at the end of the reporting period. For the six months ended November 30, 2012, the Portfolios did not have any transfers into/out of Level 1 or Level 2.
4. TRANSACTIONS WITH AFFILIATES AND OTHER EXPENSES
Advisory fees
The Trust has entered into an advisory contract with Funds Management, an indirect wholly owned subsidiary of Wells Fargo & Company (“Wells Fargo”). The adviser is responsible for implementing investment policies and guidelines and for supervising the subadvisers, who are responsible for day-to-day portfolio management of the Portfolios.
Funds Management has retained the services of certain sub-advisers to provide daily portfolio management to the Portfolios. Funds Management has engaged WellsCap (an affiliate of Funds Management), Peregrine Capital Management, Inc. (an affiliate of Funds Management), Artisan Partners Limited Partnership, Cooke & Bieler, L.P., LSV Asset Management, SSgA Funds Management, Systematic Financial Management, L.P., Golden Capital Management, LLC (an affiliate of Funds Management) and Phocas Financial Corporation as subadvisers.
| | | | |
| 170 | | Wells Fargo Advantage Equity Gateway Funds | | Notes to financial statements (unaudited) |
Pursuant to the contract, Funds Management is entitled to receive an annual advisory fee which is calculated based on the average daily net assets of each Portfolio. The fees for subadvisory services are borne by Funds Management. The subadvisers are each entitled to receive from Funds Management an annual subadvisory fee which is calculated based on the average daily net assets of each Portfolio.
| | | | | | | | | | | | | | | | | | | | | | |
| | | Advisory fee | | | Effective rate for
the six months ended November 30, 2012 | | | Subadviser | | Subadvisory Fee | |
| | | starting at | | | declining to | | | | | starting at | | | declining to | |
C&B Large Cap Value Portfolio | | | 0.65 | % | | | 0.55 | % | | | 0.65 | % | | Cooke & Bieler, L.P. | | | 0.45% | | | | 0.30 | % |
Diversified Large Cap Growth Portfolio | | | 0.65 | | | | 0.55 | | | | 0.65 | | | WellsCap | | | 0.35 | | | | 0.15 | |
Emerging Growth Portfolio | | | 0.80 | | | | 0.70 | | | | 0.79 | | | WellsCap | | | 0.55 | | | | 0.40 | |
Equity Value Portfolio | | | 0.65 | | | | 0.55 | | | | 0.64 | | | Systematic Financial Management, L.P. | | | 0.30 | | | | 0.10 | |
Index Portfolio | | | 0.10 | | | | 0.05 | | | | 0.09 | | | Golden Capital Management, LLC | | | 0.05 | | | | 0.02 | |
International Equity Portfolio | | | 0.85 | | | | 0.70 | | | | 0.85 | | | WellsCap | | | 0.45 | | | | 0.40 | |
International Growth Portfolio | | | 0.85 | | | | 0.70 | | | | 0.85 | | | Artisan Partners Limited Partnership | | | 0.80 | | | | 0.50 | |
International Index Portfolio | | | 0.35 | | | | 0.30 | | | | 0.35 | | | SSgA Funds Management | | | 0.08 | | | | 0.06 | |
International Value Portfolio | | | 0.85 | | | | 0.70 | | | | 0.85 | | | LSV Asset Management | | | 0.35 | | | | 0.30 | |
Large Company Value Portfolio | | | 0.65 | | | | 0.55 | | | | 0.65 | | | Phocas Financial Corporation | | | 0.29 | | | | 0.20 | |
Small Cap Value Portfolio | | | 0.80 | | | | 0.70 | | | | 0.80 | | | WellsCap | | | 0.55 | | | | 0.40 | |
Small Company Growth Portfolio | | | 0.80 | | | | 0.70 | | | | 0.80 | | | Peregrine Capital Management, Inc. | | | 0.90 | | | | 0.55 | |
Small Company Value Portfolio | | | 0.80 | | | | 0.70 | | | | 0.80 | | | Peregrine Capital Management, Inc. | | | * | | | | * | |
| * | For Small Company Value Portfolio, the subadvisory fee starts at 0.50% and increases to 0.75% as its average net assets increase. |
Funds Management has voluntarily waived and/or reimbursed advisory fees to the extent necessary to maintain certain net operating expense ratios for the Portfolios.
5. INVESTMENT PORTFOLIO TRANSACTIONS
Purchases and sales of investments, excluding short-term securities, for the six months ended November 30, 2012 were as follows:
| | | | | | | | |
| | | Purchases at cost | | | Sales proceeds | |
C&B Large Cap Value Portfolio | | $ | 18,698,560 | | | $ | 42,273,724 | |
Diversified Large Cap Growth Portfolio | | | 42,349,741 | | | | 52,786,863 | |
Emerging Growth Portfolio | | | 316,181,528 | | | | 394,757,830 | |
Equity Value Portfolio | | | 404,791,661 | | | | 620,737,271 | |
Index Portfolio | | | 58,926,423 | | | | 111,509,451 | |
International Equity Portfolio | | | 5,139,346 | | | | 6,737,313 | |
International Growth Portfolio | | | 22,489,806 | | | | 32,106,881 | |
International Index Portfolio | | | 347,750 | | | | 4,319,702 | |
International Value Portfolio | | | 56,665,560 | | | | 28,672,875 | |
Large Company Value Portfolio | | | 15,805,760 | | | | 23,403,212 | |
Small Cap Value Portfolio | | | 7,639,744 | | | | 42,453,635 | |
Small Company Growth Portfolio | | | 71,583,294 | | | | 113,667,326 | |
Small Company Value Portfolio | | | 63,865,400 | | | | 102,780,561 | |
6. DERIVATIVE TRANSACTIONS
During the six months ended November 30, 2012, Index Portfolio and International Index Portfolio used uninvested cash to enter into futures contracts to gain market exposure.
| | | | | | |
| Notes to financial statements (unaudited) | | Wells Fargo Advantage Equity Gateway Funds | | | 171 | |
At November 30, 2012, the Portfolios had long futures contracts outstanding as follows:
| | | | | | | | | | | | | | |
| | | Expiration date | | Contracts | | Type | | Contract value at
November 30, 2012 | | | Unrealized
losses | |
Index Portfolio | | 12-20-12 | | 133 Long | | S&P 500 Index | | $ | 47,028,800 | | | $ | (205,915 | ) |
International Index Portfolio | | 12-21-12 | | 5 Long | | MSCI EAFE E-Mini Index | | | 389,825 | | | | (725 | ) |
The receivable and payable for daily variation margin on open futures contracts reflected in the Statements of Assets and Liabilities only represents the current day’s variation margin.
As of November 30, 2012, International Index Portfolio had segregated $56,719 as cash collateral for open futures contracts.
Index Portfolio and International Index Portfolio had average notional amounts of $37,388,819 and $478,653, respectively, in long futures contracts during the six months ended November 30, 2012.
The fair value, realized gains or losses and change in unrealized gains or losses on derivative instruments are reflected in the appropriate financial statements.
7. INDEMNIFICATION
Under the Trust’s organizational documents, the officers and directors are indemnified against certain liabilities that may arise out of performance of their duties to the Trust. Additionally, in the normal course of business, the Trust may enter into contracts with service providers that contain a variety of indemnification clauses. The Trust’s maximum exposure under these arrangements is dependent on future claims that may be made against the Portfolios and, therefore, cannot be estimated.
8. NEW ACCOUNTING PRONOUNCEMENT
In December 2011, the Financial Accounting Standards Board (“FASB”) issued Accounting Standard Update (“ASU”) No. 2011-11, Disclosures about Offsetting Assets and Liabilities. ASU 2011-11, which amends FASB ASC Topic 210, Balance Sheet, creates new disclosure requirements which require entities to disclose both gross and net information for derivatives and other financial instruments that are either offset in the Statement of Assets and Liabilities or subject to an enforceable master netting arrangement or similar agreement. The disclosure requirements are effective for interim and annual reporting periods beginning on or after January 1, 2013. Management is currently assessing the potential impact, in addition to expanded financial statement disclosure, that may result from adopting this ASU.
| | | | |
| 172 | | Wells Fargo Advantage Equity Gateway Funds | | Other information (unaudited) |
PROXY VOTING INFORMATION
A description of the policies and procedures used to determine how to vote proxies relating to portfolio securities is available without charge, upon request, by calling 1-800-222-8222, visiting our website at wellsfargoadvantagefunds.com, or visiting the SEC website at sec.gov. Information regarding how the proxies related to portfolio securities were voted during the most recent 12-month period ended June 30 is available without charge on the website at wellsfargoadvantagefunds.com or by visiting the SEC website at sec.gov.
PORTFOLIO HOLDINGS INFORMATION
The complete portfolio holdings for the Funds are publicly available on the website (wellsfargoadvantagefunds.com) on a monthly, 30-day or more delayed basis. In addition, top ten holdings information is publicly available on the website on a monthly, seven-day or more delayed basis. Each Fund and Portfolio files its complete schedule of portfolio holdings with the SEC for the first and third quarters of each fiscal year on Form N-Q, which is available without charge by visiting the SEC website at sec.gov. In addition, each Fund’s and Portfolio’s Form N-Q may be reviewed and copied at the SEC’s Public Reference Room in Washington, DC, and at regional offices in New York City, at 233 Broadway, and in Chicago, at 175 West Jackson Boulevard, Suite 900. Information about the Public Reference Room may be obtained by calling 1-800-SEC-0330.
| | | | | | |
| Other information (unaudited) | | Wells Fargo Advantage Equity Gateway Funds | | | 173 | |
BOARD OF TRUSTEES AND OFFICERS
Each of the Trustees and Officers listed in the table below acts in identical capacities for the Wells Fargo Advantage family of funds, which consists of 138 funds1 comprising the Wells Fargo Funds Trust, Wells Fargo Variable Trust, Wells Fargo Master Trust and four closed-end funds (collectively the “Fund Complex”). This table should be read in conjunction with the Prospectus and the Statement of Additional Information2. All of the Trustees are also Members of the Audit and Governance Committees of each Trust in the Fund Complex. The mailing address of each Trustee and Officer is 525 Market Street, 12th Floor, San Francisco, CA 94105. Each Trustee and Officer serves an indefinite term, however, each Trustee serves such term until reaching the mandatory retirement age established by the Trustees.
Independent Trustees
| | | | | | |
Name and year of birth | | Position held and length of service* | | Principal occupations during past five years | | Other directorships during
past five years |
Peter G. Gordon
(Born 1942) | | Trustee, since 1998; Chairman, since 2005 | | Co-Founder, Retired Chairman, President and CEO of Crystal Geyser Water Company. Trustee Emeritus, Colby College. | | Asset Allocation Trust |
Isaiah Harris, Jr.
(Born 1952) | | Trustee, since 2009 | | Retired. Prior thereto, President and CEO of BellSouth Advertising and Publishing Corp. from 2005 to 2007. Emeritus member of the Iowa State University Foundation Board of Governors. Emeritus Member of the Advisory Board of Iowa State University School of Business. Mr. Harris is a certified public accountant. | | CIGNA Corporation; Deluxe Corporation; Asset Allocation Trust |
Judith M. Johnson
(Born 1949) | | Trustee, since 2008; Audit Committee Chairman, since 2008 | | Retired. Prior thereto, Chief Executive Officer and Chief Investment Officer of Minneapolis Employees Retirement Fund from 1996 to 2008. Ms. Johnson is an attorney, certified public accountant and a certified managerial accountant. | | Asset Allocation Trust |
Leroy Keith, Jr.
(Born 1939) | | Trustee, since 2010 | | Chairman, Bloc Global Services (development and construction). Trustee of the Evergreen Funds from 1983 to 2010. Former Managing Director, Almanac Capital Management (commodities firm), former Partner, Stonington Partners, Inc. (private equity fund), former Director, Obagi Medical Products Co. and former Director, Lincoln Educational Services. | | Trustee, Virtus Fund Complex (consisting of 40 portfolios as of 12/31/11); Asset Allocation Trust |
David F. Larcker
(Born 1950) | | Trustee, since 2009 | | James Irvin Miller Professor of Accounting at the Graduate School of Business, Stanford University, Director of Corporate Governance Research Program and Senior Faculty of The Rock Center for Corporate Governance since 2006. From 2005 to 2008, Professor of Accounting at the Graduate School of Business, Stanford University. | | Asset Allocation Trust |
Olivia S. Mitchell
(Born 1953) | | Trustee, since 2006 | | International Foundation of Employee Benefit Plans Professor, Wharton School of the University of Pennsylvania since 1993. Director of Wharton’s Pension Research Council and Boettner Center on Pensions & Retirement Research, and Research Associate at the National Bureau of Economic Research. | | Asset Allocation Trust |
Timothy J. Penny
(Born 1951) | | Trustee, since 1996 | | President and CEO of Southern Minnesota Initiative Foundation, a non-profit organization, since 2007 and Senior Fellow at the Humphrey Institute Policy Forum at the University of Minnesota since 1995. Member of the Board of Trustees of NorthStar Education Finance, Inc., a non-profit organization, since 2007. | | Asset Allocation Trust |
| | | | |
| 174 | | Wells Fargo Advantage Equity Gateway Funds | | Other information (unaudited) |
| | | | | | |
Name and year of birth | | Position held and length of service* | | Principal occupations during past five years | | Other directorships during
past five years |
Michael S. Scofield
(Born 1943) | | Trustee, since 2010 | | Served on the Investment Company Institute’s Board of Governors and Executive Committee from 2008-2011 as well the Governing Council of the Independent Directors Council from 2006-2011 and the Independent Directors Council Executive Committee from 2008-2011. Chairman of the IDC from 2008-2010. Institutional Investor (Fund Directions) Trustee of Year in 2007. Trustee of the Evergreen Funds (and its predecessors) from 1984 to 2010. Chairman of the Evergreen Funds from 2000-2010. Former Trustee of the Mentor Funds. Retired Attorney, Law Offices of Michael S. Scofield. | | Asset Allocation Trust |
Donald C. Willeke
(Born 1940) | | Trustee, since 1996 | | Principal of the law firm of Willeke & Daniels. General Counsel of the Minneapolis Employees Retirement Fund from 1984 until its consolidation into the Minnesota Public Employees Retirement Association on June 30, 2010. Director, General Counsel, and Vice Chair of The Tree Trust (non-profit corporation). Director and General Counsel of The American Chestnut Foundation (non-profit corporation). | | Asset Allocation Trust |
| * | Length of service dates reflect the Trustee’s commencement of service with the Trust’s predecessor entities, where applicable. |
Officers
| | | | | | |
Name and year of birth | | Position held and
length of service | | Principal occupations during past five years | | |
Karla M. Rabusch
(Born 1959) | | President, since 2003 | | Executive Vice President of Wells Fargo Bank, N.A. and President of Wells Fargo Funds Management, LLC since 2003. | | |
Jeremy DePalma1
(Born 1974) | | Treasurer, since 2012 Assistant Treasurer, since 2009 | | Senior Vice President of Wells Fargo Funds Management, LLC since 2009. Senior Vice President of Evergreen Investment Management Company, LLC from 2008 to 2010. Vice President, Evergreen Investment Services, Inc. from 2004 to 2007. Head of the Fund Reporting and Control Team within Fund Administration from 2005 to 2010. | | |
Nancy Wiser1 (Born 1967) | | Treasurer, since 2012 | | Executive Vice President of Wells Fargo Funds Management, LLC since 2011. Chief Operating Officer and Chief Compliance Officer at LightBox Capital Management LLC, from 2008 to 2011. Owned and operated a consulting business providing services to various hedge funds including acting as Chief Operating Officer and Chief Compliance Officer for a hedge fund from 2007 to 2008. Chief Operating Officer and Chief Compliance Officer of GMN Capital LLC from 2006 to 2007. | | |
C. David Messman
(Born 1960) | | Secretary, since 2000; Chief Legal Officer, since 2003 | | Senior Vice President and Secretary of Wells Fargo Funds Management, LLC since 2001. Vice President and Managing Counsel of Wells Fargo Bank, N.A. since 1996. | | |
Debra Ann Early
(Born 1964) | | Chief Compliance Officer, since 2007 | | Chief Compliance Officer of Wells Fargo Funds Management, LLC since 2007. Chief Compliance Officer of Parnassus Investments from 2005 to 2007. Chief Financial Officer of Parnassus Investments from 2004 to 2007. | | |
David Berardi
(Born 1975) | | Assistant Treasurer, since 2009 | | Vice President of Wells Fargo Funds Management, LLC since 2009. Vice President of Evergreen Investment Management Company, LLC from 2008 to 2010. Assistant Vice President of Evergreen Investment Services, Inc. from 2004 to 2008. Manager of Fund Reporting and Control for Evergreen Investment Management Company, LLC from 2004 to 2010. | | |
| 1. | Jeremy DePalma acts as Treasurer of International Value Fund, International Equity Portfolio, International Growth Portfolio, International Index Portfolio and International Value Portfolio and Assistant Treasurer of the remaining funds in this shareholder report. In addition, Jeremy DePalma acts as Treasurer of 56 other funds and Assistant Treasurer of 60 other funds in the Fund Complex. Nancy Wiser serves as Treasurer of the remaining funds in this shareholder report as well as 60 other funds in the Fund Complex. |
| 2. | The Statement of Additional Information includes additional information about the Trustees and is available, without charge, upon request, by calling
1-800-222-8222 or by visiting the website at wellsfargoadvantagefunds.com. |
| | | | | | |
| List of abbreviations | | Wells Fargo Advantage Equity Gateway Funds | | | 175 | |
The following is a list of common abbreviations for terms and entities that may have appeared in this report.
| ACB | — Agricultural Credit Bank |
| ADR | — American depositary receipt |
| ADS | — American depositary shares |
| AGC-ICC | — Assured Guaranty Corporation - Insured Custody Certificates |
| AGM | — Assured Guaranty Municipal |
| AMBAC | — American Municipal Bond Assurance Corporation |
| AMT | — Alternative minimum tax |
| BAN | — Bond anticipation notes |
| BHAC | — Berkshire Hathaway Assurance Corporation |
| CAB | — Capital appreciation bond |
| CCAB | — Convertible capital appreciation bond |
| CDA | — Community Development Authority |
| CDO | — Collateralized debt obligation |
| COP | — Certificate of participation |
| DRIVER | — Derivative inverse tax-exempt receipts |
| DW&P | — Department of Water & Power |
| DWR | — Department of Water Resources |
| ECFA | — Educational & Cultural Facilities Authority |
| EDA | — Economic Development Authority |
| EDFA | — Economic Development Finance Authority |
| ETF | — Exchange-traded fund |
| FDIC | — Federal Deposit Insurance Corporation |
| FFCB | — Federal Farm Credit Banks |
| FGIC | — Financial Guaranty Insurance Corporation |
| FGLMC | — Federal Government Loan Mortgage Corporation |
| FHA | — Federal Housing Administration |
| FHLB | — Federal Home Loan Bank |
| FHLMC | — Federal Home Loan Mortgage Corporation |
| FICO | — The Financing Corporation |
| FNMA | — Federal National Mortgage Association |
| GDR | — Global depositary receipt |
| GNMA | — Government National Mortgage Association |
| HCFR | — Healthcare facilities revenue |
| HEFA | — Health & Educational Facilities Authority |
| HEFAR | — Higher education facilities authority revenue |
| HFA | — Housing Finance Authority |
| HFFA | — Health Facilities Financing Authority |
| IBC | — Insured bond certificate |
| IDA | — Industrial Development Authority |
| IDAG | — Industrial Development Agency |
| IDR | — Industrial development revenue |
| KRW | — Republic of Korea won |
| LIBOR | — London Interbank Offered Rate |
| LLC | — Limited liability company |
| LLP | — Limited liability partnership |
| MBIA | — Municipal Bond Insurance Association |
| MFHR | — Multifamily housing revenue |
| MSTR | — Municipal securities trust receipts |
| MUD | — Municipal Utility District |
| NATL-RE | — National Public Finance Guarantee Corporation |
| PCFA | — Pollution Control Financing Authority |
| PCL | — Public Company Limited |
| PCR | — Pollution control revenue |
| PFA | — Public Finance Authority |
| PFFA | — Public Facilities Financing Authority |
| PFOTER | — Puttable floating option tax-exempt receipts |
| plc | — Public limited company |
| PUTTER | — Puttable tax-exempt receipts |
| R&D | — Research & development |
| RDA | — Redevelopment Authority |
| RDFA | — Redevelopment Finance Authority |
| REIT | — Real estate investment trust |
| ROC | — Reset option certificates |
| SAVRS | — Select auction variable rate securities |
| SBA | — Small Business Authority |
| SFHR | — Single-family housing revenue |
| SFMR | — Single-family mortgage revenue |
| SPA | — Standby purchase agreement |
| SPDR | — Standard & Poor’s Depositary Receipts |
| STRIPS | — Separate trading of registered interest and principal securities |
| TAN | — Tax anticipation notes |
| TIPS | — Treasury inflation-protected securities |
| TRAN | — Tax revenue anticipation notes |
| TCR | — Transferable custody receipts |
| TTFA | — Transportation Trust Fund Authority |
| TVA | — Tennessee Valley Authority |
| XLCA | — XL Capital Assurance |
This page is intentionally left blank.
This page is intentionally left blank.
This page is intentionally left blank.


For more information
More information about Wells Fargo Advantage Funds is available free upon request. To obtain literature, please write, email, visit the Fund’s website, or call:
Wells Fargo Advantage Funds
P.O. Box 8266
Boston, MA 02266-8266
Email: wfaf@wellsfargo.com
Website: wellsfargoadvantagefunds.com
Individual investors: 1-800-222-8222
Retail investment professionals: 1-888-877-9275
Institutional investment professionals: 1-866-765-0778
This report and the financial statements contained herein are submitted for the general information of the shareholders of Wells Fargo Advantage Funds. If this report is used for promotional purposes, distribution of the report must be accompanied or preceded by a current prospectus. For a current prospectus and, if available, a summary prospectus containing more complete information, including charges and expenses, call 1-800-222-8222 or visit the Fund’s website at wellsfargoadvantagefunds.com. Please consider the investment objectives, risks, charges, and expenses of the investment carefully before investing. This and other information about Wells Fargo Advantage Funds can be found in the current prospectus. Read the prospectus carefully before you invest or send money.
Wells Fargo Funds Management, LLC, a wholly owned subsidiary of Wells Fargo & Company, provides investment advisory and administrative services for Wells Fargo Advantage Funds. Other affiliates of Wells Fargo & Company provide subadvisory and other services for the Funds. The Funds are distributed by Wells Fargo Funds Distributor, LLC, Member FINRA/SIPC, an affiliate of Wells Fargo & Company.
NOT FDIC INSURED ¡ NO BANK GUARANTEE ¡ MAY LOSE VALUE
© 2013 Wells Fargo Funds Management, LLC. All rights reserved.
| | |
 | | 213710 01-13 SEGF/SAR111 11-12 |

Wells Fargo Advantage Income Funds

Semi-Annual Report
November 30, 2012
| n | | Wells Fargo Advantage Core Bond Fund (formerly, Wells Fargo Advantage Total Return Bond Fund) |
| n | | Wells Fargo Advantage Inflation-Protected Bond Fund |

Reduce clutter. Save trees.
Sign up for electronic delivery of prospectuses and shareholder reports at wellsfargo.com/advantagedelivery
Contents
The views expressed and any forward-looking statements are as of November 30, 2012, unless otherwise noted, and are those of the Fund managers and/or Wells Fargo Funds Management, LLC. Discussions of individual securities, or the markets generally, or any Wells Fargo Advantage Fund are not intended as individual recommendations. Future events or results may vary significantly from those expressed in any forward-looking statements; the views expressed are subject to change at any time in response to changing circumstances in the market. Wells Fargo Funds Management, LLC, disclaims any obligation to publicly update or revise any views expressed or forward-looking statements.
NOT FDIC INSURED ¡ NO BANK GUARANTEE ¡ MAY LOSE VALUE

Wells Fargo investment history
| | |
| 1932 | | Keystone creates one of the first mutual fund families. |
| 1971 | | Wells Fargo & Company introduces one of the first institutional index funds. |
| 1978 | | Wells Fargo applies Markowitz and Sharpe’s research on Modern Portfolio Theory to introduce one of the industry’s first tactical asset allocation models in institutional separately managed accounts. |
| 1984 | | Wells Fargo Stagecoach Funds launches its first asset allocation fund. |
| 1989 | | The Tactical Asset Allocation (TAA) Model is first applied to Wells Fargo’s asset allocation mutual funds. |
| 1994 | | Wells Fargo introduces the LifePath Funds, one of the first suites of target date funds (now the Wells Fargo Advantage Dow Jones Target Date FundsSM). |
| 1996 | | Evergreen Investments and Keystone Funds merge. |
| 1997 | | Wells Fargo launches the Wells Fargo Advantage WealthBuilder PortfoliosSM, a fund-of-funds suite of products that includes the use of quantitative models to shift assets among investment styles. |
| 1999 | | Norwest Advantage Funds and Stagecoach Funds are reorganized into Wells Fargo Funds after the merger of Norwest and Wells Fargo. |
| 2002 | | Evergreen Retail and Evergreen Institutional companies form the umbrella asset management company, Evergreen Investments. |
| 2005 | | The integration of Strong Funds with Wells Fargo Funds creates Wells Fargo Advantage Funds, resulting in one of the top 20 mutual fund companies in the United States. |
| 2006 | | Wells Fargo Advantage Funds relaunches the target date product line as Wells Fargo Advantage Dow Jones Target Date Funds. |
| 2010 | | The mergers and reorganizations of Evergreen and Wells Fargo Advantage mutual funds are completed, unifying the families under the brand of Wells Fargo Advantage Funds. |
Wells Fargo Advantage Funds®
Wells Fargo Advantage Funds skillfully guides institutions, financial advisors, and individuals through the investment terrain to help them reach their financial objectives. Everything we do on behalf of investors is backed by our unique combination of qualifications.
Strength
Our organization is built on the standards of integrity and service established by our parent company—Wells Fargo & Company—more than 150 years ago. And, because we’re part of a highly diversified financial enterprise, we offer the depth of resources to help investors succeed.
Expertise
Our multi-boutique model offers investors access to the independent thinking of premier investment managers that have been chosen for their time-tested strategies. While each team specializes in a specific investment strategy, collectively they provide investors a wide choice of distinct investment styles. Our dedication to investment excellence doesn’t end with our expertise in manager selection—risk management, analysis, and rigorous ongoing review seek to ensure each manager’s investment process remains consistent.
Partnership
Our collaborative approach is built around understanding the needs and goals of our clients. By adhering to core principles of sound judgment and steady guidance, we support you through every stage of the investment decision process.
Carefully consider the investment objectives, risks, charges, and expenses before investing. For a current prospectus and, if available, a summary prospectus, for Wells Fargo Advantage Funds, containing this and other information, visit wellsfargoadvantagefunds.com. Read it carefully before investing.
Wells Fargo Funds Management, LLC, a wholly owned subsidiary of Wells Fargo & Company, provides investment advisory and administrative services for Wells Fargo Advantage Funds. Other affiliates of Wells Fargo & Company provide subadvisory and other services for the Funds. The Funds are distributed by Wells Fargo Funds Distributor, LLC, Member FINRA/SIPC, an affiliate of Wells Fargo & Company.
“Dow Jones®” and “Dow Jones Target Date IndexesSM” are service marks of Dow Jones Trademark Holdings LLC (“Dow Jones”); have been licensed to CME Group Index Services LLC (“CME Indexes”); and have been sublicensed for use for certain purposes by Global Index Advisors, Inc., and Wells Fargo Funds Management, LLC. The Wells Fargo Advantage Dow Jones Target Date FundsSM, based on the Dow Jones Target Date Indexes, are not sponsored, endorsed, sold, or promoted by Dow Jones, CME Indexes, or their respective affiliates, and none of them makes any representation regarding the advisability of investing in such product(s).
NOT FDIC INSURED ¡ NO BANK GUARANTEE ¡ MAY LOSE VALUE
Not part of the semi-annual report.
Wells Fargo Advantage Funds offers more than 110 mutual funds across a wide range of asset classes, representing over $214 billion in assets under management, as of November 30, 2012.
| | | | |
| Equity funds | | | | |
Asia Pacific Fund | | Enterprise Fund† | | Opportunity Fund† |
C&B Large Cap Value Fund | | Equity Value Fund | | Precious Metals Fund |
C&B Mid Cap Value Fund | | Global Opportunities Fund | | Premier Large Company Growth Fund |
Capital Growth Fund | | Growth Fund | | Small Cap Opportunities Fund |
Common Stock Fund | | Index Fund | | Small Cap Value Fund |
Disciplined U.S. Core Fund | | International Equity Fund | | Small Company Growth Fund |
Discovery Fund† | | International Value Fund | | Small Company Value Fund |
Diversified Equity Fund | | Intrinsic Small Cap Value Fund | | Small/Mid Cap Core Fund |
Diversified International Fund | | Intrinsic Value Fund | | Small/Mid Cap Value Fund |
Diversified Small Cap Fund | | Intrinsic World Equity Fund | | Special Mid Cap Value Fund |
Emerging Growth Fund | | Large Cap Core Fund | | Special Small Cap Value Fund |
Emerging Markets Equity Fund | | Large Cap Growth Fund | | Specialized Technology Fund |
Emerging Markets Equity Income Fund | | Large Company Value Fund | | Traditional Small Cap Growth Fund |
Endeavor Select Fund† | | Omega Growth Fund | | Utility and Telecommunications Fund |
| Bond funds | | | | |
Adjustable Rate Government Fund | | Income Plus Fund | | Short Duration Government Bond Fund |
California Limited-Term Tax-Free Fund | | Inflation-Protected Bond Fund | | Short-Term Bond Fund |
California Tax-Free Fund | | Intermediate Tax/AMT-Free Fund | | Short-Term High Yield Bond Fund |
Colorado Tax-Free Fund | | International Bond Fund | | Short-Term Municipal Bond Fund |
Core Bond Fund | | Minnesota Tax-Free Fund | | Strategic Municipal Bond Fund |
Emerging Markets Local Bond Fund | | Municipal Bond Fund | | Ultra Short-Term Income Fund |
Government Securities Fund | | North Carolina Tax-Free Fund | | Ultra Short-Term Municipal Income Fund |
High Income Fund | | Pennsylvania Tax-Free Fund | | Wisconsin Tax-Free Fund |
High Yield Bond Fund | | | | |
| Asset allocation funds | | | | |
Absolute Return Fund | | WealthBuilder Equity Portfolio† | | Target 2020 Fund† |
Asset Allocation Fund | | WealthBuilder Growth Allocation Portfolio† | | Target 2025 Fund† |
Conservative Allocation Fund | | WealthBuilder Growth Balanced Portfolio† | | Target 2030 Fund† |
Diversified Capital Builder Fund | | WealthBuilder Moderate Balanced Portfolio† | | Target 2035 Fund† |
Diversified Income Builder Fund | | WealthBuilder Tactical Equity Portfolio† | | Target 2040 Fund† |
Growth Balanced Fund | | Target Today Fund† | | Target 2045 Fund† |
Index Asset Allocation Fund | | Target 2010 Fund† | | Target 2050 Fund† |
Moderate Balanced Fund | | Target 2015 Fund† | | Target 2055 Fund† |
WealthBuilder Conservative Allocation Portfolio† | | | | |
| Money market funds | | | | |
100% Treasury Money Market Fund | | Heritage Money Market Fund† | | National Tax-Free Money Market Fund |
California Municipal Money Market Fund | | Money Market Fund | | Prime Investment Money Market Fund |
Cash Investment Money Market Fund | | Municipal Cash Management Money Market Fund | | Treasury Plus Money Market Fund |
Government Money Market Fund | | Municipal Money Market Fund | | |
| Variable trust funds1 | | | | |
VT Discovery Fund† | | VT Intrinsic Value Fund | | VT Small Cap Growth Fund |
VT Index Asset Allocation Fund | | VT Omega Growth Fund | | VT Small Cap Value Fund |
VT International Equity Fund | | VT Opportunity Fund† | | VT Total Return Bond Fund |
An investment in a money market fund is not insured or guaranteed by the Federal Deposit Insurance Corporation or any other government agency. Although the Wells Fargo Advantage Money Market Funds seek to preserve the value of your investment at $1.00 per share, it is possible to lose money by investing in a money market fund.
| 1. | The variable trust funds are generally available only through insurance company variable contracts. |
| † | In this report, the Wells Fargo Advantage Discovery FundSM, Wells Fargo Advantage Endeavor Select FundSM, Wells Fargo Advantage Enterprise FundSM, Wells Fargo Advantage Opportunity FundSM, Wells Fargo Advantage WealthBuilder Conservative Allocation PortfolioSM, Wells Fargo Advantage WealthBuilder Equity PortfolioSM, Wells Fargo Advantage WealthBuilder Growth Allocation PortfolioSM, Wells Fargo Advantage WealthBuilder Growth Balanced PortfolioSM, Wells Fargo Advantage WealthBuilder Moderate Balanced PortfolioSM, Wells Fargo Advantage WealthBuilder Tactical Equity PortfolioSM, Wells Fargo Advantage Dow Jones Target Today FundSM, Wells Fargo Advantage Dow Jones Target 2010 FundSM, Wells Fargo Advantage Dow Jones Target 2015 FundSM, Wells Fargo Advantage Dow Jones Target 2020 FundSM, Wells Fargo Advantage Dow Jones Target 2025 FundSM, Wells Fargo Advantage Dow Jones Target 2030 FundSM, Wells Fargo Advantage Dow Jones Target 2035 FundSM, Wells Fargo Advantage Dow Jones Target 2040 FundSM, Wells Fargo Advantage Dow Jones Target 2045 FundSM, Wells Fargo Advantage Dow Jones Target 2050 FundSM, Wells Fargo Advantage Dow Jones Target 2055 FundSM, Wells Fargo Advantage Heritage Money Market FundSM, Wells Fargo Advantage VT Discovery FundSM, and Wells Fargo Advantage VT Opportunity FundSM are referred to as the Discovery Fund, Endeavor Select Fund, Enterprise Fund, Opportunity Fund, WealthBuilder Conservative Allocation Portfolio, WealthBuilder Equity Portfolio, WealthBuilder Growth Allocation Portfolio, WealthBuilder Growth Balanced Portfolio, WealthBuilder Moderate Balanced Portfolio, WealthBuilder Tactical Equity Portfolio, Target Today Fund, Target 2010 Fund, Target 2015 Fund, Target 2020 Fund, Target 2025 Fund, Target 2030 Fund, Target 2035 Fund, Target 2040 Fund, Target 2045 Fund, Target 2050 Fund, Target 2055 Fund, Heritage Money Market Fund, VT Discovery Fund, and VT Opportunity Fund, respectively. |
Not part of the semi-annual report.
| | | | |
| 2 | | Wells Fargo Advantage Income Funds | | Letter to shareholders (unaudited) |

Karla M. Rabusch
President
Wells Fargo Advantage Funds
Fixed-income performance was best among corporate bonds and commercial mortgage-backed securities (CMBS), as continued monetary accommodation from the U.S. Federal Reserve (Fed) strengthened the demand for securities with higher yields.
Dear Valued Shareholder:
We are pleased to offer you this semi-annual report for the Wells Fargo Advantage Income Funds, which covers the six-month period that ended November 30, 2012. During the period, fixed-income performance was best among corporate bonds and commercial mortgage-backed securities (CMBS), as continued monetary accommodation from the U.S. Federal Reserve (Fed) strengthened the demand for securities with higher yields. The lower-rated credit tiers and longest-maturity segments of the fixed-income market outperformed the higher-quality and shorter-maturity segments. Volatility rippled through the markets on and off throughout the period as deteriorating credit conditions in Europe routinely counteracted burgeoning trends of economic improvement in the U.S.
Despite significant risk aversion at the outset of the period, U.S. credit markets rallied.
Just prior to the reporting period in May 2012, global credit markets were roiled once again by a crescendo of sovereign debt problems in Europe that appeared to threaten the very viability of the euro. These leading events set the context for what would occur during the six-month period. During the month, Greece once again approached default on its sovereign debt and this time hinted at the possibility of exiting the euro. Consequently, global investors returned to a protective posture and rallied to the U.S. Treasury market, driving long-term yields to some of their lowest levels on record. U.S. Treasuries and the highest-rated credit tiers were the best performers during May 2012 and the first two weeks of June, while the lower-rated credit tiers generally performed positively but offered less return, with spread-widening offsetting the benefits of their higher yields.
For several weeks, it appeared that investors would continue to prefer higher quality over the riskier asset classes as long as the problems in Europe persisted, but by mid-June 2012, these trends began to reverse as credit market confidence refortified in the U.S. The second half of June and the entire month of July saw some of the strongest performance in the lower-rated and longer-maturity segments of the fixed-income markets from the entire six-month period. The A-rated, BBB-rated, and BB-rated1 segments of the markets performed best, as investors rallied to the higher yield and more moderate credit risk of those mid-grade credit tiers.
Credit sectors outperformed U.S. Treasuries.
Corporate bonds and CMBS continued to perform strongly through the rest of the period, significantly outpacing the returns from U.S. Treasuries, which had been the better-returning sector at the very beginning of the period. U.S. Treasury inflation-protected securities (TIPS) performed relatively well but similarly underperformed the corporate bond and CMBS sectors. However, TIPS performed better than the Treasury market, benefiting from an increase in inflation expectations that drove the value of their inflation-protection components higher. In fact, the appreciating value of the inflation-protection feature drove TIPS to outperform the mortgage-backed securities (MBS) and asset-backed securities (ABS) sectors during the period, resulting in some competitively generous returns.
| 1. | The ratings indicated are from Standard & Poor’s. Standard & Poor’s rates the creditworthiness of bonds, ranging from AAA (highest) to D (lowest). We generally define higher-quality (investment grade) bonds as bonds having a rating above BBB/Baa and lower-quality bonds as bonds having a rating below BBB/Baa. |
| | | | | | |
| Letter to shareholders (unaudited) | | Wells Fargo Advantage Income Funds | | | 3 | |
Thus, the theme for the period in the U.S. fixed-income markets was a strengthening rally of mid-grade and lower-rated debt securities as investors increasingly sought higher-yielding securities and resisted the effects of ongoing volatility in the European credit markets. On the whole, most credit-related sectors generated relatively generous returns during the six-month period considering the extraordinarily low level of interest rates. Corporate bonds and CMBS
generally performed exceedingly well, followed by the TIPS sector and then ABS and MBS. Additionally, longer-maturity securities performed the best, with each respectively longer maturity range outperforming the one shorter than it. Thus, investment strategies that focused on mid-rated credit tiers and longer-maturity securities generally saw the strongest returns during the period.
Don’t let short-term uncertainty derail long-term investment goals.
Periods of uncertainty can present challenges, but experience has taught us that maintaining a long-term investment strategy based on individual goals and risk tolerance can be an effective way to plan for the future. To help you create a sound strategy based on your personal goals and risk tolerance, Wells Fargo Advantage Funds offers more than 110 mutual funds and other investments spanning a wide range of asset classes and investment styles. Although diversification cannot guarantee an investment profit or prevent losses, we believe it can be an effective way to manage investment risk and potentially smooth out overall portfolio performance.
Thank you for choosing to invest with Wells Fargo Advantage Funds. We appreciate your confidence in us and remain committed to helping you meet your financial needs. For current information about your fund investments, contact your investment professional, visit our website at wellsfargoadvantagefunds.com, or call us directly at 1-800-222-8222. We are available 24 hours a day, 7 days a week.
Sincerely,

Karla M. Rabusch
President
Wells Fargo Advantage Funds
Most credit-related sectors generated relatively generous returns during the six-month period considering the extraordinarily low level of interest rates.
Notice to shareholders
At its November 6-7, 2012 meeting, the Board of Trustees unanimously approved the following modifications to certain Class A sales load waiver privileges, with each change becoming effective on July 1, 2013:
| | n | | Annuity payments received under an annuity option or from death proceeds will no longer qualify for net asset value (NAV) repurchase privileges. | |
| | n | | The ability to reinvest redemption proceeds at NAV will be reduced from 120 days to 90 days. | |
| | n | | NAV purchase privileges for certain types of “grandfathered” shareholders will be modified to remove the ability to purchase Class A shares at NAV, unless those shares are held directly with the Fund. | |
Please contact your investment professional or call us directly at 1-800-222-8222 if you have any questions on this Notice to Shareholders.
| | | | |
| 4 | | Wells Fargo Advantage Income Funds | | Performance highlights (unaudited) |
Wells Fargo Advantage Core Bond Fund1
Investment objective
The Fund seeks total return, consisting of income and capital appreciation.
Adviser
Wells Fargo Funds Management, LLC
Subadviser for master portfolio
Wells Capital Management Incorporated
Portfolio managers
Troy Ludgood
Thomas O’Connor, CFA
Average annual total returns2 (%) as of November 30, 2012
| | | | | | | | | | | | | | | | | | |
| | | | | Including sales charge | | Excluding sales charge | | Expense ratios3 (%) |
| | | Inception date | | 1 year | | 5 year | | 10 year | | 1 year | | 5 year | | 10 year | | Gross | | Net4 |
| Class A (MBFAX) | | 10-31-01 | | 2.47 | | 6.14 | | 5.27 | | 7.30 | | 7.12 | | 5.76 | | 0.85 | | 0.78 |
| Class B (MBFBX)* | | 10-31-01 | | 1.52 | | 5.94 | | 5.19 | | 6.52 | | 6.25 | | 5.19 | | 1.60 | | 1.53 |
| Class C (MBFCX) | | 10-31-01 | | 5.55 | | 6.25 | | 4.91 | | 6.55 | | 6.25 | | 4.91 | | 1.60 | | 1.53 |
| Class R (WTRRX) | | 7-9-10 | | – | | – | | – | | 7.01 | | 6.79 | | 5.51 | | 1.10 | | 1.03 |
| Administrator Class (MNTRX) | | 6-30-97 | | – | | – | | – | | 7.40 | | 7.19 | | 5.91 | | 0.79 | | 0.70 |
| Institutional Class (MBFIX) | | 10-31-01 | | – | | – | | – | | 7.79 | | 7.49 | | 6.16 | | 0.52 | | 0.42 |
| Investor Class (WTRZX) | | 4-8-05 | | – | | – | | – | | 7.24 | | 7.02 | | 5.68 | | 0.88 | | 0.81 |
| Barclays U.S. Aggregate Bond Index5 | | – | | – | | – | | – | | 5.51 | | 6.04 | | 5.41 | | – | | – |
* Class B shares are closed to investment, except in connection with the reinvestment of any distributions and permitted exchanges.
Figures quoted represent past performance, which is no guarantee of future results and do not reflect the deduction of taxes that a shareholder may pay on fund distributions or the redemption of fund shares. Investment return and principal value of an investment will fluctuate so that an investor’s shares, when redeemed, may be worth more or less than their original cost. Performance shown without sales charges would be lower if sales charges were reflected. Current performance may be lower or higher than the performance data quoted and assumes the reinvestment of dividends and capital gains. Current month-end performance is available on the Fund’s website, wellsfargoadvantagefunds.com.
Index returns do not include transaction costs associated with buying and selling securities, any mutual fund fees or expenses, or any taxes. It is not possible to invest directly in an index.
For Class A shares, the maximum front-end sales charge is 4.50%. For Class B shares, the maximum contingent deferred sales charge is 5.00%. For Class C shares, the maximum contingent deferred sales charge is 1.00%. Performance including sales charge assumes the sales charge for the corresponding time period. Class R, Administrator Class, Institutional Class, and Investor Class shares are sold without a front-end sales charge or contingent deferred sales charge.
Bond values fluctuate in response to the financial condition of individual issuers, general market and economic conditions, and changes in interest rates. In general, when interest rates rise, bond values fall and investors may lose principal value. The use of derivatives may reduce returns and/or increase volatility. Certain investment strategies tend to increase the total risk of an investment (relative to the broader market). The Fund is exposed to foreign investment risk and mortgage- and asset-backed securities risk. Consult the Fund’s prospectus for additional information on these and other risks.
Please see footnotes on page 5.
| | | | | | |
| Performance highlights (unaudited) | | Wells Fargo Advantage Income Funds | | | 5 | |
Wells Fargo Advantage Core Bond Fund (continued)
| | | | |
| Ten largest long-term holdings6 (%) as of November 30, 2012 | |
FNMA, 2.50%, 2-1-27 | | | 3.97 | |
U.S. Treasury Note, 0.38%, 11-15-15 | | | 3.52 | |
U.S. Treasury Note, 3.00%, 9-30-16 | | | 2.47 | |
FNMA, 4.00%, 9-1-42 | | | 2.28 | |
FNMA, 2.50%, 1-1-27 | | | 2.01 | |
U.S. Treasury Note, 0.25%, 10-15-15 | | | 1.76 | |
FHLMC, 2.50%, 1-1-27 | | | 1.57 | |
FNMA, 6.00%, 3-1-34 | | | 1.48 | |
U.S. Treasury Note, 0.25%, 1-15-15 | | | 1.46 | |
Chase Issuance Trust Series 2012-A6 Class A, 0.34%, 8-15-17 | | | 1.39 | |
| | |
| Portfolio allocation7 as of November 30, 2012 |
|
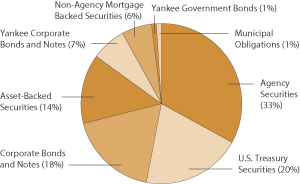
|
| 1. | The Fund is a gateway feeder fund that invests all of its assets in a single master portfolio of the Wells Fargo Master Trust (the “Master Trust”) with a substantially similar investment objective and substantially similar investment strategies. References to the investment activities of the Fund are intended to refer to the investment activities of the master portfolio in which it invests. See Notes to Financial Statements for a discussion of the Master Trust. |
| 2. | Historical performance shown for Class R and Investor Class shares prior to their inception reflects the performance of the Administrator Class shares, adjusted to reflect the higher expenses applicable to Class R and Investor Class shares. Effective June 20, 2008, Class Z was renamed Investor Class and modified to assume the features and attributes of the Investor Class. |
| 3. | Reflects the expense ratios as stated in the most recent prospectuses. |
| 4. | The Adviser has committed through September 30, 2014, to waive fees and/or reimburse expenses to the extent necessary to cap the Fund’s Total Annual Fund Operating Expenses After Fee Waiver, excluding certain expenses, at the amounts shown. Brokerage commissions, stamp duty fees, interest, taxes, acquired fund fees and expenses, and extraordinary expenses are excluded from the cap. Fees from the underlying master portfolio(s) are included in the cap. Without this cap, the Fund’s returns would have been lower. |
| 5. | The Barclays U.S. Aggregate Bond Index is composed of the Barclays U.S. Government/Credit Index and the Barclays U.S. Mortgage-Backed Securities Index and includes U.S. Treasury issues, agency issues, corporate bond issues, and mortgage-backed securities. You cannot invest directly in an index. |
| 6. | The ten largest long-term holdings are calculated based on the value of the securities of the master portfolio allocable to the Fund divided by the total net assets of the Fund. Holdings are subject to change and may have changed since the date specified. |
| 7. | Portfolio allocation is subject to change and represents the portfolio allocation of the master portfolio which is calculated based on the total long-term investments of the master portfolio. |
| | | | |
| 6 | | Wells Fargo Advantage Income Funds | | Performance highlights (unaudited) |
Wells Fargo Advantage Inflation-Protected Bond Fund1
Investment objective
The Fund seeks returns that exceed the rate of inflation over the long-term.
Adviser
Wells Fargo Funds Management, LLC
Subadviser for master portfolio
Wells Capital Management Incorporated
Portfolio managers
Michael J. Bray, CFA
Jay N. Mueller, CFA
Average annual total returns (%) as of November 30, 2012
| | | | | | | | | | | | | | | | | | |
| | | | | Including sales charge | | Excluding sales charge | | Expense ratios2 (%) |
| | | Inception date | | 1 year | | 5 year | | Life of Fund | | 1 year | | 5 year | | Life of Fund | | Gross | | Net3 |
| Class A (IPBAX) | | 2-28-03 | | 2.02 | | 5.16 | | 5.06 | | 6.82 | | 6.13 | | 5.56 | | 1.14 | | 0.85 |
| Class B (IPBBX)* | | 2-28-03 | | 1.06 | | 5.09 | | 4.96 | | 6.06 | | 5.41 | | 4.96 | | 1.89 | | 1.60 |
| Class C (MBFCX) | | 2-28-03 | | 5.14 | | 5.45 | | 4.80 | | 6.14 | | 5.45 | | 4.80 | | 1.89 | | 1.60 |
| Administrator Class (MNTRX) | | 2-28-03 | | – | | – | | – | | 7.07 | | 6.46 | | 5.83 | | 1.08 | | 0.60 |
| Barclays U.S. Treasury Inflation-Protected Securities Index4 | | – | | – | | – | | – | | 7.72 | | 7.14 | | 6.41 | | – | | – |
| * | | Class B shares are closed to investment, except in connection with the reinvestment of any distributions and permitted exchanges. |
Figures quoted represent past performance, which is no guarantee of future results and do not reflect the deduction of taxes that a shareholder may pay on fund distributions or the redemption of fund shares. Investment return and principal value of an investment will fluctuate so that an investor’s shares, when redeemed, may be worth more or less than their original cost. Performance shown without sales charges would be lower if sales charges were reflected. Current performance may be lower or higher than the performance data quoted and assumes the reinvestment of dividends and capital gains. Current month-end performance is available on the Fund’s website, wellsfargoadvantagefunds.com.
Index returns do not include transaction costs associated with buying and selling securities, any mutual fund fees or expenses, or any taxes. It is not possible to invest directly in an index.
For Class A shares, the maximum front-end sales charge is 4.50%. For Class B shares, the maximum contingent deferred sales charge is 5.00%. For Class C shares, the maximum contingent deferred sales charge is 1.00%. Performance including sales charge assumes the sales charge for the corresponding time period. Administrator Class shares are sold without a front-end sales charge or contingent deferred sales charge.
Bond values fluctuate in response to the financial condition of individual issuers, general market and economic conditions, and changes in interest rates. In general, when interest rates rise, bond values fall and investors may lose principal value. The principal value of and interest payments on inflation-protected debt securities tend to fall with the rate of inflation. The use of derivatives may reduce returns and/or increase volatility. Certain investment strategies tend to increase the total risk of an investment (relative to the broader market). The Fund is exposed to mortgage- and asset-backed securities risk. Consult the Fund’s prospectus for additional information on these and other risks.
Please see footnotes on page 7.
| | | | | | |
| Performance highlights (unaudited) | | Wells Fargo Advantage Income Funds | | | 7 | |
Wells Fargo Advantage Inflation-Protected Bond Fund (continued)
| | | | |
| Ten largest long-term holdings5 (%) as of November 30, 2012 | |
TIPS, 0.63%, 7-15-21 | | | 6.77 | |
TIPS, 1.13%, 1-15-21 | | | 6.38 | |
TIPS, 0.13%, 4-15-16 | | | 6.01 | |
TIPS, 2.38%, 1-15-25 | | | 5.94 | |
TIPS, 1.25%, 7-15-20 | | | 5.78 | |
TIPS, 0.13%, 1-15-22 | | | 5.56 | |
TIPS, 2.13%, 2-15-21 | | | 4.75 | |
TIPS, 0.13%, 7-15-22 | | | 4.62 | |
TIPS, 3.63%, 4-15-28 | | | 4.59 | |
TIPS, 2.00%, 1-15-26 | | | 4.52 | |
| | |
| Effective maturity distribution6 as of November 30, 2012 |
|
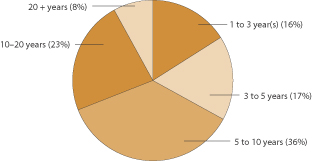
|
| 1. | The Fund is a gateway feeder fund that invests all of its assets in a single master portfolio of the Wells Fargo Master Trust (the “Master Trust”) with a substantially similar investment objective and substantially similar investment strategies. References to the investment activities of the Fund are intended to refer to the investment activities of the master portfolio in which it invests. See Notes to Financial Statements for a discussion of the Master Trust. |
| 2. | Reflects the expense ratios as stated in the most recent prospectuses. |
| 3. | The Adviser has committed through September 30, 2013, to waive fees and/or reimburse expenses to the extent necessary to cap the Fund’s Total Annual Fund Operating Expenses After Fee Waiver, excluding certain expenses, at the amounts shown. Brokerage commissions, stamp duty fees, interest, taxes, acquired fund fees and expenses, and extraordinary expenses are excluded from the cap. Fees from the underlying master portfolio(s) are included in the cap. Without this cap, the Fund’s returns would have been lower. |
| 4. | The Barclays U.S. Treasury Inflation-Protected Securities Index is an index of inflation-indexed linked U.S. Treasury securities. You cannot invest directly in an index. |
| 5. | The ten largest long-term holdings are calculated based on the value of the securities of the master portfolio allocable to the Fund divided by the total net assets of the Fund. Holdings are subject to change and may have changed since the date specified. |
| 6. | Effective maturity represents the effective maturity of the master portfolio and is calculated based on the total long-term investments of the master portfolio. It is subject to change and may have changed since the date specified. |
| | | | |
| 8 | | Wells Fargo Advantage Income Funds | | Fund expenses (unaudited) |
As a shareholder of the Fund, you incur two types of costs: (1) transaction costs, including sales charges (loads) on purchase payments and contingent deferred sales charges (if any) on redemptions and (2) ongoing costs, including management fees, distribution (12b-1) and/or shareholder service fees, and other Fund expenses. This example is intended to help you understand your ongoing costs (in dollars) of investing in the Fund and to compare these costs with the ongoing costs of investing in other mutual funds.
The example is based on an investment of $1,000 invested at the beginning of the six-month period and held for the entire period from June 1, 2012, to November 30, 2012.
Actual expenses
The “Actual” line of the table below provides information about actual account values and actual expenses. You may use the information in this line, together with the amount you invested, to estimate the expenses that you paid over the period. Simply divide your account value by $1,000 (for example, an $8,600 account value divided by $1,000 = 8.6), then multiply the result by the number in the “Actual” line under the heading entitled “Expenses paid during period” for your applicable class of shares to estimate the expenses you paid on your account during this period.
Hypothetical example for comparison purposes
The “Hypothetical” line of the table below provides information about hypothetical account values and hypothetical expenses based on the Fund’s actual expense ratio and an assumed rate of return of 5% per year before expenses, which is not the Fund’s actual return. The hypothetical account values and expenses may not be used to estimate the actual ending account balance or expenses you paid for the period. You may use this information to compare the ongoing costs of investing in the Fund and other funds. To do so, compare this 5% hypothetical example with the 5% hypothetical examples that appear in the shareholder reports of the other funds.
Please note that the expenses shown in the table are meant to highlight your ongoing costs only and do not reflect any transactional costs, such as sales charges (loads) and contingent deferred sales charges. Therefore, the “Hypothetical” line of the table is useful in comparing ongoing costs only and will not help you determine the relative total costs of owning different funds. In addition, if these transactional costs were included, your costs would have been higher.
| | | | | | | | | | | | | | | | |
| Wells Fargo Advantage Core Bond Fund | | Beginning
account value
6-1-12 | | | Ending
account value
11-30-12 | | | Expenses
paid during
the period¹ | | | Net annual
expense ratio | |
Class A | | | | | | | | | | | | | | | | |
Actual | | $ | 1,000.00 | | | $ | 1,031.00 | | | $ | 4.23 | | | | 0.83 | % |
Hypothetical (5% return before expenses) | | $ | 1,000.00 | | | $ | 1,020.91 | | | $ | 4.20 | | | | 0.83 | % |
Class B | | | | | | | | | | | | | | | | |
Actual | | $ | 1,000.00 | | | $ | 1,026.48 | | | $ | 7.98 | | | | 1.57 | % |
Hypothetical (5% return before expenses) | | $ | 1,000.00 | | | $ | 1,017.20 | | | $ | 7.94 | | | | 1.57 | % |
Class C | | | | | | | | | | | | | | | | |
Actual | | $ | 1,000.00 | | | $ | 1,027.36 | | | $ | 8.03 | | | | 1.58 | % |
Hypothetical (5% return before expenses) | | $ | 1,000.00 | | | $ | 1,017.15 | | | $ | 7.99 | | | | 1.58 | % |
Class R | | | | | | | | | | | | | | | | |
Actual | | $ | 1,000.00 | | | $ | 1,029.51 | | | $ | 5.44 | | | | 1.07 | % |
Hypothetical (5% return before expenses) | | $ | 1,000.00 | | | $ | 1,019.70 | | | $ | 5.42 | | | | 1.07 | % |
Administrator Class | | | | | | | | | | | | | | | | |
Actual | | $ | 1,000.00 | | | $ | 1,031.43 | | | $ | 3.56 | | | | 0.70 | % |
Hypothetical (5% return before expenses) | | $ | 1,000.00 | | | $ | 1,021.56 | | | $ | 3.55 | | | | 0.70 | % |
Institutional Class | | | | | | | | | | | | | | | | |
Actual | | $ | 1,000.00 | | | $ | 1,033.67 | | | $ | 2.14 | | | | 0.42 | % |
Hypothetical (5% return before expenses) | | $ | 1,000.00 | | | $ | 1,022.96 | | | $ | 2.13 | | | | 0.42 | % |
Investor Class | | | | | | | | | | | | | | | | |
Actual | | $ | 1,000.00 | | | $ | 1,030.66 | | | $ | 4.33 | | | | 0.85 | % |
Hypothetical (5% return before expenses) | | $ | 1,000.00 | | | $ | 1,020.81 | | | $ | 4.31 | | | | 0.85 | % |
| | | | | | |
| Fund expenses (unaudited) | | Wells Fargo Advantage Income Funds | | | 9 | |
| | | | | | | | | | | | | | | | |
| Wells Fargo Advantage Inflation-Protected Bond Fund | | Beginning
account value
6-1-12 | | | Ending
account value
11-30-12 | | | Expenses
paid during
the period¹ | | | Net annual
expense ratio | |
Class A | | | | | | | | | | | | | | | | |
Actual | | $ | 1,000.00 | | | $ | 1,024.07 | | | $ | 4.31 | | | | 0.85 | % |
Hypothetical (5% return before expenses) | | $ | 1,000.00 | | | $ | 1,020.81 | | | $ | 4.31 | | | | 0.85 | % |
Class B | | | | | | | | | | | | | | | | |
Actual | | $ | 1,000.00 | | | $ | 1,020.31 | | | $ | 8.10 | | | | 1.60 | % |
Hypothetical (5% return before expenses) | | $ | 1,000.00 | | | $ | 1,017.05 | | | $ | 8.09 | | | | 1.60 | % |
Class C | | | | | | | | | | | | | | | | |
Actual | | $ | 1,000.00 | | | $ | 1,021.17 | | | $ | 8.11 | | | | 1.60 | % |
Hypothetical (5% return before expenses) | | $ | 1,000.00 | | | $ | 1,017.05 | | | $ | 8.09 | | | | 1.60 | % |
Administrator Class | | | | | | | | | | | | | | | | |
Actual | | $ | 1,000.00 | | | $ | 1,025.31 | | | $ | 3.05 | | | | 0.60 | % |
Hypothetical (5% return before expenses) | | $ | 1,000.00 | | | $ | 1,022.06 | | | $ | 3.04 | | | | 0.60 | % |
| 1. | Expenses paid is equal to the annualized expense ratio of each class multiplied by the average account value over the period, multiplied by the number of days in the most recent fiscal half-year divided by the number of days in the fiscal year (to reflect the one-half-year period). |
| | | | |
| 10 | | Wells Fargo Advantage Income Funds | | Portfolio of investments—November 30, 2012 (unaudited) |
CORE BOND FUND
| | | | | | | | | | |
| Security name | | | | | | | | Value | |
| | | | |
Investment Companies: 99.98% | | | | | | | | | | |
| | | | |
| Affiliated Master Portfolio: 99.98% | | | | | | | | | | |
Wells Fargo Advantage Core Bond Portfolio | | | | | | | | $ | 3,324,108,899 | |
| | | | | | | | | | |
| | | | |
Total Investment Companies (Cost $3,255,958,108) | | | | | | | | | 3,324,108,899 | |
| | | | | | | | | | |
| | | | | | | | |
Total investments in securities (Cost $3,255,958,108) * | | | 99.98 | % | | | 3,324,108,899 | |
Other assets and liabilities, net
| | | 0.02 | | | | 565,386 | |
| | | | | | | | |
| Total net assets | | | 100.00 | % | | $ | 3,324,674,285 | |
| | | | | | | | |
| * | Cost for federal income tax purposes is substantially the same as for financial reporting purposes. |
The accompanying notes are an integral part of these financial statements.
| | | | | | |
| Portfolio of investments—November 30, 2012 (unaudited) | | Wells Fargo Advantage Income Funds | | | 11 | |
INFLATION-PROTECTED BOND FUND
| | | | | | | | | | |
| Security name | | | | | | | | Value | |
| | | | |
Investment Companies: 100.31% | | | | | | | | | | |
| | | | |
| Affiliated Master Portfolio: 100.31% | | | | | | | | | | |
Wells Fargo Advantage Inflation-Protected Bond Portfolio | | | | | | | | $ | 63,588,443 | |
| | | | | | | | | | |
| | | | |
Total Investment Companies (Cost $56,567,493) | | | | | | | | | 63,588,443 | |
| | | | | | | | | | |
| | | | | | | | |
Total investments in securities (Cost $56,567,493) * | | | 100.31 | % | | | 63,588,443 | |
Other assets and liabilities, net | | | (0.31 | ) | | | (194,605 | ) |
| | | | | | | | |
| Total net assets | | | 100.00 | % | | $ | 63,393,838 | |
| | | | | | | | |
| * | Cost for federal income tax purposes is substantially the same as for financial reporting purposes. |
The accompanying notes are an integral part of these financial statements.
| | | | |
| 12 | | Wells Fargo Advantage Income Funds | | Statements of assets and liabilities—November 30, 2012 (unaudited) |
| | | | | | | | |
| | | Core Bond
Fund | | | Inflation-
Protected
Bond Fund | |
| | |
Assets | | | | | | | | |
Investment in affiliated Master Portfolio, at value (see cost below) | | $ | 3,324,108,899 | | | $ | 63,588,443 | |
Receivable for Fund shares sold | | | 4,732,091 | | | | 68,405 | |
Receivable from administrator | | | 141,626 | | | | 14,412 | |
Prepaid expenses and other assets | | | 166,841 | | | | 15,134 | |
| | | | | | | | |
Total assets | | | 3,329,149,457 | | | | 63,686,394 | |
| | | | | | | | |
| | |
Liabilities | | | | | | | | |
Dividends payable | | | 605,814 | | | | 15,959 | |
Payable for Fund shares redeemed | | | 2,757,603 | | | | 214,986 | |
Distribution fees payable | | | 98,492 | | | | 10,919 | |
Due to other related parties | | | 442,644 | | | | 11,316 | |
Shareholder report expenses payable | | | 64,158 | | | | 23,975 | |
Shareholder servicing fees payable | | | 295,332 | | | | 14,101 | |
Accrued expenses and other liabilities | | | 211,129 | | | | 1,300 | |
| | | | | | | | |
Total liabilities | | | 4,475,172 | | | | 292,556 | |
| | | | | | | | |
Total net assets | | $ | 3,324,674,285 | | | $ | 63,393,838 | |
| | | | | | | | |
| | |
NET ASSETS CONSIST OF | | | | | | | | |
Paid-in capital | | $ | 3,185,318,040 | | | $ | 53,837,461 | |
Undistributed (overdistributed) net investment income | | | (591,362 | ) | | | 84,779 | |
Accumulated net realized gains on investments | | | 71,796,816 | | | | 2,450,648 | |
Net unrealized gains on investments | | | 68,150,791 | | | | 7,020,950 | |
| | | | | | | | |
Total net assets | | $ | 3,324,674,285 | | | $ | 63,393,838 | |
| | | | | | | | |
| | |
COMPUTATION OF NET ASSET VALUE AND OFFERING PRICE PER SHARE1 | | | | | | | | |
Net assets – Class A | | $ | 465,631,301 | | | $ | 36,314,197 | |
Shares outstanding – Class A | | | 33,782,833 | | | | 3,084,170 | |
Net asset value per share – Class A | | | $13.78 | | | | $11.77 | |
Maximum offering price per share – Class A2 | | | $14.43 | | | | $12.32 | |
Net assets – Class B | | $ | 10,644,076 | | | $ | 898,794 | |
Shares outstanding – Class B | | | 774,430 | | | | 76,867 | |
Net asset value per share – Class B | | | $13.74 | | | | $11.69 | |
Net assets – Class C | | $ | 131,756,871 | | | $ | 15,681,675 | |
Shares outstanding – Class C | | | 9,646,344 | | | | 1,339,670 | |
Net asset value per share – Class C | | | $13.66 | | | | $11.71 | |
Net assets – Class R | | $ | 20,918,700 | | | | N/A | |
Shares outstanding – Class R | | | 1,552,551 | | | | N/A | |
Net asset value per share – Class R | | | $13.47 | | | | N/A | |
Net assets – Administrator Class | | $ | 643,456,224 | | | $ | 10,499,172 | |
Shares outstanding – Administrator Class | | | 47,756,078 | | | | 888,077 | |
Net asset value per share – Administrator Class | | | $13.47 | | | | $11.82 | |
Net assets – Institutional Class | | $ | 1,950,850,547 | | | | N/A | |
Shares outstanding – Institutional Class | | | 144,985,286 | | | | N/A | |
Net asset value per share – Institutional Class | | | $13.46 | | | | N/A | |
Net assets – Investor Class | | $ | 101,416,566 | | | | N/A | |
Shares outstanding – Investor Class | | | 7,527,178 | | | | N/A | |
Net asset value per share – Investor Class | | | $13.47 | | | | N/A | |
| | |
Investment in affiliated Master Portfolio, at cost | | $ | 3,255,958,108 | | | $ | 56,567,493 | |
| | | | | | | | |
| 1. | Each Fund has an unlimited number of authorized shares. |
| 2. | Maximum offering price is computed as 100/95.50 of net asset value. On investments of $50,000 or more, the offering price is reduced. |
The accompanying notes are an integral part of these financial statements.
| | | | | | |
| Statements of operations—six months ended November 30, 2012 (unaudited) | | Wells Fargo Advantage Income Funds | | | 13 | |
| | | | | | | | |
| | | Core Bond
Fund | | | Inflation-
Protected
Bond Fund | |
| | |
Investment income | | | | | | | | |
Interest allocated from affiliated Master Portfolio* | | $ | 38,210,518 | | | $ | 760,401 | |
Securities lending income allocated from affiliated Master Portfolio | | | 44,060 | | | | 3,675 | |
Expenses allocated from affiliated Master Portfolio | | | (6,560,310 | ) | | | (156,374 | ) |
Waivers allocated from affiliated Master Portfolio | | | 255,421 | | | | 13,738 | |
| | | | | | | | |
Total investment income | | | 31,949,689 | | | | 621,440 | |
| | | | | | | | |
| | |
Expenses | | | | | | | | |
Administration fees | | | | | | | | |
Fund level | | | 901,784 | | | | 16,207 | |
Class A | | | 376,938 | | | | 30,537 | |
Class B | | | 9,177 | | | | 747 | |
Class C | | | 106,100 | | | | 12,635 | |
Class R | | | 16,992 | | | | N/A | |
Administrator Class | | | 382,299 | | | | 4,965 | |
Institutional Class | | | 846,855 | | | | N/A | |
Investor Class | | | 84,127 | | | | N/A | |
Shareholder servicing fees | | | | | | | | |
Class A | | | 588,966 | | | | 47,713 | |
Class B | | | 14,132 | | | | 1,168 | |
Class C | | | 165,780 | | | | 19,743 | |
Class R | | | 26,968 | | | | N/A | |
Administrator Class | | | 943,129 | | | | 12,149 | |
Investor Class | | | 110,694 | | | | N/A | |
Distribution fees | | | | | | | | |
Class B | | | 43,018 | | | | 3,503 | |
Class C | | | 497,342 | | | | 59,228 | |
Class R | | | 26,968 | | | | N/A | |
Custody and accounting fees | | | 67,693 | | | | 2,102 | |
Professional fees | | | 8,643 | | | | 11,315 | |
Registration fees | | | 97,739 | | | | 21,093 | |
Shareholder report expenses | | | 56,812 | | | | 11,211 | |
Trustees’ fees and expenses | | | 7,794 | | | | 6,220 | |
Other fees and expenses | | | 38,670 | | | | 3,889 | |
| | | | | | | | |
Total expenses | | | 5,418,620 | | | | 264,425 | |
Less: Fee waivers and/or expense reimbursements | | | (1,029,909 | ) | | | (81,218 | ) |
| | | | | | | | |
Net expenses | | | 4,388,711 | | | | 183,207 | |
| | | | | | | | |
Net investment income | | | 27,560,978 | | | | 438,233 | |
| | | | | | | | |
| | |
REALIZED AND UNREALIZED GAINS (LOSSES) ON INVESTMENTS | | | | | | | | |
Net realized gains on securities transaction allocated from affiliated Master Portfolio | | | 98,142,016 | | | | 1,516,410 | |
Net change in unrealized gains (losses) on securities transactions allocated from affiliated Master Portfolio | | | (12,290,115 | ) | | | (464,111 | ) |
| | | | | | | | |
Net realized and unrealized gains (losses) on investments | | | 85,851,901 | | | | 1,052,299 | |
| | | | | | | | |
Net increase in net assets resulting from operations | | $ | 113,412,879 | | | $ | 1,490,532 | |
| | | | | | | | |
| | |
* Net of foreign interest withholding taxes allocated from affiliated Master Portfolio in the amount of | | | $38,073 | | | | $0 | |
The accompanying notes are an integral part of these financial statements.
| | | | |
| 14 | | Wells Fargo Advantage Income Funds | | Statements of changes in net assets |
| | | | | | | | | | | | | | | | |
| | | Core Bond Fund | |
| | | Six months ended
November 30, 2012 (unaudited) | | | Year ended
May 31, 2012 | |
| | | | |
Operations | | | | | | | | | | | | | | | | |
Net investment income | | | | | | $ | 27,560,978 | | | | | | | $ | 66,854,164 | |
Net realized gains on investments | | | | | | | 98,142,016 | | | | | | | | 144,354,876 | |
Net change in unrealized gains (losses) on investments | | | | | | | (12,290,115 | ) | | | | | | | 27,356,838 | |
| | | | | | | | | | | | | | | | |
Net increase in net assets resulting from operations | | | | | | | 113,412,879 | | | | | | | | 238,565,878 | |
| | | | | | | | | | | | | | | | |
| | | | |
Distributions to shareholders from | | | | | | | | | | | | | | | | |
Net investment income | | | | | | | | | | | | | | | | |
Class A | | | | | | | (3,314,564 | ) | | | | | | | (7,662,520 | ) |
Class B | | | | | | | (38,077 | ) | | | | | | | (178,134 | ) |
Class C | | | | | | | (434,955 | ) | | | | | | | (1,396,862 | ) |
Class R | | | | | | | (124,689 | ) | | | | | | | (260,384 | ) |
Administrator Class | | | | | | | (5,861,689 | ) | | | | | | | (19,053,792 | ) |
Institutional Class | | | | | | | (19,083,265 | ) | | | | | | | (37,297,779 | ) |
Investor Class | | | | | | | (610,309 | ) | | | | | | | (1,010,788 | ) |
Net realized gains | | | | | | | | | | | | | | | | |
Class A | | | | | | | 0 | | | | | | | | (9,454,465 | ) |
Class B | | | | | | | 0 | | | | | | | | (325,495 | ) |
Class C | | | | | | | 0 | | | | | | | | (2,783,467 | ) |
Class R | | | | | | | 0 | | | | | | | | (353,950 | ) |
Administrator Class | | | | | | | 0 | | | | | | | | (21,245,767 | ) |
Institutional Class | | | | | | | 0 | | | | | | | | (38,599,513 | ) |
Investor Class | | | | | | | 0 | | | | | | | | (1,276,941 | ) |
| | | | | | | | | | | | | | | | |
Total distributions to shareholders | | | | | | | (29,467,548 | ) | | | | | | | (140,899,857 | ) |
| | | | | | | | | | | | | | | | |
| | | | |
Capital share transactions | | | Shares | | | | | | | | Shares | | | | | |
Proceeds from shares sold | | | | | | | | | | | | | | | | |
Class A | | | 5,244,041 | | | | 71,523,160 | | | | 17,684,107 | | | | 234,567,193 | |
Class B | | | 63,592 | | | | 866,180 | | | | 211,793 | | | | 2,807,036 | |
Class C | | | 1,449,041 | | | | 19,592,776 | | | | 3,945,348 | | | | 51,872,342 | |
Class R | | | 444,068 | | | | 5,926,029 | | | | 967,392 | | | | 12,538,640 | |
Administrator Class | | | 7,790,691 | | | | 103,871,195 | | | | 19,350,712 | | | | 250,782,208 | |
Institutional Class | | | 45,698,548 | | | | 610,337,024 | | | | 66,174,836 | | | | 856,275,279 | |
Investor Class | | | 2,515,626 | | | | 33,596,254 | | | | 3,946,394 | | | | 51,202,999 | |
| | | | | | | | | | | | | | | | |
| | | | | | | 845,712,618 | | | | | | | | 1,460,045,697 | |
| | | | | | | | | | | | | | | | |
Reinvestment of distributions | | | | | | | | | | | | | | | | |
Class A | | | 214,483 | | | | 2,934,884 | | | | 1,090,596 | | | | 14,364,133 | |
Class B | | | 2,634 | | | | 35,921 | | | | 34,213 | | | | 448,668 | |
Class C | | | 16,032 | | | | 217,407 | | | | 140,264 | | | | 1,827,367 | |
Class R | | | 3,026 | | | | 40,474 | | | | 13,097 | | | | 168,645 | |
Administrator Class | | | 424,706 | | | | 5,677,301 | | | | 3,045,066 | | | | 39,217,442 | |
Institutional Class | | | 1,209,534 | | | | 16,158,413 | | | | 5,026,156 | | | | 64,690,752 | |
Investor Class | | | 44,521 | | | | 595,815 | | | | 173,583 | | | | 2,235,890 | |
| | | | | | | | | | | | | | | | |
| | | | | | | 25,660,215 | | | | | | | | 122,952,897 | |
| | | | | | | | | | | | | | | | |
Payment for shares redeemed | | | | | | | | | | | | | | | | |
Class A | | | (5,097,813 | ) | | | (69,628,233 | ) | | | (11,924,505 | ) | | | (157,854,813 | ) |
Class B | | | (185,418 | ) | | | (2,524,024 | ) | | | (794,104 | ) | | | (10,480,923 | ) |
Class C | | | (1,387,591 | ) | | | (18,784,718 | ) | | | (3,109,709 | ) | | | (40,843,146 | ) |
Class R | | | (420,759 | ) | | | (5,634,993 | ) | | | (597,972 | ) | | | (7,730,830 | ) |
Administrator Class | | | (21,455,228 | ) | | | (287,442,894 | ) | | | (45,484,620 | ) | | | (588,136,697 | ) |
Institutional Class | | | (51,445,387 | ) | | | (689,772,223 | ) | | | (25,714,338 | ) | | | (332,895,670 | ) |
Investor Class | | | (743,390 | ) | | | (9,918,811 | ) | | | (1,432,007 | ) | | | (18,547,709 | ) |
| | | | | | | | | | | | | | | | |
| | | | | | | (1,083,705,896 | ) | | | | | | | (1,156,489,788 | ) |
| | | | | | | | | | | | | | | | |
Net increase (decrease) in net assets resulting from capital share transactions | | | | | | | (212,333,063 | ) | | | | | | | 426,508,806 | |
| | | | | | | | | | | | | | | | |
Total increase (decrease) in net assets | | | | | | | (128,387,732 | ) | | | | | | | 524,174,827 | |
| | | | | | | | | | | | | | | | |
| | | | |
Net assets | | | | | | | | | | | | | | | | |
Beginning of period | | | | | | | 3,453,062,017 | | | | | | | | 2,928,887,190 | |
| | | | | | | | | | | | | | | | |
End of period | | | | | | $ | 3,324,674,285 | | | | | | | $ | 3,453,062,017 | |
| | | | | | | | | | | | | | | | |
Undistributed (overdistributed) net investment income | | | | | | $ | (591,362 | ) | | | | | | $ | 1,315,208 | |
| | | | | | | | | | | | | | | | |
The accompanying notes are an integral part of these financial statements.
| | | | | | |
| Statements of changes in net assets | | Wells Fargo Advantage Income Funds | | | 15 | |
| | | | | | | | | | | | | | | | |
| | | Inflation-Protected Bond Fund | |
| | | Six months ended November 30, 2012
(unaudited) | | | Year ended May 31, 2012 | |
| | | | |
Operations | | | | | | | | | | | | | | | | |
Net investment income | | | | | | $ | 438,233 | | | | | | | $ | 1,695,938 | |
Net realized gains on investments | | | | | | | 1,516,410 | | | | | | | | 3,770,525 | |
Net change in unrealized gains (losses) on investments | | | | | | | (464,111 | ) | | | | | | | 3,064,616 | |
| | | | | | | | | | | | | | | | |
Net increase in net assets resulting from operations | | | | | | | 1,490,532 | | | | | | | | 8,531,079 | |
| | | | | | | | | | | | | | | | |
| | | | |
Distributions to shareholders from | | | | | | | | | | | | | | | | |
Net investment income | | | | | | | | | | | | | | | | |
Class A | | | | | | | (544,501 | ) | | | | | | | (1,092,069 | ) |
Class B | | | | | | | (9,588 | ) | | | | | | | (29,236 | ) |
Class C | | | | | | | (166,664 | ) | | | | | | | (360,585 | ) |
Administrator Class | | | | | | | (153,187 | ) | | | | | | | (606,974 | ) |
Net realized gains | | | | | | | | | | | | | | | | |
Class A | | | | | | | 0 | | | | | | | | (327,874 | ) |
Class B | | | | | | | 0 | | | | | | | | (10,025 | ) |
Class C | | | | | | | 0 | | | | | | | | (139,934 | ) |
Administrator Class | | | | | | | 0 | | | | | | | | (111,542 | ) |
| | | | | | | | | | | | | | | | |
Total distributions to shareholders | | | | | | | (873,940 | ) | | | | | | | (2,678,239 | ) |
| | | | | | | | | | | | | | | | |
| | | | |
Capital share transactions | | | Shares | | | | | | | | Shares | | | | | |
Proceeds from shares sold | | | | | | | | | | | | | | | | |
Class A | | | 417,198 | | | | 4,890,733 | | | | 967,342 | | | | 10,973,785 | |
Class B | | | 22,295 | | | | 257,025 | | | | 80,673 | | | | 902,222 | |
Class C | | | 95,159 | | | | 1,108,197 | | | | 464,925 | | | | 5,240,434 | |
Administrator Class | | | 162,177 | | | | 1,909,105 | | | | 396,682 | | | | 4,483,193 | |
| | | | | | | | | | | | | | | | |
| | | | | | | 8,165,060 | | | | | | | | 21,599,634 | |
| | | | | | | | | | | | | | | | |
Reinvestment of distributions | | | | | | | | | | | | | | | | |
Class A | | | 44,793 | | | | 522,311 | | | | 113,085 | | | | 1,284,941 | |
Class B | | | 703 | | | | 8,141 | | | | 2,222 | | | | 25,012 | |
Class C | | | 11,331 | | | | 131,195 | | | | 31,837 | | | | 359,654 | |
Administrator Class | | | 12,479 | | | | 146,083 | | | | 52,376 | | | | 592,884 | |
| | | | | | | | | | | | | | | | |
| | | | | | | 807,730 | | | | | | | | 2,262,491 | |
| | | | | | | | | | | | | | | | |
Payment for shares redeemed | | | | | | | | | | | | | | | | |
Class A | | | (545,762 | ) | | | (6,395,635 | ) | | | (734,837 | ) | | | (8,330,550 | ) |
Class B | | | (23,793 | ) | | | (276,254 | ) | | | (151,100 | ) | | | (1,690,668 | ) |
Class C | | | (115,186 | ) | | | (1,337,673 | ) | | | (454,577 | ) | | | (5,111,173 | ) |
Administrator Class | | | (126,396 | ) | | | (1,484,426 | ) | | | (2,863,678 | ) | | | (32,935,668 | ) |
| | | | | | | | | | | | | | | | |
| | | | | | | (9,493,988 | ) | | | | | | | (48,068,059 | ) |
| | | | | | | | | | | | | | | | |
Net decrease in net assets resulting from capital share transactions | | | | | | | (521,198 | ) | | | | | | | (24,205,934 | ) |
| | | | | | | | | | | | | | | | |
Total increase (decrease) in net assets | | | | | | | 95,394 | | | | | | | | (18,353,094 | ) |
| | | | | | | | | | | | | | | | |
| | | | |
Net assets | | | | | | | | | | | | | | | | |
Beginning of period | | | | | | | 63,298,444 | | | | | | | | 81,651,538 | |
| | | | | | | | | | | | | | | | |
End of period | | | | | | $ | 63,393,838 | | | | | | | $ | 63,298,444 | |
| | | | | | | | | | | | | | | | |
Undistributed net investment income | | | | | | $ | 84,779 | | | | | | | $ | 520,486 | |
| | | | | | | | | | | | | | | | |
The accompanying notes are an integral part of these financial statements.
| | | | |
| 16 | | Wells Fargo Advantage Income Funds | | Financial highlights |
| | | | | | | | | | | | | | | | | | | | |
| | | Beginning
net asset
value per
share | | | Net
investment
income1 | | | Net realized
and unrealized
gains
on investments | | | Distributions
from net
investment
income | | | Distributions
from
net
realized gains | |
| | | | | |
Core Bond Fund | | | | | | | | | | | | | | | | | | | | |
Class A | | | | | | | | | | | | | | | | | | | | |
June 1, 2012 to November 30, 2012 (unaudited) | | $ | 13.46 | | | | 0.09 | | | | 0.33 | | | | (0.10 | ) | | | 0.00 | |
June 1, 2011 to May 31, 2012 | | $ | 13.05 | | | | 0.26 | | | | 0.72 | | | | (0.26 | ) | | | (0.31 | ) |
June 1, 2010 to May 31, 2011 | | $ | 13.25 | | | | 0.31 | | | | 0.52 | | | | (0.33 | ) | | | (0.70 | ) |
June 1, 2009 to May 31, 2010 | | $ | 12.52 | | | | 0.36 | | | | 0.96 | | | | (0.47 | ) | | | (0.12 | ) |
June 1, 2008 to May 31, 2009 | | $ | 12.37 | | | | 0.56 | | | | 0.17 | | | | (0.58 | ) | | | 0.00 | |
June 1, 2007 to May 31, 2008 | | $ | 12.20 | | | | 0.56 | | | | 0.18 | | | | (0.57 | ) | | | 0.00 | |
Class B | | | | | | | | | | | | | | | | | | | | |
June 1, 2012 to November 30, 2012 (unaudited) | | $ | 13.43 | | | | 0.05 | | | | 0.31 | | | | (0.05 | ) | | | 0.00 | |
June 1, 2011 to May 31, 2012 | | $ | 13.01 | | | | 0.16 | | | | 0.73 | | | | (0.16 | ) | | | (0.31 | ) |
June 1, 2010 to May 31, 2011 | | $ | 13.22 | | | | 0.20 | | | | 0.52 | | | | (0.23 | ) | | | (0.70 | ) |
June 1, 2009 to May 31, 2010 | | $ | 12.53 | | | | 0.34 | | | | 0.84 | | | | (0.37 | ) | | | (0.12 | ) |
June 1, 2008 to May 31, 2009 | | $ | 12.38 | | | | 0.45 | | | | 0.19 | | | | (0.49 | ) | | | 0.00 | |
June 1, 2007 to May 31, 2008 | | $ | 12.21 | | | | 0.48 | | | | 0.17 | | | | (0.48 | ) | | | 0.00 | |
Class C | | | | | | | | | | | | | | | | | | | | |
June 1, 2012 to November 30, 2012 (unaudited) | | $ | 13.34 | | | | 0.04 | | | | 0.32 | | | | (0.04 | ) | | | 0.00 | |
June 1, 2011 to May 31, 2012 | | $ | 12.93 | | | | 0.16 | | | | 0.72 | | | | (0.16 | ) | | | (0.31 | ) |
June 1, 2010 to May 31, 2011 | | $ | 13.14 | | | | 0.22 | | | | 0.50 | | | | (0.23 | ) | | | (0.70 | ) |
June 1, 2009 to May 31, 2010 | | $ | 12.46 | | | | 0.34 | | | | 0.83 | | | | (0.37 | ) | | | (0.12 | ) |
June 1, 2008 to May 31, 2009 | | $ | 12.31 | | | | 0.46 | | | | 0.18 | | | | (0.49 | ) | | | 0.00 | |
June 1, 2007 to May 31, 2008 | | $ | 12.14 | | | | 0.47 | | | | 0.17 | | | | (0.47 | ) | | | 0.00 | |
Class R | | | | | | | | | | | | | | | | | | | | |
June 1, 2012 to November 30, 2012 (unaudited) | | $ | 13.16 | | | | 0.07 | 4 | | | 0.32 | | | | (0.08 | ) | | | 0.00 | |
June 1, 2011 to May 31, 2012 | | $ | 12.76 | | | | 0.22 | | | | 0.71 | | | | (0.22 | ) | | | (0.31 | ) |
July 9, 20105 to May 31, 2011 | | $ | 12.78 | | | | 0.25 | | | | 0.33 | | | | (0.25 | ) | | | (0.35 | ) |
Administrator Class | | | | | | | | | | | | | | | | | | | | |
June 1, 2012 to November 30, 2012 (unaudited) | | $ | 13.16 | | | | 0.10 | | | | 0.31 | | | | (0.10 | ) | | | 0.00 | |
June 1, 2011 to May 31, 2012 | | $ | 12.76 | | | | 0.27 | | | | 0.71 | | | | (0.27 | ) | | | (0.31 | ) |
June 1, 2010 to May 31, 2011 | | $ | 12.98 | | | | 0.33 | | | | 0.49 | | | | (0.34 | ) | | | (0.70 | ) |
June 1, 2009 to May 31, 2010 | | $ | 12.31 | | | | 0.44 | | | | 0.83 | | | | (0.48 | ) | | | (0.12 | ) |
June 1, 2008 to May 31, 2009 | | $ | 12.16 | | | | 0.56 | | | | 0.18 | | | | (0.59 | ) | | | 0.00 | |
June 1, 2007 to May 31, 2008 | | $ | 11.99 | | | | 0.57 | | | | 0.18 | | | | (0.58 | ) | | | 0.00 | |
Institutional Class | | | | | | | | | | | | | | | | | | | | |
June 1, 2012 to November 30, 2012 (unaudited) | | $ | 13.14 | | | | 0.11 | | | | 0.33 | | | | (0.12 | ) | | | 0.00 | |
June 1, 2011 to May 31, 2012 | | $ | 12.75 | | | | 0.31 | | | | 0.69 | | | | (0.30 | ) | | | (0.31) | |
June 1, 2010 to May 31, 2011 | | $ | 12.96 | | | | 0.36 | | | | 0.50 | | | | (0.37 | ) | | | (0.70) | |
June 1, 2009 to May 31, 2010 | | $ | 12.30 | | | | 0.50 | | | | 0.79 | | | | (0.51 | ) | | | (0.12) | |
June 1, 2008 to May 31, 2009 | | $ | 12.15 | | | | 0.59 | | | | 0.18 | | | | (0.62 | ) | | | 0.00 | |
June 1, 2007 to May 31, 2008 | | $ | 11.98 | | | | 0.61 | | | | 0.18 | | | | (0.62 | ) | | | 0.00 | |
Investor Class | | | | | | | | | | | | | | | | | | | | |
June 1, 2012 to November 30, 2012 (unaudited) | | $ | 13.16 | | | | 0.08 | | | | 0.32 | | | | (0.09 | ) | | | 0.00 | |
June 1, 2011 to May 31, 2012 | | $ | 12.76 | | | | 0.24 | | | | 0.72 | | | | (0.25 | ) | | | (0.31) | |
June 1, 2010 to May 31, 2011 | | $ | 12.98 | | | | 0.30 | | | | 0.50 | | | | (0.32 | ) | | | (0.70) | |
June 1, 2009 to May 31, 2010 | | $ | 12.30 | | | | 0.45 | | | | 0.80 | | | | (0.45 | ) | | | (0.12) | |
June 1, 2008 to May 31, 20096 | | $ | 12.15 | | | | 0.55 | | | | 0.17 | | | | (0.57 | ) | | | 0.00 | |
June 1, 2007 to May 31, 20086 | | $ | 11.99 | | | | 0.55 | | | | 0.16 | | | | (0.55 | ) | | | 0.00 | |
Please see footnotes on page 18.
The accompanying notes are an integral part of these financial statements.
| | | | | | |
| Financial highlights | | Wells Fargo Advantage Income Funds | | | 17 | |
| | | | | | | | | | | | | | | | | | | | | | | | | | |
Ending
net asset
value
per
share | | | Ratio to average net assets (annualized) | | | | | | Portfolio
turnover
rate3 | | | Net assets at
end of period
(000s omitted) | |
| | Net investment
income1 | | | Gross
expenses1 | | | Net
expenses1 | | | Total
return2 | | | |
| | | | | | |
| | | | | | | | | | | | | | | | | | | | | | | | | | | |
| | | | | | | | | | | | | | | | | | | | | | | | | | |
| $ | 13.78 | | | | 1.32 | % | | | 0.83 | % | | | 0.83 | % | | | 3.10 | % | | | 270 | % | | $ | 465,631 | |
| $ | 13.46 | | | | 1.91 | % | | | 0.82 | % | | | 0.82 | % | | | 7.65 | % | | | 803 | % | | $ | 450,013 | |
| $ | 13.05 | | | | 2.42 | % | | | 0.83 | % | | | 0.83 | % | | | 6.55 | % | | | 761 | % | | $ | 346,740 | |
| $ | 13.25 | | | | 3.21 | % | | | 0.84 | % | | | 0.84 | % | | | 10.71 | % | | | 638 | % | | $ | 182,316 | |
| $ | 12.52 | | | | 4.30 | % | | | 0.89 | % | | | 0.85 | % | | | 6.16 | % | | | 633 | % | | $ | 237,191 | |
| $ | 12.37 | | | | 4.49 | % | | | 0.99 | % | | | 0.90 | % | | | 6.15 | % | | | 572 | % | | $ | 65,825 | |
| | | | | | | | | | | | | | | | | | | | | | | | | | |
| $ | 13.74 | | | | 0.58 | % | | | 1.57 | % | | | 1.57 | % | | | 2.65 | % | | | 270 | % | | $ | 10,644 | |
| $ | 13.43 | | | | 1.23 | % | | | 1.57 | % | | | 1.57 | % | | | 6.95 | % | | | 803 | % | | $ | 11,998 | |
| $ | 13.01 | | | | 1.66 | % | | | 1.58 | % | | | 1.58 | % | | | 5.69 | % | | | 761 | % | | $ | 18,762 | |
| $ | 13.22 | | | | 2.65 | % | | | 1.59 | % | | | 1.59 | % | | | 9.56 | % | | | 638 | % | | $ | 7,514 | |
| $ | 12.53 | | | | 3.77 | % | | | 1.65 | % | | | 1.60 | % | | | 5.38 | % | | | 633 | % | | $ | 10,082 | |
| $ | 12.38 | | | | 3.69 | % | | | 1.75 | % | | | 1.65 | % | | | 5.36 | % | | | 572 | % | | $ | 13,248 | |
| | | | | | | | | | | | | | | | | | | | | | | | | | |
| $ | 13.66 | | | | 0.52 | % | | | 1.58 | % | | | 1.58 | % | | | 2.74 | % | | | 270 | % | | $ | 131,757 | |
| $ | 13.34 | | | | 1.18 | % | | | 1.57 | % | | | 1.57 | % | | | 6.90 | % | | | 803 | % | | $ | 127,677 | |
| $ | 12.93 | | | | 1.67 | % | | | 1.58 | % | | | 1.58 | % | | | 5.71 | % | | | 761 | % | | $ | 111,140 | |
| $ | 13.14 | | | | 2.45 | % | | | 1.59 | % | | | 1.59 | % | | | 9.50 | % | | | 638 | % | | $ | 32,556 | |
| $ | 12.46 | | | | 3.67 | % | | | 1.64 | % | | | 1.60 | % | | | 5.38 | % | | | 633 | % | | $ | 12,410 | |
| $ | 12.31 | | | | 3.78 | % | | | 1.74 | % | | | 1.65 | % | | | 5.37 | % | | | 572 | % | | $ | 5,632 | |
| | | | | | | | | | | | | | | | | | | | | | | | | | |
| $ | 13.47 | | | | 1.04 | % | | | 1.07 | % | | | 1.07 | % | | | 2.95 | % | | | 270 | % | | $ | 20,919 | |
| $ | 13.16 | | | | 1.67 | % | | | 1.07 | % | | | 1.07 | % | | | 7.43 | % | | | 803 | % | | $ | 20,088 | |
| $ | 12.76 | | | | 2.18 | % | | | 1.08 | % | | | 1.08 | % | | | 4.73 | % | | | 761 | % | | $ | 14,596 | |
| | | | | | | | | | | | | | | | | | | | | | | | | | |
| $ | 13.47 | | | | 1.48 | % | | | 0.76 | % | | | 0.70 | % | | | 3.14 | % | | | 270 | % | | $ | 643,456 | |
| $ | 13.16 | | | | 2.08 | % | | | 0.76 | % | | | 0.70 | % | | | 7.83 | % | | | 803 | % | | $ | 802,788 | |
| $ | 12.76 | | | | 2.54 | % | | | 0.77 | % | | | 0.70 | % | | | 6.62 | % | | | 761 | % | | $ | 1,073,115 | |
| $ | 12.98 | | | | 3.44 | % | | | 0.76 | % | | | 0.70 | % | | | 10.48 | % | | | 638 | % | | $ | 1,003,134 | |
| $ | 12.31 | | | | 4.65 | % | | | 0.82 | % | | | 0.70 | % | | | 6.35 | % | | | 633 | % | | $ | 816,927 | |
| $ | 12.16 | | | | 4.72 | % | | | 0.82 | % | | | 0.70 | % | | | 6.38 | % | | | 572 | % | | $ | 865,453 | |
| | | | | | | | | | | | | | | | | | | | | | | | | | |
| $ | 13.46 | | | | 1.68 | % | | | 0.49 | % | | | 0.42 | % | | | 3.37 | % | | | 270 | % | | $ | 1,950,851 | |
| $ | 13.14 | | | | 2.32 | % | | | 0.49 | % | | | 0.42 | % | | | 8.05 | % | | | 803 | % | | $ | 1,965,338 | |
| $ | 12.75 | | | | 2.84 | % | | | 0.50 | % | | | 0.42 | % | | | 7.00 | % | | | 761 | % | | $ | 1,325,962 | |
| $ | 12.96 | | | | 3.68 | % | | | 0.49 | % | | | 0.42 | % | | | 10.70 | % | | | 638 | % | | $ | 1,000,253 | |
| $ | 12.30 | | | | 4.91 | % | | | 0.55 | % | | | 0.42 | % | | | 6.65 | % | | | 633 | % | | $ | 604,992 | |
| $ | 12.15 | | | | 4.97 | % | | | 0.55 | % | | | 0.42 | % | | | 6.68 | % | | | 572 | % | | $ | 493,165 | |
| | | | | | | | | | | | | | | | | | | | | | | | | | |
| $ | 13.47 | | | | 1.24 | % | | | 0.86 | % | | | 0.85 | % | | | 3.07 | % | | | 270 | % | | $ | 101,417 | |
| $ | 13.16 | | | | 1.85 | % | | | 0.85 | % | | | 0.85 | % | | | 7.67 | % | | | 803 | % | | $ | 75,160 | |
| $ | 12.76 | | | | 2.38 | % | | | 0.87 | % | | | 0.86 | % | | | 6.45 | % | | | 761 | % | | $ | 38,573 | |
| $ | 12.98 | | | | 3.47 | % | | | 0.89 | % | | | 0.89 | % | | | 10.36 | % | | | 638 | % | | $ | 36,375 | |
| $ | 12.30 | | | | 4.36 | % | | | 0.95 | % | | | 0.90 | % | | | 6.15 | % | | | 633 | % | | $ | 18,005 | |
| $ | 12.15 | | | | 4.29 | % | | | 1.15 | % | | | 0.95 | % | | | 6.04 | % | | | 572 | % | | $ | 3,254 | |
Please see footnotes on page 18.
The accompanying notes are an integral part of these financial statements.
| | | | |
| 18 | | Wells Fargo Advantage Income Funds | | Financial highlights |
| | | | | | | | | | | | | | | | | | | | |
| | | Beginning
net asset
value per
share | | | Net
investment
income1 | | | Net realized
and unrealized
gains (losses)
on investments | | | Distributions
from net
investment
income | | | Distributions
from net
realized gains | |
| | | | | |
Inflation-Protected Bond Fund | | | | | | | | | | | | | | | | | | | | |
Class A | | | | | | | | | | | | | | | | | | | | |
June 1, 2012 to November 30, 2012 (unaudited) | | $ | 11.66 | | | | 0.09 | | | | 0.19 | | | | (0.17 | ) | | | 0.00 | |
June 1, 2011 to May 31, 2012 | | $ | 10.84 | | | | 0.27 | | | | 1.01 | | | | (0.36 | ) | | | (0.10 | ) |
June 1, 2010 to May 31, 2011 | | $ | 10.29 | | | | 0.31 | | | | 0.47 | | | | (0.23 | ) | | | 0.00 | |
June 1, 2009 to May 31, 2010 | | $ | 9.76 | | | | 0.31 | 4 | | | 0.49 | | | | (0.27 | ) | | | 0.00 | |
June 1, 2008 to May 31, 2009 | | $ | 10.22 | | | | 0.07 | | | | (0.25 | ) | | | (0.19 | ) | | | 0.00 | |
June 1, 2007 to May 31, 2008 | | $ | 9.62 | | | | 0.54 | | | | 0.62 | | | | (0.56 | ) | | | 0.00 | |
Class B | | | | | | | | | | | | | | | | | | | | |
June 1, 2012 to November 30, 2012 (unaudited) | | $ | 11.58 | | | | 0.04 | | | | 0.19 | | | | (0.12 | ) | | | 0.00 | |
June 1, 2011 to May 31, 2012 | | $ | 10.76 | | | | 0.19 | 4 | | | 1.00 | | | | (0.27 | ) | | | (0.10 | ) |
June 1, 2010 to May 31, 2011 | | $ | 10.20 | | | | 0.19 | 4 | | | 0.53 | | | | (0.16 | ) | | | 0.00 | |
June 1, 2009 to May 31, 2010 | | $ | 9.71 | | | | 0.24 | 4 | | | 0.47 | | | | (0.22 | ) | | | 0.00 | |
June 1, 2008 to May 31, 2009 | | $ | 10.20 | | | | 0.03 | | | | (0.29 | ) | | | (0.14 | ) | | | 0.00 | |
June 1, 2007 to May 31, 2008 | | $ | 9.60 | | | | 0.48 | | | | 0.61 | | | | (0.49 | ) | | | 0.00 | |
Class C | | | | | | | | | | | | | | | | | | | | |
June 1, 2012 to November 30, 2012 (unaudited) | | $ | 11.59 | | | | 0.04 | | | | 0.20 | | | | (0.12 | ) | | | 0.00 | |
June 1, 2011 to May 31, 2012 | | $ | 10.77 | | | | 0.19 | | | | 1.00 | | | | (0.27 | ) | | | (0.10 | ) |
June 1, 2010 to May 31, 2011 | | $ | 10.21 | | | | 0.24 | 4 | | | 0.48 | | | | (0.16 | ) | | | 0.00 | |
June 1, 2009 to May 31, 2010 | | $ | 9.72 | | | | 0.23 | 4 | | | 0.48 | | | | (0.22 | ) | | | 0.00 | |
June 1, 2008 to May 31, 2009 | | $ | 10.20 | | | | 0.01 | | | | (0.26 | ) | | | (0.14 | ) | | | 0.00 | |
June 1, 2007 to May 31, 2008 | | $ | 9.61 | | | | 0.45 | | | | 0.63 | | | | (0.49 | ) | | | 0.00 | |
Administrator Class | | | | | | | | | | | | | | | | | | | | |
June 1, 2012 to November 30, 2012 (unaudited) | | $ | 11.71 | | | | 0.10 | 4 | | | 0.19 | | | | (0.18 | ) | | | 0.00 | |
June 1, 2011 to May 31, 2012 | | $ | 10.89 | | | | 0.39 | 4 | | | 0.92 | | | | (0.39 | ) | | | (0.10 | ) |
June 1, 2010 to May 31, 2011 | | $ | 10.30 | | | | 0.33 | | | | 0.51 | | | | (0.25 | ) | | | 0.00 | |
June 1, 2009 to May 31, 2010 | | $ | 9.75 | | | | 0.33 | 4 | | | 0.49 | | | | (0.27 | ) | | | 0.00 | |
June 1, 2008 to May 31, 2009 | | $ | 10.21 | | | | 0.12 | | | | (0.28 | ) | | | (0.21 | ) | | | 0.00 | |
June 1, 2007 to May 31, 2008 | | $ | 9.60 | | | | 0.59 | | | | 0.61 | | | | (0.59 | ) | | | 0.00 | |
| 1. | Includes net expenses allocated from the Master Portfolio in which the Fund invests. |
| 2. | Total return calculations do not include any applicable sales charges. Returns for periods of less than one year are not annualized. |
| 3. | Portfolio turnover rate is calculated by aggregating the results of multiplying the Fund’s investment percentage in the respective Master Portfolio by the corresponding Master Portfolio’s portfolio turnover rate. |
| 4. | Calculated based upon average shares outstanding |
| 5. | Commencement of class operations |
| 6. | Effective June 20, 2008, Class Z was renamed Investor Class. |
The accompanying notes are an integral part of these financial statements.
| | | | | | |
| Financial highlights | | Wells Fargo Advantage Income Funds | | | 19 | |
| | | | | | | | | | | | | | | | | | | | | | | | | | | | | | |
Distributions
from
tax basis
return
of capital | | | Ending
net asset
value
per
share | | | Ratio to average net assets (annualized) | | | | | | Portfolio
turnover
rate3 | | | Net assets at
end of period
(000s omitted) | |
| | | Net investment
income1 | | | Gross
expenses1 | | | Net
expenses1 | | | Total
return2 | | | |
| | | | | | | |
| | | | | | | | | | | | | | | | | | | | | | | | | | | | | | | |
| | | | | | | | | | | | | | | | | | | | | | | | | | | | | | |
| | 0.00 | | | $ | 11.77 | | | | 1.52 | % | | | 1.07 | % | | | 0.85 | % | | | 2.41 | % | | | 9 | % | | $ | 36,314 | |
| | 0.00 | | | $ | 11.66 | | | | 2.42 | % | | | 1.11 | % | | | 0.85 | % | | | 12.02 | % | | | 23 | % | | $ | 36,935 | |
| | 0.00 | | | $ | 10.84 | | | | 2.90 | % | | | 1.04 | % | | | 0.85 | % | | | 7.59 | % | | | 19 | % | | $ | 30,581 | |
| | 0.00 | | | $ | 10.29 | | | | 3.09 | % | | | 0.98 | % | | | 0.85 | % | | | 8.23 | % | | | 31 | % | | $ | 30,086 | |
| | (0.09 | ) | | $ | 9.76 | | | | 0.66 | % | | | 0.95 | % | | | 0.83 | % | | | (1.68 | )% | | | 53 | % | | $ | 31,826 | |
| | 0.00 | | | $ | 10.22 | | | | 5.52 | % | | | 1.23 | % | | | 0.85 | % | | | 12.34 | % | | | 40 | % | | $ | 24,982 | |
| | | | | | | | | | | | | | | | | | | | | | | | | | | | | | |
| | 0.00 | | | $ | 11.69 | | | | 0.67 | % | | | 1.82 | % | | | 1.60 | % | | | 2.03 | % | | | 9 | % | | $ | 899 | |
| | 0.00 | | | $ | 11.58 | | | | 1.69 | % | | | 1.84 | % | | | 1.60 | % | | | 11.25 | % | | | 23 | % | | $ | 899 | |
| | 0.00 | | | $ | 10.76 | | | | 1.83 | % | | | 1.79 | % | | | 1.60 | % | | | 7.11 | % | | | 19 | % | | $ | 1,570 | |
| | 0.00 | | | $ | 10.20 | | | | 2.41 | % | | | 1.75 | % | | | 1.60 | % | | | 7.38 | % | | | 31 | % | | $ | 2,942 | |
| | (0.09 | ) | | $ | 9.71 | | | | 0.42 | % | | | 1.72 | % | | | 1.59 | % | | | (2.51 | )% | | | 53 | % | | $ | 5,255 | |
| | 0.00 | | | $ | 10.20 | | | | 4.61 | % | | | 1.98 | % | | | 1.60 | % | | | 11.53 | % | | | 40 | % | | $ | 7,365 | |
| | | | | | | | | | | | | | | | | | | | | | | | | | | | | | |
| | 0.00 | | | $ | 11.71 | | | | 0.76 | % | | | 1.82 | % | | | 1.60 | % | | | 2.12 | % | | | 9 | % | | $ | 15,682 | |
| | 0.00 | | | $ | 11.59 | | | | 1.68 | % | | | 1.86 | % | | | 1.60 | % | | | 11.24 | % | | | 23 | % | | $ | 15,631 | |
| | 0.00 | | | $ | 10.77 | | | | 2.27 | % | | | 1.79 | % | | | 1.60 | % | | | 7.11 | % | | | 19 | % | | $ | 14,074 | |
| | 0.00 | | | $ | 10.21 | | | | 2.32 | % | | | 1.75 | % | | | 1.60 | % | | | 7.36 | % | | | 31 | % | | $ | 12,412 | |
| | (0.09 | ) | | $ | 9.72 | | | | 0.18 | % | | | 1.69 | % | | | 1.59 | % | | | (2.41 | )% | | | 53 | % | | $ | 10,237 | |
| | 0.00 | | | $ | 10.20 | | | | 4.78 | % | | | 1.98 | % | | | 1.60 | % | | | 11.41 | % | | | 40 | % | | $ | 9,913 | |
| | | | | | | | | | | | | | | | | | | | | | | | | | | | | | |
| | 0.00 | | | $ | 11.82 | | | | 1.71 | % | | | 1.01 | % | | | 0.60 | % | | | 2.53 | % | | | 9 | % | | $ | 10,499 | |
| | 0.00 | | | $ | 11.71 | | | | 3.42 | % | | | 1.01 | % | | | 0.60 | % | | | 12.26 | % | | | 23 | % | | $ | 9,833 | |
| | 0.00 | | | $ | 10.89 | | | | 3.32 | % | | | 0.98 | % | | | 0.60 | % | | | 8.22 | % | | | 19 | % | | $ | 35,427 | |
| | 0.00 | | | $ | 10.30 | | | | 3.26 | % | | | 0.92 | % | | | 0.60 | % | | | 8.49 | % | | | 31 | % | | $ | 28,476 | |
| | (0.09 | ) | | $ | 9.75 | | | | 0.70 | % | | | 0.88 | % | | | 0.60 | % | | | (1.53 | )% | | | 53 | % | | $ | 27,428 | |
| | 0.00 | | | $ | 10.21 | | | | 5.43 | % | | | 1.06 | % | | | 0.60 | % | | | 12.74 | % | | | 40 | % | | $ | 14,926 | |
The accompanying notes are an integral part of these financial statements.
| | | | |
| 20 | | Wells Fargo Advantage Income Funds | | Notes to financial statements (unaudited) |
1. ORGANIZATION
Wells Fargo Funds Trust (the “Trust”), a Delaware statutory trust organized on March 10, 1999, is an open-end management investment company registered under the Investment Company Act of 1940, as amended (the “1940 Act”). These financial statements report on the following funds: Wells Fargo Advantage Core Bond Fund (“Core Bond Fund”) (formerly, Wells Fargo Advantage Total Return Bond Fund) and Wells Fargo Advantage Inflation-Protected Bond Fund (“Inflation-Protected Bond Fund”) (each, a “Fund”, collectively, the “Funds”). Each Fund is a diversified series of the Trust.
On November 30, 2012, Core Bond Fund began offering two new classes of shares, Class R4 and Class R6 shares, to participants in certain retirement plans. As of November 30, 2012, Wells Fargo Funds Management, LLC (“Funds Management”) purchased shares of Class R4 valued at $10,000 and shares of Class R6 valued at $50,000. Class R4 and Class R6 shares had no other activity for the period.
Each Fund seeks to achieve its investment objective by investing 100% of all its investable assets in a separate diversified portfolio (each, a “Master Portfolio”, collectively, the “Master Portfolios”) of Wells Fargo Master Trust, a registered open-end management investment company. Each Master Portfolio directly acquires portfolio securities, and a Fund investing in a Master Portfolio acquires an indirect interest in those securities. Each Fund accounts for its investment in the Master Portfolios as partnership investments and records on a daily basis its share of the Master Portfolio’s income, expense, and realized and unrealized gains and losses. The financial statements of the Master Portfolios for the six months ended November 30, 2012 are included in this report and should be read in conjunction with each Fund’s financial statements. As of November 30, 2012, Core Bond Fund owned 90% of Wells Fargo Advantage Core Bond Portfolio and Inflation-Protected Bond Fund owned 78% of Wells Fargo Advantage Inflation-Protected Bond Portfolio.
2. SIGNIFICANT ACCOUNTING POLICIES
The following significant accounting policies, which are consistently followed in the preparation of the financial statements of each Fund, are in conformity with U.S. generally accepted accounting principles which require management to make estimates and assumptions that affect the reported amounts of assets and liabilities, disclosure of contingent assets and liabilities at the date of the financial statements, and the reported amounts of revenues and expenses during the reporting period. Actual results could differ from those estimates.
Securities valuation
All investments are valued each business day as of the close of regular trading on the New York Stock Exchange (normally 4 p.m. Eastern Time).
Investments in the Master Portfolios are valued daily based on each Fund’s proportionate share of each Master Portfolio’s net assets, which are also valued daily. Securities held in the Master Portfolios are valued as discussed in the Notes to Financial Statements of the Master Portfolios, which are included elsewhere in this report.
Security transactions and income recognition
Securities transactions are recorded on a trade date basis in each Master Portfolio. Realized gains or losses in each Master Portfolio are recorded on the basis of identified cost.
Interest income is accrued daily and bond discounts are accreted and premiums are amortized daily based on the effective interest method by each Master Portfolio. To the extent debt obligations are placed on non-accrual status, any related interest income may be reduced by writing off interest receivables when the collection of all or a portion of interest has become doubtful based on consistently applied procedures. If the issuer subsequently resumes interest payments or when the collectability of interest is reasonably assured, the debt obligation is removed from non-accrual status.
Each Fund records on a daily basis its proportionate share of each Master Portfolio’s interest income, expenses, waivers, and realized and unrealized gains or losses.
Distributions to shareholders
Distributions to shareholders from net investment income are accrued daily and paid monthly. Distributions from net realized gains, if any, are recorded on the ex-dividend date. Such distributions are determined in conformity with federal income tax regulations, which may differ in amount or character from net investment income and realized gains recognized for purposes of U.S. generally accepted accounting principles.
| | | | | | |
| Notes to financial statements (unaudited) | | Wells Fargo Advantage Income Funds | | | 21 | |
Federal and other taxes
Each Fund is treated as a separate entity for federal income tax purposes. Each Fund intends to continue to qualify as a regulated investment company by distributing substantially all of its investment company taxable income and any net realized capital gains (after reduction for capital loss carryforwards) sufficient to relieve it from all, or substantially all, federal income taxes. Accordingly, no provision for federal income taxes was required.
Each Fund’s income and federal excise tax returns and all financial records supporting those returns for the prior three fiscal years are subject to examination by the federal and Delaware revenue authorities. Management has analyzed each Fund’s tax positions taken on federal, state, and foreign tax returns for all open tax years and does not believe that there are any uncertain tax positions that require recognition of a tax liability.
At May 31, 2012, net capital loss carryforwards, which are available to offset future net realized capital gains, were as follows:
| | | | | | | | | | | | | | | | | | | | |
| | | Pre-enactment capital loss expiration* | |
| | | 2013 | | | 2014 | | | 2015 | | | 2016 | | | 2017 | |
Core Bond Fund | | $ | 98,497 | | | $ | 7,915,745 | | | $ | 726,524 | | | $ | 61,281,963 | | | $ | 17,505,682 | |
| * | Losses incurred in taxable years beginning before December 22, 2010. |
Class allocations
The separate classes of shares offered by each Fund differ principally in applicable sales charges, distribution, shareholder servicing, and administration fees. Shareholders of each class bear certain expenses that pertain to that particular class. All shareholders bear the common expenses of a Fund, earn income from the portfolio, and are allocated unrealized gains and losses pro rata based on the average daily net assets of each class, without distinction between share classes. Dividends are determined separately for each class based on income and expenses allocable to each class. Realized gains and losses are allocated to each class pro rata based upon the net assets of each class on the date realized. Differences in per share dividend rates generally result from the relative weightings of pro rata income and realized gain allocations and from differences in separate class expenses, including distribution, shareholder servicing, and administration fees.
3. FAIR VALUATION MEASUREMENTS
Fair value measurements of investments are determined within a framework that has established a fair value hierarchy based upon the various data inputs utilized in determining the value of each Fund’s investments. The three-level hierarchy gives the highest priority to unadjusted quoted prices in active markets for identical assets or liabilities (Level 1) and the lowest priority to significant unobservable inputs (Level 3). Each Fund’s investments are classified within the fair value hierarchy based on the lowest level of input that is significant to the fair value measurement. The inputs are summarized into three broad levels as follows:
| n | | Level 1 – quoted prices in active markets for identical securities |
| n | | Level 2 – other significant observable inputs (including quoted prices for similar securities, interest rates, prepayment speeds, credit risk, etc.) |
| n | | Level 3 – significant unobservable inputs (including the Fund’s own assumptions in determining the fair value of investments) |
The inputs or methodologies used for valuing investments in securities are not necessarily an indication of the risk associated with investing in those securities.
At November 30, 2012, each Fund’s investment in an affiliated Master Portfolio carried at fair value was designated as Level 2 inputs.
Transfers in and transfers out are recognized at the end of the reporting period. For the six months ended November 30, 2012, the Funds did not have any transfers into/out of Level 1 or Level 2.
4. TRANSACTIONS WITH AFFILIATES AND OTHER EXPENSES
Advisory fees
The Trust has entered into an advisory contract with Funds Management, an indirect wholly owned subsidiary of Wells Fargo & Company (“Wells Fargo”). The adviser is responsible for implementing investment policies and guidelines of the Funds.
Since each Fund invests all of its assets in a single Master Portfolio, Funds Management does not currently receive an advisory fee.
| | | | |
| 22 | | Wells Fargo Advantage Income Funds | | Notes to financial statements (unaudited) |
Funds Management also serves as the adviser to each Master Portfolio and is entitled to receive a fee from each Master Portfolio for those services.
Administration and transfer agent fees
The Trust has entered into an administration agreement with Funds Management. Under this agreement, for providing administrative services, which includes paying fees and expenses for services provided by the transfer agent, sub-transfer agents, omnibus account servicers and record-keepers, Funds Management is entitled to receive from each Fund an annual fund level administration fee starting at 0.05% and declining to 0.03% as the average daily net assets of each Fund increase and a class level administration fee which is calculated based on the average daily net assets of each class as follows:
| | | | |
| | | Class level administration fee | |
Class A, Class B, Class C, Class R | | | 0.16 | % |
Administrator Class | | | 0.10 | |
Institutional Class | | | 0.08 | |
Investor Class | | | 0.19 | |
Funds Management has contractually waived and/or reimbursed administration fees to the extent necessary to maintain certain net operating expense ratios for the Funds. Waiver of fees and/or reimbursement of expenses by Funds Management were made first from fund level expenses on a proportionate basis and then from class specific expenses. Funds Management has committed to waive fees and/or reimburse expenses to the extent necessary to cap each Fund’s expenses as follows:
| | | | | | | | | | | | | | | | | | | | | | | | | | | | | | |
| | | Expiration date | | Class A | | | Class B | | | Class C | | | Class R | | | Administrator
Class | | | Institutional
Class | | | Investor
Class | |
Core Bond Fund | | September 30, 2014 | | | 0.78 | % | | | 1.53 | % | | | 1.53 | % | | | 1.03 | % | | | 0.70 | % | | | 0.42 | % | | | 0.81 | % |
Inflation-Protected Bond Fund | | September 30, 2013 | | | 0.85 | % | | | 1.60 | % | | | 1.60 | % | | | N/A | | | | 0.60 | % | | | N/A | | | | N/A | |
Distribution fees
The Trust has adopted a Distribution Plan for Class B, Class C, and Class R shares of the applicable Funds pursuant to Rule 12b-1 under the 1940 Act. Distribution fees are charged to the Class B, Class C, and Class R shares and paid to Wells Fargo Funds Distributor, LLC, the principal underwriter of each Fund, at an annual rate of 0.75% of the average daily net assets of Class B and Class C shares and 0.25% of the average daily net assets of Class R shares.
For the six months ended November 30, 2012, Wells Fargo Funds Distributor, LLC received the following amounts in front-end sales charges and contingent deferred sales charges.
| | | | | | | | | | | | | | | | |
| | | Front-end
sales charges Class A | | | Contingent deferred sales charges | |
| | | | Class A | | | Class B | | | Class C | |
Core Bond Fund | | $ | 12,005 | | | $ | 1,050 | | | $ | 660 | | | $ | 634 | |
Inflation-Protected Bond Fund | | | 7,122 | | | | 0 | | | | 0 | | | | 0 | |
Shareholder servicing fees
The Trust has entered into contracts with one or more shareholder servicing agents, whereby Class A, Class B, Class C, Class R, Administrator Class, and Investor Class of each applicable Fund is charged a fee at an annual rate of 0.25% of the average daily net assets of each respective class.
A portion of these total shareholder servicing fees were paid to affiliates of Wells Fargo.
| | | | | | |
| Notes to financial statements (unaudited) | | Wells Fargo Advantage Income Funds | | | 23 | |
5. INVESTMENT PORTFOLIO TRANSACTIONS
Purchases and sales of investments, excluding short-term securities, for the six months ended November 30, 2012 were as follows:
| | | | | | | | | | | | | | | | |
| | | Purchases at cost* | | | Sales proceeds* | |
| | | U.S.
Government | | | Non-U.S.
Government | | | U.S.
Government | | | Non-U.S.
Government | |
Core Bond Fund | | $ | 7,941,563,229 | | | $ | 1,897,297,953 | | | $ | 8,216,225,180 | | | $ | 1,665,076,603 | |
Inflation-Protected Bond Fund | | | 5,500,797 | | | | 0 | | | | 8,657,263 | | | | 0 | |
| * | The Funds seek to achieve their investment objective by investing all of its investable assets in a single Master Portfolio. Purchases and sales have been calculated by aggregating the results of multiplying each Fund’s ownership percentage of the respective Master Portfolio by the corresponding Master Portfolio’s purchases and sales. |
6. CAPITAL SHARES
As a result of the transfer of assets from Funds Management, former program manager of the 529 college savings plans for the State of Wisconsin, to a new program manager, Core Bond Fund redeemed assets from its Institutional Class on October 26, 2012 with a value of $296,707,154, representing 8.15% of the Fund. This amount is reflected in the Statement of Changes in Net Assets for the six months ended November 30, 2012.
7. BANK BORROWINGS
The Trust (excluding the money market funds and certain other funds in the Trust) and Wells Fargo Variable Trust are parties to a $150,000,000 revolving credit agreement with State Street Bank and Trust Company, whereby the Funds are permitted to use bank borrowings for temporary or emergency purposes, such as to fund shareholder redemption requests. Interest under the credit agreement is charged to each Fund based on a borrowing rate equal to the higher of the Federal Funds rate in effect on that day plus 1.25% or the overnight LIBOR rate in effect on that day plus 1.25%. In addition, an annual commitment fee equal to 0.10% of the unused balance is allocated to each participating fund. For the six months ended November 30, 2012, Core Bond Fund and Inflation-Protected Bond Fund paid commitment fees in the amount of $2,305 and $42, respectively.
For the six months ended November 30, 2012, there were no borrowings by the Funds under the agreement.
8. INDEMNIFICATION
Under the Trust’s organizational documents, the officers and directors are indemnified against certain liabilities that may arise out of performance of their duties to the Trust. Additionally, in the normal course of business, the Trust may enter into contracts with service providers that contain a variety of indemnification clauses. The Trust’s maximum exposure under these arrangements is dependent on future claims that may be made against the Funds and, therefore, cannot be estimated.
9. NEW ACCOUNTING PRONOUNCEMENT
In December 2011, the Financial Accounting Standards Board (“FASB”) issued Accounting Standard Update (“ASU”) No. 2011-11, Disclosures about Offsetting Assets and Liabilities. ASU 2011-11, which amends FASB ASC Topic 210, Balance Sheet, creates new disclosure requirements which require entities to disclose both gross and net information for derivatives and other financial instruments that are either offset in the Statement of Assets and Liabilities or subject to an enforceable master netting arrangement or similar agreement. The disclosure requirements are effective for interim and annual reporting periods beginning on or after January 1, 2013. Management is currently assessing the potential impact, in addition to expanded financial statement disclosure, that may result from adopting this ASU.
| | | | |
| 24 | | Wells Fargo Advantage Income Funds | | Notes to financial statements (unaudited) |
10. SUBSEQUENT DISTRIBUTIONS
On December 7, 2012, the Funds declared distributions from short-term capital gains and long-term capital gains to shareholders of record on December 6, 2012. The per share amounts payable on December 10, 2012 were as follows:
| | | | | | | | |
| | | Core
Bond Fund | | | Inflation-
Protected
Bond Fund | |
Short-term capital gains | | | | | | | | |
Class A | | $ | 0.40271 | | | $ | 0.00000 | |
Class B | | | 0.40271 | | | | 0.00000 | |
Class C | | | 0.40271 | | | | 0.00000 | |
Class R | | | 0.40271 | | | | N/A | |
Class R4 | | | 0.40271 | | | | N/A | |
Class R6 | | | 0.40271 | | | | N/A | |
Administrator Class | | | 0.40271 | | | | 0.00000 | |
Institutional Class | | | 0.40271 | | | | N/A | |
Investor Class | | | 0.40271 | | | | N/A | |
Long-term capital gains | | | | | | | | |
Class A | | $ | 0.15819 | | | $ | 0.35495 | |
Class B | | | 0.15819 | | | | 0.35495 | |
Class C | | | 0.15819 | | | | 0.35495 | |
Class R | | | 0.15819 | | | | N/A | |
Class R4 | | | 0.15819 | | | | N/A | |
Class R6 | | | 0.15819 | | | | N/A | |
Administrator Class | | | 0.15819 | | | | 0.35495 | |
Institutional Class | | | 0.15819 | | | | N/A | |
Investor Class | | | 0.15819 | | | | N/A | |
These distributions are not reflected in the accompanying financial statements.
| | | | | | |
| Summary portfolio of investments—November 30, 2012 (unaudited) | | Wells Fargo Advantage Income Funds | | | 25 | |
CORE BOND PORTFOLIO
The Summary Portfolio of Investments shows the 50 largest portfolio holdings in unaffiliated issuers and any holdings exceeding 1% of the total net assets as of the report date. The remaining securities held are grouped as “Other securities” in each category. You can request a complete schedule of portfolio holdings as of the report date, free of charge, by accessing the following website:
http://a584.g.akamai.net/f/584/1326/1d/www.wellsfargoadvantagefunds.com/pdf/semi/holdings/corebond.pdf or by calling Wells Fargo Advantage Funds at 1-800-222-8222. This complete schedule, filed on the Form N-CSR, is also available on the SEC’s website at sec.gov.
| | | | | | | | | | | | | | | | | | | | |
| Security name | | Interest rate | | | Maturity date | | | Principal | | | Value | | | Percent of
net assets | |
| | | | | | | | | | | | | | | | | | | | |
| | | | | |
Agency Securities : 35.58% | | | | | | | | | | | | | | | | | | | | |
FHLMC %% | | | 2.50 | % | | | 1-1-27 | | | $ | 55,900,000 | | | $ | 58,162,200 | | | | 1.58 | % |
FHLMC %% | | | 2.50 | | | | 12-1-27 | | | | 15,600,000 | | | | 16,255,683 | | | | 0.44 | |
FHLMC | | | 0.95-7.50 | | | | 8 -1-17 to 3-25-44 | | | | 149,965,229 | | | | 165,468,694 | | | | 4.48 | |
FHLMC | | | 4.00 | | | | 4-1-42 | | | | 19,448,472 | | | | 21,592,492 | | | | 0.59 | |
FHLMC | | | 4.00 | | | | 6-1-42 | | | | 40,071,200 | | | | 44,488,690 | | | | 1.21 | |
FHLMC | | | 5.00 | | | | 8-1-39 | | | | 26,643,876 | | | | 29,586,002 | | | | 0.80 | |
FHLMC | | | 5.00 | | | | 8-1-41 | | | | 26,486,600 | | | | 29,750,719 | | | | 0.81 | |
FNMA | | | 2.31-7.50 | | | | 9-1-16 to 12-25-42 | | | | 255,262,346 | | | | 282,516,800 | | | | 7.70 | |
FNMA %% | | | 2.50 | | | | 1-1-27 | | | | 71,100,000 | | | | 74,199,512 | | | | 2.01 | |
FNMA %% | | | 2.50 | | | | 2-1-27 | | | | 140,900,000 | | | | 146,800,180 | | | | 3.99 | |
FNMA %% | | | 3.00 | | | | 1-1-42 | | | | 29,200,000 | | | | 30,637,189 | | | | 0.83 | |
FNMA %% | | | 3.00 | | | | 2-1-42 | | | | 29,100,000 | | | | 30,464,064 | | | | 0.83 | |
FNMA | | | 4.00 | | | | 8-1-42 | | | | 37,752,178 | | | | 42,065,025 | | | | 1.14 | |
FNMA | | | 4.00 | | | | 9-1-42 | | | | 75,452,702 | | | | 84,072,496 | | | | 2.28 | |
FNMA | | | 4.00 | | | | 10-1-42 | | | | 31,430,452 | | | | 35,021,099 | | | | 0.95 | |
FNMA | | | 4.00 | | | | 11-1-42 | | | | 15,643,291 | | | | 17,430,396 | | | | 0.47 | |
FNMA | | | 5.00 | | | | 4-1-40 | | | | 18,132,263 | | | | 19,743,525 | | | | 0.54 | |
FNMA | | | 5.00 | | | | 7-1-41 | | | | 26,850,609 | | | | 30,436,484 | | | | 0.83 | |
FNMA | | | 6.00 | | | | 3-1-34 | | | | 48,865,760 | | | | 54,659,750 | | | | 1.48 | |
FNMA Series 2010-M03 Class A3 ± | | | 4.33 | | | | 3-25-20 | | | | 20,018,000 | | | | 23,324,333 | | | | 0.63 | |
FNMA Series 2011-53 Class TN | | | 4.00 | | | | 6-25-41 | | | | 32,997,904 | | | | 34,797,577 | | | | 0.94 | |
GNMA | | | 3.00-11.50 | | | | 5-15-13 to 1-20-42 | | | | 18,804,474 | | | | 20,533,302 | | | | 0.54 | |
GNMA | | | 6.00 | | | | 1-15-40 | | | | 16,569,548 | | | | 18,596,211 | | | | 0.51 | |
| | | | | | | | | | | | | | | | | | | | |
| | | | | |
Total Agency Securities (Cost $1,282,483,964) | | | | | | | | | | | | | | | 1,310,602,423 | | | | 35.58 | |
| | | | | | | | | | | | | | | | | | | | |
| | | | | |
Asset-Backed Securities: 14.12% | | | | | | | | | | | | | | | | | | | | |
Ally Auto Receivables Trust | | | 0.48-2.23 | | | | 3 -17-14 to 9-15-19 | | | | 51,531,576 | | | | 52,154,763 | | | | 1.41 | |
American Express Credit Account Master Trust Series 2012-4 Class A ± | | | 0.45 | | | | 5-15-20 | | | | 16,856,000 | | | | 16,889,543 | | | | 0.46 | |
Chase Issuance Trust Series 2008-A13 Class A13 ± | | | 1.89 | | | | 9-15-15 | | | | 12,439,000 | | | | 12,589,114 | | | | 0.34 | |
Chase Issuance Trust Series 2011-A2 Class A2 ± | | | 0.30 | | | | 5-15-15 | | | | 24,987,000 | | | | 25,001,967 | | | | 0.68 | |
Chase Issuance Trust Series 2012-A6 Class A ± | | | 0.34 | | | | 8-15-17 | | | | 51,409,000 | | | | 51,451,207 | | | | 1.40 | |
Ford Credit Floorplan Master Trust Series 2012-4 Class A2 ± | | | 0.56 | | | | 9-15-16 | | | | 16,254,000 | | | | 16,254,000 | | | | 0.44 | |
Nelnet Student Loan Trust | | | 0.32-0.81 | | | | 11 -27-18 to 3-23-37 | | | | 48,847,951 | | | | 46,489,043 | | | | 1.27 | |
Nelnet Student Loan Trust Series 2006-1 Class A4 ± | | | 0.40 | | | | 11-23-22 | | | | 17,969,158 | | | | 17,915,933 | | | | 0.49 | |
Nelnet Student Loan Trust Series 2006-2 Class A4 ± | | | 0.40 | | | | 10-26-26 | | | | 17,854,312 | | | | 17,833,012 | | | | 0.48 | |
Nelnet Student Loan Trust Series 2007-2A Class A3L ± 144A | | | 0.72 | | | | 3-25-26 | | | | 19,677,000 | | | | 19,141,294 | | | | 0.52 | |
SLM Student Loan Trust | | | 0.32-3.74 | | | | 7 -25-17 to 6-15-45 | | | | 128,226,165 | | | | 129,140,684 | | | | 3.50 | |
SLM Student Loan Trust Series 2012-E Class A1 ± 144A | | | 0.96 | | | | 10-16-23 | | | | 16,551,000 | | | | 16,551,033 | | | | 0.45 | |
Other securities | | | | | | | | | | | | | | | 98,648,281 | | | | 2.68 | |
| | | | | | | | | | | | | | | | | | | | |
| | | | |
Total Asset-Backed Securities (Cost $517,566,890) | | | | | | | | | | | | 520,059,874 | | | | 14.12 | |
| | | | | | | | | | | | | | | | | | | | |
The accompanying notes are an integral part of these financial statements.
| | | | |
| 26 | | Wells Fargo Advantage Income Funds | | Summary portfolio of investments—November 30, 2012 (unaudited) |
CORE BOND PORTFOLIO
| | | | | | | | | | | | | | |
| Security name | | | | | | | | Value | | | Percent of
net assets | |
| | | | | | | | | | | | | | |
| | | | | |
Corporate Bonds and Notes: 19.28% | | | | | | | | | | | | | | |
| | | | | |
Consumer Discretionary: 1.97% | | | | | | | | | | | | | | |
| | | | | |
| Auto Components: 0.29% | | | | | | | | | | | | | | |
Other securities | | | | | | | | $ | 10,563,107 | | | | 0.29 | % |
| | | | | | | | | | | | | | |
| | | | | |
| Automobiles: 0.47% | | | | | | | | | | | | | | |
Other securities | | | | | | | | | 17,456,401 | | | | 0.47 | |
| | | | | | | | | | | | | | |
| | | | | |
| Diversified Consumer Services: 0.09% | | | | | | | | | | | | | | |
Other securities | | | | | | | | | 3,244,315 | | | | 0.09 | |
| | | | | | | | | | | | | | |
| | | | | |
| Hotels, Restaurants & Leisure: 0.20% | | | | | | | | | | | | | | |
Other securities | | | | | | | | | 7,174,097 | | | | 0.20 | |
| | | | | | | | | | | | | | |
| | | | | |
| Internet & Catalog Retail: 0.08% | | | | | | | | | | | | | | |
Other securities | | | | | | | | | 2,858,374 | | | | 0.08 | |
| | | | | | | | | | | | | | |
| | | | | |
| Media: 0.63% | | | | | | | | | | | | | | |
Other securities | | | | | | | | | 23,377,172 | | | | 0.63 | |
| | | | | | | | | | | | | | |
| | | | | |
| Specialty Retail: 0.21% | | | | | | | | | | | | | | |
Other securities | | | | | | | | | 7,858,168 | | | | 0.21 | |
| | | | | | | | | | | | | | |
| | | | | |
Consumer Staples: 1.88% | | | | | | | | | | | | | | |
| | | | | |
| Beverages: 1.12% | | | | | | | | | | | | | | |
Other securities | | | | | | | | | 41,411,242 | | | | 1.12 | |
| | | | | | | | | | | | | | |
| | | | | |
| Food & Staples Retailing: 0.07% | | | | | | | | | | | | | | |
Other securities | | | | | | | | | 2,454,759 | | | | 0.07 | |
| | | | | | | | | | | | | | |
| | | | | |
| Food Products: 0.55% | | | | | | | | | | | | | | |
Other securities | | | | | | | | | 20,274,203 | | | | 0.55 | |
| | | | | | | | | | | | | | |
| | | | | |
| Tobacco: 0.14% | | | | | | | | | | | | | | |
Other securities | | | | | | | | | 5,255,873 | | | | 0.14 | |
| | | | | | | | | | | | | | |
| | | | | |
Energy: 1.84% | | | | | | | | | | | | | | |
| | | | | |
| Energy Equipment & Services: 0.05% | | | | | | | | | | | | | | |
Other securities | | | | | | | | | 1,745,164 | | | | 0.05 | |
| | | | | | | | | | | | | | |
| | | | | |
| Oil, Gas & Consumable Fuels: 1.79% | | | | | | | | | | | | | | |
Other securities | | | | | | | | | 66,100,909 | | | | 1.79 | |
| | | | | | | | | | | | | | |
| | | | | |
Financials: 8.62% | | | | | | | | | | | | | | |
| | | | | |
| Capital Markets: 0.91% | | | | | | | | | | | | | | |
Other securities | | | | | | | | | 33,436,604 | | | | 0.91 | |
| | | | | | | | | | | | | | |
| | | | | |
| Commercial Banks: 0.68% | | | | | | | | | | | | | | |
Other securities | | | | | | | | | 24,922,033 | | | | 0.68 | |
| | | | | | | | | | | | | | |
The accompanying notes are an integral part of these financial statements.
| | | | | | |
| Summary portfolio of investments—November 30, 2012 (unaudited) | | Wells Fargo Advantage Income Funds | | | 27 | |
CORE BOND PORTFOLIO
| | | | | | | | | | | | | | | | | | | | |
| Security name | | Interest rate | | | Maturity date | | | Principal | | | Value | | | Percent of
net assets | |
| | | | | | | | | | | | | | | | | | | | |
| | | | | |
| Consumer Finance: 0.80% | | | | | | | | | | | | | | | | | | | | |
Other securities | | | | | | | | | | | | | | $ | 29,657,992 | | | | 0.80 | % |
| | | | | | | | | | | | | | | | | | | | |
| | | | | |
| Diversified Financial Services: 3.79% | | | | | | | | | | | | | | | | | | | | |
JPMorgan Chase & Company | | | 1.10-5.40 | % | | | 6 -1-14 to 1-6-42 | | | $ | 24,818,000 | | | | 25,966,701 | | | | 0.70 | |
Other securities | | | | | | | | | | | | | | | 113,525,839 | | | | 3.09 | |
| | | | | |
| | | | | | | | | | | | | | | 139,492,540 | | | | 3.79 | |
| | | | | | | | | | | | | | | | | | | | |
| | | | | |
| Insurance: 1.45% | | | | | | | | | | | | | | | | | | | | |
MetLife Global Funding I ±144A | | | 0.73 | | | | 3-19-14 | | | | 19,510,000 | | | | 19,527,949 | | | | 0.53 | |
Other securities | | | | | | | | | | | | | | | 34,034,806 | | | | 0.92 | |
| | | | | |
| | | | | | | | | | | | | | | 53,562,755 | | | | 1.45 | |
| | | | | | | | | | | | | | | | | | | | |
| | | | | |
| REITs: 0.99% | | | | | | | | | | | | | | | | | | | | |
Other securities | | | | | | | | | | | | | | | 36,482,119 | | | | 0.99 | |
| | | | | | | | | | | | | | | | | | | | |
| | | | | |
Health Care: 2.00% | | | | | | | | | | | | | | | | | | | | |
| | | | | |
| Biotechnology: 0.49% | | | | | | | | | | | | | | | | | | | | |
Other securities | | | | | | | | | | | | | | | 18,054,187 | | | | 0.49 | |
| | | | | | | | | | | | | | | | | | | | |
| | | | | |
| Health Care Equipment & Supplies: 0.11% | | | | | | | | | | | | | | | | | | | | |
Other securities | | | | | | | | | | | | | | | 4,175,391 | | | | 0.11 | |
| | | | | | | | | | | | | | | | | | | | |
| | | | | |
| Health Care Providers & Services: 0.73% | | | | | | | | | | | | | | | | | | | | |
Other securities | | | | | | | | | | | | | | | 26,678,612 | | | | 0.73 | |
| | | | | | | | | | | | | | | | | | | | |
| | | | | |
| Life Sciences Tools & Services: 0.09% | | | | | | | | | | | | | | | | | | | | |
Other securities | | | | | | | | | | | | | | | 3,267,290 | | | | 0.09 | |
| | | | | | | | | | | | | | | | | | | | |
| | | | | |
| Pharmaceuticals: 0.58% | | | | | | | | | | | | | | | | | | | | |
Other securities | | | | | | | | | | | | | | | 21,304,437 | | | | 0.58 | |
| | | | | | | | | | | | | | | | | | | | |
| | | | | |
Industrials: 0.24% | | | | | | | | | | | | | | | | | | | | |
| | | | | |
| Building Products: 0.07% | | | | | | | | | | | | | | | | | | | | |
Other securities | | | | | | | | | | | | | | | 2,735,265 | | | | 0.07 | |
| | | | | | | | | | | | | | | | | | | | |
| | | | | |
| Road & Rail: 0.17% | | | | | | | | | | | | | | | | | | | | |
Other securities | | | | | | | | | | | | | | | 6,172,984 | | | | 0.17 | |
| | | | | | | | | | | | | | | | | | | | |
| | | | | |
| Information Technology: 0.24% | | | | | | | | | | | | | | | | | | | | |
| | | | | |
| Software: 0.24% | | | | | | | | | | | | | | | | | | | | |
Other securities | | | | | | | | | | | | | | | 8,950,538 | | | | 0.24 | |
| | | | | | | | | | | | | | | | | | | | |
| | | | | |
Materials: 0.08% | | | | | | | | | | | | | | | | | | | | |
| | | | | |
| Chemicals: 0.08% | | | | | | | | | | | | | | | | | | | | |
Other securities | | | | | | | | | | | | | | | 2,886,900 | | | | 0.08 | |
| | | | | | | | | | | | | | | | | | | | |
| | | | | |
Telecommunication Services: 0.61% | | | | | | | | | | | | | | | | | | | | |
| | | | | |
| Diversified Telecommunication Services: 0.39% | | | | | | | | | | | | | | | | | | | | |
Other securities | | | | | | | | | | | | | | | 14,275,369 | | | | 0.39 | |
| | | | | | | | | | | | | | | | | | | | |
The accompanying notes are an integral part of these financial statements.
| | | | |
| 28 | | Wells Fargo Advantage Income Funds | | Summary portfolio of investments—November 30, 2012 (unaudited) |
CORE BOND PORTFOLIO
| | | | | | | | | | | | | | | | | | | | |
| Security name | | Interest rate | | | Maturity date | | | Principal | | | Value | | | Percent of
net assets | |
| | | | | | | | | | | | | | | | | | | | |
| | | | | |
| Wireless Telecommunication Services: 0.22% | | | | | | | | | | | | | | | | | | | | |
Other securities | | | | | | | | | | | | | | $ | 8,055,498 | | | | 0.22 | % |
| | | | | | | | | | | | | | | | | | | | |
| | | | | |
Utilities: 1.80% | | | | | | | | | | | | | | | | | | | | |
| | | | | |
| Electric Utilities: 1.23% | | | | | | | | | | | | | | | | | | | | |
Other securities | | | | | | | | | | | | | | | 45,281,531 | | | | 1.23 | |
| | | | | | | | | | | | | | | | | | | | |
| | | | | |
| Gas Utilities: 0.22% | | | | | | | | | | | | | | | | | | | | |
Other securities | | | | | | | | | | | | | | | 7,973,024 | | | | 0.22 | |
| | | | | | | | | | | | | | | | | | | | |
| | | | | |
| Multi-Utilities: 0.35% | | | | | | | | | | | | | | | | | | | | |
Other securities | | | | | | | | | | | | | | | 12,857,305 | | | | 0.35 | |
| | | | | | | | | | | | | | | | | | | | |
| | | | |
Total Corporate Bonds and Notes (Cost $686,653,690) | | | | | | | | | | | | 709,996,158 | | | | 19.28 | |
| | | | | | | | | | | | | | | | | | | | |
| | | | | |
Municipal Obligations: 1.10% | | | | | | | | | | | | | | | | | | | | |
| | | | | |
| California: 0.27% | | | | | | | | | | | | | | | | | | | | |
Other securities | | | | | | | | | | | | | | | 9,872,117 | | | | 0.27 | |
| | | | | | | | | | | | | | | | | | | | |
| | | | | |
| Illinois: 0.18% | | | | | | | | | | | | | | | | | | | | |
Other securities | | | | | | | | | | | | | | | 6,569,672 | | | | 0.18 | |
| | | | | | | | | | | | | | | | | | | | |
| | | | | |
| Nevada: 0.14% | | | | | | | | | | | | | | | | | | | | |
Other securities | | | | | | | | | | | | | | | 5,217,670 | | | | 0.14 | |
| | | | | | | | | | | | | | | | | | | | |
| | | | | |
| New Jersey: 0.18% | | | | | | | | | | | | | | | | | | | | |
Other securities | | | | | | | | | | | | | | | 6,744,657 | | | | 0.18 | |
| | | | | | | | | | | | | | | | | | | | |
| | | | | |
| New York: 0.14% | | | | | | | | | | | | | | | | | | | | |
Other securities | | | | | | | | | | | | | | | 5,004,321 | | | | 0.14 | |
| | | | | | | | | | | | | | | | | | | | |
| | | | | |
| Ohio: 0.04% | | | | | | | | | | | | | | | | | | | | |
Other securities | | | | | | | | | | | | | | | 1,528,135 | | | | 0.04 | |
| | | | | | | | | | | | | | | | | | | | |
| | | | | |
| Texas: 0.15% | | | | | | | | | | | | | | | | | | | | |
Other securities | | | | | | | | | | | | | | | 5,702,696 | | | | 0.15 | |
| | | | | | | | | | | | | | | | | | | | |
| | | | | |
Total Municipal Obligations (Cost $33,047,469) | | | | | | | | | | | | | | | 40,639,268 | | | | 1.10 | |
| | | | | | | | | | | | | | | | | | | | |
| | | | | |
Non-Agency Mortgage Backed Securities: 6.73% | | | | | | | | | | | | | | | | | | | | |
Credit Suisse Mortgage Capital Certificates Series 2006-C5 Class A3 | | | 5.31 | % | | | 12-15-39 | | | $ | 18,499,000 | | | | 21,011,904 | | | | 0.57 | |
Discover Master Owners Trust Series 2011 Class A1 ± | | | 0.56 | | | | 8-15-16 | | | | 17,801,000 | | | | 17,858,800 | | | | 0.48 | |
Greenwich Capital Commercial Funding Corporation Series 2005-GG5 Class A5 ± | | | 5.22 | | | | 4-10-37 | | | | 15,359,000 | | | | 16,966,473 | | | | 0.46 | |
JPMorgan Chase Commercial Mortgage Securities Corporation | | | 2.38-6.85 | | | | 8 -5-32 to 2-15-51 | | | | 30,199,607 | | | | 32,968,591 | | | | 0.90 | |
Other securities | | | | | | | | | | | | | | | 159,032,509 | | | | 4.32 | |
| | | | | | | | | | | | | | | | | | | | |
| | | | |
Total Non-Agency Mortgage Backed Securities (Cost $240,765,820) | | | | | | | | | | | | 247,838,277 | | | | 6.73 | |
| | | | | | | | | | | | | | | | | | | | |
The accompanying notes are an integral part of these financial statements.
| | | | | | |
| Summary portfolio of investments—November 30, 2012 (unaudited) | | Wells Fargo Advantage Income Funds | | | 29 | |
CORE BOND PORTFOLIO
| | | | | | | | | | | | | | | | | | | | |
| Security name | | Interest rate | | | Maturity date | | | Principal | | | Value | | | Percent of
net assets | |
| | | | | | | | | | | | | | | | | | | | |
| | | | | |
U.S. Treasury Securities: 21.73% | | | | | | | | | | | | | | | | | | | | |
U.S. Treasury Bond | | | 2.75 | % | | | 8-15-42 | | | $ | 23,980,000 | | | $ | 23,721,472 | | | | 0.64 | % |
U.S. Treasury Bond | | | 2.75-4.38 | | | | 5 -15-41 to 11-15-42 | | | | 7,774,000 | | | | 8,453,121 | | | | 0.23 | |
U.S. Treasury Bond | | | 3.00 | | | | 5-15-42 | | | | 33,898,000 | | | | 35,349,241 | | | | 0.96 | |
U.S. Treasury Bond | | | 4.50 | | | | 5-15-38 | | | | 21,059,000 | | | | 28,383,573 | | | | 0.77 | |
U.S. Treasury Note | | | 0.25 | | | | 1-31-14 | | | | 49,574,000 | | | | 49,591,450 | | | | 1.35 | |
U.S. Treasury Note « | | | 0.25 | | | | 10-31-14 | | | | 42,151,000 | | | | 42,151,000 | | | | 1.14 | |
U.S. Treasury Note ## | | | 0.25 | | | | 1-15-15 | | | | 54,004,000 | | | | 53,970,248 | | | | 1.47 | |
U.S. Treasury Note ## | | | 0.25 | | | | 9-15-15 | | | | 48,394,000 | | | | 48,303,261 | | | | 1.31 | |
U.S. Treasury Note ## | | | 0.25 | | | | 10-15-15 | | | | 65,318,000 | | | | 65,185,339 | | | | 1.77 | |
U.S. Treasury Note « | | | 0.38 | | | | 4-15-15 | | | | 46,998,000 | | | | 47,089,787 | | | | 1.28 | |
U.S. Treasury Note ## | | | 0.38 | | | | 11-15-15 | | | | 129,905,000 | | | | 130,097,779 | | | | 3.53 | |
U.S. Treasury Note | | | 0.63-1.25 | | | | 9 -30-17 to 10-31-19 | | | | 9,739,000 | | | | 9,871,175 | | | | 0.27 | |
U.S. Treasury Note | | | 0.75 | | | | 6-30-17 | | | | 16,089,000 | | | | 16,231,034 | | | | 0.44 | |
U.S. Treasury Note « | | | 0.75 | | | | 10-31-17 | | | | 33,541,000 | | | | 33,771,594 | | | | 0.92 | |
U.S. Treasury Note | | | 1.25 | | | | 3-15-14 | | | | 26,548,000 | | | | 26,892,301 | | | | 0.73 | |
U.S. Treasury Note | | | 1.63 | | | | 11-15-22 | | | | 20,419,000 | | | | 20,434,947 | | | | 0.56 | |
U.S. Treasury Note | | | 1.75 | | | | 3-31-14 | | | | 29,411,000 | | | | 29,999,220 | | | | 0.81 | |
U.S. Treasury Note « | | | 2.38 | | | | 2-28-15 | | | | 37,816,000 | | | | 39,579,776 | | | | 1.07 | |
U.S. Treasury Note ## | | | 3.00 | | | | 9-30-16 | | | | 83,341,000 | | | | 91,427,661 | | | | 2.48 | |
| | | | | | | | | | | | | | | | | | | | |
| | | | | |
Total U.S. Treasury Securities (Cost $797,651,278) | | | | | | | | | | | | | | | 800,503,979 | | | | 21.73 | |
| | | | | | | | | | | | | | | | | | | | |
| | | | | |
Yankee Corporate Bonds and Notes: 7.33% | | | | | | | | | | | | | | | | | | | | |
| | | | | |
Consumer Discretionary: 0.27% | | | | | | | | | | | | | | | | | | | | |
| | | | | |
| Media: 0.09% | | | | | | | | | | | | | | | | | | | | |
Other securities | | | | | | | | | | | | | | | 3,347,964 | | | | 0.09 | |
| | | | | | | | | | | | | | | | | | | | |
| | | | | |
| Textiles, Apparel & Luxury Goods: 0.18% | | | | | | | | | | | | | | | | | | | | |
Other securities | | | | | | | | | | | | | | | 6,686,774 | | | | 0.18 | |
| | | | | | | | | | | | | | | | | | | | |
| | | | | |
Consumer Staples: 0.18% | | | | | | | | | | | | | | | | | | | | |
| | | | | |
| Beverages: 0.18% | | | | | | | | | | | | | | | | | | | | |
Other securities | | | | | | | | | | | | | | | 6,492,030 | | | | 0.18 | |
| | | | | | | | | | | | | | | | | | | | |
| | | | | |
Energy: 2.04% | | | | | | | | | | | | | | | | | | | | |
| | | | | |
| Oil, Gas & Consumable Fuels: 2.04% | | | | | | | | | | | | | | | | | | | | |
Other securities | | | | | | | | | | | | | | | 75,174,615 | | | | 2.04 | |
| | | | | | | | | | | | | | | | | | | | |
| | | | | |
Financials: 3.08% | | | | | | | | | | | | | | | | | | | | |
| | | | | |
| Commercial Banks: 2.52% | | | | | | | | | | | | | | | | | | | | |
Royal Bank of Scotland Group plc | | | 2.55 | | | | 9-18-15 | | | | 16,058,000 | | | | 16,430,321 | | | | 0.45 | |
Other securities | | | | | | | | | | | | | | | 76,241,186 | | | | 2.07 | |
| | | | | | | | | | | | | | | | | | | | |
| | | | | |
| | | | | | | | | | | | | | | 92,671,507 | | | | 2.52 | |
| | | | | | | | | | | | | | | | | | | | |
| | | | | |
| Real Estate Management & Development: 0.06% | | | | | | | | | | | | | | | | | | | | |
Other securities | | | | | | | | | | | | | | | 2,041,544 | | | | 0.06 | |
| | | | | | | | | | | | | | | | | | | | |
The accompanying notes are an integral part of these financial statements.
| | | | |
| 30 | | Wells Fargo Advantage Income Funds | | Summary portfolio of investments—November 30, 2012 (unaudited) |
CORE BOND PORTFOLIO
| | | | | | | | | | | | | | | | | | |
| Security name | | | | | | | Principal | | | Value | | | Percent of
net assets | |
| | | | | | | | | | | | | | | | | | |
| | | | | |
| Thrifts & Mortgage Finance: 0.50% | | | | | | | | | | | | | | | | | | |
Other securities | | | | | | | | | | | | $ | 18,592,236 | | | | 0.50 | % |
| | | | | | | | | | | | | | | | | | |
| | | | | |
Health Care: 0.10% | | | | | | | | | | | | | | | | | | |
| | | | | |
| Pharmaceuticals: 0.10% | | | | | | | | | | | | | | | | | | |
Other securities | | | | | | | | | | | | | 3,803,376 | | | | 0.10 | |
| | | | | | | | | | | | | | | | | | |
| | | | | |
Information Technology: 0.07% | | | | | | | | | | | | | | | | | | |
| | | | | |
| Internet Software & Services: 0.07% | | | | | | | | | | | | | | | | | | |
Other securities | | | | | | | | | | | | | 2,497,847 | | | | 0.07 | |
| | | | | | | | | | | | | | | | | | |
| | | | | |
Materials: 0.69% | | | | | | | | | | | | | | | | | | |
| | | | | |
| Metals & Mining: 0.69% | | | | | | | | | | | | | | | | | | |
Other securities | | | | | | | | | | | | | 25,459,531 | | | | 0.69 | |
| | | | | | | | | | | | | | | | | | |
| | | | | |
Telecommunication Services: 0.86% | | | | | | | | | | | | | | | | | | |
| | | | | |
| Diversified Telecommunication Services: 0.35% | | | | | | | | | | | | | | | | | | |
Other securities | | | | | | | | | | | | | 12,862,416 | | | | 0.35 | |
| | | | | | | | | | | | | | | | | | |
| | | | | |
| Wireless Telecommunication Services: 0.51% | | | | | | | | | | | | | | | | | | |
Other securities | | | | | | | | | | | | | 18,797,639 | | | | 0.51 | |
| | | | | | | | | | | | | | | | | | |
| | | | | |
Utilities: 0.04% | | | | | | | | | | | | | | | | | | |
| | | | | |
| Electric Utilities: 0.04% | | | | | | | | | | | | | | | | | | |
Other securities | | | | | | | | | | | | | 1,495,813 | | | | 0.04 | |
| | | | | | | | | | | | | | | | | | |
| | | | | |
Total Yankee Corporate Bonds and Notes (Cost $262,833,270) | | | | | | | | | | | | | 269,923,292 | | | | 7.33 | |
| | | | | | | | | | | | | | | | | | |
| | | | | |
Yankee Government Bonds: 1.14% | | | | | | | | | | | | | | | | | | |
Other securities | | | | | | | | | | | | | 42,082,254 | | | | 1.14 | |
| | | | | | | | | | | | | | | | | | |
| | | | | |
Total Yankee Government Bonds (Cost $40,721,279) | | | | | | | | | | | | | 42,082,254 | | | | 1.14 | |
| | | | | | | | | | | | | | | | | | |
| | | | | |
Other: 0.03% | | | | | | | | | | | | | | | | | | |
Gryphon Funding Limited, Pass-Through Entity (a)(i)(v) | | | | | | | | $ | 3,436,964 | | | | 1,134,198 | | | | 0.03 | |
| | | | | | | | | | | | | | | | | | |
| | | | | |
Total Other (Cost $325,645) | | | | | | | | | | | | | 1,134,198 | | | | 0.03 | |
| | | | | | | | | | | | | | | | | | |
| | | | | |
| | | Yield | | | | | Shares | | | | | | | |
| | | | | |
Short-Term Investments: 7.66% | | | | | | | | | | | | | | | | | | |
| | | | | |
| Investment Companies: 7.66% | | | | | | | | | | | | | | | | | | |
Wells Fargo Advantage Cash Investment Money Market Fund,
Select Class (l)(u)# | | | 0.16 | % | | | | | 201,172,161 | | | | 201,172,161 | | | | 5.46 | |
Wells Fargo Securities Lending Cash Investments, LLC (l)(u)(v)(r) | | | 0.21 | | | | | | 80,871,705 | | | | 80,871,705 | | | | 2.20 | |
| | | | | | | | | | | | | | | | | | |
| | | | | |
Total Short-Term Investments (Cost $282,043,866) | | | | | | | | | | | | | 282,043,866 | | | | 7.66 | |
| | | | | | | | | | | | | | | | | | |
| | | | | |
| Total investments in securities | | | | | | | | | | | | | | | | | | |
| (Cost $4,144,093,171) * | | | | | | | | | | | | | 4,224,823,589 | | | | 114.70 | |
Other assets and liabilities, net | | | | | | | | | | | | | (541,582,748 | ) | | | (14.70 | ) |
| | | | | | | | | | | | | | | | | | |
| | | | | |
Total net assets | | | | | | | | | | | | $ | 3,683,240,841 | | | | 100.00 | % |
| | | | | | | | | | | | | | | | | | |
The accompanying notes are an integral part of these financial statements.
| | | | | | |
| Summary portfolio of investments—November 30, 2012 (unaudited) | | Wells Fargo Advantage Income Funds | | | 31 | |
CORE BOND PORTFOLIO
| %% | Security issued on a when-issued basis |
| ## | All or a portion of this security has been segregated for when-issued securities. |
| ± | Variable rate investment |
| (a) | Security is fair valued by the Management Valuation Team, and in certain instances by the Board of Trustees, in accordance with procedures approved by the Board of Trustees. |
| 144A | Security that may be resold to “qualified institutional buyers” under Rule 144A or security offered pursuant to Section 4(2) of the Securities Act of 1933, as amended. |
| « | All or a portion of this security is on loan. |
| (v) | Security represents investment of cash collateral received from securities on loan. |
| (l) | Investment in an affiliate |
| (u) | Rate shown is the 7-day annualized yield at period end. |
| # | All or a portion of this security is segregated as collateral for investments in derivative instruments. |
| (r) | The investment company is exempt from registration under Section 3(c)(7) of the Investment Company Act of 1940, as amended. |
| * | Cost for federal income tax purposes is $4,149,567,914 and unrealized appreciation (depreciation) consists of: |
| | | | |
Gross unrealized appreciation | | $ | 77,428,474 | |
Gross unrealized depreciation | | | (2,172,799 | ) |
| | | | |
Net unrealized appreciation | | $ | 75,255,675 | |
The accompanying notes are an integral part of these financial statements.
| | | | |
| 32 | | Wells Fargo Advantage Income Funds | | Portfolio of investments—November 30, 2012 (unaudited) |
INFLATION-PROTECTED BOND PORTFOLIO
| | | | | | | | | | | | | | | | |
| Security name | | Interest rate | | | Maturity date | | | Principal | | | Value | |
| | | | | | | | | | | | | | | | |
| | | | |
U.S. Treasury Securities: 98.67% | | | | | | | | | | | | | | | | |
TIPS | | | 0.13 | % | | | 4-15-16 | | | $ | 3,616,842 | | | $ | 3,809,833 | |
TIPS | | | 0.13 | | | | 4-15-17 | | | | 1,355,017 | | | | 1,453,362 | |
TIPS | | | 0.13 | | | | 1-15-22 | | | | 3,215,448 | | | | 3,523,427 | |
TIPS | | | 0.13 | | | | 7-15-22 | | | | 2,671,647 | | | | 2,928,584 | |
TIPS | | | 0.50 | | | | 4-15-15 | | | | 1,943,378 | | | | 2,025,668 | |
TIPS | | | 0.63 | | | | 7-15-21 | | | | 3,747,492 | | | | 4,290,293 | |
TIPS | | | 0.75 | | | | 2-15-42 | | | | 1,761,435 | | | | 1,962,762 | |
TIPS | | | 1.13 | | | | 1-15-21 | | | | 3,422,080 | | | | 4,043,670 | |
TIPS | | | 1.25 | | | | 4-15-14 | | | | 1,880,682 | | | | 1,937,250 | |
TIPS | | | 1.25 | | | | 7-15-20 | | | | 3,071,798 | | | | 3,666,000 | |
TIPS | | | 1.38 | | | | 7-15-18 | | | | 1,963,773 | | | | 2,294,239 | |
TIPS « | | | 1.38 | | | | 1-15-20 | | | | 1,910,129 | | | | 2,275,888 | |
TIPS | | | 1.63 | | | | 1-15-15 | | | | 2,120,808 | | | | 2,250,707 | |
TIPS | | | 1.63 | | | | 1-15-18 | | | | 1,192,936 | | | | 1,388,651 | |
TIPS | | | 1.75 | | | | 1-15-28 | | | | 1,331,007 | | | | 1,739,980 | |
TIPS | | | 1.88 | | | | 7-15-15 | | | | 1,844,004 | | | | 2,009,100 | |
TIPS | | | 1.88 | | | | 7-15-19 | | | | 1,712,357 | | | | 2,094,827 | |
TIPS | | | 2.00 | | | | 1-15-14 | | | | 1,778,351 | | | | 1,835,870 | |
TIPS | | | 2.00 | | | | 7-15-14 | | | | 2,455,260 | | | | 2,588,382 | |
TIPS | | | 2.00 | | | | 1-15-16 | | | | 2,075,302 | | | | 2,304,397 | |
TIPS | | | 2.00 | | | | 1-15-26 | | | | 2,168,574 | | | | 2,866,922 | |
TIPS | | | 2.13 | | | | 1-15-19 | | | | 1,675,979 | | | | 2,045,217 | |
TIPS | | | 2.13 | | | | 2-15-40 | | | | 974,264 | | | | 1,450,588 | |
TIPS | | | 2.13 | | | | 2-15-41 | | | | 2,007,692 | | | | 3,011,068 | |
TIPS | | | 2.38 | | | | 1-15-17 | | | | 2,294,940 | | | | 2,675,397 | |
TIPS | | | 2.38 | | | | 1-15-25 | | | | 2,768,306 | | | | 3,768,140 | |
TIPS | | | 2.38 | | | | 1-15-27 | | | | 1,181,894 | | | | 1,644,402 | |
TIPS | | | 2.50 | | | | 7-15-16 | | | | 2,429,181 | | | | 2,796,405 | |
TIPS | | | 2.50 | | | | 1-15-29 | | | | 1,455,030 | | | | 2,098,085 | |
TIPS | | | 2.63 | | | | 7-15-17 | | | | 580,585 | | | | 697,791 | |
TIPS | | | 3.38 | | | | 4-15-32 | | | | 638,808 | | | | 1,066,710 | |
TIPS | | | 3.63 | | | | 4-15-28 | | | | 1,817,014 | | | | 2,910,205 | |
TIPS | | | 3.88 | | | | 4-15-29 | | | | 1,485,039 | | | | 2,486,510 | |
| | | | |
Total U.S. Treasury Securities (Cost $69,617,657) | | | | | | | | | | | | | | | 79,940,330 | |
| | | | | | | | | | | | | | | | |
| | | | |
Other: 0.22% | | | | | | | | | | | | | | | | |
Gryphon Funding Limited, Pass-Through Entity (i)(a)(v) | | | | | | | | | | | 548,184 | | | | 180,901 | |
| | | | |
Total Other (Cost $51,939) | | | | | | | | | | | | | | | 180,901 | |
| | | | | | | | | | | | | | | | |
| | | | |
| Short-Term Investments: 2.99% | | Yield | | | | | | Shares | | | | |
| | | | |
| Investment Companies: 2.99% | | | | | | | | | | | | | | | | |
Wells Fargo Advantage Government Money Market Fund, Institutional Class (l)(u) | | | 0.01 | | | | | | | | 643,913 | | | | 643,913 | |
Wells Fargo Securities Lending Cash Investments, LLC (v)(l)(u)(r) | | | 0.21 | | | | | | | | 1,778,061 | | | | 1,778,061 | |
| | | | |
Total Short-Term Investments (Cost $2,421,974) | | | | | | | | | | | | | | | 2,421,974 | |
| | | | | | | | | | | | | | | | |
| | | | | | | | |
| Total investments in securities | | | | | | | | |
| (Cost $72,091,570)* | | | 101.88 | % | | | 82,543,205 | |
Other assets and liabilities, net | | | (1.88 | ) | | | (1,523,384 | ) |
| | | | | | | | |
| Total net assets | | | 100.00 | % | | $ | 81,019,821 | |
| | | | | | | | |
The accompanying notes are an integral part of these financial statements.
| | | | | | |
| Portfolio of investments—November 30, 2012 (unaudited) | | Wells Fargo Advantage Income Funds | | | 33 | |
INFLATION-PROTECTED BOND PORTFOLIO
| « | All or a portion of this security is on loan. |
| (a) | Security is fair valued by the Management Valuation Team, and in certain instances by the Board of Trustees, in accordance with procedures approved by the Board of Trustees. |
| (l) | Investment in an affiliate |
| (u) | Rate shown is the 7-day annualized yield at period end. |
| (v) | Security represents investment of cash collateral received from securities on loan. |
| (r) | The investment company is exempt from registration under Section 3(c)(7) of the Investment Company Act of 1940, as amended. |
| * | Cost for federal income tax purposes is $72,446,513 and unrealized appreciation (depreciation) consists of: |
| | | | |
Gross unrealized appreciation | | $ | 10,096,692 | |
Gross unrealized depreciation | | | 0 | |
| | | | |
Net unrealized appreciation | | $ | 10,096,692 | |
The accompanying notes are an integral part of these financial statements.
| | | | |
| 34 | | Wells Fargo Advantage Income Funds | | Statements of assets and liabilities—November 30, 2012 (unaudited) |
| | | | | | | | |
| | | Core Bond Portfolio | | | Inflation-Protected
Bond Portfolio | |
| | |
Assets | | | | | | | | |
Investments | | | | | | | | |
In unaffiliated securities (including securities on loan), at value (see cost below) | | $ | 3,942,779,723 | | | $ | 80,121,231 | |
In affiliated securities, at value (see cost below) | | | 282,043,866 | | | | 2,421,974 | |
| | | | | | | | |
Total investments, at value (see cost below) | | | 4,224,823,589 | | | | 82,543,205 | |
Receivable for investments sold | | | 748,510,282 | | | | 0 | |
Principal paydown receivable | | | 106 | | | | 0 | |
Receivable for interest | | | 16,945,446 | | | | 342,975 | |
Receivable for securities lending income | | | 979 | | | | 0 | |
Premiums paid on credit default swap transactions | | | 688,002 | | | | 0 | |
Unrealized gains on credit default swap transactions | | | 85,825 | | | | 0 | |
Prepaid expenses and other assets | | | 22,449 | | | | 1,255 | |
| | | | | | | | |
Total assets | | | 4,991,076,678 | | | | 82,887,435 | |
| | | | | | | | |
| | |
Liabilities | | | | | | | | |
Payable for investments purchased | | | 1,224,692,741 | | | | 0 | |
Unrealized losses on credit default swap transactions | | | 613,082 | | | | 0 | |
Premiums received on credit default swap transactions | | | 114,158 | | | | 0 | |
Payable upon receipt of securities loaned | | | 81,197,350 | | | | 1,830,000 | |
Advisory fee payable | | | 1,092,278 | | | | 25,555 | |
Shareholder report expenses payable | | | 8,414 | | | | 4,767 | |
Professional fees payable | | | 32,092 | | | | 3,901 | |
Accrued expenses and other liabilities | | | 85,722 | | | | 3,391 | |
| | | | | | | | |
Total liabilities | | | 1,307,835,837 | | | | 1,867,614 | |
| | | | | | | | |
Total net assets | | $ | 3,683,240,841 | | | $ | 81,019,821 | |
| | | | | | | | |
| | |
Investments in unaffiliated securities, at cost | | $ | 3,862,049,305 | | | $ | 69,669,596 | |
| | | | | | | | |
Investments in affiliated securities, at cost | | $ | 282,043,866 | | | $ | 2,421,974 | |
| | | | | | | | |
Total investments, at cost | | $ | 4,144,093,171 | | | $ | 72,091,570 | |
| | | | | | | | |
Securities on loan, at value | | $ | 79,589,138 | | | $ | 1,791,605 | |
| | | | | | | | |
The accompanying notes are an integral part of these financial statements.
| | | | | | |
| Statements of operations—six months ended November 30, 2012 (unaudited) | | Wells Fargo Advantage Income Funds | | | 35 | |
| | | | | | | | |
| | | Core Bond
Portfolio | | | Inflation-Protected
Bond Portfolio | |
| | |
Investment income | | | | | | | | |
Interest* | | $ | 42,261,155 | | | $ | 971,179 | |
Income from affiliated securities | | | 141,561 | | | | 38 | |
Securities lending income, net | | | 48,519 | | | | 4,719 | |
| | | | | | | | |
Total investment income | | | 42,451,235 | | | | 975,936 | |
| | | | | | | | |
| | |
Expenses | | | | | | | | |
Advisory fee | | | 7,031,048 | | | | 166,149 | |
Custody and accounting fees | | | 118,909 | | | | 5,404 | |
Professional fees | | | 29,310 | | | | 16,963 | |
Shareholder report expenses | | | 8,503 | | | | 936 | |
Trustees’ fees and expenses | | | 6,233 | | | | 5,855 | |
Other fees and expenses | | | 29,242 | | | | 4,419 | |
| | | | | | | | |
Total expenses | | | 7,223,245 | | | | 199,726 | |
Less: Fee waivers and/or expense reimbursements | | | (281,318 | ) | | | (17,545 | ) |
| | | | | | | | |
Net expenses | | | 6,941,927 | | | | 182,181 | |
| | | | | | | | |
Net investment income | | | 35,509,308 | | | | 793,755 | |
| | | | | | | | |
| | |
REALIZED AND UNREALIZED GAINS (LOSSES) ON INVESTMENTS | | | | | | | | |
| | |
Net realized gains (losses) on: | | | | | | | | |
Unaffiliated securities | | | 108,340,648 | | | | 1,936,141 | |
Credit default swap transactions | | | (40,717 | ) | | | 0 | |
TBA sale commitments | | | (355,719 | ) | | | 0 | |
| | | | | | | | |
Net realized gains on investments | | | 107,944,212 | | | | 1,936,141 | |
| | | | | | | | |
| | |
Net change in unrealized gains (losses) on: | | | | | | | | |
Unaffiliated securities | | | (13,631,453 | ) | | | (559,251 | ) |
Credit default swap transactions | | | (418,505 | ) | | | 0 | |
TBA sale commitments | | | 293,360 | | | | 0 | |
| | | | | | | | |
Net change in unrealized gains (losses) on investments | | | (13,756,598 | ) | | | (559,251 | ) |
| | | | | | | | |
Net realized and unrealized gains (losses) on investments | | | 94,187,614 | | | | 1,376,890 | |
| | | | | | | | |
Net increase in net assets resulting from operations | | $ | 129,696,922 | | | $ | 2,170,645 | |
| | | | | | | | |
| | |
* Net of foreign interest withholding taxes in the amount of | | | $41,842 | | | | $0 | |
The accompanying notes are an integral part of these financial statements.
| | | | |
| 36 | | Wells Fargo Advantage Income Funds | | Statements of changes in net assets |
| | | | | | | | |
| | | Core Bond Portfolio | |
| | | Six months ended
November 30, 2012
(unaudited) | | | Year ended
May 31, 2012 | |
| | |
Operations | | | | | | | | |
Net investment income | | $ | 35,509,308 | | | $ | 81,191,274 | |
Net realized gains on investments | | | 107,944,212 | | | | 164,577,584 | |
Net change in unrealized gains (losses) on investments | | | (13,756,598 | ) | | | 29,875,554 | |
| | | | | | | | |
Net increase in net assets resulting from operations | | | 129,696,922 | | | | 275,644,412 | |
| | | | | | | | |
| | |
Capital share transactions | | | | | | | | |
Transactions in investors’ beneficial interests | | | | | | | | |
Contributions | | | 504,049,062 | | | | 686,049,279 | |
Withdrawals | | | (764,041,287 | ) | | | (443,191,494 | ) |
| | | | | | | | |
Net increase (decrease) in net assets resulting from capital share transactions | | | (259,992,225 | ) | | | 242,857,785 | |
| | | | | | | | |
Total increase (decrease) in net assets | | | (130,295,303 | ) | | | 518,502,197 | |
| | | | | | | | |
| | |
Net assets | | | | | | | | |
Beginning of period | | | 3,813,536,144 | | | | 3,295,033,947 | |
| | | | | | | | |
End of period | | $ | 3,683,240,841 | | | $ | 3,813,536,144 | |
| | | | | | | | |
The accompanying notes are an integral part of these financial statements.
| | | | | | |
| Statements of changes in net assets | | Wells Fargo Advantage Income Funds | | | 37 | |
| | | | | | | | |
| | | Inflation-Protected Bond Portfolio | |
| | | Six months ended
November 30, 2012
(unaudited) | | | Year ended
May 31, 2012 | |
| | |
Operations | | | | | | | | |
Net investment income | | $ | 793,755 | | | $ | 2,680,432 | |
Net realized gains on investments | | | 1,936,141 | | | | 5,557,478 | |
Net change in unrealized gains (losses) on investments | | | (559,251 | ) | | | 3,311,880 | |
| | | | | | | | |
Net increase in net assets resulting from operations | | | 2,170,645 | | | | 11,549,790 | |
| | | | | | | | |
| | |
Capital share transactions | | | | | | | | |
Transactions in investors’ beneficial interests | | | | | | | | |
Contributions | | | 8,593,093 | | | | 21,266,199 | |
Withdrawals | | | (13,193,227 | ) | | | (54,247,708 | ) |
| | | | | | | | |
Net decrease in net assets resulting from capital share transactions | | | (4,600,134 | ) | | | (32,981,509 | ) |
| | | | | | | | |
Total decrease in net assets | | | (2,429,489 | ) | | | (21,431,719 | ) |
| | | | | | | | |
| | |
Net assets | | | | | | | | |
Beginning of period | | | 83,449,310 | | | | 104,881,029 | |
| | | | | | | | |
End of period | | $ | 81,019,821 | | | $ | 83,449,310 | |
| | | | | | | | |
The accompanying notes are an integral part of these financial statements.
| | | | |
| 38 | | Wells Fargo Advantage Income Funds | | Financial highlights |
| | | | | | | | | | | | | | | | | | | | |
| | | Ratio to average net assets (annualized) | | | Total
return1 | | | Portfolio turnover rate | |
| | | Net investment
income | | | Gross
expenses | | | Net
expenses | | | |
| | | | | |
Core Bond Portfolio | | | | | | | | | | | | | | | | | | | | |
June 1, 2012 to November 30, 2012 (unaudited) | | | 1.79 | % | | | 0.36 | % | | | 0.35 | % | | | 3.35 | % | | | 270 | % |
June 1, 2011 to May 31, 2012 | | | 2.33 | % | | | 0.37 | % | | | 0.35 | % | | | 8.20 | % | | | 803 | % |
June 1, 2010 to May 31, 2011 | | | 2.99 | % | | | 0.37 | % | | | 0.35 | % | | | 7.02 | % | | | 789 | % |
June 1, 2009 to May 31, 2010 | | | 3.78 | % | | | 0.38 | % | | | 0.34 | % | | | 10.87 | % | | | 638 | % |
June 1, 2008 to May 31, 2009 | | | 4.92 | % | | | 0.40 | % | | | 0.39 | % | | | 6.58 | % | | | 633 | % |
June 1, 2007 to May 31, 2008 | | | 5.05 | % | | | 0.42 | % | | | 0.40 | % | | | 6.72 | % | | | 572 | % |
| | | | | |
Inflation-Protected Bond Portfolio | | | | | | | | | | | | | | | | | | | | |
June 1, 2012 to November 30, 2012 (unaudited) | | | 1.91 | % | | | 0.48 | % | | | 0.44 | % | | | 2.69 | % | | | 9 | % |
June 1, 2011 to May 31, 2012 | | | 3.00 | % | | | 0.48 | % | | | 0.44 | % | | | 12.62 | % | | | 23 | % |
June 1, 2010 to May 31, 2011 | | | 3.25 | % | | | 0.44 | % | | | 0.43 | % | | | 8.19 | % | | | 19 | % |
June 1, 2009 to May 31, 2010 | | | 3.53 | % | | | 0.45 | % | | | 0.44 | % | | | 8.28 | % | | | 31 | % |
June 1, 2008 to May 31, 2009 | | | 1.70 | % | | | 0.45 | % | | | 0.37 | % | | | (1.33 | )% | | | 53 | % |
June 1, 2007 to May 31, 2008 | | | 5.78 | % | | | 0.48 | % | | | 0.40 | % | | | 12.78 | % | | | 40 | % |
| 1. | Returns for periods of less than one year are not annualized. |
The accompanying notes are an integral part of these financial statements.
| | | | | | |
| Notes to financial statements (unaudited) | | Wells Fargo Advantage Income Funds | | | 39 | |
1. ORGANIZATION
Wells Fargo Master Trust (the “Trust”), a Delaware statutory trust organized on March 10, 1999, is an open-end management investment company registered under the Investment Company Act of 1940, as amended (the “1940 Act”). These financial statements report on the following funds: Wells Fargo Advantage Core Bond Portfolio (“Core Bond Portfolio” ) (formerly, Wells Fargo Advantage Total Return Bond Portfolio) and Wells Fargo Advantage Inflation-Protected Bond Portfolio (“Inflation-Protected Bond Portfolio”) (each, a “Portfolio”, collectively, the “Portfolios”). Each Portfolio is a diversified series of the Trust.
The Portfolios, which are master portfolios in a master/feeder structure, offer their shares to multiple feeder funds and other master portfolios rather than directly to the public.
2. SIGNIFICANT ACCOUNTING POLICIES
The following significant accounting policies, which are consistently followed in the preparation of the financial statements of each Portfolio, are in conformity with U.S. generally accepted accounting principles which require management to make estimates and assumptions that affect the reported amounts of assets and liabilities, disclosure of contingent assets and liabilities at the date of the financial statements, and the reported amounts of revenues and expenses during the reporting period. Actual results could differ from those estimates.
Securities valuation
All investments are valued each business day as of the close of regular trading on the New York Stock Exchange (normally 4 p.m. Eastern Time).
Fixed income securities acquired with maturities exceeding 60 days are valued based on evaluated bid prices received from an independent pricing service which may utilize both transaction data and market information such as yield, prices of securities of comparable quality, coupon rate, maturity, type of issue, trading characteristics and other market data. If valuations are not available from the independent pricing service or values received are deemed not representative of market value, values will be obtained from a broker-dealer or otherwise determined based on the Portfolios’ Valuation Procedures.
Debt securities of sufficient credit quality acquired with maturities of 60 days or less generally are valued at amortized cost which approximates fair value. The amortized cost method involves valuing a security at its cost, plus accretion of discount or minus amortization of premium over the period until maturity.
Investments in registered open-end investment companies are valued at net asset value. Non-registered investment companies are fair valued at net asset value.
Investments which are not valued using any of the methods discussed above are valued at their fair value, as determined by procedures established in good faith and approved by the Board of Trustees. The Board of Trustees has established a Valuation Committee comprised of the Trustees and has delegated to it the authority to take any actions regarding the valuation of portfolio securities that the Valuation Committee deems necessary or appropriate, including determining the fair value of portfolio securities, unless the determination has been delegated to the Management Valuation Team of Wells Fargo Funds Management, LLC (“Funds Management”). The Board of Trustees retains the authority to make or ratify any valuation decisions or approve any changes to the Valuation Procedures as it deems appropriate. On a quarterly basis, the Board of Trustees receives reports on any valuation actions taken by the Valuation Committee or the Management Valuation Team which may include items for ratification.
Valuations of fair valued securities are compared to the next actual sales price when available, or other appropriate market information to assess the continued appropriateness of the fair valuation methodology used. These securities are fair valued on a day-to-day basis, taking into consideration changes to appropriate market information and any significant changes to the input factors considered in the valuation process until there is a readily available price provided on the exchange or by an independent pricing service. Valuations received from an independent pricing service or broker quotes are periodically validated by comparisons to most recent trades and valuations provided by other independent pricing services in addition to the review of prices by the adviser and/or subadviser. Unobservable inputs used in determining fair valuations are identified based on the type of security, taking into consideration factors utilized by market participants in valuing the investment, knowledge about the issuer and the current market environment.
Security loans
The Portfolios may lend their securities from time to time in order to earn additional income in the form of fees or interest on securities received as collateral or the investment of any cash received as collateral. The Portfolios continue to receive interest or dividends on the securities loaned. The Portfolios receive collateral in the form of cash or securities with a value at least equal to the value of the securities on loan. The value of the loaned securities is determined at the close of each business day and any additional required collateral is delivered to the Portfolios on the next business day. In a
| | | | |
| 40 | | Wells Fargo Advantage Income Funds | | Notes to financial statements (unaudited) |
securities lending transaction, the net asset value of the Portfolios will be affected by an increase or decrease in the value of the securities loaned and by an increase or decrease in the value of the instrument in which collateral is invested. The amount of securities lending activity undertaken by the Portfolios fluctuate from time to time, In the event of default or bankruptcy by the borrower, the Portfolios may be prevented from recovering the loaned securities or gaining access to the collateral or may experience delays or costs in doing so. In addition, the investment of any cash collateral received may lose all or part of its value. The Portfolios have the right under the lending agreement to recover the securities from the borrower on demand.
The Portfolios lend their securities through an unaffiliated securities lending agent. Cash collateral received in connection with its securities lending transactions is invested in Wells Fargo Securities Lending Cash Investments, LLC (the “Cash Collateral Fund”). The Cash Collateral Fund is exempt from registration under Section 3(c)(7) of the 1940 Act and is managed by Funds Management and is subadvised by Wells Capital Management Incorporated (“WellsCap”). Funds Management receives an advisory fee starting at 0.05% and declining to 0.01% as the average daily net assets of the Cash Collateral Fund increase. All of the fees received by Funds Management are paid to WellsCap for its services as subadviser. The Cash Collateral Fund seeks to provide a positive return compared to the daily Fed Funds Open rate by investing in high-quality, U.S. dollar-denominated short-term money market instruments. Cash Collateral Fund investments are fair valued based upon the amortized cost valuation technique. Income earned from investment in the Cash Collateral Fund is included in securities lending income on the Statements of Operations.
When-issued transactions
Each Portfolio may purchase securities on a forward commitment or ‘when-issued’ basis. A Portfolio records a when-issued transaction on the trade date and will segregate assets in an amount at least equal in value to the Portfolio’s commitment to purchase when-issued securities. Securities purchased on a when-issued basis are marked-to-market daily and the Portfolio begins earning interest on the settlement date. Losses may arise due to changes in the market value of the underlying securities or if the counterparty does not perform under the contract.
Futures contracts
Certain Portfolios may be subject to interest rate risk in the normal course of pursuing its investment objectives. The Portfolio may buy and sell futures contracts in order to gain exposure to, or protect against, changes in security values and interest rates. The primary risks associated with the use of futures contracts are the imperfect correlation between changes in market values of securities held by the Portfolio and the prices of futures contracts, and the possibility of an illiquid market.
Futures contracts are valued based upon their quoted daily settlement prices when available. The aggregate principal amounts of the contracts are not recorded in the financial statements. Fluctuations in the value of the contracts are recorded in the Statements of Assets and Liabilities as an asset or liability and in the Statements of Operations as unrealized gains or losses until the contracts are closed, at which point they are recorded as net realized gains or losses on futures contracts. With futures contracts, there is minimal counterparty risk to the Portfolio since futures are exchange traded and the exchange’s clearinghouse, as counterparty to all exchange traded futures, guarantees the futures against default.
TBA sale commitments
A Portfolio may enter into To Be Announced (“TBA”) sale commitments to hedge its portfolio positions or to sell mortgage-backed securities it owns under delayed delivery arrangements. Proceeds of TBA sale commitments are not received until the contractual settlement date. During the time a TBA sale commitment is outstanding, equivalent deliverable securities or offsetting TBA purchase commitments, which are deliverable on or before the sale commitment date, are held as “cover” for the transaction. Unsettled TBA sale commitments are valued at the current market value of the underlying securities, generally according to the procedures described under “Securities valuation”. The contract is marked-to-market daily and the change in market value is recorded by the Portfolio as an unrealized gain or loss. If the TBA sale commitment is closed through the acquisition of an offsetting purchase commitment, the Portfolio realizes a gain or loss. If the Portfolio delivers securities under the commitment, the Portfolio realizes a gain or a loss from the sale of the securities based upon the unit price established at the date the commitment was entered into.
Inflation-indexed bonds and TIPS
Certain Portfolios may invest in inflation-indexed bonds, including Treasury inflation-protected securities (TIPS). Inflation-indexed bonds are fixed income securities whose principal value is periodically adjusted according to the rate of inflation. If the index measuring inflation falls, the principal value of inflation-indexed bonds (other than municipal inflation indexed bonds and certain corporate inflation-indexed bonds) will be adjusted downward, and consequently the interest payable on these securities (calculated with respect to a smaller principal amount) will be reduced. Repayment of the
| | | | | | |
| Notes to financial statements (unaudited) | | Wells Fargo Advantage Income Funds | | | 41 | |
original bond principal upon maturity (as adjusted for inflation) is guaranteed in the case of U.S. Treasury inflation-indexed bonds. For bonds that do not provide a similar guarantee, the adjusted principal value of the bond repaid at maturity may be less than the original principal. The value of inflation-indexed bonds is expected to change in response to changes in real interest rates. Real interest rates are tied to the relationship between nominal interest rates and the rate of inflation. If nominal interest rates increase at a faster rate than inflation, real interest rates may rise, leading to a decrease in value of inflation-indexed bonds. Inflation-indexed bonds, including TIPS, decline in value when real interest rates rise. In certain interest rate environments, such as when real interest rates are rising faster than nominal interest rates, inflation-indexed bonds may experience greater losses than other fixed income securities with similar durations.
Credit default swaps
Certain Portfolios may be subject to credit risk in the normal course of pursuing its investment objectives. The Portfolio may enter into credit default swap contracts for hedging or speculative purposes to provide or receive a measure of protection against default on a referenced entity, obligation or index or for investment gains. Credit default swaps involve an exchange of a stream of payments for protection against the loss in value of an underlying security or index. Under the terms of the swap, one party acts as a guarantor (referred to as the seller of protection) and receives a periodic stream of payments, provided that there is no credit event, from another party (referred to as the buyer of protection) that is a fixed percentage applied to a notional principal amount over the term of the swap. An index credit default swap references all the names in the index, and if a credit event is triggered, the credit event is settled based on that name’s weight in the index. A credit event includes bankruptcy, failure to pay, obligation default, obligation acceleration, repudiation/moratorium, and restructuring. The Portfolio may enter into credit default swaps as either the seller of protection or the buyer of protection. As the seller of protection, the Portfolio is subject to investment exposure on the notional amount of the swap and has assumed the risk of default of the underlying security or index. As the buyer of protection, the Portfolio could be exposed to risks if the seller of the protection defaults on its obligation to perform, or if there are unfavorable changes in the fluctuation of interest rates. The maximum potential amount of future payments (undiscounted) that the Portfolio as the seller of protection could be required to make under the credit default swap contract would be an amount equal to the notional amount of the swap contract. The Portfolio’s maximum risk of loss from counterparty risk, either as the protection seller or as the protection buyer, is the fair value of the contract. This risk is mitigated by having a master netting arrangement between the Portfolio and the counterparty and by having the counterparty post collateral to cover the Portfolio’s exposure to the counterparty.
If the Portfolio is the seller of protection and a credit event occurs, as defined under the terms of that particular swap agreement, the Portfolio will pay to the buyer of protection the notional amount of the swap and take delivery of the referenced obligation or underlying securities comprising the referenced index. If the Portfolio is the buyer of protection and a credit event occurs, as defined under the terms of that particular swap agreement, the Portfolio will receive from the seller of protection the notional amount of the swap and deliver the referenced obligation or underlying securities comprising the referenced index.
Any premiums paid or received on the transactions are recorded as an asset or liability on the Statements of Assets and Liabilities and amortized. The value of the swap contract is marked-to-market daily based on quotations from an independent pricing service or market makers and any change in value is recorded as an unrealized gain or loss. Periodic payments made or received are recorded as realized gains or losses. In addition, payments received or made as a result of a credit event or termination of the contract are recognized as realized gains or losses.
Certain credit default swap contracts entered into by the Portfolio provide for conditions that result in events of default or termination that enable the counterparty to the agreement to cause an early termination of the transactions under those agreements. Any election by the counterparty to terminate early may impact the amounts reported on the financial statements.
Mortgage dollar roll transactions
The Portfolios may engage in mortgage dollar roll transactions with respect to mortgage-backed securities issued by Government National Mortgage Association (GNMA), Federal National Mortgage Association (FNMA) and Federal Home Loan Mortgage Corporation (FHLMC). In a mortgage dollar roll transaction, a Portfolio sells a mortgage-backed security to a financial institution, such as a bank or broker-dealer and simultaneously agrees to repurchase a substantially similar security from the institution at a later date at an agreed upon price. The mortgage-backed securities that are repurchased will bear the same interest rate as those sold, but generally will be collateralized by different pools of mortgages with different pre-payment histories. During the roll period, a Portfolio foregoes principal and interest paid on the securities. A Portfolio is compensated by the difference between the current sales price and the forward price for the future purchase as well as by the earnings on the cash proceeds of the initial sale. Mortgage dollar rolls may be renewed without physical delivery of the securities subject to the contract. The Portfolios account for TBA dollar roll transactions as purchases and sales.
| | | | |
| 42 | | Wells Fargo Advantage Income Funds | | Notes to financial statements (unaudited) |
Security transactions and income recognition
Securities transactions are recorded on a trade date basis. Realized gains or losses are recorded on the basis of identified cost.
Interest income is accrued daily and bond discounts are accreted and premiums are amortized daily based on the effective interest method. To the extent debt obligations are placed on non-accrual status, any related interest income may be reduced by writing off interest receivables when the collection of all or a portion of interest has become doubtful based on consistently applied procedures. If the issuer subsequently resumes interest payments or when the collectability of interest is reasonably assured, the debt obligation is removed from non-accrual status.
Federal and other taxes
Each Portfolio is treated as a separate entity for federal income tax purposes. The Portfolios are not required to pay federal income taxes on their net investment income and net capital gain as they are treated as partnerships for federal income tax purposes. All interest, dividends, gains and losses of a Portfolio are deemed to have been “passed through” to the interestholders in proportion to their holdings of the Portfolio regardless of whether such interest, dividends and gains have been distributed by the Portfolio.
Each Portfolio’s income and federal excise tax returns and all financial records supporting those returns for the prior three fiscal years are subject to examination by the federal and Delaware revenue authorities. Management has analyzed each Portfolio’s tax positions taken on federal, state, and foreign tax returns for all open tax years and does not believe that there are any uncertain tax positions that require recognition of a tax liability.
3. FAIR VALUATION MEASUREMENTS
Fair value measurements of investments are determined within a framework that has established a fair value hierarchy based upon the various data inputs utilized in determining the value of each Portfolio’s investments. The three-level hierarchy gives the highest priority to unadjusted quoted prices in active markets for identical assets or liabilities (Level 1) and the lowest priority to significant unobservable inputs (Level 3). Each Portfolio’s investments are classified within the fair value hierarchy based on the lowest level of input that is significant to the fair value measurement. The inputs are summarized into three broad levels as follows:
| n | | Level 1 – quoted prices in active markets for identical securities |
| n | | Level 2 – other significant observable inputs (including quoted prices for similar securities, interest rates, prepayment speeds, credit risk, etc.) |
| n | | Level 3 – significant unobservable inputs (including each Portfolio’s own assumptions in determining the fair value of investments) |
The inputs or methodologies used for valuing investments in securities are not necessarily an indication of the risk associated with investing in those securities.
| | | | | | |
| Notes to financial statements (unaudited) | | Wells Fargo Advantage Income Funds | | | 43 | |
As of November 30, 2012, the inputs used in valuing investments in securities, which were carried at fair value, were as follows:
| | | | | | | | | | | | | | | | |
| Investments in Securities | | Quoted prices
(Level 1) | | | Significant other
observable inputs
(Level 2) | | | Significant
unobservable inputs
(Level 3) | | | Total | |
Core Bond Portfolio | | | | | | | | | | | | | | | | |
| | | | |
Agency securities | | $ | 0 | | | $ | 1,310,602,423 | | | $ | 0 | | | $ | 1,310,602,423 | |
| | | | |
Asset-backed securities | | | 0 | | | | 520,059,874 | | | | 0 | | | | 520,059,874 | |
| | | | |
Corporate bonds and notes | | | 0 | | | | 709,996,158 | | | | 0 | | | | 709,996,158 | |
| | | | |
Municipal obligations | | | 0 | | | | 40,639,268 | | | | 0 | | | | 40,639,268 | |
| | | | |
Non-agency mortgage backed securities | | | 0 | | | | 247,838,277 | | | | 0 | | | | 247,838,277 | |
| | | | |
U.S. Treasury securities | | | 800,503,979 | | | | 0 | | | | 0 | | | | 800,503,979 | |
| | | | |
Yankee corporate bonds and notes | | | 0 | | | | 269,923,292 | | | | 0 | | | | 269,923,292 | |
| | | | |
Yankee government bonds | | | 0 | | | | 42,082,254 | | | | 0 | | | | 42,082,254 | |
| | | | |
Other | | | 0 | | | | 0 | | | | 1,134,198 | | | | 1,134,198 | |
| | | | |
Short-term investments | | | | | | | | | | | | | | | | |
Investment companies | | | 201,172,161 | | | | 80,871,705 | | | | 0 | | | | 282,043,866 | |
Total | | $ | 1,001,676,140 | | | $ | 3,222,013,251 | | | $ | 1,134,198 | | | $ | 4,224,823,589 | |
Inflation-Protected Bond Portfolio | | | | | | | | | | | | | | | | |
| | | | |
U.S. Treasury securities | | $ | 79,940,330 | | | $ | 0 | | | $ | 0 | | | $ | 79,940,330 | |
| | | | |
Other | | | 0 | | | | 0 | | | | 180,901 | | | | 180,901 | |
| | | | |
Short-term investments | | | | | | | | | | | | | | | | |
Investment companies | | | 643,913 | | | | 1,778,061 | | | | 0 | | | | 2,421,974 | |
Total | | $ | 80,584,243 | | | $ | 1,778,061 | | | $ | 180,901 | | | $ | 82,543,205 | |
Further details on the major security types listed above can be found in each Portfolio of Investments or Summary Portfolio of Investments.
As of November 30, 2012, the inputs used in valuing each Portfolio’s other financial instruments, which are carried at fair value, were as follows:
| | | | | | | | | | | | | | | | |
| Credit default swaps* | | Quoted prices
(Level 1) | | | Significant other
observable inputs
(Level 2) | | | Significant
unobservable inputs
(Level 3) | | | Total | |
Core Bond Portfolio | | $ | 0 | | | $ | 46,587 | | | $ | 0 | | | $ | 46,587 | |
| * | The value of swap contracts consists of unrealized gains or losses and premiums paid/received on swap contracts as reflected on the Statements of Assets and Liabilities. |
Transfers in and transfers out are recognized at the end of the reporting period. For the six months ended November 30, 2012, the Portfolios did not have any transfers into/out of Level 1 or Level 2.
4. TRANSACTIONS WITH AFFILIATES AND OTHER EXPENSES
Advisory fees
The Trust has entered into an advisory contract with Funds Management, an indirect wholly owned subsidiary of Wells Fargo & Company (“Wells Fargo”). The adviser is responsible for implementing investment policies and guidelines and for supervising the subadviser, who is responsible for day-to-day portfolio management of the Portfolios.
Pursuant to the contract, Funds Management is entitled to receive an annual advisory fee starting at 0.40% and declining to 0.30% as the average net assets of each Portfolio increase. For the six months ended November 30, 2012, the advisory fee was equivalent to an annual rate of 0.35% and 0.40% of the average daily net assets of Core Bond Portfolio and Inflation-Protected Bond Portfolio, respectively.
| | | | |
| 44 | | Wells Fargo Advantage Income Funds | | Notes to financial statements (unaudited) |
Funds Management has retained the services of a subadviser to provide daily portfolio management to the Portfolios. The fees for subadvisory services are borne by Funds Management. WellsCap, an affiliate of Funds Management, is the subadviser to each Portfolio and is entitled to receive a fee from Funds Management at an annual rate starting at 0.20% and declining to 0.10% as the average daily net assets of each Portfolio increase.
Funds Management has voluntarily waived and/or reimbursed advisory fees to the extent necessary to maintain certain net operating expense ratios for the Portfolios.
5. INVESTMENT PORTFOLIO TRANSACTIONS
Purchases and sales of investments, excluding short-term securities, for the six months ended November 30, 2012 were as follows:
| | | | | | | | | | | | | | | | |
| | | Purchases at cost | | | Sales proceeds | |
| | | U.S.
Government | | | Non-U.S.
Government | | | U.S.
Government | | | Non-U.S.
Government | |
Core Bond Portfolio | | $ | 8,799,558,293 | | | $ | 2,102,279,294 | | | $ | 9,103,894,325 | | | $ | 1,844,969,083 | |
Inflation-Protected Bond Portfolio | | | 7,008,666 | | | | 0 | | | | 11,030,377 | | | | 0 | |
6. DERIVATIVE TRANSACTIONS
Core Bond Portfolio entered into credit default swap contracts as a substitute for taking a position in the underlying security or basket of securities or to potentially enhance the Portfolio’s total return.
At November 30, 2012, Core Bond Portfolio had the following credit default swap contracts outstanding:
Credit default swaps on debt obligations – Buy protection
| | | | | | | | | | | | | | | | | | | | | | | | | | | | |
| Expiration date | | Counterparty | | Reference debt obligation | | Rating of
reference
debt
obligation* | | | Notional
amount | | | Fixed
payments
made | | | Value | | | Upfront
premiums
paid/
(received) | | | Unrealized
losses | |
| 12-20-16 | | Citibank | | Prudential Financial Incorporated, 4.50%, 7-15-13 | | | A | | | $ | 5,000,000 | | | | 1.00 | % | | $ | 74,385 | | | $ | 286,257 | | | $ | (211,872 | ) |
| 6-20-17 | | Citibank | | Mondelez International Incorporated, 6.50%, 8-11-17 | | | BBB- | | | | 5,000,000 | | | | 1.00 | | | | (158,755 | ) | | | (114,158 | ) | | | (44,597 | ) |
Credit default swaps on debt obligations – Sell protection
| | | | | | | | | | | | | | | | | | | | | | | | | | | | |
| Expiration date | | Counterparty | | Reference debt
obligation | | Rating of
reference
debt
obligation* | | | Notional
amount | | | Fixed
payments
received | | | Value | | | Upfront
premiums
paid | | | Unrealized
gains | |
| 3-20-17 | | Citibank | | Coca-Cola Company, 5.35%, 11-15-17 | | | AA- | | | $ | 10,000,000 | | | | 1.00 | % | | $ | 293,701 | | | $ | 207,876 | | | $ | 85,825 | |
Credit default swaps on an index – Buy protection
| | | | | | | | | | | | | | | | | | | | | | | | |
| Expiration date | | Counterparty | | Reference index | | Notional
amount | | | Fixed
payments
made | | | Value | | | Upfront
premiums
paid | | | Unrealized
losses | |
| 12-20-16 | | Barclays | | Markit CDX North America Investment Grade 17 Index | | $ | 5,000,000 | | | | 1.00 | % | | $ | (54,248 | ) | | $ | 78,997 | | | $ | (133,245 | ) |
| 12-20-16 | | Barclays | | Markit CDX North America Investment Grade 17 Index | | | 5,000,000 | | | | 1.00 | | | | (54,248 | ) | | | 39,548 | | | | (93,796 | ) |
| 12-20-16 | | Citibank | | Markit CDX North America Investment Grade 17 Index | | | 5,000,000 | | | | 1.00 | | | | (54,248 | ) | | | 75,324 | | | | (129,572 | ) |
| * | Reflects the ratings of a nationally recognized ratings agency at period end. The credit rating serves as an indicator of the current status of the payment/performance risk of the credit derivative. A rating of D would most likely indicate a trigger event of default has occurred although circumstances including bankruptcy, failure to pay, obligation default, obligation acceleration, repudiation/moratorium and restructuring may also cause a credit event to take place. |
| | | | | | |
| Notes to financial statements (unaudited) | | Wells Fargo Advantage Income Funds | | | 45 | |
Core Bond Portfolio had an average notional balance on credit default swaps of $38,770,492 during the six months ended November 30, 2012.
Core Bond Portfolio’s credit default swap contracts may contain provisions for early termination in the event the net assets of the Portfolio declines below specific levels identified by the counterparty. If these levels are triggered, the counterparty may terminate the transaction and seek payment or request full collateralization of the credit default swap transactions in net liability positions. On November 30, 2012, the aggregate fair value of all credit default swap contracts with net asset contingent features that were in a liability positions amounted to $613,082 for Core Bond Portfolio.
The fair value, realized gains or losses and change in unrealized gains or losses on derivative instruments are reflected in the appropriate financial statements.
7. INDEMNIFICATION
Under the Trust’s organizational documents, the officers and directors are indemnified against certain liabilities that may arise out of performance of their duties to the Trust. Additionally, in the normal course of business, the Trust may enter into contracts with service providers that contain a variety of indemnification clauses. The Trust’s maximum exposure under these arrangements is dependent on future claims that may be made against the Portfolios and, therefore, cannot be estimated.
8. NEW ACCOUNTING PRONOUNCEMENT
In December 2011, the Financial Accounting Standards Board (“FASB”) issued Accounting Standard Update (“ASU”) No. 2011-11, Disclosures about Offsetting Assets and Liabilities. ASU 2011-11, which amends FASB ASC Topic 210, Balance Sheet, creates new disclosure requirements which require entities to disclose both gross and net information for derivatives and other financial instruments that are either offset in the Statement of Assets and Liabilities or subject to an enforceable master netting arrangement or similar agreement. The disclosure requirements are effective for interim and annual reporting periods beginning on or after January 1, 2013. Management is currently assessing the potential impact, in addition to expanded financial statement disclosure, that may result from adopting this ASU.
| | | | |
| 46 | | Wells Fargo Advantage Income Funds | | Other information (unaudited) |
PROXY VOTING INFORMATION
A description of the policies and procedures used to determine how to vote proxies relating to portfolio securities is available without charge, upon request, by calling 1-800-222-8222, visiting our website at wellsfargoadvantagefunds.com, or visiting the SEC website at sec.gov. Information regarding how the proxies related to portfolio securities were voted during the most recent 12-month period ended June 30 is available without charge on the website at wellsfargoadvantagefunds.com or by visiting the SEC website at sec.gov.
PORTFOLIO HOLDINGS INFORMATION
The complete portfolio holdings for the Funds are publicly available on the website (wellsfargoadvantagefunds.com) on a monthly, 30-day or more delayed basis. In addition, top ten holdings information is publicly available on the website on a monthly, seven-day or more delayed basis. Each Fund and Portfolio files its complete schedule of portfolio holdings with the SEC for the first and third quarters of each fiscal year on Form N-Q, which is available without charge by visiting the SEC website at sec.gov. In addition, each Fund’s and Portfolio’s Form N-Q may be reviewed and copied at the SEC’s Public Reference Room in Washington, DC, and at regional offices in New York City, at 233 Broadway, and in Chicago, at 175 West Jackson Boulevard, Suite 900. Information about the Public Reference Room may be obtained by calling 1-800-SEC-0330.
| | | | | | |
| Other information (unaudited) | | Wells Fargo Advantage Income Funds | | | 47 | |
BOARD OF TRUSTEES AND OFFICERS
Each of the Trustees and Officers listed in the table below acts in identical capacities for the Wells Fargo Advantage family of funds, which consists of 138 funds1 comprising the Wells Fargo Funds Trust, Wells Fargo Variable Trust, Wells Fargo Master Trust and four closed-end funds (collectively the “Fund Complex”). This table should be read in conjunction with the Prospectus and the Statement of Additional Information2. All of the Trustees are also Members of the Audit and Governance Committees of each Trust in the Fund Complex. The mailing address of each Trustee and Officer is 525 Market Street, 12th Floor, San Francisco, CA 94105. Each Trustee and Officer serves an indefinite term, however, each Trustee serves such term until reaching the mandatory retirement age established by the Trustees.
Independent Trustees
| | | | | | |
Name and year of birth | | Position held and length of service* | | Principal occupations during past five years | | Other directorships during
past five years |
Peter G. Gordon
(Born 1942) | | Trustee, since 1998; Chairman, since 2005 | | Co-Founder, Retired Chairman, President and CEO of Crystal Geyser Water Company. Trustee Emeritus, Colby College. | | Asset Allocation Trust |
Isaiah Harris, Jr.
(Born 1952) | | Trustee, since 2009 | | Retired. Prior thereto, President and CEO of BellSouth Advertising and Publishing Corp. from 2005 to 2007. Emeritus member of the Iowa State University Foundation Board of Governors. Emeritus Member of the Advisory Board of Iowa State University School of Business. Mr. Harris is a certified public accountant. | | CIGNA Corporation; Deluxe Corporation; Asset Allocation Trust |
Judith M. Johnson
(Born 1949) | | Trustee, since 2008; Audit Committee Chairman, since 2008 | | Retired. Prior thereto, Chief Executive Officer and Chief Investment Officer of Minneapolis Employees Retirement Fund from 1996 to 2008. Ms. Johnson is an attorney, certified public accountant and a certified managerial accountant. | | Asset Allocation Trust |
Leroy Keith, Jr.
(Born 1939) | | Trustee, since 2010 | | Chairman, Bloc Global Services (development and construction). Trustee of the Evergreen Funds from 1983 to 2010. Former Managing Director, Almanac Capital Management (commodities firm), former Partner, Stonington Partners, Inc. (private equity fund), former Director, Obagi Medical Products Co. and former Director, Lincoln Educational Services. | | Trustee, Virtus Fund Complex (consisting of 40 portfolios as of 12/31/11); Asset Allocation Trust |
David F. Larcker
(Born 1950) | | Trustee, since 2009 | | James Irvin Miller Professor of Accounting at the Graduate School of Business, Stanford University, Director of Corporate Governance Research Program and Senior Faculty of The Rock Center for Corporate Governance since 2006. From 2005 to 2008, Professor of Accounting at the Graduate School of Business, Stanford University. | | Asset Allocation Trust |
Olivia S. Mitchell
(Born 1953) | | Trustee, since 2006 | | International Foundation of Employee Benefit Plans Professor, Wharton School of the University of Pennsylvania since 1993. Director of Wharton’s Pension Research Council and Boettner Center on Pensions & Retirement Research, and Research Associate at the National Bureau of Economic Research. | | Asset Allocation Trust |
Timothy J. Penny
(Born 1951) | | Trustee, since 1996 | | President and CEO of Southern Minnesota Initiative Foundation, a non-profit organization, since 2007 and Senior Fellow at the Humphrey Institute Policy Forum at the University of Minnesota since 1995. Member of the Board of Trustees of NorthStar Education Finance, Inc., a non-profit organization, since 2007. | | Asset Allocation Trust |
| | | | |
| 48 | | Wells Fargo Advantage Income Funds | | Other information (unaudited) |
| | | | | | |
Name and year of birth | | Position held and length of service* | | Principal occupations during past five years | | Other directorships during
past five years |
Michael S. Scofield
(Born 1943) | | Trustee, since 2010 | | Served on the Investment Company Institute’s Board of Governors and Executive Committee from 2008-2011 as well the Governing Council of the Independent Directors Council from 2006-2011 and the Independent Directors Council Executive Committee from 2008-2011. Chairman of the IDC from 2008-2010. Institutional Investor (Fund Directions) Trustee of Year in 2007. Trustee of the Evergreen Funds (and its predecessors) from 1984 to 2010. Chairman of the Evergreen Funds from 2000-2010. Former Trustee of the Mentor Funds. Retired Attorney, Law Offices of Michael S. Scofield. | | Asset Allocation Trust |
Donald C. Willeke
(Born 1940) | | Trustee, since 1996 | | Principal of the law firm of Willeke & Daniels. General Counsel of the Minneapolis Employees Retirement Fund from 1984 until its consolidation into the Minnesota Public Employees Retirement Association on June 30, 2010. Director, General Counsel, and Vice Chair of The Tree Trust (non-profit corporation). Director and General Counsel of The American Chestnut Foundation (non-profit corporation). | | Asset Allocation Trust |
| * | Length of service dates reflect the Trustee’s commencement of service with the Trust’s predecessor entities, where applicable. |
Officers
| | | | | | |
Name and year of birth | | Position held and
length of service | | Principal occupations during past five years | | |
Karla M. Rabusch
(Born 1959) | | President, since 2003 | | Executive Vice President of Wells Fargo Bank, N.A. and President of Wells Fargo Funds Management, LLC since 2003. | | |
Nancy Wiser1 (Born 1967) | | Treasurer, since 2012 | | Executive Vice President of Wells Fargo Funds Management, LLC since 2011. Chief Operating Officer and Chief Compliance Officer at LightBox Capital Management LLC, from 2008 to 2011. Owned and operated a consulting business providing services to various hedge funds including acting as Chief Operating Officer and Chief Compliance Officer for a hedge fund from 2007 to 2008. Chief Operating Officer and Chief Compliance Officer of GMN Capital LLC from 2006 to 2007. | | |
C. David Messman
(Born 1960) | | Secretary, since 2000; Chief Legal Officer, since 2003 | | Senior Vice President and Secretary of Wells Fargo Funds Management, LLC since 2001. Vice President and Managing Counsel of Wells Fargo Bank, N.A. since 1996. | | |
Debra Ann Early
(Born 1964) | | Chief Compliance Officer, since 2007 | | Chief Compliance Officer of Wells Fargo Funds Management, LLC since 2007. Chief Compliance Officer of Parnassus Investments from 2005 to 2007. Chief Financial Officer of Parnassus Investments from 2004 to 2007. | | |
David Berardi
(Born 1975) | | Assistant Treasurer, since 2009 | | Vice President of Wells Fargo Funds Management, LLC since 2009. Vice President of Evergreen Investment Management Company, LLC from 2008 to 2010. Assistant Vice President of Evergreen Investment Services, Inc. from 2004 to 2008. Manager of Fund Reporting and Control for Evergreen Investment Management Company, LLC from 2004 to 2010. | | |
Jeremy DePalma1
(Born 1974) | | Assistant Treasurer, since 2009 | | Senior Vice President of Wells Fargo Funds Management, LLC since 2009. Senior Vice President of Evergreen Investment Management Company, LLC from 2008 to 2010. Vice President, Evergreen Investment Services, Inc. from 2004 to 2007. Head of the Fund Reporting and Control Team within Fund Administration from 2005 to 2010. | | |
| 1. | Nancy Wiser acts as Treasurer of 77 funds in the Fund Complex. Jeremy DePalma acts as Treasurer of 61 funds and Assistant Treasurer of 77 funds in the Fund Complex. |
| 2. | The Statement of Additional Information includes additional information about the Trustees and is available, without charge, upon request, by calling
1-800-222-8222 or by visiting the website at wellsfargoadvantagefunds.com. |
| | | | | | |
| List of abbreviations | | Wells Fargo Advantage Income Funds | | | 49 | |
The following is a list of common abbreviations for terms and entities that may have appeared in this report.
| ACB | — Agricultural Credit Bank |
| ADR | — American depositary receipt |
| ADS | — American depositary shares |
| AGC-ICC | — Assured Guaranty Corporation - Insured Custody Certificates |
| AGM | — Assured Guaranty Municipal |
| AMBAC | — American Municipal Bond Assurance Corporation |
| AMT | — Alternative minimum tax |
| BAN | — Bond anticipation notes |
| BHAC | — Berkshire Hathaway Assurance Corporation |
| CAB | — Capital appreciation bond |
| CCAB | — Convertible capital appreciation bond |
| CDA | — Community Development Authority |
| CDO | — Collateralized debt obligation |
| COP | — Certificate of participation |
| DRIVER | — Derivative inverse tax-exempt receipts |
| DW&P | — Department of Water & Power |
| DWR | — Department of Water Resources |
| ECFA | — Educational & Cultural Facilities Authority |
| EDA | — Economic Development Authority |
| EDFA | — Economic Development Finance Authority |
| ETF | — Exchange-traded fund |
| FDIC | — Federal Deposit Insurance Corporation |
| FFCB | — Federal Farm Credit Banks |
| FGIC | — Financial Guaranty Insurance Corporation |
| FGLMC | — Federal Government Loan Mortgage Corporation |
| FHA | — Federal Housing Administration |
| FHLB | — Federal Home Loan Bank |
| FHLMC | — Federal Home Loan Mortgage Corporation |
| FICO | — The Financing Corporation |
| FNMA | — Federal National Mortgage Association |
| GDR | — Global depositary receipt |
| GNMA | — Government National Mortgage Association |
| HCFR | — Healthcare facilities revenue |
| HEFA | — Health & Educational Facilities Authority |
| HEFAR | — Higher education facilities authority revenue |
| HFA | — Housing Finance Authority |
| HFFA | — Health Facilities Financing Authority |
| IBC | — Insured bond certificate |
| IDA | — Industrial Development Authority |
| IDAG | — Industrial Development Agency |
| IDR | — Industrial development revenue |
| KRW | — Republic of Korea won |
| LIBOR | — London Interbank Offered Rate |
| LLC | — Limited liability company |
| LLP | — Limited liability partnership |
| MBIA | — Municipal Bond Insurance Association |
| MFHR | — Multifamily housing revenue |
| MSTR | — Municipal securities trust receipts |
| MUD | — Municipal Utility District |
| NATL-RE | — National Public Finance Guarantee Corporation |
| PCFA | — Pollution Control Financing Authority |
| PCL | — Public Company Limited |
| PCR | — Pollution control revenue |
| PFA | — Public Finance Authority |
| PFFA | — Public Facilities Financing Authority |
| PFOTER | — Puttable floating option tax-exempt receipts |
| plc | — Public limited company |
| PUTTER | — Puttable tax-exempt receipts |
| R&D | — Research & development |
| RDA | — Redevelopment Authority |
| RDFA | — Redevelopment Finance Authority |
| REIT | — Real estate investment trust |
| ROC | — Reset option certificates |
| SAVRS | — Select auction variable rate securities |
| SBA | — Small Business Authority |
| SFHR | — Single-family housing revenue |
| SFMR | — Single-family mortgage revenue |
| SPA | — Standby purchase agreement |
| SPDR | — Standard & Poor’s Depositary Receipts |
| STRIPS | — Separate trading of registered interest and principal securities |
| TAN | — Tax anticipation notes |
| TIPS | — Treasury inflation-protected securities |
| TRAN | — Tax revenue anticipation notes |
| TCR | — Transferable custody receipts |
| TTFA | — Transportation Trust Fund Authority |
| TVA | — Tennessee Valley Authority |
| XLCA | — XL Capital Assurance |
This page is intentionally left blank.


For more information
More information about Wells Fargo Advantage Funds is available free upon request. To obtain literature, please write, email, visit the Fund’s website, or call:
Wells Fargo Advantage Funds
P.O. Box 8266
Boston, MA 02266-8266
Email: wfaf@wellsfargo.com
Website: wellsfargoadvantagefunds.com
Individual investors: 1-800-222-8222
Retail investment professionals: 1-888-877-9275
Institutional investment professionals: 1-866-765-0778
This report and the financial statements contained herein are submitted for the general information of the shareholders of Wells Fargo Advantage Funds. If this report is used for promotional purposes, distribution of the report must be accompanied or preceded by a current prospectus. For a current prospectus and, if available, a summary prospectus containing more complete information, including charges and expenses, call 1-800-222-8222 or visit the Fund’s website at wellsfargoadvantagefunds.com. Please consider the investment objectives, risks, charges, and expenses of the investment carefully before investing. This and other information about Wells Fargo Advantage Funds can be found in the current prospectus. Read the prospectus carefully before you invest or send money.
Wells Fargo Funds Management, LLC, a wholly owned subsidiary of Wells Fargo & Company, provides investment advisory and administrative services for Wells Fargo Advantage Funds. Other affiliates of Wells Fargo & Company provide subadvisory and other services for the Funds. The Funds are distributed by Wells Fargo Funds Distributor, LLC, Member FINRA/SIPC, an affiliate of Wells Fargo & Company.
NOT FDIC INSURED ¡ NO BANK GUARANTEE ¡ MAY LOSE VALUE
© 2013 Wells Fargo Funds Management, LLC. All rights reserved.
| | |
 | | 213711 01-13 SILD/SAR103 11-12 |

Wells Fargo Advantage
WealthBuilder PortfoliosSM

Semi-Annual Report
November 30, 2012
| n | | Wells Fargo Advantage WealthBuilder Conservative Allocation PortfolioSM |
| n | | Wells Fargo Advantage WealthBuilder Moderate Balanced PortfolioSM |
| n | | Wells Fargo Advantage WealthBuilder Growth Balanced PortfolioSM |
| n | | Wells Fargo Advantage WealthBuilder Growth Allocation PortfolioSM |
| n | | Wells Fargo Advantage WealthBuilder Equity PortfolioSM |
| n | | Wells Fargo Advantage WealthBuilder Tactical Equity PortfolioSM |

Reduce clutter. Save trees.
Sign up for electronic delivery of prospectuses and shareholder reports at wellsfargo.com/advantagedelivery
Contents
The views expressed and any forward-looking statements are as of November 30, 2012, unless otherwise noted, and are those of the Fund managers and/or Wells Fargo Funds Management, LLC. Discussions of individual securities, or the markets generally, or any Wells Fargo Advantage Fund are not intended as individual recommendations. Future events or results may vary significantly from those expressed in any forward-looking statements; the views expressed are subject to change at any time in response to changing circumstances in the market. Wells Fargo Funds Management, LLC, disclaims any obligation to publicly update or revise any views expressed or forward-looking statements.
NOT FDIC INSURED ¡ NO BANK GUARANTEE ¡ MAY LOSE VALUE

Wells Fargo investment history
| | |
| 1932 | | Keystone creates one of the first mutual fund families. |
| 1971 | | Wells Fargo & Company introduces one of the first institutional index funds. |
| 1978 | | Wells Fargo applies Markowitz and Sharpe’s research on Modern Portfolio Theory to introduce one of the industry’s first tactical asset allocation models in institutional separately managed accounts. |
| 1984 | | Wells Fargo Stagecoach Funds launches its first asset allocation fund. |
| 1989 | | The Tactical Asset Allocation (TAA) Model is first applied to Wells Fargo’s asset allocation mutual funds. |
| 1994 | | Wells Fargo introduces the LifePath Funds, one of the first suites of target date funds (now the Wells Fargo Advantage Dow Jones Target Date FundsSM). |
| 1996 | | Evergreen Investments and Keystone Funds merge. |
| 1997 | | Wells Fargo launches the Wells Fargo Advantage WealthBuilder PortfoliosSM, a fund-of-funds suite of products that includes the use of quantitative models to shift assets among investment styles. |
| 1999 | | Norwest Advantage Funds and Stagecoach Funds are reorganized into Wells Fargo Funds after the merger of Norwest and Wells Fargo. |
| 2002 | | Evergreen Retail and Evergreen Institutional companies form the umbrella asset management company, Evergreen Investments. |
| 2005 | | The integration of Strong Funds with Wells Fargo Funds creates Wells Fargo Advantage Funds, resulting in one of the top 20 mutual fund companies in the United States. |
| 2006 | | Wells Fargo Advantage Funds relaunches the target date product line as Wells Fargo Advantage Dow Jones Target Date Funds. |
| 2010 | | The mergers and reorganizations of Evergreen and Wells Fargo Advantage mutual funds are completed, unifying the families under the brand of Wells Fargo Advantage Funds. |
Wells Fargo Advantage Funds®
Wells Fargo Advantage Funds skillfully guides institutions, financial advisors, and individuals through the investment terrain to help them reach their financial objectives. Everything we do on behalf of investors is backed by our unique combination of qualifications.
Strength
Our organization is built on the standards of integrity and service established by our parent company—Wells Fargo & Company—more than 150 years ago. And, because we’re part of a highly diversified financial enterprise, we offer the depth of resources to help investors succeed.
Expertise
Our multi-boutique model offers investors access to the independent thinking of premier investment managers that have been chosen for their time-tested strategies. While each team specializes in a specific investment strategy, collectively they provide investors a wide choice of distinct investment styles. Our dedication to investment excellence doesn’t end with our expertise in manager selection—risk management, analysis, and rigorous ongoing review seek to ensure each manager’s investment process remains consistent.
Partnership
Our collaborative approach is built around understanding the needs and goals of our clients. By adhering to core principles of sound judgment and steady guidance, we support you through every stage of the investment decision process.
Carefully consider the investment objectives, risks, charges, and expenses before investing. For a current prospectus and, if available, a summary prospectus, for Wells Fargo Advantage Funds, containing this and other information, visit wellsfargoadvantagefunds.com. Read it carefully before investing.
Wells Fargo Funds Management, LLC, a wholly owned subsidiary of Wells Fargo & Company, provides investment advisory and administrative services for Wells Fargo Advantage Funds. Other affiliates of Wells Fargo & Company provide subadvisory and other services for the Funds. The Funds are distributed by Wells Fargo Funds Distributor, LLC, Member FINRA/SIPC, an affiliate of Wells Fargo & Company.
“Dow Jones®” and “Dow Jones Target Date IndexesSM” are service marks of Dow Jones Trademark Holdings LLC (“Dow Jones”); have been licensed to CME Group Index Services LLC (“CME Indexes”); and have been sublicensed for use for certain purposes by Global Index Advisors, Inc., and Wells Fargo Funds Management, LLC. The Wells Fargo Advantage Dow Jones Target Date FundsSM, based on the Dow Jones Target Date Indexes, are not sponsored, endorsed, sold, or promoted by Dow Jones, CME Indexes, or their respective affiliates, and none of them makes any representation regarding the advisability of investing in such product(s).
NOT FDIC INSURED ¡ NO BANK GUARANTEE ¡ MAY LOSE VALUE
Not part of the semi-annual report.
Wells Fargo Advantage Funds offers more than 110 mutual funds across a wide range of asset classes, representing over $214 billion in assets under management, as of November 30, 2012.
| | | | |
| Equity funds | | | | |
Asia Pacific Fund | | Enterprise Fund† | | Opportunity Fund† |
C&B Large Cap Value Fund | | Equity Value Fund | | Precious Metals Fund |
C&B Mid Cap Value Fund | | Global Opportunities Fund | | Premier Large Company Growth Fund |
Capital Growth Fund | | Growth Fund | | Small Cap Opportunities Fund |
Common Stock Fund | | Index Fund | | Small Cap Value Fund |
Disciplined U.S. Core Fund | | International Equity Fund | | Small Company Growth Fund |
Discovery Fund† | | International Value Fund | | Small Company Value Fund |
Diversified Equity Fund | | Intrinsic Small Cap Value Fund | | Small/Mid Cap Core Fund |
Diversified International Fund | | Intrinsic Value Fund | | Small/Mid Cap Value Fund |
Diversified Small Cap Fund | | Intrinsic World Equity Fund | | Special Mid Cap Value Fund |
Emerging Growth Fund | | Large Cap Core Fund | | Special Small Cap Value Fund |
Emerging Markets Equity Fund | | Large Cap Growth Fund | | Specialized Technology Fund |
Emerging Markets Equity Income Fund | | Large Company Value Fund | | Traditional Small Cap Growth Fund |
Endeavor Select Fund† | | Omega Growth Fund | | Utility and Telecommunications Fund |
| Bond funds | | | | |
Adjustable Rate Government Fund | | Income Plus Fund | | Short Duration Government Bond Fund |
California Limited-Term Tax-Free Fund | | Inflation-Protected Bond Fund | | Short-Term Bond Fund |
California Tax-Free Fund | | Intermediate Tax/AMT-Free Fund | | Short-Term High Yield Bond Fund |
Colorado Tax-Free Fund | | International Bond Fund | | Short-Term Municipal Bond Fund |
Core Bond Fund | | Minnesota Tax-Free Fund | | Strategic Municipal Bond Fund |
Emerging Markets Local Bond Fund | | Municipal Bond Fund | | Ultra Short-Term Income Fund |
Government Securities Fund | | North Carolina Tax-Free Fund | | Ultra Short-Term Municipal Income Fund |
High Income Fund | | Pennsylvania Tax-Free Fund | | Wisconsin Tax-Free Fund |
High Yield Bond Fund | | | | |
| Asset allocation funds | | | | |
Absolute Return Fund | | WealthBuilder Equity Portfolio† | | Target 2020 Fund† |
Asset Allocation Fund | | WealthBuilder Growth Allocation Portfolio† | | Target 2025 Fund† |
Conservative Allocation Fund | | WealthBuilder Growth Balanced Portfolio† | | Target 2030 Fund† |
Diversified Capital Builder Fund | | WealthBuilder Moderate Balanced Portfolio† | | Target 2035 Fund† |
Diversified Income Builder Fund | | WealthBuilder Tactical Equity Portfolio† | | Target 2040 Fund† |
Growth Balanced Fund | | Target Today Fund† | | Target 2045 Fund† |
Index Asset Allocation Fund | | Target 2010 Fund† | | Target 2050 Fund† |
Moderate Balanced Fund | | Target 2015 Fund† | | Target 2055 Fund† |
WealthBuilder Conservative Allocation Portfolio† | | | | |
| Money market funds | | | | |
100% Treasury Money Market Fund | | Heritage Money Market Fund† | | National Tax-Free Money Market Fund |
California Municipal Money Market Fund | | Money Market Fund | | Prime Investment Money Market Fund |
Cash Investment Money Market Fund | | Municipal Cash Management Money Market Fund | | Treasury Plus Money Market Fund |
Government Money Market Fund | | Municipal Money Market Fund | | |
| Variable trust funds1 | | | | |
VT Discovery Fund† | | VT Intrinsic Value Fund | | VT Small Cap Growth Fund |
VT Index Asset Allocation Fund | | VT Omega Growth Fund | | VT Small Cap Value Fund |
VT International Equity Fund | | VT Opportunity Fund† | | VT Total Return Bond Fund |
An investment in a money market fund is not insured or guaranteed by the Federal Deposit Insurance Corporation or any other government agency. Although the Wells Fargo Advantage Money Market Funds seek to preserve the value of your investment at $1.00 per share, it is possible to lose money by investing in a money market fund.
| 1. | The variable trust funds are generally available only through insurance company variable contracts. |
| † | In this report, the Wells Fargo Advantage Discovery FundSM, Wells Fargo Advantage Endeavor Select FundSM, Wells Fargo Advantage Enterprise FundSM, Wells Fargo Advantage Opportunity FundSM, Wells Fargo Advantage WealthBuilder Conservative Allocation PortfolioSM, Wells Fargo Advantage WealthBuilder Equity PortfolioSM, Wells Fargo Advantage WealthBuilder Growth Allocation PortfolioSM, Wells Fargo Advantage WealthBuilder Growth Balanced PortfolioSM, Wells Fargo Advantage WealthBuilder Moderate Balanced PortfolioSM, Wells Fargo Advantage WealthBuilder Tactical Equity PortfolioSM, Wells Fargo Advantage Dow Jones Target Today FundSM, Wells Fargo Advantage Dow Jones Target 2010 FundSM, Wells Fargo Advantage Dow Jones Target 2015 FundSM, Wells Fargo Advantage Dow Jones Target 2020 FundSM, Wells Fargo Advantage Dow Jones Target 2025 FundSM, Wells Fargo Advantage Dow Jones Target 2030 FundSM, Wells Fargo Advantage Dow Jones Target 2035 FundSM, Wells Fargo Advantage Dow Jones Target 2040 FundSM, Wells Fargo Advantage Dow Jones Target 2045 FundSM, Wells Fargo Advantage Dow Jones Target 2050 FundSM, Wells Fargo Advantage Dow Jones Target 2055 FundSM, Wells Fargo Advantage Heritage Money Market FundSM, Wells Fargo Advantage VT Discovery FundSM, and Wells Fargo Advantage VT Opportunity FundSM are referred to as the Discovery Fund, Endeavor Select Fund, Enterprise Fund, Opportunity Fund, WealthBuilder Conservative Allocation Portfolio, WealthBuilder Equity Portfolio, WealthBuilder Growth Allocation Portfolio, WealthBuilder Growth Balanced Portfolio, WealthBuilder Moderate Balanced Portfolio, WealthBuilder Tactical Equity Portfolio, Target Today Fund, Target 2010 Fund, Target 2015 Fund, Target 2020 Fund, Target 2025 Fund, Target 2030 Fund, Target 2035 Fund, Target 2040 Fund, Target 2045 Fund, Target 2050 Fund, Target 2055 Fund, Heritage Money Market Fund, VT Discovery Fund, and VT Opportunity Fund, respectively. |
Not part of the semi-annual report.
| | | | |
| 2 | | Wells Fargo Advantage WealthBuilder Portfolios | | Letter to shareholders (unaudited) |

Karla M. Rabusch
President
Wells Fargo Advantage Funds
Much of the period was marked by increased confidence that the U.S. economy was staging a fragile recovery, characterized by improvements in the U.S. housing sector and employment situation.
Dear Valued Shareholder:
We are pleased to offer you this semi-annual report for the Wells Fargo Advantage WealthBuilder Portfolios for the six-month period that ended November 30, 2012. Much of the period was marked by increased confidence that the U.S. economy was staging a fragile recovery, characterized by improvements in the U.S. housing sector and employment situation. Some of this momentum was offset by continued concerns about the ongoing European sovereign debt crisis and the potential effects that U.S. fiscal and monetary policy decisions would have on the pace of economic growth. As measured by various Russell indexes, U.S. stocks across the market capitalization spectrum posted strong single-digit gains for the period. Major international indexes, by comparison, ended the period with double-digit returns in U.S. dollar terms. Across the fixed-income markets, total returns were positive over the six-month period, with investment-grade and high-yield bonds outperforming U.S. Treasury securities as investors continued to seek yield in the current low and steady interest-rate environment.
Macroeconomic optimism improved, but caution remains.
Early in the reporting period, economic numbers supported the case for a gradual recovery. Real gross domestic product (GDP) growth for the U.S. was positive in the first quarter of 2012, with GDP increasing by 2.0% on an annualized basis. However, the rate of GDP growth slowed in the second quarter, with data showing a 1.7% annualized growth rate. Just prior to the end of the six-month reporting period, the third-quarter preliminary GDP data was released, showing that U.S. economic growth accelerated to a 2.7% annualized rate, lending evidence that the U.S. economy may finally have reached a sustainable growth pattern. Further bolstering the U.S. economic picture, the U.S. unemployment rate continued to trend downward throughout the period, due in part to a decline in the number of people actively participating in the labor force. The U.S. housing sector also strengthened over the six-month period, with new housing activity and existing home sales trending higher.
While the U.S. economy, in particular, continued to show signs of life, there remained uncertainty during the period ahead of the U.S. presidential election and the possibility of a fiscal cliff, which included a series of automatic federal budget cuts and the expiration of several tax cut programs. The U.S. election was decided without incident and Washington was able to strike a compromise to avoid the full impact of the U.S. fiscal cliff, which provided some stability to the markets. Looking ahead, however, several other fiscal policy decisions will be made during the first few months of 2013 that potentially could impact market sentiment and the pace of U.S. economic growth.
Beyond the uncertainties facing the U.S., the health of the eurozone continued to evolve during the period. By mid-June 2012, analysts were openly discussing the possibility of a crisis within the European banking system, a worry that remained near the forefront throughout most of the summer. In September and October 2012, however, the European Central Bank (ECB) and several key members of the eurozone, including France and Germany, announced their commitment to maintaining the integrity of the single currency. Despite the progress made across Europe in further addressing its ongoing debt issues, there remains a prolonged uncertainty about the eurozone and global economic growth.
Central banks continued to provide stimulus.
Throughout the reporting period, the Federal Reserve (Fed) kept its key interest rates effectively at zero in an effort to support the economy and financial system. In September 2012, the Fed responded to the stagnant U.S. labor market by
| | | | | | |
| Letter to shareholders (unaudited) | | Wells Fargo Advantage WealthBuilder Portfolios | | | 3 | |
announcing its third round of quantitative easing. However, the Fed surprised some investors by including an open-ended program to purchase mortgage-backed securities until employment growth materially improves. Additionally, the Fed restated its intention to keep interest rates low through 2015. Through additional bond purchases and an exceptionally low federal funds rate, the Fed is aiming to support the U.S. economic expansion and provide a catalyst for stronger job growth.
At the beginning of the period, the ECB had a key rate of 1.00%, which it had lowered from its previous level of 1.25% in response to weakness in the southern European economies. In July 2012, the ECB again cut its main interest rate to a historic low of 0.75% in hopes of offering relief to the eurozone’s sluggish economy amid signs that inflationary pressures were fading.
We remain committed to our investment strategies, even as many variables are at work in the market.
The full effect of the credit crisis remains unknown. Elevated unemployment and debt defaults continue to pressure consumers and businesses alike. In our experience, strict adherence to time-tested investment strategies has its rewards. As a whole, Wells Fargo Advantage Funds represents investments across a range of asset classes and investment styles, giving you an opportunity to create a diversified investment portfolio. While diversification may not prevent losses in a downturn, we believe it helps manage risk.
Thank you for choosing to invest with Wells Fargo Advantage Funds. We appreciate your confidence in us and remain committed to helping you meet your financial needs. For current information about your fund investments, contact your investment professional, visit our website at wellsfargoadvantagefunds.com, or call us directly at 1-800-222-8222. We are available 24 hours a day, 7 days a week.
Sincerely,

Karla M. Rabusch
President
Wells Fargo Advantage Funds
The Fed restated its intention to keep interest rates low through 2015. Through additional bond purchases and an exceptionally low federal funds rate, the Fed is aiming to support the U.S. economic expansion and provide a catalyst for stronger job growth.
Notice to shareholders
At its November 6-7, 2012 meeting, the Board of Trustees unanimously approved the following modification to WealthBuilder Portfolio shares sales load waiver privileges, with the change becoming effective on July 1, 2013:
| | n | | The ability to reinvest redemption proceeds at NAV will be reduced from 120 days to 90 days. | |
Please contact your investment professional or call us directly at 1-800-222-8222 if you have any questions on this Notice to Shareholders.
| | | | |
| 4 | | Wells Fargo Advantage WealthBuilder Portfolios | | Performance highlights (unaudited) |
Wells Fargo Advantage WealthBuilder Conservative Allocation Portfolio
Investment objective
The Portfolio seeks current income with a secondary emphasis on capital appreciation.
Adviser
Wells Fargo Funds Management, LLC
Subadviser
Wells Capital Management Incorporated
Portfolio managers
Doug Beath
Petros Bocray, CFA, FRM
Jeffrey P. Mellas, CAIA
Average annual total returns (%) as of November 30, 2012
| | | | | | | | | | | | | | | | | | | | | | | | | | | | | | | | | | |
| | | | | Including sales charge | | | Excluding sales charge | | | Expense ratios1 (%) | |
| | | Inception date | | 1 year | | | 5 year | | | Life of
Portfolio | | | 1 year | | | 5 year | | | Life of
Portfolio | | | Gross | | | Net2 | |
| WealthBuilder Conservative Allocation Portfolio (WBCAX) | | 9-30-04 | | | 4.75 | | | | 2.76 | | | | 3.78 | | | | 6.34 | | | | 3.08 | | | | 3.97 | | | | 2.07 | | | | 2.03 | |
| WealthBuilder Conservative Allocation Composite Index3 | | – | | | – | | | | – | | | | – | | | | 7.66 | | | | 5.38 | | | | 5.60 | | | | – | | | | – | |
| S&P 500 Index4 | | – | | | – | | | | – | | | | – | | | | 16.13 | | | | 1.34 | | | | 5.15 | | | | – | | | | – | |
| Barclays U.S. Aggregate Bond Index5 | | – | | | – | | | | – | | | | – | | | | 5.51 | | | | 6.04 | | | | 5.45 | | | | – | | | | – | |
Figures quoted represent past performance, which is no guarantee of future results and do not reflect the deduction of taxes that a shareholder may pay on fund distributions or the redemption of fund shares. Investment return and principal value of an investment will fluctuate so that an investor’s shares, when redeemed, may be worth more or less than their original cost. Performance shown without sales charges would be lower if sales charges were reflected. Current performance may be lower or higher than the performance data quoted and assumes the reinvestment of dividends and capital gains. Current month-end performance is available on the Portfolio’s website, wellsfargoadvantagefunds.com.
Index returns do not include transaction costs associated with buying and selling securities, any mutual fund fees or expenses, or any taxes. It is not possible to invest directly in an index.
For WealthBuilder Portfolio shares, the maximum front-end sales charge is 1.50%. Performance including sales charge assumes the sales charge for the corresponding time period.
Balanced funds may invest in stocks and bonds. Stock values fluctuate in response to the activities of individual companies and general market and economic conditions. Bond values fluctuate in response to the financial condition of individual issuers, general market and economic conditions, and changes in interest rates. In general, when interest rates rise, bond values fall and investors may lose principal value. The Portfolio will indirectly be exposed to all of the risks of an investment in the underlying funds and will indirectly bear expenses of the underlying funds. The use of derivatives may reduce returns and/or increase volatility. Certain investment strategies tend to increase the total risk of an investment (relative to the broader market). This Portfolio is exposed to alternative investment risk, foreign investment risk, high yield securities risk, mortgage- and asset-backed securities risk, and smaller company investment risk. Consult the Portfolio’s prospectus for additional information on these and other risks.
Please see footnotes on page 5.
| | | | | | |
| Performance highlights (unaudited) | | Wells Fargo Advantage WealthBuilder Portfolios | | | 5 | |
Wells Fargo Advantage WealthBuilder Conservative Allocation Portfolio (continued)
| | | | |
| Ten largest holdings6 (%) as of November 30, 2012 | |
Wells Fargo Advantage Short Duration Government Bond Fund | | | 27.76 | |
Wells Fargo Advantage Government Securities Fund | | | 18.50 | |
Wells Fargo Advantage Core Bond Portfolio | | | 18.48 | |
PIMCO High Yield Fund | | | 4.68 | |
Oppenheimer International Bond Fund | | | 4.66 | |
PIMCO CommodityRealReturn Strategy Fund | | | 2.95 | |
T. Rowe Price Blue Chip Growth Fund | | | 2.33 | |
ING Global Real Estate Fund | | | 1.98 | |
Thornburg International Value Fund | | | 1.70 | |
American Century Growth Fund | | | 1.66 | |
| | |
| Current target allocation7 as of November 30,2012 |
|
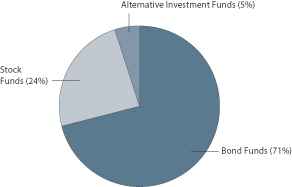
|
| 1. | Reflects the expense ratios as stated in the most recent prospectus. |
| 2. | The Adviser has committed through September 30, 2013, to waive fees and/or reimburse expenses to the extent necessary to cap the Portfolio’s Total Annual Fund Operating Expenses After Fee Waiver, excluding certain expenses, at 1.50%. Brokerage commissions, stamp duty fees, interest, taxes, acquired fund fees and expenses, and extraordinary expenses are excluded from the cap. Without this cap, the Portfolio’s returns would have been lower. |
| 3. | The WealthBuilder Conservative Allocation Composite Index is weighted 20% in the S&P 500 Index and 80% in the Barclays U.S. Aggregate Bond Index (includes Treasury issues, agency issues, corporate bond issues, and mortgage-backed securities). You cannot invest directly in an index. |
| 4. | The S&P 500 Index consists of 500 stocks chosen for market size, liquidity, and industry group representation. It is a market-value weighted index with each stock’s weight in the index proportionate to its market value. You cannot invest directly in an index. |
| 5. | The Barclays U.S. Aggregate Bond Index is composed of the Barclays U.S. Government/Credit Index and the Barclays U.S. Mortgage-Backed Securities Index and includes U.S. Treasury issues, agency issues, corporate bond issues, and mortgage-backed securities. You cannot invest directly in an index. |
| 6. | The ten largest holdings are calculated based on the value of the holdings divided by total net assets of the Portfolio. Holdings are subject to change and may have changed since the date specified. |
| 7. | Current target allocation is subject to change and is calculated based on the total long-term investments of the Portfolio. The Portfolio’s use of futures contracts to implement a Tactical Asset Allocation (TAA) shift toward stocks or bonds is reflected in the allocation shown. |
| | | | |
| 6 | | Wells Fargo Advantage WealthBuilder Portfolios | | Performance highlights (unaudited) |
Wells Fargo Advantage WealthBuilder Moderate Balanced Portfolio
Investment objective
The Portfolio seeks a combination of current income and capital appreciation.
Adviser
Wells Fargo Funds Management, LLC
Subadviser
Wells Capital Management Incorporated
Portfolio managers
Doug Beath
Petros Bocray, CFA, FRM
Jeffrey P. Mellas, CAIA
Average annual total returns (%) as of November 30, 2012
| | | | | | | | | | | | | | | | | | | | | | | | | | | | | | | | | | |
| | | | | Including sales charge | | | Excluding sales charge | | | Expense ratios1 (%) | |
| | | Inception date | | 1 year | | | 5 year | | | Life of
Portfolio | | | 1 year | | | 5 year | | | Life of
Portfolio | | | Gross | | | Net2 | |
| WealthBuilder Moderate Balanced Portfolio (WBBBX) | | 9-30-04 | | | 7.09 | | | | 1.44 | | | | 3.86 | | | | 8.72 | | | | 1.75 | | | | 4.05 | | | | 2.13 | | | | 2.09 | |
| WealthBuilder Moderate Balanced Composite Index3 | | – | | | – | | | | – | | | | – | | | | 9.81 | | | | 4.59 | | | | 5.65 | | | | – | | | | – | |
| S&P 500 Index4 | | – | | | – | | | | – | | | | – | | | | 16.13 | | | | 1.34 | | | | 5.15 | | | | – | | | | – | |
| Barclays U.S. Aggregate Bond Index5 | | – | | | – | | | | – | | | | – | | | | 5.51 | | | | 6.04 | | | | 5.45 | | | | – | | | | – | |
Figures quoted represent past performance, which is no guarantee of future results and do not reflect the deduction of taxes that a shareholder may pay on fund distributions or the redemption of fund shares. Investment return and principal value of an investment will fluctuate so that an investor’s shares, when redeemed, may be worth more or less than their original cost. Performance shown without sales charges would be lower if sales charges were reflected. Current performance may be lower or higher than the performance data quoted and assumes the reinvestment of dividends and capital gains. Current month-end performance is available on the Portfolio’s website, wellsfargoadvantagefunds.com.
Index returns do not include transaction costs associated with buying and selling securities, any mutual fund fees or expenses, or any taxes. It is not possible to invest directly in an index.
For WealthBuilder Portfolio shares, the maximum front-end sales charge is 1.50%. Performance including sales charge assumes the sales charge for the corresponding time period.
Balanced funds may invest in stocks and bonds. Stock values fluctuate in response to the activities of individual companies and general market and economic conditions. Bond values fluctuate in response to the financial condition of individual issuers, general market and economic conditions, and changes in interest rates. In general, when interest rates rise, bond values fall and investors may lose principal value. The Portfolio will indirectly be exposed to all of the risks of an investment in the underlying funds and will indirectly bear expenses of the underlying funds. The use of derivatives may reduce returns and/or increase volatility. Certain investment strategies tend to increase the total risk of an investment (relative to the broader market). This Portfolio is exposed to alternative investment risk, foreign investment risk, high yield securities risk, mortgage- and asset-backed securities risk, and smaller company investment risk. Consult the Portfolio’s prospectus for additional information on these and other risks.
Please see footnotes on page 7.
| | | | | | |
| Performance highlights (unaudited) | | Wells Fargo Advantage WealthBuilder Portfolios | | | 7 | |
Wells Fargo Advantage WealthBuilder Moderate Balanced Portfolio (continued)
| | | | |
| Ten largest holdings6 (%) as of November 30, 2012 | |
Wells Fargo Advantage Short Duration Government Bond Fund | | | 18.17 | |
Wells Fargo Advantage Government Securities Fund | | | 13.66 | |
Wells Fargo Advantage Core Bond Portfolio | | | 13.64 | |
PIMCO High Yield Fund | | | 4.61 | |
Oppenheimer International Bond Fund | | | 4.59 | |
T. Rowe Price Blue Chip Growth Fund | | | 4.57 | |
Thornburg International Value Fund | | | 3.35 | |
American Century Growth Fund | | | 3.25 | |
PIMCO CommodityRealReturn Strategy Fund | | | 2.93 | |
Wells Fargo Advantage Equity Value Portfolio | | | 2.76 | |
| | |
| Current target allocation7 as of November 30, 2012 |
|
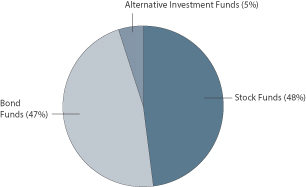
|
| 1. | Reflects the expense ratios as stated in the most recent prospectus. |
| 2. | The Adviser has committed through September 30, 2013, to waive fees and/or reimburse expenses to the extent necessary to cap the Portfolio’s Total Annual Fund Operating Expenses After Fee Waiver, excluding certain expenses, at 1.50%. Brokerage commissions, stamp duty fees, interest, taxes, acquired fund fees and expenses, and extraordinary expenses are excluded from the cap. Without this cap, the Portfolio’s returns would have been lower. |
| 3. | The WealthBuilder Moderate Balanced Composite Index is weighted 40% in the S&P 500 Index and 60% in the Barclays U.S. Aggregate Bond Index (includes Treasury issues, agency issues, corporate bond issues, and mortgage-backed securities). You cannot invest directly in an index. |
| 4. | The S&P 500 Index consists of 500 stocks chosen for market size, liquidity, and industry group representation. It is a market-value weighted index with each stock’s weight in the index proportionate to its market value. You cannot invest directly in an index. |
| 5. | The Barclays U.S. Aggregate Bond Index is composed of the Barclays U.S. Government/Credit Index and the Barclays U.S. Mortgage-Backed Securities Index and includes U.S. Treasury issues, agency issues, corporate bond issues, and mortgage-backed securities. You cannot invest directly in an index. |
| 6. | The ten largest holdings are calculated based on the value of the holdings divided by total net assets of the Portfolio. Holdings are subject to change and may have changed since the date specified. |
| 7. | Current target allocation is subject to change and is calculated based on the total long-term investments of the Portfolio. The Portfolio’s use of futures contracts to implement a Tactical Asset Allocation (TAA) shift toward stocks or bonds is reflected in the allocation shown. |
| | | | |
| 8 | | Wells Fargo Advantage WealthBuilder Portfolios | | Performance highlights (unaudited) |
Wells Fargo Advantage WealthBuilder Growth Balanced Portfolio
Investment objective
The Portfolio seeks a combination of capital appreciation and current income.
Adviser
Wells Fargo Funds Management, LLC
Subadviser
Wells Capital Management Incorporated
Portfolio managers
Doug Beath
Petros Bocray, CFA, FRM
Jeffrey P. Mellas, CAIA
Average annual total returns (%) as of November 30, 2012
| | | | | | | | | | | | | | | | | | | | | | | | | | | | | | | | | | |
| | | | | Including sales charge | | | Excluding sales charge | | | Expense ratios1 (%) | |
| | | Inception date | | 1 year | | | 5 year | | | 10 year | | | 1 year | | | 5 year | | | 10 year | | | Gross | | | Net2 | |
| WealthBuilder Growth Balanced Portfolio (WBGBX) | | 10-1-97 | | | 10.02 | | | | (0.41 | ) | | | 4.85 | | | | 11.69 | | | | (0.11 | ) | | | 5.01 | | | | 2.22 | | | | 2.18 | |
| WealthBuilder Growth Balanced Composite Index3 | | – | | | – | | | | – | | | | – | | | | 12.46 | | | | 3.39 | | | | 6.31 | | | | – | | | | – | |
| S&P 500 Index4 | | – | | | – | | | | – | | | | – | | | | 16.13 | | | | 1.34 | | | | 6.36 | | | | – | | | | – | |
| Barclays U.S. Aggregate Bond Index5 | | – | | | – | | | | – | | | | – | | | | 5.51 | | | | 6.04 | | | | 5.41 | | | | – | | | | – | |
Figures quoted represent past performance, which is no guarantee of future results and do not reflect the deduction of taxes that a shareholder may pay on fund distributions or the redemption of fund shares. Investment return and principal value of an investment will fluctuate so that an investor’s shares, when redeemed, may be worth more or less than their original cost. Performance shown without sales charges would be lower if sales charges were reflected. Current performance may be lower or higher than the performance data quoted and assumes the reinvestment of dividends and capital gains. Current month-end performance is available on the Portfolio’s website, wellsfargoadvantagefunds.com.
Index returns do not include transaction costs associated with buying and selling securities, any mutual fund fees or expenses, or any taxes. It is not possible to invest directly in an index.
For WealthBuilder Portfolio shares, the maximum front-end sales charge is 1.50%. Performance including sales charge assumes the sales charge for the corresponding time period.
Balanced funds may invest in stocks and bonds. Stock values fluctuate in response to the activities of individual companies and general market and economic conditions. Bond values fluctuate in response to the financial condition of individual issuers, general market and economic conditions, and changes in interest rates. In general, when interest rates rise, bond values fall and investors may lose principal value. The Portfolio will indirectly be exposed to all of the risks of an investment in the underlying funds and will indirectly bear expenses of the underlying funds. The use of derivatives may reduce returns and/or increase volatility. Certain investment strategies tend to increase the total risk of an investment (relative to the broader market). This Portfolio is exposed to alternative investment risk, foreign investment risk, high yield securities risk, mortgage- and asset-backed securities risk, and smaller company investment risk. Consult the Portfolio’s prospectus for additional information on these and other risks.
Please see footnotes on page 9.
| | | | | | |
| Performance highlights (unaudited) | | Wells Fargo Advantage WealthBuilder Portfolios | | | 9 | |
Wells Fargo Advantage WealthBuilder Growth Balanced Portfolio (continued)
| | | | |
| Ten largest holdings6 (%) as of November 30, 2012 | |
Wells Fargo Advantage Government Securities Fund | | | 11.50 | |
Wells Fargo Advantage Core Bond Portfolio | | | 10.62 | |
T. Rowe Price Blue Chip Growth Fund | | | 7.26 | |
Thornburg International Value Fund | | | 5.30 | |
American Century Growth Fund | | | 5.17 | |
PIMCO High Yield Fund | | | 4.48 | |
Oppenheimer International Bond Fund | | | 4.46 | |
Wells Fargo Advantage Equity Value Portfolio | | | 4.39 | |
Wells Fargo Advantage Endeavor Select Fund | | | 4.16 | |
Wells Fargo Advantage Large Cap Growth Fund | | | 4.14 | |
| | |
| Current target allocation7 as of November 30, 2012 |
|
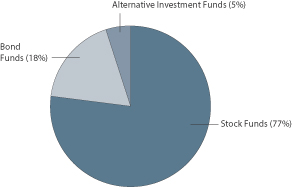
|
| 1. | Reflects the expense ratios as stated in the most recent prospectus. |
| 2. | The Adviser has committed through September 30, 2013, to waive fees and/or reimburse expenses to the extent necessary to cap the Portfolio’s Total Annual Fund Operating Expenses After Fee Waiver, excluding certain expenses, at 1.50%. Brokerage commissions, stamp duty fees, interest, taxes, acquired fund fees and expenses, and extraordinary expenses are excluded from the cap. Without this cap, the Portfolio’s returns would have been lower. |
| 3. | The WealthBuilder Growth Balanced Composite Index is weighted 65% in the S&P 500 Index and 35% in the Barclays U.S. Aggregate Bond Index (includes Treasury issues, agency issues, corporate bond issues, and mortgage-backed securities). You cannot invest directly in an index. |
| 4. | The S&P 500 Index consists of 500 stocks chosen for market size, liquidity, and industry group representation. It is a market-value weighted index with each stock’s weight in the index proportionate to its market value. You cannot invest directly in an index. |
| 5. | The Barclays U.S. Aggregate Bond Index is composed of the Barclays U.S. Government/Credit Index and the Barclays U.S. Mortgage-Backed Securities Index and includes U.S. Treasury issues, agency issues, corporate bond issues, and mortgage-backed securities. You cannot invest directly in an index. |
| 6. | The ten largest holdings are calculated based on the value of the holdings divided by total net assets of the Portfolio. Holdings are subject to change and may have changed since the date specified. |
| 7. | Current target allocation is subject to change and is calculated based on the total long-term investments of the Portfolio. The Portfolio’s use of futures contracts to implement a Tactical Asset Allocation (TAA) shift toward stocks or bonds is reflected in the allocation shown. |
| | | | |
| 10 | | Wells Fargo Advantage WealthBuilder Portfolios | | Performance highlights (unaudited) |
Wells Fargo Advantage WealthBuilder Growth Allocation Portfolio
Investment objective
The Portfolio seeks capital appreciation with a secondary emphasis on current income.
Adviser
Wells Fargo Funds Management, LLC
Subadviser
Wells Capital Management Incorporated
Portfolio managers
Doug Beath
Petros Bocray, CFA, FRM
Jeffrey P. Mellas, CAIA
Average annual total returns (%) as of November 30, 2012
| | | | | | | | | | | | | | | | | | | | | | | | | | | | | | | | | | |
| | | | | Including sales charge | | | Excluding sales charge | | | Expense ratios1 (%) | |
| | | Inception date | | 1 year | | | 5 year | | | Life of
Portfolio | | | 1 year | | | 5 year | | | Life of
Portfolio | | | Gross | | | Net2 | |
| WealthBuilder Growth Allocation Portfolio (WBGGX) | | 9-30-04 | | | 10.98 | | | | (1.44 | ) | | | 3.44 | | | | 12.67 | | | | (1.15 | ) | | | 3.63 | | | | 2.29 | | | | 2.22 | |
| WealthBuilder Growth Allocation Composite Index3 | | – | | | – | | | | – | | | | – | | | | 14.04 | | | | 2.56 | | | | 5.42 | | | | – | | | | – | |
| S&P 500 Index4 | | – | | | – | | | | – | | | | – | | | | 16.13 | | | | 1.34 | | | | 5.15 | | | | – | | | | – | |
| Barclays U.S. Aggregate Bond Index5 | | – | | | – | | | | – | | | | – | | | | 5.51 | | | | 6.04 | | | | 5.45 | | | | – | | | | – | |
Figures quoted represent past performance, which is no guarantee of future results and do not reflect the deduction of taxes that a shareholder may pay on fund distributions or the redemption of fund shares. Investment return and principal value of an investment will fluctuate so that an investor’s shares, when redeemed, may be worth more or less than their original cost. Performance shown without sales charges would be lower if sales charges were reflected. Current performance may be lower or higher than the performance data quoted and assumes the reinvestment of dividends and capital gains. Current month-end performance is available on the Portfolio’s website, wellsfargoadvantagefunds.com.
Index returns do not include transaction costs associated with buying and selling securities, any mutual fund fees or expenses, or any taxes. It is not possible to invest directly in an index.
For WealthBuilder Portfolio shares, the maximum front-end sales charge is 1.50%. Performance including sales charge assumes the sales charge for the corresponding time period.
Balanced funds may invest in stocks and bonds. Stock values fluctuate in response to the activities of individual companies and general market and economic conditions. Bond values fluctuate in response to the financial condition of individual issuers, general market and economic conditions, and changes in interest rates. In general, when interest rates rise, bond values fall and investors may lose principal value. The Portfolio will indirectly be exposed to all of the risks of an investment in the underlying funds and will indirectly bear expenses of the underlying funds. The use of derivatives may reduce returns and/or increase volatility. Certain investment strategies tend to increase the total risk of an investment (relative to the broader market). This Portfolio is exposed to alternative investment risk, foreign investment risk, high yield securities risk, mortgage- and asset-backed securities risk, and smaller company investment risk. Consult the Portfolio’s prospectus for additional information on these and other risks.
Please see footnotes on page 11.
| | | | | | |
| Performance highlights (unaudited) | | Wells Fargo Advantage WealthBuilder Portfolios | | | 11 | |
Wells Fargo Advantage WealthBuilder Growth Allocation Portfolio (continued)
| | | | |
| Ten largest holdings6 (%) as of November 30, 2012 | |
T. Rowe Price Blue Chip Growth Fund | | | 8.82 | |
Thornburg International Value Fund | | | 6.42 | |
American Century Growth Fund | | | 6.28 | |
Wells Fargo Advantage Government Securities Fund | | | 6.20 | |
Wells Fargo Advantage Core Bond Portfolio | | | 6.20 | |
Wells Fargo Advantage Equity Value Portfolio | | | 5.34 | |
Wells Fargo Advantage Endeavor Select Fund | | | 5.05 | |
Wells Fargo Advantage Large Cap Growth Fund | | | 5.04 | |
Wells Fargo Advantage International Growth Portfolio | | | 4.30 | |
Wells Fargo Advantage Small Company Value Portfolio | | | 3.59 | |
| | |
| Current target allocation7 as of November 30, 2012 |
|
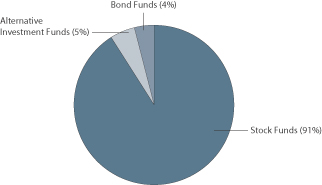
|
| 1. | Reflects the expense ratios as stated in the most recent prospectus. |
| 2. | The Adviser has committed through September 30, 2013, to waive fees and/or reimburse expenses to the extent necessary to cap the Portfolio’s Total Annual Fund Operating Expenses After Fee Waiver, excluding certain expenses, at 1.50%. Brokerage commissions, stamp duty fees, interest, taxes, acquired fund fees and expenses, and extraordinary expenses are excluded from the cap. Without this cap, the Portfolio’s returns would have been lower. |
| 3. | The WealthBuilder Growth Allocation Composite Index is weighted 80% in the S&P 500 Index and 20% in the Barclays U.S. Aggregate Bond Index (includes Treasury issues, agency issues, corporate bond issues, and mortgage-backed securities). You cannot invest directly in an index. |
| 4. | The S&P 500 Index consists of 500 stocks chosen for market size, liquidity, and industry group representation. It is a market-value weighted index with each stock’s weight in the index proportionate to its market value. You cannot invest directly in an index. |
| 5. | The Barclays U.S. Aggregate Bond Index is composed of the Barclays U.S. Government/Credit Index and the Barclays U.S. Mortgage-Backed Securities Index and includes U.S. Treasury issues, agency issues, corporate bond issues, and mortgage-backed securities. You cannot invest directly in an index. |
| 6. | The ten largest holdings are calculated based on the value of the holdings divided by total net assets of the Portfolio. Holdings are subject to change and may have changed since the date specified. |
| 7. | Current target allocation is subject to change and is calculated based on the total long-term investments of the Portfolio. The Portfolio’s use of futures contracts to implement a Tactical Asset Allocation (TAA) shift toward stocks or bonds is reflected in the allocation shown. |
| | | | |
| 12 | | Wells Fargo Advantage WealthBuilder Portfolios | | Performance highlights (unaudited) |
Wells Fargo Advantage WealthBuilder Equity Portfolio
Investment objective
The Portfolio seeks long-term capital appreciation with no emphasis on income.
Adviser
Wells Fargo Funds Management, LLC
Subadviser
Wells Capital Management Incorporated
Portfolio managers
Doug Beath
Petros Bocray, CFA, FRM
Jeffrey P. Mellas, CAIA
Average annual total returns (%) as of November 30, 2012
| | | | | | | | | | | | | | | | | | | | | | | | | | | | | | | | | | |
| | | | | Including sales charge | | | Excluding sales charge | | | Expense ratios1 (%) | |
| | | Inception date | | 1 year | | | 5 year | | | 10 year | | | 1 year | | | 5 year | | | 10 year | | | Gross | | | Net2 | |
| WealthBuilder Equity Portfolio (WBGIX) | | 10-1-97 | | | 9.99 | | | | (2.42 | ) | | | 4.62 | | | | 11.66 | | | | (2.13 | ) | | | 4.78 | | | | 2.42 | | | | 2.32 | |
| S&P 500 Index3 | | – | | | – | | | | – | | | | – | | | | 16.13 | | | | 1.34 | | | | 6.36 | | | | – | | | | – | |
Figures quoted represent past performance, which is no guarantee of future results and do not reflect the deduction of taxes that a shareholder may pay on fund distributions or the redemption of fund shares. Investment return and principal value of an investment will fluctuate so that an investor’s shares, when redeemed, may be worth more or less than their original cost. Performance shown without sales charges would be lower if sales charges were reflected. Current performance may be lower or higher than the performance data quoted and assumes the reinvestment of dividends and capital gains. Current month-end performance is available on the Portfolio’s website, wellsfargoadvantagefunds.com.
Index returns do not include transaction costs associated with buying and selling securities, any mutual fund fees or expenses, or any taxes. It is not possible to invest directly in an index.
For WealthBuilder Portfolio shares, the maximum front-end sales charge is 1.50%. Performance including sales charge assumes the sales charge for the corresponding time period.
Stock fund values fluctuate in response to the activities of individual companies and general market and economic conditions. The Portfolio will indirectly be exposed to all of the risks of an investment in the underlying funds and will indirectly bear expenses of the underlying funds. Certain investment strategies tend to increase the total risk of an investment (relative to the broader market). This Portfolio is exposed to foreign investment risk and smaller-company investment risk. Consult the Portfolio’s prospectus for additional information on these and other risks.
Please see footnotes on page 13.
| | | | | | |
| Performance highlights (unaudited) | | Wells Fargo Advantage WealthBuilder Portfolios | | | 13 | |
Wells Fargo Advantage WealthBuilder Equity Portfolio (continued)
| | | | |
| Ten largest holdings4 (%) as of November 30, 2012 | |
Wells Fargo Advantage Equity Value Portfolio | | | 12.45 | |
Thornburg International Value Fund | | | 9.01 | |
T. Rowe Price Blue Chip Growth Fund | | | 8.78 | |
American Century Growth Fund | | | 6.27 | |
MFS Value Fund | | | 6.23 | |
Eaton Vance Large Cap Value Fund | | | 6.22 | |
Wells Fargo Advantage International Growth Portfolio | | | 6.06 | |
Wells Fargo Advantage Endeavor Select Fund | | | 5.03 | |
Wells Fargo Advantage Small Company Value Portfolio | | | 5.02 | |
Wells Fargo Advantage Large Cap Growth Fund | | | 5.02 | |
| | |
| Portfolio allocation5 as of November 30, 2012 |
|
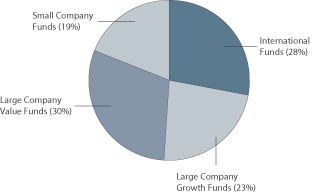
|
| 1. | Reflects the expense ratios as stated in the most recent prospectus. |
| 2. | The Adviser has committed through September 30, 2013, to waive fees and/or reimburse expenses to the extent necessary to cap the Portfolio’s Total Annual Fund Operating Expenses After Fee Waiver, excluding certain expenses, at 1.50%. Brokerage commissions, stamp duty fees, interest, taxes, acquired fund fees and expenses, and extraordinary expenses are excluded from the cap. Without this cap, the Portfolio’s returns would have been lower. |
| 3. | The S&P 500 Index consists of 500 stocks chosen for market size, liquidity, and industry group representation. It is a market-value weighted index with each stock’s weight in the index proportionate to its market value. You cannot invest directly in an index. |
| 4. | The ten largest holdings are calculated based on the value of the holdings divided by total net assets of the Portfolio. Holdings are subject to change and may have changed since the date specified. |
| 5. | Portfolio allocation is subject to change and is calculated based on the total long-term investments of the Portfolio. |
| | | | |
| 14 | | Wells Fargo Advantage WealthBuilder Portfolios | | Performance highlights (unaudited) |
Wells Fargo Advantage WealthBuilder Tactical Equity Portfolio
Investment objective
The Portfolio seeks long-term capital appreciation with no emphasis on income.
Adviser
Wells Fargo Funds Management, LLC
Subadviser
Wells Capital Management Incorporated
Portfolio managers
Doug Beath
Petros Bocray, CFA, FRM
Jeffrey P. Mellas, CAIA
Average annual total returns (%) as of November 30, 2012
| | | | | | | | | | | | | | | | | | | | | | | | | | | | | | | | | | |
| | | | | Including sales charge | | | Excluding sales charge | | | Expense ratios1 (%) | |
| | | Inception date | | 1 year | | | 5 year | | | 10 year | | | 1 year | | | 5 year | | | 10 year | | | Gross | | | Net2 | |
| WealthBuilder Tactical Equity Portfolio (WBGAX) | | 10-1-97 | | | 11.29 | | | | (2.41 | ) | | | 6.24 | | | | 12.98 | | | | (2.12 | ) | | | 6.40 | | | | 2.33 | | | | 2.27 | |
| S&P 500 Index3 | | – | | | – | | | | – | | | | – | | | | 16.13 | | | | 1.34 | | | | 6.36 | | | | – | | | | – | |
Figures quoted represent past performance, which is no guarantee of future results and do not reflect the deduction of taxes that a shareholder may pay on fund distributions or the redemption of fund shares. Investment return and principal value of an investment will fluctuate so that an investor’s shares, when redeemed, may be worth more or less than their original cost. Performance shown without sales charges would be lower if sales charges were reflected. Current performance may be lower or higher than the performance data quoted and assumes the reinvestment of dividends and capital gains. Current month-end performance is available on the Portfolio’s website, wellsfargoadvantagefunds.com.
Index returns do not include transaction costs associated with buying and selling securities, any mutual fund fees or expenses, or any taxes. It is not possible to invest directly in an index.
For WealthBuilder Portfolio shares, the maximum front-end sales charge is 1.50%. Performance including sales charge assumes the sales charge for the corresponding time period.
Stock fund values fluctuate in response to the activities of individual companies and general market and economic conditions. The Portfolio will indirectly be exposed to all of the risks of an investment in the underlying funds and will indirectly bear expenses of the underlying funds. The use of derivatives may reduce returns and/or increase volatility. Certain investment strategies tend to increase the total risk of an investment (relative to the broader market). This Portfolio is exposed to foreign investment risk and smaller-company investment risk. Consult the Portfolio’s prospectus for additional information on these and other risks.
Please see footnotes on page 15.
| | | | | | |
| Performance highlights (unaudited) | | Wells Fargo Advantage WealthBuilder Portfolios | | | 15 | |
Wells Fargo Advantage WealthBuilder Tactical Equity Portfolio (continued)
| | | | |
| Ten largest holdings4 (%) as of November 30, 2012 | |
T. Rowe Price Blue Chip Growth Fund | | | 11.50 | |
Thornburg International Value Fund | | | 8.42 | |
American Century Growth Fund | | | 8.21 | |
Wells Fargo Advantage Equity Value Portfolio | | | 7.01 | |
Wells Fargo Advantage Endeavor Select Fund | | | 6.59 | |
Wells Fargo Advantage Large Cap Growth Fund | | | 6.57 | |
Wells Fargo Advantage International Growth Portfolio | | | 5.63 | |
Wells Fargo Advantage Small Company Value Portfolio | | | 4.70 | |
Royce Pennsylvania Mutual Fund | | | 4.69 | |
Wells Fargo Advantage Emerging Growth Portfolio | | | 4.59 | |
| | |
| Current target allocation5 as of November 30, 2012 |
|
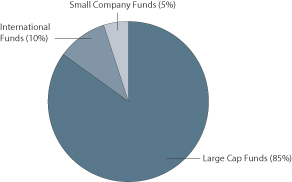
|
| 1. | Reflects the expense ratios as stated in the most recent prospectus. |
| 2. | The Adviser has committed through September 30, 2013, to waive fees and/or reimburse expenses to the extent necessary to cap the Portfolio’s Total Annual Fund Operating Expenses After Fee Waiver, excluding certain expenses, at 1.50%. Brokerage commissions, stamp duty fees, interest, taxes, acquired fund fees and expenses, and extraordinary expenses are excluded from the cap. Without this cap, the Portfolio’s returns would have been lower. |
| 3. | The S&P 500 Index consists of 500 stocks chosen for market size, liquidity, and industry group representation. It is a market-value weighted index with each stock’s weight in the index proportionate to its market value. You cannot invest directly in an index. |
| 4. | The ten largest holdings are calculated based on the value of the holdings divided by total net assets of the Portfolio. Holdings are subject to change and may have changed since the date specified. |
| 5. | Current target allocation is subject to change and is calculated based on the total long-term investments of the Portfolio. The Portfolio’s use of a Tactical Equity Allocation (TEA) Model to allocate across stock fund styles is reflected in the allocation shown. |
| | | | |
| 16 | | Wells Fargo Advantage WealthBuilder Portfolios | | Fund expenses (unaudited) |
As a shareholder of the Portfolio, you incur two types of costs: (1) transaction costs, including sales charges (loads) on purchase payments and (2) ongoing costs, including management fees, distribution (12b-1) and/or shareholder service fees, and other Portfolio expenses. This example is intended to help you understand your ongoing costs (in dollars) of investing in the Portfolio and to compare these costs with the ongoing costs of investing in other mutual funds.
The example is based on an investment of $1,000 invested at the beginning of the six-month period and held for the entire period from June 1, 2012, to November 30, 2012.
Actual expenses
The “Actual” line of the table below provides information about actual account values and actual expenses. You may use the information in this line, together with the amount you invested, to estimate the expenses that you paid over the period. Simply divide your account value by $1,000 (for example, an $8,600 account value divided by $1,000 = 8.6), then multiply the result by the number in the “Actual” line under the heading entitled “Expenses paid during period” for your applicable class of shares to estimate the expenses you paid on your account during this period.
Hypothetical example for comparison purposes
The “Hypothetical” line of the table below provides information about hypothetical account values and hypothetical expenses based on the Portfolio’s actual expense ratio and an assumed rate of return of 5% per year before expenses, which is not the Portfolio’s actual return. The hypothetical account values and expenses may not be used to estimate the actual ending account balance or expenses you paid for the period. You may use this information to compare the ongoing costs of investing in the Portfolio and other funds. To do so, compare this 5% hypothetical example with the 5% hypothetical examples that appear in the shareholder reports of the other funds.
Please note that the expenses shown in the table are meant to highlight your ongoing costs only and do not reflect any transactional costs, such as sales charges (loads). Therefore, the “Hypothetical” line of the table is useful in comparing ongoing costs only and will not help you determine the relative total costs of owning different funds. In addition, if these transactional costs were included, your costs would have been higher.
| | | | | | | | | | | | | | | | |
| | | Beginning
account value
6-1-12 | | | Ending
account value
11-30-12 | | | Expenses
paid during
the period1 | | | Net annual
expense ratio | |
WealthBuilder Conservative Allocation Portfolio | | | | | | | | | | | | | | | | |
Actual | | $ | 1,000.00 | | | $ | 1,038.03 | | | $ | 7.66 | | | | 1.50 | % |
Hypothetical (5% return before expenses) | | $ | 1,000.00 | | | $ | 1,017.55 | | | $ | 7.59 | | | | 1.50 | % |
WealthBuilder Moderate Balanced Portfolio | | | | | | | | | | | | | | | | |
Actual | | $ | 1,000.00 | | | $ | 1,055.35 | | | $ | 7.73 | | | | 1.50 | % |
Hypothetical (5% return before expenses) | | $ | 1,000.00 | | | $ | 1,017.55 | | | $ | 7.59 | | | | 1.50 | % |
WealthBuilder Growth Balanced Portfolio | | | | | | | | | | | | | | | | |
Actual | | $ | 1,000.00 | | | $ | 1,076.57 | | | $ | 7.81 | | | | 1.50 | % |
Hypothetical (5% return before expenses) | | $ | 1,000.00 | | | $ | 1,017.55 | | | $ | 7.59 | | | | 1.50 | % |
WealthBuilder Growth Allocation Portfolio | | | | | | | | | | | | | | | | |
Actual | | $ | 1,000.00 | | | $ | 1,082.80 | | | $ | 7.83 | | | | 1.50 | % |
Hypothetical (5% return before expenses) | | $ | 1,000.00 | | | $ | 1,017.55 | | | $ | 7.59 | | | | 1.50 | % |
WealthBuilder Equity Portfolio | | | | | | | | | | | | | | | | |
Actual | | $ | 1,000.00 | | | $ | 1,092.84 | | | $ | 7.87 | | | | 1.50 | % |
Hypothetical (5% return before expenses) | | $ | 1,000.00 | | | $ | 1,017.55 | | | $ | 7.59 | | | | 1.50 | % |
WealthBuilder Tactical Equity Portfolio | | | | | | | | | | | | | | | | |
Actual | | $ | 1,000.00 | | | $ | 1,074.69 | | | $ | 7.80 | | | | 1.50 | % |
Hypothetical (5% return before expenses) | | $ | 1,000.00 | | | $ | 1,017.55 | | | $ | 7.59 | | | | 1.50 | % |
| 1. | Expenses paid is equal to the annualized expense ratio multiplied by the average account value over the period, multiplied by the number of days in the most recent fiscal half-year divided by the number of days in the fiscal year (to reflect the one-half-year period). |
| | | | | | |
| Portfolio of investments—November 30, 2012 (unaudited) | | Wells Fargo Advantage WealthBuilder Portfolios | | | 17 | |
WEALTHBUILDER CONSERVATIVE ALLOCATION PORTFOLIO
| | | | | | | | | | | | |
| Security name | | | | | | | | | Value | |
| | | | | | | | | | | | |
| | | | |
Investment Companies: 98.44% | | | | | | | | | | | | |
| | | | |
| Affiliated Master Portfolios: 22.94% | | | | | | | | | | | | |
Wells Fargo Advantage Core Bond Portfolio | | | | | | | | | | $ | 128,218,655 | |
Wells Fargo Advantage Emerging Growth Portfolio | | | | | | | | | | | 6,568,056 | |
Wells Fargo Advantage Equity Value Portfolio | | | | | | | | | | | 9,811,615 | |
Wells Fargo Advantage International Growth Portfolio | | | | | | | | | | | 7,915,004 | |
Wells Fargo Advantage Small Company Value Portfolio | | | | | | | | | | | 6,604,554 | |
| | | | |
| | | | | | | | | | | 159,117,884 | |
| | | | | | | | | | | | |
| | | | |
| | | | | | | Shares | | | | |
| | | | |
| Alternative Investment Funds : 5.43% | | | | | | | | | | | | |
AQR Managed Futures Strategy Fund | | | | | | | 361,036 | | | | 3,444,283 | |
ING Global Real Estate Fund | | | | | | | 775,160 | | | | 13,712,572 | |
PIMCO CommodityRealReturn Strategy Fund | | | | | | | 2,960,863 | | | | 20,489,169 | |
| | | | |
| | | | | | | | | | | 37,646,024 | |
| | | | | | | | | | | | |
| | | | |
| International Equity Funds: 4.53% | | | | | | | | | | | | |
DFA International Small Cap Value Portfolio | | | | | | | 171,136 | | | | 2,630,356 | |
Dodge & Cox International Stock Fund | | | | | | | 117,224 | | | | 3,926,987 | |
Oppenheimer Developing Markets Fund | | | | | | | 96,032 | | | | 3,254,537 | |
T. Rowe Price International Discovery Fund | | | | | | | 57,440 | �� | | | 2,620,432 | |
Templeton Institutional Foreign Equity Fund | | | | | | | 204,180 | | | | 3,952,934 | |
Thornburg International Value Fund | | | | | | | 431,533 | | | | 11,802,423 | |
Wells Fargo Advantage Emerging Markets Equity Fund (l) | | | | | | | 149,397 | | | | 3,238,936 | |
| | | | |
| | | | | | | | | | | 31,426,605 | |
| | | | | | | | | | | | |
| | | | |
| International Fixed Income Funds: 4.66% | | | | | | | | | | | | |
Oppenheimer International Bond Fund | | | | | | | 4,925,579 | | | | 32,361,054 | |
| | | | | | | | | | | | |
| | | | |
| U.S. Equity Funds: 9.93% | | | | | | | | | | | | |
American Century Growth Fund | | | | | | | 406,953 | | | | 11,488,273 | |
Eaton Vance Large Cap Value Fund | | | | | | | 251,254 | | | | 4,874,323 | |
MFS Value Fund | | | | | | | 191,753 | | | | 4,889,696 | |
Royce Pennsylvania Mutual Fund | | | | | | | 552,072 | | | | 6,569,659 | |
T. Rowe Price Blue Chip Growth Fund | | | | | | | 353,017 | | | | 16,150,543 | |
Wells Fargo Advantage Endeavor Select Fund (l)† | | | | | | | 816,112 | | | | 9,254,713 | |
Wells Fargo Advantage Large Cap Growth Fund (l)† | | | | | | | 268,809 | | | | 9,209,397 | |
Wells Fargo Advantage Small Cap Value Fund (l) | | | | | | | 196,610 | | | | 6,464,525 | |
| | | | |
| | | | | | | | | | | 68,901,129 | |
| | | | | | | | | | | | |
| | | | |
| U.S. Fixed Income Funds: 50.95% | | | | | | | | | | | | |
PIMCO High Yield Fund | | | | | | | 3,386,974 | | | | 32,481,084 | |
Wells Fargo Advantage Government Securities Fund (l) | | | | | | | 11,211,245 | | | | 128,368,760 | |
Wells Fargo Advantage Short Duration Government Bond Fund (l) | | | | | | | 18,643,204 | | | | 192,584,297 | |
| | | | |
| | | | | | | | | | | 353,434,141 | |
| | | | | | | | | | | | |
| | | | |
Total Investment Companies (Cost $637,809,732) | | | | | | | | | | | 682,886,837 | |
| | | | | | | | | | | | |
The accompanying notes are an integral part of these financial statements.
| | | | |
| 18 | | Wells Fargo Advantage WealthBuilder Portfolios | | Portfolio of investments—November 30, 2012 (unaudited) |
WEALTHBUILDER CONSERVATIVE ALLOCATION PORTFOLIO
| | | | | | | | | | | | | | | | |
| Security name | | Yield | | | | | | Shares | | | Value | |
| | | | | | | | | | | | | | | | |
| | | | |
Short-Term Investments: 1.60% | | | | | | | | | | | | | | | | |
| | | | |
| Investment Companies: 0.09% | | | | | | | | | | | | | | | | |
Wells Fargo Advantage Cash Investment Money Market Fund, Select Class (u)(l) | | | 0.16 | % | | | | | | | 657,700 | | | $ | 657,700 | |
| | | | | | | | | | | | | | | | |
| | | | |
| | | | | | Maturity date | | | Principal | | | | |
| | | | |
| U.S. Treasury Securities: 1.51% | | | | | | | | | | | | | | | | |
U.S. Treasury Bill #(z) | | | 0.10 | | | | 12-27-12 | | | $ | 5,485,000 | | | | 5,484,600 | |
U.S. Treasury Bill #(z) | | | 0.13 | | | | 12-20-12 | | | | 4,985,000 | | | | 4,984,635 | |
| | | | |
| | | | | | | | | | | | | | | 10,469,235 | |
| | | | | | | | | | | | | | | | |
| | | | |
Total Short-Term Investments (Cost $11,126,732) | | | | | | | | | | | | | | | 11,126,935 | |
| | | | | | | | | | | | | | | | |
| | | | | | | | |
Total investments in securities (Cost $648,936,464)* | | | 100.04 | % | | | 694,013,772 | |
Other assets and liabilities, net | | | (0.04 | ) | | | (276,418 | ) |
| | | | | | | | |
| Total net assets | | | 100.00 | % | | $ | 693,737,354 | |
| | | | | | | | |
| (l) | Investment in an affiliate |
| † | Non-income-earning security |
| (u) | Rate shown is the 7-day annualized yield at period end. |
| # | All or a portion of this security is segregated as collateral for investments in derivative instruments. |
| (z) | Zero coupon security. Rate represents yield to maturity at time of purchase. |
| * | Cost for federal income tax purposes is $655,175,084 and unrealized appreciation (depreciation) consists of: |
| | | | |
Gross unrealized appreciation | | $ | 38,945,269 | |
Gross unrealized depreciation | | | (106,581 | ) |
| | | | |
Net unrealized appreciation | | $ | 38,838,688 | |
The accompanying notes are an integral part of these financial statements.
| | | | | | |
| Portfolio of investments—November 30, 2012 (unaudited) | | Wells Fargo Advantage WealthBuilder Portfolios | | | 19 | |
WEALTHBUILDER MODERATE BALANCED PORTFOLIO
| | | | | | | | | | | | |
| Security name | | | | | | | | | Value | |
| | | | | | | | | | | | |
| | | | |
Investment Companies: 97.16% | | | | | | | | | | | | |
| | | | |
| Affiliated Master Portfolios: 22.35% | | | | | | | | | | | | |
Wells Fargo Advantage Core Bond Portfolio | | | | | | | | | | $ | 102,185,978 | |
Wells Fargo Advantage Emerging Growth Portfolio | | | | | | | | | | | 13,683,388 | |
Wells Fargo Advantage Equity Value Portfolio | | | | | | | | | | | 20,675,900 | |
Wells Fargo Advantage International Growth Portfolio | | | | | | | | | | | 16,917,056 | |
Wells Fargo Advantage Small Company Value Portfolio | | | | | | | | | | | 13,954,290 | |
| | | | |
| | | | | | | | | | | 167,416,612 | |
| | | | | | | | | | | | |
| | | | |
| | | | | | | Shares | | | | |
| | | | |
| Alternative Investment Funds: 5.38% | | | | | | | | | | | | |
AQR Managed Futures Strategy Fund | | | | | | | 385,473 | | | | 3,677,416 | |
ING Global Real Estate Fund | | | | | | | 829,598 | | | | 14,675,584 | |
PIMCO CommodityRealReturn Strategy Fund | | | | | | | 3,171,352 | | | | 21,945,757 | |
| | | | |
| | | | | | | | | | | 40,298,757 | |
| | | | | | | | | | | | |
| | | | |
| International Equity Funds: 8.93% | | | | | | | | | | | | |
DFA International Small Cap Value Portfolio | | | | | | | 363,992 | | | | 5,594,558 | |
Dodge & Cox International Stock Fund | | | | | | | 250,739 | | | | 8,399,751 | |
Oppenheimer Developing Markets Fund | | | | | | | 203,873 | | | | 6,909,269 | |
T. Rowe Price International Discovery Fund | | | | | | | 122,100 | | | | 5,570,218 | |
Templeton Institutional Foreign Equity Fund | | | | | | | 434,820 | | | | 8,418,110 | |
Thornburg International Value Fund | | | | | | | 918,594 | | | | 25,123,554 | |
Wells Fargo Advantage Emerging Markets Equity Fund (l) | | | | | | | 317,071 | | | | 6,874,100 | |
| | | | |
| | | | | | | | | | | 66,889,560 | |
| | | | | | | | | | | | |
| | | | |
| International Fixed Income Funds: 4.59% | | | | | | | | | | | | |
Oppenheimer International Bond Fund | | | | | | | 5,230,493 | | | | 34,364,336 | |
| | | | | | | | | | | | |
| | | | |
| U.S. Equity Funds: 19.47% | | | | | | | | | | | | |
American Century Growth Fund | | | | | | | 861,709 | | | | 24,326,053 | |
Eaton Vance Large Cap Value Fund | | | | | | | 531,139 | | | | 10,304,099 | |
MFS Value Fund | | | | | | | 406,292 | | | | 10,360,441 | |
Royce Pennsylvania Mutual Fund | | | | | | | 1,171,243 | | | | 13,937,787 | |
T. Rowe Price Blue Chip Growth Fund | | | | | | | 748,425 | | | | 34,240,432 | |
Wells Fargo Advantage Endeavor Select Fund (l)† | | | | | | | 1,735,365 | | | | 19,679,039 | |
Wells Fargo Advantage Large Cap Growth Fund (l)† | | | | | | | 569,040 | | | | 19,495,319 | |
Wells Fargo Advantage Small Cap Value Fund (l) | | | | | | | 411,290 | | | | 13,523,216 | |
| | | | |
| | | | | | | | | | | 145,866,386 | |
| | | | | | | | | | | | |
| | | | |
| U.S. Fixed Income Funds: 36.44% | | | | | | | | | | | | |
PIMCO High Yield Fund | | | | | | | 3,598,478 | | | | 34,509,408 | |
Wells Fargo Advantage Government Securities Fund (l) | | | | | | | 8,933,887 | | | | 102,293,005 | |
Wells Fargo Advantage Short Duration Government Bond Fund (l) | | | | | | | 13,177,185 | | | | 136,120,322 | |
| | | | |
| | | | | | | | | | | 272,922,735 | |
| | | | | | | | | | | | |
| | | | |
Total Investment Companies (Cost $662,070,577) | | | | | | | | | | | 727,758,386 | |
| | | | | | | | | | | | |
The accompanying notes are an integral part of these financial statements.
| | | | |
| 20 | | Wells Fargo Advantage WealthBuilder Portfolios | | Portfolio of investments—November 30, 2012 (unaudited) |
WEALTHBUILDER MODERATE BALANCED PORTFOLIO
| | | | | | | | | | | | | | | | |
| Security name | | Yield | | | | | | Shares | | | Value | |
| | | | | | | | | | | | | | | | |
| | | | |
Short-Term Investments: 2.93% | | | | | | | | | | | | | | | | |
| | | | |
| Investment Companies: 0.17% | | | | | | | | | | | | | | | | |
Wells Fargo Advantage Cash Investment Money Market Fund, Select Class (l)(u) | | | 0.16 | % | | | | | | | 1,258,560 | | | $ | 1,258,560 | |
| | | | | | | | | | | | | | | | |
| | | | |
| | | | | | Maturity date | | | Principal | | | | |
| U.S. Treasury Securities: 2.76% | | | | | | | | | | | | | | | | |
U.S. Treasury Bill #(z) | | | 0.10 | | | | 12-27-12 | | | $ | 11,260,000 | | | | 11,259,178 | |
U.S. Treasury Bill #(z) | | | 0.13 | | | | 12-20-12 | | | | 9,460,000 | | | | 9,459,308 | |
| | | | |
| | | | | | | | | | | | | | | 20,718,486 | |
| | | | | | | | | | | | | | | | |
| | | | |
Total Short-Term Investments (Cost $21,976,629) | | | | | | | | | | | | | | | 21,977,046 | |
| | | | | | | | | | | | | | | | |
| | | | | | | | |
| Total investments in securities | | | | | | | | |
| (Cost $684,047,206)* | | | 100.09 | % | | | 749,735,432 | |
Other assets and liabilities, net | | | (0.09 | ) | | | (677,705 | ) |
| | | | | | | | |
| Total net assets | | | 100.00 | % | | $ | 749,057,727 | |
| | | | | | | | |
| (l) | Investment in an affiliate |
| † | Non-income-earning security |
| (u) | Rate shown is the 7-day annualized yield at period end. |
| # | All or a portion of this security is segregated as collateral for investments in derivative instruments. |
| (z) | Zero coupon security. Rate represents yield to maturity at time of purchase. |
| * | Cost for federal income tax purposes is $692,309,717 and unrealized appreciation (depreciation) consists of: |
| | | | |
Gross unrealized appreciation | | $ | 58,372,399 | |
Gross unrealized depreciation | | | (946,684 | ) |
| | | | |
Net unrealized appreciation | | $ | 57,425,715 | |
The accompanying notes are an integral part of these financial statements.
| | | | | | |
| Portfolio of investments—November 30, 2012 (unaudited) | | Wells Fargo Advantage WealthBuilder Portfolios | | | 21 | |
WEALTHBUILDER GROWTH BALANCED PORTFOLIO
| | | | | | | | | | | | |
| Security name | | | | | | | | | Value | |
| | | | | | | | | | | | |
| | | | |
Investment Companies: 95.13% | | | | | | | | | | | | |
| | | | |
| Affiliated Master Portfolios: 24.45% | | | | | | | | | | | | |
Wells Fargo Advantage Core Bond Portfolio | | | | | | | | | | $ | 76,114,655 | |
Wells Fargo Advantage Emerging Growth Portfolio | | | | | | | | | | | 20,859,271 | |
Wells Fargo Advantage Equity Value Portfolio | | | | | | | | | | | 31,468,014 | |
Wells Fargo Advantage International Growth Portfolio | | | | | | | | | | | 25,552,588 | |
Wells Fargo Advantage Small Company Value Portfolio | | | | | | | | | | | 21,174,953 | |
| | | | |
| | | | | | | | | | | 175,169,481 | |
| | | | | | | | | | | | |
| | | | |
| | | | | | | Shares | | | | |
| | | | |
| Alternative Investment Funds: 5.22% | | | | | | | | | | | | |
AQR Managed Futures Strategy Fund | | | | | | | 357,993 | | | | 3,415,249 | |
ING Global Real Estate Fund | | | | | | | 767,076 | | | | 13,569,579 | |
PIMCO CommodityRealReturn Strategy Fund | | | | | | | 2,954,058 | | | | 20,442,078 | |
| | | | |
| | | | | | | | | | | 37,426,906 | |
| | | | | | | | | | | | |
| | | | |
| International Equity Funds: 14.10% | | | | | | | | | | | | |
DFA International Small Cap Value Portfolio | | | | | | | 550,204 | | | | 8,456,633 | |
Dodge & Cox International Stock Fund | | | | | | | 378,483 | | | | 12,679,173 | |
Oppenheimer Developing Markets Fund | | | | | | | 306,266 | | | | 10,379,361 | |
T. Rowe Price International Discovery Fund | | | | | | | 184,254 | | | | 8,405,687 | |
Templeton Institutional Foreign Equity Fund | | | | | | | 657,337 | | | | 12,726,039 | |
Thornburg International Value Fund | | | | | | | 1,387,452 | | | | 37,946,823 | |
Wells Fargo Advantage Emerging Markets Equity Fund (l) | | | | | | | 478,828 | | | | 10,381,001 | |
| | | | |
| | | | | | | | | | | 100,974,717 | |
| | | | | | | | | | | | |
| | | | |
| International Fixed Income Funds: 4.46% | | | | | | | | | | | | |
Oppenheimer International Bond Fund | | | | | | | 4,861,069 | | | | 31,937,222 | |
| | | | | | | | | | | | |
| | | | |
| U.S. Equity Funds: 30.93% | | | | | | | | | | | | |
American Century Growth Fund | | | | | | | 1,311,015 | | | | 37,009,961 | |
Eaton Vance Large Cap Value Fund | | | | | | | 807,027 | | | | 15,656,327 | |
MFS Value Fund | | | | | | | 618,581 | | | | 15,773,804 | |
Royce Pennsylvania Mutual Fund | | | | | | | 1,774,248 | | | | 21,113,553 | |
T. Rowe Price Blue Chip Growth Fund | | | | | | | 1,137,041 | | | | 52,019,647 | |
Wells Fargo Advantage Endeavor Select Fund (l)† | | | | | | | 2,629,835 | | | | 29,822,327 | |
Wells Fargo Advantage Large Cap Growth Fund (l)† | | | | | | | 866,415 | | | | 29,683,390 | |
Wells Fargo Advantage Small Cap Value Fund (l) | | | | | | | 623,389 | | | | 20,497,038 | |
| | | | |
| | | | | | | | | | | 221,576,047 | |
| | | | | | | | | | | | |
| | | | |
| U.S. Fixed Income Funds: 15.97% | | | | | | | | | | | | |
PIMCO High Yield Fund | | | | | | | 3,343,893 | | | | 32,067,931 | |
Wells Fargo Advantage Government Securities Fund (l) | | | | | | | 7,193,192 | | | | 82,362,051 | |
| | | | |
| | | | | | | | | | | 114,429,982 | |
| | | | | | | | | | | | |
| | | | |
Total Investment Companies (Cost $581,406,389) | | | | | | | | | | | 681,514,355 | |
| | | | | | | | | | | | |
The accompanying notes are an integral part of these financial statements.
| | | | |
| 22 | | Wells Fargo Advantage WealthBuilder Portfolios | | Portfolio of investments—November 30, 2012 (unaudited) |
WEALTHBUILDER GROWTH BALANCED PORTFOLIO
| | | | | | | | | | | | | | | | |
| Security name | | Yield | | | | | | Shares | | | Value | |
| | | | | | | | | | | | | | | | |
| | | | |
Short-Term Investments: 5.06% | | | | | | | | | | | | | | | | |
| | | | |
| Investment Companies: 0.37% | | | | | | | | | | | | | | | | |
Wells Fargo Advantage Cash Investment Money Market Fund, Select Class (u)(l) | | | 0.16 | % | | | | | | | 2,652,130 | | | $ | 2,652,130 | |
| | | | | | | | | | | | | | | | |
| | | | |
| | | | | | Maturity date | | | Principal | | | | |
| U.S. Treasury Securities: 4.69% | | | | | | | | | | | | | | | | |
U.S. Treasury Bill #(z) | | | 0.10 | | | | 12-27-12 | | | $ | 18,500,000 | | | | 18,498,650 | |
U.S. Treasury Bill #(z) | | | 0.13 | | | | 12-20-12 | | | | 15,095,000 | | | | 15,093,895 | |
| | | | |
| | | | | | | | | | | | | | | 33,592,545 | |
| | | | | | | | | | | | | | | | |
| | | | |
Total Short-Term Investments (Cost $36,243,990) | | | | | | | | | | | | | | | 36,244,675 | |
| | | | | | | | | | | | | | | | |
| | | | | | | | |
| Total investments in securities | | | | | | | | |
| (Cost $617,650,379)* | | | 100.19 | % | | | 717,759,030 | |
Other assets and liabilities, net | | | (0.19 | ) | | | (1,368,480 | ) |
| | | | | | | | |
| Total net assets | | | 100.00 | % | | $ | 716,390,550 | |
| | | | | | | | |
| (l) | Investment in an affiliate |
| † | Non-income-earning security |
| (u) | Rate shown is the 7-day annualized yield at period end. |
| # | All or a portion of this security is segregated as collateral for investments in derivative instruments. |
| (z) | Zero coupon security. Rate represents yield to maturity at time of purchase. |
| * | Cost for federal income tax purposes is $617,482,404 and unrealized appreciation (depreciation) consists of: |
| | | | |
Gross unrealized appreciation | | $ | 100,453,281 | |
Gross unrealized depreciation | | | (176,655 | ) |
| | | | |
Net unrealized appreciation | | $ | 100,276,626 | |
The accompanying notes are an integral part of these financial statements.
| | | | | | |
| Portfolio of investments—November 30, 2012 (unaudited) | | Wells Fargo Advantage WealthBuilder Portfolios | | | 23 | |
WEALTHBUILDER GROWTH ALLOCATION PORTFOLIO
| | | | | | | | | | | | |
| Security name | | | | | | | | | Value | |
| | | | | | | | | | | | |
| | | | |
Investment Companies: 94.36% | | | | | | | | | | | | |
| | | | |
| Affiliated Master Portfolios: 22.99% | | | | | | | | | | | | |
Wells Fargo Advantage Core Bond Portfolio | | | | | | | | | | $ | 17,924,525 | |
Wells Fargo Advantage Emerging Growth Portfolio | | | | | | | | | | | 10,297,148 | |
Wells Fargo Advantage Equity Value Portfolio | | | | | | | | | | | 15,455,033 | |
Wells Fargo Advantage International Growth Portfolio | | | | | | | | | | | 12,453,950 | |
Wells Fargo Advantage Small Company Value Portfolio | | | | | | | | | | | 10,378,341 | |
| | | | |
| | | | | | | | | | | 66,508,997 | |
| | | | | | | | | | | | |
| | | | |
| | | | | | | Shares | | | | |
| | | | |
| Alternative Investment Funds: 5.12% | | | | | | | | | | | | |
AQR Managed Futures Strategy Fund | | | | | | | 141,666 | | | | 1,351,498 | |
ING Global Real Estate Fund | | | | | | | 306,056 | | | | 5,414,127 | |
PIMCO CommodityRealReturn Strategy Fund | | | | | | | 1,161,713 | | | | 8,039,053 | |
| | | | |
| | | | | | | | | | | 14,804,678 | |
| | | | | | | | | | | | |
| | | | |
| International Equity Funds: 17.10% | | | | | | | | | | | | |
DFA International Small Cap Value Portfolio | | | | | | | 269,666 | | | | 4,144,764 | |
Dodge & Cox International Stock Fund | | | | | | | 185,386 | | | | 6,210,437 | |
Oppenheimer Developing Markets Fund | | | | | | | 150,892 | | | | 5,113,727 | |
T. Rowe Price International Discovery Fund | | | | | | | 90,221 | | | | 4,115,878 | |
Templeton Institutional Foreign Equity Fund | | | | | | | 321,212 | | | | 6,218,660 | |
Thornburg International Value Fund | | | | | | | 678,632 | | | | 18,560,579 | |
Wells Fargo Advantage Emerging Markets Equity Fund (l) | | | | | | | 235,575 | | | | 5,107,260 | |
| | | | |
| | | | | | | | | | | 49,471,305 | |
| | | | | | | | | | | | |
| | | | |
| International Fixed Income Funds: 2.67% | | | | | | | | | | | | |
Oppenheimer International Bond Fund | | | | | | | 1,175,425 | | | | 7,722,544 | |
| | | | | | | | | | | | |
| | | | |
| U.S. Equity Funds: 37.60% | | | | | | | | | | | | |
American Century Growth Fund | | | | | | | 643,532 | | | | 18,166,917 | |
Eaton Vance Large Cap Value Fund | | | | | | | 396,594 | | | | 7,693,933 | |
MFS Value Fund | | | | | | | 303,416 | | | | 7,737,102 | |
Royce Pennsylvania Mutual Fund | | | | | | | 870,432 | | | | 10,358,145 | |
T. Rowe Price Blue Chip Growth Fund | | | | | | | 557,535 | | | | 25,507,235 | |
Wells Fargo Advantage Endeavor Select Fund (l)† | | | | | | | 1,288,477 | | | | 14,611,328 | |
Wells Fargo Advantage Large Cap Growth Fund (l)��� | | | | | | | 425,628 | | | | 14,582,016 | |
Wells Fargo Advantage Small Cap Value Fund (l) | | | | | | | 307,654 | | | | 10,115,651 | |
| | | | |
| | | | | | | | | | | 108,772,327 | |
| | | | | | | | | | | | |
| | | | |
| U.S. Fixed Income Funds: 8.88% | | | | | | | | | | | | |
PIMCO High Yield Fund | | | | | | | 807,786 | | | | 7,746,664 | |
Wells Fargo Advantage Government Securities Fund (l) | | | | | | | 1,566,721 | | | | 17,938,954 | |
| | | | |
| | | | | | | | | | | 25,685,618 | |
| | | | | | | | | | | | |
| | | | |
Total Investment Companies (Cost $229,853,239) | | | | | | | | | | | 272,965,469 | |
| | | | | | | | | | | | |
The accompanying notes are an integral part of these financial statements.
| | | | |
| 24 | | Wells Fargo Advantage WealthBuilder Portfolios | | Portfolio of investments—November 30, 2012 (unaudited) |
WEALTHBUILDER GROWTH ALLOCATION PORTFOLIO
| | | | | | | | | | | | | | | | |
| Security name | | Yield | | | | | | Shares | | | Value | |
| | | | | | | | | | | | | | | | |
| | | | |
Short-Term Investments: 5.81% | | | | | | | | | | | | | | | | |
| | | | |
| Investment Companies: 0.33% | | | | | | | | | | | | | | | | |
Wells Fargo Advantage Cash Investment Money Market Fund, Select Class (l)(u) | | | 0.16 | % | | | | | | | 966,950 | | | $ | 966,950 | |
| | | | | | | | | | | | | | | | |
| | | | |
| | | | | | Maturity date | | | Principal | | | | |
| U.S. Treasury Securities: 5.48% | | | | | | | | | | | | | | | | |
U.S. Treasury Bill #(z) | | | 0.10 | | | | 12-20-12 | | | $ | 7,215,000 | | | | 7,214,472 | |
U.S. Treasury Bill #(z) | | | 0.13 | | | | 12-27-12 | | | | 8,635,000 | | | | 8,634,370 | |
| | | | |
| | | | | | | | | | | | | | | 15,848,842 | |
| | | | | | | | | | | | | | | | |
| | | | |
Total Short-Term Investments (Cost $16,815,472) | | | | | | | | | | | | | | | 16,815,792 | |
| | | | | | | | | | | | | | | | |
| | | | | | | | |
| Total investments in securities | | | | | | | | |
| (Cost $246,668,711)* | | | 100.17 | % | | | 289,781,261 | |
Other assets and liabilities, net | | | (0.17 | ) | | | (481,732 | ) |
| | | | | | | | |
| Total net assets | | | 100.00 | % | | $ | 289,299,529 | |
| | | | | | | | |
| (l) | Investment in an affiliate |
| † | Non-income-earning security |
| (u) | Rate shown is the 7-day annualized yield at period end. |
| # | All or a portion of this security is segregated as collateral for investments in derivative instruments. |
| (z) | Zero coupon security. Rate represents yield to maturity at time of purchase. |
| * | Cost for federal income tax purposes is $255,139,289 and unrealized appreciation (depreciation) consists of: |
| | | | |
Gross unrealized appreciation | | $ | 34,670,691 | |
Gross unrealized depreciation | | | (28,719 | ) |
| | | | |
Net unrealized appreciation | | $ | 34,641,972 | |
The accompanying notes are an integral part of these financial statements.
| | | | | | |
| Portfolio of investments—November 30, 2012 (unaudited) | | Wells Fargo Advantage WealthBuilder Portfolios | | | 25 | |
WEALTHBUILDER EQUITY PORTFOLIO
| | | | | | | | | | | | | | | | | | |
| Security name | | | | | | | | | | | | | Value | |
| | | | | | | | | | | | | | | | | | |
| | | | | |
Investment Companies: 99.82% | | | | | | | | | | | | | | | | | | |
| | | | | |
| Affiliated Master Portfolios: 28.40% | | | | | | | | | | | | | | | | | | |
Wells Fargo Advantage Emerging Growth Portfolio | | | | | | | | | | | | | | | | $ | 5,328,281 | |
Wells Fargo Advantage Equity Value Portfolio | | | | | | | | | | | | | | | | | 13,621,795 | |
Wells Fargo Advantage International Growth Portfolio | | | | | | | | | | | | | | | | | 6,629,277 | |
Wells Fargo Advantage Small Company Value Portfolio | | | | | | | | | | | | | | | | | 5,491,250 | |
| | | | | |
| | | | | | | | | | | | | | | | | 31,070,603 | |
| | | | | | | | | | | | | | | | | | |
| | | | | |
| | | | | | | | | | | Shares | | | | |
| | | | | |
| International Equity Funds: 23.99% | | | | | | | | | | | | | | | | | | |
DFA International Small Cap Value Portfolio | | | | | | | | | | | | | 143,082 | | | | 2,199,164 | |
Dodge & Cox International Stock Fund | | | | | | | | | | | | | 98,119 | | | | 3,286,996 | |
Oppenheimer Developing Markets Fund | | | | | | | | | | | | | 79,958 | | | | 2,709,775 | |
T. Rowe Price International Discovery Fund | | | | | | | | | | | | | 47,889 | | | | 2,184,684 | |
Templeton Institutional Foreign Equity Fund | | | | | | | | | | | | | 170,594 | | | | 3,302,698 | |
Thornburg International Value Fund | | | | | | | | | | | | | 360,495 | | | | 9,859,530 | |
Wells Fargo Advantage Emerging Markets Equity Fund (l) | | | | | | | | | | | | | 124,829 | | | | 2,706,283 | |
| | | | | |
| | | | | | | | | | | | | | | | | 26,249,130 | |
| | | | | | | | | | | | | | | | | | |
| | | | | |
| U.S. Equity Funds: 47.43% | | | | | | | | | | | | | | | | | | |
American Century Growth Fund | | | | | | | | | | | | | 242,892 | | | | 6,856,838 | |
Eaton Vance Large Cap Value Fund | | | | | | | | | | | | | 350,514 | | | | 6,799,974 | |
MFS Value Fund | | | | | | | | | | | | | 267,232 | | | | 6,814,428 | |
Royce Pennsylvania Mutual Fund | | | | | | | | | | | | | 460,332 | | | | 5,477,950 | |
T. Rowe Price Blue Chip Growth Fund | | | | | | | | | | | | | 209,872 | | | | 9,601,665 | |
Wells Fargo Advantage Endeavor Select Fund (l)† | | | | | | | | | | | | | 485,457 | | | | 5,505,085 | |
Wells Fargo Advantage Large Cap Growth Fund (l)† | | | | | | | | | | | | | 160,173 | | | | 5,487,538 | |
Wells Fargo Advantage Small Cap Value Fund (l) | | | | | | | | | | | | | 162,689 | | | | 5,349,200 | |
| | | | | |
| | | | | | | | | | | | | | | | | 51,892,678 | |
| | | | | | | | | | | | | | | | | | |
| | | | | |
Total Investment Companies (Cost $88,156,739) | | | | | | | | | | | | | | | | | 109,212,411 | |
| | | | | | | | | | | | | | | | | | |
| | | | | |
| | | | | | Yield | | | | | | | | | |
| | | | | |
Short-Term Investments: 0.33% | | | | | | | | | | | | | | | | | | |
| | | | | |
| Investment Companies: 0.33% | | | | | | | | | | | | | | | | | | |
Wells Fargo Advantage Cash Investment Money Market Fund, Select Class (u)(l) | | | | | | | 0.16 | % | | | | | 362,445 | | | | 362,445 | |
| | | | | | | | | | | | | | | | | | |
| | | | | |
Total Short-Term Investments (Cost $362,445) | | | | | | | | | | | | | | | | | 362,445 | |
| | | | | | | | | | | | | | | | | | |
| Total investments in securities | | | | | | | | | | | | | | | | | | |
| (Cost $88,519,184)* | | | 100.15 | % | | | | | | | | | | | | | 109,574,856 | |
Other assets and liabilities, net | | | (0.15 | ) | | | | | | | | | | | | | (168,979 | ) |
| | | | | | | | | | | | | | | | | | |
| Total net assets | | | 100.00 | % | | | | | | | | | | | | $ | 109,405,877 | |
| | | | | | | | | | | | | | | | | | |
| (l) | Investment in an affiliate |
| † | Non-income-earning security |
| (u) | Rate shown is the 7-day annualized yield at period end. |
| * | Cost for federal income tax purposes is $89,229,601 and unrealized appreciation (depreciation) consists of: |
| | | | |
Gross unrealized appreciation | | $ | 20,393,930 | |
Gross unrealized depreciation | | | (48,675 | ) |
| | | | |
Net unrealized appreciation | | $ | 20,345,255 | |
The accompanying notes are an integral part of these financial statements.
| | | | |
| 26 | | Wells Fargo Advantage WealthBuilder Portfolios | | Portfolio of investments—November 30, 2012 (unaudited) |
WEALTHBUILDER TACTICAL EQUITY PORTFOLIO
| | | | | | | | | | | | | | | | |
| Security name | | | | | | | | | | | Value | |
| | | | |
Investment Companies: 93.47% | | | | | | | | | | | | | | | | |
| | | | |
| Affiliated Master Portfolios: 21.93% | | | | | | | | | | | | | | | | |
Wells Fargo Advantage Emerging Growth Portfolio | | | | | | | | | | | | | | $ | 16,113,483 | |
Wells Fargo Advantage Equity Value Portfolio | | | | | | | | | | | | | | | 24,593,781 | |
Wells Fargo Advantage International Growth Portfolio | | | | | | | | | | | | | | | 19,758,011 | |
Wells Fargo Advantage Small Company Value Portfolio | | | | | | | | | | | | | | | 16,474,560 | |
| | | | |
| | | | | | | | | | | | | | | 76,939,835 | |
| | | | | | | | | | | | | | | | |
| | | | |
| | | | | | | | | Shares | | | | |
| | | | |
| International Equity Funds: 22.40% | | | | | | | | | | | | | | | | |
DFA International Small Cap Value Portfolio | | | | | | | | | | | 427,883 | | | | 6,576,555 | |
Dodge & Cox International Stock Fund | | | | | | | | | | | 293,583 | | | | 9,835,020 | |
Oppenheimer Developing Markets Fund | | | | | | | | | | | 239,854 | | | | 8,128,641 | |
T. Rowe Price International Discovery Fund | | | | | | | | | | | 143,112 | | | | 6,528,750 | |
Templeton Institutional Foreign Equity Fund | | | | | | | | | | | 510,060 | | | | 9,874,762 | |
Thornburg International Value Fund | | | | | | | | | | | 1,080,265 | | | | 29,545,254 | |
Wells Fargo Advantage Emerging Markets Equity Fund (l) | | | | | | | | | | | 373,916 | | | | 8,106,496 | |
| | | | |
| | | | | | | | | | | | | | | 78,595,478 | |
| | | | | | | | | | | | | | | | |
| | | | |
| U.S. Equity Funds: 49.14% | | | | | | | | | | | | | | | | |
American Century Growth Fund | | | | | | | | | | | 1,020,438 | | | | 28,806,968 | |
Eaton Vance Large Cap Value Fund | | | | | | | | | | | 632,077 | | | | 12,262,296 | |
MFS Value Fund | | | | | | | | | | | 481,885 | | | | 12,288,067 | |
Royce Pennsylvania Mutual Fund | | | | | | | | | | | 1,382,927 | | | | 16,456,835 | |
T. Rowe Price Blue Chip Growth Fund | | | | | | | | | | | 881,581 | | | | 40,332,310 | |
Wells Fargo Advantage Endeavor Select Fund (l)† | | | | | | | | | | | 2,037,987 | | | | 23,110,770 | |
Wells Fargo Advantage Large Cap Growth Fund (l)† | | | | | | | | | | | 673,237 | | | | 23,065,111 | |
Wells Fargo Advantage Small Cap Value Fund (l) | | | | | | | | | | | 489,033 | | | | 16,079,407 | |
| | | | |
| | | | | | | | | | | | | | | 172,401,764 | |
| | | | | | | | | | | | | | | | |
| | | | |
Total Investment Companies (Cost $263,262,059) | | | | | | | | | | | | | | | 327,937,077 | |
| | | | | | | | | | | | | | | | |
| | | | |
| | | Yield | | | | | | | | | | |
| Short-Term Investments: 6.68% | | | | | | | | | | | | | | | | |
| | | | |
| Investment Companies: 0.76% | | | | | | | | | | | | | | | | |
Wells Fargo Advantage Cash Investment Money Market Fund, Select Class (u)(l) | | | 0.16 | % | | | | | | | 2,665,832 | | | | 2,665,832 | |
| | | | | | | | | | | | | | | | |
| | | | |
| | | | | | Maturity date | | | Principal | | | | |
| U.S. Treasury Securities : 5.92% | | | | | | | | | | | | | | | | |
U.S. Treasury Bill (z)# | | | 0.10 | | | | 12-27-12 | | | $ | 6,300,000 | | | | 6,299,540 | |
U.S. Treasury Bill (z)# | | | 0.13 | | | | 12-20-12 | | | | 14,485,000 | | | | 14,483,940 | |
| | | | |
| | | | | | | | | | | | | | | 20,783,480 | |
| | | | | | | | | | | | | | | | |
| | | | |
Total Short-Term Investments (Cost $23,449,079) | | | | | | | | | | | | | | | 23,449,312 | |
| | | | | | | | | | | | | | | | |
| | | | | | | | |
| Total investments in securities | | | | | | | | |
| (Cost $286,711,138)* | | | 100.15 | % | | | 351,386,389 | |
Other assets and liabilities, net | | | (0.15 | ) | | | (532,842 | ) |
| | | | | | | | |
| Total net assets | | | 100.00 | % | | $ | 350,853,547 | |
| | | | | | | | |
The accompanying notes are an integral part of these financial statements.
--
| | | | | | |
| Portfolio of investments—November 30, 2012 (unaudited) | | Wells Fargo Advantage WealthBuilder Portfolios | | | 27 | |
WEALTHBUILDER TACTICAL EQUITY PORTFOLIO
| (l) | Investment in an affiliate |
| † | Non-income-earning security |
| (u) | Rate shown is the 7-day annualized yield at period end. |
| (z) | Zero coupon security. Rate represents yield to maturity at time of purchase. |
| # | All or a portion of this security is segregated as collateral for investments in derivative instruments. |
| * | Cost for federal income tax purposes is $296,424,362 and unrealized appreciation (depreciation) consists of: |
| | | | |
Gross unrealized appreciation | | $ | 54,991,602 | |
Gross unrealized depreciation | | | (29,575 | ) |
| | | | |
Net unrealized appreciation | | $ | 54,962,027 | |
The accompanying notes are an integral part of these financial statements.
| | | | |
| 28 | | Wells Fargo Advantage WealthBuilder Portfolios | | Statements of assets and liabilities—November 30, 2012 (unaudited) |
| | | | | | | | |
| | | WealthBuilder
Conservative
Allocation
Portfolio | | | WealthBuilder
Moderate
Balanced Portfolio | |
| | |
Assets | | | | | | | | |
Investments | | | | | | | | |
In unaffiliated Underlying Funds and securities, at value (see cost below) | | $ | 185,117,560 | | | $ | 283,075,259 | |
In affiliated Master Portfolios, at value (see cost below) | | | 159,117,884 | | | | 167,416,612 | |
In affiliated Underlying Funds, at value (see cost below) | | | 349,778,328 | | | | 299,243,561 | |
| | | | | | | | |
Total investments, at value (see cost below) | | | 694,013,772 | | | | 749,735,432 | |
Cash | | | 281,994 | | | | 0 | |
Receivable for investments sold | | | 0 | | | | 23,609 | |
Receivable for Portfolio shares sold | | | 2,117,785 | | | | 1,774,131 | |
Receivable for dividends | | | 760,817 | | | | 659,121 | |
Receivable for daily variation margin on open futures contracts | | | 0 | | | | 0 | |
Prepaid expenses and other assets | | | 33,305 | | | | 40,310 | |
| | | | | | | | |
Total assets | | | 697,207,673 | | | | 752,232,603 | |
| | | | | | | | |
| | |
Liabilities | | | | | | | | |
Payable for investments purchased | | | 1,033,833 | | | | 651,002 | |
Payable for Portfolio shares redeemed | | | 1,482,200 | | | | 1,444,166 | |
Payable for daily variation margin on open futures contracts | | | 49,932 | | | | 112,377 | |
Advisory fee payable | | | 95,047 | | | | 105,447 | |
Distribution fees payable | | | 451,558 | | | | 489,463 | |
Due to other related parties | | | 186,644 | | | | 202,342 | |
Shareholder servicing fees payable | | | 149,667 | | | | 162,835 | |
Accrued expenses and other liabilities | | | 21,438 | | | | 7,244 | |
| | | | | | | | |
Total liabilities | | | 3,470,319 | | | | 3,174,876 | |
| | | | | | | | |
Total net assets | | $ | 693,737,354 | | | $ | 749,057,727 | |
| | | | | | | | |
| | |
NET ASSETS CONSIST OF | | | | | | | | |
Paid-in capital | | $ | 644,372,404 | | | $ | 684,792,671 | |
Undistributed net investment income (loss) | | | 6,619 | | | | 111,345 | |
Accumulated net realized gains (losses) on investments | | | 5,224,321 | | | | 513,444 | |
Net unrealized gains on investments | | | 44,134,010 | | | | 63,640,267 | |
| | | | | | | | |
Total net assets | | $ | 693,737,354 | | | $ | 749,057,727 | |
| | | | | | | | |
| | |
COMPUTATION OF NET ASSET VALUE AND OFFERING PRICE PER SHARE1 | | | | | | | | |
Net assets | | $ | 693,737,354 | | | $ | 749,057,727 | |
Shares outstanding | | | 63,358,913 | | | | 64,824,727 | |
Net asset value per share | | $ | 10.95 | | | $ | 11.56 | |
Maximum offering price per share2 | | $ | 11.12 | | | $ | 11.74 | |
| | |
Investments in unaffiliated Underlying Funds and securities, at cost | | $ | 161,272,091 | | | $ | 245,225,862 | |
| | | | | | | | |
Investments in affiliated Master Portfolios, at cost | | $ | 152,464,299 | | | $ | 158,483,956 | |
| | | | | | | | |
Investments in affiliated Underlying Funds, at cost | | $ | 335,200,074 | | | $ | 280,337,388 | |
| | | | | | | | |
Total investments, at cost | | $ | 648,936,464 | | | $ | 684,047,206 | |
| | | | | | | | |
| 1. | Each Portfolio has an unlimited number of authorized shares. |
| 2. | Maximum offering price is computed as 100/98.50 of net asset value. On investments of $50,000 or more, the offering price is reduced. |
The accompanying notes are an integral part of these financial statements.
| | | | | | |
| Statements of assets and liabilities—November 30, 2012 (unaudited) | | Wells Fargo Advantage WealthBuilder Portfolios | | | 29 | |
| | | | | | | | | | | | | | |
WealthBuilder
Growth Balanced
Portfolio | | | WealthBuilder
Growth Allocation
Portfolio | | | WealthBuilder
Equity Portfolio | | | WealthBuilder
Tactical Equity
Portfolio | |
| | | |
| | | | | | | | | | | | | | |
| | | | | | | | | | | | | | |
| $ | 367,191,612 | | | $ | 159,950,105 | | | $ | 59,093,702 | | | $ | 201,418,938 | |
| | 175,169,481 | | | | 66,508,997 | | | | 31,070,603 | | | | 76,939,835 | |
| | 175,397,937 | | | | 63,322,159 | | | | 19,410,551 | | | | 73,027,616 | |
| | | | | | | | | | | | | | |
| | 717,759,030 | | | | 289,781,261 | | | | 109,574,856 | | | | 351,386,389 | |
| | 181,854 | | | | 46,089 | | | | 0 | | | | 0 | |
| | 0 | | | | 0 | | | | 37,555 | | | | 334,168 | |
| | 1,240,016 | | | | 590,065 | | | | 54,411 | | | | 327,745 | |
| | 376,340 | | | | 88,199 | | | | 0 | | | | 0 | |
| | 0 | | | | 0 | | | | 0 | | | | 34,654 | |
| | 26,862 | | | | 22,551 | | | | 12,430 | | | | 21,042 | |
| | | | | | | | | | | | | | |
| | 719,584,102 | | | | 290,528,165 | | | | 109,679,252 | | | | 352,103,998 | |
| | | | | | | | | | | | | | |
| | | |
| | | | | | | | | | | | | | |
| | 549,795 | | | | 131,919 | | | | 0 | | | | 0 | |
| | 1,532,637 | | | | 646,619 | | | | 134,127 | | | | 786,921 | |
| | 167,623 | | | | 63,281 | | | | 0 | | | | 0 | |
| | 98,693 | | | | 36,720 | | | | 3,663 | | | | 44,182 | |
| | 466,352 | | | | 187,870 | | | | 71,208 | | | | 229,419 | |
| | 192,726 | | | | 77,635 | | | | 29,433 | | | | 94,832 | |
| | 155,420 | | | | 62,607 | | | | 23,499 | | | | 76,473 | |
| | 30,306 | | | | 21,985 | | | | 11,445 | | | | 18,624 | |
| | | | | | | | | | | | | | |
| | 3,193,552 | | | | 1,228,636 | | | | 273,375 | | | | 1,250,451 | |
| | | | | | | | | | | | | | |
| $ | 716,390,550 | | | $ | 289,299,529 | | | $ | 109,405,877 | | | $ | 350,853,547 | |
| | | | | | | | | | | | | | |
| | | |
| | | | | | | | | | | | | | |
| $ | 718,089,357 | | | $ | 281,191,546 | | | $ | 121,900,592 | | | $ | 425,851,631 | |
| | (520,118 | ) | | | (533,690 | ) | | | (399,454 | ) | | | (1,566,944 | ) |
| | (98,229,559 | ) | | | (33,113,250 | ) | | | (33,150,933 | ) | | | (137,046,542 | ) |
| | 97,050,870 | | | | 41,754,923 | | | | 21,055,672 | | | | 63,615,402 | |
| | | | | | | | | | | | | | |
| $ | 716,390,550 | | | $ | 289,299,529 | | | $ | 109,405,877 | | | $ | 350,853,547 | |
| | | | | | | | | | | | | | |
| | | |
| | | | | | | | | | | | | | |
| $ | 716,390,550 | | | $ | 289,299,529 | | | $ | 109,405,877 | | | $ | 350,853,547 | |
| | 60,665,332 | | | | 24,588,212 | | | | 9,679,531 | | | | 24,882,456 | |
| $ | 11.81 | | | $ | 11.77 | | | $ | 11.30 | | | $ | 14.10 | |
| $ | 11.99 | | | $ | 11.95 | | | $ | 11.47 | | | $ | 14.31 | |
| | | |
| $ | 304,059,972 | | | $ | 132,548,300 | | | $ | 45,509,789 | | | $ | 162,256,233 | |
| | | | | | | | | | | | | | |
| $ | 163,163,299 | | | $ | 61,189,069 | | | $ | 27,857,283 | | | $ | 68,254,615 | |
| | | | | | | | | | | | | | |
| $ | 150,427,108 | | | $ | 52,931,342 | | | $ | 15,152,112 | | | $ | 56,200,290 | |
| | | | | | | | | | | | | | |
| $ | 617,650,379 | | | $ | 246,668,711 | | | $ | 88,519,184 | | | $ | 286,711,138 | |
| | | | | | | | | | | | | | |
The accompanying notes are an integral part of these financial statements.
| | | | |
| 30 | | Wells Fargo Advantage WealthBuilder Portfolios | | Statements of operations—six months ended November 30, 2012 (unaudited) |
| | | | | | | | |
| | | WealthBuilder
Conservative
Allocation
Portfolio | | | WealthBuilder
Moderate
Balanced Portfolio | |
| | |
Investment income | | | | | | | | |
Dividends from unaffiliated Underlying Funds | | $ | 2,345,728 | | | $ | 4,070,300 | |
Dividends from affiliated Underlying Funds | | | 2,931,613 | | | | 893,197 | |
Dividends allocated from affiliated Master Portfolios* | | | 235,390 | | | | 502,994 | |
Interest | | | 4,245 | | | | 8,407 | |
Interest allocated from affiliated Master Portfolios** | | | 1,374,675 | | | | 1,103,395 | |
Securities lending income allocated from affiliated Master Portfolios | | | 10,715 | | | | 20,739 | |
Expenses allocated from affiliated Master Portfolios | | | (358,912 | ) | | | (454,054 | ) |
Waivers allocated from affiliated Master Portfolios | | | 9,166 | | | | 7,352 | |
| | | | | | | | |
Total investment income | | | 6,552,620 | | | | 6,152,330 | |
| | | | | | | | |
| | |
Expenses | | | | | | | | |
Advisory fee | | | 691,598 | | | | 750,920 | |
Administration fees | | | 1,071,977 | | | | 1,163,926 | |
Shareholder servicing fee | | | 862,823 | | | | 937,088 | |
Distribution fees | | | 2,593,492 | | | | 2,815,950 | |
Custody and accounting fees | | | 35,034 | | | | 33,727 | |
Professional fees | | | 9,762 | | | | 8,536 | |
Registration fees | | | 28,174 | | | | 23,382 | |
Shareholder report expenses | | | 18,811 | | | | 25,959 | |
Trustees’ fees and expenses | | | 6,497 | | | | 6,279 | |
Other fees and expenses | | | 5,433 | | | | 11,352 | |
| | | | | | | | |
Total expenses | | | 5,323,601 | | | | 5,777,119 | |
Less: Fee waivers and/or expense reimbursements | | | (136,616 | ) | | | (145,218 | ) |
| | | | | | | | |
Net expenses | | | 5,186,985 | | | | 5,631,901 | |
| | | | | | | | |
Net investment income (loss) | | | 1,365,635 | | | | 520,429 | |
| | | | | | | | |
| | |
REALIZED AND UNREALIZED GAINS (LOSSES) ON INVESTMENTS | | | | | | | | |
| | |
Net realized gains (losses) on: | | | | | | | | |
Unaffiliated Underlying Funds | | | (338,395 | ) | | | (969,428 | ) |
Affiliated Underlying Funds | | | 82,838 | | | | 116,924 | |
Futures transactions | | | 3,449,909 | | | | 7,290,835 | |
Capital gain distributions from unaffiliated Underlying Funds | | | 3,176 | | | | 6,807 | |
Securities transactions allocated from affiliated Master Portfolios | | | 4,318,200 | | | | 4,610,661 | |
| | | | | | | | |
Net realized gains on investments | | | 7,515,728 | | | | 11,055,799 | |
| | | | | | | | |
| | |
Net change in unrealized gains (losses) on: | | | | | | | | |
Unaffiliated Underlying Funds | | | 14,639,217 | | | | 23,473,694 | |
Affiliated Underlying Funds | | | 1,893,464 | | | | 4,047,364 | |
Futures transactions | | | (1,640,176 | ) | | | (3,483,326 | ) |
Securities transactions allocated from affiliated Master Portfolios | | | 1,400,896 | | | | 3,444,732 | |
| | | | | | | | |
Net change in unrealized gains (losses) on investments | | | 16,293,401 | | | | 27,482,464 | |
| | | | | | | | |
Net realized and unrealized gains (losses) on investments | | | 23,809,129 | | | | 38,538,263 | |
| | | | | | | | |
Net increase in net assets resulting from operations | | $ | 25,174,764 | | | $ | 39,058,692 | |
| | | | | | | | |
| | |
* Net of foreign dividend withholding taxes allocated from affiliated Master Portfolios in the amount of | | | $5,631 | | | | $12,021 | |
| | |
** Net of foreign interest withholding taxes allocated from affiliated Master Portfolios in the amount of | | | $1,335 | | | | $1,068 | |
The accompanying notes are an integral part of these financial statements.
| | | | | | |
| Statements of operations—six months ended November 30, 2012 (unaudited) | | Wells Fargo Advantage WealthBuilder Portfolios | | | 31 | |
| | | | | | | | | | | | | | |
| | | |
WealthBuilder
Growth Balanced
Portfolio | | | WealthBuilder
Growth Allocation
Portfolio | | | WealthBuilder
Equity Portfolio | | | WealthBuilder
Tactical Equity
Portfolio | |
| | | |
| | | | | | | | | | | | | | |
| $ | 2,959,530 | | | $ | 1,004,392 | | | $ | 287,947 | | | $ | 689,621 | |
| | 540,257 | | | | 132,223 | | | | 10,704 | | | | 45,159 | |
| | 773,274 | | | | 379,760 | | | | 272,079 | | | | 615,502 | |
| | 13,635 | | | | 6,431 | | | | 0 | | | | 4,327 | |
| | 829,876 | | | | 195,191 | | | | 0 | | | | 0 | |
| | 30,832 | | | | 14,915 | | | | 8,505 | | | | 23,705 | |
| | (549,918 | ) | | | (233,866 | ) | | | (127,067 | ) | | | (324,342 | ) |
| | 5,522 | | | | 1,295 | | | | 0 | | | | 0 | |
| | | | | | | | | | | | | | |
| | 4,603,008 | | | | 1,500,341 | | | | 452,168 | | | | 1,053,972 | |
| | | | | | | | | | | | | | |
| | | |
| | | | | | | | | | | | | | |
| | 724,437 | | | | 292,228 | | | | 113,487 | | | | 361,885 | |
| | 1,122,877 | | | | 452,954 | | | | 175,904 | | | | 560,922 | |
| | 904,112 | | | | 364,836 | | | | 141,293 | | | | 451,297 | |
| | 2,716,638 | | | | 1,095,856 | | | | 425,575 | | | | 1,357,070 | |
| | 32,701 | | | | 30,284 | | | | 17,081 | | | | 25,988 | |
| | 9,213 | | | | 10,051 | | | | 9,381 | | | | 9,644 | |
| | 23,928 | | | | 16,750 | | | | 12,711 | | | | 15,671 | |
| | 30,960 | | | | 15,575 | | | | 8,527 | | | | 22,910 | |
| | 5,976 | | | | 6,205 | | | | 6,090 | | | | 5,724 | |
| | 14,066 | | | | 5,289 | | | | 6,249 | | | | 5,660 | |
| | | | | | | | | | | | | | |
| | 5,584,908 | | | | 2,290,028 | | | | 916,298 | | | | 2,816,771 | |
| | (151,631 | ) | | | (98,317 | ) | | | (65,146 | ) | | | (102,631 | ) |
| | | | | | | | | | | | | | |
| | 5,433,277 | | | | 2,191,711 | | | | 851,152 | | | | 2,714,140 | |
| | | | | | | | | | | | | | |
| | (830,269 | ) | | | (691,370 | ) | | | (398,984 | ) | | | (1,660,168 | ) |
| | | | | | | | | | | | | | |
| | | |
| | | | | | | | | | | | | | |
| | | |
| | | | | | | | | | | | | | |
| | (151,744 | ) | | | (48,862 | ) | | | 932,921 | | | | 2,062,305 | |
| | 457,804 | | | | 116,971 | | | | 337,055 | | | | 799,776 | |
| | 11,481,909 | | | | 5,265,738 | | | | 0 | | | | 5,132,361 | |
| | 10,513 | | | | 5,173 | | | | 2,802 | | | | 8,382 | |
| | 4,884,785 | | | | 1,860,099 | | | | 1,069,787 | | | | 2,205,815 | |
| | | | | | | | | | | | | | |
| | 16,683,267 | | | | 7,199,119 | | | | 2,342,565 | | | | 10,208,639 | |
| | | | | | | | | | | | | | |
| | | |
| | | | | | | | | | | | | | |
| | 30,118,039 | | | | 13,471,984 | | | | 5,168,111 | | | | 15,923,846 | |
| | 6,219,212 | | | | 3,028,742 | | | | 1,752,609 | | | | 4,159,372 | |
| | (5,711,861 | ) | | | (3,188,355 | ) | | | 0 | | | | (7,702,801 | ) |
| | 5,551,730 | | | | 2,758,577 | | | | 1,066,895 | | | | 4,573,266 | |
| | | | | | | | | | | | | | |
| | 36,177,120 | | | | 16,070,948 | | | | 7,987,615 | | | | 16,953,683 | |
| | | | | | | | | | | | | | |
| | 52,860,387 | | | | 23,270,067 | | | | 10,330,180 | | | | 27,162,322 | |
| | | | | | | | | | | | | | |
| $ | 52,030,118 | | | $ | 22,578,697 | | | $ | 9,931,196 | | | $ | 25,502,154 | |
| | | | | | | | | | | | | | |
| | | |
| | $18,445 | | | | $9,076 | | | | $5,629 | | | | $14,664 | |
| | | |
| | $803 | | | | $188 | | | | $0 | | | | $0 | |
The accompanying notes are an integral part of these financial statements.
| | | | |
| 32 | | Wells Fargo Advantage WealthBuilder Portfolios | | Statements of changes in net assets |
| | | | | | | | | | | | | | | | |
| | | WealthBuilder Conservative Allocation Portfolio | |
| | | Six months ended
November 30, 2012
(unaudited) | | | Year ended
May 31, 2012 | |
| | | | |
Operations | | | | | | | | | | | | | | | | |
Net investment income | | | | | | $ | 1,365,635 | | | | | | | $ | 10,021,337 | |
Net realized gains on investments | | | | | | | 7,515,728 | | | | | | | | 7,796,562 | |
Net change in unrealized gains (losses) on investments | | | | | | | 16,293,401 | | | | | | | | (17,957,480 | ) |
| | | | | | | | | | | | | | | | |
Net increase (decrease) in net assets resulting from operations | | | | | | | 25,174,764 | | | | | | | | (139,581 | ) |
| | | | | | | | | | | | | | | | |
| | | | |
Distributions to shareholders from | | | | | | | | | | | | | | | | |
Net investment income | | | | | | | (1,367,731 | ) | | | | | | | (12,894,980 | ) |
Net realized gains | | | | | | | 0 | | | | | | | | (12,573,547 | ) |
| | | | | | | | | | | | | | | | |
Total distributions to shareholders | | | | | | | (1,367,731 | ) | | | | | | | (25,468,527 | ) |
| | | | | | | | | | | | | | | | |
| | | | |
Capital share transactions | | | Shares | | | | | | | | Shares | | | | | |
Proceeds from shares sold | | | 8,302,886 | | | | 90,027,938 | | | | 18,488,616 | | | | 197,314,662 | |
Reinvestment of distributions | | | 125,009 | | | | 1,351,744 | | | | 2,290,736 | | | | 23,999,576 | |
Payment for shares redeemed | | | (7,693,561 | ) | | | (83,541,293 | ) | | | (15,356,395 | ) | | | (163,699,578 | ) |
| | | | | | | | | | | | | | | | |
Net increase in net assets resulting from capital share transactions | | | | | | | 7,838,389 | | | | | | | | 57,614,660 | |
| | | | | | | | | | | | | | | | |
Total increase in net assets | | | | | | | 31,645,422 | | | | | | | | 32,006,552 | |
| | | | | | | | | | | | | | | | |
| | | | |
Net assets | | | | | | | | | | | | | | | | |
Beginning of period | | | | | | | 662,091,932 | | | | | | | | 630,085,380 | |
| | | | | | | | | | | | | | | | |
End of period | | | | | | $ | 693,737,354 | | | | | | | $ | 662,091,932 | |
| | | | | | | | | | | | | | | | |
Undistributed net investment income | | | | | | $ | 6,619 | | | | | | | $ | 8,715 | |
| | | | | | | | | | | | | | | | |
The accompanying notes are an integral part of these financial statements.
| | | | | | |
| Statements of changes in net assets | | Wells Fargo Advantage WealthBuilder Portfolios | | | 33 | |
| | | | | | | | | | | | | | | | |
| | | WealthBuilder Moderate Balanced Portfolio | |
| | | Six months ended
November 30, 2012
(unaudited) | | | Year ended
May 31, 2012 | |
| | | | |
Operations | | | | | | | | | | | | | | | | |
Net investment income | | | | | | $ | 520,429 | | | | | | | $ | 8,208,939 | |
Net realized gains on investments | | | | | | | 11,055,799 | | | | | | | | 3,911,354 | |
Net change in unrealized gains (losses) on investments | | | | | | | 27,482,464 | | | | | | | | (32,953,777 | ) |
| | | | | | | | | | | | | | | | |
Net increase (decrease) in net assets resulting from operations | | | | | | | 39,058,692 | | | | | | | | (20,833,484 | ) |
| | | | | | | | | | | | | | | | |
| | | | |
Distributions to shareholders from | | | | | | | | | | | | | | | | |
Net investment income | | | | | | | (425,764 | ) | | | | | | | (11,998,269 | ) |
Net realized gains | | | | | | | 0 | | | | | | | | (100,284 | ) |
| | | | | | | | | | | | | | | | |
Total distributions to shareholders | | | | | | | (425,764 | ) | | | | | | | (12,098,553 | ) |
| | | | | | | | | | | | | | | | |
| | | | |
Capital share transactions | | | Shares | | | | | | | | Shares | | | | | |
Proceeds from shares sold | | | 6,814,676 | | | | 77,663,817 | | | | 16,953,948 | | | | 186,784,849 | |
Reinvestment of distributions | | | 36,739 | | | | 422,528 | | | | 1,088,624 | | | | 11,746,556 | |
Payment for shares redeemed | | | (6,787,283 | ) | | | (77,462,971 | ) | | | (13,390,824 | ) | | | (146,942,445 | ) |
| | | | | | | | | | | | | | | | |
Net increase in net assets resulting from capital share transactions | | | | | | | 623,374 | | | | | | | | 51,588,960 | |
| | | | | | | | | | | | | | | | |
Total increase in net assets | | | | | | | 39,256,302 | | | | | | | | 18,656,923 | |
| | | | | | | | | | | | | | | | |
| | | | |
Net assets | | | | | | | | | | | | | | | | |
Beginning of period | | | | | | | 709,801,425 | | | | | | | | 691,144,502 | |
| | | | | | | | | | | | | | | | |
End of period | | | | | | $ | 749,057,727 | | | | | | | $ | 709,801,425 | |
| | | | | | | | | | | | | | | | |
Undistributed net investment income | | | | | | $ | 111,345 | | | | | | | $ | 16,680 | |
| | | | | | | | | | | | | | | | |
The accompanying notes are an integral part of these financial statements.
| | | | |
| 34 | | Wells Fargo Advantage WealthBuilder Portfolios | | Statements of changes in net assets |
| | | | | | | | | | | | | | | | |
| | | WealthBuilder Growth Balanced Portfolio | |
| | | Six months ended
November 30, 2012
(unaudited) | | | Year ended
May 31, 2012 | |
| | | | |
Operations | | | | | | | | | | | | | | | | |
Net investment income (loss) | | | | | | $ | (830,269 | ) | | | | | | $ | 5,985,010 | |
Net realized gains on investments | | | | | | | 16,683,267 | | | | | | | | 3,360,997 | |
Net change in unrealized gains (losses) on investments | | | | | | | 36,177,120 | | | | | | | | (58,939,797 | ) |
| | | | | | | | | | | | | | | | |
Net increase (decrease) in net assets resulting from operations | | | | | | | 52,030,118 | | | | | | | | (49,593,790 | ) |
| | | | | | | | | | | | | | | | |
| | | | |
Distributions to shareholders from | | | | | | | | | | | | | | | | |
Net investment income | | | | | | | 0 | | | | | | | | (7,382,373 | ) |
| | | | | | | | | | | | | | | | |
| | | | |
Capital share transactions | | | Shares | | | | | | | | Shares | | | | | |
Proceeds from shares sold | | | 3,771,950 | | | | 43,779,162 | | | | 10,761,743 | | | | 119,273,773 | |
Reinvestment of distributions | | | 0 | | | | 0 | | | | 680,606 | | | | 7,180,393 | |
Payment for shares redeemed | | | (5,982,812 | ) | | | (69,234,339 | ) | | | (15,010,886 | ) | | | (164,945,505 | ) |
| | | | | | | | | | | | | | | | |
Net decrease in net assets resulting from capital share transactions | | | | | | | (25,455,177 | ) | | | | | | | (38,491,339 | ) |
| | | | | | | | | | | | | | | | |
Total increase (decrease) in net assets | | | | | | | 26,574,941 | | | | | | | | (95,467,502 | ) |
| | | | | | | | | | | | | | | | |
| | | | |
Net assets | | | | | | | | | | | | | | | | |
Beginning of period | | | | | | | 689,815,609 | | | | | | | | 785,283,111 | |
| | | | | | | | | | | | | | | | |
End of period | | | | | | $ | 716,390,550 | | | | | | | $ | 689,815,609 | |
| | | | | | | | | | | | | | | | |
Undistributed net investment income (loss) | | | | | | $ | (520,118 | ) | | | | | | $ | 310,151 | |
| | | | | | | | | | | | | | | | |
The accompanying notes are an integral part of these financial statements.
| | | | | | |
| Statements of changes in net assets | | Wells Fargo Advantage WealthBuilder Portfolios | | | 35 | |
| | | | | | | | | | | | | | | | |
| | | WealthBuilder Growth Allocation Portfolio | |
| | | Six months ended
November 30, 2012
(unaudited) | | | Year ended
May 31, 2012 | |
| | | | |
Operations | | | | | | | | | | | | | | | | |
Net investment income (loss) | | | | | | $ | (691,370) | | | | | | | $ | 1,415,622 | |
Net realized gains on investments | | | | | | | 7,199,119 | | | | | | | | 335,788 | |
Net change in unrealized gains (losses) on investments | | | | | | | 16,070,948 | | | | | | | | (25,511,541 | ) |
| | | | | | | | | | | | | | | | |
Net increase (decrease) in net assets resulting from operations | | | | | | | 22,578,697 | | | | | | | | (23,760,131 | ) |
| | | | | | | | | | | | | | | | |
| | | | |
Distributions to shareholders from | | | | | | | | | | | | | | | | |
Net investment income | | | | | | | 0 | | | | | | | | (1,913,751 | ) |
| | | | | | | | | | | | | | | | |
| | | | |
Capital share transactions | | | Shares | | | | | | | | Shares | | | | | |
Proceeds from shares sold | | | 1,562,162 | | | | 18,029,642 | | | | 4,729,644 | | | | 51,894,105 | |
Reinvestment of distributions | | | 0 | | | | 0 | | | | 180,767 | | | | 1,881,788 | |
Payment for shares redeemed | | | (2,421,601 | ) | | | (27,965,446 | ) | | | (5,934,741 | ) | | | (64,651,337 | ) |
| | | | | | | | | | | | | | | | |
Net decrease in net assets resulting from capital share transactions | | | | | | | (9,935,804 | ) | | | | | | | (10,875,444 | ) |
| | | | | | | | | | | | | | | | |
Total increase (decrease) in net assets | | | | | | | 12,642,893 | | | | | | | | (36,549,326 | ) |
| | | | | | | | | | | | | | | | |
| | | | |
Net assets | | | | | | | | | | | | | | | | |
Beginning of period | | | | | | | 276,656,636 | | | | | | | | 313,205,962 | |
| | | | | | | | | | | | | | | | |
End of period | | | | | | $ | 289,299,529 | | | | | | | $ | 276,656,636 | |
| | | | | | | | | | | | | | | | |
Undistributed net investment income (loss) | | | | | | $ | (533,690 | ) | | | | | | $ | 157,680 | |
| | | | | | | | | | | | | | | | |
The accompanying notes are an integral part of these financial statements.
| | | | |
| 36 | | Wells Fargo Advantage WealthBuilder Portfolios | | Statements of changes in net assets |
| | | | | | | | | | | | | | | | |
| | | WealthBuilder Equity Portfolio | |
| | | Six months ended
November 30, 2012
(unaudited) | | | Year ended
May 31, 2012 | |
| | | | |
Operations | | | | | | | | | | | | | | | | |
Net investment loss | | | | | | $ | (398,984 | ) | | | | | | $ | (463,832 | ) |
Net realized gains on investments | | | | | | | 2,342,565 | | | | | | | | 3,614,446 | |
Net change in unrealized gains (losses) on investments | | | | | | | 7,987,615 | | | | | | | | (16,806,165 | ) |
| | | | | | | | | | | | | | | | |
Net increase (decrease) in net assets resulting from operations | | | | | | | 9,931,196 | | | | | | | | (13,655,551 | ) |
| | | | | | | | | | | | | | | | |
| | | | |
Capital share transactions | | | Shares | | | | | | | | Shares | | | | | |
Proceeds from shares sold | | | 214,795 | | | | 2,359,324 | | | | 899,112 | | | | 9,453,570 | |
Payment for shares redeemed | | | (1,144,790 | ) | | | (12,611,339 | ) | | | (2,640,455 | ) | | | (27,495,988 | ) |
| | | | | | | | | | | | | | | | |
Net decrease in net assets resulting from capital share transactions | | | | | | | (10,252,015 | ) | | | | | | | (18,042,418 | ) |
| | | | | | | | | | | | | | | | |
Total decrease in net assets | | | | | | | (320,819 | ) | | | | | | | (31,697,969 | ) |
| | | | | | | | | | | | | | | | |
| | | | |
Net assets | | | | | | | | | | | | | | | | |
Beginning of period | | | | | | | 109,726,696 | | | | | | | | 141,424,665 | |
| | | | | | | | | | | | | | | | |
End of period | | | | | | $ | 109,405,877 | | | | | | | $ | 109,726,696 | |
| | | | | | | | | | | | | | | | |
Undistributed net investment loss | | | | | | $ | (399,454 | ) | | | | | | $ | (470 | ) |
| | | | | | | | | | | | | | | | |
The accompanying notes are an integral part of these financial statements.
| | | | | | |
| Statements of changes in net assets | | Wells Fargo Advantage WealthBuilder Portfolios | | | 37 | |
| | | | | | | | | | | | | | | | |
| | | WealthBuilder Tactical Equity Portfolio | |
| | | Six months ended
November 30, 2012 (unaudited) | | | Year ended
May 31, 2012 | |
| | | | |
Operations | | | | | | | | | | | | | | | | |
Net investment loss | | | | | | $ | (1,660,168 | ) | | | | | | $ | (2,116,577 | ) |
Net realized gains on investments | | | | | | | 10,208,639 | | | | | | | | 19,023,266 | |
Net change in unrealized gains (losses) on investments | | | | | | | 16,953,683 | | | | | | | | (40,897,304 | ) |
| | | | | | | | | | | | | | | | |
Net increase (decrease) in net assets resulting from operations | | | | | | | 25,502,154 | | | | | | | | (23,990,615 | ) |
| | | | | | | | | | | | | | | | |
| | | | |
Capital share transactions | | | Shares | | | | | | | | Shares | | | | | |
Proceeds from shares sold | | | 1,271,744 | | | | 17,462,848 | | | | 2,991,981 | | | | 39,140,068 | |
Payment for shares redeemed | | | (2,816,724 | ) | | | (38,943,867 | ) | | | (6,576,556 | ) | | | (85,179,881 | ) |
| | | | | | | | | | | | | | | | |
Net decrease in net assets resulting from capital share transactions | | | | | | | (21,481,019 | ) | | | | | | | (46,039,813 | ) |
| | | | | | | | | | | | | | | | |
Total increase (decrease) in net assets | | | | | | | 4,021,135 | | | | | | | | (70,030,428 | ) |
| | | | | | | | | | | | | | | | |
| | | | |
Net assets | | | | | | | | | | | | | | | | |
Beginning of period | | | | | | | 346,832,412 | | | | | | | | 416,862,840 | |
| | | | | | | | | | | | | | | | |
End of period | | | | | | $ | 350,853,547 | | | | | | | $ | 346,832,412 | |
| | | | | | | | | | | | | | | | |
Undistributed net investment income (loss) | | | | | | $ | (1,566,944 | ) | | | | | | $ | 93,224 | |
| | | | | | | | | | | | | | | | |
The accompanying notes are an integral part of these financial statements.
| | | | |
| 38 | | Wells Fargo Advantage WealthBuilder Portfolios | | Financial highlights |
| | | | | | | | | | | | | | | | |
| | | Beginning
net asset
value per
share | | | Net
investment
income (loss)1 | | | Net realized
and unrealized
gains (losses)
on investments | | | Distributions
from net
investment
income | |
| | | | |
WealthBuilder Conservative Allocation Portfolio | | | | | | | | | | | | | | | | |
June 1, 2012 to November 30, 2012 (unaudited) | | $ | 10.57 | | | | 0.02 | | | | 0.38 | | | | (0.02 | ) |
June 1, 2011 to May 31, 2012 | | $ | 11.02 | | | | 0.16 | | | | (0.20 | ) | | | (0.21 | ) |
June 1, 2010 to May 31, 2011 | | $ | 10.08 | | | | 0.18 | | | | 0.96 | | | | (0.20 | ) |
June 1, 2009 to May 31, 2010 | | $ | 9.38 | | | | 0.21 | | | | 0.71 | | | | (0.22 | ) |
June 1, 2008 to May 31, 2009 | | $ | 10.64 | | | | 0.31 | | | | (1.23 | ) | | | (0.32 | ) |
June 1, 2007 to May 31, 2008 | | $ | 10.84 | | | | 0.33 | | | | (0.01 | ) | | | (0.32 | ) |
| | | | |
WealthBuilder Moderate Balanced Portfolio | | | | | | | | | | | | | | | | |
June 1, 2012 to November 30, 2012 (unaudited) | | $ | 10.96 | | | | 0.01 | | | | 0.60 | | | | (0.01 | ) |
June 1, 2011 to May 31, 2012 | | $ | 11.50 | | | | 0.13 | 3 | | | (0.48 | ) | | | (0.19 | ) |
June 1, 2010 to May 31, 2011 | | $ | 10.01 | | | | 0.14 | | | | 1.54 | | | | (0.19 | ) |
June 1, 2009 to May 31, 2010 | | $ | 9.01 | | | | 0.15 | | | | 1.00 | | | | (0.15 | ) |
June 1, 2008 to May 31, 2009 | | $ | 11.35 | | | | 0.24 | | | | (2.32 | ) | | | (0.26 | ) |
June 1, 2007 to May 31, 2008 | | $ | 12.00 | | | | 0.29 | | | | (0.30 | ) | | | (0.29 | ) |
| | | | |
WealthBuilder Growth Balanced Portfolio | | | | | | | | | | | | | | | | |
June 1, 2012 to November 30, 2012 (unaudited) | | $ | 10.97 | | | | (0.01 | ) | | | 0.85 | | | | 0.00 | |
June 1, 2011 to May 31, 2012 | | $ | 11.82 | | | | 0.09 | | | | (0.82 | ) | | | (0.12 | ) |
June 1, 2010 to May 31, 2011 | | $ | 9.60 | | | | 0.06 | | | | 2.26 | | | | (0.10 | ) |
June 1, 2009 to May 31, 2010 | | $ | 8.30 | | | | 0.10 | | | | 1.29 | | | | (0.09 | ) |
June 1, 2008 to May 31, 2009 | | $ | 12.27 | | | | 0.17 | | | | (3.86 | ) | | | (0.20 | ) |
June 1, 2007 to May 31, 2008 | | $ | 13.85 | | | | 0.27 | | | | (0.79 | ) | | | (0.25 | ) |
| | | | |
WealthBuilder Growth Allocation Portfolio | | | | | | | | | | | | | | | | |
June 1, 2012 to November 30, 2012 (unaudited) | | $ | 10.87 | | | | (0.03 | ) | | | 0.93 | | | | 0.00 | |
June 1, 2011 to May 31, 2012 | | $ | 11.83 | | | | 0.05 | 3 | | | (0.94 | ) | | | (0.07 | ) |
June 1, 2010 to May 31, 2011 | | $ | 9.34 | | | | 0.02 | | | | 2.53 | | | | (0.06 | ) |
June 1, 2009 to May 31, 2010 | | $ | 7.98 | | | | 0.04 | | | | 1.36 | | | | (0.04 | ) |
June 1, 2008 to May 31, 2009 | | $ | 12.47 | | | | 0.12 | | | | (4.41 | ) | | | (0.12 | ) |
June 1, 2007 to May 31, 2008 | | $ | 13.99 | | | | 0.20 | | | | (0.99 | ) | | | (0.19 | ) |
| | | | |
WealthBuilder Equity Portfolio | | | | | | | | | | | | | | | | |
June 1, 2012 to November 30, 2012 (unaudited) | | $ | 10.34 | | | | (0.04 | ) | | | 1.00 | | | | 0.00 | |
June 1, 2011 to May 31, 2012 | | $ | 11.45 | | | | (0.04 | ) | | | (1.07 | ) | | | 0.00 | |
June 1, 2010 to May 31, 2011 | | $ | 9.10 | | | | (0.07 | ) | | | 2.42 | | | | 0.00 | |
June 1, 2009 to May 31, 2010 | | $ | 7.72 | | | | (0.06 | ) | | | 1.44 | | | | 0.00 | |
June 1, 2008 to May 31, 2009 | | $ | 12.55 | | | | (0.01 | ) | | | (4.39 | ) | | | (0.01 | ) |
June 1, 2007 to May 31, 2008 | | $ | 15.11 | | | | 0.11 | | | | (1.36 | ) | | | (0.10 | ) |
| | | | |
WealthBuilder Tactical Equity Portfolio | | | | | | | | | | | | | | | | |
June 1, 2012 to November 30, 2012 (unaudited) | | $ | 13.12 | | | | (0.07 | ) | | | 1.05 | | | | 0.00 | |
June 1, 2011 to May 31, 2012 | | $ | 13.89 | | | | (0.08 | )3 | | | (0.69 | ) | | | 0.00 | |
June 1, 2010 to May 31, 2011 | | $ | 11.05 | | | | (0.10 | ) | | | 2.94 | | | | 0.00 | |
June 1, 2009 to May 31, 2010 | | $ | 9.13 | | | | (0.06 | ) | | | 1.98 | | | | 0.00 | |
June 1, 2008 to May 31, 2009 | | $ | 15.79 | | | | (0.01 | ) | | | (5.98 | ) | | | (0.01 | ) |
June 1, 2007 to May 31, 2008 | | $ | 18.72 | | | | 0.22 | | | | (1.49 | ) | | | (0.21 | ) |
| 1. | Includes net expenses allocated from affiliated Master Portfolios in which the Portfolio invests. |
| 2. | Total return calculations do not include any sales charges. Returns for periods of less than one year are not annualized. |
| 3. | Calculated based upon average shares outstanding |
| 4. | Amount is less than $0.005. |
The accompanying notes are an integral part of these financial statements.
| | | | | | |
| Financial highlights | | Wells Fargo Advantage WealthBuilder Portfolios | | | 39 | |
| | | | | | | | | | | | | | | | | | | | | | | | | | | | | | |
Distributions
from net
realized gains | | | Ending
net asset
value
per share | | | Ratio to average net assets (annualized) | | | Total
return2 | | | Portfolio
turnover
rate | | | Net assets at
end of period
(000s omitted) | |
| | | Net investment
income (loss)1 | | | Gross
expenses1 | | | Net
expenses1 | | | | |
| | | | | | | |
| | | | | | | | | | | | | | | | | | | | | | | | | | | | | | | |
| | 0.00 | | | $ | 10.95 | | | | 0.40 | % | | | 1.54 | % | | | 1.50 | % | | | 3.80 | % | | | 61 | % | | $ | 693,737 | |
| | (0.20 | ) | | $ | 10.57 | | | | 1.51 | % | | | 1.54 | % | | | 1.50 | % | | | (0.32 | )% | | | 176 | % | | $ | 662,092 | |
| | 0.00 | | | $ | 11.02 | | | | 1.75 | % | | | 1.58 | % | | | 1.50 | % | | | 11.42 | % | | | 168 | % | | $ | 630,085 | |
| | 0.00 | | | $ | 10.08 | | | | 2.18 | % | | | 1.56 | % | | | 1.50 | % | | | 9.87 | % | | | 157 | % | | $ | 442,245 | |
| | (0.02 | ) | | $ | 9.38 | | | | 3.43 | % | | | 1.56 | % | | | 1.50 | % | | | (8.47 | )% | | | 153 | % | | $ | 206,683 | |
| | (0.20 | ) | | $ | 10.64 | | | | 3.06 | % | | | 1.59 | % | | | 1.50 | % | | | 3.04 | % | | | 135 | % | | $ | 134,804 | |
| | | | | | | |
| | | | | | | | | | | | | | | | | | | | | | | | | | | | | | | |
| | 0.00 | | | $ | 11.56 | | | | 0.14 | % | | | 1.54 | % | | | 1.50 | % | | | 5.53 | % | | | 52 | % | | $ | 749,058 | |
| | (0.00 | )4 | | $ | 10.96 | | | | 1.20 | % | | | 1.54 | % | | | 1.50 | % | | | (2.96 | )% | | | 145 | % | | $ | 709,801 | |
| | 0.00 | | | $ | 11.50 | | | | 1.24 | % | | | 1.55 | % | | | 1.50 | % | | | 16.96 | % | | | 142 | % | | $ | 691,145 | |
| | 0.00 | | | $ | 10.01 | | | | 1.62 | % | | | 1.57 | % | | | 1.50 | % | | | 12.81 | % | | | 130 | % | | $ | 472,947 | |
| | (0.00 | )4 | | $ | 9.01 | | | | 2.76 | % | | | 1.57 | % | | | 1.50 | % | | | (18.25 | )% | | | 134 | % | | $ | 249,607 | |
| | (0.35 | ) | | $ | 11.35 | | | | 2.61 | % | | | 1.57 | % | | | 1.50 | % | | | (0.14 | )% | | | 109 | % | | $ | 245,104 | |
| | | | | | | |
| | | | | | | | | | | | | | | | | | | | | | | | | | | | | | | |
| | 0.00 | | | $ | 11.81 | | | | (0.23 | )% | | | 1.54 | % | | | 1.50 | % | | | 7.66 | % | | | 48 | % | | $ | 716,391 | |
| | 0.00 | | | $ | 10.97 | | | | 0.84 | % | | | 1.54 | % | | | 1.50 | % | | | (6.17 | )% | | | 131 | % | | $ | 689,816 | |
| | 0.00 | | | $ | 11.82 | | | | 0.59 | % | | | 1.54 | % | | | 1.50 | % | | | 24.27 | % | | | 140 | % | | $ | 785,283 | |
| | 0.00 | | | $ | 9.60 | | | | 1.12 | % | | | 1.56 | % | | | 1.50 | % | | | 16.75 | % | | | 120 | % | | $ | 590,907 | |
| | (0.08 | ) | | $ | 8.30 | | | | 1.95 | % | | | 1.56 | % | | | 1.50 | % | | | (29.76 | )% | | | 142 | % | | $ | 447,000 | |
| | (0.81 | ) | | $ | 12.27 | | | | 2.07 | % | | | 1.57 | % | | | 1.50 | % | | | (4.00 | )% | | | 104 | % | | $ | 693,612 | |
| | | | | | | |
| | | | | | | | | | | | | | | | | | | | | | | | | | | | | | | |
| | 0.00 | | | $ | 11.77 | | | | (0.47 | )% | | | 1.57 | % | | | 1.50 | % | | | 8.28 | % | | | 37 | % | | $ | 289,300 | |
| | 0.00 | | | $ | 10.87 | | | | 0.49 | % | | | 1.57 | % | | | 1.50 | % | | | (7.47 | )% | | | 96 | % | | $ | 276,657 | |
| | 0.00 | | | $ | 11.83 | | | | 0.16 | % | | | 1.57 | % | | | 1.50 | % | | | 27.33 | % | | | 110 | % | | $ | 313,206 | |
| | 0.00 | | | $ | 9.34 | | | | 0.47 | % | | | 1.60 | % | | | 1.50 | % | | | 17.51 | % | | | 97 | % | | $ | 219,357 | |
| | (0.08 | ) | | $ | 7.98 | | | | 1.42 | % | | | 1.59 | % | | | 1.50 | % | | | (34.13 | )% | | | 119 | % | | $ | 147,691 | |
| | (0.54 | ) | | $ | 12.47 | | | | 1.59 | % | | | 1.58 | % | | | 1.50 | % | | | (5.84 | )% | | | 76 | % | | $ | 207,241 | |
| | | | | | | |
| | | | | | | | | | | | | | | | | | | | | | | | | | | | | | | |
| | 0.00 | | | $ | 11.30 | | | | (0.70 | )% | | | 1.61 | % | | | 1.50 | % | | | 9.28 | % | | | 15 | % | | $ | 109,406 | |
| | 0.00 | | | $ | 10.34 | | | | (0.39 | )% | | | 1.60 | % | | | 1.50 | % | | | (9.69 | )% | | | 24 | % | | $ | 109,727 | |
| | 0.00 | | | $ | 11.45 | | | | (0.68 | )% | | | 1.60 | % | | | 1.50 | % | | | 25.82 | % | | | 52 | % | | $ | 141,425 | |
| | 0.00 | | | $ | 9.10 | | | | (0.68 | )% | | | 1.61 | % | | | 1.50 | % | | | 17.88 | % | | | 46 | % | | $ | 119,993 | |
| | (0.42 | ) | | $ | 7.72 | | | | (0.08 | )% | | | 1.61 | % | | | 1.50 | % | | | (34.63 | )% | | | 62 | % | | $ | 104,334 | |
| | (1.21 | ) | | $ | 12.55 | | | | 0.73 | % | | | 1.59 | % | | | 1.50 | % | | | (8.75 | )% | | | 37 | % | | $ | 187,597 | |
| | | | | | | |
| | | | | | | | | | | | | | | | | | | | | | | | | | | | | | | |
| | 0.00 | | | $ | 14.10 | | | | (0.91 | )% | | | 1.56 | % | | | 1.50 | % | | | 7.47 | % | | | 17 | % | | $ | 350,854 | |
| | 0.00 | | | $ | 13.12 | | | | (0.58 | )% | | | 1.56 | % | | | 1.50 | % | | | (5.54 | )% | | | 31 | % | | $ | 346,832 | |
| | 0.00 | | | $ | 13.89 | | | | (0.81 | )% | | | 1.55 | % | | | 1.50 | % | | | 25.70 | % | | | 73 | % | | $ | 416,863 | |
| | 0.00 | | | $ | 11.05 | | | | (0.54 | )% | | | 1.57 | % | | | 1.50 | % | | | 21.03 | % | | | 89 | % | | $ | 356,382 | |
| | (0.66 | ) | | $ | 9.13 | | | | (0.01 | )% | | | 1.57 | % | | | 1.50 | % | | | (37.36 | )% | | | 123 | % | | $ | 304,770 | |
| | (1.45 | ) | | $ | 15.79 | | | | 1.28 | % | | | 1.57 | % | | | 1.50 | % | | | (7.31 | )% | | | 47 | % | | $ | 582,572 | |
The accompanying notes are an integral part of these financial statements.
| | | | |
| 40 | | Wells Fargo Advantage WealthBuilder Portfolios | | Notes to financial statements (unaudited) |
1. ORGANIZATION
Wells Fargo Funds Trust (the “Trust”), a Delaware statutory trust organized on March 10, 1999, is an open-end management investment company registered under the Investment Company Act of 1940, as amended (the “1940 Act”). These financial statements report on the following funds: Wells Fargo Advantage WealthBuilder Conservative Allocation Portfolio (“WealthBuilder Conservative Allocation Portfolio”), Wells Fargo Advantage WealthBuilder Moderate Balanced Portfolio (“WealthBuilder Moderate Balanced Portfolio”), Wells Fargo Advantage WealthBuilder Growth Balanced Portfolio (“WealthBuilder Growth Balanced Portfolio”), Wells Fargo Advantage WealthBuilder Growth Allocation Portfolio (“WealthBuilder Growth Allocation Portfolio”), Wells Fargo Advantage WealthBuilder Equity Portfolio (“WealthBuilder Equity Portfolio”), and Wells Fargo Advantage WealthBuilder Tactical Equity Portfolio (“WealthBuilder Tactical Equity Portfolio”) (each, a “Portfolio”, collectively, the “Portfolios”). Each Portfolio is a diversified series of the Trust.
The Portfolios seek to achieve their investment objectives by allocating their assets across asset classes of stocks, bonds, and money market instruments by investing in a number of affiliated and unaffiliated mutual funds (collectively, the “Underlying Funds”). The Underlying Funds incur separate expenses in seeking to achieve their investment objectives. Investments in affiliated mutual funds may also include investments in one or more separate diversified portfolios (each, a “Master Portfolio”, collectively, the “Master Portfolios”) of Wells Fargo Master Trust, a registered open-end management investment company. Each Master Portfolio directly acquires portfolio securities, and a Portfolio investing in a Master Portfolio acquires an indirect interest in those securities. Each Portfolio accounts for its investment in the Master Portfolios as partnership investments and records on a daily basis its share of the Master Portfolio’s income, expense, and realized and unrealized gains and losses. The financial statements and financial highlights for the Underlying Funds are presented in separate financial statements and may be obtained from Wells Fargo Investor Services or from the servicing agent of the unaffiliated funds.
2. SIGNIFICANT ACCOUNTING POLICIES
The following significant accounting policies, which are consistently followed in the preparation of the financial statements of each Portfolio, are in conformity with U.S. generally accepted accounting principles which require management to make estimates and assumptions that affect the reported amounts of assets and liabilities, disclosure of contingent assets and liabilities at the date of the financial statements, and the reported amounts of revenues and expenses during the reporting period. Actual results could differ from those estimates.
Securities valuation
All investments are valued each business day as of the close of regular trading on the New York Stock Exchange (normally 4 p.m. Eastern Time).
Investments in underlying open-end mutual funds are valued at net asset per share as reported by the Underlying Funds as of the close of the regular trading on the New York Stock Exchange on each day the exchange is open for trading. Investments in the Master Portfolios are valued daily based on each Portfolio’s proportionate share of each Master Portfolio’s net assets, which are also valued daily.
Debt securities of sufficient credit quality acquired with maturities of 60 days or less generally are valued at amortized cost which approximates fair value. The amortized cost method involves valuing a security at its cost, plus accretion of discount or minus amortization of premium over the period until maturity.
Futures contracts
Each Portfolio may be subject to interest rate risk and equity price risk in the normal course of pursuing its investment objectives. The Portfolios may buy and sell futures contracts in order to gain exposure to, or protect against, changes in security values and interest rates. The primary risks associated with the use of futures contracts are the imperfect correlation between changes in market values of securities held by the Portfolio and the prices of futures contracts, and the possibility of an illiquid market.
Futures contracts are valued based upon their quoted daily settlement prices when available. The aggregate principal amounts of the contracts are not recorded in the financial statements. Fluctuations in the value of the contracts are recorded in the Statements of Assets and Liabilities as an asset or liability and in the Statements of Operations as unrealized gains or losses until the contracts are closed, at which point they are recorded as net realized gains or losses on futures contracts. With futures contracts, there is minimal counterparty risk to the Portfolio since futures are exchange traded and the exchange’s clearinghouse, as counterparty to all exchange traded futures, guarantees the futures against default.
| | | | | | |
| Notes to financial statements (unaudited) | | Wells Fargo Advantage WealthBuilder Portfolios | | | 41 | |
Security transactions and income recognition
Securities transactions are recorded on a trade date basis. Realized gains or losses are recorded on the basis of identified cost.
Income dividends and capital gain distributions from Underlying Funds are recorded on the ex-dividend date. Capital gain distributions from Underlying Funds are treated as realized gains.
Interest income is accrued daily and bond discounts are accreted and premiums are amortized daily based on the effective interest method. To the extent debt obligations are placed on non-accrual status, any related interest income may be reduced by writing off interest receivables when the collection of all or a portion of interest has become doubtful based on consistently applied procedures. If the issuer subsequently resumes interest payments or when the collectability of interest is reasonably assured, the debt obligation is removed from non-accrual status.
Each Portfolio records on a daily basis its proportionate share of each affiliated Master Portfolio’s interest and dividend income, in addition to expenses, waivers, and realized and unrealized gains and losses.
Distributions to shareholders
Distributions to shareholders from net investment income and net realized gains, if any, are recorded on the ex-dividend date. Such distributions are determined in conformity with federal income tax regulations, which may differ in amount or character from net investment income and realized gains recognized for purposes of U.S. generally accepted accounting principles.
Federal and other taxes
Each Portfolio is treated as a separate entity for federal income tax purposes. Each Portfolio intends to continue to qualify as a regulated investment company by distributing substantially all of its investment company taxable income and any net realized capital gains (after reduction for capital loss carryforwards) sufficient to relieve it from all, or substantially all, federal income taxes. Accordingly, no provision for federal income taxes was required.
Each Portfolio’s income and federal excise tax returns and all financial records supporting those returns for the prior three fiscal years are subject to examination by the federal and Delaware revenue authorities. Management has analyzed each Portfolio’s tax positions taken on federal, state, and foreign tax returns for all open tax years and does not believe that there are any uncertain tax positions that require recognition of a tax liability.
At May 31, 2012, net capital loss carryforwards, which were available to offset future net realized capital gains, were as follows:
| | | | | | | | | | | | |
| | | Pre-enactment capital loss expiration* | | | Post-enactment capital losses** | |
| | | 2017 | | | 2018 | | | Short term | |
WealthBuilder Growth Balanced Portfolio | | $ | 0 | | | $ | 86,032,930 | | | $ | 412,859 | |
WealthBuilder Growth Allocation Portfolio | | | 0 | | | | 28,576,555 | | | | 0 | |
WealthBuilder Equity Portfolio | | | 0 | | | | 34,583,567 | | | | 0 | |
WealthBuilder Tactical Equity Portfolio | | | 13,230,947 | | | | 119,979,973 | | | | 0 | |
| * | | Losses incurred in taxable years beginning before December 22, 2010. |
| ** | | Losses incurred in taxable years which began after December 22, 2010 are carried forward for an unlimited period. |
3. FAIR VALUATION MEASUREMENTS
Fair value measurements of investments are determined within a framework that has established a fair value hierarchy based upon the various data inputs utilized in determining the value of each Portfolio’s investments. The three-level hierarchy gives the highest priority to unadjusted quoted prices in active markets for identical assets or liabilities (Level 1) and the lowest priority to significant unobservable inputs (Level 3). Each Portfolio’s investments are classified within the fair value hierarchy based on the lowest level of input that is significant to the fair value measurement. The inputs are summarized into three broad levels as follows:
| n | | Level 1 – quoted prices in active markets for identical securities |
| n | | Level 2 – other significant observable inputs (including quoted prices for similar securities, interest rates, prepayment speeds, credit risk, etc.) |
| n | | Level 3 – significant unobservable inputs (including the Portfolio’s own assumptions in determining the fair value of investments) |
| | | | |
| 42 | | Wells Fargo Advantage WealthBuilder Portfolios | | Notes to financial statements (unaudited) |
The inputs or methodologies used for valuing investments in securities are not necessarily an indication of the risk associated with investing in those securities.
As of November 30, 2012, the inputs used in valuing investments in securities, which were carried at fair value, were as follows:
| | | | | | | | | | | | | | | | |
| Investments in securities | | Quoted prices (Level 1) | | | Significant other
observable inputs (Level 2) | | | Significant unobservable inputs (Level 3) | | | Total | |
WealthBuilder Conservative Allocation Portfolio | | | | | | | | | | | | | | | | |
| | | | |
Equity securities | | | | | | | | | | | | | | | | |
Investment companies | | $ | 523,768,953 | | | $ | 159,117,884 | | | $ | 0 | | | $ | 682,886,837 | |
| | | | |
Short-term investments | | | | | | | | | | | | | | | | |
Investment companies | | | 657,700 | | | | 0 | | | | 0 | | | | 657,700 | |
U.S. Treasury securities | | | 10,469,235 | | | | 0 | | | | 0 | | | | 10,469,235 | |
| | | $ | 534,895,888 | | | $ | 159,117,884 | | | $ | 0 | | | $ | 694,013,772 | |
WealthBuilder Moderate Balanced Portfolio | | | | | | | | | | | | | | | | |
| | | | |
Equity securities | | | | | | | | | | | | | | | | |
Investment companies | | $ | 560,341,774 | | | $ | 167,416,612 | | | $ | 0 | | | $ | 727,758,386 | |
| | | | |
Short-term investments | | | | | | | | | | | | | | | | |
Investment companies | | | 1,258,560 | | | | 0 | | | | 0 | | | | 1,258,560 | |
U.S. Treasury securities | | | 20,718,486 | | | | 0 | | | | 0 | | | | 20,718,486 | |
| | | $ | 582,318,820 | | | $ | 167,416,612 | | | $ | 0 | | | $ | 749,735,432 | |
WealthBuilder Growth Balanced Portfolio | | | | | | | | | | | | | | | | |
| | | | |
Equity securities | | | | | | | | | | | | | | | | |
Investment companies | | $ | 506,344,874 | | | $ | 175,169,481 | | | $ | 0 | | | $ | 681,514,355 | |
| | | | |
Short-term investments | | | | | | | | | | | | | | | | |
Investment companies | | | 2,652,130 | | | | 0 | | | | 0 | | | | 2,652,130 | |
U.S. Treasury securities | | | 33,592,545 | | | | 0 | | | | 0 | | | | 33,592,545 | |
| | | $ | 542,589,549 | | | $ | 175,169,481 | | | $ | 0 | | | $ | 717,759,030 | |
WealthBuilder Growth Allocation Portfolio | | | | | | | | | | | | | | | | |
| | | | |
Equity securities | | | | | | | | | | | | | | | | |
Investment companies | | $ | 206,456,472 | | | $ | 66,508,997 | | | $ | 0 | | | $ | 272,965,469 | |
| | | | |
Short-term investments | | | | | | | | | | | | | | | | |
Investment companies | | | 966,950 | | | | 0 | | | | 0 | | | | 966,950 | |
U.S. Treasury securities | | | 15,848,842 | | | | 0 | | | | 0 | | | | 15,848,842 | |
| | | $ | 223,272,264 | | | $ | 66,508,997 | | | $ | 0 | | | $ | 289,781,261 | |
WealthBuilder Equity Portfolio | | | | | | | | | | | | | | | | |
| | | | |
Equity securities | | | | | | | | | | | | | | | | |
Investment companies | | $ | 78,141,808 | | | $ | 31,070,603 | | | $ | 0 | | | $ | 109,212,411 | |
| | | | |
Short-term investments | | | | | | | | | | | | | | | | |
Investment companies | | | 362,445 | | | | 0 | | | | 0 | | | | 362,445 | |
| | | $ | 78,504,253 | | | $ | 31,070,603 | | | $ | 0 | | | $ | 109,574,856 | |
WealthBuilder Tactical Equity Portfolio | | | | | | | | | | | | | | | | |
| | | | |
Equity securities | | | | | | | | | | | | | | | | |
Investment companies | | $ | 250,997,242 | | | $ | 76,939,835 | | | $ | 0 | | | $ | 327,937,077 | |
| | | | |
Short-term investments | | | | | | | | | | | | | | | | |
Investment companies | | | 2,665,832 | | | | 0 | | | | 0 | | | | 2,665,832 | |
U.S. Treasury securities | | | 20,783,480 | | | | 0 | | | | 0 | | | | 20,783,480 | |
| | | $ | 274,446,554 | | | $ | 76,939,835 | | | $ | 0 | | | $ | 351,386,389 | |
| | | | | | |
| Notes to financial statements (unaudited) | | Wells Fargo Advantage WealthBuilder Portfolios | | | 43 | |
Further details on the major security types listed above can be found in each Portfolio of Investments.
As of November 30, 2012, the inputs used in valuing each Portfolio’s other financial instruments, which are carried at fair value, were as follows:
| | | | | | | | | | | | | | | | |
| Futures contracts+ | | Quoted prices (Level 1) | | | Significant other
observable inputs (Level 2) | | | Significant unobservable inputs (Level 3) | | | Total | |
WealthBuilder Conservative Allocation Portfolio | | $ | (943,298 | ) | | $ | 0 | | | $ | 0 | | | $ | (943,298 | ) |
WealthBuilder Moderate Balanced Portfolio | | | (2,047,959 | ) | | | 0 | | | | 0 | | | | (2,047,959 | ) |
WealthBuilder Growth Balanced Portfolio | | | (3,057,781 | ) | | | 0 | | | | 0 | | | | (3,057,781 | ) |
WealthBuilder Growth Allocation Portfolio | | | (1,357,627 | ) | | | 0 | | | | 0 | | | | (1,357,627 | ) |
WealthBuilder Tactical Equity Portfolio | | | (1,059,849 | ) | | | 0 | | | | 0 | | | | (1,059,849 | ) |
| + | Futures contracts are presented at the unrealized gains or losses on the instruments. |
Transfers in and transfers out are recognized at the end of the reporting period. For the six months ended November 30, 2012, the Portfolios did not have any transfers into/out of Level 1 or Level 2.
4. TRANSACTIONS WITH AFFILIATES AND OTHER EXPENSES
Advisory fees
The Trust has entered into an advisory contract with Wells Fargo Funds Management, LLC (“Funds Management”) an indirect wholly owned subsidiary of Wells Fargo & Company (“Wells Fargo”). The adviser is responsible for implementing investment policies and guidelines and for supervising the subadviser, who is responsible for day-to-day portfolio management of the Portfolios.
Pursuant to the contract, Funds Management is entitled to receive an annual advisory fee starting at 0.20% and declining to 0.15% as the average daily net assets of each Portfolio increases. For the six months ended November 30, 2012, the advisory fee was equivalent to an annual rate of 0.20% of each Portfolio’s average daily net assets.
Funds Management also serves as the adviser to each affiliated Master Portfolio and affiliated Underlying Fund and is entitled to receive a fee for those services.
Funds Management has retained the services of a subadviser to provide daily portfolio management to each Portfolio. The fee for subadvisory services is borne by Funds Management. Wells Capital Management Incorporated, an affiliate of Funds Management, is the subadviser to each Portfolio and is paid an annual subadvisory fee of 0.15% of the average daily net assets of each Portfolio.
Administration and transfer agent fees
The Trust has entered into an administration agreement with Funds Management. Under this agreement, for providing administrative services, which includes paying fees and expenses for services provided by the transfer agent, sub-transfer agents, omnibus account servicers, and record-keepers, Funds Management is entitled to receive from each Portfolio an annual fee starting at 0.31% and declining to 0.29% as the average daily net assets of each Portfolio increase. For the six months ended November 30, 2012, the administration fee for each Portfolio was equivalent to an annual rate of 0.31% of each Portfolio’s average daily net assets.
Funds Management has contractually waived and/or reimbursed advisory and administration fees to the extent necessary to maintain certain net operating expense ratios for the Portfolios. Funds Management has committed through September 30, 2013 to waive fees and/or reimburse expenses to the extent necessary to cap each Portfolio’s expenses at 1.50%.
Distribution fees
The Trust has adopted a Distribution Plan for each Portfolio pursuant to Rule 12b-1 under the 1940 Act. Distribution fees are charged and paid to Wells Fargo Funds Distributor, LLC, the principal underwriter of each Portfolio, at an annual rate of 0.75% of each Portfolio’s average daily net assets.
| | | | |
| 44 | | Wells Fargo Advantage WealthBuilder Portfolios | | Notes to financial statements (unaudited) |
For the six months ended November 30, 2012, Wells Fargo Funds Distributor, LLC received the following amounts in front-end sales charges:
| | | | |
| | | Front-end sales charges | |
WealthBuilder Conservation Allocation Portfolio | | $ | 14,312 | |
WealthBuilder Moderate Balanced Portfolio | | | 13,977 | |
WealthBuilder Growth Balanced Portfolio | | | 7,423 | |
WealthBuilder Growth Allocation Portfolio | | | 3,358 | |
WealthBuilder Equity Portfolio | | | 448 | |
WealthBuilder Tactical Equity Portfolio | | | 1,901 | |
Shareholder servicing fees
The Trust has entered into contracts with one or more shareholder servicing agents, whereby each Portfolio is charged a fee at an annual rate of 0.25% of its average daily net assets.
A portion of these total shareholder servicing fees were paid to affiliates of Wells Fargo.
5. INVESTMENT PORTFOLIO TRANSACTIONS
Purchases and sales of investments, excluding U.S. Government obligations (if any) and short-term securities, for the six months ended November 30, 2012 were as follows:
| | | | | | | | |
| | | Purchases at cost* | | | Sales proceeds* | |
WealthBuilder Conservation Allocation Portfolio | | $ | 411,293,653 | | | $ | 408,892,367 | |
WealthBuilder Moderate Balanced Portfolio | | | 373,389,555 | | | | 380,044,296 | |
WealthBuilder Growth Balanced Portfolio | | | 322,427,577 | | | | 354,355,330 | |
WealthBuilder Growth Allocation Portfolio | | | 99,023,728 | | | | 113,859,980 | |
WealthBuilder Equity Portfolio | | | 16,934,988 | | | | 29,977,874 | |
WealthBuilder Tactical Equity Portfolio | | | 56,800,855 | | | | 89,127,260 | |
| * | The Portfolios seek to achieve their investment objective by investing some or all of their investable assets in one or more affiliated Master Portfolios. Purchases and sales related to these investments have been calculated by aggregating the results of multiplying such Portfolio’s ownership percentage of the respective affiliated Master Portfolio by the corresponding affiliated Master Portfolio’s purchases and sales. Purchases and sales of the affiliated and unaffiliated Underlying Funds in which the Portfolios invest are actual aggregate purchases and sales of those funds. |
6. INVESTMENTS IN AFFILIATES
A summary of each Portfolio’s transactions in shares of affiliated Underlying Funds (excluding short-term investments and affiliated Master Portfolios) during the six months ended November 30, 2012 were as follows:
| | | | | | | | | | | | | | | | | | | | | | | | |
| | | Shares, beginning of period | | | Shares
purchases | | | Shares
sold | | | Shares, end of
period | | | Value, end of
period | | | Dividend
income from affiliated
Underlying
Funds | |
WealthBuilder Conservative Allocation Portfolio | | | | | | | | | | | | | | | | | | | | | | | | |
Wells Fargo Advantage Emerging Markets Equity Fund | | | 153,813 | | | | 8,736 | | | | 13,152 | | | | 149,397 | | | $ | 3,238,936 | | | $ | 0 | |
Wells Fargo Advantage Endeavor Select Fund | | | 798,016 | | | | 70,100 | | | | 52,004 | | | | 816,112 | | | | 9,254,713 | | | | 0 | |
Wells Fargo Advantage Government Securities Fund | | | 11,004,448 | | | | 654,791 | | | | 447,994 | | | | 11,211,245 | | | | 128,368,760 | | | | 742,571 | |
Wells Fargo Advantage Large Cap Growth Fund | | | 0 | | | | 283,626 | | | | 14,817 | | | | 268,809 | | | | 9,209,397 | | | | 0 | |
Wells Fargo Advantage Short Duration Government Bond Fund | | | 18,153,755 | | | | 1,067,007 | | | | 577,558 | | | | 18,643,204 | | | | 192,584,297 | | | | 2,172,334 | |
Wells Fargo Advantage Small Cap Value Fund | | | 202,358 | | | | 15,576 | | | | 21,324 | | | | 196,610 | | | | 6,464,525 | | | | 0 | |
Wells Fargo Advantage Strategic Large Cap Growth Fund | | | 255,200 | | | | 7,480 | | | | 262,680 | | | | 0 | | | | 0 | | | | 16,380 | |
| | | | | | | | | | | | | | | | | | | $ | 349,120,628 | | | $ | 2,931,285 | |
| | | | | | |
| Notes to financial statements (unaudited) | | Wells Fargo Advantage WealthBuilder Portfolios | | | 45 | |
| | | | | | | | | | | | | | | | | | | | | | | | |
| | | Shares, beginning of period | | | Shares
purchases | | | Shares
sold | | | Shares, end of
period | | | Value, end of
period | | | Dividend
income from affiliated
Underlying
Funds | |
WealthBuilder Moderate Balanced Portfolio | | | | | | | | | | | | | | | | | | | | | | | | |
Wells Fargo Advantage Emerging Markets Equity Fund | | | 328,569 | | | | 9,623 | | | | 21,121 | | | | 317,071 | | | $ | 6,874,100 | | | $ | 0 | |
Wells Fargo Advantage Endeavor Select Fund | | | 1,704,402 | | | | 99,603 | | | | 68,640 | | | | 1,735,365 | | | | 19,679,039 | | | | 0 | |
Wells Fargo Advantage Government Securities Fund | | | 8,760,362 | | | | 1,011,610 | | | | 838,085 | | | | 8,933,887 | | | | 102,293,005 | | | | 596,056 | |
Wells Fargo Advantage Large Cap Growth Fund | | | 0 | | | | 587,801 | | | | 18,761 | | | | 569,040 | | | | 19,495,319 | | | | 0 | |
Wells Fargo Advantage Short Duration Government Bond Fund | | | 12,856,095 | | | | 1,381,932 | | | | 1,060,842 | | | | 13,177,185 | | | | 136,120,322 | | | | 261,603 | |
Wells Fargo Advantage Small Cap Value Fund | | | 430,384 | | | | 20,105 | | | | 39,199 | | | | 411,290 | | | | 13,523,216 | | | | 0 | |
Wells Fargo Advantage Strategic Large Cap Growth Fund | | | 546,175 | | | | 11,245 | | | | 557,420 | | | | 0 | | | | 0 | | | | 34,819 | |
| | | | | | | | | | | | | | | | | | | $ | 297,985,001 | | | $ | 892,478 | |
WealthBuilder Growth Balanced Portfolio | | | | | | | | | | | | | | | | | | | | | | | | |
Wells Fargo Advantage Emerging Markets Equity Fund | | | 518,379 | | | | 10,698 | | | | 50,249 | | | | 478,828 | | | $ | 10,381,001 | | | $ | 0 | |
Wells Fargo Advantage Endeavor Select Fund | | | 2,692,532 | | | | 59,080 | | | | 121,777 | | | | 2,629,835 | | | | 29,822,327 | | | | 0 | |
Wells Fargo Advantage Government Securities Fund | | | 7,078,891 | | | | 1,779,963 | | | | 1,665,662 | | | | 7,193,192 | | | | 82,362,051 | | | | 484,580 | |
Wells Fargo Advantage Large Cap Growth Fund | | | 0 | | | | 896,540 | | | | 30,125 | | | | 866,415 | | | | 29,683,390 | | | | 0 | |
Wells Fargo Advantage Small Cap Value Fund | | | 672,291 | | | | 14,170 | | | | 63,072 | | | | 623,389 | | | | 20,497,038 | | | | 0 | |
Wells Fargo Advantage Strategic Large Cap Growth Fund | | | 861,206 | | | | 3,592 | | | | 864,798 | | | | 0 | | | | 0 | | | | 54,291 | |
| | | | | | | | | | | | | | | | | | | $ | 172,745,807 | | | $ | 538,871 | |
WealthBuilder Growth Allocation Portfolio | | | | | | | | | | | | | | | | | | | | | | | | |
Wells Fargo Advantage Emerging Markets Equity Fund | | | 253,570 | | | | 8,507 | | | | 26,502 | | | | 235,575 | | | $ | 5,107,260 | | | $ | 0 | |
Wells Fargo Advantage Endeavor Select Fund | | | 1,316,587 | | | | 36,258 | | | | 64,368 | | | | 1,288,477 | | | | 14,611,328 | | | | 0 | |
Wells Fargo Advantage Government Securities Fund | | | 1,531,634 | | | | 558,206 | | | | 523,119 | | | | 1,566,721 | | | | 17,938,954 | | | | 105,182 | |
Wells Fargo Advantage Large Cap Growth Fund | | | 0 | | | | 437,794 | | | | 12,166 | | | | 425,628 | | | | 14,582,016 | | | | 0 | |
Wells Fargo Advantage Small Cap Value Fund | | | 326,886 | | | | 16,254 | | | | 35,486 | | | | 307,654 | | | | 10,115,651 | | | | 0 | |
Wells Fargo Advantage Strategic Large Cap Growth Fund | | | 422,994 | | | | 1,128 | | | | 424,122 | | | | 0 | | | | 0 | | | | 26,557 | |
| | | | | | | | | | | | | | | | | | | $ | 62,355,209 | | | $ | 131,739 | |
WealthBuilder Equity Portfolio | | | | | | | | | | | | | | | | | | | | | | | | |
Wells Fargo Advantage Emerging Markets Equity Fund | | | 136,165 | | | | 1,226 | | | | 12,562 | | | | 124,829 | | | $ | 2,706,283 | | | $ | 0 | |
Wells Fargo Advantage Endeavor Select Fund | | | 526,399 | | | | 2,096 | | | | 43,038 | | | | 485,457 | | | | 5,505,085 | | | | 0 | |
Wells Fargo Advantage Large Cap Growth Fund | | | 0 | | | | 167,510 | | | | 7,337 | | | | 160,173 | | | | 5,487,538 | | | | 0 | |
Wells Fargo Advantage Small Cap Value Fund | | | 183,559 | | | | 729 | | | | 21,599 | | | | 162,689 | | | | 5,349,200 | | | | 0 | |
Wells Fargo Advantage Strategic Large Cap Growth Fund | | | 167,651 | | | | 322 | | | | 167,973 | | | | 0 | | | | 0 | | | | 10,484 | |
| | | | | | | | | | | | | | | | | | | $ | 19,048,106 | | | $ | 10,484 | |
WealthBuilder Tactical Equity Portfolio | | | | | | | | | | | | | | | | | | | | | | | | |
Wells Fargo Advantage Emerging Markets Equity Fund | | | 412,099 | | | | 19,311 | | | | 57,494 | | | | 373,916 | | | $ | 8,106,496 | | | $ | 0 | |
Wells Fargo Advantage Endeavor Select Fund | | | 2,170,521 | | | | 60,448 | | | | 192,982 | | | | 2,037,987 | | | | 23,110,770 | | | | 0 | |
Wells Fargo Advantage Large Cap Growth Fund | | | 0 | | | | 710,842 | | | | 37,605 | | | | 673,237 | | | | 23,065,111 | | | | 0 | |
Wells Fargo Advantage Small Cap Value Fund | | | 541,954 | | | | 28,354 | | | | 81,275 | | | | 489,033 | | | | 16,079,407 | | | | 0 | |
Wells Fargo Advantage Strategic Large Cap Growth Fund | | | 692,895 | | | | 2,768 | | | | 695,663 | | | | 0 | | | | 0 | | | | 43,251 | |
| | | | | | | | | | | | | | | | | | | $ | 70,361,784 | | | $ | 43,251 | |
| | | | |
| 46 | | Wells Fargo Advantage WealthBuilder Portfolios | | Notes to financial statements (unaudited) |
As of November 30, 2012, the Portfolios own the following percentages in the affiliated Master Portfolios:
| | | | | | | | | | | | | | | | | | | | |
| | | Wells Fargo
Advantage
Core Bond
Portfolio | | | Wells Fargo
Advantage
Emerging
Growth
Portfolio | | | Wells Fargo
Advantage
Equity
Value
Portfolio | | | Wells Fargo
Advantage
International
Growth
Portfolio | | | Wells Fargo
Advantage
Small
Company
Value
Portfolio | |
WealthBuilder Conservative Allocation Portfolio | | | 3 | % | | | 1 | % | | | 1 | % | | | 7 | % | | | 4 | % |
WealthBuilder Moderate Balanced Portfolio | | | 3 | % | | | 1 | % | | | 2 | % | | | 15 | % | | | 8 | % |
WealthBuilder Growth Balanced Portfolio | | | 2 | % | | | 2 | % | | | 4 | % | | | 23 | % | | | 12 | % |
WealthBuilder Growth Allocation Portfolio | | | 0 | %* | | | 1 | % | | | 2 | % | | | 11 | % | | | 6 | % |
WealthBuilder Equity Portfolio | | | N/A | | | | 1 | % | | | 2 | % | | | 6 | % | | | 3 | % |
WealthBuilder Tactical Equity Portfolio | | | N/A | | | | 2 | % | | | 3 | % | | | 18 | % | | | 10 | % |
| * | The amount invested is less than 1%. |
7. DERIVATIVE TRANSACTIONS
During the six months ended November 30, 2012, the Portfolios entered into futures contracts to gain market exposure to certain asset classes consistent with an active asset allocation strategy.
At November 30, 2012, the Portfolios had long and short futures contracts outstanding as follows:
| | | | | | | | | | | | | | |
| | | Expiration date | | Contracts | | Type | | Contract value at November 30, 2012 | | | Unrealized
gains (losses) | |
WealthBuilder Conservative Allocation Portfolio | | 12-20-12 | | 238 Long | | S&P 500 Index | | $ | 84,156,800 | | | $ | (1,064,292 | ) |
| | 12-21-12 | | 258 Short | | MSCI EAFE
E-Mini Index | | | 20,114,970 | | | | (134,733 | ) |
| | 12-21-12 | | 80 Short | | MSCI Emerging Markets
E-Mini Index | | | 4,021,200 | | | | (100,965 | ) |
| | 12-21-12 | | 222 Short | | Russell 2000 E-Mini
Index | | | 18,219,540 | | | | 465,249 | |
| | 3-19-13 | | 18 Long | | 10-Year
U.S. Treasury Notes | | | 2,405,531 | | | | 7,399 | |
| | | 3-19-13 | | 230 Short | | 30-Year
U.S. Treasury Bonds | | | 34,514,375 | | | | (115,956 | ) |
WealthBuilder Moderate Balanced Portfolio | | 12-20-12 | | 513 Long | | S&P 500 Index | | | 181,396,800 | | | | (2,319,551 | ) |
| | 12-21-12 | | 551 Short | | MSCI EAFE E-Mini Index | | | 42,958,715 | | | | (282,298 | ) |
| | 12-21-12 | | 171 Short | | MSCI Emerging Markets
E-Mini Index | | | 8,595,315 | | | | (218,538 | ) |
| | 12-21-12 | | 473 Short | | Russell 2000
E-Mini Index | | | 38,819,110 | | | | 1,012,651 | |
| | 3-19-13 | | 27 Long | | 10-Year
U.S. Treasury Notes | | | 3,608,297 | | | | 11,099 | |
| | | 3-19-13 | | 498 Short | | 30-Year
U.S. Treasury Bonds | | | 74,731,125 | | | | (251,322 | ) |
WealthBuilder Growth Balanced Portfolio | | 12-20-12 | | 769 Long | | S&P 500 Index | | | 271,918,400 | | | | (3,508,889 | ) |
| | 12-21-12 | | 829 Short | | MSCI EAFE E-Mini Index | | | 64,632,985 | | | | (414,244 | ) |
| | 12-21-12 | | 257 Short | | MSCI Emerging Markets
E-Mini Index | | | 12,918,105 | | | | (328,446 | ) |
| | 12-21-12 | | 713 Short | | Russell 2000
E-Mini Index | | | 58,515,910 | | | | 1,541,506 | |
| | | | | | |
| Notes to financial statements (unaudited) | | Wells Fargo Advantage WealthBuilder Portfolios | | | 47 | |
| | | | | | | | | | | | | | |
| | | Expiration date | | Contracts | | Type | | Contract value at November 30, 2012 | | | Unrealized
gains (losses) | |
WealthBuilder Growth Balanced Portfolio (continued) | | 3-19-13 | | 24 Long | | 10-Year U.S.
Treasury Notes | | $ | 3,207,375 | | | $ | 9,866 | |
| | | 3-19-13 | | 715 Short | | 30-Year
U.S. Treasury Bonds | | | 107,294,688 | | | | (357,574 | ) |
WealthBuilder Growth Allocation Portfolio | | 12-20-12 | | 353 Long | | S&P 500 Index | | | 124,820,800 | | | | (1,610,712 | ) |
| | 12-21-12 | | 406 Short | | MSCI EAFE
E-Mini Index | | | 31,653,790 | | | | (200,463 | ) |
| | 12-21-12 | | 126 Short | | MSCI
Emerging MarketsE-Mini Index | | | 6,333,390 | | | | (161,028 | ) |
| | 12-21-12 | | 350 Short | | Russell 2000
E-Mini Index | | | 28,724,500 | | | | 756,700 | |
| | 3-19-13 | | 5 Long | | 10-Year
U.S. Treasury Notes | | | 668,203 | | | | 2,055 | |
| | | 3-19-13 | | 289 Short | | 30-Year
U.S. Treasury Bonds | | | 43,368,063 | | | | (144,179 | ) |
WealthBuilder Tactical Equity Portfolio | | 12-20-12 | | 380 Long | | S&P 500 Index | | | 134,368,000 | | | | (1,733,912 | ) |
| | 12-21-12 | | 681 Short | | MSCI EAFE E-Mini
Index | | | 53,094,165 | | | | (323,211 | ) |
| | 12-21-12 | | 211 Short | | MSCI Emerging
Markets E-Mini
Index | | | 10,605,915 | | | | (269,658 | ) |
| | | 12-21-12 | | 586 Short | | Russell 2000
E-Mini Index | | | 48,093,020 | | | | 1,266,932 | |
The Portfolios had average notional amounts in futures contracts outstanding during the six months ended November 30, 2012 as follows:
| | | | | | | | |
| | | Long contracts | | | Short contracts | |
WealthBuilder Conservative Allocation Portfolio | | $ | 83,798,723 | | | $ | 74,496,584 | |
WealthBuilder Moderate Balanced Portfolio | | | 179,314,100 | | | | 160,821,615 | |
WealthBuilder Growth Balanced Portfolio | | | 271,968,686 | | | | 241,198,155 | |
WealthBuilder Growth Allocation Portfolio | | | 123,726,612 | | | | 109,422,284 | |
WealthBuilder Tactical Equity Portfolio | | | 135,806,417 | | | | 115,076,163 | |
A summary of derivative instruments by primary risk exposure is outlined in the following tables.
The fair value of derivative instruments as of November 30, 2012 was as follows for WealthBuilder Conservative Allocation Portfolio:
| | | | | | | | | | | | |
| | | Asset derivatives | | | Liability derivatives | |
| | | Balance sheet location | | Fair value | | | Balance sheet location | | Fair value | |
Interest rate contracts | | Net assets – Net unrealized gains on investments | | $ | 7,399 | * | | Net assets – Net unrealized gains on investments | | $ | 115,956 | * |
Equity contracts | | Net assets – Net unrealized gains on investments | | | 465,249 | * | | Net assets – Net unrealized gains on investments | | | 1,299,990 | * |
| | | | | $ | 472,648 | | | | | $ | 1,415,946 | |
| * | Amount represents cumulative unrealized gains/losses on futures contracts. Only the variation margin as of November 30, 2012 is reported separately on the Statement of Assets and Liabilities. |
| | | | |
| 48 | | Wells Fargo Advantage WealthBuilder Portfolios | | Notes to financial statements (unaudited) |
The effect of derivative instruments on the Statement of Operations for the six months ended November 30, 2012 was as follows for WealthBuilder Conservative Allocation Portfolio:
| | | | | | | | |
| | | Amount of realized
gains (losses) on
derivatives | | | Change in unrealized
gains (losses) on
derivatives | |
Interest rate contracts | | $ | (702,680 | ) | | $ | 498,468 | |
Equity contracts | | | 4,152,589 | | | | (2,138,644 | ) |
| | | $ | 3,449,909 | | | $ | (1,640,176 | ) |
The fair value of derivative instruments as of November 30, 2012 was as follows for WealthBuilder Moderate Balanced Portfolio:
| | | | | | | | | | | | |
| | | Asset derivatives | | | Liability derivatives | |
| | | Balance sheet location | | Fair value | | | Balance sheet location | | Fair value | |
Interest rate contracts | | Net assets – Net unrealized gains on investments | | $ | 11,099 | * | | Net assets – Net unrealized gains on investments | | $ | 251,322 | * |
Equity contracts | | Net assets – Net unrealized gains on investments | | | 1,012,651 | * | | Net assets – Net unrealized gains on investments | | | 2,820,387 | * |
| | | | | $ | 1,023,750 | | | | | $ | 3,071,709 | |
| * | Amount represents cumulative unrealized gains/losses on futures contracts. Only the variation margin as of November 30, 2012 is reported separately on the Statement of Assets and Liabilities. |
The effect of derivative instruments on the Statement of Operations for the six months ended November 30, 2012 was as follows for WealthBuilder Moderate Balanced Portfolio:
| | | | | | | | |
| | | Amount of realized
gains (losses) on
derivatives | | | Change in unrealized
gains (losses) on
derivatives | |
Interest rate contracts | | $ | (1,529,138 | ) | | $ | 1,069,377 | |
Equity contracts | | | 8,819,973 | | | | (4,552,703 | ) |
| | | $ | 7,290,835 | | | $ | (3,483,326 | ) |
The fair value of derivative instruments as of November 30, 2012 was as follows for WealthBuilder Growth Balanced Portfolio:
| | | | | | | | | | | | |
| | | Asset derivatives | | | Liability derivatives | |
| | | Balance sheet location | | Fair value | | | Balance sheet location | | Fair value | |
Interest rate contracts | | Net assets – Net unrealized gains on investments | | $ | 9,866 | * | | Net assets – Net unrealized gains on investments | | $ | 357,574 | * |
Equity contracts | | Net assets – Net unrealized gains on investments | | | 1,541,506 | * | | Net assets – Net unrealized gains on investments | | | 4,251,579 | * |
| | | | | $ | 1,551,372 | | | | | $ | 4,609,153 | |
| * | Amount represents cumulative unrealized gains/losses on futures contracts. Only the variation margin as of November 30, 2012 is reported separately on the Statement of Assets and Liabilities. |
The effect of derivative instruments on the Statement of Operations for the six months ended November 30, 2012 was as follows for WealthBuilder Growth Balanced Portfolio:
| | | | | | | | |
| | | Amount of realized
gains (losses) on
derivatives | | | Change in unrealized
gains (losses) on
derivatives | |
Interest rate contracts | | $ | (2,259,917 | ) | | $ | 1,574,160 | |
Equity contracts | | | 13,741,826 | | | | (7,286,021 | ) |
| | | $ | 11,481,909 | | | $ | (5,711,861 | ) |
| | | | | | |
| Notes to financial statements (unaudited) | | Wells Fargo Advantage WealthBuilder Portfolios | | | 49 | |
The fair value of derivative instruments as of November 30, 2012 was as follows for WealthBuilder Growth Allocation Portfolio:
| | | | | | | | | | | | |
| | | Asset derivatives | | | Liability derivatives | |
| | | Balance sheet location | | Fair value | | | Balance sheet location | | Fair value | |
Interest rate contracts | | Net assets – Net unrealized gains on investments | | $ | 2,055 | * | | Net assets – Net unrealized gains on investments | | $ | 144,179 | * |
Equity contracts | | Net assets – Net unrealized gains on investments | | | 756,700 | * | | Net assets – Net unrealized gains on investments | | | 1,972,203 | * |
| | | | | $ | 758,755 | | | | | $ | 2,116,382 | |
| * | Amount represents cumulative unrealized gains/losses on futures contracts. Only the variation margin as of November 30, 2012 is reported separately on the Statement of Assets and Liabilities. |
The effect of derivative instruments on the Statement of Operations for the six months ended November 30, 2012 was as follows for WealthBuilder Growth Allocation Portfolio:
| | | | | | | | |
| | | Amount of realized
gains (losses) on
derivatives | | | Change in unrealized
gains (losses) on
derivatives | |
Interest rate contracts | | $ | (920,247 | ) | | $ | 636,404 | |
Equity contracts | | | 6,185,985 | | | | (3,824,759 | ) |
| | | $ | 5,265,738 | | | $ | (3,188,355 | ) |
On November 30, 2012, the cumulative unrealized losses on futures contracts with equity risk in the amount of $1,059,849 is reflected in net unrealized losses on investments on the Statement of Assets and Liabilities for WealthBuilder Tactical Equity Portfolio. The receivable for daily variation margin on open futures contracts reflected in the Statements of Assets and Liabilities only represents the current day’s variation margin. The realized gains (losses) and change in unrealized gains (losses) on futures contracts are reflected in the Statements of Operations.
8. BANK BORROWINGS
The Trust (excluding the money market funds and certain other funds in the Trust) and Wells Fargo Variable Trust are parties to a $150,000,000 revolving credit agreement with State Street Bank and Trust Company, whereby the Portfolios are permitted to use bank borrowings for temporary or emergency purposes, such as to fund shareholder redemption requests. Interest under the credit agreement is charged to each Portfolio based on a borrowing rate equal to the higher of the Federal Funds rate in effect on that day plus 1.25% or the overnight LIBOR rate in effect on that day plus 1.25%. In addition, an annual commitment fee equal to 0.10% of the unused balance is allocated to each participating fund. For the six months ended November 30, 2012, the Portfolios paid the following amounts in commitment fees:
| | | | |
| | | Commitment fee | |
WealthBuilder Conservative Allocation Portfolio | | $ | 447 | |
WealthBuilder Moderate Balanced Portfolio | | | 481 | |
WealthBuilder Growth Balanced Portfolio | | | 630 | |
WealthBuilder Growth Allocation Portfolio | | | 255 | |
WealthBuilder Equity Portfolio | | | 101 | |
WealthBuilder Tactical Equity Portfolio | | | 318 | |
For the six months ended November 30, 2012, there were no borrowings by the Portfolios under the agreement.
9. INDEMNIFICATION
Under the Trust’s organizational documents, the officers and directors are indemnified against certain liabilities that may arise out of performance of their duties to the Trust. Additionally, in the normal course of business, the Trust may enter into contracts with service providers that contain a variety of indemnification clauses. The Trust’s maximum exposure under these arrangements is dependent on future claims that may be made against the Portfolios and, therefore, cannot be estimated.
| | | | |
| 50 | | Wells Fargo Advantage WealthBuilder Portfolios | | Notes to financial statements (unaudited) |
10. NEW ACCOUNTING PRONOUNCEMENT
In December 2011, the Financial Accounting Standards Board (“FASB”) issued Accounting Standard Update (“ASU”) No. 2011-11, Disclosures about Offsetting Assets and Liabilities. ASU 2011-11, which amends FASB ASC Topic 210, Balance Sheet, creates new disclosure requirements which require entities to disclose both gross and net information for derivatives and other financial instruments that are either offset in the Statement of Assets and Liabilities or subject to an enforceable master netting arrangement or similar agreement. The disclosure requirements are effective for interim and annual reporting periods beginning on or after January 1, 2013. Management is currently assessing the potential impact, in addition to expanded financial statement disclosure, that may result from adopting this ASU.
11. SUBSEQUENT DISTRIBUTIONS
On December 10, 2012, the Portfolios declared distributions from short-term capital gains and long-term capital gains to shareholders of record on December 7, 2012. The per share amounts payable on December 11, 2012 were as follows:
| | | | | | | | |
| | | Short-term capital gains | | | Long-term capital gains | |
WealthBuilder Conservative Allocation Portfolio | | $ | 0.10256 | | | $ | 0.08272 | |
WealthBuilder Moderate Balanced Portfolio | | $ | 0.04185 | | | $ | 0.07397 | |
On December 28, 2012, the Portfolios declared distributions from net investment income to shareholders of record on December 27, 2012. The per share amounts payable on December 31, 2012 were as follows:
| | | | |
| | | Net investment income | |
WealthBuilder Conservative Allocation Portfolio | | $ | 0.03526 | |
WealthBuilder Moderate Balanced Portfolio | | $ | 0.00800 | |
WealthBuilder Growth Balanced Portfolio | | $ | 0.02560 | |
WealthBuilder Growth Allocation Portfolio | | $ | 0.00574 | |
WealthBuilder Tactical Equity Portfolio | | $ | 0.02163 | |
These distributions are not reflected in the accompanying financial statements.
| | | | | | |
| Other information (unaudited) | | Wells Fargo Advantage WealthBuilder Portfolios | | | 51 | |
PROXY VOTING INFORMATION
A description of the policies and procedures that the Portfolios use to determine how to vote proxies relating to portfolio securities is available without charge, upon request, by calling 1-800-222-8222, visiting our website at wellsfargoadvantagefunds.com, or visiting the SEC website at sec.gov. Information regarding how the Portfolios voted proxies relating to portfolio securities during the most recent 12-month period ended June 30 is available without charge on the Portfolios’ website at wellsfargoadvantagefunds.com or by visiting the SEC website at sec.gov.
PORTFOLIO HOLDINGS INFORMATION
The complete portfolio holdings for the Portfolios are publicly available on the Portfolios’ website (wellsfargoadvantagefunds.com) on a monthly, 30-day or more delayed basis. In addition, top ten holdings information is publicly available on the Portfolios’ website on a monthly, seven-day or more delayed basis. Each Portfolio files its complete schedule of portfolio holdings with the SEC for the first and third quarters of each fiscal year on Form N-Q, which is available without charge by visiting the SEC website at sec.gov. In addition, each Portfolio’s Form N-Q may be reviewed and copied at the SEC’s Public Reference Room in Washington, DC, and at regional offices in New York City, at 233 Broadway, and in Chicago, at 175 West Jackson Boulevard, Suite 900. Information about the Public Reference Room may be obtained by calling 1-800-SEC-0330.
| | | | |
| 52 | | Wells Fargo Advantage WealthBuilder Portfolios | | Other information (unaudited) |
BOARD OF TRUSTEES AND OFFICERS
Each of the Trustees and Officers listed in the table below acts in identical capacities for the Wells Fargo Advantage family of funds, which consists of 138 funds1 comprising the Wells Fargo Funds Trust, Wells Fargo Variable Trust, Wells Fargo Master Trust and four closed-end funds (collectively the “Fund Complex”). This table should be read in conjunction with the Prospectus and the Statement of Additional Information2. All of the Trustees are also Members of the Audit and Governance Committees of each Trust in the Fund Complex. The mailing address of each Trustee and Officer is 525 Market Street, 12th Floor, San Francisco, CA 94105. Each Trustee and Officer serves an indefinite term, however, each Trustee serves such term until reaching the mandatory retirement age established by the Trustees.
Independent Trustees
| | | | | | |
Name and year of birth | | Position held and length of service* | | Principal occupations during past five years | | Other directorships during
past five years |
Peter G. Gordon
(Born 1942) | | Trustee, since 1998; Chairman, since 2005 | | Co-Founder, Retired Chairman, President and CEO of Crystal Geyser Water Company. Trustee Emeritus, Colby College. | | Asset Allocation Trust |
Isaiah Harris, Jr.
(Born 1952) | | Trustee, since 2009 | | Retired. Prior thereto, President and CEO of BellSouth Advertising and Publishing Corp. from 2005 to 2007. Emeritus member of the Iowa State University Foundation Board of Governors. Emeritus Member of the Advisory Board of Iowa State University School of Business. Mr. Harris is a certified public accountant. | | CIGNA Corporation; Deluxe Corporation; Asset Allocation Trust |
Judith M. Johnson
(Born 1949) | | Trustee, since 2008; Audit Committee Chairman, since 2008 | | Retired. Prior thereto, Chief Executive Officer and Chief Investment Officer of Minneapolis Employees Retirement Fund from 1996 to 2008. Ms. Johnson is an attorney, certified public accountant and a certified managerial accountant. | | Asset Allocation Trust |
Leroy Keith, Jr.
(Born 1939) | | Trustee, since 2010 | | Chairman, Bloc Global Services (development and construction). Trustee of the Evergreen Funds from 1983 to 2010. Former Managing Director, Almanac Capital Management (commodities firm), former Partner, Stonington Partners, Inc. (private equity fund), former Director, Obagi Medical Products Co. and former Director, Lincoln Educational Services. | | Trustee, Virtus Fund Complex (consisting of 40 portfolios as of 12/31/11); Asset Allocation Trust |
David F. Larcker
(Born 1950) | | Trustee, since 2009 | | James Irvin Miller Professor of Accounting at the Graduate School of Business, Stanford University, Director of Corporate Governance Research Program and Senior Faculty of The Rock Center for Corporate Governance since 2006. From 2005 to 2008, Professor of Accounting at the Graduate School of Business, Stanford University. | | Asset Allocation Trust |
Olivia S. Mitchell
(Born 1953) | | Trustee, since 2006 | | International Foundation of Employee Benefit Plans Professor, Wharton School of the University of Pennsylvania since 1993. Director of Wharton’s Pension Research Council and Boettner Center on Pensions & Retirement Research, and Research Associate at the National Bureau of Economic Research. | | Asset Allocation Trust |
Timothy J. Penny
(Born 1951) | | Trustee, since 1996 | | President and CEO of Southern Minnesota Initiative Foundation, a non-profit organization, since 2007 and Senior Fellow at the Humphrey Institute Policy Forum at the University of Minnesota since 1995. Member of the Board of Trustees of NorthStar Education Finance, Inc., a non-profit organization, since 2007. | | Asset Allocation Trust |
| | | | | | |
| Other information (unaudited) | | Wells Fargo Advantage WealthBuilder Portfolios | | | 53 | |
| | | | | | |
Name and year of birth | | Position held and length of service* | | Principal occupations during past five years | | Other directorships during
past five years |
Michael S. Scofield
(Born 1943) | | Trustee, since 2010 | | Served on the Investment Company Institute’s Board of Governors and Executive Committee from 2008-2011 as well the Governing Council of the Independent Directors Council from 2006-2011 and the Independent Directors Council Executive Committee from 2008-2011. Chairman of the IDC from 2008-2010. Institutional Investor (Fund Directions) Trustee of Year in 2007. Trustee of the Evergreen Funds (and its predecessors) from 1984 to 2010. Chairman of the Evergreen Funds from 2000-2010. Former Trustee of the Mentor Funds. Retired Attorney, Law Offices of Michael S. Scofield. | | Asset Allocation Trust |
Donald C. Willeke
(Born 1940) | | Trustee, since 1996 | | Principal of the law firm of Willeke & Daniels. General Counsel of the Minneapolis Employees Retirement Fund from 1984 until its consolidation into the Minnesota Public Employees Retirement Association on June 30, 2010. Director, General Counsel, and Vice Chair of The Tree Trust (non-profit corporation). Director and General Counsel of The American Chestnut Foundation (non-profit corporation). | | Asset Allocation Trust |
| * | Length of service dates reflect the Trustee’s commencement of service with the Trust’s predecessor entities, where applicable. |
Officers
| | | | | | |
Name and year of birth | | Position held and
length of service | | Principal occupations during past five years | | |
Karla M. Rabusch
(Born 1959) | | President, since 2003 | | Executive Vice President of Wells Fargo Bank, N.A. and President of Wells Fargo Funds Management, LLC since 2003. | | |
Jeremy DePalma1
(Born 1974) | | Treasurer, since 2012; | | Senior Vice President of Wells Fargo Funds Management, LLC since 2009. Senior Vice President of Evergreen Investment Management Company, LLC from 2008 to 2010. Vice President, Evergreen Investment Services, Inc. from 2004 to 2007. Head of the Fund Reporting and Control Team within Fund Administration from 2005 to 2010. | | |
C. David Messman
(Born 1960) | | Secretary, since 2000; Chief Legal Officer, since 2003 | | Senior Vice President and Secretary of Wells Fargo Funds Management, LLC since 2001. Vice President and Managing Counsel of Wells Fargo Bank, N.A. since 1996. | | |
Debra Ann Early
(Born 1964) | | Chief Compliance Officer, since 2007 | | Chief Compliance Officer of Wells Fargo Funds Management, LLC since 2007. Chief Compliance Officer of Parnassus Investments from 2005 to 2007. Chief Financial Officer of Parnassus Investments from 2004 to 2007. | | |
David Berardi
(Born 1975) | | Assistant Treasurer, since 2009 | | Vice President of Wells Fargo Funds Management, LLC since 2009. Vice President of Evergreen Investment Management Company, LLC from 2008 to 2010. Assistant Vice President of Evergreen Investment Services, Inc. from 2004 to 2008. Manager of Fund Reporting and Control for Evergreen Investment Management Company, LLC from 2004 to 2010. | | |
| 1. | Jeremy DePalma acts as Treasurer of 61 funds and Assistant Treasurer of 77 funds in the Fund Complex. |
| 2. | The Statement of Additional Information includes additional information about the Trustees and is available, without charge, upon request, by calling
1-800-222-8222 or by visiting the website at wellsfargoadvantagefunds.com. |
| | | | |
| 54 | | Wells Fargo Advantage WealthBuilder Portfolios | | List of abbreviations |
The following is a list of common abbreviations for terms and entities that may have appeared in this report.
| ACB | — Agricultural Credit Bank |
| ADR | — American depositary receipt |
| ADS | — American depositary shares |
| AGC-ICC | — Assured Guaranty Corporation - Insured Custody Certificates |
| AGM | — Assured Guaranty Municipal |
| AMBAC | — American Municipal Bond Assurance Corporation |
| AMT | — Alternative minimum tax |
| BAN | — Bond anticipation notes |
| BHAC | — Berkshire Hathaway Assurance Corporation |
| CAB | — Capital appreciation bond |
| CCAB | — Convertible capital appreciation bond |
| CDA | — Community Development Authority |
| CDO | — Collateralized debt obligation |
| COP | — Certificate of participation |
| DRIVER | — Derivative inverse tax-exempt receipts |
| DW&P | — Department of Water & Power |
| DWR | — Department of Water Resources |
| ECFA | — Educational & Cultural Facilities Authority |
| EDA | — Economic Development Authority |
| EDFA | — Economic Development Finance Authority |
| ETF | — Exchange-traded fund |
| FDIC | — Federal Deposit Insurance Corporation |
| FFCB | — Federal Farm Credit Banks |
| FGIC | — Financial Guaranty Insurance Corporation |
| FGLMC | — Federal Government Loan Mortgage Corporation |
| FHA | — Federal Housing Administration |
| FHLB | — Federal Home Loan Bank |
| FHLMC | — Federal Home Loan Mortgage Corporation |
| FICO | — The Financing Corporation |
| FNMA | — Federal National Mortgage Association |
| GDR | — Global depositary receipt |
| GNMA | — Government National Mortgage Association |
| HCFR | — Healthcare facilities revenue |
| HEFA | — Health & Educational Facilities Authority |
| HEFAR | — Higher education facilities authority revenue |
| HFA | — Housing Finance Authority |
| HFFA | — Health Facilities Financing Authority |
| IBC | — Insured bond certificate |
| IDA | — Industrial Development Authority |
| IDAG | — Industrial Development Agency |
| IDR | — Industrial development revenue |
| KRW | — Republic of Korea won |
| LIBOR | — London Interbank Offered Rate |
| LLC | — Limited liability company |
| LLP | — Limited liability partnership |
| MBIA | — Municipal Bond Insurance Association |
| MFHR | — Multifamily housing revenue |
| MSTR | — Municipal securities trust receipts |
| MUD | — Municipal Utility District |
| NATL-RE | — National Public Finance Guarantee Corporation |
| PCFA | — Pollution Control Financing Authority |
| PCL | — Public Company Limited |
| PCR | — Pollution control revenue |
| PFA | — Public Finance Authority |
| PFFA | — Public Facilities Financing Authority |
| PFOTER | — Puttable floating option tax-exempt receipts |
| plc | — Public limited company |
| PUTTER | — Puttable tax-exempt receipts |
| R&D | — Research & development |
| RDA | — Redevelopment Authority |
| RDFA | — Redevelopment Finance Authority |
| REIT | — Real estate investment trust |
| ROC | — Reset option certificates |
| SAVRS | — Select auction variable rate securities |
| SBA | — Small Business Authority |
| SFHR | — Single-family housing revenue |
| SFMR | — Single-family mortgage revenue |
| SPA | — Standby purchase agreement |
| SPDR | — Standard & Poor’s Depositary Receipts |
| STRIPS | — Separate trading of registered interest and principal securities |
| TAN | — Tax anticipation notes |
| TIPS | — Treasury inflation-protected securities |
| TRAN | — Tax revenue anticipation notes |
| TCR | — Transferable custody receipts |
| TTFA | — Transportation Trust Fund Authority |
| TVA | — Tennessee Valley Authority |
| XLCA | — XL Capital Assurance |


For more information
More information about Wells Fargo Advantage Funds is available free upon request. To obtain literature, please write, email, visit the Fund’s website, or call:
Wells Fargo Advantage Funds
P.O. Box 8266
Boston, MA 02266-8266
Email: wfaf@wellsfargo.com
Website: wellsfargoadvantagefunds.com
Individual investors: 1-800-222-8222
Retail investment professionals: 1-888-877-9275
Institutional investment professionals: 1-866-765-0778
This report and the financial statements contained herein are submitted for the general information of the shareholders of Wells Fargo Advantage Funds. If this report is used for promotional purposes, distribution of the report must be accompanied or preceded by a current prospectus. For a current prospectus and, if available, a summary prospectus containing more complete information, including charges and expenses, call 1-800-222-8222 or visit the Fund’s website at wellsfargoadvantagefunds.com. Please consider the investment objectives, risks, charges, and expenses of the investment carefully before investing. This and other information about Wells Fargo Advantage Funds can be found in the current prospectus. Read the prospectus carefully before you invest or send money.
Wells Fargo Funds Management, LLC, a wholly owned subsidiary of Wells Fargo & Company, provides investment advisory and administrative services for Wells Fargo Advantage Funds. Other affiliates of Wells Fargo & Company provide subadvisory and other services for the Funds. The Funds are distributed by Wells Fargo Funds Distributor, LLC, Member FINRA/SIPC, an affiliate of Wells Fargo & Company.
NOT FDIC INSURED ¡ NO BANK GUARANTEE ¡ MAY LOSE VALUE
© 2013 Wells Fargo Funds Management, LLC. All rights reserved.
| | |
 | | 213712 01-13 SWBP/SAR102 11-12 |
Not required in this filing
| ITEM 3. | AUDIT COMMITTEE FINANCIAL EXPERT |
Not required in this filing.
| ITEM 4. | PRINCIPAL ACCOUNTANT FEES AND SERVICES |
Not required in this filing.
| ITEM 5. | AUDIT COMMITTEE OF LISTED REGISTRANTS |
Not required in this filing.
| ITEM 6. | PORTFOLIO OF INVESTMENTS |
The Portfolio of investments is included as part of the report to shareholders filed under Item 1 of this Form.
| ITEM 7. | DISCLOSURE OF PROXY VOTING POLICIES AND PROCEDURES FOR CLOSED-END MANAGEMENT INVESTMENT COMPANIES |
Not applicable.
| ITEM 8. | PORTFOLIO MANAGERS OF CLOSED-END MANAGEMENT INVESTMENT COMPANIES |
Not applicable.
| ITEM 9. | PURCHASES OF EQUITY SECURITIES BY CLOSED-END MANAGEMENT INVESTMENT COMPANY AND AFFILIATED PURCHASES |
Not applicable.
| ITEM 10. | SUBMISSION OF MATTERS TO A VOTE OF SECURITY HOLDERS |
The Governance Committee (the “Committee”) of the Board of Trustees of the registrant (the “Trust”) has adopted procedures by which a shareholder of any series of the Trust may submit properly a nominee recommendation for the Committee’s consideration.
The shareholder must submit any such recommendation (a “Shareholder Recommendation”) in writing to the Trust, to the attention of the Trust’s Secretary, at the address of the principal executive offices of the Trust.
The Shareholder Recommendation must be delivered to, or mailed and received at, the principal executive offices of the Trust not less than forty-five (45) calendar days nor more than seventy-five (75) calendar days prior to the date of the Committee meeting at which the nominee would be considered.
The Shareholder Recommendation must include: (i) a statement in writing setting forth (A) the name, age, date of birth, business address, residence address and nationality of the person recommended by the shareholder (the “candidate”); (B) the series (and, if applicable, class) and number of all shares of the Trust owned of record or beneficially by the candidate, as reported to such shareholder by the candidate; (C) any other information regarding the candidate called for with respect to director nominees by paragraphs (a), (d), (e) and (f) of Item 401 of Regulation S-K or paragraph (b) of Item 22 of Rule 14a-101 (Schedule 14A) under the Securities Exchange Act of 1934, as amended (the “Exchange Act”), adopted by the Securities and Exchange Commission (or the corresponding provisions of any regulation or rule subsequently adopted by the Securities and Exchange Commission or any successor agency applicable to the Trust); (D) any other information regarding the candidate that would be required to be disclosed if the candidate were a nominee in a proxy statement or other filing required to be made in connection with solicitation of proxies for election of directors pursuant to Section 14 of the Exchange Act and the rules and regulations promulgated thereunder; and (E) whether the recommending shareholder believes that the candidate is or will be an “interested person” of the Trust (as defined in the Investment Company Act of 1940, as amended) and, if not an “interested person,” information regarding the candidate that will be sufficient for the Trust to make such determination; (ii) the written and signed consent of the candidate to be named as a nominee and to serve as a Trustee if elected; (iii) the recommending shareholder’s name as it appears on the Trust’s books; (iv) the series (and, if applicable, class) and number of all shares of the Trust owned beneficially and of record by the recommending shareholder; and (v) a description of all arrangements or understandings between the recommending shareholder and the candidate and any other person or persons (including their names) pursuant to which the recommendation is being made by the recommending shareholder. In addition, the Committee may require the candidate to interview in person and furnish such other information as it may reasonably require or deem necessary to determine the eligibility of such candidate to serve as a Trustee of the Trust.
| ITEM 11. | CONTROLS AND PROCEDURES |
(a) The President and Treasurer have concluded that the Wells Fargo Funds Trust (the “Trust”) disclosure controls and procedures (as defined in Rule 30a-3(c) under the Investment Company Act of 1940) provide reasonable assurances that material information relating to the Trust is made known to them by the appropriate persons, based on their evaluation of these controls and procedures as of a date within 90 days of the filing of this report.
(b) There were no significant changes in the Trust’s internal controls over financial reporting (as defined in Rule 30a-3(d) under the Investment Company Act of 1940) that occurred during the second quarter of the period covered by this report that materially affected, or is reasonably likely to materially affect, the registrant’s internal control over financial reporting.
(a)(1) Not required in this filing.
(a)(2) Certification pursuant to Rule 30a-2(a) under the Investment Company Act of 1940 (17 CFR 270.30a-2(a)) is filed and attached hereto as Exhibit 99.CERT.
(a)(3) Not applicable.
(b) Certification pursuant to Rule 30a-2(b) under the Investment Company Act of 1940 (17 CFR 270.30a-2(b)) is filed and attached hereto as Exhibit 99.906CERT.
SIGNATURES
Pursuant to the requirements of the Securities Exchange Act of 1934 and the Investment Company Act of 1940, the registrant has duly caused this report to be signed on its behalf by the undersigned, thereunto duly authorized.
| | |
| Wells Fargo Funds Trust |
| |
| By: | | |
| | /s/ Karla M. Rabusch |
| |
| | Karla M. Rabusch |
| | President |
| |
| Date: | | January 28, 2013 |
Pursuant to the requirements of the Securities Exchange Act of 1934 and the Investment Company Act of 1940, this report has been signed below by the following persons on behalf of the registrant and in the capacities and on the date indicated.
| | |
| By: | | |
| | /s/ Karla M. Rabusch |
| |
| | Karla M. Rabusch |
| | President |
| |
| Date: | | January 28, 2013 |
| |
| By: | | |
| | /s/ Nancy Wiser |
| |
| | Nancy Wiser |
| | Treasurer |
| |
| Date: | | January 28, 2013 |
| |
| By: | | |
| | /s/ Jeremy DePalma |
| |
| | Jeremy DePalma |
| | Treasurer |
| |
| Date: | | January 28, 2013 |