
UNITED STATES
SECURITIES AND EXCHANGE COMMISSION
Washington, D.C. 20549
FORM N-CSRS
CERTIFIED SHAREHOLDER REPORT OF REGISTERED
MANAGEMENT INVESTMENT COMPANIES
Investment Company Act file number: 811-09253
Wells Fargo Funds Trust
(Exact name of registrant as specified in charter)
525 Market St., San Francisco, CA 94105
(Address of principal executive offices) (Zip code)
C. David Messman
Wells Fargo Funds Management, LLC
525 Market St., San Francisco, CA 94105
(Name and address of agent for service)
Registrant’s telephone number, including area code: 800-222-8222
Date of fiscal year end: July 31, 2012
Date of reporting period: January 31, 2013
| ITEM 1. | REPORT TO SHAREHOLDERS |

Wells Fargo Advantage Capital Growth Fund

Semi-Annual Report
January 31, 2013

Reduce clutter. Save trees.
Sign up for electronic delivery of prospectuses and shareholder reports at wellsfargo.com/advantagedelivery
Contents
The views expressed and any forward-looking statements are as of January 31, 2013, unless otherwise noted, and are those of the Fund managers and/or Wells Fargo Funds Management, LLC. Discussions of individual securities, or the markets generally, or any Wells Fargo Advantage Fund are not intended as individual recommendations. Future events or results may vary significantly from those expressed in any forward-looking statements; the views expressed are subject to change at any time in response to changing circumstances in the market. Wells Fargo Funds Management, LLC, disclaims any obligation to publicly update or revise any views expressed or forward-looking statements.
NOT FDIC INSURED ¡ NO BANK GUARANTEE ¡ MAY LOSE VALUE

Wells Fargo investment history
| | |
| 1932 | | Keystone creates one of the first mutual fund families. |
| 1971 | | Wells Fargo & Company introduces one of the first institutional index funds. |
| 1978 | | Wells Fargo applies Markowitz and Sharpe’s research on Modern Portfolio Theory to introduce one of the industry’s first tactical asset allocation models in institutional separately managed accounts. |
| 1984 | | Wells Fargo Stagecoach Funds launches its first asset allocation fund. |
| 1989 | | The Tactical Asset Allocation (TAA) Model is first applied to Wells Fargo’s asset allocation mutual funds. |
| 1994 | | Wells Fargo introduces the LifePath Funds, one of the first suites of target date funds (now the Wells Fargo Advantage Dow Jones Target Date FundsSM). |
| 1996 | | Evergreen Investments and Keystone Funds merge. |
| 1997 | | Wells Fargo launches the Wells Fargo Advantage WealthBuilder PortfoliosSM, a fund-of-funds suite of products that includes the use of quantitative models to shift assets among investment styles. |
| 1999 | | Norwest Advantage Funds and Stagecoach Funds are reorganized into Wells Fargo Funds after the merger of Norwest and Wells Fargo. |
| 2002 | | Evergreen Retail and Evergreen Institutional companies form the umbrella asset management company, Evergreen Investments. |
| 2005 | | The integration of Strong Funds with Wells Fargo Funds creates Wells Fargo Advantage Funds, resulting in one of the top 20 mutual fund companies in the United States. |
| 2006 | | Wells Fargo Advantage Funds relaunches the target date product line as Wells Fargo Advantage Dow Jones Target Date Funds. |
| 2010 | | The mergers and reorganizations of Evergreen and Wells Fargo Advantage mutual funds are completed, unifying the families under the brand of Wells Fargo Advantage Funds. |
Wells Fargo Advantage Funds®
Wells Fargo Advantage Funds skillfully guides institutions, financial advisors, and individuals through the investment terrain to help them reach their financial objectives. Everything we do on behalf of investors is backed by our unique combination of qualifications.
Strength
Our organization is built on the standards of integrity and service established by our parent company—Wells Fargo & Company—more than 150 years ago. And, because we’re part of a highly diversified financial enterprise, we offer the depth of resources to help investors succeed.
Expertise
Our multi-boutique model offers investors access to the independent thinking of premier investment managers that have been chosen for their time-tested strategies. While each team specializes in a specific investment strategy, collectively they provide investors a wide choice of distinct investment styles. Our dedication to investment excellence doesn’t end with our expertise in manager selection—risk management, analysis, and rigorous ongoing review seek to ensure each manager’s investment process remains consistent.
Partnership
Our collaborative approach is built around understanding the needs and goals of our clients. By adhering to core principles of sound judgment and steady guidance, we support you through every stage of the investment decision process.
Carefully consider the investment objectives, risks, charges, and expenses before investing. For a current prospectus and, if available, a summary prospectus, for Wells Fargo Advantage Funds, containing this and other information, visit wellsfargoadvantagefunds.com. Read it carefully before investing.
Wells Fargo Funds Management, LLC, a wholly owned subsidiary of Wells Fargo & Company, provides investment advisory and administrative services for Wells Fargo Advantage Funds. Other affiliates of Wells Fargo & Company provide subadvisory and other services for the Funds. The Funds are distributed by Wells Fargo Funds Distributor, LLC, Member FINRA/SIPC, an affiliate of Wells Fargo & Company.
“Dow Jones®” and “Dow Jones Target Date IndexesSM” are service marks of Dow Jones Trademark Holdings LLC (“Dow Jones”); have been licensed to CME Group Index Services LLC (“CME Indexes”); and have been sublicensed for use for certain purposes by Global Index Advisors, Inc., and Wells Fargo Funds Management, LLC. The Wells Fargo Advantage Dow Jones Target Date FundsSM, based on the Dow Jones Target Date Indexes, are not sponsored, endorsed, sold, or promoted by Dow Jones, CME Indexes, or their respective affiliates, and none of them makes any representation regarding the advisability of investing in such product(s).
NOT FDIC INSURED ¡ NO BANK GUARANTEE ¡ MAY LOSE VALUE
Not part of the semi-annual report.
Wells Fargo Advantage Funds offers more than 110 mutual funds across a wide range of asset classes, representing over $226 billion in assets under management, as of January 31, 2013.
| | | | |
| Equity funds | | | | |
Asia Pacific Fund | | Enterprise Fund† | | Opportunity Fund† |
C&B Large Cap Value Fund | | Global Opportunities Fund | | Precious Metals Fund |
C&B Mid Cap Value Fund | | Growth Fund | | Premier Large Company Growth Fund |
Capital Growth Fund | | Index Fund | | Small Cap Opportunities Fund |
Common Stock Fund | | International Equity Fund | | Small Cap Value Fund |
Disciplined U.S. Core Fund | | International Value Fund | | Small Company Growth Fund |
Discovery Fund† | | Intrinsic Small Cap Value Fund | | Small Company Value Fund |
Diversified Equity Fund | | Intrinsic Value Fund | | Small/Mid Cap Value Fund |
Diversified International Fund | | Intrinsic World Equity Fund | | Special Mid Cap Value Fund |
Emerging Growth Fund | | Large Cap Core Fund | | Special Small Cap Value Fund |
Emerging Markets Equity Fund | | Large Cap Growth Fund | | Specialized Technology Fund |
Emerging Markets Equity Income Fund | | Large Company Value Fund | | Traditional Small Cap Growth Fund |
Endeavor Select Fund† | | Omega Growth Fund | | Utility and Telecommunications Fund |
| Bond funds | | | | |
Adjustable Rate Government Fund | | High Yield Municipal Bond Fund | | Short Duration Government Bond Fund |
California Limited-Term Tax-Free Fund | | Income Plus Fund | | Short-Term Bond Fund |
California Tax-Free Fund | | Inflation-Protected Bond Fund | | Short-Term High Yield Bond Fund |
Colorado Tax-Free Fund | | Intermediate Tax/AMT-Free Fund | | Short-Term Municipal Bond Fund |
Core Bond Fund | | International Bond Fund | | Strategic Income Fund |
Emerging Markets Local Bond Fund | | Minnesota Tax-Free Fund | | Strategic Municipal Bond Fund |
Government Securities Fund | | Municipal Bond Fund | | Ultra Short-Term Income Fund |
High Income Fund | | North Carolina Tax-Free Fund | | Ultra Short-Term Municipal Income Fund |
High Yield Bond Fund | | Pennsylvania Tax-Free Fund | | Wisconsin Tax-Free Fund |
| Asset allocation funds | | | | |
Absolute Return Fund | | WealthBuilder Equity Portfolio† | | Target 2020 Fund† |
Asset Allocation Fund | | WealthBuilder Growth Allocation Portfolio† | | Target 2025 Fund† |
Conservative Allocation Fund | | WealthBuilder Growth Balanced Portfolio† | | Target 2030 Fund† |
Diversified Capital Builder Fund | | WealthBuilder Moderate Balanced Portfolio† | | Target 2035 Fund† |
Diversified Income Builder Fund | | WealthBuilder Tactical Equity Portfolio† | | Target 2040 Fund† |
Growth Balanced Fund | | Target Today Fund† | | Target 2045 Fund† |
Index Asset Allocation Fund | | Target 2010 Fund† | | Target 2050 Fund† |
Moderate Balanced Fund | | Target 2015 Fund† | | Target 2055 Fund† |
WealthBuilder Conservative Allocation Portfolio† | | | | |
| Money market funds | | | | |
100% Treasury Money Market Fund | | Heritage Money Market Fund† | | National Tax-Free Money Market Fund |
California Municipal Money Market Fund | | Money Market Fund | | Treasury Plus Money Market Fund |
Cash Investment Money Market Fund | | Municipal Cash Management Money Market Fund | | |
Government Money Market Fund | | Municipal Money Market Fund | | |
| Variable trust funds1 | | | | |
VT Discovery Fund† | | VT Intrinsic Value Fund | | VT Small Cap Growth Fund |
VT Index Asset Allocation Fund | | VT Omega Growth Fund | | VT Small Cap Value Fund |
VT International Equity Fund | | VT Opportunity Fund† | | VT Total Return Bond Fund |
An investment in a money market fund is not insured or guaranteed by the Federal Deposit Insurance Corporation or any other government agency. Although the Wells Fargo Advantage Money Market Funds seek to preserve the value of your investment at $1.00 per share, it is possible to lose money by investing in a money market fund.
| 1. | The variable trust funds are generally available only through insurance company variable contracts. |
| † | In this report, the Wells Fargo Advantage Discovery FundSM, Wells Fargo Advantage Endeavor Select FundSM, Wells Fargo Advantage Enterprise FundSM, Wells Fargo Advantage Opportunity FundSM, Wells Fargo Advantage WealthBuilder Conservative Allocation PortfolioSM, Wells Fargo Advantage WealthBuilder Equity PortfolioSM, Wells Fargo Advantage WealthBuilder Growth Allocation PortfolioSM, Wells Fargo Advantage WealthBuilder Growth Balanced PortfolioSM, Wells Fargo Advantage WealthBuilder Moderate Balanced PortfolioSM, Wells Fargo Advantage WealthBuilder Tactical Equity PortfolioSM, Wells Fargo Advantage Dow Jones Target Today FundSM, Wells Fargo Advantage Dow Jones Target 2010 FundSM, Wells Fargo Advantage Dow Jones Target 2015 FundSM, Wells Fargo Advantage Dow Jones Target 2020 FundSM, Wells Fargo Advantage Dow Jones Target 2025 FundSM, Wells Fargo Advantage Dow Jones Target 2030 FundSM, Wells Fargo Advantage Dow Jones Target 2035 FundSM, Wells Fargo Advantage Dow Jones Target 2040 FundSM, Wells Fargo Advantage Dow Jones Target 2045 FundSM, Wells Fargo Advantage Dow Jones Target 2050 FundSM, Wells Fargo Advantage Dow Jones Target 2055 FundSM, Wells Fargo Advantage Heritage Money Market FundSM, Wells Fargo Advantage VT Discovery FundSM, and Wells Fargo Advantage VT Opportunity FundSM are referred to as the Discovery Fund, Endeavor Select Fund, Enterprise Fund, Opportunity Fund, WealthBuilder Conservative Allocation Portfolio, WealthBuilder Equity Portfolio, WealthBuilder Growth Allocation Portfolio, WealthBuilder Growth Balanced Portfolio, WealthBuilder Moderate Balanced Portfolio, WealthBuilder Tactical Equity Portfolio, Target Today Fund, Target 2010 Fund, Target 2015 Fund, Target 2020 Fund, Target 2025 Fund, Target 2030 Fund, Target 2035 Fund, Target 2040 Fund, Target 2045 Fund, Target 2050 Fund, Target 2055 Fund, Heritage Money Market Fund, VT Discovery Fund, and VT Opportunity Fund, respectively. |
Not part of the semi-annual report.
| | | | |
| 2 | | Wells Fargo Advantage Capital Growth Fund | | Letter to shareholders (unaudited) |

Karla M. Rabusch
President
Wells Fargo Advantage Funds
Entering the period, concerns about the eurozone sovereign debt situation held center stage as investors again focused on economic weakness in southern European economies.
Aggressive central bank actions helped support stock prices, as did relatively solid economic data.
Dear Valued Shareholder:
We are pleased to offer you this semi-annual report for the Wells Fargo Advantage Capital Growth Fund for the six-month period that ended January 31, 2013. Much of the period was marked by continued concerns about the possible effects that the ongoing European sovereign debt crisis would have on the global economy. However, relatively solid economic data in the U.S. and efforts by European authorities to address the sovereign debt issue alleviated investor fears and supported global stock markets. Judging by various indexes, U.S. large-cap stocks underperformed small-cap stocks. Within the large-cap universe, value stocks outperformed growth stocks, partly because of strong performance from the financials sector.
The period was dominated by worries that ongoing debt problems in the eurozone would affect global economic growth.
Entering the period, concerns about the eurozone sovereign debt situation held center stage as investors again focused on economic weakness in southern European economies. Because many eurozone banks owned southern European debt and many U.S. banks had financial ties to eurozone banks, investors worried about the effects of a possible southern European debt default on the global financial system and economy. Ongoing weakness in the Greek economy made it difficult for the country to meet previously agreed upon austerity targets. Toward the end of the reporting period, political risk resurfaced in both Italy and Spain. In Italy, Prime Minister Mario Monti, an economist who was appointed to implement austerity measures and labor market reforms, resigned in December 2012. Monti later decided to run for office in the general election scheduled for February 2013.
European leaders took concerted action to calm investor concerns. In September 2012, the European Central Bank (ECB) announced that it would purchase an unlimited amount of one- to three-year sovereign debt from countries that had applied for a formal bailout through either the European Financial Stability Facility or the European Stability Mechanism. In another positive sign, in late November 2012, finance ministers from the 17-country eurozone and the International Monetary Fund struck a deal aimed at reducing Greece’s debt by the year 2020.
Central banks continued to provide stimulus.
Major central banks, including the U.S. Federal Reserve (Fed) and the ECB, continued to inject liquidity into the banks and the markets through various quantitative easing policies. Throughout the reporting period, the Federal Open Market Committee (FOMC) kept its key interest rates effectively at zero in order to support the economy and the financial system. The ECB was similarly aggressive, keeping its key rate at a historic low of 0.75%. Just prior to the beginning of the reporting period, the FOMC announced its intention to keep interest rates low until at least mid-2015 in order to support the sluggish economy. The Fed also announced open-ended purchases of $40 billion per month in mortgage-backed securities in an effort to support the housing market.
Stock markets posted solid gains in an eventful period.
Aggressive central bank actions helped support stock prices, as did relatively solid economic data. For much of the reporting period, the U.S. stock market benefited from favorable gross domestic product (GDP) data, with the growth rate improving from 1.3% (annualized) in the second quarter of 2012 to 3.1% (annualized) in the third quarter of 2012. However, the GDP growth rate slowed in the final months of 2012, with GDP growth coming in at 0.1% (annualized) in the fourth quarter of 2012. Because many investors attributed the weak number to the aftereffects of Hurricane Sandy on the eastern seaboard, the stock market remained resilient.
| | | | | | |
| Letter to shareholders (unaudited) | | Wells Fargo Advantage Capital Growth Fund | | | 3 | |
The steady improvement in the housing market supported investor sentiment. The National Association of Home Builders/First American Improving Markets Index identifies metro areas that have shown improvement from their respective troughs in housing permits, employment, and house prices for at least six consecutive months. The index rose for a fifth-consecutive month in January 2013, indicating improvements in 242 housing markets across the country. As a result, housing-related stocks strongly outperformed over the period, leading to better-than-index returns for sectors ranging from consumer discretionary (home improvement retailers), to materials (construction material providers), and to financials (mortgage lenders).
Throughout the period, a continued high unemployment rate was the main negative piece of U.S. economic data. Although the unemployment rate improved from 8.1% in August 2012 to 7.9% in January 2013, the labor market remained soft are only counted as unemployed if they are officially looking for work.)
We remain committed to our investment strategies, even as many variables are at work in the market.
The full effect of the European credit crisis remains unknown. Elevated unemployment and debt defaults continue to pressure consumers and businesses alike. As a whole, Wells Fargo Advantage Funds represents investments across a range of asset classes and investment styles, giving you an opportunity to create a diversified investment portfolio. While diversification may not prevent losses in a downturn, we believe it helps manage risk.
Thank you for choosing to invest with Wells Fargo Advantage Funds. We appreciate your confidence in us and remain committed to helping you meet your financial needs. For current information about your fund investments, contact your investment professional, visit our website at wellsfargoadvantagefunds.com, or call us directly at 1-800-222-8222. We are available 24 hours a day, 7 days a week.
Sincerely,

Karla M. Rabusch
President
Wells Fargo Advantage Funds
Notice to shareholders
At its November 6-7, 2012 meeting, the Board of Trustees unanimously approved the following modifications to certain Class A sales load waiver privileges, with each change becoming effective on July 1, 2013:
| | n | | Annuity payments received under an annuity option or from death proceeds will no longer qualify for net asset value (NAV) repurchase privileges. | |
| | n | | The ability to reinvest redemption proceeds at NAV will be reduced from 120 days to 90 days. | |
| | n | | NAV purchase privileges for certain types of “grandfathered” shareholders will be modified to remove the ability to purchase Class A shares at NAV, unless those shares are held directly with the Fund. | |
Please contact your investment professional or call us directly at 1-800-222-8222 if you have any questions on this Notice to Shareholders.
| | | | |
| 4 | | Wells Fargo Advantage Capital Growth Fund | | Performance highlights (unaudited) |
Investment objective
The Fund seeks long-term capital appreciation.
Adviser
Wells Fargo Funds Management, LLC
Subadviser
Wells Capital Management Incorporated
Portfolio managers
Thomas J. Pence, CFA
Michael T. Smith, CFA
Average annual total returns1 (%) as of January 31, 2013
| | | | | | | | | | | | | | | | | | | | | | | | |
| | | | | Including sales charge | | Excluding sales charge | | | Expense ratios2 (%) |
| | | Inception date | | 1 year | | 5 year | | 10 year | | 1 year | | | 5 year | | | 10 year | | | Gross | | Net3 |
| Class A (WFCGX) | | 7-31-2007 | | 6.40 | | 0.66 | | 6.48 | | | 12.88 | | | | 1.85 | | | | 7.11 | | | 1.21 | | 1.11 |
| Class C (WFCCX) | | 7-31-2007 | | 11.09 | | 1.10 | | 6.40 | | | 12.09 | | | | 1.10 | | | | 6.40 | | | 1.96 | | 1.86 |
| Class R4 (WCGRX) | | 11-30-2012 | | – | | – | | – | | | 13.40 | | | | 2.35 | | | | 7.64 | | | 0.88 | | 0.75 |
| Class R6 (WFCRX) | | 11-30-2012 | | – | | – | | – | | | 13.48 | | | | 2.37 | | | | 7.65 | | | 0.73 | | 0.60 |
| Administrator Class (WFCDX) | | 6-30-2003 | | – | | – | | – | | | 13.14 | | | | 2.13 | | | | 7.48 | | | 1.05 | | 0.90 |
| Institutional Class (WWCIX) | | 4-8-2005 | | – | | – | | – | | | 13.50 | | | | 2.37 | | | | 7.65 | | | 0.78 | | 0.65 |
| Investor Class (SLGIX) | | 11-3-1997 | | – | | – | | – | | | 12.82 | | | | 1.77 | | | | 7.05 | | | 1.27 | | 1.17 |
| Russell 1000® Growth Index4 | | – | | – | | – | | – | | | 13.43 | | | | 5.70 | | | | 8.24 | | | – | | – |
Figures quoted represent past performance, which is no guarantee of future results and do not reflect the deduction of taxes that a shareholder may pay on fund distributions or the redemption of fund shares. Investment return and principal value of an investment will fluctuate so that an investor’s shares, when redeemed, may be worth more or less than their original cost. Performance shown without sales charges would be lower if sales charges were reflected. Current performance may be lower or higher than the performance data quoted and assumes the reinvestment of dividends and capital gains. Current month-end performance is available on the Fund’s website, wellsfargoadvantagefunds.com.
Index returns do not include transaction costs associated with buying and selling securities, any mutual fund fees or expenses, or any taxes. It is not possible to invest directly in an index.
For Class A shares, the maximum front-end sales charge is 5.75%. For Class C shares, the maximum contingent deferred sales charge is 1.00%. Performance including sales charge assumes the sales charge for the corresponding time period. Class R4, Class R6, Administrator Class, Institutional Class, and Investor Class shares are sold without a front-end sales charge or contingent deferred sales charge.
Stock values fluctuate in response to the activities of individual companies and general market and economic conditions. Certain investment strategies tend to increase the total risk of an investment (relative to the broader market). This Fund is exposed to foreign investment risk. Consult the Fund’s prospectus for additional information on these and other risks.
Please see footnotes on page 5.
| | | | | | |
| Performance highlights (unaudited) | | Wells Fargo Advantage Capital Growth Fund | | | 5 | |
| | | | |
| Ten largest equity holdings5 (%) as of January 31, 2013 | |
Apple Incorporated | | | 6.02 | |
Google Incorporated Class A | | | 3.74 | |
eBay Incorporated | | | 2.77 | |
Visa Incorporated Class A | | | 2.66 | |
Union Pacific Corporation | | | 2.33 | |
Amazon.com Incorporated | | | 2.23 | |
Home Depot Incorporated | | | 2.18 | |
Monsanto Company | | | 2.18 | |
Gilead Sciences Incorporated | | | 2.11 | |
Dollar General Corporation | | | 2.10 | |
|
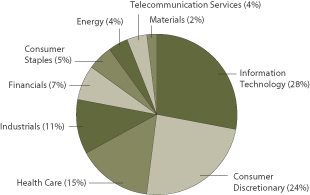
| Sector distribution6 as of January 31, 2013 |
|
 |
| 1. | Historical performance shown for Class R4 shares prior to their inception reflects the performance of the Institutional Class shares, adjusted to reflect the higher expenses applicable to Class R4 shares. Historical performance shown for the Class R6 shares prior to their inception reflects the performance of the Institutional Class shares, and includes the higher expenses applicable to the Institutional Class shares. If these expenses had not been included, returns would be higher. Historical performance shown for Class A and Administrator Class shares prior to their inception reflects the performance of the Investor Class shares, and includes the higher expenses applicable to the Investor Class shares. If these expenses had not been included, returns would be higher. Historical performance shown for Class C shares prior to their inception reflects the performance of the Investor Class shares, adjusted to reflect the higher expenses applicable to Class C shares. Historical performance shown for the Institutional Class shares prior to their inception reflects the performance of the Administrator Class shares, and includes the higher expenses applicable to the Administrator Class shares. If these expenses had not been included, returns would be higher. |
| 2. | Reflects the expense ratios as stated in the most recent prospectuses. |
| 3. | The Adviser has committed through November 30, 2014, to waive fees and/or reimburse expenses to the extent necessary to cap the Fund’s Total Annual Fund Operating Expenses After Fee Waiver, excluding certain expenses, at the amounts shown. Brokerage commissions, stamp duty fees, interest, taxes, acquired fund fees and expenses, and extraordinary expenses are excluded from the cap. Without this cap, the Fund’s returns would have been lower. |
| 4. | The Russell 1000® Growth Index measures the performance of those Russell 1000 Index companies with higher price-to-book ratios and higher forecasted growth values. You cannot invest directly in an index. |
| 5. | The ten largest equity holdings are calculated based on the value of the securities divided by total net assets of the Fund. Holdings are subject to change and may have changed since the date specified. |
| 6. | Sector distribution is subject to change and is calculated based on the total long-term investments of the Fund. |
| | | | |
| 6 | | Wells Fargo Advantage Capital Growth Fund | | Fund expenses (unaudited) |
As a shareholder of the Fund, you incur two types of costs: (1) transaction costs, including sales charges (loads) on purchase payments and contingent deferred sales charges (if any) on redemptions and (2) ongoing costs, including management fees, distribution (12b-1) and/or shareholder service fees, and other Fund expenses. This example is intended to help you understand your ongoing costs (in dollars) of investing in the Fund and to compare these costs with the ongoing costs of investing in other mutual funds.
The example is based on an investment of $1,000 invested at the beginning of the six-month period and held for the entire period from August 1, 2012 to January 31, 2013.
Actual expenses
The “Actual” line of the table below provides information about actual account values and actual expenses. You may use the information in this line, together with the amount you invested, to estimate the expenses that you paid over the period. Simply divide your account value by $1,000 (for example, an $8,600 account value divided by $1,000 = 8.6), then multiply the result by the number in the “Actual” line under the heading entitled “Expenses paid during period” for your applicable class of shares to estimate the expenses you paid on your account during this period.
Hypothetical example for comparison purposes
The “Hypothetical” line of the table below provides information about hypothetical account values and hypothetical expenses based on the Fund’s actual expense ratio and an assumed rate of return of 5% per year before expenses, which is not the Fund’s actual return. The hypothetical account values and expenses may not be used to estimate the actual ending account balance or expenses you paid for the period. You may use this information to compare the ongoing costs of investing in the Fund and other funds. To do so, compare this 5% hypothetical example with the 5% hypothetical examples that appear in the shareholder reports of the other funds.
Please note that the expenses shown in the table are meant to highlight your ongoing costs only and do not reflect any transactional costs, such as sales charges (loads) and contingent deferred sales charges. Therefore, the “Hypothetical” line of the table is useful in comparing ongoing costs only and will not help you determine the relative total costs of owning different funds. In addition, if these transactional costs were included, your costs would have been higher.
| | | | | | | | | | | | | | | | |
| | | Beginning
account value
8-1-2012 | | | Ending
account value
1-31-2013 | | | Expenses
paid during
the period1 | | | Net annual
expense ratio | |
Class A | | | | | | | | | | | | | | | | |
Actual | | $ | 1,000.00 | | | $ | 1,072.86 | | | $ | 6.11 | | | | 1.17 | % |
Hypothetical (5% return before expenses) | | $ | 1,000.00 | | | $ | 1,019.31 | | | $ | 5.96 | | | | 1.17 | % |
Class C | | | | | | | | | | | | | | | | |
Actual | | $ | 1,000.00 | | | $ | 1,069.45 | | | $ | 10.02 | | | | 1.92 | % |
Hypothetical (5% return before expenses) | | $ | 1,000.00 | | | $ | 1,015.53 | | | $ | 9.75 | | | | 1.92 | % |
Class R4 | | | | | | | | | | | | | | | | |
Actual | | $ | 1,000.00 | | | $ | 1,075.20 | | | $ | 3.92 | | | | 0.75 | % |
Hypothetical (5% return before expenses) | | $ | 1,000.00 | | | $ | 1,021.42 | | | $ | 3.82 | | | | 0.75 | % |
Class R6 | | | | | | | | | | | | | | | | |
Actual | | $ | 1,000.00 | | | $ | 1,075.95 | | | $ | 3.14 | | | | 0.60 | % |
Hypothetical (5% return before expenses) | | $ | 1,000.00 | | | $ | 1,022.18 | | | $ | 3.06 | | | | 0.60 | % |
Administrator Class | | | | | | | | | | | | | | | | |
Actual | | $ | 1,000.00 | | | $ | 1,074.51 | | | $ | 4.86 | | | | 0.93 | % |
Hypothetical (5% return before expenses) | | $ | 1,000.00 | | | $ | 1,020.52 | | | $ | 4.74 | | | | 0.93 | % |
Institutional Class | | | | | | | | | | | | | | | | |
Actual | | $ | 1,000.00 | | | $ | 1,076.11 | | | $ | 3.61 | | | | 0.69 | % |
Hypothetical (5% return before expenses) | | $ | 1,000.00 | | | $ | 1,021.73 | | | $ | 3.52 | | | | 0.69 | % |
Investor Class | | | | | | | | | | | | | | | | |
Actual | | $ | 1,000.00 | | | $ | 1,072.66 | | | $ | 6.48 | | | | 1.24 | % |
Hypothetical (5% return before expenses) | | $ | 1,000.00 | | | $ | 1,018.95 | | | $ | 6.31 | | | | 1.24 | % |
| 1. | Expenses paid is equal to the annualized expense ratio of each class multiplied by the average account value over the period, multiplied by the number of days in the most recent fiscal half-year divided by the number of days in the fiscal year (to reflect the one-half-year period). |
| | | | | | |
| Portfolio of investments—January 31, 2013 (unaudited) | | Wells Fargo Advantage Capital Growth Fund | | | 7 | |
| | | | | | | | | | | | |
| Security name | | | | | | Shares | | | Value | |
| | | | | | | | | | | | |
| | | | |
Common Stocks: 98.21% | | | | | | | | | | | | |
| | | | |
Consumer Discretionary: 23.34% | | | | | | | | | | | | |
| | | | |
| Auto Components: 1.54% | | | | | | | | | | | | |
Delphi Automotive plc † | | | | | | | 221,450 | | | $ | 8,561,257 | |
| | | | | | | | | | | | |
| | | | |
| Hotels, Restaurants & Leisure: 2.07% | | | | | | | | | | | | |
Starbucks Corporation | | | | | | | 204,924 | | | | 11,500,335 | |
| | | | | | | | | | | | |
| | | | |
| Internet & Catalog Retail: 3.35% | | | | | | | | | | | | |
Amazon.com Incorporated † | | | | | | | 46,790 | | | | 12,422,745 | |
priceline.com Incorporated † | | | | | | | 9,110 | | | | 6,244,632 | |
| | | | |
| | | | | | | | | | | 18,667,377 | |
| | | | | | | | | | | | |
| | | | |
| Media: 4.04% | | | | | | | | | | | | |
CBS Corporation Class B | | | | | | | 201,920 | | | | 8,424,102 | |
Liberty Media Corporation † | | | | | | | 57,600 | | | | 6,422,976 | |
Virgin Media Incorporated « | | | | | | | 193,200 | | | | 7,610,148 | |
| | | | |
| | | | | | | | | | | 22,457,226 | |
| | | | | | | | | | | | |
| | | | |
| Multiline Retail: 4.00% | | | | | | | | | | | | |
Dollar General Corporation † | | | | | | | 252,365 | | | | 11,664,310 | |
Nordstrom Incorporated | | | | | | | 141,350 | | | | 7,806,761 | |
Target Corporation « | | | | | | | 45,750 | | | | 2,763,758 | |
| | | | |
| | | | | | | | | | | 22,234,829 | |
| | | | | | | | | | | | |
| | | | |
| Specialty Retail: 5.92% | | | | | | | | | | | | |
Home Depot Incorporated | | | | | | | 181,050 | | | | 12,115,866 | |
Limited Brands Incorporated « | | | | | | | 195,350 | | | | 9,380,707 | |
TJX Companies Incorporated | | | | | | | 252,900 | | | | 11,426,022 | |
| | | | |
| | | | | | | | | | | 32,922,595 | |
| | | | | | | | | | | | |
| | | | |
| Textiles, Apparel & Luxury Goods: 2.42% | | | | | | | | | | | | |
Coach Incorporated | | | | | | | 21,450 | | | | 1,093,950 | |
lululemon athletica incorporated Ǡ | | | | | | | 87,850 | | | | 6,061,650 | |
Under Armour Incorporated Class A Ǡ | | | | | | | 123,750 | | | | 6,295,163 | |
| | | | |
| | | | | | | | | | | 13,450,763 | |
| | | | | | | | | | | | |
| | | | |
Consumer Staples: 5.12% | | | | | | | | | | | | |
| | | | |
| Beverages: 2.25% | | | | | | | | | | | | |
Anheuser-Busch Companies Incorporated ADR « | | | | | | | 113,100 | | | | 10,020,660 | |
Constellation Brands Incorporated Class A † | | | | | | | 77,300 | | | | 2,501,428 | |
| | | | |
| | | | | | | | | | | 12,522,088 | |
| | | | | | | | | | | | |
| | | | |
| Food & Staples Retailing: 1.84% | | | | | | | | | | | | |
Whole Foods Market Incorporated | | | | | | | 106,400 | | | | 10,241,000 | |
| | | | | | | | | | | | |
| | | | |
| Food Products: 1.03% | | | | | | | | | | | | |
The Hershey Company | | | | | | | 72,050 | | | | 5,724,373 | |
| | | | | | | | | | | | |
The accompanying notes are an integral part of these financial statements.
| | | | |
| 8 | | Wells Fargo Advantage Capital Growth Fund | | Portfolio of investments—January 31, 2013 (unaudited) |
| | | | | | | | | | | | |
| Security name | | | | | | Shares | | | Value | |
| | | | | | | | | | | | |
| | | | |
Energy: 3.71% | | | | | | | | | | | | |
| | | | |
| Energy Equipment & Services: 0.85% | | | | | | | | | | | | |
Schlumberger Limited | | | | | | | 60,800 | | | $ | 4,745,440 | |
| | | | | | | | | | | | |
| | | | |
| Oil, Gas & Consumable Fuels: 2.86% | | | | | | | | | | | | |
Pioneer Natural Resources Company | | | | | | | 75,780 | | | | 8,907,181 | |
The Williams Companies Incorporated | | | | | | | 199,700 | | | | 6,999,485 | |
| | | | |
| | | | | | | | | | | 15,906,666 | |
| | | | | | | | | | | | |
| | | | |
Financials: 6.72% | | | | | | | | | | | | |
| | | | |
| Capital Markets: 2.65% | | | | | | | | | | | | |
Affiliated Managers Group Incorporated Ǡ | | | | | | | 50,622 | | | | 7,286,024 | |
Ameriprise Financial Incorporated | | | | | | | 112,100 | | | | 7,434,472 | |
| | | | |
| | | | | | | | | | | 14,720,496 | |
| | | | | | | | | | | | |
| | | | |
| Commercial Banks: 0.96% | | | | | | | | | | | | |
Branch Banking & Trust Corporation | | | | | | | 176,050 | | | | 5,330,794 | |
| | | | | | | | | | | | |
| | | | |
| Consumer Finance: 1.76% | | | | | | | | | | | | |
Capital One Financial Corporation | | | | | | | 111,200 | | | | 6,262,784 | |
Discover Financial Services | | | | | | | 91,800 | | | | 3,524,202 | |
| | | | |
| | | | | | | | | | | 9,786,986 | |
| | | | | | | | | | | | |
| | | | |
| Diversified Financial Services: 1.35% | | | | | | | | | | | | |
Intercontinental Exchange Incorporated † | | | | | | | 54,150 | | | | 7,513,313 | |
| | | | | | | | | | | | |
| | | | |
Health Care: 15.11% | | | | | | | | | | | | |
| | | | |
| Biotechnology: 4.24% | | | | | | | | | | | | |
Alexion Pharmaceuticals Incorporated † | | | | | | | 62,632 | | | | 5,886,782 | |
Celgene Corporation † | | | | | | | 60,150 | | | | 5,952,444 | |
Gilead Sciences Incorporated Ǡ | | | | | | | 297,900 | | | | 11,752,155 | |
| | | | |
| | | | | | | | | | | 23,591,381 | |
| | | | | | | | | | | | |
| | | | |
| Health Care Equipment & Supplies: 1.39% | | | | | | | | | | | | |
Intuitive Surgical Incorporated Ǡ | | | | | | | 13,450 | | | | 7,725,411 | |
| | | | | | | | | | | | |
| | | | |
| Health Care Providers & Services: 4.24% | | | | | | | | | | | | |
Cardinal Health Incorporated | | | | | | | 106,300 | | | | 4,657,003 | |
Catamaran Corporation † | | | | | | | 134,150 | | | | 6,961,044 | |
HCA Holdings Incorporated | | | | | | | 121,000 | | | | 4,555,650 | |
UnitedHealth Group Incorporated | | | | | | | 133,950 | | | | 7,395,380 | |
| | | | |
| | | | | | | | | | | 23,569,077 | |
| | | | | | | | | | | | |
| | | | |
| Health Care Technology: 0.70% | | | | | | | | | | | | |
Cerner Corporation Ǡ | | | | | | | 47,000 | | | | 3,879,850 | |
| | | | | | | | | | | | |
| | | | |
| Life Sciences Tools & Services: 1.46% | | | | | | | | | | | | |
Agilent Technologies Incorporated | | | | | | | 181,100 | | | | 8,109,658 | |
| | | | | | | | | | | | |
The accompanying notes are an integral part of these financial statements.
| | | | | | |
| Portfolio of investments—January 31, 2013 (unaudited) | | Wells Fargo Advantage Capital Growth Fund | | | 9 | |
| | | | | | | | | | | | |
| Security name | | | | | | Shares | | | Value | |
| | | | | | | | | | | | |
| | | | |
| Pharmaceuticals: 3.08% | | | | | | | | | | | | |
AbbVie Incorporation | | | | | | | 20,550 | | | $ | 753,980 | |
Allergan Incorporated | | | | | | | 75,940 | | | | 7,974,459 | |
Sanofi ADR | | | | | | | 165,992 | | | | 8,080,491 | |
Zoetis Incorporated † | | | | | | | 11,673 | | | | 303,498 | |
| | | | |
| | | | | | | | | | | 17,112,428 | |
| | | | | | | | | | | | |
| | | | |
Industrials: 11.07% | | | | | | | | | | | | |
| | | | |
| Aerospace & Defense: 1.35% | | | | | | | | | | | | |
Precision Castparts Corporation | | | | | | | 40,831 | | | | 7,488,405 | |
| | | | | | | | | | | | |
| | | | |
| Electrical Equipment: 1.06% | | | | | | | | | | | | |
Eaton Corporation | | | | | | | 103,850 | | | | 5,914,258 | |
| | | | | | | | | | | | |
| | | | |
| Industrial Conglomerates: 0.96% | | | | | | | | | | | | |
Danaher Corporation | | | | | | | 89,450 | | | | 5,360,739 | |
| | | | | | | | | | | | |
| | | | |
| Machinery: 1.32% | | | | | | | | | | | | |
Cummins Incorporated « | | | | | | | 64,061 | | | | 7,356,125 | |
| | | | | | | | | | | | |
| | | | |
| Road & Rail:5.44% | | | | | | | | | | | | |
Hertz Global Holdings Incorporated † | | | | | | | 417,900 | | | | 7,639,212 | |
Kansas City Southern Railway Company « | | | | | | | 103,600 | | | | 9,646,196 | |
Union Pacific Corporation | | | | | | | 98,589 | | | | 12,960,510 | |
| | | | |
| | | | | | | | | | | 30,245,918 | |
| | | | | | | | | | | | |
| | | | |
| Trading Companies & Distributors: 0.94% | | | | | | | | | | | | |
W.W. Grainger Incorporated | | | | | | | 23,889 | | | | 5,203,502 | |
| | | | | | | | | | | | |
| | | | |
Information Technology: 27.21% | | | | | | | | | | | | |
| | | | |
| Computers & Peripherals: 6.01% | | | | | | | | | | | | |
Apple Incorporated | | | | | | | 73,475 | | | | 33,453,896 | |
| | | | | | | | | | | | |
| | | | |
| Internet Software & Services: 8.69% | | | | | | | | | | | | |
eBay Incorporated † | | | | | | | 275,700 | | | | 15,419,901 | |
Facebook Incorporated Class A † | | | | | | | 186,450 | | | | 5,774,357 | |
Google Incorporated Class A † | | | | | | | 27,550 | | | | 20,819,260 | |
LinkedIn Corporation Class A † | | | | | | | 51,000 | | | | 6,313,290 | |
| | | | |
| | | | | | | | | | | 48,326,808 | |
| | | | | | | | | | | | |
| | | | |
| IT Services: 8.21% | | | | | | | | | | | | |
Accenture plc « | | | | | | | 146,593 | | | | 10,538,571 | |
Alliance Data Systems Corporation Ǡ | | | | | | | 62,500 | | | | 9,850,000 | |
MasterCard Incorporated Class A | | | | | | | 20,210 | | | | 10,476,864 | |
Visa Incorporated Class A « | | | | | | | 93,550 | | | | 14,772,481 | |
| | | | |
| | | | | | | | | | | 45,637,916 | |
| | | | | | | | | | | | |
| | | | |
| Semiconductors & Semiconductor Equipment: 0.50% | | | | | | | | | | | | |
Broadcom Corporation Class A | | | | | | | 85,400 | | | | 2,771,230 | |
| | | | | | | | | | | | |
The accompanying notes are an integral part of these financial statements.
| | | | |
| 10 | | Wells Fargo Advantage Capital Growth Fund | | Portfolio of investments—January 31, 2013 (unaudited) |
| | | | | | | | | | | | | | |
| Security name | | | | | | | Shares | | | Value | |
| | | | | | | | | | | | | | |
| | | | |
| Software: 3.80% | | | | | | | | | | | | | | |
Red Hat Incorporated † | | | | | | | | | 128,950 | | | $ | 7,164,462 | |
Salesforce.com Incorporated Ǡ | | | | | | | | | 42,550 | | | | 7,324,132 | |
VMware Incorporated Ǡ | | | | | | | | | 86,600 | | | | 6,623,168 | |
| | | | |
| | | | | | | | | | | | | 21,111,762 | |
| | | | | | | | | | | | | | |
| | | | |
Materials: 2.18% | | | | | | | | | | | | | | |
| | | | |
| Chemicals: 2.18% | | | | | | | | | | | | | | |
Monsanto Company | | | | | | | | | 119,400 | | | | 12,101,190 | |
| | | | | | | | | | | | | | |
| | | | |
Telecommunication Services: 3.75% | | | | | | | | | | | | | | |
| | | | |
| Wireless Telecommunication Services : 3.75% | | | | | | | | | | | | | | |
Crown Castle International Corporation † | | | | | | | | | 152,200 | | | | 10,733,144 | |
QUALCOMM Incorporated | | | | | | | | | 153,500 | | | | 10,135,605 | |
| | | | | | | | | | | | | 20,868,749 | |
| | | | |
Total Common Stocks (Cost $476,186,819) | | | | | | | | | | | | | 546,113,841 | |
| | | | | | | | | | | | | | |
| | | | |
| | | | | | | | Principal | | | | |
| | | | |
Other: 0.24% | | | | | | | | | | | | | | |
Gryphon Funding Limited, Pass-Through Entity (v)(i)(a) | | | | | | | | $ | 3,862,731 | | | | 1,313,328 | |
| | | | | | | | | | | | | | |
| | | | |
Total Other (Cost $314,786) | | | | | | | | | | | | | 1,313,328 | |
| | | | | | | | | | | | | | |
| | | | |
| | | | | | | | | | | | |
| | | | |
| | | Yield | | | | | Shares | | | | |
| Short-Term Investments: 18.33% | | | | | | | | | | | | | | |
| | | | |
| Investment Companies: 18.33% | | | | | | | | | | | | | | |
Wells Fargo Advantage Cash Investment Money Market Fund, Select Class (l)(u) | | | 0.14 | % | | | | | 8,808,573 | | | | 8,808,573 | |
Wells Fargo Securities Lending Cash Investments, LLC (l)(u)(r)(v) | | | 0.19 | | | | | | 93,095,489 | | | | 93,095,489 | |
| | | | |
Total Short-Term Investments (Cost $101,904,062) | | | | | | | | | | | | | 101,904,062 | |
| | | | | | | | | | | | | | |
| | | | | | | | |
| Total investments in securities | | | | | | | | |
| (Cost $578,405,667) * | | | 116.78 | % | | | 649,331,231 | |
Other assets and liabilities, net | | | (16.78 | ) | | | (93,280,134 | ) |
| | | | | | | | |
| Total net assets | | | 100.00 | % | | $ | 556,051,097 | |
| | | | | | | | |
| † | Non-income-earning security |
| « | All or a portion of this security is on loan. |
| (v) | Security represents investment of cash collateral received from securities on loan. |
| (a) | Security is fair valued by the Management Valuation Team, and in certain instances by the Board of Trustees, in accordance with procedures approved by the Board of Trustees. |
| (l) | Investment in an affiliate |
| (u) | Rate shown is the 7-day annualized yield at period end. |
| (r) | The investment company is exempt from registration under Section 3(c)(7) of the Investment Company Act of 1940, as amended. |
| * | Cost for federal income tax purposes is $582,573,949 and unrealized appreciation (depreciation) consists of: |
| | | | |
Gross unrealized appreciation | | $ | 69,890,830 | |
Gross unrealized depreciation | | | (3,133,548 | ) |
| | | | |
Net unrealized appreciation | | $ | 66,757,282 | |
The accompanying notes are an integral part of these financial statements.
| | | | | | |
| Statement of assets and liabilities—January 31, 2013 (unaudited) | | Wells Fargo Advantage Capital Growth Fund | | | 11 | |
| | | | |
| | | | |
| |
Assets | | | | |
Investments | | | | |
In unaffiliated securities (including securities on loan), at value (see cost below) | | $ | 547,427,169 | |
In affiliated securities, at value (see cost below) | | | 101,904,062 | |
| | | | |
Total investments, at value (see cost below) | | | 649,331,231 | |
Receivable for investments sold | | | 2,592,760 | |
Receivable for Fund shares sold | | | 279,465 | |
Receivable for dividends | | | 47,294 | |
Receivable for securities lending income | | | 8,562 | |
Prepaid expenses and other assets | | | 76,636 | |
| | | | |
Total assets | | | 652,335,948 | |
| | | | |
| |
Liabilities | | | | |
Payable for investments purchased | | | 1,859,656 | |
Payable for Fund shares redeemed | | | 571,639 | |
Payable upon receipt of securities loaned | | | 93,410,275 | |
Advisory fee payable | | | 225,923 | |
Distribution fees payable | | | 3,318 | |
Due to other related parties | | | 82,337 | |
Accrued expenses and other liabilities | | | 131,703 | |
| | | | |
Total liabilities | | | 96,284,851 | |
| | | | |
Total net assets | | $ | 556,051,097 | |
| | | | |
| |
NET ASSETS CONSIST OF | | | | |
Paid-in capital | | $ | 492,823,154 | |
Undistributed net investment income | | | 785,095 | |
Accumulated net realized losses on investments | | | (8,482,716 | ) |
Net unrealized gains on investments | | | 70,925,564 | |
| | | | |
Total net assets | | $ | 556,051,097 | |
| | | | |
| |
COMPUTATION OF NET ASSET VALUE AND OFFERING PRICE PER SHARE1 | | | | |
Net assets – Class A | | $ | 17,624,135 | |
Shares outstanding – Class A | | | 998,893 | |
Net asset value per share – Class A | | | $17.64 | |
Maximum offering price per share – Class A2 | | | $18.72 | |
Net assets – Class C | | $ | 5,189,380 | |
Shares outstanding – Class C | | | 306,761 | |
Net asset value per share – Class C | | | $16.92 | |
Net assets – Class R4 | | $ | 10,360 | |
Share outstanding – Class R4 | | | 561 | |
Net asset value per share – Class R4 | | | $18.47 | |
Net assets – Class R6 | | $ | 51,810 | |
Share outstanding – Class R6 | | | 2,805 | |
Net asset value per share – Class R6 | | | $18.47 | |
Net assets – Administrator Class | | $ | 69,589,028 | |
Shares outstanding – Administrator Class | | | 3,806,347 | |
Net asset value per share – Administrator Class | | | $18.28 | |
Net assets – Institutional Class | | $ | 383,055,673 | |
Shares outstanding – Institutional Class | | | 20,742,360 | |
Net asset value per share – Institutional Class | | | $18.47 | |
Net assets – Investor Class | | $ | 80,530,711 | |
Shares outstanding – Investor Class | | | 4,590,367 | |
Net asset value per share – Investor Class | | | $17.54 | |
Investment in unaffiliated securities (including securities on loan), at cost | | $ | 476,501,605 | |
| | | | |
Investments in affiliated securities, at cost | | $ | 101,904,062 | |
| | | | |
Total investments, at cost | | $ | 578,405,667 | |
| | | | |
Securities on loan, at value | | $ | 91,400,321 | |
| | | | |
| 1. | The Fund has an unlimited number of authorized shares. |
| 2. | Maximum offering price is computed as 100/94.25 of net asset value. On investments of $50,000 or more, the offering price is reduced. |
The accompanying notes are an integral part of these financial statements.
| | | | |
| 12 | | Wells Fargo Advantage Capital Growth Fund | | Statement of operations—six months ended January 31, 2013 (unaudited) |
| | | | |
| | | | |
| |
Investment income | | | | |
Dividends | | $ | 3,889,457 | |
Securities lending income, net | | | 70,253 | |
Income from affiliated securities | | | 10,547 | |
| | | | |
Total investment income | | | 3,970,257 | |
| | | | |
| |
Expenses | | | | |
Advisory fee | | | 2,077,600 | |
Administration fees | | | | |
Fund level | | | 161,167 | |
Class A | | | 23,528 | |
Class C | | | 7,352 | |
Class R4 | | | 1 | 1 |
Class R6 | | | 2 | 1 |
Administrator Class | | | 36,520 | |
Institutional Class | | | 186,550 | |
Investor Class | | | 130,365 | |
Shareholder servicing fees | | | | |
Class A | | | 22,623 | |
Class C | | | 7,069 | |
Class R4 | | | 2 | 1 |
Administrator Class | | | 90,689 | |
Investor Class | | | 101,848 | |
Distribution fees | | | | |
Class C | | | 21,208 | |
Custody and accounting fees | | | 24,666 | |
Professional fees | | | 18,895 | |
Registration fees | | | 24,189 | |
Shareholder report expenses | | | 31,810 | |
Trustees’ fees and expenses | | | 5,936 | |
Other fees and expenses | | | 17,618 | |
| | | | |
Total expenses | | | 2,989,638 | |
Less: Fee waivers and/or expense reimbursements | | | (384,770 | ) |
| | | | |
Net expenses | | | 2,604,868 | |
| | | | |
Net investment income | | | 1,365,389 | |
| | | | |
| |
REALIZED AND UNREALIZED GAINS (LOSSES) ON INVESTMENTS | | | | |
Net realized gains on investments | | | 40,628,130 | |
Net change in unrealized gains (losses) on investments | | | 261,185 | |
| | | | |
Net realized and unrealized gains (losses) on investments | | | 40,889,315 | |
| | | | |
Net increase in net assets resulting from operations | | $ | 42,254,704 | |
| | | | |
| 1. | For the period from November 30, 2012 (commencement of class operations) to January 31, 2013 |
The accompanying notes are an integral part of these financial statements.
| | | | | | |
| Statement of changes in net assets | | Wells Fargo Advantage Capital Growth Fund | | | 13 | |
| | | | | | | | | | | | | | | | |
| | | | | | Six months ended
January 31, 2013
(unaudited) | | | | | | Year ended
July 31, 2012 | |
| | | | |
Operations | | | | | | | | | | | | | | | | |
Net investment income | | | | | | $ | 1,365,389 | | | | | | | $ | 1,155,744 | |
Net realized gains on investments | | | | | | | 40,628,130 | | | | | | | | 182,157,178 | |
Net change in unrealized gains (losses) on investments | | | | | | | 261,185 | | | | | | | | (126,756,740 | ) |
| | | | | | | | | | | | | | | | |
Net increase in net assets resulting from operations | | | | | | | 42,254,704 | | | | | | | | 56,556,182 | |
| | | | | | | | | | | | | | | | |
| | | | |
Distributions to shareholders from | | | | | | | | | | | | | | | | |
Net investment income | | | | | | | | | | | | | | | | |
Class R4 | | | | | | | (48 | )1 | | | | | | | N/A | |
Class R6 | | | | | | | (246 | )1 | | | | | | | N/A | |
Institutional Class | | | | | | | (1,895,530 | ) | | | | | | | 0 | |
Net realized gains | | | | | | | | | | | | | | | | |
Class A | | | | | | | (314,970 | ) | | | | | | | 0 | |
Class C | | | | | | | (99,514 | ) | | | | | | | 0 | |
Class R4 | | | | | | | (167 | )1 | | | | | | | N/A | |
Class R6 | | | | | | | (837 | )1 | | | | | | | N/A | |
Administrator Class | | | | | | | (1,194,743 | ) | | | | | | | 0 | |
Institutional Class | | | | | | | (6,263,868 | ) | | | | | | | 0 | |
Investor Class | | | | | | | (1,405,932 | ) | | | | | | | 0 | |
| | | | | | | | | | | | | | | | |
Total distributions to shareholders | | | | | | | (11,175,855 | ) | | | | | | | 0 | |
| | | | | | | | | | | | | | | | |
| | | | |
| | | Shares | | | | | | | | Shares | | | | | |
| | | | |
Capital share transactions | | | | | | | | | | | | | | | | |
Proceeds from shares sold | | | | | | | | | | | | | | | | |
Class A | | | 66,588 | | | | 1,144,198 | | | | 122,287 | | | | 1,936,369 | |
Class C | | | 14,837 | | | | 243,496 | | | | 43,857 | | | | 666,184 | |
Class R4 | | | 549 | 1 | | | 10,000 | 1 | | | N/A | | | | N/A | |
Class R6 | | | 2,744 | 1 | | | 50,000 | 1 | | | N/A | | | | N/A | |
Administrator Class | | | 236,390 | | | | 4,220,676 | | | | 3,928,533 | | | | 61,599,365 | |
Institutional Class | | | 1,373,636 | | | | 24,858,624 | | | | 6,758,122 | | | | 107,414,515 | |
Investor Class | | | 133,158 | | | | 2,277,827 | | | | 387,393 | | | | 6,068,141 | |
| | | | | | | | | | | | | | | | |
| | | | | | | 32,804,821 | | | | | | | | 177,684,574 | |
| | | | | | | | | | | | | | | | |
Reinvestment of distributions | | | | | | | | | | | | | | | | |
Class A | | | 18,353 | | | | 308,705 | | | | 0 | | | | 0 | |
Class C | | | 4,727 | | | | 76,288 | | | | 0 | | | | 0 | |
Class R4 | | | 12 | 1 | | | 215 | 1 | | | N/A | | | | N/A | |
Class R6 | | | 61 | I | | | 1,083 | 1 | | | N/A | | | | N/A | |
Administrator Class | | | 64,170 | | | | 1,117,846 | | | | 0 | | | | 0 | |
Institutional Class | | | 433,529 | | | | 7,652,649 | | | | 0 | | | | 0 | |
Investor Class | | | 81,385 | | | | 1,360,759 | | | | 0 | | | | 0 | |
| | | | | | | | | | | | | | | | |
| | | | | | | 10,517,545 | | | | | | | | 0 | |
| | | | | | | | | | | | | | | | |
Payment for shares redeemed | | | | | | | | | | | | | | | | |
Class A | | | (148,355 | ) | | | (2,550,543 | ) | | | (333,193 | ) | | | (5,281,014 | ) |
Class C | | | (87,487 | ) | | | (1,448,603 | ) | | | (193,662 | ) | | | (3,011,786 | ) |
Administrator Class | | | (798,401 | ) | | | (14,251,903 | ) | | | (21,814,212 | ) | | | (379,002,167 | ) |
Institutional Class | | | (12,048,525 | ) | | | (214,999,208 | ) | | | (34,071,744 | ) | | | (586,752,715 | ) |
Investor Class | | | (499,964 | ) | | | (8,587,077 | ) | | | (1,503,509 | ) | | | (23,422,338 | ) |
| | | | | | | | | | | | | | | | |
| | | | | | | (241,837,334 | ) | | | | | | | (997,470,020 | ) |
| | | | | | | | | | | | | | | | |
Net decrease in net assets resulting from capital share transactions | | | | | | | (198,514,968 | ) | | | | | | | (819,785,446 | ) |
| | | | | | | | | | | | | | | | |
Total decrease in net assets | | | | | | | (167,436,119 | ) | | | | | | | (763,229,264 | ) |
| | | | | | | | | | | | | | | | |
| | | | |
Net assets | | | | | | | | | | | | | | | | |
Beginning of period | | | | | | | 723,487,216 | | | | | | | | 1,486,716,480 | |
| | | | | | | | | | | | | | | | |
End of period | | | | | | $ | 556,051,097 | | | | | | | $ | 723,487,216 | |
| | | | | | | | | | | | | | | | |
Undistributed net investment income | | | | | | $ | 785,095 | | | | | | | $ | 1,315,530 | |
| | | | | | | | | | | | | | | | |
| 1. | For the period from November 30, 2012 (commencement of class operations) to January 31, 2013 |
The accompanying notes are an integral part of these financial statements.
| | | | |
| 14 | | Wells Fargo Advantage Capital Growth Fund | | Financial highlights |
(For a share outstanding throughout each period)
| | | | | | | | | | | | | | | | | | | | | | | | |
| | | Six months ended
January 31, 2013 (unaudited) | | | Year ended July 31 | |
| CLASS A | | | 2012 | | | 2011 | | | 2010 | | | 2009 | | | 2008 | |
Net asset value, beginning of period | | | $16.74 | | | | $16.25 | | | | $13.07 | | | | $11.83 | | | | $17.60 | | | | $18.64 | |
Net investment income (loss) | | | 0.01 | 1 | | | (0.05 | ) 1 | | | (0.07 | )1 | | | (0.06 | )1 | | | (0.00 | )1 | | | (0.08 | )1 |
Net realized and unrealized gains (losses) on investments | | | 1.19 | | | | 0.54 | | | | 3.25 | | | | 1.30 | | | | (5.26 | ) | | | 0.08 | |
| | | | | | | | | | | | | | | | | | | | | | | | |
Total from investment operations | | | 1.20 | | | | 0.49 | | | | 3.18 | | | | 1.24 | | | | (5.26 | ) | | | 0.00 | |
Distributions to shareholders from | | | | | | | | | | | | | | | | | | | | | | | | |
Net realized gains | | | (0.30 | ) | | | 0.00 | | | | 0.00 | | | | 0.00 | | | | (0.51 | ) | | | (1.04 | ) |
Net asset value, end of period | | | $17.64 | | | | $16.74 | | | | $16.25 | | | | $13.07 | | | | $11.83 | | | | $17.60 | |
Total return2 | | | 7.29 | % | | | 3.02 | % | | | 24.43 | % | | | 10.40 | % | | | (29.23 | )% | | | (0.46 | )% |
Ratios to average net assets (annualized) | | | | | | | | | | | | | | | | | | | | | | | | |
Gross expenses | | | 1.25 | % | | | 1.21 | % | | | 1.21 | % | | | 1.27 | % | | | 1.31 | % | | | 1.22 | % |
Net expenses | | | 1.17 | % | | | 1.20 | % | | | 1.20 | % | | | 1.25 | % | | | 1.25 | % | | | 1.22 | % |
Net investment income (loss) | | | 0.10 | % | | | (0.30 | )% | | | (0.48 | )% | | | (0.55 | )% | | | (0.01 | )% | | | (0.45 | )% |
Supplemental data | | | | | | | | | | | | | | | | | | | | | | | | |
Portfolio turnover rate | | | 53 | % | | | 116 | % | | | 116 | % | | | 128 | % | | | 172 | % | | | 151 | % |
Net assets, end of period (000s omitted) | | $ | 17,624 | | | $ | 17,784 | | | $ | 20,693 | | | $ | 24,222 | | | $ | 21,064 | | | $ | 33,756 | |
| 1. | Calculated based upon average shares outstanding |
| 2. | Total return calculations do not include any sales charges. Returns for periods of less than one year are not annualized. |
The accompanying notes are an integral part of these financial statements.
| | | | | | |
| Financial highlights | | Wells Fargo Advantage Capital Growth Fund | | | 15 | |
(For a share outstanding throughout each period)
| | | | | | | | | | | | | | | | | | | | | | | | |
| | | Six months ended
January 31, 2013 (unaudited) | | | Year ended July 31 | |
| CLASS C | | | 2012 | | | 2011 | | | 2010 | | | 2009 | | | 2008 | |
Net asset value, beginning of period | | $ | 16.12 | | | $ | 15.77 | | | $ | 12.77 | | | $ | 11.65 | | | $ | 17.47 | | | $ | 18.64 | |
Net investment loss | | | (0.05 | )1 | | | (0.16 | )1 | | | (0.19 | )1 | | | (0.17 | ) | | | (0.08 | )1 | | | (0.22 | )1 |
Net realized and unrealized gains (losses) on investments | | | 1.15 | | | | 0.51 | | | | 3.19 | | | | 1.29 | | | | (5.23 | ) | | | 0.09 | |
| | | | | | | | | | | | | | | | | | | | | | | | |
Total from investment operations | | | 1.10 | | | | 0.35 | | | | 3.00 | | | | 1.12 | | | | (5.31 | ) | | | (0.13 | ) |
Distributions to shareholders from | | | | | | | | | | | | | | | | | | | | | | | | |
Net realized gains | | | (0.30 | ) | | | 0.00 | | | | 0.00 | | | | 0.00 | | | | (0.51 | ) | | | (1.04 | ) |
Net asset value, end of period | | $ | 16.92 | | | $ | 16.12 | | | $ | 15.77 | | | $ | 12.77 | | | $ | 11.65 | | | $ | 17.47 | |
Total return2 | | | 6.94 | % | | | 2.22 | % | | | 23.49 | % | | | 9.61 | % | | | (29.75 | )% | | | (1.18 | )% |
Ratios to average net assets (annualized) | | | | | | | | | | | | | | | | | | | | | | | | |
Gross expenses | | | 2.00 | % | | | 1.96 | % | | | 1.96 | % | | | 2.02 | % | | | 2.02 | % | | | 2.14 | % |
Net expenses | | | 1.92 | % | | | 1.95 | % | | | 1.95 | % | | | 2.00 | % | | | 1.96 | % | | | 2.00 | % |
Net investment loss | | | (0.65 | )% | | | (1.05 | )% | | | (1.23 | )% | | | (1.31 | )% | | | (0.70 | )% | | | (1.21 | )% |
Supplemental data | | | | | | | | | | | | | | | | | | | | | | | | |
Portfolio turnover rate | | | 53 | % | | | 116 | % | | | 116 | % | | | 128 | % | | | 172 | % | | | 151 | % |
Net assets, end of period (000s omitted) | | $ | 5,189 | | | $ | 6,042 | | | $ | 8,272 | | | $ | 7,127 | | | $ | 6,772 | | | $ | 7,835 | |
| 1. | Calculated based upon average shares outstanding |
| 2. | Total return calculations do not include any sales charges. Returns for periods of less than one year are not annualized. |
The accompanying notes are an integral part of these financial statements.
| | | | |
| 16 | | Wells Fargo Advantage Capital Growth Fund | | Financial highlights |
(For a share outstanding throughout the period)
| | | | |
| | | Period ended
January 31, 20131 | |
| CLASS R4 | | (unaudited) | |
Net asset value, beginning of period | | $ | 18.22 | |
Net investment income | | | 0.02 | |
Net realized and unrealized gains on investments | | | 0.62 | |
| | | | |
Total from investment operations | | | 0.64 | |
Distributions to shareholders from | | | | |
Net investment income | | | (0.09 | ) |
Net realized gains | | | (0.30 | ) |
| | | | |
Total distributions to shareholders | | | (0.39 | ) |
Net asset value, end of period | | $ | 18.47 | |
Total return2 | | | 3.57 | % |
Ratios to average net assets (annualized) | | | | |
Gross expenses | | | 0.88 | % |
Net expenses | | | 0.75 | % |
Net investment income | | | 0.73 | % |
Supplemental data | | | | |
Portfolio turnover rate | | | 53 | % |
Net assets, end of period (000s omitted) | | | $10 | |
| 1. | For the period from November 30, 2012 (commencement of class operations) to January 31, 2013 |
| 2. | Returns for periods of less than one year are not annualized. |
The accompanying notes are an integral part of these financial statements.
| | | | | | |
| Financial highlights | | Wells Fargo Advantage Capital Growth Fund | | | 17 | |
(For a share outstanding throughout period)
| | | | |
| CLASS R6 | | Period ended
January 31, 20131
(unaudited) | |
Net asset value, beginning of period | | $ | 18.22 | |
Net investment income | | | 0.03 | |
Net realized and unrealized gains on investments | | | 0.61 | |
| | | | |
Total from investment operations | | | 0.64 | |
Distributions to shareholders from | | | | |
Net investment income | | | (0.09 | ) |
Net realized gains | | | (0.30 | ) |
| | | | |
Total distributions to shareholders | | | (0.39 | ) |
Net asset value, end of period | | $ | 18.47 | |
Total return2 | | | 3.64 | % |
Ratios to average net assets (annualized) | | | | |
Gross expenses | | | 0.77 | % |
Net expenses | | | 0.60 | % |
Net investment income | | | 0.89 | % |
Supplemental data | | | | |
Portfolio turnover rate | | | 53 | % |
Net assets, end of period (000s omitted) | | | $52 | |
| 1. | For the period from November 30, 2012 (commencement of class operations) to January 31, 2013 |
| 2. | Returns for periods of less than one year are not annualized. |
The accompanying notes are an integral part of these financial statements.
| | | | |
| 18 | | Wells Fargo Advantage Capital Growth Fund | | Financial highlights |
(For a share outstanding throughout each period)
| | | | | | | | | | | | | | | | | | | | | | | | |
| | | Six months ended
January 31, 2013
(unaudited) | | | Year ended July 31 | |
| ADMINISTRATOR CLASS | | | 2012 | | | 2011 | | | 2010 | | | 2009 | | | 2008 | |
Net asset value, beginning of period | | $ | 17.32 | | | $ | 16.77 | | | $ | 13.45 | | | $ | 12.17 | | | $ | 18.03 | | | $ | 19.03 | |
Net investment income (loss) | | | 0.03 | 1 | | | (0.00 | )1 | | | (0.03 | )1 | | | (0.03 | )1 | | | 0.04 | 1 | | | (0.02 | ) 1 |
Net realized and unrealized gains (losses) on investments | | | 1.23 | | | | 0.55 | | | | 3.35 | | | | 1.35 | | | | (5.39 | ) | | | 0.06 | |
| | | | | | | | | | | | | | | | | | | | | | | | |
Total from investment operations | | | 1.26 | | | | 0.55 | | | | 3.32 | | | | 1.32 | �� | | | (5.35 | ) | | | 0.04 | |
Distributions to shareholders from | | | | | | | | | | | | | | | | | | | | | | | | |
Net investment income | | | 0.00 | | | | 0.00 | | | | 0.00 | | | | (0.04 | ) | | | 0.00 | | | | 0.00 | |
Net realized gains | | | (0.30 | ) | | | 0.00 | | | | 0.00 | | | | 0.00 | | | | (0.51 | ) | | | (1.04 | ) |
| | | | | | | | | | | | | | | | | | | | | | | | |
Total distributions to shareholders | | | (0.30 | ) | | | 0.00 | | | | 0.00 | | | | (0.04 | ) | | | (0.51 | ) | | | (1.04 | ) |
Net asset value, end of period | | $ | 18.28 | | | $ | 17.32 | | | $ | 16.77 | | | $ | 13.45 | | | $ | 12.17 | | | $ | 18.03 | |
Total return2 | | | 7.45 | % | | | 3.22 | % | | | 24.68 | % | | | 10.81 | % | | | (29.02 | )% | | | (0.24 | )% |
Ratios to average net assets (annualized) | | | | | | | | | | | | | | | | | | | | | | | | |
Gross expenses | | | 1.09 | % | | | 1.05 | % | | | 1.05 | % | | | 1.09 | % | | | 1.13 | % | | | 1.12 | % |
Net expenses | | | 0.93 | % | | | 0.94 | % | | | 0.94 | % | | | 0.94 | % | | | 0.94 | % | | | 0.94 | % |
Net investment income (loss) | | | 0.35 | % | | | (0.01 | )% | | | (0.21 | )% | | | (0.25 | )% | | | 0.33 | % | | | (0.11 | )% |
Supplemental data | | | | | | | | | | | | | | | | | | | | | | | | |
Portfolio turnover rate | | | 53 | % | | | 116 | % | | | 116 | % | | | 128 | % | | | 172 | % | | | 151 | % |
Net assets, end of period (000s omitted) | | | $69,589 | | | | $74,529 | | | | $372,178 | | | | $684,207 | | | | $680,869 | | | | $678,414 | |
| 1. | Calculated based upon average shares outstanding |
| 2. | Returns for periods of less than one year are not annualized. |
The accompanying notes are an integral part of these financial statements.
| | | | | | |
| Financial highlights | | Wells Fargo Advantage Capital Growth Fund | | | 19 | |
(For a share outstanding throughout each period)
| | | | | | | | | | | | | | | | | | | | | | | | |
| | | Six months ended
January 31, 2013
(unaudited) | | | Year ended July 31 | |
| INSTITUTIONAL CLASS | | | 2012 | | | 2011 | | | 2010 | | | 2009 | | | 2008 | |
Net asset value, beginning of period | | $ | 17.56 | | | $ | 16.96 | | | $ | 13.57 | | | $ | 12.27 | | | $ | 18.14 | | | $ | 19.10 | |
Net Investment income (loss) | | | 0.05 | 1 | | | 0.03 | 1 | | | 0.00 | 1,2 | | | (0.00 | )1 | | | 0.06 | 1 | | | 0.01 | 1 |
Net realized and unrealized gains (losses) on investments | | | 1.25 | | | | 0.57 | | | | 3.39 | | | | 1.36 | | | | (5.42 | ) | | | 0.07 | |
| | | | | | | | | | | | | | | | | | | | | | | | |
Total from investment operations | | | 1.30 | | | | 0.60 | | | | 3.39 | | | | 1.36 | | | | (5.36 | ) | | | 0.08 | |
Distributions to shareholders from | | | | | | | | | | | | | | | | | | | | | | | | |
Net investment income | | | (0.09 | ) | | | 0.00 | | | | 0.00 | | | | (0.06 | ) | | | 0.00 | | | | 0.00 | |
Net realized gains | | | (0.30 | ) | | | 0.00 | | | | 0.00 | | | | 0.00 | | | | (0.51 | ) | | | (1.04 | ) |
| | | | | | | | | | | | | | | | | | | | | | | | |
Total distributions to shareholders | | | (0.39 | ) | | | 0.00 | | | | 0.00 | | | | (0.06 | ) | | | (0.51 | ) | | | (1.04 | ) |
Net asset value, end of period | | $ | 18.47 | | | $ | 17.56 | | | $ | 16.96 | | | $ | 13.57 | | | $ | 12.27 | | | $ | 18.14 | |
Total return3 | | | 7.61 | % | | | 3.48 | % | | | 25.07 | % | | | 10.97 | % | | | (28.90 | )% | | | (0.02 | )% |
Ratios to average net assets (annualized) | | | | | | | | | | | | | | | | | | | | | | | | |
Gross expenses | | | 0.81 | % | | | 0.78 | % | | | 0.78 | % | | | 0.82 | % | | | 0.86 | % | | | 0.85 | % |
Net expenses | | | 0.69 | % | | | 0.70 | % | | | 0.70 | % | | | 0.75 | % | | | 0.75 | % | | | 0.75 | % |
Net investment income (loss) | | | 0.53 | % | | | 0.21 | % | | | 0.00 | % | | | (0.06 | )% | | | 0.51 | % | | | 0.07 | % |
Supplemental data | | | | | | | | | | | | | | | | | | | | | | | | |
Portfolio turnover rate | | | 53 | % | | | 116 | % | | | 116 | % | | | 128 | % | | | 172 | % | | | 151 | % |
Net assets, end of period (000s omitted) | | | $383,056 | | | | $543,933 | | | | $988,633 | | | | $473,777 | | | | $443,931 | | | | $539,373 | |
| 1. | Calculated based upon average shares outstanding |
| 2. | Amount is less than $0.005. |
| 3. | Returns for periods of less than one year are not annualized. |
The accompanying notes are an integral part of these financial statements.
| | | | |
| 20 | | Wells Fargo Advantage Capital Growth Fund | | Financial highlights |
(For a share outstanding throughout each period)
| | | | | | | | | | | | | | | | | | | | | | | | |
| | | Six months ended
January 31, 2013
(unaudited) | | | Year ended July 31 | |
| INVESTOR CLASS | | | 2012 | | | 2011 | | | 2010 | | | 2009 | | | 2008 | |
Net asset value, beginning of period | | $ | 16.65 | | | $ | 16.18 | | | $ | 13.02 | | | $ | 11.79 | | | $ | 17.56 | | | $ | 18.64 | |
Net investment income (loss) | | | 0.00 | 1 ,2 | | | (0.06 | )1 | | | (0.08 | )1 | | | (0.08 | )1 | | | (0.01 | )1 | | | (0.10 | )1 |
Net realized and unrealized gains (losses) on investments | | | 1.19 | | | | 0.53 | | | | 3.24 | | | | 1.31 | | | | (5.25 | ) | | | 0.06 | |
| | | | | | | | | | | | | | | | | | | | | | | | |
Total from investment operations | | | 1.19 | | | | 0.47 | | | | 3.16 | | | | 1.23 | | | | (5.26 | ) | | | (0.04 | ) |
Distributions to shareholders from | | | | | | | | | | | | | | | | | | | | | | | | |
Net realized gains | | | (0.30 | ) | | | 0.00 | | | | 0.00 | | | | 0.00 | | | | (0.51 | ) | | | (1.04 | ) |
Net asset value, end of period | | $ | 17.54 | | | $ | 16.65 | | | $ | 16.18 | | | $ | 13.02 | | | $ | 11.79 | | | $ | 17.56 | |
Total return3 | | | 7.27 | % | | | 2.90 | % | | | 24.37 | % | | | 10.35 | % | | | (29.30 | )% | | | (0.68 | )% |
Ratios to average net assets (annualized) | | | | | | | | | | | | | | | | | | | | | | | | |
Gross expenses | | | 1.31 | % | | | 1.28 | % | | | 1.28 | % | | | 1.36 | % | | | 1.41 | % | | | 1.42 | % |
Net expenses | | | 1.24 | % | | | 1.27 | % | | | 1.27 | % | | | 1.35 | % | | | 1.36 | % | | | 1.39 | % |
Net investment income (loss) | | | 0.03 | % | | | (0.37 | )% | | | (0.55 | )% | | | (0.64 | )% | | | (0.12 | )% | | | (0.54 | )% |
Supplemental data | | | | | | | | | | | | | | | | | | | | | | | | |
Portfolio turnover rate | | | 53 | % | | | 116 | % | | | 116 | % | | | 128 | % | | | 172 | % | | | 151 | % |
Net assets, end of period (000s omitted) | | | $80,531 | | | | $81,199 | | | | $96,941 | | | | $104,200 | | | | $220,008 | | | | $379,966 | |
| 1. | Calculated based upon average shares outstanding |
| 2. | Amount is less than $0.005. |
| 3. | Returns for periods of less than one year are not annualized. |
The accompanying notes are an integral part of these financial statements.
| | | | | | |
| Notes to financial statements (unaudited) | | Wells Fargo Advantage Capital Growth Fund | | | 21 | |
1. ORGANIZATION
Wells Fargo Funds Trust (the “Trust”), a Delaware statutory trust organized on March 10, 1999, is an open-end management investment company registered under the Investment Company Act of 1940, as amended (the “1940 Act”). These financial statements report on Wells Fargo Advantage Capital Growth Fund (the “Fund”) which is a diversified series of the Trust.
2. SIGNIFICANT ACCOUNTING POLICIES
The following significant accounting policies, which are consistently followed in the preparation of the financial statements of the Fund, are in conformity with U.S. generally accepted accounting principles which require management to make estimates and assumptions that affect the reported amounts of assets and liabilities, disclosure of contingent assets and liabilities at the date of the financial statements, and the reported amounts of revenues and expenses during the reporting period. Actual results could differ from those estimates.
Securities valuation
All investments are valued each business day as of the close of regular trading on the New York Stock Exchange (normally 4 p.m. Eastern Time).
Equity securities that are listed on a foreign or domestic exchange, except for The Nasdaq Stock Market, Inc. (“Nasdaq”), are valued at the official closing price or, if none, the last sales price. Securities listed on Nasdaq are valued at the Nasdaq Official Closing Price (“NOCP”). If no NOCP is available, securities are valued at the last sales price. If no sales price is shown on the Nasdaq, the bid price will be used. If no sale occurs on the primary exchange or market for the security that day or if no sale occurs and no bid price is shown on Nasdaq, the prior day’s price will be deemed “stale” and fair values will be determined in accordance with the Fund’s Valuation Procedures.
Investments in registered open-end investment companies are valued at net asset value. Non-registered investment companies are fair valued at net asset value.
Investments which are not valued using any of the methods discussed above are valued at their fair value, as determined by procedures established in good faith and approved by the Board of Trustees. The Board of Trustees has established a Valuation Committee comprised of the Trustees and has delegated to it the authority to take any actions regarding the valuation of portfolio securities that the Valuation Committee deems necessary or appropriate, including determining the fair value of portfolio securities, unless the determination has been delegated to the Management Valuation Team of Wells Fargo Funds Management, LLC (“Funds Management”). The Board of Trustees retains the authority to make or ratify any valuation decisions or approve any changes to the Valuation Procedures as it deems appropriate. On a quarterly basis, the Board of Trustees receives reports on any valuation actions taken by the Valuation Committee or the Management Valuation Team which may include items for ratification.
Valuations of fair valued securities are compared to the next actual sales price when available, or other appropriate market information to assess the continued appropriateness of the fair valuation methodology used. These securities are fair valued on a day-to-day basis, taking into consideration changes to appropriate market information and any significant changes to the input factors considered in the valuation process until there is a readily available price provided on the exchange or by an independent pricing service. Valuations received from an independent pricing service or broker quotes are periodically validated by comparisons to most recent trades and valuations provided by other independent pricing services in addition to the review of prices by the adviser and/or subadviser. Unobservable inputs used in determining fair valuations are identified based on the type of security, taking into consideration factors utilized by market participants in valuing the investment, knowledge about the issuer and the current market environment.
Security loans
The Fund may lend its securities from time to time in order to earn additional income in the form of fees or interest on securities received as collateral or the investment of any cash received as collateral. The Fund continues to receive interest or dividends on the securities loaned. The Fund receives collateral in the form of cash or securities with a value at least equal to the value of the securities on loan. The value of the loaned securities is determined at the close of each business day and any additional required collateral is delivered to the Fund on the next business day. In a securities lending transaction, the net asset value of the Fund will be affected by an increase or decrease in the value of the securities loaned and by an increase or decrease in the value of the instrument in which collateral is invested. The amount of securities lending activity undertaken by the Fund fluctuates from time to time. In the event of default or bankruptcy by the borrower, the Fund may be prevented from recovering the loaned securities or gaining access to the collateral or may experience delays or costs in doing so. In addition, the investment of any cash collateral received may lose all or part of its value. The Fund has the right under the lending agreement to recover the securities from the borrower on demand.
| | | | |
| 22 | | Wells Fargo Advantage Capital Growth Fund | | Notes to financial statements (unaudited) |
The Fund lends its securities through an unaffiliated securities lending agent. Cash collateral received in connection with its securities lending transactions is invested in Wells Fargo Securities Lending Cash Investments, LLC (the “Cash Collateral Fund”). The Cash Collateral Fund is exempt from registration under Section 3(c)(7) of the 1940 Act and is managed by Funds Management and is subadvised by Wells Capital Management Incorporated (“WellsCap”). Funds Management receives an advisory fee starting at 0.05% and declining to 0.01% as the average daily net assets of the Cash Collateral Fund increase. All of the fees received by Funds Management are paid to WellsCap for its services as subadviser. The Cash Collateral Fund seeks to provide a positive return compared to the daily Fed Funds Open rate by investing in high-quality, U.S. dollar-denominated short-term money market instruments. Cash Collateral Fund investments are fair valued based upon the amortized cost valuation technique. Income earned from investment in the Cash Collateral Fund is included in securities lending income on the Statement of Operations.
Security transactions and income recognition
Securities transactions are recorded on a trade date basis. Realized gains or losses are recorded on the basis of identified cost.
Dividend income is recognized on the ex-dividend date.
Distributions to shareholders
Distributions to shareholders from net investment income and net realized gains, if any, are recorded on the ex-dividend date. Such distributions are determined in conformity with federal income tax regulations, which may differ in amount or character from net investment income and realized gains recognized for purposes of U.S. generally accepted accounting principles.
Federal and other taxes
The Fund intends to continue to qualify as a regulated investment company by distributing substantially all of its investment company taxable income and any net realized capital gains (after reduction for capital loss carryforwards) sufficient to relieve it from all, or substantially all, federal income taxes. Accordingly, no provision for federal income taxes was required.
The Fund’s income and federal excise tax returns and all financial records supporting those returns for the prior three fiscal years are subject to examination by the federal and Delaware revenue authorities. Management has analyzed the Fund’s tax positions taken on federal, state, and foreign tax returns for all open tax years and does not believe that there are any uncertain tax positions that require recognition of a tax liability.
As of July 31, 2012, the Fund had pre-enactment capital loss carryforwards incurred in taxable years beginning before December 22, 2010, which are available to offset future net realized capital gains, in the amount of $35,603,034 with $3,347,360 expiring in 2015; $5,625,700 expiring in 2016; and $26,629,974 expiring in 2018.
Class allocations
The separate classes of shares offered by the Fund differ principally in applicable sales charges, distribution, shareholder servicing, and administration fees. Shareholders of each class bear certain expenses that pertain to that particular class. All shareholders bear the common expenses of the Fund, earn income from the portfolio, and are allocated any unrealized gains and losses pro rata based on the average daily net assets of each class, without distinction between share classes. Dividends are determined separately for each class based on income and expenses allocable to each class. Realized gains and losses are allocated to each class pro rata based upon the net assets of each class on the date realized. Differences in per share dividend rates generally result from the relative weightings of pro rata income and realized gain allocations and from differences in separate class expenses, including distribution, shareholder servicing, and administration fees.
3. FAIR VALUATION MEASUREMENTS
Fair value measurements of investments are determined within a framework that has established a fair value hierarchy based upon the various data inputs utilized in determining the value of the Fund’s investments. The three-level hierarchy gives the highest priority to unadjusted quoted prices in active markets for identical assets or liabilities (Level 1) and the lowest priority to significant unobservable inputs (Level 3). The Fund’s investments are classified within the fair value hierarchy based on the lowest level of input that is significant to the fair value measurement. The inputs are summarized into three broad levels as follows:
| n | | Level 1 – quoted prices in active markets for identical securities |
| n | | Level 2 – other significant observable inputs (including quoted prices for similar securities, interest rates, prepayment speeds, credit risk, use of amortized cost, etc.) |
| n | | Level 3 – significant unobservable inputs (including the Fund’s own assumptions in determining the fair value of investments) |
The inputs or methodologies used for valuing investments in securities are not necessarily an indication of the risk associated with investing in those securities.
| | | | | | |
| Notes to financial statements (unaudited) | | Wells Fargo Advantage Capital Growth Fund | | | 23 | |
As of January 31, 2013, the inputs used in valuing investments in securities, which are carried at fair value, were as follows:
| | | | | | | | | | | | | | | | |
| Investments in securities | | Quoted prices (Level 1) | | | Significant other
observable Inputs (Level 2) | | | Significant unobservable inputs (Level 3) | | | Total | |
| | | | |
Equity securities | | | | | | | | | | | | | | | | |
Common stocks | | $ | 546,113,841 | | | $ | 0 | | | $ | 0 | | | $ | 546,113,841 | |
| | | | |
Other | | | 0 | | | | 0 | | | | 1,313,328 | | | | 1,313,328 | |
| | | | |
Short-term investments | | | | | | | | | | | | | | | | |
Investment companies | | | 8,808,573 | | | | 93,095,489 | | | | 0 | | | | 101,904,062 | |
| | | $ | 554,922,414 | | | $ | 93,095,489 | | | $ | 1,313,328 | | | $ | 649,331,231 | |
Further details on the major security types listed above can be found in the Portfolio of Investments.
Transfers in and transfers out are recognized at the end of the reporting period. For the six months ended January 31, 2013, the Fund did not have any transfers into/out of Level 1 or Level 2.
4. TRANSACTIONS WITH AFFILIATES AND OTHER EXPENSES
Advisory fee
The Trust has entered into an advisory contract with Funds Management, an indirect wholly owned subsidiary of Wells Fargo & Company (“Wells Fargo”). The adviser is responsible for implementing investment policies and guidelines and for supervising the subadviser, who is responsible for day-to-day portfolio management of the Fund.
Pursuant to the contract, Funds Management is entitled to receive an annual advisory fee starting at 0.65% and declining to 0.55% as the average daily net assets of the Fund increase. For the six months ended January 31, 2013, the advisory fee was equivalent to an annual rate of 0.64% of the Fund’s average daily net assets.
Funds Management has retained the services of a subadviser to provide daily portfolio management to the Fund. The fee for subadvisory services is borne by Funds Management. WellsCap, an affiliate of Funds Management, is the subadviser to the Fund and is entitled to receive a fee from Funds Management at an annual rate starting at 0.35% and declining to 0.15% as the average daily net assets of the Fund increase.
Administration and transfer agent fees
The Trust has entered into an administration agreement with Funds Management. Under this agreement, for providing administrative services, which includes paying fees and expenses for services provided by the transfer agent, sub-transfer agents, omnibus account servicers and record-keepers, Funds Management is entitled to receive from the Fund an annual fund level administration fee starting at 0.05% and declining to 0.03% as the average daily net assets of the Fund increase and a class level administration fee which is calculated based on the average daily net assets of each class as follows:
| | | | |
| | | Class level
administration fee | |
Class A, Class C | | | 0.26 | % |
Class R4, Institutional Class | | | 0.08 | |
Class R6 | | | 0.03 | |
Administrator Class | | | 0.10 | |
Investor Class | | | 0.32 | |
Funds Management has contractually waived and/or reimbursed advisory and administration fees to the extent necessary to maintain certain net operating expense ratios for the Fund. Waiver of fees and/or reimbursement of expenses by Funds Management were made first from fund level expenses on a proportionate basis and then from class specific expenses. Funds Management has committed through November 30, 2014 to waive fees and/or reimburse expenses to the extent necessary to cap the Fund’s expenses at 1.11% for Class A shares, 1.86% for Class C shares, 0.75% for Class R4 shares, 0.60% for Class R6 shares, 0.90% for Administrator Class shares, 0.65% for Institutional Class shares, and 1.17% for Investor Class shares.
| | | | |
| 24 | | Wells Fargo Advantage Capital Growth Fund | | Notes to financial statements (unaudited) |
Distribution fees
The Trust has adopted a Distribution Plan for Class C shares of the Fund pursuant to Rule 12b-1 under the 1940 Act. Distribution fees are charged to Class C shares and paid to Wells Fargo Funds Distributor, LLC, the principal underwriter, at an annual rate of 0.75% of the average daily net assets of Class C shares.
For the six months ended January 31, 2013, Wells Fargo Funds Distributor, LLC received $1,019 from the sale of Class A shares.
Shareholder servicing fees
The Trust has entered into contracts with one or more shareholder servicing agents, whereby Class A, Class C, Administrator Class, and Investor Class of the Fund is charged a fee at an annual rate of 0.25% of the average daily net assets of each respective class. Class R4 shares are charged a fee at an annual rate of 0.10% of its average daily net assets.
A portion of these total shareholder servicing fees were paid to affiliates of Wells Fargo.
5. INVESTMENT PORTFOLIO TRANSACTIONS
Purchases and sales of investments, excluding U.S. government obligations (if any) and short-term securities, for the six months ended January 31, 2013 were $322,033,812 and $513,136,158, respectively.
6. CAPITAL SHARES
As a result of the transfer of assets from Funds Management, former program manager of the 529 college savings plans for the State of Wisconsin, to a new program manager, the Fund redeemed assets from its Institutional Class on October 26, 2012 with a value of $167,017,167, representing 23.6% of the Fund. This amount is reflected in the Statement of Changes in Net Assets for the six months ended January 31, 2013.
7. BANK BORROWINGS
The Trust (excluding the money market funds and certain other funds in the Trust) and Wells Fargo Variable Trust are parties to a $150,000,000 revolving credit agreement with State Street Bank and Trust Company, whereby the Fund is permitted to use bank borrowings for temporary or emergency purposes, such as to fund shareholder redemption requests. Interest under the credit agreement is charged to the Fund based on a borrowing rate equal to the higher of the Federal Funds rate in effect on that day plus 1.25% or the overnight LIBOR rate in effect on that day plus 1.25%. In addition, an annual commitment fee equal to 0.10% of the unused balance is allocated to each participating fund. For the six months ended January 31, 2013, the Fund paid $318 in commitment fees.
For the six months ended January 31, 2013, there were no borrowings by the Fund under the agreement.
8. INDEMNIFICATION
Under the Trust’s organizational documents, the officers and directors are indemnified against certain liabilities that may arise out of performance of their duties to the Trust. Additionally, in the normal course of business, the Trust may enter into contracts with service providers that contain a variety of indemnification clauses. The Trust’s maximum exposure under these arrangements is dependent on future claims that may be made against the Fund and, therefore, cannot be estimated.
9. NEW ACCOUNTING PRONOUNCEMENT
In December 2011, the Financial Accounting Standards Board (“FASB”) issued Accounting Standard Update (“ASU”) No. 2011-11, Disclosures about Offsetting Assets and Liabilities. ASU 2011-11, which amends FASB ASC Topic 210, Balance Sheet, creates new disclosure requirements which require entities to disclose both gross and net information for derivatives and other financial instruments that are either offset in the Statement of Assets and Liabilities or subject to an enforceable master netting arrangement or similar agreement. The disclosure requirements are effective for interim and annual reporting periods beginning on or after January 1, 2013. Management is currently assessing the potential impact, in addition to expanded financial statement disclosure, that may result from adopting this ASU.
| | | | | | |
| Other information (unaudited) | | Wells Fargo Advantage Capital Growth Fund | | | 25 | |
PROXY VOTING INFORMATION
A description of the policies and procedures that the Fund uses to determine how to vote proxies relating to portfolio securities is available without charge, upon request, by calling 1-800-222-8222, visiting our website at wellsfargoadvantagefunds.com, or visiting the SEC website at sec.gov. Information regarding how the Fund voted proxies relating to portfolio securities during the most recent 12-month period ended June 30 is available without charge on the Fund’s website at wellsfargoadvantagefunds.com or by visiting the SEC website at sec.gov.
PORTFOLIO HOLDINGS INFORMATION
The complete portfolio holdings for the Fund are publicly available on the Fund’s website (wellsfargoadvantagefunds.com) on a monthly, 30-day or more delayed basis. In addition, top ten holdings information for the Fund is publicly available on the Fund’s website on a monthly, seven-day or more delayed basis. The Fund files its complete schedule of portfolio holdings with the SEC for the first and third quarters of each fiscal year on Form N-Q, which is available without charge by visiting the SEC website at sec.gov. In addition, the Fund’s Form N-Q may be reviewed and copied at the SEC’s Public Reference Room in Washington, DC, and at regional offices in New York City,at 233 Broadway, and in Chicago, at 175 West Jackson Boulevard, Suite 900. Information about the Public Reference Room may be obtained by calling 1-800-SEC-0330.
| | | | |
| 26 | | Wells Fargo Advantage Capital Growth Fund | | Other information (unaudited) |
BOARD OF TRUSTEES AND OFFICERS
Each of the Trustees and Officers listed in the table below acts in identical capacities for the Wells Fargo Advantage family of funds, which consists of 136 funds1 comprising the Wells Fargo Funds Trust, Wells Fargo Variable Trust, Wells Fargo Master Trust and four closed-end funds (collectively the “Fund Complex”). This table should be read in conjunction with the Prospectus and the Statement of Additional Information2. All of the Trustees are also Members of the Audit and Governance Committees of each Trust in the Fund Complex. The mailing address of each Trustee and Officer is 525 Market Street, 12th Floor, San Francisco, CA 94105. Each Trustee and Officer serves an indefinite term, however, each Trustee serves such term until reaching the mandatory retirement age established by the Trustees.
Independent Trustees
| | | | | | |
Name and year of birth | | Position held and length of service* | | Principal occupations during past five years | | Other directorships during
past five years |
| Peter G. Gordon (Born 1942) | | Trustee, since 1998; Chairman, since 2005 | | Co-Founder, Retired Chairman, President and CEO of Crystal Geyser Water Company. Trustee Emeritus, Colby College. | | Asset Allocation Trust |
| Isaiah Harris, Jr. (Born 1952) | | Trustee, since 2009 | | Retired. Prior thereto, President and CEO of BellSouth Advertising and Publishing Corp. from 2005 to 2007, President and CEO of BellSouth Enterprises from 2004 to 2005 and President of BellSouth Consumer Services from 2000 to 2003. Emeritus member of the Iowa State University Foundation Board of Governors. Emeritus Member of the Advisory Board of Iowa State University School of Business. Advisory Board Member, Palm Coast Academy (charter school). Mr. Harris is a certified public accountant. | | CIGNA Corporation; Deluxe Corporation; Asset Allocation Trust |
| Judith M. Johnson (Born 1949) | | Trustee, since 2008; Audit Committee Chairman, since 2008 | | Retired. Prior thereto, Chief Executive Officer and Chief Investment Officer of Minneapolis Employees Retirement Fund from 1996 to 2008. Ms. Johnson is an attorney, certified public accountant and a certified managerial accountant. | | Asset Allocation Trust |
| Leroy Keith, Jr. (Born 1939) | | Trustee, since 2010 | | Chairman, Bloc Global Services (development and construction). Trustee of the Evergreen Funds from 1983 to 2010. Former Managing Director, Almanac Capital Management (commodities firm), former Partner, Stonington Partners, Inc. (private equity fund), former Director, Obagi Medical Products Co. and former Director, Lincoln Educational Services. | | Trustee, Virtus Fund Complex (consisting of 48 portfolios as of 1/31/13); Asset Allocation Trust |
| David F. Larcker (Born 1950) | | Trustee, since 2009 | | James Irvin Miller Professor of Accounting at the Graduate School of Business, Stanford University, Morgan Stanley Director of the Center for Leadership Development and Research and Senior Faculty of The Rock Center for Corporate Governance since 2006. From 2005 to 2008, Professor of Accounting at the Graduate School of Business, Stanford University. Prior thereto, Ernst & Young Professor of Accounting at The Wharton School, University of Pennsylvania from 1985 to 2005. | | Asset Allocation Trust |
| Olivia S. Mitchell (Born 1953) | | Trustee, since 2006 | | International Foundation of Employee Benefit Plans Professor, Wharton School of the University of Pennsylvania since 1993. Director of Wharton’s Pension Research Council and Boettner Center on Pensions & Retirement Research, and Research Associate at the National Bureau of Economic Research. Previously, Cornell University Professor from 1978 to 1993. | | Asset Allocation Trust |
| Timothy J. Penny (Born 1951) | | Trustee, since 1996 | | President and CEO of Southern Minnesota Initiative Foundation, a non-profit organization, since 2007 and Senior Fellow at the Humphrey Institute Policy Forum at the University of Minnesota since 1995. Member of the Board of Trustees of NorthStar Education Finance, Inc., a non-profit organization, since 2007. | | Asset Allocation Trust |
| | | | | | |
| Other information (unaudited) | | Wells Fargo Advantage Capital Growth Fund | | | 27 | |
| | | | | | |
Name and year of birth | | Position held and length of service* | | Principal occupations during past five years | | Other directorships during
past five years |
| Michael S. Scofield (Born 1943) | | Trustee, since 2010 | | Served on the Investment Company Institute’s Board of Governors and Executive Committee from 2008-2011 as well the Governing Council of the Independent Directors Council from 2006-2011 and the Independent Directors Council Executive Committee from 2008-2011. Chairman of the IDC from 2008-2010. Institutional Investor (Fund Directions) Trustee of Year in 2007. Trustee of the Evergreen Funds (and its predecessors) from 1984 to 2010. Chairman of the Evergreen Funds from 2000-2010. Former Trustee of the Mentor Funds. Retired Attorney, Law Offices of Michael S. Scofield. | | Asset Allocation Trust |
| Donald C. Willeke (Born 1940) | | Trustee, since 1996 | | Principal of the law firm of Willeke & Daniels. General Counsel of the Minneapolis Employees Retirement Fund from 1984 until its consolidation into the Minnesota Public Employees Retirement Association on June 30, 2010. Director and Vice Chair of The Tree Trust (non-profit corporation). Director of the American Chestnut Foundation (non-profit corporation). | | Asset Allocation Trust |
| * | Length of service dates reflect the Trustee’s commencement of service with the Trust’s predecessor entities, where applicable. |
Officers
| | | | | | |
Name and year of birth | | Position held and length of service | | Principal occupations during past five years | | |
| Karla M. Rabusch (Born 1959) | | President, since 2003 | | Executive Vice President of Wells Fargo Bank, N.A. and President of Wells Fargo Funds Management, LLC since 2003. | | |
| Jeremy DePalma1 (Born 1974) | | Treasurer, since 2012 | | Senior Vice President of Wells Fargo Funds Management, LLC since 2009. Senior Vice President of Evergreen Investment Management Company, LLC from 2008 to 2010. Vice President, Evergreen Investment Services, Inc. from 2004 to 2007. Head of the Fund Reporting and Control Team within Fund Administration from 2005 to 2010. | | |
| C. David Messman (Born 1960) | | Secretary, since 2000; Chief Legal Officer, since 2003 | | Senior Vice President and Secretary of Wells Fargo Funds Management, LLC since 2001. Vice President and Managing Counsel of Wells Fargo Bank, N.A. since 1996. | | |
| Debra Ann Early (Born 1964) | | Chief Compliance Officer, since 2007 | | Chief Compliance Officer of Wells Fargo Funds Management, LLC since 2007. Chief Compliance Officer of Parnassus Investments from 2005 to 2007. Chief Financial Officer of Parnassus Investments from 2004 to 2007. | | |
| David Berardi (Born 1975) | | Assistant Treasurer, since 2009 | | Vice President of Wells Fargo Funds Management, LLC since 2009. Vice President of Evergreen Investment Management Company, LLC from 2008 to 2010. Assistant Vice President of Evergreen Investment Services, Inc. from 2004 to 2008. Manager of Fund Reporting and Control for Evergreen Investment Management Company, LLC from 2004 to 2010. | | |
| 1. | Jeremy DePalma acts as Treasurer of 61 funds and Assistant Treasurer of 75 funds in the Fund Complex. |
| 2. | The Statement of Additional Information includes additional information about the Trustees and is available, without charge, upon request, by calling 1-800-222-8222 or by visiting the website at wellsfargoadvantagefunds.com. |
| | | | |
| 28 | | Wells Fargo Advantage Pennsylvania Tax-Free Fund | | List of abbreviations |
The following is a list of common abbreviations for terms and entities that may have appeared in this report.
| ACA | — ACA Financial Guaranty Corporation |
| ADR | — American depositary receipt |
| ADS | — American depositary shares |
| AGC | — Assured Guaranty Corporation |
| AGM | — Assured Guaranty Municipal |
| Ambac | — Ambac Financial Group Incorporated |
| AMT | — Alternative minimum tax |
| BAN | — Bond anticipation notes |
| BHAC | — Berkshire Hathaway Assurance Corporation |
| CAB | — Capital appreciation bond |
| CCAB | — Convertible capital appreciation bond |
| CDA | — Community Development Authority |
| CDO | — Collateralized debt obligation |
| COP | — Certificate of participation |
| DRIVER | — Derivative inverse tax-exempt receipts |
| DW&P | — Department of Water & Power |
| DWR | — Department of Water Resources |
| ECFA | — Educational & Cultural Facilities Authority |
| EDA | — Economic Development Authority |
| EDFA | — Economic Development Finance Authority |
| ETF | — Exchange-traded fund |
| FDIC | — Federal Deposit Insurance Corporation |
| FFCB | — Federal Farm Credit Banks |
| FGIC | — Financial Guaranty Insurance Corporation |
| FHA | — Federal Housing Administration |
| FHLB | — Federal Home Loan Bank |
| FICO | — The Financing Corporation |
| FNMA | — Federal National Mortgage Association |
| GDR | — Global depositary receipt |
| GNMA | — Government National Mortgage Association |
| HCFR | — Healthcare facilities revenue |
| HEFA | — Health & Educational Facilities Authority |
| HEFAR | — Higher education facilities authority revenue |
| HFA | — Housing Finance Authority |
| HFFA | — Health Facilities Financing Authority |
| HUD | — Department of Housing and Urban Development |
| IDA | — Industrial Development Authority |
| IDAG | — Industrial Development Agency |
| IDR | — Industrial development revenue |
| KRW | — Republic of Korea won |
| LIBOR | — London Interbank Offered Rate |
| LLC | — Limited liability company |
| LLP | — Limited liability partnership |
| MBIA | — Municipal Bond Insurance Association |
| MFHR | — Multifamily housing revenue |
| MSTR | — Municipal securities trust receipts |
| MUD | — Municipal Utility District |
| National | — National Public Finance Guarantee Corporation |
| PCFA | — Pollution Control Financing Authority |
| PCL | — Public Company Limited |
| PCR | — Pollution control revenue |
| PFA | — Public Finance Authority |
| PFFA | — Public Facilities Financing Authority |
| PFOTER | — Puttable floating option tax-exempt receipts |
| plc | — Public limited company |
| PUTTER | — Puttable tax-exempt receipts |
| R&D | — Research & development |
| Radian | — Radian Asset Assurance |
| RAN | — Revenue anticipation notes |
| RDA | — Redevelopment Authority |
| RDFA | — Redevelopment Finance Authority |
| REIT | — Real estate investment trust |
| ROC | — Reset option certificates |
| SAVRS | — Select auction variable rate securities |
| SBA | — Small Business Authority |
| SFHR | — Single-family housing revenue |
| SFMR | — Single-family mortgage revenue |
| SPA | — Standby purchase agreement |
| SPDR | — Standard & Poor’s Depositary Receipts |
| STRIPS | — Separate trading of registered interest and principal securities |
| TAN | — Tax anticipation notes |
| TIPS | — Treasury inflation-protected securities |
| TRAN | — Tax revenue anticipation notes |
| TTFA | — Transportation Trust Fund Authority |
| TVA | — Tennessee Valley Authority |
This page is intentionally left blank.
This page is intentionally left blank.


For more information
More information about Wells Fargo Advantage Funds is available free upon request. To obtain literature, please write, email, visit the Fund’s website, or call:
Wells Fargo Advantage Funds
P.O. Box 8266
Boston, MA 02266-8266
Email: wfaf@wellsfargo.com
Website: wellsfargoadvantagefunds.com
Individual investors: 1-800-222-8222
Retail investment professionals: 1-888-877-9275
Institutional investment professionals: 1-866-765-0778
This report and the financial statements contained herein are submitted for the general information of the shareholders of Wells Fargo Advantage Funds. If this report is used for promotional purposes, distribution of the report must be accompanied or preceded by a current prospectus. For a current prospectus and, if available, a summary prospectus containing more complete information, including charges and expenses, call 1-800-222-8222 or visit the Fund’s website at wellsfargoadvantagefunds.com. Please consider the investment objectives, risks, charges, and expenses of the investment carefully before investing. This and other information about Wells Fargo Advantage Funds can be found in the current prospectus. Read the prospectus carefully before you invest or send money.
Wells Fargo Funds Management, LLC, a wholly owned subsidiary of Wells Fargo & Company, provides investment advisory and administrative services for Wells Fargo Advantage Funds. Other affiliates of Wells Fargo & Company provide subadvisory and other services for the Funds. The Funds are distributed by Wells Fargo Funds Distributor, LLC, Member FINRA/SIPC, an affiliate of Wells Fargo & Company.
NOT FDIC INSURED ¡ NO BANK GUARANTEE ¡ MAY LOSE VALUE
© 2013 Wells Fargo Funds Management, LLC. All rights reserved.
| | |
 | | 215101 03-13 SA200/SAR200 1-13 |

Wells Fargo Advantage
Disciplined U.S. Core Fund

Semi-Annual Report
January 31, 2013

Reduce clutter. Save trees.
Sign up for electronic delivery of prospectuses and shareholder reports at wellsfargo.com/advantagedelivery
Contents
The views expressed and any forward-looking statements are as of January 31, 2013, unless otherwise noted, and are those of the Fund managers and/or Wells Fargo Funds Management, LLC. Discussions of individual securities, or the markets generally, or any Wells Fargo Advantage Fund are not intended as individual recommendations. Future events or results may vary significantly from those expressed in any forward-looking statements; the views expressed are subject to change at any time in response to changing circumstances in the market. Wells Fargo Funds Management, LLC, disclaims any obligation to publicly update or revise any views expressed or forward-looking statements.
NOT FDIC INSURED ¡ NO BANK GUARANTEE ¡ MAY LOSE VALUE

Wells Fargo investment history
| | |
| 1932 | | Keystone creates one of the first mutual fund families. |
| 1971 | | Wells Fargo & Company introduces one of the first institutional index funds. |
| 1978 | | Wells Fargo applies Markowitz and Sharpe’s research on Modern Portfolio Theory to introduce one of the industry’s first tactical asset allocation models in institutional separately managed accounts. |
| 1984 | | Wells Fargo Stagecoach Funds launches its first asset allocation fund. |
| 1989 | | The Tactical Asset Allocation (TAA) Model is first applied to Wells Fargo’s asset allocation mutual funds. |
| 1994 | | Wells Fargo introduces the LifePath Funds, one of the first suites of target date funds (now the Wells Fargo Advantage Dow Jones Target Date FundsSM). |
| 1996 | | Evergreen Investments and Keystone Funds merge. |
| 1997 | | Wells Fargo launches the Wells Fargo Advantage WealthBuilder PortfoliosSM, a fund-of-funds suite of products that includes the use of quantitative models to shift assets among investment styles. |
| 1999 | | Norwest Advantage Funds and Stagecoach Funds are reorganized into Wells Fargo Funds after the merger of Norwest and Wells Fargo. |
| 2002 | | Evergreen Retail and Evergreen Institutional companies form the umbrella asset management company, Evergreen Investments. |
| 2005 | | The integration of Strong Funds with Wells Fargo Funds creates Wells Fargo Advantage Funds, resulting in one of the top 20 mutual fund companies in the United States. |
| 2006 | | Wells Fargo Advantage Funds relaunches the target date product line as Wells Fargo Advantage Dow Jones Target Date Funds. |
| 2010 | | The mergers and reorganizations of Evergreen and Wells Fargo Advantage mutual funds are completed, unifying the families under the brand of Wells Fargo Advantage Funds. |
Wells Fargo Advantage Funds®
Wells Fargo Advantage Funds skillfully guides institutions, financial advisors, and individuals through the investment terrain to help them reach their financial objectives. Everything we do on behalf of investors is backed by our unique combination of qualifications.
Strength
Our organization is built on the standards of integrity and service established by our parent company—Wells Fargo & Company—more than 150 years ago. And, because we’re part of a highly diversified financial enterprise, we offer the depth of resources to help investors succeed.
Expertise
Our multi-boutique model offers investors access to the independent thinking of premier investment managers that have been chosen for their time-tested strategies. While each team specializes in a specific investment strategy, collectively they provide investors a wide choice of distinct investment styles. Our dedication to investment excellence doesn’t end with our expertise in manager selection—risk management, analysis, and rigorous ongoing review seek to ensure each manager’s investment process remains consistent.
Partnership
Our collaborative approach is built around understanding the needs and goals of our clients. By adhering to core principles of sound judgment and steady guidance, we support you through every stage of the investment decision process.
Carefully consider the investment objectives, risks, charges, and expenses before investing. For a current prospectus and, if available, a summary prospectus, for Wells Fargo Advantage Funds, containing this and other information, visit wellsfargoadvantagefunds.com. Read it carefully before investing.
Wells Fargo Funds Management, LLC, a wholly owned subsidiary of Wells Fargo & Company, provides investment advisory and administrative services for Wells Fargo Advantage Funds. Other affiliates of Wells Fargo & Company provide subadvisory and other services for the Funds. The Funds are distributed by Wells Fargo Funds Distributor, LLC, Member FINRA/SIPC, an affiliate of Wells Fargo & Company.
“Dow Jones®” and “Dow Jones Target Date IndexesSM” are service marks of Dow Jones Trademark Holdings LLC (“Dow Jones”); have been licensed to CME Group Index Services LLC (“CME Indexes”); and have been sublicensed for use for certain purposes by Global Index Advisors, Inc., and Wells Fargo Funds Management, LLC. The Wells Fargo Advantage Dow Jones Target Date FundsSM, based on the Dow Jones Target Date Indexes, are not sponsored, endorsed, sold, or promoted by Dow Jones, CME Indexes, or their respective affiliates, and none of them makes any representation regarding the advisability of investing in such product(s).
NOT FDIC INSURED ¡ NO BANK GUARANTEE ¡ MAY LOSE VALUE
Not part of the semi-annual report.
Wells Fargo Advantage Funds offers more than 110 mutual funds across a wide range of asset classes, representing over $226 billion in assets under management, as of January 31, 2013.
| | | | |
| Equity funds | | | | |
Asia Pacific Fund | | Enterprise Fund† | | Opportunity Fund† |
C&B Large Cap Value Fund | | Global Opportunities Fund | | Precious Metals Fund |
C&B Mid Cap Value Fund | | Growth Fund | | Premier Large Company Growth Fund |
Capital Growth Fund | | Index Fund | | Small Cap Opportunities Fund |
Common Stock Fund | | International Equity Fund | | Small Cap Value Fund |
Disciplined U.S. Core Fund | | International Value Fund | | Small Company Growth Fund |
Discovery Fund† | | Intrinsic Small Cap Value Fund | | Small Company Value Fund |
Diversified Equity Fund | | Intrinsic Value Fund | | Small/Mid Cap Value Fund |
Diversified International Fund | | Intrinsic World Equity Fund | | Special Mid Cap Value Fund |
Emerging Growth Fund | | Large Cap Core Fund | | Special Small Cap Value Fund |
Emerging Markets Equity Fund | | Large Cap Growth Fund | | Specialized Technology Fund |
Emerging Markets Equity Income Fund | | Large Company Value Fund | | Traditional Small Cap Growth Fund |
Endeavor Select Fund† | | Omega Growth Fund | | Utility and Telecommunications Fund |
| Bond funds | | | | |
Adjustable Rate Government Fund | | High Yield Municipal Bond Fund | | Short Duration Government Bond Fund |
California Limited-Term Tax-Free Fund | | Income Plus Fund | | Short-Term Bond Fund |
California Tax-Free Fund | | Inflation-Protected Bond Fund | | Short-Term High Yield Bond Fund |
Colorado Tax-Free Fund | | Intermediate Tax/AMT-Free Fund | | Short-Term Municipal Bond Fund |
Core Bond Fund | | International Bond Fund | | Strategic Income Fund |
Emerging Markets Local Bond Fund | | Minnesota Tax-Free Fund | | Strategic Municipal Bond Fund |
Government Securities Fund | | Municipal Bond Fund | | Ultra Short-Term Income Fund |
High Income Fund | | North Carolina Tax-Free Fund | | Ultra Short-Term Municipal Income Fund |
High Yield Bond Fund | | Pennsylvania Tax-Free Fund | | Wisconsin Tax-Free Fund |
| Asset allocation funds | | | | |
Absolute Return Fund | | WealthBuilder Equity Portfolio† | | Target 2020 Fund† |
Asset Allocation Fund | | WealthBuilder Growth Allocation Portfolio† | | Target 2025 Fund† |
Conservative Allocation Fund | | WealthBuilder Growth Balanced Portfolio† | | Target 2030 Fund† |
Diversified Capital Builder Fund | | WealthBuilder Moderate Balanced Portfolio† | | Target 2035 Fund† |
Diversified Income Builder Fund | | WealthBuilder Tactical Equity Portfolio† | | Target 2040 Fund† |
Growth Balanced Fund | | Target Today Fund† | | Target 2045 Fund† |
Index Asset Allocation Fund | | Target 2010 Fund† | | Target 2050 Fund† |
Moderate Balanced Fund | | Target 2015 Fund† | | Target 2055 Fund† |
WealthBuilder Conservative Allocation Portfolio† | | | | |
| Money market funds | | | | |
100% Treasury Money Market Fund | | Heritage Money Market Fund† | | National Tax-Free Money Market Fund |
California Municipal Money Market Fund | | Money Market Fund | | Treasury Plus Money Market Fund |
Cash Investment Money Market Fund | | Municipal Cash Management Money Market Fund | | |
Government Money Market Fund | | Municipal Money Market Fund | | |
| Variable trust funds1 | | | | |
VT Discovery Fund† | | VT Intrinsic Value Fund | | VT Small Cap Growth Fund |
VT Index Asset Allocation Fund | | VT Omega Growth Fund | | VT Small Cap Value Fund |
VT International Equity Fund | | VT Opportunity Fund† | | VT Total Return Bond Fund |
An investment in a money market fund is not insured or guaranteed by the Federal Deposit Insurance Corporation or any other government agency. Although the Wells Fargo Advantage Money Market Funds seek to preserve the value of your investment at $1.00 per share, it is possible to lose money by investing in a money market fund.
| 1. | The variable trust funds are generally available only through insurance company variable contracts. |
| † | In this report, the Wells Fargo Advantage Discovery FundSM, Wells Fargo Advantage Endeavor Select FundSM, Wells Fargo Advantage Enterprise FundSM, Wells Fargo Advantage Opportunity FundSM, Wells Fargo Advantage WealthBuilder Conservative Allocation PortfolioSM, Wells Fargo Advantage WealthBuilder Equity PortfolioSM, Wells Fargo Advantage WealthBuilder Growth Allocation PortfolioSM, Wells Fargo Advantage WealthBuilder Growth Balanced PortfolioSM, Wells Fargo Advantage WealthBuilder Moderate Balanced PortfolioSM, Wells Fargo Advantage WealthBuilder Tactical Equity PortfolioSM, Wells Fargo Advantage Dow Jones Target Today FundSM, Wells Fargo Advantage Dow Jones Target 2010 FundSM, Wells Fargo Advantage Dow Jones Target 2015 FundSM, Wells Fargo Advantage Dow Jones Target 2020 FundSM, Wells Fargo Advantage Dow Jones Target 2025 FundSM, Wells Fargo Advantage Dow Jones Target 2030 FundSM, Wells Fargo Advantage Dow Jones Target 2035 FundSM, Wells Fargo Advantage Dow Jones Target 2040 FundSM, Wells Fargo Advantage Dow Jones Target 2045 FundSM, Wells Fargo Advantage Dow Jones Target 2050 FundSM, Wells Fargo Advantage Dow Jones Target 2055 FundSM, Wells Fargo Advantage Heritage Money Market FundSM, Wells Fargo Advantage VT Discovery FundSM, and Wells Fargo Advantage VT Opportunity FundSM are referred to as the Discovery Fund, Endeavor Select Fund, Enterprise Fund, Opportunity Fund, WealthBuilder Conservative Allocation Portfolio, WealthBuilder Equity Portfolio, WealthBuilder Growth Allocation Portfolio, WealthBuilder Growth Balanced Portfolio, WealthBuilder Moderate Balanced Portfolio, WealthBuilder Tactical Equity Portfolio, Target Today Fund, Target 2010 Fund, Target 2015 Fund, Target 2020 Fund, Target 2025 Fund, Target 2030 Fund, Target 2035 Fund, Target 2040 Fund, Target 2045 Fund, Target 2050 Fund, Target 2055 Fund, Heritage Money Market Fund, VT Discovery Fund, and VT Opportunity Fund, respectively. |
Not part of the semi-annual report.
| | | | |
| 2 | | Wells Fargo Advantage Disciplined U.S. Core Fund | | Letter to shareholders (unaudited) |

Karla M. Rabusch
President
Wells Fargo Advantage Funds
Entering the period, concerns about the eurozone sovereign debt situation held center stage as investors again focused on economic weakness in southern European economies.
Aggressive central bank actions helped support stock prices, as did relatively solid economic data.
Dear Valued Shareholder:
We are pleased to offer you this semi-annual report for the Wells Fargo Advantage Disciplined U.S. Core Fund for the six-month period that ended January 31, 2013. Much of the period was marked by continued concerns about the possible effects that the ongoing European sovereign debt crisis would have on the global economy. However, relatively solid economic data in the U.S. and efforts by European authorities to address the sovereign debt issue alleviated investor fears and supported global stock markets. Judging by various indexes, U.S. large-cap stocks underperformed small-cap stocks. Within the large-cap universe, value stocks outperformed growth stocks, partly because of strong performance from the financials sector.
The period was dominated by worries that ongoing debt problems in the eurozone would affect global economic growth.
Entering the period, concerns about the eurozone sovereign debt situation held center stage as investors again focused on economic weakness in southern European economies. Because many eurozone banks owned southern European debt and many U.S. banks had financial ties to eurozone banks, investors worried about the effects of a possible southern European debt default on the global financial system and economy. Ongoing weakness in the Greek economy made it difficult for the country to meet previously agreed upon austerity targets. Toward the end of the reporting period, political risk resurfaced in both Italy and Spain. In Italy, Prime Minister Mario Monti, an economist who was appointed to implement austerity measures and labor market reforms, resigned in December 2012. Monti later decided to run for office in the general election scheduled for February 2013.
European leaders took concerted action to calm investor concerns. In September 2012, the European Central Bank (ECB) announced that it would purchase an unlimited amount of one- to three-year sovereign debt from countries that had applied for a formal bailout through either the European Financial Stability Facility or the European Stability Mechanism. In another positive sign, in late November 2012, finance ministers from the 17-country eurozone and the International Monetary Fund struck a deal aimed at reducing Greece’s debt by the year 2020.
Central banks continued to provide stimulus.
Major central banks, including the U.S. Federal Reserve (Fed) and the ECB, continued to inject liquidity into the banks and the markets through various quantitative easing policies. Throughout the reporting period, the Federal Open Market Committee (FOMC) kept its key interest rates effectively at zero in order to support the economy and the financial system. The ECB was similarly aggressive, keeping its key rate at a historic low of 0.75%. Just prior to the beginning of the reporting period, the FOMC announced its intention to keep interest rates low until at least mid-2015 in order to support the sluggish economy. The Fed also announced open-ended purchases of $40 billion per month in mortgage-backed securities in an effort to support the housing market.
Stock markets posted solid gains in an eventful period.
Aggressive central bank actions helped support stock prices, as did relatively solid economic data. For much of the reporting period, the U.S. stock market benefited from favorable gross domestic product (GDP) data, with the growth rate improving from 1.3% (annualized) in the second quarter of 2012 to 3.1% (annualized) in the third quarter of 2012. However, the GDP growth rate slowed in the final months of 2012, with GDP growth coming in at 0.1% (annualized) in the fourth quarter of 2012. Because many investors attributed the weak number to the aftereffects of Hurricane Sandy on the eastern seaboard, the stock market remained resilient.
| | | | | | |
| Letter to shareholders (unaudited) | | Wells Fargo Advantage Disciplined U.S. Core Fund | | | 3 | |
The steady improvement in the housing market supported investor sentiment. The National Association of Home Builders/First American Improving Markets Index identifies metro areas that have shown improvement from their respective troughs in housing permits, employment, and house prices for at least six consecutive months. The index rose for a fifth-consecutive month in January 2013, indicating improvements in 242 housing markets across the country. As a result, housing-related stocks strongly outperformed over the period, leading to better-than-index returns for sectors ranging from consumer discretionary (home improvement retailers), to materials (construction material providers), and to financials (mortgage lenders).
Throughout the period, a continued high unemployment rate was the main negative piece of U.S. economic data. Although the unemployment rate improved from 8.1% in August 2012 to 7.9% in January 2013, the labor market remained soft.
We remain committed to our investment strategies, even as many variables are at work in the market.
The full effect of the European credit crisis remains unknown. Elevated unemployment and debt defaults continue to pressure consumers and businesses alike. As a whole, Wells Fargo Advantage Funds represents investments across a range of asset classes and investment styles, giving you an opportunity to create a diversified investment portfolio. While diversification may not prevent losses in a downturn, we believe it helps manage risk.
Thank you for choosing to invest with Wells Fargo Advantage Funds. We appreciate your confidence in us and remain committed to helping you meet your financial needs. For current information about your fund investments, contact your investment professional, visit our website at wellsfargoadvantagefunds.com, or call us directly at 1-800-222-8222. We are available 24 hours a day, 7 days a week.
Sincerely,

Karla M. Rabusch
President
Wells Fargo Advantage Funds
Notice to shareholders
At its November 6-7, 2012 meeting, the Board of Trustees unanimously approved the following modifications to certain Class A sales load waiver privileges, with each change becoming effective on July 1, 2013:
| | n | | Annuity payments received under an annuity option or from death proceeds will no longer qualify for net asset value (NAV) repurchase privileges. | |
| | n | | The ability to reinvest redemption proceeds at NAV will be reduced from 120 days to 90 days. | |
| | n | | NAV purchase privileges for certain types of “grandfathered” shareholders will be modified to remove the ability to purchase Class A shares at NAV, unless those shares are held directly with the Fund. | |
Please contact your investment professional or call us directly at 1-800-222-8222 if you have any questions on this Notice to Shareholders.
| | | | |
| 4 | | Wells Fargo Advantage Disciplined U.S. Core Fund | | Performance highlights (unaudited) |
Investment objective
The Fund seeks long-term capital appreciation.
Adviser
Wells Fargo Funds Management, LLC
Subadviser
Golden Capital Management, LLC
Portfolio manager
Greg Golden, CFA
Average annual total returns1 (%) as of January 31, 2013
| | | | | | | | | | | | | | | | | | | | | | | | |
| | | | | Including sales charge | | Excluding sales charge | | | Expense ratios2 (%) |
| | | Inception date | | 1 year | | 5 year | | 10 year | | 1 year | | | 5 year | | | 10 year | | | Gross | | Net3 |
| Class A (EVSAX) | | 2-28-1990 | | 8.83 | | 2.33 | | 7.55 | | | 15.48 | | | | 3.55 | | | | 8.19 | | | 0.92 | | 0.92 |
| Class C (EVSTX) | | 6-30-1999 | | 13.56 | | 2.79 | | 7.40 | | | 14.56 | | | | 2.79 | | | | 7.40 | | | 1.67 | | 1.67 |
| Administrator Class (EVSYX) | | 2-21-1995 | | – | | – | | – | | | 15.67 | | | | 3.78 | | | | 8.46 | | | 0.76 | | 0.74 |
| Institutional Class (EVSIX) | | 7-30-2010 | | – | | – | | – | | | 16.02 | | | | 3.91 | | | | 8.53 | | | 0.49 | | 0.48 |
| S&P 500 Index4 | | – | | – | | – | | – | | | 16.78 | | | | 3.97 | | | | 7.93 | | | – | | – |
Figures quoted represent past performance, which is no guarantee of future results and do not reflect the deduction of taxes that a shareholder may pay on fund distributions or the redemption of fund shares. Investment return and principal value of an investment will fluctuate so that an investor’s shares, when redeemed, may be worth more or less than their original cost. Performance shown without sales charges would be lower if sales charges were reflected. Current performance may be lower or higher than the performance data quoted and assumes the reinvestment of dividends and capital gains. Current month-end performance is available on the Fund’s website, wellsfargoadvantagefunds.com.
Index returns do not include transaction costs associated with buying and selling securities, any mutual fund fees or expenses, or any taxes. It is not possible to invest directly in an index.
For Class A shares, the maximum front-end sales charge is 5.75%. For Class C shares, the maximum contingent deferred sales charge is 1.00%. Performance including sales charge assumes the sales charge for the corresponding time period. Administrator Class and Institutional Class shares are sold without a front-end sales charge or contingent deferred sales charge.
Stock values fluctuate in response to the activities of individual companies and general market and economic conditions. The use of derivatives may reduce returns and/or increase volatility. Consult the Fund’s prospectus for additional information on these and other risks.
Please see footnotes on page 5.
| | | | | | |
| Performance highlights (unaudited) | | Wells Fargo Advantage Disciplined U.S. Core Fund | | | 5 | |
| | | | |
| Ten largest equity holdings5 (%) as of January 31, 2013 | |
Exxon Mobil Corporation | | | 3.65 | |
Apple Incorporated | | | 3.18 | |
Chevron Corporation | | | 2.08 | |
Johnson & Johnson Services Incorporated | | | 1.85 | |
Oracle Corporation | | | 1.79 | |
Microsoft Corporation | | | 1.77 | |
AT&T Incorporated | | | 1.76 | |
General Electric Company | | | 1.75 | |
Pfizer Incorporated | | | 1.72 | |
Citigroup Incorporated | | | 1.54 | |
| | |
| Sector distribution6 as of January 31, 2013 |
|
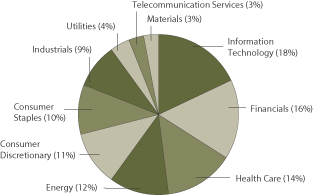
|
| 1. | Historical performance shown for the Institutional Class shares prior to their inception reflects the performance of the Administrator Class shares, and includes the higher expenses applicable to the Administrator Class shares. If these expenses had not been included, returns would be higher. Historical performance shown for all classes of the Fund prior to July 19, 2010, is based on the performance of the Fund’s predecessor, Evergreen Enhanced S&P 500 Fund. |
| 2. | Reflects the expense ratios as stated in the most recent prospectuses. |
| 3. | The Adviser has committed through November 30, 2013, to waive fees and/or reimburse expenses to the extent necessary to cap the Fund’s Total Annual Fund Operating Expenses After Fee Waiver, excluding certain expenses, at the amounts shown. Brokerage commissions, stamp duty fees, interest, taxes, acquired fund fees and expenses, and extraordinary expenses are excluded from the cap. Without this cap, the Fund’s returns would have been lower. |
| 4. | The S&P 500 Index consists of 500 stocks chosen for market size, liquidity, and industry group representation. It is a market-value weighted index with each stock’s weight in the index proportionate to its market value. You cannot invest directly in an index. |
| 5. | The ten largest equity holdings are calculated based on the value of the securities divided by total net assets of the Fund. Holdings are subject to change and may have changed since the date specified. |
| 6. | Sector distribution is subject to change and is calculated based on the total long-term investments of the Fund. |
| | | | |
| 6 | | Wells Fargo Advantage Disciplined U.S. Core Fund | | Fund expenses (unaudited) |
As a shareholder of the Fund, you incur two types of costs: (1) transaction costs, including sales charges (loads) on purchase payments and contingent deferred sales charges (if any) on redemptions and (2) ongoing costs, including management fees, distribution (12b-1) and/or shareholder service fees, and other Fund expenses. This example is intended to help you understand your ongoing costs (in dollars) of investing in the Fund and to compare these costs with the ongoing costs of investing in other mutual funds.
The example is based on an investment of $1,000 invested at the beginning of the six-month period and held for the entire period from August 1, 2012 to January 31, 2013.
Actual expenses
The “Actual” line of the table below provides information about actual account values and actual expenses. You may use the information in this line, together with the amount you invested, to estimate the expenses that you paid over the period. Simply divide your account value by $1,000 (for example, an $8,600 account value divided by $1,000 = 8.6), then multiply the result by the number in the “Actual” line under the heading entitled “Expenses paid during period” for your applicable class of shares to estimate the expenses you paid on your account during this period.
Hypothetical example for comparison purposes
The “Hypothetical” line of the table below provides information about hypothetical account values and hypothetical expenses based on the Fund’s actual expense ratio and an assumed rate of return of 5% per year before expenses, which is not the Fund’s actual return. The hypothetical account values and expenses may not be used to estimate the actual ending account balance or expenses you paid for the period. You may use this information to compare the ongoing costs of investing in the Fund and other funds. To do so, compare this 5% hypothetical example with the 5% hypothetical examples that appear in the shareholder reports of the other funds.
Please note that the expenses shown in the table are meant to highlight your ongoing costs only and do not reflect any transactional costs, such as sales charges (loads) and contingent deferred sales charges. Therefore, the “Hypothetical” line of the table is useful in comparing ongoing costs only and will not help you determine the relative total costs of owning different funds. In addition, if these transactional costs were included, your costs would have been higher.
| | | | | | | | | | | | | | | | |
| | | Beginning
account value
8-1-2012 | | | Ending
account value
1-31-2013 | | | Expenses
paid during
the period1 | | | Net annual
expense ratio | |
Class A | | | | | | | | | | | | | | | | |
Actual | | $ | 1,000.00 | | | $ | 1,095.73 | | | $ | 4.86 | | | | 0.92 | % |
Hypothetical (5% return before expenses) | | $ | 1,000.00 | | | $ | 1,020.57 | | | $ | 4.69 | | | | 0.92 | % |
Class C | | | | | | | | | | | | | | | | |
Actual | | $ | 1,000.00 | | | $ | 1,091.20 | | | $ | 8.80 | | | | 1.67 | % |
Hypothetical (5% return before expenses) | | $ | 1,000.00 | | | $ | 1,016.79 | | | $ | 8.49 | | | | 1.67 | % |
Administrator Class | | | | | | | | | | | | | | | | |
Actual | | $ | 1,000.00 | | | $ | 1,096.48 | | | $ | 3.91 | | | | 0.74 | % |
Hypothetical (5% return before expenses) | | $ | 1,000.00 | | | $ | 1,021.48 | | | $ | 3.77 | | | | 0.74 | % |
Institutional Class | | | | | | | | | | | | | | | | |
Actual | | $ | 1,000.00 | | | $ | 1,098.23 | | | $ | 2.54 | | | | 0.48 | % |
Hypothetical (5% return before expenses) | | $ | 1,000.00 | | | $ | 1,022.79 | | | $ | 2.45 | | | | 0.48 | % |
| 1. | Expenses paid is equal to the annualized expense ratio of each class multiplied by the average account value over the period, multiplied by the number of days in the most recent fiscal half-year divided by the number of days in the fiscal year (to reflect the one-half-year period). |
| | | | | | |
| Portfolio of investments—January 31, 2013 (unaudited) | | Wells Fargo Advantage Disciplined U.S. Core Fund | | | 7 | |
| | | | | | | | | | | | |
| Security name | | | | | | Shares | | | Value | |
| | | | |
Common Stocks: 99.40% | | | | | | | | | | | | |
| | | | |
Consumer Discretionary: 10.93% | | | | | | | | | | | | |
| | | | |
| Auto Components: 0.65% | | | | | | | | | | | | |
Dana Holding Corporation | | | | | | | 85,856 | | | $ | 1,380,560 | |
The Goodyear Tire & Rubber Company † | | | | | | | 83,745 | | | | 1,152,331 | |
| | | | |
| | | | | | | | | | | 2,532,891 | |
| | | | | | | | | | | | |
| | | | |
| Automobiles: 0.95% | | | | | | | | | | | | |
Ford Motor Company « | | | | | | | 287,105 | | | | 3,718,010 | |
| | | | | | | | | | | | |
| | | | |
| Diversified Consumer Services: 0.13% | | | | | | | | | | | | |
Apollo Group Incorporated Class A Ǡ | | | | | | | 24,980 | | | | 505,096 | |
| | | | | | | | | | | | |
| | | | |
| Hotels, Restaurants & Leisure: 0.87% | | | | | | | | | | | | |
Marriott International Incorporated Class A | | | | | | | 62,970 | | | | 2,517,541 | |
Starwood Hotels & Resorts Worldwide Incorporated | | | | | | | 13,900 | | | | 853,599 | |
| | | | |
| | | | | | | | | | | 3,371,140 | |
| | | | | | | | | | | | |
| | | | |
| Internet & Catalog Retail: 0.39% | | | | | | | | | | | | |
Expedia Incorporated | | | | | | | 23,305 | | | | 1,520,651 | |
| | | | | | | | | | | | |
| | | | |
| Media: 4.05% | | | | | | | | | | | | |
Comcast Corporation Class A | | | | | | | 115,906 | | | | 4,413,700 | |
DIRECTV Group Incorporated † | | | | | | | 33,361 | | | | 1,706,082 | |
Gannett Company Incorporated « | | | | | | | 26,360 | | | | 517,447 | |
News Corporation Class A | | | | | | | 140,835 | | | | 3,906,763 | |
Time Warner Incorporated | | | | | | | 37,874 | | | | 1,913,394 | |
Walt Disney Company | | | | | | | 62,037 | | | | 3,342,554 | |
| | | | |
| | | | | | | | | | | 15,799,940 | |
| | | | | | | | | | | | |
| | | | |
| Multiline Retail: 0.26% | | | | | | | | | | | | |
Target Corporation « | | | | | | | 16,830 | | | | 1,016,700 | |
| | | | | | | | | | | | |
| | | | |
| Specialty Retail: 3.63% | | | | | | | | | | | | |
Best Buy Company Incorporated « | | | | | | | 36,810 | | | | 598,531 | |
Gap Incorporated | | | | | | | 36,715 | | | | 1,199,846 | |
Home Depot Incorporated | | | | | | | 67,741 | | | | 4,533,228 | |
Lowe’s Companies Incorporated | | | | | | | 83,911 | | | | 3,204,561 | |
PetSmart Incorporated | | | | | | | 30,965 | | | | 2,025,421 | |
Staples Incorporated « | | | | | | | 82,785 | | | | 1,115,942 | |
TJX Companies Incorporated | | | | | | | 32,415 | | | | 1,464,510 | |
| | | | |
| | | | | | | | | | | 14,142,039 | |
| | | | | | | | | | | | |
| | | | |
Consumer Staples: 10.18% | | | | | | | | | | | | |
| | | | |
| Beverages: 1.39% | | | | | | | | | | | | |
Coca-Cola Enterprises Incorporated | | | | | | | 19,655 | | | | 685,370 | |
Molson Coors Brewing Company | | | | | | | 30,740 | | | | 1,388,833 | |
The Coca-Cola Company | | | | | | | 89,390 | | | | 3,328,884 | |
| | | | |
| | | | | | | | | | | 5,403,087 | |
| | | | | | | | | | | | |
The accompanying notes are an integral part of these financial statements.
| | | | |
| 8 | | Wells Fargo Advantage Disciplined U.S. Core Fund | | Portfolio of investments—January 31, 2013 (unaudited) |
| | | | | | | | | | | | |
| Security name | | | | | | Shares | | | Value | |
| | | | |
| Food & Staples Retailing: 3.69% | | | | | | | | | | | | |
Costco Wholesale Corporation | | | | | | | 36,066 | | | $ | 3,690,994 | |
CVS Caremark Corporation | | | | | | | 76,494 | | | | 3,916,493 | |
Kroger Company | | | | | | | 72,172 | | | | 1,999,164 | |
Safeway Incorporated « | | | | | | | 66,865 | | | | 1,287,151 | |
Wal-Mart Stores Incorporated | | | | | | | 38,377 | | | | 2,684,471 | |
Walgreen Company | | | | | | | 19,725 | | | | 788,211 | |
| | | | |
| | | | | | | | | | | 14,366,484 | |
| | | | | | | | | | | | |
| | | | |
| Food Products: 2.35% | | | | | | | | | | | | |
Archer Daniels Midland Company | | | | | | | 46,294 | | | | 1,320,768 | |
Dean Foods Company Ǡ | | | | | | | 62,463 | | | | 1,143,698 | |
Hormel Foods Corporation | | | | | | | 26,335 | | | | 911,454 | |
Kraft Foods Group Incorporated | | | | | | | 23,680 | | | | 1,094,490 | |
McCormick & Company Incorporated | | | | | | | 21,385 | | | | 1,333,355 | |
The Hershey Company | | | | | | | 14,260 | | | | 1,132,957 | |
Tyson Foods Incorporated Class A | | | | | | | 99,970 | | | | 2,211,336 | |
| | | | |
| | | | | | | | | | | 9,148,058 | |
| | | | | | | | | | | | |
| | | | |
| Household Products: 1.65% | | | | | | | | | | | | |
Colgate-Palmolive Company | | | | | | | 2,085 | | | | 223,866 | |
Kimberly-Clark Corporation « | | | | | | | 24,585 | | | | 2,200,603 | |
Procter & Gamble Company | | | | | | | 53,397 | | | | 4,013,319 | |
| | | | |
| | | | | | | | | | | 6,437,788 | |
| | | | | | | | | | | | |
| | | | |
| Personal Products: 0.19% | | | | | | | | | | | | |
Herbalife Limited « | | | | | | | 20,601 | | | | 748,228 | |
| | | | | | | | | | | | |
| | | | |
| Tobacco: 0.91% | | | | | | | | | | | | |
Altria Group Incorporated | | | | | | | 76,855 | | | | 2,588,476 | |
Philip Morris International | | | | | | | 11,114 | | | | 979,810 | |
| | | | |
| | | | | | | | | | | 3,568,286 | |
| | | | | | | | | | | | |
| | | | |
Energy: 11.51% | | | | | | | | | | | | |
| | | | |
| Energy Equipment & Services: 1.15% | | | | | | | | | | | | |
Diamond Offshore Drilling Incorporated | | | | | | | 7,580 | | | | 569,182 | |
Ensco plc Class A | | | | | | | 14,350 | | | | 912,230 | |
Schlumberger Limited | | | | | | | 38,456 | | | | 3,001,491 | |
| | | | |
| | | | | | | | | | | 4,482,903 | |
| | | | | | | | | | | | |
| | | | |
| Oil, Gas & Consumable Fuels: 10.36% | | | | | | | | | | | | |
Chevron Corporation | | | | | | | 70,562 | | | | 8,125,214 | |
ConocoPhillips Company | | | | | | | 73,094 | | | | 4,239,452 | |
Exxon Mobil Corporation | | | | | | | 158,040 | | | | 14,218,859 | |
Marathon Oil Corporation | | | | | | | 1,132 | | | | 38,047 | |
Marathon Petroleum Corporation | | | | | | | 46,587 | | | | 3,457,221 | |
Murphy Oil Corporation | | | | | | | 36,966 | | | | 2,200,216 | |
Phillips 66 Incorporated | | | | | | | 36,180 | | | | 2,191,423 | |
Tesoro Corporation | | | | | | | 45,746 | | | | 2,227,373 | |
Valero Energy Corporation | | | | | | | 84,375 | | | | 3,689,719 | |
| | | | |
| | | | | | | | | | | 40,387,524 | |
| | | | | | | | | | | | |
The accompanying notes are an integral part of these financial statements.
| | | | | | |
| Portfolio of investments—January 31, 2013 (unaudited) | | Wells Fargo Advantage Disciplined U.S. Core Fund | | | 9 | |
| | | | | | | | | | | | |
| Security name | | | | | | Shares | | | Value | |
| | | | |
Financials: 16.21% | | | | | | | | | | | | |
| | | | |
| Capital Markets: 1.70% | | | | | | | | | | | | |
Bank of New York Mellon Corporation | | | | | | | 118,338 | | | $ | 3,214,060 | |
Goldman Sachs Group Incorporated | | | | | | | 13,285 | | | | 1,964,320 | |
Northern Trust Corporation | | | | | | | 11,895 | | | | 612,236 | |
State Street Corporation | | | | | | | 15,290 | | | | 850,889 | |
| | | | |
| | | | | | | | | | | 6,641,505 | |
| | | | | | | | | | | | |
| | | | |
| Commercial Banks: 1.93% | | | | | | | | | | | | |
Fifth Third Bancorp | | | | | | | 164,298 | | | | 2,676,414 | |
Huntington Bancshares Incorporated | | | | | | | 79,365 | | | | 552,380 | |
KeyCorp | | | | | | | 68,170 | | | | 640,798 | |
Regions Financial Corporation | | | | | | | 118,975 | | | | 925,626 | |
SunTrust Banks Incorporated | | | | | | | 31,640 | | | | 897,627 | |
US Bancorp | | | | | | | 55,557 | | | | 1,838,937 | |
| | | | |
| | | | | | | | | | | 7,531,782 | |
| | | | | | | | | | | | |
| | | | |
| Consumer Finance: 0.75% | | | | | | | | | | | | |
American Express Company | | | | | | | 28,475 | | | | 1,674,615 | |
Discover Financial Services | | | | | | | 32,816 | | | | 1,259,806 | |
| | | | |
| | | | | | | | | | | 2,934,421 | |
| | | | | | | | | | | | |
| | | | |
| Diversified Financial Services: 5.28% | | | | | | | | | | | | |
Bank of America Corporation | | | | | | | 230,160 | | | | 2,605,411 | |
Berkshire Hathaway Incorporated Class B † | | | | | | | 61,719 | | | | 5,982,423 | |
Citigroup Incorporated | | | | | | | 142,685 | | | | 6,015,600 | |
JPMorgan Chase & Company | | | | | | | 114,971 | | | | 5,409,386 | |
NASDAQ OMX Group Incorporated « | | | | | | | 19,905 | | | | 563,710 | |
| | | | |
| | | | | | | | | | | 20,576,530 | |
| | | | | | | | | | | | |
| | | | |
| Insurance: 3.71% | | | | | | | | | | | | |
ACE Limited | | | | | | | 8,982 | | | | 766,434 | |
AFLAC Incorporated | | | | | | | 49,186 | | | | 2,609,809 | |
Allstate Corporation | | | | | | | 22,510 | | | | 988,189 | |
American Financial Group Incorporated | | | | | | | 60,262 | | | | 2,564,751 | |
American International Group Incorporated † | | | | | | | 22,080 | | | | 835,286 | |
Lincoln National Corporation | | | | | | | 14,080 | | | | 408,038 | |
MetLife Incorporated | | | | | | | 58,794 | | | | 2,195,368 | |
The Travelers Companies Incorporated | | | | | | | 51,910 | | | | 4,072,859 | |
| | | | |
| | | | | | | | | | | 14,440,734 | |
| | | | | | | | | | | | |
| | | | |
| REITs: 2.84% | | | | | | | | | | | | |
Equity Residential | | | | | | | 25,139 | | | | 1,392,449 | |
HCP Incorporated | | | | | | | 54,158 | | | | 2,512,390 | |
Host Hotels & Resorts Incorporated « | | | | | | | 170,164 | | | | 2,857,054 | |
Simon Property Group Incorporated | | | | | | | 21,728 | | | | 3,480,391 | |
Ventas Incorporated | | | | | | | 12,630 | | | | 837,243 | |
| | | | |
| | | | | | | | | | | 11,079,527 | |
| | | | | | | | | | | | |
The accompanying notes are an integral part of these financial statements.
| | | | |
| 10 | | Wells Fargo Advantage Disciplined U.S. Core Fund | | Portfolio of investments—January 31, 2013 (unaudited) |
| | | | | | | | | | | | |
| Security name | | | | | | Shares | | | Value | |
| | | | |
Health Care: 13.35% | | | | | | | | | | | | |
| | | | |
| Biotechnology: 0.89% | | | | | | | | | | | | |
Amgen Incorporated | | | | | | | 29,866 | | | $ | 2,552,348 | |
Celgene Corporation † | | | | | | | 9,445 | | | | 934,677 | |
| | | | |
| | | | | | | | | | | 3,487,025 | |
| | | | | | | | | | | | |
| | | | |
| Health Care Equipment & Supplies: 2.20% | | | | | | | | | | | | |
Abbott Laboratories | | | | | | | 48,306 | | | | 1,636,607 | |
Boston Scientific Corporation † | | | | | | | 290,204 | | | | 2,167,824 | |
Covidien plc | | | | | | | 18,980 | | | | 1,183,213 | |
Medtronic Incorporated | | | | | | | 77,297 | | | | 3,602,040 | |
| | | | |
| | | | | | | | | | | 8,589,684 | |
| | | | | | | | | | | | |
| | | | |
| Health Care Providers & Services: 3.21% | | | | | | | | | | | | |
Aetna Incorporated | | | | | | | 47,920 | | | | 2,311,182 | |
AmerisourceBergen Corporation « | | | | | | | 53,830 | | | | 2,442,267 | |
CIGNA Corporation | | | | | | | 10,954 | | | | 639,056 | |
Humana Incorporated | | | | | | | 19,927 | | | | 1,481,772 | |
McKesson Corporation | | | | | | | 26,321 | | | | 2,769,759 | |
UnitedHealth Group Incorporated | | | | | | | 39,788 | | | | 2,196,695 | |
WellPoint Incorporated | | | | | | | 10,343 | | | | 670,433 | |
| | | | |
| | | | | | | | | | | 12,511,164 | |
| | | | | | | | | | | | |
| | | | |
| Life Sciences Tools & Services: 0.10% | | | | | | | | | | | | |
Thermo Fisher Scientific Incorporated | | | | | | | 5,270 | | | | 380,178 | |
| | | | | | | | | | | | |
| | | | |
| Pharmaceuticals: 6.95% | | | | | | | | | | | | |
AbbVie Incorporation | | | | | | | 48,711 | | | | 1,787,207 | |
Bristol-Myers Squibb Company | | | | | | | 114,679 | | | | 4,144,499 | |
Eli Lilly & Company | | | | | | | 54,092 | | | | 2,904,199 | |
Johnson & Johnson Services Incorporated | | | | | | | 97,434 | | | | 7,202,321 | |
Merck & Company Incorporated | | | | | | | 100,715 | | | | 4,355,924 | |
Pfizer Incorporated | | | | | | | 245,528 | | | | 6,698,004 | |
| | | | |
| | | | | | | | | | | 27,092,154 | |
| | | | | | | | | | | | |
| | | | |
Industrials: 9.36% | | | | | | | | | | | | |
| | | | |
| Aerospace & Defense: 3.37% | | | | | | | | | | | | |
Boeing Company | | | | | | | 20,320 | | | | 1,501,038 | |
General Dynamics Corporation | | | | | | | 31,147 | | | | 2,065,046 | |
L-3 Communications Holdings Incorporated | | | | | | | 26,716 | | | | 2,028,279 | |
Lockheed Martin Corporation | | | | | | | 29,550 | | | | 2,567,009 | |
Northrop Grumman Corporation | | | | | | | 34,666 | | | | 2,254,677 | |
Raytheon Company « | | | | | | | 24,723 | | | | 1,302,408 | |
Textron Incorporated | | | | | | | 48,695 | | | | 1,400,468 | |
| | | | |
| | | | | | | | | | | 13,118,925 | |
| | | | | | | | | | | | |
| | | | |
| Air Freight & Logistics: 0.46% | | | | | | | | | | | | |
FedEx Corporation | | | | | | | 16,176 | | | | 1,641,055 | |
United Parcel Service Incorporated Class B | | | | | | | 1,975 | | | | 156,598 | |
| | | | |
| | | | | | | | | | | 1,797,653 | |
| | | | | | | | | | | | |
The accompanying notes are an integral part of these financial statements.
| | | | | | |
| Portfolio of investments—January 31, 2013 (unaudited) | | Wells Fargo Advantage Disciplined U.S. Core Fund | | | 11 | |
| | | | | | | | | | | | |
| Security name | | | | | | Shares | | | Value | |
| | | | |
| Airlines: 0.28% | | | | | | | | | | | | |
Southwest Airlines Company | | | | | | | 96,181 | | | $ | 1,078,189 | |
| | | | | | | | | | | | |
| | | | |
| Commercial Services & Supplies: 1.09% | | | | | | | | | | | | |
Pitney Bowes Incorporated « | | | | | | | 53,930 | | | | 777,131 | |
RR Donnelley & Sons Company « | | | | | | | 100,807 | | | | 927,424 | |
Tyco International Limited ADR | | | | | | | 84,835 | | | | 2,564,562 | |
| | | | |
| | | | | | | | | | | 4,269,117 | |
| | | | | | | | | | | | |
| | | | |
| Construction & Engineering: 0.76% | | | | | | | | | | | | |
Fluor Corporation | | | | | | | 45,960 | | | | 2,979,587 | |
| | | | | | | | | | | | |
| | | | |
| Electrical Equipment: 0.21% | | | | | | | | | | | | |
Rockwell Automation Incorporated | | | | | | | 9,000 | | | | 802,710 | |
| | | | | | | | | | | | |
| | | | |
| Industrial Conglomerates: 1.75% | | | | | | | | | | | | |
General Electric Company | | | | | | | 306,036 | | | | 6,818,482 | |
| | | | | | | | | | | | |
| | | | |
| Machinery: 0.56% | | | | | | | | | | | | |
Caterpillar Incorporated | | | | | | | 5,270 | | | | 518,515 | |
Cummins Incorporated | | | | | | | 1,669 | | | | 191,651 | |
Timken Company | | | | | | | 27,527 | | | | 1,475,722 | |
| | | | |
| | | | | | | | | | | 2,185,888 | |
| | | | | | | | | | | | |
| | | | |
| Professional Services: 0.42% | | | | | | | | | | | | |
Equifax Incorporated | | | | | | | 19,685 | | | | 1,155,510 | |
Robert Half International Incorporated | | | | | | | 13,275 | | | | 467,811 | |
| | | | |
| | | | | | | | | | | 1,623,321 | |
| | | | | | | | | | | | |
| | | | |
| Road & Rail: 0.46% | | | | | | | | | | | | |
CSX Corporation | | | | | | | 57,704 | | | | 1,271,219 | |
Ryder System Incorporated « | | | | | | | 9,260 | | | | 525,783 | |
| | | | |
| | | | | | | | | | | 1,797,002 | |
| | | | | | | | | | | | |
| | | | |
Information Technology: 18.05% | | | | | | | | | | | | |
| | | | |
| Communications Equipment: 2.14% | | | | | | | | | | | | |
Cisco Systems Incorporated | | | | | | | 208,191 | | | | 4,282,489 | |
Motorola Solutions Incorporated | | | | | | | 15,220 | | | | 888,696 | |
QUALCOMM Incorporated | | | | | | | 48,094 | | | | 3,175,647 | |
| | | | |
| | | | | | | | | | | 8,346,832 | |
| | | | | | | | | | | | |
| | | | |
| Computers & Peripherals: 5.39% | | | | | | | | | | | | |
Apple Incorporated | | | | | | | 27,243 | | | | 12,404,010 | |
Dell Incorporated | | | | | | | 82,964 | | | | 1,098,443 | |
EMC Corporation † | | | | | | | 80,845 | | | | 1,989,595 | |
Hewlett-Packard Company | | | | | | | 77,910 | | | | 1,286,294 | |
Seagate Technology plc « | | | | | | | 58,843 | | | | 1,999,485 | |
Western Digital Corporation | | | | | | | 47,689 | | | | 2,241,383 | |
| | | | |
| | | | | | | | | | | 21,019,210 | |
| | | | | | | | | | | | |
The accompanying notes are an integral part of these financial statements.
| | | | |
| 12 | | Wells Fargo Advantage Disciplined U.S. Core Fund | | Portfolio of investments—January 31, 2013 (unaudited) |
| | | | | | | | | | | | |
| Security name | | | | | | Shares | | | Value | |
| | | | |
| Electronic Equipment, Instruments & Components: 0.22% | | | | | | | | | | | | |
Corning Incorporated | | | | | | | 70,096 | | | $ | 841,152 | |
| | | | | | | | | | | | |
| | | | |
| Internet Software & Services: 1.44% | | | | | | | | | | | | |
eBay Incorporated † | | | | | | | 26,045 | | | | 1,456,697 | |
Google Incorporated Class A † | | | | | | | 3,030 | | | | 2,289,741 | |
IAC/InterActive Corporation | | | | | | | 23,355 | | | | 963,394 | |
Yahoo! Incorporated † | | | | | | | 45,630 | | | | 895,717 | |
| | | | |
| | | | | | | | | | | 5,605,549 | |
| | | | | | | | | | | | |
| | | | |
| IT Services: 3.16% | | | | | | | | | | | | |
Accenture plc | | | | | | | 24,365 | | | | 1,751,600 | |
Computer Sciences Corporation | | | | | | | 23,264 | | | | 972,435 | |
International Business Machines Corporation | | | | | | | 24,540 | | | | 4,983,338 | |
SAIC Incorporated « | | | | | | | 41,190 | | | | 498,399 | |
Total System Services Incorporated | | | | | | | 96,284 | | | | 2,238,603 | |
Visa Incorporated Class A | | | | | | | 11,760 | | | | 1,857,022 | |
| | | | |
| | | | | | | | | | | 12,301,397 | |
| | | | | | | | | | | | |
| | | | |
| Office Electronics: 0.42% | | | | | | | | | | | | |
Xerox Corporation | | | | | | | 203,515 | | | | 1,630,155 | |
| | | | | | | | | | | | |
| | | | |
| Semiconductors & Semiconductor Equipment: 1.73% | | | | | | | | | | | | |
Amkor Technology Incorporated Ǡ | | | | | | | 70,908 | | | | 328,304 | |
Applied Materials Incorporated | | | | | | | 62,198 | | | | 802,976 | |
Intel Corporation | | | | | | | 189,793 | | | | 3,993,245 | |
LSI Corporation † | | | | | | | 229,134 | | | | 1,613,103 | |
| | | | |
| | | | | | | | | | | 6,737,628 | |
| | | | | | | | | | | | |
| | | | |
| Software: 3.55% | | | | | | | | | | | | |
Microsoft Corporation | | | | | | | 250,789 | | | | 6,889,174 | |
Oracle Corporation | | | | | | | 196,326 | | | | 6,971,536 | |
| | | | |
| | | | | | | | | | | 13,860,710 | |
| | | | | | | | | | | | |
| | | | |
Materials: 2.80% | | | | | | | | | | | | |
| | | | |
| Chemicals: 1.90% | | | | | | | | | | | | |
CF Industries Holdings Incorporated | | | | | | | 11,960 | | | | 2,740,873 | |
Dow Chemical Company | | | | | | | 45,755 | | | | 1,473,311 | |
E.I. du Pont de Nemours & Company | | | | | | | 8,220 | | | | 390,039 | |
LyondellBasell Industries Class A ADR | | | | | | | 31,480 | | | | 1,996,462 | |
Sherwin-Williams Company | | | | | | | 4,915 | | | | 796,918 | |
| | | | |
| | | | | | | | | | | 7,397,603 | |
| | | | | | | | | | | | |
| | | | |
| Containers & Packaging: 0.31% | | | | | | | | | | | | |
Ball Corporation | | | | | | | 14,060 | | | | 625,951 | |
Owens-Illinois Incorporated † | | | | | | | 25,030 | | | | 595,714 | |
| | | | |
| | | | | | | | | | | 1,221,665 | |
| | | | | | | | | | | | |
| | | | |
| Metals & Mining: 0.24% | | | | | | | | | | | | |
Nucor Corporation | | | | | | | 12,729 | | | | 585,661 | |
United States Steel Corporation « | | | | | | | 15,465 | | | | 345,643 | |
| | | | |
| | | | | | | | | | | 931,304 | |
| | | | | | | | | | | | |
The accompanying notes are an integral part of these financial statements.
| | | | | | |
| Portfolio of investments—January 31, 2013 (unaudited) | | Wells Fargo Advantage Disciplined U.S. Core Fund | | | 13 | |
| | | | | | | | | | | | | | |
| Security name | | | | | | | Shares | | | Value | |
| | | | |
| Paper & Forest Products: 0.35% | | | | | | | | | | | | | | |
International Paper Company « | | | | | | | | | 32,679 | | | $ | 1,353,564 | |
| | | | | | | | | | | | | | |
| | | | |
Telecommunication Services: 3.27% | | | | | | | | | | | | | | |
| | | | |
| Diversified Telecommunication Services: 2.88% | | | | | | | | | | | | | | |
AT&T Incorporated | | | | | | | | | 197,173 | | | | 6,859,649 | |
Verizon Communications Incorporated | | | | | | | | | 100,365 | | | | 4,376,918 | |
| | | | |
| | | | | | | | | | | | | 11,236,567 | |
| | | | | | | | | | | | | | |
| | | | |
| Wireless Telecommunication Services: 0.39% | | | | | | | | | | | | | | |
Sprint Nextel Corporation † | | | | | | | | | 267,180 | | | | 1,504,223 | |
| | | | | | | | | | | | | | |
| | | | |
Utilities: 3.74% | | | | | | | | | | | | | | |
| | | | |
| Electric Utilities: 1.57% | | | | | | | | | | | | | | |
Edison International | | | | | | | | | 32,461 | | | | 1,564,296 | |
Entergy Corporation | | | | | | | | | 16,143 | | | | 1,042,838 | |
Exelon Corporation | | | | | | | | | 57,336 | | | | 1,802,644 | |
Pinnacle West Capital Corporation | | | | | | | | | 9,950 | | | | 531,131 | |
PPL Corporation | | | | | | | | | 38,950 | | | | 1,179,796 | |
| | | | |
| | | | | | | | | | | | | 6,120,705 | |
| | | | | | | | | | | | | | |
| | | | |
| Independent Power Producers & Energy Traders: 0.44% | | | | | | | | | | | | | | |
AES Corporation | | | | | | | | | 103,306 | | | | 1,119,837 | |
NRG Energy Incorporated | | | | | | | | | 24,045 | | | | 577,080 | |
| | | | |
| | | | | | | | | | | | | 1,696,917 | |
| | | | | | | | | | | | | | |
| | | | |
| Multi-Utilities: 1.73% | | | | | | | | | | | | | | |
Ameren Corporation | | | | | | | | | 58,391 | | | | 1,894,204 | |
CenterPoint Energy Incorporated « | | | | | | | | | 57,990 | | | | 1,185,316 | |
Consolidated Edison Incorporated | | | | | | | | | 10,175 | | | | 578,754 | |
DTE Energy Company | | | | | | | | | 18,615 | | | | 1,178,516 | |
Public Service Enterprise Group Incorporated | | | | | | | | | 61,791 | | | | 1,926,643 | |
| | | | |
| | | | | | | | | | | | | 6,763,433 | |
| | | | | | | | | | | | | | |
| | | | |
Total Common Stocks (Cost $260,846,995) | | | | | | | | | | | | | 387,453,017 | |
| | | | | | | | | | | | | | |
| | | | |
| | | Yield | | | | | | | | | |
| Short-Term Investments: 5.48% | | | | | | | | | | | | | | |
| | | | |
| Investment Companies: 5.48% | | | | | | | | | | | | | | |
Wells Fargo Advantage Cash Investment Money Market Fund, Select Class (l)(u) | | | 0.14 | % | | | | | 2,630,904 | | | | 2,630,904 | |
Wells Fargo Securities Lending Cash Investments, LLC (l)(r)(u)(v) | | | 0.19 | | | | | | 18,743,839 | | | | 18,743,839 | |
| | | | |
Total Short-Term Investments (Cost $21,374,743) | | | | | | | | | | | | | 21,374,743 | |
| | | | | | | | | | | | | | |
| | | | | | | | |
| Total investments in securities | | | | | | | | |
| (Cost $282,221,738) * | | | 104.88 | % | | | 408,827,760 | |
Other assets and liabilities, net | | | (4.88 | ) | | | (19,026,941 | ) |
| | | | | | | | |
| Total net assets | | | 100.00 | % | | $ | 389,800,819 | |
| | | | | | | | |
The accompanying notes are an integral part of these financial statements.
| | | | |
| 14 | | Wells Fargo Advantage Disciplined U.S. Core Fund | | Portfolio of investments—January 31, 2013 (unaudited) |
| † | Non-income-earning security |
| « | All or a portion of this security is on loan. |
| (l) | Investment in an affiliate |
| (u) | Rate shown is the 7-day annualized yield at period end. |
| (r) | The investment company is exempt from registration under Section 3(c)(7) of the Investment Company Act of 1940, as amended. |
| (v) | Security represents investment of cash collateral received from securities on loan. |
| * | Cost for federal income tax purposes is $283,419,143 and unrealized appreciation (depreciation) consists of: |
| | | | |
Gross unrealized appreciation | | $ | 127,374,894 | |
Gross unrealized depreciation | | | (1,966,277 | ) |
| | | | |
Net unrealized appreciation | | $ | 125,408,617 | |
The accompanying notes are an integral part of these financial statements.
| | | | | | |
| Statement of assets and liabilities—January 31, 2013 (unaudited) | | Wells Fargo Advantage Disciplined U.S. Core Fund | | | 15 | |
| | | | |
| | | | |
| |
Assets | | | | |
Investments | | | | |
In unaffiliated securities (including securities on loan), at value (see cost below) | | $ | 387,453,017 | |
In affiliated securities, at value (see cost below) | | | 21,374,743 | |
| | | | |
Total investments, at value (see cost below) | | | 408,827,760 | |
Receivable for Fund shares sold | | | 115,592 | |
Receivable for dividends | | | 511,210 | |
Receivable for securities lending income | | | 10,773 | |
Prepaid expenses and other assets | | | 27,861 | |
| | | | |
Total assets | | | 409,493,196 | |
| | | | |
| |
Liabilities | | | | |
Payable for Fund shares redeemed | | | 474,109 | |
Payable upon receipt of securities loaned | | | 18,743,839 | |
Advisory fee payable | | | 90,297 | |
Distribution fees payable | | | 3,386 | |
Due to other related parties | | | 85,444 | |
Accrued expenses and other liabilities | | | 295,302 | |
| | | | |
Total liabilities | | | 19,692,377 | |
| | | | |
Total net assets | | $ | 389,800,819 | |
| | | | |
| |
NET ASSETS CONSIST OF | | | | |
Paid-in capital | | $ | 225,639,943 | |
Undistributed net investment income | | | 3,685,797 | |
Accumulated net realized gains on investments | | | 33,869,057 | |
Net unrealized gains on investments | | | 126,606,022 | |
| | | | |
Total net assets | | $ | 389,800,819 | |
| | | | |
| |
COMPUTATION OF NET ASSET VALUE AND OFFERING PRICE PER SHARE1 | | | | |
Net assets – Class A | | $ | 259,632,996 | |
Shares outstanding – Class A | | | 18,436,369 | |
Net asset value per share – Class A | | | $14.08 | |
Maximum offering price per share – Class A2 | | | $14.94 | |
Net assets – Class C | | $ | 8,221,143 | |
Shares outstanding – Class C | | | 607,411 | |
Net asset value per share – Class C | | | $13.53 | |
Net assets – Administrator Class | | $ | 120,777,205 | |
Shares outstanding – Administrator Class | | | 8,481,250 | |
Net asset value per share – Administrator Class | | | $14.24 | |
Net assets – Institutional Class | | $ | 1,169,475 | |
Shares outstanding – Institutional Class | | | 82,401 | |
Net asset value per share – Institutional Class | | | $14.19 | |
| |
Investment in unaffiliated securities (including securities on loan), at cost | | $ | 260,846,995 | |
| | | | |
Investments in affiliated securities, at cost | | $ | 21,374,743 | |
| | | | |
Total investments, at cost | | $ | 282,221,738 | |
| | | | |
Securities on loan, at value | | $ | 18,283,933 | |
| | | | |
| 1. | The Fund has an unlimited number of authorized shares. |
| 2. | Maximum offering price is computed as 100/94.25 of net asset value. On investments of $50,000 or more, the offering price is reduced. |
The accompanying notes are an integral part of these financial statements.
| | | | |
| 16 | | Wells Fargo Advantage Disciplined U.S. Core Fund | | Statement of operations—six months ended January 31, 2013 (unaudited) |
| | | | |
| | | | |
| |
Investment income | | | | |
Dividends* | | $ | 5,430,725 | |
Securities lending income, net | | | 98,259 | |
Income from affiliated securities | | | 3,200 | |
| | | | |
Total investment income | | | 5,532,184 | |
| | | | |
| |
Expenses | | | | |
Advisory fee | | | 610,213 | |
Administration fees | | | | |
Fund level | | | 101,702 | |
Class A | | | 335,266 | |
Class C | | | 11,057 | |
Administrator Class | | | 69,599 | |
Institutional Class | | | 483 | |
Shareholder servicing fees | | | | |
Class A | | | 322,371 | |
Class C | | | 10,632 | |
Administrator Class | | | 173,477 | |
Distribution fees | | | | |
Class C | | | 31,896 | |
Custody and accounting fees | | | 22,191 | |
Professional fees | | | 22,523 | |
Registration fees | | | 23,245 | |
Shareholder report expenses | | | 32,958 | |
Trustees’ fees and expenses | | | 7,529 | |
Other fees and expenses | | | 48,104 | |
| | | | |
Total expenses | | | 1,823,246 | |
Less: Fee waivers and/or expense reimbursements | | | (47,967 | ) |
| | | | |
Net expenses | | | 1,775,279 | |
| | | | |
Net investment income | | | 3,756,905 | |
| | | | |
| |
REALIZED AND UNREALIZED GAINS (LOSSES) ON INVESTMENTS | | | | |
Net realized gains on investments | | | 35,232,198 | |
Net change in unrealized gains (losses) on investments | | | (2,618,380 | ) |
| | | | |
Net realized and unrealized gains (losses) on investments | | | 32,613,818 | |
| | | | |
Net increase in net assets resulting from operations | | $ | 36,370,723 | |
| | | | |
| |
* Net of foreign dividend withholding taxes in the amount of | | | $13,842 | |
The accompanying notes are an integral part of these financial statements.
| | | | | | |
| Statement of changes in net assets | | Wells Fargo Advantage Disciplined U.S. Core Fund | | | 17 | |
| | | | | | | | | | | | | | | | |
| | | Six months ended January 31, 2013 (unaudited) | | | Year ended July 31, 2012 | |
| | | | |
Operations | | | | | | | | | | | | | | | | |
Net investment income | | | | | | $ | 3,756,905 | | | | | | | $ | 6,716,533 | |
Net realized gains on investments | | | | | | | 35,232,198 | | | | | | | | 43,016,382 | |
Net change in unrealized gains (losses) on investments | | | | | | | (2,618,380 | ) | | | | | | | (17,059,470 | ) |
| | | | |
Net increase in net assets resulting from operations | | | | | | | 36,370,723 | | | | | | | | 32,673,445 | |
| | | | |
| | | | |
Distributions to shareholders from | | | | | | | | | | | | | | | | |
Net investment income | | | | | | | | | | | | | | | | |
Class A | | | | | | | (4,355,787 | ) | | | | | | | (4,231,155 | ) |
Class C | | | | | | | (82,326 | ) | | | | | | | (53,972 | ) |
Administrator Class | | | | | | | (2,153,996 | ) | | | | | | | (3,244,083 | ) |
Institutional Class | | | | | | | (24,206 | ) | | | | | | | (25,062 | ) |
Net realized gains | | | | | | | | | | | | | | | | |
Class A | | | | | | | (27,133,857 | ) | | | | | | | (9,085,986 | ) |
Class C | | | | | | | (948,466 | ) | | | | | | | (310,411 | ) |
Administrator Class | | | | | | | (14,145,664 | ) | | | | | | | (7,012,529 | ) |
Institutional Class | | | | | | | (117,107 | ) | | | | | | | (40,036 | ) |
| | | | |
Total distributions to shareholders | | | | | | | (48,961,409 | ) | | | | | | | (24,003,234 | ) |
| | | | |
| | | | |
| | | Shares | | | | | | | | Shares | | | | | |
| | | | |
Capital share transactions | | | | | | | | | | | | | | | | |
Proceeds from shares sold | | | | | | | | | | | | | | | | |
Class A | | | 264,618 | | | | 3,879,337 | | | | 345,571 | | | | 4,810,621 | |
Class C | | | 42,952 | | | | 590,241 | | | | 63,246 | | | | 843,293 | |
Administrator Class | | | 295,286 | | | | 4,356,274 | | | | 436,966 | | | | 6,049,718 | |
Institutional Class | | | 4,774 | | | | 71,357 | | | | 93,631 | | | | 1,191,311 | |
| | | | |
| | | | | | | 8,897,209 | | | | | | | | 12,894,943 | |
| | | | |
Reinvestment of distributions | | | | | | | | | | | | | | | | |
Class A | | | 2,203,332 | | | | 29,720,911 | | | | 931,488 | | | | 12,377,000 | |
Class C | | | 53,713 | | | | 692,961 | | | | 17,202 | | | | 220,814 | |
Administrator Class | | | 433,941 | | | | 5,920,813 | | | | 203,569 | | | | 2,733,877 | |
Institutional Class | | | 10,367 | | | | 141,313 | | | | 4,870 | | | | 65,098 | |
| | | | |
| | | | | | | 36,475,998 | | | | | | | | 15,396,789 | |
| | | | |
Payment for shares redeemed | | | | | | | | | | | | | | | | |
Class A | | | (1,384,438 | ) | | | (20,114,418 | ) | | | (2,760,530 | ) | | | (38,418,435 | ) |
Class C | | | (98,500 | ) | | | (1,348,483 | ) | | | (111,568 | ) | | | (1,504,813 | ) |
Administrator Class | | | (2,419,139 | ) | | | (35,785,216 | ) | | | (7,514,960 | ) | | | (104,269,188 | ) |
Institutional Class | | | (14,897 | ) | | | (217,710 | ) | | | (17,179 | ) | | | (241,407 | ) |
| | | | |
| | | | | | | (57,465,827 | ) | | | | | | | (144,433,843 | ) |
| | | | |
Net decrease in net assets resulting from capital share transactions | | | | | | | (12,092,620 | ) | | | | | | | (116,142,111 | ) |
| | | | |
Total decrease in net assets | | | | | | | (24,683,306 | ) | | | | | | | (107,471,900 | ) |
| | | | |
| | | | |
Net assets | | | | | | | | | | | | | | | | |
Beginning of period | | | | | | | 414,484,125 | | | | | | | | 521,956,025 | |
| | | | |
End of period | | | | | | $ | 389,800,819 | | | | | | | $ | 414,484,125 | |
| | | | |
Undistributed net investment income | | | | | | $ | 3,685,797 | | | | | | | $ | 6,545,207 | |
| | | | |
The accompanying notes are an integral part of these financial statements.
| | | | |
| 18 | | Wells Fargo Advantage Disciplined U.S. Core Fund | | Financial highlights |
(For a share outstanding throughout each period)
| | | | | | | | | | | | | | | | | | | | | | | | | | | | |
| | | Six months ended
January 31, 2013
(unaudited) | | | Year ended July 31 | | | Year ended
September 30,
20071 | |
| CLASS A | | | 2012 | | | 2011 | | | 20101 | | | 20091 | | | 20081,2 | | |
Net asset value, beginning of period | | $ | 14.65 | | | $ | 14.25 | | | $ | 11.93 | | | $ | 10.85 | | | $ | 14.40 | | | $ | 18.97 | | | $ | 17.09 | |
Net investment income | | | 0.12 | | | | 0.20 | | | | 0.16 | | | | 0.15 | | | | 0.18 | | | | 0.14 | | | | 0.18 | |
Net realized and unrealized gains (losses) on investments | | | 1.18 | | | | 0.93 | | | | 2.17 | | | | 1.09 | | | | (3.15 | ) | | | (2.58 | ) | | | 2.48 | |
| | | | | | | | | | | | | | | | | | | | | | | | | | | | |
Total from investment operations | | | 1.30 | | | | 1.13 | | | | 2.33 | | | | 1.24 | | | | (2.97 | ) | | | (2.44 | ) | | | 2.66 | |
Distributions to shareholders from | | | | | | | | | | | | | | | | | | | | | | | | | | | | |
Net investment income | | | (0.24 | ) | | | (0.23 | ) | | | (0.01 | ) | | | (0.16 | ) | | | (0.17 | ) | | | (0.14 | ) | | | (0.18 | ) |
Net realized gains | | | (1.63 | ) | | | (0.50 | ) | | | 0.00 | | | | 0.00 | | | | (0.41 | ) | | | (1.99 | ) | | | (0.60 | ) |
| | | | | | | | | | | | | | | | | | | | | | | | | | | | |
Total distributions to shareholders | | | (1.87 | ) | | | (0.73 | ) | | | (0.01 | ) | | | (0.16 | ) | | | (0.58 | ) | | | (2.13 | ) | | | (0.78 | ) |
Net asset value, end of period | | $ | 14.08 | | | $ | 14.65 | | | $ | 14.25 | | | $ | 11.93 | | | $ | 10.85 | | | $ | 14.40 | | | $ | 18.97 | |
Total return3 | | | 9.57 | % | | | 8.54 | % | | | 19.50 | % | | | 11.39 | % | | | (20.07 | )% | | | (14.06 | )% | | | 15.98 | % |
Ratios to average net assets (annualized) | | | | | | | | | | | | | | | | | | | | | | | | | | | | |
Gross expenses | | | 0.94 | % | | | 0.92 | % | | | 0.93 | % | | | 0.76 | % | | | 1.00 | % | | | 0.94 | % | | | 0.89 | % |
Net expenses | | | 0.92 | % | | | 0.92 | % | | | 0.92 | % | | | 0.76 | % | | | 1.00 | % | | | 0.94 | % | | | 0.89 | % |
Net investment income | | | 1.79 | % | | | 1.43 | % | | | 1.18 | % | | | 1.27 | % | | | 1.71 | % | | | 1.12 | % | | | 0.92 | % |
Supplemental data | | | | | | | | | | | | | | | | | | | | | | | | | | | | |
Portfolio turnover rate | | | 37 | % | | | 82 | % | | | 64 | % | | | 63 | % | | | 30 | % | | | 29 | % | | | 71 | % |
Net assets, end of period (000s omitted) | | | $259,633 | | | | $254,272 | | | | $268,460 | | | | $265,835 | | | | $243,049 | | | | $348,350 | | | | $513,074 | |
| 1. | After the close of business on July 16, 2010, the Fund acquired the net assets of Evergreen Enhanced S&P 500 Fund which became the accounting and performance survivor in the transaction. The information for the periods prior to July 19, 2010 is that of Class A of Evergreen Enhanced S&P 500 Fund. |
| 2. | For the ten months ended July 31, 2008. The Fund changed its fiscal year end from September 30 to July 31, effective July 31, 2008. |
| 3. | Total return calculations do not include any sales charges. Returns for periods of less than one year are not annualized. |
The accompanying notes are an integral part of these financial statements.
| | | | | | |
| Financial highlights | | Wells Fargo Advantage Disciplined U.S. Core Fund | | | 19 | |
(For a share outstanding throughout each period)
| | | | | | | | | | | | | | | | | | | | | | | | | | | | |
| | | Six months ended
January 31, 2013
(unaudited) | | | Year ended July 31 | | | Year ended
September 30,
20071 | |
| CLASS C | | | 2012 | | | 2011 | | | 20101 | | | 20091 | | | 20081,2 | | |
Net asset value, beginning of period | | $ | 14.10 | | | $ | 13.69 | | | $ | 11.54 | | | $ | 10.50 | | | $ | 13.95 | | | $ | 18.45 | | | $ | 16.64 | |
Net investment income | | | 0.07 | | | | 0.09 | | | | 0.05 | | | | 0.06 | | | | 0.11 | | | | 0.05 | | | | 0.04 | 3 |
Net realized and unrealized gains (losses) on investments | | | 1.12 | | | | 0.90 | | | | 2.10 | | | | 1.04 | | | | (3.06 | ) | | | (2.51 | ) | | | 2.42 | |
| | | | | | | | | | | | | | | | | | | | | | | | | | | | |
Total from investment operations | | | 1.19 | | | | 0.99 | | | | 2.15 | | | | 1.10 | | | | (2.95 | ) | | | (2.46 | ) | | | 2.46 | |
Distributions to shareholders from | | | | | | | | | | | | | | | | | | | | | | | | | | | | |
Net investment income | | | (0.13 | ) | | | (0.08 | ) | | | 0.00 | | | | (0.06 | ) | | | (0.09 | ) | | | (0.05 | ) | | | (0.05 | ) |
Net realized gains | | | (1.63 | ) | | | (0.50 | ) | | | 0.00 | | | | 0.00 | | | | (0.41 | ) | | | (1.99 | ) | | | (0.60 | ) |
| | | | | | | | | | | | | | | | | | | | | | | | | | | | |
Total distributions to shareholders | | | (1.76 | ) | | | (0.58 | ) | | | 0.00 | | | | (0.06 | ) | | | (0.50 | ) | | | (2.04 | ) | | | (0.65 | ) |
Net asset value, end of period | | $ | 13.53 | | | $ | 14.10 | | | $ | 13.69 | | | $ | 11.54 | | | $ | 10.50 | | | $ | 13.95 | | | $ | 18.45 | |
Total return4 | | | 9.12 | % | | | 7.75 | % | | | 18.63 | % | | | 10.51 | % | | | (20.65 | )% | | | (14.58 | )% | | | 15.10 | % |
Ratios to average net assets (annualized) | | | | | | | | | | | | | | | | | | | | | | | | | | | | |
Gross expenses | | | 1.69 | % | | | 1.67 | % | | | 1.68 | % | | | 1.51 | % | | | 1.76 | % | | | 1.69 | % | | | 1.63 | % |
Net expenses | | | 1.67 | % | | | 1.67 | % | | | 1.67 | % | | | 1.51 | % | | | 1.76 | % | | | 1.69 | % | | | 1.63 | % |
Net investment income | | | 1.06 | % | | | 0.68 | % | | | 0.44 | % | | | 0.52 | % | | | 0.95 | % | | | 0.36 | % | | | 0.24 | % |
Supplemental data | | | | | | | | | | | | | | | | | | | | | | | | | | | | |
Portfolio turnover rate | | | 37 | % | | | 82 | % | | | 64 | % | | | 63 | % | | | 30 | % | | | 29 | % | | | 71 | % |
Net assets, end of period (000s omitted) | | | $8,221 | | | | $8,590 | | | | $8,768 | | | | $11,613 | | | | $11,462 | | | | $10,409 | | | | $12,331 | |
| 1. | After the close of business on July 16, 2010, the Fund acquired the net assets of Evergreen Enhanced S&P 500 Fund which became the accounting and performance survivor in the transaction. The information for the periods prior to July 19, 2010 is that of Class C of Evergreen Enhanced S&P 500 Fund. |
| 2. | For the ten months ended July 31, 2008. The Fund changed its fiscal year end from September 30 to July 31, effective July 31, 2008. |
| 3. | Calculated based upon average shares outstanding |
| 4. | Total return calculations do not include any sales charges. Returns for periods of less than one year are not annualized. |
The accompanying notes are an integral part of these financial statements.
| | | | |
| 20 | | Wells Fargo Advantage Disciplined U.S. Core Fund | | Financial highlights |
(For a share outstanding throughout each period)
| | | | | | | | | | | | | | | | | | | | | | | | | | | | |
| | | Six months ended
January 31, 2013
(unaudited) | | | Year ended July 31 | | | Year ended
September 30,
20071 | |
| ADMINISTRATOR CLASS | | | 2012 | | | 2011 | | | 20101 | | | 20091 | | | 20081,2 | | |
Net asset value, beginning of period | | $ | 14.79 | | | $ | 14.36 | | | $ | 11.99 | | | $ | 10.92 | | | $ | 14.48 | | | $ | 19.06 | | | $ | 17.16 | |
Net investment income | | | 0.15 | 3 | | | 0.23 | 3 | | | 0.19 | 3 | | | 0.20 | | | | 0.22 | | | | 0.19 | | | | 0.23 | |
Net realized and unrealized gains (losses) on investments | | | 1.17 | | | | 0.93 | | | | 2.19 | | | | 1.06 | | | | (3.17 | ) | | | (2.61 | ) | | | 2.49 | |
| | | | | | | | | | | | | | | | | | | | | | | | | | | | |
Total from investment operations | | | 1.32 | | | | 1.16 | | | | 2.38 | | | | 1.26 | | | | (2.95 | ) | | | (2.42 | ) | | | 2.72 | |
Distributions to shareholders from | | | | | | | | | | | | | | | | | | | | | | | | | | | | |
Net investment income | | | (0.24 | ) | | | (0.23 | ) | | | (0.01 | ) | | | (0.19 | ) | | | (0.20 | ) | | | (0.17 | ) | | | (0.22 | ) |
Net realized gains | | | (1.63 | ) | | | (0.50 | ) | | | 0.00 | | | | 0.00 | | | | (0.41 | ) | | | (1.99 | ) | | | (0.60 | ) |
| | | | | | | | | | | | | | | | | | | | | | | | | | | | |
Total distributions to shareholders | | | (1.87 | ) | | | (0.73 | ) | | | (0.01 | ) | | | (0.19 | ) | | | (0.61 | ) | | | (2.16 | ) | | | (0.82 | ) |
Net asset value, end of period | | $ | 14.24 | | | $ | 14.79 | | | $ | 14.36 | | | $ | 11.99 | | | $ | 10.92 | | | $ | 14.48 | | | $ | 19.06 | |
Total return4 | | | 9.65 | % | | | 8.72 | % | | | 19.84 | % | | | 11.51 | % | | | (19.81 | )% | | | (13.89 | )% | | | 16.28 | % |
Ratios to average net assets (annualized) | | | | | | | | | | | | | | | | | | | | | | | | | | | | |
Gross expenses | | | 0.78 | % | | | 0.75 | % | | | 0.77 | % | | | 0.52 | % | | | 0.75 | % | | | 0.69 | % | | | 0.62 | % |
Net expenses | | | 0.74 | % | | | 0.74 | % | | | 0.74 | % | | | 0.52 | % | | | 0.75 | % | | | 0.69 | % | | | 0.62 | % |
Net investment income | | | 2.00 | % | | | 1.63 | % | | | 1.37 | % | | | 1.53 | % | | | 1.99 | % | | | 1.36 | % | | | 1.25 | % |
Supplemental data | | | | | | | | | | | | | | | | | | | | | | | | | | | | |
Portfolio turnover rate | | | 37 | % | | | 82 | % | | | 64 | % | | | 63 | % | | | 30 | % | | | 29 | % | | | 71 | % |
Net assets, end of period (000s omitted) | | | $120,777 | | | | $150,408 | | | | $244,716 | | | | $371,389 | | | | $484,594 | | | | $942,112 | | | | $1,592,166 | |
| 1. | After the close of business on July 16, 2010, the Fund acquired the net assets of Evergreen Enhanced S&P 500 Fund which became the accounting and performance survivor in the transaction. The information for the periods prior to July 19, 2010 is that of Class I of Evergreen Enhanced S&P 500 Fund. |
| 2. | For the ten months ended July 31, 2008. The Fund changed its fiscal year end from September 30 to July 31, effective July 31, 2008. |
| 3. | Calculated based upon average shares outstanding |
| 4. | Returns for periods of less than one year are not annualized. |
The accompanying notes are an integral part of these financial statements.
| | | | | | |
| Financial highlights | | Wells Fargo Advantage Disciplined U.S. Core Fund | | | 21 | |
(For a share outstanding throughout each period)
| | | | | | | | | | | | | | | | |
| | | Six months ended
January 31, 2013
(unaudited) | | | Year ended July 31 | |
| INSTITUTIONAL CLASS | | | 2012 | | | 2011 | | | 20101 | |
Net asset value, beginning of period | | $ | 14.78 | | | $ | 14.39 | | | $ | 11.99 | | | $ | 11.99 | |
Net investment income | | | 0.17 | | | | 0.26 | 2 | | | 0.22 | | | | 0.00 | |
Net realized and unrealized gains (losses) on investments | | | 1.17 | | | | 0.93 | | | | 2.19 | | | | 0.00 | |
| | | | | | | | | | | | | | | | |
Total from investment operations | | | 1.34 | | | | 1.19 | | | | 2.41 | | | | 0.00 | |
Distributions to shareholders from | | | | | | | | | | | | | | | | |
Net investment income | | | (0.30 | ) | | | (0.30 | ) | | | (0.01 | ) | | | 0.00 | |
Net realized gains | | | (1.63 | ) | | | (0.50 | ) | | | 0.00 | | | | 0.00 | |
| | | | | | | | | | | | | | | | |
Total distributions to shareholders | | | (1.93 | ) | | | (0.80 | ) | | | (0.01 | ) | | | 0.00 | |
Net asset value, end of period | | $ | 14.19 | | | $ | 14.78 | | | $ | 14.39 | | | $ | 11.99 | |
Total return3 | | | 9.82 | % | | | 9.02 | % | | | 20.10 | % | | | 0.00 | % |
Ratios to average net assets (annualized) | | | | | | | | | | | | | | | | |
Gross expenses | | | 0.51 | % | | | 0.49 | % | | | 0.51 | % | | | 0.00 | % |
Net expenses | | | 0.48 | % | | | 0.48 | % | | | 0.47 | % | | | 0.00 | % |
Net investment income | | | 2.25 | % | | | 1.80 | % | | | 1.62 | % | | | 0.00 | % |
Supplemental data | | | | | | | | | | | | | | | | |
Portfolio turnover rate | | | 37 | % | | | 82 | % | | | 64 | % | | | 63 | % |
Net assets, end of period (000s omitted) | | | $1,169 | | | | $1,215 | | | | $12 | | | | $10 | |
| 1. | For the period from July 30, 2010 (commencement of class operations) to July 31, 2010 |
| 2. | Calculated based upon average shares outstanding |
| 3. | Returns for periods of less than one year are not annualized. |
The accompanying notes are an integral part of these financial statements.
| | | | |
| 22 | | Wells Fargo Advantage Disciplined U.S. Core Fund | | Notes to financial statements (unaudited) |
1. ORGANIZATION
Wells Fargo Funds Trust (the “Trust”), a Delaware statutory trust organized on March 10, 1999, is an open-end management investment company registered under the Investment Company Act of 1940, as amended (the “1940 Act”). These financial statements report on Wells Fargo Advantage Disciplined U.S. Core Fund (the “Fund”) which is a diversified series of the Trust.
2. SIGNIFICANT ACCOUNTING POLICIES
The following significant accounting policies, which are consistently followed in the preparation of the financial statements of the Fund, are in conformity with U.S. generally accepted accounting principles which require management to make estimates and assumptions that affect the reported amounts of assets and liabilities, disclosure of contingent assets and liabilities at the date of the financial statements, and the reported amounts of revenues and expenses during the reporting period. Actual results could differ from those estimates.
Securities valuation
All investments are valued each business day as of the close of regular trading on the New York Stock Exchange (normally 4 p.m. Eastern Time).
Equity securities that are listed on a foreign or domestic exchange, except for The Nasdaq Stock Market, Inc. (“Nasdaq”), are valued at the official closing price or, if none, the last sales price. Securities listed on Nasdaq are valued at the Nasdaq Official Closing Price (“NOCP”). If no NOCP is available, securities are valued at the last sales price. If no sales price is shown on the Nasdaq, the bid price will be used. If no sale occurs on the primary exchange or market for the security that day or if no sale occurs and no bid price is shown on Nasdaq, the prior day’s price will be deemed “stale” and fair values will be determined in accordance with the Fund’s Valuation Procedures.
Fixed income securities acquired with maturities exceeding 60 days are valued based on evaluated bid prices received from an independent pricing service which may utilize both transaction data and market information such as yield, prices of securities of comparable quality, coupon rate, maturity, type of issue, trading characteristics and other market data. If valuations are not available from the independent pricing service or values received are deemed not representative of market value, values will be obtained from a broker-dealer or otherwise determined based on the Fund’s Valuation Procedures.
Investments in registered open-end investment companies are valued at net asset value. Non-registered investment companies are fair valued at net asset value.
Investments which are not valued using any of the methods discussed above are valued at their fair value, as determined by procedures established in good faith and approved by the Board of Trustees. The Board of Trustees has established a Valuation Committee comprised of the Trustees and has delegated to it the authority to take any actions regarding the valuation of portfolio securities that the Valuation Committee deems necessary or appropriate, including determining the fair value of portfolio securities, unless the determination has been delegated to the Management Valuation Team of Wells Fargo Funds Management, LLC (“Funds Management”). The Board of Trustees retains the authority to make or ratify any valuation decisions or approve any changes to the Valuation Procedures as it deems appropriate. On a quarterly basis, the Board of Trustees receives reports on any valuation actions taken by the Valuation Committee or the Management Valuation Team which may include items for ratification.
Valuations of fair valued securities are compared to the next actual sales price when available, or other appropriate market information to assess the continued appropriateness of the fair valuation methodology used. These securities are fair valued on a day-to-day basis, taking into consideration changes to appropriate market information and any significant changes to the input factors considered in the valuation process until there is a readily available price provided on the exchange or by an independent pricing service. Valuations received from an independent pricing service or broker quotes are periodically validated by comparisons to most recent trades and valuations provided by other independent pricing services in addition to the review of prices by the adviser and/or subadviser. Unobservable inputs used in determining fair valuations are identified based on the type of security, taking into consideration factors utilized by market participants in valuing the investment, knowledge about the issuer and the current market environment.
Security loans
The Fund may lend its securities from time to time in order to earn additional income in the form of fees or interest on securities received as collateral or the investment of any cash received as collateral. The Fund continues to receive interest or dividends on the securities loaned. The Fund receives collateral in the form of cash or securities with a value at least equal to the value of the securities on loan. The value of the loaned securities is determined at the close of each business day and any additional required collateral is delivered to the Fund on the next business day. In a securities lending transaction, the net asset value of the Fund will be affected by an increase or decrease in the value of the
| | | | | | |
| Notes to financial statements (unaudited) | | Wells Fargo Advantage Disciplined U.S. Core Fund | | | 23 | |
securities loaned and by an increase or decrease in the value of the instrument in which collateral is invested. The amount of securities lending activity undertaken by the Fund fluctuates from time to time. In the event of default or bankruptcy by the borrower, the Fund may be prevented from recovering the loaned securities or gaining access to the collateral or may experience delays or costs in doing so. In addition, the investment of any cash collateral received may lose all or part of its value. The Fund has the right under the lending agreement to recover the securities from the borrower on demand.
The Fund lends its securities through an unaffiliated securities lending agent. Cash collateral received in connection with its securities lending transactions is invested in Wells Fargo Securities Lending Cash Investments, LLC (the “Cash Collateral Fund”). The Cash Collateral Fund is exempt from registration under Section 3(c)(7) of the 1940 Act and is managed by Funds Management and is subadvised by Wells Capital Management Incorporated (“WellsCap”). Funds Management receives an advisory fee starting at 0.05% and declining to 0.01% as the average daily net assets of the Cash Collateral Fund increase. All of the fees received by Funds Management are paid to WellsCap for its services as subadviser. The Cash Collateral Fund seeks to provide a positive return compared to the daily Fed Funds Open rate by investing in high-quality, U.S. dollar-denominated short-term money market instruments. Cash Collateral Fund investments are fair valued based upon the amortized cost valuation technique. Income earned from investment in the Cash Collateral Fund is included in securities lending income on the Statement of Operations.
Futures contracts
The Fund may be subject to equity price risk in the normal course of pursuing its investment objectives. The Fund may buy and sell futures contracts in order to gain exposure to, or protect against, changes in security values and interest rates. The primary risks associated with the use of futures contracts are the imperfect correlation between changes in market values of securities held by the Fund and the prices of futures contracts, and the possibility of an illiquid market.
Futures contracts are valued based upon their quoted daily settlement prices when available. The aggregate principal amounts of the contracts are not recorded in the financial statements. Fluctuations in the value of the contracts are recorded in the Statement of Assets and Liabilities as an asset or liability and in the Statement of Operations as unrealized gains or losses until the contracts are closed, at which point they are recorded as net realized gains or losses on futures contracts. With futures contracts, there is minimal counterparty risk to the Fund since futures are exchange traded and the exchange’s clearinghouse, as counterparty to all exchange traded futures, guarantees the futures against default.
Security transactions and income recognition
Securities transactions are recorded on a trade date basis. Realized gains or losses are recorded on the basis of identified cost.
Dividend income is recognized on the ex-dividend date. Dividend income is recorded net of foreign taxes withheld where recovery of such taxes is not assured.
Distributions to shareholders
Distributions to shareholders from net investment income and net realized gains, if any, are recorded on the ex-dividend date. Such distributions are determined in conformity with federal income tax regulations, which may differ in amount or character from net investment income and realized gains recognized for purposes of U.S. generally accepted accounting principles.
Federal and other taxes
The Fund intends to continue to qualify as a regulated investment company by distributing substantially all of its investment company taxable income and any net realized capital gains (after reduction for capital loss carryforwards) sufficient to relieve it from all, or substantially all, federal income taxes. Accordingly, no provision for federal income taxes was required.
The Fund’s income and federal excise tax returns and all financial records supporting those returns for the prior three fiscal years are subject to examination by the federal and Delaware revenue authorities. Management has analyzed the Fund’s tax positions taken on federal, state, and foreign tax returns for all open tax years and does not believe that there are any uncertain tax positions that require recognition of a tax liability.
Class allocations
The separate classes of shares offered by the Fund differ principally in applicable sales charges, distribution, shareholder servicing, and administration fees. Shareholders of each class bear certain expenses that pertain to that particular class. All shareholders bear the common expenses of the Fund, earn income from the portfolio, and are allocated any unrealized gains and losses pro rata based on the average daily net assets of each class, without distinction between share classes. Dividends are determined separately for each class based on income and expenses allocable to each class. Realized gains and losses are allocated to each class pro rata based upon the net assets of each class on the date realized.
| | | | |
| 24 | | Wells Fargo Advantage Disciplined U.S. Core Fund | | Notes to financial statements (unaudited) |
Differences in per share dividend rates generally result from the relative weightings of pro rata income and realized gain allocations and from differences in separate class expenses, including distribution, shareholder servicing, and administration fees.
3. FAIR VALUATION MEASUREMENTS
Fair value measurements of investments are determined within a framework that has established a fair value hierarchy based upon the various data inputs utilized in determining the value of the Fund’s investments. The three-level hierarchy gives the highest priority to unadjusted quoted prices in active markets for identical assets or liabilities (Level 1) and the lowest priority to significant unobservable inputs (Level 3). The Fund’s investments are classified within the fair value hierarchy based on the lowest level of input that is significant to the fair value measurement. The inputs are summarized into three broad levels as follows:
| n | | Level 1 – quoted prices in active markets for identical securities |
| n | | Level 2 – other significant observable inputs (including quoted prices for similar securities, interest rates, prepayment speeds, credit risk, use of amortized cost, etc.) |
| n | | Level 3 – significant unobservable inputs (including the Fund’s own assumptions in determining the fair value of investments) |
The inputs or methodologies used for valuing investments in securities are not necessarily an indication of the risk associated with investing in those securities.
As of January 31, 2013, the inputs used in valuing investments in securities, which are carried at fair value, were as follows:
| | | | | | | | | | | | | | | | |
| Investments in securities | | Quoted prices (Level 1) | | | Significant other
observable inputs (Level 2) | | | Significant unobservable inputs (Level 3) | | | Total | |
Equity securities | | | | | | | | | | | | | | | | |
Common stocks | | $ | 387,453,017 | | | $ | 0 | | | $ | 0 | | | $ | 387,453,017 | |
Short-term investments | | | | | | | | | | | | | | | | |
Investment companies | | | 2,630,904 | | | | 18,743,839 | | | | 0 | | | | 21,374,743 | |
| | | $ | 390,083,921 | | | $ | 18,743,839 | | | $ | 0 | | | $ | 408,827,760 | |
Further details on the major security types listed above can be found in the Portfolio of Investments.
Transfers in and transfers out are recognized at the end of the reporting period. For the six months ended January 31, 2013, the Fund did not have any transfers into/out of Level 1 or Level 2.
4. TRANSACTIONS WITH AFFILIATES AND OTHER EXPENSES
Advisory fee
The Trust has entered into an advisory contract with Funds Management, an indirect wholly owned subsidiary of Wells Fargo & Company (“Wells Fargo”). The adviser is responsible for implementing investment policies and guidelines and for supervising the subadviser, who is responsible for day-to-day portfolio management of the Fund.
Pursuant to the contract, Funds Management is entitled to receive an annual advisory fee starting at 0.30% and declining to 0.25% as the average daily net assets of the Fund increase. For the six months ended January 31, 2013, the advisory fee was equivalent to an annual rate of 0.30% of the Fund’s average daily net assets.
Funds Management has retained the services of a subadviser to provide daily portfolio management to the Fund. The fee for subadvisory services is borne by Funds Management. Golden Capital Management, LLC, an affiliate of Funds Management, is the subadviser to the Fund and is entitled to receive a fee from Funds Management at an annual rate starting at 0.25% and declining to 0.15% as the average daily net assets of the Fund increase.
| | | | | | |
| Notes to financial statements (unaudited) | | Wells Fargo Advantage Disciplined U.S. Core Fund | | | 25 | |
Administration and transfer agent fees
The Trust has entered into an administration agreement with Funds Management. Under this agreement, for providing administrative services, which includes paying fees and expenses for services provided by the transfer agent, sub-transfer agents, omnibus account servicers and record-keepers, Funds Management is entitled to receive from the Fund an annual fund level administration fee starting at 0.05% and declining to 0.03% as the average daily net assets of the Fund increase and a class level administration fee which is calculated based on the average daily net assets of each class as follows:
| | | | |
| | | Class level administration fee | |
Class A, Class C | | | 0.26 | % |
Administrator Class | | | 0.10 | |
Institutional Class | | | 0.08 | |
Funds Management has contractually waived and/or reimbursed advisory and administration fees to the extent necessary to maintain certain net operating expense ratios for the Fund. Waiver of fees and/or reimbursement of expenses by Funds Management were made first from fund level expenses on a proportionate basis and then from class specific expenses. Funds Management has committed through November 30, 2013 to waive fees and/or reimburse expenses to the extent necessary to cap the Fund’s expenses at 0.92% for Class A shares, 1.67% for Class C shares, 0.74% for Administrator Class shares, and 0.48% for Institutional Class shares.
Distribution fees
The Trust has adopted a Distribution Plan for Class C shares of the Fund pursuant to Rule 12b-1 under the 1940 Act. Distribution fees are charged to Class C shares and paid to Wells Fargo Funds Distributor, LLC, the principal underwriter, at an annual rate of 0.75% of the average daily net assets of Class C shares.
For the six months ended January 31, 2013, Wells Fargo Funds Distributor, LLC received $3,330 from the sale of Class A shares.
Shareholder servicing fees
The Trust has entered into contracts with one or more shareholder servicing agents, whereby Class A, Class C, and Administrator Class of the Fund is charged a fee at an annual rate of 0.25% of the average daily net assets of each respective class.
A portion of these total shareholder servicing fees were paid to affiliates of Wells Fargo.
5. INVESTMENT PORTFOLIO TRANSACTIONS
Purchases and sales of investments, excluding U.S. government obligations (if any) and short-term securities, for the six months ended January 31, 2013 were $146,690,652 and $201,659,237, respectively.
6. BANK BORROWINGS
The Trust (excluding the money market funds and certain other funds in the Trust) and Wells Fargo Variable Trust are parties to a $150,000,000 revolving credit agreement with State Street Bank and Trust Company, whereby the Fund is permitted to use bank borrowings for temporary or emergency purposes, such as to fund shareholder redemption requests. Interest under the credit agreement is charged to the Fund based on a borrowing rate equal to the higher of the Federal Funds rate in effect on that day plus 1.25% or the overnight LIBOR rate in effect on that day plus 1.25%. In addition, an annual commitment fee equal to 0.10% of the unused balance is allocated to each participating fund. For the six months ended January 31, 2013, the Fund paid $183 in commitment fees.
For the six months ended January 31, 2013, there were no borrowings by the Fund under the agreement.
7. INDEMNIFICATION
Under the Trust’s organizational documents, the officers and directors are indemnified against certain liabilities that may arise out of performance of their duties to the Trust. Additionally, in the normal course of business, the Trust may enter into contracts with service providers that contain a variety of indemnification clauses. The Trust’s maximum exposure under these arrangements is dependent on future claims that may be made against the Fund and, therefore, cannot be estimated.
| | | | |
| 26 | | Wells Fargo Advantage Disciplined U.S. Core Fund | | Notes to financial statements (unaudited) |
8. NEW ACCOUNTING PRONOUNCEMENT
In December 2011, the Financial Accounting Standards Board (“FASB”) issued Accounting Standard Update (“ASU”) No. 2011-11, Disclosures about Offsetting Assets and Liabilities. ASU 2011-11, which amends FASB ASC Topic 210, Balance Sheet, creates new disclosure requirements which require entities to disclose both gross and net information for derivatives and other financial instruments that are either offset in the Statement of Assets and Liabilities or subject to an enforceable master netting arrangement or similar agreement. The disclosure requirements are effective for interim and annual reporting periods beginning on or after January 1, 2013. Management is currently assessing the potential impact, in addition to expanded financial statement disclosure, that may result from adopting this ASU.
| | | | | | |
| Other information (unaudited) | | Wells Fargo Advantage Disciplined U.S. Core Fund | | | 27 | |
PROXY VOTING INFORMATION
A description of the policies and procedures that the Fund uses to determine how to vote proxies relating to portfolio securities is available without charge, upon request, by calling 1-800-222-8222, visiting our website at wellsfargoadvantagefunds.com, or visiting the SEC website at sec.gov. Information regarding how the Fund voted proxies relating to portfolio securities during the most recent 12-month period ended June 30 is available without charge on the Fund’s website at wellsfargoadvantagefunds.com or by visiting the SEC website at sec.gov.
PORTFOLIO HOLDINGS INFORMATION
The complete portfolio holdings for the Fund are publicly available on the Fund’s website (wellsfargoadvantagefunds.com) on a monthly, 30-day or more delayed basis. In addition, top ten holdings information for the Fund is publicly available on the Fund’s website on a monthly, seven-day or more delayed basis. The Fund files its complete schedule of portfolio holdings with the SEC for the first and third quarters of each fiscal year on Form N-Q, which is available without charge by visiting the SEC website at sec.gov. In addition, the Fund’s Form N-Q may be reviewed and copied at the SEC’s Public Reference Room in Washington, DC, and at regional offices in New York City, at 233 Broadway, and in Chicago, at 175 West Jackson Boulevard, Suite 900. Information about the Public Reference Room may be obtained by calling 1-800-SEC-0330.
| | | | |
| 28 | | Wells Fargo Advantage Disciplined U.S. Core Fund | | Other information (unaudited) |
BOARD OF TRUSTEES AND OFFICERS
Each of the Trustees and Officers listed in the table below acts in identical capacities for the Wells Fargo Advantage family of funds, which consists of 136 funds1 comprising the Wells Fargo Funds Trust, Wells Fargo Variable Trust, Wells Fargo Master Trust and four closed-end funds (collectively the “Fund Complex”). This table should be read in conjunction with the Prospectus and the Statement of Additional Information2. All of the Trustees are also Members of the Audit and Governance Committees of each Trust in the Fund Complex. The mailing address of each Trustee and Officer is 525 Market Street, 12th Floor, San Francisco, CA 94105. Each Trustee and Officer serves an indefinite term, however, each Trustee serves such term until reaching the mandatory retirement age established by the Trustees.
Independent Trustees
| | | | | | |
Name and year of birth | | Position held and length of service* | | Principal occupations during past five years | | Other directorships during
past five years |
| Peter G. Gordon (Born 1942) | | Trustee, since 1998; Chairman, since 2005 | | Co-Founder, Retired Chairman, President and CEO of Crystal Geyser Water Company. Trustee Emeritus, Colby College. | | Asset Allocation Trust |
| Isaiah Harris, Jr. (Born 1952) | | Trustee, since 2009 | | Retired. Prior thereto, President and CEO of BellSouth Advertising and Publishing Corp. from 2005 to 2007, President and CEO of BellSouth Enterprises from 2004 to 2005 and President of BellSouth Consumer Services from 2000 to 2003. Emeritus member of the Iowa State University Foundation Board of Governors. Emeritus Member of the Advisory Board of Iowa State University School of Business. Advisory Board Member, Palm Coast Academy (charter school). Mr. Harris is a certified public accountant. | | CIGNA Corporation; Deluxe Corporation; Asset Allocation Trust |
| Judith M. Johnson (Born 1949) | | Trustee, since 2008;
Audit Committee Chairman, since 2008 | | Retired. Prior thereto, Chief Executive Officer and Chief Investment Officer of Minneapolis Employees Retirement Fund from 1996 to 2008. Ms. Johnson is an attorney, certified public accountant and a certified managerial accountant. | | Asset Allocation Trust |
| Leroy Keith, Jr. (Born 1939) | | Trustee, since 2010 | | Chairman, Bloc Global Services (development and construction). Trustee of the Evergreen Funds from 1983 to 2010. Former Managing Director, Almanac Capital Management (commodities firm), former Partner, Stonington Partners, Inc. (private equity fund), former Director, Obagi Medical Products Co. and former Director, Lincoln Educational Services. | | Trustee, Virtus Fund Complex (consisting of 48 portfolios as of 1/31/2013); Asset Allocation Trust |
| David F. Larcker (Born 1950) | | Trustee, since 2009 | | James Irvin Miller Professor of Accounting at the Graduate School of Business, Stanford University, Morgan Stanley Director of the Center for Leadership Development and Research and Senior Faculty of The Rock Center for Corporate Governance since 2006. From 2005 to 2008, Professor of Accounting at the Graduate School of Business, Stanford University. Prior thereto, Ernst & Young Professor of Accounting at The Wharton School, University of Pennsylvania from 1985 to 2005. | | Asset Allocation Trust |
| Olivia S. Mitchell (Born 1953) | | Trustee, since 2006 | | International Foundation of Employee Benefit Plans Professor, Wharton School of the University of Pennsylvania since 1993. Director of Wharton’s Pension Research Council and Boettner Center on Pensions & Retirement Research, and Research Associate at the National Bureau of Economic Research. Previously, Cornell University Professor from 1978 to 1993. | | Asset Allocation Trust |
| Timothy J. Penny (Born 1951) | | Trustee, since 1996 | | President and CEO of Southern Minnesota Initiative Foundation, a non-profit organization, since 2007 and Senior Fellow at the Humphrey Institute Policy Forum at the University of Minnesota since 1995. Member of the Board of Trustees of NorthStar Education Finance, Inc., a non-profit organization, since 2007. | | Asset Allocation Trust |
| | | | | | |
| Other information (unaudited) | | Wells Fargo Advantage Disciplined U.S. Core Fund | | | 29 | |
| | | | | | |
Name and year of birth | | Position held and length of service* | | Principal occupations during past five years | | Other directorships during
past five years |
| Michael S. Scofield (Born 1943) | | Trustee, since 2010 | | Served on the Investment Company Institute’s Board of Governors and Executive Committee from 2008-2011 as well the Governing Council of the Independent Directors Council from 2006-2011 and the Independent Directors Council Executive Committee from 2008-2011. Chairman of the IDC from 2008-2010. Institutional Investor (Fund Directions) Trustee of Year in 2007. Trustee of the Evergreen Funds (and its predecessors) from 1984 to 2010. Chairman of the Evergreen Funds from 2000-2010. Former Trustee of the Mentor Funds. Retired Attorney, Law Offices of Michael S. Scofield. | | Asset Allocation Trust |
| Donald C. Willeke (Born 1940) | | Trustee, since 1996 | | Principal of the law firm of Willeke & Daniels. General Counsel of the Minneapolis Employees Retirement Fund from 1984 until its consolidation into the Minnesota Public Employees Retirement Association on June 30, 2010. Director and Vice Chair of The Tree Trust (non-profit corporation). Director of the American Chestnut Foundation (non-profit corporation). | | Asset Allocation Trust |
| * | Length of service dates reflect the Trustee’s commencement of service with the Trust’s predecessor entities, where applicable. |
Officers
| | | | | | |
Name and year of birth | | Position held and length of service | | Principal occupations during past five years | | |
| Karla M. Rabusch (Born 1959) | | President, since 2003 | | Executive Vice President of Wells Fargo Bank, N.A. and President of Wells Fargo Funds Management, LLC since 2003. | | |
Jeremy DePalma1
(Born 1974) | | Treasurer, since 2012 | | Senior Vice President of Wells Fargo Funds Management, LLC since 2009. Senior Vice President of Evergreen Investment Management Company, LLC from 2008 to 2010. Vice President, Evergreen Investment Services, Inc. from 2004 to 2007. Head of the Fund Reporting and Control Team within Fund Administration from 2005 to 2010. | | |
C. David Messman
(Born 1960) | | Secretary, since 2000; Chief Legal Officer, since 2003 | | Senior Vice President and Secretary of Wells Fargo Funds Management, LLC since 2001. Vice President and Managing Counsel of Wells Fargo Bank, N.A. since 1996. | | |
Debra Ann Early
(Born 1964) | | Chief Compliance Officer, since 2007 | | Chief Compliance Officer of Wells Fargo Funds Management, LLC since 2007. Chief Compliance Officer of Parnassus Investments from 2005 to 2007. Chief Financial Officer of Parnassus Investments from 2004 to 2007. | | |
David Berardi
(Born 1975) | | Assistant Treasurer, since 2009 | | Vice President of Wells Fargo Funds Management, LLC since 2009. Vice President of Evergreen Investment Management Company, LLC from 2008 to 2010. Assistant Vice President of Evergreen Investment Services, Inc. from 2004 to 2008. Manager of Fund Reporting and Control for Evergreen Investment Management Company, LLC from 2004 to 2010. | | |
| 1. | Jeremy DePalma acts as Treasurer of 61 funds and Assistant Treasurer of 75 funds in the Fund Complex. |
| 2. | The Statement of Additional Information includes additional information about the Trustees and is available, without charge, upon request, by calling 1-800-222-8222 or by visiting the website at wellsfargoadvantagefunds.com. |
| | | | |
| 30 | | Wells Fargo Advantage Disciplined U.S. Core Fund | | List of abbreviations |
The following is a list of common abbreviations for terms and entities that may have appeared in this report.
| ACA | — ACA Financial Guaranty Corporation |
| ADR | — American depositary receipt |
| ADS | — American depositary shares |
| AGC | — Assured Guaranty Corporation |
| AGM | — Assured Guaranty Municipal |
| Ambac | — Ambac Financial Group Incorporated |
| AMT | — Alternative minimum tax |
| BAN | — Bond anticipation notes |
| BHAC | — Berkshire Hathaway Assurance Corporation |
| CAB | — Capital appreciation bond |
| CCAB | — Convertible capital appreciation bond |
| CDA | — Community Development Authority |
| CDO | — Collateralized debt obligation |
| COP | — Certificate of participation |
| DRIVER | — Derivative inverse tax-exempt receipts |
| DW&P | — Department of Water & Power |
| DWR | — Department of Water Resources |
| ECFA | — Educational & Cultural Facilities Authority |
| EDA | — Economic Development Authority |
| EDFA | — Economic Development Finance Authority |
| ETF | — Exchange-traded fund |
| FDIC | — Federal Deposit Insurance Corporation |
| FFCB | — Federal Farm Credit Banks |
| FGIC | — Financial Guaranty Insurance Corporation |
| FHA | — Federal Housing Administration |
| FHLB | — Federal Home Loan Bank |
| FHLMC | — Federal Home Loan Mortgage Corporation |
| FICO | — The Financing Corporation |
| FNMA | — Federal National Mortgage Association |
| GDR | — Global depositary receipt |
| GNMA | — Government National Mortgage Association |
| HCFR | — Healthcare facilities revenue |
| HEFA | — Health & Educational Facilities Authority |
| HEFAR | — Higher education facilities authority revenue |
| HFA | — Housing Finance Authority |
| HFFA | — Health Facilities Financing Authority |
| HUD | — Department of Housing and Urban Development |
| IDA | — Industrial Development Authority |
| IDAG | — Industrial Development Agency |
| IDR | — Industrial development revenue |
| KRW | — Republic of Korea won |
| LIBOR | — London Interbank Offered Rate |
| LLC | — Limited liability company |
| LLP | — Limited liability partnership |
| MBIA | — Municipal Bond Insurance Association |
| MFHR | — Multifamily housing revenue |
| MSTR | — Municipal securities trust receipts |
| MUD | — Municipal Utility District |
| National | — National Public Finance Guarantee Corporation |
| PCFA | — Pollution Control Financing Authority |
| PCL | — Public Company Limited |
| PCR | — Pollution control revenue |
| PFA | — Public Finance Authority |
| PFFA | — Public Facilities Financing Authority |
| PFOTER | — Puttable floating option tax-exempt receipts |
| plc | — Public limited company |
| PUTTER | — Puttable tax-exempt receipts |
| R&D | — Research & development |
| Radian | — Radian Asset Assurance |
| RAN | — Revenue anticipation notes |
| RDA | — Redevelopment Authority |
| RDFA | — Redevelopment Finance Authority |
| REIT | — Real estate investment trust |
| ROC | — Reset option certificates |
| SAVRS | — Select auction variable rate securities |
| SBA | — Small Business Authority |
| SFHR | — Single-family housing revenue |
| SFMR | — Single-family mortgage revenue |
| SPA | — Standby purchase agreement |
| SPDR | — Standard & Poor’s Depositary Receipts |
| STRIPS | — Separate trading of registered interest and principal securities |
| TAN | — Tax anticipation notes |
| TIPS | — Treasury inflation-protected securities |
| TRAN | — Tax revenue anticipation notes |
| TTFA | — Transportation Trust Fund Authority |
| TVA | — Tennessee Valley Authority |


For more information
More information about Wells Fargo Advantage Funds is available free upon request. To obtain literature, please write, email, visit the Fund’s website, or call:
Wells Fargo Advantage Funds
P.O. Box 8266
Boston, MA 02266-8266
Email: wfaf@wellsfargo.com
Website: wellsfargoadvantagefunds.com
Individual investors: 1-800-222-8222
Retail investment professionals: 1-888-877-9275
Institutional investment professionals: 1-866-765-0778
This report and the financial statements contained herein are submitted for the general information of the shareholders of Wells Fargo Advantage Funds. If this report is used for promotional purposes, distribution of the report must be accompanied or preceded by a current prospectus. For a current prospectus and, if available, a summary prospectus containing more complete information, including charges and expenses, call 1-800-222-8222 or visit the Fund’s website at wellsfargoadvantagefunds.com. Please consider the investment objectives, risks, charges, and expenses of the investment carefully before investing. This and other information about Wells Fargo Advantage Funds can be found in the current prospectus. Read the prospectus carefully before you invest or send money.
Wells Fargo Funds Management, LLC, a wholly owned subsidiary of Wells Fargo & Company, provides investment advisory and administrative services for Wells Fargo Advantage Funds. Other affiliates of Wells Fargo & Company provide subadvisory and other services for the Funds. The Funds are distributed by Wells Fargo Funds Distributor, LLC, Member FINRA/SIPC, an affiliate of Wells Fargo & Company.
NOT FDIC INSURED ¡ NO BANK GUARANTEE ¡ MAY LOSE VALUE
© 2013 Wells Fargo Funds Management, LLC. All rights reserved.
| | |
 | | 215102 03-13 SA203/SAR203 1-13 |

Wells Fargo Advantage Endeavor Select FundSM

Semi-Annual Report
January 31, 2013

Reduce clutter. Save trees.
Sign up for electronic delivery of prospectuses and shareholder reports at wellsfargo.com/advantagedelivery
Contents
The views expressed and any forward-looking statements are as of January 31, 2013, unless otherwise noted, and are those of the Fund managers and/or Wells Fargo Funds Management, LLC. Discussions of individual securities, or the markets generally, or any Wells Fargo Advantage Fund are not intended as individual recommendations. Future events or results may vary significantly from those expressed in any forward-looking statements; the views expressed are subject to change at any time in response to changing circumstances in the market. Wells Fargo Funds Management, LLC, disclaims any obligation to publicly update or revise any views expressed or forward-looking statements.
NOT FDIC INSURED ¡ NO BANK GUARANTEE ¡ MAY LOSE VALUE

Wells Fargo investment history
| | |
| 1932 | | Keystone creates one of the first mutual fund families. |
| 1971 | | Wells Fargo & Company introduces one of the first institutional index funds. |
| 1978 | | Wells Fargo applies Markowitz and Sharpe’s research on Modern Portfolio Theory to introduce one of the industry’s first tactical asset allocation models in institutional separately managed accounts. |
| 1984 | | Wells Fargo Stagecoach Funds launches its first asset allocation fund. |
| 1989 | | The Tactical Asset Allocation (TAA) Model is first applied to Wells Fargo’s asset allocation mutual funds. |
| 1994 | | Wells Fargo introduces the LifePath Funds, one of the first suites of target date funds (now the Wells Fargo Advantage Dow Jones Target Date FundsSM). |
| 1996 | | Evergreen Investments and Keystone Funds merge. |
| 1997 | | Wells Fargo launches the Wells Fargo Advantage WealthBuilder PortfoliosSM, a fund-of-funds suite of products that includes the use of quantitative models to shift assets among investment styles. |
| 1999 | | Norwest Advantage Funds and Stagecoach Funds are reorganized into Wells Fargo Funds after the merger of Norwest and Wells Fargo. |
| 2002 | | Evergreen Retail and Evergreen Institutional companies form the umbrella asset management company, Evergreen Investments. |
| 2005 | | The integration of Strong Funds with Wells Fargo Funds creates Wells Fargo Advantage Funds, resulting in one of the top 20 mutual fund companies in the United States. |
| 2006 | | Wells Fargo Advantage Funds relaunches the target date product line as Wells Fargo Advantage Dow Jones Target Date Funds. |
| 2010 | | The mergers and reorganizations of Evergreen and Wells Fargo Advantage mutual funds are completed, unifying the families under the brand of Wells Fargo Advantage Funds. |
Wells Fargo Advantage Funds®
Wells Fargo Advantage Funds skillfully guides institutions, financial advisors, and individuals through the investment terrain to help them reach their financial objectives. Everything we do on behalf of investors is backed by our unique combination of qualifications.
Strength
Our organization is built on the standards of integrity and service established by our parent company—Wells Fargo & Company—more than 150 years ago. And, because we’re part of a highly diversified financial enterprise, we offer the depth of resources to help investors succeed.
Expertise
Our multi-boutique model offers investors access to the independent thinking of premier investment managers that have been chosen for their time-tested strategies. While each team specializes in a specific investment strategy, collectively they provide investors a wide choice of distinct investment styles. Our dedication to investment excellence doesn’t end with our expertise in manager selection—risk management, analysis, and rigorous ongoing review seek to ensure each manager’s investment process remains consistent.
Partnership
Our collaborative approach is built around understanding the needs and goals of our clients. By adhering to core principles of sound judgment and steady guidance, we support you through every stage of the investment decision process.
Carefully consider the investment objectives, risks, charges, and expenses before investing. For a current prospectus and, if available, a summary prospectus, for Wells Fargo Advantage Funds, containing this and other information, visit wellsfargoadvantagefunds.com. Read it carefully before investing.
Wells Fargo Funds Management, LLC, a wholly owned subsidiary of Wells Fargo & Company, provides investment advisory and administrative services for Wells Fargo Advantage Funds. Other affiliates of Wells Fargo & Company provide subadvisory and other services for the Funds. The Funds are distributed by Wells Fargo Funds Distributor, LLC, Member FINRA/SIPC, an affiliate of Wells Fargo & Company.
“Dow Jones®” and “Dow Jones Target Date IndexesSM” are service marks of Dow Jones Trademark Holdings LLC (“Dow Jones”); have been licensed to CME Group Index Services LLC (“CME Indexes”); and have been sublicensed for use for certain purposes by Global Index Advisors, Inc., and Wells Fargo Funds Management, LLC. The Wells Fargo Advantage Dow Jones Target Date FundsSM, based on the Dow Jones Target Date Indexes, are not sponsored, endorsed, sold, or promoted by Dow Jones, CME Indexes, or their respective affiliates, and none of them makes any representation regarding the advisability of investing in such product(s).
NOT FDIC INSURED ¡ NO BANK GUARANTEE ¡ MAY LOSE VALUE
Not part of the semi-annual report.
Wells Fargo Advantage Funds offers more than 110 mutual funds across a wide range of asset classes, representing over $226 billion in assets under management, as of January 31, 2013.
| | | | |
| Equity funds | | | | |
Asia Pacific Fund | | Enterprise Fund† | | Opportunity Fund† |
C&B Large Cap Value Fund | | Global Opportunities Fund | | Precious Metals Fund |
C&B Mid Cap Value Fund | | Growth Fund | | Premier Large Company Growth Fund |
Capital Growth Fund | | Index Fund | | Small Cap Opportunities Fund |
Common Stock Fund | | International Equity Fund | | Small Cap Value Fund |
Disciplined U.S. Core Fund | | International Value Fund | | Small Company Growth Fund |
Discovery Fund† | | Intrinsic Small Cap Value Fund | | Small Company Value Fund |
Diversified Equity Fund | | Intrinsic Value Fund | | Small/Mid Cap Value Fund |
Diversified International Fund | | Intrinsic World Equity Fund | | Special Mid Cap Value Fund |
Emerging Growth Fund | | Large Cap Core Fund | | Special Small Cap Value Fund |
Emerging Markets Equity Fund | | Large Cap Growth Fund | | Specialized Technology Fund |
Emerging Markets Equity Income Fund | | Large Company Value Fund | | Traditional Small Cap Growth Fund |
Endeavor Select Fund† | | Omega Growth Fund | | Utility and Telecommunications Fund |
| Bond funds | | | | |
Adjustable Rate Government Fund | | High Yield Municipal Bond Fund | | Short Duration Government Bond Fund |
California Limited-Term Tax-Free Fund | | Income Plus Fund | | Short-Term Bond Fund |
California Tax-Free Fund | | Inflation-Protected Bond Fund | | Short-Term High Yield Bond Fund |
Colorado Tax-Free Fund | | Intermediate Tax/AMT-Free Fund | | Short-Term Municipal Bond Fund |
Core Bond Fund | | International Bond Fund | | Strategic Income Fund |
Emerging Markets Local Bond Fund | | Minnesota Tax-Free Fund | | Strategic Municipal Bond Fund |
Government Securities Fund | | Municipal Bond Fund | | Ultra Short-Term Income Fund |
High Income Fund | | North Carolina Tax-Free Fund | | Ultra Short-Term Municipal Income Fund |
High Yield Bond Fund | | Pennsylvania Tax-Free Fund | | Wisconsin Tax-Free Fund |
| Asset allocation funds | | | | |
Absolute Return Fund | | WealthBuilder Equity Portfolio† | | Target 2020 Fund† |
Asset Allocation Fund | | WealthBuilder Growth Allocation Portfolio† | | Target 2025 Fund† |
Conservative Allocation Fund | | WealthBuilder Growth Balanced Portfolio† | | Target 2030 Fund† |
Diversified Capital Builder Fund | | WealthBuilder Moderate Balanced Portfolio† | | Target 2035 Fund† |
Diversified Income Builder Fund | | WealthBuilder Tactical Equity Portfolio† | | Target 2040 Fund† |
Growth Balanced Fund | | Target Today Fund† | | Target 2045 Fund† |
Index Asset Allocation Fund | | Target 2010 Fund† | | Target 2050 Fund† |
Moderate Balanced Fund | | Target 2015 Fund† | | Target 2055 Fund† |
WealthBuilder Conservative Allocation Portfolio† | | | | |
| Money market funds | | | | |
100% Treasury Money Market Fund | | Heritage Money Market Fund† | | National Tax-Free Money Market Fund |
California Municipal Money Market Fund | | Money Market Fund | | Treasury Plus Money Market Fund |
Cash Investment Money Market Fund | | Municipal Cash Management Money Market Fund | | |
Government Money Market Fund | | Municipal Money Market Fund | | |
| Variable trust funds1 | | | | |
VT Discovery Fund† | | VT Intrinsic Value Fund | | VT Small Cap Growth Fund |
VT Index Asset Allocation Fund | | VT Omega Growth Fund | | VT Small Cap Value Fund |
VT International Equity Fund | | VT Opportunity Fund† | | VT Total Return Bond Fund |
An investment in a money market fund is not insured or guaranteed by the Federal Deposit Insurance Corporation or any other government agency. Although the Wells Fargo Advantage Money Market Funds seek to preserve the value of your investment at $1.00 per share, it is possible to lose money by investing in a money market fund.
| 1. | The variable trust funds are generally available only through insurance company variable contracts. |
| † | In this report, the Wells Fargo Advantage Discovery FundSM, Wells Fargo Advantage Endeavor Select FundSM, Wells Fargo Advantage Enterprise FundSM, Wells Fargo Advantage Opportunity FundSM, Wells Fargo Advantage WealthBuilder Conservative Allocation PortfolioSM, Wells Fargo Advantage WealthBuilder Equity PortfolioSM, Wells Fargo Advantage WealthBuilder Growth Allocation PortfolioSM, Wells Fargo Advantage WealthBuilder Growth Balanced PortfolioSM, Wells Fargo Advantage WealthBuilder Moderate Balanced PortfolioSM, Wells Fargo Advantage WealthBuilder Tactical Equity PortfolioSM, Wells Fargo Advantage Dow Jones Target Today FundSM, Wells Fargo Advantage Dow Jones Target 2010 FundSM, Wells Fargo Advantage Dow Jones Target 2015 FundSM, Wells Fargo Advantage Dow Jones Target 2020 FundSM, Wells Fargo Advantage Dow Jones Target 2025 FundSM, Wells Fargo Advantage Dow Jones Target 2030 FundSM, Wells Fargo Advantage Dow Jones Target 2035 FundSM, Wells Fargo Advantage Dow Jones Target 2040 FundSM, Wells Fargo Advantage Dow Jones Target 2045 FundSM, Wells Fargo Advantage Dow Jones Target 2050 FundSM, Wells Fargo Advantage Dow Jones Target 2055 FundSM, Wells Fargo Advantage Heritage Money Market FundSM, Wells Fargo Advantage VT Discovery FundSM, and Wells Fargo Advantage VT Opportunity FundSM are referred to as the Discovery Fund, Endeavor Select Fund, Enterprise Fund, Opportunity Fund, WealthBuilder Conservative Allocation Portfolio, WealthBuilder Equity Portfolio, WealthBuilder Growth Allocation Portfolio, WealthBuilder Growth Balanced Portfolio, WealthBuilder Moderate Balanced Portfolio, WealthBuilder Tactical Equity Portfolio, Target Today Fund, Target 2010 Fund, Target 2015 Fund, Target 2020 Fund, Target 2025 Fund, Target 2030 Fund, Target 2035 Fund, Target 2040 Fund, Target 2045 Fund, Target 2050 Fund, Target 2055 Fund, Heritage Money Market Fund, VT Discovery Fund, and VT Opportunity Fund, respectively. |
Not part of the semi-annual report.
| | | | |
| 2 | | Wells Fargo Advantage Endeavor Select Fund | | Letter to shareholders (unaudited) |

Karla M. Rabusch
President
Wells Fargo Advantage Funds
Entering the period, concerns about the eurozone sovereign debt situation held center stage as investors again focused on economic weakness in southern European economies.
Aggressive central bank actions helped support stock prices, as did relatively solid economic data.
Dear Valued Shareholder:
We are pleased to offer you this semi-annual report for the Wells Fargo Advantage Endeavor Select Fund for the six-month period that ended January 31, 2013. Much of the period was marked by continued concerns about the possible effects that the ongoing European sovereign debt crisis would have on the global economy. However, relatively solid economic data in the U.S. and efforts by European authorities to address the sovereign debt issue alleviated investor fears and supported global stock markets. Judging by various indexes, U.S. large-cap stocks underperformed small-cap stocks. Within the large-cap universe, value stocks outperformed growth stocks, partly because of strong performance from the financials sector.
The period was dominated by worries that ongoing debt problems in the eurozone would affect global economic growth.
Entering the period, concerns about the eurozone sovereign debt situation held center stage as investors again focused on economic weakness in southern European economies. Because many eurozone banks owned southern European debt and many U.S. banks had financial ties to eurozone banks, investors worried about the effects of a possible southern European debt default on the global financial system and economy. Ongoing weakness in the Greek economy made it difficult for the country to meet previously agreed upon austerity targets. Toward the end of the reporting period, political risk resurfaced in both Italy and Spain. In Italy, Prime Minister Mario Monti, an economist who was appointed to implement austerity measures and labor market reforms, resigned in December 2012. Monti later decided to run for office in the general election scheduled for February 2013.
European leaders took concerted action to calm investor concerns. In September 2012, the European Central Bank (ECB) announced that it would purchase an unlimited amount of one- to three-year sovereign debt from countries that had applied for a formal bailout through either the European Financial Stability Facility or the European Stability Mechanism. In another positive sign, in late November 2012, finance ministers from the 17-country eurozone and the International Monetary Fund struck a deal aimed at reducing Greece’s debt by the year 2020.
Central banks continued to provide stimulus.
Major central banks, including the U.S. Federal Reserve (Fed) and the ECB, continued to inject liquidity into the banks and the markets through various quantitative easing policies. Throughout the reporting period, the Federal Open Market Committee (FOMC) kept its key interest rates effectively at zero in order to support the economy and the financial system. The ECB was similarly aggressive, keeping its key rate at a historic low of 0.75%. Just prior to the beginning of the reporting period, the FOMC announced its intention to keep interest rates low until at least mid-2015 in order to support the sluggish economy. The Fed also announced open-ended purchases of $40 billion per month in mortgage-backed securities in an effort to support the housing market.
Stock markets posted solid gains in an eventful period.
Aggressive central bank actions helped support stock prices, as did relatively solid economic data. For much of the reporting period, the U.S. stock market benefited from favorable gross domestic product (GDP) data, with the growth rate improving from 1.3% (annualized) in the second quarter of 2012 to 3.1% (annualized) in the third quarter of 2012. However, the GDP growth rate slowed in the final months of 2012, with GDP growth coming in at 0.1% (annualized) in the fourth quarter of 2012. Because many investors attributed the weak number to the aftereffects of Hurricane Sandy on the eastern seaboard, the stock market remained resilient.
| | | | | | |
| Letter to shareholders (unaudited) | | Wells Fargo Advantage Endeavor Select Fund | | | 3 | |
The steady improvement in the housing market supported investor sentiment. The National Association of Home Builders/First American Improving Markets Index identifies metro areas that have shown improvement from their respective troughs in housing permits, employment, and house prices for at least six consecutive months. The index rose for a fifth-consecutive month in January 2013, indicating improvements in 242 housing markets across the country. As a result, housing-related stocks strongly outperformed over the period, leading to better-than-index returns for sectors ranging from consumer discretionary (home improvement retailers), to materials (construction material providers), and to financials (mortgage lenders).
Throughout the period, a continued high unemployment rate was the main negative piece of U.S. economic data. Although the unemployment rate improved from 8.1% in August 2012 to 7.9% in January 2013, the labor market remained soft.
We remain committed to our investment strategies, even as many variables are at work in the market.
The full effect of the European credit crisis remains unknown. Elevated unemployment and debt defaults continue to pressure consumers and businesses alike. As a whole, Wells Fargo Advantage Funds represents investments across a range of asset classes and investment styles, giving you an opportunity to create a diversified investment portfolio. While diversification may not prevent losses in a downturn, we believe it helps manage risk.
Thank you for choosing to invest with Wells Fargo Advantage Funds. We appreciate your confidence in us and remain committed to helping you meet your financial needs. For current information about your fund investments, contact your investment professional, visit our website at wellsfargoadvantagefunds.com, or call us directly at 1-800-222-8222. We are available 24 hours a day, 7 days a week.
Sincerely,

Karla M. Rabusch
President
Wells Fargo Advantage Funds
Notice to shareholders
At its November 6-7, 2012 meeting, the Board of Trustees unanimously approved the following modifications to certain Class A sales load waiver privileges, with each change becoming effective on July 1, 2013:
| | n | | Annuity payments received under an annuity option or from death proceeds will no longer qualify for net asset value (NAV) repurchase privileges. | |
| | n | | The ability to reinvest redemption proceeds at NAV will be reduced from 120 days to 90 days. | |
| | n | | NAV purchase privileges for certain types of “grandfathered” shareholders will be modified to remove the ability to purchase Class A shares at NAV, unless those shares are held directly with the Fund. | |
Please contact your investment professional or call us directly at 1-800-222-8222 if you have any questions on this Notice to Shareholders.
| | | | |
| 4 | | Wells Fargo Advantage Endeavor Select Fund | | Performance highlights (unaudited) |
Investment objective
The Fund seeks long-term capital appreciation.
Adviser
Wells Fargo Funds Management, LLC
Subadviser
Wells Capital Management Incorporated
Portfolio managers
Thomas J. Pence, CFA
Michael T. Smith, CFA
Average annual total returns1 (%) as of January 31, 2013
| | | | | | | | | | | | | | | | | | | | | | | | | | | | | | | | | | | | |
| | | | | Including sales charge | | | Excluding sales charge | | | | | Expense ratios2 (%) | |
| | | Inception date | | 1 year | | | 5 year | | | 10 year | | | 1 year | | | 5 year | | | 10 year | | | | | Gross | | | Net3 | |
| Class A (STAEX) | | 12-29-2000 | | | 7.74 | | | | 1.23 | | | | 7.59 | | | | 14.29 | | | | 2.44 | | | | 8.23 | | | | | | 1.23 | | | | 1.23 | |
| Class B (WECBX)* | | 12-29-2000 | | | 8.30 | | | | 1.25 | | | | 7.63 | | | | 13.30 | | | | 1.63 | | | | 7.63 | | | | | | 1.98 | | | | 1.98 | |
| Class C (WECCX) | | 12-29-2000 | | | 12.30 | | | | 1.65 | | | | 7.38 | | | | 13.30 | | | | 1.65 | | | | 7.38 | | | | | | 1.98 | | | | 1.98 | |
| Administrator Class (WECDX) | | 4-8-2005 | | | – | | | | – | | | | – | | | | 14.44 | | | | 2.71 | | | | 8.44 | | | | | | 1.07 | | | | 1.00 | |
| Institutional Class (WFCIX) | | 4-8-2005 | | | – | | | | – | | | | – | | | | 14.69 | | | | 2.89 | | | | 8.60 | | | | | | 0.80 | | | | 0.80 | |
| Russell 1000® Growth Index4 | | – | | | – | | | | – | | | | – | | | | 13.43 | | | | 5.70 | | | | 8.24 | | | | | | – | | | | – | |
| * | | Class B shares are closed to investment, except in connection with the reinvestment of any distributions and permitted exchanges. |
Figures quoted represent past performance, which is no guarantee of future results and do not reflect the deduction of taxes that a shareholder may pay on fund distributions or the redemption of fund shares. Investment return and principal value of an investment will fluctuate so that an investor’s shares, when redeemed, may be worth more or less than their original cost. Performance shown without sales charges would be lower if sales charges were reflected. Current performance may be lower or higher than the performance data quoted and assumes the reinvestment of dividends and capital gains. Current month-end performance is available on the Fund’s website, wellsfargoadvantagefunds.com.
Index returns do not include transaction costs associated with buying and selling securities, any mutual fund fees or expenses, or any taxes. It is not possible to invest directly in an index.
For Class A shares, the maximum front-end sales charge is 5.75%. For Class B shares, the maximum contingent deferred sales charge is 5.00%. For Class C shares, the maximum contingent deferred sales charge is 1.00%. Performance including sales charge assumes the sales charge for the corresponding time period. Administrator Class and Institutional Class shares are sold without a front-end sales charge or contingent deferred sales charge.
Stock values fluctuate in response to the activities of individual companies and general market and economic conditions. Certain investment strategies tend to increase the total risk of an investment (relative to the broader market). This Fund is exposed to foreign investment risk and non-diversification risk. Consult the Fund’s prospectus for additional information on these and other risks.
Please see footnotes on page 5.
| | | | | | |
| Performance highlights (unaudited) | | Wells Fargo Advantage Endeavor Select Fund | | | 5 | |
| | | | |
| Ten largest equity holdings5 (%) as of January 31, 2013 | |
Apple Incorporated | | | 6.32 | |
Google Incorporated Class A | | | 4.08 | |
eBay Incorporated | | | 3.82 | |
Visa Incorporated Class A | | | 3.55 | |
Monsanto Company | | | 3.22 | |
Union Pacific Corporation | | | 3.08 | |
Gilead Sciences Incorporated | | | 2.92 | |
Crown Castle International Corporation | | | 2.78 | |
Danaher Corporation | | | 2.76 | |
TJX Companies Incorporated | | | 2.76 | |
| | |
| Sector distribution6 as of January 31, 2013 |
|
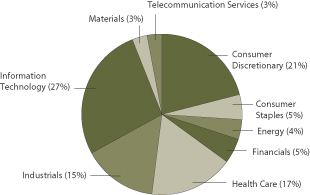
|
| 1. | Historical performance shown for the Administrator Class and Institutional Class shares prior to their inception reflects the performance of Class A shares, and includes the higher expenses applicable to Class A shares. If these expenses had not been included, returns would be higher. |
| 2. | Reflects the expense ratios as stated in the most recent prospectuses. |
| 3. | The Adviser has committed through November 30, 2013, to waive fees and/or reimburse expenses to the extent necessary to cap the Fund’s Total Annual Fund Operating Expenses After Fee Waiver, excluding certain expenses, at 1.25% for Class A, 2.00% for Class B, 2.00% for Class C, 1.00% for Administrator Class, and 0.80% for Institutional Class. Brokerage commissions, stamp duty fees, interest, taxes, acquired fund fees and expenses, and extraordinary expenses are excluded from the cap. Without this cap, the Fund’s returns would have been lower. |
| 4. | The Russell 1000® Growth Index measures the performance of those Russell 1000 Index companies with higher price-to-book ratios and higher forecasted growth values. You cannot invest directly in an index. |
| 5. | The ten largest equity holdings are calculated based on the value of the securities divided by total net assets of the Fund. Holdings are subject to change and may have changed since the date specified. |
| 6. | Sector distribution is subject to change and is calculated based on the total long-term investments of the Fund. |
| | | | |
| 6 | | Wells Fargo Advantage Endeavor Select Fund | | Fund expenses (unaudited) |
As a shareholder of the Fund, you incur two types of costs: (1) transaction costs, including sales charges (loads) on purchase payments and contingent deferred sales charges (if any) on redemptions and (2) ongoing costs, including management fees, distribution (12b-1) and/or shareholder service fees, and other Fund expenses. This example is intended to help you understand your ongoing costs (in dollars) of investing in the Fund and to compare these costs with the ongoing costs of investing in other mutual funds.
The example is based on an investment of $1,000 invested at the beginning of the six-month period and held for the entire period from August 1, 2012 to January 31, 2013.
Actual expenses
The “Actual” line of the table below provides information about actual account values and actual expenses. You may use the information in this line, together with the amount you invested, to estimate the expenses that you paid over the period. Simply divide your account value by $1,000 (for example, an $8,600 account value divided by $1,000 = 8.6), then multiply the result by the number in the “Actual” line under the heading entitled “Expenses paid during period” for your applicable class of shares to estimate the expenses you paid on your account during this period.
Hypothetical example for comparison purposes
The “Hypothetical” line of the table below provides information about hypothetical account values and hypothetical expenses based on the Fund’s actual expense ratio and an assumed rate of return of 5% per year before expenses, which is not the Fund’s actual return. The hypothetical account values and expenses may not be used to estimate the actual ending account balance or expenses you paid for the period. You may use this information to compare the ongoing costs of investing in the Fund and other funds. To do so, compare this 5% hypothetical example with the 5% hypothetical examples that appear in the shareholder reports of the other funds.
Please note that the expenses shown in the table are meant to highlight your ongoing costs only and do not reflect any transactional costs, such as sales charges (loads) and contingent deferred sales charges. Therefore, the “Hypothetical” line of the table is useful in comparing ongoing costs only and will not help you determine the relative total costs of owning different funds. In addition, if these transactional costs were included, your costs would have been higher.
| | | | | | | | | | | | | | | | |
| | | Beginning
account value
8-1-2012 | | | Ending
account value
1-31-2013 | | | Expenses
paid during
the period1 | | | Net annual
expense ratio | |
Class A | | | | | | | | | | | | | | | | |
Actual | | $ | 1,000.00 | | | $ | 1,079.43 | | | $ | 6.55 | | | | 1.25 | % |
Hypothetical (5% return before expenses) | | $ | 1,000.00 | | | $ | 1,018.90 | | | $ | 6.36 | | | | 1.25 | % |
Class B | | | | | | | | | | | | | | | | |
Actual | | $ | 1,000.00 | | | $ | 1,074.66 | | | $ | 10.46 | | | | 2.00 | % |
Hypothetical (5% return before expenses) | | $ | 1,000.00 | | | $ | 1,015.12 | | | $ | 10.16 | | | | 2.00 | % |
Class C | | | | | | | | | | | | | | | | |
Actual | | $ | 1,000.00 | | | $ | 1,074.66 | | | $ | 10.46 | | | | 2.00 | % |
Hypothetical (5% return before expenses) | | $ | 1,000.00 | | | $ | 1,015.12 | | | $ | 10.16 | | | | 2.00 | % |
Administrator Class | | | | | | | | | | | | | | | | |
Actual | | $ | 1,000.00 | | | $ | 1,080.90 | | | $ | 5.25 | | | | 1.00 | % |
Hypothetical (5% return before expenses) | | $ | 1,000.00 | | | $ | 1,020.16 | | | $ | 5.09 | | | | 1.00 | % |
Institutional Class | | | | | | | | | | | | | | | | |
Actual | | $ | 1,000.00 | | | $ | 1,081.86 | | | $ | 4.20 | | | | 0.80 | % |
Hypothetical (5% return before expenses) | | $ | 1,000.00 | | | $ | 1,021.17 | | | $ | 4.08 | | | | 0.80 | % |
| 1. | Expenses paid is equal to the annualized expense ratio of each class multiplied by the average account value over the period, multiplied by the number of days in the most recent fiscal half-year divided by the number of days in the fiscal year (to reflect the one-half-year period). |
| | | | | | |
| Portfolio of investments—January 31, 2013 (unaudited) | | Wells Fargo Advantage Endeavor Select Fund | | | 7 | |
| | | | | | | | | | | | |
| Security name | | | | | | Shares | | | Value | |
| | | | |
Common Stocks: 97.30% | | | | | | | | | | | | |
| | | | |
Consumer Discretionary: 20.45% | | | | | | | | | | | | |
| | | | |
| Hotels, Restaurants & Leisure: 2.38% | | | | | | | | | | | | |
Starbucks Corporation | | | | | | | 255,947 | | | $ | 14,363,746 | |
| | | | | | | | | | | | |
| | | | |
| Internet & Catalog Retail: 4.04% | | | | | | | | | | | | |
Amazon.com Incorporated † | | | | | | | 45,000 | | | | 11,947,500 | |
priceline.com Incorporated † | | | | | | | 18,200 | | | | 12,475,554 | |
| | | | |
| | | | | | | | | | | 24,423,054 | |
| | | | | | | | | | | | |
| | | | |
| Media: 2.06% | | | | | | | | | | | | |
CBS Corporation Class B | | | | | | | 298,600 | | | | 12,457,592 | |
| | | | | | | | | | | | |
| | | | |
| Multiline Retail: 2.70% | | | | | | | | | | | | |
Dollar General Corporation † | | | | | | | 353,484 | | | | 16,338,030 | |
| | | | | | | | | | | | |
| | | | |
| Specialty Retail: 7.77% | | | | | | | | | | | | |
Home Depot Incorporated | | | | | | | 231,500 | | | | 15,491,980 | |
Limited Brands Incorporated « | | | | | | | 308,900 | | | | 14,833,378 | |
TJX Companies Incorporated | | | | | | | 368,700 | | | | 16,657,866 | |
| | | | |
| | | | | | | | | | | 46,983,224 | |
| | | | | | | | | | | | |
| | | | |
| Textiles, Apparel & Luxury Goods: 1.50% | | | | | | | | | | | | |
lululemon athletica incorporated Ǡ | | | | | | | 130,940 | | | | 9,034,860 | |
| | | | | | | | | | | | |
| | | | |
Consumer Staples: 4.99% | | | | | | | | | | | | |
| | | | |
| Beverages: 2.34% | | | | | | | | | | | | |
Anheuser-Busch Companies Incorporated ADR « | | | | | | | 160,000 | | | | 14,176,000 | |
| | | | | | | | | | | | |
| | | | |
| Food & Staples Retailing: 2.65% | | | | | | | | | | | | |
Whole Foods Market Incorporated | | | | | | | 166,300 | | | | 16,006,375 | |
| | | | | | | | | | | | |
| | | | |
Energy: 4.16% | | | | | | | | | | | | |
| | | | |
| Oil, Gas & Consumable Fuels: 4.16% | | | | | | | | | | | | |
Pioneer Natural Resources Company « | | | | | | | 119,700 | | | | 14,069,538 | |
The Williams Companies Incorporated | | | | | | | 315,900 | | | | 11,072,295 | |
| | | | |
| | | | | | | | | | | 25,141,833 | |
| | | | | | | | | | | | |
| | | | |
Financials: 4.33% | | | | | | | | | | | | |
| | | | |
| Capital Markets: 2.34% | | | | | | | | | | | | |
Ameriprise Financial Incorporated | | | | | | | 213,400 | | | | 14,152,688 | |
| | | | | | | | | | | | |
| | | | |
| Diversified Financial Services: 1.99% | | | | | | | | | | | | |
Intercontinental Exchange Incorporated † | | | | | | | 86,400 | | | | 11,988,000 | |
| | | | | | | | | | | | |
| | | | |
Health Care: 16.34% | | | | | | | | | | | | |
| | | | |
| Biotechnology: 4.58% | | | | | | | | | | | | |
Alexion Pharmaceuticals Incorporated † | | | | | | | 106,054 | | | | 9,968,015 | |
Gilead Sciences Incorporated Ǡ | | | | | | | 448,000 | | | | 17,673,600 | |
| | | | |
| | | | | | | | | | | 27,641,615 | |
| | | | | | | | | | | | |
The accompanying notes are an integral part of these financial statements.
| | | | |
| 8 | | Wells Fargo Advantage Endeavor Select Fund | | Portfolio of investments—January 31, 2013 (unaudited) |
| | | | | | | | | | | | |
| Security name | | | | | | Shares | | | Value | |
| | | | |
| Health Care Equipment & Supplies: 1.84% | | | | | | | | | | | | |
Intuitive Surgical Incorporated Ǡ | | | | | | | 19,400 | | | $ | 11,142,972 | |
| | | | | | | | | | | | |
| | | | |
| Health Care Providers & Services: 3.32% | | | | | | | | | | | | |
HCA Holdings Incorporated | | | | | | | 234,600 | | | | 8,832,690 | |
UnitedHealth Group Incorporated | | | | | | | 202,800 | | | | 11,196,588 | |
| | | | |
| | | | | | | | | | | 20,029,278 | |
| | | | | | | | | | | | |
| | | | |
| Life Sciences Tools & Services: 1.87% | | | | | | | | | | | | |
Agilent Technologies Incorporated | | | | | | | 252,400 | | | | 11,302,472 | |
| | | | | | | | | | | | |
| | | | |
| Pharmaceuticals: 4.73% | | | | | | | | | | | | |
Allergan Incorporated « | | | | | | | 137,900 | | | | 14,480,879 | |
Sanofi ADR | | | | | | | 290,184 | | | | 14,126,157 | |
| | | | |
| | | | | | | | | | | 28,607,036 | |
| | | | | | | | | | | | |
| | | | |
Industrials: 14.44% | | | | | | | | | | | | |
| | | | |
| Aerospace & Defense: 2.28% | | | | | | | | | | | | |
Precision Castparts Corporation | | | | | | | 75,242 | | | | 13,799,383 | |
| | | | | | | | | | | | |
| | | | |
| Electrical Equipment: 1.75% | | | | | | | | | | | | |
Eaton Corporation plc | | | | | | | 186,000 | | | | 10,592,700 | |
| | | | | | | | | | | | |
| | | | |
| Industrial Conglomerates: 2.76% | | | | | | | | | | | | |
Danaher Corporation « | | | | | | | 277,800 | | | | 16,648,554 | |
| | | | | | | | | | | | |
| | | | |
| Machinery: 2.26% | | | | | | | | | | | | |
Cummins Incorporated « | | | | | | | 118,994 | | | | 13,664,081 | |
| | | | | | | | | | | | |
| | | | |
| Road & Rail: 5.39% | | | | | | | | | | | | |
Hertz Global Holdings Incorporated † | | | | | | | 760,700 | | | | 13,905,596 | |
Union Pacific Corporation | | | | | | | 141,714 | | | | 18,629,722 | |
| | | | |
| | | | | | | | | | | 32,535,318 | |
| | | | | | | | | | | | |
| | | | |
Information Technology: 26.60% | | | | | | | | | | | | |
| | | | |
| Communications Equipment: 2.17% | | | | | | | | | | | | |
QUALCOMM Incorporated | | | | | | | 198,800 | | | | 13,126,764 | |
| | | | | | | | | | | | |
| | | | |
| Computers & Peripherals: 6.32% | | | | | | | | | | | | |
Apple Incorporated | | | | | | | 83,849 | | | | 38,177,288 | |
| | | | | | | | | | | | |
| | | | |
| Internet Software & Services: 9.58% | | | | | | | | | | | | |
eBay Incorporated † | | | | | | | 412,200 | | | | 23,054,346 | |
Google Incorporated Class A † | | | | | | | 32,600 | | | | 24,635,494 | |
LinkedIn Corporation Class A † | | | | | | | 82,400 | | | | 10,200,296 | |
| | | | |
| | | | | | | | | | | 57,890,136 | |
| | | | | | | | | | | | |
| | | | |
| IT Services: 4.66% | | | | | | | | | | | | |
Accenture plc | | | | | | | 93,269 | | | | 6,705,108 | |
Visa Incorporated Class A « | | | | | | | 135,800 | | | | 21,444,178 | |
| | | | |
| | | | | | | | | | | 28,149,286 | |
| | | | | | | | | | | | |
The accompanying notes are an integral part of these financial statements.
| | | | | | |
| Portfolio of investments—January 31, 2013 (unaudited) | | Wells Fargo Advantage Endeavor Select Fund | | | 9 | |
| | | | | | | | | | | | | | |
| Security name | | | | | | | Shares | | | Value | |
| | | | |
| Software: 3.87% | | | | | | | | | | | | | | |
Salesforce.com Incorporated Ǡ | | | | | | | | | 69,300 | | | $ | 11,928,609 | |
VMware Incorporated Ǡ | | | | | | | | | 150,300 | | | | 11,494,944 | |
| | | | |
| | | | | | | | | | | | | 23,423,553 | |
| | | | | | | | | | | | | | |
| | | | |
Materials: 3.22% | | | | | | | | | | | | | | |
| | | | |
| Chemicals: 3.22% | | | | | | | | | | | | | | |
Monsanto Company | | | | | | | | | 191,900 | | | | 19,449,065 | |
| | | | | | | | | | | | | | |
| | | | |
Telecommunication Services: 2.77% | | | | | | | | | | | | | | |
| | | | |
| Wireless Telecommunication Services: 2.77% | | | | | | | | | | | | | | |
Crown Castle International Corporation † | | | | | | | | | 237,800 | | | | 16,769,657 | |
| | | | | | | | | | | | | | |
| | | | |
Total Common Stocks (Cost $440,536,795) | | | | | | | | | | | | | 588,014,560 | |
| | | | | | | | | | | | | | |
| | | | |
| | | | | | | | Principal | | | | |
| | | | |
Other: 0.29% | | | | | | | | | | | | | | |
Gryphon Funding Limited, Pass-Through Entity (i)(a)(v) | | | | | | | | $ | 5,164,628 | | | | 1,755,974 | |
| | | | | | | | | | | | | | |
| | | | |
Total Other (Cost $420,882) | | | | | | | | | | | | | 1,755,974 | |
| | | | | | | | | | | | | | |
| | | | |
| | | | | Yield | | | Shares | | | | |
| | | | |
Short-Term Investments: 15.94% | | | | | | | | | | | | | | |
| | | | |
| Investment Companies: 15.94% | | | | | | | | | | | | | | |
Wells Fargo Advantage Cash Investment Money Market Fund, Select Class (u)(l) | | | | | 0.14 | % | | | 8,993,585 | | | | 8,993,585 | |
Wells Fargo Securities Lending Cash Investments, LLC (v)(r)(u)(l) | | | | | 0.19 | | | | 87,302,568 | | | | 87,302,568 | |
| | | | |
Total Short-Term Investments (Cost $96,296,153) | | | | | | | | | | | | | 96,296,153 | |
| | | | | | | | | | | | | | |
| | | | | | | | |
| Total investments in securities | | | | | | | | |
| (Cost $537,253,830) * | | | 113.53 | % | | | 686,066,687 | |
Other assets and liabilities, net | | | (13.53 | ) | | | (81,765,606 | ) |
| | | | | | | | |
| Total net assets | | | 100.00 | % | | $ | 604,301,081 | |
| | | | | | | | |
| † | Non-income-earning security |
| « | All or a portion of this security is on loan. |
| (a) | Security is fair valued by the Management Valuation Team, and in certain instances by the Board of Trustees, in accordance with procedures approved by the Board of Trustees. |
| (v) | Security represents investment of cash collateral received from securities on loan. |
| (u) | Rate shown is the 7-day annualized yield at period end. |
| (l) | Investment in an affiliate |
| (r) | The investment company is exempt from registration under Section 3(c)(7) of the Investment Company Act of 1940, as amended. |
| * | Cost for federal income tax purposes is $543,315,377 and unrealized appreciation (depreciation) consists of: |
| | | | |
Gross unrealized appreciation | | $ | 145,488,121 | |
Gross unrealized depreciation | | | (2,736,811 | ) |
| | | | |
Net unrealized appreciation | | $ | 142,751,310 | |
The accompanying notes are an integral part of these financial statements.
| | | | |
| 10 | | Wells Fargo Advantage Endeavor Select Fund | | Statement of assets and liabilities—January 31, 2013 (unaudited) |
| | | | |
| | | | |
| |
Assets | | | | |
Investments | | | | |
In unaffiliated securities (including securities on loan), at value (see cost below) | | $ | 589,770,534 | |
In affiliated securities, at value (see cost below) | | | 96,296,153 | |
| | | | |
Total investments, at value (see cost below) | | | 686,066,687 | |
Receivable for investments sold | | | 12,332,789 | |
Receivable for Fund shares sold | | | 1,354,337 | |
Receivable for dividends | | | 66,511 | |
Receivable for securities lending income | | | 9,968 | |
Prepaid expenses and other assets | | | 35,243 | |
| | | | |
Total assets | | | 699,865,535 | |
| | | | |
| |
Liabilities | | | | |
Payable for investments purchased | | | 6,742,859 | |
Payable for Fund shares redeemed | | | 581,224 | |
Payable upon receipt of securities loaned | | | 87,723,450 | |
Advisory fee payable | | | 312,884 | |
Distribution fees payable | | | 4,285 | |
Due to other related parties | | | 75,506 | |
Accrued expenses and other liabilities | | | 124,246 | |
| | | | |
Total liabilities | | | 95,564,454 | |
| | | | |
Total net assets | | $ | 604,301,081 | |
| | | | |
| |
NET ASSETS CONSIST OF | | | | |
Paid-in capital | | $ | 526,282,742 | |
Undistributed net investment income | | | 1,361,219 | |
Accumulated net realized losses on investments | | | (72,155,737 | ) |
Net unrealized gains on investments | | | 148,812,857 | |
| | | | |
Total net assets | | $ | 604,301,081 | |
| | | | |
| |
COMPUTATION OF NET ASSET VALUE AND OFFERING PRICE PER SHARE1 | | | | |
Net assets – Class A | | $ | 44,726,079 | |
Shares outstanding – Class A | | | 3,965,969 | |
Net asset value per share – Class A | | | $11.28 | |
Maximum offering price per share – Class A2 | | | $11.97 | |
Net assets – Class B | | $ | 709,034 | |
Shares outstanding – Class B | | | 69,331 | |
Net asset value per share – Class B | | | $10.23 | |
Net assets – Class C | | $ | 6,017,424 | |
Shares outstanding – Class C | | | 588,416 | |
Net asset value per share – Class C | | | $10.23 | |
Net assets – Administrator Class | | $ | 52,900,037 | |
Shares outstanding – Administrator Class | | | 4,604,109 | |
Net asset value per share – Administrator Class | | | $11.49 | |
Net assets – Institutional Class | | $ | 499,948,507 | |
Shares outstanding – Institutional Class | | | 42,978,629 | |
Net asset value per share – Institutional Class | | | $11.63 | |
| |
Investment in unaffiliated securities (including securities on loan), at cost | | $ | 440,957,677 | |
| | | | |
Investments in affiliated securities, at cost | | $ | 96,296,153 | |
| | | | |
Total investments, at cost | | $ | 537,253,830 | |
| | | | |
Securities on loan, at value | | $ | 85,830,295 | |
| | | | |
| 1. | The Fund has an unlimited number of authorized shares. |
| 2. | Maximum offering price is computed as 100/94.25 of net asset value. On investments of $50,000 or more, the offering price is reduced. |
The accompanying notes are an integral part of these financial statements.
| | | | | | |
| Statement of operations—six months ended January 31, 2013 (unaudited) | | Wells Fargo Advantage Endeavor Select Fund | | | 11 | |
| | | | |
| | | | |
| |
Investment income | | | | |
Dividends | | $ | 4,940,815 | |
Securities lending income, net | | | 54,550 | |
Income from affiliated securities | | | 14,969 | |
| | | | |
Total investment income | | | 5,010,334 | |
| | | | |
| |
Expenses | | | | |
Advisory fee | | | 2,161,555 | |
Administration fees | | | | |
Fund level | | | 167,883 | |
Class A | | | 60,289 | |
Class B | | | 1,155 | |
Class C | | | 8,136 | |
Administrator Class | | | 28,025 | |
Institutional Class | | | 224,784 | |
Shareholder servicing fees | | | | |
Class A | | | 57,970 | |
Class B | | | 1,110 | |
Class C | | | 7,823 | |
Administrator Class | | | 68,978 | |
Distribution fees | | | | |
Class B | | | 3,331 | |
Class C | | | 23,468 | |
Custody and accounting fees | | | 25,379 | |
Professional fees | | | 12,700 | |
Registration fees | | | 50,287 | |
Shareholder report expenses | | | 65,421 | |
Trustees’ fees and expenses | | | 6,020 | |
Other fees and expenses | | | 17,814 | |
| | | | |
Total expenses | | | 2,992,128 | |
Less: Fee waivers and/or expense reimbursements | | | (103,019 | ) |
| | | | |
Net expenses | | | 2,889,109 | |
| | | | |
Net investment income | | | 2,121,225 | |
| | | | |
| |
REALIZED AND UNREALIZED GAINS (LOSSES) ON INVESTMENTS | | | | |
Net realized gains on investments | | | 68,444,739 | |
Net change in unrealized gains (losses) on investments | | | (13,595,523 | ) |
| | | | |
Net realized and unrealized gains (losses) on investments | | | 54,849,216 | |
| | | | |
Net increase in net assets resulting from operations | | $ | 56,970,441 | |
| | | | |
The accompanying notes are an integral part of these financial statements.
| | | | |
| 12 | | Wells Fargo Advantage Endeavor Select Fund | | Statement of changes in net assets |
| | | | | | | | | | | | | | | | |
| | | Six months ended
January 31, 2013
(unaudited) | | | Year ended
July 31, 2012 | |
| | | | |
Operations | | | | | | | | | | | | | | | | |
Net investment income (loss) | | | | | | $ | 2,121,225 | | | | | | | $ | (1,190,478 | ) |
Net realized gains on investments | | | | | | | 68,444,739 | | | | | | | | 101,870,198 | |
Net change in unrealized gains (losses) on investments | | | | | | | (13,595,523 | ) | | | | | | | (82,933,288 | ) |
| | | | | | | | | | | | | | | | |
Net increase in net assets resulting from operations | | | | | | | 56,970,441 | | | | | | | | 17,746,432 | |
| | | | | | | | | | | | | | | | |
| | | | |
| | | Shares | | | | | | | | Shares | | | | | |
| | | | |
Capital share transactions | | | | | | | | | | | | | | | | |
Proceeds from shares sold | | | | | | | | | | | | | | | | |
Class A | | | 205,834 | | | | 2,251,370 | | | | 388,389 | | | | 3,762,167 | |
Class B | | | 0 | | | | 0 | | | | 7,261 | | | | 64,392 | |
Class C | | | 29,721 | | | | 296,104 | | | | 34,534 | | | | 315,722 | |
Administrator Class | | | 345,825 | | | | 3,829,815 | | | | 7,438,773 | | | | 73,650,990 | |
Institutional Class | | | 4,090,054 | | | | 46,056,664 | | | | 11,875,785 | | | | 119,799,281 | |
| | | | | | | | | | | | | | | | |
| | | | | | | 52,433,953 | | | | | | | | 197,592,552 | |
| | | | | | | | | | | | | | | | |
Payment for shares redeemed | | | | | | | | | | | | | | | | |
Class A | | | (760,864 | ) | | | (8,301,862 | ) | | | (5,224,849 | ) | | | (50,768,514 | ) |
Class B | | | (45,787 | ) | | | (451,421 | ) | | | (68,098 | ) | | | (603,465 | ) |
Class C | | | (93,220 | ) | | | (927,530 | ) | | | (185,451 | ) | | | (1,692,754 | ) |
Administrator Class | | | (1,153,213 | ) | | | (12,688,215 | ) | | | (24,725,319 | ) | | | (247,613,713 | ) |
Institutional Class | | | (29,523,804 | ) | | | (330,427,761 | ) | | | (25,795,402 | ) | | | (257,200,679 | ) |
| | | | | | | | | | | | | | | | |
| | | | | | | (352,796,789 | ) | | | | | | | (557,879,125 | ) |
| | | | | | | | | | | | | | | | |
Net decrease in net assets resulting from capital share transactions | | | | | | | (300,362,836 | ) | | | | | | | (360,286,573 | ) |
| | | | | | | | | | | | | | | | |
Total decrease in net assets | | | | | | | (243,392,395 | ) | | | | | | | (342,540,141 | ) |
| | | | | | | | | | | | | | | | |
| | | | |
Net assets | | | | | | | | | | | | | | | | |
Beginning of period | | | | | | | 847,693,476 | | | | | | | | 1,190,233,617 | |
| | | | | | | | | | | | | | | | |
End of period | | | | | | $ | 604,301,081 | | | | | | | $ | 847,693,476 | |
| | | | | | | | | | | | | | | | |
Undistributed net investment income (loss) | | | | | | $ | 1,361,219 | | | | | | | $ | (760,006 | ) |
| | | | | | | | | | | | | | | | |
The accompanying notes are an integral part of these financial statements.
| | | | | | |
| Financial highlights | | Wells Fargo Advantage Endeavor Select Fund | | | 13 | |
(For a share outstanding throughout each period)
| | | | | | | | | | | | | | | | | | | | | | | | |
| | | Six months ended
January 31, 2013
(unaudited) | | | Year ended July 31 | |
| CLASS A | | | 2012 | | | 2011 | | | 2010 | | | 2009 | | | 2008 | |
Net asset value, beginning of period | | | $10.45 | | | | $10.12 | | | | $8.12 | | | | $7.25 | | | | $10.81 | | | | $10.85 | |
Net investment income (loss) | | | 0.01 | 1 | | | (0.05 | )1 | | | (0.05 | )1 | | | (0.04 | )1 | | | (0.01 | )1 | | | (0.04 | )1 |
Net realized and unrealized gains (losses) on investments | | | 0.82 | | | | 0.38 | | | | 2.05 | | | | 0.91 | | | | (3.29 | ) | | | 0.10 | |
| | | | | | | | | | | | | | | | | | | | | | | | |
Total from investment operations | | | 0.83 | | | | 0.33 | | | | 2.00 | | | | 0.87 | | | | (3.30 | ) | | | 0.06 | |
Distributions to shareholders from | | | | | | | | | | | | | | | | | | | | | | | | |
Net realized gains | | | 0.00 | | | | 0.00 | | | | 0.00 | | | | 0.00 | | | | (0.26 | ) | | | (0.10 | ) |
Net asset value, end of period | | | $11.28 | | | | $10.45 | | | | $10.12 | | | | $8.12 | | | | $7.25 | | | | $10.81 | |
Total return2 | | | 7.94 | % | | | 3.26 | % | | | 24.63 | % | | | 12.00 | % | | | (30.10 | )% | | | 0.50 | % |
Ratios to average net assets (annualized) | | | | | | | | | | | | | | | | | | | | | | | | |
Gross expenses | | | 1.26 | % | | | 1.23 | % | | | 1.23 | % | | | 1.28 | % | | | 1.32 | % | | | 1.31 | % |
Net expenses | | | 1.25 | % | | | 1.23 | % | | | 1.23 | % | | | 1.25 | % | | | 1.25 | % | | | 1.25 | % |
Net investment income (loss) | | | 0.22 | % | | | (0.49 | )% | | | (0.52 | )% | | | (0.51 | )% | | | (0.08 | )% | | | (0.38 | )% |
Supplemental data | | | | | | | | | | | | | | | | | | | | | | | | |
Portfolio turnover rate | | | 42 | % | | | 94 | % | | | 100 | % | | | 139 | % | | | 173 | % | | | 154 | % |
Net assets, end of period (000s omitted) | | $ | 44,726 | | | $ | 47,233 | | | $ | 94,704 | | | $ | 125,266 | | | $ | 155,666 | | | $ | 237,689 | |
| 1. | Calculated based upon average shares outstanding |
| 2. | Total return calculations do not include any sales charges. Returns for periods of less than one year are not annualized. |
The accompanying notes are an integral part of these financial statements.
| | | | |
| 14 | | Wells Fargo Advantage Endeavor Select Fund | | Financial highlights |
(For a share outstanding throughout each period)
| | | | | | | | | | | | | | | | | | | | | | | | |
| | | Six months ended
January 31, 2013
(unaudited) | | | Year ended July 31 | |
| CLASS B | | | 2012 | | | 2011 | | | 2010 | | | 2009 | | | 2008 | |
Net asset value, beginning of period | | | $9.51 | | | | $9.28 | | | | $7.50 | | | | $6.75 | | | | $10.18 | | | | $10.29 | |
Net investment loss | | | (0.03 | )1 | | | (0.11 | )1 | | | (0.11 | )1 | | | (0.09 | )1 | | | (0.06 | )1 | | | (0.12 | )1 |
Net realized and unrealized gains (losses) on investments | | | 0.75 | | | | 0.34 | | | | 1.89 | | | | 0.84 | | | | (3.11 | ) | | | 0.11 | |
| | | | | | | | | | | | | | | | | | | | | | | | |
Total from investment operations | | | 0.72 | | | | 0.23 | | | | 1.78 | | | | 0.75 | | | | (3.17 | ) | | | (0.01 | ) |
Distributions to shareholders from | | | | | | | | | | | | | | | | | | | | | | | | |
Net realized gains | | | 0.00 | | | | 0.00 | | | | 0.00 | | | | 0.00 | | | | (0.26 | ) | | | (0.10 | ) |
Net asset value, end of period | | $ | 10.23 | | | | $9.51 | | | | $9.28 | | | | $7.50 | | | | $6.75 | | | | $10.18 | |
Total return2 | | | 7.47 | % | | | 2.48 | % | | | 23.73 | % | | | 11.11 | % | | | (30.71 | )% | | | (0.15 | )% |
Ratios to average net assets (annualized) | | | | | | | | | | | | | | | | | | | | | | | | |
Gross expenses | | | 2.01 | % | | | 1.98 | % | | | 1.98 | % | | | 2.02 | % | | | 2.07 | % | | | 2.06 | % |
Net expenses | | | 2.00 | % | | | 1.98 | % | | | 1.98 | % | | | 2.00 | % | | | 2.00 | % | | | 2.00 | % |
Net investment loss | | | (0.53 | )% | | | (1.24 | )% | | | (1.26 | )% | | | (1.25 | )% | | | (0.85 | )% | | | (1.12 | )% |
Supplemental data | | | | | | | | | | | | | | | | | | | | | | | | |
Portfolio turnover rate | | | 42 | % | | | 94 | % | | | 100 | % | | | 139 | % | | | 173 | % | | | 154 | % |
Net assets, end of period (000s omitted) | | | $709 | | | $ | 1,095 | | | $ | 1,633 | | | $ | 2,622 | | | $ | 3,976 | | | $ | 9,097 | |
| 1. | Calculated based upon average shares outstanding |
| 2. | Total return calculations do not include any sales charges. Returns for periods of less than one year are not annualized. |
The accompanying notes are an integral part of these financial statements.
| | | | | | |
| Financial highlights | | Wells Fargo Advantage Endeavor Select Fund | | | 15 | |
(For a share outstanding throughout each period)
| | | | | | | | | | | | | | | | | | | | | | | | |
| | | Six months ended
January 31, 2013
(unaudited) | | | Year ended July 31 | |
| CLASS C | | | 2012 | | | 2011 | | | 2010 | | | 2009 | | | 2008 | |
Net asset value, beginning of period | | | $9.51 | | | | $9.28 | | | | $7.50 | | | | $6.75 | | | $ | 10.18 | | | | $10.28 | |
Net investment loss | | | (0.03 | )1 | | | (0.11 | )1 | | | (0.11 | )1 | | | (0.09 | )1 | | | (0.05 | )1 | | | (0.12 | )1 |
Net realized and unrealized gains (losses) on investments | | | 0.75 | | | | 0.34 | | | | 1.89 | | | | 0.84 | | | | (3.12 | ) | | | 0.12 | |
| | | | | | | | | | | | | | | | | | | | | | | | |
Total from investment operations | | | 0.72 | | | | 0.23 | | | | 1.78 | | | | 0.75 | | | | (3.17 | ) | | | 0.00 | |
Distributions to shareholders from | | | | | | | | | | | | | | | | | | | | | | | | |
Net realized gains | | | 0.00 | | | | 0.00 | | | | 0.00 | | | | 0.00 | | | | (0.26 | ) | | | (0.10 | ) |
Net asset value, end of period | | $ | 10.23 | | | | $9.51 | | | | $9.28 | | | | $7.50 | | | | $6.75 | | | | $10.18 | |
Total return2 | | | 7.47 | % | | | 2.48 | % | | | 23.73 | % | | | 11.11 | % | | | (30.70 | )% | | | (0.06 | )% |
Ratios to average net assets (annualized) | | | | | | | | | | | | | | | | | | | | | | | | |
Gross expenses | | | 2.01 | % | | | 1.98 | % | | | 1.98 | % | | | 2.03 | % | | | 2.07 | % | | | 2.06 | % |
Net expenses | | | 2.00 | % | | | 1.98 | % | | | 1.98 | % | | | 2.00 | % | | | 2.00 | % | | | 2.00 | % |
Net investment loss | | | (0.53 | )% | | | (1.25 | )% | | | (1.27 | )% | | | (1.26 | )% | | | (0.82 | )% | | | (1.13 | )% |
Supplemental data | | | | | | | | | | | | | | | | | | | | | | | | |
Portfolio turnover rate | | | 42 | % | | | 94 | % | | | 100 | % | | | 139 | % | | | 173 | % | | | 154 | % |
Net assets, end of period (000s omitted) | | $ | 6,017 | | | $ | 6,199 | | | $ | 7,448 | | | $ | 7,825 | | | $ | 9,139 | | | $ | 12,297 | |
| 1. | Calculated based upon average shares outstanding |
| 2. | Total return calculations do not include any sales charges. Returns for periods of less than one year are not annualized. |
The accompanying notes are an integral part of these financial statements.
| | | | |
| 16 | | Wells Fargo Advantage Endeavor Select Fund | | Financial highlights |
(For a share outstanding throughout each period)
| | | | | | | | | | | | | | | | | | | | | | | | |
| | | Six months ended
January 31, 2013
(unaudited) | | | Year ended July 31 | |
| ADMINISTRATOR CLASS | | | 2012 | | | 2011 | | | 2010 | | | 2009 | | | 2008 | |
Net asset value, beginning of period | | | $10.63 | | | | $10.26 | | | | $8.22 | | | | $7.34 | | | | $10.91 | | | | $10.91 | |
Net investment income (loss) | | | 0.02 | 1 | | | (0.03 | )1 | | | (0.03 | )1 | | | (0.02 | )1 | | | 0.01 | 1 | | | (0.01 | )1 |
Net realized and unrealized gains (losses) on investments | | | 0.84 | | | | 0.40 | | | | 2.07 | | | | 0.91 | | | | (3.32 | ) | | | 0.11 | |
| | | | | | | | | | | | | | | | | | | | | | | | |
Total from investment operations | | | 0.86 | | | | 0.37 | | | | 2.04 | | | | 0.89 | | | | (3.31 | ) | | | 0.10 | |
Distributions to shareholders from | | | | | | | | | | | | | | | | | | | | | | | | |
Net investment income | | | 0.00 | | | | 0.00 | | | | 0.00 | | | | (0.01 | ) | | | 0.00 | | | | 0.00 | |
Net realized gains | | | 0.00 | | | | 0.00 | | | | 0.00 | | | | 0.00 | | | | (0.26 | ) | | | (0.10 | ) |
| | | | | | | | | | | | | | | | | | | | | | | | |
Total distributions to shareholders | | | 0.00 | | | | 0.00 | | | | 0.00 | | | | (0.01 | ) | | | (0.26 | ) | | | (0.10 | ) |
Net asset value, end of period | | | $11.49 | | | | $10.63 | | | | $10.26 | | | | $8.22 | | | | $7.34 | | | | $10.91 | |
Total return2 | | | 8.09 | % | | | 3.51 | % | | | 24.94 | % | | | 12.16 | % | | | (29.91 | )% | | | 0.87 | % |
Ratios to average net assets (annualized) | | | | | | | | | | | | | | | | | | | | | | | | |
Gross expenses | | | 1.09 | % | | | 1.07 | % | | | 1.07 | % | | | 1.10 | % | | | 1.14 | % | | | 1.12 | % |
Net expenses | | | 1.00 | % | | | 1.00 | % | | | 1.00 | % | | | 1.00 | % | | | 1.00 | % | | | 1.00 | % |
Net investment income (loss) | | | 0.45 | % | | | (0.27 | )% | | | (0.29 | )% | | | (0.26 | )% | | | 0.20 | % | | | (0.12 | )% |
Supplemental data | | | | | | | | | | | | | | | | | | | | | | | | |
Portfolio turnover rate | | | 42 | % | | | 94 | % | | | 100 | % | | | 139 | % | | | 173 | % | | | 154 | % |
Net assets, end of period (000s omitted) | | $ | 52,900 | | | $ | 57,533 | | | $ | 232,954 | | | $ | 223,320 | | | $ | 247,298 | | | $ | 276,388 | |
| 1. | Calculated based upon average shares outstanding |
| 2. | Returns for periods of less than one year are not annualized. |
The accompanying notes are an integral part of these financial statements.
| | | | | | |
| Financial highlights | | Wells Fargo Advantage Endeavor Select Fund | | | 17 | |
(For a share outstanding throughout each period)
| | | | | | | | | | | | | | | | | | | | | | | | |
| | | Six months ended
January 31, 2013
(unaudited) | | | Year ended July 31 | |
| INSTITUTIONAL CLASS | | | 2012 | | | 2011 | | | 2010 | | | 2009 | | | 2008 | |
Net asset value, beginning of period | | | $10.75 | | | | $10.37 | | | | $8.28 | | | | $7.39 | | | | $10.97 | | | | $10.96 | |
Net Investment income (loss) | | | 0.04 | 1 | | | (0.01 | )1 | | | (0.01 | )1 | | | (0.01 | )1 | | | 0.03 | 1 | | | 0.01 | 1 |
Net realized and unrealized gains (losses) on investments | | | 0.84 | | | | 0.39 | | | | 2.10 | | | | 0.93 | | | | (3.35 | ) | | | 0.11 | |
| | | | | | | | | | | | | | | | | | | | | | | | |
Total from investment operations | | | 0.88 | | | | 0.38 | | | | 2.09 | | | | 0.92 | | | | (3.32 | ) | | | 0.12 | |
Distributions to shareholders from | | | | | | | | | | | | | | | | | | | | | | | | |
Net investment income | | | 0.00 | | | | 0.00 | | | | 0.00 | | | | (0.03 | ) | | | 0.00 | | | | (0.01 | ) |
Net realized gains | | | 0.00 | | | | 0.00 | | | | 0.00 | | | | 0.00 | | | | (0.26 | ) | | | (0.10 | ) |
| | | | | | | | | | | | | | | | | | | | | | | | |
Total distributions to shareholders | | | 0.00 | | | | 0.00 | | | | 0.00 | | | | (0.03 | ) | | | (0.26 | ) | | | (0.11 | ) |
Net asset value, end of period | | | $11.63 | | | | $10.75 | | | | $10.37 | | | | $8.28 | | | | $7.39 | | | | $10.97 | |
Total return2 | | | 8.19 | % | | | 3.66 | % | | | 25.24 | % | | | 12.41 | % | | | (29.84 | )% | | | 1.06 | % |
Ratios to average net assets (annualized) | | | | | | | | | | | | | | | | | | | | | | | | |
Gross expenses | | | 0.83 | % | | | 0.80 | % | | | 0.80 | % | | | 0.83 | % | | | 0.88 | % | | | 0.86 | % |
Net expenses | | | 0.80 | % | | | 0.79 | % | | | 0.80 | % | | | 0.80 | % | | | 0.80 | % | | | 0.80 | % |
Net investment income (loss) | | | 0.70 | % | | | (0.06 | )% | | | (0.08 | )% | | | (0.07 | )% | | | 0.38 | % | | | 0.07 | % |
Supplemental data | | | | | | | | | | | | | | | | | | | | | | | | |
Portfolio turnover rate | | | 42 | % | | | 94 | % | | | 100 | % | | | 139 | % | | | 173 | % | | | 154 | % |
Net assets, end of period (000s omitted) | | $ | 499,949 | | | $ | 735,633 | | | $ | 853,494 | | | $ | 933,587 | | | $ | 867,167 | | | $ | 1,158,997 | |
| 1. | Calculated based upon average shares outstanding |
| 2. | Returns for periods of less than one year are not annualized. |
The accompanying notes are an integral part of these financial statements.
| | | | |
| 18 | | Wells Fargo Advantage Endeavor Select Fund | | Notes to financial statements (unaudited) |
1. ORGANIZATION
Wells Fargo Funds Trust (the “Trust”), a Delaware statutory trust organized on March 10, 1999, is an open-end management investment company registered under the Investment Company Act of 1940, as amended (the “1940 Act”). These financial statements report on Wells Fargo Advantage Endeavor Select Fund (the “Fund”) which is a non-diversified series of the Trust.
2. SIGNIFICANT ACCOUNTING POLICIES
The following significant accounting policies, which are consistently followed in the preparation of the financial statements of the Fund, are in conformity with U.S. generally accepted accounting principles which require management to make estimates and assumptions that affect the reported amounts of assets and liabilities, disclosure of contingent assets and liabilities at the date of the financial statements, and the reported amounts of revenues and expenses during the reporting period. Actual results could differ from those estimates.
Securities valuation
All investments are valued each business day as of the close of regular trading on the New York Stock Exchange (normally 4 p.m. Eastern Time).
Equity securities that are listed on a foreign or domestic exchange, except for The Nasdaq Stock Market, Inc. (“Nasdaq”), are valued at the official closing price or, if none, the last sales price. Securities listed on Nasdaq are valued at the Nasdaq Official Closing Price (“NOCP”). If no NOCP is available, securities are valued at the last sales price. If no sales price is shown on the Nasdaq, the bid price will be used. If no sale occurs on the primary exchange or market for the security that day or if no sale occurs and no bid price is shown on Nasdaq, the prior day’s price will be deemed “stale” and fair values will be determined in accordance with the Fund’s Valuation Procedures.
Investments in registered open-end investment companies are valued at net asset value. Non-registered investment companies are fair valued at net asset value.
Investments which are not valued using any of the methods discussed above are valued at their fair value, as determined by procedures established in good faith and approved by the Board of Trustees. The Board of Trustees has established a Valuation Committee comprised of the Trustees and has delegated to it the authority to take any actions regarding the valuation of portfolio securities that the Valuation Committee deems necessary or appropriate, including determining the fair value of portfolio securities, unless the determination has been delegated to the Management Valuation Team of Wells Fargo Funds Management, LLC (“Funds Management”). The Board of Trustees retains the authority to make or ratify any valuation decisions or approve any changes to the Valuation Procedures as it deems appropriate. On a quarterly basis, the Board of Trustees receives reports on any valuation actions taken by the Valuation Committee or the Management Valuation Team which may include items for ratification.
Valuations of fair valued securities are compared to the next actual sales price when available, or other appropriate market information to assess the continued appropriateness of the fair valuation methodology used. These securities are fair valued on a day-to-day basis, taking into consideration changes to appropriate market information and any significant changes to the input factors considered in the valuation process until there is a readily available price provided on the exchange or by an independent pricing service. Valuations received from an independent pricing service or broker quotes are periodically validated by comparisons to most recent trades and valuations provided by other independent pricing services in addition to the review of prices by the adviser and/or subadviser. Unobservable inputs used in determining fair valuations are identified based on the type of security, taking into consideration factors utilized by market participants in valuing the investment, knowledge about the issuer and the current market environment.
Security loans
The Fund may lend its securities from time to time in order to earn additional income in the form of fees or interest on securities received as collateral or the investment of any cash received as collateral. The Fund continues to receive interest or dividends on the securities loaned. The Fund receives collateral in the form of cash or securities with a value at least equal to the value of the securities on loan. The value of the loaned securities is determined at the close of each business day and any additional required collateral is delivered to the Fund on the next business day. In a securities lending transaction, the net asset value of the Fund will be affected by an increase or decrease in the value of the securities loaned and by an increase or decrease in the value of the instrument in which collateral is invested. The amount of securities lending activity undertaken by the Fund fluctuates from time to time. In the event of default or bankruptcy by the borrower, the Fund may be prevented from recovering the loaned securities or gaining access to the collateral or may experience delays or costs in doing so. In addition, the investment of any cash collateral received may lose all or part of its value. The Fund has the right under the lending agreement to recover the securities from the borrower on demand.
| | | | | | |
| Notes to financial statements (unaudited) | | Wells Fargo Advantage Endeavor Select Fund | | | 19 | |
The Fund lends its securities through an unaffiliated securities lending agent. Cash collateral received in connection with its securities lending transactions is invested in Wells Fargo Securities Lending Cash Investments, LLC (the “Cash Collateral Fund”). The Cash Collateral Fund is exempt from registration under Section 3(c)(7) of the 1940 Act and is managed by Funds Management and is subadvised by Wells Capital Management Incorporated (“WellsCap”). Funds Management receives an advisory fee starting at 0.05% and declining to 0.01% as the average daily net assets of the Cash Collateral Fund increase. All of the fees received by Funds Management are paid to WellsCap for its services as subadviser. The Cash Collateral Fund seeks to provide a positive return compared to the daily Fed Funds Open rate by investing in high-quality, U.S. dollar-denominated short-term money market instruments. Cash Collateral Fund investments are fair valued based upon the amortized cost valuation technique. Income earned from investment in the Cash Collateral Fund is included in securities lending income on the Statement of Operations.
Security transactions and income recognition
Securities transactions are recorded on a trade date basis. Realized gains or losses are recorded on the basis of identified cost.
Dividend income is recognized on the ex-dividend date.
Distributions to shareholders
Distributions to shareholders from net investment income and net realized gains, if any, are recorded on the ex-dividend date. Such distributions are determined in conformity with federal income tax regulations, which may differ in amount or character from net investment income and realized gains recognized for purposes of U.S. generally accepted accounting principles.
Federal and other taxes
The Fund intends to continue to qualify as a regulated investment company by distributing substantially all of its investment company taxable income and any net realized capital gains (after reduction for capital loss carryforwards) sufficient to relieve it from all, or substantially all, federal income taxes. Accordingly, no provision for federal income taxes was required.
The Fund’s income and federal excise tax returns and all financial records supporting those returns for the prior three fiscal years are subject to examination by the federal and Delaware revenue authorities. Management has analyzed the Fund’s tax positions taken on federal, state, and foreign tax returns for all open tax years and does not believe that there are any uncertain tax positions that require recognition of a tax liability.
As of July 31, 2012, the Fund had pre-enactment capital loss carryforwards incurred in taxable years beginning before December 22, 2010, which are available to offset future net realized capital gains, in the amount of $134,473,436 expiring in 2018.
As of July 31, 2012, the Fund had a qualified late-year ordinary loss of $760,006 which was recognized on the first day of the current fiscal year. A late-year ordinary loss is the net loss comprised of (a) net gain or loss from the sale or other disposition of certain capital assets for the portion of the taxable year after October 31 and (b) other ordinary income or loss for the portion of the taxable year after December 31.
Class allocations
The separate classes of shares offered by the Fund differ principally in applicable sales charges, distribution, shareholder servicing, and administration fees. Shareholders of each class bear certain expenses that pertain to that particular class. All shareholders bear the common expenses of the Fund, earn income from the portfolio, and are allocated any unrealized gains and losses pro rata based on the average daily net assets of each class, without distinction between share classes. Dividends are determined separately for each class based on income and expenses allocable to each class. Realized gains and losses are allocated to each class pro rata based upon the net assets of each class on the date realized. Differences in per share dividend rates generally result from the relative weightings of pro rata income and realized gain allocations and from differences in separate class expenses, including distribution, shareholder servicing, and administration fees.
3. FAIR VALUATION MEASUREMENTS
Fair value measurements of investments are determined within a framework that has established a fair value hierarchy based upon the various data inputs utilized in determining the value of the Fund’s investments. The three-level hierarchy gives the highest priority to unadjusted quoted prices in active markets for identical assets or liabilities (Level 1) and the lowest priority to significant unobservable inputs (Level 3). The Fund’s investments are classified within the fair value hierarchy based on the lowest level of input that is significant to the fair value measurement. The inputs are summarized into three broad levels as follows:
| n | | Level 1 – quoted prices in active markets for identical securities |
| | | | |
| 20 | | Wells Fargo Advantage Endeavor Select Fund | | Notes to financial statements (unaudited) |
| n | | Level 2 – other significant observable inputs (including quoted prices for similar securities, interest rates, prepayment speeds, credit risk, use of amortized cost, etc.) |
| n | | Level 3 – significant unobservable inputs (including the Fund’s own assumptions in determining the fair value of investments) |
The inputs or methodologies used for valuing investments in securities are not necessarily an indication of the risk associated with investing in those securities.
As of January 31, 2013, the inputs used in valuing investments in securities, which are carried at fair value, were as follows:
| | | | | | | | | | | | | | | | |
| Investments in securities | | Quoted prices (Level 1) | | | Significant other
observable inputs (Level 2) | | | Significant
unobservable inputs (Level 3) | | | Total | |
Equity securities | | | | | | | | | | | | | | | | |
Common stocks | | $ | 588,014,560 | | | $ | 0 | | | $ | 0 | | | $ | 588,014,560 | |
Other | | | 0 | | | | 0 | | | | 1,755,974 | | | | 1,755,974 | |
Short-term investments | | | | | | | | | | | | | | | | |
Investment companies | | | 8,993,585 | | | | 87,302,568 | | | | 0 | | | | 96,296,153 | |
| | | $ | 597,008,145 | | | $ | 87,302,568 | | | $ | 1,755,974 | | | $ | 686,066,687 | |
Further details on the major security types listed above can be found in the Portfolio of Investments.
Transfers in and transfers out are recognized at the end of the reporting period. For the six months ended January 31, 2013, the Fund did not have any transfers into/out of Level 1 or Level 2.
4. TRANSACTIONS WITH AFFILIATES AND OTHER EXPENSES
Advisory fee
The Trust has entered into an advisory contract with Funds Management, an indirect wholly owned subsidiary of Wells Fargo & Company (“Wells Fargo”). The adviser is responsible for implementing investment policies and guidelines and for supervising the subadviser, who is responsible for day-to-day portfolio management of the Fund.
Pursuant to the contract, Funds Management is entitled to receive an annual advisory fee starting at 0.65% and declining to 0.55% as the average daily net assets of the Fund increase. For the six months ended January 31, 2013, the advisory fee was equivalent to an annual rate of 0.64% of the Fund’s average daily net assets.
Funds Management has retained the services of a subadviser to provide daily portfolio management to the Fund. The fee for subadvisory services is borne by Funds Management. WellsCap, an affiliate of Funds Management, is the subadviser to the Fund and is entitled to receive a fee from Funds Management at an annual rate starting at 0.35% and declining to 0.15% as the average daily net assets of the Fund increase.
Administration and transfer agent fees
The Trust has entered into an administration agreement with Funds Management. Under this agreement, for providing administrative services, which includes paying fees and expenses for services provided by the transfer agent, sub-transfer agents, omnibus account servicers and record-keepers, Funds Management is entitled to receive from the Fund an annual fund level administration fee starting at 0.05% and declining to 0.03% as the average daily net assets of the Fund increase and a class level administration fee which is calculated based on the average daily net assets of each class as follows:
| | | | |
| | | Class level
administration fee | |
Class A, Class B, Class C | | | 0.26 | % |
Administrator Class | | | 0.10 | |
Institutional Class | | | 0.08 | |
Funds Management has contractually waived and/or reimbursed advisory and administration fees to the extent necessary to maintain certain net operating expense ratios for the Fund. Waiver of fees and/or reimbursement of expenses by Funds Management were made first from fund level expenses on a proportionate basis and then from class specific expenses. Funds Management has committed through November 30, 2013 to waive fees and/or reimburse expenses to the extent necessary to cap the Fund’s expenses at 1.25% for Class A shares, 2.00% for Class B shares, 2.00% for Class C shares, 1.00% for Administrator Class shares, and 0.80% for Institutional Class shares.
| | | | | | |
| Notes to financial statements (unaudited) | | Wells Fargo Advantage Endeavor Select Fund | | | 21 | |
Distribution fees
The Trust has adopted a Distribution Plan for Class B and Class C shares of the Fund pursuant to Rule 12b-1 under the 1940 Act. Distribution fees are charged to Class B and Class C shares and paid to Wells Fargo Funds Distributor, LLC, the principal underwriter, at an annual rate of 0.75% of the average daily net assets of Class B and Class C shares.
For the six months ended January 31, 2013, Wells Fargo Funds Distributor, LLC received $3,869 from the sale of Class A shares.
Shareholder servicing fees
The Trust has entered into contracts with one or more shareholder servicing agents, whereby Class A, Class B, Class C, and Administrator Class of the Fund is charged a fee at an annual rate of 0.25% of the average daily net assets of each respective class.
A portion of these total shareholder servicing fees were paid to affiliates of Wells Fargo.
5. INVESTMENT PORTFOLIO TRANSACTIONS
Purchases and sales of investments, excluding U.S. government obligations (if any) and short-term securities, for the six months ended January 31, 2013 were $272,861,853 and $536,379,494, respectively.
6. BANK BORROWINGS
The Trust (excluding the money market funds and certain other funds in the Trust) and Wells Fargo Variable Trust are parties to a $150,000,000 revolving credit agreement with State Street Bank and Trust Company, whereby the Fund is permitted to use bank borrowings for temporary or emergency purposes, such as to fund shareholder redemption requests. Interest under the credit agreement is charged to the Fund based on a borrowing rate equal to the higher of the Federal Funds rate in effect on that day plus 1.25% or the overnight LIBOR rate in effect on that day plus 1.25%. In addition, an annual commitment fee equal to 0.10% of the unused balance is allocated to each participating fund. For the six months ended January 31, 2013, the Fund paid $354 in commitment fees.
For the six months ended January 31, 2013, there were no borrowings by the Fund under the agreement.
7. INDEMNIFICATION
Under the Trust’s organizational documents, the officers and directors are indemnified against certain liabilities that may arise out of performance of their duties to the Trust. Additionally, in the normal course of business, the Trust may enter into contracts with service providers that contain a variety of indemnification clauses. The Trust’s maximum exposure under these arrangements is dependent on future claims that may be made against the Fund and, therefore, cannot be estimated.
8. NEW ACCOUNTING PRONOUNCEMENT
In December 2011, the Financial Accounting Standards Board (“FASB”) issued Accounting Standard Update (“ASU”) No. 2011-11, Disclosures about Offsetting Assets and Liabilities. ASU 2011-11, which amends FASB ASC Topic 210, Balance Sheet, creates new disclosure requirements which require entities to disclose both gross and net information for derivatives and other financial instruments that are either offset in the Statement of Assets and Liabilities or subject to an enforceable master netting arrangement or similar agreement. The disclosure requirements are effective for interim and annual reporting periods beginning on or after January 1, 2013. Management is currently assessing the potential impact, in addition to expanded financial statement disclosure, that may result from adopting this ASU.
| | | | |
| 22 | | Wells Fargo Advantage Endeavor Select Fund | | Other information (unaudited) |
PROXY VOTING INFORMATION
A description of the policies and procedures that the Fund uses to determine how to vote proxies relating to portfolio securities is available without charge, upon request, by calling 1-800-222-8222, visiting our website at wellsfargoadvantagefunds.com, or visiting the SEC website at sec.gov. Information regarding how the Fund voted proxies relating to portfolio securities during the most recent 12-month period ended June 30 is available without charge on the Fund’s website at wellsfargoadvantagefunds.com or by visiting the SEC website at sec.gov.
PORTFOLIO HOLDINGS INFORMATION
The complete portfolio holdings for the Fund are publicly available on the Fund’s website (wellsfargoadvantagefunds.com) on a monthly, 30-day or more delayed basis. In addition, top ten holdings information for the Fund is publicly available on the Fund’s website on a monthly, seven-day or more delayed basis. The Fund files its complete schedule of portfolio holdings with the SEC for the first and third quarters of each fiscal year on Form N-Q, which is available without charge by visiting the SEC website at sec.gov. In addition, the Fund’s Form N-Q may be reviewed and copied at the SEC’s Public Reference Room in Washington, DC, and at regional offices in New York City, at 233 Broadway, and in Chicago, at 175 West Jackson Boulevard, Suite 900. Information about the Public Reference Room may be obtained by calling 1-800-SEC-0330.
| | | | | | |
| Other information (unaudited) | | Wells Fargo Advantage Endeavor Select Fund | | | 23 | |
BOARD OF TRUSTEES AND OFFICERS
Each of the Trustees and Officers listed in the table below acts in identical capacities for the Wells Fargo Advantage family of funds, which consists of 136 funds1 comprising the Wells Fargo Funds Trust, Wells Fargo Variable Trust, Wells Fargo Master Trust and four closed-end funds (collectively the “Fund Complex”). This table should be read in conjunction with the Prospectus and the Statement of Additional Information2. All of the Trustees are also Members of the Audit and Governance Committees of each Trust in the Fund Complex. The mailing address of each Trustee and Officer is 525 Market Street, 12th Floor, San Francisco, CA 94105. Each Trustee and Officer serves an indefinite term, however, each Trustee serves such term until reaching the mandatory retirement age established by the Trustees.
Independent Trustees
| | | | | | |
Name and year of birth | | Position held and length of service* | | Principal occupations during past five years | | Other directorships during
past five years |
Peter G. Gordon
(Born 1942) | | Trustee, since 1998; Chairman, since 2005 | | Co-Founder, Retired Chairman, President and CEO of Crystal Geyser Water Company. Trustee Emeritus, Colby College. | | Asset Allocation Trust |
Isaiah Harris, Jr.
(Born 1952) | | Trustee, since 2009 | | Retired. Prior thereto, President and CEO of BellSouth Advertising and Publishing Corp. from 2005 to 2007, President and CEO of BellSouth Enterprises from 2004 to 2005 and President of BellSouth Consumer Services from 2000 to 2003. Emeritus member of the Iowa State University Foundation Board of Governors. Emeritus Member of the Advisory Board of Iowa State University School of Business. Advisory Board Member, Palm Coast Academy (charter school). Mr. Harris is a certified public accountant. | | CIGNA Corporation; Deluxe Corporation; Asset Allocation Trust |
Judith M. Johnson
(Born 1949) | | Trustee, since 2008; Audit Committee Chairman, since 2008 | | Retired. Prior thereto, Chief Executive Officer and Chief Investment Officer of Minneapolis Employees Retirement Fund from 1996 to 2008. Ms. Johnson is an attorney, certified public accountant and a certified managerial accountant. | | Asset Allocation Trust |
Leroy Keith, Jr.
(Born 1939) | | Trustee, since 2010 | | Chairman, Bloc Global Services (development and construction). Trustee of the Evergreen Funds from 1983 to 2010. Former Managing Director, Almanac Capital Management (commodities firm), former Partner, Stonington Partners, Inc. (private equity fund), former Director, Obagi Medical Products Co. and former Director, Lincoln Educational Services. | | Trustee, Virtus Fund Complex (consisting of 48 portfolios as of 1/31/13); Asset Allocation Trust |
David F. Larcker
(Born 1950) | | Trustee, since 2009 | | James Irvin Miller Professor of Accounting at the Graduate School of Business, Stanford University, Morgan Stanley Director of the Center for Leadership Development and Research and Senior Faculty of The Rock Center for Corporate Governance since 2006. From 2005 to 2008, Professor of Accounting at the Graduate School of Business, Stanford University. Prior thereto, Ernst & Young Professor of Accounting at The Wharton School, University of Pennsylvania from 1985 to 2005. | | Asset Allocation Trust |
Olivia S. Mitchell
(Born 1953) | | Trustee, since 2006 | | International Foundation of Employee Benefit Plans Professor, Wharton School of the University of Pennsylvania since 1993. Director of Wharton’s Pension Research Council and Boettner Center on Pensions & Retirement Research, and Research Associate at the National Bureau of Economic Research. Previously, Cornell University Professor from 1978 to 1993. | | Asset Allocation Trust |
Timothy J. Penny
(Born 1951) | | Trustee, since 1996 | | President and CEO of Southern Minnesota Initiative Foundation, a non-profit organization, since 2007 and Senior Fellow at the Humphrey Institute Policy Forum at the University of Minnesota since 1995. Member of the Board of Trustees of NorthStar Education Finance, Inc., a non-profit organization, since 2007. | | Asset Allocation Trust |
| | | | |
| 24 | | Wells Fargo Advantage Endeavor Select Fund | | Other information (unaudited) |
| | | | | | |
Name and year of birth | | Position held and length of service* | | Principal occupations during past five years | | Other directorships during
past five years |
Michael S. Scofield
(Born 1943) | | Trustee, since 2010 | | Served on the Investment Company Institute’s Board of Governors and Executive Committee from 2008-2011 as well the Governing Council of the Independent Directors Council from 2006-2011 and the Independent Directors Council Executive Committee from 2008-2011. Chairman of the IDC from 2008-2010. Institutional Investor (Fund Directions) Trustee of Year in 2007. Trustee of the Evergreen Funds (and its predecessors) from 1984 to 2010. Chairman of the Evergreen Funds from 2000-2010. Former Trustee of the Mentor Funds. Retired Attorney, Law Offices of Michael S. Scofield. | | Asset Allocation Trust |
Donald C. Willeke
(Born 1940) | | Trustee, since 1996 | | Principal of the law firm of Willeke & Daniels. General Counsel of the Minneapolis Employees Retirement Fund from 1984 until its consolidation into the Minnesota Public Employees Retirement Association on June 30, 2010. Director and Vice Chair of The Tree Trust (non-profit corporation). Director of the American Chestnut Foundation (non-profit corporation). | | Asset Allocation Trust |
| * | Length of service dates reflect the Trustee’s commencement of service with the Trust’s predecessor entities, where applicable. |
Officers
| | | | | | |
Name and year of birth | | Position held and length of service | | Principal occupations during past five years | | |
Karla M. Rabusch
(Born 1959) | | President, since 2003 | | Executive Vice President of Wells Fargo Bank, N.A. and President of Wells Fargo Funds Management, LLC since 2003. | | |
Jeremy DePalma1
(Born 1974) | | Treasurer, since 2012 | | Senior Vice President of Wells Fargo Funds Management, LLC since 2009. Senior Vice President of Evergreen Investment Management Company, LLC from 2008 to 2010. Vice President, Evergreen Investment Services, Inc. from 2004 to 2007. Head of the Fund Reporting and Control Team within Fund Administration from 2005 to 2010. | | |
C. David Messman
(Born 1960) | | Secretary, since 2000; Chief Legal Officer, since 2003 | | Senior Vice President and Secretary of Wells Fargo Funds Management, LLC since 2001. Vice President and Managing Counsel of Wells Fargo Bank, N.A. since 1996. | | |
Debra Ann Early
(Born 1964) | | Chief Compliance Officer, since 2007 | | Chief Compliance Officer of Wells Fargo Funds Management, LLC since 2007. Chief Compliance Officer of Parnassus Investments from 2005 to 2007. Chief Financial Officer of Parnassus Investments from 2004 to 2007. | | |
David Berardi
(Born 1975) | | Assistant Treasurer, since 2009 | | Vice President of Wells Fargo Funds Management, LLC since 2009. Vice President of Evergreen Investment Management Company, LLC from 2008 to 2010. Assistant Vice President of Evergreen Investment Services, Inc. from 2004 to 2008. Manager of Fund Reporting and Control for Evergreen Investment Management Company, LLC from 2004 to 2010. | | |
| 1. | Jeremy DePalma acts as Treasurer of 61 funds and Assistant Treasurer of 75 funds in the Fund Complex. |
| 2. | The Statement of Additional Information includes additional information about the Trustees and is available, without charge, upon request, by calling 1-800-222-8222 or by visiting the website at wellsfargoadvantagefunds.com. |
| | | | | | |
| List of abbreviations | | Wells Fargo Advantage Endeavor Select Fund | | | 25 | |
The following is a list of common abbreviations for terms and entities that may have appeared in this report.
| ACA | — ACA Financial Guaranty Corporation |
| ADR | — American depositary receipt |
| ADS | — American depositary shares |
| AGC | — Assured Guaranty Corporation |
| AGM | — Assured Guaranty Municipal |
| Ambac | — Ambac Financial Group Incorporated |
| AMT | — Alternative minimum tax |
| BAN | — Bond anticipation notes |
| BHAC | — Berkshire Hathaway Assurance Corporation |
| CAB | — Capital appreciation bond |
| CCAB | — Convertible capital appreciation bond |
| CDA | — Community Development Authority |
| CDO | — Collateralized debt obligation |
| COP | — Certificate of participation |
| DRIVER | — Derivative inverse tax-exempt receipts |
| DW&P | — Department of Water & Power |
| DWR | — Department of Water Resources |
| ECFA | — Educational & Cultural Facilities Authority |
| EDA | — Economic Development Authority |
| EDFA | — Economic Development Finance Authority |
| ETF | — Exchange-traded fund |
| FDIC | — Federal Deposit Insurance Corporation |
| FFCB | — Federal Farm Credit Banks |
| FGIC | — Financial Guaranty Insurance Corporation |
| FHA | — Federal Housing Administration |
| FHLB | — Federal Home Loan Bank |
| FHLMC | — Federal Home Loan Mortgage Corporation |
| FICO | — The Financing Corporation |
| FNMA | — Federal National Mortgage Association |
| FSA | —�� Farm Service Agency |
| GDR | — Global depositary receipt |
| GNMA | — Government National Mortgage Association |
| HCFR | — Healthcare facilities revenue |
| HEFA | — Health & Educational Facilities Authority |
| HEFAR | — Higher education facilities authority revenue |
| HFA | — Housing Finance Authority |
| HFFA | — Health Facilities Financing Authority |
| HUD | — Department of Housing and Urban Development |
| IDA | — Industrial Development Authority |
| IDAG | — Industrial Development Agency |
| IDR | — Industrial development revenue |
| KRW | — Republic of Korea won |
| LIBOR | — London Interbank Offered Rate |
| LLC | — Limited liability company |
| LLP | — Limited liability partnership |
| MBIA | — Municipal Bond Insurance Association |
| MFHR | — Multifamily housing revenue |
| MSTR | — Municipal securities trust receipts |
| MUD | — Municipal Utility District |
| National | — National Public Finance Guarantee Corporation |
| PCFA | — Pollution Control Financing Authority |
| PCL | — Public Company Limited |
| PCR | — Pollution control revenue |
| PFA | — Public Finance Authority |
| PFFA | — Public Facilities Financing Authority |
| PFOTER | — Puttable floating option tax-exempt receipts |
| plc | — Public limited company |
| PUTTER | — Puttable tax-exempt receipts |
| R&D | — Research & development |
| Radian | — Radian Asset Assurance |
| RAN | — Revenue anticipation notes |
| RDA | — Redevelopment Authority |
| RDFA | — Redevelopment Finance Authority |
| REIT | — Real estate investment trust |
| ROC | — Reset option certificates |
| SAVRS | — Select auction variable rate securities |
| SBA | — Small Business Authority |
| SFHR | — Single-family housing revenue |
| SFMR | — Single-family mortgage revenue |
| SPA | — Standby purchase agreement |
| SPDR | — Standard & Poor’s Depositary Receipts |
| STRIPS | — Separate trading of registered interest and principal securities |
| TAN | — Tax anticipation notes |
| TIPS | — Treasury inflation-protected securities |
| TRAN | — Tax revenue anticipation notes |
| TTFA | — Transportation Trust Fund Authority |
| TVA | — Tennessee Valley Authority |
This page is intentionally left blank.


For more information
More information about Wells Fargo Advantage Funds is available free upon request. To obtain literature, please write, email, visit the Fund’s website, or call:
Wells Fargo Advantage Funds
P.O. Box 8266
Boston, MA 02266-8266
Email: wfaf@wellsfargo.com
Website: wellsfargoadvantagefunds.com
Individual investors: 1-800-222-8222
Retail investment professionals: 1-888-877-9275
Institutional investment professionals: 1-866-765-0778
This report and the financial statements contained herein are submitted for the general information of the shareholders of Wells Fargo Advantage Funds. If this report is used for promotional purposes, distribution of the report must be accompanied or preceded by a current prospectus. For a current prospectus and, if available, a summary prospectus containing more complete information, including charges and expenses, call 1-800-222-8222 or visit the Fund’s website at wellsfargoadvantagefunds.com. Please consider the investment objectives, risks, charges, and expenses of the investment carefully before investing. This and other information about Wells Fargo Advantage Funds can be found in the current prospectus. Read the prospectus carefully before you invest or send money.
Wells Fargo Funds Management, LLC, a wholly owned subsidiary of Wells Fargo & Company, provides investment advisory and administrative services for Wells Fargo Advantage Funds. Other affiliates of Wells Fargo & Company provide subadvisory and other services for the Funds. The Funds are distributed by Wells Fargo Funds Distributor, LLC, Member FINRA/SIPC, an affiliate of Wells Fargo & Company.
NOT FDIC INSURED ¡ NO BANK GUARANTEE ¡ MAY LOSE VALUE
© 2013 Wells Fargo Funds Management, LLC. All rights reserved.
| | |
 | | 215103 03-13 SA205/SAR205 1-13 |

Wells Fargo Advantage Growth Fund

Semi-Annual Report
January 31, 2013

Reduce clutter. Save trees.
Sign up for electronic delivery of prospectuses and shareholder reports at wellsfargo.com/advantagedelivery
Contents
The views expressed and any forward-looking statements are as of January 31, 2013, unless otherwise noted, and are those of the Fund managers and/or Wells Fargo Funds Management, LLC. Discussions of individual securities, or the markets generally, or any Wells Fargo Advantage Fund are not intended as individual recommendations. Future events or results may vary significantly from those expressed in any forward-looking statements; the views expressed are subject to change at any time in response to changing circumstances in the market. Wells Fargo Funds Management, LLC, disclaims any obligation to publicly update or revise any views expressed or forward-looking statements.
NOT FDIC INSURED ¡ NO BANK GUARANTEE ¡ MAY LOSE VALUE

Wells Fargo investment history
| | |
| 1932 | | Keystone creates one of the first mutual fund families. |
| 1971 | | Wells Fargo & Company introduces one of the first institutional index funds. |
| 1978 | | Wells Fargo applies Markowitz and Sharpe’s research on Modern Portfolio Theory to introduce one of the industry’s first tactical asset allocation models in institutional separately managed accounts. |
| 1984 | | Wells Fargo Stagecoach Funds launches its first asset allocation fund. |
| 1989 | | The Tactical Asset Allocation (TAA) Model is first applied to Wells Fargo’s asset allocation mutual funds. |
| 1994 | | Wells Fargo introduces the LifePath Funds, one of the first suites of target date funds (now the Wells Fargo Advantage Dow Jones Target Date FundsSM). |
| 1996 | | Evergreen Investments and Keystone Funds merge. |
| 1997 | | Wells Fargo launches the Wells Fargo Advantage WealthBuilder PortfoliosSM, a fund-of-funds suite of products that includes the use of quantitative models to shift assets among investment styles. |
| 1999 | | Norwest Advantage Funds and Stagecoach Funds are reorganized into Wells Fargo Funds after the merger of Norwest and Wells Fargo. |
| 2002 | | Evergreen Retail and Evergreen Institutional companies form the umbrella asset management company, Evergreen Investments. |
| 2005 | | The integration of Strong Funds with Wells Fargo Funds creates Wells Fargo Advantage Funds, resulting in one of the top 20 mutual fund companies in the United States. |
| 2006 | | Wells Fargo Advantage Funds relaunches the target date product line as Wells Fargo Advantage Dow Jones Target Date Funds. |
| 2010 | | The mergers and reorganizations of Evergreen and Wells Fargo Advantage mutual funds are completed, unifying the families under the brand of Wells Fargo Advantage Funds. |
Wells Fargo Advantage Funds®
Wells Fargo Advantage Funds skillfully guides institutions, financial advisors, and individuals through the investment terrain to help them reach their financial objectives. Everything we do on behalf of investors is backed by our unique combination of qualifications.
Strength
Our organization is built on the standards of integrity and service established by our parent company—Wells Fargo & Company—more than 150 years ago. And, because we’re part of a highly diversified financial enterprise, we offer the depth of resources to help investors succeed.
Expertise
Our multi-boutique model offers investors access to the independent thinking of premier investment managers that have been chosen for their time-tested strategies. While each team specializes in a specific investment strategy, collectively they provide investors a wide choice of distinct investment styles. Our dedication to investment excellence doesn’t end with our expertise in manager selection—risk management, analysis, and rigorous ongoing review seek to ensure each manager’s investment process remains consistent.
Partnership
Our collaborative approach is built around understanding the needs and goals of our clients. By adhering to core principles of sound judgment and steady guidance, we support you through every stage of the investment decision process.
Carefully consider the investment objectives, risks, charges, and expenses before investing. For a current prospectus and, if available, a summary prospectus, for Wells Fargo Advantage Funds, containing this and other information, visit wellsfargoadvantagefunds.com. Read it carefully before investing.
Wells Fargo Funds Management, LLC, a wholly owned subsidiary of Wells Fargo & Company, provides investment advisory and administrative services for Wells Fargo Advantage Funds. Other affiliates of Wells Fargo & Company provide subadvisory and other services for the Funds. The Funds are distributed by Wells Fargo Funds Distributor, LLC, Member FINRA/SIPC, an affiliate of Wells Fargo & Company.
“Dow Jones®” and “Dow Jones Target Date IndexesSM” are service marks of Dow Jones Trademark Holdings LLC (“Dow Jones”); have been licensed to CME Group Index Services LLC (“CME Indexes”); and have been sublicensed for use for certain purposes by Global Index Advisors, Inc., and Wells Fargo Funds Management, LLC. The Wells Fargo Advantage Dow Jones Target Date FundsSM, based on the Dow Jones Target Date Indexes, are not sponsored, endorsed, sold, or promoted by Dow Jones, CME Indexes, or their respective affiliates, and none of them makes any representation regarding the advisability of investing in such product(s).
NOT FDIC INSURED ¡ NO BANK GUARANTEE ¡ MAY LOSE VALUE
Not part of the semi-annual report.
Wells Fargo Advantage Funds offers more than 110 mutual funds across a wide range of asset classes, representing over $226 billion in assets under management, as of January 31, 2013.
| | | | |
| Equity funds | | | | |
Asia Pacific Fund | | Enterprise Fund† | | Opportunity Fund† |
C&B Large Cap Value Fund | | Global Opportunities Fund | | Precious Metals Fund |
C&B Mid Cap Value Fund | | Growth Fund | | Premier Large Company Growth Fund |
Capital Growth Fund | | Index Fund | | Small Cap Opportunities Fund |
Common Stock Fund | | International Equity Fund | | Small Cap Value Fund |
Disciplined U.S. Core Fund | | International Value Fund | | Small Company Growth Fund |
Discovery Fund† | | Intrinsic Small Cap Value Fund | | Small Company Value Fund |
Diversified Equity Fund | | Intrinsic Value Fund | | Small/Mid Cap Value Fund |
Diversified International Fund | | Intrinsic World Equity Fund | | Special Mid Cap Value Fund |
Emerging Growth Fund | | Large Cap Core Fund | | Special Small Cap Value Fund |
Emerging Markets Equity Fund | | Large Cap Growth Fund | | Specialized Technology Fund |
Emerging Markets Equity Income Fund | | Large Company Value Fund | | Traditional Small Cap Growth Fund |
Endeavor Select Fund† | | Omega Growth Fund | | Utility and Telecommunications Fund |
| Bond funds | | | | |
Adjustable Rate Government Fund | | High Yield Municipal Bond Fund | | Short Duration Government Bond Fund |
California Limited-Term Tax-Free Fund | | Income Plus Fund | | Short-Term Bond Fund |
California Tax-Free Fund | | Inflation-Protected Bond Fund | | Short-Term High Yield Bond Fund |
Colorado Tax-Free Fund | | Intermediate Tax/AMT-Free Fund | | Short-Term Municipal Bond Fund |
Core Bond Fund | | International Bond Fund | | Strategic Income Fund |
Emerging Markets Local Bond Fund | | Minnesota Tax-Free Fund | | Strategic Municipal Bond Fund |
Government Securities Fund | | Municipal Bond Fund | | Ultra Short-Term Income Fund |
High Income Fund | | North Carolina Tax-Free Fund | | Ultra Short-Term Municipal Income Fund |
High Yield Bond Fund | | Pennsylvania Tax-Free Fund | | Wisconsin Tax-Free Fund |
| Asset allocation funds | | | | |
Absolute Return Fund | | WealthBuilder Equity Portfolio† | | Target 2020 Fund† |
Asset Allocation Fund | | WealthBuilder Growth Allocation Portfolio† | | Target 2025 Fund† |
Conservative Allocation Fund | | WealthBuilder Growth Balanced Portfolio† | | Target 2030 Fund† |
Diversified Capital Builder Fund | | WealthBuilder Moderate Balanced Portfolio† | | Target 2035 Fund† |
Diversified Income Builder Fund | | WealthBuilder Tactical Equity Portfolio† | | Target 2040 Fund† |
Growth Balanced Fund | | Target Today Fund† | | Target 2045 Fund† |
Index Asset Allocation Fund | | Target 2010 Fund† | | Target 2050 Fund† |
Moderate Balanced Fund | | Target 2015 Fund† | | Target 2055 Fund† |
WealthBuilder Conservative Allocation Portfolio† | | | | |
| Money market funds | | | | |
100% Treasury Money Market Fund | | Heritage Money Market Fund† | | National Tax-Free Money Market Fund |
California Municipal Money Market Fund | | Money Market Fund | | Treasury Plus Money Market Fund |
Cash Investment Money Market Fund | | Municipal Cash Management Money Market Fund | | |
Government Money Market Fund | | Municipal Money Market Fund | | |
| Variable trust funds1 | | | | |
VT Discovery Fund† | | VT Intrinsic Value Fund | | VT Small Cap Growth Fund |
VT Index Asset Allocation Fund | | VT Omega Growth Fund | | VT Small Cap Value Fund |
VT International Equity Fund | | VT Opportunity Fund† | | VT Total Return Bond Fund |
An investment in a money market fund is not insured or guaranteed by the Federal Deposit Insurance Corporation or any other government agency. Although the Wells Fargo Advantage Money Market Funds seek to preserve the value of your investment at $1.00 per share, it is possible to lose money by investing in a money market fund.
| 1. | The variable trust funds are generally available only through insurance company variable contracts. |
| † | In this report, the Wells Fargo Advantage Discovery FundSM, Wells Fargo Advantage Endeavor Select FundSM, Wells Fargo Advantage Enterprise FundSM, Wells Fargo Advantage Opportunity FundSM, Wells Fargo Advantage WealthBuilder Conservative Allocation PortfolioSM, Wells Fargo Advantage WealthBuilder Equity PortfolioSM, Wells Fargo Advantage WealthBuilder Growth Allocation PortfolioSM, Wells Fargo Advantage WealthBuilder Growth Balanced PortfolioSM, Wells Fargo Advantage WealthBuilder Moderate Balanced PortfolioSM, Wells Fargo Advantage WealthBuilder Tactical Equity PortfolioSM, Wells Fargo Advantage Dow Jones Target Today FundSM, Wells Fargo Advantage Dow Jones Target 2010 FundSM, Wells Fargo Advantage Dow Jones Target 2015 FundSM, Wells Fargo Advantage Dow Jones Target 2020 FundSM, Wells Fargo Advantage Dow Jones Target 2025 FundSM, Wells Fargo Advantage Dow Jones Target 2030 FundSM, Wells Fargo Advantage Dow Jones Target 2035 FundSM, Wells Fargo Advantage Dow Jones Target 2040 FundSM, Wells Fargo Advantage Dow Jones Target 2045 FundSM, Wells Fargo Advantage Dow Jones Target 2050 FundSM, Wells Fargo Advantage Dow Jones Target 2055 FundSM, Wells Fargo Advantage Heritage Money Market FundSM, Wells Fargo Advantage VT Discovery FundSM, and Wells Fargo Advantage VT Opportunity FundSM are referred to as the Discovery Fund, Endeavor Select Fund, Enterprise Fund, Opportunity Fund, WealthBuilder Conservative Allocation Portfolio, WealthBuilder Equity Portfolio, WealthBuilder Growth Allocation Portfolio, WealthBuilder Growth Balanced Portfolio, WealthBuilder Moderate Balanced Portfolio, WealthBuilder Tactical Equity Portfolio, Target Today Fund, Target 2010 Fund, Target 2015 Fund, Target 2020 Fund, Target 2025 Fund, Target 2030 Fund, Target 2035 Fund, Target 2040 Fund, Target 2045 Fund, Target 2050 Fund, Target 2055 Fund, Heritage Money Market Fund, VT Discovery Fund, and VT Opportunity Fund, respectively. |
Not part of the semi-annual report.
| | | | |
| 2 | | Wells Fargo Advantage Growth Fund | | Letter to shareholders (unaudited) |

Karla M. Rabusch
President
Wells Fargo Advantage Funds
Entering the period, concerns about the eurozone sovereign debt situation held center stage as investors again focused on economic weakness in southern European economies.
Aggressive central bank actions helped support stock prices, as did relatively solid economic data.
Dear Valued Shareholder:
We are pleased to offer you this semi-annual report for the Wells Fargo Advantage Growth Fund for the six-month period that ended January 31, 2013. Much of the period was marked by continued concerns about the possible effects that the ongoing European sovereign debt crisis would have on the global economy. However, relatively solid economic data in the U.S. and efforts by European authorities to address the sovereign debt issue alleviated investor fears and supported global stock markets. Judging by various indexes, U.S. large-cap stocks underperformed small-cap stocks. Within the large-cap universe, value stocks outperformed growth stocks, partly because of strong performance from the financials sector.
The period was dominated by worries that ongoing debt problems in the eurozone would affect global economic growth.
Entering the period, concerns about the eurozone sovereign debt situation held center stage as investors again focused on economic weakness in southern European economies. Because many eurozone banks owned southern European debt and many U.S. banks had financial ties to eurozone banks, investors worried about the effects of a possible southern European debt default on the global financial system and economy. Ongoing weakness in the Greek economy made it difficult for the country to meet previously agreed upon austerity targets. Toward the end of the reporting period, political risk resurfaced in both Italy and Spain. In Italy, Prime Minister Mario Monti, an economist who was appointed to implement austerity measures and labor market reforms, resigned in December 2012. Monti later decided to run for office in the general election scheduled for February 2013.
European leaders took concerted action to calm investor concerns. In September 2012, the European Central Bank (ECB) announced that it would purchase an unlimited amount of one-to three-year sovereign debt from countries that had applied for a formal bailout through either the European Financial Stability Facility or the European Stability Mechanism. In another positive sign, in late November 2012, finance ministers from the 17-country eurozone and the International Monetary Fund struck a deal aimed at reducing Greece’s debt by the year 2020.
Central banks continued to provide stimulus.
Major central banks, including the U.S. Federal Reserve (Fed) and the ECB, continued to inject liquidity into the banks and the markets through various quantitative easing policies. Throughout the reporting period, the Federal Open Market Committee (FOMC) kept its key interest rates effectively at zero in order to support the economy and the financial system. The ECB was similarly aggressive, keeping its key rate at a historic low of 0.75%. Just prior to the beginning of the reporting period, the FOMC announced its intention to keep interest rates low until at least mid-2015 in order to support the sluggish economy. The Fed also announced open-ended purchases of $40 billion per month in mortgage-backed securities in an effort to support the housing market.
Stock markets posted solid gains in an eventful period.
Aggressive central bank actions helped support stock prices, as did relatively solid economic data. For much of the reporting period, the U.S. stock market benefited from favorable gross domestic product (GDP) data, with the growth rate improving from 1.3% (annualized) in the second quarter of 2012 to 3.1% (annualized) in the third quarter of 2012. However, the GDP growth rate slowed in the final months of 2012, with GDP growth coming in at 0.1% (annualized) in the fourth quarter of 2012. Because many investors attributed the weak number to the aftereffects of Hurricane Sandy on the eastern seaboard, the stock market remained resilient.
| | | | | | |
| Letter to shareholders (unaudited) | | Wells Fargo Advantage Growth Fund | | | 3 | |
The steady improvement in the housing market supported investor sentiment. The National Association of Home Builders/First American Improving Markets Index identifies metro areas that have shown improvement from their respective troughs in housing permits, employment, and house prices for at least six consecutive months. The index rose for a fifth-consecutive month in January 2013, indicating improvements in 242 housing markets across the country. As a result, housing-related stocks strongly outperformed over the period, leading to better-than-index returns for sectors ranging from consumer discretionary (home improvement retailers), to materials (construction material providers), and to financials (mortgage lenders).
Throughout the period, a continued high unemployment rate was the main negative piece of U.S. economic data. Although the unemployment rate improved from 8.1% in August 2012 to 7.9% in January 2013, the labor market remained soft.
We remain committed to our investment strategies, even as many variables are at work in the market.
The full effect of the European credit crisis remains unknown. Elevated unemployment and debt defaults continue to pressure consumers and businesses alike. As a whole, Wells Fargo Advantage Funds represents investments across a range of asset classes and investment styles, giving you an opportunity to create a diversified investment portfolio. While diversification may not prevent losses in a downturn, we believe it helps manage risk.
Thank you for choosing to invest with Wells Fargo Advantage Funds. We appreciate your confidence in us and remain committed to helping you meet your financial needs. For current information about your fund investments, contact your investment professional, visit our website at wellsfargoadvantagefunds.com, or call us directly at 1-800-222-8222. We are available 24 hours a day, 7 days a week.
Sincerely,

Karla M. Rabusch
President
Wells Fargo Advantage Funds
Notice to shareholders
At its November 6-7, 2012 meeting, the Board of Trustees unanimously approved the following modifications to certain Class A sales load waiver privileges, with each change becoming effective on July 1, 2013:
| | n | | Annuity payments received under an annuity option or from death proceeds will no longer qualify for net asset value (NAV) repurchase privileges. | |
| | n | | The ability to reinvest redemption proceeds at NAV will be reduced from 120 days to 90 days. | |
| | n | | NAV purchase privileges for certain types of “grandfathered” shareholders will be modified to remove the ability to purchase Class A shares at NAV, unless those shares are held directly with the Fund. | |
Please contact your investment professional or call us directly at 1-800-222-8222 if you have any questions on this Notice to Shareholders.
| | | | |
| 4 | | Wells Fargo Advantage Growth Fund | | Performance highlights (unaudited) |
The Fund is closed to new investors1
Investment objective
The Fund seeks long-term capital appreciation.
Adviser
Wells Fargo Funds Management, LLC
Subadviser
Wells Capital Management Incorporated
Portfolio managers
Joseph M. Eberhardy, CFA, CPA
Thomas C. Ognar, CFA
Bruce C. Olson, CFA
Average annual total returns2 (%) as of January 31, 2013
| | | | | | | | | | | | | | | | | | | | | | | | | | | | | | | | | | |
| | | | | Including sales charge | | | Excluding sales charge | | | Expense ratios3 (%) | |
| | | Inception date | | 1 year | | | 5 year | | | 10 year | | | 1 year | | | 5 year | | | 10 year | | | Gross | | | Net4 | |
| Class A (SGRAX) | | 2-24-2000 | | | 8.06 | | | | 9.06 | | | | 12.01 | | | | 14.66 | | | | 10.36 | | | | 12.67 | | | | 1.21 | | | | 1.21 | |
| Class C (WGFCX) | | 12-26-2002 | | | 12.80 | | | | 9.54 | | | | 11.84 | | | | 13.80 | | | | 9.54 | | | | 11.84 | | | | 1.96 | | | | 1.96 | |
| Administrator Class (SGRKX) | | 8-30-2002 | | | – | | | | – | | | | – | | | | 14.90 | | | | 10.68 | | | | 13.08 | | | | 1.05 | | | | 0.97 | |
| Institutional Class (SGRNX) | | 2-24-2000 | | | – | | | | – | | | | – | | | | 15.15 | | | | 10.87 | | | | 13.24 | | | | 0.78 | | | | 0.76 | |
| Investor Class (SGROX) | | 12-31-1993 | | | – | | | | – | | | | – | | | | 14.58 | | | | 10.26 | | | | 12.57 | | | | 1.28 | | | | 1.28 | |
| Russell 3000® Growth Index5 | | – | | | – | | | | – | | | | – | | | | 13.44 | | | | 5.79 | | | | 8.43 | | | | – | | | | – | |
Figures quoted represent past performance, which is no guarantee of future results and do not reflect the deduction of taxes that a shareholder may pay on fund distributions or the redemption of fund shares. Investment return and principal value of an investment will fluctuate so that an investor’s shares, when redeemed, may be worth more or less than their original cost. Performance shown without sales charges would be lower if sales charges were reflected. Current performance may be lower or higher than the performance data quoted and assumes the reinvestment of dividends and capital gains. Current month-end performance is available on the Fund’s website, wellsfargoadvantagefunds.com.
Index returns do not include transaction costs associated with buying and selling securities, any mutual fund fees or expenses, or any taxes. It is not possible to invest directly in an index.
For Class A shares, the maximum front-end sales charge is 5.75%. For Class C shares, the maximum contingent deferred sales charge is 1.00%. Performance including sales charge assumes the sales charge for the corresponding time period. Administrator Class, Institutional Class, and Investor Class shares are sold without a front-end sales charge or contingent deferred sales charge.
Stock values fluctuate in response to the activities of individual companies and general market and economic conditions. Certain investment strategies tend to increase the total risk of an investment (relative to the broader market). The Fund is exposed to foreign investment risk. Consult the Fund’s prospectus for additional information on these and other risks.
Please see footnotes on page 5.
| | | | | | |
| Performance highlights (unaudited) | | Wells Fargo Advantage Growth Fund | | | 5 | |
| | | | |
| Ten largest equity holdings5 (%) as of January 31, 2013 | |
Apple Incorporated | | | 4.45 | |
eBay Incorporated | | | 3.67 | |
Google Incorporated Class A | | | 3.49 | |
Cognizant Technology Solutions Corporation Class A | | | 3.12 | |
Whole Foods Market Incorporated | | | 2.84 | |
Alexion Pharmaceuticals Incorporated | | | 2.63 | |
Kansas City Southern Railway Company | | | 2.57 | |
Rackspace Hosting Incorporated | | | 2.55 | |
Dollar Tree Incorporated | | | 2.47 | |
Tractor Supply Company | | | 2.19 | |
| | |
| Sector distribution6 as of January 31, 2013 |
|
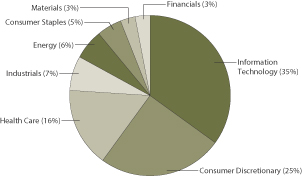
|
| 1. | Please see the Statement of Additional Information for further details. |
| 2. | Historical performance shown for the Administrator Class shares prior to their inception reflects the performance of the Investor Class shares, and includes the higher expenses applicable to the Investor Class shares. If these expenses had not been included, returns would be higher. Historical performance shown for the Class C shares prior to their inception reflects the performance of the Investor Class shares, adjusted to reflect the higher expenses applicable to Class C shares. Effective June 20, 2008, the Advisor Class was renamed Class A and modified to assume the features and attributes of Class A. Historical performance shown for the Class A shares through June 20, 2008, includes Advisor Class expenses. |
| 3. | Reflects the expense ratios as stated in the most recent prospectuses. |
| 4. | The Adviser has committed through November 30, 2013, to waive fees and/or reimburse expenses to the extent necessary to cap the Fund’s Total Annual Fund Operating Expenses After Fee Waiver, excluding certain expenses, at 1.21% for Class A, 1.96% for Class C, 0.96% for Administrator Class, 0.75% for Institutional Class, and 1.27% for Investor Class. Brokerage commissions, stamp duty fees, interest, taxes, acquired fund fees and expenses, and extraordinary expenses are excluded from the cap. Without this cap, the Fund’s returns would have been lower. |
| 5. | The Russell 3000® Growth Index measures the performance of those Russell 3000® Index companies with higher price-to-book ratios and higher forecasted growth values. The stocks in this index are also members of either the Russell 1000® Growth Index or the Russell 2000® Growth Index. You cannot invest directly in an index. |
| 6. | The ten largest equity holdings are calculated based on the value of the securities divided by total net assets of the Fund. Holdings are subject to change and may have changed since the date specified. |
| 7. | Sector distribution is subject to change and is calculated based on the total long-term investments of the Fund. |
| | | | |
| 6 | | Wells Fargo Advantage Growth Fund | | Fund expenses (unaudited) |
As a shareholder of the Fund, you incur two types of costs: (1) transaction costs, including sales charges (loads) on purchase payments and contingent deferred sales charges (if any) on redemptions and (2) ongoing costs, including management fees, distribution (12b-1) and/or shareholder service fees, and other Fund expenses. This example is intended to help you understand your ongoing costs (in dollars) of investing in the Fund and to compare these costs with the ongoing costs of investing in other mutual funds.
The example is based on an investment of $1,000 invested at the beginning of the six-month period and held for the entire period from August 1, 2012 to January 31, 2013.
Actual expenses
The “Actual” line of the table below provides information about actual account values and actual expenses. You may use the information in this line, together with the amount you invested, to estimate the expenses that you paid over the period. Simply divide your account value by $1,000 (for example, an $8,600 account value divided by $1,000 = 8.6), then multiply the result by the number in the “Actual” line under the heading entitled “Expenses paid during period” for your applicable class of shares to estimate the expenses you paid on your account during this period.
Hypothetical example for comparison purposes
The “Hypothetical” line of the table below provides information about hypothetical account values and hypothetical expenses based on the Fund’s actual expense ratio and an assumed rate of return of 5% per year before expenses, which is not the Fund’s actual return. The hypothetical account values and expenses may not be used to estimate the actual ending account balance or expenses you paid for the period. You may use this information to compare the ongoing costs of investing in the Fund and other funds. To do so, compare this 5% hypothetical example with the 5% hypothetical examples that appear in the shareholder reports of the other funds.
Please note that the expenses shown in the table are meant to highlight your ongoing costs only and do not reflect any transactional costs, such as sales charges (loads) and contingent deferred sales charges. Therefore, the “Hypothetical” line of the table is useful in comparing ongoing costs only and will not help you determine the relative total costs of owning different funds. In addition, if these transactional costs were included, your costs would have been higher.
| | | | | | | | | | | | | | | | |
| | | Beginning
account value
8-1-2012 | | | Ending
account value 1-31-2013 | | | Expenses
paid during the period1 | | | Net annual
expense ratio | |
Class A | | | | | | | | | | | | | | | | |
Actual | | $ | 1,000.00 | | | $ | 1,105.42 | | | $ | 6.32 | | | | 1.19 | % |
Hypothetical (5% return before expenses) | | $ | 1,000.00 | | | $ | 1,019.21 | | | $ | 6.06 | | | | 1.19 | % |
Class C | | | | | | | | | | | | | | | | |
Actual | | $ | 1,000.00 | | | $ | 1,101.35 | | | $ | 10.28 | | | | 1.94 | % |
Hypothetical (5% return before expenses) | | $ | 1,000.00 | | | $ | 1,015.43 | | | $ | 9.86 | | | | 1.94 | % |
Administrator Class | | | | | | | | | | | | | | | | |
Actual | | $ | 1,000.00 | | | $ | 1,106.75 | | | $ | 5.10 | | | | 0.96 | % |
Hypothetical (5% return before expenses) | | $ | 1,000.00 | | | $ | 1,020.37 | | | $ | 4.89 | | | | 0.96 | % |
Institutional Class | | | | | | | | | | | | | | | | |
Actual | | $ | 1,000.00 | | | $ | 1,108.04 | | | $ | 3.99 | | | | 0.75 | % |
Hypothetical (5% return before expenses) | | $ | 1,000.00 | | | $ | 1,021.42 | | | $ | 3.82 | | | | 0.75 | % |
Investor Class | | | | | | | | | | | | | | | | |
Actual | | $ | 1,000.00 | | | $ | 1,105.11 | | | $ | 6.63 | | | | 1.25 | % |
Hypothetical (5% return before expenses) | | $ | 1,000.00 | | | $ | 1,018.90 | | | $ | 6.36 | | | | 1.25 | % |
| 1. | Expenses paid is equal to the annualized expense ratio of each class multiplied by the average account value over the period, multiplied by the number of days in the most recent fiscal half-year divided by the number of days in the fiscal year (to reflect the one-half-year period). |
| | | | | | |
| Portfolio of investments—January 31, 2013 (unaudited) | | Wells Fargo Advantage Growth Fund | | | 7 | |
| | | | | | | | | | | | |
| Security name | | | | | | Shares | | | Value | |
| | | | | | | | | | | | |
| | | | |
Common Stocks: 99.66% | | | | | | | | | | | | |
| | | | |
Consumer Discretionary: 25.22% | | | | | | | | | | | | |
| | | | |
| Auto Components: 0.19% | | | | | | | | | | | | |
BorgWarner Incorporated Ǡ | | | | | | | 277,300 | | | $ | 20,570,114 | |
| | | | | | | | | | | | |
| | | | |
| Distributors: 0.54% | | | | | | | | | | | | |
LKQ Corporation † | | | | | | | 2,575,000 | | | | 57,654,250 | |
| | | | | | | | | | | | |
| | | | |
| Hotels, Restaurants & Leisure: 3.56% | | | | | | | | | | | | |
Chipotle Mexican Grill Incorporated Ǡ | | | | | | | 512,000 | | | | 157,189,120 | |
Life Time Fitness Incorporated Ǡ**(l) | | | | | | | 2,635,000 | | | | 133,673,550 | |
McDonald’s Corporation | | | | | | | 375,000 | | | | 35,733,750 | |
Starbucks Corporation | | | | | | | 984,000 | | | | 55,222,080 | |
| | | | |
| | | | | | | | | | | 381,818,500 | |
| | | | | | | | | | | | |
| | | | |
| Internet & Catalog Retail: 4.70% | | | | | | | | | | | | |
Amazon.com Incorporated † | | | | | | | 684,000 | | | | 181,602,000 | |
HomeAway Incorporated Ǡ**(l) | | | | | | | 4,290,000 | | | | 102,831,300 | |
priceline.com Incorporated † | | | | | | | 180,000 | | | | 123,384,600 | |
Shutterfly Incorporated Ǡ**(l) | | | | | | | 2,925,000 | | | | 96,759,000 | |
| | | | |
| | | | | | | | | | | 504,576,900 | |
| | | | | | | | | | | | |
| | | | |
| Multiline Retail: 3.42% | | | | | | | | | | | | |
Dollar General Corporation † | | | | | | | 2,225,000 | | | | 102,839,500 | |
Dollar Tree Incorporated † | | | | | | | 6,625,000 | | | | 264,933,750 | |
| | | | |
| | | | | | | | | | | 367,773,250 | |
| | | | | | | | | | | | |
| | | | |
| Specialty Retail: 10.25% | | | | | | | | | | | | |
CarMax Incorporated † | | | | | | | 4,676,000 | | | | 184,327,920 | |
Dick’s Sporting Goods Incorporated | | | | | | | 2,260,000 | | | | 107,553,400 | |
DSW Incorporated Class A « | | | | | | | 836,600 | | | | 55,993,638 | |
GNC Holdings Incorporated Class A | | | | | | | 4,165,000 | | | | 149,690,100 | |
Hibbett Sports Incorporated Ǡ | | | | | | | 500,000 | | | | 26,330,000 | |
Tractor Supply Company | | | | | | | 2,265,000 | | | | 234,812,550 | |
Ulta Salon Cosmetics & Fragrance Incorporated | | | | | | | 1,950,000 | | | | 190,749,000 | |
Vitamin Shoppe Incorporated Ǡ**(l) | | | | | | | 2,475,000 | | | | 151,173,000 | |
| | | | |
| | | | | | | | | | | 1,100,629,608 | |
| | | | | | | | | | | | |
| | | | |
| Textiles, Apparel & Luxury Goods: 2.56% | | | | | | | | | | | | |
lululemon athletica incorporated Ǡ | | | | | | | 2,150,000 | | | | 148,350,000 | |
Michael Kors Holdings Limited † | | | | | | | 1,172,000 | | | | 65,784,360 | |
Under Armour Incorporated Class A Ǡ | | | | | | | 1,186,000 | | | | 60,331,820 | |
| | | | |
| | | | | | | | | | | 274,466,180 | |
| | | | | | | | | | | | |
| | | | |
Consumer Staples: 5.16% | | | | | | | | | | | | |
| | | | |
| Beverages: 0.42% | | | | | | | | | | | | |
Monster Beverage Corporation † | | | | | | | 950,000 | | | | 45,505,000 | |
| | | | | | | | | | | | |
The accompanying notes are an integral part of these financial statements.
| | | | |
| 8 | | Wells Fargo Advantage Growth Fund | | Portfolio of investments—January 31, 2013 (unaudited) |
| | | | | | | | | | | | |
| Security name | | | | | | Shares | | | Value | |
| | | | | | | | | | | | |
| | | | |
| Food & Staples Retailing: 4.44% | | | | | | | | | | | | |
The Fresh Market Incorporated Ǡ**(l) | | | | | | | 3,515,000 | | | $ | 171,848,350 | |
Whole Foods Market Incorporated | | | | | | | 3,170,000 | | | | 305,112,500 | |
| | | | |
| | | | | | | | | | | 476,960,850 | |
| | | | | | | | | | | | |
| | | | |
| Personal Products: 0.30% | | | | | | | | | | | | |
Estee Lauder Companies Incorporated Class A | | | | | | | 525,000 | | | | 31,988,250 | |
| | | | | | | | | | | | |
| | | | |
Energy: 5.32% | | | | | | | | | | | | |
| | | | |
| Energy Equipment & Services: 0.52% | | | | | | | | | | | | |
Schlumberger Limited | | | | | | | 714,700 | | | | 55,782,335 | |
| | | | | | | | | | | | |
| | | | |
| Oil, Gas & Consumable Fuels: 4.80% | | | | | | | | | | | | |
Concho Resources Incorporated † | | | | | | | 2,250,000 | | | | 205,245,000 | |
Continental Resources Incorporated † | | | | | | | 35,000 | | | | 2,909,200 | |
Energy XXI (Bermuda) Limited « | | | | | | | 2,960,000 | | | | 92,707,200 | |
Oasis Petroleum Incorporated † | | | | | | | 648,000 | | | | 23,250,240 | |
Pioneer Natural Resources Company | | | | | | | 1,625,000 | | | | 191,002,500 | |
| | | | |
| | | | | | | | | | | 515,114,140 | |
| | | | | | | | | | | | |
| | | | |
Financials: 3.27% | | | | | | | | | | | | |
| | | | |
| Capital Markets: 1.90% | | | | | | | | | | | | |
Financial Engines Incorporated Ǡ | | | | | | | 2,090,000 | | | | 69,513,400 | |
TD Ameritrade Holding Corporation « | | | | | | | 6,900,000 | | | | 133,791,000 | |
| | | | |
| | | | | | | | | | | 203,304,400 | |
| | | | | | | | | | | | |
| | | | |
| Consumer Finance: 1.37% | | | | | | | | | | | | |
American Express Company | | | | | | | 2,505,000 | | | | 147,319,050 | |
| | | | | | | | | | | | |
| | | | |
Health Care: 16.07% | | | | | | | | | | | | |
| | | | |
| Biotechnology: 6.33% | | | | | | | | | | | | |
Alexion Pharmaceuticals Incorporated † | | | | | | | 3,000,000 | | | | 281,970,000 | |
Biogen Idec Incorporated † | | | | | | | 345,000 | | | | 53,847,600 | |
BioMarin Pharmaceutical Incorporated Ǡ | | | | | | | 647,000 | | | | 35,513,830 | |
Celgene Corporation † | | | | | | | 2,000,000 | | | | 197,920,000 | |
Gilead Sciences Incorporated † | | | | | | | 470,000 | | | | 18,541,500 | |
Medivation Incorporated † | | | | | | | 411,000 | | | | 22,341,960 | |
Onyx Pharmaceuticals Incorporated Ǡ | | | | | | | 890,000 | | | | 68,992,800 | |
| | | | |
| | | | | | | | | | | 679,127,690 | |
| | | | | | | | | | | | |
| | | | |
| Health Care Equipment & Supplies: 2.86% | | | | | | | | | | | | |
Covidien plc | | | | | | | 1,435,300 | | | | 89,476,602 | |
Intuitive Surgical Incorporated † | | | | | | | 254,100 | | | | 145,949,958 | |
NxStage Medical Incorporated Ǡ | | | | | | | 2,425,000 | | | | 28,372,500 | |
Volcano Corporation Ǡ | | | | | | | 1,713,600 | | | | 42,908,544 | |
| | | | |
| | | | | | | | | | | 306,707,604 | |
| | | | | | | | | | | | |
| | | | |
| Health Care Providers & Services: 1.92% | | | | | | | | | | | | |
AmerisourceBergen Corporation « | | | | | | | 2,382,000 | | | | 108,071,340 | |
The accompanying notes are an integral part of these financial statements.
| | | | | | |
| Portfolio of investments—January 31, 2013 (unaudited) | | Wells Fargo Advantage Growth Fund | | | 9 | |
| | | | | | | | | | | | |
| Security name | | | | | | Shares | | | Value | |
| | | | | | | | | | | | |
| | | | |
| Health Care Providers & Services (continued) | | | | | | | | | | | | |
Catamaran Corporation † | | | | | | | 1,582,000 | | | $ | 82,089,980 | |
Express Scripts Holding Corporation † | | | | | | | 300,000 | | | | 16,026,000 | |
| | | | |
| | | | | | | | | | | 206,187,320 | |
| | | | | | | | | | | | |
| | | | |
| Health Care Technology: 1.85% | | | | | | | | | | | | |
Cerner Corporation Ǡ | | | | | | | 2,400,000 | | | | 198,120,000 | |
| | | | | | | | | | | | |
| | | | |
| Life Sciences Tools & Services: 1.20% | | | | | | | | | | | | |
Mettler-Toledo International Incorporated Ǡ | | | | | | | 607,000 | | | | 129,005,710 | |
| | | | | | | | | | | | |
| | | | |
| Pharmaceuticals: 1.91% | | | | | | | | | | | | |
Actavis Incorporated † | | | | | | | 105,000 | | | | 9,070,950 | |
Allergan Incorporated | | | | | | | 550,000 | | | | 57,755,500 | |
Shire plc ADR | | | | | | | 1,325,000 | | | | 132,685,500 | |
Zoetis Incorporated † | | | | | | | 225,357 | | | | 5,859,282 | |
| | | | |
| | | | | | | | | | | 205,371,232 | |
| | | | | | | | | | | | |
| | | | |
Industrials: 6.35% | | | | | | | | | | | | |
| | | | |
| Aerospace & Defense: 1.17% | | | | | | | | | | | | |
Precision Castparts Corporation | | | | | | | 362,000 | | | | 66,390,800 | |
United Technologies Corporation | | | | | | | 678,600 | | | | 59,425,002 | |
| | | | |
| | | | | | | | | | | 125,815,802 | |
| | | | | | | | | | | | |
| | | | |
| Air Freight & Logistics: 0.37% | | | | | | | | | | | | |
United Parcel Service Incorporated Class B | | | | | | | 500,000 | | | | 39,645,000 | |
| | | | | | | | | | | | |
| | | | |
| Industrial Conglomerates: 0.50% | | | | | | | | | | | | |
Danaher Corporation | | | | | | | 900,000 | | | | 53,937,000 | |
| | | | | | | | | | | | |
| | | | |
| Machinery: 0.92% | | | | | | | | | | | | |
Flowserve Corporation | | | | | | | 352,000 | | | | 55,183,040 | |
Joy Global Incorporated | | | | | | | 685,000 | | | | 43,271,450 | |
| | | | |
| | | | | | | | | | | 98,454,490 | |
| | | | | | | | | | | | |
| | | | |
| Road & Rail: 3.39% | | | | | | | | | | | | |
J.B. Hunt Transport Services Incorporated | | | | | | | 290,000 | | | | 19,508,300 | |
Kansas City Southern Railway Company | | | | | | | 2,960,000 | | | | 275,605,600 | |
Norfolk Southern Corporation « | | | | | | | 135,000 | | | | 9,297,450 | |
Union Pacific Corporation | | | | | | | 449,000 | | | | 59,025,540 | |
| | | | |
| | | | | | | | | | | 363,436,890 | |
| | | | | | | | | | | | |
| | | | |
Information Technology: 35.05% | | | | | | | | | | | | |
| | | | |
| Communications Equipment: 2.34% | | | | | | | | | | | | |
Aruba Networks Incorporated † | | | | | | | 266,000 | | | | 6,128,640 | |
Cisco Systems Incorporated | | | | | | | 1,750,000 | | | | 35,997,500 | |
Palo Alto Networks Incorporated Ǡ | | | | | | | 600,000 | | | | 33,216,000 | |
QUALCOMM Incorporated | | | | | | | 2,665,100 | | | | 175,976,553 | |
| | | | |
| | | | | | | | | | | 251,318,693 | |
| | | | | | | | | | | | |
The accompanying notes are an integral part of these financial statements.
| | | | |
| 10 | | Wells Fargo Advantage Growth Fund | | Portfolio of investments—January 31, 2013 (unaudited) |
| | | | | | | | | | | | |
| Security name | | | | | | Shares | | | Value | |
| | | | | | | | | | | | |
| | | | |
| Computers & Peripherals: 5.00% | | | | | | | | | | | | |
Apple Incorporated | | | | | | | 1,048,000 | | | $ | 477,164,880 | |
EMC Corporation † | | | | | | | 2,410,000 | | | | 59,310,100 | |
| | | | |
| | | | | | | | | | | 536,474,980 | |
| | | | | | | | | | | | |
| | | | |
| Internet Software & Services: 11.03% | | | | | | | | | | | | |
eBay Incorporated † | | | | | | | 7,050,000 | | | | 394,306,500 | |
Facebook Incorporated Class A † | | | | | | | 555,000 | | | | 17,188,350 | |
Google Incorporated Class A † | | | | | | | 495,000 | | | | 374,066,550 | |
Mercadolibre Incorporated « | | | | | | | 1,410,000 | | | | 124,644,000 | |
Rackspace Hosting Incorporated Ǡ | | | | | | | 3,633,000 | | | | 273,746,550 | |
| | | | |
| | | | | | | | | | | 1,183,951,950 | |
| | | | | | | | | | | | |
| | | | |
| IT Services: 7.40% | | | | | | | | | | | | |
Alliance Data Systems Corporation Ǡ | | | | | | | 864,000 | | | | 136,166,400 | |
Cognizant Technology Solutions Corporation Class A † | | | | | | | 4,290,000 | | | | 335,392,200 | |
MarketAxess Holdings Incorporated | | | | | | | 1,108,000 | | | | 41,893,480 | |
MasterCard Incorporated Class A | | | | | | | 376,000 | | | | 194,918,400 | |
Visa Incorporated Class A « | | | | | | | 540,000 | | | | 85,271,400 | |
| | | | |
| | | | | | | | | | | 793,641,880 | |
| | | | | | | | | | | | |
| | | | |
| Semiconductors & Semiconductor Equipment: 2.54% | | | | | | | | | | | | |
Avago Technologies Limited | | | | | | | 915,000 | | | | 32,729,550 | |
Linear Technology Corporation | | | | | | | 394,500 | | | | 14,446,590 | |
Maxim Integrated Products Incorporated | | | | | | | 1,725,000 | | | | 54,251,250 | |
Microchip Technology Incorporated « | | | | | | | 4,960,000 | | | | 165,912,000 | |
Silicon Laboratories Incorporated † | | | | | | | 128,000 | | | | 5,585,920 | |
| | | | |
| | | | | | | | | | | 272,925,310 | |
| | | | | | | | | | | | |
| | | | |
| Software: 6.74% | | | | | | | | | | | | |
BroadSoft Incorporated †**(l) | | | | | | | 1,750,000 | | | | 59,447,500 | |
Citrix Systems Incorporated † | | | | | | | 335,000 | | | | 24,508,600 | |
Fleetmatics Group plc Ǡ | | | | | | | 652,074 | | | | 16,347,495 | |
Fortinet Incorporated † | | | | | | | 7,278,000 | | | | 171,688,020 | |
Red Hat Incorporated † | | | | | | | 1,505,000 | | | | 83,617,800 | |
Salesforce.com Incorporated Ǡ | | | | | | | 281,000 | | | | 48,368,530 | |
Solarwinds Incorporated † | | | | | | | 1,551,000 | | | | 84,405,420 | |
Sourcefire Incorporated † | | | | | | | 575,100 | | | | 24,499,260 | |
Splunk Incorporated Ǡ | | | | | | | 1,070,000 | | | | 35,267,200 | |
Synchronoss Technologies Incorporated Ǡ | | | | | | | 1,900,000 | | | | 45,239,000 | |
Ultimate Software Group Incorporated † | | | | | | | 1,050,000 | | | | 106,617,000 | |
VMware Incorporated Ǡ | | | | | | | 310,000 | | | | 23,708,800 | |
| | | | |
| | | | | | | | | | | 723,714,625 | |
| | | | | | | | | | | | |
| | | | |
Materials: 3.22% | | | | | | | | | | | | |
| | | | |
| Chemicals: 3.22% | | | | | | | | | | | | |
Airgas Incorporated | | | | | | | 551,000 | | | | 52,477,240 | |
Monsanto Company | | | | | | | 1,237,600 | | | | 125,430,760 | |
Praxair Incorporated | | | | | | | 1,523,000 | | | | 168,093,510 | |
| | | | |
| | | | | | | | | | | 346,001,510 | |
| | | | | | | | | | | | |
| | | | |
Total Common Stocks (Cost $7,918,951,071) | | | | | | | | | | | 10,697,300,513 | |
| | | | | | | | | | | | |
The accompanying notes are an integral part of these financial statements.
| | | | | | |
| Portfolio of investments—January 31, 2013 (unaudited) | | Wells Fargo Advantage Growth Fund | | | 11 | |
| | | | | | | | | | | | | | |
| Security name | | | | | | | Principal | | | Value | |
| | | | | | | | | | | | | | |
| | | | |
Other: 0.02% | | | | | | | | | | | | | | |
Gryphon Funding Limited, Pass-Through Entity (a)(i)(v) | | | | | | | | $ | 4,929,792 | | | $ | 1,676,129 | |
| | | | | | | | | | | | | | |
| | | | |
Total Other (Cost $401,744) | | | | | | | | | | | | | 1,676,129 | |
| | | | | | | | | | | | | | |
| | | | |
| | | Yield | | | | | Shares | | | | |
| | | | |
Short-Term Investments: 9.70% | | | | | | | | | | | | | | |
| | | | |
| Investment Companies: 9.70% | | | | | | | | | | | | | | |
Wells Fargo Advantage Cash Investment Money Market Fund, Select Class (l)(u) | | | 0.14 | % | | | | | 47,459,711 | | | | 47,459,711 | |
Wells Fargo Securities Lending Cash Investments, LLC (l)(r)(u)(v) | | | 0.19 | | | | | | 993,866,578 | | | | 993,866,578 | |
| | | | |
Total Short-Term Investments (Cost $1,041,326,289) | | | | | | | | | | | | | 1,041,326,289 | |
| | | | | | | | | | | | | | |
| | | | | | | | |
Total investments in securities
(Cost $8,960,679,104) * | | | 109.38 | % | | | 11,740,302,931 | |
Other assets and liabilities, net | | | (9.38 | ) | | | (1,006,689,433 | ) |
| | | | | | | | |
| Total net assets | | | 100.00 | % | | $ | 10,733,613,498 | |
| | | | | | | | |
| † | Non-income-earning security |
| « | All or a portion of this security is on loan. |
| ** | Represents an affiliate of the Fund under Section 2(a)(2) and 2(a)(3) of the Investment Company Act of 1940, as amended, as the Fund holds 5% or more of the issuer’s outstanding voting shares. |
| (u) | Rate shown is the 7-day annualized yield at period end. |
| (l) | Investment in an affiliate |
| (v) | Security represents investment of cash collateral received from securities on loan. |
| (r) | The investment company is exempt from registration under Section 3(c)(7) of the Investment Company Act of 1940, as amended. |
| (a) | Security is fair valued by the Management Valuation Team, and in certain instances by the Board of Trustees, in accordance with procedures approved by the Board of Trustees. |
| * | Cost for federal income tax purposes is $8,989,963,557 and unrealized appreciation (depreciation) consists of: |
| | | | |
Gross unrealized appreciation | | $ | 2,850,049,449 | |
Gross unrealized depreciation | | | (99,710,075 | ) |
| | | | |
Net unrealized appreciation | | | $2,750,339,374 | |
The accompanying notes are an integral part of these financial statements.
| | | | |
| 12 | | Wells Fargo Advantage Growth Fund | | Statement of assets and liabilities—January 31, 2013 (unaudited) |
| | | | |
| | | | |
| |
Assets | | | | |
Investments | | | | |
In unaffiliated securities (including securities on loan), at value (see cost below) | | $ | 9,983,243,942 | |
In affiliated securities, at value (see cost below) | | | 1,757,058,989 | |
| | | | |
Total investments, at value (see cost below) | | | 11,740,302,931 | |
Receivable for investments sold | | | 14,709,808 | |
Receivable for Fund shares sold | | | 33,512,224 | |
Receivable for dividends | | | 1,324,355 | |
Receivable for securities lending income | | | 168,825 | |
Prepaid expenses and other assets | | | 388,378 | |
| | | | |
Total assets | | | 11,790,406,521 | |
| | | | |
| |
Liabilities | | | | |
Payable for investments purchased | | | 31,329,209 | |
Payable for Fund shares redeemed | | | 21,664,755 | |
Payable upon receipt of securities loaned | | | 994,268,322 | |
Advisory fee payable | | | 5,373,356 | |
Distribution fees payable | | | 352,688 | |
Due to other related parties | | | 2,066,337 | |
Accrued expenses and other liabilities | | | 1,738,356 | |
| | | | |
Total liabilities | | | 1,056,793,023 | |
| | | | |
Total net assets | | $ | 10,733,613,498 | |
| | | | |
| |
NET ASSETS CONSIST OF | | | | |
Paid-in capital | | $ | 8,048,725,189 | |
Undistributed net investment loss | | | (7,265,093 | ) |
Accumulated net realized losses on investments | | | (87,470,425 | ) |
Net unrealized gains on investments | | | 2,779,623,827 | |
| | | | |
Total net assets | | $ | 10,733,613,498 | |
| | | | |
| |
COMPUTATION OF NET ASSET VALUE AND OFFERING PRICE PER SHARE1 | | | | |
Net assets – Class A | | $ | 2,387,461,389 | |
Shares outstanding – Class A | | | 57,063,241 | |
Net asset value per share – Class A | | | $41.84 | |
Maximum offering price per share – Class A2 | | | $44.39 | |
Net assets – Class C | | $ | 563,165,875 | |
Shares outstanding – Class C | | | 14,436,713 | |
Net asset value per share – Class C | | | $39.01 | |
Net assets – Administrator Class | | $ | 3,147,003,553 | |
Shares outstanding – Administrator Class | | | 71,583,885 | |
Net asset value per share – Administrator Class | | | $43.96 | |
Net assets – Institutional Class | | $ | 2,385,505,083 | |
Shares outstanding – Institutional Class | | | 52,742,358 | |
Net asset value per share – Institutional Class | | | $45.23 | |
Net assets – Investor Class | | $ | 2,250,477,598 | |
Shares outstanding – Investor Class | | | 53,916,254 | |
Net asset value per share – Investor Class | | | $41.74 | |
| |
Investment in unaffiliated securities (including securities on loan), at cost | | $ | 7,316,541,956 | |
| | | | |
Investments in affiliated securities, at cost | | $ | 1,644,137,148 | |
| | | | |
Total investments, at cost | | $ | 8,960,679,104 | |
| | | | |
Securities on loan, at value | | $ | 972,448,919 | |
| | | | |
| 1. | The Fund has an unlimited number of authorized shares. |
| 2. | Maximum offering price is computed as 100/94.25 of net asset value. On investments of $50,000 or more, the offering price is reduced. |
The accompanying notes are an integral part of these financial statements.
| | | | | | |
| Statement of operations—six months ended January 31, 2013 (unaudited) | | Wells Fargo Advantage Growth Fund | | | 13 | |
| | | | |
| | | | |
| |
Investment income | | | | |
Dividends | | $ | 49,303,873 | |
Securities lending income, net | | | 942,525 | |
Income from affiliated securities | | | 109,708 | |
| | | | |
Total investment income | | | 50,356,106 | |
| | | | |
| |
Expenses | | | | |
Advisory fee | | | 33,280,320 | |
Administration fees | | | | |
Fund level | | | 2,363,232 | |
Class A | | | 3,086,575 | |
Class C | | | 717,162 | |
Administrator Class | | | 1,563,068 | |
Institutional Class | | | 957,449 | |
Investor Class | | | 3,631,437 | |
Shareholder servicing fees | | | | |
Class A | | | 2,967,861 | |
Class C | | | 689,579 | |
Administrator Class | | | 3,826,179 | |
Investor Class | | | 2,831,974 | |
Distribution fees | | | | |
Class C | | | 2,068,735 | |
Custody and accounting fees | | | 279,494 | |
Professional fees | | | 16,494 | |
Registration fees | | | 149,828 | |
Shareholder report expenses | | | 255,438 | |
Trustees’ fees and expenses | | | 6,486 | |
Other fees and expenses | | | 51,874 | |
| | | | |
Total expenses | | | 58,743,185 | |
Less: Fee waivers and/or expense reimbursements | | | (1,121,986 | ) |
| | | | |
Net expenses | | | 57,621,199 | |
| | | | |
Net investment loss | | | (7,265,093 | ) |
| | | | |
| |
REALIZED AND UNREALIZED GAINS (LOSSES) ON INVESTMENTS | | | | |
| |
Net realized gains (losses) on: | | | | |
Unaffiliated securities | | | 172,954,881 | |
Affiliated securities | | | 1,146,448 | |
| | | | |
Net realized gains on investments | | | 174,101,329 | |
| | | | |
| |
Net change in unrealized gains (losses) on: | | | | |
Unaffiliated securities | | | 850,358,008 | |
Affiliated securities | | | 30,106,038 | |
| | | | |
Net change in unrealized gains (losses) on investments | | | 880,464,046 | |
| | | | |
Net realized and unrealized gains (losses) on investments | | | 1,054,565,375 | |
| | | | |
Net increase in net assets resulting from operations | | $ | 1,047,300,282 | |
| | | | |
The accompanying notes are an integral part of these financial statements.
| | | | |
| 14 | | Wells Fargo Advantage Growth Fund | | Statement of changes in net assets |
| | | | | | | | | | | | | | | | |
| | | Six months ended
January 31, 2013
(unaudited) | | | Year ended
July 31, 2012 | |
| | | | |
Operations | | | | | | | | | | | | | | | | |
Net investment loss | | | | | | $ | (7,265,093 | ) | | | | | | $ | (39,036,591 | ) |
Net realized gains (losses) on investments | | | | | | | 174,101,329 | | | | | | | | (225,338,804 | ) |
Net change in unrealized gains (losses) on investments | | | | | | | 880,464,046 | | | | | | | | 939,632,051 | |
| | | | | | | | | | | | | | | | |
Net increase in net assets resulting from operations | | | | | | | 1,047,300,282 | | | | | | | | 675,256,656 | |
| | | | | | | | | | | | | | | | |
| | | | |
Distributions to shareholders from | | | | | | | | | | | | | | | | |
Net realized gains | | | | | | | | | | | | | | | | |
Class A | | | | | | | 0 | | | | | | | | (22,822,266 | ) |
Class C | | | | | | | 0 | | | | | | | | (4,924,744 | ) |
Administrator Class | | | | | | | 0 | | | | | | | | (24,893,217 | ) |
Institutional Class | | | | | | | 0 | | | | | | | | (18,155,514 | ) |
Investor Class | | | | | | | 0 | | | | | | | | (25,630,798 | ) |
| | | | | | | | | | | | | | | | |
Total distributions to shareholders | | | | | | | 0 | | | | | | | | (96,426,539 | ) |
| | | | | | | | | | | | | | | | |
| | | | |
| | | Shares | | | | | | | | Shares | | | | | |
Capital share transactions | | | | | | | | | | | | | | | | |
Proceeds from shares sold | | | | | | | | | | | | | | | | |
Class A | | | 5,928,165 | | | | 236,828,737 | | | | 45,084,569 | | | | 1,609,802,564 | |
Class C | | | 700,529 | | | | 26,309,883 | | | | 9,260,855 | | | | 308,259,538 | |
Administrator Class | | | 12,279,778 | | | | 519,448,866 | | | | 54,655,303 | | | | 2,072,257,753 | |
Institutional Class | | | 9,797,550 | | | | 425,190,324 | | | | 40,423,928 | | | | 1,577,726,976 | |
Investor Class | | | 3,046,857 | | | | 122,055,833 | | | | 27,864,565 | | | | 1,001,221,628 | |
| | | | | | | | | | | | | | | | |
| | | | | | | 1,329,833,643 | | | | | | | | 6,569,268,459 | |
| | | | | | | | | | | | | | | | |
Reinvestment of distributions | | | | | | | | | | | | | | | | |
Class A | | | 0 | | | | 0 | | | | 605,550 | | | | 21,285,084 | |
Class C | | | 0 | | | | 0 | | | | 94,859 | | | | 3,135,087 | |
Administrator Class | | | 0 | | | | 0 | | | | 619,824 | | | | 22,828,128 | |
Institutional Class | | | 0 | | | | 0 | | | | 464,162 | | | | 17,549,951 | |
Investor Class | | | 0 | | | | 0 | | | | 701,493 | | | | 24,615,404 | |
| | | | | | | | | | | | | | | | |
| | | | | | | 0 | | | | | | | | 89,413,654 | |
| | | | | | | | | | | | | | | | |
Payment for shares redeemed | | | | | | | | | | | | | | | | |
Class A | | | (8,730,255 | ) | | | (348,506,406 | ) | | | (19,402,054 | ) | | | (717,639,483 | ) |
Class C | | | (1,092,766 | ) | | | (40,528,582 | ) | | | (1,412,210 | ) | | | (48,291,704 | ) |
Administrator Class | | | (15,833,057 | ) | | | (661,267,538 | ) | | | (15,811,398 | ) | | | (612,739,866 | ) |
Institutional Class | | | (13,687,431 | ) | | | (587,720,879 | ) | | | (10,047,770 | ) | | | (399,055,588 | ) |
Investor Class | | | (7,586,908 | ) | | | (301,440,047 | ) | | | (17,762,906 | ) | | | (640,909,388 | ) |
| | | | | | | | | | | | | | | | |
| | | | | | | (1,939,463,452 | ) | | | | | | | (2,418,636,029 | ) |
| | | | | | | | | | | | | | | | |
Net increase (decrease) in net assets resulting from capital share transactions | | | | | | | (609,629,809 | ) | | | | | | | 4,240,046,084 | |
| | | | | | | | | | | | | | | | |
Total increase in net assets | | | | | | | 437,670,473 | | | | | | | | 4,818,876,201 | |
| | | | | | | | | | | | | | | | |
| | | | |
Net assets | | | | | | | | | | | | | | | | |
Beginning of period | | | | | | | 10,295,943,025 | | | | | | | | 5,477,066,824 | |
| | | | | | | | | | | | | | | | |
End of period | | | | | | $ | 10,733,613,498 | | | | | | | $ | 10,295,943,025 | |
| | | | | | | | | | | | | | | | |
Undistributed net investment income (loss) | | | | | | $ | (7,265,093 | ) | | | | | | $ | 0 | |
| | | | | | | | | | | | | | | | |
The accompanying notes are an integral part of these financial statements.
| | | | | | |
| Financial highlights | | Wells Fargo Advantage Growth Fund | | | 15 | |
(For a share outstanding throughout each period)
| | | | | | | | | | | | | | | | | | | | | | | | |
| | | Six months ended January 31, 2013 (unaudited) | | | Year ended July 31 | |
| CLASS A | | | 2012 | | | 2011 | | | 2010 | | | 2009 | | | 20081 | |
Net asset value, beginning of period | | $ | 37.85 | | | $ | 35.88 | | | $ | 26.10 | | | $ | 21.13 | | | $ | 25.20 | | | $ | 26.36 | |
Net investment loss | | | (0.05 | ) | | | (0.21 | )2 | | | (0.27 | )2 | | | (0.16 | )2 | | | (0.08 | )2 | | | (0.16 | )2 |
Net realized and unrealized gains (losses) on investments | | | 4.04 | | | | 2.65 | | | | 10.05 | | | | 5.13 | | | | (3.99 | ) | | | (1.00 | ) |
| | | | | | | | | | | | | | | | | | | | | | | | |
Total from investment operations | | | 3.99 | | | | 2.44 | | | | 9.78 | | | | 4.97 | | | | (4.07 | ) | | | (1.16 | ) |
Distributions to shareholders from | | | | | | | | | | | | | | | | | | | | | | | | |
Net realized gains | | | 0.00 | | | | (0.47 | ) | | | 0.00 | | | | 0.00 | | | | 0.00 | | | | 0.00 | |
Net asset value, end of period | | $ | 41.84 | | | $ | 37.85 | | | $ | 35.88 | | | $ | 26.10 | | | $ | 21.13 | | | $ | 25.20 | |
Total return3 | | | 10.54 | % | | | 6.93 | % | | | 37.43 | % | | | 23.52 | % | | | (16.15 | )% | | | (4.40 | )% |
Ratios to average net assets (annualized) | | | | | | | | | | | | | | | | | | | | | | | | |
Gross expenses | | | 1.19 | % | | | 1.20 | % | | | 1.24 | % | | | 1.31 | % | | | 1.35 | % | | | 1.35 | % |
Net expenses | | | 1.19 | % | | | 1.20 | % | | | 1.24 | % | | | 1.30 | % | | | 1.29 | % | | | 1.30 | % |
Net investment loss | | | (0.25 | )% | | | (0.56 | )% | | | (0.81 | )% | | | (0.64 | )% | | | (0.44 | )% | | | (0.60 | )% |
Supplemental data | | | | | | | | | | | | | | | | | | | | | | | | |
Portfolio turnover rate | | | 20 | % | | | 47 | % | | | 54 | % | | | 72 | % | | | 88 | % | | | 122 | % |
Net assets, end of period (000s omitted) | | | $2,387,461 | | | | $2,265,845 | | | | $1,204,675 | | | | $163,485 | | | | $46,250 | | | | $34,992 | |
| 1. | Effective June 20, 2008, Advisor Class was renamed Class A. |
| 2. | Calculated based upon average shares outstanding |
| 3. | Total return calculations do not include any sales charges. Returns for periods of less than one year are not annualized. |
The accompanying notes are an integral part of these financial statements.
| | | | |
| 16 | | Wells Fargo Advantage Growth Fund | | Financial highlights |
(For a share outstanding throughout each period)
| | | | | | | | | | | | | | | | | | | | | | | | |
| | | Six months ended January 31, 2013 (unaudited) | | | Year ended July 31 | |
| CLASS C | | | 2012 | | | 2011 | | | 2010 | | | 2009 | | | 2008 | |
Net asset value, beginning of period | | $ | 35.42 | | | $ | 33.86 | | | $ | 24.81 | | | $ | 20.24 | | | $ | 24.30 | | | $ | 25.62 | |
Net investment loss | | | (0.20 | ) | | | (0.46 | )1 | | | (0.51 | )1 | | | (0.34 | )1 | | | (0.21 | )1 | | | (0.35 | )1 |
Net realized and unrealized gains (losses) on investments | | | 3.79 | | | | 2.49 | | | | 9.56 | | | | 4.91 | | | | (3.85 | ) | | | (0.97 | ) |
| | | | | | | | | | | | | | | | | | | | | | | | |
Total from investment operations | | | 3.59 | | | | 2.03 | | | | 9.05 | | | | 4.57 | | | | (4.06 | ) | | | (1.32 | ) |
Distributions to shareholders from | | | | | | | | | | | | | | | | | | | | | | | | |
Net realized gains | | | 0.00 | | | | (0.47 | ) | | | 0.00 | | | | 0.00 | | | | 0.00 | | | | 0.00 | |
Net asset value, end of period | | $ | 39.01 | | | $ | 35.42 | | | $ | 33.86 | | | $ | 24.81 | | | $ | 20.24 | | | $ | 24.30 | |
Total return2 | | | 10.14 | % | | | 6.12 | % | | | 36.44 | % | | | 22.58 | % | | | (16.71 | )% | | | (5.15 | )% |
Ratios to average net assets (annualized) | | | | | | | | | | | | | | | | | | | | | | | | |
Gross expenses | | | 1.94 | % | | | 1.95 | % | | | 1.99 | % | | | 2.06 | % | | | 2.07 | % | | | 2.11 | % |
Net expenses | | | 1.94 | % | | | 1.95 | % | | | 1.99 | % | | | 2.05 | % | | | 2.02 | % | | | 2.05 | % |
Net investment loss | | | (1.00 | )% | | | (1.32 | )% | | | (1.57 | )% | | | (1.40 | )% | | | (1.17 | )% | | | (1.36 | )% |
Supplemental data | | | | | | | | | | | | | | | | | | | | | | | | |
Portfolio turnover rate | | | 20 | % | | | 47 | % | | | 54 | % | | | 72 | % | | | 88 | % | | | 122 | % |
Net assets, end of period (000s omitted) | | | $563,166 | | | | $525,285 | | | | $233,114 | | | | $14,737 | | | | $2,387 | | | | $1,307 | |
| 1. | Calculated based upon average shares outstanding |
| 2. | Total return calculations do not include any sales charges. Returns for periods of less than one year are not annualized. |
The accompanying notes are an integral part of these financial statements.
| | | | | | |
| Financial highlights | | Wells Fargo Advantage Growth Fund | | | 17 | |
(For a share outstanding throughout each period)
| | | | | | | | | | | | | | | | | | | | | | | | |
| | | Six months ended January 31, 2013 (unaudited) | | | Year ended July 31 | |
| ADMINISTRATOR CLASS | | | 2012 | | | 2011 | | | 2010 | | | 2009 | | | 2008 | |
Net asset value, beginning of period | | $ | 39.72 | | | $ | 37.54 | | | $ | 27.24 | | | $ | 21.98 | | | $ | 26.12 | | | $ | 27.23 | |
Net investment income (loss) | | | (0.00 | ) | | | (0.13 | )1 | | | (0.18 | )1 | | | (0.08 | )1 | | | (0.01 | )1 | | | (0.07 | )1 |
Net realized and unrealized gains (losses) on investments | | | 4.24 | | | | 2.78 | | | | 10.48 | | | | 5.34 | | | | (4.13 | ) | | | (1.04 | ) |
| | | | | | | | | | | | | | | | | | | | | | | | |
Total from investment operations | | | 4.24 | | | | 2.65 | | | | 10.30 | | | | 5.26 | | | | (4.14 | ) | | | (1.11 | ) |
Distributions to shareholders from | | | | | | | | | | | | | | | | | | | | | | | | |
Net realized gains | | | 0.00 | | | | (0.47 | ) | | | 0.00 | | | | 0.00 | | | | 0.00 | | | | 0.00 | |
Net asset value, end of period | | $ | 43.96 | | | $ | 39.72 | | | $ | 37.54 | | | $ | 27.24 | | | $ | 21.98 | | | $ | 26.12 | |
Total return2 | | | 10.67 | % | | | 7.15 | % | | | 37.81 | % | | | 23.93 | % | | | (15.85 | )% | | | (4.08 | )% |
Ratios to average net assets (annualized) | | | | | | | | | | | | | | | | | | | | | | | | |
Gross expenses | | | 1.02 | % | | | 1.03 | % | | | 1.08 | % | | | 1.13 | % | | | 1.18 | % | | | 1.17 | % |
Net expenses | | | 0.96 | % | | | 0.96 | % | | | 0.96 | % | | | 0.96 | % | | | 0.96 | % | | | 0.96 | % |
Net investment loss | | | (0.02 | )% | | | (0.33 | )% | | | (0.51 | )% | | | (0.29 | )% | | | (0.07 | )% | | | (0.25 | )% |
Supplemental data | | | | | | | | | | | | | | | | | | | | | | | | |
Portfolio turnover rate | | | 20 | % | | | 47 | % | | | 54 | % | | | 72 | % | | | 88 | % | | | 122 | % |
Net assets, end of period (000s omitted) | | | $3,147,004 | | | | $2,984,775 | | | | $1,339,245 | | | | $414,489 | | | | $196,301 | | | | $109,958 | |
| 1. | Calculated based upon average shares outstanding |
| 2. | Returns for periods of less than one year are not annualized. |
The accompanying notes are an integral part of these financial statements.
| | | | |
| 18 | | Wells Fargo Advantage Growth Fund | | Financial highlights |
(For a share outstanding throughout each period)
| | | | | | | | | | | | | | | | | | | | | | | | |
| | | Six months ended January 31, 2013 (unaudited) | | | Year ended July 31 | |
| INSTITUTIONAL CLASS | | | 2012 | | | 2011 | | | 2010 | | | 2009 | | | 2008 | |
Net asset value, beginning of period | | $ | 40.83 | | | $ | 38.49 | | | $ | 27.88 | | | $ | 22.46 | | | $ | 26.65 | | | $ | 27.74 | |
Net Investment income (loss) | | | 0.04 | 1 | | | (0.05 | )1 | | | (0.12 | )1 | | | (0.03 | )1 | | | 0.01 | 1 | | | (0.03 | )1 |
Net realized and unrealized gains (losses) on investments | | | 4.36 | | | | 2.86 | | | | 10.73 | | | | 5.45 | | | | (4.20 | ) | | | (1.06 | ) |
| | | | | | | | | | | | | | | | | | | | | | | | |
Total from investment operations | | | 4.40 | | | | 2.81 | | | | 10.61 | | | | 5.42 | | | | (4.19 | ) | | | (1.09 | ) |
Distributions to shareholders from | | | | | | | | | | | | | | | | | | | | | | | | |
Net realized gains | | | 0.00 | | | | (0.47 | ) | | | 0.00 | | | | 0.00 | | | | 0.00 | | | | 0.00 | |
Net asset value, end of period | | $ | 45.23 | | | $ | 40.83 | | | $ | 38.49 | | | $ | 27.88 | | | $ | 22.46 | | | $ | 26.65 | |
Total return2 | | | 10.80 | % | | | 7.37 | % | | | 38.06 | % | | | 24.13 | % | | | (15.72 | )% | | | (3.93 | )% |
Ratios to average net assets (annualized) | | | | | | | | | | | | | | | | | | | | | | | | |
Gross expenses | | | 0.76 | % | | | 0.77 | % | | | 0.81 | % | | | 0.86 | % | | | 0.91 | % | | | 0.90 | % |
Net expenses | | | 0.75 | % | | | 0.76 | % | | | 0.80 | % | | | 0.80 | % | | | 0.80 | % | | | 0.80 | % |
Net investment income (loss) | | | 0.18 | % | | | (0.13 | )% | | | (0.35 | )% | | | (0.12 | )% | | | 0.07 | % | | | (0.10 | )% |
Supplemental data | | | | | | | | | | | | | | | | | | | | | | | | |
Portfolio turnover rate | | | 20 | % | | | 47 | % | | | 54 | % | | | 72 | % | | | 88 | % | | | 122 | % |
Net assets, end of period (000s omitted) | | | $2,385,505 | | | | $2,312,074 | | | | $992,748 | | | | $367,360 | | | | $255,282 | | | | $260,671 | |
| 1. | Calculated based upon average shares outstanding |
| 2. | Returns for periods of less than one year are not annualized. |
The accompanying notes are an integral part of these financial statements.
| | | | | | |
| Financial highlights | | Wells Fargo Advantage Growth Fund | | | 19 | |
(For a share outstanding throughout each period)
| | | | | | | | | | | | | | | | | | | | | | | | |
| | | Six months ended January 31, 2013 (unaudited) | | | Year ended July 31 | |
| INVESTOR CLASS | | | 2012 | | | 2011 | | | 2010 | | | 2009 | | | 2008 | |
Net asset value, beginning of period | | $ | 37.77 | | | $ | 35.83 | | | $ | 26.09 | | | $ | 21.14 | | | $ | 25.23 | | | $ | 26.43 | |
Net investment loss | | | (0.06 | )1 | | | (0.23 | )1 | | | (0.28 | )1 | | | (0.17 | )1 | | | (0.10 | )1 | | | (0.20 | )1 |
Net realized and unrealized gains (losses) on investments | | | 4.03 | | | | 2.64 | | | | 10.02 | | | | 5.12 | | | | (3.99 | ) | | | (1.00 | ) |
| | | | | | | | | | | | | | | | | | | | | | | | |
Total from investment operations | | | 3.97 | | | | 2.41 | | | | 9.74 | | | | 4.95 | | | | (4.09 | ) | | | (1.20 | ) |
Distributions to shareholders from | | | | | | | | | | | | | | | | | | | | | | | | |
Net realized gains | | | 0.00 | | | | (0.47 | ) | | | 0.00 | | | | 0.00 | | | | 0.00 | | | | 0.00 | |
Net asset value, end of period | | $ | 41.74 | | | $ | 37.77 | | | $ | 35.83 | | | $ | 26.09 | | | $ | 21.14 | | | $ | 25.23 | |
Total return2 | | | 10.51 | % | | | 6.85 | % | | | 37.29 | % | | | 23.42 | % | | | (16.21 | )% | | | (4.54 | )% |
Ratios to average net assets (annualized) | | | | | | | | | | | | | | | | | | | | | | | | |
Gross expenses | | | 1.25 | % | | | 1.26 | % | | | 1.31 | % | | | 1.41 | % | | | 1.46 | % | | | 1.49 | % |
Net expenses | | | 1.25 | % | | | 1.26 | % | | | 1.31 | % | | | 1.40 | % | | | 1.40 | % | | | 1.44 | % |
Net investment loss | | | (0.30 | )% | | | (0.64 | )% | | | (0.85 | )% | | | (0.71 | )% | | | (0.54 | )% | | | (0.73 | )% |
Supplemental data | | | | | | | | | | | | | | | | | | | | | | | | |
Portfolio turnover rate | | | 20 | % | | | 47 | % | | | 54 | % | | | 72 | % | | | 88 | % | | | 122 | % |
Net assets, end of period (000s omitted) | | | $2,250,478 | | | | $2,207,964 | | | | $1,707,285 | | | | $941,660 | | | | $748,218 | | | | $958,160 | |
| 1. | Calculated based upon average shares outstanding |
| 2. | Returns for periods of less than one year are not annualized. |
The accompanying notes are an integral part of these financial statements.
| | | | |
| 20 | | Wells Fargo Advantage Growth Fund | | Notes to financial statements (unaudited) |
1. ORGANIZATION
Wells Fargo Funds Trust (the “Trust”), a Delaware statutory trust organized on March 10, 1999, is an open-end management investment company registered under the Investment Company Act of 1940, as amended (the “1940 Act”). These financial statements report on Wells Fargo Advantage Growth Fund (the “Fund”) which is a diversified series of the Trust.
2. SIGNIFICANT ACCOUNTING POLICIES
The following significant accounting policies, which are consistently followed in the preparation of the financial statements of the Fund, are in conformity with U.S. generally accepted accounting principles which require management to make estimates and assumptions that affect the reported amounts of assets and liabilities, disclosure of contingent assets and liabilities at the date of the financial statements, and the reported amounts of revenues and expenses during the reporting period. Actual results could differ from those estimates.
Securities valuation
All investments are valued each business day as of the close of regular trading on the New York Stock Exchange (normally 4 p.m. Eastern Time).
Equity securities that are listed on a foreign or domestic exchange, except for The Nasdaq Stock Market, Inc. (“Nasdaq”), are valued at the official closing price or, if none, the last sales price. Securities listed on Nasdaq are valued at the Nasdaq Official Closing Price (“NOCP”). If no NOCP is available, securities are valued at the last sales price. If no sales price is shown on the Nasdaq, the bid price will be used. If no sale occurs on the primary exchange or market for the security that day or if no sale occurs and no bid price is shown on Nasdaq, the prior day’s price will be deemed “stale” and fair values will be determined in accordance with the Fund’s Valuation Procedures.
Investments in registered open-end investment companies are valued at net asset value. Non-registered investment companies are fair valued at net asset value.
Investments which are not valued using any of the methods discussed above are valued at their fair value, as determined by procedures established in good faith and approved by the Board of Trustees. The Board of Trustees has established a Valuation Committee comprised of the Trustees and has delegated to it the authority to take any actions regarding the valuation of portfolio securities that the Valuation Committee deems necessary or appropriate, including determining the fair value of portfolio securities, unless the determination has been delegated to the Management Valuation Team of Wells Fargo Funds Management, LLC (“Funds Management”). The Board of Trustees retains the authority to make or ratify any valuation decisions or approve any changes to the Valuation Procedures as it deems appropriate. On a quarterly basis, the Board of Trustees receives reports on any valuation actions taken by the Valuation Committee or the Management Valuation Team which may include items for ratification.
Valuations of fair valued securities are compared to the next actual sales price when available, or other appropriate market information to assess the continued appropriateness of the fair valuation methodology used. These securities are fair valued on a day-to-day basis, taking into consideration changes to appropriate market information and any significant changes to the input factors considered in the valuation process until there is a readily available price provided on the exchange or by an independent pricing service. Valuations received from an independent pricing service or broker quotes are periodically validated by comparisons to most recent trades and valuations provided by other independent pricing services in addition to the review of prices by the adviser and/or subadviser. Unobservable inputs used in determining fair valuations are identified based on the type of security, taking into consideration factors utilized by market participants in valuing the investment, knowledge about the issuer and the current market environment.
Security loans
The Fund may lend its securities from time to time in order to earn additional income in the form of fees or interest on securities received as collateral or the investment of any cash received as collateral. The Fund continues to receive interest or dividends on the securities loaned. The Fund receives collateral in the form of cash or securities with a value at least equal to the value of the securities on loan. The value of the loaned securities is determined at the close of each business day and any additional required collateral is delivered to the Fund on the next business day. In a securities lending transaction, the net asset value of the Fund will be affected by an increase or decrease in the value of the securities loaned and by an increase or decrease in the value of the instrument in which collateral is invested. The amount of securities lending activity undertaken by the Fund fluctuates from time to time. In the event of default or bankruptcy by the borrower, the Fund may be prevented from recovering the loaned securities or gaining access to the collateral or may experience delays or costs in doing so. In addition, the investment of any cash collateral received may lose all or part of its value. The Fund has the right under the lending agreement to recover the securities from the borrower on demand.
| | | | | | |
| Notes to financial statements (unaudited) | | Wells Fargo Advantage Growth Fund | | | 21 | |
The Fund lends its securities through an unaffiliated securities lending agent. Cash collateral received in connection with its securities lending transactions is invested in Wells Fargo Securities Lending Cash Investments, LLC (the “Cash Collateral Fund”). The Cash Collateral Fund is exempt from registration under Section 3(c)(7) of the 1940 Act and is managed by Funds Management and is subadvised by Wells Capital Management Incorporated (“WellsCap”). Funds Management receives an advisory fee starting at 0.05% and declining to 0.01% as the average daily net assets of the Cash Collateral Fund increase. All of the fees received by Funds Management are paid to WellsCap for its services as subadviser. The Cash Collateral Fund seeks to provide a positive return compared to the daily Fed Funds Open rate by investing in high-quality, U.S. dollar-denominated short-term money market instruments. Cash Collateral Fund investments are fair valued based upon the amortized cost valuation technique. Income earned from investment in the Cash Collateral Fund is included in securities lending income on the Statement of Operations.
Security transactions and income recognition
Securities transactions are recorded on a trade date basis. Realized gains or losses are recorded on the basis of identified cost.
Dividend income is recognized on the ex-dividend date.
Distributions to shareholders
Distributions to shareholders from net investment income and net realized gains, if any, are recorded on the ex-dividend date. Such distributions are determined in conformity with federal income tax regulations, which may differ in amount or character from net investment income and realized gains recognized for purposes of U.S. generally accepted accounting principles.
Federal and other taxes
The Fund intends to continue to qualify as a regulated investment company by distributing substantially all of its investment company taxable income and any net realized capital gains (after reduction for capital loss carryforwards) sufficient to relieve it from all, or substantially all, federal income taxes. Accordingly, no provision for federal income taxes was required.
The Fund’s income and federal excise tax returns and all financial records supporting those returns for the prior three fiscal years are subject to examination by the federal and Delaware revenue authorities. Management has analyzed the Fund’s tax positions taken on federal, state, and foreign tax returns for all open tax years and does not believe that there are any uncertain tax positions that require recognition of a tax liability.
As of July 31, 2012, the Fund had post-enactment capital loss carryforwards (losses incurred in taxable years which began after December 22, 2010) which consist of $219,708,344 in short-term capital losses and $938,115 in long-term capital losses.
Class allocations
The separate classes of shares offered by the Fund differ principally in applicable sales charges, distribution, shareholder servicing, and administration fees. Shareholders of each class bear certain expenses that pertain to that particular class. All shareholders bear the common expenses of the Fund, earn income from the portfolio, and are allocated any unrealized gains and losses pro rata based on the average daily net assets of each class, without distinction between share classes. Dividends are determined separately for each class based on income and expenses allocable to each class. Realized gains and losses are allocated to each class pro rata based upon the net assets of each class on the date realized. Differences in per share dividend rates generally result from the relative weightings of pro rata income and realized gain allocations and from differences in separate class expenses, including distribution, shareholder servicing, and administration fees.
3. FAIR VALUATION MEASUREMENTS
Fair value measurements of investments are determined within a framework that has established a fair value hierarchy based upon the various data inputs utilized in determining the value of the Fund’s investments. The three-level hierarchy gives the highest priority to unadjusted quoted prices in active markets for identical assets or liabilities (Level 1) and the lowest priority to significant unobservable inputs (Level 3). The Fund’s investments are classified within the fair value hierarchy based on the lowest level of input that is significant to the fair value measurement. The inputs are summarized into three broad levels as follows:
| n | | Level 1 – quoted prices in active markets for identical securities |
| n | | Level 2 – other significant observable inputs (including quoted prices for similar securities, interest rates, prepayment speeds, credit risk, use of amortized cost, etc.) |
| n | | Level 3 – significant unobservable inputs (including the Fund’s own assumptions in determining the fair value of investments) |
| | | | |
| 22 | | Wells Fargo Advantage Growth Fund | | Notes to financial statements (unaudited) |
The inputs or methodologies used for valuing investments in securities are not necessarily an indication of the risk associated with investing in those securities.
As of January 31, 2013, the inputs used in valuing investments in securities, which are carried at fair value, were as follows:
| | | | | | | | | | | | | | | | |
| Investments in securities | | Quoted prices (Level 1) | | | Significant other observable Inputs (Level 2) | | | Significant unobservable inputs (Level 3) | | | Total | |
Equity securities | | | | | | | | | | | | | | | | |
Common stocks | | $ | 10,697,300,513 | | | $ | 0 | | | $ | 0 | | | $ | 10,697,300,513 | |
Other | | | 0 | | | | 0 | | | | 1,676,129 | | | | 1,676,129 | |
Short-term investments | | | | | | | | | | | | | | | | |
Investment companies | | | 47,459,711 | | | | 993,866,578 | | | | 0 | | | | 1,041,326,289 | |
| | | $ | 10,744,760,224 | | | $ | 993,866,578 | | | $ | 1,676,129 | | | $ | 11,740,302,931 | |
Further details on the major security types listed above can be found in the Portfolio of Investments.
Transfers in and transfers out are recognized at the end of the reporting period. For the six months ended January 31, 2013, the Fund did not have any transfers into/out of Level 1 or Level 2.
4. TRANSACTIONS WITH AFFILIATES AND OTHER EXPENSES
Advisory fee
The Trust has entered into an advisory contract with Funds Management, an indirect wholly owned subsidiary of Wells Fargo & Company (“Wells Fargo”). The adviser is responsible for implementing investment policies and guidelines and for supervising the subadviser, who is responsible for day-to-day portfolio management of the Fund.
Pursuant to the contract, Funds Management is entitled to receive an annual advisory fee starting at 0.75% and declining to 0.60% as the average daily net assets of the Fund increase. For the six months ended January 31, 2013, the advisory fee was equivalent to an annual rate of 0.62% of the Fund’s average daily net assets.
Funds Management has retained the services of a subadviser to provide daily portfolio management to the Fund. The fee for subadvisory services is borne by Funds Management. WellsCap, an affiliate of Funds Management, is the subadviser to the Fund and is entitled to receive a fee from Funds Management at an annual rate starting at 0.45% and declining to 0.20% as the average daily net assets of the Fund increase. Prior to October 1, 2012, WellsCap received a fee at an annual rate which started at 0.35% and declined to 0.15% as the average daily net assets of the Fund increased.
Administration and transfer agent fees
The Trust has entered into an administration agreement with Funds Management. Under this agreement, for providing administrative services, which includes paying fees and expenses for services provided by the transfer agent, sub-transfer agents, omnibus account servicers and record-keepers, Funds Management is entitled to receive from the Fund an annual fund level administration fee starting at 0.05% and declining to 0.03% as the average daily net assets of the Fund increase and a class level administration fee which is calculated based on the average daily net assets of each class as follows:
| | | | |
| | | Class level administration fee | |
Class A, Class C | | | 0.26 | % |
Administrator Class | | | 0.10 | |
Institutional Class | | | 0.08 | |
Investor Class | | | 0.32 | |
Funds Management has contractually waived and/or reimbursed advisory and administration fees to the extent necessary to maintain certain net operating expense ratios for the Fund. Waiver of fees and/or reimbursement of expenses by Funds Management were made first from fund level expenses on a proportionate basis and then from class specific expenses. Funds Management has committed through November 30, 2013 to waive fees and/or reimburse expenses to the extent necessary to cap the Fund’s expenses at 1.21% for Class A shares, 1.96% for Class C shares, 0.96% for Administrator Class shares, 0.75% for Institutional Class shares, and 1.27% for Investor Class shares.
| | | | | | |
| Notes to financial statements (unaudited) | | Wells Fargo Advantage Growth Fund | | | 23 | |
Distribution fees
The Trust has adopted a Distribution Plan for Class C shares of the Fund pursuant to Rule 12b-1 under the 1940 Act. Distribution fees are charged to Class C shares and paid to Wells Fargo Funds Distributor, LLC, the principal underwriter, at an annual rate of 0.75% of its average daily net assets.
For the six months ended January 31, 2013, Wells Fargo Funds Distributor, LLC received $66,220 from the sale of Class A shares and $10,000 and $10,322 in contingent deferred sales charges from redemptions of Class A and Class C shares, respectively.
Shareholder servicing fees
The Trust has entered into contracts with one or more shareholder servicing agents, whereby Class A, Class C, Administrator Class, and Investor Class of the Fund is charged a fee at an annual rate of 0.25% of the average daily net assets of each respective class.
A portion of these total shareholder servicing fees were paid to affiliates of Wells Fargo.
5. INVESTMENT PORTFOLIO TRANSACTIONS
Purchases and sales of investments, excluding U.S. government obligations (if any) and short-term securities, for the six months ended January 31, 2013 were $2,062,473,892 and $2,411,340,381, respectively.
6. INVESTMENTS IN AFFILIATES
An affiliated investment is a company in which the Fund has ownership of at least 5% of the outstanding voting shares. The following is a summary of transactions in issuers that were either affiliates of the Fund at the beginning of the period or the end of the period.
| | | | | | | | | | | | | | | | | | | | | | | | | | | | |
| | | Shares, beginning of period | | | Shares
purchased | | | Shares
sold | | | Shares, end
of period | | | Value, end of period | | | Income from affiliated securities | | | Realized gains (losses) | |
BroadSoft Incorporated | | | 1,574,300 | | | | 175,700 | | | | 0 | | | | 1,750,000 | | | $ | 59,447,500 | | | $ | 0 | | | $ | 0 | |
HomeAway Incorporated | | | 3,089,470 | | | | 1,200,530 | | | | 0 | | | | 4,290,000 | | | | 102,831,300 | | | | 0 | | | | 0 | |
Life Time Fitness Incorporated | | | 3,049,000 | | | | 35,000 | | | | 449,000 | | | | 2,635,000 | | | | 133,673,550 | | | | 0 | | | | 1,914,155 | |
Shutterfly Incorporated | | | 2,466,100 | | | | 575,000 | | | | 116,100 | | | | 2,925,000 | | | | 96,759,000 | | | | 0 | | | | (1,291,159 | ) |
The Fresh Market Incorporated | | | 2,197,000 | | | | 1,367,000 | | | | 49,000 | | | | 3,515,000 | | | | 171,848,350 | | | | 0 | | | | 405,339 | |
Vitamin Shoppe Incorporated | | | 1,423,800 | | | | 1,066,200 | | | | 15,000 | | | | 2,475,000 | | | | 151,173,000 | | | | 0 | | | | 118,113 | |
| | | | | | | | | | | | | | | | | | $ | 715,732,700 | | | $ | 0 | | | $ | 1,146,448 | |
7. BANK BORROWINGS
The Trust (excluding the money market funds and certain other funds in the Trust) and Wells Fargo Variable Trust are parties to a $150,000,000 revolving credit agreement with State Street Bank and Trust Company, whereby the Fund is permitted to use bank borrowings for temporary or emergency purposes, such as to fund shareholder redemption requests. Interest under the credit agreement is charged to the Fund based on a borrowing rate equal to the higher of the Federal Funds rate in effect on that day plus 1.25% or the overnight LIBOR rate in effect on that day plus 1.25%. In addition, an annual commitment fee equal to 0.10% of the unused balance is allocated to each participating fund. For the six months ended January 31, 2013, the Fund paid $4,570 in commitment fees.
For the six months ended January 31, 2013, there were no borrowings by the Fund under the agreement.
8. INDEMNIFICATION
Under the Trust’s organizational documents, the officers and directors are indemnified against certain liabilities that may arise out of performance of their duties to the Trust. Additionally, in the normal course of business, the Trust may enter into contracts with service providers that contain a variety of indemnification clauses. The Trust’s maximum exposure under these arrangements is dependent on future claims that may be made against the Fund and, therefore, cannot be estimated.
9. NEW ACCOUNTING PRONOUNCEMENT
In December 2011, the Financial Accounting Standards Board (“FASB”) issued Accounting Standard Update (“ASU”) No. 2011-11, Disclosures about Offsetting Assets and Liabilities. ASU 2011-11, which amends FASB ASC Topic 210, Balance Sheet, creates new disclosure requirements which require entities to disclose both gross and net information for derivatives and other financial instruments that are either offset in the Statement of Assets and Liabilities or subject to an enforceable master netting arrangement or similar agreement. The disclosure requirements are effective for interim and annual reporting periods beginning on or after January 1, 2013. Management is currently assessing the potential impact, in addition to expanded financial statement disclosure, that may result from adopting this ASU.
| | | | |
| 24 | | Wells Fargo Advantage Growth Fund | | Other information (unaudited) |
PROXY VOTING INFORMATION
A description of the policies and procedures that the Fund uses to determine how to vote proxies relating to portfolio securities is available without charge, upon request, by calling 1-800-222-8222, visiting our website at wellsfargoadvantagefunds.com, or visiting the SEC website at sec.gov. Information regarding how the Fund voted proxies relating to portfolio securities during the most recent 12-month period ended June 30 is available without charge on the Fund’s website at wellsfargoadvantagefunds.com or by visiting the SEC website at sec.gov.
PORTFOLIO HOLDINGS INFORMATION
The complete portfolio holdings for the Fund are publicly available on the Fund’s website (wellsfargoadvantagefunds.com) on a monthly, 30-day or more delayed basis. In addition, top ten holdings information for the Fund is publicly available on the Fund’s website on a monthly, seven-day or more delayed basis. The Fund files its complete schedule of portfolio holdings with the SEC for the first and third quarters of each fiscal year on Form N-Q, which is available without charge by visiting the SEC website at sec.gov. In addition, the Fund’s Form N-Q may be reviewed and copied at the SEC’s Public Reference Room in Washington, DC, and at regional offices in New York City, at 233 Broadway, and in Chicago, at 175 West Jackson Boulevard, Suite 900. Information about the Public Reference Room may be obtained by calling 1-800-SEC-0330.
| | | | | | |
| Other information (unaudited) | | Wells Fargo Advantage Growth Fund | | | 25 | |
BOARD OF TRUSTEES AND OFFICERS
Each of the Trustees and Officers listed in the table below acts in identical capacities for the Wells Fargo Advantage family of funds, which consists of 136 funds1 comprising the Wells Fargo Funds Trust, Wells Fargo Variable Trust, Wells Fargo Master Trust and four closed-end funds (collectively the “Fund Complex”). This table should be read in conjunction with the Prospectus and the Statement of Additional Information2. All of the Trustees are also Members of the Audit and Governance Committees of each Trust in the Fund Complex. The mailing address of each Trustee and Officer is 525 Market Street, 12th Floor, San Francisco, CA 94105. Each Trustee and Officer serves an indefinite term, however, each Trustee serves such term until reaching the mandatory retirement age established by the Trustees.
Independent Trustees
| | | | | | |
Name and year of birth | | Position held and length of service* | | Principal occupations during past five years | | Other directorships during past five years |
Peter G. Gordon
(Born 1942) | | Trustee, since 1998; Chairman, since 2005 | | Co-Founder, Retired Chairman, President and CEO of Crystal Geyser Water Company. Trustee Emeritus, Colby College. | | Asset Allocation Trust |
Isaiah Harris, Jr.
(Born 1952) | | Trustee, since 2009 | | Retired. Prior thereto, President and CEO of BellSouth Advertising and Publishing Corp. from 2005 to 2007, President and CEO of BellSouth Enterprises from 2004 to 2005 and President of BellSouth Consumer Services from 2000 to 2003. Emeritus member of the Iowa State University Foundation Board of Governors. Emeritus Member of the Advisory Board of Iowa State University School of Business. Advisory Board Member, Palm Coast Academy (charter school). Mr. Harris is a certified public accountant. | | CIGNA Corporation; Deluxe Corporation; Asset Allocation Trust |
Judith M. Johnson
(Born 1949) | | Trustee, since 2008;
Audit Committee
Chairman, since 2008 | | Retired. Prior thereto, Chief Executive Officer and Chief Investment Officer of Minneapolis Employees Retirement Fund from 1996 to 2008. Ms. Johnson is an attorney, certified public accountant and a certified managerial accountant. | | Asset Allocation Trust |
Leroy Keith, Jr.
(Born 1939) | | Trustee, since 2010 | | Chairman, Bloc Global Services (development and construction). Trustee of the Evergreen Funds from 1983 to 2010. Former Managing Director, Almanac Capital Management (commodities firm), former Partner, Stonington Partners, Inc. (private equity fund), former Director, Obagi Medical Products Co. and former Director, Lincoln Educational Services. | | Trustee, Virtus Fund Complex (consisting of 48 portfolios as of 1/31/2013); Asset Allocation Trust |
David F. Larcker
(Born 1950) | | Trustee, since 2009 | | James Irvin Miller Professor of Accounting at the Graduate School of Business, Stanford University, Morgan Stanley Director of the Center for Leadership Development and Research and Senior Faculty of The Rock Center for Corporate Governance since 2006. From 2005 to 2008, Professor of Accounting at the Graduate School of Business, Stanford University. Prior thereto, Ernst & Young Professor of Accounting at The Wharton School, University of Pennsylvania from 1985 to 2005. | | Asset Allocation Trust |
Olivia S. Mitchell
(Born 1953) | | Trustee, since 2006 | | International Foundation of Employee Benefit Plans Professor, Wharton School of the University of Pennsylvania since 1993. Director of Wharton’s Pension Research Council and Boettner Center on Pensions & Retirement Research, and Research Associate at the National Bureau of Economic Research. Previously, Cornell University Professor from 1978 to 1993. | | Asset Allocation Trust |
Timothy J. Penny
(Born 1951) | | Trustee, since 1996 | | President and CEO of Southern Minnesota Initiative Foundation, a non-profit organization, since 2007 and Senior Fellow at the Humphrey Institute Policy Forum at the University of Minnesota since 1995. Member of the Board of Trustees of NorthStar Education Finance, Inc., a non-profit organization, since 2007. | | Asset Allocation Trust |
| | | | |
| 26 | | Wells Fargo Advantage Growth Fund | | Other information (unaudited) |
| | | | | | |
Name and year of birth | | Position held and length of service* | | Principal occupations during past five years | | Other directorships during past five years |
Michael S. Scofield
(Born 1943) | | Trustee, since 2010 | | Served on the Investment Company Institute’s Board of Governors and Executive Committee from 2008-2011 as well the Governing Council of the Independent Directors Council from 2006-2011 and the Independent Directors Council Executive Committee from 2008-2011. Chairman of the IDC from 2008-2010. Institutional Investor (Fund Directions) Trustee of Year in 2007. Trustee of the Evergreen Funds (and its predecessors) from 1984 to 2010. Chairman of the Evergreen Funds from 2000-2010. Former Trustee of the Mentor Funds. Retired Attorney, Law Offices of Michael S. Scofield. | | Asset Allocation Trust |
Donald C. Willeke
(Born 1940) | | Trustee, since 1996 | | Principal of the law firm of Willeke & Daniels. General Counsel of the Minneapolis Employees Retirement Fund from 1984 until its consolidation into the Minnesota Public Employees Retirement Association on June 30, 2010. Director and Vice Chair of The Tree Trust (non-profit corporation). Director of the American Chestnut Foundation (non-profit corporation). | | Asset Allocation Trust |
| * | Length of service dates reflect the Trustee’s commencement of service with the Trust’s predecessor entities, where applicable. |
Officers
| | | | | | |
Name and
year of birth | | Position held and
length of service | | Principal occupations during past five years | | |
Karla M. Rabusch
(Born 1959) | | President, since 2003 | | Executive Vice President of Wells Fargo Bank, N.A. and President of Wells Fargo Funds Management, LLC since 2003. | | |
Jeremy DePalma1
(Born 1974) | | Treasurer, since 2012 | | Senior Vice President of Wells Fargo Funds Management, LLC since 2009. Senior Vice President of Evergreen Investment Management Company, LLC from 2008 to 2010. Vice President, Evergreen Investment Services, Inc. from 2004 to 2007. Head of the Fund Reporting and Control Team within Fund Administration from 2005 to 2010. | | |
C. David Messman
(Born 1960) | | Secretary, since 2000; Chief Legal Officer, since 2003 | | Senior Vice President and Secretary of Wells Fargo Funds Management, LLC since 2001. Vice President and Managing Counsel of Wells Fargo Bank, N.A. since 1996. | | |
Debra Ann Early
(Born 1964) | | Chief Compliance Officer, since 2007 | | Chief Compliance Officer of Wells Fargo Funds Management, LLC since 2007. Chief Compliance Officer of Parnassus Investments from 2005 to 2007. Chief Financial Officer of Parnassus Investments from 2004 to 2007. | | |
David Berardi
(Born 1975) | | Assistant Treasurer, since 2009 | | Vice President of Wells Fargo Funds Management, LLC since 2009. Vice President of Evergreen Investment Management Company, LLC from 2008 to 2010. Assistant Vice President of Evergreen Investment Services, Inc. from 2004 to 2008. Manager of Fund Reporting and Control for Evergreen Investment Management Company, LLC from 2004 to 2010. | | |
| 1. | Jeremy DePalma acts as Treasurer of 61 funds and Assistant Treasurer of 75 funds in the Fund Complex. |
| 2. | The Statement of Additional Information includes additional information about the Trustees and is available, without charge, upon request, by calling 1-800-222-8222 or by visiting the website at wellsfargoadvantagefunds.com. |
| | | | | | |
| List of abbreviations | | Wells Fargo Advantage Growth Fund | | | 27 | |
The following is a list of common abbreviations for terms and entities that may have appeared in this report.
| ACA | — ACA Financial Guaranty Corporation |
| ADR | — American depositary receipt |
| ADS | — American depositary shares |
| AGC | — Assured Guaranty Corporation |
| AGM | — Assured Guaranty Municipal |
| Ambac | — Ambac Financial Group Incorporated |
| AMT | — Alternative minimum tax |
| BAN | — Bond anticipation notes |
| BHAC | — Berkshire Hathaway Assurance Corporation |
| CAB | — Capital appreciation bond |
| CCAB | — Convertible capital appreciation bond |
| CDA | — Community Development Authority |
| CDO | — Collateralized debt obligation |
| COP | — Certificate of participation |
| DRIVER | — Derivative inverse tax-exempt receipts |
| DW&P | — Department of Water & Power |
| DWR | — Department of Water Resources |
| ECFA | — Educational & Cultural Facilities Authority |
| EDA | — Economic Development Authority |
| EDFA | — Economic Development Finance Authority |
| ETF | — Exchange-traded fund |
| FDIC | — Federal Deposit Insurance Corporation |
| FFCB | — Federal Farm Credit Banks |
| FGIC | — Financial Guaranty Insurance Corporation |
| FHA | — Federal Housing Administration |
| FHLB | — Federal Home Loan Bank |
| FHLMC | — Federal Home Loan Mortgage Corporation |
| FICO | — The Financing Corporation |
| FNMA | — Federal National Mortgage Association |
| GDR | — Global depositary receipt |
| GNMA | — Government National Mortgage Association |
| HCFR | — Healthcare facilities revenue |
| HEFA | — Health & Educational Facilities Authority |
| HEFAR | — Higher education facilities authority revenue |
| HFA | — Housing Finance Authority |
| HFFA | — Health Facilities Financing Authority |
| HUD | — Department of Housing and Urban Development |
| IDA | — Industrial Development Authority |
| IDAG | — Industrial Development Agency |
| IDR | — Industrial development revenue |
| KRW | — Republic of Korea won |
| LIBOR | — London Interbank Offered Rate |
| LLC | — Limited liability company |
| LLP | — Limited liability partnership |
| MBIA | — Municipal Bond Insurance Association |
| MFHR | — Multifamily housing revenue |
| MSTR | — Municipal securities trust receipts |
| MUD | — Municipal Utility District |
| National | — National Public Finance Guarantee Corporation |
| PCFA | — Pollution Control Financing Authority |
| PCL | — Public Company Limited |
| PCR | — Pollution control revenue |
| PFA | — Public Finance Authority |
| PFFA | — Public Facilities Financing Authority |
| PFOTER | — Puttable floating option tax-exempt receipts |
| plc | — Public limited company |
| PUTTER | — Puttable tax-exempt receipts |
| R&D | — Research & development |
| Radian | — Radian Asset Assurance |
| RAN | — Revenue anticipation notes |
| RDA | — Redevelopment Authority |
| RDFA | — Redevelopment Finance Authority |
| REIT | — Real estate investment trust |
| ROC | — Reset option certificates |
| SAVRS | — Select auction variable rate securities |
| SBA | — Small Business Authority |
| SFHR | — Single-family housing revenue |
| SFMR | — Single-family mortgage revenue |
| SPA | — Standby purchase agreement |
| SPDR | — Standard & Poor’s Depositary Receipts |
| STRIPS | — Separate trading of registered interest and principal securities |
| TAN | — Tax anticipation notes |
| TIPS | — Treasury inflation-protected securities |
| TRAN | — Tax revenue anticipation notes |
| TTFA | — Transportation Trust Fund Authority |
| TVA | — Tennessee Valley Authority |
This page is intentionally left blank.
This page is intentionally left blank.
This page is intentionally left blank.


For more information
More information about Wells Fargo Advantage Funds is available free upon request. To obtain literature, please write, email, visit the Fund’s website, or call:
Wells Fargo Advantage Funds
P.O. Box 8266
Boston, MA 02266-8266
Email: wfaf@wellsfargo.com
Website: wellsfargoadvantagefunds.com
Individual investors: 1-800-222-8222
Retail investment professionals: 1-888-877-9275
Institutional investment professionals: 1-866-765-0778
This report and the financial statements contained herein are submitted for the general information of the shareholders of Wells Fargo Advantage Funds. If this report is used for promotional purposes, distribution of the report must be accompanied or preceded by a current prospectus. For a current prospectus and, if available, a summary prospectus containing more complete information, including charges and expenses, call 1-800-222-8222 or visit the Fund’s website at wellsfargoadvantagefunds.com. Please consider the investment objectives, risks, charges, and expenses of the investment carefully before investing. This and other information about Wells Fargo Advantage Funds can be found in the current prospectus. Read the prospectus carefully before you invest or send money.
Wells Fargo Funds Management, LLC, a wholly owned subsidiary of Wells Fargo & Company, provides investment advisory and administrative services for Wells Fargo Advantage Funds. Other affiliates of Wells Fargo & Company provide subadvisory and other services for the Funds. The Funds are distributed by Wells Fargo Funds Distributor, LLC, Member FINRA/SIPC, an affiliate of Wells Fargo & Company.
NOT FDIC INSURED ¡ NO BANK GUARANTEE ¡ MAY LOSE VALUE
© 2013 Wells Fargo Funds Management, LLC. All rights reserved.
| | |
 | | 215104 03-13 SA206/SAR206 1-13 |

Wells Fargo Advantage Intrinsic Value Fund

Semi-Annual Report
January 31, 2013

Reduce clutter. Save trees.
Sign up for electronic delivery of prospectuses and shareholder reports at wellsfargo.com/advantagedelivery
Contents
The views expressed and any forward-looking statements are as of January 31, 2013, unless otherwise noted, and are those of the Fund managers and/or Wells Fargo Funds Management, LLC. Discussions of individual securities, or the markets generally, or any Wells Fargo Advantage Fund are not intended as individual recommendations. Future events or results may vary significantly from those expressed in any forward-looking statements; the views expressed are subject to change at any time in response to changing circumstances in the market. Wells Fargo Funds Management, LLC, disclaims any obligation to publicly update or revise any views expressed or forward-looking statements.
NOT FDIC INSURED ¡ NO BANK GUARANTEE ¡ MAY LOSE VALUE

Wells Fargo investment history
| | |
| 1932 | | Keystone creates one of the first mutual fund families. |
| 1971 | | Wells Fargo & Company introduces one of the first institutional index funds. |
| 1978 | | Wells Fargo applies Markowitz and Sharpe’s research on Modern Portfolio Theory to introduce one of the industry’s first tactical asset allocation models in institutional separately managed accounts. |
| 1984 | | Wells Fargo Stagecoach Funds launches its first asset allocation fund. |
| 1989 | | The Tactical Asset Allocation (TAA) Model is first applied to Wells Fargo’s asset allocation mutual funds. |
| 1994 | | Wells Fargo introduces the LifePath Funds, one of the first suites of target date funds (now the Wells Fargo Advantage Dow Jones Target Date FundsSM). |
| 1996 | | Evergreen Investments and Keystone Funds merge. |
| 1997 | | Wells Fargo launches the Wells Fargo Advantage WealthBuilder PortfoliosSM, a fund-of-funds suite of products that includes the use of quantitative models to shift assets among investment styles. |
| 1999 | | Norwest Advantage Funds and Stagecoach Funds are reorganized into Wells Fargo Funds after the merger of Norwest and Wells Fargo. |
| 2002 | | Evergreen Retail and Evergreen Institutional companies form the umbrella asset management company, Evergreen Investments. |
| 2005 | | The integration of Strong Funds with Wells Fargo Funds creates Wells Fargo Advantage Funds, resulting in one of the top 20 mutual fund companies in the United States. |
| 2006 | | Wells Fargo Advantage Funds relaunches the target date product line as Wells Fargo Advantage Dow Jones Target Date Funds. |
| 2010 | | The mergers and reorganizations of Evergreen and Wells Fargo Advantage mutual funds are completed, unifying the families under the brand of Wells Fargo Advantage Funds. |
Wells Fargo Advantage Funds®
Wells Fargo Advantage Funds skillfully guides institutions, financial advisors, and individuals through the investment terrain to help them reach their financial objectives. Everything we do on behalf of investors is backed by our unique combination of qualifications.
Strength
Our organization is built on the standards of integrity and service established by our parent company—Wells Fargo & Company—more than 150 years ago. And, because we’re part of a highly diversified financial enterprise, we offer the depth of resources to help investors succeed.
Expertise
Our multi-boutique model offers investors access to the independent thinking of premier investment managers that have been chosen for their time-tested strategies. While each team specializes in a specific investment strategy, collectively they provide investors a wide choice of distinct investment styles. Our dedication to investment excellence doesn’t end with our expertise in manager selection—risk management, analysis, and rigorous ongoing review seek to ensure each manager’s investment process remains consistent.
Partnership
Our collaborative approach is built around understanding the needs and goals of our clients. By adhering to core principles of sound judgment and steady guidance, we support you through every stage of the investment decision process.
Carefully consider the investment objectives, risks, charges, and expenses before investing. For a current prospectus and, if available, a summary prospectus, for Wells Fargo Advantage Funds, containing this and other information, visit wellsfargoadvantagefunds.com. Read it carefully before investing.
Wells Fargo Funds Management, LLC, a wholly owned subsidiary of Wells Fargo & Company, provides investment advisory and administrative services for Wells Fargo Advantage Funds. Other affiliates of Wells Fargo & Company provide subadvisory and other services for the Funds. The Funds are distributed by Wells Fargo Funds Distributor, LLC, Member FINRA/SIPC, an affiliate of Wells Fargo & Company.
“Dow Jones®” and “Dow Jones Target Date IndexesSM” are service marks of Dow Jones Trademark Holdings LLC (“Dow Jones”); have been licensed to CME Group Index Services LLC (“CME Indexes”); and have been sublicensed for use for certain purposes by Global Index Advisors, Inc., and Wells Fargo Funds Management, LLC. The Wells Fargo Advantage Dow Jones Target Date FundsSM, based on the Dow Jones Target Date Indexes, are not sponsored, endorsed, sold, or promoted by Dow Jones, CME Indexes, or their respective affiliates, and none of them makes any representation regarding the advisability of investing in such product(s).
NOT FDIC INSURED ¡ NO BANK GUARANTEE ¡ MAY LOSE VALUE
Not part of the semi-annual report.
Wells Fargo Advantage Funds offers more than 110 mutual funds across a wide range of asset classes, representing over $226 billion in assets under management, as of January 31, 2013.
| | | | |
| Equity funds | | | | |
Asia Pacific Fund | | Enterprise Fund† | | Opportunity Fund† |
C&B Large Cap Value Fund | | Global Opportunities Fund | | Precious Metals Fund |
C&B Mid Cap Value Fund | | Growth Fund | | Premier Large Company Growth Fund |
Capital Growth Fund | | Index Fund | | Small Cap Opportunities Fund |
Common Stock Fund | | International Equity Fund | | Small Cap Value Fund |
Disciplined U.S. Core Fund | | International Value Fund | | Small Company Growth Fund |
Discovery Fund† | | Intrinsic Small Cap Value Fund | | Small Company Value Fund |
Diversified Equity Fund | | Intrinsic Value Fund | | Small/Mid Cap Value Fund |
Diversified International Fund | | Intrinsic World Equity Fund | | Special Mid Cap Value Fund |
Emerging Growth Fund | | Large Cap Core Fund | | Special Small Cap Value Fund |
Emerging Markets Equity Fund | | Large Cap Growth Fund | | Specialized Technology Fund |
Emerging Markets Equity Income Fund | | Large Company Value Fund | | Traditional Small Cap Growth Fund |
Endeavor Select Fund† | | Omega Growth Fund | | Utility and Telecommunications Fund |
| Bond funds | | | | |
Adjustable Rate Government Fund | | High Yield Municipal Bond Fund | | Short Duration Government Bond Fund |
California Limited-Term Tax-Free Fund | | Income Plus Fund | | Short-Term Bond Fund |
California Tax-Free Fund | | Inflation-Protected Bond Fund | | Short-Term High Yield Bond Fund |
Colorado Tax-Free Fund | | Intermediate Tax/AMT-Free Fund | | Short-Term Municipal Bond Fund |
Core Bond Fund | | International Bond Fund | | Strategic Income Fund |
Emerging Markets Local Bond Fund | | Minnesota Tax-Free Fund | | Strategic Municipal Bond Fund |
Government Securities Fund | | Municipal Bond Fund | | Ultra Short-Term Income Fund |
High Income Fund | | North Carolina Tax-Free Fund | | Ultra Short-Term Municipal Income Fund |
High Yield Bond Fund | | Pennsylvania Tax-Free Fund | | Wisconsin Tax-Free Fund |
| Asset allocation funds | | | | |
Absolute Return Fund | | WealthBuilder Equity Portfolio† | | Target 2020 Fund† |
Asset Allocation Fund | | WealthBuilder Growth Allocation Portfolio† | | Target 2025 Fund† |
Conservative Allocation Fund | | WealthBuilder Growth Balanced Portfolio† | | Target 2030 Fund† |
Diversified Capital Builder Fund | | WealthBuilder Moderate Balanced Portfolio† | | Target 2035 Fund† |
Diversified Income Builder Fund | | WealthBuilder Tactical Equity Portfolio† | | Target 2040 Fund† |
Growth Balanced Fund | | Target Today Fund† | | Target 2045 Fund† |
Index Asset Allocation Fund | | Target 2010 Fund† | | Target 2050 Fund† |
Moderate Balanced Fund | | Target 2015 Fund† | | Target 2055 Fund† |
WealthBuilder Conservative Allocation Portfolio† | | | | |
| Money market funds | | | | |
100% Treasury Money Market Fund | | Heritage Money Market Fund† | | National Tax-Free Money Market Fund |
California Municipal Money Market Fund | | Money Market Fund | | Treasury Plus Money Market Fund |
Cash Investment Money Market Fund | | Municipal Cash Management Money Market Fund | | |
Government Money Market Fund | | Municipal Money Market Fund | | |
| Variable trust funds1 | | | | |
VT Discovery Fund† | | VT Intrinsic Value Fund | | VT Small Cap Growth Fund |
VT Index Asset Allocation Fund | | VT Omega Growth Fund | | VT Small Cap Value Fund |
VT International Equity Fund | | VT Opportunity Fund† | | VT Total Return Bond Fund |
An investment in a money market fund is not insured or guaranteed by the Federal Deposit Insurance Corporation or any other government agency. Although the Wells Fargo Advantage Money Market Funds seek to preserve the value of your investment at $1.00 per share, it is possible to lose money by investing in a money market fund.
| 1. | The variable trust funds are generally available only through insurance company variable contracts. |
| † | In this report, the Wells Fargo Advantage Discovery FundSM, Wells Fargo Advantage Endeavor Select FundSM, Wells Fargo Advantage Enterprise FundSM, Wells Fargo Advantage Opportunity FundSM, Wells Fargo Advantage WealthBuilder Conservative Allocation PortfolioSM, Wells Fargo Advantage WealthBuilder Equity PortfolioSM, Wells Fargo Advantage WealthBuilder Growth Allocation PortfolioSM, Wells Fargo Advantage WealthBuilder Growth Balanced PortfolioSM, Wells Fargo Advantage WealthBuilder Moderate Balanced PortfolioSM, Wells Fargo Advantage WealthBuilder Tactical Equity PortfolioSM, Wells Fargo Advantage Dow Jones Target Today FundSM, Wells Fargo Advantage Dow Jones Target 2010 FundSM, Wells Fargo Advantage Dow Jones Target 2015 FundSM, Wells Fargo Advantage Dow Jones Target 2020 FundSM, Wells Fargo Advantage Dow Jones Target 2025 FundSM, Wells Fargo Advantage Dow Jones Target 2030 FundSM, Wells Fargo Advantage Dow Jones Target 2035 FundSM, Wells Fargo Advantage Dow Jones Target 2040 FundSM, Wells Fargo Advantage Dow Jones Target 2045 FundSM, Wells Fargo Advantage Dow Jones Target 2050 FundSM, Wells Fargo Advantage Dow Jones Target 2055 FundSM, Wells Fargo Advantage Heritage Money Market FundSM, Wells Fargo Advantage VT Discovery FundSM, and Wells Fargo Advantage VT Opportunity FundSM are referred to as the Discovery Fund, Endeavor Select Fund, Enterprise Fund, Opportunity Fund, WealthBuilder Conservative Allocation Portfolio, WealthBuilder Equity Portfolio, WealthBuilder Growth Allocation Portfolio, WealthBuilder Growth Balanced Portfolio, WealthBuilder Moderate Balanced Portfolio, WealthBuilder Tactical Equity Portfolio, Target Today Fund, Target 2010 Fund, Target 2015 Fund, Target 2020 Fund, Target 2025 Fund, Target 2030 Fund, Target 2035 Fund, Target 2040 Fund, Target 2045 Fund, Target 2050 Fund, Target 2055 Fund, Heritage Money Market Fund, VT Discovery Fund, and VT Opportunity Fund, respectively. |
Not part of the semi-annual report.
| | | | |
| 2 | | Wells Fargo Advantage Intrinsic Value Fund | | Letter to shareholders (unaudited) |

Karla M. Rabusch
President
Wells Fargo Advantage Funds
Entering the period, concerns about the eurozone sovereign debt situation held center stage as investors again focused on economic weakness in southern European economies.
Aggressive central bank actions helped support stock prices, as did relatively solid economic data.
Dear Valued Shareholder:
We are pleased to offer you this semi-annual report for the Wells Fargo Advantage Intrinsic Value Fund for the six-month period that ended January 31, 2013. Much of the period was marked by continued concerns about the possible effects that the ongoing European sovereign debt crisis would have on the global economy. However, relatively solid economic data in the U.S. and efforts by European authorities to address the sovereign debt issue alleviated investor fears and supported global stock markets. Judging by various indexes, U.S. large-cap stocks underperformed small-cap stocks. Within the large-cap universe, value stocks outperformed growth stocks, partly because of strong performance from the financials sector.
The period was dominated by worries that ongoing debt problems in the eurozone would affect global economic growth.
Entering the period, concerns about the eurozone sovereign debt situation held center stage as investors again focused on economic weakness in southern European economies. Because many eurozone banks owned southern European debt and many U.S. banks had financial ties to eurozone banks, investors worried about the effects of a possible southern European debt default on the global financial system and economy. Ongoing weakness in the Greek economy made it difficult for the country to meet previously agreed upon austerity targets. Toward the end of the reporting period, political risk resurfaced in both Italy and Spain. In Italy, Prime Minister Mario Monti, an economist who was appointed to implement austerity measures and labor market reforms, resigned in December 2012. Monti later decided to run for office in the general election scheduled for February 2013.
European leaders took concerted action to calm investor concerns. In September 2012, the European Central Bank (ECB) announced that it would purchase an unlimited amount of one- to three-year sovereign debt from countries that had applied for a formal bailout through either the European Financial Stability Facility or the European Stability Mechanism. In another positive sign, in late November 2012, finance ministers from the 17-country eurozone and the International Monetary Fund struck a deal aimed at reducing Greece’s debt by the year 2020.
Central banks continued to provide stimulus.
Major central banks, including the U.S. Federal Reserve (Fed) and the ECB, continued to inject liquidity into the banks and the markets through various quantitative easing policies. Throughout the reporting period, the Federal Open Market Committee (FOMC) kept its key interest rates effectively at zero in order to support the economy and the financial system. The ECB was similarly aggressive, keeping its key rate at a historic low of 0.75%. Just prior to the beginning of the reporting period, the FOMC announced its intention to keep interest rates low until at least mid-2015 in order to support the sluggish economy. The Fed also announced open-ended purchases of $40 billion per month in mortgage-backed securities in an effort to support the housing market.
Stock markets posted solid gains in an eventful period.
Aggressive central bank actions helped support stock prices, as did relatively solid economic data. For much of the reporting period, the U.S. stock market benefited from favorable gross domestic product (GDP) data, with the growth rate improving from 1.3% (annualized) in the second quarter of 2012 to 3.1% (annualized) in the third quarter of 2012. However, the GDP growth rate slowed in the final months of 2012, with GDP growth coming in at 0.1% (annualized) in
| | | | | | |
| Letter to shareholders (unaudited) | | Wells Fargo Advantage Intrinsic Value Fund | | | 3 | |
the fourth quarter of 2012. Because many investors attributed the weak number to the aftereffects of Hurricane Sandy on the eastern seaboard, the stock market remained resilient.
The steady improvement in the housing market supported investor sentiment. The National Association of Home Builders/First American Improving Markets Index identifies metro areas that have shown improvement from their respective troughs in housing permits, employment, and house prices for at least six consecutive months. The index rose for a fifth-consecutive month in January 2013, indicating improvements in 242 housing markets across the country. As a result, housing-related stocks strongly outperformed over the period, leading to better-than-index returns for sectors ranging from consumer discretionary (home improvement retailers), to materials (construction material providers), and to financials (mortgage lenders).
Throughout the period, a continued high unemployment rate was the main negative piece of U.S. economic data. Although the unemployment rate improved from 8.1% in August 2012 to 7.9% in January 2013, the labor market remained soft.
We remain committed to our investment strategies, even as many variables are at work in the market.
The full effect of the European credit crisis remains unknown. Elevated unemployment and debt defaults continue to pressure consumers and businesses alike. As a whole, Wells Fargo Advantage Funds represents investments across a range of asset classes and investment styles, giving you an opportunity to create a diversified investment portfolio. While diversification may not prevent losses in a downturn, we believe it helps manage risk.
Thank you for choosing to invest with Wells Fargo Advantage Funds. We appreciate your confidence in us and remain committed to helping you meet your financial needs. For current information about your fund investments, contact your investment professional, visit our website at wellsfargoadvantagefunds.com, or call us directly at 1-800-222-8222. We are available 24 hours a day, 7 days a week.
Sincerely,

Karla M. Rabusch
President
Wells Fargo Advantage Funds
| | | | |
| 4 | | Wells Fargo Advantage Intrinsic Value Fund | | Letter to shareholders (unaudited) |
Notice to shareholders
At its November 6-7, 2012 meeting, the Board of Trustees unanimously approved the following modifications to certain Class A sales load waiver privileges, with each change becoming effective on July 1, 2013:
| | n | | Annuity payments received under an annuity option or from death proceeds will no longer qualify for net asset value (NAV) repurchase privileges. | |
| | n | | The ability to reinvest redemption proceeds at NAV will be reduced from 120 days to 90 days. | |
| | n | | NAV purchase privileges for certain types of “grandfathered” shareholders will be modified to remove the ability to purchase Class A shares at NAV, unless those shares are held directly with the Fund. | |
Please contact your investment professional or call us directly at 1-800-222-8222 if you have any questions on this Notice to Shareholders.
This page is intentionally left blank.
| | | | |
| 6 | | Wells Fargo Advantage Intrinsic Value Fund | | Performance highlights (unaudited) |
Investment objective
The Fund seeks long-term capital appreciation.
Adviser
Wells Fargo Funds Management, LLC
Subadviser
Metropolitan West Capital Management, LLC
Portfolio managers
Gary Lisenbee
Jeffrey Peck
Average annual total returns1 (%) as of January 31, 2013
| | | | | | | | | | | | | | | | | | | | | | | | | | | | | | | | | | |
| | | | | Including sales charge | | | Excluding sales charge | | | Expense ratios2 (%) | |
| | | Inception date | | 1 year | | | 5 year | | | Life of the Fund | | | 1 year | | | 5 year | | | Life of the Fund | | | Gross | | | Net3 | |
| Class A (EIVAX) | | 8-1-2006 | | | 13.46 | | | | 3.45 | | | | 5.04 | | | | 20.38 | | | | 4.68 | | | | 6.00 | | | | 1.27 | | | | 1.17 | |
| Class B (EIVBX)* | | 8-1-2006 | | | 14.46 | | | | 3.54 | | | | 5.23 | | | | 19.46 | | | | 3.89 | | | | 5.23 | | | | 2.02 | | | | 1.92 | |
| Class C (EIVCX) | | 8-1-2006 | | | 18.44 | | | | 3.88 | | | | 5.23 | | | | 19.44 | | | | 3.88 | | | | 5.23 | | | | 2.02 | | | | 1.92 | |
| Class R4 (EIVRX) | | 11-30-2012 | | | – | | | | – | | | | – | | | | 20.79 | | | | 4.97 | | | | 6.28 | | | | 0.94 | | | | 0.81 | |
| Class R6 (EIVFX) | | 11-30-2012 | | | – | | | | – | | | | – | | | | 20.81 | | | | 4.98 | | | | 6.29 | | | | 0.79 | | | | 0.66 | |
| Administrator Class (EIVDX) | | 7-30-2010 | | | – | | | | – | | | | – | | | | 20.62 | | | | 4.86 | | | | 6.18 | | | | 1.11 | | | | 0.96 | |
| Institutional Class (EIVIX) | | 8-1-2006 | | | – | | | | – | | | | – | | | | 20.81 | | | | 4.98 | | | | 6.29 | | | | 0.84 | | | | 0.71 | |
| Russell 1000® Value Index4 | | – | | | – | | | | – | | | | – | | | | 20.58 | | | | 2.70 | | | | 3.22 | | | | – | | | | – | |
| * | | Class B shares are closed to investment, except in connection with the reinvestment of any distributions and permitted exchanges. |
Figures quoted represent past performance, which is no guarantee of future results and do not reflect the deduction of taxes that a shareholder may pay on fund distributions or the redemption of fund shares. Investment return and principal value of an investment will fluctuate so that an investor’s shares, when redeemed, may be worth more or less than their original cost. Performance shown without sales charges would be lower if sales charges were reflected. Current performance may be lower or higher than the performance data quoted and assumes the reinvestment of dividends and capital gains. Current month-end performance is available on the Fund’s website, wellsfargoadvantagefunds.com.
Index returns do not include transaction costs associated with buying and selling securities, any mutual fund fees or expenses, or any taxes. It is not possible to invest directly in an index.
For Class A shares, the maximum front-end sales charge is 5.75%. For Class B shares, the maximum contingent deferred sales charge is 5.00%. For Class C shares, the maximum contingent deferred sales charge is 1.00%. Performance including sales charge assumes the sales charge for the corresponding time period. Class R4, Class R6, Administrator Class, and Institutional Class shares are sold without a front-end sales charge or contingent deferred sales charge.
Stock values fluctuate in response to the activities of individual companies and general market and economic conditions. Certain investment strategies tend to increase the total risk of an investment (relative to the broader market). This Fund is exposed to foreign investment risk. Consult the Fund’s prospectus for additional information on these and other risks.
Please see footnotes on page 7.
| | | | | | |
| Performance highlights (unaudited) | | Wells Fargo Advantage Intrinsic Value Fund | | | 7 | |
| | | | |
| Ten largest equity holdings5 (%) as of January 31, 2013 | |
Home Depot Incorporated | | | 3.18 | |
Time Warner Incorporated | | | 3.08 | |
CIGNA Corporation | | | 3.03 | |
Zions Bancorporation | | | 2.96 | |
Nextera Energy Incorporated | | | 2.93 | |
Occidental Petroleum Corporation | | | 2.78 | |
Oracle Corporation | | | 2.77 | |
Boeing Company | | | 2.77 | |
PepsiCo Incorporated | | | 2.75 | |
Charles Schwab Corporation | | | 2.72 | |
| | |
| Sector distribution6 as of January 31, 2013 |
|
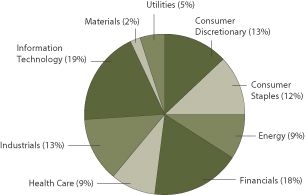 |
| 1. | Historical performance shown for Class R4 shares prior to their inception reflects the performance of the Institutional Class shares, adjusted to reflect the higher expenses applicable to Class R4 shares. Historical performance shown for the Class R6 shares prior to their inception reflects the performance of the Institutional Class shares, and includes the higher expenses applicable to the Institutional Class shares. If these expenses had not been included, returns would be higher. Historical performance shown for the Administrator Class shares prior to their inception reflects the performance of the Institutional Class shares, adjusted to reflect the higher expenses applicable to the Administrator Class shares. Historical performance shown for all classes of the Fund prior to July 19, 2010 is based on the performance of the Fund’s predecessor, Evergreen Intrinsic Value Fund. |
| 2. | Reflects the expense ratios as stated in the most recent prospectuses. |
| 3. | The Adviser has committed through November 30, 2014, to waive fees and/or reimburse expenses to the extent necessary to cap the Fund’s Total Annual Fund Operating Expenses After Fee Waiver, excluding certain expenses, at 1.16% for Class A, 1.91% for Class B, 1.91% for Class C, 0.80% for Class R4, 0.65% for Class R6, 0.95% for Administrator Class, and 0.70% for Institutional Class. Brokerage commissions, stamp duty fees, interest, taxes, acquired fund fees and expenses, and extraordinary expenses are excluded from the cap. Without this cap, the Fund’s returns would have been lower. |
| 4. | The Russell 1000® Value Index measures the performance of those Russell 1000 Index companies with lower price-to-book ratios and lower forecasted growth values. You cannot invest directly in an index. |
| 5. | The ten largest equity holdings are calculated based on the value of the securities divided by total net assets of the Fund. Holdings are subject to change and may have changed since the date specified. |
| 6. | Sector distribution is subject to change and is calculated based on the total long-term investments of the Fund. |
| | | | |
| 8 | | Wells Fargo Advantage Intrinsic Value Fund | | Fund expenses (unaudited) |
As a shareholder of the Fund, you incur two types of costs: (1) transaction costs, including sales charges (loads) on purchase payments and contingent deferred sales charges (if any) on redemptions and (2) ongoing costs, including management fees, distribution (12b-1) and/or shareholder service fees, and other Fund expenses. This example is intended to help you understand your ongoing costs (in dollars) of investing in the Fund and to compare these costs with the ongoing costs of investing in other mutual funds.
The example is based on an investment of $1,000 invested at the beginning of the six-month period and held for the entire period from August 1, 2012 to January 31, 2013.
Actual expenses
The “Actual” line of the table below provides information about actual account values and actual expenses. You may use the information in this line, together with the amount you invested, to estimate the expenses that you paid over the period. Simply divide your account value by $1,000 (for example, an $8,600 account value divided by $1,000 = 8.6), then multiply the result by the number in the “Actual” line under the heading entitled “Expenses paid during period” for your applicable class of shares to estimate the expenses you paid on your account during this period.
Hypothetical example for comparison purposes
The “Hypothetical” line of the table below provides information about hypothetical account values and hypothetical expenses based on the Fund’s actual expense ratio and an assumed rate of return of 5% per year before expenses, which is not the Fund’s actual return. The hypothetical account values and expenses may not be used to estimate the actual ending account balance or expenses you paid for the period. You may use this information to compare the ongoing costs of investing in the Fund and other funds. To do so, compare this 5% hypothetical example with the 5% hypothetical examples that appear in the shareholder reports of the other funds.
Please note that the expenses shown in the table are meant to highlight your ongoing costs only and do not reflect any transactional costs, such as sales charges (loads) and contingent deferred sales charges. Therefore, the “Hypothetical” line of the table is useful in comparing ongoing costs only and will not help you determine the relative total costs of owning different funds. In addition, if these transactional costs were included, your costs would have been higher.
| | | | | | | | | | | | | | | | |
| | | Beginning
account value
8-1-2012 | | | Ending
account value
1-31-2013 | | | Expenses
paid during
the period¹ | | | Net annual
expense ratio | |
Class A | | | | | | | | | | | | | | | | |
Actual | | $ | 1,000.00 | | | $ | 1,132.35 | | | $ | 6.29 | | | | 1.17 | % |
Hypothetical (5% return before expenses) | | $ | 1,000.00 | | | $ | 1,019.31 | | | $ | 5.96 | | | | 1.17 | % |
Class B | | | | | | | | | | | | | | | | |
Actual | | $ | 1,000.00 | | | $ | 1,128.78 | | | $ | 10.30 | | | | 1.92 | % |
Hypothetical (5% return before expenses) | | $ | 1,000.00 | | | $ | 1,015.53 | | | $ | 9.75 | | | | 1.92 | % |
Class C | | | | | | | | | | | | | | | | |
Actual | | $ | 1,000.00 | | | $ | 1,128.26 | | | $ | 10.30 | | | | 1.92 | % |
Hypothetical (5% return before expenses) | | $ | 1,000.00 | | | $ | 1,015.53 | | | $ | 9.75 | | | | 1.92 | % |
Class R4 | | | | | | | | | | | | | | | | |
Actual | | $ | 1,000.00 | | | $ | 1,134.16 | | | $ | 4.30 | | | | 0.80 | % |
Hypothetical (5% return before expenses) | | $ | 1,000.00 | | | $ | 1,021.17 | | | $ | 4.08 | | | | 0.80 | % |
Class R6 | | | | | | | | | | | | | | | | |
Actual | | $ | 1,000.00 | | | $ | 1,134.31 | | | $ | 3.50 | | | | 0.65 | % |
Hypothetical (5% return before expenses) | | $ | 1,000.00 | | | $ | 1,021.93 | | | $ | 3.31 | | | | 0.65 | % |
Administrator Class | | | | | | | | | | | | | | | | |
Actual | | $ | 1,000.00 | | | $ | 1,133.45 | | | $ | 5.11 | | | | 0.95 | % |
Hypothetical (5% return before expenses) | | $ | 1,000.00 | | | $ | 1,020.42 | | | $ | 4.84 | | | | 0.95 | % |
Institutional Class | | | | | | | | | | | | | | | | |
Actual | | $ | 1,000.00 | | | $ | 1,134.35 | | | $ | 4.09 | | | | 0.76 | % |
Hypothetical (5% return before expenses) | | $ | 1,000.00 | | | $ | 1,021.37 | | | $ | 3.87 | | | | 0.76 | % |
| 1. | Expenses paid is equal to the annualized expense ratio of each class multiplied by the average account value over the period, multiplied by the number of days in the most recent fiscal half-year divided by the number of days in the fiscal year (to reflect the one-half-year period). |
| | | | | | |
| Portfolio of investments—January 31, 2013 (unaudited) | | Wells Fargo Advantage Intrinsic Value Fund | | | 9 | |
| | | | | | | | | | | | |
| Security name | | | | | | Shares | | | Value | |
| | | | | | | | | | | | |
| | | | |
Common Stocks: 96.34% | | | | | | | | | | | | |
| | | | |
Consumer Discretionary: 12.27% | | | | | | | | | | | | |
| | | | |
| Auto Components: 2.58% | | | | | | | | | | | | |
TRW Automotive Holdings Corporation † | | | | | | | 170,000 | | | $ | 9,797,100 | |
| | | | | | | | | | | | |
| | | | |
| Media: 5.57% | | | | | | | | | | | | |
Time Warner Incorporated | | | | | | | 231,000 | | | | 11,670,120 | |
Walt Disney Company | | | | | | | 175,000 | | | | 9,429,000 | |
| | | | |
| | | | | | | | | | | 21,099,120 | |
| | | | | | | | | | | | |
| | | | |
| Specialty Retail: 4.12% | | | | | | | | | | | | |
Home Depot Incorporated | | | | | | | 180,000 | | | | 12,045,600 | |
Tiffany & Company « | | | | | | | 54,000 | | | | 3,550,500 | |
| | | | |
| | | | | | | | | | | 15,596,100 | |
| | | | | | | | | | | | |
| | | | |
Consumer Staples: 11.85% | | | | | | | | | | | | |
| | | | |
| Beverages: 4.83% | | | | | | | | | | | | |
Diageo plc ADR | | | | | | | 66,000 | | | | 7,873,800 | |
PepsiCo Incorporated | | | | | | | 143,000 | | | | 10,417,550 | |
| | | | |
| | | | | | | | | | | 18,291,350 | |
| | | | | | | | | | | | |
| | | | |
| Food Products: 7.02% | | | | | | | | | | | | |
H.J. Heinz Company « | | | | | | | 131,000 | | | | 7,942,530 | |
The Hershey Company | | | | | | | 107,000 | | | | 8,501,150 | |
Unilever NV ADR « | | | | | | | 251,000 | | | | 10,160,480 | |
| | | | |
| | | | | | | | | | | 26,604,160 | |
| | | | | | | | | | | | |
| | | | |
Energy: 8.36% | | | | | | | | | | | | |
| | | | |
| Energy Equipment & Services: 2.06% | | | | | | | | | | | | |
Schlumberger Limited | | | | | | | 100,100 | | | | 7,812,805 | |
| | | | | | | | | | | | |
| | | | |
| Oil, Gas & Consumable Fuels: 6.30% | | | | | | | | | | | | |
Hess Corporation | | | | | | | 124,000 | | | | 8,327,840 | |
Occidental Petroleum Corporation | | | | | | | 119,100 | | | | 10,512,957 | |
QEP Resources Incorporated | | | | | | | 171,000 | | | | 5,018,850 | |
| | | | |
| | | | | | | | | | | 23,859,647 | |
| | | | | | | | | | | | |
| | | | |
Financials: 17.42% | | | | | | | | | | | | |
| | | | |
| Capital Markets: 7.36% | | | | | | | | | | | | |
Charles Schwab Corporation | | | | | | | 623,000 | | | | 10,298,190 | |
Franklin Resources Incorporated | | | | | | | 59,300 | | | | 8,116,984 | |
Northern Trust Corporation « | | | | | | | 184,000 | | | | 9,470,480 | |
| | | | |
| | | | | | | | | | | 27,885,654 | |
| | | | | | | | | | | | |
| | | | |
| Commercial Banks: 7.48% | | | | | | | | | | | | |
M&T Bank Corporation « | | | | | | | 82,500 | | | | 8,471,925 | |
SunTrust Banks Incorporated | | | | | | | 305,000 | | | | 8,652,850 | |
Zions Bancorporation « | | | | | | | 480,470 | | | | 11,204,560 | |
| | | | |
| | | | | | | | | | | 28,329,335 | |
| | | | | | | | | | | | |
The accompanying notes are an integral part of these financial statements.
| | | | |
| 10 | | Wells Fargo Advantage Intrinsic Value Fund | | Portfolio of investments—January 31, 2013 (unaudited) |
| | | | | | | | | | | | |
| Security name | | | | | | Shares | | | Value | |
| | | | | | | | | | | | |
| | | | |
| Diversified Financial Services: 2.58% | | | | | | | | | | | | |
JPMorgan Chase & Company | | | | | | | 208,000 | | | $ | 9,786,400 | |
| | | | | | | | | | | | |
| | | | |
Health Care: 9.21% | | | | | | | | | | | | |
| | | | |
| Health Care Equipment & Supplies: 4.44% | | | | | | | | | | | | |
Abbott Laboratories | | | | | | | 227,600 | | | | 7,711,088 | |
Baxter International Incorporated | | | | | | | 134,000 | | | | 9,090,560 | |
| | | | |
| | | | | | | | | | | 16,801,648 | |
| | | | | | | | | | | | |
| | | | |
| Health Care Providers & Services: 3.03% | | | | | | | | | | | | |
CIGNA Corporation | | | | | | | 197,000 | | | | 11,492,980 | |
| | | | | | | | | | | | |
| | | | |
| Pharmaceuticals: 1.74% | | | | | | | | | | | | |
AbbVie Incorporation | | | | | | | 104,000 | | | | 3,815,760 | |
Hospira Incorporated † | | | | | | | 81,000 | | | | 2,763,720 | |
| | | | |
| | | | | | | | | | | 6,579,480 | |
| | | | | | | | | | | | |
| | | | |
Industrials: 12.32% | | | | | | | | | | | | |
| | | | |
| Aerospace & Defense: 5.95% | | | | | | | | | | | | |
Boeing Company | | | | | | | 142,000 | | | | 10,489,540 | |
Huntington Ingalls Industries Incorporated | | | | | | | 83,000 | | | | 3,676,900 | |
Northrop Grumman Corporation | | | | | | | 128,500 | | | | 8,357,640 | |
| | | | |
| | | | | | | | | | | 22,524,080 | |
| | | | | | | | | | | | |
| | | | |
| Air Freight & Logistics: 2.29% | | | | | | | | | | | | |
United Parcel Service Incorporated Class B | | | | | | | 109,300 | | | | 8,666,397 | |
| | | | | | | | | | | | |
| | | | |
| Machinery: 4.08% | | | | | | | | | | | | |
Deere & Company « | | | | | | | 88,900 | | | | 8,361,934 | |
SPX Corporation | | | | | | | 95,200 | | | | 7,104,776 | |
| | | | |
| | | | | | | | | | | 15,466,710 | |
| | | | | | | | | | | | |
| | | | |
Information Technology: 18.30% | | | | | | | | | | | | |
| | | | |
| Communications Equipment: 2.32% | | | | | | | | | | | | |
QUALCOMM Incorporated | | | | | | | 133,000 | | | | 8,781,990 | |
| | | | | | | | | | | | |
| | | | |
| Computers & Peripherals: 4.48% | | | | | | | | | | | | |
Apple Incorporated | | | | | | | 16,300 | | | | 7,421,553 | |
EMC Corporation † | | | | | | | 388,840 | | | | 9,569,352 | |
| | | | |
| | | | | | | | | | | 16,990,905 | |
| | | | | | | | | | | | |
| | | | |
| Internet Software & Services: 1.82% | | | | | | | | | | | | |
eBay Incorporated † | | | | | | | 123,000 | | | | 6,879,390 | |
| | | | | | | | | | | | |
| | | | |
| IT Services: 2.54% | | | | | | | | | | | | |
International Business Machines Corporation | | | | | | | 47,400 | | | | 9,625,518 | |
| | | | | | | | | | | | |
| | | | |
| Semiconductors & Semiconductor Equipment: 1.87% | | | | | | | | | | | | |
Texas Instruments Incorporated | | | | | | | 214,000 | | | | 7,079,120 | |
| | | | | | | | | | | | |
The accompanying notes are an integral part of these financial statements.
| | | | | | |
| Portfolio of investments—January 31, 2013 (unaudited) | | Wells Fargo Advantage Intrinsic Value Fund | | | 11 | |
| | | | | | | | | | | | | | |
| Security name | | | | | | | Shares | | | Value | |
| | | | | | | | | | | | | | |
| | | | |
| Software: 5.27% | | | | | | | | | | | | | | |
Intuit Incorporated | | | | | | | | | 151,500 | | | $ | 9,450,570 | |
Oracle Corporation | | | | | | | | | 296,000 | | | | 10,510,960 | |
| | | | |
| | | | | | | | | | | | | 19,961,530 | |
| | | | | | | | | | | | | | |
| | | | |
Materials: 1.73% | | | | | | | | | | | | | | |
| | | | |
| Chemicals: 1.73% | | | | | | | | | | | | | | |
Air Products & Chemicals Incorporated | | | | | | | | | 74,940 | | | | 6,552,005 | |
| | | | | | | | | | | | | | |
| | | | |
Utilities: 4.88% | | | | | | | | | | | | | | |
| | | | |
| Electric Utilities: 4.88% | | | | | | | | | | | | | | |
Nextera Energy Incorporated | | | | | | | | | 154,000 | | | | 11,095,700 | |
Northeast Utilities | | | | | | | | | 181,000 | | | | 7,372,130 | |
| | | | |
| | | | | | | | | | | | | 18,467,830 | |
| | | | | | | | | | | | | | |
| | | | |
Total Common Stocks (Cost $265,933,382) | | | | | | | | | | | | | 364,931,254 | |
| | | | | | | | | | | | | | |
| | | | |
| | | | | Yield | | | | | | | |
| | | | |
Short-Term Investments: 14.81% | | | | | | | | | | | | | | |
| | | | |
| Investment Companies: 14.81% | | | | | | | | | | | | | | |
Wells Fargo Advantage Cash Investment Money Market Fund, Select Class (l)(u) | | | | | 0.14 | % | | | 11,711,547 | | | | 11,711,547 | |
Wells Fargo Securities Lending Cash Investments, LLC (l)(r)(u)(v) | | | | | 0.19 | | | | 44,399,450 | | | | 44,399,450 | |
| | | | |
Total Short-Term Investments (Cost $56,110,997) | | | | | | | | | | | | | 56,110,997 | |
| | | | | | | | | | | | | | |
| | | | | | | | |
| Total investments in securities | | | | | | | | |
| (Cost $322,044,379) * | | | 111.15 | % | | | 421,042,251 | |
Other assets and liabilities, net | | | (11.15 | ) | | | (42,252,663 | ) |
| | | | | | | | |
| Total net assets | | | 100.00 | % | | $ | 378,789,588 | |
| | | | | | | | |
| † | Non-income-earning security |
| « | All or a portion of this security is on loan. |
| (l) | Investment in an affiliate |
| (u) | Rate shown is the 7-day annualized yield at period end. |
| (v) | Security represents investment of cash collateral received from securities on loan. |
| (r) | The investment company is exempt from registration under Section 3(c)(7) of the Investment Company Act of 1940, as amended. |
| * | Cost for federal income tax purposes is $322,574,064 and unrealized appreciation (depreciation) consists of: |
| | | | |
Gross unrealized appreciation | | $ | 98,970,440 | |
Gross unrealized depreciation | | | (502,253 | ) |
| | | | |
Net unrealized appreciation | | $ | 98,468,187 | |
The accompanying notes are an integral part of these financial statements.
| | | | |
| 12 | | Wells Fargo Advantage Intrinsic Value Fund | | Statement of assets and liabilities—January 31, 2013 (unaudited) |
| | | | |
| |
Assets | | | | |
Investments | | | | |
In unaffiliated securities (including securities on loan), at value (see cost below) | | $ | 364,931,254 | |
In affiliated securities, at value (see cost below) | | | 56,110,997 | |
| | | | |
Total investments, at value (see cost below) | | | 421,042,251 | |
Receivable for investments sold | | | 2,237,287 | |
Receivable for Fund shares sold | | | 444,570 | |
Receivable for dividends | | | 404,466 | |
Receivable for securities lending income | | | 5,321 | |
Prepaid expenses and other assets | | | 108,371 | |
| | | | |
Total assets | | | 424,242,266 | |
| | | | |
| |
Liabilities | | | | |
Payable for investments purchased | | | 354,978 | |
Payable for Fund shares redeemed | | | 226,077 | |
Payable upon receipt of securities loaned | | | 44,399,450 | |
Advisory fee payable | | | 180,709 | |
Distribution fees payable | | | 15,752 | |
Due to other related parties | | | 58,514 | |
Accrued expenses and other liabilities | | | 217,198 | |
| | | | |
Total liabilities | | | 45,452,678 | |
| | | | |
Total net assets | | $ | 378,789,588 | |
| | | | |
| |
NET ASSETS CONSIST OF | | | | |
Paid-in capital | | $ | 268,867,987 | |
Overdistributed net investment income | | | (99,864 | ) |
Accumulated net realized gains on investments | | | 11,023,593 | |
Net unrealized gains on investments | | | 98,997,872 | |
| | | | |
Total net assets | | $ | 378,789,588 | |
| | | | |
| |
COMPUTATION OF NET ASSET VALUE AND OFFERING PRICE PER SHARE1 | | | | |
Net assets – Class A | | $ | 91,861,150 | |
Shares outstanding – Class A | | | 8,328,843 | |
Net asset value per share – Class A | | | $11.03 | |
Maximum offering price per share – Class A2 | | | $11.70 | |
Net assets – Class B | | $ | 3,636,842 | |
Shares outstanding – Class B | | | 331,070 | |
Net asset value per share – Class B | | | $10.99 | |
Net assets – Class C | | $ | 21,714,354 | |
Shares outstanding – Class C | | | 1,989,111 | |
Net asset value per share – Class C | | | $10.92 | |
Net assets – Class R4 | | $ | 10,709 | |
Share outstanding – Class R4 | | | 970 | |
Net asset value per share – Class R4 | | | $11.04 | |
Net assets – Class R6 | | $ | 53,559 | |
Share outstanding – Class R6 | | | 4,850 | |
Net asset value per share – Class R6 | | | $11.04 | |
Net assets – Administrator Class | | $ | 35,728,707 | |
Shares outstanding – Administrator Class | | | 3,135,871 | |
Net asset value per share – Administrator Class | | | $11.39 | |
Net assets – Institutional Class | | $ | 225,784,267 | |
Shares outstanding – Institutional Class | | | 20,426,769 | |
Net asset value per share – Institutional Class | | | $11.05 | |
| |
Investment in unaffiliated securities (including securities on loan), at cost | | $ | 265,933,382 | |
| | | | |
Investments in affiliated securities, at cost | | $ | 56,110,997 | |
| | | | |
Total investments, at cost | | $ | 322,044,379 | |
| | | | |
Securities on loan, at value | | $ | 43,359,772 | |
| | | | |
| 1. | The Fund has an unlimited number of authorized shares. |
| 2. | Maximum offering price is computed as 100/94.25 of net asset value. On investments of $50,000 or more, the offering price is reduced. |
The accompanying notes are an integral part of these financial statements.
| | | | | | |
| Statement of operations—six months ended January 31, 2013 (unaudited) | | Wells Fargo Advantage Intrinsic Value Fund | | | 13 | |
| | | | |
| |
Investment income | | | | |
Dividends* | | $ | 3,784,023 | |
Securities lending income, net | | | 34,787 | |
Income from affiliated securities | | | 15,487 | |
| | | | |
Total investment income | | | 3,834,297 | |
| | | | |
| |
Expenses | | | | |
Advisory fee | | | 1,196,727 | |
Administration fees | | | | |
Fund level | | | 92,056 | |
Class A | | | 113,575 | |
Class B | | | 5,184 | |
Class C | | | 26,729 | |
Class R4 | | | 1 | 1 |
Class R6 | | | 2 | 1 |
Administrator Class | | | 14,726 | |
Institutional Class | | | 90,735 | |
Shareholder servicing fees | | | | |
Class A | | | 93,280 | |
Class B | | | 4,985 | |
Class C | | | 25,701 | |
Class R4 | | | 2 | 1 |
Administrator Class | | | 36,601 | |
Distribution fees | | | | |
Class B | | | 14,954 | |
Class C | | | 77,104 | |
Custody and accounting fees | | | 7,824 | |
Professional fees | | | 1,656 | |
Registration fees | | | 1,840 | |
Shareholder report expenses | | | 1,840 | |
Trustees’ fees and expenses | | | 552 | |
Other fees and expenses | | | 1,656 | |
| | | | |
Total expenses | | | 1,807,730 | |
Less: Fee waivers and/or expense reimbursements | | | (60,287 | ) |
| | | | |
Net expenses | | | 1,747,443 | |
| | | | |
Net investment income | | | 2,086,854 | |
| | | | |
| |
REALIZED AND UNREALIZED GAINS (LOSSES) ON INVESTMENTS | | | | |
Net realized gains on investments | | | 15,904,105 | |
Net change in unrealized gains (losses) on investments | | | 27,793,990 | |
| | | | |
Net realized and unrealized gains (losses) on investments | | | 43,698,095 | |
| | | | |
Net increase in net assets resulting from operations | | $ | 45,784,949 | |
| | | | |
| |
* Net of foreign dividend withholding taxes in the amount of | | | $28,771 | |
| 1. | For the period from November 30, 2012 (commencement of class operations) to January 31, 2013 |
The accompanying notes are an integral part of these financial statements.
| | | | |
| 14 | | Wells Fargo Advantage Intrinsic Value Fund | | Statement of changes in net assets |
| | | | | | | | | | | | | | | | |
| | | Six months ended January 31, 2013 (unaudited) | | | Year ended
July 31, 2012 | |
| | | | |
Operations | | | | | | | | | | | | | | | | |
Net investment income | | | | | | $ | 2,086,854 | | | | | | | $ | 4,415,696 | |
Net realized gains on investments | | | | | | | 15,904,105 | | | | | | | | 17,185,013 | |
Net change in unrealized gains (losses) on investments | | | | | | | 27,793,990 | | | | | | | | (16,910,395 | ) |
| | | | | | | | | | | | | | | | |
Net increase in net assets resulting from operations | | | | | | | 45,784,949 | | | | | | | | 4,690,314 | |
| | | | | | | | | | | | | | | | |
| | | | |
Distributions to shareholders from | | | | | | | | | | | | | | | | |
Net investment income | | | | | | | | | | | | | | | | |
Class A | | | | | | | (826,684 | ) | | | | | | | (3,158,452 | ) |
Class B | | | | | | | 0 | | | | | | | | (102,030 | ) |
Class C | | | | | | | (35,977 | ) | | | | | | | (486,427 | ) |
Class R4 | | | | | | | (147 | )1 | | | | | | | N/A | |
Class R6 | | | | | | | (740 | )1 | | | | | | | N/A | |
Administrator Class | | | | | | | (376,820 | ) | | | | | | | (53,362 | ) |
Institutional Class | | | | | | | (2,942,395 | ) | | | | | | | (6,661,737 | ) |
Net realized gains | | | | | | | | | | | | | | | | |
Class A | | | | | | | (4,870,427 | ) | | | | | | | (11,786,758 | ) |
Class B | | | | | | | (216,860 | ) | | | | | | | (603,944 | ) |
Class C | | | | | | | (1,166,530 | ) | | | | | | | (2,557,958 | ) |
Class R4 | | | | | | | (575 | )1 | | | | | | | N/A | |
Class R6 | | | | | | | (2,875 | )1 | | | | | | | N/A | |
Administrator Class | | | | | | | (1,660,496 | ) | | | | | | | (1,707,718 | ) |
Institutional Class | | | | | | | (12,200,925 | ) | | | | | | | (20,996,038 | ) |
| | | | | | | | | | | | | | | | |
Total distributions to shareholders | | | | | | | (24,301,451 | ) | | | | | | | (48,114,424 | ) |
| | | | |
| | | | |
| | | Shares | | | | | | | | | | | | Shares | |
Capital share transactions | | | | | | | | | | | | | | | | |
Proceeds from shares sold | | | | | | | | | | | | | | | | |
Class A | | | 1,083,287 | | | | 11,693,596 | | | | 1,647,052 | | | | 16,994,714 | |
Class B | | | 4,147 | | | | 44,261 | | | | 18,971 | | | | 190,176 | |
Class C | | | 215,077 | | | | 2,281,070 | | | | 254,471 | | | | 2,585,635 | |
Class R4 | | | 901 | 1 | | | 10,000 | 1 | | | N/A | | | | N/A | |
Class R6 | | | 4,504 | 1 | | | 50,000 | 1 | | | N/A | | | | N/A | |
Administrator Class | | | 839,046 | | | | 9,320,288 | | | | 2,764,809 | | | | 28,764,230 | |
Institutional Class | | | 2,144,097 | | | | 23,343,863 | | | | 4,712,518 | | | | 47,964,906 | |
| | | | |
| | | | | | | 46,743,078 | | | | | | | | 96,499,661 | |
| | | | |
Reinvestment of distributions | | | | | | | | | | | | | | | | |
Class A | | | 494,065 | | | | 5,145,848 | | | | 1,315,618 | | | | 12,628,143 | |
Class B | | | 20,171 | | | | 207,552 | | | | 68,307 | | | | 649,452 | |
Class C | | | 105,346 | | | | 1,079,735 | | | | 283,110 | | | | 2,683,755 | |
Class R4 | | | 69 | 1 | | | 722 | 1 | | | N/A | | | | N/A | |
Class R6 | | | 346 | 1 | | | 3,615 | 1 | | | N/A | | | | N/A | |
Administrator Class | | | 162,840 | | | | 1,754,702 | | | | 82,852 | | | | 810,567 | |
Institutional Class | | | 1,242,972 | | | | 13,004,365 | | | | 2,479,308 | | | | 23,891,924 | |
| | | | |
| | | | | | | 21,196,539 | | | | | | | | 40,663,841 | |
| | | | |
Payment for shares redeemed | | | | | | | | | | | | | | | | |
Class A | | | (1,658,324 | ) | | | (18,135,727 | ) | | | (8,398,558 | ) | | | (84,847,840 | ) |
Class B | | | (111,253 | ) | | | (1,189,398 | ) | | | (343,683 | ) | | | (3,499,264 | ) |
Class C | | | (291,752 | ) | | | (3,114,312 | ) | | | (1,064,389 | ) | | | (10,746,413 | ) |
Administrator Class | | | (341,344 | ) | | | (3,828,603 | ) | | | (1,211,695 | ) | | | (11,999,406 | ) |
Institutional Class | | | (4,234,690 | ) | | | (46,295,495 | ) | | | (9,917,914 | ) | | | (102,812,211 | ) |
| | | | |
| | | | | | | (72,563,535 | ) | | | | | | | (213,905,134 | ) |
| | | | |
Net decrease in net assets resulting from capital share transactions | | | | | | | (4,623,918 | ) | | | | | | | (76,741,632 | ) |
| | | | |
Total increase (decrease) in net assets | | | | | | | 16,859,580 | | | | | | | | (120,165,742 | ) |
| | | | |
| | | | |
Net assets | | | | | | | | | | | | | | | | |
Beginning of period | | | | | | | 361,930,008 | | | | | | | | 482,095,750 | |
| | | | |
End of period | | | | | | $ | 378,789,588 | | | | | | | $ | 361,930,008 | |
| | | | |
Undistributed (overdistributed) net investment income | | | | | | $ | (99,864 | ) | | | | | | $ | 1,996,045 | |
| | | | |
| 1. | For the period from November 30, 2012 (commencement of class operations) to January 31, 2013 |
The accompanying notes are an integral part of these financial statements.
| | | | | | |
| Financial highlights | | Wells Fargo Advantage Intrinsic Value Fund | | | 15 | |
(For a share outstanding throughout each period)
| | | | | | | | | | | | | | | | | | | | | | | | |
| | | Six months ended
January 31, 2013
(unaudited) | | | Year ended July 31 | |
| CLASS A | | | 2012 | | | 2011 | | | 20101 | | | 20091 | | | 20081 | |
Net asset value, beginning of period | | $ | 10.44 | | | $ | 11.50 | | | | $9.84 | | | $ | 8.48 | | | $ | 10.19 | | | $ | 11.53 | |
Net investment income | | | 0.05 | | | | 0.11 | 2 | | | 0.10 | | | | 0.10 | 2 | | | 0.10 | | | | 0.09 | |
Net realized and unrealized gains (losses) on investments | | | 1.28 | | | | 0.24 | | | | 1.65 | | | | 1.31 | | | | (1.71 | ) | | | (0.96 | ) |
| | | | | | | | | | | | | | | | | | | | | | | | |
Total from investment operations | | | 1.33 | | | | 0.35 | | | | 1.75 | | | | 1.41 | | | | (1.61 | ) | | | (0.87 | ) |
Distributions to shareholders from | | | | | | | | | | | | | | | | | | | | | | | | |
Net investment income | | | (0.10 | ) | | | (0.28 | ) | | | (0.09 | ) | | | (0.05 | ) | | | (0.04 | ) | | | (0.05 | ) |
Net realized gains | | | (0.64 | ) | | | (1.13 | ) | | | 0.00 | | | | 0.00 | | | | (0.06 | ) | | | (0.42 | ) |
| | | | | | | | | | | | | | | | | | | | | | | | |
Total distributions to shareholders | | | (0.74 | ) | | | (1.41 | ) | | | (0.09 | ) | | | (0.05 | ) | | | (0.10 | ) | | | (0.47 | ) |
Net asset value, end of period | | $ | 11.03 | | | $ | 10.44 | | | $ | 11.50 | | | $ | 9.84 | | | | $8.48 | | | $ | 10.19 | |
Total return3 | | | 13.24 | % | | | 4.38 | % | | | 17.88 | % | | | 16.67 | % | | | (15.62 | )% | | | (7.89 | )% |
Ratios to average net assets (annualized) | | | | | | | | | | | | | | | | | | | | | | | | |
Gross expenses | | | 1.18 | % | | | 1.24 | % | | | 1.24 | % | | | 1.17 | % | | | 1.15 | % | | | 1.12 | % |
Net expenses | | | 1.17 | % | | | 1.17 | % | | | 1.17 | % | | | 1.11 | % | | | 1.14 | % | | | 1.11 | % |
Net investment income | | | 0.91 | % | | | 1.05 | % | | | 0.81 | % | | | 1.05 | % | | | 1.62 | % | | | 0.96 | % |
Supplemental data | | | | | | | | | | | | | | | | | | | | | | | | |
Portfolio turnover rate | | | 16 | % | | | 34 | % | | | 25 | % | | | 23 | % | | | 23 | % | | | 26 | % |
Net assets, end of period (000s omitted) | | | $91,861 | | | | $87,784 | | | | $159,178 | | | | $147,957 | | | | $90,382 | | | | $88,456 | |
| 1. | After the close of business on July 16, 2010, the Fund acquired the net assets of Evergreen Intrinsic Value Fund which became the accounting and performance survivor in the transaction. The information for the periods prior to July 19, 2010 is that of Class A of Evergreen Intrinsic Value Fund. |
| 2. | Calculated based upon average shares outstanding. |
| 3. | Total return calculations do not include any sales charges. Returns for periods of less than one year are not annualized. |
The accompanying notes are an integral part of these financial statements.
| | | | |
| 16 | | Wells Fargo Advantage Intrinsic Value Fund | | Financial highlights |
(For a share outstanding throughout each period)
| | | | | | | | | | | | | | | | | | | | | | | | |
| | | Six months ended
January 31, 2013
(unaudited) | | | Year ended July 31 | |
| CLASS B | | | 2012 | | | 2011 | | | 20101 | | | 20091 | | | 20081 | |
Net asset value, beginning of period | | $ | 10.34 | | | $ | 11.37 | | | $ | 9.72 | | | $ | 8.40 | | | $ | 10.11 | | | $ | 11.48 | |
Net investment income | | | 0.01 | 2 | | | 0.03 | 2 | | | 0.01 | 2 | | | 0.03 | 2 | | | 0.07 | 2 | | | 0.02 | |
Net realized and unrealized gains (losses) on investments | | | 1.28 | | | | 0.24 | | | | 1.64 | | | | 1.29 | | | | (1.72 | ) | | | (0.97 | ) |
| | | | | | | | | | | | | | | | | | | | | | | | |
Total from investment operations | | | 1.29 | | | | 0.27 | | | | 1.65 | | | | 1.32 | | | | (1.65 | ) | | | (0.95 | ) |
Distributions to shareholders from | | | | | | | | | | | | | | | | | | | | | | | | |
Net investment income | | | 0.00 | | | | (0.17 | ) | | | (0.00 | )3 | | | 0.00 | | | | 0.00 | | | | 0.00 | |
Net realized gains | | | (0.64 | ) | | | (1.13 | ) | | | 0.00 | | | | 0.00 | | | | (0.06 | ) | | | (0.42 | ) |
| | | | | | | | | | | | | | | | | | | | | | | | |
Total distributions to shareholders | | | (0.64 | ) | | | (1.30 | ) | | | (0.00 | )3 | | | 0.00 | | | | (0.06 | ) | | | (0.42 | ) |
Net asset value, end of period | | | $10.99 | | | | $10.34 | | | | $11.37 | | | | $9.72 | | | | $8.40 | | | | $10.11 | |
Total return4 | | | 12.88 | % | | | 3.56 | % | | | 17.03 | % | | | 15.71 | % | | | (16.22 | )% | | | (8.58 | )% |
Ratios to average net assets (annualized) | | | | | | | | | | | | | | | | | | | | | | | | |
Gross expenses | | | 1.97 | % | | | 2.01 | % | | | 1.99 | % | | | 1.93 | % | | | 1.91 | % | | | 1.91 | % |
Net expenses | | | 1.92 | % | | | 1.92 | % | | | 1.91 | % | | | 1.88 | % | | | 1.90 | % | | | 1.90 | % |
Net investment income | | | 0.19 | % | | | 0.27 | % | | | 0.07 | % | | | 0.30 | % | | | 0.84 | % | | | 0.15 | % |
Supplemental data | | | | | | | | | | | | | | | | | | | | | | | | |
Portfolio turnover rate | | | 16 | % | | | 34 | % | | | 25 | % | | | 23 | % | | | 23 | % | | | 26 | % |
Net assets, end of period (000s omitted) | | | $3,637 | | | | $4,323 | | | | $7,666 | | | | $9,206 | | | | $10,014 | | | | $18,248 | |
| 1. | After the close of business on July 16, 2010, the Fund acquired the net assets of Evergreen Intrinsic Value Fund which became the accounting and performance survivor in the transaction. The information for the periods prior to July 19, 2010 is that of Class B of Evergreen Intrinsic Value Fund. |
| 2. | Calculated based upon average shares outstanding. |
| 3. | Amount is less than $0.005. |
| 4. | Total return calculations do not include any sales charges. Returns for periods of less than one year are not annualized. |
The accompanying notes are an integral part of these financial statements.
| | | | | | |
| Financial highlights | | Wells Fargo Advantage Intrinsic Value Fund | | | 17 | |
(For a share outstanding throughout each period)
| | | | | | | | | | | | | | | | | | | | | | | | |
| | | Six months ended
January 31, 2013 (unaudited) | | | Year ended July 31 | |
| CLASS C | | | 2012 | | | 2011 | | | 20101 | | | 20091 | | | 20081 | |
Net asset value, beginning of period | | $ | 10.30 | | | $ | 11.35 | | | $ | 9.72 | | | $ | 8.40 | | | $ | 10.11 | | | $ | 11.48 | |
Net investment income | | | 0.01 | | | | 0.03 | 2 | | | 0.02 | | | | 0.03 | 2 | | | 0.06 | 2 | | | 0.01 | |
Net realized and unrealized gains (losses) on investments | | | 1.27 | | | | 0.24 | | | | 1.63 | | | | 1.29 | | | | (1.71 | ) | | | (0.96 | ) |
| | | | | | | | | | | | | | | | | | | | | | | | |
Total from investment operations | | | 1.28 | | | | 0.27 | | | | 1.65 | | | | 1.32 | | | | (1.65 | ) | | | (0.95 | ) |
Distributions to shareholders from | | | | | | | | | | | | | | | | | | | | | | | | |
Net investment income | | | (0.02 | ) | | | (0.19 | ) | | | (0.02 | ) | | | 0.00 | | | | 0.00 | | | | 0.00 | |
Net realized gains | | | (0.64 | ) | | | (1.13 | ) | | | 0.00 | | | | 0.00 | | | | (0.06 | ) | | | (0.42 | ) |
| | | | | | | | | | | | | | | | | | | | | | | | |
Total distributions to shareholders | | | (0.66 | ) | | | (1.32 | ) | | | (0.02 | ) | | | 0.00 | | | | (0.06 | ) | | | (0.42 | ) |
Net asset value, end of period | | | $10.92 | | | | $10.30 | | | | $11.35 | | | | $9.72 | | | | $8.40 | | | | $10.11 | |
Total return3 | | | 12.83 | % | | | 3.62 | % | | | 16.98 | % | | | 15.71 | % | | | (16.22 | )% | | | (8.58 | )% |
Ratios to average net assets (annualized) | | | | | | | | | | | | | | | | | | | | | | | | |
Gross expenses | | | 1.97 | % | | | 2.01 | % | | | 1.97 | % | | | 1.94 | % | | | 1.92 | % | | | 1.91 | % |
Net expenses | | | 1.92 | % | | | 1.92 | % | | | 1.92 | % | | | 1.88 | % | | | 1.91 | % | | | 1.90 | % |
Net investment income | | | 0.16 | % | | | 0.26 | % | | | 0.07 | % | | | 0.29 | % | | | 0.84 | % | | | 0.18 | % |
Supplemental data | | | | | | | | | | | | | | | | | | | | | | | | |
Portfolio turnover rate | | | 16 | % | | | 34 | % | | | 25 | % | | | 23 | % | | | 23 | % | | | 26 | % |
Net assets, end of period (000s omitted) | | | $21,714 | | | | $20,187 | | | | $28,230 | | | | $26,934 | | | | $20,396 | | | | $22,369 | |
| 1. | After the close of business on July 16, 2010, the Fund acquired the net assets of Evergreen Intrinsic Value Fund which became the accounting and performance survivor in the transaction. The information for the periods prior to July 19, 2010 is that of Class C of Evergreen Intrinsic Value Fund. |
| 2. | Calculated based upon average shares outstanding. |
| 3. | Total return calculations do not include any sales charges. Returns for periods of less than one year are not annualized. |
The accompanying notes are an integral part of these financial statements.
| | | | |
| 18 | | Wells Fargo Advantage Intrinsic Value Fund | | Financial highlights |
(For a share outstanding throughout each period)
| | | | |
| CLASS R4 | | Period ended
January 31, 20131 (unaudited) | |
Net asset value, beginning of period | | $ | 11.10 | |
Net investment income | | | 0.02 | |
Net realized and unrealized gains (losses) on investments | | | 0.71 | |
| | | | |
Total from investment operations | | | 0.73 | |
Distributions to shareholders from | | | | |
Net investment income | | | (0.15 | ) |
Net realized gains | | | (0.64 | ) |
| | | | |
Total distributions to shareholders | | | (0.79 | ) |
Net asset value, end of period | | $ | 11.04 | |
Total return2 | | | 7.08 | % |
Ratios to average net assets (annualized) | | | | |
Gross expenses | | | 0.87 | % |
Net expenses | | | 0.80 | % |
Net investment income | | | 1.07 | % |
Supplemental data | | | | |
Portfolio turnover rate | | | 16 | % |
Net assets, end of period (000s omitted) | | | $11 | |
| 1. | For the period from November 30, 2012 (commencement of class operations) to January 31, 2013 |
| 2. | Returns for periods of less than one year are not annualized. |
The accompanying notes are an integral part of these financial statements.
| | | | | | |
| Financial highlights | | Wells Fargo Advantage Intrinsic Value Fund | | | 19 | |
(For a share outstanding throughout each period)
| | | | |
| CLASS R6 | | Period ended
January 31, 20131
(unaudited) | |
Net asset value, beginning of period | | | $11.10 | |
Net investment income | | | 0.02 | |
Net realized and unrealized gains (losses) on investments | | | 0.71 | |
| | | | |
Total from investment operations | | | 0.73 | |
Distributions to shareholders from | | | | |
Net investment income | | | (0.15 | ) |
Net realized gains | | | (0.64 | ) |
| | | | |
Total distributions to shareholders | | | (0.79 | ) |
Net asset value, end of period | | $ | 11.04 | |
Total return2 | | | 7.10 | % |
Ratios to average net assets (annualized) | | | | |
Gross expenses | | | 0.73 | % |
Net expenses | | | 0.65 | % |
Net investment income | | | 1.23 | % |
Supplemental data | | | | |
Portfolio turnover rate | | | 16 | % |
Net assets, end of period (000s omitted) | | | $54 | |
| 1. | For the period from November 30, 2012 (commencement of class operations) to January 31, 2013 |
| 2. | Returns for periods of less than one year are not annualized. |
The accompanying notes are an integral part of these financial statements.
| | | | |
| 20 | | Wells Fargo Advantage Intrinsic Value Fund | | Financial highlights |
(For a share outstanding throughout each period)
| | | | | | | | | | | | | | | | |
| | | Six months ended
January 31, 2013
(unaudited) | | | Year ended July 31 | |
| ADMINISTRATOR CLASS | | | 2012 | | | 2011 | | | 20101 | |
Net asset value, beginning of period | | $ | 10.78 | | | $ | 11.55 | | | | $9.87 | | | $ | 9.87 | |
Net investment income | | | 0.06 | 2 | | | 0.12 | 2 | | | 0.11 | 2 | | | 0.00 | |
Net realized and unrealized gains (losses) on investments | | | 1.33 | | | | 0.28 | | | | 1.68 | | | | 0.00 | |
| | | | | | | | | | | | | | | | |
Total from investment operations | | | 1.39 | | | | 0.40 | | | | 1.79 | | | | 0.00 | |
Distributions to shareholders from | | | | | | | | | | | | | | | | |
Net investment income | | | (0.14 | ) | | | (0.04 | ) | | | (0.11 | ) | | | 0.00 | |
Net realized gains | | | (0.64 | ) | | | (1.13 | ) | | | 0.00 | | | | 0.00 | |
| | | | | | | | | | | | | | | | |
Total distributions to shareholders | | | (0.78 | ) | | | (1.17 | ) | | | (0.11 | ) | | | 0.00 | |
Net asset value, end of period | | $ | 11.39 | | | $ | 10.78 | | | $ | 11.55 | | | $ | 9.87 | |
Total return3 | | | 13.34 | % | | | 4.57 | % | | | 18.23 | % | | | 0.00 | % |
Ratios to average net assets (annualized) | | | | | | | | | | | | | | | | |
Gross expenses | | | 1.06 | % | | | 1.09 | % | | | 1.06 | % | | | 0.00 | % |
Net expenses | | | 0.95 | % | | | 0.95 | % | | | 0.95 | % | | | 0.00 | % |
Net investment income | | | 1.11 | % | | | 1.13 | % | | | 1.04 | % | | | 0.00 | % |
Supplemental data | | | | | | | | | | | | | | | | |
Portfolio turnover rate | | | 16 | % | | | 34 | % | | | 25 | % | | | 23 | % |
Net assets, end of period (000s omitted) | | | $35,729 | | | | $26,687 | | | | $9,693 | | | | $10 | |
| 1. | For the period from July 30, 2010 (commencement of class operations) to July 31, 2010 |
| 2. | Calculated based upon average shares outstanding. |
| 3. | Returns for periods of less than one year are not annualized. |
The accompanying notes are an integral part of these financial statements.
| | | | | | |
| Financial highlights | | Wells Fargo Advantage Intrinsic Value Fund | | | 21 | |
(For a share outstanding throughout each period)
| | | | | | | | | | | | | | | | | | | | | | | | |
| | | Six months ended
January 31, 2013
(unaudited) | | | Year ended July 31 | |
| INSTITUTIONAL CLASS | | | 2012 | | | 2011 | | | 20101 | | | 20091 | | | 20081 | |
Net asset value, beginning of period | | $ | 10.48 | | | $ | 11.56 | | | $ | 9.87 | | | $ | 8.51 | | | $ | 10.22 | | | $ | 11.55 | |
Net investment income | | | 0.08 | | | | 0.14 | 2 | | | 0.13 | 2 | | | 0.12 | 2 | | | 0.12 | | | | 0.14 | 2 |
Net realized and unrealized gains (losses) on investments | | | 1.28 | | | | 0.24 | | | | 1.67 | | | | 1.32 | | | | (1.72 | ) | | | (0.98 | ) |
| | | | | | | | | | | | | | | | | | | | | | | | |
Total from investment operations | | | 1.36 | | | | 0.38 | | | | 1.80 | | | | 1.44 | | | | (1.60 | ) | | | (0.84 | ) |
Distributions to shareholders from | | | | | | | | | | | | | | | | | | | | | | | | |
Net investment income | | | (0.15 | ) | | | (0.33 | ) | | | (0.11 | ) | | | (0.08 | ) | | | (0.05 | ) | | | (0.07 | ) |
Net realized gains | | | (0.64 | ) | | | (1.13 | ) | | | 0.00 | | | | 0.00 | | | | (0.06 | ) | | | (0.42 | ) |
| | | | | | | | | | | | | | | | | | | | | | | | |
Total distributions to shareholders | | | (0.79 | ) | | | (1.46 | ) | | | (0.11 | ) | | | (0.08 | ) | | | (0.11 | ) | | | (0.49 | ) |
Net asset value, end of period | | | $11.05 | | | | $10.48 | | | | $11.56 | | | | $9.87 | | | | $8.51 | | | | $10.22 | |
Total return3 | | | 13.43 | % | | | 4.71 | % | | | 18.32 | % | | | 16.93 | % | | | (15.44 | )% | | | (7.66 | )% |
Ratios to average net assets (annualized) | | | | | | | | | | | | | | | | | | | | | | | | |
Gross expenses | | | 0.79 | % | | | 0.83 | % | | | 0.79 | % | | | 0.94 | % | | | 0.92 | % | | | 0.89 | % |
Net expenses | | | 0.76 | % | | | 0.82 | % | | | 0.79 | % | | | 0.88 | % | | | 0.91 | % | | | 0.88 | % |
Net investment income | | | 1.33 | % | | | 1.35 | % | | | 1.16 | % | | | 1.27 | % | | | 1.86 | % | | | 1.25 | % |
Supplemental data | | | | | | | | | | | | | | | | | | | | | | | | |
Portfolio turnover rate | | | 16 | % | | | 34 | % | | | 25 | % | | | 23 | % | | | 23 | % | | | 26 | % |
Net assets, end of period (000s omitted) | | | $225,784 | | | | $222,949 | | | | $277,329 | | | | $1,109,507 | | | | $348,093 | | | | $299,456 | |
| 1. | After the close of business on July 16, 2010, the Fund acquired the net assets of Evergreen Intrinsic Value Fund which became the accounting and performance survivor in the transaction. The information for the periods prior to July 19, 2010 is that of Class I of Evergreen Intrinsic Value Fund. |
| 2. | Calculated based upon average shares outstanding. |
| 3. | Returns for periods of less than one year are not annualized. |
The accompanying notes are an integral part of these financial statements.
| | | | |
| 22 | | Wells Fargo Advantage Intrinsic Value Fund | | Notes to financial statements (unaudited) |
1. ORGANIZATION
Wells Fargo Funds Trust (the “Trust”), a Delaware statutory trust organized on March 10, 1999, is an open-end management investment company registered under the Investment Company Act of 1940, as amended (the “1940 Act”). These financial statements report on Wells Fargo Advantage Intrinsic Value Fund (the “Fund”) which is a diversified series of the Trust.
2. SIGNIFICANT ACCOUNTING POLICIES
The following significant accounting policies, which are consistently followed in the preparation of the financial statements of the Fund, are in conformity with U.S. generally accepted accounting principles which require management to make estimates and assumptions that affect the reported amounts of assets and liabilities, disclosure of contingent assets and liabilities at the date of the financial statements, and the reported amounts of revenues and expenses during the reporting period. Actual results could differ from those estimates.
Securities valuation
All investments are valued each business day as of the close of regular trading on the New York Stock Exchange (normally 4 p.m. Eastern Time).
Equity securities that are listed on a foreign or domestic exchange, except for The Nasdaq Stock Market, Inc. (“Nasdaq”), are valued at the official closing price or, if none, the last sales price. Securities listed on Nasdaq are valued at the Nasdaq Official Closing Price (“NOCP”). If no NOCP is available, securities are valued at the last sales price. If no sales price is shown on the Nasdaq, the bid price will be used. If no sale occurs on the primary exchange or market for the security that day or if no sale occurs and no bid price is shown on Nasdaq, the prior day’s price will be deemed “stale” and fair values will be determined in accordance with the Fund’s Valuation Procedures.
Investments in registered open-end investment companies are valued at net asset value. Non-registered investment companies are fair valued at net asset value.
Investments which are not valued using any of the methods discussed above are valued at their fair value, as determined by procedures established in good faith and approved by the Board of Trustees. The Board of Trustees has established a Valuation Committee comprised of the Trustees and has delegated to it the authority to take any actions regarding the valuation of portfolio securities that the Valuation Committee deems necessary or appropriate, including determining the fair value of portfolio securities, unless the determination has been delegated to the Management Valuation Team of Wells Fargo Funds Management, LLC (“Funds Management”). The Board of Trustees retains the authority to make or ratify any valuation decisions or approve any changes to the Valuation Procedures as it deems appropriate. On a quarterly basis, the Board of Trustees receives reports on any valuation actions taken by the Valuation Committee or the Management Valuation Team which may include items for ratification.
Valuations of fair valued securities are compared to the next actual sales price when available, or other appropriate market information to assess the continued appropriateness of the fair valuation methodology used. These securities are fair valued on a day-to-day basis, taking into consideration changes to appropriate market information and any significant changes to the input factors considered in the valuation process until there is a readily available price provided on the exchange or by an independent pricing service. Valuations received from an independent pricing service or broker quotes are periodically validated by comparisons to most recent trades and valuations provided by other independent pricing services in addition to the review of prices by the adviser and/or subadviser. Unobservable inputs used in determining fair valuations are identified based on the type of security, taking into consideration factors utilized by market participants in valuing the investment, knowledge about the issuer and the current market environment.
Security loans
The Fund may lend its securities from time to time in order to earn additional income in the form of fees or interest on securities received as collateral or the investment of any cash received as collateral. The Fund continues to receive interest or dividends on the securities loaned. The Fund receives collateral in the form of cash or securities with a value at least equal to the value of the securities on loan. The value of the loaned securities is determined at the close of each business day and any additional required collateral is delivered to the Fund on the next business day. In a securities lending transaction, the net asset value of the Fund will be affected by an increase or decrease in the value of the securities loaned and by an increase or decrease in the value of the instrument in which collateral is invested. The amount of securities lending activity undertaken by the Fund fluctuates from time to time. In the event of default or bankruptcy by the borrower, the Fund may be prevented from recovering the loaned securities or gaining access to the collateral or may experience delays or costs in doing so. In addition, the investment of any cash collateral received may lose all or part of its value. The Fund has the right under the lending agreement to recover the securities from the borrower on demand.
| | | | | | |
| Notes to financial statements (unaudited) | | Wells Fargo Advantage Intrinsic Value Fund | | | 23 | |
The Fund lends its securities through an unaffiliated securities lending agent. Cash collateral received in connection with its securities lending transactions is invested in Wells Fargo Securities Lending Cash Investments, LLC (the “Cash Collateral Fund”). The Cash Collateral Fund is exempt from registration under Section 3(c)(7) of the 1940 Act and is managed by Funds Management and is subadvised by Wells Capital Management Incorporated (“WellsCap”). Funds Management receives an advisory fee starting at 0.05% and declining to 0.01% as the average daily net assets of the Cash Collateral Fund increase. All of the fees received by Funds Management are paid to WellsCap for its services as subadviser. The Cash Collateral Fund seeks to provide a positive return compared to the daily Fed Funds Open rate by investing in high-quality, U.S. dollar-denominated short-term money market instruments. Cash Collateral Fund investments are fair valued based upon the amortized cost valuation technique. Income earned from investment in the Cash Collateral Fund is included in securities lending income on the Statement of Operations.
Security transactions and income recognition
Securities transactions are recorded on a trade date basis. Realized gains or losses are recorded on the basis of identified cost.
Dividend income is recognized on the ex-dividend date. Dividend income is recorded net of foreign taxes withheld where recovery of such taxes is not assured.
Distributions to shareholders
Distributions to shareholders from net investment income and net realized gains, if any, are recorded on the ex-dividend date. Such distributions are determined in conformity with federal income tax regulations, which may differ in amount or character from net investment income and realized gains recognized for purposes of U.S. generally accepted accounting principles.
Federal and other taxes
The Fund intends to continue to qualify as a regulated investment company by distributing substantially all of its investment company taxable income and any net realized capital gains (after reduction for capital loss carryforwards) sufficient to relieve it from all, or substantially all, federal income taxes. Accordingly, no provision for federal income taxes was required.
The Fund’s income and federal excise tax returns and all financial records supporting those returns for the prior three fiscal years are subject to examination by the federal and Delaware revenue authorities. Management has analyzed the Fund’s tax positions taken on federal, state, and foreign tax returns for all open tax years and does not believe that there are any uncertain tax positions that require recognition of a tax liability.
Class allocations
The separate classes of shares offered by the Fund differ principally in applicable sales charges, distribution, shareholder servicing, and administration fees. Shareholders of each class bear certain expenses that pertain to that particular class. All shareholders bear the common expenses of the Fund, earn income from the portfolio, and are allocated any unrealized gains and losses pro rata based on the average daily net assets of each class, without distinction between share classes. Dividends are determined separately for each class based on income and expenses allocable to each class. Realized gains and losses are allocated to each class pro rata based upon the net assets of each class on the date realized. Differences in per share dividend rates generally result from the relative weightings of pro rata income and realized gain allocations and from differences in separate class expenses, including distribution, shareholder servicing, and administration fees.
3. FAIR VALUATION MEASUREMENTS
Fair value measurements of investments are determined within a framework that has established a fair value hierarchy based upon the various data inputs utilized in determining the value of the Fund’s investments. The three-level hierarchy gives the highest priority to unadjusted quoted prices in active markets for identical assets or liabilities (Level 1) and the lowest priority to significant unobservable inputs (Level 3). The Fund’s investments are classified within the fair value hierarchy based on the lowest level of input that is significant to the fair value measurement. The inputs are summarized into three broad levels as follows:
| n | | Level 1 – quoted prices in active markets for identical securities |
| n | | Level 2 – other significant observable inputs (including quoted prices for similar securities, interest rates, prepayment speeds, credit risk, use of amortized cost, etc.) |
| n | | Level 3 – significant unobservable inputs (including the Fund’s own assumptions in determining the fair value of investments) |
| | | | |
| 24 | | Wells Fargo Advantage Intrinsic Value Fund | | Notes to financial statements (unaudited) |
The inputs or methodologies used for valuing investments in securities are not necessarily an indication of the risk associated with investing in those securities.
As of January 31, 2013, the inputs used in valuing investments in securities, which are carried at fair value, were as follows:
| | | | | | | | | | | | | | | | |
| Investments in securities | | Quoted prices (Level 1) | | | Significant other observable Inputs (Level 2) | | | Significant unobservable inputs (Level 3) | | | Total | |
| | | | |
Equity securities | | | | | | | | | | | | | | | | |
Common stocks | | $ | 364,931,254 | | | $ | 0 | | | $ | 0 | | | $ | 364,931,254 | |
| | | | |
Short-term investments | | | | | | | | | | | | | | | | |
Investment companies | | | 11,711,547 | | | | 44,399,450 | | | | 0 | | | | 56,110,997 | |
| | | $ | 376,642,801 | | | $ | 44,399,450 | | | $ | 0 | | | $ | 421,042,251 | |
Further details on the major security types listed above can be found in the Portfolio of Investments.
Transfers in and transfers out are recognized at the end of the reporting period. For the six months ended January 31, 2013, the Fund did not have any transfers into/out of Level 1 or Level 2.
4. TRANSACTIONS WITH AFFILIATES AND OTHER EXPENSES
Advisory fee
The Trust has entered into an advisory contract with Funds Management, an indirect wholly owned subsidiary of Wells Fargo & Company (“Wells Fargo”). The adviser is responsible for implementing investment policies and guidelines and for supervising the subadviser, who is responsible for day-to-day portfolio management of the Fund.
Pursuant to the contract, Funds Management is entitled to receive an annual advisory fee starting at 0.65% and declining to 0.55% as the average daily net assets of the Fund increase. For the six months ended January 31, 2013, the advisory fee was equivalent to an annual rate of 0.65% of the Fund’s average daily net assets.
Funds Management has retained the services of a subadviser to provide daily portfolio management to the Fund. The fee for subadvisory services is borne by Funds Management. Metropolitan West Capital Management, LLC, an affiliate of Funds Management, is the subadviser to the Fund and is entitled to receive a fee from Funds Management at an annual rate starting at 0.35% and declining to 0.25% as the average daily net assets of the Fund increase.
Administration and transfer agent fees
The Trust has entered into an administration agreement with Funds Management. Under this agreement, for providing administrative services, which includes paying fees and expenses for services provided by the transfer agent, sub-transfer agents, omnibus account servicers and record-keepers, Funds Management is entitled to receive from the Fund an annual fund level administration fee starting at 0.05% and declining to 0.03% as the average daily net assets of the Fund increase and a class level administration fee which is calculated based on the average daily net assets of each class as follows:
| | | | |
| | | Class level administration fee | |
Class A, Class B, Class C | | | 0.26 | % |
Class R4, Institutional Class | | | 0.08 | |
Class R6 | | | 0.03 | |
Administrator Class | | | 0.10 | |
Funds Management has contractually waived and/or reimbursed advisory and administration fees to the extent necessary to maintain certain net operating expense ratios for the Fund. Waiver of fees and/or reimbursement of expenses by Funds Management were made first from fund level expenses on a proportionate basis and then from class specific expenses. Funds Management has committed through November 30, 2014 to waive fees and/or reimburse expenses to the extent necessary to cap the Fund’s expenses at 1.16% for Class A shares, 1.91% for Class B shares, 1.91% for Class C shares, 0.80% for Class R4 shares, 0.65% for Class R6 shares, 0.95% for Administrator Class shares, and 0.70% for Institutional Class shares.
| | | | | | |
| Notes to financial statements (unaudited) | | Wells Fargo Advantage Intrinsic Value Fund | | | 25 | |
Distribution fees
The Trust has adopted a Distribution Plan for Class B and Class C shares of the Fund pursuant to Rule 12b-1 under the 1940 Act. Distribution fees are charged to Class B and Class C shares and paid to Wells Fargo Funds Distributor, LLC, the principal underwriter, at an annual rate of 0.75% of the average daily net assets of Class B and Class C shares.
For the six months ended January 31, 2013, Wells Fargo Funds Distributor, LLC received $6,885 from the sale of Class A shares and $100, $378, and $34 in contingent deferred sales charges from redemptions of Class A, Class B, and Class C shares, respectively.
Shareholder servicing fees
The Trust has entered into contracts with one or more shareholder servicing agents, whereby Class A, Class B, Class C, and Administrator Class of the Fund is charged a fee at an annual rate of 0.25% of the average daily net assets of each respective class. Class R4 shares are charged a fee at an annual rate of 0.10% of its average daily net assets.
A portion of these total shareholder servicing fees were paid to affiliates of Wells Fargo.
5. INVESTMENT PORTFOLIO TRANSACTIONS
Purchases and sales of investments, excluding U.S. government obligations (if any) and short-term securities, for the six months ended January 31, 2013 were $53,892,236 and $82,095,876, respectively.
6. BANK BORROWINGS
The Trust (excluding the money market funds and certain other funds in the Trust) and Wells Fargo Variable Trust are parties to a $150,000,000 revolving credit agreement with State Street Bank and Trust Company, whereby the Fund is permitted to use bank borrowings for temporary or emergency purposes, such as to fund shareholder redemption requests. Interest under the credit agreement is charged to the Fund based on a borrowing rate equal to the higher of the Federal Funds rate in effect on that day plus 1.25% or the overnight LIBOR rate in effect on that day plus 1.25%. In addition, an annual commitment fee equal to 0.10% of the unused balance is allocated to each participating fund. For the six months ended January 31, 2013, the Fund paid $159 in commitment fees.
For the six months ended January 31, 2013, there were no borrowings by the Fund under the agreement.
7. INDEMNIFICATION
Under the Trust’s organizational documents, the officers and directors are indemnified against certain liabilities that may arise out of performance of their duties to the Trust. Additionally, in the normal course of business, the Trust may enter into contracts with service providers that contain a variety of indemnification clauses. The Trust’s maximum exposure under these arrangements is dependent on future claims that may be made against the Fund and, therefore, cannot be estimated.
8. NEW ACCOUNTING PRONOUNCEMENT
In December 2011, the Financial Accounting Standards Board (“FASB”) issued Accounting Standard Update (“ASU”) No. 2011-11, Disclosures about Offsetting Assets and Liabilities. ASU 2011-11, which amends FASB ASC Topic 210, Balance Sheet, creates new disclosure requirements which require entities to disclose both gross and net information for derivatives and other financial instruments that are either offset in the Statement of Assets and Liabilities or subject to an enforceable master netting arrangement or similar agreement. The disclosure requirements are effective for interim and annual reporting periods beginning on or after January 1, 2013. Management is currently assessing the potential impact, in addition to expanded financial statement disclosure, that may result from adopting this ASU.
| | | | |
| 26 | | Wells Fargo Advantage Intrinsic Value Fund | | Other information (unaudited) |
PROXY VOTING INFORMATION
A description of the policies and procedures that the Fund uses to determine how to vote proxies relating to portfolio securities is available without charge, upon request, by calling 1-800-222-8222, visiting our website at wellsfargoadvantagefunds.com, or visiting the SEC website at sec.gov. Information regarding how the Fund voted proxies relating to portfolio securities during the most recent 12-month period ended June 30 is available without charge on the Fund’s website at wellsfargoadvantagefunds.com or by visiting the SEC website at sec.gov.
PORTFOLIO HOLDINGS INFORMATION
The complete portfolio holdings for the Fund are publicly available on the Fund’s website (wellsfargoadvantagefunds.com) on a monthly, 30-day or more delayed basis. In addition, top ten holdings information for the Fund is publicly available on the Fund’s website on a monthly, seven-day or more delayed basis. The Fund files its complete schedule of portfolio holdings with the SEC for the first and third quarters of each fiscal year on Form N-Q, which is available without charge by visiting the SEC website at sec.gov. In addition, the Fund’s Form N-Q may be reviewed and copied at the SEC’s Public Reference Room in Washington, DC, and at regional offices in New York City, at 233 Broadway, and in Chicago, at 175 West Jackson Boulevard, Suite 900. Information about the Public Reference Room may be obtained by calling 1-800-SEC-0330.
| | | | | | |
| Other information (unaudited) | | Wells Fargo Advantage Intrinsic Value Fund | | | 27 | |
BOARD OF TRUSTEES AND OFFICERS
Each of the Trustees and Officers listed in the table below acts in identical capacities for the Wells Fargo Advantage family of funds, which consists of 136 funds1 comprising the Wells Fargo Funds Trust, Wells Fargo Variable Trust, Wells Fargo Master Trust and four closed-end funds (collectively the “Fund Complex”). This table should be read in conjunction with the Prospectus and the Statement of Additional Information2. All of the Trustees are also Members of the Audit and Governance Committees of each Trust in the Fund Complex. The mailing address of each Trustee and Officer is 525 Market Street, 12th Floor, San Francisco, CA 94105. Each Trustee and Officer serves an indefinite term, however, each Trustee serves such term until reaching the mandatory retirement age established by the Trustees.
Independent Trustees
| | | | | | |
Name and year of birth | | Position held and length of service* | | Principal occupations during past five years | | Other directorships during past five years |
Peter G. Gordon (Born 1942) | | Trustee, since 1998; Chairman, since 2005 | | Co-Founder, Retired Chairman, President and CEO of Crystal Geyser Water Company. Trustee Emeritus, Colby College. | | Asset Allocation Trust |
| Isaiah Harris, Jr. (Born 1952) | | Trustee, since 2009 | | Retired. Prior thereto, President and CEO of BellSouth Advertising and Publishing Corp. from 2005 to 2007, President and CEO of BellSouth Enterprises from 2004 to 2005 and President of BellSouth Consumer Services from 2000 to 2003. Emeritus member of the Iowa State University Foundation Board of Governors. Emeritus Member of the Advisory Board of Iowa State University School of Business. Advisory Board Member, Palm Coast Academy (charter school). Mr. Harris is a certified public accountant. | | CIGNA Corporation; Deluxe Corporation; Asset Allocation Trust |
Judith M. Johnson (Born 1949) | | Trustee, since 2008;
Audit Committee Chairman, since 2008 | | Retired. Prior thereto, Chief Executive Officer and Chief Investment Officer of Minneapolis Employees Retirement Fund from 1996 to 2008. Ms. Johnson is an attorney, certified public accountant and a certified managerial accountant. | | Asset Allocation Trust |
Leroy Keith, Jr. (Born 1939) | | Trustee, since 2010 | | Chairman, Bloc Global Services (development and construction). Trustee of the Evergreen Funds from 1983 to 2010. Former Managing Director, Almanac Capital Management (commodities firm), former Partner, Stonington Partners, Inc. (private equity fund), former Director, Obagi Medical Products Co. and former Director, Lincoln Educational Services. | | Trustee, Virtus Fund Complex (consisting of 48 portfolios as of 1/31/2013); Asset Allocation Trust |
David F. Larcker (Born 1950) | | Trustee, since 2009 | | James Irvin Miller Professor of Accounting at the Graduate School of Business, Stanford University, Morgan Stanley Director of the Center for Leadership Development and Research and Senior Faculty of The Rock Center for Corporate Governance since 2006. From 2005 to 2008, Professor of Accounting at the Graduate School of Business, Stanford University. Prior thereto, Ernst & Young Professor of Accounting at The Wharton School, University of Pennsylvania from 1985 to 2005. | | Asset Allocation Trust |
Olivia S. Mitchell (Born 1953) | | Trustee, since 2006 | | International Foundation of Employee Benefit Plans Professor, Wharton School of the University of Pennsylvania since 1993. Director of Wharton’s Pension Research Council and Boettner Center on Pensions & Retirement Research, and Research Associate at the National Bureau of Economic Research. Previously, Cornell University Professor from 1978 to 1993. | | Asset Allocation Trust |
Timothy J. Penny (Born 1951) | | Trustee, since 1996 | | President and CEO of Southern Minnesota Initiative Foundation, a non-profit organization, since 2007 and Senior Fellow at the Humphrey Institute Policy Forum at the University of Minnesota since 1995. Member of the Board of Trustees of NorthStar Education Finance, Inc., a non-profit organization, since 2007. | | Asset Allocation Trust |
| | | | |
| 28 | | Wells Fargo Advantage Intrinsic Value Fund | | Other information (unaudited) |
| | | | | | |
Name and year of birth | | Position held and length of service* | | Principal occupations during past five years | | Other directorships during past five years |
| Michael S. Scofield (Born 1943) | | Trustee, since 2010 | | Served on the Investment Company Institute’s Board of Governors and Executive Committee from 2008-2011 as well the Governing Council of the Independent Directors Council from 2006-2011 and the Independent Directors Council Executive Committee from 2008-2011. Chairman of the IDC from 2008-2010. Institutional Investor (Fund Directions) Trustee of Year in 2007. Trustee of the Evergreen Funds (and its predecessors) from 1984 to 2010. Chairman of the Evergreen Funds from 2000-2010. Former Trustee of the Mentor Funds. Retired Attorney, Law Offices of Michael S. Scofield. | | Asset Allocation Trust |
Donald C. Willeke (Born 1940) | | Trustee, since 1996 | | Principal of the law firm of Willeke & Daniels. General Counsel of the Minneapolis Employees Retirement Fund from 1984 until its consolidation into the Minnesota Public Employees Retirement Association on June 30, 2010. Director and Vice Chair of The Tree Trust (non-profit corporation). Director of the American Chestnut Foundation (non-profit corporation). | | Asset Allocation Trust |
| * | Length of service dates reflect the Trustee’s commencement of service with the Trust’s predecessor entities, where applicable. |
Officers
| | | | | | |
Name and year of birth | | Position held and length of service | | Principal occupations during past five years | | |
| Karla M. Rabusch (Born 1959) | | President, since 2003 | | Executive Vice President of Wells Fargo Bank, N.A. and President of Wells Fargo Funds Management, LLC since 2003. | | |
| Jeremy DePalma1 (Born 1974) | | Treasurer, since 2012 | | Senior Vice President of Wells Fargo Funds Management, LLC since 2009. Senior Vice President of Evergreen Investment Management Company, LLC from 2008 to 2010. Vice President, Evergreen Investment Services, Inc. from 2004 to 2007. Head of the Fund Reporting and Control Team within Fund Administration from 2005 to 2010. | | |
| C. David Messman (Born 1960) | | Secretary, since 2000; Chief Legal Officer, since 2003 | | Senior Vice President and Secretary of Wells Fargo Funds Management, LLC since 2001. Vice President and Managing Counsel of Wells Fargo Bank, N.A. since 1996. | | |
Debra Ann Early (Born 1964) | | Chief Compliance Officer, since 2007 | | Chief Compliance Officer of Wells Fargo Funds Management, LLC since 2007. Chief Compliance Officer of Parnassus Investments from 2005 to 2007. Chief Financial Officer of Parnassus Investments from 2004 to 2007. | | |
David Berardi (Born 1975) | | Assistant Treasurer, since 2009 | | Vice President of Wells Fargo Funds Management, LLC since 2009. Vice President of Evergreen Investment Management Company, LLC from 2008 to 2010. Assistant Vice President of Evergreen Investment Services, Inc. from 2004 to 2008. Manager of Fund Reporting and Control for Evergreen Investment Management Company, LLC from 2004 to 2010. | | |
| 1. | Jeremy DePalma acts as Treasurer of 61 funds and Assistant Treasurer of 75 funds in the Fund Complex. |
| 2. | The Statement of Additional Information includes additional information about the Trustees and is available, without charge, upon request, by calling 1-800-222-8222 or by visiting the website at wellsfargoadvantagefunds.com. |
| | | | | | |
| List of abbreviations | | Wells Fargo Advantage Intrinsic Value Fund | | | 29 | |
The following is a list of common abbreviations for terms and entities that may have appeared in this report.
| ACA | — ACA Financial Guaranty Corporation |
| ADR | — American depositary receipt |
| ADS | — American depositary shares |
| AGC | — Assured Guaranty Corporation |
| AGM | — Assured Guaranty Municipal |
| Ambac | — Ambac Financial Group Incorporated |
| AMT | — Alternative minimum tax |
| BAN | — Bond anticipation notes |
| BHAC | — Berkshire Hathaway Assurance Corporation |
| CAB | — Capital appreciation bond |
| CCAB | — Convertible capital appreciation bond |
| CDA | — Community Development Authority |
| CDO | — Collateralized debt obligation |
| COP | — Certificate of participation |
| DRIVER | — Derivative inverse tax-exempt receipts |
| DW&P | — Department of Water & Power |
| DWR | — Department of Water Resources |
| ECFA | — Educational & Cultural Facilities Authority |
| EDA | — Economic Development Authority |
| EDFA | — Economic Development Finance Authority |
| ETF | — Exchange-traded fund |
| FDIC | — Federal Deposit Insurance Corporation |
| FFCB | — Federal Farm Credit Banks |
| FGIC | — Financial Guaranty Insurance Corporation |
| FHA | — Federal Housing Administration |
| FHLB | — Federal Home Loan Bank |
| FHLMC | — Federal Home Loan Mortgage Corporation |
| FICO | — The Financing Corporation |
| FNMA | — Federal National Mortgage Association |
| GDR | — Global depositary receipt |
| GNMA | —�� Government National Mortgage Association |
| HCFR | — Healthcare facilities revenue |
| HEFA | — Health & Educational Facilities Authority |
| HEFAR | — Higher education facilities authority revenue |
| HFA | — Housing Finance Authority |
| HFFA | — Health Facilities Financing Authority |
| HUD | — Department of Housing and Urban Development |
| IDA | — Industrial Development Authority |
| IDAG | — Industrial Development Agency |
| IDR | — Industrial development revenue |
| KRW | — Republic of Korea won |
| LIBOR | — London Interbank Offered Rate |
| LLC | — Limited liability company |
| LLP | — Limited liability partnership |
| MBIA | — Municipal Bond Insurance Association |
| MFHR | — Multifamily housing revenue |
| MSTR | — Municipal securities trust receipts |
| MUD | — Municipal Utility District |
| National | — National Public Finance Guarantee Corporation |
| PCFA | — Pollution Control Financing Authority |
| PCL | — Public Company Limited |
| PCR | — Pollution control revenue |
| PFA | — Public Finance Authority |
| PFFA | — Public Facilities Financing Authority |
| PFOTER | — Puttable floating option tax-exempt receipts |
| plc | — Public limited company |
| PUTTER | — Puttable tax-exempt receipts |
| R&D | — Research & development |
| Radian | — Radian Asset Assurance |
| RAN | — Revenue anticipation notes |
| RDA | — Redevelopment Authority |
| RDFA | — Redevelopment Finance Authority |
| REIT | — Real estate investment trust |
| ROC | — Reset option certificates |
| SAVRS | — Select auction variable rate securities |
| SBA | — Small Business Authority |
| SFHR | — Single-family housing revenue |
| SFMR | — Single-family mortgage revenue |
| SPA | — Standby purchase agreement |
| SPDR | — Standard & Poor’s Depositary Receipts |
| STRIPS | — Separate trading of registered interest and principal securities |
| TAN | — Tax anticipation notes |
| TIPS | — Treasury inflation-protected securities |
| TRAN | — Tax revenue anticipation notes |
| TTFA | — Transportation Trust Fund Authority |
| TVA | — Tennessee Valley Authority |
This page is intentionally left blank.


For more information
More information about Wells Fargo Advantage Funds is available free upon request. To obtain literature, please write, email, visit the Fund’s website, or call:
Wells Fargo Advantage Funds
P.O. Box 8266
Boston, MA 02266-8266
Email: wfaf@wellsfargo.com
Website: wellsfargoadvantagefunds.com
Individual investors: 1-800-222-8222
Retail investment professionals: 1-888-877-9275
Institutional investment professionals: 1-866-765-0778
This report and the financial statements contained herein are submitted for the general information of the shareholders of Wells Fargo Advantage Funds. If this report is used for promotional purposes, distribution of the report must be accompanied or preceded by a current prospectus. For a current prospectus and, if available, a summary prospectus containing more complete information, including charges and expenses, call 1-800-222-8222 or visit the Fund’s website at wellsfargoadvantagefunds.com. Please consider the investment objectives, risks, charges, and expenses of the investment carefully before investing. This and other information about Wells Fargo Advantage Funds can be found in the current prospectus. Read the prospectus carefully before you invest or send money.
Wells Fargo Funds Management, LLC, a wholly owned subsidiary of Wells Fargo & Company, provides investment advisory and administrative services for Wells Fargo Advantage Funds. Other affiliates of Wells Fargo & Company provide subadvisory and other services for the Funds. The Funds are distributed by Wells Fargo Funds Distributor, LLC, Member FINRA/SIPC, an affiliate of Wells Fargo & Company.
NOT FDIC INSURED ¡ NO BANK GUARANTEE ¡ MAY LOSE VALUE
© 2013 Wells Fargo Funds Management, LLC. All rights reserved.
| | |
 | | 215105 03-13 SA207/SAR207 1-13 |

Wells Fargo Advantage Large Cap Core Fund

Semi-Annual Report
January 31, 2013

Reduce clutter. Save trees.
Sign up for electronic delivery of prospectuses and shareholder reports at wellsfargo.com/advantagedelivery
Contents
The views expressed and any forward-looking statements are as of January 31, 2013, unless otherwise noted, and are those of the Fund managers and/or Wells Fargo Funds Management, LLC. Discussions of individual securities, or the markets generally, or any Wells Fargo Advantage Fund are not intended as individual recommendations. Future events or results may vary significantly from those expressed in any forward-looking statements; the views expressed are subject to change at any time in response to changing circumstances in the market. Wells Fargo Funds Management, LLC, disclaims any obligation to publicly update or revise any views expressed or forward-looking statements.
NOT FDIC INSURED ¡ NO BANK GUARANTEE ¡ MAY LOSE VALUE

Wells Fargo investment history
| | |
| 1932 | | Keystone creates one of the first mutual fund families. |
| 1971 | | Wells Fargo & Company introduces one of the first institutional index funds. |
| 1978 | | Wells Fargo applies Markowitz and Sharpe’s research on Modern Portfolio Theory to introduce one of the industry’s first tactical asset allocation models in institutional separately managed accounts. |
| 1984 | | Wells Fargo Stagecoach Funds launches its first asset allocation fund. |
| 1989 | | The Tactical Asset Allocation (TAA) Model is first applied to Wells Fargo’s asset allocation mutual funds. |
| 1994 | | Wells Fargo introduces the LifePath Funds, one of the first suites of target date funds (now the Wells Fargo Advantage Dow Jones Target Date FundsSM). |
| 1996 | | Evergreen Investments and Keystone Funds merge. |
| 1997 | | Wells Fargo launches the Wells Fargo Advantage WealthBuilder PortfoliosSM, a fund-of-funds suite of products that includes the use of quantitative models to shift assets among investment styles. |
| 1999 | | Norwest Advantage Funds and Stagecoach Funds are reorganized into Wells Fargo Funds after the merger of Norwest and Wells Fargo. |
| 2002 | | Evergreen Retail and Evergreen Institutional companies form the umbrella asset management company, Evergreen Investments. |
| 2005 | | The integration of Strong Funds with Wells Fargo Funds creates Wells Fargo Advantage Funds, resulting in one of the top 20 mutual fund companies in the United States. |
| 2006 | | Wells Fargo Advantage Funds relaunches the target date product line as Wells Fargo Advantage Dow Jones Target Date Funds. |
| 2010 | | The mergers and reorganizations of Evergreen and Wells Fargo Advantage mutual funds are completed, unifying the families under the brand of Wells Fargo Advantage Funds. |
Wells Fargo Advantage Funds®
Wells Fargo Advantage Funds skillfully guides institutions, financial advisors, and individuals through the investment terrain to help them reach their financial objectives. Everything we do on behalf of investors is backed by our unique combination of qualifications.
Strength
Our organization is built on the standards of integrity and service established by our parent company—Wells Fargo & Company—more than 150 years ago. And, because we’re part of a highly diversified financial enterprise, we offer the depth of resources to help investors succeed.
Expertise
Our multi-boutique model offers investors access to the independent thinking of premier investment managers that have been chosen for their time-tested strategies. While each team specializes in a specific investment strategy, collectively they provide investors a wide choice of distinct investment styles. Our dedication to investment excellence doesn’t end with our expertise in manager selection—risk management, analysis, and rigorous ongoing review seek to ensure each manager’s investment process remains consistent.
Partnership
Our collaborative approach is built around understanding the needs and goals of our clients. By adhering to core principles of sound judgment and steady guidance, we support you through every stage of the investment decision process.
Carefully consider the investment objectives, risks, charges, and expenses before investing. For a current prospectus and, if available, a summary prospectus, for Wells Fargo Advantage Funds, containing this and other information, visit wellsfargoadvantagefunds.com. Read it carefully before investing.
Wells Fargo Funds Management, LLC, a wholly owned subsidiary of Wells Fargo & Company, provides investment advisory and administrative services for Wells Fargo Advantage Funds. Other affiliates of Wells Fargo & Company provide subadvisory and other services for the Funds. The Funds are distributed by Wells Fargo Funds Distributor, LLC, Member FINRA/SIPC, an affiliate of Wells Fargo & Company.
“Dow Jones®” and “Dow Jones Target Date IndexesSM” are service marks of Dow Jones Trademark Holdings LLC (“Dow Jones”); have been licensed to CME Group Index Services LLC (“CME Indexes”); and have been sublicensed for use for certain purposes by Global Index Advisors, Inc., and Wells Fargo Funds Management, LLC. The Wells Fargo Advantage Dow Jones Target Date FundsSM, based on the Dow Jones Target Date Indexes, are not sponsored, endorsed, sold, or promoted by Dow Jones, CME Indexes, or their respective affiliates, and none of them makes any representation regarding the advisability of investing in such product(s).
NOT FDIC INSURED ¡ NO BANK GUARANTEE ¡ MAY LOSE VALUE
Not part of the semi-annual report.
Wells Fargo Advantage Funds offers more than 110 mutual funds across a wide range of asset classes, representing over $226 billion in assets under management, as of January 31, 2013.
| | | | |
| Equity funds | | | | |
Asia Pacific Fund | | Global Opportunities Fund | | Premier Large Company Growth Fund |
C&B Large Cap Value Fund | | Growth Fund | | Small Cap Opportunities Fund |
C&B Mid Cap Value Fund | | Index Fund | | Small Cap Value Fund |
Capital Growth Fund | | International Equity Fund | | Small Company Growth Fund |
Common Stock Fund | | International Value Fund | | Small Company Value Fund |
Disciplined U.S. Core Fund | | Intrinsic Small Cap Value Fund | | Small/Mid Cap Value Fund |
Discovery Fund† | | Intrinsic Value Fund | | Special Mid Cap Value Fund |
Diversified Equity Fund | | Intrinsic World Equity Fund | | Special Small Cap Value Fund |
Diversified International Fund | | Large Cap Core Fund | | Specialized Technology Fund |
Emerging Growth Fund | | Large Cap Growth Fund | | Traditional Small Cap Growth Fund |
Emerging Markets Equity Fund | | Large Company Value Fund | | Utility and Telecommunications Fund |
Emerging Markets Equity Income Fund | | Omega Growth Fund | | |
Endeavor Select Fund† | | Opportunity Fund† | | |
Enterprise Fund† | | Precious Metals Fund | | |
| Bond funds | | | | |
Adjustable Rate Government Fund | | High Yield Municipal Bond Fund | | Short Duration Government Bond Fund |
California Limited-Term Tax-Free Fund | | Income Plus Fund | | Short-Term Bond Fund |
California Tax-Free Fund | | Inflation-Protected Bond Fund | | Short-Term High Yield Bond Fund |
Colorado Tax-Free Fund | | Intermediate Tax/AMT-Free Fund | | Short-Term Municipal Bond Fund |
Core Bond Fund | | International Bond Fund | | Strategic Income Fund |
Emerging Markets Local Bond Fund | | Minnesota Tax-Free Fund | | Strategic Municipal Bond Fund |
Government Securities Fund | | Municipal Bond Fund | | Ultra Short-Term Income Fund |
High Income Fund | | North Carolina Tax-Free Fund | | Ultra Short-Term Municipal Income Fund |
High Yield Bond Fund | | Pennsylvania Tax-Free Fund | | Wisconsin Tax-Free Fund |
| Asset allocation funds | | | | |
Absolute Return Fund | | WealthBuilder Equity Portfolio† | | Target 2020 Fund† |
Asset Allocation Fund | | WealthBuilder Growth Allocation Portfolio† | | Target 2025 Fund† |
Conservative Allocation Fund | | WealthBuilder Growth Balanced Portfolio† | | Target 2030 Fund† |
Diversified Capital Builder Fund | | WealthBuilder Moderate Balanced Portfolio† | | Target 2035 Fund† |
Diversified Income Builder Fund | | WealthBuilder Tactical Equity Portfolio† | | Target 2040 Fund† |
Growth Balanced Fund | | Target Today Fund† | | Target 2045 Fund† |
Index Asset Allocation Fund | | Target 2010 Fund† | | Target 2050 Fund† |
Moderate Balanced Fund | | Target 2015 Fund† | | Target 2055 Fund† |
WealthBuilder Conservative Allocation Portfolio† | | | | |
| Money market funds | | | | |
100% Treasury Money Market Fund | | Heritage Money Market Fund† | | National Tax-Free Money Market Fund |
California Municipal Money Market Fund | | Money Market Fund | | Treasury Plus Money Market Fund |
Cash Investment Money Market Fund | | Municipal Cash Management Money Market Fund | | |
Government Money Market Fund | | Municipal Money Market Fund | | |
| Variable trust funds1 | | | | |
VT Discovery Fund† | | VT Intrinsic Value Fund | | VT Small Cap Growth Fund |
VT Index Asset Allocation Fund | | VT Omega Growth Fund | | VT Small Cap Value Fund |
VT International Equity Fund | | VT Opportunity Fund† | | VT Total Return Bond Fund |
An investment in a money market fund is not insured or guaranteed by the Federal Deposit Insurance Corporation or any other government agency. Although the Wells Fargo Advantage Money Market Funds seek to preserve the value of your investment at $1.00 per share, it is possible to lose money by investing in a money market fund.
| 1. | The variable trust funds are generally available only through insurance company variable contracts. |
| † | In this report, the Wells Fargo Advantage Discovery FundSM, Wells Fargo Advantage Endeavor Select FundSM, Wells Fargo Advantage Enterprise FundSM, Wells Fargo Advantage Opportunity FundSM, Wells Fargo Advantage WealthBuilder Conservative Allocation PortfolioSM, Wells Fargo Advantage WealthBuilder Equity PortfolioSM, Wells Fargo Advantage WealthBuilder Growth Allocation PortfolioSM, Wells Fargo Advantage WealthBuilder Growth Balanced PortfolioSM, Wells Fargo Advantage WealthBuilder Moderate Balanced PortfolioSM, Wells Fargo Advantage WealthBuilder Tactical Equity PortfolioSM, Wells Fargo Advantage Dow Jones Target Today FundSM, Wells Fargo Advantage Dow Jones Target 2010 FundSM, Wells Fargo Advantage Dow Jones Target 2015 FundSM, Wells Fargo Advantage Dow Jones Target 2020 FundSM, Wells Fargo Advantage Dow Jones Target 2025 FundSM, Wells Fargo Advantage Dow Jones Target 2030 FundSM, Wells Fargo Advantage Dow Jones Target 2035 FundSM, Wells Fargo Advantage Dow Jones Target 2040 FundSM, Wells Fargo Advantage Dow Jones Target 2045 FundSM, Wells Fargo Advantage Dow Jones Target 2050 FundSM, Wells Fargo Advantage Dow Jones Target 2055 FundSM, Wells Fargo Advantage Heritage Money Market FundSM, Wells Fargo Advantage VT Discovery FundSM, and Wells Fargo Advantage VT Opportunity FundSM are referred to as the Discovery Fund, Endeavor Select Fund, Enterprise Fund, Opportunity Fund, WealthBuilder Conservative Allocation Portfolio, WealthBuilder Equity Portfolio, WealthBuilder Growth Allocation Portfolio, WealthBuilder Growth Balanced Portfolio, WealthBuilder Moderate Balanced Portfolio, WealthBuilder Tactical Equity Portfolio, Target Today Fund, Target 2010 Fund, Target 2015 Fund, Target 2020 Fund, Target 2025 Fund, Target 2030 Fund, Target 2035 Fund, Target 2040 Fund, Target 2045 Fund, Target 2050 Fund, Target 2055 Fund, Heritage Money Market Fund, VT Discovery Fund, and VT Opportunity Fund, respectively. |
Not part of the semi-annual report.
| | | | |
| 2 | | Wells Fargo Advantage Large Cap Core Fund | | Letter to shareholders (unaudited) |

Karla M. Rabusch
President
Wells Fargo Advantage Funds
Entering the period, concerns about the eurozone sovereign debt situation held center stage as investors again focused on economic weakness in southern European economies.
Aggressive central bank actions helped support stock prices, as did relatively solid economic data.
Dear Valued Shareholder:
We are pleased to offer you this semi-annual report for the Wells Fargo Advantage Large Cap Core Fund for the six-month period that ended January 31, 2013. Much of the period was marked by continued concerns about the possible effects that the ongoing European sovereign debt crisis would have on the global economy. However, relatively solid economic data in the U.S. and efforts by European authorities to address the sovereign debt issue alleviated investor fears and supported global stock markets. Judging by various indexes, U.S. large-cap stocks underperformed small-cap stocks. Within the large-cap universe, value stocks outperformed growth stocks, partly because of strong performance from the financials sector.
The period was dominated by worries that ongoing debt problems in the eurozone would affect global economic growth.
Entering the period, concerns about the eurozone sovereign debt situation held center stage as investors again focused on economic weakness in southern European economies. Because many eurozone banks owned southern European debt and many U.S. banks had financial ties to eurozone banks, investors worried about the effects of a possible southern European debt default on the global financial system and economy. Ongoing weakness in the Greek economy made it difficult for the country to meet previously agreed upon austerity targets. Toward the end of the reporting period, political risk resurfaced in both Italy and Spain. In Italy, Prime Minister Mario Monti, an economist who was appointed to implement austerity measures and labor market reforms, resigned in December 2012. Monti later decided to run for office in the general election scheduled for February 2013.
European leaders took concerted action to calm investor concerns. In September 2012, the European Central Bank (ECB) announced that it would purchase an unlimited amount of one-to three-year sovereign debt from countries that had applied for a formal bailout through either the European Financial Stability Facility or the European Stability Mechanism. In another positive sign, in late November 2012, finance ministers from the 17-country eurozone and the International Monetary Fund struck a deal aimed at reducing Greece’s debt by the year 2020.
Central banks continued to provide stimulus.
Major central banks, including the U.S. Federal Reserve (Fed) and the ECB, continued to inject liquidity into the banks and the markets through various quantitative easing policies. Throughout the reporting period, the Federal Open Market Committee (FOMC) kept its key interest rates effectively at zero in order to support the economy and the financial system. The ECB was similarly aggressive, keeping its key rate at a historic low of 0.75%. Just prior to the beginning of the reporting period, the FOMC announced its intention to keep interest rates low until at least mid-2015 in order to support the sluggish economy. The Fed also announced open-ended purchases of $40 billion per month in mortgage-backed securities in an effort to support the housing market.
Stock markets posted solid gains in an eventful period.
Aggressive central bank actions helped support stock prices, as did relatively solid economic data. For much of the reporting period, the U.S. stock market benefited from favorable gross domestic product (GDP) data, with the growth rate improving from 1.3% (annualized) in the second quarter of 2012 to 3.1% (annualized) in the third quarter of 2012. However, the GDP growth rate slowed in the final months of 2012, with GDP growth coming in at 0.1% (annualized) in the fourth quarter of 2012. Because many investors attributed the weak number to the aftereffects of Hurricane Sandy on the eastern seaboard, the stock market remained resilient.
| | | | | | |
| Letter to shareholders (unaudited) | | Wells Fargo Advantage Large Cap Core Fund | | | 3 | |
The steady improvement in the housing market supported investor sentiment. The National Association of Home Builders/First American Improving Markets Index identifies metro areas that have shown improvement from their respective troughs in housing permits, employment, and house prices for at least six consecutive months. The index rose for a fifth-consecutive month in January 2013, indicating improvements in 242 housing markets across the country. As a result, housing-related stocks strongly outperformed over the period, leading to better-than-index returns for sectors ranging from consumer discretionary (home improvement retailers), to materials (construction material providers), and to financials (mortgage lenders).
Throughout the period, a continued high unemployment rate was the main negative piece of U.S. economic data. Although the unemployment rate improved from 8.1% in August 2012 to 7.9% in January 2013, the labor market remained soft.
We remain committed to our investment strategies, even as many variables are at work in the market.
The full effect of the European credit crisis remains unknown. Elevated unemployment and debt defaults continue to pressure consumers and businesses alike. As a whole, Wells Fargo Advantage Funds represents investments across a range of asset classes and investment styles, giving you an opportunity to create a diversified investment portfolio. While diversification may not prevent losses in a downturn, we believe it helps manage risk.
Thank you for choosing to invest with Wells Fargo Advantage Funds. We appreciate your confidence in us and remain committed to helping you meet your financial needs. For current information about your fund investments, contact your investment professional, visit our website at wellsfargoadvantagefunds.com, or call us directly at 1-800-222-8222. We are available 24 hours a day, 7 days a week.
Sincerely,

Karla M. Rabusch
President
Wells Fargo Advantage Funds
Notice to shareholders
At its November 6-7, 2012 meeting, the Board of Trustees unanimously approved the following modifications to certain Class A sales load waiver privileges, with each change becoming effective on July 1, 2013:
| | n | | Annuity payments received under an annuity option or from death proceeds will no longer qualify for net asset value (NAV) repurchase privileges. | |
| | n | | The ability to reinvest redemption proceeds at NAV will be reduced from 120 days to 90 days. | |
| | n | | NAV purchase privileges for certain types of “grandfathered” shareholders will be modified to remove the ability to purchase Class A shares at NAV, unless those shares are held directly with the Fund. | |
Please contact your investment professional or call us directly at 1-800-222-8222 if you have any questions on this Notice to Shareholders.
| | | | |
| 4 | | Wells Fargo Advantage Large Cap Core Fund | | Performance highlights (unaudited) |
Investment objective
The Fund seeks long-term capital appreciation.
Adviser
Wells Fargo Funds Management, LLC
Subadviser
Golden Capital Management, LLC
Portfolio manager
Jeff C. Moser, CFA
Average annual total returns1 (%) as of January 31, 2013
| | | | | | | | | | | | | | | | | | | | | | | | | | | | | | | | | | |
| | | | | Including sales charge | | | Excluding sales charge | | | Expense ratios2 (%) | |
| | | Inception date | | 1 year | | | 5 year | | | Life of Fund | | | 1 year | | | 5 year | | | Life of Fund | | | Gross | | | Net3 | |
| Class A (EGOAX) | | 12-17-2007 | | | 10.12 | | | | 1.57 | | | | 0.33 | | | | 16.79 | | | | 2.78 | | | | 1.50 | | | | 1.37 | | | | 1.14 | |
| Class C (EGOCX) | | 12-17-2007 | | | 15.01 | | | | 2.01 | | | | 0.78 | | | | 16.01 | | | | 2.01 | | | | 0.78 | | | | 2.12 | | | | 1.89 | |
| Administrator Class (WFLLX) | | 7-16-2010 | | | – | | | | – | | | | – | | | | 17.18 | | | | 2.93 | | | | 1.66 | | | | 1.21 | | | | 0.90 | |
| Institutional Class (EGOIX) | | 12-17-2007 | | | – | | | | – | | | | – | | | | 17.44 | | | | 3.16 | | | | 1.89 | | | | 0.94 | | | | 0.66 | |
| Investor Class (WFLNX) | | 7-16-2010 | | | – | | | | – | | | | – | | | | 16.78 | | | | 2.59 | | | | 1.33 | | | | 1.43 | | | | 1.20 | |
| S&P 500 Index4 | | – | | | – | | | | – | | | | – | | | | 16.78 | | | | 3.97 | | | | 2.95 | | | | – | | | | – | |
Figures quoted represent past performance, which is no guarantee of future results and do not reflect the deduction of taxes that a shareholder may pay on fund distributions or the redemption of fund shares. Investment return and principal value of an investment will fluctuate so that an investor’s shares, when redeemed, may be worth more or less than their original cost. Performance shown without sales charges would be lower if sales charges were reflected. Current performance may be lower or higher than the performance data quoted and assumes the reinvestment of dividends and capital gains. Current month-end performance is available on the Fund’s website, wellsfargoadvantagefunds.com .
Index returns do not include transaction costs associated with buying and selling securities, any mutual fund fees or expenses, or any taxes. It is not possible to invest directly in an index.
For Class A shares, the maximum front-end sales charge is 5.75%. For Class C shares, the maximum contingent deferred sales charge is 1.00%. Performance including sales charge assumes the sales charge for the corresponding time period. Administrator Class, Institutional Class, and Investor Class shares are sold without a front-end sales charge or contingent deferred sales charge.
Stock values fluctuate in response to the activities of individual companies and general market and economic conditions. The use of derivatives may reduce returns and/or increase volatility. Certain investment strategies tend to increase the total risk of an investment (relative to the broader market). The Fund is exposed to foreign investment risk. Consult the Fund’s prospectus for additional information on these and other risks.
Please see footnotes on page 5.
| | | | | | |
| Performance highlights (unaudited) | | Wells Fargo Advantage Large Cap Core Fund | | | 5 | |
| | | | |
| Ten largest equity holdings5 (%) as of January 31, 2013 | |
Chicago Bridge & Iron Company NV | | | 2.51 | |
Terex Corporation | | | 2.40 | |
Celgene Corporation | | | 2.39 | |
JPMorgan Chase & Company | �� | | 2.29 | |
Goldman Sachs Group Incorporated | | | 2.29 | |
CVS Caremark Corporation | | | 2.24 | |
W.R. Grace & Company | | | 2.24 | |
Cadence Design Systems Incorporated | | | 2.23 | |
ACE Limited | | | 2.23 | |
HollyFrontier Corporation | | | 2.22 | |
| | |
| Sector distribution6 as of January 31, 2013 |
|
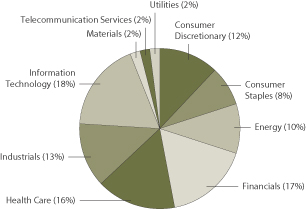
|
| 1. | Historical performance shown for the Administrator Class and Investor Class shares prior to their inception reflects the performance of the Institutional Class shares, adjusted to reflect higher expenses applicable to the Administrator Class and Investor Class shares. Historical performance shown for all classes of the Fund prior to July 19, 2010, is based on the performance of the Fund’s predecessor, Evergreen Golden Large Cap Core Fund. |
| 2. | Reflects the expense ratios as stated in the most recent prospectuses. |
| 3. | The Adviser has committed through November 30, 2013, to waive fees and/or reimburse expenses to the extent necessary to cap the Fund’s Total Annual Fund Operating Expenses After Fee Waiver, excluding certain expenses, at the amounts shown. Brokerage commissions, stamp duty fees, interest, taxes, acquired fund fees and expenses, and extraordinary expenses are excluded from the cap. Without this cap, the Fund’s returns would have been lower. |
| 4. | The S&P 500 Index consists of 500 stocks chosen for market size, liquidity, and industry group representation. It is a market-value weighted index with each stock’s weight in the index proportionate to its market value. You cannot invest directly in an index. |
| 5. | The ten largest equity holdings are calculated based on the value of the securities divided by total net assets of the Fund. Holdings are subject to change and may have changed since the date specified. |
| 6. | Sector distribution is subject to change and is calculated based on the total long-term investments of the Fund. |
| | | | |
| 6 | | Wells Fargo Advantage Large Cap Core Fund | | Fund expenses (unaudited) |
As a shareholder of the Fund, you incur two types of costs: (1) transaction costs, including sales charges (loads) on purchase payments and contingent deferred sales charges (if any) on redemptions and (2) ongoing costs, including management fees, distribution (12b-1) and/or shareholder service fees, and other Fund expenses. This example is intended to help you understand your ongoing costs (in dollars) of investing in the Fund and to compare these costs with the ongoing costs of investing in other mutual funds.
The example is based on an investment of $1,000 invested at the beginning of the six-month period and held for the entire period from August 1, 2012 to January 31, 2013.
Actual expenses
The “Actual” line of the table below provides information about actual account values and actual expenses. You may use the information in this line, together with the amount you invested, to estimate the expenses that you paid over the period. Simply divide your account value by $1,000 (for example, an $8,600 account value divided by $1,000 = 8.6), then multiply the result by the number in the “Actual” line under the heading entitled “Expenses paid during period” for you applicable class of shares to estimate the expenses you paid on your account during this period.
Hypothetical example for comparison purposes
The “Hypothetical” line of the table below provides information about hypothetical account values and hypothetical expenses based on the Fund’s actual expense ratio and an assumed rate of return of 5% per year before expenses, which is not the Fund’s actual return. The hypothetical account values and expenses may not be used to estimate the actual ending account balance or expenses you paid for the period. You may use this information to compare the ongoing cost of investing in the Fund and other funds. To do so, compare this 5% hypothetical example with the 5% hypothetical examples that appear in the shareholder reports of the other funds.
Please note that the expenses shown in the table are meant to highlight your ongoing costs only and do not reflect any transactional costs, such as sales charges (loads) and contingent deferred sales charges. Therefore, the “Hypothetical” line of the table is useful in comparing ongoing costs only and will not help you determine the relative total costs of owning different funds. In addition, if these transactional costs were included, your costs would have been higher.
| | | | | | | | | | | | | | | | |
| | | Beginning
account value
8-1-2012 | | | Ending
account value
1-31-2013 | | | Expenses
paid during
the period1 | | | Net annual
expense ratio | |
Class A | | | | | | | | | | | | | | | | |
Actual | | $ | 1,000.00 | | | $ | 1,096.57 | | | $ | 6.02 | | | | 1.14 | % |
Hypothetical (5% return before expenses) | | $ | 1,000.00 | | | $ | 1,019.46 | | | $ | 5.80 | | | | 1.14 | % |
Class C | | | | | | | | | | | | | | | | |
Actual | | $ | 1,000.00 | | | $ | 1,092.58 | | | $ | 9.97 | | | | 1.89 | % |
Hypothetical (5% return before expenses) | | $ | 1,000.00 | | | $ | 1,015.68 | | | $ | 9.60 | | | | 1.89 | % |
Administrator Class | | | | | | | | | | | | | | | | |
Actual | | $ | 1,000.00 | | | $ | 1,097.92 | | | $ | 4.76 | | | | 0.90 | % |
Hypothetical (5% return before expenses) | | $ | 1,000.00 | | | $ | 1,020.67 | | | $ | 4.58 | | | | 0.90 | % |
Institutional Class | | | | | | | | | | | | | | | | |
Actual | | $ | 1,000.00 | | | $ | 1,099.11 | | | $ | 3.49 | | | | 0.66 | % |
Hypothetical (5% return before expenses) | | $ | 1,000.00 | | | $ | 1,021.88 | | | $ | 3.36 | | | | 0.66 | % |
Investor Class | | | | | | | | | | | | | | | | |
Actual | | $ | 1,000.00 | | | $ | 1,096.48 | | | $ | 6.39 | | | | 1.21 | % |
Hypothetical (5% return before expenses) | | $ | 1,000.00 | | | $ | 1,019.11 | | | $ | 6.16 | | | | 1.21 | % |
| 1. | Expenses paid is equal to the annualized expense ratio of each class multiplied by the average account value over the period, multiplied by the number of days in the most recent fiscal half-year divided by the number of days in the fiscal year (to reflect the one-half-year period). |
| | | | | | |
| Portfolio of investments—January 31, 2013 (unaudited) | | Wells Fargo Advantage Large Cap Core Fund | | | 7 | |
| | | | | | | | | | | | |
| Security name | | | | | | Shares | | | Value | |
| | | | | | | | | | | | |
| | | | |
Common Stocks: 99.15% | | | | | | | | | | | | |
| | | | |
Consumer Discretionary: 11.66% | | | | | | | | | | | | |
| | | | |
| Media: 1.95% | | | | | | | | | | | | |
Comcast Corporation Class A | | | | | | | 92,342 | | | $ | 3,516,383 | |
| | | | | | | | | | | | |
| | | | |
| Specialty Retail: 9.71% | | | | | | | | | | | | |
Foot Locker Incorporated | | | | | | | 105,213 | | | | 3,614,067 | |
GNC Holdings Incorporated Class A | | | | | | | 97,925 | | | | 3,519,425 | |
Home Depot Incorporated | | | | | | | 59,748 | | | | 3,998,336 | |
Ross Stores Incorporated | | | | | | | 47,505 | | | | 2,836,049 | |
TJX Companies Incorporated | | | | | | | 79,000 | | | | 3,569,220 | |
| | | | |
| | | | | | | | | | | 17,537,097 | |
| | | | | | | | | | | | |
| | | | |
Consumer Staples: 7.48% | | | | | | | | | | | | |
| | | | |
| Food & Staples Retailing: 4.14% | | | | | | | | | | | | |
CVS Caremark Corporation | | | | | | | 78,916 | | | | 4,040,499 | |
Wal-Mart Stores Incorporated | | | | | | | 49,177 | | | | 3,439,931 | |
| | | | |
| | | | | | | | | | | 7,480,430 | |
| | | | | | | | | | | | |
| | | | |
| Household Products: 2.07% | | | | | | | | | | | | |
Spectrum Brands Holdings Incorporated | | | | | | | 73,905 | | | | 3,742,549 | |
| | | | | | | | | | | | |
| | | | |
| Personal Products: 1.27% | | | | | | | | | | | | |
Herbalife Limited « | | | | | | | 62,808 | | | | 2,281,187 | |
| | | | | | | | | | | | |
| | | | |
Energy: 9.85% | | | | | | | | | | | | |
| | | | |
| Oil, Gas & Consumable Fuels: 9.85% | | | | | | | | | | | | |
Chevron Corporation | | | | | | | 29,294 | | | | 3,373,204 | |
ConocoPhillips Company | | | | | | | 59,805 | | | | 3,468,690 | |
Exxon Mobil Corporation | | | | | | | 34,941 | | | | 3,143,642 | |
HollyFrontier Corporation | | | | | | | 76,630 | | | | 4,001,619 | |
Phillips 66 Incorporated | | | | | | | 62,845 | | | | 3,806,522 | |
| | | | |
| | | | | | | | | | | 17,793,677 | |
| | | | | | | | | | | | |
| | | | |
Financials: 16.86% | | | | | | | | | | | | |
| | | | |
| Capital Markets: 2.29% | | | | | | | | | | | | |
Goldman Sachs Group Incorporated | | | | | | | 27,935 | | | | 4,130,469 | |
| | | | | | | | | | | | |
| | | | |
| Commercial Banks: 5.88% | | | | | | | | | | | | |
Fifth Third Bancorp | | | | | | | 227,303 | | | | 3,702,766 | |
SunTrust Banks Incorporated | | | | | | | 120,935 | | | | 3,430,926 | |
US Bancorp | | | | | | | 105,630 | | | | 3,496,353 | |
| | | | |
| | | | | | | | | | | 10,630,045 | |
| | | | | | | | | | | | |
| | | | |
| Diversified Financial Services: 2.29% | | | | | | | | | | | | |
JPMorgan Chase & Company | | | | | | | 87,796 | | | | 4,130,802 | |
| | | | | | | | | | | | |
| | | | |
| Insurance: 6.40% | | | | | | | | | | | | |
ACE Limited | | | | | | | 47,094 | | | | 4,018,531 | |
The accompanying notes are an integral part of these financial statements.
| | | | |
| 8 | | Wells Fargo Advantage Large Cap Core Fund | | Portfolio of investments—January 31, 2013 (unaudited) |
| | | | | | | | | | | | |
| Security name | | | | | | Shares | | | Value | |
| | | | | | | | | | | | |
| | | | |
| Insurance (continued) | | | | | | | | | | | | |
Allstate Corporation | | | | | | | 83,195 | | | $ | 3,652,261 | |
MetLife Incorporated | | | | | | | 104,081 | | | | 3,886,385 | |
| | | | |
| | | | | | | | | | | 11,557,177 | |
| | | | | | | | | | | | |
| | | | |
Health Care: 15.80% | | | | | | | | | | | | |
| | | | |
| Biotechnology: 4.43% | | | | | | | | | | | | |
Amgen Incorporated | | | | | | | 43,193 | | | | 3,691,274 | |
Celgene Corporation † | | | | | | | 43,554 | | | | 4,310,104 | |
| | | | |
| | | | | | | | | | | 8,001,378 | |
| | | | | | | | | | | | |
| | | | |
| Health Care Equipment & Supplies: 1.86% | | | | | | | | | | | | |
Abbott Laboratories | | | | | | | 98,865 | | | | 3,349,546 | |
| | | | | | | | | | | | |
| | | | |
| Health Care Providers & Services: 3.71% | | | | | | | | | | | | |
McKesson Corporation | | | | | | | 32,758 | | | | 3,447,124 | |
UnitedHealth Group Incorporated | | | | | | | 58,813 | | | | 3,247,066 | |
| | | | |
| | | | | | | | | | | 6,694,190 | |
| | | | | | | | | | | | |
| | | | |
| Life Sciences Tools & Services: 2.21% | | | | | | | | | | | | |
Thermo Fisher Scientific Incorporated | | | | | | | 55,435 | | | | 3,999,081 | |
| | | | | | | | | | | | |
| | | | |
| Pharmaceuticals: 3.59% | | | | | | | | | | | | |
AbbVie Incorporation | | | | | | | 95,365 | | | | 3,498,942 | |
Johnson & Johnson Services Incorporated | | | | | | | 40,334 | | | | 2,981,489 | |
| | | | |
| | | | | | | | | | | 6,480,431 | |
| | | | | | | | | | | | |
| | | | |
Industrials: 12.90% | | | | | | | | | | | | |
| | | | |
| Air Freight & Logistics: 2.07% | | | | | | | | | | | | |
FedEx Corporation | | | | | | | 36,860 | | | | 3,739,447 | |
| | | | | | | | | | | | |
| | | | |
| Construction & Engineering: 4.67% | | | | | | | | | | | | |
Chicago Bridge & Iron Company NV « | | | | | | | 89,165 | | | | 4,530,474 | |
Fluor Corporation | | | | | | | 60,150 | | | | 3,899,525 | |
| | | | |
| | | | | | | | | | | 8,429,999 | |
| | | | | | | | | | | | |
| | | | |
| Industrial Conglomerates: 2.10% | | | | | | | | | | | | |
General Electric Company | | | | | | | 170,436 | | | | 3,797,314 | |
| | | | | | | | | | | | |
| | | | |
| Machinery: 4.06% | | | | | | | | | | | | |
Terex Corporation †« | | | | | | | 133,560 | | | | 4,324,673 | |
Wabco Holdings Incorporated † | | | | | | | 47,771 | | | | 2,993,331 | |
| | | | |
| | | | | | | | | | | 7,318,004 | |
| | | | | | | | | | | | |
| | | | |
Information Technology: 18.34% | | | | | | | | | | | | |
| | | | |
| Communications Equipment: 3.82% | | | | | | | | | | | | |
Cisco Systems Incorporated | | | | | | | 178,512 | | | | 3,671,992 | |
QUALCOMM Incorporated | | | | | | | 48,720 | | | | 3,216,982 | |
| | | | |
| | | | | | | | | | | 6,888,974 | |
| | | | | | | | | | | | |
The accompanying notes are an integral part of these financial statements.
| | | | | | |
| Portfolio of investments—January 31, 2013 (unaudited) | | Wells Fargo Advantage Large Cap Core Fund | | | 9 | |
| | | | | | | | | | | | | | |
| Security name | | | | | | | Shares | | | Value | |
| | | | | | | | | | | | | | |
| | | | |
| Computers & Peripherals: 3.21% | | | | | | | | | | | | | | |
Apple Incorporated | | | | | | | | | 6,179 | | | $ | 2,813,360 | |
EMC Corporation † | | | | | | | | | 121,298 | | | | 2,985,144 | |
| | | | |
| | | | | | | | | | | | | 5,798,504 | |
| | | | | | | | | | | | | | |
| | | | |
| Internet Software & Services: 1.39% | | | | | | | | | | | | | | |
IAC/InterActive Corporation | | | | | | | | | 60,975 | | | | 2,515,219 | |
| | | | | | | | | | | | | | |
| | | | |
| IT Services: 4.06% | | | | | | | | | | | | | | |
Accenture plc « | | | | | | | | | 50,455 | | | | 3,627,210 | |
Alliance Data Systems Corporation †« | | | | | | | | | 23,525 | | | | 3,707,540 | |
| | | | |
| | | | | | | | | | | | | 7,334,750 | |
| | | | | | | | | | | | | | |
| | | | |
| Software: 5.86% | | | | | | | | | | | | | | |
Cadence Design Systems Incorporated †« | | | | | | | | | 289,165 | | | | 4,028,068 | |
Microsoft Corporation | | | | | | | | | 100,183 | | | | 2,752,027 | |
Oracle Corporation | | | | | | | | | 106,804 | | | | 3,792,610 | |
| | | | |
| | | | | | | | | | | | | 10,572,705 | |
| | | | | | | | | | | | | | |
| | | | |
Materials: 2.24% | | | | | | | | | | | | | | |
| | | | |
| Chemicals: 2.24% | | | | | | | | | | | | | | |
W.R. Grace & Company † | | | | | | | | | 56,225 | | | | 4,036,955 | |
| | | | | | | | | | | | | | |
| | | | |
Telecommunication Services: 2.00% | | | | | | | | | | | | | | |
| | | | |
| Diversified Telecommunication Services: 2.00% | | | | | | | | | | | | | | |
Verizon Communications Incorporated | | | | | | | | | 82,679 | | | | 3,605,631 | |
| | | | | | | | | | | | | | |
| | | | |
Utilities: 2.02% | | | | | | | | | | | | | | |
| | | | |
| Independent Power Producers & Energy Traders: 2.02% | | | | | | | | | | | | | | |
NRG Energy Incorporated | | | | | | | | | 152,050 | | | | 3,649,196 | |
| | | | | | | | | | | | | | |
| | | | |
Total Common Stocks (Cost $137,682,974) | | | | | | | | | | | | | 179,011,140 | |
| | | | | | | | | | | | | | |
| | | | |
| | | | | | | | Principal | | | | |
| Other: 0.19% | | | | | | | | | | | | | | |
Gryphon Funding Limited, Pass-Through Entity (v)(i)(a) | | | | | | | | $ | 1,025,892 | | | | 348,803 | |
| | | | | | | | | | | | | | |
| | | | |
Total Other (Cost $83,603) | | | | | | | | | | | | | 348,803 | |
| | | | | | | | | | | | | | |
| | | | |
| | | Yield | | | | | Shares | | | | |
| Short-Term Investments: 12.24% | | | | | | | | | | | | | | |
| | | | |
| Investment Companies: 12.24% | | | | | | | | | | | | | | |
Wells Fargo Advantage Cash Investment Money Market Fund, Select Class (l)(u) | | | 0.14 | % | | | | | 1,295,646 | | | | 1,295,646 | |
Wells Fargo Securities Lending Cash Investments, LLC (v)(r)(l)(u) | | | 0.19 | | | | | | 20,808,371 | | | | 20,808,371 | |
| | | | |
Total Short-Term Investments (Cost $22,104,017) | | | | | | | | | | | | | 22,104,017 | |
| | | | | | | | | | | | | | |
| | | | | | | | |
| Total investments in securities | | | | | | | | |
| (Cost $159,870,594) * | | | 111.58 | % | | | 201,463,960 | |
Other assets and liabilities, net | | | (11.58 | ) | | | (20,914,251 | ) |
| | | | | | | | |
| Total net assets | | | 100.00 | % | | $ | 180,549,709 | |
| | | | | | | | |
The accompanying notes are an integral part of these financial statements.
| | | | |
| 10 | | Wells Fargo Advantage Large Cap Core Fund | | Portfolio of investments—January 31, 2013 (unaudited) |
| « | All or a portion of this security is on loan. |
| † | Non-income-earning security |
| (v) | Security represents investment of cash collateral received from securities on loan. |
| (i) | Illiquid security for which the designation as illiquid is unaudited. |
| (a) | Security is fair valued by the Management Valuation Team, and in certain instances by the Board of Trustees, in accordance with procedures approved by the Board of Trustees. |
| (l) | Investment in an affiliate |
| (u) | Rate shown is the 7-day annualized yield at period end. |
| (r) | The investment company is exempt from registration under Section 3(c)(7) of the Investment Company Act of 1940, as amended. |
| * | Cost for federal income tax purposes is $160,309,791 and unrealized appreciation (depreciation) consists of: |
| | | | |
Gross unrealized appreciation | | $ | 42,935,361 | |
Gross unrealized depreciation | | | (1,781,192 | ) |
| | | | |
Net unrealized appreciation | | $ | 41,154,169 | |
The accompanying notes are an integral part of these financial statements.
| | | | | | |
| Statement of assets and liabilities—January 31, 2013 (unaudited) | | Wells Fargo Advantage Large Cap Core Fund | | | 11 | |
| | | | |
| | | | |
| |
Assets | | | | |
Investments | | | | |
In unaffiliated securities (including securities on loan), at value (see cost below) | | $ | 179,359,943 | |
In affiliated securities, at value (see cost below) | | | 22,104,017 | |
| | | | |
Total investments, at value (see cost below) | | | 201,463,960 | |
Receivable for Fund shares sold | | | 180,711 | |
Receivable for dividends | | | 145,121 | |
Receivable for securities lending income | | | 5,962 | |
Prepaid expenses and other assets | | | 29,262 | |
| | | | |
Total assets | | | 201,825,016 | |
| | | | |
| |
Liabilities | | | | |
Payable for Fund shares redeemed | | | 178,559 | |
Payable upon receipt of securities loaned | | | 20,891,974 | |
Advisory fee payable | | | 69,212 | |
Distribution fees payable | | | 1,691 | |
Due to other related parties | | | 54,742 | |
Accrued expenses and other liabilities | | | 79,129 | |
| | | | |
Total liabilities | | | 21,275,307 | |
| | | | |
Total net assets | | $ | 180,549,709 | |
| | | | |
| |
NET ASSETS CONSIST OF | | | | |
Paid-in capital | | $ | 204,569,990 | |
Overdistributed net investment income | | | (95,883 | ) |
Accumulated net realized losses on investments | | | (65,517,764 | ) |
Net unrealized gains on investments | | | 41,593,366 | |
| | | | |
Total net assets | | $ | 180,549,709 | |
| | | | |
| |
COMPUTATION OF NET ASSET VALUE AND OFFERING PRICE PER SHARE1 | | | | |
Net assets – Class A | | $ | 10,257,836 | |
Shares outstanding – Class A | | | 992,967 | |
Net asset value per share – Class A | | | $10.33 | |
Maximum offering price per share – Class A2 | | | $10.96 | |
Net assets – Class C | | $ | 2,800,925 | |
Shares outstanding – Class C | | | 271,931 | |
Net asset value per share – Class C | | | $10.30 | |
Net assets – Administrator Class | | $ | 762,266 | |
Shares outstanding – Administrator Class | | | 73,709 | |
Net asset value per share – Administrator Class | | | $10.34 | |
Net assets – Institutional Class | | $ | 522,192 | |
Shares outstanding – Institutional Class | | | 50,542 | |
Net asset value per share – Institutional Class | | | $10.33 | |
Net assets – Investor Class | | $ | 166,206,490 | |
Shares outstanding – Investor Class | | | 16,081,115 | |
Net asset value per share – Investor Class | | | $10.34 | |
| |
Investment in unaffiliated securities (including securities on loan), at cost | | $ | 137,766,577 | |
| | | | |
Investments in affiliated securities, at cost | | $ | 22,104,017 | |
| | | | |
Total investments, at cost | | $ | 159,870,594 | |
| | | | |
Securities on loan, at value | | $ | 20,430,613 | |
| | | | |
| 1. | The Fund has an unlimited number of authorized shares. |
| 2. | Maximum offering price is computed as 100/94.25 of net asset value. On investments of $50,000 or more, the offering price is reduced. |
The accompanying notes are an integral part of these financial statements.
| | | | |
| 12 | | Wells Fargo Advantage Large Cap Core Fund | | Statement of operations—six months ended January 31, 2013 (unaudited) |
| | | | |
| | | | |
| |
Investment income | | | | |
Dividends* | | $ | 1,551,876 | |
Securities lending income, net | | | 41,887 | |
Income from affiliated securities | | | 1,723 | |
| | | | |
Total investment income | | | 1,595,486 | |
| | | | |
| |
Expenses | | | | |
Advisory fee | | | 569,474 | |
Administration fees | | | | |
Fund level | | | 43,806 | |
Class A | | | 11,936 | |
Class C | | | 3,062 | |
Administrator Class | | | 330 | |
Institutional Class | | | 197 | |
Investor Class | | | 260,052 | |
Shareholder servicing fees | | | | |
Class A | | | 11,477 | |
Class C | | | 2,945 | |
Administrator Class | | | 825 | |
Investor Class | | | 199,586 | |
Distribution fees | | | | |
Class C | | | 8,834 | |
Custody and accounting fees | | | 7,764 | |
Professional fees | | | 11,430 | |
Registration fees | | | 33,711 | |
Shareholder report expenses | | | 38,910 | |
Trustees’ fees and expenses | | | 5,949 | |
Other fees and expenses | | | 8,416 | |
| | | | |
Total expenses | | | 1,218,704 | |
Less: Fee waivers and/or expense reimbursements | | | (158,834 | ) |
| | | | |
Net expenses | | | 1,059,870 | |
| | | | |
Net investment income | | | 535,616 | |
| | | | |
| |
REALIZED AND UNREALIZED GAINS (LOSSES) ON INVESTMENTS | | | | |
Net realized gains on investments | | | 5,912,430 | |
Net change in unrealized gains (losses) on investments | | | 9,573,176 | |
| | | | |
Net realized and unrealized gains (losses) on investments | | | 15,485,606 | |
| | | | |
Net increase in net assets resulting from operations | | $ | 16,021,222 | |
| | | | |
| |
* Net of foreign dividend withholding taxes in the amount of | | | $1,353 | |
The accompanying notes are an integral part of these financial statements.
| | | | | | |
| Statement of changes in net assets | | Wells Fargo Advantage Large Cap Core Fund | | | 13 | |
| | | | | | | | | | | | | | | | |
| | | Six months ended
January 31, 2013
(unaudited) | | | Year ended
July 31, 2012 | |
| | | | |
Operations | | | | | | | | | | | | | | | | |
Net investment income | | | | | | $ | 535,616 | | | | | | | $ | 1,044,282 | |
Net realized gains on investments | | | | | | | 5,912,430 | | | | | | | | 6,960,374 | |
Net change in unrealized gains (losses) on investments | | | | | | | 9,573,176 | | | | | | | | 6,451,975 | |
| | | | | | | | | | | | | | | | |
Net increase in net assets resulting from operations | | | | | | | 16,021,222 | | | | | | | | 14,456,631 | |
| | | | | | | | | | | | | | | | |
| | | | |
Distributions to shareholders from | | | | | | | | | | | | | | | | |
Net investment income | | | | | | | | | | | | | | | | |
Class A | | | | | | | (77,248 | ) | | | | | | | (42,583 | ) |
Class C | | | | | | | (6,053 | ) | | | | | | | 0 | |
Administrator Class | | | | | | | (7,825 | ) | | | | | | | (4,224 | ) |
Institutional Class | | | | | | | (6,104 | ) | | | | | | | (5,032 | ) |
Investor Class | | | | | | | (1,162,943 | ) | | | | | | | (842,065 | ) |
| | | | | | | | | | | | | | | | |
Total distributions to shareholders | | | | | | | (1,260,173 | ) | | | | | | | (893,904 | ) |
| | | | | | | | | | | | | | | | |
| | | | |
| | | Shares | | | | | | | | Shares | | | | | |
Capital share transactions | | | | | | | | | | | | | | | | |
Proceeds from shares sold | | | | | | | | | | | | | | | | |
Class A | | | 238,279 | | | | 2,351,545 | | | | 283,551 | | | | 2,548,078 | |
Class C | | | 62,566 | | | | 612,792 | | | | 59,288 | | | | 541,152 | |
Administrator Class | | | 22,776 | | | | 222,142 | | | | 25,448 | | | | 236,119 | |
Institutional Class | | | 2,268 | | | | 22,314 | | | | 5,880 | | | | 55,211 | |
Investor Class | | | 331,227 | | | | 3,244,038 | | | | 509,714 | | | | 4,487,370 | |
| | | | | | | | | | | | | | | | |
| | | | | | | 6,452,831 | | | | | | | | 7,867,930 | |
| | | | | | | | | | | | | | | | |
Reinvestment of distributions | | | | | | | | | | | | | | | | |
Class A | | | 7,711 | | | | 74,568 | | | | 5,037 | | | | 40,746 | |
Class C | | | 522 | | | | 5,039 | | | | 0 | | | | 0 | |
Administrator Class | | | 531 | | | | 5,134 | | | | 311 | | | | 2,512 | |
Institutional Class | | | 615 | | | | 5,941 | | | | 607 | | | | 4,903 | |
Investor Class | | | 116,833 | | | | 1,129,780 | | | | 100,884 | | | | 816,154 | |
| | | | | | | | | | | | | | | | |
| | | | | | | 1,220,462 | | | | | | | | 864,315 | |
| | | | | | | | | | | | | | | | |
Payment for shares redeemed | | | | | | | | | | | | | | | | |
Class A | | | (124,116 | ) | | | (1,215,647 | ) | | | (274,417 | ) | | | (2,387,563 | ) |
Class C | | | (7,012 | ) | | | (68,895 | ) | | | (44,312 | ) | | | (395,218 | ) |
Administrator Class | | | (4,407 | ) | | | (44,103 | ) | | | (25,366 | ) | | | (231,367 | ) |
Institutional Class | | | (2,767 | ) | | | (26,889 | ) | | | (10,498 | ) | | | (95,611 | ) |
Investor Class | | | (1,147,635 | ) | | | (11,270,772 | ) | | | (2,004,538 | ) | | | (17,609,859 | ) |
| | | | | | | | | | | | | | | | |
| | | | | | | (12,626,306 | ) | | | | | | | (20,719,618 | ) |
| | | | | | | | | | | | | | | | |
Net decrease in net assets resulting from capital share transactions | | | | | | | (4,953,013 | ) | | | | | | | (11,987,373 | ) |
| | | | | | | | | | | | | | | | |
Total increase in net assets | | | | | | | 9,808,036 | | | | | | | | 1,575,354 | |
| | | | | | | | | | | | | | | | |
| | | | |
Net assets | | | | | | | | | | | | | | | | |
Beginning of period | | | | | | | 170,741,673 | | | | | | | | 169,166,319 | |
| | | | | | | | | | | | | | | | |
End of period | | | | | | $ | 180,549,709 | | | | | | | $ | 170,741,673 | |
| | | | | | | | | | | | | | | | |
Undistributed (overdistributed) net investment income | | | | | | $ | (95,883 | ) | | | | | | $ | 628,674 | |
| | | | | | | | | | | | | | | | |
The accompanying notes are an integral part of these financial statements.
| | | | |
| 14 | | Wells Fargo Advantage Large Cap Core Fund | | Financial highlights |
(For a share outstanding throughout each period)
| | | | | | | | | | | | | | | | | | | | | | | | |
| | | Six months ended
January 31, 2013
(unaudited) | | | Year ended July 31 | |
| CLASS A | | | 2012 | | | 2011 | | | 20101 | | | 20091 | | | 20081,2 | |
Net asset value, beginning of period | | $ | 9.50 | | | $ | 8.75 | | | $ | 7.37 | | | $ | 6.96 | | | $ | 8.77 | | | $ | 10.00 | |
Net investment income | | | 0.03 | | | | 0.06 | | | | 0.05 | | | | 0.06 | | | | 0.08 | | | | 0.03 | |
Net realized and unrealized gains (losses) on investments | | | 0.88 | | | | 0.74 | | | | 1.36 | | | | 0.46 | | | | (1.82 | ) | | | (1.26 | ) |
| | | | | | | | | | | | | | | | | | | | | | | | |
Total from investment operations | | | 0.91 | | | | 0.80 | | | | 1.41 | | | | 0.52 | | | | (1.74 | ) | | | (1.23 | ) |
Distributions to shareholders from | | | | | | | | | | | | | | | | | | | | | | | | |
Net investment income | | | (0.08 | ) | | | (0.05 | ) | | | (0.03 | ) | | | (0.11 | ) | | | (0.07 | ) | | | 0.00 | |
Net asset value, end of period | | $ | 10.33 | | | $ | 9.50 | | | $ | 8.75 | | | $ | 7.37 | | | $ | 6.96 | | | $ | 8.77 | |
Total return3 | | | 9.66 | % | | | 9.27 | % | | | 19.16 | % | | | 7.43 | % | | | (19.78 | )% | | | (12.30 | )% |
Ratios to average net assets (annualized) | | | | | | | | | | | | | | | | | | | | | | | | |
Gross expenses | | | 1.33 | % | | | 1.37 | % | | | 1.30 | % | | | 2.55 | % | | | 4.10 | % | | | 5.03 | % |
Net expenses | | | 1.14 | % | | | 1.14 | % | | | 1.14 | % | | | 1.15 | % | | | 1.15 | % | | | 1.15 | % |
Net investment income | | | 0.67 | % | | | 0.71 | % | | | 0.61 | % | | | 0.91 | % | | | 1.22 | % | | | 0.69 | % |
Supplemental data | | | | | | | | | | | | | | | | | | | | | | | | |
Portfolio turnover rate | | | 32 | % | | | 41 | % | | | 43 | % | | | 18 | % | | | 45 | % | | | 23 | % |
Net assets, end of period (000s omitted) | | | $10,258 | | | | $8,277 | | | | $7,495 | | | | $8,501 | | | | $533 | | | | $604 | |
| 1. | After the close of business on July 16, 2010, the Fund acquired the net assets of Evergreen Golden Large Cap Core Fund and Wells Fargo Advantage Large Company Core Fund. Evergreen Golden Large Cap Core Fund was the accounting and performance survivor in the transaction. The information for the periods prior to July 19, 2010 is that of Class A of Evergreen Golden Large Cap Core Fund. |
| 2. | For the period from December 17, 2007 (commencement of class operations) to July 31, 2008 |
| 3. | Total return calculations do not include any sales charges. Returns for periods of less than one year are not annualized. |
The accompanying notes are an integral part of these financial statements.
| | | | | | |
| Financial highlights | | Wells Fargo Advantage Large Cap Core Fund | | | 15 | |
(For a share outstanding throughout each period)
| | | | | | | | | | | | | | | | | | | | | | | | |
| | | Six months ended
January 31, 2013
(unaudited) | | | Year ended July 31 | |
| CLASS C | | | 2012 | | | 2011 | | | 20101 | | | 20091 | | | 20081,2 | |
Net asset value, beginning of period | | $ | 9.45 | | | $ | 8.71 | | | $ | 7.37 | | | $ | 6.94 | | | $ | 8.75 | | | $ | 10.00 | |
Net investment income (loss) | | | (0.00 | )3 | | | (0.00 | ) | | | (0.01 | ) | | | 0.01 | | | | 0.03 | | | | (0.00 | ) |
Net realized and unrealized gains (losses) on investments | | | 0.87 | | | | 0.74 | | | | 1.35 | | | | 0.44 | | | | (1.81 | ) | | | (1.25 | ) |
| | | | | | | | | | | | | | | | | | | | | | | | |
Total from investment operations | | | 0.87 | | | | 0.74 | | | | 1.34 | | | | 0.45 | | | | (1.78 | ) | | | (1.25 | ) |
Distributions to shareholders from | | | | | | | | | | | | | | | | | | | | | | | | |
Net investment income | | | (0.02 | ) | | | 0.00 | | | | 0.00 | | | | (0.02 | ) | | | (0.03 | ) | | | 0.00 | |
Net asset value, end of period | | $ | 10.30 | | | $ | 9.45 | | | $ | 8.71 | | | $ | 7.37 | | | $ | 6.94 | | | $ | 8.75 | |
Total return4 | | | 9.26 | % | | | 8.50 | % | | | 18.18 | % | | | 6.54 | % | | | (20.33 | )% | | | (12.50 | )% |
Ratios to average net assets (annualized) | | | | | | | | | | | | | | | | | | | | | | | | |
Gross expenses | | | 2.08 | % | | | 2.12 | % | | | 2.05 | % | | | 3.75 | % | | | 4.85 | % | | | 5.78 | % |
Net expenses | | | 1.89 | % | | | 1.89 | % | | | 1.89 | % | | | 1.90 | % | | | 1.90 | % | | | 1.90 | % |
Net investment income (loss) | | | (0.09 | )% | | | (0.04 | )% | | | (0.13 | )% | | | 0.09 | % | | | 0.48 | % | | | (0.06 | )% |
Supplemental data | | | | | | | | | | | | | | | | | | | | | | | | |
Portfolio turnover rate | | | 32 | % | | | 41 | % | | | 43 | % | | | 18 | % | | | 45 | % | | | 23 | % |
Net assets, end of period (000s omitted) | | | $2,801 | | | | $2,041 | | | | $1,750 | | | | $1,947 | | | | $1,043 | | | | $942 | |
| 1. | After the close of business on July 16, 2010, the Fund acquired the net assets of Evergreen Golden Large Cap Core Fund and Wells Fargo Advantage Large Company Core Fund. Evergreen Golden Large Cap Core Fund was the accounting and performance survivor in the transaction. The information for the periods prior to July 19, 2010 is that of Class C of Evergreen Golden Large Cap Core Fund. |
| 2. | For the period from December 17, 2007 (commencement of class operations) to July 31, 2008 |
| 3. | Calculated based upon average shares outstanding |
| 4. | Total return calculations do not include any sales charges. Returns for periods of less than one year are not annualized. |
The accompanying notes are an integral part of these financial statements.
| | | | |
| 16 | | Wells Fargo Advantage Large Cap Core Fund | | Financial highlights |
(For a share outstanding throughout each period)
| | | | | | | | | | | | | | | | |
| | | Six months ended January 31, 2013
(unaudited) | | | Year ended July 31 | |
| ADMINISTRATOR CLASS | | | 2012 | | | 2011 | | | 20101 | |
Net asset value, beginning of period | | $ | 9.52 | | | $ | 8.77 | | | $ | 7.38 | | | $ | 7.22 | |
Net investment income | | | 0.05 | | | | 0.09 | | | | 0.07 | 2 | | | 0.00 | |
Net realized and unrealized gains (losses) on investments | | | 0.87 | | | | 0.74 | | | | 1.36 | | | | 0.16 | |
| | | | | | | | | | | | | | | | |
Total from investment operations | | | 0.92 | | | | 0.83 | | | | 1.43 | | | | 0.16 | |
Distributions to shareholders from | | | | | | | | | | | | | | | | |
Net investment income | | | (0.10 | ) | | | (0.08 | ) | | | (0.04 | ) | | | 0.00 | |
Net asset value, end of period | | $ | 10.34 | | | $ | 9.52 | | | $ | 8.77 | | | $ | 7.38 | |
Total return3 | | | 9.79 | % | | | 9.61 | % | | | 19.44 | % | | | 2.22 | % |
Ratios to average net assets (annualized) | | | | | | | | | | | | | | | | |
Gross expenses | | | 1.17 | % | | | 1.16 | % | | | 1.08 | % | | | 1.12 | % |
Net expenses | | | 0.90 | % | | | 0.87 | % | | | 0.86 | % | | | 0.89 | % |
Net investment income | | | 0.90 | % | | | 0.97 | % | | | 0.76 | % | | | 1.12 | % |
Supplemental data | | | | | | | | | | | | | | | | |
Portfolio turnover rate | | | 32 | % | | | 41 | % | | | 43 | % | | | 18 | % |
Net assets, end of period (000s omitted) | | | $762 | | | | $522 | | | | $477 | | | | $42 | |
| 1. | For the period from July 16, 2010 (commencement of class operations) to July 31, 2010 |
| 2. | Calculated based upon average shares outstanding |
| 3. | Returns for periods of less than one year are not annualized. |
The accompanying notes are an integral part of these financial statements.
| | | | | | |
| Financial highlights | | Wells Fargo Advantage Large Cap Core Fund | | | 17 | |
(For a share outstanding throughout each period)
| | | | | | | | | | | | | | | | | | | | | | | | |
| | | Six months ended
January 31, 2013
(unaudited) | | | Year ended July 31 | |
| INSTITUTIONAL CLASS | | | 2012 | | | 2011 | | | 20101 | | | 20091 | | | 20081,2 | |
Net asset value, beginning of period | | $ | 9.52 | | | $ | 8.77 | | | $ | 7.38 | | | $ | 6.97 | | | $ | 8.79 | | | $ | 10.00 | |
Net investment income | | | 0.06 | | | | 0.12 | | | | 0.10 | 3 | | | 0.08 | | | | 0.09 | | | | 0.05 | |
Net realized and unrealized gains (losses) on investments | | | 0.87 | | | | 0.73 | | | | 1.35 | | | | 0.46 | | | | (1.82 | ) | | | (1.26 | ) |
| | | | | | | | | | | | | | | | | | | | | | | | |
Total from investment operations | | | 0.93 | | | | 0.85 | | | | 1.45 | | | | 0.54 | | | | (1.73 | ) | | | (1.21 | ) |
Distributions to shareholders from | | | | | | | | | | | | | | | | | | | | | | | | |
Net investment income | | | (0.12 | ) | | | (0.10 | ) | | | (0.06 | ) | | | (0.13 | ) | | | (0.09 | ) | | | 0.00 | |
Net asset value, end of period | | $ | 10.33 | | | $ | 9.52 | | | $ | 8.77 | | | $ | 7.38 | | | $ | 6.97 | | | $ | 8.79 | |
Total return4 | | | 9.91 | % | | | 9.88 | % | | | 19.65 | % | | | 7.79 | % | | | (19.61 | )% | | | (12.10 | )% |
Ratios to average net assets (annualized) | | | | | | | | | | | | | | | | | | | | | | | | |
Gross expenses | | | 0.90 | % | | | 0.94 | % | | | 0.86 | % | | | 2.80 | % | | | 3.85 | % | | | 4.78 | % |
Net expenses | | | 0.66 | % | | | 0.66 | % | | | 0.66 | % | | | 0.89 | % | | | 0.90 | % | | | 0.90 | % |
Net investment income | | | 1.16 | % | | | 1.19 | % | | | 1.32 | % | | | 1.09 | % | | | 1.47 | % | | | 0.93 | % |
Supplemental data | | | | | | | | | | | | | | | | | | | | | | | | |
Portfolio turnover rate | | | 32 | % | | | 41 | % | | | 43 | % | | | 18 | % | | | 45 | % | | | 23 | % |
Net assets, end of period (000s omitted) | | | $522 | | | | $480 | | | | $478 | | | | $3,132 | | | | $2,809 | | | | $3,149 | |
| 1. | After the close of business on July 16, 2010, the Fund acquired the net assets of Evergreen Golden Large Cap Core Fund and Wells Fargo Advantage Large Company Core Fund. Evergreen Golden Large Cap Core Fund was the accounting and performance survivor in the transaction. The information for the periods prior to July 19, 2010 is that of Class I of Evergreen Golden Large Cap Core Fund. |
| 2. | For the period from December 17, 2007 (commencement of class operations) to July 31, 2008 |
| 3. | Calculated based upon average shares outstanding |
| 4. | Returns for periods of less than one year are not annualized. |
The accompanying notes are an integral part of these financial statements.
| | | | |
| 18 | | Wells Fargo Advantage Large Cap Core Fund | | Financial highlights |
(For a share outstanding throughout each period)
| | | | | | | | | | | | | | | | |
| | | Six months ended
January 31, 2013
(unaudited) | | | Year ended July 31 | |
| INVESTOR CLASS | | | 2012 | | | 2011 | | | 20101 | |
Net asset value, beginning of period | | $ | 9.50 | | | $ | 8.75 | | | $ | 7.38 | | | $ | 7.22 | |
Net investment income | | | 0.03 | | | | 0.06 | | | | 0.05 | | | | 0.00 | |
Net realized and unrealized gains (losses) on investments | | | 0.88 | | | | 0.74 | | | | 1.35 | | | | 0.16 | |
| | | | | | | | | | | | | | | | |
Total from investment operations | | | 0.91 | | | | 0.80 | | | | 1.40 | | | | 0.16 | |
Distributions to shareholders from | | | | | | | | | | | | | | | | |
Net investment income | | | (0.07 | ) | | | (0.05 | ) | | | (0.03 | ) | | | 0.00 | |
Net asset value, end of period | | $ | 10.34 | | | $ | 9.50 | | | $ | 8.75 | | | $ | 7.38 | |
Total return2 | | | 9.65 | % | | | 9.21 | % | | | 18.97 | % | | | 2.22 | % |
Ratios to average net assets (annualized) | | | | | | | | | | | | | | | | |
Gross expenses | | | 1.39 | % | | | 1.43 | % | | | 1.37 | % | | | 1.37 | % |
Net expenses | | | 1.21 | % | | | 1.21 | % | | | 1.21 | % | | | 1.21 | % |
Net investment income | | | 0.62 | % | | | 0.64 | % | | | 0.53 | % | | | 1.03 | % |
Supplemental data | | | | | | | | | | | | | | | | |
Portfolio turnover rate | | | 32 | % | | | 41 | % | | | 43 | % | | | 18 | % |
Net assets, end of period (000s omitted) | | | $166,206 | | | | $159,422 | | | | $158,966 | | | | $150,157 | |
| 1. | For the period from July 16, 2010 (commencement of class operations) to July 31, 2010 |
| 2. | Returns for periods of less than one year are not annualized. |
The accompanying notes are an integral part of these financial statements.
| | | | | | |
| Notes to financial statements (unaudited) | | Wells Fargo Advantage Large Cap Core Fund | | | 19 | |
1. ORGANIZATION
Wells Fargo Funds Trust (the “Trust”), a Delaware statutory trust organized on March 10, 1999, is an open-end management investment company registered under the Investment Company Act of 1940, as amended (the “1940 Act”). These financial statements report on Wells Fargo Advantage Large Cap Core Fund (the “Fund”) which is a diversified series of the Trust.
2. SIGNIFICANT ACCOUNTING POLICIES
The following significant accounting policies, which are consistently followed in the preparation of the financial statements of the Fund, are in conformity with U.S. generally accepted accounting principles which require management to make estimates and assumptions that affect the reported amounts of assets and liabilities, disclosure of contingent assets and liabilities at the date of the financial statements, and the reported amounts of revenues and expenses during the reporting period. Actual results could differ from those estimates.
Securities valuation
All investments are valued each business day as of the close of regular trading on the New York Stock Exchange (normally 4 p.m. Eastern Time).
Equity securities that are listed on a foreign or domestic exchange, except for The Nasdaq Stock Market, Inc. (“Nasdaq”), are valued at the official closing price or, if none, the last sales price. Securities listed on Nasdaq are valued at the Nasdaq Official Closing Price (“NOCP”). If no NOCP is available, securities are valued at the last sales price. If no sales price is shown on the Nasdaq, the bid price will be used. If no sale occurs on the primary exchange or market for the security that day or if no sale occurs and no bid price is shown on Nasdaq, the prior day’s price will be deemed “stale” and fair values will be determined in accordance with the Fund’s Valuation Procedures.
Investments in registered open-end investment companies are valued at net asset value. Non-registered investment companies are fair valued at net asset value.
Investments which are not valued using any of the methods discussed above are valued at their fair value, as determined by procedures established in good faith and approved by the Board of Trustees. The Board of Trustees has established a Valuation Committee comprised of the Trustees and has delegated to it the authority to take any actions regarding the valuation of portfolio securities that the Valuation Committee deems necessary or appropriate, including determining the fair value of portfolio securities, unless the determination has been delegated to the Management Valuation Team of Wells Fargo Funds Management, LLC (“Funds Management”). The Board of Trustees retains the authority to make or ratify any valuation decisions or approve any changes to the Valuation Procedures as it deems appropriate. On a quarterly basis, the Board of Trustees receives reports on any valuation actions taken by the Valuation Committee or the Management Valuation Team which may include items for ratification.
Valuations of fair valued securities are compared to the next actual sales price when available, or other appropriate market information to assess the continued appropriateness of the fair valuation methodology used. These securities are fair valued on a day-to-day basis, taking into consideration changes to appropriate market information and any significant changes to the input factors considered in the valuation process until there is a readily available price provided on the exchange or by an independent pricing service. Valuations received from an independent pricing service or broker quotes are periodically validated by comparisons to most recent trades and valuations provided by other independent pricing services in addition to the review of prices by the adviser and/or subadviser. Unobservable inputs used in determining fair valuations are identified based on the type of security, taking into consideration factors utilized by market participants in valuing the investment, knowledge about the issuer and the current market environment.
Security loans
The Fund may lend its securities from time to time in order to earn additional income in the form of fees or interest on securities received as collateral or the investment of any cash received as collateral. The Fund continues to receive interest or dividends on the securities loaned. The Fund receives collateral in the form of cash or securities with a value at least equal to the value of the securities on loan. The value of the loaned securities is determined at the close of each business day and any additional required collateral is delivered to the Fund on the next business day. In a securities lending transaction, the net asset value of the Fund will be affected by an increase or decrease in the value of the securities loaned and by an increase or decrease in the value of the instrument in which collateral is invested. The amount of securities lending activity undertaken by the Fund fluctuates from time to time. In the event of default or bankruptcy by the borrower, the Fund may be prevented from recovering the loaned securities or gaining access to the collateral or
| | | | |
| 20 | | Wells Fargo Advantage Large Cap Core Fund | | Notes to financial statements (unaudited) |
may experience delays or costs in doing so. In addition, the investment of any cash collateral received may lose all or part of its value. The Fund has the right under the lending agreement to recover the securities from the borrower on demand.
The Fund lends its securities through an unaffiliated securities lending agent. Cash collateral received in connection with its securities lending transactions is invested in Wells Fargo Securities Lending Cash Investments, LLC (the “Cash Collateral Fund”). The Cash Collateral Fund is exempt from registration under Section 3(c)(7) of the 1940 Act and is managed by Funds Management and is subadvised by Wells Capital Management Incorporated (“WellsCap”). Funds Management receives an advisory fee starting at 0.05% and declining to 0.01% as the average daily net assets of the Cash Collateral Fund increase. All of the fees received by Funds Management are paid to WellsCap for its services as subadviser. The Cash Collateral Fund seeks to provide a positive return compared to the daily Fed Funds Open rate by investing in high-quality, U.S. dollar-denominated short-term money market instruments. Cash Collateral Fund investments are fair valued based upon the amortized cost valuation technique. Income earned from investment in the Cash Collateral Fund is included in securities lending income on the Statement of Operations.
Security transactions and income recognition
Securities transactions are recorded on a trade date basis. Realized gains or losses are recorded on the basis of identified cost.
Dividend income is recognized on the ex-dividend date. Dividend income is recorded net of foreign taxes withheld where recovery of such taxes is not assured.
Distributions to shareholders
Distributions to shareholders from net investment income and net realized gains, if any, are recorded on the ex-dividend date. Such distributions are determined in conformity with federal income tax regulations, which may differ in amount or character from net investment income and realized gains recognized for purposes of U.S. generally accepted accounting principles.
Federal and other taxes
The Fund intends to continue to qualify as a regulated investment company by distributing substantially all of its investment company taxable income and any net realized capital gains (after reduction for capital loss carryforwards) sufficient to relieve it from all, or substantially all, federal income taxes. Accordingly, no provision for federal income taxes was required.
The Fund’s income and federal excise tax returns and all financial records supporting those returns for the prior three fiscal years are subject to examination by the federal and Delaware revenue authorities. Management has analyzed the Fund’s tax positions taken on federal, state, and foreign tax returns for all open tax years and does not believe that there are any uncertain tax positions that require recognition of a tax liability.
As of July 31, 2012, the Fund had pre-enactment capital loss carryforwards incurred in taxable years beginning before December 22, 2010, which were available to offset future net realized capital gains, in the amount of $70,963,016 with $905,489 expiring in 2017; and $70,057,527 expiring in 2018.
Class allocations
The separate classes of shares offered by the Fund differ principally in applicable sales charges, distribution, shareholder servicing, and administration fees. Shareholders of each class bear certain expenses that pertain to that particular class. All shareholders bear the common expenses of the Fund, earn income from the portfolio, and are allocated any unrealized gains and losses pro rata based on the average daily net assets of each class, without distinction between share classes. Dividends are determined separately for each class based on income and expenses allocable to each class. Realized gains and losses are allocated to each class pro rata based upon the net assets of each class on the date realized. Differences in per share dividend rates generally result from the relative weightings of pro rata income and realized gain allocations and from differences in separate class expenses, including distribution, shareholder servicing, and administration fees.
3. FAIR VALUATION MEASUREMENTS
Fair value measurements of investments are determined within a framework that has established a fair value hierarchy based upon the various data inputs utilized in determining the value of the Fund’s investments. The three-level hierarchy gives the highest priority to unadjusted quoted prices in active markets for identical assets or liabilities (Level 1) and the lowest priority to significant unobservable inputs (Level 3). The Fund’s investments are classified within the fair value hierarchy based on the lowest level of input that is significant to the fair value measurement. The inputs are summarized into three broad levels as follows:
| n | | Level 1 – quoted prices in active markets for identical securities |
| | | | | | |
| Notes to financial statements (unaudited) | | Wells Fargo Advantage Large Cap Core Fund | | | 21 | |
| n | | Level 2 – other significant observable inputs (including quoted prices for similar securities, interest rates, prepayment speeds, credit risk, use of amortized cost, etc.) |
| n | | Level 3 – significant unobservable inputs (including the Fund’s own assumptions in determining the fair value of investments) |
The inputs or methodologies used for valuing investments in securities are not necessarily an indication of the risk associated with investing in those securities.
As of January 31, 2013, the inputs used in valuing investments in securities, which are carried at fair value, were as follows:
| | | | | | | | | | | | | | | | |
| Investments in securities | | Quoted prices
(Level 1) | | | Significant other
observable Inputs
(Level 2) | | | Significant
unobservable inputs
(Level 3) | | | Total | |
| | | | |
| Equity securities | | | | | | | | | | | | | | | | |
Common stocks | | $ | 179,011,140 | | | $ | 0 | | | $ | 0 | | | $ | 179,011,140 | |
| | | | |
| Other | | | 0 | | | | 0 | | | | 348,803 | | | | 348,803 | |
| | | | |
| Short-term investments | | | | | | | | | | | | | | | | |
Investment companies | | | 1,295,646 | | | | 20,808,371 | | | | 0 | | | | 22,104,017 | |
| | | $ | 180,306,786 | | | $ | 20,808,371 | | | $ | 348,803 | | | $ | 201,463,960 | |
Further details on the major security types listed above can be found in the Portfolio of Investments.
Transfers in and transfers out are recognized at the end of the reporting period. For the six months ended January 31, 2013, the Fund did not have any transfers into/out of Level 1 or Level 2.
4. TRANSACTIONS WITH AFFILIATES AND OTHER EXPENSES
Advisory fee
The Trust has entered into an advisory contract with Funds Management, an indirect wholly owned subsidiary of Wells Fargo & Company (“Wells Fargo”). The adviser is responsible for implementing investment policies and guidelines and for supervising the subadviser, who is responsible for day-to-day portfolio management of the Fund.
Pursuant to the contract, Funds Management is entitled to receive an annual advisory fee starting at 0.65% and declining to 0.55% as the average daily net assets of the Fund increase. For the six months ended January 31, 2013, the advisory fee was equivalent to an annual rate of 0.65% of the Fund’s average daily net assets.
Funds Management has retained the services of a subadviser to provide daily portfolio management to the Fund. The fee for subadvisory services is borne by Funds Management. Golden Capital Management, LLC, an affiliate of Funds Management, is the subadviser to the Fund and is entitled to receive a fee from Funds Management at an annual rate starting at 0.35% and declining to 0.30% as the average daily net assets of the Fund increase. Wells Fargo Bank, N.A., an affiliate of Funds Management, owns a 65% majority stake interest in Golden Capital Management, LLC.
Administration and transfer agent fees
The Trust has entered into an administration agreement with Funds Management. Under this agreement, for providing administrative services, which includes paying fees and expenses for services provided by the transfer agent, sub-transfer agents, omnibus account servicers and record-keepers, Funds Management is entitled to receive from the Fund an annual fund level administration fee starting at 0.05% and declining to 0.03% as the average daily net assets of the Fund increase and a class level administration fee which is calculated based on the average daily net assets of each class as follows:
| | | | |
| | | Class level
administration fee | |
Class A, Class C | | | 0.26 | % |
Administrator Class | | | 0.10 | |
Institutional Class | | | 0.08 | |
Investor Class | | | 0.32 | |
| | | | |
| 22 | | Wells Fargo Advantage Large Cap Core Fund | | Notes to financial statements (unaudited) |
Funds Management has contractually waived and/or reimbursed advisory and administration fees to the extent necessary to maintain certain net operating expense ratios for the Fund. Waiver of fees and/or reimbursement of expenses by Funds Management were made first from fund level expenses on a proportionate basis and then from class specific expenses. Funds Management has committed through November 30, 2013 to waive fees and/or reimburse expenses to the extent necessary to cap the Fund’s expenses at 1.14% for Class A shares, 1.89% for Class C shares, 0.90% for Administrator Class shares, 0.66% for Institutional Class shares and 1.20% for Investor Class shares.
Distribution fees
The Trust has adopted a Distribution Plan for Class C shares of the Fund pursuant to Rule 12b-1 under the 1940 Act. Distribution fees are charged to Class C shares and paid to Wells Fargo Funds Distributor, LLC, the principal underwriter, at an annual rate of 0.75% of the average daily net assets of Class C shares.
For the six months ended January 31, 2013, Wells Fargo Funds Distributor, LLC received $1,136 from the sale of Class A shares.
Shareholder servicing fees
The Trust has entered into contracts with one or more shareholder servicing agents, whereby Class A, Class C, Administrator Class and Investor Class of the Fund is charged a fee at an annual rate of 0.25% of the average daily net assets of each respective class.
A portion of these total shareholder servicing fees were paid to affiliates of Wells Fargo.
5. INVESTMENT PORTFOLIO TRANSACTIONS
Purchases and sales of investments, excluding U.S. government obligations (if any) and short-term securities, for the six months ended January 31, 2013 were $55,256,916 and $59,244,796, respectively.
6. BANK BORROWINGS
The Trust (excluding the money market funds and certain other funds in the Trust) and Wells Fargo Variable Trust are parties to a $150,000,000 revolving credit agreement with State Street Bank and Trust Company, whereby the Fund is permitted to use bank borrowings for temporary or emergency purposes, such as to fund shareholder redemption requests. Interest under the credit agreement is charged to the Fund based on a borrowing rate equal to the higher of the Federal Funds rate in effect on that day plus 1.25% or the overnight LIBOR rate in effect on that day plus 1.25%. In addition, an annual commitment fee equal to 0.10% of the unused balance is allocated to each participating fund. For the six months ended January 31, 2013, the Fund paid $75 in commitment fees.
For the six months ended January 31, 2013, there were no borrowings by the Fund under the agreement.
7. INDEMNIFICATION
Under the Trust’s organizational documents, the officers and directors are indemnified against certain liabilities that may arise out of performance of their duties to the Trust. Additionally, in the normal course of business, the Trust may enter into contracts with service providers that contain a variety of indemnification clauses. The Trust’s maximum exposure under these arrangements is dependent on future claims that may be made against the Fund and, therefore, cannot be estimated.
8. NEW ACCOUNTING PRONOUNCEMENT
In December 2011, the Financial Accounting Standards Board (“FASB”) issued Accounting Standard Update (“ASU”) No. 2011-11, Disclosures about Offsetting Assets and Liabilities. ASU 2011-11, which amends FASB ASC Topic 210, Balance Sheet, creates new disclosure requirements which require entities to disclose both gross and net information for derivatives and other financial instruments that are either offset in the Statement of Assets and Liabilities or subject to an enforceable master netting arrangement or similar agreement. The disclosure requirements are effective for interim and annual reporting periods beginning on or after January 1, 2013. Management is currently assessing the potential impact, in addition to expanded financial statement disclosure, that may result from adopting this ASU.
| | | | | | |
| Other information (unaudited) | | Wells Fargo Advantage Large Cap Core Fund | | | 23 | |
PROXY VOTING INFORMATION
A description of the policies and procedures that the Fund uses to determine how to vote proxies relating to portfolio securities is available without charge, upon request, by calling 1-800-222-8222, visiting our website at wellsfargoadvantagefunds.com, or visiting the SEC website at sec.gov. Information regarding how the Fund voted proxies relating to portfolio securities during the most recent 12-month period ended June 30 is available without charge on the Fund’s website at wellsfargoadvantagefunds.com or by visiting the SEC website at sec.gov.
PORTFOLIO HOLDINGS INFORMATION
The complete portfolio holdings for the Fund are publicly available on the Fund’s website (wellsfargoadvantagefunds.com) on a monthly, 30-day or more delayed basis. In addition, top ten holdings information for the Fund is publicly available on the Fund’s website on a monthly, seven-day or more delayed basis. The Fund files its complete schedule of portfolio holdings with the SEC for the first and third quarters of each fiscal year on Form N-Q, which is available without charge by visiting the SEC website at sec.gov. In addition, the Fund’s Form N-Q may be reviewed and copied at the SEC’s Public Reference Room in Washington, DC, and at regional offices in New York City, at 233 Broadway, and in Chicago, at 175 West Jackson Boulevard, Suite 900. Information about the Public Reference Room may be obtained by calling 1-800-SEC-0330.
| | | | |
| 24 | | Wells Fargo Advantage Large Cap Core Fund | | Other information (unaudited) |
BOARD OF TRUSTEES AND OFFICERS
Each of the Trustees and Officers listed in the table below acts in identical capacities for the Wells Fargo Advantage family of funds, which consists of 136 funds1 comprising the Wells Fargo Funds Trust, Wells Fargo Variable Trust, Wells Fargo Master Trust and four closed-end funds (collectively the “Fund Complex”). This table should be read in conjunction with the Prospectus and the Statement of Additional Information2. All of the Trustees are also Members of the Audit and Governance Committees of each Trust in the Fund Complex. The mailing address of each Trustee and Officer is 525 Market Street, 12th Floor, San Francisco, CA 94105. Each Trustee and Officer serves an indefinite term, however, each Trustee serves such term until reaching the mandatory retirement age established by the Trustees.
Independent Trustees
| | | | | | |
Name and year of birth | | Position held and length of service* | | Principal occupations during past five years | | Other directorships during
past five years |
Peter G. Gordon
(Born 1942) | | Trustee, since 1998; Chairman, since 2005 | | Co-Founder, Retired Chairman, President and CEO of Crystal Geyser Water Company. Trustee Emeritus, Colby College. | | Asset Allocation Trust |
Isaiah Harris, Jr.
(Born 1952) | | Trustee, since 2009 | | Retired. Prior thereto, President and CEO of BellSouth Advertising and Publishing Corp. from 2005 to 2007, President and CEO of BellSouth Enterprises from 2004 to 2005 and President of BellSouth Consumer Services from 2000 to 2003. Emeritus member of the Iowa State University Foundation Board of Governors. Emeritus Member of the Advisory Board of Iowa State University School of Business. Advisory Board Member, Palm Coast Academy (charter school). Mr. Harris is a certified public accountant. | | CIGNA Corporation; Deluxe Corporation; Asset Allocation Trust |
Judith M. Johnson
(Born 1949) | | Trustee, since 2008;
Audit Committee Chairman, since 2008 | | Retired. Prior thereto, Chief Executive Officer and Chief Investment Officer of Minneapolis Employees Retirement Fund from 1996 to 2008. Ms. Johnson is an attorney, certified public accountant and a certified managerial accountant. | | Asset Allocation Trust |
Leroy Keith, Jr.
(Born 1939) | | Trustee, since 2010 | | Chairman, Bloc Global Services (development and construction). Trustee of the Evergreen Funds from 1983 to 2010. Former Managing Director, Almanac Capital Management (commodities firm), former Partner, Stonington Partners, Inc. (private equity fund), former Director, Obagi Medical Products Co. and former Director, Lincoln Educational Services. | | Trustee, Virtus Fund Complex (consisting of 48 portfolios as of 1/31/13); Asset Allocation Trust |
David F. Larcker
(Born 1950) | | Trustee, since 2009 | | James Irvin Miller Professor of Accounting at the Graduate School of Business, Stanford University, Morgan Stanley Director of the Center for Leadership Development and Research and Senior Faculty of The Rock Center for Corporate Governance since 2006. From 2005 to 2008, Professor of Accounting at the Graduate School of Business, Stanford University. Prior thereto, Ernst & Young Professor of Accounting at The Wharton School, University of Pennsylvania from 1985 to 2005. | | Asset Allocation Trust |
Olivia S. Mitchell
(Born 1953) | | Trustee, since 2006 | | International Foundation of Employee Benefit Plans Professor, Wharton School of the University of Pennsylvania since 1993. Director of Wharton’s Pension Research Council and Boettner Center on Pensions & Retirement Research, and Research Associate at the National Bureau of Economic Research. Previously, Cornell University Professor from 1978 to 1993. | | Asset Allocation Trust |
Timothy J. Penny
(Born 1951) | | Trustee, since 1996 | | President and CEO of Southern Minnesota Initiative Foundation, a non-profit organization, since 2007 and Senior Fellow at the Humphrey Institute Policy Forum at the University of Minnesota since 1995. Member of the Board of Trustees of NorthStar Education Finance, Inc., a non-profit organization, since 2007. | | Asset Allocation Trust |
| | | | | | |
| Other information (unaudited) | | Wells Fargo Advantage Large Cap Core Fund | | | 25 | |
| | | | | | |
Name and year of birth | | Position held and length of service* | | Principal occupations during past five years | | Other directorships during
past five years |
Michael S. Scofield
(Born 1943) | | Trustee, since 2010 | | Served on the Investment Company Institute’s Board of Governors and Executive Committee from 2008-2011 as well the Governing Council of the Independent Directors Council from 2006-2011 and the Independent Directors Council Executive Committee from 2008-2011. Chairman of the IDC from 2008-2010. Institutional Investor (Fund Directions) Trustee of Year in 2007. Trustee of the Evergreen Funds (and its predecessors) from 1984 to 2010. Chairman of the Evergreen Funds from 2000-2010. Former Trustee of the Mentor Funds. Retired Attorney, Law Offices of Michael S. Scofield. | | Asset Allocation Trust |
Donald C. Willeke
(Born 1940) | | Trustee, since 1996 | | Principal of the law firm of Willeke & Daniels. General Counsel of the Minneapolis Employees Retirement Fund from 1984 until its consolidation into the Minnesota Public Employees Retirement Association on June 30, 2010. Director and Vice Chair of The Tree Trust (non-profit corporation). Director of the American Chestnut Foundation (non-profit corporation). | | Asset Allocation Trust |
| * | Length of service dates reflect the Trustee’s commencement of service with the Trust’s predecessor entities, where applicable. |
Officers
| | | | | | |
Name and year of birth | | Position held and
length of service | | Principal occupations during past five years | | |
Karla M. Rabusch
(Born 1959) | | President, since 2003 | | Executive Vice President of Wells Fargo Bank, N.A. and President of Wells Fargo Funds Management, LLC since 2003. | | |
Jeremy DePalma1
(Born 1974) | | Treasurer, since 2012 | | Senior Vice President of Wells Fargo Funds Management, LLC since 2009. Senior Vice President of Evergreen Investment Management Company, LLC from 2008 to 2010. Vice President, Evergreen Investment Services, Inc. from 2004 to 2007. Head of the Fund Reporting and Control Team within Fund Administration from 2005 to 2010. | | |
C. David Messman
(Born 1960) | | Secretary, since 2000; Chief Legal Officer, since 2003 | | Senior Vice President and Secretary of Wells Fargo Funds Management, LLC since 2001. Vice President and Managing Counsel of Wells Fargo Bank, N.A. since 1996. | | |
Debra Ann Early
(Born 1964) | | Chief Compliance Officer, since 2007 | | Chief Compliance Officer of Wells Fargo Funds Management, LLC since 2007. Chief Compliance Officer of Parnassus Investments from 2005 to 2007. Chief Financial Officer of Parnassus Investments from 2004 to 2007. | | |
David Berardi
(Born 1975) | | Assistant Treasurer, since 2009 | | Vice President of Wells Fargo Funds Management, LLC since 2009. Vice President of Evergreen Investment Management Company, LLC from 2008 to 2010. Assistant Vice President of Evergreen Investment Services, Inc. from 2004 to 2008. Manager of Fund Reporting and Control for Evergreen Investment Management Company, LLC from 2004 to 2010. | | |
| 1. | Jeremy DePalma acts as Treasurer of 61 funds and Assistant Treasurer of 75 funds in the Fund Complex. |
| 2. | The Statement of Additional Information includes additional information about the Trustees and is available, without charge, upon request, by calling 1-800-222-8222 or by visiting the website at wellsfargoadvantagefunds.com. |
| | | | |
| 26 | | Wells Fargo Advantage Large Cap Core Fund | | List of abbreviations |
The following is a list of common abbreviations for terms and entities that may have appeared in this report.
| ACA | — ACA Financial Guaranty Corporation |
| ADR | — American depositary receipt |
| ADS | — American depositary shares |
| AGC | — Assured Guaranty Corporation |
| AGM | — Assured Guaranty Municipal |
| Ambac | — Ambac Financial Group Incorporated |
| AMT | — Alternative minimum tax |
| BAN | — Bond anticipation notes |
| BHAC | — Berkshire Hathaway Assurance Corporation |
| CAB | — Capital appreciation bond |
| CCAB | — Convertible capital appreciation bond |
| CDA | — Community Development Authority |
| CDO | — Collateralized debt obligation |
| COP | — Certificate of participation |
| DRIVER | — Derivative inverse tax-exempt receipts |
| DW&P | — Department of Water & Power |
| DWR | — Department of Water Resources |
| ECFA | — Educational & Cultural Facilities Authority |
| EDA | — Economic Development Authority |
| EDFA | — Economic Development Finance Authority |
| ETF | — Exchange-traded fund |
| FDIC | — Federal Deposit Insurance Corporation |
| FFCB | — Federal Farm Credit Banks |
| FGIC | — Financial Guaranty Insurance Corporation |
| FHA | — Federal Housing Administration |
| FHLB | — Federal Home Loan Bank |
| FHLMC | — Federal Home Loan Mortgage Corporation |
| FICO | — The Financing Corporation |
| FNMA | — Federal National Mortgage Association |
| GDR | — Global depositary receipt |
| GNMA | — Government National Mortgage Association |
| HCFR | — Healthcare facilities revenue |
| HEFA | — Health & Educational Facilities Authority |
| HEFAR | — Higher education facilities authority revenue |
| HFA | — Housing Finance Authority |
| HFFA | — Health Facilities Financing Authority |
| HUD | — Department of Housing and Urban Development |
| IDA | — Industrial Development Authority |
| IDAG | — Industrial Development Agency |
| IDR | — Industrial development revenue |
| KRW | — Republic of Korea won |
| LIBOR | — London Interbank Offered Rate |
| LLC | — Limited liability company |
| LLP | — Limited liability partnership |
| MBIA | — Municipal Bond Insurance Association |
| MFHR | — Multifamily housing revenue |
| MSTR | — Municipal securities trust receipts |
| MUD | — Municipal Utility District |
| National | — National Public Finance Guarantee Corporation |
| PCFA | — Pollution Control Financing Authority |
| PCL | — Public Company Limited |
| PCR | — Pollution control revenue |
| PFA | — Public Finance Authority |
| PFFA | — Public Facilities Financing Authority |
| PFOTER | — Puttable floating option tax-exempt receipts |
| plc | — Public limited company |
| PUTTER | — Puttable tax-exempt receipts |
| R&D | — Research & development |
| Radian | — Radian Asset Assurance |
| RAN | — Revenue anticipation notes |
| RDA | — Redevelopment Authority |
| RDFA | — Redevelopment Finance Authority |
| REIT | — Real estate investment trust |
| ROC | — Reset option certificates |
| SAVRS | — Select auction variable rate securities |
| SBA | — Small Business Authority |
| SFHR | — Single-family housing revenue |
| SFMR | — Single-family mortgage revenue |
| SPA | — Standby purchase agreement |
| SPDR | — Standard & Poor’s Depositary Receipts |
| STRIPS | — Separate trading of registered interest and principal securities |
| TAN | — Tax anticipation notes |
| TIPS | — Treasury inflation-protected securities |
| TRAN | — Tax revenue anticipation notes |
| TTFA | — Transportation Trust Fund Authority |
| TVA | — Tennessee Valley Authority |
This page is intentionally left blank.
This page is intentionally left blank.
This page is intentionally left blank.
This page is intentionally left blank.


For more information
More information about Wells Fargo Advantage Funds is available free upon request. To obtain literature, please write, email, visit the Fund’s website, or call:
Wells Fargo Advantage Funds
P.O. Box 8266
Boston, MA 02266-8266
Email: wfaf@wellsfargo.com
Website: wellsfargoadvantagefunds.com
Individual investors: 1-800-222-8222
Retail investment professionals: 1-888-877-9275
Institutional investment professionals: 1-866-765-0778
This report and the financial statements contained herein are submitted for the general information of the shareholders of Wells Fargo Advantage Funds. If this report is used for promotional purposes, distribution of the report must be accompanied or preceded by a current prospectus. For a current prospectus and, if available, a summary prospectus containing more complete information, including charges and expenses, call 1-800-222-8222 or visit the Fund’s website at wellsfargoadvantagefunds.com. Please consider the investment objectives, risks, charges, and expenses of the investment carefully before investing. This and other information about Wells Fargo Advantage Funds can be found in the current prospectus. Read the prospectus carefully before you invest or send money.
Wells Fargo Funds Management, LLC, a wholly owned subsidiary of Wells Fargo & Company, provides investment advisory and administrative services for Wells Fargo Advantage Funds. Other affiliates of Wells Fargo & Company provide subadvisory and other services for the Funds. The Funds are distributed by Wells Fargo Funds Distributor, LLC, Member FINRA/SIPC, an affiliate of Wells Fargo & Company.
NOT FDIC INSURED ¡ NO BANK GUARANTEE ¡ MAY LOSE VALUE
© 2013 Wells Fargo Funds Management, LLC. All rights reserved.
| | |
 | | 215106 03-13 SA208/SAR208 1-13 |

Wells Fargo Advantage Large Cap Growth Fund

Semi-Annual Report
January 31, 2013

Reduce clutter. Save trees.
Sign up for electronic delivery of prospectuses and shareholder reports at wellsfargo.com/advantagedelivery
Contents
The views expressed and any forward-looking statements are as of January 31, 2013, unless otherwise noted, and are those of the Fund managers and/or Wells Fargo Funds Management, LLC. Discussions of individual securities, or the markets generally, or any Wells Fargo Advantage Fund are not intended as individual recommendations. Future events or results may vary significantly from those expressed in any forward-looking statements; the views expressed are subject to change at any time in response to changing circumstances in the market. Wells Fargo Funds Management, LLC, disclaims any obligation to publicly update or revise any views expressed or forward-looking statements.
NOT FDIC INSURED ¡ NO BANK GUARANTEE ¡ MAY LOSE VALUE

Wells Fargo investment history
| | |
| 1932 | | Keystone creates one of the first mutual fund families. |
| 1971 | | Wells Fargo & Company introduces one of the first institutional index funds. |
| 1978 | | Wells Fargo applies Markowitz and Sharpe’s research on Modern Portfolio Theory to introduce one of the industry’s first tactical asset allocation models in institutional separately managed accounts. |
| 1984 | | Wells Fargo Stagecoach Funds launches its first asset allocation fund. |
| 1989 | | The Tactical Asset Allocation (TAA) Model is first applied to Wells Fargo’s asset allocation mutual funds. |
| 1994 | | Wells Fargo introduces the LifePath Funds, one of the first suites of target date funds (now the Wells Fargo Advantage Dow Jones Target Date FundsSM). |
| 1996 | | Evergreen Investments and Keystone Funds merge. |
| 1997 | | Wells Fargo launches the Wells Fargo Advantage WealthBuilder PortfoliosSM, a fund-of-funds suite of products that includes the use of quantitative models to shift assets among investment styles. |
| 1999 | | Norwest Advantage Funds and Stagecoach Funds are reorganized into Wells Fargo Funds after the merger of Norwest and Wells Fargo. |
| 2002 | | Evergreen Retail and Evergreen Institutional companies form the umbrella asset management company, Evergreen Investments. |
| 2005 | | The integration of Strong Funds with Wells Fargo Funds creates Wells Fargo Advantage Funds, resulting in one of the top 20 mutual fund companies in the United States. |
| 2006 | | Wells Fargo Advantage Funds relaunches the target date product line as Wells Fargo Advantage Dow Jones Target Date Funds. |
| 2010 | | The mergers and reorganizations of Evergreen and Wells Fargo Advantage mutual funds are completed, unifying the families under the brand of Wells Fargo Advantage Funds. |
Wells Fargo Advantage Funds®
Wells Fargo Advantage Funds skillfully guides institutions, financial advisors, and individuals through the investment terrain to help them reach their financial objectives. Everything we do on behalf of investors is backed by our unique combination of qualifications.
Strength
Our organization is built on the standards of integrity and service established by our parent company—Wells Fargo & Company—more than 150 years ago. And, because we’re part of a highly diversified financial enterprise, we offer the depth of resources to help investors succeed.
Expertise
Our multi-boutique model offers investors access to the independent thinking of premier investment managers that have been chosen for their time-tested strategies. While each team specializes in a specific investment strategy, collectively they provide investors a wide choice of distinct investment styles. Our dedication to investment excellence doesn’t end with our expertise in manager selection—risk management, analysis, and rigorous ongoing review seek to ensure each manager’s investment process remains consistent.
Partnership
Our collaborative approach is built around understanding the needs and goals of our clients. By adhering to core principles of sound judgment and steady guidance, we support you through every stage of the investment decision process.
Carefully consider the investment objectives, risks, charges, and expenses before investing. For a current prospectus and, if available, a summary prospectus, for Wells Fargo Advantage Funds, containing this and other information, visit wellsfargoadvantagefunds.com. Read it carefully before investing.
Wells Fargo Funds Management, LLC, a wholly owned subsidiary of Wells Fargo & Company, provides investment advisory and administrative services for Wells Fargo Advantage Funds. Other affiliates of Wells Fargo & Company provide subadvisory and other services for the Funds. The Funds are distributed by Wells Fargo Funds Distributor, LLC, Member FINRA/SIPC, an affiliate of Wells Fargo & Company.
“Dow Jones®” and “Dow Jones Target Date IndexesSM” are service marks of Dow Jones Trademark Holdings LLC (“Dow Jones”); have been licensed to CME Group Index Services LLC (“CME Indexes”); and have been sublicensed for use for certain purposes by Global Index Advisors, Inc., and Wells Fargo Funds Management, LLC. The Wells Fargo Advantage Dow Jones Target Date FundsSM, based on the Dow Jones Target Date Indexes, are not sponsored, endorsed, sold, or promoted by Dow Jones, CME Indexes, or their respective affiliates, and none of them makes any representation regarding the advisability of investing in such product(s).
NOT FDIC INSURED ¡ NO BANK GUARANTEE ¡ MAY LOSE VALUE
Not part of the semi-annual report.
Wells Fargo Advantage Funds offers more than 110 mutual funds across a wide range of asset classes, representing over $226 billion in assets under management, as of January 31, 2013.
| | | | |
| Equity funds | | | | |
Asia Pacific Fund | | Enterprise Fund† | | Opportunity Fund† |
C&B Large Cap Value Fund | | Global Opportunities Fund | | Precious Metals Fund |
C&B Mid Cap Value Fund | | Growth Fund | | Premier Large Company Growth Fund |
Capital Growth Fund | | Index Fund | | Small Cap Opportunities Fund |
Common Stock Fund | | International Equity Fund | | Small Cap Value Fund |
Disciplined U.S. Core Fund | | International Value Fund | | Small Company Growth Fund |
Discovery Fund† | | Intrinsic Small Cap Value Fund | | Small Company Value Fund |
Diversified Equity Fund | | Intrinsic Value Fund | | Small/Mid Cap Value Fund |
Diversified International Fund | | Intrinsic World Equity Fund | | Special Mid Cap Value Fund |
Emerging Growth Fund | | Large Cap Core Fund | | Special Small Cap Value Fund |
Emerging Markets Equity Fund | | Large Cap Growth Fund | | Specialized Technology Fund |
Emerging Markets Equity Income Fund | | Large Company Value Fund | | Traditional Small Cap Growth Fund |
Endeavor Select Fund† | | Omega Growth Fund | | Utility and Telecommunications Fund |
| Bond funds | | | | |
Adjustable Rate Government Fund | | High Yield Municipal Bond Fund | | Short Duration Government Bond Fund |
California Limited-Term Tax-Free Fund | | Income Plus Fund | | Short-Term Bond Fund |
California Tax-Free Fund | | Inflation-Protected Bond Fund | | Short-Term High Yield Bond Fund |
Colorado Tax-Free Fund | | Intermediate Tax/AMT-Free Fund | | Short-Term Municipal Bond Fund |
Core Bond Fund | | International Bond Fund | | Strategic Income Fund |
Emerging Markets Local Bond Fund | | Minnesota Tax-Free Fund | | Strategic Municipal Bond Fund |
Government Securities Fund | | Municipal Bond Fund | | Ultra Short-Term Income Fund |
High Income Fund | | North Carolina Tax-Free Fund | | Ultra Short-Term Municipal Income Fund |
High Yield Bond Fund | | Pennsylvania Tax-Free Fund | | Wisconsin Tax-Free Fund |
| Asset allocation funds | | | | |
Absolute Return Fund | | WealthBuilder Equity Portfolio† | | Target 2020 Fund† |
Asset Allocation Fund | | WealthBuilder Growth Allocation Portfolio† | | Target 2025 Fund† |
Conservative Allocation Fund | | WealthBuilder Growth Balanced Portfolio† | | Target 2030 Fund† |
Diversified Capital Builder Fund | | WealthBuilder Moderate Balanced Portfolio† | | Target 2035 Fund† |
Diversified Income Builder Fund | | WealthBuilder Tactical Equity Portfolio† | | Target 2040 Fund† |
Growth Balanced Fund | | Target Today Fund† | | Target 2045 Fund† |
Index Asset Allocation Fund | | Target 2010 Fund† | | Target 2050 Fund† |
Moderate Balanced Fund | | Target 2015 Fund† | | Target 2055 Fund† |
WealthBuilder Conservative Allocation Portfolio† | | | | |
| Money market funds | | | | |
100% Treasury Money Market Fund | | Heritage Money Market Fund† | | National Tax-Free Money Market Fund |
California Municipal Money Market Fund | | Money Market Fund | | Treasury Plus Money Market Fund |
Cash Investment Money Market Fund | | Municipal Cash Management Money Market Fund | | |
Government Money Market Fund | | Municipal Money Market Fund | | |
| Variable trust funds1 | | | | |
VT Discovery Fund† | | VT Intrinsic Value Fund | | VT Small Cap Growth Fund |
VT Index Asset Allocation Fund | | VT Omega Growth Fund | | VT Small Cap Value Fund |
VT International Equity Fund | | VT Opportunity Fund† | | VT Total Return Bond Fund |
An investment in a money market fund is not insured or guaranteed by the Federal Deposit Insurance Corporation or any other government agency. Although the Wells Fargo Advantage Money Market Funds seek to preserve the value of your investment at $1.00 per share, it is possible to lose money by investing in a money market fund.
| 1. | The variable trust funds are generally available only through insurance company variable contracts. |
| † | In this report, the Wells Fargo Advantage Discovery FundSM, Wells Fargo Advantage Endeavor Select FundSM, Wells Fargo Advantage Enterprise FundSM, Wells Fargo Advantage Opportunity FundSM, Wells Fargo Advantage WealthBuilder Conservative Allocation PortfolioSM, Wells Fargo Advantage WealthBuilder Equity PortfolioSM, Wells Fargo Advantage WealthBuilder Growth Allocation PortfolioSM, Wells Fargo Advantage WealthBuilder Growth Balanced PortfolioSM, Wells Fargo Advantage WealthBuilder Moderate Balanced PortfolioSM, Wells Fargo Advantage WealthBuilder Tactical Equity PortfolioSM, Wells Fargo Advantage Dow Jones Target Today FundSM, Wells Fargo Advantage Dow Jones Target 2010 FundSM, Wells Fargo Advantage Dow Jones Target 2015 FundSM, Wells Fargo Advantage Dow Jones Target 2020 FundSM, Wells Fargo Advantage Dow Jones Target 2025 FundSM, Wells Fargo Advantage Dow Jones Target 2030 FundSM, Wells Fargo Advantage Dow Jones Target 2035 FundSM, Wells Fargo Advantage Dow Jones Target 2040 FundSM, Wells Fargo Advantage Dow Jones Target 2045 FundSM, Wells Fargo Advantage Dow Jones Target 2050 FundSM, Wells Fargo Advantage Dow Jones Target 2055 FundSM, Wells Fargo Advantage Heritage Money Market FundSM, Wells Fargo Advantage VT Discovery FundSM, and Wells Fargo Advantage VT Opportunity FundSM are referred to as the Discovery Fund, Endeavor Select Fund, Enterprise Fund, Opportunity Fund, WealthBuilder Conservative Allocation Portfolio, WealthBuilder Equity Portfolio, WealthBuilder Growth Allocation Portfolio, WealthBuilder Growth Balanced Portfolio, WealthBuilder Moderate Balanced Portfolio, WealthBuilder Tactical Equity Portfolio, Target Today Fund, Target 2010 Fund, Target 2015 Fund, Target 2020 Fund, Target 2025 Fund, Target 2030 Fund, Target 2035 Fund, Target 2040 Fund, Target 2045 Fund, Target 2050 Fund, Target 2055 Fund, Heritage Money Market Fund, VT Discovery Fund, and VT Opportunity Fund, respectively. |
Not part of the semi-annual report.
| | | | |
| 2 | | Wells Fargo Advantage Large Cap Growth Fund | | Letter to shareholders (unaudited) |

Karla M. Rabusch
President
Wells Fargo Advantage Funds
Entering the period, concerns about the eurozone sovereign debt situation held center stage as investors again focused on economic weakness in southern European economies.
Aggressive central bank actions helped support stock prices, as did relatively solid economic data.
Dear Valued Shareholder:
We are pleased to offer you this semi-annual report for the Wells Fargo Advantage Large Cap Growth Fund for the six-month period that ended January 31, 2013. Much of the period was marked by continued concerns about the possible effects that the ongoing European sovereign debt crisis would have on the global economy. However, relatively solid economic data in the U.S. and efforts by European authorities to address the sovereign debt issue alleviated investor fears and supported global stock markets. Judging by various indexes, U.S. large-cap stocks underperformed small-cap stocks. Within the large-cap universe, value stocks outperformed growth stocks, partly because of strong performance from the financials sector.
The period was dominated by worries that ongoing debt problems in the eurozone would affect global economic growth.
Entering the period, concerns about the eurozone sovereign debt situation held center stage as investors again focused on economic weakness in southern European economies. Because many eurozone banks owned southern European debt and many U.S. banks had financial ties to eurozone banks, investors worried about the effects of a possible southern European debt default on the global financial system and economy. Ongoing weakness in the Greek economy made it difficult for the country to meet previously agreed upon austerity targets. Toward the end of the reporting period, political risk resurfaced in both Italy and Spain. In Italy, Prime Minister Mario Monti, an economist who was appointed to implement austerity measures and labor market reforms, resigned in December 2012. Monti later decided to run for office in the general election scheduled for February 2013.
European leaders took concerted action to calm investor concerns. In September 2012, the European Central Bank (ECB) announced that it would purchase an unlimited amount of one- to three-year sovereign debt from countries that had applied for a formal bailout through either the European Financial Stability Facility or the European Stability Mechanism. In another positive sign, in late November 2012, finance ministers from the 17-country eurozone and the International Monetary Fund struck a deal aimed at reducing Greece’s debt by the year 2020.
Central banks continued to provide stimulus.
Major central banks, including the U.S. Federal Reserve (Fed) and the ECB, continued to inject liquidity into the banks and the markets through various quantitative easing policies. Throughout the reporting period, the Federal Open Market Committee (FOMC) kept its key interest rates effectively at zero in order to support the economy and the financial system. The ECB was similarly aggressive, keeping its key rate at a historic low of 0.75%. Just prior to the beginning of the reporting period, the FOMC announced its intention to keep interest rates low until at least mid-2015 in order to support the sluggish economy. The Fed also announced open-ended purchases of $40 billion per month in mortgage-backed securities in an effort to support the housing market.
Stock markets posted solid gains in an eventful period.
Aggressive central bank actions helped support stock prices, as did relatively solid economic data. For much of the reporting period, the U.S. stock market benefited from favorable gross domestic product (GDP) data, with the growth rate improving from 1.3% (annualized) in the second quarter of 2012 to 3.1% (annualized) in the third quarter of 2012. However, the GDP growth rate slowed in the final months of 2012, with GDP growth coming in at 0.1% (annualized) in the fourth quarter of 2012. Because many investors attributed the weak number to the aftereffects of Hurricane Sandy on the eastern seaboard, the stock market remained resilient.
| | | | | | |
| Letter to shareholders (unaudited) | | Wells Fargo Advantage Large Cap Growth Fund | | | 3 | |
The steady improvement in the housing market supported investor sentiment. The National Association of Home Builders/First American Improving Markets Index identifies metro areas that have shown improvement from their respective troughs in housing permits, employment, and house prices for at least six consecutive months. The index rose for a fifth-consecutive month in January 2013, indicating improvements in 242 housing markets across the country. As a result, housing-related stocks strongly outperformed over the period, leading to better-than-index returns for sectors ranging from consumer discretionary (home improvement retailers), to materials (construction material providers), and to financials (mortgage lenders).
Throughout the period, a continued high unemployment rate was the main negative piece of U.S. economic data. Although the unemployment rate improved from 8.1% in August 2012 to 7.9% in January 2013, the labor market remained soft.
We remain committed to our investment strategies, even as many variables are at work in the market.
The full effect of the European credit crisis remains unknown. Elevated unemployment and debt defaults continue to pressure consumers and businesses alike. As a whole, Wells Fargo Advantage Funds represents investments across a range of asset classes and investment styles, giving you an opportunity to create a diversified investment portfolio. While diversification may not prevent losses in a downturn, we believe it helps manage risk.
Thank you for choosing to invest with Wells Fargo Advantage Funds. We appreciate your confidence in us and remain committed to helping you meet your financial needs. For current information about your fund investments, contact your investment professional, visit our website at wellsfargoadvantagefunds.com, or call us directly at 1-800-222-8222. We are available 24 hours a day, 7 days a week.
Sincerely,

Karla M. Rabusch
President
Wells Fargo Advantage Funds
Notice to shareholders
At its November 6-7, 2012 meeting, the Board of Trustees unanimously approved the following modifications to certain Class A sales load waiver privileges, with each change becoming effective on July 1, 2013:
| | n | | Annuity payments received under an annuity option or from death proceeds will no longer qualify for net asset value (NAV) repurchase privileges. | |
| | n | | The ability to reinvest redemption proceeds at NAV will be reduced from 120 days to 90 days. | |
| | n | | NAV purchase privileges for certain types of “grandfathered” shareholders will be modified to remove the ability to purchase Class A shares at NAV, unless those shares are held directly with the Fund. | |
Please contact your investment professional or call us directly at 1-800-222-8222 if you have any questions on this Notice to Shareholders.
| | | | |
| 4 | | Wells Fargo Advantage Large Cap Growth Fund | | Performance highlights (unaudited) |
Investment objective
The Fund seeks long-term capital appreciation.
Adviser
Wells Fargo Funds Management, LLC
Subadviser
Wells Capital Management Incorporated
Portfolio managers
Joseph M. Eberhardy CFA, CPA
Thomas C. Ognar, CFA
Bruce C. Olson, CFA
Average annual total returns1 (%) as of January 31, 2013
| | | | | | | | | | | | | | | | | | | | | | | | | | | | | | | | | | |
| | | | | Including sales charge | | | Excluding sales charge | | | Expense ratios2 (%) | |
| | | Inception date | | 1 year | | | 5 year | | | 10 year | | | 1 year | | | 5 year | | | 10 year | | | Gross | | | Net3 | |
| Class A (STAFX) | | 7-30-2010 | | | 3.65 | | | | 4.14 | | | | 7.43 | | | | 9.97 | | | | 5.38 | | | | 8.06 | | | | 1.26 | | | | 1.08 | |
| Class C (STOFX) | | 7-30-2010 | | | 8.16 | | | | 4.63 | | | | 7.32 | | | | 9.16 | | | | 4.63 | | | | 7.32 | | | | 2.01 | | | | 1.83 | |
| Class R (STMFX) | | 6-15-2012 | | | – | | | | – | | | | – | | | | 9.71 | | | | 5.19 | | | | 7.90 | | | | 1.51 | | | | 1.33 | |
| Class R4 (SLGRX) | | 11-30-2012 | | | – | | | | – | | | | – | | | | 10.36 | | | | 5.57 | | | | 8.16 | | | | 0.93 | | | | 0.76 | |
| Class R6 (STFFX) | | 11-30-2012 | | | – | | | | – | | | | – | | | | 10.37 | | | | 5.57 | | | | 8.16 | | | | 0.78 | | | | 0.61 | |
| Administrator Class (STDFX) | | 7-30-2010 | | | – | | | | – | | | | – | | | | 10.10 | | | | 5.45 | | | | 8.10 | | | | 1.10 | | | | 0.96 | |
| Institutional Class (STNFX) | | 7-30-2010 | | | – | | | | – | | | | – | | | | 10.35 | | | | 5.57 | | | | 8.16 | | | | 0.83 | | | | 0.66 | |
| Investor Class (STRFX) | | 12-31-1981 | | | – | | | | – | | | | – | | | | 9.88 | | | | 5.33 | | | | 8.04 | | | | 1.32 | | | | 1.14 | |
| Russell 1000® Growth Index4 | | – | | | – | | | | – | | | | – | | | | 13.43 | | | | 5.70 | | | | 8.24 | | | | – | | | | – | |
Figures quoted represent past performance, which is no guarantee of future results and do not reflect the deduction of taxes that a shareholder may pay on fund distributions or the redemption of fund shares. Investment return and principal value of an investment will fluctuate so that an investor’s shares, when redeemed, may be worth more or less than their original cost. Performance shown without sales charges would be lower if sales charges were reflected. Current performance may be lower or higher than the performance data quoted and assumes the reinvestment of dividends and capital gains. Current month-end performance is available on the Fund’s website, wellsfargoadvantagefunds.com.
Index returns do not include transaction costs associated with buying and selling securities, any mutual fund fees or expenses, or any taxes. It is not possible to invest directly in an index.
For Class A shares, the maximum front-end sales charge is 5.75%. For Class C shares, the maximum contingent deferred sales charge is 1.00%. Performance including sales charge assumes the sales charge for the corresponding time period. Class R, Class R4, Class R6, Administrator Class, Institutional Class, and Investor Class shares are sold without a front-end sales charge or contingent deferred sales charge.
Stock values fluctuate in response to the activities of individual companies and general market and economic conditions. Certain investment strategies tend to increase the total risk of an investment (relative to the broader market). The Fund is exposed to foreign investment risk. Consult the Fund’s prospectus for additional information on these and other risks.
Please see footnotes on page 5.
| | | | | | |
| Performance highlights (unaudited) | | Wells Fargo Advantage Large Cap Growth Fund | | | 5 | |
| | | | |
| Ten largest equity holdings5 (%) as of January 31, 2013 | |
Apple Incorporated | | | 5.16 | |
Google Incorporated Class A | | | 3.91 | |
eBay Incorporated | | | 3.21 | |
Cognizant Technology Solutions Corporation Class A | | | 2.93 | |
QUALCOMM Incorporated | | | 2.72 | |
Alexion Pharmaceuticals Incorporated | | | 2.61 | |
Whole Foods Market Incorporated | | | 2.53 | |
Union Pacific Corporation | | | 2.30 | |
Dollar Tree Incorporated | | | 2.30 | |
MasterCard Incorporated Class A | | | 2.21 | |
| | |
| Sector distribution6 as of January 31, 2013 |
|
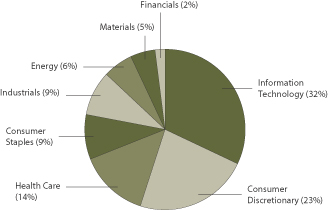
|
| 1. | Historical performance shown for Class R4 shares prior to their inception reflects the performance of the Institutional Class shares, adjusted to reflect the higher expenses applicable to Class R4 shares. Historical performance shown for the Class R6 shares prior to their inception reflects the performance of the Institutional Class shares, and includes the higher expenses applicable to the Institutional Class shares. If these expenses had not been included, returns would be higher. Historical performance for the Institutional Class shares prior to their inception reflects the performance of the Investor Class shares, and includes the higher expenses applicable to the Investor Class shares. If these expenses had not been included, returns would be higher. Historical performance shown for Class R shares prior to their inception reflects the performance of the Investor Class shares, adjusted to reflect the higher expenses applicable to Class R shares. Historical performance shown for Class C shares prior to their inception reflects the performance of the Investor Class shares, adjusted to reflect the higher expenses applicable to Class C shares. Historical performance shown for the Class A and Administrator shares prior to their inception reflects the performance of the Investor Class shares, and includes the higher expenses applicable to the Investor Class shares. If these expenses had not been included, returns would be higher. |
| 2. | Reflects the expense ratios as stated in the most recent prospectuses. |
| 3. | The Adviser has committed through November 30, 2014, to waive fees and/or reimburse expenses to the extent necessary to cap the Fund’s Total Annual Fund Operating Expenses After Fee Waiver, excluding certain expenses, at 1.07% for Class A, 1.82% for Class C, 1.32% for Class R, 0.75% for Class R4, 0.60% for Class R6, 0.95% for Administrator Class, 0.65% for Institutional Class, and 1.13% for Investor Class. Brokerage commissions, stamp duty fees, interest, taxes, acquired fund fees and expenses, and extraordinary expenses are excluded from the cap. Without this cap, the Fund’s returns would have been lower. |
| 4. | The Russell 1000® Growth Index measures the performance of those Russell 1000 Index companies with higher price-to-book ratios and higher forecasted growth values. You cannot invest directly in an index. |
| 5. | The ten largest equity holdings are calculated based on the value of the securities divided by total net assets of the Fund. Holdings are subject to change and may have changed since the date specified. |
| 6. | Sector distribution is subject to change and is calculated based on the total long-term investments of the Fund. |
| | | | |
| 6 | | Wells Fargo Advantage Large Cap Growth Fund | | Fund expenses (unaudited) |
As a shareholder of the Fund, you incur two types of costs: (1) transaction costs, including sales charges (loads) on purchase payments and contingent deferred sales charges (if any) on redemptions and (2) ongoing costs, including management fees, distribution (12b-1) and/or shareholder service fees, and other Fund expenses. This example is intended to help you understand your ongoing costs (in dollars) of investing in the Fund and to compare these costs with the ongoing costs of investing in other mutual funds.
The example is based on an investment of $1,000 invested at the beginning of the six-month period and held for the entire period from August 1, 2012 to January 31, 2013.
Actual expenses
The “Actual” line of the table below provides information about actual account values and actual expenses. You may use the information in this line, together with the amount you invested, to estimate the expenses that you paid over the period. Simply divide your account value by $1,000 (for example, an $8,600 account value divided by $1,000 = 8.6), then multiply the result by the number in the “Actual” line under the heading entitled “Expenses paid during period” for your applicable class of shares to estimate the expenses you paid on your account during this period.
Hypothetical example for comparison purposes
The “Hypothetical” line of the table below provides information about hypothetical account values and hypothetical expenses based on the Fund’s actual expense ratio and an assumed rate of return of 5% per year before expenses, which is not the Fund’s actual return. The hypothetical account values and expenses may not be used to estimate the actual ending account balance or expenses you paid for the period. You may use this information to compare the ongoing costs of investing in the Fund and other funds. To do so, compare this 5% hypothetical example with the 5% hypothetical examples that appear in the shareholder reports of the other funds.
Please note that the expenses shown in the table are meant to highlight your ongoing costs only and do not reflect any transactional costs, such as sales charges (loads) and contingent deferred sales charges. Therefore, the “Hypothetical” line of the table is useful in comparing ongoing costs only and will not help you determine the relative total costs of owning different funds. In addition, if these transactional costs were included, your costs would have been higher.
| | | | | | | | | | | | | | | | |
| | | Beginning
account value
8-1-2012 | | | Ending
account value
1-31-2013 | | | Expenses
paid during
the period1 | | | Net annual
expense ratio | |
Class A | | | | | | | | | | | | | | | | |
Actual | | $ | 1,000.00 | | | $ | 1,073.36 | | | $ | 5.59 | | | | 1.07 | % |
Hypothetical (5% return before expenses) | | $ | 1,000.00 | | | $ | 1,019.81 | | | $ | 5.45 | | | | 1.07 | % |
Class C | | | | | | | | | | | | | | | | |
Actual | | $ | 1,000.00 | | | $ | 1,069.38 | | | $ | 9.49 | | | | 1.82 | % |
Hypothetical (5% return before expenses) | | $ | 1,000.00 | | | $ | 1,016.03 | | | $ | 9.25 | | | | 1.82 | % |
Class R | | | | | | | | | | | | | | | | |
Actual | | $ | 1,000.00 | | | $ | 1,071.92 | | | $ | 6.89 | | | | 1.32 | % |
Hypothetical (5% return before expenses) | | $ | 1,000.00 | | | $ | 1,018.55 | | | $ | 6.72 | | | | 1.32 | % |
Class R4 | | | | | | | | | | | | | | | | |
Actual | | $ | 1,000.00 | | | $ | 1,075.28 | | | $ | 3.92 | | | | 0.75 | % |
Hypothetical (5% return before expenses) | | $ | 1,000.00 | | | $ | 1,021.42 | | | $ | 3.82 | | | | 0.75 | % |
Class R6 | | | | | | | | | | | | | | | | |
Actual | | $ | 1,000.00 | | | $ | 1,075.45 | | | $ | 3.14 | | | | 0.60 | % |
Hypothetical (5% return before expenses) | | $ | 1,000.00 | | | $ | 1,022.18 | | | $ | 3.06 | | | | 0.60 | % |
Administrator Class | | | | | | | | | | | | | | | | |
Actual | | $ | 1,000.00 | | | $ | 1,073.96 | | | $ | 4.97 | | | | 0.95 | % |
Hypothetical (5% return before expenses) | | $ | 1,000.00 | | | $ | 1,020.42 | | | $ | 4.84 | | | | 0.95 | % |
Institutional Class | | | | | | | | | | | | | | | | |
Actual | | $ | 1,000.00 | | | $ | 1,075.17 | | | $ | 3.77 | | | | 0.72 | % |
Hypothetical (5% return before expenses) | | $ | 1,000.00 | | | $ | 1,021.58 | | | $ | 3.67 | | | | 0.72 | % |
Investor Class | | | | | | | | | | | | | | | | |
Actual | | $ | 1,000.00 | | | $ | 1,073.04 | | | $ | 5.96 | | | | 1.14 | % |
Hypothetical (5% return before expenses) | | $ | 1,000.00 | | | $ | 1,019.46 | | | $ | 5.80 | | | | 1.14 | % |
| 1. | Expenses paid is equal to the annualized expense ratio of each class multiplied by the average account value over the period, multiplied by the number of days in the most recent fiscal half-year divided by the number of days in the fiscal year (to reflect the one-half-year period). |
| | | | | | |
| Portfolio of investments—January 31, 2013 (unaudited) | | Wells Fargo Advantage Large Cap Growth Fund | | | 7 | |
| | | | | | | | | | | | |
| Security name | | | | | | Shares | | | Value | |
| | | | | | | | | | | | |
| | | | |
Common Stocks: 98.30% | | | | | | | | | | | | |
| | | | |
Consumer Discretionary: 22.58% | | | | | | | | | | | | |
| | | | |
| Hotels, Restaurants & Leisure: 6.04% | | | | | | | | | | | | |
Chipotle Mexican Grill Incorporated †« | | | | | | | 56,000 | | | $ | 17,192,560 | |
Marriott International Incorporated Class A « | | | | | | | 439,000 | | | | 17,551,220 | |
McDonald’s Corporation | | | | | | | 139,000 | | | | 13,245,310 | |
Starbucks Corporation | | | | | | | 415,000 | | | | 23,289,800 | |
Wynn Resorts Limited | | | | | | | 65,000 | | | | 8,139,300 | |
| | | | |
| | | | | | | | | | | 79,418,190 | |
| | | | | | | | | | | | |
| | | | |
| Internet & Catalog Retail: 2.82% | | | | | | | | | | | | |
Amazon.com Incorporated † | | | | | | | 78,000 | | | | 20,709,000 | |
priceline.com Incorporated † | | | | | | | 24,000 | | | | 16,451,280 | |
| | | | |
| | | | | | | | | | | 37,160,280 | |
| | | | | | | | | | | | |
| | | | |
| Media: 0.70% | | | | | | | | | | | | |
CBS Corporation Class B | | | | | | | 222,000 | | | | 9,261,840 | |
| | | | | | | | | | | | |
| | | | |
| Multiline Retail: 4.34% | | | | | | | | | | | | |
Dollar General Corporation † | | | | | | | 255,000 | | | | 11,786,100 | |
Dollar Tree Incorporated † | | | | | | | 756,000 | | | | 30,232,440 | |
Nordstrom Incorporated | | | | | | | 273,000 | | | | 15,077,790 | |
| | | | |
| | | | | | | | | | | 57,096,330 | |
| | | | | | | | | | | | |
| | | | |
| Specialty Retail: 4.47% | | | | | | | | | | | | |
Bed Bath & Beyond Incorporated † | | | | | | | 57,000 | | | | 3,345,900 | |
CarMax Incorporated † | | | | | | | 300,000 | | | | 11,826,000 | |
Dick’s Sporting Goods Incorporated « | | | | | | | 235,000 | | | | 11,183,650 | |
O’Reilly Automotive Incorporated † | | | | | | | 179,000 | | | | 16,584,350 | |
Ross Stores Incorporated | | | | | | | 265,000 | | | | 15,820,500 | |
| | | | |
| | | | | | | | | | | 58,760,400 | |
| | | | | | | | | | | | |
| | | | |
| Textiles, Apparel & Luxury Goods: 4.21% | | | | | | | | | | | | |
lululemon athletica incorporated †« | | | | | | | 203,000 | | | | 14,007,000 | |
Michael Kors Holdings Limited † | | | | | | | 208,000 | | | | 11,675,040 | |
Nike Incorporated Class B | | | | | | | 270,000 | | | | 14,593,500 | |
VF Corporation | | | | | | | 102,000 | | | | 15,053,160 | |
| | | | |
| | | | | | | | | | | 55,328,700 | |
| | | | | | | | | | | | |
| | | | |
Consumer Staples: 8.39% | | | | | | | | | | | | |
| | | | |
| Beverages: 2.56% | | | | | | | | | | | | |
Monster Beverage Corporation † | | | | | | | 120,000 | | | | 5,748,000 | |
The Coca-Cola Company | | | | | | | 750,000 | | | | 27,930,000 | |
| | | | |
| | | | | | | | | | | 33,678,000 | |
| | | | | | | | | | | | |
| | | | |
| Food & Staples Retailing: 5.36% | | | | | | | | | | | | |
Costco Wholesale Corporation | | | | | | | 235,000 | | | | 24,049,900 | |
Walgreen Company | | | | | | | 330,000 | | | | 13,186,800 | |
The accompanying notes are an integral part of these financial statements.
| | | | |
| 8 | | Wells Fargo Advantage Large Cap Growth Fund | | Portfolio of investments—January 31, 2013 (unaudited) |
| | | | | | | | | | | | |
| Security name | | | | | | Shares | | | Value | |
| | | | | | | | | | | | |
| | | | |
| Food & Staples Retailing (continued) | | | | | | | | | | | | |
Whole Foods Market Incorporated | | | | | | | 346,000 | | | $ | 33,302,500 | |
| | | | |
| | | | | | | | | | | 70,539,200 | |
| | | | | | | | | | | | |
| | | | |
| Personal Products: 0.47% | | | | | | | | | | | | |
Estee Lauder Companies Incorporated Class A | | | | | | | 102,000 | | | | 6,214,860 | |
| | | | | | | | | | | | |
| | | | |
Energy: 6.27% | | | | | | | | | | | | |
| | | | |
| Energy Equipment & Services: 2.83% | | | | | | | | | | | | |
National Oilwell Varco Incorporated | | | | | | | 229,000 | | | | 16,978,060 | |
Schlumberger Limited | | | | | | | 260,000 | | | | 20,293,000 | |
| | | | |
| | | | | | | | | | | 37,271,060 | |
| | | | | | | | | | | | |
| | | | |
| Oil, Gas & Consumable Fuels: 3.44% | | | | | | | | | | | | |
Concho Resources Incorporated † | | | | | | | 151,000 | | | | 13,774,220 | |
Continental Resources Incorporated †« | | | | | | | 60,000 | | | | 4,987,200 | |
Pioneer Natural Resources Company | | | | | | | 225,000 | | | | 26,446,500 | |
| | | | |
| | | | | | | | | | | 45,207,920 | |
| | | | | | | | | | | | |
| | | | |
Financials: 2.40% | | | | | | | | | | | | |
| | | | |
| Capital Markets: 0.90% | | | | | | | | | | | | |
Northern Trust Corporation | | | | | | | 77,000 | | | | 3,963,190 | |
TD Ameritrade Holding Corporation | | | | | | | 403,000 | | | | 7,814,170 | |
| | | | |
| | | | | | | | | | | 11,777,360 | |
| | | | | | | | | | | | |
| | | | |
| Consumer Finance: 1.50% | | | | | | | | | | | | |
American Express Company | | | | | | | 336,000 | | | | 19,760,160 | |
| | | | | | | | | | | | |
| | | | |
Health Care: 13.29% | | | | | | | | | | | | |
| | | | |
| Biotechnology: 5.58% | | | | | | | | | | | | |
Alexion Pharmaceuticals Incorporated † | | | | | | | 365,000 | | | | 34,306,350 | |
Biogen Idec Incorporated † | | | | | | | 65,000 | | | | 10,145,200 | |
Celgene Corporation † | | | | | | | 139,000 | | | | 13,755,440 | |
Gilead Sciences Incorporated † | | | | | | | 384,000 | | | | 15,148,800 | |
| | | | |
| | | | | | | | | | | 73,355,790 | |
| | | | | | | | | | | | |
| | | | |
| Health Care Equipment & Supplies: 2.09% | | | | | | | | | | | | |
Covidien plc | | | | | | | 110,000 | | | | 6,857,400 | |
Intuitive Surgical Incorporated †« | | | | | | | 36,000 | | | | 20,677,680 | |
| | | | |
| | | | | | | | | | | 27,535,080 | |
| | | | | | | | | | | | |
| | | | |
| Health Care Providers & Services: 1.96% | | | | | | | | | | | | |
AmerisourceBergen Corporation « | | | | | | | 225,000 | | | | 10,208,250 | |
Catamaran Corporation † | | | | | | | 300,000 | | | | 15,567,000 | |
| | | | |
| | | | | | | | | | | 25,775,250 | |
| | | | | | | | | | | | |
| | | | |
| Health Care Technology: 1.79% | | | | | | | | | | | | |
Cerner Corporation †« | | | | | | | 285,000 | | | | 23,526,750 | |
| | | | | | | | | | | | |
The accompanying notes are an integral part of these financial statements.
| | | | | | |
| Portfolio of investments—January 31, 2013 (unaudited) | | Wells Fargo Advantage Large Cap Growth Fund | | | 9 | |
| | | | | | | | | | | | |
| Security name | | | | | | Shares | | | Value | |
| | | | | | | | | | | | |
| | | | |
| Pharmaceuticals: 1.87% | | | | | | | | | | | | |
Allergan Incorporated | | | | | | | 76,000 | | | $ | 7,980,760 | |
Shire plc ADR | | | | | | | 159,000 | | | | 15,922,260 | |
Zoetis Incorporated † | | | | | | | 27,597 | | | | 717,522 | |
| | | | |
| | | | | | | | | | | 24,620,542 | |
| | | | | | | | | | | | |
| | | | |
Industrials: 9.10% | | | | | | | | | | | | |
| | | | |
| Aerospace & Defense: 2.20% | | | | | | | | | | | | |
Precision Castparts Corporation | | | | | | | 72,000 | | | | 13,204,800 | |
United Technologies Corporation « | | | | | | | 179,000 | | | | 15,675,030 | |
| | | | |
| | | | | | | | | | | 28,879,830 | |
| | | | | | | | | | | | |
| | | | |
| Air Freight & Logistics: 0.83% | | | | | | | | | | | | |
United Parcel Service Incorporated Class B | | | | | | | 137,000 | | | | 10,862,730 | |
| | | | | | | | | | | | |
| | | | |
| Machinery: 2.02% | | | | | | | | | | | | |
Danaher Corporation | | | | | | | 229,000 | | | | 13,723,970 | |
Deere & Company « | | | | | | | 63,000 | | | | 5,925,780 | |
Joy Global Incorporated « | | | | | | | 110,000 | | | | 6,948,700 | |
| | | | |
| | | | | | | | | | | 26,598,450 | |
| | | | | | | | | | | | |
| | | | |
| Road & Rail: 2.30% | | | | | | | | | | | | |
Union Pacific Corporation | | | | | | | 230,000 | | | | 30,235,800 | |
| | | | | | | | | | | | |
| | | | |
| Trading Companies & Distributors: 1.75% | | | | | | | | | | | | |
W.W. Grainger Incorporated | | | | | | | 106,000 | | | | 23,088,920 | |
| | | | | | | | | | | | |
| | | | |
Information Technology: 31.40% | | | | | | | | | | | | |
| | | | |
| Communications Equipment: 2.72% | | | | | | | | | | | | |
QUALCOMM Incorporated | | | | | | | 541,000 | | | | 35,722,230 | |
| | | | | | | | | | | | |
| | | | |
| Computers & Peripherals: 5.75% | | | | | | | | | | | | |
Apple Incorporated | | | | | | | 149,000 | | | | 67,841,190 | |
EMC Corporation † | | | | | | | 315,000 | | | | 7,752,150 | |
| | | | |
| | | | | | | | | | | 75,593,340 | |
| | | | | | | | | | | | |
| | | | |
| Internet Software & Services: 8.25% | | | | | | | | | | | | |
eBay Incorporated † | | | | | | | 755,000 | | | | 42,227,150 | |
Google Incorporated Class A † | | | | | | | 68,000 | | | | 51,386,920 | |
Rackspace Hosting Incorporated †« | | | | | | | 198,000 | | | | 14,919,300 | |
| | | | |
| | | | | | | | | | | 108,533,370 | |
| | | | | | | | | | | | |
| | | | |
| IT Services: 8.70% | | | | | | | | | | | | |
Accenture plc | | | | | | | 193,000 | | | | 13,874,770 | |
Cognizant Technology Solutions Corporation Class A † | | | | | | | 493,000 | | | | 38,542,740 | |
MasterCard Incorporated Class A | | | | | | | 56,000 | | | | 29,030,400 | |
Teradata Corporation † | | | | | | | 251,000 | | | | 16,731,660 | |
Visa Incorporated Class A « | | | | | | | 103,000 | | | | 16,264,730 | |
| | | | |
| | | | | | | | | | | 114,444,300 | |
| | | | | | | | | | | | |
The accompanying notes are an integral part of these financial statements.
| | | | |
| 10 | | Wells Fargo Advantage Large Cap Growth Fund | | Portfolio of investments—January 31, 2013 (unaudited) |
| | | | | | | | | | | | | | |
| Security name | | | | | | | Shares | | | Value | |
| | | | | | | | | | | | | | |
| | | | |
| Semiconductors & Semiconductor Equipment: 2.13% | | | | | | | | | | | | | | |
Avago Technologies Limited | | | | | | | | | 132,000 | | | $ | 4,721,640 | |
Maxim Integrated Products Incorporated | | | | | | | | | 243,000 | | | | 7,642,350 | |
Microchip Technology Incorporated « | | | | | | | | | 470,000 | | | | 15,721,500 | |
| | | | |
| | | | | | | | | | | | | 28,085,490 | |
| | | | | | | | | | | | | | |
| | | | |
| Software: 3.85% | | | | | | | | | | | | | | |
Citrix Systems Incorporated † | | | | | | | | | 89,000 | | | | 6,511,240 | |
Red Hat Incorporated † | | | | | | | | | 382,000 | | | | 21,223,920 | |
Salesforce.com Incorporated †« | | | | | | | | | 101,000 | | | | 17,385,130 | |
VMware Incorporated †« | | | | | | | | | 72,000 | | | | 5,506,560 | |
| | | | |
| | | | | | | | | | | | | 50,626,850 | |
| | | | | | | | | | | | | | |
| | | | |
Materials: 4.87% | | | | | | | | | | | | | | |
| | | | |
| Chemicals: 4.87% | | | | | | | | | | | | | | |
Ecolab Incorporated « | | | | | | | | | 224,000 | | | | 16,217,600 | |
Monsanto Company | | | | | | | | | 205,000 | | | | 20,776,750 | |
Praxair Incorporated | | | | | | | | | 245,000 | | | | 27,040,650 | |
| | | | |
| | | | | | | | | | | | | 64,035,000 | |
| | | | | | | | | | | | | | |
| | | | |
Total Common Stocks (Cost $1,087,528,480) | | | | | | | | | | | | | 1,292,994,022 | |
| | | | | | | | | | | | | | |
| | | | |
| | | | | | | | Principal | | | | |
| | | | |
| Other: 0.03% | | | | | | | | | | | | | | |
Gryphon Funding Limited , Pass-Through Entity (v)(a)(i) | | | | | | | | $ | 1,121,425 | | | | 381,285 | |
| | | | |
Total Other (Cost $91,389) | | | | | | | | | | | | | 381,285 | |
| | | | | | | | | | | | | | |
| | | | |
| | | Yield | | | | | Shares | | | | |
| Short-Term Investments: 10.83% | | | | | | | | | | | | | | |
| | | | |
| Investment Companies: 10.83% | | | | | | | | | | | | | | |
Wells Fargo Advantage Cash Investment Money Market Fund, Select Class (l)(u) | | | 0.14 | % | | | | | 24,694,448 | | | | 24,694,448 | |
Wells Fargo Securities Lending Cash Investments, LLC (v)(l)(u)(r) | | | 0.19 | | | | | | 117,795,790 | | | | 117,795,790 | |
| | | | |
Total Short-Term Investments (Cost $142,490,238) | | | | | | | | | | | | | 142,490,238 | |
| | | | | | | | | | | | | | |
| | | | | | | | |
| Total investments in securities | | | | | | | | |
| (Cost $1,230,110,107) * | | | 109.16 | % | | | 1,435,865,545 | |
Other assets and liabilities, net | | | (9.16 | ) | | | (120,523,246 | ) |
| | | | | | | | |
| Total net assets | | | 100.00 | % | | $ | 1,315,342,299 | |
| | | | | | | | |
The accompanying notes are an integral part of these financial statements.
| | | | | | |
| Portfolio of investments—January 31, 2013 (unaudited) | | Wells Fargo Advantage Large Cap Growth Fund | | | 11 | |
| † | Non-income earning security |
| « | All or a portion of this security is on loan. |
| (v) | Security represents investment of cash collateral received from securities on loan. |
| (a) | Security is fair valued by the Management Valuation Team, and in certain instances by the Board of Trustees, in accordance with procedures approved by the Board of Trustees. |
| (l) | Investment in an affiliate |
| (u) | Rate shown is the 7-day annualized yield at period end. |
| (r) | The investment company is exempt from registration under Section 3(c)(7) of the Investment Company Act of 1940, as amended. |
| * | Cost for federal income tax purposes is $1,233,027,808 and unrealized appreciation (depreciation) consists of: |
| | | | |
Gross unrealized appreciation | | $ | 214,342,605 | |
Gross unrealized depreciation | | | (11,504,868 | ) |
| | | | |
Net unrealized appreciation | | $ | 202,837,737 | |
The accompanying notes are an integral part of these financial statements.
| | | | |
| 12 | | Wells Fargo Advantage Large Cap Growth Fund | | Statement of assets and liabilities—January 31, 2013 (unaudited) |
| | | | |
| | | | |
| |
Assets | | | | |
Investments | | | | |
In unaffiliated securities (including securities on loan), at value (see cost below) | | $ | 1,293,375,307 | |
In affiliated securities, at value (see cost below) | | | 142,490,238 | |
| | | | |
Total investments, at value (see cost below) | | | 1,435,865,545 | |
Receivable for investments sold | | | 8,949,416 | |
Receivable for Fund shares sold | | | 3,065,634 | |
Receivable for dividends | | | 119,311 | |
Receivable for securities lending income | | | 12,934 | |
Prepaid expenses and other assets | | | 137,311 | |
| | | | |
Total assets | | | 1,448,150,151 | |
| | | | |
| |
Liabilities | | | | |
Payable for investments purchased | | | 12,857,044 | |
Payable for Fund shares redeemed | | | 1,056,122 | |
Payable upon receipt of securities loaned | | | 117,887,179 | |
Advisory fee payable | | | 544,686 | |
Distribution fees payable | | | 10,951 | |
Due to other related parties | | | 242,663 | |
Accrued expenses and other liabilities | | | 209,207 | |
| | | | |
Total liabilities | | | 132,807,852 | |
| | | | |
Total net assets | | $ | 1,315,342,299 | |
| | | | |
| |
NET ASSETS CONSIST OF | | | | |
Paid-in capital | | $ | 1,131,891,629 | |
Undistributed net investment income | | | 722,990 | |
Accumulated net realized losses on investments | | | (23,027,758 | ) |
Net unrealized gains on investments | | | 205,755,438 | |
| | | | |
Total net assets | | $ | 1,315,342,299 | |
| | | | |
| |
COMPUTATION OF NET ASSET VALUE AND OFFERING PRICE PER SHARE1 | | | | |
Net assets – Class A | | $ | 114,032,014 | |
Shares outstanding – Class A | | | 3,231,704 | |
Net asset value per share – Class A | | | $35.29 | |
Maximum offering price per share – Class A2 | | | $37.44 | |
Net assets – Class C | | $ | 15,028,743 | |
Shares outstanding – Class C | | | 433,418 | |
Net asset value per share – Class C | | | $34.67 | |
Net assets – Class R | | $ | 7,274,110 | |
Shares outstanding – Class R | | | 206,621 | |
Net asset value per share – Class R | | | $35.21 | |
Net assets – Class R4 | | $ | 10,407 | |
Share outstanding – Class R4 | | | 293 | |
Net asset value per share – Class R4 | | | $35.52 | |
Net assets – Class R6 | | $ | 52,045 | |
Share outstanding – Class R6 | | | 1,464 | |
Net asset value per share – Class R6 | | | $35.55 | |
Net assets – Administrator Class | | $ | 188,928,119 | |
Shares outstanding – Administrator Class | | | 5,339,848 | |
Net asset value per share – Administrator Class | | | $35.38 | |
Net assets – Institutional Class | | $ | 621,250,366 | |
Shares outstanding – Institutional Class | | | 17,479,460 | |
Net asset value per share – Institutional Class | | | $35.54 | |
Net assets – Investor Class | | $ | 368,766,495 | |
Shares outstanding – Investor Class | | | 10,459,137 | |
Net asset value per share – Investor Class | | | $35.26 | |
| |
Investment in unaffiliated securities (including securities on loan), at cost | | $ | 1,087,619,869 | |
| | | | |
Investments in affiliated securities, at cost | | $ | 142,490,238 | |
| | | | |
Total investments, at cost | | $ | 1,230,110,107 | |
| | | | |
Securities on loan, at value | | $ | 115,426,314 | |
| | | | |
| 1. | The Fund has an unlimited number of authorized shares. |
| 2. | Maximum offering price is computed as 100/94.25 of net asset value. On investments of $50,000 or more, the offering price is reduced. |
The accompanying notes are an integral part of these financial statements.
| | | | | | |
| Statement of operations—six months ended January 31, 2013 (unaudited) | | Wells Fargo Advantage Large Cap Growth Fund | | | 13 | |
| | | | |
| | | | |
| |
Investment income | | | | |
Dividends | | $ | 8,709,848 | |
Securities lending income, net | | | 70,602 | |
Income from affiliated securities | | | 27,632 | |
| | | | |
Total investment income | | | 8,808,082 | |
| | | | |
| |
Expenses | | | | |
Advisory fee | | | 3,908,730 | |
Administration fees | | | | |
Fund level | | | 309,974 | |
Class A | | | 120,080 | |
Class C | | | 17,834 | |
Class R | | | 7,945 | |
Class R4 | | | 1 | 1 |
Class R6 | | | 2 | 1 |
Administrator Class | | | 69,918 | |
Institutional Class | | | 248,083 | |
Investor Class | | | 588,216 | |
Shareholder servicing fees | | | | |
Class A | | | 115,462 | |
Class C | | | 17,148 | |
Class R | | | 7,436 | |
Class R4 | | | 2 | 1 |
Administrator Class | | | 174,795 | |
Investor Class | | | 459,253 | |
Distribution fees | | | | |
Class C | | | 51,444 | |
Class R | | | 7,640 | |
Custody and accounting fees | | | 40,838 | |
Professional fees | | | 16,720 | |
Registration fees | | | 50,166 | |
Shareholder report expenses | | | 39,290 | |
Trustees’ fees and expenses | | | 6,988 | |
Other fees and expenses | | | 6,339 | |
| | | | |
Total expenses | | | 6,264,304 | |
Less: Fee waivers and/or expense reimbursements | | | (625,556 | ) |
| | | | |
Net expenses | | | 5,638,748 | |
| | | | |
Net investment income | | | 3,169,334 | |
| | | | |
| |
REALIZED AND UNREALIZED GAINS (LOSSES) ON INVESTMENTS | | | | |
Net realized gains on investments | | | 40,651,078 | |
Net change in unrealized gains (losses) on investments | | | 43,216,340 | |
| | | | |
Net realized and unrealized gains (losses) on investments | | | 83,867,418 | |
| | | | |
Net increase in net assets resulting from operations | | $ | 87,036,752 | |
| | | | |
| 1. | For the period from November 30, 2012 (commencement of class operations) to January 31, 2013. |
The accompanying notes are an integral part of these financial statements.
| | | | |
| 14 | | Wells Fargo Advantage Large Cap Growth Fund | | Statement of changes in net assets |
| | | | | | | | | | | | | | | | |
| | | Six months ended January 31, 2013 (unaudited) | | | Year ended July 31, 2012 | |
| | | | |
Operations | | | | | | | | | | | | | | | | |
Net investment income (loss) | | | | | | $ | 3,169,334 | | | | | | | $ | (1,152,598 | ) |
Net realized gains on investments | | | | | | | 40,651,078 | | | | | | | | 14,370,289 | |
Net change in unrealized gains (losses) on investments | | | | | | | 43,216,340 | | | | | | | | (7,417,988 | ) |
| | | | | | | | | | | | | | | | |
Net increase in net assets resulting from operations | | | | | | | 87,036,752 | | | | | | | | 5,799,703 | |
| | | | | | | | | | | | | | | | |
| | | | |
Distributions to shareholders from | | | | | | | | | | | | | | | | |
Net investment income | | | | | | | | | | | | | | | | |
Class A | | | | | | | (121,892 | ) | | | | | | | 0 | |
Class R | | | | | | | (2,374 | ) | | | | | | | 0 | |
Class R4 | | | | | | | (32 | )2 | | | | | | | N/A | |
Class R6 | | | | | | | (169 | )2 | | | | | | | N/A | |
Administrator Class | | | | | | | (406,148 | ) | | | | | | | 0 | |
Institutional Class | | | | | | | (1,878,483 | ) | | | | | | | 0 | |
| | | | | | | | | | | | | | | | |
Total distributions to shareholders | | | | | | | (2,409,098 | ) | | | | | | | 0 | |
| | | | | | | | | | | | | | | | |
| | | | |
| | | Shares | | | | | | | | Shares | | | | | |
| | | | |
Capital share transactions | | | | | | | | | | | | | | | | |
Proceeds from shares sold | | | | | | | | | | | | | | | | |
Class A | | | 1,235,120 | | | | 42,437,697 | | | | 1,420,676 | | | | 46,495,652 | |
Class C | | | 130,891 | | | | 4,414,326 | | | | 185,565 | | | | 6,124,502 | |
Class R | | | 71,505 | | | | 2,440,170 | | | | 15,968 | 1 | | | 524,876 | 1 |
Class R4 | | | 292 | 2 | | | 10,000 | 2 | | | N/A | | | | N/A | |
Class R6 | | | 1,459 | 2 | | | 50,000 | 2 | | | N/A | | | | N/A | |
Administrator Class | | | 3,799,042 | | | | 130,026,601 | | | | 2,405,184 | | | | 80,952,701 | |
Institutional Class | | | 2,662,177 | | | | 91,921,969 | | | | 3,603,346 | | | | 124,519,350 | |
Investor Class | | | 630,386 | | | | 21,501,773 | | | | 1,775,921 | | | | 58,272,977 | |
| | | | | | | | | | | | | | | | |
| | | | | | | 292,802,536 | | | | | | | | 316,890,058 | |
| | | | | | | | | | | | | | | | |
Reinvestment of distributions | | | | | | | | | | | | | | | | |
Class A | | | 2,942 | | | | 98,914 | | | | 0 | | | | 0 | |
Class R | | | 33 | | | | 1,092 | | | | 0 | | | | 0 | |
Class R4 | | | 1 | 2 | | | 32 | 2 | | | N/A | | | | N/A | |
Class R6 | | | 5 | 2 | | | 169 | 2 | | | N/A | | | | N/A | |
Administrator Class | | | 10,982 | | | | 370,195 | | | | 0 | | | | 0 | |
Institutional Class | | | 45,346 | | | | 1,534,948 | | | | 0 | | | | 0 | |
| | | | | | | | | | | | | | | | |
| | | | | | | 2,005,350 | | | | | | | | 0 | |
| | | | | | | | | | | | | | | | |
Payment for shares redeemed | | | | | | | | | | | | | | | | |
Class A | | | (289,078 | ) | | | (9,856,141 | ) | | | (118,356 | ) | | | (3,849,936 | ) |
Class C | | | (62,197 | ) | | | (2,082,130 | ) | | | (18,339 | ) | | | (590,650 | ) |
Class R | | | (19,060 | ) | | | (655,506 | ) | | | (7,963 | )1 | | | (261,323 | )1 |
Administrator Class | | | (744,188 | ) | | | (25,714,655 | ) | | | (245,875 | ) | | | (8,254,193 | ) |
Institutional Class | | | (3,371,159 | ) | | | (116,308,467 | ) | | | (1,088,143 | ) | | | (36,011,333 | ) |
Investor Class | | | (1,065,079 | ) | | | (36,318,890 | ) | | | (1,521,894 | ) | | | (48,931,218 | ) |
| | | | | | | | | | | | | | | | |
| | | | | | | (190,935,789 | ) | | | | | | | (97,898,653 | ) |
| | | | | | | | | | | | | | | | |
Net asset value of shares issued in acquisition | | | | | | | | | | | | | | | | |
Class A | | | 0 | | | | 0 | | | | 905,505 | | | | 29,850,257 | |
Class C | | | 0 | | | | 0 | | | | 188,817 | | | | 6,137,864 | |
Class R | | | 0 | | | | 0 | | | | 146,138 | 1 | | | 4,809,816 | 1 |
Administrator Class | | | 0 | | | | 0 | | | | 71,146 | | | | 2,352,495 | |
Institutional Class | | | 0 | | | | 0 | | | | 15,601,231 | | | | 517,906,845 | |
| | | | | | | | | | | | | | | | |
| | | | | | | 0 | | | | | | | | 561,057,277 | |
| | | | | | | | | | | | | | | | |
Please see footnotes on page 15.
The accompanying notes are an integral part of these financial statements.
| | | | | | |
| Statement of changes in net assets | | Wells Fargo Advantage Large Cap Growth Fund | | | 15 | |
| | | | | | | | | | | | |
| | | Six months ended January 31, 2013 (unaudited) | | | Year ended July 31, 2012 | |
| | | | |
Capital share transactions (continued) | | | | | | | | | | | | |
Net increase in net assets resulting from capital share transactions | | | | $ | 103,872,097 | | | | | $ | 780,048,682 | |
| | | | | | | | | | | | |
Total increase in net assets | | | | | 188,499,751 | | | | | | 785,848,385 | |
| | | | | | | | | | | | |
| | | | |
Net assets | | | | | | | | | | | | |
Beginning of period | | | | | 1,126,842,548 | | | | | | 340,994,163 | |
| | | | | | | | | | | | |
End of period | | | | $ | 1,315,342,299 | | | | | $ | 1,126,842,548 | |
| | | | | | | | | | | | |
Undistributed net investment income (loss) | | | | $ | 722,990 | | | | | $ | (37,246 | ) |
| | | | | | | | | | | | |
| 1. | For the period from June 15, 2012 (commencement of class operations) to July 31, 2012 |
| 2. | For the period from November 30, 2012 (commencement of class operations) to January 31, 2013 |
The accompanying notes are an integral part of these financial statements.
| | | | |
| 16 | | Wells Fargo Advantage Large Cap Growth Fund | | Financial highlights |
(For a share outstanding throughout each period)
| | | | | | | | | | | | | | | | |
| | | Six months ended
January 31, 2013
(unaudited) | | | Year ended July 31 | |
| CLASS A | | | 2012 | | | 2011 | | | 20101 | |
Net asset value, beginning of period | | $ | 32.92 | | | $ | 31.62 | | | $ | 24.54 | | | $ | 24.54 | |
Net investment income (loss) | | | 0.06 | | | | (0.12 | ) 2 | | | (0.10 | )2 | | | 0.00 | |
Net realized and unrealized gains (losses) on investments | | | 2.35 | | | | 1.42 | | | | 7.18 | | | | 0.00 | |
| | | | | | | | | | | | | | | | |
Total from investment operations | | | 2.41 | | | | 1.30 | | | | 7.08 | | | | 0.00 | |
Distributions to shareholders from | | | | | | | | | | | | | | | | |
Net investment income | | | (0.04 | ) | | | 0.00 | | | | 0.00 | | | | 0.00 | |
Net asset value, end of period | | | $35.29 | | | | $32.92 | | | | $31.62 | | | | $24.54 | |
Total return3 | | | 7.34 | % | | | 4.08 | % | | | 28.89 | % | | | 0.00 | % |
Ratios to average net assets (annualized) | | | | | | | | | | | | | | | | |
Gross expenses | | | 1.22 | % | | | 1.24 | % | | | 1.25 | % | | | 0.00 | % |
Net expenses | | | 1.07 | % | | | 1.10 | % | | | 1.12 | % | | | 0.00 | % |
Net investment income (loss) | | | 0.34 | % | | | (0.37 | )% | | | (0.33 | )% | | | 0.00 | % |
Supplemental data | | | | | | | | | | | | | | | | |
Portfolio turnover rate | | | 26 | % | | | 46 | % | | | 47 | % | | | 60 | % |
Net assets, end of period (000s omitted) | | | $114,032 | | | | $75,149 | | | | $2,368 | | | | $10 | |
| 1. | For the period from July 30, 2010 (commencement of class operations) to July 31, 2010 |
| 2. | Calculated based upon average shares outstanding |
| 3. | Total return calculations do not include any sales charges. Returns for periods of less than one year are not annualized. |
The accompanying notes are an integral part of these financial statements.
| | | | | | |
| Financial highlights | | Wells Fargo Advantage Large Cap Growth Fund | | | 17 | |
(For a share outstanding throughout each period)
| | | | | | | | | | | | | | | | |
| | | Six months ended
January 31, 2013
(unaudited) | | | Year ended July 31 | |
| CLASS C | | | 2012 | | | 2011 | | | 20101 | |
Net asset value, beginning of period | | $ | 32.43 | | | $ | 31.38 | | | $ | 24.54 | | | $ | 24.54 | |
Net investment income (loss) | | | (0.07 | )2 | | | (0.37 | )2 | | | (0.32 | )2 | | | 0.00 | |
Net realized and unrealized gains (losses) on investments | | | 2.31 | | | | 1.42 | | | | 7.16 | | | | 0.00 | |
| | | | | | | | | | | | | | | | |
Total from investment operations | | | 2.24 | | | | 1.05 | | | | 6.84 | | | | 0.00 | |
Net asset value, end of period | | $ | 34.67 | | | $ | 32.43 | | | $ | 31.38 | | | $ | 24.54 | |
Total return3 | | | 6.94 | % | | | 3.31 | % | | | 27.91 | % | | | 0.00 | % |
Ratios to average net assets (annualized) | | | | | | | | | | | | | | | | |
Gross expenses | | | 1.97 | % | | | 1.99 | % | | | 2.00 | % | | | 0.00 | % |
Net expenses | | | 1.82 | % | | | 1.84 | % | | | 1.87 | % | | | 0.00 | % |
Net investment income (loss) | | | (0.41 | )% | | | (1.16 | )% | | | (1.04 | )% | | | 0.00 | % |
Supplemental data | | | | | | | | | | | | | | | | |
Portfolio turnover rate | | | 26 | % | | | 46 | % | | | 47 | % | | | 60 | % |
Net assets, end of period (000s omitted) | | | $15,029 | | | | $11,829 | | | | $272 | | | | $10 | |
| 1. | For the period from July 30, 2010 (commencement of class operations) to July 31, 2010 |
| 2. | Calculated based upon average shares outstanding |
| 3. | Total return calculations do not include any sales charges. Returns for periods of less than one year are not annualized. |
The accompanying notes are an integral part of these financial statements.
| | | | |
| 18 | | Wells Fargo Advantage Large Cap Growth Fund | | Financial highlights |
(For a share outstanding throughout each period)
| | | | | | | | |
| | | Six months ended
January 31, 2013
(unaudited) | | | Year ended
July 31, 20121 | |
| CLASS R | | |
Net asset value, beginning of period | | $ | 32.86 | | | $ | 32.91 | |
Net investment income (loss) | | | 0.01 | 2 | | | (0.05 | ) 2 |
Net realized and unrealized gains (losses) on investments | | | 2.35 | | | | 0.00 | |
| | | | | | | | |
Total from investment operations | | | 2.36 | | | | (0.05 | ) |
Distributions to shareholders from | | | | | | | | |
Net investment income | | | (0.01 | ) | | | 0.00 | |
Net asset value, end of period | | $ | 35.21 | | | $ | 32.86 | |
Total return3 | | | 7.19 | % | | | (0.15 | )% |
Ratios to average net assets (annualized) | | | | | | | | |
Gross expenses | | | 1.46 | % | | | 1.47 | % |
Net expenses | | | 1.32 | % | | | 1.32 | % |
Net investment income (loss) | | | 0.08 | % | | | (0.95 | )% |
Supplemental data | | | | | | | | |
Portfolio turnover rate | | | 26 | % | | | 46 | % |
Net assets, end of period (000s omitted) | | | $7,274 | | | | $5,065 | |
| 1. | For the period from June 15, 2012 (commencement of class operations) to July 31, 2012 |
| 2. | Calculated based upon average shares outstanding |
| 3. | Returns for periods of less than one year are not annualized. |
The accompanying notes are an integral part of these financial statements.
| | | | | | |
| Financial highlights | | Wells Fargo Advantage Large Cap Growth Fund | | | 19 | |
(For a share outstanding throughout the period)
| | | | |
| CLASS R4 | | Period ended January 31, 20131 (unaudited) | |
Net asset value, beginning of period | | $ | 34.26 | |
Net investment income | | | 0.06 | |
Net realized and unrealized gains on investments | | | 1.31 | |
| | | | |
Total from investment operations | | | 1.37 | |
Distributions to shareholders from | | | | |
Net investment income | | | (0.11 | ) |
Net asset value, end of period | | $ | 35.52 | |
Total return2 | | | 4.08 | % |
Ratios to average net assets (annualized) | | | | |
Gross expenses | | | 0.86 | % |
Net expenses | | | 0.75 | % |
Net investment income | | | 0.96 | % |
Supplemental data | | | | |
Portfolio turnover rate | | | 26 | % |
Net assets, end of period (000s omitted) | | | $10 | |
| 1. | For the period from November 30, 2012 (commencement of class operations) to January 31, 2013 |
| 2. | Returns for periods of less than one year are not annualized. |
The accompanying notes are an integral part of these financial statements.
| | | | |
| 20 | | Wells Fargo Advantage Large Cap Growth Fund | | Financial highlights |
(For a share outstanding throughout the period)
| | | | |
| CLASS R6 | | Period ended
January 31, 20131
(unaudited) | |
Net asset value, beginning of period | | $ | 34.26 | |
Net investment income | | | 0.06 | |
Net realized and unrealized gains on investments | | | 1.35 | |
| | | | |
Total from investment operations | | | 1.41 | |
Distributions to shareholders from | | | | |
Net investment income | | | (0.12 | ) |
Net asset value, end of period | | $ | 35.55 | |
Total return2 | | | 4.09 | % |
Ratios to average net assets (annualized) | | | | |
Gross expenses | | | 0.74 | % |
Net expenses | | | 0.60 | % |
Net investment income | | | 1.12 | % |
Supplemental data | | | | |
Portfolio turnover rate | | | 26 | % |
Net assets, end of period (000s omitted) | | | $52 | |
| 1. | For the period from November 30, 2012 (commencement of class operations) to January 31, 2013 |
| 2. | Returns for periods of less than one year are not annualized. |
The accompanying notes are an integral part of these financial statements.
| | | | | | |
| Financial highlights | | Wells Fargo Advantage Large Cap Growth Fund | | | 21 | |
(For a share outstanding throughout each period)
| | | | | | | | | | | | | | | | |
| | | Six months ended
January 31, 2013
(unaudited) | | | Year ended July 31 | |
| ADMINISTRATOR CLASS | | | 2012 | | | 2011 | | | 20101 | |
Net asset value, beginning of period | | | $33.02 | | | | $31.67 | | | | $24.54 | | | | $24.54 | |
Net investment income (loss) | | | 0.09 | 2 | | | (0.06 | )2 | | | (0.06 | )2 | | | 0.00 | |
Net realized and unrealized gains (losses) on investments | | | 2.35 | | | | 1.41 | | | | 7.19 | | | | 0.00 | |
| | | | | | | | | | | | | | | | |
Total from investment operations | | | 2.44 | | | | 1.35 | | | | 7.13 | | | | 0.00 | |
Distributions to shareholders from | | | | | | | | | | | | | | | | |
Net investment income | | | (0.08 | ) | | | 0.00 | | | | 0.00 | | | | 0.00 | |
Net asset value, end of period | | | $35.38 | | | | $33.02 | | | | $31.67 | | | | $24.54 | |
Total return3 | | | 7.40 | % | | | 4.26 | % | | | 29.05 | % | | | 0.00 | % |
Ratios to average net assets (annualized) | | | | | | | | | | | | | | | | |
Gross expenses | | | 1.06 | % | | | 1.08 | % | | | 1.07 | % | | | 0.00 | % |
Net expenses | | | 0.95 | % | | | 0.95 | % | | | 0.94 | % | | | 0.00 | % |
Net investment income (loss) | | | 0.54 | % | | | (0.17 | )% | | | (0.19 | )% | | | 0.00 | % |
Supplemental data | | | | | | | | | | | | | | | | |
Portfolio turnover rate | | | 26 | % | | | 46 | % | | | 47 | % | | | 60 | % |
Net assets, end of period (000s omitted) | | | $188,928 | | | | $75,099 | | | | $1,379 | | | | $10 | |
| 1. | For the period from July 30, 2010 (commencement of class operations) to July 31, 2010 |
| 2. | Calculated based upon average shares outstanding |
| 3. | Returns for periods of less than one year are not annualized. |
The accompanying notes are an integral part of these financial statements.
| | | | |
| 22 | | Wells Fargo Advantage Large Cap Growth Fund | | Financial highlights |
(For a share outstanding throughout each period)
| | | | | | | | | | | | | | | | |
| | | Six months ended
January 31, 2013
(unaudited) | | | Year ended July 31 | |
| INSTITUTIONAL CLASS | | | 2012 | | | 2011 | | | 20101 | |
Net asset value, beginning of period | | | $33.16 | | | | $31.73 | | | $ | 24.54 | | | $ | 24.54 | |
Net investment income (loss) | | | 0.12 | | | | (0.08 | )2 | | | (0.00 | ) | | | 0.00 | |
Net realized and unrealized gains (losses) on investments | | | 2.37 | | | | 1.51 | | | | 7.19 | | | | 0.00 | |
| | | | | | | | | | | | | | | | |
Total from investment operations | | | 2.49 | | | | 1.43 | | | | 7.19 | | | | 0.00 | |
Distributions to shareholders from | | | | | | | | | | | | | | | | |
Net investment income | | | (0.11 | ) | | | 0.00 | | | | 0.00 | | | | 0.00 | |
Net asset value, end of period | | | $35.54 | | | | $33.16 | | | $ | 31.73 | | | $ | 24.54 | |
Total return3 | | | 7.52 | % | | | 4.47 | % | | | 29.34 | % | | | 0.00 | % |
Ratios to average net assets (annualized) | | | | | | | | | | | | | | | | |
Gross expenses | | | 0.79 | % | | | 0.80 | % | | | 0.81 | % | | | 0.00 | % |
Net expenses | | | 0.72 | % | | | 0.75 | % | | | 0.75 | % | | | 0.00 | % |
Net investment income (loss) | | | 0.69 | % | | | (0.25 | )% | | | (0.01 | )% | | | 0.00 | % |
Supplemental data | | | | | | | | | | | | | | | | |
Portfolio turnover rate | | | 26 | % | | | 46 | % | | | 47 | % | | | 60 | % |
Net assets, end of period (000s omitted) | | $ | 621,250 | | | $ | 601,684 | | | | $846 | | | | $10 | |
| 1. | For the period from July 30, 2010 (commencement of class operations) to July 31, 2010 |
| 2. | Calculated based upon average shares outstanding |
| 3. | Returns for periods of less than one year are not annualized. |
The accompanying notes are an integral part of these financial statements.
| | | | | | |
| Financial highlights | | Wells Fargo Advantage Large Cap Growth Fund | | | 23 | |
(For a share outstanding throughout each period)
| | | | | | | | | | | | | | | | | | | | | | | | |
| | | Six months ended
January 31, 2013
(unaudited) | | | Year ended July 31 | |
| INVESTOR CLASS | | | 2012 | | | 2011 | | | 2010 | | | 2009 | | | 2008 | |
Net asset value, beginning of period | | $ | 32.86 | | | $ | 31.59 | | | $ | 24.54 | | | $ | 21.77 | | | $ | 26.62 | | | $ | 27.18 | |
Net investment income (loss) | | | 0.05 | | | | (0.07 | ) | | | (0.06 | ) | | | (0.02 | )1 | | | 0.02 | 1 | | | (0.04 | )1 |
Net realized and unrealized gains (losses) on investments | | | 2.35 | | | | 1.34 | | | | 7.11 | | | | 2.81 | | | | (4.87 | ) | | | (0.52 | ) |
| | | | | | | | | | | | | | | | | | | | | | | | |
Total from investment operations | | | 2.40 | | | | 1.27 | | | | 7.05 | | | | 2.79 | | | | (4.85 | ) | | | (0.56 | ) |
Distribution to shareholders from | | | | | | | | | | | | | | | | | | | | | | | | |
Net investment income | | | 0.00 | | | | 0.00 | | | | 0.00 | | | | (0.02 | ) | | | 0.00 | | | | 0.00 | |
Net asset value, end of period | | | $35.26 | | | | $32.86 | | | | $31.59 | | | | $24.54 | | | | $21.77 | | | | $26.62 | |
Total return2 | | | 7.30 | % | | | 4.02 | % | | | 28.73 | % | | | 12.80 | % | | | (18.22 | )% | | | (2.06 | )% |
Ratios to average net assets (annualized) | | | | | | | | | | | | | | | | | | | | | | | | |
Gross expenses | | | 1.28 | % | | | 1.32 | % | | | 1.32 | % | | | 1.43 | % | | | 1.46 | % | | | 1.47 | % |
Net expenses | | | 1.14 | % | | | 1.18 | % | | | 1.19 | % | | | 1.19 | % | | | 1.19 | % | | | 1.19 | % |
Net investment income (loss) | | | 0.28 | % | | | (0.23 | )% | | | (0.19 | )% | | | (0.07 | )% | | | 0.07 | % | | | (0.13 | )% |
Supplemental data | | | | | | | | | | | | | | | | | | | | | | | | |
Portfolio turnover rate | | | 26 | % | | | 46 | % | | | 47 | % | | | 60 | % | | | 81 | % | | | 131 | % |
Net assets, end of period (000s omitted) | | | $368,766 | | | | $358,017 | | | | $336,128 | | | | $278,585 | | | | $264,776 | | | | $350,352 | |
| 1. | Calculated based upon average shares outstanding |
| 2. | Returns for periods of less than one year are not annualized. |
The accompanying notes are an integral part of these financial statements.
| | | | |
| 24 | | Wells Fargo Advantage Large Cap Growth Fund | | Notes to financial statements (unaudited) |
1. ORGANIZATION
Wells Fargo Funds Trust (the “Trust”), a Delaware statutory trust organized on March 10, 1999, is an open-end management investment company registered under the Investment Company Act of 1940, as amended (the “1940 Act”). These financial statements report on Wells Fargo Advantage Large Cap Growth Fund (the “Fund”) which is a diversified series of the Trust.
2. SIGNIFICANT ACCOUNTING POLICIES
The following significant accounting policies, which are consistently followed in the preparation of the financial statements of the Fund, are in conformity with U.S. generally accepted accounting principles which require management to make estimates and assumptions that affect the reported amounts of assets and liabilities, disclosure of contingent assets and liabilities at the date of the financial statements, and the reported amounts of revenues and expenses during the reporting period. Actual results could differ from those estimates.
Securities valuation
All investments are valued each business day as of the close of regular trading on the New York Stock Exchange (normally 4 p.m. Eastern Time).
Equity securities that are listed on a foreign or domestic exchange, except for The Nasdaq Stock Market, Inc. (“Nasdaq”), are valued at the official closing price or, if none, the last sales price. Securities listed on Nasdaq are valued at the Nasdaq Official Closing Price (“NOCP”). If no NOCP is available, securities are valued at the last sales price. If no sales price is shown on the Nasdaq, the bid price will be used. If no sale occurs on the primary exchange or market for the security that day or if no sale occurs and no bid price is shown on Nasdaq, the prior day’s price will be deemed “stale” and fair values will be determined in accordance with the Fund’s Valuation Procedures.
Investments in registered open-end investment companies are valued at net asset value. Non-registered investment companies are fair valued at net asset value.
Investments which are not valued using any of the methods discussed above are valued at their fair value, as determined by procedures established in good faith and approved by the Board of Trustees. The Board of Trustees has established a Valuation Committee comprised of the Trustees and has delegated to it the authority to take any actions regarding the valuation of portfolio securities that the Valuation Committee deems necessary or appropriate, including determining the fair value of portfolio securities, unless the determination has been delegated to the Management Valuation Team of Wells Fargo Funds Management, LLC (“Funds Management”). The Board of Trustees retains the authority to make or ratify any valuation decisions or approve any changes to the Valuation Procedures as it deems appropriate. On a quarterly basis, the Board of Trustees receives reports on any valuation actions taken by the Valuation Committee or the Management Valuation Team which may include items for ratification.
Valuations of fair valued securities are compared to the next actual sales price when available, or other appropriate market information to assess the continued appropriateness of the fair valuation methodology used. These securities are fair valued on a day-to-day basis, taking into consideration changes to appropriate market information and any significant changes to the input factors considered in the valuation process until there is a readily available price provided on the exchange or by an independent pricing service. Valuations received from an independent pricing service or broker quotes are periodically validated by comparisons to most recent trades and valuations provided by other independent pricing services in addition to the review of prices by the adviser and/or subadviser. Unobservable inputs used in determining fair valuations are identified based on the type of security, taking into consideration factors utilized by market participants in valuing the investment, knowledge about the issuer and the current market environment.
Security loans
The Fund may lend its securities from time to time in order to earn additional income in the form of fees or interest on securities received as collateral or the investment of any cash received as collateral. The Fund continues to receive interest or dividends on the securities loaned. The Fund receives collateral in the form of cash or securities with a value at least equal to the value of the securities on loan. The value of the loaned securities is determined at the close of each business day and any additional required collateral is delivered to the Fund on the next business day. In a securities lending transaction, the net asset value of the Fund will be affected by an increase or decrease in the value of the securities loaned and by an increase or decrease in the value of the instrument in which collateral is invested. The amount of securities lending activity undertaken by the Fund fluctuates from time to time. In the event of default or bankruptcy by the borrower, the Fund may be prevented from recovering the loaned securities or gaining access to the collateral or may experience delays or costs in doing so. In addition, the investment of any cash collateral received may lose all or part of its value. The Fund has the right under the lending agreement to recover the securities from the borrower on demand.
| | | | | | |
| Notes to financial statements (unaudited) | | Wells Fargo Advantage Large Cap Growth Fund | | | 25 | |
The Fund lends its securities through an unaffiliated securities lending agent. Cash collateral received in connection with its securities lending transactions is invested in Wells Fargo Securities Lending Cash Investments, LLC (the “Cash Collateral Fund”). The Cash Collateral Fund is exempt from registration under Section 3(c)(7) of the 1940 Act and is managed by Funds Management and is subadvised by Wells Capital Management Incorporated (“WellsCap”). Funds Management receives an advisory fee starting at 0.05% and declining to 0.01% as the average daily net assets of the Cash Collateral Fund increase. All of the fees received by Funds Management are paid to WellsCap for its services as subadviser. The Cash Collateral Fund seeks to provide a positive return compared to the daily Fed Funds Open rate by investing in high-quality, U.S. dollar-denominated short-term money market instruments. Cash Collateral Fund investments are fair valued based upon the amortized cost valuation technique. Income earned from investment in the Cash Collateral Fund is included in securities lending income on the Statement of Operations.
Security transactions and income recognition
Securities transactions are recorded on a trade date basis. Realized gains or losses are recorded on the basis of identified cost.
Dividend income is recognized on the ex-dividend date.
Distributions to shareholders
Distributions to shareholders from net investment income and net realized gains, if any, are recorded on the ex-dividend date. Such distributions are determined in conformity with federal income tax regulations, which may differ in amount or character from net investment income and realized gains recognized for purposes of U.S. generally accepted accounting principles.
Federal and other taxes
The Fund intends to continue to qualify as a regulated investment company by distributing substantially all of its investment company taxable income and any net realized capital gains (after reduction for capital loss carryforwards) sufficient to relieve it from all, or substantially all, federal income taxes. Accordingly, no provision for federal income taxes was required.
The Fund’s income and federal excise tax returns and all financial records supporting those returns for the prior three fiscal years are subject to examination by the federal and Delaware revenue authorities. Management has analyzed the Fund’s tax positions taken on federal, state, and foreign tax returns for all open tax years and does not believe that there are any uncertain tax positions that require recognition of a tax liability.
As of July 31, 2012, the Fund had pre-enactment capital loss carryforwards incurred in taxable years beginning before December 22, 2010, which were available to offset future net realized capital gains, in the amount of $60,761,603 with $29,515,293 expiring in 2017 and $31,246,310 expiring in 2019.
Class allocations
The separate classes of shares offered by the Fund differ principally in applicable sales charges, distribution, shareholder servicing, and administration fees. Shareholders of each class bear certain expenses that pertain to that particular class. All shareholders bear the common expenses of the Fund, earn income from the portfolio, and are allocated any unrealized gains and losses pro rata based on the average daily net assets of each class, without distinction between share classes. Dividends are determined separately for each class based on income and expenses allocable to each class. Realized gains and losses are allocated to each class pro rata based upon the net assets of each class on the date realized. Differences in per share dividend rates generally result from the relative weightings of pro rata income and realized gain allocations and from differences in separate class expenses, including distribution, shareholder servicing, and administration fees.
3. FAIR VALUATION MEASUREMENTS
Fair value measurements of investments are determined within a framework that has established a fair value hierarchy based upon the various data inputs utilized in determining the value of the Fund’s investments. The three-level hierarchy gives the highest priority to unadjusted quoted prices in active markets for identical assets or liabilities (Level 1) and the lowest priority to significant unobservable inputs (Level 3). The Fund’s investments are classified within the fair value hierarchy based on the lowest level of input that is significant to the fair value measurement. The inputs are summarized into three broad levels as follows:
| n | | Level 1 – quoted prices in active markets for identical securities |
| n | | Level 2 – other significant observable inputs (including quoted prices for similar securities, interest rates, prepayment speeds, credit risk, use of amortized cost, etc.) |
| n | | Level 3 – significant unobservable inputs (including the Fund’s own assumptions in determining the fair value of investments) |
| | | | |
| 26 | | Wells Fargo Advantage Large Cap Growth Fund | | Notes to financial statements (unaudited) |
The inputs or methodologies used for valuing investments in securities are not necessarily an indication of the risk associated with investing in those securities.
As of January 31, 2013, the inputs used in valuing investments in securities, which are carried at fair value, were as follows:
| | | | | | | | | | | | | | | | |
| Investments in Securities | | Quoted prices (level 1) | | | Significant other
observable Inputs (level 2) | | | Significant unobservable inputs (level 3) | | | Total | |
| | | | |
Equity securities | | | | | | | | | | | | | | | | |
Common stocks | | $ | 1,292,994,022 | | | $ | 0 | | | $ | 0 | | | $ | 1,292,994,022 | |
| | | | |
Other | | | 0 | | | | 0 | | | | 381,285 | | | | 381,285 | |
| | | | |
Short-term investments | | | | | | | | | | | | | | | | |
Investment companies | | | 24,694,448 | | | | 117,795,790 | | | | 0 | | | | 142,490,238 | |
| | | $ | 1,317,688,470 | | | $ | 117,795,790 | | | $ | 381,285 | | | $ | 1,435,865,545 | |
Further details on the major security types listed above can be found in the Portfolio of Investments.
Transfers in and transfers out are recognized at the end of the reporting period. For the six months ended January 31, 2013, the Fund did not have any transfers into/out of Level 1 or Level 2.
4. TRANSACTIONS WITH AFFILIATES AND OTHER EXPENSES
Advisory Fee
The Trust has entered into an advisory contract with Funds Management, an indirect wholly owned subsidiary of Wells Fargo & Company (“Wells Fargo”). The adviser is responsible for implementing investment policies and guidelines and for supervising the subadviser, who is responsible for day-to-day portfolio management of the Fund.
Pursuant to the contract, Funds Management is entitled to receive an annual advisory fee starting at 0.65% and declining to 0.55% as the average daily net assets of the Fund increase. For the six months ended January 31, 2013, the advisory fee was equivalent to an annual rate of 0.63% of the Fund’s average daily net assets.
Funds Management has retained the services of a subadviser to provide daily portfolio management to the Fund. The fee for subadvisory services is borne by Funds Management. WellsCap, an affiliate of Funds Management, is the subadviser to the Fund and is entitled to receive a fee from Funds Management at an annual rate starting at 0.35% and declining to 0.15% as the average daily net assets of the Fund increase.
Administration and transfer agent fees
The Trust has entered into an administration agreement with Funds Management. Under this agreement, for providing administrative services, which includes paying fees and expenses for services provided by the transfer agent, sub-transfer agents, omnibus account servicers and record-keepers, Funds Management is entitled to receive from the Fund an annual fund level administration fee starting at 0.05% and declining to 0.03% as the average daily net assets of the Fund increase and a class level administration fee which is calculated based on the average daily net assets of each class as follows:
| | | | |
| | | Class level administration fee | |
Class A, Class C, Class R | | | 0.26 | % |
Class R4, Institutional Class | | | 0.08 | |
Class R6 | | | 0.03 | |
Administrator Class | | | 0.10 | |
Investor Class | | | 0.32 | |
Funds Management has contractually waived and/or reimbursed advisory and administration fees to the extent necessary to maintain certain net operating expense ratios for the Fund. Waiver of fees and/or reimbursement of expenses by Funds Management were made first from fund level expenses on a proportionate basis and then from class specific expenses. Funds Management has committed through November 30, 2014 to waive fees and/or reimburse expenses to the extent necessary to cap the Fund’s expenses at 1.07% for Class A shares, 1.82% for Class C shares, 1.32%
| | | | | | |
| Notes to financial statements (unaudited) | | Wells Fargo Advantage Large Cap Growth Fund | | | 27 | |
for Class R shares, 0.75% for Class R4 shares, 0.60% for Class R6 shares, 0.95% for Administrator Class shares, 0.65% for Institutional Class shares and 1.13% for Investor Class shares.
Distribution fees
The Trust has adopted a Distribution Plan for Class C and Class R shares of the Fund pursuant to Rule 12b-1 under the 1940 Act. Distribution fees are charged to Class C and Class R shares and paid to Wells Fargo Funds Distributor, LLC, the principal underwriter, at an annual rate of 0.75% of the average daily net assets of Class C shares and 0.25% of the average daily net assets for Class R shares.
For the six months ended January 31, 2013, Wells Fargo Funds Distributor, LLC received $3,867 from the sale of Class A shares and $690 in contingent deferred sales charges from redemptions of Class C shares.
Shareholder servicing fees
The Trust has entered into contracts with one or more shareholder servicing agents, whereby Class A, Class C, Class R, Administrator Class, and Investor Class of the Fund is charged a fee at an annual rate of 0.25% of the average daily net assets of each respective class. Class R4 shares are charged a fee at an annual rate of 0.10% of its average daily net assets.
A portion of these total shareholder servicing fees were paid to affiliates of Wells Fargo.
5. INVESTMENT PORTFOLIO TRANSACTIONS
Purchases and sales of investments, excluding U.S. government obligations (if any) and short-term securities, for the six months ended January 31, 2013 were $446,764,647 and $314,251,170, respectively.
6. ACQUISITION
After the close of business on June 15, 2012, the Fund acquired the net assets of Wells Fargo Advantage Strategic Large Cap Growth Fund. The purpose of the transaction was to combine two funds with similar investment objectives and strategies. Shareholders holding Class A, Class C, Class R, Administrator Class and Institutional Class shares of Wells Fargo Advantage Strategic Large Cap Growth Fund received Class A, Class C, Class R, Administrator Class and Institutional Class shares, respectively, of the Fund in the reorganization. The acquisition was accomplished by a tax-free exchange of all of the shares of Wells Fargo Advantage Strategic Large Cap Growth Fund for 16,912,837 shares of the Fund valued at 561,057,277 at an exchange ratio of 1.00, 0.94, 0.99, 1.00 and 1.00 for Class A, Class C, Class R, Administrator Class and Institutional Class shares, respectively. The investment portfolio of Wells Fargo Advantage Strategic Large Cap Growth Fund with a fair value of $560,614,856, identified cost of $467,081,023 and unrealized gains of $93,533,833 at June 15, 2012 were the principal assets acquired by the Fund. The aggregate net assets of Wells Fargo Advantage Strategic Large Cap Fund and the Fund immediately prior to the acquisition were $561,057,277 and $540,954,928, respectively. The aggregate net assets of the Fund immediately after the acquisition were $1,102,012,205. For financial reporting purposes, assets received and shares issued by the Fund were recorded at fair value; however, the cost basis of the investments received from Wells Fargo Advantage Strategic Large Cap Growth Fund was carried forward to align ongoing reporting of the Fund’s realized and unrealized gains and losses with amounts distributable to shareholders for tax purposes.
Assuming the acquisition had been completed August 1, 2011, the beginning of the annual reporting period for the Fund, the pro forma results of operations for the year ended July 31, 2012 would have been:
| | | | |
Net investment income | | $ | 156,944 | |
Net realized and unrealized gains on investments | | $ | 107,233,423 | |
Net increase in net assets resulting from operations | | $ | 107,390,367 | |
7. BANK BORROWINGS
The Trust (excluding the money market funds and certain other funds in the Trust) and Wells Fargo Variable Trust are parties to a $150,000,000 revolving credit agreement with State Street Bank and Trust Company, whereby the Fund is permitted to use bank borrowings for temporary or emergency purposes, such as to fund shareholder redemption requests. Interest under the credit agreement is charged to the Fund based on a borrowing rate equal to the higher of the Federal Funds rate in effect on that day plus 1.25% or the overnight LIBOR rate in effect on that day plus 1.25%. In addition, an annual commitment fee equal to 0.10% of the unused balance is allocated to each participating fund. For the six months ended January 31, 2013, the Fund paid $496 in commitment fees.
For the six months ended January 31, 2013, there were no borrowings by the Fund under the agreement.
| | | | |
| 28 | | Wells Fargo Advantage Large Cap Growth Fund | | Notes to financial statements (unaudited) |
8. INDEMNIFICATION
Under the Trust’s organizational documents, the officers and directors are indemnified against certain liabilities that may arise out of performance of their duties to the Trust. Additionally, in the normal course of business, the Trust may enter into contracts with service providers that contain a variety of indemnification clauses. The Trust’s maximum exposure under these arrangements is dependent on future claims that may be made against the Fund and, therefore, cannot be estimated.
9. NEW ACCOUNTING PRONOUNCEMENT
In December 2011, the Financial Accounting Standards Board (“FASB”) issued Accounting Standard Update (“ASU”) No. 2011-11, Disclosures about Offsetting Assets and Liabilities. ASU 2011-11, which amends FASB ASC Topic 210, Balance Sheet, creates new disclosure requirements which require entities to disclose both gross and net information for derivatives and other financial instruments that are either offset in the Statement of Assets and Liabilities or subject to an enforceable master netting arrangement or similar agreement. The disclosure requirements are effective for interim and annual reporting periods beginning on or after January 1, 2013. Management is currently assessing the potential impact, in addition to expanded financial statement disclosure, that may result from adopting this ASU.
| | | | | | |
| Other information (unaudited) | | Wells Fargo Advantage Large Cap Growth Fund | | | 29 | |
PROXY VOTING INFORMATION
A description of the policies and procedures that the Fund uses to determine how to vote proxies relating to portfolio securities is available without charge, upon request, by calling 1-800-222-8222, visiting our website at wellsfargoadvantagefunds.com, or visiting the SEC website at sec.gov. Information regarding how the Fund voted proxies relating to portfolio securities during the most recent 12-month period ended June 30 is available without charge on the Fund’s website at wellsfargoadvantagefunds.com or by visiting the SEC website at sec.gov.
PORTFOLIO HOLDINGS INFORMATION
The complete portfolio holdings for the Fund are publicly available on the Fund’s website (wellsfargoadvantagefunds.com) on a monthly, 30-day or more delayed basis. In addition, top ten holdings information for the Fund is publicly available on the Fund’s website on a monthly, seven-day or more delayed basis. The Fund files its complete schedule of portfolio holdings with the SEC for the first and third quarters of each fiscal year on Form N-Q, which is available without charge by visiting the SEC website at sec.gov. In addition, the Fund’s Form N-Q may be reviewed and copied at the SEC’s Public Reference Room in Washington, DC, and at regional offices in New York City, at 233 Broadway, and in Chicago, at 175 West Jackson Boulevard, Suite 900. Information about the Public Reference Room may be obtained by calling 1-800-SEC-0330.
| | | | |
| 30 | | Wells Fargo Advantage Large Cap Growth Fund | | Other information (unaudited) |
BOARD OF TRUSTEES AND OFFICERS
Each of the Trustees and Officers listed in the table below acts in identical capacities for the Wells Fargo Advantage family of funds, which consists of 136 funds1 comprising the Wells Fargo Funds Trust, Wells Fargo Variable Trust, Wells Fargo Master Trust and four closed-end funds (collectively the “Fund Complex”). This table should be read in conjunction with the Prospectus and the Statement of Additional Information2. All of the Trustees are also Members of the Audit and Governance Committees of each Trust in the Fund Complex. The mailing address of each Trustee and Officer is 525 Market Street, 12th Floor, San Francisco, CA 94105. Each Trustee and Officer serves an indefinite term, however, each Trustee serves such term until reaching the mandatory retirement age established by the Trustees.
Independent Trustees
| | | | | | |
Name and
year of birth | | Position held and
length of service* | | Principal occupations during past five years | | Other
directorships during
past five years |
| Peter G. Gordon (Born 1942) | | Trustee, since 1998; Chairman, since 2005 | | Co-Founder, Retired Chairman, President and CEO of Crystal Geyser Water Company. Trustee Emeritus, Colby College. | | Asset Allocation Trust |
| Isaiah Harris, Jr. (Born 1952) | | Trustee, since 2009 | | Retired. Prior thereto, President and CEO of BellSouth Advertising and Publishing Corp. from 2005 to 2007, President and CEO of BellSouth Enterprises from 2004 to 2005 and President of BellSouth Consumer Services from 2000 to 2003. Emeritus member of the Iowa State University Foundation Board of Governors. Emeritus Member of the Advisory Board of Iowa State University School of Business. Advisory Board Member, Palm Coast Academy (charter school). Mr. Harris is a certified public accountant. | | CIGNA Corporation; Deluxe Corporation; Asset Allocation Trust |
| Judith M. Johnson (Born 1949) | | Trustee, since 2008; Audit Committee Chairman, since 2008 | | Retired. Prior thereto, Chief Executive Officer and Chief Investment Officer of Minneapolis Employees Retirement Fund from 1996 to 2008. Ms. Johnson is an attorney, certified public accountant and a certified managerial accountant. | | Asset Allocation Trust |
| Leroy Keith, Jr. (Born 1939) | | Trustee, since 2010 | | Chairman, Bloc Global Services (development and construction). Trustee of the Evergreen Funds from 1983 to 2010. Former Managing Director, Almanac Capital Management (commodities firm), former Partner, Stonington Partners, Inc. (private equity fund), former Director, Obagi Medical Products Co. and former Director, Lincoln Educational Services. | | Trustee, Virtus Fund Complex (consisting of 48 portfolios as of 1/31/13); Asset Allocation Trust |
| David F. Larcker (Born 1950) | | Trustee, since 2009 | | James Irvin Miller Professor of Accounting at the Graduate School of Business, Stanford University, Morgan Stanley Director of the Center for Leadership Development and Research and Senior Faculty of The Rock Center for Corporate Governance since 2006. From 2005 to 2008, Professor of Accounting at the Graduate School of Business, Stanford University. Prior thereto, Ernst & Young Professor of Accounting at The Wharton School, University of Pennsylvania from 1985 to 2005. | | Asset Allocation Trust |
| Olivia S. Mitchell (Born 1953) | | Trustee, since 2006 | | International Foundation of Employee Benefit Plans Professor, Wharton School of the University of Pennsylvania since 1993. Director of Wharton’s Pension Research Council and Boettner Center on Pensions & Retirement Research, and Research Associate at the National Bureau of Economic Research. Previously, Cornell University Professor from 1978 to 1993. | | Asset Allocation Trust |
| Timothy J. Penny (Born 1951) | | Trustee, since 1996 | | President and CEO of Southern Minnesota Initiative Foundation, a non-profit organization, since 2007 and Senior Fellow at the Humphrey Institute Policy Forum at the University of Minnesota since 1995. Member of the Board of Trustees of NorthStar Education Finance, Inc., a non-profit organization, since 2007. | | Asset Allocation Trust |
| | | | | | |
| Other information (unaudited) | | Wells Fargo Advantage Large Cap Growth Fund | | | 31 | |
| | | | | | |
Name and
year of birth | | Position held and
length of service* | | Principal occupations during past five years | | Other
directorships during
past five years |
| Michael S. Scofield (Born 1943) | | Trustee, since 2010 | | Served on the Investment Company Institute’s Board of Governors and Executive Committee from 2008-2011 as well the Governing Council of the Independent Directors Council from 2006-2011 and the Independent Directors Council Executive Committee from 2008-2011. Chairman of the IDC from 2008-2010. Institutional Investor (Fund Directions) Trustee of Year in 2007. Trustee of the Evergreen Funds (and its predecessors) from 1984 to 2010. Chairman of the Evergreen Funds from 2000-2010. Former Trustee of the Mentor Funds. Retired Attorney, Law Offices of Michael S. Scofield. | | Asset Allocation Trust |
| Donald C. Willeke (Born 1940) | | Trustee, since 1996 | | Principal of the law firm of Willeke & Daniels. General Counsel of the Minneapolis Employees Retirement Fund from 1984 until its consolidation into the Minnesota Public Employees Retirement Association on June 30, 2010. Director and Vice Chair of The Tree Trust (non-profit corporation). Director of the American Chestnut Foundation (non-profit corporation). | | Asset Allocation Trust |
| * | Length of service dates reflect the Trustee’s commencement of service with the Trust’s predecessor entities, where applicable. |
Officers
| | | | | | |
Name and
year of birth | | Position held and
length of service | | Principal occupations during past five years | | |
Karla M. Rabusch
(Born 1959) | | President, since 2003 | | Executive Vice President of Wells Fargo Bank, N.A. and President of Wells Fargo Funds Management, LLC since 2003. | | |
Jeremy DePalma1
(Born 1974) | | Treasurer, since 2012 | | Senior Vice President of Wells Fargo Funds Management, LLC since 2009. Senior Vice President of Evergreen Investment Management Company, LLC from 2008 to 2010. Vice President, Evergreen Investment Services, Inc. from 2004 to 2007. Head of the Fund Reporting and Control Team within Fund Administration from 2005 to 2010. | | |
C. David Messman
(Born 1960) | | Secretary, since 2000; Chief Legal Officer, since 2003 | | Senior Vice President and Secretary of Wells Fargo Funds Management, LLC since 2001. Vice President and Managing Counsel of Wells Fargo Bank, N.A. since 1996. | | |
Debra Ann Early
(Born 1964) | | Chief Compliance Officer, since 2007 | | Chief Compliance Officer of Wells Fargo Funds Management, LLC since 2007. Chief Compliance Officer of Parnassus Investments from 2005 to 2007. Chief Financial Officer of Parnassus Investments from 2004 to 2007. | | |
David Berardi
(Born 1975) | | Assistant Treasurer, since 2009 | | Vice President of Wells Fargo Funds Management, LLC since 2009. Vice President of Evergreen Investment Management Company, LLC from 2008 to 2010. Assistant Vice President of Evergreen Investment Services, Inc. from 2004 to 2008. Manager of Fund Reporting and Control for Evergreen Investment Management Company, LLC from 2004 to 2010. | | |
| 1. | Jeremy DePalma acts as Treasurer of 61 funds and Assistant Treasurer of 75 funds in the Fund Complex. |
| 2. | The Statement of Additional Information includes additional information about the Trustees and is available, without charge, upon request, by calling 1-800-222-8222 or by visiting the website at wellsfargoadvantagefunds.com. |
| | | | |
| 32 | | Wells Fargo Advantage Large Cap Growth Fund | | List of abbreviations |
The following is a list of common abbreviations for terms and entities that may have appeared in this report.
| ACA | — ACA Financial Guaranty Corporation |
| ADR | — American depositary receipt |
| ADS | — American depositary shares |
| AGC | — Assured Guaranty Corporation |
| AGM | — Assured Guaranty Municipal |
| Ambac | — Ambac Financial Group Incorporated |
| AMT | — Alternative minimum tax |
| BAN | — Bond anticipation notes |
| BHAC | — Berkshire Hathaway Assurance Corporation |
| CAB | — Capital appreciation bond |
| CCAB | — Convertible capital appreciation bond |
| CDA | — Community Development Authority |
| CDO | — Collateralized debt obligation |
| COP | — Certificate of participation |
| DRIVER | — Derivative inverse tax-exempt receipts |
| DW&P | — Department of Water & Power |
| DWR | — Department of Water Resources |
| ECFA | — Educational & Cultural Facilities Authority |
| EDA | — Economic Development Authority |
| EDFA | — Economic Development Finance Authority |
| ETF | — Exchange-traded fund |
| FDIC | — Federal Deposit Insurance Corporation |
| FFCB | — Federal Farm Credit Banks |
| FGIC | — Financial Guaranty Insurance Corporation |
| FHA | — Federal Housing Administration |
| FHLB | — Federal Home Loan Bank |
| FHLMC | — Federal Home Loan Mortgage Corporation |
| FICO | — The Financing Corporation |
| FNMA | — Federal National Mortgage Association |
| GDR | — Global depositary receipt |
| GNMA | — Government National Mortgage Association |
| HCFR | — Healthcare facilities revenue |
| HEFA | — Health & Educational Facilities Authority |
| HEFAR | — Higher education facilities authority revenue |
| HFA | — Housing Finance Authority |
| HFFA | — Health Facilities Financing Authority |
| HUD | — Department of Housing and Urban Development |
| IDA | — Industrial Development Authority |
| IDAG | — Industrial Development Agency |
| IDR | — Industrial development revenue |
| KRW | — Republic of Korea won |
| LIBOR | — London Interbank Offered Rate |
| LLC | — Limited liability company |
| LLP | — Limited liability partnership |
| MBIA | — Municipal Bond Insurance Association |
| MFHR | — Multifamily housing revenue |
| MSTR | — Municipal securities trust receipts |
| MUD | — Municipal Utility District |
| National | — National Public Finance Guarantee Corporation |
| PCFA | — Pollution Control Financing Authority |
| PCL | — Public Company Limited |
| PCR | — Pollution control revenue |
| PFA | — Public Finance Authority |
| PFFA | — Public Facilities Financing Authority |
| PFOTER | — Puttable floating option tax-exempt receipts |
| plc | — Public limited company |
| PUTTER | — Puttable tax-exempt receipts |
| R&D | — Research & development |
| Radian | — Radian Asset Assurance |
| RAN | — Revenue anticipation notes |
| RDA | — Redevelopment Authority |
| RDFA | — Redevelopment Finance Authority |
| REIT | — Real estate investment trust |
| ROC | — Reset option certificates |
| SAVRS | — Select auction variable rate securities |
| SBA | — Small Business Authority |
| SFHR | — Single-family housing revenue |
| SFMR | — Single-family mortgage revenue |
| SPA | — Standby purchase agreement |
| SPDR | — Standard & Poor’s Depositary Receipts |
| STRIPS | — Separate trading of registered interest and |
| TAN | — Tax anticipation notes |
| TIPS | — Treasury inflation-protected securities |
| TRAN | — Tax revenue anticipation notes |
| TTFA | — Transportation Trust Fund Authority |
| TVA | — Tennessee Valley Authority |
This page is intentionally left blank.
This page is intentionally left blank.


For more information
More information about Wells Fargo Advantage Funds is available free upon request. To obtain literature, please write, email, visit the Fund’s website, or call:
Wells Fargo Advantage Funds
P.O. Box 8266
Boston, MA 02266-8266
Email: wfaf@wellsfargo.com
Website: wellsfargoadvantagefunds.com
Individual investors: 1-800-222-8222
Retail investment professionals: 1-888-877-9275
Institutional investment professionals: 1-866-765-0778
This report and the financial statements contained herein are submitted for the general information of the shareholders of Wells Fargo Advantage Funds. If this report is used for promotional purposes, distribution of the report must be accompanied or preceded by a current prospectus. For a current prospectus and, if available, a summary prospectus containing more complete information, including charges and expenses, call 1-800-222-8222 or visit the Fund’s website at wellsfargoadvantagefunds.com. Please consider the investment objectives, risks, charges, and expenses of the investment carefully before investing. This and other information about Wells Fargo Advantage Funds can be found in the current prospectus. Read the prospectus carefully before you invest or send money.
Wells Fargo Funds Management, LLC, a wholly owned subsidiary of Wells Fargo & Company, provides investment advisory and administrative services for Wells Fargo Advantage Funds. Other affiliates of Wells Fargo & Company provide subadvisory and other services for the Funds. The Funds are distributed by Wells Fargo Funds Distributor, LLC, Member FINRA/SIPC, an affiliate of Wells Fargo & Company.
NOT FDIC INSURED ¡ NO BANK GUARANTEE ¡ MAY LOSE VALUE
© 2013 Wells Fargo Funds Management, LLC. All rights reserved.
| | |
 | | 215107 03-13 SA209/SAR209 1-13 |

Wells Fargo Advantage
Large Company Value Fund

Semi-Annual Report
January 31, 2013

Reduce clutter. Save trees.
Sign up for electronic delivery of prospectuses and shareholder reports at wellsfargo.com/advantagedelivery
Contents
The views expressed and any forward-looking statements are as of January 31, 2013, unless otherwise noted, and are those of the Fund managers and/or Wells Fargo Funds Management, LLC. Discussions of individual securities, or the markets generally, or any Wells Fargo Advantage Fund are not intended as individual recommendations. Future events or results may vary significantly from those expressed in any forward-looking statements; the views expressed are subject to change at any time in response to changing circumstances in the market. Wells Fargo Funds Management, LLC, disclaims any obligation to publicly update or revise any views expressed or forward-looking statements.
NOT FDIC INSURED ¡ NO BANK GUARANTEE ¡ MAY LOSE VALUE

Wells Fargo investment history
| | |
| 1932 | | Keystone creates one of the first mutual fund families. |
| 1971 | | Wells Fargo & Company introduces one of the first institutional index funds. |
| 1978 | | Wells Fargo applies Markowitz and Sharpe’s research on Modern Portfolio Theory to introduce one of the industry’s first tactical asset allocation models in institutional separately managed accounts. |
| 1984 | | Wells Fargo Stagecoach Funds launches its first asset allocation fund. |
| 1989 | | The Tactical Asset Allocation (TAA) Model is first applied to Wells Fargo’s asset allocation mutual funds. |
| 1994 | | Wells Fargo introduces the LifePath Funds, one of the first suites of target date funds (now the Wells Fargo Advantage Dow Jones Target Date FundsSM). |
| 1996 | | Evergreen Investments and Keystone Funds merge. |
| 1997 | | Wells Fargo launches the Wells Fargo Advantage WealthBuilder PortfoliosSM, a fund-of-funds suite of products that includes the use of quantitative models to shift assets among investment styles. |
| 1999 | | Norwest Advantage Funds and Stagecoach Funds are reorganized into Wells Fargo Funds after the merger of Norwest and Wells Fargo. |
| 2002 | | Evergreen Retail and Evergreen Institutional companies form the umbrella asset management company, Evergreen Investments. |
| 2005 | | The integration of Strong Funds with Wells Fargo Funds creates Wells Fargo Advantage Funds, resulting in one of the top 20 mutual fund companies in the United States. |
| 2006 | | Wells Fargo Advantage Funds relaunches the target date product line as Wells Fargo Advantage Dow Jones Target Date Funds. |
| 2010 | | The mergers and reorganizations of Evergreen and Wells Fargo Advantage mutual funds are completed, unifying the families under the brand of Wells Fargo Advantage Funds. |
Wells Fargo Advantage Funds®
Wells Fargo Advantage Funds skillfully guides institutions, financial advisors, and individuals through the investment terrain to help them reach their financial objectives. Everything we do on behalf of investors is backed by our unique combination of qualifications.
Strength
Our organization is built on the standards of integrity and service established by our parent company—Wells Fargo & Company—more than 150 years ago. And, because we’re part of a highly diversified financial enterprise, we offer the depth of resources to help investors succeed.
Expertise
Our multi-boutique model offers investors access to the independent thinking of premier investment managers that have been chosen for their time-tested strategies. While each team specializes in a specific investment strategy, collectively they provide investors a wide choice of distinct investment styles. Our dedication to investment excellence doesn’t end with our expertise in manager selection—risk management, analysis, and rigorous ongoing review seek to ensure each manager’s investment process remains consistent.
Partnership
Our collaborative approach is built around understanding the needs and goals of our clients. By adhering to core principles of sound judgment and steady guidance, we support you through every stage of the investment decision process.
Carefully consider the investment objectives, risks, charges, and expenses before investing. For a current prospectus and, if available, a summary prospectus, for Wells Fargo Advantage Funds, containing this and other information, visit wellsfargoadvantagefunds.com. Read it carefully before investing.
Wells Fargo Funds Management, LLC, a wholly owned subsidiary of Wells Fargo & Company, provides investment advisory and administrative services for Wells Fargo Advantage Funds. Other affiliates of Wells Fargo & Company provide subadvisory and other services for the Funds. The Funds are distributed by Wells Fargo Funds Distributor, LLC, Member FINRA/SIPC, an affiliate of Wells Fargo & Company.
“Dow Jones®” and “Dow Jones Target Date IndexesSM” are service marks of Dow Jones Trademark Holdings LLC (“Dow Jones”); have been licensed to CME Group Index Services LLC (“CME Indexes”); and have been sublicensed for use for certain purposes by Global Index Advisors, Inc., and Wells Fargo Funds Management, LLC. The Wells Fargo Advantage Dow Jones Target Date FundsSM, based on the Dow Jones Target Date Indexes, are not sponsored, endorsed, sold, or promoted by Dow Jones, CME Indexes, or their respective affiliates, and none of them makes any representation regarding the advisability of investing in such product(s).
NOT FDIC INSURED ¡ NO BANK GUARANTEE ¡ MAY LOSE VALUE
Not part of the semi-annual report.
Wells Fargo Advantage Funds offers more than 110 mutual funds across a wide range of asset classes, representing over $226 billion in assets under management, as of January 31, 2013.
| | | | |
| Equity funds | | | | |
Asia Pacific Fund | | Enterprise Fund† | | Opportunity Fund† |
C&B Large Cap Value Fund | | Global Opportunities Fund | | Precious Metals Fund |
C&B Mid Cap Value Fund | | Growth Fund | | Premier Large Company Growth Fund |
Capital Growth Fund | | Index Fund | | Small Cap Opportunities Fund |
Common Stock Fund | | International Equity Fund | | Small Cap Value Fund |
Disciplined U.S. Core Fund | | International Value Fund | | Small Company Growth Fund |
Discovery Fund† | | Intrinsic Small Cap Value Fund | | Small Company Value Fund |
Diversified Equity Fund | | Intrinsic Value Fund | | Small/Mid Cap Value Fund |
Diversified International Fund | | Intrinsic World Equity Fund | | Special Mid Cap Value Fund |
Emerging Growth Fund | | Large Cap Core Fund | | Special Small Cap Value Fund |
Emerging Markets Equity Fund | | Large Cap Growth Fund | | Specialized Technology Fund |
Emerging Markets Equity Income Fund | | Large Company Value Fund | | Traditional Small Cap Growth Fund |
Endeavor Select Fund† | | Omega Growth Fund | | Utility and Telecommunications Fund |
| Bond funds | | | | |
Adjustable Rate Government Fund | | High Yield Municipal Bond Fund | | Short Duration Government Bond Fund |
California Limited-Term Tax-Free Fund | | Income Plus Fund | | Short-Term Bond Fund |
California Tax-Free Fund | | Inflation-Protected Bond Fund | | Short-Term High Yield Bond Fund |
Colorado Tax-Free Fund | | Intermediate Tax/AMT-Free Fund | | Short-Term Municipal Bond Fund |
Core Bond Fund | | International Bond Fund | | Strategic Income Fund |
Emerging Markets Local Bond Fund | | Minnesota Tax-Free Fund | | Strategic Municipal Bond Fund |
Government Securities Fund | | Municipal Bond Fund | | Ultra Short-Term Income Fund |
High Income Fund | | North Carolina Tax-Free Fund | | Ultra Short-Term Municipal Income Fund |
High Yield Bond Fund | | Pennsylvania Tax-Free Fund | | Wisconsin Tax-Free Fund |
| Asset allocation funds | | | | |
Absolute Return Fund | | WealthBuilder Equity Portfolio† | | Target 2020 Fund† |
Asset Allocation Fund | | WealthBuilder Growth Allocation Portfolio† | | Target 2025 Fund† |
Conservative Allocation Fund | | WealthBuilder Growth Balanced Portfolio† | | Target 2030 Fund† |
Diversified Capital Builder Fund | | WealthBuilder Moderate Balanced Portfolio† | | Target 2035 Fund† |
Diversified Income Builder Fund | | WealthBuilder Tactical Equity Portfolio† | | Target 2040 Fund† |
Growth Balanced Fund | | Target Today Fund† | | Target 2045 Fund† |
Index Asset Allocation Fund | | Target 2010 Fund† | | Target 2050 Fund† |
Moderate Balanced Fund | | Target 2015 Fund† | | Target 2055 Fund† |
WealthBuilder Conservative Allocation Portfolio† | | | | |
| Money market funds | | | | |
100% Treasury Money Market Fund | | Heritage Money Market Fund† | | National Tax-Free Money Market Fund |
California Municipal Money Market Fund | | Money Market Fund | | Treasury Plus Money Market Fund |
Cash Investment Money Market Fund | | Municipal Cash Management Money Market Fund | | |
Government Money Market Fund | | Municipal Money Market Fund | | |
| Variable trust funds1 | | | | |
VT Discovery Fund† | | VT Intrinsic Value Fund | | VT Small Cap Growth Fund |
VT Index Asset Allocation Fund | | VT Omega Growth Fund | | VT Small Cap Value Fund |
VT International Equity Fund | | VT Opportunity Fund† | | VT Total Return Bond Fund |
An investment in a money market fund is not insured or guaranteed by the Federal Deposit Insurance Corporation or any other government agency. Although the Wells Fargo Advantage Money Market Funds seek to preserve the value of your investment at $1.00 per share, it is possible to lose money by investing in a money market fund.
| 1. | The variable trust funds are generally available only through insurance company variable contracts. |
| † | In this report, the Wells Fargo Advantage Discovery FundSM, Wells Fargo Advantage Endeavor Select FundSM, Wells Fargo Advantage Enterprise FundSM, Wells Fargo Advantage Opportunity FundSM, Wells Fargo Advantage WealthBuilder Conservative Allocation PortfolioSM, Wells Fargo Advantage WealthBuilder Equity PortfolioSM, Wells Fargo Advantage WealthBuilder Growth Allocation PortfolioSM, Wells Fargo Advantage WealthBuilder Growth Balanced PortfolioSM, Wells Fargo Advantage WealthBuilder Moderate Balanced PortfolioSM, Wells Fargo Advantage WealthBuilder Tactical Equity PortfolioSM, Wells Fargo Advantage Dow Jones Target Today FundSM, Wells Fargo Advantage Dow Jones Target 2010 FundSM, Wells Fargo Advantage Dow Jones Target 2015 FundSM, Wells Fargo Advantage Dow Jones Target 2020 FundSM, Wells Fargo Advantage Dow Jones Target 2025 FundSM, Wells Fargo Advantage Dow Jones Target 2030 FundSM, Wells Fargo Advantage Dow Jones Target 2035 FundSM, Wells Fargo Advantage Dow Jones Target 2040 FundSM, Wells Fargo Advantage Dow Jones Target 2045 FundSM, Wells Fargo Advantage Dow Jones Target 2050 FundSM, Wells Fargo Advantage Dow Jones Target 2055 FundSM, Wells Fargo Advantage Heritage Money Market FundSM, Wells Fargo Advantage VT Discovery FundSM, and Wells Fargo Advantage VT Opportunity FundSM are referred to as the Discovery Fund, Endeavor Select Fund, Enterprise Fund, Opportunity Fund, WealthBuilder Conservative Allocation Portfolio, WealthBuilder Equity Portfolio, WealthBuilder Growth Allocation Portfolio, WealthBuilder Growth Balanced Portfolio, WealthBuilder Moderate Balanced Portfolio, WealthBuilder Tactical Equity Portfolio, Target Today Fund, Target 2010 Fund, Target 2015 Fund, Target 2020 Fund, Target 2025 Fund, Target 2030 Fund, Target 2035 Fund, Target 2040 Fund, Target 2045 Fund, Target 2050 Fund, Target 2055 Fund, Heritage Money Market Fund, VT Discovery Fund, and VT Opportunity Fund, respectively. |
Not part of the semi-annual report.
| | | | |
| 2 | | Wells Fargo Advantage Large Company Value Fund | | Letter to shareholders (unaudited) |

Karla M. Rabusch
President
Wells Fargo Advantage Funds
Entering the period, concerns about the eurozone sovereign debt situation held center stage as investors again focused on economic weakness in southern European economies.
Aggressive central bank actions helped support stock prices, as did relatively solid economic data.
Dear Valued Shareholder:
We are pleased to offer you this semi-annual report for the Wells Fargo Advantage Large Company Value Fund for the six-month period that ended January 31, 2013. Much of the period was marked by continued concerns about the possible effects that the ongoing European sovereign debt crisis would have on the global economy. However, relatively solid economic data in the U.S. and efforts by European authorities to address the sovereign debt issue alleviated investor fears and supported global stock markets. Judging by various indexes, U.S. large-cap stocks underperformed small-cap stocks. Within the large-cap universe, value stocks outperformed growth stocks, partly because of strong performance from the financials sector.
The period was dominated by worries that ongoing debt problems in the eurozone would affect global economic growth.
Entering the period, concerns about the eurozone sovereign debt situation held center stage as investors again focused on economic weakness in southern European economies. Because many eurozone banks owned southern European debt and many U.S. banks had financial ties to eurozone banks, investors worried about the effects of a possible southern European debt default on the global financial system and economy. Ongoing weakness in the Greek economy made it difficult for the country to meet previously agreed upon austerity targets. Toward the end of the reporting period, political risk resurfaced in both Italy and Spain. In Italy, Prime Minister Mario Monti, an economist who was appointed to implement austerity measures and labor market reforms, resigned in December 2012. Monti later decided to run for office in the general election scheduled for February 2013.
European leaders took concerted action to calm investor concerns. In September 2012, the European Central Bank (ECB) announced that it would purchase an unlimited amount of one- to three-year sovereign debt from countries that had applied for a formal bailout through either the European Financial Stability Facility or the European Stability Mechanism. In another positive sign, in late November 2012, finance ministers from the 17-country eurozone and the International Monetary Fund struck a deal aimed at reducing Greece’s debt by the year 2020.
Central banks continued to provide stimulus.
Major central banks, including the U.S. Federal Reserve (Fed) and the ECB, continued to inject liquidity into the banks and the markets through various quantitative easing policies. Throughout the reporting period, the Federal Open Market Committee (FOMC) kept its key interest rates effectively at zero in order to support the economy and the financial system. The ECB was similarly aggressive, keeping its key rate at a historic low of 0.75%. Just prior to the beginning of the reporting period, the FOMC announced its intention to keep interest rates low until at least mid-2015 in order to support the sluggish economy. The Fed also announced open-ended purchases of $40 billion per month in mortgage-backed securities in an effort to support the housing market.
Stock markets posted solid gains in an eventful period.
Aggressive central bank actions helped support stock prices, as did relatively solid economic data. For much of the reporting period, the U.S. stock market benefited from favorable gross domestic product (GDP) data, with the growth rate improving from 1.3% (annualized) in the second quarter of 2012 to 3.1% (annualized) in the third quarter of 2012. However, the GDP growth rate slowed in the final months of 2012, with GDP growth coming in at 0.1% (annualized) in the fourth quarter of 2012. Because many investors attributed the weak number to the aftereffects of Hurricane Sandy on the eastern seaboard, the stock market remained resilient.
| | | | | | |
| Letter to shareholders (unaudited) | | Wells Fargo Advantage Large Company Value Fund | | | 3 | |
The steady improvement in the housing market supported investor sentiment. The National Association of Home Builders/First American Improving Markets Index identifies metro areas that have shown improvement from their respective troughs in housing permits, employment, and house prices for at least six consecutive months. The index rose for a fifth-consecutive month in January 2013, indicating improvements in 242 housing markets across the country. As a result, housing-related stocks strongly outperformed over the period, leading to better-than-index returns for sectors ranging from consumer discretionary (home improvement retailers), to materials (construction material providers), and to financials (mortgage lenders).
Throughout the period, a continued high unemployment rate was the main negative piece of U.S. economic data. Although the unemployment rate improved from 8.1% in August 2012 to 7.9% in January 2013, the labor market remained soft.
We remain committed to our investment strategies, even as many variables are at work in the market.
The full effect of the European credit crisis remains unknown. Elevated unemployment and debt defaults continue to pressure consumers and businesses alike. As a whole, Wells Fargo Advantage Funds represents investments across a range of asset classes and investment styles, giving you an opportunity to create a diversified investment portfolio. While diversification may not prevent losses in a downturn, we believe it helps manage risk.
Thank you for choosing to invest with Wells Fargo Advantage Funds. We appreciate your confidence in us and remain committed to helping you meet your financial needs. For current information about your fund investments, contact your investment professional, visit our website at wellsfargoadvantagefunds.com, or call us directly at 1-800-222-8222. We are available 24 hours a day, 7 days a week.
Sincerely,

Karla M. Rabusch
President
Wells Fargo Advantage Funds
Notice to shareholders
At its November 6-7, 2012 meeting, the Board of Trustees unanimously approved the following modifications to certain Class A sales load waiver privileges, with each change becoming effective on July 1, 2013:
| | n | | Annuity payments received under an annuity option or from death proceeds will no longer qualify for net asset value (NAV) repurchase privileges. | |
| | n | | The ability to reinvest redemption proceeds at NAV will be reduced from 120 days to 90 days. | |
| | n | | NAV purchase privileges for certain types of “grandfathered” shareholders will be modified to remove the ability to purchase Class A shares at NAV, unless those shares are held directly with the Fund. | |
Please contact your investment professional or call us directly at 1-800-222-8222 if you have any questions on this Notice to Shareholders.
| | | | |
| 4 | | Wells Fargo Advantage Large Company Value Fund | | Performance highlights (unaudited) |
Investment objective
The Fund seeks long-term capital appreciation.
Adviser
Wells Fargo Funds Management, LLC
Subadviser
Phocas Financial Corporation
Portfolio managers
Stephen L. Block, CFA
William F.K. Schaff, CFA
Average annual total returns1 (%) as of January 31, 2013
| | | | | | | | | | | | | | | | | | | | | | | | | | | | | | | | | | |
| | | | | Including sales charge | | | Excluding sales charge | | | Expense ratios2 (%) | |
| | | Inception date | | 1 year | | | 5 year | | | 10 year | | | 1 year | | | 5 year | | | 10 year | | | Gross | | | Net3 | |
| Class A (WLCAX) | | 3-31-2008 | | | 9.61 | | | | 1.04 | | | | 6.78 | | | | 16.26 | | | | 2.25 | | | | 7.41 | | | | 1.27 | | | | 1.10 | |
| Class C (WFLVX) | | 3-31-2008 | | | 14.48 | | | | 1.51 | | | | 6.70 | | | | 15.48 | | | | 1.51 | | | | 6.70 | | | | 2.02 | | | | 1.85 | |
| Administrator Class (WWIDX) | | 12-31-2001 | | | 16.59 | | | | 2.54 | | | | 7.79 | | | | 16.59 | | | | 2.54 | | | | 7.79 | | | | 1.11 | | | | 0.85 | |
| Institutional Class (WLCIX) | | 3-31-2008 | | | – | | | | – | | | | – | | | | 17.02 | | | | 2.76 | | | | 7.90 | | | | 0.84 | | | | 0.65 | |
| Investor Class (SDVIX) | | 7-1-1993 | | | – | | | | – | | | | – | | | | 16.29 | | | | 2.17 | | | | 7.38 | | | | 1.33 | | | | 1.16 | |
| Russell 1000® Value Index4 | | – | | | – | | | | – | | | | – | | | | 20.58 | | | | 2.70 | | | | 8.32 | | | | – | | | | – | |
Figures quoted represent past performance, which is no guarantee of future results and do not reflect the deduction of taxes that a shareholder may pay on fund distributions or the redemption of fund shares. Investment return and principal value of an investment will fluctuate so that an investor’s shares, when redeemed, may be worth more or less than their original cost. Performance shown without sales charges would be lower if sales charges were reflected. Current performance may be lower or higher than the performance data quoted and assumes the reinvestment of dividends and capital gains. Current month-end performance is available on the Fund’s website, wellsfargoadvantagefunds.com.
Index returns do not include transaction costs associated with buying and selling securities, any mutual fund fees or expenses, or any taxes. It is not possible to invest directly in an index.
For Class A shares, the maximum front-end sales charge is 5.75%. For Class C shares, the maximum contingent deferred sales charge is 1.00%. Performance including sales charge assumes the sales charge for the corresponding time period. Administrator Class, Institutional Class, and Investor Class shares are sold without a front-end sales charge or contingent deferred sales charge.
Stock values fluctuate in response to the activities of individual companies and general market and economic conditions. Certain investment strategies tend to increase the total risk of an investment (relative to the broader market). The Fund is exposed to foreign investment risk. Consult the Fund’s prospectus for additional information on these and other risks.
Please see footnotes on page 5.
| | | | | | |
| Performance highlights (unaudited) | | Wells Fargo Advantage Large Company Value Fund | | | 5 | |
| | | | |
| Ten largest equity holdings5 (%) as of January 31, 2013 | |
Chevron Corporation | | | 4.79 | |
General Electric Company | | | 2.79 | |
JPMorgan Chase & Company | | | 2.76 | |
Pfizer Incorporated | | | 2.60 | |
Citigroup Incorporated | | | 2.53 | |
CIGNA Corporation | | | 2.20 | |
CVS Caremark Corporation | | | 2.19 | |
Johnson & Johnson Services Incorporated | | | 2.16 | |
Continental Resources Incorporated | | | 2.09 | |
Simon Property Group Incorporated | | | 2.06 | |
|
| Sector distribution6 as of January 31, 2013 |
|
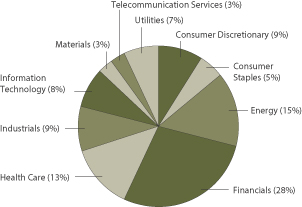
|
| 1. | Historical performance shown for Class A shares prior to their inception reflects the performance of the Investor Class shares, and includes the higher expenses applicable to the Investor Class shares (except during those periods in which the expenses of Class A shares would have been higher than those of the Investor Class shares.) If these expenses had not been included, returns would be higher. Historical performance shown for Class C shares prior to their inception reflects the performance of the Investor Class shares, adjusted to reflect the higher expenses applicable to Class C shares. Historical performance shown for the Institutional Class shares prior to their inception reflects the performance of the Investor Class shares and includes the higher expenses applicable to the Investor Class shares. If these expenses had not been included, returns would be higher. |
2. Reflects the expense ratios as stated in the most recent prospectuses.
| 3. | The Adviser has committed through November 30, 2013, to waive fees and/or reimburse expenses to the extent necessary to cap the Fund’s Total Annual Fund Operating Expenses After Fee Waiver, excluding certain expenses, at the amounts shown. Brokerage commissions, stamp duty fees, interest, taxes, acquired fund fees and expenses, and extraordinary expenses are excluded from the cap. Without this cap, the Fund’s returns would have been lower. |
| 4. | The Russell 1000® Value Index measures the performance of those Russell 1000 Index companies with lower price-to-book ratios and lower forecasted growth values. You cannot invest directly in an index. |
| 5. | The ten largest equity holdings are calculated based on the value of the securities divided by total net assets of the Fund. Holdings are subject to change and may have changed since the date specified. |
| 6. | Sector distribution is subject to change and is calculated based on the total long-term investments of the Fund. |
| | | | |
| 6 | | Wells Fargo Advantage Large Company Value Fund | | Fund expenses (unaudited) |
As a shareholder of the Fund, you incur two types of costs: (1) transaction costs, including sales charges (loads) on
purchase payments and contingent deferred sales charges (if any) on redemptions and (2) ongoing costs, including
management fees, distribution (12b-1) and/or shareholder service fees, and other Fund expenses. This example is intended to help you understand your ongoing costs (in dollars) of investing in the Fund and to compare these costs with the ongoing costs of investing in other mutual funds.
The example is based on an investment of $1,000 invested at the beginning of the six-month period and held for the entire period from August 1, 2012 to January 31, 2013.
Actual Expenses
The “Actual” line of the table below provides information about actual account values and actual expenses. You may use the information in this line, together with the amount you invested, to estimate the expenses that you paid over the period. Simply divide your account value by $1,000 (for example, an $8,600 account value divided by $1,000 = 8.6), then multiply the result by the number in the “Actual” line under the heading entitled “Expenses paid during period” for your applicable class of shares to estimate the expenses you paid on your account during this period.
Hypothetical example for comparison purposes
The “Hypothetical” line of the table below provides information about hypothetical account values and hypothetical expenses based on the Fund’s actual expense ratio and an assumed rate of return of 5% per year before expenses, which is not the Fund’s actual return. The hypothetical account values and expenses may not be used to estimate the actual ending account balance or expenses you paid for the period. You may use this information to compare the ongoing costs of investing in the Fund and other funds. To do so, compare this 5% hypothetical example with the 5% hypothetical examples that appear in the shareholder reports of the other funds.
Please note that the expenses shown in the table are meant to highlight your ongoing costs only and do not reflect any transactional costs, such as sales charges (loads) and contingent deferred sales charges. Therefore, the “Hypothetical” line of the table is useful in comparing ongoing costs only and will not help you determine the relative total costs of owning different funds. In addition, if these transactional costs were included, your costs would have been higher.
| | | | | | | | | | | | | | | | |
| | | Beginning
account value
8-1-2012 | | | Ending
account value
1-31-2013 | | | Expenses
paid during
the period1 | | | Net annual
expense ratio | |
Class A | | | | | | | | | | | | | | | | |
Actual | | $ | 1,000.00 | | | $ | 1,114.70 | | | $ | 5.86 | | | | 1.10 | % |
Hypothetical (5% return before expenses) | | $ | 1,000.00 | | | $ | 1,019.66 | | | $ | 5.60 | | | | 1.10 | % |
Class C | | | | | | | | | | | | | | | | |
Actual | | $ | 1,000.00 | | | $ | 1,110.30 | | | $ | 9.84 | | | | 1.85 | % |
Hypothetical (5% return before expenses) | | $ | 1,000.00 | | | $ | 1,015.88 | | | $ | 9.40 | | | | 1.85 | % |
Administrator Class | | | | | | | | | | | | | | | | |
Actual | | $ | 1,000.00 | | | $ | 1,115.90 | | | $ | 4.48 | | | | 0.84 | % |
Hypothetical (5% return before expenses) | | $ | 1,000.00 | | | $ | 1,020.97 | | | $ | 4.28 | | | | 0.84 | % |
Institutional Class | | | | | | | | | | | | | | | | |
Actual | | $ | 1,000.00 | | | $ | 1,118.83 | | | $ | 3.47 | | | | 0.65 | % |
Hypothetical (5% return before expenses) | | $ | 1,000.00 | | | $ | 1,021.93 | | | $ | 3.31 | | | | 0.65 | % |
Investor Class | | | | | | | | | | | | | | | | |
Actual | | $ | 1,000.00 | | | $ | 1,114.67 | | | $ | 6.24 | | | | 1.17 | % |
Hypothetical (5% return before expenses) | | $ | 1,000.00 | | | $ | 1,019.31 | | | $ | 5.96 | | | | 1.17 | % |
| 1. | Expenses paid is equal to the annualized expense ratio of each class multiplied by the average account value over the period, multiplied by the number of days in the most recent fiscal half-year divided by the number of days in the fiscal year (to reflect the one-half-year period). |
| | | | | | |
| Portfolio of investments—January 31, 2013 (unaudited) | | Wells Fargo Advantage Large Company Value Fund | | | 7 | |
| | | | | | | | | | | | |
| Security name | | | | | | Shares | | | Value | |
| | | | | | | | | | | | |
| | | | |
Common Stocks: 94.59% | | | | | | | | | | | | |
| | | | |
Consumer Discretionary: 8.46% | | | | | | | | | | | | |
| | | | |
| Household Durables: 2.82% | | | | | | | | | | | | |
Harman International Industries Incorporated | | | | | | | 61,982 | | | $ | 2,775,554 | |
Newell Rubbermaid Incorporated | | | | | | | 212,501 | | | | 4,989,523 | |
| | | | |
| | | | | | | | | | | 7,765,077 | |
| | | | | | | | | | | | |
| | | | |
| Media: 2.85% | | | | | | | | | | | | |
DIRECTV Group Incorporated † | | | | | | | 55,232 | | | | 2,824,564 | |
Omnicom Group Incorporated « | | | | | | | 34,170 | | | | 1,854,748 | |
Walt Disney Company | | | | | | | 58,725 | | | | 3,164,103 | |
| | | | |
| | | | | | | | | | | 7,843,415 | |
| | | | | | | | | | | | |
| | | | |
| Multiline Retail: 0.90% | | | | | | | | | | | | |
Target Corporation « | | | | | | | 41,246 | | | | 2,491,671 | |
| | | | | | | | | | | | |
| | | | |
| Specialty Retail: 1.89% | | | | | | | | | | | | |
Bed Bath & Beyond Incorporated † | | | | | | | 43,205 | | | | 2,536,134 | |
Home Depot Incorporated | | | | | | | 39,916 | | | | 2,671,179 | |
| | | | |
| | | | | | | | | | | 5,207,313 | |
| | | | | | | | | | | | |
| | | | | | | | | | | | |
| | | | |
Consumer Staples: 5.07% | | | | | | | | | | | | |
| | | | |
| Beverages: 1.43% | | | | | | | | | | | | |
PepsiCo Incorporated | | | | | | | 54,300 | | | | 3,955,755 | |
| | | | | | | | | | | | |
| | | | |
| Food & Staples Retailing: 2.19% | | | | | | | | | | | | |
CVS Caremark Corporation | | | | | | | 117,797 | | | | 6,031,206 | |
| | | | | | | | | | | | |
| | | | |
| Household Products: 1.45% | | | | | | | | | | | | |
Procter & Gamble Company | | | | | | | 53,155 | | | | 3,995,130 | |
| | | | | | | | | | | | |
| | | | |
Energy: 14.59% | | | | | | | | | | | | |
| | | | |
| Energy Equipment & Services: 1.33% | | | | | | | | | | | | |
Noble Corporation | | | | | | | 90,079 | | | | 3,648,200 | |
| | | | | | | | | | | | |
| | | | |
| Oil, Gas & Consumable Fuels: 13.26% | | | | | | | | | | | | |
Chevron Corporation | | | | | | | 114,658 | | | | 13,202,869 | |
ConocoPhillips Company | | | | | | | 60,115 | | | | 3,486,670 | |
Continental Resources Incorporated « † | | | | | | | 69,285 | | | | 5,758,969 | |
Denbury Resources Incorporated « † | | | | | | | 161,027 | | | | 2,999,933 | |
Noble Energy Incorporated | | | | | | | 24,904 | | | | 2,684,402 | |
Valero Energy Corporation | | | | | | | 63,682 | | | | 2,784,814 | |
Whiting Petroleum Corporation † | | | | | | | 118,062 | | | | 5,617,390 | |
| | | | |
| | | | | | | | | | | 36,535,047 | |
| | | | | | | | | | | | |
The accompanying notes are an integral part of these financial statements.
| | | | |
| 8 | | Wells Fargo Advantage Large Company Value Fund | | Portfolio of investments—January 31, 2013 (unaudited) |
| | | | | | | | | | | | |
| Security name | | | | | | Shares | | | Value | |
| | | | | | | | | | | | |
| | | | |
Financials: 26.20% | | | | | | | | | | | | |
| | | | |
| Capital Markets: 1.42% | | | | | | | | | | | | |
Goldman Sachs Group Incorporated | | | | | | | 26,499 | | | $ | 3,918,142 | |
| | | | | | | | | | | | |
| | | | |
| Commercial Banks: 5.52% | | | | | | | | | | | | |
Comerica Incorporated « | | | | | | | 141,268 | | | | 4,853,968 | |
First Republic Bank Corporation | | | | | | | 149,165 | | | | 5,323,699 | |
| | | | |
| Commercial Banks | | | | | | | | | | | | |
KeyCorp | | | | | | | 533,617 | | | | 5,016,000 | |
| | | | |
| | | | | | | | | | | 15,193,667 | |
| | | | | | | | | | | | |
| | | | |
| Consumer Finance: 2.34% | | | | | | | | | | | | |
Capital One Financial Corporation | | | | | | | 66,841 | | | | 3,764,485 | |
SLM Corporation | | | | | | | 158,987 | | | | 2,685,290 | |
| | | | |
| | | | | | | | | | | 6,449,775 | |
| | | | | | | | | | | | |
| | | | |
| Diversified Financial Services: 7.28% | | | | | | | | | | | | |
Bank of America Corporation | | | | | | | 482,825 | | | | 5,465,579 | |
Citigroup Incorporated | | | | | | | 165,317 | | | | 6,969,765 | |
JPMorgan Chase & Company | | | | | | | 161,766 | | | | 7,611,090 | |
| | | | |
| | | | | | | | | | | 20,046,434 | |
| | | | | | | | | | | | |
| | | | |
| Insurance: 6.23% | | | | | | | | | | | | |
American International Group Incorporated † | | | | | | | 144,153 | | | | 5,453,308 | |
MetLife Incorporated | | | | | | | 119,881 | | | | 4,476,357 | |
The Hartford Financial Services Group Incorporated « | | | | | | | 171,810 | | | | 4,260,888 | |
The Travelers Companies Incorporated | | | | | | | 38,011 | | | | 2,982,343 | |
| | | | |
| | | | | | | | | | | 17,172,896 | |
| | | | | | | | | | | | |
| | | | |
| REITs: 3.41% | | | | | | | | | | | | |
American Campus Communities Incorporated | | | | | | | 79,622 | | | | 3,707,997 | |
Simon Property Group Incorporated | | | | | | | 35,504 | | | | 5,687,031 | |
| | | | |
| | | | | | | | | | | 9,395,028 | |
| | | | | | | | | | | | |
| | | | |
Health Care: 12.13% | | | | | | | | | | | | |
| | | | |
| Health Care Equipment & Supplies: 2.01% | | | | | | | | | | | | |
Medtronic Incorporated | | | | | | | 61,266 | | | | 2,854,996 | |
Stryker Corporation « | | | | | | | 42,745 | | | | 2,677,974 | |
| | | | |
| | | | | | | | | | | 5,532,970 | |
| | | | | | | | | | | | |
| | | | |
| Health Care Providers & Services: 2.20% | | | | | | | | | | | | |
CIGNA Corporation | | | | | | | 103,736 | | | | 6,051,958 | |
| | | | | | | | | | | | |
| | | | |
| Pharmaceuticals: 7.92% | | | | | | | | | | | | |
Hospira Incorporated † | | | | | | | 107,192 | | | | 3,657,391 | |
Johnson & Johnson Services Incorporated | | | | | | | 80,444 | | | | 5,946,420 | |
Merck & Company Incorporated | | | | | | | 70,809 | | | | 3,062,489 | |
Pfizer Incorporated | | | | | | | 262,559 | | | | 7,162,610 | |
Teva Pharmaceutical Industries Limited ADR | | | | | | | 52,746 | | | | 2,003,821 | |
| | | | |
| | | | | | | | | | | 21,832,731 | |
| | | | | | | | | | | | |
The accompanying notes are an integral part of these financial statements.
| | | | | | |
| Portfolio of investments—January 31, 2013 (unaudited) | | Wells Fargo Advantage Large Company Value Fund | | | 9 | |
| | | | | | | | | | | | |
| Security name | | | | | | Shares | | | Value | |
| | | | | | | | | | | | |
| | | | |
Industrials: 8.71% | | | | | | | | | | | | |
| | | | |
| Aerospace & Defense: 0.97% | | | | | | | | | | | | |
Triumph Group Incorporated | | | | | | | 37,857 | | | $ | 2,663,997 | |
| | | | | | | | | | | | |
| | | | |
| Airlines: 1.22% | | | | | | | | | | | | |
Southwest Airlines Company | | | | | | | 300,818 | | | | 3,372,170 | |
| | | | | | | | | | | | |
| | | | |
| Construction & Engineering: 1.00% | | | | | | | | | | | | |
URS Corporation | | | | | | | 66,549 | | | | 2,760,453 | |
| | | | | | | | | | | | |
| | | | |
| Industrial Conglomerates: 2.79% | | | | | | | | | | | | |
General Electric Company | | | | | | | 345,008 | | | | 7,686,778 | |
| | | | | | | | | | | | |
| | | | |
| Machinery: 2.73% | | | | | | | | | | | | |
Dover Corporation | | | | | | | 46,868 | | | | 3,242,328 | |
Eaton Corporation | | | | | | | 75,047 | | | | 4,273,927 | |
| | | | |
| | | | | | | | | | | 7,516,255 | |
| | | | | | | | | | | | |
| | | | |
Information Technology: 7.31% | | | | | | | | | | | | |
| | | | |
| Communications Equipment: 1.76% | | | | | | | | | | | | |
Cisco Systems Incorporated | | | | | | | 235,136 | | | | 4,836,748 | |
| | | | | | | | | | | | |
| | | | |
| Computers & Peripherals: 0.51% | | | | | | | | | | | | |
Apple Incorporated | | | | | | | 3,093 | | | | 1,408,274 | |
| | | | | | | | | | | | |
| | | | |
| Internet Software & Services: 0.96% | | | | | | | | | | | | |
Google Incorporated Class A † | | | | | | | 3,519 | | | | 2,659,273 | |
| | | | | | | | | | | | |
| | | | |
| IT Services: 1.02% | | | | | | | | | | | | |
VeriFone Systems Incorporated « † | | | | | | | 81,089 | | | | 2,815,410 | |
| | | | | | | | | | | | |
| | | | |
| Semiconductors & Semiconductor Equipment: 1.50% | | | | | | | | | | | | |
Broadcom Corporation Class A | | | | | | | 61,590 | | | | 1,998,596 | |
Maxim Integrated Products Incorporated | | | | | | | 67,735 | | | | 2,130,266 | |
| | | | |
| | | | | | | | | | | 4,128,862 | |
| | | | | | | | | | | | |
| | | | |
| Software: 1.56% | | | | | | | | | | | | |
Symantec Corporation † | | | | | | | 197,299 | | | | 4,295,199 | |
| | | | | | | | | | | | |
| | | | |
Materials: 3.15% | | | | | | | | | | | | |
| | | | |
| Chemicals: 3.15% | | | | | | | | | | | | |
Ashland Incorporated | | | | | | | 52,737 | | | | 4,140,382 | |
Dow Chemical Company | | | | | | | 96,429 | | | | 3,105,014 | |
Westlake Chemical Corporation | | | | | | | 15,587 | | | | 1,431,822 | |
| | | | |
| | | | | | | | | | | 8,677,218 | |
| | | | | | | | | | | | |
| | | | |
Telecommunication Services: 2.60% | | | | | | | | | | | | |
| | | | |
| Diversified Telecommunication Services: 2.60% | | | | | | | | | | | | |
AT&T Incorporated | | | | | | | 79,825 | | | | 2,777,112 | |
Verizon Communications Incorporated | | | | | | | 100,390 | | | | 4,378,008 | |
| | | | |
| | | | | | | | | | | 7,155,120 | |
| | | | | | | | | | | | |
The accompanying notes are an integral part of these financial statements.
| | | | |
| 10 | | Wells Fargo Advantage Large Company Value Fund | | Portfolio of investments—January 31, 2013 (unaudited) |
| | | | | | | | | | | | | | |
| Security name | | | | | | | Shares | | | Value | |
| | | | | | | | | | | | | | |
| | | | |
Utilities: 6.37% | | | | | | | | | | | | | | |
| | | | |
| Electric Utilities: 2.23% | | | | | | | | | | | | | | |
Duke Energy Corporation « | | | | | | | | | 40,066 | | | $ | 2,754,137 | |
Entergy Corporation | | | | | | | | | 52,399 | | | | 3,384,975 | |
| | | | |
| | | | | | | | | | | | | 6,139,112 | |
| | | | | | | | | | | | | | |
| | | | |
| Multi-Utilities: 2.73% | | | | | | | | | | | | | | |
Dominion Resources Incorporated | | | | | | | | | 64,466 | | | | 3,488,255 | |
NiSource Incorporated | | | | | | | | | 149,900 | | | | 4,051,797 | |
| | | | |
| | | | | | | | | | | | | 7,540,052 | |
| | | | | | | | | | | | | | |
| | | | |
| Water Utilities: 1.41% | | | | | | | | | | | | | | |
American Water Works Company Incorporated | | | | | | | | | 101,341 | | | | 3,879,330 | |
| | | | |
Total Common Stocks (Cost $198,855,255) | | | | | | | | | | | | | 260,600,666 | |
| | | | | | | | | | | | | | |
| | | | |
| Other: 0.08% | | | | | | | | | | | | | | |
Gryphon Funding Limited, Pass-Through Entity (a)(i)(v) | | | | | | | | | 590,081 | | | | 200,628 | |
| | | | | | | | | | | | | | |
| | | | |
Total Other (Cost $48,088) | | | | | | | | | | | | | 200,628 | |
| | | | | | | | | | | | | | |
| | | | | Yield | | | | | | | |
| | | | |
Short-Term Investments: 11.32% | | | | | | | | | | | | | | |
| | | | |
| Investment Companies: 11.32% | | | | | | | | | | | | | | |
Wells Fargo Advantage Cash Investment Money Market Fund, Select Class (l)(u) | | | | | 0.14 | % | | | 12,112,531 | | | | 12,112,531 | |
Wells Fargo Securities Lending Cash Investments, LLC (v)(l)(u)(r) | | | | | 0.19 | | | | 19,081,287 | | | | 19,081,287 | |
| | | | |
Total Short-Term Investments (Cost $31,193,818) | | | | | | | | | | | | | 31,193,818 | |
| | | | | | | | | | | | | | |
| | | | | | | | |
Total investments in securities (Cost $230,097,161) * | | | 105.99 | % | | | 291,995,112 | |
Other assets and liabilities, net | | | (5.99 | ) | | | (16,497,395 | ) |
| | | | | | | | |
| Total net assets | | | 100.00 | % | | $ | 275,497,717 | |
| | | | | | | | |
| † | Non-income-earning security |
| « | All or a portion of this security is on loan. |
| (a) | Security is fair valued by the Management Valuation Team, and in certain instances by the Board of Trustees, in accordance with procedures approved by the Board of Trustees. |
| (v) | Security represents investment of cash collateral received from securities on loan. |
| (l) | Investment in an affiliate |
| (u) | Rate shown is the 7-day annualized yield at period end. |
| (r) | The investment company is exempt from registration under Section 3(c)(7) of the 1940 Act. |
| * | Cost for federal income tax purposes is $236,212,646 and unrealized appreciation (depreciation) consists of: |
| | | | |
Gross unrealized appreciation | | $ | 62,307,455 | |
Gross unrealized depreciation | | | (6,524,989 | ) |
| | | | |
Net unrealized appreciation | | $ | 55,782,466 | |
The accompanying notes are an integral part of these financial statements.
| | | | | | |
| Statements of assets and liabilities—January 31, 2013 (unaudited) | | Wells Fargo Advantage Large Company Value Fund | | | 11 | |
| | | | |
| | | | |
| |
Assets | | | | |
Investments | | | | |
In unaffiliated securities (including securities on loan), at value (see cost below) | | $ | 260,801,294 | |
In affiliated securities, at value (see cost below) | | | 31,193,818 | |
| | | | |
Total investments, at value (see cost below) | | | 291,995,112 | |
Receivable for investments sold | | | 15,712,283 | |
Receivable for Fund shares sold | | | 46,829 | |
Receivable for dividends | | | 251,379 | |
Receivable for securities lending income | | | 1,303 | |
Prepaid expenses and other assets | | | 32,702 | |
| | | | |
Total assets | | | 308,039,608 | |
| | | | |
| |
Liabilities | | | | |
Payable for investments purchased | | | 12,822,124 | |
Payable for Fund shares redeemed | | | 297,104 | |
Payable upon receipt of securities loaned | | | 19,129,375 | |
Advisory fee payable | | | 106,889 | |
Distribution fees payable | | | 2,692 | |
Due to other related parties | | | 73,319 | |
Accrued expenses and other liabilities | | | 110,388 | |
| | | | |
Total liabilities | | | 32,541,891 | |
| | | | |
Total net assets | | $ | 275,497,717 | |
| | | | |
| |
NET ASSETS CONSIST OF | | | | |
Paid-in capital | | $ | 251,355,010 | |
Undistributed net investment income | | | 17,251 | |
Accumulated net realized losses on investments | | | (37,772,495 | ) |
Net unrealized gains on investments | | | 61,897,951 | |
| | | | |
Total net assets | | $ | 275,497,717 | |
| | | | |
| |
COMPUTATION OF NET ASSET VALUE AND OFFERING PRICE PER SHARE1 | | | | |
Net assets – Class A | | $ | 106,844,682 | |
Shares outstanding – Class A | | | 7,475,902 | |
Net asset value per share – Class A | | | $14.29 | |
Maximum offering price per share – Class A2 | | | $15.16 | |
Net assets – Class C | | $ | 4,179,141 | |
Shares outstanding – Class C | | | 286,800 | |
Net asset value per share – Class C | | | $14.57 | |
Net assets – Administrator Class | | $ | 36,746,872 | |
Shares outstanding – Administrator Class | | | 2,558,322 | |
Net asset value per share – Administrator Class | | | $14.36 | |
Net assets – Institutional Class | | $ | 2,135,616 | |
Shares outstanding – Institutional Class | | | 148,925 | |
Net asset value per share – Institutional Class | | | $14.34 | |
Net assets – Investor Class | | $ | 125,591,406 | |
Shares outstanding – Investor Class | | | 8,584,651 | |
Net asset value per share – Investor Class | | | $14.63 | |
| |
Investment in unaffiliated securities (including securities on loan), at cost | | $ | 198,903,343 | |
| | | | |
Investments in affiliated securities, at cost | | $ | 31,193,818 | |
| | | | |
Total investments, at cost | | $ | 230,097,161 | |
| | | | |
Securities on loan, at value | | $ | 18,699,086 | |
| | | | |
| 1. | The Fund has an unlimited number of authorized shares. |
| 2. | Maximum offering price is computed as 100/94.25 of net asset value. On investments of $50,000 or more, the offering price is reduced. |
The accompanying notes are an integral part of these financial statements.
| | | | |
| 12 | | Wells Fargo Advantage Large Company Value Fund | | Statement of operations—six months ended January 31, 2013 (unaudited) |
| | | | |
| | | | |
| |
Investment income | | | | |
Dividends * | | $ | 3,956,015 | |
Securities lending income, net | | | 19,414 | |
Income from affiliated securities | | | 6,189 | |
| | | | |
Total investment income | | | 3,981,618 | |
| | | | |
| |
Expenses | | | | |
Advisory fee | | | 1,125,390 | |
Administration fees | | | | |
Fund level | | | 86,568 | |
Class A | | | 136,614 | |
Class C | | | 5,275 | |
Administrator Class | | | 53,842 | |
Institutional Class | | | 1,920 | |
Investor Class | | | 199,431 | |
Shareholder servicing fees | | | | |
Class A | | | 131,360 | |
Class C | | | 5,072 | |
Administrator Class | | | 133,574 | |
Investor Class | | | 155,144 | |
Distribution fees | | | | |
Class C | | | 15,217 | |
Custody and accounting fees | | | 9,510 | |
Professional fees | | | 15,535 | |
Registration fees | | | 35,032 | |
Shareholder report expenses | | | 30,737 | |
Trustees’ fees and expenses | | | 7,581 | |
Other fees and expenses | | | 4,964 | |
| | | | |
Total expenses | | | 2,152,766 | |
Less: Fee waivers and/or expense reimbursements | | | (339,804 | ) |
| | | | |
Net expenses | | | 1,812,962 | |
| | | | |
Net investment income | | | 2,168,656 | |
| | | | |
| |
REALIZED AND UNREALIZED GAINS (LOSSES) ON INVESTMENTS | | | | |
Net realized gains on investments | | | 26,974,592 | |
Net change in unrealized gains (losses) on investments | | | 5,847,829 | |
| | | | |
Net realized and unrealized gains (losses) on investments | | | 32,822,421 | |
| | | | |
Net increase in net assets resulting from operations | | $ | 34,991,077 | |
| | | | |
| |
* Net of foreign dividend withholding taxes in the amount of | | | $6,517 | |
The accompanying notes are an integral part of these financial statements.
| | | | | | |
| Statements of changes in net assets | | Wells Fargo Advantage Large Company Value Fund | | | 13 | |
| | | | | | | | | | | | | | | | |
| | | Six months ended January 31, 2013 (unaudited) | | | Year ended July 31, 2012 | |
| | | | |
Operations | | | | | | | | | | | | | | | | |
Net investment income | | | | | | $ | 2,168,656 | | | | | | | $ | 5,688,528 | |
Net realized gains on investments | | | | | | | 26,974,592 | | | | | | | | 12,693,847 | |
Net change in unrealized gains (losses) on investments | | | | | | | 5,847,829 | | | | | | | | 33,266,822 | |
| | | | |
Net increase in net assets resulting from operations | | | | | | | 34,991,077 | | | | | | | | 51,649,197 | |
| | | | |
| | | | |
Distributions to shareholders from | | | | | | | | | | | | | | | | |
Net investment income | | | | | | | | | | | | | | | | |
Class A | | | | | | | (1,066,333 | ) | | | | | | | (1,060,565 | ) |
Class C | | | | | | | (23,887 | ) | | | | | | | (14,917 | ) |
Administrator Class | | | | | | | (1,251,579 | ) | | | | | | | (2,212,931 | ) |
Institutional Class | | | | | | | (37,874 | ) | | | | | | | (307,291 | ) |
Investor Class | | | | | | | (1,185,374 | ) | | | | | | | (1,354,263 | ) |
| | | | |
Total distributions to shareholders | | | | | | | (3,565,047 | ) | | | | | | | (4,949,967 | ) |
| | | | |
| | | | |
| | | Shares | | | | | | | | Shares | | | | | |
| | | | |
Capital share transactions | | | | | | | | | | | | | | | | |
Proceeds from shares sold | | | | | | | | | | | | | | | | |
Class A | | | 64,927 | | | | 882,269 | | | | 152,985 | | | | 1,851,394 | |
Class C | | | 11,856 | | | | 163,170 | | | | 12,873 | | | | 159,190 | |
Administrator Class | | | 280,100 | | | | 3,736,295 | | | | 694,791 | | | | 8,599,183 | |
Institutional Class | | | 9,316 | | | | 126,393 | | | | 58,158 | | | | 690,316 | |
Investor Class | | | 222,939 | | | | 3,101,539 | | | | 659,614 | | | | 8,374,472 | |
| | | | |
| | | | | | | 8,009,666 | | | | | | | | 19,674,555 | |
| | | | |
Reinvestment of distributions | | | | | | | | | | | | | | | | |
Class A | | | 76,663 | | | | 1,038,048 | | | | 81,989 | | | | 1,022,599 | |
Class C | | | 1,499 | | | | 20,723 | | | | 974 | | | | 12,858 | |
Administrator Class | | | 87,235 | | | | 1,193,266 | | | | 162,960 | | | | 2,037,419 | |
Institutional Class | | | 2,267 | | | | 30,823 | | | | 24,912 | | | | 299,996 | |
Investor Class | | | 80,595 | | | | 1,117,303 | | | | 101,993 | | | | 1,275,600 | |
| | | | |
| | | | | | | 3,400,163 | | | | | | | | 4,648,472 | |
| | | | |
Payment for shares redeemed | | | | | | | | | | | | | | | | |
Class A | | | (629,393 | ) | | | (8,501,074 | ) | | | (1,429,586 | ) | | | (17,672,994 | ) |
Class C | | | (31,102 | ) | | | (428,635 | ) | | | (86,263 | ) | | | (1,062,163 | ) |
Administrator Class | | | (11,375,246 | ) | | | (152,941,485 | ) | | | (3,967,895 | ) | | | (49,042,196 | ) |
Institutional Class | | | (1,087,574 | ) | | | (14,464,834 | ) | | | (116,799 | ) | | | (1,475,505 | ) |
Investor Class | | | (1,052,818 | ) | | | (14,540,169 | ) | | | (1,614,250 | ) | | | (20,485,064 | ) |
| | | | |
| | | | | | | (190,876,197 | ) | | | | | | | (89,737,922 | ) |
| | | | |
Net asset value of shares issued in acquisition | | | | | | | | | | | | | | | | |
Class A | | | 0 | | | | 0 | | | | 9,107,380 | | | | 102,927,298 | |
Class C | | | 0 | | | | 0 | | | | 336,931 | | | | 3,882,391 | |
Administrator Class | | | 0 | | | | 0 | | | | 16,623,780 | | | | 188,701,817 | |
Institutional Class | | | 0 | | | | 0 | | | | 122,764 | | | | 1,391,319 | |
Investor Class | | | 0 | | | | 0 | | | | 1,606,771 | | | | 18,572,940 | |
| | | | |
| | | | | | | 0 | | | | | | | | 315,475,765 | |
| | | | |
Net increase (decrease) in net assets resulting from capital share transactions | | | | | | | (179,466,368 | ) | | | | | | | 250,060,870 | |
| | | | |
Total increase (decrease) in net assets | | | | | | | (148,040,338 | ) | | | | | | | 296,760,100 | |
| | | | |
| | | | |
Net assets | | | | | | | | | | | | | | | | |
Beginning of period | | | | | | | 423,538,055 | | | | | | | | 126,777,955 | |
| | | | | | | | |
End of period | | | | | | $ | 275,497,717 | | | | | | | $ | 423,538,055 | |
| | | | | | | | |
Undistributed net investment income | | | | | | $ | 17,251 | | | | | | | $ | 1,413,642 | |
| | | | | | | | |
The accompanying notes are an integral part of these financial statements.
| | | | |
| 14 | | Wells Fargo Advantage Large Company Value Fund | | Financial highlights |
(For a share outstanding throughout each period)
| | | | | | | | | | | | | | | | | | | | | | | | |
| | | Six months ended
January 31, 2013 (unaudited) | | | Year ended July 31 | |
| CLASS A | | | 2012 | | | 2011 | | | 2010 | | | 2009 | | | 20081 | |
Net asset value, beginning of period | | $ | 12.96 | | | $ | 12.61 | | | $ | 11.04 | | | $ | 9.84 | | | $ | 14.43 | | | $ | 14.92 | |
Net investment income | | | 0.08 | | | | 0.17 | | | | 0.12 | | | | 0.09 | | | | 0.17 | 2 | | | 0.08 | 2 |
Net realized and unrealized gains (losses) on investments | | | 1.39 | | | | 0.35 | | | | 1.51 | | | | 1.21 | | | | (3.39 | ) | | | (0.51 | ) |
| | | | | | | | | | | | | | | | | | | | | | | | |
Total from investment operations | | | 1.47 | | | | 0.52 | | | | 1.63 | | | | 1.30 | | | | (3.22 | ) | | | (0.43 | ) |
Distributions to shareholders from | | | | | | | | | | | | | | | | | | | | | | | | |
Net investment income | | | (0.14 | ) | | | (0.17 | ) | | | (0.06 | ) | | | (0.10 | ) | | | (0.24 | ) | | | (0.06 | ) |
Net realized gains | | | 0.00 | | | | 0.00 | | | | 0.00 | | | | 0.00 | | | | (1.13 | ) | | | 0.00 | |
| | | | | | | | | | | | | | | | | | | | | | | | |
Total distributions to shareholders | | | (0.14 | ) | | | (0.17 | ) | | | (0.06 | ) | | | (0.10 | ) | | | (1.37 | ) | | | (0.06 | ) |
Net asset value, end of period | | $ | 14.29 | | | $ | 12.96 | | | $ | 12.61 | | | $ | 11.04 | | | $ | 9.84 | | | $ | 14.43 | |
Total return3 | | | 11.47 | % | | | 4.21 | % | | | 14.77 | % | | | 13.22 | % | | | (21.52 | )% | | | (2.92 | )% |
Ratios to average net assets (annualized) | | | | | | | | | | | | | | | | | | | | | | | | |
Gross expenses | | | 1.28 | % | | | 1.27 | % | | | 1.32 | % | | | 1.42 | % | | | 1.52 | % | | | 1.37 | % |
Net expenses | | | 1.10 | % | | | 1.10 | % | | | 1.25 | % | | | 1.25 | % | | | 1.23 | % | | | 1.25 | % |
Net investment income | | | 1.23 | % | | | 1.29 | % | | | 0.74 | % | | | 0.74 | % | | | 1.85 | % | | | 1.55 | % |
Supplemental data | | | | | | | | | | | | | | | | | | | | | | | | |
Portfolio turnover rate | | | 37 | % | | | 37 | % | | | 35 | % | | | 42 | % | | | 61 | % | | | 71 | % |
Net assets, end of period (000s omitted) | | | $106,845 | | | | $103,195 | | | | $642 | | | | $362 | | | | $165 | | | | $14 | |
| 1. | For the period from March 31, 2008 (commencement of class operations) to July 31, 2008 |
| 2. | Calculated based upon average shares outstanding |
| 3. | Total return calculations do not include any sales charges. Returns for periods of less than one year are not annualized. |
The accompanying notes are an integral part of these financial statements.
| | | | | | |
| Financial highlights | | Wells Fargo Advantage Large Company Value Fund | | | 15 | |
(For a share outstanding throughout each period)
| | | | | | | | | | | | | | | | | | | | | | | | |
| | | Six months ended January 31, 2013 (unaudited) | | | Year ended July 31 | |
| CLASS C | | | 2012 | | | 2011 | | | 2010 | | | 2009 | | | 20081 | |
Net asset value, beginning of period | | $ | 13.21 | | | $ | 12.81 | | | $ | 11.26 | | | $ | 10.03 | | | $ | 14.66 | | | $ | 15.17 | |
Net investment income | | | 0.03 | | | | 0.09 | | | | 0.01 | | | | 0.03 | | | | 0.06 | 2 | | | 0.04 | 2 |
Net realized and unrealized gains (losses) on investments | | | 1.41 | | | | 0.36 | | | | 1.55 | | | | 1.22 | | | | (3.40 | ) | | | (0.52 | ) |
| | | | | | | | | | | | | | | | | | | | | | | | |
Total from investment operations | | | 1.44 | | | | 0.45 | | | | 1.56 | | | | 1.25 | | | | (3.34 | ) | | | (0.48 | ) |
Distributions to shareholders from | | | | | | | | | | | | | | | | | | | | | | | | |
Net investment income | | | (0.08 | ) | | | (0.05 | ) | | | (0.01 | ) | | | (0.02 | ) | | | (0.16 | ) | | | (0.03 | ) |
Net realized gains | | | 0.00 | | | | 0.00 | | | | 0.00 | | | | 0.00 | | | | (1.13 | ) | | | 0.00 | |
| | | | | | | | | | | | | | | | | | | | | | | | |
Total distributions to shareholders | | | (0.08 | ) | | | (0.05 | ) | | | (0.01 | ) | | | (0.02 | ) | | | (1.29 | ) | | | (0.03 | ) |
Net asset value, end of period | | $ | 14.57 | | | $ | 13.21 | | | $ | 12.81 | | | $ | 11.26 | | | $ | 10.03 | | | $ | 14.66 | |
Total return3 | | | 11.03 | % | | | 3.49 | % | | | 13.85 | % | | | 12.47 | % | | | (22.07 | )% | | | (3.17 | )% |
Ratios to average net assets (annualized) | | | | | | | | | | | | | | | | | | | | | | | | |
Gross expenses | | | 2.03 | % | | | 2.02 | % | | | 2.08 | % | | | 2.17 | % | | | 2.23 | % | | | 2.12 | % |
Net expenses | | | 1.85 | % | | | 1.85 | % | | | 2.00 | % | | | 2.00 | % | | | 1.97 | % | | | 2.00 | % |
Net investment income | | | 0.48 | % | | | 0.54 | % | | | 0.04 | % | | | 0.02 | % | | | 0.69 | % | | | 0.78 | % |
Supplemental data | | | | | | | | | | | | | | | | | | | | | | | | |
Portfolio turnover rate | | | 37 | % | | | 37 | % | | | 35 | % | | | 42 | % | | | 61 | % | | | 71 | % |
Net assets, end of period (000s omitted) | | | $4,179 | | | | $4,022 | | | | $513 | | | | $438 | | | | $274 | | | | $10 | |
| 1. | For the period from March 31, 2008 (commencement of class operations) to July 31, 2008 |
| 2. | Calculated based upon average shares outstanding |
| 3. | Total return calculations do not include any sales charges. Returns for periods of less than one year are not annualized. |
The accompanying notes are an integral part of these financial statements.
| | | | |
| 16 | | Wells Fargo Advantage Large Company Value Fund | | Financial highlights |
(For a share outstanding throughout each period)
| | | | | | | | | | | | | | | | | | | | | | | | |
| | | Six months ended
January 31, 2013 (unaudited) | | | Year ended July 31 | |
| ADMINISTRATOR CLASS | | | 2012 | | | 2011 | | | 2010 | | | 2009 | | | 2008 | |
Net asset value, beginning of period | | | $13.02 | | | | $12.68 | | | $ | 11.08 | | | | $9.87 | | | | $14.43 | | | | $17.09 | |
Net investment income | | | 0.09 | 1 | | | 0.19 | 1 | | | 0.11 | | | | 0.12 | 1 | | | 0.31 | 1 | | | 0.33 | 1 |
Net realized and unrealized gains (losses) on investments | | | 1.40 | | | | 0.36 | | | | 1.56 | | | | 1.22 | | | | (3.49 | ) | | | (1.46 | ) |
| | | | | | | | | | | | | | | | | | | | | | | | |
Total from investment operations | | | 1.49 | | | | 0.55 | | | | 1.67 | | | | 1.34 | | | | (3.18 | ) | | | (1.13 | ) |
Distributions to shareholders from | | | | | | | | | | | | | | | | | | | | | | | | |
Net investment income | | | (0.15 | ) | | | (0.21 | ) | | | (0.07 | ) | | | (0.13 | ) | | | (0.25 | ) | | | (0.34 | ) |
Net realized gains | | | 0.00 | | | | 0.00 | | | | 0.00 | | | | 0.00 | | | | (1.13 | ) | | | (1.19 | ) |
| | | | | | | | | | | | | | | | | | | | | | | | |
Total distributions to shareholders | | | (0.15 | ) | | | (0.21 | ) | | | (0.07 | ) | | | (0.13 | ) | | | (1.38 | ) | | | (1.53 | ) |
Net asset value, end of period | | $ | 14.36 | | | $ | 13.02 | | | $ | 12.68 | | | $ | 11.08 | | | $ | 9.87 | | | $ | 14.43 | |
Total return2 | | | 11.59 | % | | | 4.47 | % | | | 15.12 | % | | | 13.53 | % | | | (21.20 | )% | | | (7.48 | )% |
Ratios to average net assets (annualized) | | | | | | | | | | | | | | | | | | | | | | | | |
Gross expenses | | | 1.09 | % | | | 1.11 | % | | | 1.17 | % | | | 1.24 | % | | | 1.30 | % | | | 1.21 | % |
Net expenses | | | 0.84 | % | | | 0.85 | % | | | 0.96 | % | | | 0.96 | % | | | 0.95 | % | | | 0.96 | % |
Net investment income | | | 1.37 | % | | | 1.54 | % | | | 1.93 | % | | | 1.12 | % | | | 2.56 | % | | | 2.05 | % |
Supplemental data | | | | | | | | | | | | | | | | | | | | | | | | |
Portfolio turnover rate | | | 37 | % | | | 37 | % | | | 35 | % | | | 42 | % | | | 61 | % | | | 71 | % |
Net assets, end of period (000s omitted) | | | $36,747 | | | | $176,623 | | | | $667 | | | | $289 | | | | $185 | | | | $2,405 | |
| 1. | Calculated based upon average shares outstanding |
| 2. | Returns for periods of less than one year are not annualized. |
The accompanying notes are an integral part of these financial statements.
| | | | | | |
| Financial highlights | | Wells Fargo Advantage Large Company Value Fund | | | 17 | |
(For a share outstanding throughout each period)
| | | | | | | | | | | | | | | | | | | | | | | | |
| | | Six months ended
January 31, 2013 (unaudited) | | | Year ended July 31 | |
| INSTITUTIONAL CLASS | | | 2012 | | | 2011 | | | 2010 | | | 2009 | | | 20081 | |
Net asset value, beginning of period | | $ | 13.00 | | | $ | 12.68 | | | $ | 11.08 | | | $ | 9.86 | | | $ | 14.43 | | | $ | 14.92 | |
Net investment income | | | 0.14 | 2 | | | 0.22 | | | | 0.14 | | | | 0.14 | | | | 0.26 | 2 | | | 0.10 | 2 |
Net realized and unrealized gains (losses) on investments | | | 1.38 | | | | 0.35 | | | | 1.54 | | | | 1.23 | | | | (3.42 | ) | | | (0.52 | ) |
| | | | | | | | | | | | | | | | | | | | | | | | |
Total from investment operations | | | 1.52 | | | | 0.57 | | | | 1.68 | | | | 1.37 | | | | (3.16 | ) | | | (0.42 | )�� |
Distributions to shareholders from | | | | | | | | | | | | | | | | | | | | | | | | |
Net investment income | | | (0.18 | ) | | | (0.25 | ) | | | (0.08 | ) | | | (0.15 | ) | | | (0.28 | ) | | | (0.07 | ) |
Net realized gains | | | 0.00 | | | | 0.00 | | | | 0.00 | | | | 0.00 | | | | (1.13 | ) | | | 0.00 | |
| | | | | | | | | | | | | | | | | | | | | | | | |
Total distributions to shareholders | | | (0.18 | ) | | | (0.25 | ) | | | (0.08 | ) | | | (0.15 | ) | | | (1.41 | ) | | | (0.07 | ) |
Net asset value, end of period | | $ | 14.34 | | | $ | 13.00 | | | $ | 12.68 | | | $ | 11.08 | | | $ | 9.86 | | | $ | 14.43 | |
Total return3 | | | 11.88 | % | | | 4.67 | % | | | 15.36 | % | | | 13.76 | % | | | (21.07 | )% | | | (2.82 | )% |
Ratios to average net assets (annualized) | | | | | | | | | | | | | | | | | | | | | | | | |
Gross expenses | | | 0.84 | % | | | 0.85 | % | | | 0.89 | % | | | 0.96 | % | | | 1.06 | % | | | 0.91 | % |
Net expenses | | | 0.65 | % | | | 0.66 | % | | | 0.75 | % | | | 0.75 | % | | | 0.75 | % | | | 0.75 | % |
Net investment income | | | 2.09 | % | | | 1.80 | % | | | 1.12 | % | | | 1.28 | % | | | 2.64 | % | | | 2.02 | % |
Supplemental data | | | | | | | | | | | | | | | | | | | | | | | | |
Portfolio turnover rate | | | 37 | % | | | 37 | % | | | 35 | % | | | 42 | % | | | 61 | % | | | 71 | % |
Net assets, end of period (000s omitted) | | | $2,136 | | | | $15,924 | | | | $14,401 | | | | $9 | | | | $8 | | | | $10 | |
| 1. | For the period from March 31, 2008 (commencement of class operations) to July 31, 2008 |
| 2. | Calculated based upon average shares outstanding |
| 3. | Returns for periods of less than one year are not annualized. |
The accompanying notes are an integral part of these financial statements.
| | | | |
| 18 | | Wells Fargo Advantage Large Company Value Fund | | Financial highlights |
(For a share outstanding throughout each period)
| | | | | | | | | | | | | | | | | | | | | | | | |
| | | Six months ended
January 31, 2013 (unaudited) | | | Year ended July 31 | |
| INVESTOR CLASS | | | 2012 | | | 2011 | | | 2010 | | | 2009 | | | 2008 | |
Net asset value, beginning of period | | $ | 13.26 | | | $ | 12.89 | | | $ | 11.28 | | | $ | 10.05 | | | $ | 14.67 | | | $ | 17.35 | |
Net investment income | | | 0.08 | | | | 0.16 | | | | 0.09 | | | | 0.08 | | | | 0.21 | 1 | | | 0.28 | 1 |
Net realized and unrealized gains (losses) on investments | | | 1.42 | | | | 0.36 | | | | 1.57 | | | | 1.23 | | | | (3.48 | ) | | | (1.50 | ) |
| | | | | | | | | | | | | | | | | | | | | | | | |
Total from investment operations | | | 1.50 | | | | 0.52 | | | | 1.66 | | | | 1.31 | | | | (3.27 | ) | | | (1.22 | ) |
Distributions to shareholders from | | | | | | | | | | | | | | | | | | | | | | | | |
Net investment income | | | (0.13 | ) | | | (0.15 | ) | | | (0.05 | ) | | | (0.08 | ) | | | (0.22 | ) | | | (0.27 | ) |
Net realized gains | | | 0.00 | | | | 0.00 | | | | 0.00 | | | | 0.00 | | | | (1.13 | ) | | | (1.19 | ) |
| | | | | | | | | | | | | | | | | | | | | | | | |
Total distributions to shareholders | | | (0.13 | ) | | | (0.15 | ) | | | (0.05 | ) | | | (0.08 | ) | | | (1.35 | ) | | | (1.46 | ) |
Net asset value, end of period | | $ | 14.63 | | | $ | 13.26 | | | $ | 12.89 | | | $ | 11.28 | | | $ | 10.05 | | | $ | 14.67 | |
Total return2 | | | 11.47 | % | | | 4.09 | % | | | 14.75 | % | | | 13.06 | % | | | (21.53 | )% | | | (7.84 | )% |
Ratios to average net assets (annualized) | | | | | | | | | | | | | | | | | | | | | | | | |
Gross expenses | | | 1.34 | % | | | 1.34 | % | | | 1.40 | % | | | 1.52 | % | | | 1.63 | % | | | 1.52 | % |
Net expenses | | | 1.17 | % | | | 1.18 | % | | | 1.32 | % | | | 1.35 | % | | | 1.35 | % | | | 1.37 | % |
Net investment income | | | 1.16 | % | | | 1.27 | % | | | 0.74 | % | | | 0.70 | % | | | 2.05 | % | | | 1.71 | % |
Supplemental data | | | | | | | | | | | | | | | | | | | | | | | | |
Portfolio turnover rate | | | 37 | % | | | 37 | % | | | 35 | % | | | 42 | % | | | 61 | % | | | 71 | % |
Net assets, end of period (000s omitted) | | | $125,591 | | | | $123,774 | | | | $110,554 | | | | $108,703 | | | | $106,931 | | | | $151,546 | |
| 1. | Calculated based upon average shares outstanding |
| 2. | Returns for periods of less than one year are not annualized. |
The accompanying notes are an integral part of these financial statements.
| | | | | | |
| Notes to financial statements (unaudited) | | Wells Fargo Advantage Large Company Value Fund | | | 19 | |
1. ORGANIZATION
Wells Fargo Funds Trust (the “Trust”), a Delaware statutory trust organized on March 10, 1999, is an open-end management investment company registered under the Investment Company Act of 1940, as amended (the “1940 Act”). These financial statements report on Wells Fargo Advantage Large Company Value Fund (the “Fund”) which is a diversified series of the Trust.
2. SIGNIFICANT ACCOUNTING POLICIES
The following significant accounting policies, which are consistently followed in the preparation of the financial statements of the Fund, are in conformity with U.S. generally accepted accounting principles which require management to make estimates and assumptions that affect the reported amounts of assets and liabilities, disclosure of contingent assets and liabilities at the date of the financial statements, and the reported amounts of revenues and expenses during the reporting period. Actual results could differ from those estimates.
Securities valuation
All investments are valued each business day as of the close of regular trading on the New York Stock Exchange (normally 4 p.m. Eastern Time).
Equity securities that are listed on a foreign or domestic exchange, except for The Nasdaq Stock Market, Inc. (“Nasdaq”), are valued at the official closing price or, if none, the last sales price. Securities listed on Nasdaq are valued at the Nasdaq Official Closing Price (“NOCP”). If no NOCP is available, securities are valued at the last sales price. If no sales price is shown on the Nasdaq, the bid price will be used. If no sale occurs on the primary exchange or market for the security that day or if no sale occurs and no bid price is shown on Nasdaq, the prior day’s price will be deemed “stale” and fair values will be determined in accordance with the Fund’s Valuation Procedures.
Investments in registered open-end investment companies are valued at net asset value. Non-registered investment companies are fair valued at net asset value.
Investments which are not valued using any of the methods discussed above are valued at their fair value, as determined by procedures established in good faith and approved by the Board of Trustees. The Board of Trustees has established a Valuation Committee comprised of the Trustees and has delegated to it the authority to take any actions regarding the valuation of portfolio securities that the Valuation Committee deems necessary or appropriate, including determining the fair value of portfolio securities, unless the determination has been delegated to the Management Valuation Team of Wells Fargo Funds Management , LLC (“Funds Management”). The Board of Trustees retains the authority to make or ratify any valuation decisions or approve any changes to the Valuation Procedures as it deems appropriate. On a quarterly basis, the Board of Trustees receives reports on any valuation actions taken by the Valuation Committee or the Management Valuation Team which may include items for ratification.
Valuations of fair valued securities are compared to the next actual sales price when available, or other appropriate market information to assess the continued appropriateness of the fair valuation methodology used. These securities are fair valued on a day-to-day basis, taking into consideration changes to appropriate market information and any significant changes to the input factors considered in the valuation process until there is a readily available price provided on the exchange or by an independent pricing service. Valuations received from an independent pricing service or broker quotes are periodically validated by comparisons to most recent trades and valuations provided by other independent pricing services in addition to the review of prices by the adviser and/or subadviser. Unobservable inputs used in determining fair valuations are identified based on the type of security, taking into consideration factors utilized by market participants in valuing the investment, knowledge about the issuer and the current market environment.
Security loans
The Fund may lend its securities from time to time in order to earn additional income in the form of fees or interest on securities received as collateral or the investment of any cash received as collateral. The Fund continues to receive interest or dividends on the securities loaned. The Fund receives collateral in the form of cash or securities with a value at least equal to the value of the securities on loan. The value of the loaned securities is determined at the close of each business day and any additional required collateral is delivered to the Fund on the next business day. In a securities lending transaction, the net asset value of the Fund will be affected by an increase or decrease in the value of the securities loaned and by an increase or decrease in the value of the instrument in which collateral is invested. The amount of securities lending activity undertaken by the Fund fluctuates from time to time. In the event of default or bankruptcy by the borrower, the Fund may be prevented from recovering the loaned securities or gaining access to the collateral or may experience delays or costs in doing so. In addition, the investment of any cash collateral received may lose all or part of its value. The Fund has the right under the lending agreement to recover the securities from the borrower on demand.
| | | | |
| 20 | | Wells Fargo Advantage Large Company Value Fund | | Notes to financial statements (unaudited) |
The Fund lends its securities through an unaffiliated securities lending agent. Cash collateral received in connection with its securities lending transactions is invested in Wells Fargo Securities Lending Cash Investments, LLC (the “Cash Collateral Fund”). The Cash Collateral Fund is exempt from registration under Section 3(c)(7) of the 1940 Act and is managed by Funds Management and is subadvised by Wells Capital Management Incorporated (“WellsCap”). Funds Management receives an advisory fee starting at 0.05% and declining to 0.01% as the average daily net assets of the Cash Collateral Fund increase. All of the fees received by Funds Management are paid to WellsCap for its services as subadviser. The Cash Collateral Fund seeks to provide a positive return compared to the daily Fed Funds Open rate by investing in high-quality, U.S. dollar-denominated short-term money market instruments. Cash Collateral Fund investments are fair valued based upon the amortized cost valuation technique. Income earned from investment in the Cash Collateral Fund is included in securities lending income on the Statement of Operations.
Security transactions and income recognition
Securities transactions are recorded on a trade date basis. Realized gains or losses are recorded on the basis of identified cost.
Dividend income is recognized on the ex-dividend date. Dividend income is recorded net of foreign taxes withheld where recovery of such taxes is not assured.
Distributions to shareholders
Distributions to shareholders from net investment income and net realized gains, if any, are recorded on the ex-dividend date. Such distributions are determined in conformity with federal income tax regulations, which may differ in amount or character from net investment income and realized gains recognized for purposes of U.S. generally accepted accounting principles.
Federal and other taxes
The Fund intends to continue to qualify as a regulated investment company by distributing substantially all of its investment company taxable income and any net realized capital gains (after reduction for capital loss carryforwards) sufficient to relieve it from all, or substantially all, federal income taxes. Accordingly, no provision for federal income taxes was required.
The Fund’s income and federal excise tax returns and all financial records supporting those returns for the prior three fiscal years are subject to examination by the federal and Delaware revenue authorities. Management has analyzed the Fund’s tax positions taken on federal, state, and foreign tax returns for all open tax years and does not believe that there are any uncertain tax positions that require recognition of a tax liability.
At July 31, 2012, net capital loss carryforwards, which were available to offset future net realized capital gains, were as follows:
| | | | | | |
Pre-enactment capital loss expiration* |
| 2015 | | 2016 | | 2017 | | 2018 |
| $2,601,565 | | $34,195,378 | | $10,926,738 | | $10,046,072 |
| * | Losses incurred in taxable years beginning before December 22, 2010. |
Class allocations
The separate classes of shares offered by the Fund differ principally in applicable sales charges, distribution, shareholder servicing, and administration fees. Shareholders of each class bear certain expenses that pertain to that particular class. All shareholders bear the common expenses of the Fund, earn income from the portfolio, and are allocated any unrealized gains and losses pro rata based on the average daily net assets of each class, without distinction between share classes. Dividends are determined separately for each class based on income and expenses allocable to each class. Realized gains and losses are allocated to each class pro rata based upon the net assets of each class on the date realized. Differences in per share dividend rates generally result from the relative weightings of pro rata income and realized gain allocations and from differences in separate class expenses, including distribution, shareholder servicing, and administration fees.
3. FAIR VALUATION MEASUREMENTS
Fair value measurements of investments are determined within a framework that has established a fair value hierarchy based upon the various data inputs utilized in determining the value of the Fund’s investments. The three-level hierarchy gives the highest priority to unadjusted quoted prices in active markets for identical assets or liabilities (Level 1) and the lowest priority to significant unobservable inputs (Level 3). The Fund’s investments are classified within the fair value
| | | | | | |
| Notes to financial statements (unaudited) | | Wells Fargo Advantage Large Company Value Fund | | | 21 | |
hierarchy based on the lowest level of input that is significant to the fair value measurement. The inputs are summarized into three broad levels as follows:
| n | | Level 1 – quoted prices in active markets for identical securities |
| n | | Level 2 – other significant observable inputs (including quoted prices for similar securities, interest rates, prepayment speeds, credit risk, use of amortized cost, etc.) |
| n | | Level 3 – significant unobservable inputs (including the Fund’s own assumptions in determining the fair value of investments) |
The inputs or methodologies used for valuing investments in securities are not necessarily an indication of the risk associated with investing in those securities.
As of January 31, 2013, the inputs used in valuing investments in securities, which are carried at fair value, were as follows:
| | | | | | | | | | | | | | | | |
| Investments in securities | | Quoted prices (Level 1) | | | Significant other
observable inputs (Level 2) | | | Significant unobservable inputs (Level 3) | | | Total | |
Equity securities | | | | | | | | | | | | | | | | |
Common stocks | | $ | 260,600,666 | | | $ | 0 | | | $ | 0 | | | $ | 260,600,666 | |
Other | | | 0 | | | | 0 | | | | 200,628 | | | | 200,628 | |
Short-term investments | | | | | | | | | | | | | | | | |
Investment companies | | | 12,112,531 | | | | 19,081,287 | | | | 0 | | | | 31,193,818 | |
| | | $ | 272,713,197 | | | $ | 19,081,287 | | | $ | 200,628 | | | $ | 291,995,112 | |
Further details on the major security types listed above can be found in the Portfolio of Investments.
Transfers in and transfers out are recognized at the end of the reporting period. For the six months ended January 31, 2013, the Fund did not have any transfers into/out of Level 1 or Level 2.
4. TRANSACTIONS WITH AFFILIATES AND OTHER EXPENSES
Advisory fee
The Trust has entered into an advisory contract with Funds Management, an indirect wholly owned subsidiary of Wells Fargo & Company (“Wells Fargo”). The adviser is responsible for implementing investment policies and guidelines and for supervising the subadviser, who is responsible for day-to-day portfolio management of the Fund.
Pursuant to the contract, Funds Management is entitled to receive an annual advisory fee starting at 0.65% and declining to 0.55% as the average daily net assets of the Fund increase. For the six months ended January 31, 2013, the advisory fee was equivalent to an annual rate of 0.65% of the Fund’s average daily net assets.
Funds Management has retained the services of a subadviser to provide daily portfolio management to the Fund. The fee for subadvisory services is borne by Funds Management. Phocas Financial Corporation is the subadviser to the Fund and is entitled to receive a fee from Funds Management at an annual rate starting at 0.29% and declining to 0.20% as the average daily net assets of the Fund increase.
Administration and transfer agent fees
The Trust has entered into an administration agreement with Funds Management. Under this agreement, for providing administrative services, which includes paying fees and expenses for services provided by the transfer agent, sub-transfer agents, omnibus account servicers and record-keepers, Funds Management is entitled to receive from the Fund an annual fund level administration fee starting at 0.05% and declining to 0.03% as the average daily net assets of the Fund increase and a class level administration fee which is calculated based on the average daily net assets of each class as follows:
| | | | |
| | | Class level
administration fee | |
Class A, Class C | | | 0.26 | % |
Administrator Class | | | 0.10 | |
Institutional Class | | | 0.08 | |
Investor Class | | | 0.32 | |
| | | | |
| 22 | | Wells Fargo Advantage Large Company Value Fund | | Notes to financial statements (unaudited) |
Funds Management has contractually waived and/or reimbursed advisory and administration fees to the extent necessary to maintain certain net operating expense ratios for the Fund. Waiver of fees and/or reimbursement of expenses by Funds Management were made first from fund level expenses on a proportionate basis and then from class specific expenses. Funds Management has committed through November 30, 2013 to waive fees and/or reimburse expenses to the extent necessary to cap the Fund’s expenses at 1.10% for Class A shares, 1.85%, for Class C shares, 0.85% for Administrator Class shares, 0.65% for Institutional Class shares and 1.16% for Investor Class shares.
Distribution fees
The Trust has adopted a Distribution Plan for Class C shares of the Fund pursuant to Rule 12b-1 under the 1940 Act. Distribution fees are charged to Class C shares and paid to Wells Fargo Funds Distributor, LLC, the principal underwriter, at an annual rate of 0.75% of the average daily net assets of Class C shares.
For the six months ended January 31, 2013, Wells Fargo Funds Distributor, LLC received $1,516 from the sale of Class A shares.
Shareholder servicing fees
The Trust has entered into contracts with one or more shareholder servicing agents, whereby Class A, Class C, Administrator Class and Investor Class of the Fund is charged a fee at an annual rate of 0.25% of the average daily net assets of each respective class.
A portion of these total shareholder servicing fees were paid to affiliates of Wells Fargo.
5. INVESTMENT PORTFOLIO TRANSACTIONS
Purchases and sales of investments, excluding U.S. government obligations (if any) and short-term securities, for the six months ended January 31, 2013 were $119,166,827 and $300,068,122, respectively.
6. ACQUISITION
After the close of business on August 26, 2011, the Fund acquired the net assets of Wells Fargo Advantage Disciplined Value Fund. The purpose of the transaction was to combine two funds with similar investment objective and strategies. Shareholders holding Class A, Class C, Administrator Class, Institutional Class and Investor Class shares of Wells Fargo Advantage Disciplined Value Fund received Class A, Class C, Administrator Class, Institutional Class and Investor Class shares, respectively, of the Fund in the reorganization. The acquisition was accomplished by a tax-free exchange of all the shares of Wells Fargo Advantage Disciplined Value Fund for 27,797,626 shares of the Fund valued at $315,475,765 at an exchange ratio of 1.00, 0.97, 0.99, 0.99 and 0.97 for Class A, Class C, Administrator Class, Institutional Class and Investor Class, respectively. The investment portfolio of Wells Fargo Advantage Disciplined Value Fund with a fair value of $314,485,997, indentified cost of $307,903,347 and unrealized appreciation of $6,582,650 at August 26, 2011 were the principal assets acquired by the Fund. The aggregated net assets of Wells Fargo Advantage Disciplined Value Fund and the Fund immediately prior to the acquisition were $315,475,765 and $113,518,809, respectively. The aggregate net assets of the Fund immediately after the acquisition were $428,994,574. For financial reporting purposes, assets received and shares issued by the Fund were recorded at fair value; however, the cost basis of the investments received from Wells Fargo Advantage Disciplined Value Fund was carried forward to align ongoing reporting of the Fund’s realized and unrealized gains and losses with amounts distributable to shareholders for tax purpose.
Assuming the acquisition had been completed August 1, 2011, the beginning of the annual reporting period for the Fund, the pro forma results of operations for the year ended July 31, 2012 would have been:
| | | | |
Net investment income | | $ | 6,438,052 | |
Net realized and unrealized gains (losses) on investments | | $ | 22,725,944 | |
Net increase in net assets resulting form operations | | $ | 29,163,996 | |
7. CAPITAL SHARES
As a result of the transfer of assets from Funds Management, former program manager of the 529 college savings plans for the State of Wisconsin, to a new program manager, the Fund redeemed assets from its Administrator Class on October 26, 2012 with a value of $124,903,675 representing 31.1% of the Fund. This amount is reflected in the Statement of Changes in Net Assets for the six months ended January 31, 2013.
| | | | | | |
| Notes to financial statements (unaudited) | | Wells Fargo Advantage Large Company Value Fund | | | 23 | |
8. BANK BORROWINGS
The Trust (excluding the money market funds and certain other funds in the Trust) and Wells Fargo Variable Trust are parties to a $150,000,000 revolving credit agreement with State Street Bank and Trust Company, whereby the Fund is permitted to use bank borrowings for temporary or emergency purposes, such as to fund shareholder redemption requests. Interest under the credit agreement is charged to the Fund based on a borrowing rate equal to the higher of the Federal Funds rate in effect on that day plus 1.25% or the overnight LIBOR rate in effect on that day plus 1.25%. In addition, an annual commitment fee equal to 0.10% of the unused balance is allocated to each participating fund. For the six months ended January 31, 2013, the Fund paid $183 in commitment fees.
For the six months ended January 31, 2013, there were no borrowings by the Fund under the agreement.
9. INDEMNIFICATION
Under the Trust’s organizational documents, the officers and directors are indemnified against certain liabilities that may arise out of performance of their duties to the Trust. Additionally, in the normal course of business, the Trust may enter into contracts with service providers that contain a variety of indemnification clauses. The Trust’s maximum exposure under these arrangements is dependent on future claims that may be made against the Fund and, therefore, cannot be estimated.
10. NEW ACCOUNTING PRONOUNCEMENT
In December 2011, the Financial Accounting Standards Board (“FASB”) issued Accounting Standard Update (“ASU”) No. 2011-11, Disclosures about Offsetting Assets and Liabilities. ASU 2011-11, which amends FASB ASC Topic 210, Balance Sheet, creates new disclosure requirements which require entities to disclose both gross and net information for derivatives and other financial instruments that are either offset in the Statement of Assets and Liabilities or subject to an enforceable master netting arrangement or similar agreement. The disclosure requirements are effective for interim and annual reporting periods beginning on or after January 1, 2013. Management is currently assessing the potential impact, in addition to expanded financial statement disclosure, that may result from adopting this ASU.
| | | | |
| 24 | | Wells Fargo Advantage Large Company Value Fund | | Other information (unaudited) |
PROXY VOTING INFORMATION
A description of the policies and procedures that the Fund uses to determine how to vote proxies relating to portfolio securities is available without charge, upon request, by calling 1-800-222-8222, visiting our website at wellsfargoadvantagefunds.com, or visiting the SEC website at sec.gov. Information regarding how the Fund voted proxies relating to portfolio securities during the most recent 12-month period ended June 30 is available without charge on the Fund’s website at wellsfargoadvantagefunds.com or by visiting the SEC website at sec.gov.
PORTFOLIO HOLDINGS INFORMATION
The complete portfolio holdings for the Fund are publicly available on the Fund’s website (wellsfargoadvantagefunds.com) on a monthly, 30-day or more delayed basis. In addition, top ten holdings information for the Fund is publicly available on the Fund’s website on a monthly, seven-day or more delayed basis. The Fund files its complete schedule of portfolio holdings with the SEC for the first and third quarters of each fiscal year on Form N-Q, which is available without charge by visiting the SEC website at sec.gov. In addition, the Fund’s Form N-Q may be reviewed and copied at the SEC’s Public Reference Room in Washington, DC, and at regional offices in New York City, at 233 Broadway, and in Chicago, at 175 West Jackson Boulevard, Suite 900. Information about the Public Reference Room may be obtained by calling 1-800-SEC-0330.
| | | | | | |
| Other information (unaudited) | | Wells Fargo Advantage Large Company Value Fund | | | 25 | |
BOARD OF TRUSTEES AND OFFICERS
Each of the Trustees and Officers listed in the table below acts in identical capacities for the Wells Fargo Advantage family of funds, which consists of 136 funds1 comprising the Wells Fargo Funds Trust, Wells Fargo Variable Trust, Wells Fargo Master Trust and four closed-end funds (collectively the “Fund Complex”). This table should be read in conjunction with the Prospectus and the Statement of Additional Information2. All of the Trustees are also Members of the Audit and Governance Committees of each Trust in the Fund Complex. The mailing address of each Trustee and Officer is 525 Market Street, 12th Floor, San Francisco, CA 94105. Each Trustee and Officer serves an indefinite term, however, each Trustee serves such term until reaching the mandatory retirement age established by the Trustees.
Independent Trustees
| | | | | | |
Name and year of birth | | Position held and length of service* | | Principal occupations during past five years | | Other directorships during
past five years |
Peter G. Gordon
(Born 1942) | | Trustee, since 1998; Chairman, since 2005 | | Co-Founder, Retired Chairman, President and CEO of Crystal Geyser Water Company. Trustee Emeritus, Colby College. | | Asset Allocation Trust |
Isaiah Harris, Jr.
(Born 1952) | | Trustee, since 2009 | | Retired. Prior thereto, President and CEO of BellSouth Advertising and Publishing Corp. from 2005 to 2007, President and CEO of BellSouth Enterprises from 2004 to 2005 and President of BellSouth Consumer Services from 2000 to 2003. Emeritus member of the Iowa State University Foundation Board of Governors. Emeritus Member of the Advisory Board of Iowa State University School of Business. Advisory Board Member, Palm Coast Academy (charter school). Mr. Harris is a certified public accountant. | | CIGNA Corporation; Deluxe Corporation; Asset Allocation Trust |
Judith M. Johnson
(Born 1949) | | Trustee, since 2008; Audit Committee Chairman, since 2008 | | Retired. Prior thereto, Chief Executive Officer and Chief Investment Officer of Minneapolis Employees Retirement Fund from 1996 to 2008. Ms. Johnson is an attorney, certified public accountant and a certified managerial accountant. | | Asset Allocation Trust |
Leroy Keith, Jr.
(Born 1939) | | Trustee, since 2010 | | Chairman, Bloc Global Services (development and construction). Trustee of the Evergreen Funds from 1983 to 2010. Former Managing Director, Almanac Capital Management (commodities firm), former Partner, Stonington Partners, Inc. (private equity fund), former Director, Obagi Medical Products Co. and former Director, Lincoln Educational Services. | | Trustee, Virtus Fund Complex (consisting of 48 portfolios as of 1/31/2013); Asset Allocation Trust |
David F. Larcker
(Born 1950) | | Trustee, since 2009 | | James Irvin Miller Professor of Accounting at the Graduate School of Business, Stanford University, Morgan Stanley Director of the Center for Leadership Development and Research and Senior Faculty of The Rock Center for Corporate Governance since 2006. From 2005 to 2008, Professor of Accounting at the Graduate School of Business, Stanford University. Prior thereto, Ernst & Young Professor of Accounting at The Wharton School, University of Pennsylvania from 1985 to 2005. | | Asset Allocation Trust |
Olivia S. Mitchell
(Born 1953) | | Trustee, since 2006 | | International Foundation of Employee Benefit Plans Professor, Wharton School of the University of Pennsylvania since 1993. Director of Wharton’s Pension Research Council and Boettner Center on Pensions & Retirement Research, and Research Associate at the National Bureau of Economic Research. Previously, Cornell University Professor from 1978 to 1993. | | Asset Allocation Trust |
Timothy J. Penny
(Born 1951) | | Trustee, since 1996 | | President and CEO of Southern Minnesota Initiative Foundation, a non-profit organization, since 2007 and Senior Fellow at the Humphrey Institute Policy Forum at the University of Minnesota since 1995. Member of the Board of Trustees of NorthStar Education Finance, Inc., a non-profit organization, since 2007. | | Asset Allocation Trust |
| | | | |
| 26 | | Wells Fargo Advantage Large Company Value Fund | | Other information (unaudited) |
| | | | | | |
Name and year of birth | | Position held and length of service* | | Principal occupations during past five years | | Other directorships during
past five years |
Michael S. Scofield
(Born 1943) | | Trustee, since 2010 | | Served on the Investment Company Institute’s Board of Governors and Executive Committee from 2008-2011 as well the Governing Council of the Independent Directors Council from 2006-2011 and the Independent Directors Council Executive Committee from 2008-2011. Chairman of the IDC from 2008-2010. Institutional Investor (Fund Directions) Trustee of Year in 2007. Trustee of the Evergreen Funds (and its predecessors) from 1984 to 2010. Chairman of the Evergreen Funds from 2000-2010. Former Trustee of the Mentor Funds. Retired Attorney, Law Offices of Michael S. Scofield. | | Asset Allocation Trust |
Donald C. Willeke
(Born 1940) | | Trustee, since 1996 | | Principal of the law firm of Willeke & Daniels. General Counsel of the Minneapolis Employees Retirement Fund from 1984 until its consolidation into the Minnesota Public Employees Retirement Association on June 30, 2010. Director and Vice Chair of The Tree Trust (non-profit corporation). Director and of the American Chestnut Foundation (non-profit corporation). | | Asset Allocation Trust |
| * | Length of service dates reflect the Trustee’s commencement of service with the Trust’s predecessor entities, where applicable. |
Officers
| | | | | | |
Name and year of birth | | Position held and
length of service | | Principal occupations during past five years | | |
Karla M. Rabusch
(Born 1959) | | President, since 2003 | | Executive Vice President of Wells Fargo Bank, N.A. and President of Wells Fargo Funds Management, LLC since 2003. | | |
Jeremy DePalma1
(Born 1974) | | Treasurer, since 2012 | | Senior Vice President of Wells Fargo Funds Management, LLC since 2009. Senior Vice President of Evergreen Investment Management Company, LLC from 2008 to 2010. Vice President, Evergreen Investment Services, Inc. from 2004 to 2007. Head of the Fund Reporting and Control Team within Fund Administration from 2005 to 2010. | | |
C. David Messman
(Born 1960) | | Secretary, since 2000; Chief Legal Officer, since 2003 | | Senior Vice President and Secretary of Wells Fargo Funds Management, LLC since 2001. Vice President and Managing Counsel of Wells Fargo Bank, N.A. since 1996. | | |
Debra Ann Early
(Born 1964) | | Chief Compliance Officer, since 2007 | | Chief Compliance Officer of Wells Fargo Funds Management, LLC since 2007. Chief Compliance Officer of Parnassus Investments from 2005 to 2007. Chief Financial Officer of Parnassus Investments from 2004 to 2007. | | |
David Berardi
(Born 1975) | | Assistant Treasurer, since 2009 | | Vice President of Wells Fargo Funds Management, LLC since 2009. Vice President of Evergreen Investment Management Company, LLC from 2008 to 2010. Assistant Vice President of Evergreen Investment Services, Inc. from 2004 to 2008. Manager of Fund Reporting and Control for Evergreen Investment Management Company, LLC from 2004 to 2010. | | |
| 1. | Jeremy DePalma acts as Treasurer of 61 funds and Assistant Treasurer of 75 funds in the Fund Complex. |
| 2. | The Statement of Additional Information includes additional information about the Trustees and is available, without charge, upon request, by calling 1-800-222-8222 or by visiting the website at wellsfargoadvantagefunds.com. |
| | | | | | |
| List of abbreviations | | Wells Fargo Advantage Large Company Value Fund | | | 27 | |
The following is a list of common abbreviations for terms and entities that may have appeared in this report.
| ACA | — ACA Financial Guaranty Corporation |
| ADR | — American depositary receipt |
| ADS | — American depositary shares |
| AGC | — Assured Guaranty Corporation |
| AGM | — Assured Guaranty Municipal |
| Ambac | — Ambac Financial Group Incorporated |
| AMT | — Alternative minimum tax |
| BAN | — Bond anticipation notes |
| BHAC | — Berkshire Hathaway Assurance Corporation |
| CAB | — Capital appreciation bond |
| CCAB | — Convertible capital appreciation bond |
| CDA | — Community Development Authority |
| CDO | — Collateralized debt obligation |
| COP | — Certificate of participation |
| DRIVER | — Derivative inverse tax-exempt receipts |
| DW&P | — Department of Water & Power |
| DWR | — Department of Water Resources |
| ECFA | — Educational & Cultural Facilities Authority |
| EDA | — Economic Development Authority |
| EDFA | — Economic Development Finance Authority |
| ETF | — Exchange-traded fund |
| FDIC | — Federal Deposit Insurance Corporation |
| FFCB | — Federal Farm Credit Banks |
| FGIC | — Financial Guaranty Insurance Corporation |
| FHA | — Federal Housing Administration |
| FHLB | — Federal Home Loan Bank |
| FHLMC | — Federal Home Loan Mortgage Corporation |
| FICO | — The Financing Corporation |
| FNMA | — Federal National Mortgage Association |
| GDR | — Global depositary receipt |
| GNMA | — Government National Mortgage Association |
| HCFR | — Healthcare facilities revenue |
| HEFA | — Health & Educational Facilities Authority |
| HEFAR | — Higher education facilities authority revenue |
| HFA | — Housing Finance Authority |
| HFFA | — Health Facilities Financing Authority |
| HUD | — Department of Housing and Urban Development |
| IDA | — Industrial Development Authority |
| IDAG | — Industrial Development Agency |
| IDR | — Industrial development revenue |
| KRW | — Republic of Korea won |
| LIBOR | — London Interbank Offered Rate |
| LLC | — Limited liability company |
| LLP | — Limited liability partnership |
| MBIA | — Municipal Bond Insurance Association |
| MFHR | — Multifamily housing revenue |
| MSTR | — Municipal securities trust receipts |
| MUD | — Municipal Utility District |
| National | — National Public Finance Guarantee Corporation |
| PCFA | — Pollution Control Financing Authority |
| PCL | — Public Company Limited |
| PCR | — Pollution control revenue |
| PFA | — Public Finance Authority |
| PFFA | — Public Facilities Financing Authority |
| PFOTER | — Puttable floating option tax-exempt receipts |
| plc | — Public limited company |
| PUTTER | — Puttable tax-exempt receipts |
| R&D | — Research & development |
| Radian | — Radian Asset Assurance |
| RAN | — Revenue anticipation notes |
| RDA | — Redevelopment Authority |
| RDFA | — Redevelopment Finance Authority |
| REIT | — Real estate investment trust |
| ROC | — Reset option certificates |
| SAVRS | — Select auction variable rate securities |
| SBA | — Small Business Authority |
| SFHR | — Single-family housing revenue |
| SFMR | — Single-family mortgage revenue |
| SPA | — Standby purchase agreement |
| SPDR | — Standard & Poor’s Depositary Receipts |
| STRIPS | — Separate trading of registered interest and principal securities |
| TAN | — Tax anticipation notes |
| TIPS | — Treasury inflation-protected securities |
| TRAN | — Tax revenue anticipation notes |
| TTFA | — Transportation Trust Fund Authority |
| TVA | — Tennessee Valley Authority |
This page is intentionally left blank.
This page is intentionally left blank.
This page is intentionally left blank.


For more information
More information about Wells Fargo Advantage Funds is available free upon request. To obtain literature, please write, email, visit the Fund’s website, or call:
Wells Fargo Advantage Funds
P.O. Box 8266
Boston, MA 02266-8266
Email: wfaf@wellsfargo.com
Website: wellsfargoadvantagefunds.com
Individual investors: 1-800-222-8222
Retail investment professionals: 1-888-877-9275
Institutional investment professionals: 1-866-765-0778
This report and the financial statements contained herein are submitted for the general information of the shareholders of Wells Fargo Advantage Funds. If this report is used for promotional purposes, distribution of the report must be accompanied or preceded by a current prospectus. For a current prospectus and, if available, a summary prospectus containing more complete information, including charges and expenses, call 1-800-222-8222 or visit the Fund’s website at wellsfargoadvantagefunds.com. Please consider the investment objectives, risks, charges, and expenses of the investment carefully before investing. This and other information about Wells Fargo Advantage Funds can be found in the current prospectus. Read the prospectus carefully before you invest or send money.
Wells Fargo Funds Management, LLC, a wholly owned subsidiary of Wells Fargo & Company, provides investment advisory and administrative services for Wells Fargo Advantage Funds. Other affiliates of Wells Fargo & Company provide subadvisory and other services for the Funds. The Funds are distributed by Wells Fargo Funds Distributor, LLC, Member FINRA/SIPC, an affiliate of Wells Fargo & Company.
NOT FDIC INSURED ¡ NO BANK GUARANTEE ¡ MAY LOSE VALUE
© 2013 Wells Fargo Funds Management, LLC. All rights reserved.
| | |
 | | 215108 03-13 SA210/SAR210 1-13 |

Wells Fargo Advantage Omega Growth Fund

Semi-Annual Report
January 31, 2013

Reduce clutter. Save trees.
Sign up for electronic delivery of prospectuses and shareholder reports at wellsfargo.com/advantagedelivery
Contents
The views expressed and any forward-looking statements are as of January 31, 2013, unless otherwise noted, and are those of the Fund managers and/or Wells Fargo Funds Management, LLC. Discussions of individual securities, or the markets generally, or any Wells Fargo Advantage Fund are not intended as individual recommendations. Future events or results may vary significantly from those expressed in any forward-looking statements; the views expressed are subject to change at any time in response to changing circumstances in the market. Wells Fargo Funds Management, LLC, disclaims any obligation to publicly update or revise any views expressed or forward-looking statements.
NOT FDIC INSURED ¡ NO BANK GUARANTEE ¡ MAY LOSE VALUE

Wells Fargo investment history
| | |
| 1932 | | Keystone creates one of the first mutual fund families. |
| 1971 | | Wells Fargo & Company introduces one of the first institutional index funds. |
| 1978 | | Wells Fargo applies Markowitz and Sharpe’s research on Modern Portfolio Theory to introduce one of the industry’s first tactical asset allocation models in institutional separately managed accounts. |
| 1984 | | Wells Fargo Stagecoach Funds launches its first asset allocation fund. |
| 1989 | | The Tactical Asset Allocation (TAA) Model is first applied to Wells Fargo’s asset allocation mutual funds. |
| 1994 | | Wells Fargo introduces the LifePath Funds, one of the first suites of target date funds (now the Wells Fargo Advantage Dow Jones Target Date FundsSM). |
| 1996 | | Evergreen Investments and Keystone Funds merge. |
| 1997 | | Wells Fargo launches the Wells Fargo Advantage WealthBuilder PortfoliosSM, a fund-of-funds suite of products that includes the use of quantitative models to shift assets among investment styles. |
| 1999 | | Norwest Advantage Funds and Stagecoach Funds are reorganized into Wells Fargo Funds after the merger of Norwest and Wells Fargo. |
| 2002 | | Evergreen Retail and Evergreen Institutional companies form the umbrella asset management company, Evergreen Investments. |
| 2005 | | The integration of Strong Funds with Wells Fargo Funds creates Wells Fargo Advantage Funds, resulting in one of the top 20 mutual fund companies in the United States. |
| 2006 | | Wells Fargo Advantage Funds relaunches the target date product line as Wells Fargo Advantage Dow Jones Target Date Funds. |
| 2010 | | The mergers and reorganizations of Evergreen and Wells Fargo Advantage mutual funds are completed, unifying the families under the brand of Wells Fargo Advantage Funds. |
Wells Fargo Advantage Funds®
Wells Fargo Advantage Funds skillfully guides institutions, financial advisors, and individuals through the investment terrain to help them reach their financial objectives. Everything we do on behalf of investors is backed by our unique combination of qualifications.
Strength
Our organization is built on the standards of integrity and service established by our parent company—Wells Fargo & Company—more than 150 years ago. And, because we’re part of a highly diversified financial enterprise, we offer the depth of resources to help investors succeed.
Expertise
Our multi-boutique model offers investors access to the independent thinking of premier investment managers that have been chosen for their time-tested strategies. While each team specializes in a specific investment strategy, collectively they provide investors a wide choice of distinct investment styles. Our dedication to investment excellence doesn’t end with our expertise in manager selection—risk management, analysis, and rigorous ongoing review seek to ensure each manager’s investment process remains consistent.
Partnership
Our collaborative approach is built around understanding the needs and goals of our clients. By adhering to core principles of sound judgment and steady guidance, we support you through every stage of the investment decision process.
Carefully consider the investment objectives, risks, charges, and expenses before investing. For a current prospectus and, if available, a summary prospectus, for Wells Fargo Advantage Funds, containing this and other information, visit wellsfargoadvantagefunds.com. Read it carefully before investing.
Wells Fargo Funds Management, LLC, a wholly owned subsidiary of Wells Fargo & Company, provides investment advisory and administrative services for Wells Fargo Advantage Funds. Other affiliates of Wells Fargo & Company provide subadvisory and other services for the Funds. The Funds are distributed by Wells Fargo Funds Distributor, LLC, Member FINRA/SIPC, an affiliate of Wells Fargo & Company.
“Dow Jones®” and “Dow Jones Target Date IndexesSM” are service marks of Dow Jones Trademark Holdings LLC (“Dow Jones”); have been licensed to CME Group Index Services LLC (“CME Indexes”); and have been sublicensed for use for certain purposes by Global Index Advisors, Inc., and Wells Fargo Funds Management, LLC. The Wells Fargo Advantage Dow Jones Target Date FundsSM, based on the Dow Jones Target Date Indexes, are not sponsored, endorsed, sold, or promoted by Dow Jones, CME Indexes, or their respective affiliates, and none of them makes any representation regarding the advisability of investing in such product(s).
NOT FDIC INSURED ¡ NO BANK GUARANTEE ¡ MAY LOSE VALUE
Not part of the semi-annual report.
Wells Fargo Advantage Funds offers more than 110 mutual funds across a wide range of asset classes, representing over $226 billion in assets under management, as of January 31, 2013.
| | | | |
| Equity funds | | | | |
Asia Pacific Fund | | Enterprise Fund† | | Opportunity Fund† |
C&B Large Cap Value Fund | | Global Opportunities Fund | | Precious Metals Fund |
C&B Mid Cap Value Fund | | Growth Fund | | Premier Large Company Growth Fund |
Capital Growth Fund | | Index Fund | | Small Cap Opportunities Fund |
Common Stock Fund | | International Equity Fund | | Small Cap Value Fund |
Disciplined U.S. Core Fund | | International Value Fund | | Small Company Growth Fund |
Discovery Fund† | | Intrinsic Small Cap Value Fund | | Small Company Value Fund |
Diversified Equity Fund | | Intrinsic Value Fund | | Small/Mid Cap Value Fund |
Diversified International Fund | | Intrinsic World Equity Fund | | Special Mid Cap Value Fund |
Emerging Growth Fund | | Large Cap Core Fund | | Special Small Cap Value Fund |
Emerging Markets Equity Fund | | Large Cap Growth Fund | | Specialized Technology Fund |
Emerging Markets Equity Income Fund | | Large Company Value Fund | | Traditional Small Cap Growth Fund |
Endeavor Select Fund† | | Omega Growth Fund | | Utility and Telecommunications Fund |
| Bond funds | | | | |
Adjustable Rate Government Fund | | High Yield Municipal Bond Fund | | Short Duration Government Bond Fund |
California Limited-Term Tax-Free Fund | | Income Plus Fund | | Short-Term Bond Fund |
California Tax-Free Fund | | Inflation-Protected Bond Fund | | Short-Term High Yield Bond Fund |
Colorado Tax-Free Fund | | Intermediate Tax/AMT-Free Fund | | Short-Term Municipal Bond Fund |
Core Bond Fund | | International Bond Fund | | Strategic Income Fund |
Emerging Markets Local Bond Fund | | Minnesota Tax-Free Fund | | Strategic Municipal Bond Fund |
Government Securities Fund | | Municipal Bond Fund | | Ultra Short-Term Income Fund |
High Income Fund | | North Carolina Tax-Free Fund | | Ultra Short-Term Municipal Income Fund |
High Yield Bond Fund | | Pennsylvania Tax-Free Fund | | Wisconsin Tax-Free Fund |
| Asset allocation funds | | | | |
Absolute Return Fund | | WealthBuilder Equity Portfolio† | | Target 2020 Fund† |
Asset Allocation Fund | | WealthBuilder Growth Allocation Portfolio† | | Target 2025 Fund† |
Conservative Allocation Fund | | WealthBuilder Growth Balanced Portfolio† | | Target 2030 Fund† |
Diversified Capital Builder Fund | | WealthBuilder Moderate Balanced Portfolio† | | Target 2035 Fund† |
Diversified Income Builder Fund | | WealthBuilder Tactical Equity Portfolio† | | Target 2040 Fund† |
Growth Balanced Fund | | Target Today Fund† | | Target 2045 Fund† |
Index Asset Allocation Fund | | Target 2010 Fund† | | Target 2050 Fund† |
Moderate Balanced Fund | | Target 2015 Fund† | | Target 2055 Fund† |
WealthBuilder Conservative Allocation Portfolio† | | | | |
| Money market funds | | | | |
100% Treasury Money Market Fund | | Heritage Money Market Fund† | | National Tax-Free Money Market Fund |
California Municipal Money Market Fund | | Money Market Fund | | Treasury Plus Money Market Fund |
Cash Investment Money Market Fund | | Municipal Cash Management Money Market Fund | | |
Government Money Market Fund | | Municipal Money Market Fund | | |
| Variable trust funds1 | | | | |
VT Discovery Fund† | | VT Intrinsic Value Fund | | VT Small Cap Growth Fund |
VT Index Asset Allocation Fund | | VT Omega Growth Fund | | VT Small Cap Value Fund |
VT International Equity Fund | | VT Opportunity Fund† | | VT Total Return Bond Fund |
An investment in a money market fund is not insured or guaranteed by the Federal Deposit Insurance Corporation or any other government agency. Although the Wells Fargo Advantage Money Market Funds seek to preserve the value of your investment at $1.00 per share, it is possible to lose money by investing in a money market fund.
| 1. | The variable trust funds are generally available only through insurance company variable contracts. |
| † | In this report, the Wells Fargo Advantage Discovery FundSM, Wells Fargo Advantage Endeavor Select FundSM, Wells Fargo Advantage Enterprise FundSM, Wells Fargo Advantage Opportunity FundSM, Wells Fargo Advantage WealthBuilder Conservative Allocation PortfolioSM, Wells Fargo Advantage WealthBuilder Equity PortfolioSM, Wells Fargo Advantage WealthBuilder Growth Allocation PortfolioSM, Wells Fargo Advantage WealthBuilder Growth Balanced PortfolioSM, Wells Fargo Advantage WealthBuilder Moderate Balanced PortfolioSM, Wells Fargo Advantage WealthBuilder Tactical Equity PortfolioSM, Wells Fargo Advantage Dow Jones Target Today FundSM, Wells Fargo Advantage Dow Jones Target 2010 FundSM, Wells Fargo Advantage Dow Jones Target 2015 FundSM, Wells Fargo Advantage Dow Jones Target 2020 FundSM, Wells Fargo Advantage Dow Jones Target 2025 FundSM, Wells Fargo Advantage Dow Jones Target 2030 FundSM, Wells Fargo Advantage Dow Jones Target 2035 FundSM, Wells Fargo Advantage Dow Jones Target 2040 FundSM, Wells Fargo Advantage Dow Jones Target 2045 FundSM, Wells Fargo Advantage Dow Jones Target 2050 FundSM, Wells Fargo Advantage Dow Jones Target 2055 FundSM, Wells Fargo Advantage Heritage Money Market FundSM, Wells Fargo Advantage VT Discovery FundSM, and Wells Fargo Advantage VT Opportunity FundSM are referred to as the Discovery Fund, Endeavor Select Fund, Enterprise Fund, Opportunity Fund, WealthBuilder Conservative Allocation Portfolio, WealthBuilder Equity Portfolio, WealthBuilder Growth Allocation Portfolio, WealthBuilder Growth Balanced Portfolio, WealthBuilder Moderate Balanced Portfolio, WealthBuilder Tactical Equity Portfolio, Target Today Fund, Target 2010 Fund, Target 2015 Fund, Target 2020 Fund, Target 2025 Fund, Target 2030 Fund, Target 2035 Fund, Target 2040 Fund, Target 2045 Fund, Target 2050 Fund, Target 2055 Fund, Heritage Money Market Fund, VT Discovery Fund, and VT Opportunity Fund, respectively. |
Not part of the semi-annual report.
| | | | |
| 2 | | Wells Fargo Advantage Omega Growth Fund | | Letter to shareholders (unaudited) |

Karla M. Rabusch
President
Wells Fargo Advantage Funds
Entering the period, concerns about the eurozone sovereign debt situation held center stage as investors again focused on economic weakness in southern European economies.
Aggressive central bank actions helped support stock prices, as did relatively solid economic data.
Dear Valued Shareholder:
We are pleased to offer you this semi-annual report for the Wells Fargo Advantage Omega Growth Fund for the six-month period that ended January 31, 2013. Much of the period was marked by continued concerns about the possible effects that the ongoing European sovereign debt crisis would have on the global economy. However, relatively solid economic data in the U.S. and efforts by European authorities to address the sovereign debt issue alleviated investor fears and supported global stock markets. Judging by various indexes, U.S. large-cap stocks underperformed small-cap stocks. Within the large-cap universe, value stocks outperformed growth stocks, partly because of strong performance from the financials sector.
The period was dominated by worries that ongoing debt problems in the eurozone would affect global economic growth.
Entering the period, concerns about the eurozone sovereign debt situation held center stage as investors again focused on economic weakness in southern European economies. Because many eurozone banks owned southern European debt and many U.S. banks had financial ties to eurozone banks, investors worried about the effects of a possible southern European debt default on the global financial system and economy. Ongoing weakness in the Greek economy made it difficult for the country to meet previously agreed upon austerity targets. Toward the end of the reporting period, political risk resurfaced in both Italy and Spain. In Italy, Prime Minister Mario Monti, an economist who was appointed to implement austerity measures and labor market reforms, resigned in December 2012. Monti later decided to run for office in the general election scheduled for February 2013.
European leaders took concerted action to calm investor concerns. In September 2012, the European Central Bank (ECB) announced that it would purchase an unlimited amount of one- to three-year sovereign debt from countries that had applied for a formal bailout through either the European Financial Stability Facility or the European Stability Mechanism. In another positive sign, in late November 2012, finance ministers from the 17-country eurozone and the International Monetary Fund struck a deal aimed at reducing Greece’s debt by the year 2020.
Central banks continued to provide stimulus.
Major central banks, including the U.S. Federal Reserve (Fed) and the ECB, continued to inject liquidity into the banks and the markets through various quantitative easing policies. Throughout the reporting period, the Federal Open Market Committee (FOMC) kept its key interest rates effectively at zero in order to support the economy and the financial system. The ECB was similarly aggressive, keeping its key rate at a historic low of 0.75%. Just prior to the beginning of the reporting period, the FOMC announced its intention to keep interest rates low until at least mid-2015 in order to support the sluggish economy. The Fed also announced open-ended purchases of $40 billion per month in mortgage-backed securities in an effort to support the housing market.
Stock markets posted solid gains in an eventful period.
Aggressive central bank actions helped support stock prices, as did relatively solid economic data. For much of the reporting period, the U.S. stock market benefited from favorable gross domestic product (GDP) data, with the growth rate improving from 1.3% (annualized) in the second quarter of 2012 to 3.1% (annualized) in the third quarter of 2012. However, the GDP growth rate slowed in the final months of 2012, with GDP growth coming in at 0.1% (annualized) in the fourth quarter of 2012. Because many investors attributed the weak number to the aftereffects of Hurricane Sandy on the eastern seaboard, the stock market remained resilient.
| | | | | | |
| Letter to shareholders (unaudited) | | Wells Fargo Advantage Omega Growth Fund | | | 3 | |
The steady improvement in the housing market supported investor sentiment. The National Association of Home Builders/First American Improving Markets Index identifies metro areas that have shown improvement from their respective troughs in housing permits, employment, and house prices for at least six consecutive months. The index rose for a fifth-consecutive month in January 2013, indicating improvements in 242 housing markets across the country. As a result, housing-related stocks strongly outperformed over the period, leading to better-than-index returns for sectors ranging from consumer discretionary (home improvement retailers), to materials (construction material providers), and to financials (mortgage lenders).
Throughout the period, a continued high unemployment rate was the main negative piece of U.S. economic data. Although the unemployment rate improved from 8.1% in August 2012 to 7.9% in January 2013, the labor market remained soft.
We remain committed to our investment strategies, even as many variables are at work in the market.
The full effect of the European credit crisis remains unknown. Elevated unemployment and debt defaults continue to pressure consumers and businesses alike. As a whole, Wells Fargo Advantage Funds represents investments across a range of asset classes and investment styles, giving you an opportunity to create a diversified investment portfolio. While diversification may not prevent losses in a downturn, we believe it helps manage risk.
Thank you for choosing to invest with Wells Fargo Advantage Funds. We appreciate your confidence in us and remain committed to helping you meet your financial needs. For current information about your fund investments, contact your investment professional, visit our website at wellsfargoadvantagefunds.com, or call us directly at 1-800-222-8222. We are available 24 hours a day, 7 days a week.
Sincerely,

Karla M. Rabusch
President
Wells Fargo Advantage Funds
Notice to shareholders
At its November 6-7, 2012 meeting, the Board of Trustees unanimously approved the following modifications to certain Class A sales load waiver privileges, with each change becoming effective on July 1, 2013:
| | n | | Annuity payments received under an annuity option or from death proceeds will no longer qualify for net asset value (NAV) repurchase privileges. | |
| | n | | The ability to reinvest redemption proceeds at NAV will be reduced from 120 days to 90 days. | |
| | n | | NAV purchase privileges for certain types of “grandfathered” shareholders will be modified to remove the ability to purchase Class A shares at NAV, unless those shares are held directly with the Fund. | |
Please contact your investment professional or call us directly at 1-800-222-8222 if you have any questions on this Notice to Shareholders.
| | | | |
| 4 | | Wells Fargo Advantage Omega Growth Fund | | Performance highlights (unaudited) |
Investment objective
The Fund seeks long-term capital appreciation.
Adviser
Wells Fargo Funds Management, LLC
Subadviser
Wells Capital Management Incorporated
Portfolio managers
Thomas J. Pence, CFA
Michael T. Smith, CFA
Average annual total returns1 (%) as of January 31, 2013
| | | | | | | | | | | | | | | | | | | | | | | | | | | | | | | | | | |
| | | | | Including sales charge | | | Excluding sales charge | | | Expense ratios2 (%) | |
| | | Inception date | | 1 year | | | 5 year | | | 10 year | | | 1 year | | | 5 year | | | 10 year | | | Gross | | | Net3 | |
| Class A (EKOAX) | | 4-29-1968 | | | 9.28 | | | | 7.62 | | | | 9.49 | | | | 15.95 | | | | 8.91 | | | | 10.14 | | | | 1.35 | | | | 1.30 | |
| Class B (EKOBX)* | | 8-2-1993 | | | 10.07 | | | | 7.79 | | | | 9.59 | | | | 15.07 | | | | 8.08 | | | | 9.59 | | | | 2.10 | | | | 2.05 | |
| Class C (EKOCX) | | 8-2-1993 | | | 14.10 | | | | 8.10 | | | | 9.34 | | | | 15.10 | | | | 8.10 | | | | 9.34 | | | | 2.10 | | | | 2.05 | |
| Class R (EKORX) | | 10-10-2003 | | | – | | | | – | | | | – | | | | 15.64 | | | | 8.64 | | | | 9.90 | | | | 1.60 | | | | 1.55 | |
| Administrator Class (EOMYX) | | 1-13-1997 | | | – | | | | – | | | | – | | | | 16.22 | | | | 9.17 | | | | 10.44 | | | | 1.19 | | | | 1.05 | |
| Institutional Class (EKONX) | | 7-30-2010 | | | – | | | | – | | | | – | | | | 16.55 | | | | 9.32 | | | | 10.51 | | | | 0.92 | | | | 0.80 | |
| Russell 3000® Growth Index4 | | – | | | – | | | | – | | | | – | | | | 13.44 | | | | 5.79 | | | | 8.43 | | | | – | | | | – | |
| * | | Class B shares are closed to investment, except in connection with the reinvestment of any distributions and permitted exchanges. |
Figures quoted represent past performance, which is no guarantee of future results and do not reflect the deduction of taxes that a shareholder may pay on fund distributions or the redemption of fund shares. Investment return and principal value of an investment will fluctuate so that an investor’s shares, when redeemed, may be worth more or less than their original cost. Performance shown without sales charges would be lower if sales charges were reflected. Current performance may be lower or higher than the performance data quoted and assumes the reinvestment of dividends and capital gains. Current month-end performance is available on the Fund’s website, wellsfargoadvantagefunds.com.
Index returns do not include transaction costs associated with buying and selling securities, any mutual fund fees or expenses, or any taxes. It is not possible to invest directly in an index.
For Class A shares, the maximum front-end sales charge is 5.75%. For Class B shares, the maximum contingent deferred sales charge is 5.00%. For Class C shares, the maximum contingent deferred sales charge is 1.00%. Performance including sales charge assumes the sales charge for the corresponding time period. Class R, Administrator Class, and Institutional Class shares are sold without a front-end sales charge or contingent deferred sales charge.
Stock values fluctuate in response to the activities of individual companies and general market and economic conditions. Certain investment strategies tend to increase the total risk of an investment (relative to the broader market). This Fund is exposed to foreign investment risk and smaller-company securities risk. Consult the Fund’s prospectus for additional information on these and other risks.
Please see footnotes on page 5.
| | | | | | |
| Performance highlights (unaudited) | | Wells Fargo Advantage Omega Growth Fund | | | 5 | |
| | | | |
| Ten largest equity holdings5 (%) as of January 31, 2013 | |
Apple Incorporated | | | 5.37 | |
Google Incorporated Class A | | | 3.46 | |
eBay Incorporated | | | 2.75 | |
Kansas City Southern | | | 2.64 | |
Visa Incorporated Class A | | | 2.56 | |
Monsanto Company | | | 2.32 | |
Gilead Sciences Incorporated | | | 2.02 | |
SBA Communications Corporation Class A | | | 1.72 | |
Limited Brands Incorporated | | | 1.69 | |
Whole Foods Market Incorporated | | | 1.67 | |
| | |
| Sector distribution6 as of January 31, 2013 |
|
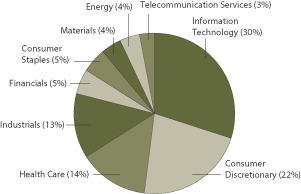
|
| 1. | Historical performance shown for Class R shares prior to their inception reflects the performance of the Class A shares, adjusted to reflect the higher expenses applicable to Class R shares. Historical performance shown for the Institutional Class shares prior to their inception reflects the performance of the Administrator Class shares, and includes the higher expenses applicable to the Administrator Class shares. If these expenses had not been included, returns would be higher. Historical performance shown for all classes of the Fund prior to July 19, 2010, is based on the performance of the Fund’s predecessor, Evergreen Omega Fund. |
| 2. | Reflects the expense ratios as stated in the most recent prospectuses. |
| 3. | The Adviser has committed through November 30, 2013, to waive fees and/or reimburse expenses to the extent necessary to cap the Fund’s Total Annual Fund Operating Expenses After Fee Waiver, excluding certain expenses, at the amounts shown. Brokerage commissions, stamp duty fees, interest, taxes, acquired fund fees and expenses, and extraordinary expenses are excluded from the cap. Without this cap, the Fund’s returns would have been lower. |
| 4. | The Russell 3000® Growth Index measures the performance of those Russell 3000 Index companies with higher price-to-book ratios and higher forecasted growth values. The stocks in this index are also members of either the Russell 1000® Growth Index or the Russell 2000® Growth Index. You cannot invest directly in an index. |
| 5. | The ten largest equity holdings are calculated based on the value of the securities divided by total net assets of the Fund. Holdings are subject to change and may have changed since the date specified. |
| 6. | Sector distribution is subject to change and is calculated based on the total long-term investments of the Fund. |
| | | | |
| 6 | | Wells Fargo Advantage Omega Growth Fund | | Fund expenses (unaudited) |
As a shareholder of the Fund, you incur two types of costs: (1) transaction costs, including sales charges (loads) on purchase payments and contingent deferred sales charges (if any) on redemptions and (2) ongoing costs, including management fees, distribution (12b-1) and/or shareholder service fees, and other Fund expenses. This example is intended to help you understand your ongoing costs (in dollars) of investing in the Fund and to compare these costs with the ongoing costs of investing in other mutual funds.
The example is based on an investment of $1,000 invested at the beginning of the six-month period and held for the entire period from August 1, 2012 to January 31, 2013.
Actual expenses
The “Actual” line of the table below provides information about actual account values and actual expenses. You may use the information in this line, together with the amount you invested, to estimate the expenses that you paid over the period. Simply divide your account value by $1,000 (for example, an $8,600 account value divided by $1,000 = 8.6), then multiply the result by the number in the “Actual” line under the heading entitled “Expenses paid during period” for your applicable class of shares to estimate the expenses you paid on your account during this period.
Hypothetical example for comparison purposes
The “Hypothetical” line of the table below provides information about hypothetical account values and hypothetical expenses based on the Fund’s actual expense ratio and an assumed rate of return of 5% per year before expenses, which is not the Fund’s actual return. The hypothetical account values and expenses may not be used to estimate the actual ending account balance or expenses you paid for the period. You may use this information to compare the ongoing costs of investing in the Fund and other funds. To do so, compare this 5% hypothetical example with the 5% hypothetical examples that appear in the shareholder reports of the other funds.
Please note that the expenses shown in the table are meant to highlight your ongoing costs only and do not reflect any transactional costs, such as sales charges (loads) and contingent deferred sales charges. Therefore, the “Hypothetical” line of the table is useful in comparing ongoing costs only and will not help you determine the relative total costs of owning different funds. In addition, if these transactional costs were included, your costs would have been higher.
| | | | | | | | | | | | | | | | |
| | | Beginning
account value
8-1-2012 | | | Ending
account value
1-31-2013 | | | Expenses
paid during
the period¹ | | | Net annual
expense ratio | |
Class A | | | | | | | | | | | | | | | | |
Actual | | $ | 1,000.00 | | | $ | 1,117.08 | | | $ | 6.94 | | | | 1.30 | % |
Hypothetical (5% return before expenses) | | $ | 1,000.00 | | | $ | 1,018.65 | | | $ | 6.61 | | | | 1.30 | % |
Class B | | | | | | | | | | | | | | | | |
Actual | | $ | 1,000.00 | | | $ | 1,112.80 | | | $ | 10.92 | | | | 2.05 | % |
Hypothetical (5% return before expenses) | | $ | 1,000.00 | | | $ | 1,014.87 | | | $ | 10.41 | | | | 2.05 | % |
Class C | | | | | | | | | | | | | | | | |
Actual | | $ | 1,000.00 | | | $ | 1,112.87 | | | $ | 10.92 | | | | 2.05 | % |
Hypothetical (5% return before expenses) | | $ | 1,000.00 | | | $ | 1,014.87 | | | $ | 10.41 | | | | 2.05 | % |
Class R | | | | | | | | | | | | | | | | |
Actual | | $ | 1,000.00 | | | $ | 1,115.42 | | | $ | 8.26 | | | | 1.55 | % |
Hypothetical (5% return before expenses) | | $ | 1,000.00 | | | $ | 1,017.39 | | | $ | 7.88 | | | | 1.55 | % |
Administrator Class | | | | | | | | | | | | | | | | |
Actual | | $ | 1,000.00 | | | $ | 1,118.16 | | | $ | 5.61 | | | | 1.05 | % |
Hypothetical (5% return before expenses) | | $ | 1,000.00 | | | $ | 1,019.91 | | | $ | 5.35 | | | | 1.05 | % |
Institutional Class | | | | | | | | | | | | | | | | |
Actual | | $ | 1,000.00 | | | $ | 1,119.77 | | | $ | 4.27 | | | | 0.80 | % |
Hypothetical (5% return before expenses) | | $ | 1,000.00 | | | $ | 1,021.17 | | | $ | 4.08 | | | | 0.80 | % |
| 1. | Expenses paid is equal to the annualized expense ratio of each class multiplied by the average account value over the period, multiplied by the number of days in the most recent fiscal half-year divided by the number of days in the fiscal year (to reflect the one-half-year period). |
| | | | | | |
| Portfolio of investments—January 31, 2013 (unaudited) | | Wells Fargo Advantage Omega Growth Fund | | | 7 | |
| | | | | | | | | | | | |
| Security name | | | | | | Shares | | | Value | |
| | | |
Common Stocks: 98.90% | | | | | | | | | | |
| | | | |
Consumer Discretionary: 21.68% | | | | | | | | | | | | |
| | | |
| Auto Components: 1.47% | | | | | | | | | | |
Delphi Automotive plc † | | | | | | | 286,800 | | | $ | 11,087,688 | |
| | | | | | | | | | | | |
| | | | |
| Automobiles: 1.11% | | | | | | | | | | | | |
Tesla Motors Incorporated Ǡ | | | | | | | 223,300 | | | | 8,375,983 | |
| | | | | | | | | | | | |
| | | | |
| Hotels, Restaurants & Leisure: 1.54% | | | | | | | | | | | | |
Starbucks Corporation | | | | | | | 206,730 | | | | 11,601,688 | |
| | | | | | | | | | | | |
| | | | |
| Internet & Catalog Retail: 2.61% | | | | | | | | | | | | |
Amazon.com Incorporated † | | | | | | | 33,100 | | | | 8,788,050 | |
Expedia Incorporated | | | | | | | 70,700 | | | | 4,613,175 | |
priceline.com Incorporated † | | | | | | | 9,110 | | | | 6,244,632 | |
| | | | |
| | | | | | | | | | | 19,645,857 | |
| | | | | | | | | | | | |
| | | |
| Media: 4.97% | | | | | | | | | | |
CBS Corporation Class B | | | | | | | 203,090 | | | | 8,472,915 | |
Discovery Communications Incorporated † | | | | | | | 154,658 | | | | 9,853,261 | |
Liberty Media Corporation † | | | | | | | 73,374 | | | | 8,181,935 | |
Virgin Media Incorporated « | | | | | | | 278,700 | | | | 10,977,993 | |
| | | | |
| | | | | | | | | | | 37,486,104 | |
| | | | | | | | | | | | |
| | | |
| Multiline Retail: 2.78% | | | | | | | | | | |
Dollar General Corporation † | | | | | | | 266,031 | | | | 12,295,953 | |
Nordstrom Incorporated | | | | | | | 156,100 | | | | 8,621,403 | |
| | | | |
| | | | | | | | | | | 20,917,356 | |
| | | | | | | | | | | | |
| | | |
| Specialty Retail: 4.86% | | | | | | | | | | |
GNC Holdings Incorporated Class A | | | | | | | 294,000 | | | | 10,566,360 | |
Limited Brands Incorporated | | | | | | | 264,565 | | | | 12,704,411 | |
TJX Companies Incorporated | | | | | | | 264,300 | | | | 11,941,074 | |
Ulta Salon Cosmetics & Fragrance Incorporated | | | | | | | 14,007 | | | | 1,370,165 | |
| | | | |
| | | | | | | | | | | 36,582,010 | |
| | | | | | | | | | | | |
| | | | |
| Textiles, Apparel & Luxury Goods: 2.34% | | | | | | | | | | | | |
lululemon athletica incorporated Ǡ | | | | | | | 118,330 | | | | 8,164,770 | |
Under Armour Incorporated Class A Ǡ | | | | | | | 186,600 | | | | 9,492,342 | |
| | | | |
| | | | | | | | | | | 17,657,112 | |
| | | | | | | | | | | | |
| | | |
Consumer Staples: 4.88% | | | | | | | | | | |
| | | |
| Beverages: 1.28% | | | | | | | | | | |
Constellation Brands Incorporated Class A † | | | | | | | 298,500 | | | | 9,659,460 | |
| | | | | | | | | | | | |
| | | |
| Food & Staples Retailing: 1.68% | | | | | | | | | | |
Whole Foods Market Incorporated | | | | | | | 131,070 | | | | 12,615,488 | |
| | | | | | | | | | | | |
| | | |
| Food Products: 1.92% | | | | | | | | | | |
Boulder Brands Incorporated Ǡ | | | | | | | 403,600 | | | | 5,420,348 | |
The Hershey Company | | | | | | | 113,900 | | | | 9,049,355 | |
| | | | |
| | | | | | | | | | | 14,469,703 | |
| | | | | | | | | | | | |
The accompanying notes are an integral part of these financial statements.
| | | | |
| 8 | | Wells Fargo Advantage Omega Growth Fund | | Portfolio of investments—January 31, 2013 (unaudited) |
| | | | | | | | | | | | |
| Security name | | | | | | Shares | | | Value | |
| | | | |
Energy: 3.62% | | | | | | | | | | | | |
| | | |
| Energy Equipment & Services: 1.06% | | | | | | | | | | |
Schlumberger Limited | | | | | | | 102,035 | | | $ | 7,963,832 | |
| | | | | | | | | | | | |
| | | |
| Oil, Gas & Consumable Fuels: 2.56% | | | | | | | | | | |
Pioneer Natural Resources Company | | | | | | | 83,335 | | | | 9,795,196 | |
The Williams Companies Incorporated | | | | | | | 271,400 | | | | 9,512,570 | |
| | | | |
| | | | | | | | | | | 19,307,766 | |
| | | | | | | | | | | | |
| | | | |
Financials: 5.22% | | | | | | | | | | | | |
| | | |
| Capital Markets: 1.20% | | | | | | | | | | |
Affiliated Managers Group Incorporated † | | | | | | | 62,972 | | | | 9,063,560 | |
| | | | | | | | | | | | |
| | | |
| Consumer Finance: 1.05% | | | | | | | | | | |
Capital One Financial Corporation | | | | | | | 140,052 | | | | 7,887,729 | |
| | | | | | | | | | | | |
| | | |
| Diversified Financial Services: 1.43% | | | | | | | | | | |
IntercontinentalExchange Incorporated † | | | | | | | 77,800 | | | | 10,794,750 | |
| | | | | | | | | | | | |
| | | |
| Real Estate Management & Development: 1.54% | | | | | | | | | | |
CBRE Group Incorporated † | | | | | | | 537,300 | | | | 11,594,934 | |
| | | | | | | | | | | | |
| | | |
Health Care: 13.58% | | | | | | | | | | |
| | | |
| Biotechnology: 5.77% | | | | | | | | | | |
Alexion Pharmaceuticals Incorporated † | | | | | | | 87,950 | | | | 8,266,421 | |
BioMarin Pharmaceutical Incorporated Ǡ | | | | | | | 109,770 | | | | 6,025,275 | |
Celgene Corporation † | | | | | | | 81,500 | | | | 8,065,240 | |
Cubist Pharmaceuticals Incorporated Ǡ | | | | | | | 137,400 | | | | 5,913,696 | |
Gilead Sciences Incorporated Ǡ | | | | | | | 385,680 | | | | 15,215,076 | |
| | | | |
| | | | | | | | | | | 43,485,708 | |
| | | | | | | | | | | | |
| | | |
| Health Care Equipment & Supplies: 1.46% | | | | | | | | | | |
Intuitive Surgical Incorporated † | | | | | | | 19,200 | | | | 11,028,096 | |
| | | | | | | | | | | | |
| | | |
| Health Care Providers & Services: 2.87% | | | | | | | | | | |
HCA Holdings Incorporated | | | | | | | 162,700 | | | | 6,125,655 | |
Team Health Holdings Incorporated † | | | | | | | 202,300 | | | | 6,851,901 | |
UnitedHealth Group Incorporated | | | | | | | 157,000 | | | | 8,667,970 | |
| | | | |
| | | | | | | | | | | 21,645,526 | |
| | | | | | | | | | | | |
| | | |
| Pharmaceuticals: 3.48% | | | | | | | | | | |
AbbVie Incorporation | | | | | | | 140,005 | | | | 5,136,783 | |
Allergan Incorporated | | | | | | | 112,900 | | | | 11,855,629 | |
Sanofi ADR | | | | | | | 180,200 | | | | 8,772,136 | |
Zoetis Incorporated † | | | | | | | 15,839 | | | | 411,814 | |
| | | | |
| | | | | | | | | | | 26,176,362 | |
| | | | | | | | | | | | |
The accompanying notes are an integral part of these financial statements.
| | | | | | |
| Portfolio of investments—January 31, 2013 (unaudited) | | Wells Fargo Advantage Omega Growth Fund | | | 9 | |
| | | | | | | | | | | | |
| Security name | | | | | | Shares | | | Value | |
| | | |
Industrials: 13.00% | | | | | | | | | | |
| | | |
| Aerospace & Defense: 2.62% | | | | | | | | | | |
Precision Castparts Corporation | | | | | | | 52,400 | | | $ | 9,610,160 | |
TransDigm Group Incorporated | | | | | | | 74,600 | | | | 10,103,824 | |
| | | | |
| | | | | | | | | | | 19,713,984 | |
| | | | | | | | | | | | |
| | | |
| Airlines: 1.49% | | | | | | | | | | |
Copa Holdings SA Class A | | | | | | | 102,600 | | | | 11,244,960 | |
| | | | | | | | | | | | |
| | | |
| Building Products: 0.78% | | | | | | | | | | |
Owens Corning Incorporated † | | | | | | | 140,500 | | | | 5,854,635 | |
| | | | | | | | | | | | |
| | | |
| Construction & Engineering: 0.98% | | | | | | | | | | |
Quanta Services Incorporated † | | | | | | | 256,200 | | | | 7,422,114 | |
| | | | | | | | | | | | |
| | | |
| Machinery: 1.55% | | | | | | | | | | |
Cummins Incorporated | | | | | | | 101,760 | | | | 11,685,101 | |
| | | | | | | | | | | | |
| | | |
| Professional Services: 1.45% | | | | | | | | | | |
Verisk Analytics Incorporated Class A † | | | | | | | 197,800 | | | | 10,910,648 | |
| | | | | | | | | | | | |
| | | |
| Road & Rail: 4.13% | | | | | | | | | | |
Hertz Global Holdings Incorporated † | | | | | | | 613,075 | | | | 11,207,011 | |
Kansas City Southern | | | | | | | 213,695 | | | | 19,897,141 | |
| | | | |
| | | | | | | | | | | 31,104,152 | |
| | | | | | | | | | | | |
| | | |
Information Technology: 29.66% | | | | | | | | | | |
| | | |
| Communications Equipment: 1.40% | | | | | | | | | | |
QUALCOMM Incorporated | | | | | | | 159,700 | | | | 10,544,991 | |
| | | | | | | | | | | | |
| | | |
| Computers & Peripherals: 5.97% | | | | | | | | | | |
Apple Incorporated | | | | | | | 88,800 | | | | 40,431,528 | |
Stratasys Limited Ǡ | | | | | | | 58,373 | | | | 4,581,113 | |
| | | | |
| | | | | | | | | | | 45,012,641 | |
| | | | | | | | | | | | |
| | | |
| Electronic Equipment, Instruments & Components: 0.47% | | | | | | | | | | |
IPG Photonics Corporation « | | | | | | | 54,232 | | | | 3,551,111 | |
| | | | | | | | | | | | |
| | | |
| Internet Software & Services: 10.75% | | | | | | | | | | |
eBay Incorporated † | | | | | | | 370,485 | | | | 20,721,226 | |
ExactTarget Incorporated Ǡ | | | | | | | 256,104 | | | | 5,631,727 | |
Facebook Incorporated Class A † | | | | | | | 170,000 | | | | 5,264,900 | |
Google Incorporated Class A † | | | | | | | 34,500 | | | | 26,071,305 | |
LinkedIn Corporation Class A Ǡ | | | | | | | 79,200 | | | | 9,804,168 | |
Mercadolibre Incorporated « | | | | | | | 103,835 | | | | 9,179,014 | |
Rackspace Hosting Incorporated † | | | | | | | 57,000 | | | | 4,294,950 | |
| | | | |
| | | | | | | | | | | 80,967,290 | |
| | | | | | | | | | | | |
| | | |
| IT Services: 2.56% | | | | | | | | | | |
Visa Incorporated Class A | | | | | | | 121,930 | | | | 19,253,966 | |
| | | | | | | | | | | | |
The accompanying notes are an integral part of these financial statements.
| | | | |
| 10 | | Wells Fargo Advantage Omega Growth Fund | | Portfolio of investments—January 31, 2013 (unaudited) |
| | | | | | | | | | | | | | |
| Security name | | | | | | | Shares | | | Value | |
| | | |
| Semiconductors & Semiconductor Equipment: 1.07% | | | | | | | | | | | | |
Broadcom Corporation Class A | | | | | | | | | 248,800 | | | $ | 8,073,560 | |
| | | | | | | | | | | | | | |
| | | |
| Software: 7.44% | | | | | | | | | | | | |
BroadSoft Incorporated † | | | | | | | | | 207,306 | | | | 7,042,185 | |
CommVault Systems Incorporated † | | | | | | | | | 118,700 | | | | 9,107,851 | |
Fortinet Incorporated † | | | | | | | | | 305,929 | | | | 7,216,865 | |
Red Hat Incorporated † | | | | | | | | | 142,700 | | | | 7,928,412 | |
Salesforce.com Incorporated Ǡ | | | | | | | | | 56,500 | | | | 9,725,345 | |
Splunk Incorporated † | | | | | | | | | 180,300 | | | | 5,942,688 | |
VMware Incorporated Ǡ | | | | | | | | | 119,000 | | | | 9,101,120 | |
| | | | |
| | | | | | | | | | | | | 56,064,466 | |
| | | | | | | | | | | | | | |
| | | |
Materials: 3.91% | | | | | | | | | | | | |
| | | |
| Chemicals: 3.91% | | | | | | | | | | | | |
Airgas Incorporated | | | | | | | | | 126,200 | | | | 12,019,288 | |
Monsanto Company | | | | | | | | | 172,300 | | | | 17,462,605 | |
| | | | |
| | | | | | | | | | | | | 29,481,893 | |
| | | | | | | | | | | | | | |
| | | |
Telecommunication Services: 3.35% | | | | | | | | | | | | |
| | | |
| Wireless Telecommunication Services: 3.35% | | | | | | | | | | | | |
Crown Castle International Corporation † | | | | | | | | | 174,000 | | | | 12,270,480 | |
SBA Communications Corporation Class A Ǡ | | | | | | | | | 186,402 | | | | 12,984,762 | |
| | | | |
| | | | | | | | | | | | | 25,255,242 | |
| | | | | | | | | | | | | | |
| | | |
Total Common Stocks (Cost $589,338,923) | | | | | | | | | | | 745,187,466 | |
| | | | | | | | | | | | | | |
| | | | | Yield | | | | | | | |
| Short-Term Investments: 16.09% | | | | | | | | | | | | | | |
| | | | |
| Investment Companies: 16.09% | | | | | | | | | | | | | | |
Wells Fargo Advantage Cash Investment Money Market Fund, Select Class (l)(u) | | | | | 0.14 | % | | | 10,478,408 | | | | 10,478,408 | |
Wells Fargo Securities Lending Cash Investments, LLC (l)(u)(r)(v) | | | | | 0.19 | | | | 110,743,925 | | | | 110,743,925 | |
| | | | |
Total Short-Term Investments (Cost $121,222,333) | | | | | | | | | | | | | 121,222,333 | |
| | | | | | | | | | | | | | |
| | | | | | | | |
| Total investments in securities | | | | | | | | |
| (Cost $710,561,256) * | | | 114.99 | % | | | 866,409,799 | |
Other assets and liabilities, net | | | (14.99 | ) | | | (112,938,186 | ) |
| | | | | | | | |
| Total net assets | | | 100.00 | % | | $ | 753,471,613 | |
| | | | | | | | |
| † | Non-income-earning security |
| « | All or a portion of this security is on loan. |
| (l) | Investment in an affiliate |
| (u) | Rate shown is the 7-day annualized yield at period end. |
| (r) | The investment company is exempt from registration under Section 3(c)(7) of the Investment Company Act of 1940, as amended. |
| (v) | Security represents investment of cash collateral received from securities on loan. |
| * | Cost for federal income tax purposes is $711,114,179 and unrealized appreciation (depreciation) consists of: |
| | | | |
Gross unrealized appreciation | | $ | 159,812,677 | |
Gross unrealized depreciation | | | (4,517,057 | ) |
| | | | |
Net unrealized appreciation | | $ | 155,295,620 | |
The accompanying notes are an integral part of these financial statements.
| | | | | | |
| Statement of assets and liabilities—January 31, 2013 (unaudited) | | Wells Fargo Advantage Omega Growth Fund | | | 11 | |
| | | | |
| | | | |
| |
Assets | | | | |
Investments | | | | |
In unaffiliated securities (including securities on loan), at value (see cost below) | | $ | 745,187,466 | |
In affiliated securities, at value (see cost below) | | | 121,222,333 | |
| | | | |
Total investments, at value (see cost below) | | | 866,409,799 | |
Receivable for investments sold | | | 9,251,563 | |
Receivable for Fund shares sold | | | 981,737 | |
Receivable for dividends | | | 78,681 | |
Receivable for securities lending income | | | 97,762 | |
Prepaid expenses and other assets | | | 83,546 | |
| | | | |
Total assets | | | 876,903,088 | |
| | | | |
| |
Liabilities | | | | |
Payable for investments purchased | | | 10,907,596 | |
Payable for Fund shares redeemed | | | 796,610 | |
Payable upon receipt of securities loaned | | | 110,743,925 | |
Advisory fee payable | | | 434,500 | |
Distribution fees payable | | | 59,558 | |
Due to other related parties | | | 189,097 | |
Accrued expenses and other liabilities | | | 300,189 | |
| | | | |
Total liabilities | | | 123,431,475 | |
| | | | |
Total net assets | | $ | 753,471,613 | |
| | | | |
| |
NET ASSETS CONSIST OF | | | | |
Paid-in capital | | $ | 583,893,597 | |
Accumulated net investment loss | | | (2,230,603 | ) |
Accumulated net realized gains on investments | | | 15,960,076 | |
Net unrealized gains on investments | | | 155,848,543 | |
| | | | |
Total net assets | | $ | 753,471,613 | |
| | | | |
| |
COMPUTATION OF NET ASSET VALUE AND OFFERING PRICE PER SHARE1 | | | | |
Net assets – Class A | | $ | 594,227,648 | |
Shares outstanding – Class A | | | 14,092,223 | |
Net asset value per share – Class A | | | $42.17 | |
Maximum offering price per share – Class A2 | | | $44.74 | |
Net assets – Class B | | $ | 19,308,894 | |
Shares outstanding – Class B | | | 546,207 | |
Net asset value per share – Class B | | | $35.35 | |
Net assets – Class C | | $ | 69,400,923 | |
Shares outstanding – Class C | | | 1,959,000 | |
Net asset value per share – Class C | | | $35.43 | |
Net assets – Class R | | $ | 17,521,769 | |
Shares outstanding – Class R | | | 424,452 | |
Net asset value per share – Class R | | | $41.28 | |
Net assets – Administrator Class | | $ | 51,785,677 | |
Shares outstanding – Administrator Class | | | 1,179,620 | |
Net asset value per share – Administrator Class | | | $43.90 | |
Net assets – Institutional Class | | $ | 1,226,702 | |
Shares outstanding – Institutional Class | | | 27,756 | |
Net asset value per share – Institutional Class | | | $44.20 | |
| |
Investment in unaffiliated securities (including securities on loan), at cost | | $ | 589,338,923 | |
| | | | |
Investments in affiliated securities, at cost | | $ | 121,222,333 | |
| | | | |
Total investments, at cost | | $ | 710,561,256 | |
| | | | |
Securities on loan, at value | | $ | 108,287,091 | |
| | | | |
| 1. | The Fund has an unlimited number of authorized shares. |
| 2. | Maximum offering price is computed as 100/94.25 of net asset value. On investments of $50,000 or more, the offering price is reduced. |
The accompanying notes are an integral part of these financial statements.
| | | | |
| 12 | | Wells Fargo Advantage Omega Growth Fund | | Statement of operations—six months ended January 31, 2013 (unaudited) |
| | | | |
| | | | |
| |
Investment income | | | | |
Dividends | | $ | 5,371,932 | |
Securities lending income, net | | | 830,039 | |
Income from affiliated securities | | | 12,878 | |
| | | | |
Total investment income | | | 6,214,849 | |
| | | | |
| |
Expenses | | | | |
Advisory fee | | | 2,728,811 | |
Administration fees | | | | |
Fund level | | | 185,913 | |
Class A | | | 761,976 | |
Class B | | | 27,128 | |
Class C | | | 84,798 | |
Class R | | | 21,208 | |
Administrator Class | | | 27,050 | |
Institutional Class | | | 403 | |
Shareholder servicing fees | | | | |
Class A | | | 732,670 | |
Class B | | | 25,932 | |
Class C | | | 81,536 | |
Class R | | | 20,393 | |
Administrator Class | | | 64,963 | |
Distribution fees | | | | |
Class B | | | 78,255 | |
Class C | | | 244,608 | |
Class R | | | 20,393 | |
Custody and accounting fees | | | 22,711 | |
Professional fees | | | 19,406 | |
Registration fees | | | 39,836 | |
Shareholder report expenses | | | 83,462 | |
Trustees’ fees and expenses | | | 5,027 | |
Other fees and expenses | | | 7,156 | |
| | | | |
Total expenses | | | 5,283,635 | |
Less: Fee waivers and/or expense reimbursements | | | (176,779 | ) |
| | | | |
Net expenses | | | 5,106,856 | |
| | | | |
Net investment income | | | 1,107,993 | |
| | | | |
| |
REALIZED AND UNREALIZED GAINS (LOSSES) ON INVESTMENTS | | | | |
Net realized gains on investments | | | 37,805,131 | |
Net change in unrealized gains (losses) on investments | | | 40,201,575 | |
| | | | |
Net realized and unrealized gains (losses) on investments | | | 78,006,706 | |
| | | | |
Net increase in net assets resulting from operations | | $ | 79,114,699 | |
| | | | |
The accompanying notes are an integral part of these financial statements.
| | | | | | |
| Statement of changes in net assets | | Wells Fargo Advantage Omega Growth Fund | | | 13 | |
| | | | | | | | | | | | | | | | |
| | | Six months ended
January 31, 2013
(unaudited) | | | Year ended
July 31, 2012 | |
| | | | |
Operations | | | | | | | | | | | | | | | | |
Net investment income (loss) | | | | | | $ | 1,107,993 | | | | | | | $ | (5,704,157 | ) |
Net realized gains on investments | | | | | | | 37,805,131 | | | | | | | | 7,625,449 | |
Net change in unrealized gains (losses) on investments | | | | | | | 40,201,575 | | | | | | | | 10,288,711 | |
| | | | | | | | | | | | | | | | |
Net increase in net assets resulting from operations | | | | | | | 79,114,699 | | | | | | | | 12,210,003 | |
| | | | | | | | | | | | | | | | |
| | | | |
Distributions to shareholders from | | | | | | | | | | | | | | | | |
Net realized gains | | | | | | | | | | | | | | | | |
Class A | | | | | | | (19,510,271 | ) | | | | | | | 0 | |
Class B | | | | | | | (778,636 | ) | | | | | | | 0 | |
Class C | | | | | | | (2,595,551 | ) | | | | | | | 0 | |
Class R | | | | | | | (558,930 | ) | | | | | | | 0 | |
Administrator Class | | | | | | | (1,813,617 | ) | | | | | | | 0 | |
Institutional Class | | | | | | | (37,612 | ) | | | | | | | 0 | |
| | | | | | | | | | | | | | | | |
Total distributions to shareholders | | | | | | | (25,294,617 | ) | | | | | | | 0 | |
| | | | | | | | | | | | | | | | |
| | | | |
Capital share transactions | | | Shares | | | | | | | | Shares | | | | | |
Proceeds from shares sold | | | | | | | | | | | | | | | | |
Class A | | | 1,360,083 | | | | 55,946,190 | | | | 2,201,499 | | | | 82,347,970 | |
Class B | | | 6,400 | | | | 221,475 | | | | 13,628 | | | | 441,767 | |
Class C | | | 271,678 | | | | 9,441,825 | | | | 363,194 | | | | 11,770,550 | |
Class R | | | 102,163 | | | | 4,120,621 | | | | 451,637 | | | | 15,404,053 | |
Administrator Class | | | 232,482 | | | | 9,944,820 | | | | 577,854 | | | | 22,921,932 | |
Institutional Class | | | 9,252 | | | | 406,285 | | | | 4,727 | | | | 183,692 | |
| | | | | | | | | | | | | | | | |
| | | | | | | 80,081,216 | | | | | | | | 133,069,964 | |
| | | | | | | | | | | | | | | | |
Reinvestment of distributions | | | | | | | | | | | | | | | | |
Class A | | | 456,138 | | | | 18,163,394 | | | | 0 | | | | 0 | |
Class B | | | 22,894 | | | | 765,115 | | | | 0 | | | | 0 | |
Class C | | | 63,333 | | | | 2,121,010 | | | | 0 | | | | 0 | |
Class R | | | 3,387 | | | | 132,045 | | | | 0 | | | | 0 | |
Administrator Class | | | 33,510 | | | | 1,388,644 | | | | 0 | | | | 0 | |
Institutional Class | | | 902 | | | | 37,612 | | | | 0 | | | | 0 | |
| | | | | | | | | | | | | | | | |
| | | | | | | 22,607,820 | | | | | | | | 0 | |
| | | | | | | | | | | | | | | | |
Payment for shares redeemed | | | | | | | | | | | | | | | | |
Class A | | | (1,811,853 | ) | | | (73,651,308 | ) | | | (3,388,347 | ) | | | (125,880,445 | ) |
Class B | | | (155,609 | ) | | | (5,402,195 | ) | | | (565,700 | ) | | | (17,861,900 | ) |
Class C | | | (168,560 | ) | | | (5,844,793 | ) | | | (351,841 | ) | | | (10,927,801 | ) |
Class R | | | (82,873 | ) | | | (3,321,942 | ) | | | (222,877 | ) | | | (8,312,137 | ) |
Administrator Class | | | (356,304 | ) | | | (15,011,527 | ) | | | (347,524 | ) | | | (13,590,151 | ) |
Institutional Class | | | (1,490 | ) | | | (63,727 | ) | | | (2,140 | ) | | | (85,297 | ) |
| | | | | | | | | | | | | | | | |
| | | | | | | (103,295,492 | ) | | | | | | | (176,657,731 | ) |
| | | | | | | | | | | | | | | | |
Net decrease in net assets resulting from capital share transactions | | | | | | | (606,456 | ) | | | | | | | (43,587,767 | ) |
| | | | | | | | | | | | | | | | |
Total increase (decrease) in net assets | | | | | | | 53,213,626 | | | | | | | | (31,377,764 | ) |
| | | | | | | | | | | | | | | | |
| | | | |
Net assets | | | | | | | | | | | | | | | | |
Beginning of period | | | | | | | 700,257,987 | | | | | | | | 731,635,751 | |
| | | | | | | | | | | | | | | | |
End of period | | | | | | $ | 753,471,613 | | | | | | | $ | 700,257,987 | |
| | | | | | | | | | | | | | | | |
Accumulated net investment loss | | | | | | $ | (2,230,603 | ) | | | | | | $ | (3,338,596 | ) |
| | | | | | | | | | | | | | | | |
The accompanying notes are an integral part of these financial statements.
| | | | |
| 14 | | Wells Fargo Advantage Omega Growth Fund | | Financial highlights |
(For a share outstanding throughout each period)
| | | | | | | | | | | | | | | | | | | | | | | | | | | | |
| | | Six months ended
January 31, 2013
(unaudited) | | | Year ended July 31 | | | Year ended September 30 | |
| CLASS A | | | 2012 | | | 2011 | | | 20101,2 | | | 20091 | | | 20081 | | | 20071 | |
Net asset value, beginning of period | | | $39.09 | | | | $38.29 | | | | $30.11 | | | | $28.44 | | | | $27.26 | | | | $31.44 | | | | $25.60 | |
Net investment income (loss) | | | 0.08 | | | | (0.28 | )3 | | | (0.29 | ) | | | (0.10 | )3 | | | 0.18 | 3 | | | 0.05 | 3 | | | (0.11 | )3 |
Net realized and unrealized gains (losses) on investments | | | 4.41 | | | | 1.08 | | | | 8.47 | | | | 1.96 | | | | 1.00 | | | | (4.23 | ) | | | 5.95 | |
| | | | | | | | | | | | | | | | | | | | | | | | | | | | |
Total from investment operations | | | 4.49 | | | | 0.80 | | | | 8.18 | | | | 1.86 | | | | 1.18 | | | | (4.18 | ) | | | 5.84 | |
Distributions to shareholders from | | | | | | | | | | | | | | | | | | | | | | | | | | | | |
Net investment income | | | 0.00 | | | | 0.00 | | | | 0.00 | | | | (0.19 | ) | | | 0.00 | | | | 0.00 | | | | 0.00 | |
Net realized gains | | | (1.41 | ) | | | 0.00 | | | | 0.00 | | | | 0.00 | | | | 0.00 | | | | 0.00 | | | | 0.00 | |
| | | | | | | | | | | | | | | | | | | | | | | | | | | | |
Total distributions to shareholders | | | (1.41 | ) | | | 0.00 | | | | 0.00 | | | | (0.19 | ) | | | 0.00 | | | | 0.00 | | | | 0.00 | |
Net asset value, end of period | | | $42.17 | | | | $39.09 | | | | $38.29 | | | | $30.11 | | | | $28.44 | | | | $27.26 | | | | $31.44 | |
Total return4 | | | 11.71 | % | | | 2.09 | % | | | 27.17 | % | | | 6.53 | % | | | 4.33 | % | | | (13.30 | )% | | | 22.81 | % |
Ratios to average net assets (annualized) | | | | | | | | | | | | | | | | | | | | | | | | | | | | |
Gross expenses | | | 1.34 | % | | | 1.35 | % | | | 1.36 | % | | | 1.35 | % | | | 1.48 | % | | | 1.44 | % | | | 1.46 | % |
Net expenses | | | 1.30 | % | | | 1.30 | % | | | 1.30 | % | | | 1.34 | % | | | 1.39 | % | | | 1.37 | % | | | 1.40 | % |
Net investment income (loss) | | | 0.37 | % | | | (0.75 | )% | | | (0.80 | )% | | | (0.40 | )% | | | 0.79 | % | | | 0.16 | % | | | (0.38 | )% |
Supplemental data | | | | | | | | | | | | | | | | | | | | | | | | | | | | |
Portfolio turnover rate | | | 39 | % | | | 101 | % | | | 123 | % | | | 116 | % | | | 26 | % | | | 44 | % | | | 23 | % |
Net assets, end of period (000s omitted) | | $ | 594,228 | | | $ | 550,758 | | | $ | 584,871 | | | $ | 460,187 | | | $ | 460,082 | | | $ | 465,952 | | | $ | 595,296 | |
| 1. | After the close of business on July 16, 2010, the Fund acquired the net assets of Evergreen Omega Fund which became the accounting and performance survivor in the transaction. The information for the periods prior to July 19, 2010 is that of Class A of Evergreen Omega Fund. |
| 2. | For the ten months ended July 31, 2010. The Fund changed its fiscal year end from September 30 to July 31, effective July 31, 2010. |
| 3. | Calculated based upon average shares outstanding |
| 4. | Total return calculations do not include any sales charges. Returns for periods of less than one year are not annualized. |
The accompanying notes are an integral part of these financial statements.
| | | | | | |
| Financial highlights | | Wells Fargo Advantage Omega Growth Fund | | | 15 | |
(For a share outstanding throughout each period)
| | | | | | | | | | | | | | | | | | | | | | | | | | | | |
| | | Six months ended
January 31, 2013
(unaudited) | | | Year ended July 31 | | | Year ended September 30 | |
| CLASS B | | | 2012 | | | 2011 | | | 20101,2 | | | 20091 | | | 20081 | | | 20071 | |
Net asset value, beginning of period | | | $33.12 | | | | $32.68 | | | | $25.89 | | | | $24.46 | | | | $23.62 | | | | $27.45 | | | | $22.51 | |
Net investment income (loss) | | | (0.07 | )3 | | | (0.47 | )3 | | | (0.48 | )3 | | | (0.25 | )3 | | | 0.02 | 3 | | | (0.15 | )3 | | | (0.27 | )3 |
Net realized and unrealized gains (losses) on investments | | | 3.71 | | | | 0.91 | | | | 7.27 | | | | 1.68 | | | | 0.82 | | | | (3.68 | ) | | | 5.21 | |
| | | | | | | | | | | | | | | | | | | | | | | | | | | | |
Total from investment operations | | | 3.64 | | | | 0.44 | | | | 6.79 | | | | 1.43 | | | | 0.84 | | | | (3.83 | ) | | | 4.94 | |
Distributions to shareholders from | | | | | | | | | | | | | | | | | | | | | | | | | | | | |
Net realized gains | | | (1.41 | ) | | | 0.00 | | | | 0.00 | | | | 0.00 | | | | 0.00 | | | | 0.00 | | | | 0.00 | |
Net asset value, end of period | | | $35.35 | | | | $33.12 | | | | $32.68 | | | | $25.89 | | | | $24.46 | | | | $23.62 | | | | $27.45 | |
Total return4 | | | 11.28 | % | | | 1.32 | % | | | 26.23 | % | | | 5.85 | % | | | 3.56 | % | | | (13.95 | )% | | | 21.95 | % |
Ratios to average net assets (annualized) | | | | | | | | | | | | | | | | | | | | | | | | | | | | |
Gross expenses | | | 2.09 | % | | | 2.10 | % | | | 2.12 | % | | | 2.10 | % | | | 2.22 | % | | | 2.16 | % | | | 2.15 | % |
Net expenses | | | 2.05 | % | | | 2.05 | % | | | 2.05 | % | | | 2.09 | % | | | 2.13 | % | | | 2.11 | % | | | 2.11 | % |
Net investment income (loss) | | | (0.39 | )% | | | (1.51 | )% | | | (1.55 | )% | | | (1.14 | )% | | | 0.10 | % | | | (0.61 | )% | | | (1.08 | )% |
Supplemental data | | | | | | | | | | | | | | | | | | | | | | | | | | | | |
Portfolio turnover rate | | | 39 | % | | | 101 | % | | | 123 | % | | | 116 | % | | | 26 | % | | | 44 | % | | | 23 | % |
Net assets, end of period (000s omitted) | | $ | 19,309 | | | $ | 22,271 | | | $ | 40,023 | | | $ | 46,434 | | | $ | 51,984 | | | $ | 85,008 | | | $ | 183,129 | |
| 1. | After the close of business on July 16, 2010, the Fund acquired the net assets of Evergreen Omega Fund which became the accounting and performance survivor in the transaction. The information for the periods prior to July 19, 2010 is that of Class B of Evergreen Omega Fund. |
| 2. | For the ten months ended July 31, 2010. The Fund changed its fiscal year end from September 30 to July 31, effective July 31, 2010. |
| 3. | Calculated based upon average shares outstanding |
| 4. | Total return calculations do not include any sales charges. Returns for periods of less than one year are not annualized. |
The accompanying notes are an integral part of these financial statements.
| | | | |
| 16 | | Wells Fargo Advantage Omega Growth Fund | | Financial highlights |
(For a share outstanding throughout each period)
| | | | | | | | | | | | | | | | | | | | | | | | | | | | |
| | | Six months ended
January 31, 2013
(unaudited) | | | Year ended July 31 | | | Year ended September 30 | |
| CLASS C | | | 2012 | | | 2011 | | | 20101,2 | | | 20091 | | | 20081 | | | 20071 | |
Net asset value, beginning of period | | | $33.18 | | | | $32.75 | | | | $25.94 | | | | $24.53 | | | | $23.69 | | | | $27.52 | | | | $22.57 | |
Net investment income (loss) | | | (0.07 | )3 | | | (0.47 | )3 | | | (0.49 | )3 | | | (0.25 | )3 | | | 0.00 | 3,4 | | | (0.15 | )3 | | | (0.27 | )3 |
Net realized and unrealized gains (losses) on investments | | | 3.73 | | | | 0.90 | | | | 7.30 | | | | 1.68 | | | | 0.84 | | | | (3.68 | ) | | | 5.22 | |
| | | | | | | | | | | | | | | | | | | | | | | | | | | | |
Total from investment operations | | | 3.66 | | | | 0.43 | | | | 6.81 | | | | 1.43 | | | | 0.84 | | | | (3.83 | ) | | | 4.95 | |
Distributions to shareholders from | | | | | | | | | | | | | | | | | | | | | | | | | | | | |
Net investment income | | | 0.00 | | | | 0.00 | | | | 0.00 | | | | (0.02 | ) | | | 0.00 | | | | 0.00 | | | | 0.00 | |
Net realized gains | | | (1.41 | ) | | | 0.00 | | | | 0.00 | | | | 0.00 | | | | 0.00 | | | | 0.00 | | | | 0.00 | |
| | | | | | | | | | | | | | | | | | | | | | | | | | | | |
Total distributions to shareholders | | | (1.41 | ) | | | 0.00 | | | | 0.00 | | | | (0.02 | ) | | | 0.00 | | | | 0.00 | | | | 0.00 | |
Net asset value, end of period | | | $35.43 | | | | $33.18 | | | | $32.75 | | | | $25.94 | | | | $24.53 | | | | $23.69 | | | | $27.52 | |
Total return5 | | | 11.29 | % | | | 1.31 | % | | | 26.25 | % | | | 5.83 | % | | | 3.55 | % | | | (13.92 | )% | | | 21.93 | % |
Ratios to average net assets (annualized) | | | | | | | | | | | | | | | | | | | | | | | | | | | | |
Gross expenses | | | 2.09 | % | | | 2.10 | % | | | 2.11 | % | | | 2.10 | % | | | 2.23 | % | | | 2.16 | % | | | 2.15 | % |
Net expenses | | | 2.05 | % | | | 2.05 | % | | | 2.05 | % | | | 2.09 | % | | | 2.14 | % | | | 2.11 | % | | | 2.11 | % |
Net investment income (loss) | | | (0.38 | )% | | | (1.49 | )% | | | (1.55 | )% | | | (1.15 | )% | | | 0.02 | % | | | (0.58 | )% | | | (1.09 | )% |
Supplemental data | | | | | | | | | | | | | | | | | | | | | | | | | | | | |
Portfolio turnover rate | | | 39 | % | | | 101 | % | | | 123 | % | | | 116 | % | | | 26 | % | | | 44 | % | | | 23 | % |
Net assets, end of period (000s omitted) | | $ | 69,401 | | | $ | 59,481 | | | $ | 58,329 | | | $ | 44,892 | | | $ | 43,806 | | | $ | 40,829 | | | $ | 54,982 | |
| 1. | After the close of business on July 16, 2010, the Fund acquired the net assets of Evergreen Omega Fund which became the accounting and performance survivor in the transaction. The information for the periods prior to July 19, 2010 is that of Class C of Evergreen Omega Fund. |
| 2. | For the ten months ended July 31, 2010. The Fund changed its fiscal year end from September 30 to July 31, effective July 31, 2010. |
| 3. | Calculated based upon average shares outstanding |
| 4. | Amount is less than $0.005. |
| 5. | Total return calculations do not include any sales charges. Returns for periods of less than one year are not annualized. |
The accompanying notes are an integral part of these financial statements.
| | | | | | |
| Financial highlights | | Wells Fargo Advantage Omega Growth Fund | | | 17 | |
(For a share outstanding throughout each period)
| | | | | | | | | | | | | | | | | | | | | | | | | | | | |
| | | Six months ended
January 31, 2013
(unaudited) | | | Year ended July 31 | | | Year ended September 30 | |
| CLASS R | | | 2012 | | | 2011 | | | 20101,2 | | | 20091 | | | 20081 | | | 20071 | |
Net asset value, beginning of period | | | $38.35 | | | | $37.66 | | | | $29.69 | | | | $28.09 | | | | $26.99 | | | | $31.20 | | | | $25.47 | |
Net investment income (loss) | | | 0.04 | | | | (0.36 | )3 | | | (0.13 | ) | | | (0.16 | )3 | | | 0.08 | 3 | | | (0.02 | )3 | | | (0.14 | )3 |
Net realized and unrealized gains (losses) on investments | | | 4.30 | | | | 1.05 | | | | 8.10 | | | | 1.94 | | | | 1.02 | | | | (4.19 | ) | | | 5.87 | |
| | | | | | | | | | | | | | | | | | | | | | | | | | | | |
Total from investment operations | | | 4.34 | | | | 0.69 | | | | 7.97 | | | | 1.78 | | | | 1.10 | | | | (4.21 | ) | | | 5.73 | |
Distributions to shareholders from | | | | | | | | | | | | | | | | | | | | | | | | | | | | |
Net investment income | | | 0.00 | | | | 0.00 | | | | 0.00 | | | | (0.18 | ) | | | 0.00 | | | | 0.00 | | | | 0.00 | |
Net realized gains | | | (1.41 | ) | | | 0.00 | | | | 0.00 | | | | 0.00 | | | | 0.00 | | | | 0.00 | | | | 0.00 | |
| | | | | | | | | | | | | | | | | | | | | | | | | | | | |
Total distributions to shareholders | | | (1.41 | ) | | | 0.00 | | | | 0.00 | | | | (0.18 | ) | | | 0.00 | | | | 0.00 | | | | 0.00 | |
Net asset value, end of period | | | $41.28 | | | | $38.35 | | | | $37.66 | | | | $29.69 | | | | $28.09 | | | | $26.99 | | | | $31.20 | |
Total return4 | | | 11.54 | % | | | 1.83 | % | | | 26.89 | % | | | 6.29 | % | | | 4.08 | % | | | (13.49 | )% | | | 22.50 | % |
Ratios to average net assets (annualized) | | | | | | | | | | | | | | | | | | | | | | | | | | | | |
Gross expenses | | | 1.59 | % | | | 1.60 | % | | | 1.59 | % | | | 1.60 | % | | | 1.76 | % | | | 1.66 | % | | | 1.65 | % |
Net expenses | | | 1.55 | % | | | 1.55 | % | | | 1.55 | % | | | 1.59 | % | | | 1.67 | % | | | 1.61 | % | | | 1.61 | % |
Net investment income (loss) | | | 0.11 | % | | | (0.99 | )% | | | (1.08 | )% | | | (0.65 | )% | | | 0.35 | % | | | (0.08 | )% | | | (0.53 | )% |
Supplemental data | | | | | | | | | | | | | | | | | | | | | | | | | | | | |
Portfolio turnover rate | | | 39 | % | | | 101 | % | | | 123 | % | | | 116 | % | | | 26 | % | | | 44 | % | | | 23 | % |
Net assets, end of period (000s omitted) | | $ | 17,522 | | | $ | 15,408 | | | $ | 6,515 | | | $ | 1,523 | | | $ | 838 | | | $ | 84 | | | $ | 63 | |
| 1. | After the close of business on July 16, 2010, the Fund acquired the net assets of Evergreen Omega Fund which became the accounting and performance survivor in the transaction. The information for the periods prior to July 19, 2010 is that of Class R of Evergreen Omega Fund. |
| 2. | For the ten months ended July 31, 2010. The Fund changed its fiscal year end from September 30 to July 31, effective July 31, 2010. |
| 3. | Calculated based upon average shares outstanding |
| 4. | Returns for periods of less than one year are not annualized. |
The accompanying notes are an integral part of these financial statements.
| | | | |
| 18 | | Wells Fargo Advantage Omega Growth Fund | | Financial highlights |
(For a share outstanding throughout each period)
| | | | | | | | | | | | | | | | | | | | | | | | | | | | |
| | | Six months ended
January 31, 2013
(unaudited) | | | Year ended July 31 | | | Year ended September 30 | |
| ADMINISTRATOR CLASS | | | 2012 | | | 2011 | | | 20101,2 | | | 20091 | | | 20081 | | | 20071 | |
Net asset value, beginning of period | | | $40.60 | | | | $39.67 | | | | $31.12 | | | | $29.39 | | | | $28.10 | | | | $32.32 | | | | $26.25 | |
Net investment income (loss) | | | 0.14 | 3 | | | (0.19 | )3 | | | (0.21 | )3 | | | (0.04 | )3 | | | 0.24 | 3 | | | 0.13 | 3 | | | (0.03 | )3 |
Net realized and unrealized gains (losses) on investments | | | 4.57 | | | | 1.12 | | | | 8.76 | | | | 2.02 | | | | 1.05 | | | | (4.35 | ) | | | 6.10 | |
| | | | | | | | | | | | | | | | | | | | | | | | | | | | |
Total from investment operations | | | 4.71 | | | | 0.93 | | | | 8.55 | | | | 1.98 | | | | 1.29 | | | | (4.22 | ) | | | 6.07 | |
Distributions to shareholders from | | | | | | | | | | | | | | | | | | | | | | | | | | | | |
Net investment income | | | 0.00 | | | | 0.00 | | | | 0.00 | | | | (0.25 | ) | | | 0.00 | | | | 0.00 | | | | 0.00 | |
Net realized gains | | | (1.41 | ) | | | 0.00 | | | | 0.00 | | | | 0.00 | | | | 0.00 | | | | 0.00 | | | | 0.00 | |
| | | | | | | | | | | | | | | | | | | | | | | | | | | | |
Total distributions to shareholders | | | (1.41 | ) | | | 0.00 | | | | 0.00 | | | | (0.25 | ) | | | 0.00 | | | | 0.00 | | | | 0.00 | |
Net asset value, end of period | | | $43.90 | | | | $40.60 | | | | $39.67 | | | | $31.12 | | | | $29.39 | | | | $28.10 | | | | $32.32 | |
Total return4 | | | 11.82 | % | | | 2.34 | % | | | 27.47 | % | | | 6.75 | % | | | 4.59 | % | | | (13.06 | )% | | | 23.12 | % |
Ratios to average net assets (annualized) | | | | | | | | | | | | | | | | | | | | | | | | | | | | |
Gross expenses | | | 1.17 | % | | | 1.17 | % | | | 1.18 | % | | | 1.11 | % | | | 1.23 | % | | | 1.17 | % | | | 1.15 | % |
Net expenses | | | 1.05 | % | | | 1.05 | % | | | 1.05 | % | | | 1.09 | % | | | 1.14 | % | | | 1.12 | % | | | 1.11 | % |
Net investment income (loss) | | | 0.66 | % | | | (0.49 | )% | | | (0.56 | )% | | | (0.16 | )% | | | 1.00 | % | | | 0.42 | % | | | (0.09 | )% |
Supplemental data | | | | | | | | | | | | | | | | | | | | | | | | | | | | |
Portfolio turnover rate | | | 39 | % | | | 101 | % | | | 123 | % | | | 116 | % | | | 26 | % | | | 44 | % | | | 23 | % |
Net assets, end of period (000s omitted) | | $ | 51,786 | | | $ | 51,560 | | | $ | 41,242 | | | $ | 29,724 | | | $ | 32,437 | | | $ | 23,910 | | | $ | 16,503 | |
| 1. | After the close of business on July 16, 2010, the Fund acquired the net assets of Evergreen Omega Fund which became the accounting and performance survivor in the transaction. The information for the periods prior to July 19, 2010 is that of Class I of Evergreen Omega Fund. |
| 2. | For the ten months ended July 31, 2010. The Fund changed its fiscal year end from September 30 to July 31, effective July 31, 2010. |
| 3. | Calculated based upon average shares outstanding |
| 4. | Returns for periods of less than one year are not annualized. |
The accompanying notes are an integral part of these financial statements.
| | | | | | |
| Financial highlights | | Wells Fargo Advantage Omega Growth Fund | | | 19 | |
(For a share outstanding throughout each period)
| | | | | | | | | | | | | | | | |
| | | Six months ended
January 31, 2013
(unaudited) | | | Year ended July 31 | |
| INSTITUTIONAL CLASS | | | 2012 | | | 2011 | | | 20101 | |
Net asset value, beginning of period | | $ | 40.81 | | | $ | 39.77 | | | $ | 31.12 | | | $ | 31.12 | |
Net Investment income (loss) | | | 0.19 | 2 | | | (0.10 | ) | | | (0.03 | ) | | | 0.00 | |
Net realized and unrealized gains (losses) on investments | | | 4.61 | | | | 1.14 | | | | 8.68 | | | | 0.00 | |
| | | | | | | | | | | | | | | | |
Total from investment operations | | | 4.80 | | | | 1.04 | | | | 8.65 | | | | 0.00 | |
Distributions to shareholders from | | | | | | | | | | | | | | | | |
Net realized gains | | | (1.41 | ) | | | 0.00 | | | | 0.00 | | | | 0.00 | |
Net asset value, end of period | | $ | 44.20 | | | $ | 40.81 | | | $ | 39.77 | | | $ | 31.12 | |
Total return3 | | | 11.98 | % | | | 2.62 | % | | | 27.80 | % | | | 0.00 | % |
Ratios to average net assets (annualized) | | | | | | | | | | | | | | | | |
Gross expenses | | | 0.91 | % | | | 0.92 | % | | | 0.88 | % | | | 0.00 | % |
Net expenses | | | 0.80 | % | | | 0.80 | % | | | 0.80 | % | | | 0.00 | % |
Net investment income (loss) | | | 0.89 | % | | | (0.24 | )% | | | (0.34 | )% | | | 0.00 | % |
Supplemental data | | | | | | | | | | | | | | | | |
Portfolio turnover rate | | | 39 | % | | | 101 | % | | | 123 | % | | | 116 | % |
Net assets, end of period (000s omitted) | | $ | 1,227 | | | $ | 779 | | | $ | 656 | | | $ | 10 | |
| 1. | For the period from July 30, 2010 (commencement of class operations) to July 31, 2010 |
| 2. | Calculated based upon average shares outstanding |
| 3. | Returns for periods of less than one year are not annualized. |
The accompanying notes are an integral part of these financial statements.
| | | | |
| 20 | | Wells Fargo Advantage Omega Growth Fund | | Notes to financial statements (unaudited) |
1. ORGANIZATION
Wells Fargo Funds Trust (the “Trust”), a Delaware statutory trust organized on March 10, 1999, is an open-end management investment company registered under the Investment Company Act of 1940, as amended (the “1940 Act”). These financial statements report on Wells Fargo Advantage Omega Growth Fund (the “Fund”) which is a diversified series of the Trust.
2. SIGNIFICANT ACCOUNTING POLICIES
The following significant accounting policies, which are consistently followed in the preparation of the financial statements of the Fund, are in conformity with U.S. generally accepted accounting principles which require management to make estimates and assumptions that affect the reported amounts of assets and liabilities, disclosure of contingent assets and liabilities at the date of the financial statements, and the reported amounts of revenues and expenses during the reporting period. Actual results could differ from those estimates.
Securities valuation
All investments are valued each business day as of the close of regular trading on the New York Stock Exchange (normally 4 p.m. Eastern Time).
Equity securities that are listed on a foreign or domestic exchange, except for The Nasdaq Stock Market, Inc. (“Nasdaq”), are valued at the official closing price or, if none, the last sales price. Securities listed on Nasdaq are valued at the Nasdaq Official Closing Price (“NOCP”). If no NOCP is available, securities are valued at the last sales price. If no sales price is shown on the Nasdaq, the bid price will be used. If no sale occurs on the primary exchange or market for the security that day or if no sale occurs and no bid price is shown on Nasdaq, the prior day’s price will be deemed “stale” and fair values will be determined in accordance with the Fund’s Valuation Procedures.
Investments in registered open-end investment companies are valued at net asset value. Non-registered investment companies are fair valued at net asset value.
Investments which are not valued using any of the methods discussed above are valued at their fair value, as determined by procedures established in good faith and approved by the Board of Trustees. The Board of Trustees has established a Valuation Committee comprised of the Trustees and has delegated to it the authority to take any actions regarding the valuation of portfolio securities that the Valuation Committee deems necessary or appropriate, including determining the fair value of portfolio securities, unless the determination has been delegated to the Management Valuation Team of Wells Fargo Funds Management, LLC (“Funds Management”). The Board of Trustees retains the authority to make or ratify any valuation decisions or approve any changes to the Valuation Procedures as it deems appropriate. On a quarterly basis, the Board of Trustees receives reports on any valuation actions taken by the Valuation Committee or the Management Valuation Team which may include items for ratification.
Valuations of fair valued securities are compared to the next actual sales price when available, or other appropriate market information to assess the continued appropriateness of the fair valuation methodology used. These securities are fair valued on a day-to-day basis, taking into consideration changes to appropriate market information and any significant changes to the input factors considered in the valuation process until there is a readily available price provided on the exchange or by an independent pricing service. Valuations received from an independent pricing service or broker quotes are periodically validated by comparisons to most recent trades and valuations provided by other independent pricing services in addition to the review of prices by the adviser and/or subadviser. Unobservable inputs used in determining fair valuations are identified based on the type of security, taking into consideration factors utilized by market participants in valuing the investment, knowledge about the issuer and the current market environment.
Security loans
The Fund may lend its securities from time to time in order to earn additional income in the form of fees or interest on securities received as collateral or the investment of any cash received as collateral. The Fund continues to receive interest or dividends on the securities loaned. The Fund receives collateral in the form of cash or securities with a value at least equal to the value of the securities on loan. The value of the loaned securities is determined at the close of each business day and any additional required collateral is delivered to the Fund on the next business day. In a securities lending transaction, the net asset value of the Fund will be affected by an increase or decrease in the value of the securities loaned and by an increase or decrease in the value of the instrument in which collateral is invested. The amount of securities lending activity undertaken by the Fund fluctuates from time to time. In the event of default or bankruptcy by the borrower, the Fund may be prevented from recovering the loaned securities or gaining access to the collateral or may experience delays or costs in doing so. In addition, the investment of any cash collateral received may lose all or part of its value. The Fund has the right under the lending agreement to recover the securities from the borrower on demand.
| | | | | | |
| Notes to financial statements (unaudited) | | Wells Fargo Advantage Omega Growth Fund | | | 21 | |
The Fund lends its securities through an unaffiliated securities lending agent. Cash collateral received in connection with its securities lending transactions is invested in Wells Fargo Securities Lending Cash Investments, LLC (the “Cash Collateral Fund”). The Cash Collateral Fund is exempt from registration under Section 3(c)(7) of the 1940 Act and is managed by Funds Management and is subadvised by Wells Capital Management Incorporated (“WellsCap”). Funds Management receives an advisory fee starting at 0.05% and declining to 0.01% as the average daily net assets of the Cash Collateral Fund increase. All of the fees received by Funds Management are paid to WellsCap for its services as subadviser. The Cash Collateral Fund seeks to provide a positive return compared to the daily Fed Funds Open rate by investing in high-quality, U.S. dollar-denominated short-term money market instruments. Cash Collateral Fund investments are fair valued based upon the amortized cost valuation technique. Income earned from investment in the Cash Collateral Fund is included in securities lending income on the Statement of Operations.
Security transactions and income recognition
Securities transactions are recorded on a trade date basis. Realized gains or losses are recorded on the basis of identified cost.
Dividend income is recognized on the ex-dividend date.
Distributions to shareholders
Distributions to shareholders from net investment income and net realized gains, if any, are recorded on the ex-dividend date. Such distributions are determined in conformity with federal income tax regulations, which may differ in amount or character from net investment income and realized gains recognized for purposes of U.S. generally accepted accounting principles.
Federal and other taxes
The Fund intends to continue to qualify as a regulated investment company by distributing substantially all of its investment company taxable income and any net realized capital gains (after reduction for capital loss carryforwards) sufficient to relieve it from all, or substantially all, federal income taxes. Accordingly, no provision for federal income taxes was required.
The Fund’s income and federal excise tax returns and all financial records supporting those returns for the prior three fiscal years are subject to examination by the federal and Delaware revenue authorities. Management has analyzed the Fund’s tax positions taken on federal, state, and foreign tax returns for all open tax years and does not believe that there are any uncertain tax positions that require recognition of a tax liability.
As of July 31, 2012, the Fund had a qualified late-year ordinary loss of $3,303,151 which will be recognized on the first day of the current fiscal year. A late-year ordinary loss is the net loss comprised of (a) net gain or loss from the sale or other disposition of certain capital assets for the portion of the taxable year after October 31 and (b) other ordinary income or loss for the portion of the taxable year after December 31.
Class allocations
The separate classes of shares offered by the Fund differ principally in applicable sales charges, distribution, shareholder servicing, and administration fees. Shareholders of each class bear certain expenses that pertain to that particular class. All shareholders bear the common expenses of the Fund, earn income from the portfolio, and are allocated any unrealized gains and losses pro rata based on the average daily net assets of each class, without distinction between share classes. Dividends are determined separately for each class based on income and expenses allocable to each class. Realized gains and losses are allocated to each class pro rata based upon the net assets of each class on the date realized. Differences in per share dividend rates generally result from the relative weightings of pro rata income and realized gain allocations and from differences in separate class expenses, including distribution, shareholder servicing, and administration fees.
3. FAIR VALUATION MEASUREMENTS
Fair value measurements of investments are determined within a framework that has established a fair value hierarchy based upon the various data inputs utilized in determining the value of the Fund’s investments. The three-level hierarchy gives the highest priority to unadjusted quoted prices in active markets for identical assets or liabilities (Level 1) and the lowest priority to significant unobservable inputs (Level 3). The Fund’s investments are classified within the fair value hierarchy based on the lowest level of input that is significant to the fair value measurement. The inputs are summarized into three broad levels as follows:
| n | | Level 1 – quoted prices in active markets for identical securities |
| n | | Level 2 – other significant observable inputs (including quoted prices for similar securities, interest rates, prepayment speeds, credit risk, use of amortized cost, etc.) |
| n | | Level 3 – significant unobservable inputs (including the Fund’s own assumptions in determining the fair value of investments) |
The inputs or methodologies used for valuing investments in securities are not necessarily an indication of the risk associated with investing in those securities.
| | | | |
| 22 | | Wells Fargo Advantage Omega Growth Fund | | Notes to financial statements (unaudited) |
As of January 31, 2013, the inputs used in valuing investments in securities, which are carried at fair value, were as follows:
| | | | | | | | | | | | | | | | |
| Investments in securities | | Quoted prices (Level 1) | | | Significant other
observable inputs (Level 2) | | | Significant unobservable inputs (Level 3) | | | Total | |
| | | | |
Equity securities | | | | | | | | | | | | | | | | |
Common stocks | | $ | 745,187,466 | | | $ | 0 | | | $ | 0 | | | $ | 745,187,466 | |
| | | | |
Short-term investments | | | | | | | | | | | | | | | | |
Investment companies | | | 10,478,408 | | | | 110,743,925 | | | | 0 | | | | 121,222,333 | |
| | | $ | 755,665,874 | | | $ | 110,743,925 | | | $ | 0 | | | $ | 866,409,799 | |
Further details on the major security types listed above can be found in the Portfolio of Investments.
Transfers in and transfers out are recognized at the end of the reporting period. For the six months ended January 31, 2013, the Fund did not have any transfers into/out of Level 1 or Level 2.
4. TRANSACTIONS WITH AFFILIATES AND OTHER EXPENSES
Advisory fee
The Trust has entered into an advisory contract with Funds Management, an indirect wholly owned subsidiary of Wells Fargo & Company (“Wells Fargo”). The adviser is responsible for implementing investment policies and guidelines and for supervising the subadviser, who is responsible for day-to-day portfolio management of the Fund.
Pursuant to the contract, Funds Management is entitled to receive an annual advisory fee starting at 0.75% and declining to 0.60% as the average daily net assets of the Fund increase. For the six months ended January 31, 2013, the advisory fee was equivalent to an annual rate of 0.73% of the Fund’s average daily net assets.
Funds Management has retained the services of a subadviser to provide daily portfolio management to the Fund. The fee for subadvisory services is borne by Funds Management. WellsCap, an affiliate of Funds Management, is the subadviser to the Fund and is entitled to receive a fee from Funds Management at an annual rate starting at 0.45% and declining to 0.20% as the average daily net assets of the Fund increase. Prior to October 1, 2012, WellsCap received a fee at an annual rate which started at 0.35% and declined to 0.15% as the average daily net assets of the Fund increased.
Administration and transfer agent fees
The Trust has entered into an administration agreement with Funds Management. Under this agreement, for providing administrative services, which includes paying fees and expenses for services provided by the transfer agent, sub-transfer agents, omnibus account servicers and record-keepers, Funds Management is entitled to receive from the Fund an annual fund level administration fee starting at 0.05% and declining to 0.03% as the average daily net assets of the Fund increase and a class level administration fee which is calculated based on the average daily net assets of each class as follows:
| | | | |
| | | Class level administration fee | |
Class A, Class B, Class C, Class R | | | 0.26 | % |
Administrator Class | | | 0.10 | |
Institutional Class | | | 0.08 | |
Funds Management has contractually waived and/or reimbursed advisory and administration fees to the extent necessary to maintain certain net operating expense ratios for the Fund. Waiver of fees and/or reimbursement of expenses by Funds Management were made first from fund level expenses on a proportionate basis and then from class specific expenses. Funds Management has committed through November 30, 2013 to waive fees and/or reimburse expenses to the extent necessary to cap the Fund’s expenses at 1.30% for Class A shares, 2.05% for Class B shares, 2.05% for Class C shares, 1.55% for Class R shares, 1.05% for Administrator Class shares, and 0.80% for Institutional Class shares.
Distribution fees
The Trust has adopted a Distribution Plan for Class B, Class C, and Class R shares of the Fund pursuant to Rule 12b-1 under the 1940 Act. Distribution fees are charged to Class B, Class C, and Class R shares and paid to Wells Fargo Funds Distributor, LLC, the principal underwriter, at an annual rate of 0.75% of the average daily net assets of Class B and Class C shares and 0.25% of the average daily net assets of Class R shares.
| | | | | | |
| Notes to financial statements (unaudited) | | Wells Fargo Advantage Omega Growth Fund | | | 23 | |
For the six months ended January 31, 2013, Wells Fargo Funds Distributor, LLC received $28,912 from the sale of Class A shares and $250, $816, and $1,171 in contingent deferred sales charges from redemptions of Class A, Class B and Class C shares, respectively.
Shareholder servicing fees
The Trust has entered into contracts with one or more shareholder servicing agents, whereby Class A, Class B, Class C, Class R, and Administrator Class of the Fund is charged a fee at an annual rate of 0.25% of the average daily net assets of each respective class.
A portion of these total shareholder servicing fees were paid to affiliates of Wells Fargo.
5. INVESTMENT PORTFOLIO TRANSACTIONS
Purchases and sales of investments, excluding U.S. government obligations (if any) and short-term securities, for the six months ended January 31, 2013 were $282,047,151 and $286,476,152, respectively.
6. BANK BORROWINGS
The Trust (excluding the money market funds and certain other funds in the Trust) and Wells Fargo Variable Trust are parties to a $150,000,000 revolving credit agreement with State Street Bank and Trust Company, whereby the Fund is permitted to use bank borrowings for temporary or emergency purposes, such as to fund shareholder redemption requests. Interest under the credit agreement is charged to the Fund based on a borrowing rate equal to the higher of the Federal Funds rate in effect on that day plus 1.25% or the overnight LIBOR rate in effect on that day plus 1.25%. In addition, an annual commitment fee equal to 0.10% of the unused balance is allocated to each participating fund. For the six months ended January 31, 2013, the Fund paid $313 in commitment fees.
For the six months ended January 31, 2013, there were no borrowings by the Fund under the agreement.
7. INDEMNIFICATION
Under the Trust’s organizational documents, the officers and directors are indemnified against certain liabilities that may arise out of performance of their duties to the Trust. Additionally, in the normal course of business, the Trust may enter into contracts with service providers that contain a variety of indemnification clauses. The Trust’s maximum exposure under these arrangements is dependent on future claims that may be made against the Fund and, therefore, cannot be estimated.
8. NEW ACCOUNTING PRONOUNCEMENT
In December 2011, the Financial Accounting Standards Board (“FASB”) issued Accounting Standard Update (“ASU”) No. 2011-11, Disclosures about Offsetting Assets and Liabilities. ASU 2011-11, which amends FASB ASC Topic 210, Balance Sheet, creates new disclosure requirements which require entities to disclose both gross and net information for derivatives and other financial instruments that are either offset in the Statement of Assets and Liabilities or subject to an enforceable master netting arrangement or similar agreement. The disclosure requirements are effective for interim and annual reporting periods beginning on or after January 1, 2013. Management is currently assessing the potential impact, in addition to expanded financial statement disclosure, that may result from adopting this ASU.
| | | | |
| 24 | | Wells Fargo Advantage Omega Growth Fund | | Other information (unaudited) |
PROXY VOTING INFORMATION
A description of the policies and procedures that the Fund uses to determine how to vote proxies relating to portfolio securities is available without charge, upon request, by calling 1-800-222-8222, visiting our website at wellsfargoadvantagefunds.com, or visiting the SEC website at sec.gov. Information regarding how the Fund voted proxies relating to portfolio securities during the most recent 12-month period ended June 30 is available without charge on the Fund’s website at wellsfargoadvantagefunds.com or by visiting the SEC website at sec.gov.
PORTFOLIO HOLDINGS INFORMATION
The complete portfolio holdings for the Fund are publicly available on the Fund’s website (wellsfargoadvantagefunds.com) on a monthly, 30-day or more delayed basis. In addition, top ten holdings information for the Fund is publicly available on the Fund’s website on a monthly, seven-day or more delayed basis. The Fund files its complete schedule of portfolio holdings with the SEC for the first and third quarters of each fiscal year on Form N-Q, which is available without charge by visiting the SEC website at sec.gov. In addition, the Fund’s Form N-Q may be reviewed and copied at the SEC’s Public Reference Room in Washington, DC, and at regional offices in New York City, at 233 Broadway, and in Chicago, at 175 West Jackson Boulevard, Suite 900. Information about the Public Reference Room may be obtained by calling 1-800-SEC-0330.
| | | | | | |
| Other information (unaudited) | | Wells Fargo Advantage Omega Growth Fund | | | 25 | |
BOARD OF TRUSTEES AND OFFICERS
Each of the Trustees and Officers listed in the table below acts in identical capacities for the Wells Fargo Advantage family of funds, which consists of 136 funds1 comprising the Wells Fargo Funds Trust, Wells Fargo Variable Trust, Wells Fargo Master Trust and four closed-end funds (collectively the “Fund Complex”). This table should be read in conjunction with the Prospectus and the Statement of Additional Information2. All of the Trustees are also Members of the Audit and Governance Committees of each Trust in the Fund Complex. The mailing address of each Trustee and Officer is 525 Market Street, 12th Floor, San Francisco, CA 94105. Each Trustee and Officer serves an indefinite term, however, each Trustee serves such term until reaching the mandatory retirement age established by the Trustees.
Independent Trustees
| | | | | | |
Name and
year of birth | | Position held and
length of service* | | Principal occupations during past five years | | Other
directorships during
past five years |
Peter G. Gordon
(Born 1942) | | Trustee, since 1998; Chairman, since 2005 | | Co-Founder, Retired Chairman, President and CEO of Crystal Geyser Water Company. Trustee Emeritus, Colby College. | | Asset Allocation Trust |
Isaiah Harris, Jr.
(Born 1952) | | Trustee, since 2009 | | Retired. Prior thereto, President and CEO of BellSouth Advertising and Publishing Corp. from 2005 to 2007, President and CEO of BellSouth Enterprises from 2004 to 2005 and President of BellSouth Consumer Services from 2000 to 2003. Emeritus member of the Iowa State University Foundation Board of Governors. Emeritus Member of the Advisory Board of Iowa State University School of Business. Advisory Board Member, Palm Coast Academy (charter school). Mr. Harris is a certified public accountant. | | CIGNA Corporation; Deluxe Corporation; Asset Allocation Trust |
Judith M. Johnson
(Born 1949) | | Trustee, since 2008;
Audit Committee Chairman, since 2008 | | Retired. Prior thereto, Chief Executive Officer and Chief Investment Officer of Minneapolis Employees Retirement Fund from 1996 to 2008. Ms. Johnson is an attorney, certified public accountant and a certified managerial accountant. | | Asset Allocation Trust |
Leroy Keith, Jr.
(Born 1939) | | Trustee, since 2010 | | Chairman, Bloc Global Services (development and construction). Trustee of the Evergreen Funds from 1983 to 2010. Former Managing Director, Almanac Capital Management (commodities firm), former Partner, Stonington Partners, Inc. (private equity fund), former Director, Obagi Medical Products Co. and former Director, Lincoln Educational Services. | | Trustee, Virtus Fund Complex (consisting of 48 portfolios as of 1/31/2013); Asset Allocation Trust |
David F. Larcker
(Born 1950) | | Trustee, since 2009 | | James Irvin Miller Professor of Accounting at the Graduate School of Business, Stanford University, Morgan Stanley Director of the Center for Leadership Development and Research and Senior Faculty of The Rock Center for Corporate Governance since 2006. From 2005 to 2008, Professor of Accounting at the Graduate School of Business, Stanford University. Prior thereto, Ernst & Young Professor of Accounting at The Wharton School, University of Pennsylvania from 1985 to 2005. | | Asset Allocation Trust |
Olivia S. Mitchell
(Born 1953) | | Trustee, since 2006 | | International Foundation of Employee Benefit Plans Professor, Wharton School of the University of Pennsylvania since 1993. Director of Wharton’s Pension Research Council and Boettner Center on Pensions & Retirement Research, and Research Associate at the National Bureau of Economic Research. Previously, Cornell University Professor from 1978 to 1993. | | Asset Allocation Trust |
Timothy J. Penny
(Born 1951) | | Trustee, since 1996 | | President and CEO of Southern Minnesota Initiative Foundation, a non-profit organization, since 2007 and Senior Fellow at the Humphrey Institute Policy Forum at the University of Minnesota since 1995. Member of the Board of Trustees of NorthStar Education Finance, Inc., a non-profit organization, since 2007. | | Asset Allocation Trust |
Michael S. Scofield
(Born 1943) | | Trustee, since 2010 | | Served on the Investment Company Institute’s Board of Governors and Executive Committee from 2008-2011 as well the Governing Council of the Independent Directors Council from 2006-2011 and the Independent Directors Council Executive Committee from 2008-2011. Chairman of the IDC from 2008-2010. Institutional Investor (Fund Directions) Trustee of Year in 2007. Trustee of the Evergreen Funds (and its predecessors) from 1984 to 2010. Chairman of the Evergreen Funds from 2000-2010. Former Trustee of the Mentor Funds. Retired Attorney, Law Offices of Michael S. Scofield. | | Asset Allocation Trust |
| | | | |
| 26 | | Wells Fargo Advantage Omega Growth Fund | | Other information (unaudited) |
| | | | | | |
Name and
year of birth | | Position held and
length of service* | | Principal occupations during past five years | | Other
directorships during
past five years |
Donald C. Willeke
(Born 1940) | | Trustee, since 1996 | | Principal of the law firm of Willeke & Daniels. General Counsel of the Minneapolis Employees Retirement Fund from 1984 until its consolidation into the Minnesota Public Employees Retirement Association on June 30, 2010. Director and Vice Chair of The Tree Trust (non-profit corporation). Director of the American Chestnut Foundation (non-profit corporation). | | Asset Allocation Trust |
| * | Length of service dates reflect the Trustee’s commencement of service with the Trust’s predecessor entities, where applicable. |
Officers
| | | | | | |
Name and
year of birth | | Position held and
length of service | | Principal occupations during past five years | | |
Karla M. Rabusch
(Born 1959) | | President, since 2003 | | Executive Vice President of Wells Fargo Bank, N.A. and President of Wells Fargo Funds Management, LLC since 2003. | | |
Jeremy DePalma1
(Born 1974) | | Treasurer, since 2012 | | Senior Vice President of Wells Fargo Funds Management, LLC since 2009. Senior Vice President of Evergreen Investment Management Company, LLC from 2008 to 2010. Vice President, Evergreen Investment Services, Inc. from 2004 to 2007. Head of the Fund Reporting and Control Team within Fund Administration from 2005 to 2010. | | |
C. David Messman
(Born 1960) | | Secretary, since 2000; Chief Legal Officer, since 2003 | | Senior Vice President and Secretary of Wells Fargo Funds Management, LLC since 2001. Vice President and Managing Counsel of Wells Fargo Bank, N.A. since 1996. | | |
Debra Ann Early
(Born 1964) | | Chief Compliance Officer, since 2007 | | Chief Compliance Officer of Wells Fargo Funds Management, LLC since 2007. Chief Compliance Officer of Parnassus Investments from 2005 to 2007. Chief Financial Officer of Parnassus Investments from 2004 to 2007. | | |
David Berardi
(Born 1975) | | Assistant Treasurer, since 2009 | | Vice President of Wells Fargo Funds Management, LLC since 2009. Vice President of Evergreen Investment Management Company, LLC from 2008 to 2010. Assistant Vice President of Evergreen Investment Services, Inc. from 2004 to 2008. Manager of Fund Reporting and Control for Evergreen Investment Management Company, LLC from 2004 to 2010. | | |
| 1. | Jeremy DePalma acts as Treasurer of 61 funds and Assistant Treasurer of 75 funds in the Fund Complex. |
| 2. | The Statement of Additional Information includes additional information about the Trustees and is available,without charge, upon request, by calling 1-800-222-8222 or by visiting t he website at wellsfargoadvantagefunds.com. |
| | | | | | |
| List of abbreviations | | Wells Fargo Advantage Omega Growth Fund | | | 27 | |
The following is a list of common abbreviations for terms and entities that may have appeared in this report.
| ACA | — ACA Financial Guaranty Corporation |
| ADR | — American depositary receipt |
| ADS | — American depositary shares |
| AGC | — Assured Guaranty Corporation |
| AGM | — Assured Guaranty Municipal |
| Ambac | — Ambac Financial Group Incorporated |
| AMT | — Alternative minimum tax |
| BAN | — Bond anticipation notes |
| BHAC | — Berkshire Hathaway Assurance Corporation |
| CAB | — Capital appreciation bond |
| CCAB | — Convertible capital appreciation bond |
| CDA | — Community Development Authority |
| CDO | — Collateralized debt obligation |
| COP | — Certificate of participation |
| DRIVER | — Derivative inverse tax-exempt receipts |
| DW&P | — Department of Water & Power |
| DWR | — Department of Water Resources |
| ECFA | — Educational & Cultural Facilities Authority |
| EDA | — Economic Development Authority |
| EDFA | — Economic Development Finance Authority |
| ETF | — Exchange-traded fund |
| FDIC | — Federal Deposit Insurance Corporation |
| FFCB | — Federal Farm Credit Banks |
| FGIC | — Financial Guaranty Insurance Corporation |
| FHA | — Federal Housing Administration |
| FHLB | — Federal Home Loan Bank |
| FHLMC | — Federal Home Loan Mortgage Corporation |
| FICO | — The Financing Corporation |
| FNMA | — Federal National Mortgage Association |
| GDR | — Global depositary receipt |
| GNMA | — Government National Mortgage Association |
| HCFR | — Healthcare facilities revenue |
| HEFA | — Health & Educational Facilities Authority |
| HEFAR | — Higher education facilities authority revenue |
| HFA | — Housing Finance Authority |
| HFFA | — Health Facilities Financing Authority |
| HUD | — Department of Housing and Urban Development |
| IDA | — Industrial Development Authority |
| IDAG | — Industrial Development Agency |
| IDR | — Industrial development revenue |
| KRW | — Republic of Korea won |
| LIBOR | — London Interbank Offered Rate |
| LLC | — Limited liability company |
| LLP | — Limited liability partnership |
| MBIA | — Municipal Bond Insurance Association |
| MFHR | — Multifamily housing revenue |
| MSTR | — Municipal securities trust receipts |
| MUD | — Municipal Utility District |
| National | — National Public Finance Guarantee Corporation |
| PCFA | — Pollution Control Financing Authority |
| PCL | — Public Company Limited |
| PCR | — Pollution control revenue |
| PFA | — Public Finance Authority |
| PFFA | — Public Facilities Financing Authority |
| PFOTER | — Puttable floating option tax-exempt receipts |
| plc | — Public limited company |
| PUTTER | — Puttable tax-exempt receipts |
| R&D | — Research & development |
| Radian | — Radian Asset Assurance |
| RAN | — Revenue anticipation notes |
| RDA | — Redevelopment Authority |
| RDFA | — Redevelopment Finance Authority |
| REIT | — Real estate investment trust |
| ROC | — Reset option certificates |
| SAVRS | — Select auction variable rate securities |
| SBA | — Small Business Authority |
| SFHR | — Single-family housing revenue |
| SFMR | — Single-family mortgage revenue |
| SPA | — Standby purchase agreement |
| SPDR | — Standard & Poor’s Depositary Receipts |
| STRIPS | — Separate trading of registered interest and principal securities |
| TAN | — Tax anticipation notes |
| TIPS | — Treasury inflation-protected securities |
| TRAN | — Tax revenue anticipation notes |
| TTFA | — Transportation Trust Fund Authority |
| TVA | — Tennessee Valley Authority |
This page is intentionally left blank.
This page is intentionally left blank.
This page is intentionally left blank.


For more information
More information about Wells Fargo Advantage Funds is available free upon request. To obtain literature, please write, email, visit the Fund’s website, or call:
Wells Fargo Advantage Funds
P.O. Box 8266
Boston, MA 02266-8266
Email: wfaf@wellsfargo.com
Website: wellsfargoadvantagefunds.com
Individual investors: 1-800-222-8222
Retail investment professionals: 1-888-877-9275
Institutional investment professionals: 1-866-765-0778
This report and the financial statements contained herein are submitted for the general information of the shareholders of Wells Fargo Advantage Funds. If this report is used for promotional purposes, distribution of the report must be accompanied or preceded by a current prospectus. For a current prospectus and, if available, a summary prospectus containing more complete information, including charges and expenses, call 1-800-222-8222 or visit the Fund’s website at wellsfargoadvantagefunds.com. Please consider the investment objectives, risks, charges, and expenses of the investment carefully before investing. This and other information about Wells Fargo Advantage Funds can be found in the current prospectus. Read the prospectus carefully before you invest or send money.
Wells Fargo Funds Management, LLC, a wholly owned subsidiary of Wells Fargo & Company, provides investment advisory and administrative services for Wells Fargo Advantage Funds. Other affiliates of Wells Fargo & Company provide subadvisory and other services for the Funds. The Funds are distributed by Wells Fargo Funds Distributor, LLC, Member FINRA/SIPC, an affiliate of Wells Fargo & Company.
NOT FDIC INSURED ¡ NO BANK GUARANTEE ¡ MAY LOSE VALUE
© 2013 Wells Fargo Funds Management, LLC. All rights reserved.
| | |
 | | 215109 03-13 SA211/SAR211 1-13 |

Wells Fargo Advantage
Premier Large Company Growth Fund

Semi-Annual Report
January 31, 2013

Reduce clutter. Save trees.
Sign up for electronic delivery of prospectuses and shareholder reports at wellsfargo.com/advantagedelivery
Contents
The views expressed and any forward-looking statements are as of January 31, 2013, unless otherwise noted, and are those of the Fund managers and/or Wells Fargo Funds Management, LLC. Discussions of individual securities, or the markets generally, or any Wells Fargo Advantage Fund are not intended as individual recommendations. Future events or results may vary significantly from those expressed in any forward-looking statements; the views expressed are subject to change at any time in response to changing circumstances in the market. Wells Fargo Funds Management, LLC, disclaims any obligation to publicly update or revise any views expressed or forward-looking statements.
NOT FDIC INSURED ¡ NO BANK GUARANTEE ¡ MAY LOSE VALUE

Wells Fargo investment history
| | |
| 1932 | | Keystone creates one of the first mutual fund families. |
| 1971 | | Wells Fargo & Company introduces one of the first institutional index funds. |
| 1978 | | Wells Fargo applies Markowitz and Sharpe’s research on Modern Portfolio Theory to introduce one of the industry’s first tactical asset allocation models in institutional separately managed accounts. |
| 1984 | | Wells Fargo Stagecoach Funds launches its first asset allocation fund. |
| 1989 | | The Tactical Asset Allocation (TAA) Model is first applied to Wells Fargo’s asset allocation mutual funds. |
| 1994 | | Wells Fargo introduces the LifePath Funds, one of the first suites of target date funds (now the Wells Fargo Advantage Dow Jones Target Date FundsSM). |
| 1996 | | Evergreen Investments and Keystone Funds merge. |
| 1997 | | Wells Fargo launches the Wells Fargo Advantage WealthBuilder PortfoliosSM, a fund-of-funds suite of products that includes the use of quantitative models to shift assets among investment styles. |
| 1999 | | Norwest Advantage Funds and Stagecoach Funds are reorganized into Wells Fargo Funds after the merger of Norwest and Wells Fargo. |
| 2002 | | Evergreen Retail and Evergreen Institutional companies form the umbrella asset management company, Evergreen Investments. |
| 2005 | | The integration of Strong Funds with Wells Fargo Funds creates Wells Fargo Advantage Funds, resulting in one of the top 20 mutual fund companies in the United States. |
| 2006 | | Wells Fargo Advantage Funds relaunches the target date product line as Wells Fargo Advantage Dow Jones Target Date Funds. |
| 2010 | | The mergers and reorganizations of Evergreen and Wells Fargo Advantage mutual funds are completed, unifying the families under the brand of Wells Fargo Advantage Funds. |
Wells Fargo Advantage Funds®
Wells Fargo Advantage Funds skillfully guides institutions, financial advisors, and individuals through the investment terrain to help them reach their financial objectives. Everything we do on behalf of investors is backed by our unique combination of qualifications.
Strength
Our organization is built on the standards of integrity and service established by our parent company—Wells Fargo & Company—more than 150 years ago. And, because we’re part of a highly diversified financial enterprise, we offer the depth of resources to help investors succeed.
Expertise
Our multi-boutique model offers investors access to the independent thinking of premier investment managers that have been chosen for their time-tested strategies. While each team specializes in a specific investment strategy, collectively they provide investors a wide choice of distinct investment styles. Our dedication to investment excellence doesn’t end with our expertise in manager selection—risk management, analysis, and rigorous ongoing review seek to ensure each manager’s investment process remains consistent.
Partnership
Our collaborative approach is built around understanding the needs and goals of our clients. By adhering to core principles of sound judgment and steady guidance, we support you through every stage of the investment decision process.
Carefully consider the investment objectives, risks, charges, and expenses before investing. For a current prospectus and, if available, a summary prospectus, for Wells Fargo Advantage Funds, containing this and other information, visit wellsfargoadvantagefunds.com. Read it carefully before investing.
Wells Fargo Funds Management, LLC, a wholly owned subsidiary of Wells Fargo & Company, provides investment advisory and administrative services for Wells Fargo Advantage Funds. Other affiliates of Wells Fargo & Company provide subadvisory and other services for the Funds. The Funds are distributed by Wells Fargo Funds Distributor, LLC, Member FINRA/SIPC, an affiliate of Wells Fargo & Company.
“Dow Jones®” and “Dow Jones Target Date IndexesSM” are service marks of Dow Jones Trademark Holdings LLC (“Dow Jones”); have been licensed to CME Group Index Services LLC (“CME Indexes”); and have been sublicensed for use for certain purposes by Global Index Advisors, Inc., and Wells Fargo Funds Management, LLC. The Wells Fargo Advantage Dow Jones Target Date FundsSM, based on the Dow Jones Target Date Indexes, are not sponsored, endorsed, sold, or promoted by Dow Jones, CME Indexes, or their respective affiliates, and none of them makes any representation regarding the advisability of investing in such product(s).
NOT FDIC INSURED ¡ NO BANK GUARANTEE ¡ MAY LOSE VALUE
Not part of the semi-annual report.
Wells Fargo Advantage Funds offers more than 110 mutual funds across a wide range of asset classes, representing over $226 billion in assets under management, as of January 31, 2013.
| | | | |
| Equity funds | | | | |
Asia Pacific Fund | | Enterprise Fund† | | Opportunity Fund† |
C&B Large Cap Value Fund | | Global Opportunities Fund | | Precious Metals Fund |
C&B Mid Cap Value Fund | | Growth Fund | | Premier Large Company Growth Fund |
Capital Growth Fund | | Index Fund | | Small Cap Opportunities Fund |
Common Stock Fund | | International Equity Fund | | Small Cap Value Fund |
Disciplined U.S. Core Fund | | International Value Fund | | Small Company Growth Fund |
Discovery Fund† | | Intrinsic Small Cap Value Fund | | Small Company Value Fund |
Diversified Equity Fund | | Intrinsic Value Fund | | Small/Mid Cap Value Fund |
Diversified International Fund | | Intrinsic World Equity Fund | | Special Mid Cap Value Fund |
Emerging Growth Fund | | Large Cap Core Fund | | Special Small Cap Value Fund |
Emerging Markets Equity Fund | | Large Cap Growth Fund | | Specialized Technology Fund |
Emerging Markets Equity Income Fund | | Large Company Value Fund | | Traditional Small Cap Growth Fund |
Endeavor Select Fund† | | Omega Growth Fund | | Utility and Telecommunications Fund |
| Bond funds | | | | |
Adjustable Rate Government Fund | | High Yield Municipal Bond Fund | | Short Duration Government Bond Fund |
California Limited-Term Tax-Free Fund | | Income Plus Fund | | Short-Term Bond Fund |
California Tax-Free Fund | | Inflation-Protected Bond Fund | | Short-Term High Yield Bond Fund |
Colorado Tax-Free Fund | | Intermediate Tax/AMT-Free Fund | | Short-Term Municipal Bond Fund |
Core Bond Fund | | International Bond Fund | | Strategic Income Fund |
Emerging Markets Local Bond Fund | | Minnesota Tax-Free Fund | | Strategic Municipal Bond Fund |
Government Securities Fund | | Municipal Bond Fund | | Ultra Short-Term Income Fund |
High Income Fund | | North Carolina Tax-Free Fund | | Ultra Short-Term Municipal Income Fund |
High Yield Bond Fund | | Pennsylvania Tax-Free Fund | | Wisconsin Tax-Free Fund |
| Asset allocation funds | | | | |
Absolute Return Fund | | WealthBuilder Equity Portfolio† | | Target 2020 Fund† |
Asset Allocation Fund | | WealthBuilder Growth Allocation Portfolio† | | Target 2025 Fund† |
Conservative Allocation Fund | | WealthBuilder Growth Balanced Portfolio† | | Target 2030 Fund† |
Diversified Capital Builder Fund | | WealthBuilder Moderate Balanced Portfolio† | | Target 2035 Fund† |
Diversified Income Builder Fund | | WealthBuilder Tactical Equity Portfolio† | | Target 2040 Fund† |
Growth Balanced Fund | | Target Today Fund† | | Target 2045 Fund† |
Index Asset Allocation Fund | | Target 2010 Fund† | | Target 2050 Fund† |
Moderate Balanced Fund | | Target 2015 Fund† | | Target 2055 Fund† |
WealthBuilder Conservative Allocation Portfolio† | | | | |
| Money market funds | | | | |
100% Treasury Money Market Fund | | Heritage Money Market Fund† | | National Tax-Free Money Market Fund |
California Municipal Money Market Fund | | Money Market Fund | | Treasury Plus Money Market Fund |
Cash Investment Money Market Fund | | Municipal Cash Management Money Market Fund | | |
Government Money Market Fund | | Municipal Money Market Fund | | |
| Variable trust funds1 | | | | |
VT Discovery Fund† | | VT Intrinsic Value Fund | | VT Small Cap Growth Fund |
VT Index Asset Allocation Fund | | VT Omega Growth Fund | | VT Small Cap Value Fund |
VT International Equity Fund | | VT Opportunity Fund† | | VT Total Return Bond Fund |
An investment in a money market fund is not insured or guaranteed by the Federal Deposit Insurance Corporation or any other government agency. Although the Wells Fargo Advantage Money Market Funds seek to preserve the value of your investment at $1.00 per share, it is possible to lose money by investing in a money market fund.
| 1. | The variable trust funds are generally available only through insurance company variable contracts. |
| † | In this report, the Wells Fargo Advantage Discovery FundSM, Wells Fargo Advantage Endeavor Select FundSM, Wells Fargo Advantage Enterprise FundSM, Wells Fargo Advantage Opportunity FundSM, Wells Fargo Advantage WealthBuilder Conservative Allocation PortfolioSM, Wells Fargo Advantage WealthBuilder Equity PortfolioSM, Wells Fargo Advantage WealthBuilder Growth Allocation PortfolioSM, Wells Fargo Advantage WealthBuilder Growth Balanced PortfolioSM, Wells Fargo Advantage WealthBuilder Moderate Balanced PortfolioSM, Wells Fargo Advantage WealthBuilder Tactical Equity PortfolioSM, Wells Fargo Advantage Dow Jones Target Today FundSM, Wells Fargo Advantage Dow Jones Target 2010 FundSM, Wells Fargo Advantage Dow Jones Target 2015 FundSM, Wells Fargo Advantage Dow Jones Target 2020 FundSM, Wells Fargo Advantage Dow Jones Target 2025 FundSM, Wells Fargo Advantage Dow Jones Target 2030 FundSM, Wells Fargo Advantage Dow Jones Target 2035 FundSM, Wells Fargo Advantage Dow Jones Target 2040 FundSM, Wells Fargo Advantage Dow Jones Target 2045 FundSM, Wells Fargo Advantage Dow Jones Target 2050 FundSM, Wells Fargo Advantage Dow Jones Target 2055 FundSM, Wells Fargo Advantage Heritage Money Market FundSM, Wells Fargo Advantage VT Discovery FundSM, and Wells Fargo Advantage VT Opportunity FundSM are referred to as the Discovery Fund, Endeavor Select Fund, Enterprise Fund, Opportunity Fund, WealthBuilder Conservative Allocation Portfolio, WealthBuilder Equity Portfolio, WealthBuilder Growth Allocation Portfolio, WealthBuilder Growth Balanced Portfolio, WealthBuilder Moderate Balanced Portfolio, WealthBuilder Tactical Equity Portfolio, Target Today Fund, Target 2010 Fund, Target 2015 Fund, Target 2020 Fund, Target 2025 Fund, Target 2030 Fund, Target 2035 Fund, Target 2040 Fund, Target 2045 Fund, Target 2050 Fund, Target 2055 Fund, Heritage Money Market Fund, VT Discovery Fund, and VT Opportunity Fund, respectively. |
Not part of the semi-annual report.
| | | | |
| 2 | | Wells Fargo Advantage Premier Large Company Growth Fund | | Letter to shareholders (unaudited) |

Karla M. Rabusch
President
Wells Fargo Advantage Funds
Entering the period, concerns about the eurozone sovereign debt situation held center stage as investors again focused on economic weakness in southern European economies.
Aggressive central bank actions helped support stock prices, as did relatively solid economic data.
Dear Valued Shareholder:
We are pleased to offer you this semi-annual report for the Wells Fargo Advantage Premier Large Company Growth Fund for the six-month period that ended January 31, 2013. Much of the period was marked by continued concerns about the possible effects that the ongoing European sovereign debt crisis would have on the global economy. However, relatively solid economic data in the U.S. and efforts by European authorities to address the sovereign debt issue alleviated investor fears and supported global stock markets. Judging by various indexes, U.S. large-cap stocks underperformed small-cap stocks. Within the large-cap universe, value stocks outperformed growth stocks, partly because of strong performance from the financials sector.
The period was dominated by worries that ongoing debt problems in the eurozone would affect global economic growth.
Entering the period, concerns about the eurozone sovereign debt situation held center stage as investors again focused on economic weakness in southern European economies. Because many eurozone banks owned southern European debt and many U.S. banks had financial ties to eurozone banks, investors worried about the effects of a possible southern European debt default on the global financial system and economy. Ongoing weakness in the Greek economy made it difficult for the country to meet previously agreed upon austerity targets. Toward the end of the reporting period, political risk resurfaced in both Italy and Spain. In Italy, Prime Minister Mario Monti, an economist who was appointed to implement austerity measures and labor market reforms, resigned in December 2012. Monti later decided to run for office in the general election scheduled for February 2013.
European leaders took concerted action to calm investor concerns. In September 2012, the European Central Bank (ECB) announced that it would purchase an unlimited amount of one- to three-year sovereign debt from countries that had applied for a formal bailout through either the European Financial Stability Facility or the European Stability Mechanism. In another positive sign, in late November 2012, finance ministers from the 17-country eurozone and the International Monetary Fund struck a deal aimed at reducing Greece’s debt by the year 2020.
Central banks continued to provide stimulus.
Major central banks, including the U.S. Federal Reserve (Fed) and the ECB, continued to inject liquidity into the banks and the markets through various quantitative easing policies. Throughout the reporting period, the Federal Open Market Committee (FOMC) kept its key interest rates effectively at zero in order to support the economy and the financial system. The ECB was similarly aggressive, keeping its key rate at a historic low of 0.75%. Just prior to the beginning of the reporting period, the FOMC announced its intention to keep interest rates low until at least mid-2015 in order to support the sluggish economy. The Fed also announced open-ended purchases of $40 billion per month in mortgage-backed securities in an effort to support the housing market.
Stock markets posted solid gains in an eventful period.
Aggressive central bank actions helped support stock prices, as did relatively solid economic data. For much of the reporting period, the U.S. stock market benefited from favorable gross domestic product (GDP) data, with the growth rate improving from 1.3% (annualized) in the second quarter of 2012 to 3.1% (annualized) in the third quarter of 2012. However, the GDP growth rate slowed in the final months of 2012, with GDP growth coming in at 0.1% (annualized) in the fourth quarter of 2012.
| | | | | | |
| Letter to shareholders (unaudited) | | Wells Fargo Advantage Premier Large Company Growth Fund | | | 3 | |
Because many investors attributed the weak number to the aftereffects of Hurricane Sandy on the eastern seaboard, the stock market remained resilient.
The steady improvement in the housing market supported investor sentiment. The National Association of Home Builders/First American Improving Markets Index identifies metro areas that have shown improvement from their respective troughs in housing permits, employment, and house prices for at least six consecutive months. The index rose for a fifth-consecutive month in January 2013, indicating improvements in 242 housing markets across the country. As a result, housing-related stocks strongly outperformed over the period, leading to better-than-index returns for sectors ranging from consumer discretionary (home improvement retailers), to materials (construction material providers), and to financials (mortgage lenders).
Throughout the period, a continued high unemployment rate was the main negative piece of U.S. economic data. Although the unemployment rate improved from 8.1% in August 2012 to 7.9% in January 2013, the labor market remained soft.
We remain committed to our investment strategies, even as many variables are at work in the market.
The full effect of the European credit crisis remains unknown. Elevated unemployment and debt defaults continue to pressure consumers and businesses alike. As a whole, Wells Fargo Advantage Funds represents investments across a range of asset classes and investment styles, giving you an opportunity to create a diversified investment portfolio. While diversification may not prevent losses in a downturn, we believe it helps manage risk.
Thank you for choosing to invest with Wells Fargo Advantage Funds. We appreciate your confidence in us and remain committed to helping you meet your financial needs. For current information about your fund investments, contact your investment professional, visit our website at wellsfargoadvantagefunds.com, or call us directly at 1-800-222-8222. We are available 24 hours a day, 7 days a week.
Sincerely,

Karla M. Rabusch
President
Wells Fargo Advantage Funds
| | | | |
| 4 | | Wells Fargo Advantage Premier Large Company Growth Fund | | Letter to shareholders (unaudited) |
Notice to shareholders
At its November 6-7, 2012 meeting, the Board of Trustees unanimously approved the following modifications to certain Class A sales load waiver privileges, with each change becoming effective on July 1, 2013:
| | n | | Annuity payments received under an annuity option or from death proceeds will no longer qualify for net asset value (NAV) repurchase privileges. | |
| | n | | The ability to reinvest redemption proceeds at NAV will be reduced from 120 days to 90 days. | |
| | n | | NAV purchase privileges for certain types of “grandfathered” shareholders will be modified to remove the ability to purchase Class A shares at NAV, unless those shares are held directly with the Fund. | |
Please contact your investment professional or call us directly at 1-800-222-8222 if you have any questions on this Notice to Shareholders.
This page is intentionally left blank.
| | | | |
| 6 | | Wells Fargo Advantage Premier Large Company Growth Fund | | Performance highlights (unaudited) |
Investment objective
The Fund seeks long-term capital appreciation.
Adviser
Wells Fargo Funds Management, LLC
Subadviser
Wells Capital Management Incorporated
Portfolio managers
Joseph M. Eberhardy, CFA, CPA
Thomas C. Ognar, CFA
Bruce C. Olson, CFA
Average annual total returns1 (%) as of January 31, 2013
| | | | | | | | | | | | | | | | | | | | | | | | | | | | | | | | | | |
| | | | | Including sales charge | | | Excluding sales charge | | | Expense ratios2 (%) | |
| | | Inception date | | 1 year | | | 5 year | | | 10 year | | | 1 year | | | 5 year | | | 10 year | | | Gross | | | Net3 | |
| Class A (EKJAX) | | 1-20-1998 | | | 7.74 | | | | 7.47 | | | | 8.81 | | | | 14.30 | | | | 8.75 | | | | 9.46 | | | | 1.24 | | | | 1.13 | |
| Class B (EKJBX)* | | 9-11-1935 | | | 8.47 | | | | 7.65 | | | | 8.89 | | | | 13.47 | | | | 7.95 | | | | 8.89 | | | | 1.99 | | | | 1.88 | |
| Class C (EKJCX) | | 1-22-1998 | | | 12.50 | | | | 7.95 | | | | 8.65 | | | | 13.50 | | | | 7.95 | | | | 8.65 | | | | 1.99 | | | | 1.88 | |
| Class R4 (EKJRX) | | 11-30-2012 | | | – | | | | – | | | | – | | | | 14.95 | | | | 9.11 | | | | 9.79 | | | | 0.91 | | | | 0.81 | |
| Class R6 (EKJFX) | | 11-30-2012 | | | – | | | | – | | | | – | | | | 14.95 | | | | 9.11 | | | | 9.79 | | | | 0.76 | | | | 0.66 | |
| Administrator Class (WFPDX) | | 7-16-2010 | | | – | | | | – | | | | – | | | | 14.59 | | | | 8.87 | | | | 9.56 | | | | 1.08 | | | | 0.96 | |
| Institutional Class (EKJYX) | | 6-30-1999 | | | – | | | | – | | | | – | | | | 14.85 | | | | 9.09 | | | | 9.78 | | | | 0.81 | | | | 0.71 | |
| Investor Class (WFPNX) | | 7-16-2010 | | | – | | | | – | | | | – | | | | 14.33 | | | | 8.69 | | | | 9.39 | | | | 1.30 | | | | 1.19 | |
| Russell 1000® Growth Index4 | | – | | | – | | | | – | | | | – | | | | 13.43 | | | | 5.70 | | | | 8.24 | | | | – | | | | – | |
| * | | Class B shares are closed to investment, except in connection with the reinvestment of any distributions and permitted exchanges. |
Figures quoted represent past performance, which is no guarantee of future results and do not reflect the deduction of taxes that a shareholder may pay on fund distributions or the redemption of fund shares. Investment return and principal value of an investment will fluctuate so that an investor’s shares, when redeemed, may be worth more or less than their original cost. Performance shown without sales charges would be lower if sales charges were reflected. Current performance may be lower or higher than the performance data quoted and assumes the reinvestment of dividends and capital gains. Current month-end performance is available on the Fund’s website, wellsfargoadvantagefunds.com.
Index returns do not include transaction costs associated with buying and selling securities, any mutual fund fees or expenses, or any taxes. It is not possible to invest directly in an index.
For Class A shares, the maximum front-end sales charge is 5.75%. For Class B, the maximum contingent deferred sales charge is 5.00%. For Class C shares, the maximum contingent deferred sales charge is 1.00%. Performance including sales charge assumes the sales charge for the corresponding time period. Class R4, Class R6, Administrator Class, Institutional Class, and Investor Class shares are sold without a front-end sales charge or contingent deferred sales charge.
Stock values fluctuate in response to the activities of individual companies and general market and economic conditions. Certain investment strategies tend to increase the total risk of an investment (relative to the broader market). This Fund is exposed to foreign investment risk. Consult the Fund’s prospectus for additional information on these and other risks.
Please see footnotes on page 6.
| | | | | | |
| Performance highlights (unaudited) | | Wells Fargo Advantage Premier Large Company Growth Fund | | | 7 | |
| | | | |
| Ten largest equity holdings5 (%) as of January 31, 2013 | |
Apple Incorporated | | | 4.64 | |
eBay Incorporated | | | 3.54 | |
Google Incorporated Class A | | | 3.43 | |
Cognizant Technology Solutions Corporation Class A | | | 3.12 | |
Whole Foods Market Incorporated | | | 2.79 | |
Kansas City Southern | | | 2.54 | |
Alexion Pharmaceuticals Incorporated | | | 2.44 | |
Dollar Tree Incorporated | | | 2.33 | |
Rackspace Hosting Incorporated | | | 2.30 | |
iShares Russell 1000 Growth | | | 1.97 | |
| | |
| Sector distribution6 as of January 31, 2013 |
|
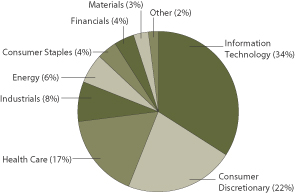
|
| 1. | Historical performance shown for Class R4 shares prior to their inception reflects the performance of the Institutional Class shares, adjusted to reflect the higher expenses applicable to Class R4 shares. Historical performance shown for the Class R6 shares prior to their inception reflects the performance of the Institutional Class shares, and includes the higher expenses applicable to the Institutional Class shares. If these expenses had not been included, returns would be higher. Historical performance shown for the Administrator Class shares prior to their inception reflects the performance of the Institutional Class shares, adjusted to reflect the higher expenses applicable to the Administrator Class shares. Historical performance shown for the Investor Class shares prior to their inception reflects the performance of the Class A shares, adjusted to reflect the higher expenses applicable to the Investor Class shares. Historical performance shown for all classes of the Fund prior to July 19, 2010, is based on the performance of the Fund’s predecessor, Evergreen Large Company Growth Fund. |
| 2. | Reflects the expense ratios as stated in the most recent prospectuses. |
| 3. | The Adviser has committed through November 30, 2014, to waive fees and/or reimburse expenses to the extent necessary to cap the Fund’s Total Annual Fund Operating Expenses After Fee Waiver, excluding certain expenses, at 1.12% for Class A, 1.87% for Class B, 1.87% for Class C, 0.80% for Class R4, 0.65% for Class R6, 0.95% for Administrator Class, 0.70% for Institutional Class, and 1.18% for Investor Class shares. Brokerage commissions, stamp duty fees, interest, taxes, acquired fund fees and expenses, and extraordinary expenses are excluded from the cap. Without this cap, the Fund’s returns would have been lower. |
| 4. | The Russell 1000® Growth Index measures the performance of those Russell 1000 Index companies with higher price-to-book ratios and higher forecasted growth values. You cannot invest directly in an index. |
| 5. | The ten largest equity holdings are calculated based on the value of the securities divided by total net assets of the Fund. Holdings are subject to change and may have changed since the date specified. |
| 6. | Sector distribution is subject to change and is calculated based on the total long-term investments of the Fund. |
| | | | |
| 8 | | Wells Fargo Advantage Premier Large Company Growth Fund | | Fund expenses (unaudited) |
As a shareholder of the Fund, you incur two types of costs: (1) transaction costs, including sales charges (loads) on purchase payments and contingent deferred sales charges (if any) on redemptions and (2) ongoing costs, including management fees, distribution (12b-1) and/or shareholder service fees, and other Fund expenses. This example is intended to help you understand your ongoing costs (in dollars) of investing in the Fund and to compare these costs with the ongoing costs of investing in other mutual funds.
The example is based on an investment of $1,000 invested at the beginning of the six-month period and held for the entire period from August 1, 2012 to January 31, 2013.
Actual expenses
The “Actual” line of the table below provides information about actual account values and actual expenses. You may use the information in this line, together with the amount you invested, to estimate the expenses that you paid over the period. Simply divide your account value by $1,000 (for example, an $8,600 account value divided by $1,000 = 8.6), then multiply the result by the number in the “Actual” line under the heading entitled “Expenses paid during period” for your applicable class of shares to estimate the expenses you paid on your account during this period.
Hypothetical example for comparison purposes
The “Hypothetical” line of the table below provides information about hypothetical account values and hypothetical expenses based on the Fund’s actual expense ratio and an assumed rate of return of 5% per year before expenses, which is not the Fund’s actual return. The hypothetical account values and expenses may not be used to estimate the actual ending account balance or expenses you paid for the period. You may use this information to compare the ongoing costs of investing in the Fund and other funds. To do so, compare this 5% hypothetical example with the 5% hypothetical examples that appear in the shareholder reports of the other funds.
Please note that the expenses shown in the table are meant to highlight your ongoing costs only and do not reflect any transactional costs, such as sales charges (loads) and contingent deferred sales charges. Therefore, the “Hypothetical” line of the table is useful in comparing ongoing costs only and will not help you determine the relative total costs of owning different funds. In addition, if these transactional costs were included, your costs would have been higher.
| | | | | | | | | | | | | | | | |
| | | Beginning
account value
8-1-2012 | | | Ending
account value
1-31-2013 | | | Expenses
paid during
the period1 | | | Net annual
expense ratio | |
Class A | | | | | | | | | | | | | | | | |
Actual | | $ | 1,000.00 | | | $ | 1,103.82 | | | $ | 5.94 | | | | 1.12 | % |
Hypothetical (5% return before expenses) | | $ | 1,000.00 | | | $ | 1,019.56 | | | $ | 5.70 | | | | 1.12 | % |
Class B | | | | | | | | | | | | | | | | |
Actual | | $ | 1,000.00 | | | $ | 1,100.11 | | | $ | 9.90 | | | | 1.87 | % |
Hypothetical (5% return before expenses) | | $ | 1,000.00 | | | $ | 1,015.78 | | | $ | 9.50 | | | | 1.87 | % |
Class C | | | | | | | | | | | | | | | | |
Actual | | $ | 1,000.00 | | | $ | 1,100.33 | | | $ | 9.90 | | | | 1.87 | % |
Hypothetical (5% return before expenses) | | $ | 1,000.00 | | | $ | 1,015.78 | | | $ | 9.50 | | | | 1.87 | % |
Class R4 | | | | | | | | | | | | | | | | |
Actual | | $ | 1,000.00 | | | $ | 1,107.00 | | | $ | 4.25 | | | | 0.80 | % |
Hypothetical (5% return before expenses) | | $ | 1,000.00 | | | $ | 1,021.17 | | | $ | 4.08 | | | | 0.80 | % |
Class R6 | | | | | | | | | | | | | | | | |
Actual | | $ | 1,000.00 | | | $ | 1,107.00 | | | $ | 3.45 | | | | 0.65 | % |
Hypothetical (5% return before expenses) | | $ | 1,000.00 | | | $ | 1,021.93 | | | $ | 3.31 | | | | 0.65 | % |
Administrator Class | | | | | | | | | | | | | | | | |
Actual | | $ | 1,000.00 | | | $ | 1,104.49 | | | $ | 5.04 | | | | 0.95 | % |
Hypothetical (5% return before expenses) | | $ | 1,000.00 | | | $ | 1,020.42 | | | $ | 4.84 | | | | 0.95 | % |
Institutional Class | | | | | | | | | | | | | | | | |
Actual | | $ | 1,000.00 | | | $ | 1,106.03 | | | $ | 3.88 | | | | 0.73 | % |
Hypothetical (5% return before expenses) | | $ | 1,000.00 | | | $ | 1,021.53 | | | $ | 3.72 | | | | 0.73 | % |
Investor Class | | | | | | | | | | | | | | | | |
Actual | | $ | 1,000.00 | | | $ | 1,104.02 | | | $ | 6.31 | | | | 1.19 | % |
Hypothetical (5% return before expenses) | | $ | 1,000.00 | | | $ | 1,019.21 | | | $ | 6.06 | | | | 1.19 | % |
| 1. | Expenses paid is equal to the annualized expense ratio of each class multiplied by the average account value over the period, multiplied by the number of days in the most recent fiscal half-year divided by the number of days in the fiscal year (to reflect the one-half-year period). |
| | | | | | |
| Portfolio of investments—January 31, 2013 (unaudited) | | Wells Fargo Advantage Premier Large Company Growth Fund | | | 9 | |
| | | | | | | | | | |
| Security name | | | | Shares | | | Value | |
| | | | | | | | | | |
| | | |
Common Stocks: 94.54% | | | | | | | | | | |
| | | |
Consumer Discretionary: 21.08% | | | | | | | | | | |
| | | |
| Auto Components: 0.29% | | | | | | | | | | |
BorgWarner Incorporated Ǡ | | | | | 90,440 | | | $ | 6,708,839 | |
| | | | | | | | | | |
| | | |
| Distributors: 0.45% | | | | | | | | | | |
LKQ Corporation † | | | | | 470,120 | | | | 10,525,987 | |
| | | | | | | | | | |
| | | |
| Hotels, Restaurants & Leisure: 3.50% | | | | | | | | | | |
Chipotle Mexican Grill Incorporated Ǡ | | | | | 95,910 | | | | 29,445,329 | |
McDonald’s Corporation | | | | | 211,070 | | | | 20,112,860 | |
Starbucks Corporation | | | | | 575,300 | | | | 32,285,836 | |
| | | |
| | | | | | | | | 81,844,025 | |
| | | | | | | | | | |
| | | |
| Internet & Catalog Retail: 2.77% | | | | | | | | | | |
Amazon.com Incorporated † | | | | | 142,160 | | | | 37,743,480 | |
priceline.com Incorporated † | | | | | 39,530 | | | | 27,096,629 | |
| | | |
| | | | | | | | | 64,840,109 | |
| | | | | | | | | | |
| | | |
| Multiline Retail: 4.77% | | | | | | | | | | |
Dollar General Corporation † | | | | | 618,500 | | | | 28,587,070 | |
Dollar Tree Incorporated † | | | | | 1,366,100 | | | | 54,630,339 | |
Nordstrom Incorporated | | | | | 515,980 | | | | 28,497,575 | |
| | | |
| | | | | | | | | 111,714,984 | |
| | | | | | | | | | |
| | | |
| Specialty Retail: 6.87% | | | | | | | | | | |
CarMax Incorporated † | | | | | 979,070 | | | | 38,594,939 | |
Dick’s Sporting Goods Incorporated | | | | | 512,010 | | | | 24,366,556 | |
GNC Holdings Incorporated Class A | | | | | 871,540 | | | | 31,323,148 | |
Tractor Supply Company | | | | | 431,530 | | | | 44,736,715 | |
Ulta Salon Cosmetics & Fragrance Incorporated | | | | | 222,630 | | | | 21,777,667 | |
| | | |
| | | | | | | | | 160,799,025 | |
| | | | | | | | | | |
| | | |
| Textiles, Apparel & Luxury Goods: 2.43% | | | | | | | | | | |
lululemon athletica incorporated Ǡ | | | | | 457,330 | | | | 31,555,770 | |
Michael Kors Holdings Limited † | | | | | 231,924 | | | | 13,017,894 | |
Under Armour Incorporated Class A Ǡ | | | | | 244,500 | | | | 12,437,715 | |
| | | |
| | | | | | | | | 57,011,379 | |
| | | | | | | | | | |
| | | |
Consumer Staples: 4.23% | | | | | | | | | | |
| | | |
| Beverages: 0.44% | | | | | | | | | | |
Monster Beverage Corporation † | | | | | 213,020 | | | | 10,203,658 | |
| | | | | | | | | | |
| | | |
| Food & Staples Retailing: 3.43% | | | | | | | | | | |
Costco Wholesale Corporation | | | | | 145,720 | | | | 14,912,985 | |
Whole Foods Market Incorporated | | | | | 679,650 | | | | 65,416,313 | |
| | | |
| | | | | | | | | 80,329,298 | |
| | | | | | | | | | |
The accompanying notes are an integral part of these financial statements.
| | | | |
| 10 | | Wells Fargo Advantage Premier Large Company Growth Fund | | Portfolio of investments—January 31, 2013 (unaudited) |
| | | | | | | | | | |
| Security name | | | | Shares | | | Value | |
| | | | | | | | | | |
| | | |
| Personal Products: 0.36% | | | | | | | | | | |
Estee Lauder Companies Incorporated Class A | | | | | 140,400 | | | $ | 8,554,572 | |
| | | | | | | | | | |
| | | |
Energy: 5.71% | | | | | | | | | | |
| | | |
| Energy Equipment & Services: 1.28% | | | | | | | | | | |
National Oilwell Varco Incorporated | | | | | 109,650 | | | | 8,129,451 | |
Schlumberger Limited | | | | | 279,510 | | | | 21,815,756 | |
| | | |
| | | | | | | | | 29,945,207 | |
| | | | | | | | | | |
| | | |
| Oil, Gas & Consumable Fuels: 4.43% | | | | | | | | | | |
Concho Resources Incorporated † | | | | | 449,040 | | | | 40,961,429 | |
Continental Resources Incorporated Ǡ | | | | | 73,680 | | | | 6,124,282 | |
Energy XXI (Bermuda) Limited « | | | | | 517,830 | | | | 16,218,436 | |
Pioneer Natural Resources Company | | | | | 344,750 | | | | 40,521,915 | |
| | | |
| | | | | | | | | 103,826,062 | |
| | | | | | | | | | |
| | | |
Financials: 3.67% | | | | | | | | | | |
| | | |
| Capital Markets: 1.80% | | | | | | | | | | |
Ameriprise Financial Incorporated | | | | | 249,180 | | | | 16,525,618 | |
TD Ameritrade Holding Corporation « | | | | | 1,326,060 | | | | 25,712,303 | |
| | | |
| | | | | | | | | 42,237,921 | |
| | | | | | | | | | |
| | | |
| Consumer Finance: 1.87% | | | | | | | | | | |
American Express Company | | | | | 583,240 | | | | 34,300,344 | |
Discover Financial Services | | | | | 245,500 | | | | 9,424,745 | |
| | | |
| | | | | | | | | 43,725,089 | |
| | | | | | | | | | |
| | | |
Health Care: 16.48% | | | | | | | | | | |
| | | |
| Biotechnology: 7.09% | | | | | | | | | | |
Alexion Pharmaceuticals Incorporated † | | | | | 607,600 | | | | 57,108,324 | |
Biogen Idec Incorporated † | | | | | 140,220 | | | | 21,885,538 | |
BioMarin Pharmaceutical Incorporated † | | | | | 150,000 | | | | 8,233,500 | |
Celgene Corporation † | | | | | 457,550 | | | | 45,279,148 | |
Gilead Sciences Incorporated † | | | | | 504,000 | | | | 19,882,800 | |
Onyx Pharmaceuticals Incorporated Ǡ | | | | | 175,800 | | | | 13,628,016 | |
| | | |
| | | | | | | | | 166,017,326 | |
| | | | | | | | | | |
| | | |
| Health Care Equipment & Supplies: 2.26% | | | | | | | | | | |
Covidien plc | | | | | 369,430 | | | | 23,030,266 | |
Intuitive Surgical Incorporated † | | | | | 52,080 | | | | 29,913,710 | |
| | | |
| | | | | | | | | 52,943,976 | |
| | | | | | | | | | |
| | | |
| Health Care Providers & Services: 2.29% | | | | | | | | | | |
AmerisourceBergen Corporation | | | | | 557,420 | | | | 25,290,145 | |
Catamaran Corporation † | | | | | 382,540 | | | | 19,850,001 | |
Express Scripts Holding Corporation † | | | | | 160,000 | | | | 8,547,200 | |
| | | |
| | | | | | | | | 53,687,346 | |
| | | | | | | | | | |
The accompanying notes are an integral part of these financial statements.
| | | | | | |
| Portfolio of investments—January 31, 2013 (unaudited) | | Wells Fargo Advantage Premier Large Company Growth Fund | | | 11 | |
| | | | | | | | | | |
| Security name | | | | Shares | | | Value | |
| | | | | | | | | | |
| | | |
| Health Care Technology: 1.72% | | | | | | | | | | |
Cerner Corporation Ǡ | | | | | 487,280 | | | $ | 40,224,964 | |
| | | | | | | | | | |
| | | |
| Life Sciences Tools & Services: 1.34% | | | | | | | | | | |
Mettler-Toledo International Incorporated Ǡ | | | | | 147,600 | | | | 31,369,428 | |
| | | | | | | | | | |
| | | |
| Pharmaceuticals: 1.78% | | | | | | | | | | |
Actavis Incorporated † | | | | | 58,130 | | | | 5,021,851 | |
Allergan Incorporated | | | | | 121,370 | | | | 12,745,064 | |
Shire plc ADR | | | | | 226,390 | | | | 22,670,695 | |
Zoetis Incorporated † | | | | | 48,594 | | | | 1,263,444 | |
| | | |
| | | | | | | | | 41,701,054 | |
| | | | | | | | | | |
| | | |
Industrials: 7.98% | | | | | | | | | | |
| | | |
| Aerospace & Defense: 1.71% | | | | | | | | | | |
Precision Castparts Corporation | | | | | 107,740 | | | | 19,759,516 | |
United Technologies Corporation | | | | | 232,980 | | | | 20,402,059 | |
| | | |
| | | | | | | | | 40,161,575 | |
| | | | | | | | | | |
| | | |
| Air Freight & Logistics: 0.63% | | | | | | | | | | |
United Parcel Service Incorporated Class B | | | | | 186,440 | | | | 14,782,828 | |
| | | | | | | | | | |
| | | |
| Industrial Conglomerates: 0.77% | | | | | | | | | | |
Danaher Corporation | | | | | 299,780 | | | | 17,965,815 | |
| | | | | | | | | | |
| | | |
| Machinery: 1.22% | | | | | | | | | | |
Flowserve Corporation « | | | | | 99,720 | | | | 15,633,104 | |
Joy Global Incorporated « | | | | | 203,300 | | | | 12,842,461 | |
| | | |
| | | | | | | | | 28,475,565 | |
| | | | | | | | | | |
| | | |
| Road & Rail: 3.65% | | | | | | | | | | |
Kansas City Southern | | | | | 637,590 | | | | 59,366,005 | |
Norfolk Southern Corporation « | | | | | 75,090 | | | | 5,171,448 | |
Union Pacific Corporation | | | | | 158,920 | | | | 20,891,623 | |
| | | |
| | | | | | | | | 85,429,076 | |
| | | | | | | | | | |
| | | |
Information Technology: 32.33% | | | | | | | | | | |
| | | |
| Communications Equipment: 2.92% | | | | | | | | | | |
Cisco Systems Incorporated | | | | | 1,102,190 | | | | 22,672,048 | |
Palo Alto Networks Incorporated Ǡ | | | | | 122,386 | | | | 6,775,289 | |
QUALCOMM Incorporated | | | | | 590,430 | | | | 38,986,093 | |
| | | |
| | | | | | | | | 68,433,430 | |
| | | | | | | | | | |
| | | |
| Computers & Peripherals: 5.18% | | | | | | | | | | |
Apple Incorporated | | | | | 238,590 | | | | 108,632,413 | |
EMC Corporation † | | | | | 513,000 | | | | 12,624,930 | |
| | | |
| | | | | | | | | 121,257,343 | |
| | | | | | | | | | |
The accompanying notes are an integral part of these financial statements.
| | | | |
| 12 | | Wells Fargo Advantage Premier Large Company Growth Fund | | Portfolio of investments—January 31, 2013 (unaudited) |
| | | | | | | | | | |
| Security name | | | | Shares | | | Value | |
| | | | | | | | | | |
| | | |
| Internet Software & Services: 10.44% | | | | | | | | | | |
Akamai Technologies Incorporated † | | | | | 70,500 | | | $ | 2,870,055 | |
eBay Incorporated † | | | | | 1,480,320 | | | | 82,794,298 | |
Facebook Incorporated Class A † | | | | | 112,500 | | | | 3,484,125 | |
Google Incorporated Class A † | | | | | 106,150 | | | | 80,216,494 | |
Mercadolibre Incorporated « | | | | | 240,110 | | | | 21,225,724 | |
Rackspace Hosting Incorporated Ǡ | | | | | 713,420 | | | | 53,756,197 | |
| | | |
| | | | | | | | | 244,346,893 | |
| | | | | | | | | | |
| | | |
| IT Services: 7.49% | | | | | | | | | | |
Alliance Data Systems Corporation Ǡ | | | | | 190,130 | | | | 29,964,488 | |
Cognizant Technology Solutions Corporation Class A † | | | | | 933,310 | | | | 72,966,176 | |
MasterCard Incorporated Class A | | | | | 83,630 | | | | 43,353,792 | |
Teradata Corporation † | | | | | 52,500 | | | | 3,499,650 | |
Visa Incorporated Class A | | | | | 162,190 | | | | 25,611,423 | |
| | | |
| | | | | | | | | 175,395,529 | |
| | | | | | | | | | |
| | | |
| Semiconductors & Semiconductor Equipment: 2.77% | | | | | | | | | | |
Avago Technologies Limited | | | | | 231,690 | | | | 8,287,551 | |
Linear Technology Corporation | | | | | 236,750 | | | | 8,669,785 | |
Maxim Integrated Products Incorporated | | | | | 434,580 | | | | 13,667,541 | |
Microchip Technology Incorporated « | | | | | 1,025,600 | | | | 34,306,320 | |
| | | |
| | | | | | | | | 64,931,197 | |
| | | | | | | | | | |
| | | |
| Software: 3.53% | | | | | | | | | | |
Citrix Systems Incorporated † | | | | | 112,270 | | | | 8,213,673 | |
Fortinet Incorporated † | | | | | 1,296,600 | | | | 30,586,794 | |
Red Hat Incorporated † | | | | | 356,710 | | | | 19,818,808 | |
Salesforce.com Incorporated Ǡ | | | | | 96,680 | | | | 16,641,528 | |
VMware Incorporated Ǡ | | | | | 95,780 | | | | 7,325,254 | |
| | | |
| | | | | | | | | 82,586,057 | |
| | | | | | | | | | |
| | | |
Materials: 3.06% | | | | | | | | | | |
| | | |
| Chemicals: 3.06% | | | | | | | | | | |
Airgas Incorporated | | | | | 124,920 | | | | 11,897,381 | |
Monsanto Company | | | | | 262,140 | | | | 26,567,889 | |
Praxair Incorporated | | | | | 299,580 | | | | 33,064,643 | |
| | | |
| | | | | | | | | 71,529,913 | |
| | | | | | | | | | |
| | | |
Total Common Stocks (Cost $1,773,660,223) | | | | | | | | | 2,213,505,470 | |
| | | | | | | | | | |
| | | |
Investment Companies: 1.97% | | | | | | | | | | |
iShares Russell 1000 Growth | | | | | 677,000 | | | | 46,212,020 | |
| | | | | | | | | | |
| | | |
Total Investment Companies (Cost $44,647,336) | | | | | | | | | 46,212,020 | |
| | | | | | | | | | |
The accompanying notes are an integral part of these financial statements.
| | | | | | |
| Portfolio of investments—January 31, 2013 (unaudited) | | Wells Fargo Advantage Premier Large Company Growth Fund | | | 13 | |
| | | | | | | | | | | | | | |
| Security name | | | | | | | Principal | | | Value | |
| | | | | | | | | | | | | | |
| | | | |
Other: 0.02% | | | | | | | | | | | | | | |
Gryphon Funding Limited, Pass-Through Entity (v)(i)(a) | | | | | | | | $ | 1,220,248 | | | $ | 414,884 | |
| | | | | | | | | | | | | | |
| | | | |
Total Other (Cost $99,442) | | | | | | | | | | | | | 414,884 | |
| | | | | | | | | | | | | | |
| | | | |
| | | Yield | | | | | Shares | | | | |
| | | | |
Short-Term Investments: 12.40% | | | | | | | | | | | | | | |
| | | | |
| Investment Companies : 12.40% | | | | | | | | | | | | | | |
Wells Fargo Advantage Cash Investment Money Market Fund, Select Class (l)(u) | | | 0.14 | % | | | | | 53,766,526 | | | | 53,766,526 | |
Wells Fargo Securities Lending Cash Investments, LLC (v)(l)(u)(r) | | | 0.19 | | | | | | 236,476,308 | | | | 236,476,308 | |
| | | | |
Total Short-Term Investments (Cost $290,242,834) | | | | | | | | | | | | | 290,242,834 | |
| | | | | | | | | | | | | | |
| | | | | | | | |
| Total investments in securities | | | | | | | | |
| (Cost $2,108,649,835) * | | | 108.93 | % | | | 2,550,375,208 | |
Other assets and liabilities, net | | | (8.93 | ) | | | (209,128,116 | ) |
| | | | | | | | |
| Total net assets | | | 100.00 | % | | $ | 2,341,247,092 | |
| | | | | | | | |
| « | All or a portion of this security is on loan. |
| † | Non-income-earning security |
| (v) | Security represents investment of cash collateral received from securities on loan. |
| (a) | Security is fair valued by the Management Valuation Team, and in certain instances by the Board of Trustees, in accordance with procedures approved by the Board of Trustees. |
| (l) | Investment in an affiliate |
| (u) | Rate shown is the 7-day annualized yield at period end. |
| (r) | The investment company is exempt from registration under Section 3(c)(7) of the Investment Company Act of 1940, as amended. |
| * | Cost for federal income tax purposes is $2,116,144,041 and unrealized appreciation (depreciation) consists of: |
| | | | |
Gross unrealized appreciation | | $ | 441,282,913 | |
Gross unrealized depreciation | | | (7,051,746 | ) |
| | | | |
Net unrealized appreciation | | $ | 434,231,167 | |
The accompanying notes are an integral part of these financial statements.
| | | | |
| 14 | | Wells Fargo Advantage Premier Large Company Growth Fund | | Statement of assets and liabilities —January 31, 2013 (unaudited) |
| | | | |
| | | | |
| |
Assets | | | | |
Investments | | | | |
In unaffiliated securities (including securities on loan), at value (see cost below) | | $ | 2,260,132,374 | |
In affiliated securities, at value (see cost below) | | | 290,242,834 | |
| | | | |
Total investments, at value (see cost below) | | | 2,550,375,208 | |
Receivable for investments sold | | | 4,956,193 | |
Receivable for Fund shares sold | | | 31,638,050 | |
Receivable for dividends | | | 306,271 | |
Receivable for securities lending income | | | 37,258 | |
Prepaid expenses and other assets | | | 208,974 | |
| | | | |
Total assets | | | 2,587,521,954 | |
| | | | |
| |
Liabilities | | | | |
Payable for investments purchased | | | 5,105,085 | |
Payable for Fund shares redeemed | | | 2,550,736 | |
Payable upon receipt of securities loaned | | | 236,575,750 | |
Advisory fee payable | | | 1,024,294 | |
Distribution fees payable | | | 130,523 | |
Due to other related parties | | | 490,133 | |
Accrued expenses and other liabilities | | | 398,341 | |
| | | | |
Total liabilities | | | 246,274,862 | |
| | | | |
Total net assets | | $ | 2,341,247,092 | |
| | | | |
| |
NET ASSETS CONSIST OF | | | | |
Paid-in capital | | $ | 1,990,917,953 | |
Accumulated net investment loss | | | (1,936,609 | ) |
Accumulated net realized losses on investments | | | (89,459,625 | ) |
Net unrealized gains on investments | | | 441,725,373 | |
| | | | |
Total net assets | | $ | 2,341,247,092 | |
| | | | |
| |
COMPUTATION OF NET ASSET VALUE AND OFFERING PRICE PER SHARE1 | | | | |
Net assets – Class A | | $ | 1,215,333,593 | |
Shares outstanding – Class A | | | 107,798,184 | |
Net asset value per share – Class A | | | $11.27 | |
Maximum offering price per share – Class A2 | | | $11.96 | |
Net assets – Class B | | $ | 6,318,045 | |
Shares outstanding – Class B | | | 624,689 | |
Net asset value per share – Class B | | | $10.11 | |
Net assets – Class C | | $ | 209,339,608 | |
Shares outstanding – Class C | | | 20,751,331 | |
Net asset value per share – Class C | | | $10.09 | |
Net assets – Class R4 | | $ | 10,524 | |
Share outstanding – Class R4 | | | 925 | |
Net asset value per share – Class R4 | | | $11.38 | |
Net assets – Class R6 | | $ | 1,501,169 | |
Share outstanding – Class R6 | | | 131,960 | |
Net asset value per share – Class R6 | | | $11.38 | |
Net assets – Administrator Class | | $ | 426,552,050 | |
Shares outstanding – Administrator Class | | | 37,700,097 | |
Net asset value per share – Administrator Class | | | $11.31 | |
Net assets – Institutional Class | | $ | 357,584,111 | |
Shares outstanding – Institutional Class | | | 31,442,028 | |
Net asset value per share – Institutional Class | | | $11.37 | |
Net assets – Investor Class | | $ | 124,607,992 | |
Shares outstanding – Investor Class | | | 11,079,740 | |
Net asset value per share – Investor Class | | | $11.25 | |
| |
Investment in unaffiliated securities (including securities on loan), at cost | | $ | 1,818,407,001 | |
| | | | |
Investments in affiliated securities, at cost | | $ | 290,242,834 | |
| | | | |
Total investments, at cost | | $ | 2,108,649,835 | |
| | | | |
Securities on loan, at value | | $ | 231,492,029 | |
| | | | |
| 1. | The Fund has an unlimited number of authorized shares. |
| 2. | Maximum offering price is computed as 100/94.25 of net asset value. On investments of $50,000 or more, the offering price is reduced. |
The accompanying notes are an integral part of these financial statements.
| | | | | | |
| Statement of operations—six months ended January 31, 2013 (unaudited) | | Wells Fargo Advantage Premier Large Company Growth Fund | | | 15 | |
| | | | |
| | | | |
| |
Investment income | | | | |
Dividends | | $ | 11,447,846 | |
Securities lending income, net | | | 158,780 | |
Income from affiliated securities | | | 56,606 | |
| | | | |
Total investment income | | | 11,663,232 | |
| | | | |
| |
Expenses | | | | |
Advisory fee | | | 6,152,516 | |
Administration fees | | | | |
Fund level | | | 497,503 | |
Class A | | | 1,399,315 | |
Class B | | | 8,532 | |
Class C | | | 220,230 | |
Class R4 | | | 1 | 1 |
Class R6 | | | 35 | 1 |
Administrator Class | | | 168,088 | |
Institutional Class | | | 115,174 | |
Investor Class | | | 181,275 | |
Shareholder servicing fees | | | | |
Class A | | | 1,345,495 | |
Class B | | | 8,204 | |
Class C | | | 211,760 | |
Class R4 | | | 2 | 1 |
Administrator Class | | | 420,219 | |
Investor Class | | | 139,666 | |
Distribution fees | | | | |
Class B | | | 24,611 | |
Class C | | | 635,279 | |
Custody and accounting fees | | | 50,932 | |
Professional fees | | | 20,273 | |
Registration fees | | | 61,281 | |
Shareholder report expenses | | | 47,439 | |
Trustees’ fees and expenses | | | 6,006 | |
Other fees and expenses | | | 10,936 | |
| | | | |
Total expenses | | | 11,724,772 | |
Less: Fee waivers and/or expense reimbursements | | | (728,190 | ) |
| | | | |
Net expenses | | | 10,996,582 | |
| | | | |
Net investment income | | | 666,650 | |
| | | | |
| |
REALIZED AND UNREALIZED GAINS (LOSSES) ON INVESTMENTS | | | | |
Net realized gains on investments | | | 139,932 | |
Net change in unrealized gains (losses) on investments | | | 192,701,572 | |
| | | | |
Net realized and unrealized gains (losses) on investments | | | 192,841,504 | |
| | | | |
Net increase in net assets resulting from operations | | $ | 193,508,154 | |
| | | | |
| 1. | For the period from November 30, 2012 (commencement of class operations) to January 31, 2013. |
The accompanying notes are an integral part of these financial statements.
| | | | |
| 16 | | Wells Fargo Advantage Premier Large Company Growth Fund | | Statement of changes in net assets |
| | | | | | | | | | | | | | | | |
| | | Six months ended January 31, 2013 (unaudited) | | | Year ended July 31, 2012 | |
| | | | |
Operations | | | | | | | | | | | | | | | | |
Net investment income (loss) | | | | | | $ | 666,650 | | | | | | | $ | (3,471,557 | ) |
Net realized gains (losses) on investments | | | | | | | 139,932 | | | | | | | | (12,384,049 | ) |
Net change in unrealized gains (losses) on investments | | | | | | | 192,701,572 | | | | | | | | 59,888,274 | |
| | | | | | | | | | | | | | | | |
Net increase in net assets resulting from operations | | | | | | | 193,508,154 | | | | | | | | 44,032,668 | |
| | | | | | | | | | | | | | | | |
| | | | |
Distributions to shareholders from | | | | | | | | | | | | | | | | |
Net realized gains | | | | | | | | | | | | | | | | |
Class A | | | | | | | 0 | | | | | | | | (16,290,743 | ) |
Class B | | | | | | | 0 | | | | | | | | (232,403 | ) |
Class C | | | | | | | 0 | | | | | | | | (1,336,936 | ) |
Administrator Class | | | | | | | 0 | | | | | | | | (1,567,504 | ) |
Institutional Class | | | | | | | 0 | | | | | | | | (1,091,657 | ) |
Investor Class | | | | | | | 0 | | | | | | | | (2,041,518 | ) |
| | | | | | | | | | | | | | | | |
Total distributions to shareholders | | | | | | | 0 | | | | | | | | (22,560,761 | ) |
| | | | | | | | | | | | | | | | |
| | | | |
| | | Shares | | | | | | | | Shares | | | | | |
Capital share transactions | | | | | | | | | | | | | | | | |
Proceeds from shares sold | | | | | | | | | | | | | | | | |
Class A | | | 26,137,139 | | | | 281,995,756 | | | | 42,270,679 | | | | 428,631,194 | |
Class B | | | 37,509 | | | | 364,020 | | | | 147,942 | | | | 1,313,239 | |
Class C | | | 7,917,994 | | | | 76,627,886 | | | | 11,676,942 | | | | 107,232,818 | |
Class R4 | | | 925 | 1 | | | 10,000 | 1 | | | N/A | | | | N/A | |
Class R6 | | | 132,209 | 1 | | | 1,469,319 | 1 | | | N/A | | | | N/A | |
Administrator Class | | | 18,885,250 | | | | 204,224,262 | | | | 22,142,988 | | | | 228,066,460 | |
Institutional Class | | | 14,088,235 | | | | 153,836,689 | | | | 20,663,426 | | | | 216,235,544 | |
Investor Class | | | 2,258,128 | | | | 24,364,307 | | | | 3,709,555 | | | | 36,729,360 | |
| | | | | | | | | | | | | | | | |
| | | | | | | 742,892,239 | | | | | | | | 1,018,208,615 | |
| | | | | | | | | | | | | | | | |
Reinvestment of distributions | | | | | | | | | | | | | | | | |
Class A | | | 0 | | | | 0 | | | | 1,545,287 | | | | 14,602,964 | |
Class B | | | 0 | | | | 0 | | | | 23,672 | | | | 202,400 | |
Class C | | | 0 | | | | 0 | | | | 93,610 | | | | 797,556 | |
Administrator Class | | | 0 | | | | 0 | | | | 120,175 | | | | 1,136,851 | |
Institutional Class | | | 0 | | | | 0 | | | | 101,699 | | | | 965,124 | |
Investor Class | | | 0 | | | | 0 | | | | 210,675 | | | | 1,986,664 | |
| | | | | | | | | | | | | | | | |
| | | | | | | 0 | | | | | | | | 19,691,559 | |
| | | | | | | | | | | | | | | | |
Payment for shares redeemed | | | | | | | | | | | | | | | | |
Class A | | | (9,639,764 | ) | | | (103,555,107 | ) | | | (15,257,112 | ) | | | (153,404,356 | ) |
Class B | | | (170,095 | ) | | | (1,637,610 | ) | | | (553,290 | ) | | | (4,914,654 | ) |
Class C | | | (1,341,845 | ) | | | (12,948,115 | ) | | | (1,583,958 | ) | | | (14,105,661 | ) |
Class R6 | | | (249 | )1 | | | (2,811 | )1 | | | N/A | | | | N/A | |
Administrator Class | | | (5,778,773 | ) | | | (62,655,801 | ) | | | (3,160,176 | ) | | | (31,356,149 | ) |
Institutional Class | | | (4,401,644 | ) | | | (48,090,717 | ) | | | (2,085,091 | ) | | | (21,201,424 | ) |
Investor Class | | | (962,215 | ) | | | (10,360,339 | ) | | | (2,183,993 | ) | | | (20,873,074 | ) |
| | | | | | | | | | | | | | | | |
| | | | | | | (239,250,500 | ) | | | | | | | (245,855,318 | ) |
| | | | | | | | | | | | | | | | |
Net increase in net assets resulting from capital share transactions | | | | | | | 503,641,739 | | | | | | | | 792,044,856 | |
| | | | | | | | | | | | | | | | |
Total increase in net assets | | | | | | | 697,149,893 | | | | | | | | 813,516,763 | |
| | | | | | | | | | | | | | | | |
| | | | |
Net assets | | | | | | | | | | | | | | | | |
Beginning of period | | | | | | | 1,644,097,199 | | | | | | | | 830,580,436 | |
| | | | | | | | | | | | | | | | |
End of period | | | | | | $ | 2,341,247,092 | | | | | | | $ | 1,644,097,199 | |
| | | | | | | | | | | | | | | | |
Accumulated net investment loss | | | | | | $ | (1,936,609 | ) | | | | | | $ | (2,603,259 | ) |
| | | | | | | | | | | | | | | | |
| 1. | For the period from November 30, 2012 (commencement of class operations) to January 31, 2013. |
The accompanying notes are an integral part of these financial statements.
| | | | | | |
| Financial highlights | | Wells Fargo Advantage Premier Large Company Growth Fund | | | 17 | |
(For a share outstanding throughout each period)
| | | | | | | | | | | | | | | | | | | | | | | | | | | | |
| | | Six months ended
January 31, 2013
(unaudited) | | | Year ended July 31 | | | Year ended September 30 | |
| CLASS A | | | 2012 | | | 2011 | | | 20101,2 | | | 20091 | | | 20081 | | | 20071 | |
Net asset value, beginning of period | | $ | 10.21 | | | $ | 9.89 | | | $ | 7.75 | | | $ | 7.23 | | | $ | 7.20 | | | $ | 8.50 | | | $ | 6.96 | |
Net investment income (loss) | | | 0.00 | 4 | | | (0.03 | )3 | | | (0.01 | ) | | | 0.00 | 3,4 | | | 0.05 | 3 | | | 0.03 | 3 | | | 0.01 | 3 |
Net realized and unrealized gains (losses) on investments | | | 1.06 | | | | 0.60 | | | | 2.15 | | | | 0.57 | | | | 0.02 | | | | (1.33 | ) | | | 1.53 | |
| | | | | | | | | | | | | | | | | | | | | | | | | | | | |
Total from investment operations | | | 1.06 | | | | 0.57 | | | | 2.14 | | | | 0.57 | | | | 0.07 | | | | (1.30 | ) | | | 1.54 | |
Distributions to shareholders from | | | | | | | | | | | | | | | | | | | | | | | | | | | | |
Net investment income | | | 0.00 | | | | 0.00 | | | | (0.00 | )4 | | | (0.05 | ) | | | (0.04 | ) | | | (0.00 | )4 | | | 0.00 | |
Net realized gains | | | 0.00 | | | | (0.25 | ) | | | 0.00 | | | | 0.00 | | | | 0.00 | | | | 0.00 | | | | 0.00 | |
| | | | | | | | | | | | | | | | | | | | | | | | | | | | |
Total distributions to shareholders | | | 0.00 | | | | (0.25 | ) | | | (0.00 | )4 | | | (0.05 | ) | | | (0.04 | ) | | | (0.00 | )4 | | | 0.00 | |
Net asset value, end of period | | $ | 11.27 | | | $ | 10.21 | | | $ | 9.89 | | | $ | 7.75 | | | $ | 7.23 | | | $ | 7.20 | | | $ | 8.50 | |
Total return5 | | | 10.38 | % | | | 6.08 | % | | | 27.55 | % | | | 7.93 | % | | | 1.04 | % | | | (15.25 | )% | | | 22.13 | % |
Ratios to average net assets (annualized) | | | | | | | | | | | | | | | | | | | | | | | | | | | | |
Gross expenses | | | 1.20 | % | | | 1.23 | % | | | 1.24 | % | | | 1.09 | % | | | 1.12 | % | | | 1.09 | % | | | 1.12 | % |
Net expenses | | | 1.12 | % | | | 1.12 | % | | | 1.12 | % | | | 1.08 | % | | | 1.12 | % | | | 1.07 | % | | | 1.10 | % |
Net investment income (loss) | | | 0.05 | % | | | (0.30 | )% | | | (0.13 | )% | | | 0.06 | % | | | 0.86 | % | | | 0.44 | % | | | 0.10 | % |
Supplemental data | | | | | | | | | | | | | | | | | | | | | | | | | | | | |
Portfolio turnover rate | | | 14 | % | | | 51 | % | | | 65 | % | | | 89 | % | | | 24 | % | | | 39 | % | | | 21 | % |
Net assets, end of period (000s omitted) | | | $1,215,334 | | | | $932,106 | | | | $620,262 | | | | $491,290 | | | | $268,422 | | | | $276,771 | | | | $361,051 | |
| 1. | After the close of business on July 16, 2010, the Fund acquired the net assets of Evergreen Large Company Growth Fund and Wells Fargo Advantage Large Company Growth Fund. Evergreen Large Company Growth Fund became the accounting and performance survivor in the transaction. The information for the periods prior to July 19, 2010 is that of Class A of Evergreen Large Company Growth Fund. |
| 2. | For the ten months ended July 31, 2010. The Fund changed its fiscal year end from September 30 to July 31, effective July 31, 2010. |
| 3. | Calculated based upon average shares outstanding |
| 4. | Amount is less than $0.005. |
| 5. | Total return calculations do not include any sales charges. Returns for periods of less than one year are not annualized. |
The accompanying notes are an integral part of these financial statements.
| | | | |
| 18 | | Wells Fargo Advantage Premier Large Company Growth Fund | | Financial highlights |
(For a share outstanding throughout each period)
| | | | | | | | | | | | | | | | | | | | | | | | | | | | |
| | | Six months ended
January 31, 2013
(unaudited) | | | Year ended July 31 | | | Year ended September 30 | |
| CLASS B | | | 2012 | | | 2011 | | | 20101,2 | | | 20091 | | | 20081 | | | 20071 | |
Net asset value, beginning of period | | $ | 9.19 | | | $ | 8.99 | | | $ | 7.10 | | | $ | 6.62 | | | $ | 6.60 | | | $ | 7.85 | | | $ | 6.47 | |
Net investment income (loss) | | | (0.03 | )3 | | | (0.09 | )3 | | | (0.07 | )3 | | | (0.04 | )3 | | | 0.01 | 3 | | | (0.02 | )3 | | | (0.04 | )3 |
Net realized and unrealized gains (losses) on investments | | | 0.95 | | | | 0.54 | | | | 1.96 | | | | 0.52 | | | | 0.01 | | | | (1.23 | ) | | | 1.42 | |
| | | | | | | | | | | | | | | | | | | | | | | | | | | | |
Total from investment operations | | | 0.92 | | | | 0.45 | | | | 1.89 | | | | 0.48 | | | | 0.02 | | | | (1.25 | ) | | | 1.38 | |
Distributions to shareholders from | | | | | | | | | | | | | | | | | | | | | | | | | | | | |
Net realized gains | | | 0.00 | | | | (0.25 | ) | | | 0.00 | | | | 0.00 | | | | 0.00 | | | | 0.00 | | | | 0.00 | |
Net asset value, end of period | | $ | 10.11 | | | $ | 9.19 | | | $ | 8.99 | | | $ | 7.10 | | | $ | 6.62 | | | $ | 6.60 | | | $ | 7.85 | |
Total return4 | | | 10.01 | % | | | 5.22 | % | | | 26.62 | % | | | 7.25 | % | | | 0.30 | % | | | (15.92 | )% | | | 21.33 | % |
Ratios to average net assets (annualized) | | | | | | | | | | | | | | | | | | | | | | | | | | | | |
Gross expenses | | | 1.95 | % | | | 1.97 | % | | | 2.00 | % | | | 1.84 | % | | | 1.87 | % | | | 1.81 | % | | | 1.82 | % |
Net expenses | | | 1.87 | % | | | 1.87 | % | | | 1.87 | % | | | 1.83 | % | | | 1.87 | % | | | 1.81 | % | | | 1.82 | % |
Net investment income (loss) | | | (0.71 | )% | | | (1.04 | )% | | | (0.85 | )% | | | (0.69 | )% | | | 0.11 | % | | | (0.31 | )% | | | (0.61 | )% |
Supplemental data | | | | | | | | | | | | | | | | | | | | | | | | | | | | |
Portfolio turnover rate | | | 14 | % | | | 51 | % | | | 65 | % | | | 89 | % | | | 24 | % | | | 39 | % | | | 21 | % |
Net assets, end of period (000s omitted) | | $ | 6,318 | | | $ | 6,962 | | | $ | 10,244 | | | $ | 13,957 | | | $ | 7,951 | | | $ | 10,489 | | | $ | 16,694 | |
| 1. | After the close of business on July 16, 2010, the Fund acquired the net assets of Evergreen Large Company Growth Fund and Wells Fargo Advantage Large Company Growth Fund. Evergreen Large Company Growth Fund became the accounting and performance survivor in the transaction. The information for the periods prior to July 19, 2010 is that of Class B of Evergreen Large Company Growth Fund. |
| 2. | For the ten months ended July 31, 2010. The Fund changed its fiscal year end from September 30 to July 31, effective July 31, 2010. |
| 3. | Calculated based upon average shares outstanding |
| 4. | Total return calculations do not include any sales charges. Returns for periods of less than one year are not annualized. |
The accompanying notes are an integral part of these financial statements.
| | | | | | |
| Financial highlights | | Wells Fargo Advantage Premier Large Company Growth Fund | | | 19 | |
(For a share outstanding throughout each period)
| | | | | | | | | | | | | | | | | | | | | | | | | | | | |
| | | Six months ended
January 31, 2013
(unaudited) | | | Year ended July 31 | | | Year ended September 30 | |
| CLASS C | | | 2012 | | | 2011 | | | 20101,2 | | | 20091 | | | 20081 | | | 20071 | |
Net asset value, beginning of period | | $ | 9.17 | | | $ | 8.97 | | | $ | 7.08 | | | $ | 6.62 | | | $ | 6.59 | | | $ | 7.84 | | | $ | 6.47 | |
Net investment income (loss) | | | (0.03 | )3 | | | (0.10 | )3 | | | (0.08 | )3 | | | (0.04 | )3 | | | 0.00 | 3,4 | | | (0.02 | )3 | | | (0.04 | )3 |
Net realized and unrealized gains (losses) on investments | | | 0.95 | | | | 0.55 | | | | 1.97 | | | | 0.52 | | | | 0.03 | | | | (1.23 | ) | | | 1.41 | |
| | | | | | | | | | | | | | | | | | | | | | | | | | | | |
Total from investment operations | | | 0.92 | | | | 0.45 | | | | 1.89 | | | | 0.48 | | | | 0.03 | | | | (1.25 | ) | | | 1.37 | |
Distributions to shareholders from | | | | | | | | | | | | | | | | | | | | | | | | | | | | |
Net investment income | | | 0.00 | | | | 0.00 | | | | 0.00 | | | | (0.02 | ) | | | 0.00 | | | | 0.00 | | | | 0.00 | |
Net realized gains | | | 0.00 | | | | (0.25 | ) | | | 0.00 | | | | 0.00 | | | | 0.00 | | | | 0.00 | | | | 0.00 | |
| | | | | | | | | | | | | | | | | | | | | | | | | | | | |
Total distributions to shareholders | | | 0.00 | | | | (0.25 | ) | | | 0.00 | | | | (0.02 | ) | | | 0.00 | | | | 0.00 | | | | 0.00 | |
Net asset value, end of period | | $ | 10.09 | | | $ | 9.17 | | | $ | 8.97 | | | $ | 7.08 | | | $ | 6.62 | | | $ | 6.59 | | | $ | 7.84 | |
Total return5 | | | 10.03 | % | | | 5.24 | % | | | 26.69 | % | | | 7.18 | % | | | 0.46 | % | | | (15.94 | )% | | | 21.17 | % |
Ratios to average net assets (annualized) | | | | | | | | | | | | | | | | | | | | | | | | | | | | |
Gross expenses | | | 1.95 | % | | | 1.98 | % | | | 1.99 | % | | | 1.84 | % | | | 1.87 | % | | | 1.82 | % | | | 1.82 | % |
Net expenses | | | 1.87 | % | | | 1.87 | % | | | 1.87 | % | | | 1.83 | % | | | 1.87 | % | | | 1.82 | % | | | 1.82 | % |
Net investment income (loss) | | | (0.69 | )% | | | (1.07 | )% | | | (0.90 | )% | | | (0.68 | )% | | | 0.08 | % | | | (0.30 | )% | | | (0.61 | )% |
Supplemental data | | | | | | | | | | | | | | | | | | | | | | | | | | | | |
Portfolio turnover rate | | | 14 | % | | | 51 | % | | | 65 | % | | | 89 | % | | | 24 | % | | | 39 | % | | | 21 | % |
Net assets, end of period (000s omitted) | | | $209,340 | | | | $129,980 | | | | $35,783 | | | | $22,246 | | | | $13,717 | | | | $10,046 | | | | $10,058 | |
| 1. | After the close of business on July 16, 2010, the Fund acquired the net assets of Evergreen Large Company Growth Fund and Wells Fargo Advantage Large Company Growth Fund. Evergreen Large Company Growth Fund became the accounting and performance survivor in the transaction. The information for the periods prior to July 19, 2010 is that of Class C of Evergreen Large Company Growth Fund. |
| 2. | For the ten months ended July 31, 2010. The Fund changed its fiscal year end from September 30 to July 31, effective July 31, 2010. |
| 3. | Calculated based upon average shares outstanding |
| 4. | Amount is less than 0.005. |
| 5. | Total return calculations do not include any sales charges. Returns for periods of less than one year are not annualized. |
The accompanying notes are an integral part of these financial statements.
| | | | |
| 20 | | Wells Fargo Advantage Premier Large Company Growth Fund | | Financial highlights |
(For a share outstanding throughout each period)
| | | | |
| | | Period ended
January 31, 20131
(unaudited) | |
| CLASS R4 | |
Net asset value, beginning of period | | $ | 10.81 | |
Net investment income | | | 0.01 | |
Net realized and unrealized gains (losses) on investments | | | 0.56 | |
| | | | |
Total from investment operations | | | 0.57 | |
Net asset value, end of period | | $ | 11.38 | |
Total return2 | | | 5.27 | % |
Ratios to average net assets (annualized) | | | | |
Gross expenses | | | 0.84 | % |
Net expenses | | | 0.80 | % |
Net investment income | | | 0.78 | % |
Supplemental data | | | | |
Portfolio turnover rate | | | 14 | % |
Net assets, end of period (000s omitted) | | | $11 | |
| 1. | For the period from November 30, 2012 (commencement of class operations) to January 31, 2013 |
| 2. | Returns for periods of less than one year are not annualized. |
The accompanying notes are an integral part of these financial statements.
| | | | | | |
| Financial highlights | | Wells Fargo Advantage Premier Large Company Growth Fund | | | 21 | |
(For a share outstanding throughout each period)
| | | | |
| | | Period ended
January 31, 20131
(unaudited) | |
| CLASS R6 | |
Net asset value, beginning of period | | $ | 10.81 | |
Net investment loss | | | (0.00 | )2 |
Net realized and unrealized gains (losses) on investments | | | 0.57 | |
| | | | |
Total from investment operations | | | 0.57 | |
Net asset value, end of period | | $ | 11.38 | |
Total return3 | | | 5.27 | % |
Ratios to average net assets (annualized) | | | | |
Gross expenses | | | 0.72 | % |
Net expenses | | | 0.65 | % |
Net investment loss | | | (0.31 | )% |
Supplemental data | | | | |
Portfolio turnover rate | | | 14 | % |
Net assets, end of period (000s omitted) | | | $1,501 | |
| 1. | For the period from November 30, 2012 (commencement of class operations) to January 31, 2013 |
| 2. | Amount is less than $0.005. |
| 3. | Returns for periods of less than one year are not annualized. |
The accompanying notes are an integral part of these financial statements.
| | | | |
| 22 | | Wells Fargo Advantage Premier Large Company Growth Fund | | Financial highlights |
(For a share outstanding throughout each period)
| | | | | | | | | | | | | | | | |
| | | Six months ended
January 31, 2013
(unaudited) | | | Year ended July 31 | |
| ADMINISTRATOR CLASS | | | 2012 | | | 2011 | | | 20101 | |
Net asset value, beginning of period | | $ | 10.24 | | | $ | 9.90 | | | $ | 7.75 | | | $ | 7.53 | |
Net investment income (loss) | | | 0.01 | | | | (0.02 | ) | | | 0.00 | 2 | | | (0.00 | ) |
Net realized and unrealized gains (losses) on investments | | | 1.06 | | | | 0.61 | | | | 2.16 | | | | 0.22 | |
| | | | | | | | | | | | | | | | |
Total from investment operations | | | 1.07 | | | | 0.59 | | | | 2.16 | | | | 0.22 | |
Distributions to shareholders from | | | | | | | | | | | | | | | | |
Net investment income | | | 0.00 | | | | 0.00 | | | | (0.01 | ) | | | 0.00 | |
Net realized gains | | | 0.00 | | | | (0.25 | ) | | | 0.00 | | | | 0.00 | |
| | | | | | | | | | | | | | | | |
Total distributions to shareholders | | | 0.00 | | | | (0.25 | ) | | | (0.01 | ) | | | 0.00 | |
Net asset value, end of period | | $ | 11.31 | | | $ | 10.24 | | | $ | 9.90 | | | $ | 7.75 | |
Total return3 | | | 10.45 | % | | | 6.28 | % | | | 27.75 | % | | | 2.92 | % |
Ratios to average net assets (annualized) | | | | | | | | | | | | | | | | |
Gross expenses | | | 1.04 | % | | | 1.07 | % | | | 1.08 | % | | | 1.13 | % |
Net expenses | | | 0.95 | % | | | 0.95 | % | | | 0.95 | % | | | 0.95 | % |
Net investment income (loss) | | | 0.23 | % | | | (0.16 | )% | | | 0.01 | % | | | (0.34 | )% |
Supplemental data | | | | | | | | | | | | | | | | |
Portfolio turnover rate | | | 14 | % | | | 51 | % | | | 65 | % | | | 89 | % |
Net assets, end of period (000s omitted) | | | $426,552 | | | | $251,759 | | | | $54,335 | | | | $36,508 | |
| 1. | For the period from July 16, 2010 (commencement of class operations) to July 31, 2010 |
| 2. | Calculated based upon average shares outstanding |
| 3. | Returns for periods of less than one year are not annualized. |
The accompanying notes are an integral part of these financial statements.
| | | | | | |
| Financial highlights | | Wells Fargo Advantage Premier Large Company Growth Fund | | | 23 | |
(For a share outstanding throughout each period)
| | | | | | | | | | | | | | | | | | | | | | | | | | | | |
| | | Six months ended
January 31, 2013
(unaudited) | | | Year ended July 31 | | | Year ended September 30 | |
| INSTITUTIONAL CLASS | | | 2012 | | | 2011 | | | 20101,2 | | | 20091 | | | 20081 | | | 20071 | |
Net asset value, beginning of period | | $ | 10.28 | | | $ | 9.91 | | | $ | 7.75 | | | $ | 7.24 | | | $ | 7.22 | | | $ | 8.53 | | | $ | 6.96 | |
Net investment income | | | 0.02 | | | | 0.00 | 3,4 | | | 0.02 | 3 | | | 0.02 | | | | 0.06 | 3 | | | 0.05 | 3 | | | 0.03 | 3 |
Net realized and unrealized gains (losses) on investments | | | 1.07 | | | | 0.62 | | | | 2.15 | | | | 0.57 | | | | 0.02 | | | | (1.33 | ) | | | 1.54 | |
| | | | | | | | | | | | | | | | | | | | | | | | | | | | |
Total from investment operations | | | 1.09 | | | | 0.62 | | | | 2.17 | | | | 0.59 | | | | 0.08 | | | | (1.28 | ) | | | 1.57 | |
Distributions to shareholders from | | | | | | | | | | | | | | | | | | | | | | | | | | | | |
Net investment income | | | 0.00 | | | | 0.00 | | | | (0.01 | ) | | | (0.08 | ) | | | (0.06 | ) | | | (0.03 | ) | | | 0.00 | |
Net realized gains | | | 0.00 | | | | (0.25 | ) | | | 0.00 | | | | 0.00 | | | | 0.00 | | | | 0.00 | | | | 0.00 | |
| | | | | | | | | | | | | | | | | | | | | | | | | | | | |
Total distributions to shareholders | | | 0.00 | | | | (0.25 | ) | | | (0.01 | ) | | | (0.08 | ) | | | (0.06 | ) | | | (0.03 | ) | | | 0.00 | |
Net asset value, end of period | | $ | 11.37 | | | $ | 10.28 | | | $ | 9.91 | | | $ | 7.75 | | | $ | 7.24 | | | $ | 7.22 | | | $ | 8.53 | |
Total return5 | | | 10.60 | % | | | 6.48 | % | | | 28.03 | % | | | 8.20 | % | | | 1.28 | % | | | (15.07 | )% | | | 22.56 | % |
Ratios to average net assets (annualized) | | | | | | | | | | | | | | | | | | | | | | | | | | | | |
Gross expenses | | | 0.77 | % | | | 0.79 | % | | | 0.81 | % | | | 0.83 | % | | | 0.87 | % | | | 0.81 | % | | | 0.82 | % |
Net expenses | | | 0.73 | % | | | 0.75 | % | | | 0.75 | % | | | 0.82 | % | | | 0.87 | % | | | 0.81 | % | | | 0.82 | % |
Net investment income | | | 0.44 | % | | | 0.04 | % | | | 0.22 | % | | | 0.34 | % | | | 1.04 | % | | | 0.68 | % | | | 0.39 | % |
Supplemental data | | | | | | | | | | | | | | | | | | | | | | | | | | | | |
Portfolio turnover rate | | | 14 | % | | | 51 | % | | | 65 | % | | | 89 | % | | | 24 | % | | | 39 | % | | | 21 | % |
Net assets, end of period (000s omitted) | | | $357,584 | | | | $223,616 | | | | $30,493 | | | | $18,841 | | | | $11,335 | | | | $6,321 | | | | $11,197 | |
| 1. | After the close of business on July 16, 2010, the Fund acquired the net assets of Evergreen Large Company Growth Fund and Wells Fargo Advantage Large Company Growth Fund. Evergreen Large Company Growth Fund became the accounting and performance survivor in the transaction. The information for the periods prior to July 19, 2010 is that of Class I of Evergreen Large Company Growth Fund. |
| 2. | For the ten months ended July 31, 2010. The Fund changed its fiscal year end from September 30 to July 31, effective July 31, 2010. |
| 3. | Calculated based upon average shares outstanding |
| 4. | Amount is less than $0.005. |
| 5. | Returns for periods of less than one year are not annualized. |
The accompanying notes are an integral part of these financial statements.
| | | | |
| 24 | | Wells Fargo Advantage Premier Large Company Growth Fund | | Financial highlights |
(For a share outstanding throughout each period)
| | | | | | | | | | | | | | | | |
| | | Six months ended
January 31, 2013
(unaudited) | | | Year ended July 31 | |
| INVESTOR CLASS | | | 2012 | | | 2011 | | | 20101 | |
Net asset value, beginning of period | | $ | 10.19 | | | $ | 9.87 | | | $ | 7.75 | | | $ | 7.54 | |
Net investment loss | | | (0.00 | )2 | | | (0.03 | ) | | | (0.02 | ) | | | (0.00 | ) |
Net realized and unrealized gains (losses) on investments | | | 1.06 | | | | 0.60 | | | | 2.15 | | | | 0.21 | |
| | | | | | | | | | | | | | | | |
Total from investment operations | | | 1.06 | | | | 0.57 | | | | 2.13 | | | | 0.21 | |
Distributions to shareholders from | | | | | | | | | | | | | | | | |
Net investment income | | | 0.00 | | | | 0.00 | | | | (0.01 | ) | | | 0.00 | |
Net realized gains | | | 0.00 | | | | (0.25 | ) | | | 0.00 | | | | 0.00 | |
| | | | | | | | | | | | | | | | |
Total distributions to shareholders | | | 0.00 | | | | (0.25 | ) | | | (0.01 | ) | | | 0.00 | |
Net asset value, end of period | | $ | 11.25 | | | $ | 10.19 | | | $ | 9.87 | | | $ | 7.75 | |
Total return3 | | | 10.40 | % | | | 5.99 | % | | | 27.48 | % | | | 2.79 | % |
Ratios to average net assets (annualized) | | | | | | | | | | | | | | | | |
Gross expenses | | | 1.25 | % | | | 1.29 | % | | | 1.31 | % | | | 1.36 | % |
Net expenses | | | 1.19 | % | | | 1.19 | % | | | 1.19 | % | | | 1.19 | % |
Net investment loss | | | (0.02 | )% | | | (0.37 | )% | | | (0.20 | )% | | | (0.59 | )% |
Supplemental data | | | | | | | | | | | | | | | | |
Portfolio turnover rate | | | 14 | % | | | 51 | % | | | 65 | % | | | 89 | % |
Net assets, end of period (000s omitted) | | | $124,608 | | | | $99,675 | | | | $79,464 | | | | $64,781 | |
| 1. | For the period from July 16, 2010 (commencement of class operations) to July 31, 2010 |
| 2. | Amount is less than $0.005. |
| 3. | Returns for periods of less than one year are not annualized. |
The accompanying notes are an integral part of these financial statements.
| | | | | | |
| Notes to financial statements (unaudited) | | Wells Fargo Advantage Premier Large Company Growth Fund | | | 25 | |
1. ORGANIZATION
Wells Fargo Funds Trust (the “Trust”), a Delaware statutory trust organized on March 10, 1999, is an open-end management investment company registered under the Investment Company Act of 1940, as amended (the “1940 Act”). These financial statements report on Wells Fargo Advantage Premier Large Company Growth Fund (the “Fund”) which is a diversified series of the Trust.
2. SIGNIFICANT ACCOUNTING POLICIES
The following significant accounting policies, which are consistently followed in the preparation of the financial statements of the Fund, are in conformity with U.S. generally accepted accounting principles which require management to make estimates and assumptions that affect the reported amounts of assets and liabilities, disclosure of contingent assets and liabilities at the date of the financial statements, and the reported amounts of revenues and expenses during the reporting period. Actual results could differ from those estimates.
Securities valuation
All investments are valued each business day as of the close of regular trading on the New York Stock Exchange (normally 4 p.m. Eastern Time).
Equity securities that are listed on a foreign or domestic exchange, except for The Nasdaq Stock Market, Inc. (“Nasdaq”), are valued at the official closing price or, if none, the last sales price. Securities listed on Nasdaq are valued at the Nasdaq Official Closing Price (“NOCP”). If no NOCP is available, securities are valued at the last sales price. If no sales price is shown on the Nasdaq, the bid price will be used. If no sale occurs on the primary exchange or market for the security that day or if no sale occurs and no bid price is shown on Nasdaq, the prior day’s price will be deemed “stale” and fair values will be determined in accordance with the Fund’s Valuation Procedures.
Investments in registered open-end investment companies are valued at net asset value. Non-registered investment companies are fair valued at net asset value.
Investments which are not valued using any of the methods discussed above are valued at their fair value, as determined by procedures established in good faith and approved by the Board of Trustees. The Board of Trustees has established a Valuation Committee comprised of the Trustees and has delegated to it the authority to take any actions regarding the valuation of portfolio securities that the Valuation Committee deems necessary or appropriate, including determining the fair value of portfolio securities, unless the determination has been delegated to the Management Valuation Team of Wells Fargo Funds Management, LLC (“Funds Management”). The Board of Trustees retains the authority to make or ratify any valuation decisions or approve any changes to the Valuation Procedures as it deems appropriate. On a quarterly basis, the Board of Trustees receives reports on any valuation actions taken by the Valuation Committee or the Management Valuation Team which may include items for ratification.
Valuations of fair valued securities are compared to the next actual sales price when available, or other appropriate market information to assess the continued appropriateness of the fair valuation methodology used. These securities are fair valued on a day-to-day basis, taking into consideration changes to appropriate market information and any significant changes to the input factors considered in the valuation process until there is a readily available price provided on the exchange or by an independent pricing service. Valuations received from an independent pricing service or broker quotes are periodically validated by comparisons to most recent trades and valuations provided by other independent pricing services in addition to the review of prices by the adviser and/or subadviser. Unobservable inputs used in determining fair valuations are identified based on the type of security, taking into consideration factors utilized by market participants in valuing the investment, knowledge about the issuer and the current market environment.
Security loans
The Fund may lend its securities from time to time in order to earn additional income in the form of fees or interest on securities received as collateral or the investment of any cash received as collateral. The Fund continues to receive interest or dividends on the securities loaned. The Fund receives collateral in the form of cash or securities with a value at least equal to the value of the securities on loan. The value of the loaned securities is determined at the close of each business day and any additional required collateral is delivered to the Fund on the next business day. In a securities lending transaction, the net asset value of the Fund will be affected by an increase or decrease in the value of the securities loaned and by an increase or decrease in the value of the instrument in which collateral is invested. The amount of securities lending activity undertaken by the Fund fluctuates from time to time. In the event of default or bankruptcy by the borrower, the Fund may be prevented from recovering the loaned securities or gaining access to the collateral or may experience delays or costs in doing so. In addition, the investment of any cash collateral received may lose all or part of its value. The Fund has the right under the lending agreement to recover the securities from the borrower on demand.
| | | | |
| 26 | | Wells Fargo Advantage Premier Large Company Growth Fund | | Notes to financial statements (unaudited) |
The Fund lends its securities through an unaffiliated securities lending agent. Cash collateral received in connection with its securities lending transactions is invested in Wells Fargo Securities Lending Cash Investments, LLC (the “Cash Collateral Fund”). The Cash Collateral Fund is exempt from registration under Section 3(c)(7) of the 1940 Act and is managed by Funds Management and is subadvised by Wells Capital Management Incorporated (“WellsCap”). Funds Management receives an advisory fee starting at 0.05% and declining to 0.01% as the average daily net assets of the Cash Collateral Fund increase. All of the fees received by Funds Management are paid to WellsCap for its services as subadviser. The Cash Collateral Fund seeks to provide a positive return compared to the daily Fed Funds Open rate by investing in high-quality, U.S. dollar-denominated short-term money market instruments. Cash Collateral Fund investments are fair valued based upon the amortized cost valuation technique. Income earned from investment in the Cash Collateral Fund is included in securities lending income on the Statement of Operations.
Security transactions and income recognition
Securities transactions are recorded on a trade date basis. Realized gains or losses are recorded on the basis of identified cost.
Dividend income is recognized on the ex-dividend date.
Distributions to shareholders
Distributions to shareholders from net investment income and net realized gains, if any, are recorded on the ex-dividend date. Such distributions are determined in conformity with federal income tax regulations, which may differ in amount or character from net investment income and realized gains recognized for purposes of U.S. generally accepted accounting principles.
Federal and other taxes
The Fund intends to continue to qualify as a regulated investment company by distributing substantially all of its investment company taxable income and any net realized capital gains (after reduction for capital loss carryforwards) sufficient to relieve it from all, or substantially all, federal income taxes. Accordingly, no provision for federal income taxes was required.
The Fund’s income and federal excise tax returns and all financial records supporting those returns for the prior three fiscal years are subject to examination by the federal and Delaware revenue authorities. Management has analyzed the Fund’s tax positions taken on federal, state, and foreign tax returns for all open tax years and does not believe that there are any uncertain tax positions that require recognition of a tax liability.
At July 31, 2012, net capital loss carryforwards, which were available to offset future net realized capital gains, were as follows:
| | | | | | |
Pre-enactment capital loss expiration* | | Post-enactment capital losses** |
| 2015 | | 2016 | | 2017 | | Short-term |
| $703,589 | | $54,899,363 | | $18,219,476 | | $9,162,645 |
| * | | Losses incurred in taxable years beginning before December 22, 2010. |
| ** | | Losses incurred in taxable years which began after December 22, 2010 are carried forward for an unlimited period. |
As of July 31, 2012, the Fund had a qualified late-year ordinary loss of $2,575,935 which will be recognized on the first day of the current fiscal year. A late-year ordinary loss is the net loss comprised of (a) net gain or loss from the sale or other disposition of certain capital assets for the portion of the taxable year after October 31 and (b) other ordinary income or loss for the portion of the taxable year after December 31.
Class allocations
The separate classes of shares offered by the Fund differ principally in applicable sales charges, distribution, shareholder servicing, and administration fees. Shareholders of each class bear certain expenses that pertain to that particular class. All shareholders bear the common expenses of the Fund, earn income from the portfolio, and are allocated any unrealized gains and losses pro rata based on the average daily net assets of each class, without distinction between share classes. Dividends are determined separately for each class based on income and expenses allocable to each class. Realized gains and losses are allocated to each class pro rata based upon the net assets of each class on the date realized. Differences in per share dividend rates generally result from the relative weightings of pro rata income and realized gain allocations and from differences in separate class expenses, including distribution, shareholder servicing, and administration fees.
| | | | | | |
| Notes to financial statements (unaudited) | | Wells Fargo Advantage Premier Large Company Growth Fund | | | 27 | |
3. FAIR VALUATION MEASUREMENTS
Fair value measurements of investments are determined within a framework that has established a fair value hierarchy based upon the various data inputs utilized in determining the value of the Fund’s investments. The three-level hierarchy gives the highest priority to unadjusted quoted prices in active markets for identical assets or liabilities (Level 1) and the lowest priority to significant unobservable inputs (Level 3). The Fund’s investments are classified within the fair value hierarchy based on the lowest level of input that is significant to the fair value measurement. The inputs are summarized into three broad levels as follows:
| n | | Level 1 – quoted prices in active markets for identical securities |
| n | | Level 2 – other significant observable inputs (including quoted prices for similar securities, interest rates, prepayment speeds, credit risk, use of amortized cost, etc.) |
| n | | Level 3 – significant unobservable inputs (including the Fund’s own assumptions in determining the fair value of investments) |
The inputs or methodologies used for valuing investments in securities are not necessarily an indication of the risk associated with investing in those securities.
As of January 31, 2013, the inputs used in valuing investments in securities, which are carried at fair value, were as follows:
| | | | | | | | | | | | | | | | |
| Investments in securities | | Quoted prices (Level 1) | | | Significant other observable Inputs (Level 2) | | | Significant unobservable inputs (Level 3) | | | Total | |
| | | | |
Equity securities | | | | | | | | | | | | | | | | |
Common stocks | | $ | 2,213,505,470 | | | $ | 0 | | | $ | 0 | | | $ | 2,213,505,470 | |
Investment companies | | | 46,212,020 | | | | 0 | | | | 0 | | | | 46,212,020 | |
| | | | |
Other | | | 0 | | | | 0 | | | | 414,884 | | | | 414,884 | |
| | | | |
Short-term investments | | | | | | | | | | | | | | | | |
Investment companies | | | 53,766,526 | | | | 236,476,308 | | | | 0 | | | | 290,242,834 | |
| | | $ | 2,313,484,016 | | | $ | 236,476,308 | | | $ | 414,884 | | | $ | 2,550,375,208 | |
Further details on the major security types listed above can be found in the Portfolio of Investments.
Transfers in and transfers out are recognized at the end of the reporting period. For the six months ended January 31, 2013, the Fund did not have any transfers into/out of Level 1 or Level 2.
4. TRANSACTIONS WITH AFFILIATES AND OTHER EXPENSES
Advisory fee
The Trust has entered into an advisory contract with Funds Management, an indirect wholly owned subsidiary of Wells Fargo & Company (“Wells Fargo”). The adviser is responsible for implementing investment policies and guidelines and for supervising the subadviser, who is responsible for day-to-day portfolio management of the Fund.
Pursuant to the contract, Funds Management is entitled to receive an annual advisory fee starting at 0.65% and declining to 0.55% as the average daily net assets of the Fund increase. For the six months ended January 31, 2013, the advisory fee was equivalent to an annual rate of 0.62% of the Fund’s average daily net assets.
Funds Management has retained the services of a subadviser to provide daily portfolio management to the Fund. The fee for subadvisory services is borne by Funds Management. WellsCap, an affiliate of Funds Management, is the subadviser to the Fund and is entitled to receive a fee from Funds Management at an annual rate starting at 0.35% and declining to 0.15% as the average daily net assets of the Fund increase.
| | | | |
| 28 | | Wells Fargo Advantage Premier Large Company Growth Fund | | Notes to financial statements (unaudited) |
Administration and transfer agent fees
The Trust has entered into an administration agreement with Funds Management. Under this agreement, for providing administrative services, which includes paying fees and expenses for services provided by the transfer agent, sub-transfer agents, omnibus account servicers and record-keepers, Funds Management is entitled to receive from the Fund an annual fund level administration fee starting at 0.05% and declining to 0.03% as the average daily net assets of the Fund increase and a class level administration fee which is calculated based on the average daily net assets of each class as follows:
| | | | |
| | | Class level administration fee | |
Class A, Class B, Class C | | | 0.26 | % |
Class R4, Institutional Class | | | 0.08 | |
Class R6 | | | 0.03 | |
Administrator Class | | | 0.10 | |
Investor Class | | | 0.32 | |
Funds Management has contractually waived and/or reimbursed advisory and administration fees to the extent necessary to maintain certain net operating expense ratios for the Fund. Waiver of fees and/or reimbursement of expenses by Funds Management were made first from fund level expenses on a proportionate basis and then from class specific expenses. Funds Management has committed through November 30, 2014 to waive fees and/or reimburse expenses to the extent necessary to cap the Fund’s expenses at 1.12% for Class A shares, 1.87% for Class B shares, 1.87% for Class C shares, 0.80% for Class R4 shares, 0.65% for Class R6 shares, 0.95% for Administrator Class shares, 0.70% for Institutional Class shares, and 1.18% for Investor Class shares.
Distribution fees
The Trust has adopted a Distribution Plan for Class B and Class C shares of the Fund pursuant to Rule 12b-1 under the 1940 Act. Distribution fees are charged to Class B and Class C shares and paid to Wells Fargo Funds Distributor, LLC, the principal underwriter, at an annual rate of 0.75% of the average daily net assets of Class B and Class C shares.
For the six months ended January 31, 2013, Wells Fargo Funds Distributor, LLC received $185,153 from the sale of Class A shares and $674 and $4,516 in contingent deferred sales charges from redemptions of Class B and Class C shares, respectively.
Shareholder servicing fees
The Trust has entered into contracts with one or more shareholder servicing agents, whereby Class A, Class B, Class C, Administrator Class, and Investor Class of the Fund is charged a fee at an annual rate of 0.25% of the average daily net assets of each respective class. Class R4 shares are charged a fee at an annual rate of 0.10% of its average daily net assets.
A portion of these total shareholder servicing fees were paid to affiliates of Wells Fargo.
5. INVESTMENT PORTFOLIO TRANSACTIONS
Purchases and sales of investments, excluding U.S. government obligations (if any) and short-term securities, for the six months ended January 31, 2013 were $758,498,097 and $262,004,065, respectively.
6. BANK BORROWINGS
The Trust (excluding the money market funds and certain other funds in the Trust) and Wells Fargo Variable Trust are parties to a $150,000,000 revolving credit agreement with State Street Bank and Trust Company, whereby the Fund is permitted to use bank borrowings for temporary or emergency purposes, such as to fund shareholder redemption requests. Interest under the credit agreement is charged to the Fund based on a borrowing rate equal to the higher of the Federal Funds rate in effect on that day plus 1.25% or the overnight LIBOR rate in effect on that day plus 1.25%. In addition, an annual commitment fee equal to 0.10% of the unused balance is allocated to each participating fund. For the six months ended January 31, 2013, the Fund paid $727 in commitment fees.
For the six months ended January 31, 2013, there were no borrowings by the Fund under the agreement.
| | | | | | |
| Notes to financial statements (unaudited) | | Wells Fargo Advantage Premier Large Company Growth Fund | | | 29 | |
7. INDEMNIFICATION
Under the Trust’s organizational documents, the officers and directors are indemnified against certain liabilities that may arise out of performance of their duties to the Trust. Additionally, in the normal course of business, the Trust may enter into contracts with service providers that contain a variety of indemnification clauses. The Trust’s maximum exposure under these arrangements is dependent on future claims that may be made against the Fund and, therefore, cannot be estimated.
8. NEW ACCOUNTING PRONOUNCEMENT
In December 2011, the Financial Accounting Standards Board (“FASB”) issued Accounting Standard Update (“ASU”) No. 2011-11, Disclosures about Offsetting Assets and Liabilities. ASU 2011-11, which amends FASB ASC Topic 210, Balance Sheet, creates new disclosure requirements which require entities to disclose both gross and net information for derivatives and other financial instruments that are either offset in the Statement of Assets and Liabilities or subject to an enforceable master netting arrangement or similar agreement. The disclosure requirements are effective for interim and annual reporting periods beginning on or after January 1, 2013. Management is currently assessing the potential impact, in addition to expanded financial statement disclosure, that may result from adopting this ASU.
| | | | |
| 30 | | Wells Fargo Advantage Premier Large Company Growth Fund | | Other information (unaudited) |
PROXY VOTING INFORMATION
A description of the policies and procedures that the Fund uses to determine how to vote proxies relating to portfolio securities is available without charge, upon request, by calling 1-800-222-8222, visiting our website at wellsfargoadvantagefunds.com, or visiting the SEC website at sec.gov. Information regarding how the Fund voted proxies relating to portfolio securities during the most recent 12-month period ended June 30 is available without charge on the Fund’s website at wellsfargoadvantagefunds.com or by visiting the SEC website at sec.gov.
PORTFOLIO HOLDINGS INFORMATION
The complete portfolio holdings for the Fund are publicly available on the Fund’s website (wellsfargoadvantagefunds.com) on a monthly, 30-day or more delayed basis. In addition, top ten holdings information for the Fund is publicly available on the Fund’s website on a monthly, seven-day or more delayed basis. The Fund files its complete schedule of portfolio holdings with the SEC for the first and third quarters of each fiscal year on Form N-Q, which is available without charge by visiting the SEC website at sec.gov. In addition, the Fund’s Form N-Q may be reviewed and copied at the SEC’s Public Reference Room in Washington, DC, and at regional offices in New York City, at 233 Broadway, and in Chicago, at 175 West Jackson Boulevard, Suite 900. Information about the Public Reference Room may be obtained by calling 1-800-SEC-0330.
| | | | | | |
| Other information (unaudited) | | Wells Fargo Advantage Premier Large Company Growth Fund | | | 31 | |
BOARD OF TRUSTEES AND OFFICERS
Each of the Trustees and Officers listed in the table below acts in identical capacities for the Wells Fargo Advantage family of funds, which consists of 136 funds1 comprising the Wells Fargo Funds Trust, Wells Fargo Variable Trust, Wells Fargo Master Trust and four closed-end funds (collectively the “Fund Complex”). This table should be read in conjunction with the Prospectus and the Statement of Additional Information2. All of the Trustees are also Members of the Audit and Governance Committees of each Trust in the Fund Complex. The mailing address of each Trustee and Officer is 525 Market Street, 12th Floor, San Francisco, CA 94105. Each Trustee and Officer serves an indefinite term, however, each Trustee serves such term until reaching the mandatory retirement age established by the Trustees.
Independent Trustees
| | | | | | |
Name and year of birth | | Position held and length of service* | | Principal occupations during past five years | | Other directorships during
past five years |
Peter G. Gordon (Born 1942) | | Trustee, since 1998; Chairman, since 2005 | | Co-Founder, Retired Chairman, President and CEO of Crystal Geyser Water Company. Trustee Emeritus, Colby College. | | Asset Allocation Trust |
Isaiah Harris, Jr. (Born 1952) | | Trustee, since 2009 | | Retired. Prior thereto, President and CEO of BellSouth Advertising and Publishing Corp. from 2005 to 2007, President and CEO of BellSouth Enterprises from 2004 to 2005 and President of BellSouth Consumer Services from 2000 to 2003. Emeritus member of the Iowa State University Foundation Board of Governors. Emeritus Member of the Advisory Board of Iowa State University School of Business. Advisory Board Member, Palm Coast Academy (charter school). Mr. Harris is a certified public accountant. | | CIGNA Corporation; Deluxe Corporation; Asset Allocation Trust |
Judith M. Johnson (Born 1949) | | Trustee, since 2008; Audit Committee Chairman, since 2008 | | Retired. Prior thereto, Chief Executive Officer and Chief Investment Officer of Minneapolis Employees Retirement Fund from 1996 to 2008. Ms. Johnson is an attorney, certified public accountant and a certified managerial accountant. | | Asset Allocation Trust |
Leroy Keith, Jr. (Born 1939) | | Trustee, since 2010 | | Chairman, Bloc Global Services (development and construction). Trustee of the Evergreen Funds from 1983 to 2010. Former Managing Director, Almanac Capital Management (commodities firm), former Partner, Stonington Partners, Inc. (private equity fund), former Director, Obagi Medical Products Co. and former Director, Lincoln Educational Services. | | Trustee, Virtus Fund Complex (consisting of 48 portfolios as of 1/31/13); Asset Allocation Trust |
David F. Larcker (Born 1950) | | Trustee, since 2009 | | James Irvin Miller Professor of Accounting at the Graduate School of Business, Stanford University, Morgan Stanley Director of the Center for Leadership Development and Research and Senior Faculty of The Rock Center for Corporate Governance since 2006. From 2005 to 2008, Professor of Accounting at the Graduate School of Business, Stanford University. Prior thereto, Ernst & Young Professor of Accounting at The Wharton School, University of Pennsylvania from 1985 to 2005. | | Asset Allocation Trust |
Olivia S. Mitchell (Born 1953) | | Trustee, since 2006 | | International Foundation of Employee Benefit Plans Professor, Wharton School of the University of Pennsylvania since 1993. Director of Wharton’s Pension Research Council and Boettner Center on Pensions & Retirement Research, and Research Associate at the National Bureau of Economic Research. Previously, Cornell University Professor from 1978 to 1993. | | Asset Allocation Trust |
Timothy J. Penny (Born 1951) | | Trustee, since 1996 | | President and CEO of Southern Minnesota Initiative Foundation, a non-profit organization, since 2007 and Senior Fellow at the Humphrey Institute Policy Forum at the University of Minnesota since 1995. Member of the Board of Trustees of NorthStar Education Finance, Inc., a non-profit organization, since 2007. | | Asset Allocation Trust |
| | | | |
| 32 | | Wells Fargo Advantage Premier Large Company Growth Fund | | Other information (unaudited) |
| | | | | | |
Name and year of birth | | Position held and length of service* | | Principal occupations during past five years | | Other directorships during
past five years |
Michael S. Scofield (Born 1943) | | Trustee, since 2010 | | Served on the Investment Company Institute’s Board of Governors and Executive Committee from 2008-2011 as well the Governing Council of the Independent Directors Council from 2006-2011 and the Independent Directors Council Executive Committee from 2008-2011. Chairman of the IDC from 2008-2010. Institutional Investor (Fund Directions) Trustee of Year in 2007. Trustee of the Evergreen Funds (and its predecessors) from 1984 to 2010. Chairman of the Evergreen Funds from 2000-2010. Former Trustee of the Mentor Funds. Retired Attorney, Law Offices of Michael S. Scofield. | | Asset Allocation Trust |
Donald C. Willeke (Born 1940) | | Trustee, since 1996 | | Principal of the law firm of Willeke & Daniels. General Counsel of the Minneapolis Employees Retirement Fund from 1984 until its consolidation into the Minnesota Public Employees Retirement Association on June 30, 2010. Director and Vice Chair of The Tree Trust (non-profit corporation). Director of the American Chestnut Foundation (non-profit corporation). | | Asset Allocation Trust |
| * | Length of service dates reflect the Trustee’s commencement of service with the Trust’s predecessor entities, where applicable. |
Officers
| | | | | | |
Name and year of birth | | Position held and
length of service | | Principal occupations during past five years | | |
Karla M. Rabusch (Born 1959) | | President, since 2003 | | Executive Vice President of Wells Fargo Bank, N.A. and President of Wells Fargo Funds Management, LLC since 2003. | | |
Jeremy DePalma1 (Born 1974) | | Treasurer, since 2012 | | Senior Vice President of Wells Fargo Funds Management, LLC since 2009. Senior Vice President of Evergreen Investment Management Company, LLC from 2008 to 2010. Vice President, Evergreen Investment Services, Inc. from 2004 to 2007. Head of the Fund Reporting and Control Team within Fund Administration from 2005 to 2010. | | |
C. David Messman (Born 1960) | | Secretary, since 2000; Chief Legal Officer, since 2003 | | Senior Vice President and Secretary of Wells Fargo Funds Management, LLC since 2001. Vice President and Managing Counsel of Wells Fargo Bank, N.A. since 1996. | | |
Debra Ann Early (Born 1964) | | Chief Compliance Officer, since 2007 | | Chief Compliance Officer of Wells Fargo Funds Management, LLC since 2007. Chief Compliance Officer of Parnassus Investments from 2005 to 2007. Chief Financial Officer of Parnassus Investments from 2004 to 2007. | | |
David Berardi (Born 1975) | | Assistant Treasurer, since 2009 | | Vice President of Wells Fargo Funds Management, LLC since 2009. Vice President of Evergreen Investment Management Company, LLC from 2008 to 2010. Assistant Vice President of Evergreen Investment Services, Inc. from 2004 to 2008. Manager of Fund Reporting and Control for Evergreen Investment Management Company, LLC from 2004 to 2010. | | |
| 1. | Jeremy DePalma acts as Treasurer of 61 funds and Assistant Treasurer of 75 funds in the Fund Complex. |
| 2. | The Statement of Additional Information includes additional information about the Trustees and is available, without charge, upon request, by calling 1-800-222-8222 or by visiting the website at wellsfargoadvantagefunds.com. |
| | | | | | |
| List of abbreviations | | Wells Fargo Advantage Premier Large Company Growth Fund | | | 33 | |
The following is a list of common abbreviations for terms and entities that may have appeared in this report.
| ACA | — ACA Financial Guaranty Corporation |
| ADR | — American depositary receipt |
| ADS | — American depositary shares |
| AGC | — Assured Guaranty Corporation |
| AGM | — Assured Guaranty Municipal |
| Ambac | — Ambac Financial Group Incorporated |
| AMT | — Alternative minimum tax |
| BAN | — Bond anticipation notes |
| BHAC | — Berkshire Hathaway Assurance Corporation |
| CAB | — Capital appreciation bond |
| CCAB | — Convertible capital appreciation bond |
| CDA | — Community Development Authority |
| CDO | — Collateralized debt obligation |
| COP | — Certificate of participation |
| DRIVER | — Derivative inverse tax-exempt receipts |
| DW&P | — Department of Water & Power |
| DWR | — Department of Water Resources |
| ECFA | — Educational & Cultural Facilities Authority |
| EDA | — Economic Development Authority |
| EDFA | — Economic Development Finance Authority |
| ETF | — Exchange-traded fund |
| FDIC | — Federal Deposit Insurance Corporation |
| FFCB | — Federal Farm Credit Banks |
| FGIC | — Financial Guaranty Insurance Corporation |
| FHA | — Federal Housing Administration |
| FHLB | — Federal Home Loan Bank |
| FHLMC | — Federal Home Loan Mortgage Corporation |
| FICO | — The Financing Corporation |
| FNMA | — Federal National Mortgage Association |
| GDR | — Global depositary receipt |
| GNMA | — Government National Mortgage Association |
| HCFR | — Healthcare facilities revenue |
| HEFA | — Health & Educational Facilities Authority |
| HEFAR | — Higher education facilities authority revenue |
| HFA | — Housing Finance Authority |
| HFFA | — Health Facilities Financing Authority |
| HUD | — Department of Housing and Urban Development |
| IDA | — Industrial Development Authority |
| IDAG | — Industrial Development Agency |
| IDR | — Industrial development revenue |
| KRW | — Republic of Korea won |
| LIBOR | — London Interbank Offered Rate |
| LLC | — Limited liability company |
| LLP | — Limited liability partnership |
| MBIA | — Municipal Bond Insurance Association |
| MFHR | — Multifamily housing revenue |
| MSTR | — Municipal securities trust receipts |
| MUD | — Municipal Utility District |
| National | — National Public Finance Guarantee Corporation |
| PCFA | — Pollution Control Financing Authority |
| PCL | — Public Company Limited |
| PCR | — Pollution control revenue |
| PFA | — Public Finance Authority |
| PFFA | — Public Facilities Financing Authority |
| PFOTER | — Puttable floating option tax-exempt receipts |
| plc | — Public limited company |
| PUTTER | — Puttable tax-exempt receipts |
| R&D | — Research & development |
| Radian | — Radian Asset Assurance |
| RAN | — Revenue anticipation notes |
| RDA | — Redevelopment Authority |
| RDFA | — Redevelopment Finance Authority |
| REIT | — Real estate investment trust |
| ROC | — Reset option certificates |
| SAVRS | — Select auction variable rate securities |
| SBA | — Small Business Authority |
| SFHR | — Single-family housing revenue |
| SFMR | — Single-family mortgage revenue |
| SPA | — Standby purchase agreement |
| SPDR | — Standard & Poor’s Depositary Receipts |
| STRIPS | — Separate trading of registered interest and principal securities |
| TAN | — Tax anticipation notes |
| TIPS | — Treasury inflation-protected securities |
| TRAN | — Tax revenue anticipation notes |
| TTFA | — Transportation Trust Fund Authority |
| TVA | — Tennessee Valley Authority |
This page is intentionally left blank.


For more information
More information about Wells Fargo Advantage Funds is available free upon request. To obtain literature, please write, email, visit the Fund’s website, or call:
Wells Fargo Advantage Funds
P.O. Box 8266
Boston, MA 02266-8266
Email: wfaf@wellsfargo.com
Website: wellsfargoadvantagefunds.com
Individual investors: 1-800-222-8222
Retail investment professionals: 1-888-877-9275
Institutional investment professionals: 1-866-765-0778
This report and the financial statements contained herein are submitted for the general information of the shareholders of Wells Fargo Advantage Funds. If this report is used for promotional purposes, distribution of the report must be accompanied or preceded by a current prospectus. For a current prospectus and, if available, a summary prospectus containing more complete information, including charges and expenses, call 1-800-222-8222 or visit the Fund’s website at wellsfargoadvantagefunds.com. Please consider the investment objectives, risks, charges, and expenses of the investment carefully before investing. This and other information about Wells Fargo Advantage Funds can be found in the current prospectus. Read the prospectus carefully before you invest or send money.
Wells Fargo Funds Management, LLC, a wholly owned subsidiary of Wells Fargo & Company, provides investment advisory and administrative services for Wells Fargo Advantage Funds. Other affiliates of Wells Fargo & Company provide subadvisory and other services for the Funds. The Funds are distributed by Wells Fargo Funds Distributor, LLC, Member FINRA/SIPC, an affiliate of Wells Fargo & Company.
NOT FDIC INSURED ¡ NO BANK GUARANTEE ¡ MAY LOSE VALUE
© 2013 Wells Fargo Funds Management, LLC. All rights reserved.
| | |
 | | 215110 03-13 SA212/SAR212 1-13 |
Not required in this filing
| ITEM 3. | AUDIT COMMITTEE FINANCIAL EXPERT |
Not required in this filing.
| ITEM 4. | PRINCIPAL ACCOUNTANT FEES AND SERVICES |
Not required in this filing.
| ITEM 5. | AUDIT COMMITTEE OF LISTED REGISTRANTS |
Not required in this filing.
| ITEM 6. | PORTFOLIO OF INVESTMENTS |
The Portfolio of investments is included as part of the report to shareholders filed under Item 1 of this Form.
| ITEM 7. | DISCLOSURE OF PROXY VOTING POLICIES AND PROCEDURES FOR CLOSED-END MANAGEMENT INVESTMENT COMPANIES |
Not applicable.
| ITEM 8. | PORTFOLIO MANAGERS OF CLOSED-END MANAGEMENT INVESTMENT COMPANIES |
Not applicable.
| ITEM 9. | PURCHASES OF EQUITY SECURITIES BY CLOSED-END MANAGEMENT INVESTMENT COMPANY AND AFFILIATED PURCHASES |
Not applicable.
| ITEM 10. | SUBMISSION OF MATTERS TO A VOTE OF SECURITY HOLDERS |
The Governance Committee (the “Committee”) of the Board of Trustees of the registrant (the “Trust”) has adopted procedures by which a shareholder of any series of the Trust may submit properly a nominee recommendation for the Committee’s consideration.
The shareholder must submit any such recommendation (a “Shareholder Recommendation”) in writing to the Trust, to the attention of the Trust’s Secretary, at the address of the principal executive offices of the Trust.
The Shareholder Recommendation must be delivered to, or mailed and received at, the principal executive offices of the Trust not less than forty-five (45) calendar days nor more than seventy-five (75) calendar days prior to the date of the Committee meeting at which the nominee would be considered.
The Shareholder Recommendation must include: (i) a statement in writing setting forth (A) the name, age, date of birth, business address, residence address and nationality of the person recommended by the shareholder (the “candidate”); (B) the series (and, if applicable, class) and number of all shares of the Trust owned of record or beneficially by the candidate, as reported to such shareholder by the candidate; (C) any other information regarding the candidate called for with respect to director nominees by paragraphs (a), (d), (e) and (f) of Item 401 of Regulation S-K or paragraph (b) of Item 22 of Rule 14a-101 (Schedule 14A) under the Securities Exchange Act of 1934, as amended (the “Exchange Act”), adopted by the Securities and Exchange Commission (or the corresponding provisions of any regulation or rule subsequently adopted by the Securities and Exchange Commission or any successor agency applicable to the Trust); (D) any other information regarding the candidate that would be required to be disclosed if the candidate were a nominee in a proxy statement or other filing required to be made in connection with solicitation of proxies for election of directors pursuant to Section 14 of the Exchange Act and the rules and regulations promulgated thereunder; and (E) whether the recommending shareholder believes that the candidate is or will be an “interested person” of the Trust (as defined in the Investment Company Act of 1940, as amended) and, if not an “interested person,” information regarding the candidate that will be sufficient for the Trust to make such determination; (ii) the written and signed consent of the candidate to be named as a nominee and to serve as a Trustee if elected; (iii) the recommending shareholder’s name as it appears on the Trust’s books; (iv) the series (and, if applicable, class) and number of all shares of the Trust owned beneficially and of record by the recommending shareholder; and (v) a description of all arrangements or understandings between the recommending shareholder and the candidate and any other person or persons (including their names) pursuant to which the recommendation is being made by the recommending shareholder. In addition, the Committee may require the candidate to interview in person and furnish such other information as it may reasonably require or deem necessary to determine the eligibility of such candidate to serve as a Trustee of the Trust.
| ITEM 11. | CONTROLS AND PROCEDURES |
(a) The President and Treasurer have concluded that the Wells Fargo Funds Trust (the “Trust”) disclosure controls and procedures (as defined in Rule 30a-3(c) under the Investment Company Act of 1940) provide reasonable assurances that material information relating to the Trust is made known to them by the appropriate persons, based on their evaluation of these controls and procedures as of a date within 90 days of the filing of this report.
(b) There were no significant changes in the Trust’s internal controls over financial reporting (as defined in Rule 30a-3(d) under the Investment Company Act of 1940) that occurred during the second quarter of the period covered by this report that materially affected, or is reasonably likely to materially affect, the registrant’s internal control over financial reporting.
(a)(1) Not required in this filing.
(a)(2) Certification pursuant to Rule 30a-2(a) under the Investment Company Act of 1940 (17 CFR 270.30a-2(a)) is filed and attached hereto as Exhibit 99.CERT.
(a)(3) Not applicable.
(b) Certification pursuant to Rule 30a-2(b) under the Investment Company Act of 1940 (17 CFR 270.30a-2(b)) is filed and attached hereto as Exhibit 99.906CERT.
SIGNATURES
Pursuant to the requirements of the Securities Exchange Act of 1934 and the Investment Company Act of 1940, the registrant has duly caused this report to be signed on its behalf by the undersigned, thereunto duly authorized.
| | |
| Wells Fargo Funds Trust |
| |
| By: | | /s/ Karla M. Rabusch |
| | Karla M. Rabusch |
| | President |
| |
| Date: | | March 26, 2013 |
Pursuant to the requirements of the Securities Exchange Act of 1934 and the Investment Company Act of 1940, this report has been signed below by the following persons on behalf of the registrant and in the capacities and on the date indicated.
| | |
| By: | | /s/ Karla M. Rabusch |
| | Karla M. Rabusch |
| | President |
| |
| Date: | | March 26, 2013 |
| |
| By: | | /s/ Jeremy DePalma |
| | Jeremy DePalma |
| | Treasurer |
| |
| Date: | | March 26, 2013 |