
UNITED STATES
SECURITIES AND EXCHANGE COMMISSION
Washington, D.C. 20549
FORM N-CSRS
CERTIFIED SHAREHOLDER REPORT OF REGISTERED
MANAGEMENT INVESTMENT COMPANIES
Investment Company Act file number: 811-09253
Wells Fargo Funds Trust
(Exact name of registrant as specified in charter)
525 Market St., San Francisco, CA 94105
(Address of principal executive offices) (Zip code)
C. David Messman
Wells Fargo Funds Management, LLC
525 Market St., San Francisco, CA 94105
(Name and address of agent for service)
Registrant’s telephone number, including area code: 800-222-8222
Date of fiscal year end: February 29, 2012
Date of reporting period: August 31, 2012
ITEM 1. REPORT TO SHAREHOLDERS

Wells Fargo Advantage Dow Jones Target Date Funds

Semi-Annual Report
August 31, 2012
| n | | Wells Fargo Advantage Dow Jones Target Today FundSM |
| n | | Wells Fargo Advantage Dow Jones Target 2010 FundSM |
| n | | Wells Fargo Advantage Dow Jones Target 2015 FundSM |
| n | | Wells Fargo Advantage Dow Jones Target 2020 FundSM |
| n | | Wells Fargo Advantage Dow Jones Target 2025 FundSM |
| n | | Wells Fargo Advantage Dow Jones Target 2030 FundSM |
| n | | Wells Fargo Advantage Dow Jones Target 2035 FundSM |
| n | | Wells Fargo Advantage Dow Jones Target 2040 FundSM |
| n | | Wells Fargo Advantage Dow Jones Target 2045 FundSM |
| n | | Wells Fargo Advantage Dow Jones Target 2050 FundSM |
| n | | Wells Fargo Advantage Dow Jones Target 2055 FundSM |

Reduce clutter. Save trees.
Sign up for electronic delivery of prospectuses and shareholder reports at wellsfargo.com/advantagedelivery
Contents
The views expressed and any forward-looking statements are as of August 31, 2012, unless otherwise noted, and are those of the Fund managers and/or Wells Fargo Funds Management, LLC. Discussions of individual securities, or the markets generally, or any Wells Fargo Advantage Fund are not intended as individual recommendations. Future events or results may vary significantly from those expressed in any forward-looking statements; the views expressed are subject to change at any time in response to changing circumstances in the market. Wells Fargo Funds Management, LLC, disclaims any obligation to publicly update or revise any views expressed or forward-looking statements.
NOT FDIC INSURED ¡ NO BANK GUARANTEE ¡ MAY LOSE VALUE

Wells Fargo investment history
| | |
| 1932 | | Keystone creates one of the first mutual fund families. |
| 1971 | | Wells Fargo & Company introduces one of the first institutional index funds. |
| 1978 | | Wells Fargo applies Markowitz and Sharpe’s research on Modern Portfolio Theory to introduce one of the industry’s first tactical asset allocation models in institutional separately managed accounts. |
| 1984 | | Wells Fargo Stagecoach Funds launches its first asset allocation fund. |
| 1989 | | The tactical asset allocation (TAA) Model is first applied to Wells Fargo’s asset allocation mutual funds. |
| 1994 | | Wells Fargo introduces the LifePath Funds, one of the first suites of target date funds (now the Wells Fargo Advantage Dow Jones Target Date FundsSM). |
| 1996 | | Evergreen Investments and Keystone Funds merge. |
| 1997 | | Wells Fargo launches the Wells Fargo Advantage WealthBuilder PortfoliosSM, a fund-of-funds suite of products that includes the use of quantitative models to shift assets among investment styles. |
| 1999 | | Norwest Advantage Funds and Stagecoach Funds are reorganized into Wells Fargo Funds after the merger of Norwest and Wells Fargo. |
| 2002 | | Evergreen Retail and Evergreen Institutional companies form the umbrella asset management company, Evergreen Investments. |
| 2005 | | The integration of Strong Funds with Wells Fargo Funds creates Wells Fargo Advantage Funds, resulting in one of the top 20 mutual fund companies in the United States. |
| 2006 | | Wells Fargo Advantage Funds relaunches the target date product line as Wells Fargo Advantage Dow Jones Target Date Funds. |
| 2010 | | The mergers and reorganizations of Evergreen and Wells Fargo Advantage mutual funds are completed, unifying the families under the brand of Wells Fargo Advantage Funds. |
Wells Fargo Advantage Funds®
Wells Fargo Advantage Funds skillfully guides institutions, financial advisors, and individuals through the investment terrain to help them reach their financial objectives. Everything we do on behalf of investors is backed by our unique combination of qualifications.
Strength
Our organization is built on the standards of integrity and service established by our parent company—Wells Fargo & Company—more than 150 years ago. And, because we’re part of a highly diversified financial enterprise, we offer the depth of resources to help investors succeed.
Expertise
Our multi-boutique model offers investors access to the independent thinking of premier investment managers that have been chosen for their time-tested strategies. While each team specializes in a specific investment strategy, collectively they provide investors a wide choice of distinct investment styles. Our dedication to investment excellence doesn’t end with our expertise in manager selection—risk management, analysis, and rigorous ongoing review seek to ensure each manager’s investment process remains consistent.
Partnership
Our collaborative approach is built around understanding the needs and goals of our clients. By adhering to core principles of sound judgment and steady guidance, we support you through every stage of the investment decision process.
Carefully consider the investment objectives, risks, charges, and expenses before investing. For a current prospectus for Wells Fargo Advantage Funds, containing this and other information, visit wellsfargoadvantagefunds.com. Read it carefully before investing.
Wells Fargo Funds Management, LLC, a wholly owned subsidiary of Wells Fargo & Company, provides investment advisory and administrative services for Wells Fargo Advantage Funds. Other affiliates of Wells Fargo & Company provide subadvisory and other services for the Funds. The Funds are distributed by Wells Fargo Funds Distributor, LLC, Member FINRA/SIPC, an affiliate of Wells Fargo & Company.
“Dow Jones®” and “Dow Jones Target Date IndexesSM” are service marks of Dow Jones Trademark Holdings LLC (“Dow Jones”); have been licensed to CME Group Index Services LLC (“CME Indexes”); and have been sublicensed for use for certain purposes by Global Index Advisors, Inc., and Wells Fargo Funds Management, LLC. The Wells Fargo Advantage Dow Jones Target Date FundsSM, based on the Dow Jones Target Date Indexes, are not sponsored, endorsed, sold, or promoted by Dow Jones, CME Indexes, or their respective affiliates, and none of them makes any representation regarding the advisability of investing in such product(s).
NOT FDIC INSURED ¡ NO BANK GUARANTEE ¡ MAY LOSE VALUE
Not part of the semi-annual report.
Wells Fargo Advantage Funds offers more than 110 mutual funds across a wide range of asset classes, representing over $213 billion in assets under management, as of August 31, 2012.
| | | | |
| Equity funds | | | | |
Asia Pacific Fund | | Enterprise Fund† | | Opportunity Fund† |
C&B Large Cap Value Fund | | Equity Value Fund | | Precious Metals Fund |
C&B Mid Cap Value Fund | | Global Opportunities Fund | | Premier Large Company Growth Fund |
Capital Growth Fund | | Growth Fund | | Small Cap Opportunities Fund |
Common Stock Fund | | Index Fund | | Small Cap Value Fund |
Disciplined U.S. Core Fund | | International Equity Fund | | Small Company Growth Fund |
Discovery Fund† | | International Value Fund | | Small Company Value Fund |
Diversified Equity Fund | | Intrinsic Small Cap Value Fund | | Small/Mid Cap Core Fund |
Diversified International Fund | | Intrinsic Value Fund | | Small/Mid Cap Value Fund |
Diversified Small Cap Fund | | Intrinsic World Equity Fund | | Special Mid Cap Value Fund |
Emerging Growth Fund | | Large Cap Core Fund | | Special Small Cap Value Fund |
Emerging Markets Equity Fund | | Large Cap Growth Fund | | Specialized Technology Fund |
Emerging Markets Equity Income Fund | | Large Company Value Fund | | Traditional Small Cap Growth Fund |
Endeavor Select Fund† | | Omega Growth Fund | | Utility and Telecommunications Fund |
| Bond funds | | | | |
Adjustable Rate Government Fund | | Inflation-Protected Bond Fund | | Short-Term Bond Fund |
California Limited-Term Tax-Free Fund | | Intermediate Tax/AMT-Free Fund | | Short-Term High Yield Bond Fund |
California Tax-Free Fund | | International Bond Fund | | Short-Term Municipal Bond Fund |
Colorado Tax-Free Fund | | Minnesota Tax-Free Fund | | Strategic Municipal Bond Fund |
Emerging Markets Local Bond Fund | | Municipal Bond Fund | | Total Return Bond Fund |
Government Securities Fund | | North Carolina Tax-Free Fund | | Ultra Short-Term Income Fund |
High Income Fund | | Pennsylvania Tax-Free Fund | | Ultra Short-Term Municipal Income Fund |
High Yield Bond Fund | | Short Duration Government Bond Fund | | Wisconsin Tax-Free Fund |
Income Plus Fund | | | | |
| Asset allocation funds | | | | |
Absolute Return Fund | | WealthBuilder Equity Portfolio† | | Target 2020 Fund† |
Asset Allocation Fund | | WealthBuilder Growth Allocation Portfolio† | | Target 2025 Fund† |
Conservative Allocation Fund | | WealthBuilder Growth Balanced Portfolio† | | Target 2030 Fund† |
Diversified Capital Builder Fund | | WealthBuilder Moderate Balanced Portfolio† | | Target 2035 Fund† |
Diversified Income Builder Fund | | WealthBuilder Tactical Equity Portfolio† | | Target 2040 Fund† |
Growth Balanced Fund | | Target Today Fund† | | Target 2045 Fund† |
Index Asset Allocation Fund | | Target 2010 Fund† | | Target 2050 Fund† |
Moderate Balanced Fund | | Target 2015 Fund† | | Target 2055 Fund† |
WealthBuilder Conservative Allocation Portfolio† | | | | |
| Money market funds | | | | |
100% Treasury Money Market Fund | | Heritage Money Market Fund† | | National Tax-Free Money Market Fund |
California Municipal Money Market Fund | | Money Market Fund | | Prime Investment Money Market Fund |
Cash Investment Money Market Fund | | Municipal Cash Management Money Market Fund | | Treasury Plus Money Market Fund |
Government Money Market Fund | | Municipal Money Market Fund | | |
| Variable trust funds1 | | | | |
VT Discovery Fund† | | VT Intrinsic Value Fund | | VT Small Cap Growth Fund |
VT Index Asset Allocation Fund | | VT Omega Growth Fund | | VT Small Cap Value Fund |
VT International Equity Fund | | VT Opportunity Fund† | | VT Total Return Bond Fund |
An investment in a money market fund is not insured or guaranteed by the Federal Deposit Insurance Corporation or any other government agency. Although the Wells Fargo Advantage Money Market Funds seek to preserve the value of your investment at $1.00 per share, it is possible to lose money by investing in a money market fund.
| 1. | The variable trust funds are generally available only through insurance company variable contracts. |
| † | In this report, the Wells Fargo Advantage Discovery FundSM, Wells Fargo Advantage Endeavor Select FundSM, Wells Fargo Advantage Enterprise FundSM, Wells Fargo Advantage Opportunity FundSM, Wells Fargo Advantage WealthBuilder Conservative Allocation PortfolioSM, Wells Fargo Advantage WealthBuilder Equity PortfolioSM, Wells Fargo Advantage WealthBuilder Growth Allocation PortfolioSM, Wells Fargo Advantage WealthBuilder Growth Balanced PortfolioSM, Wells Fargo Advantage WealthBuilder Moderate Balanced PortfolioSM, Wells Fargo Advantage WealthBuilder Tactical Equity PortfolioSM, Wells Fargo Advantage Dow Jones Target Today FundSM, Wells Fargo Advantage Dow Jones Target 2010 FundSM, Wells Fargo Advantage Dow Jones Target 2015 FundSM, Wells Fargo Advantage Dow Jones Target 2020 FundSM, Wells Fargo Advantage Dow Jones Target 2025 FundSM, Wells Fargo Advantage Dow Jones Target 2030 FundSM, Wells Fargo Advantage Dow Jones Target 2035 FundSM, Wells Fargo Advantage Dow Jones Target 2040 FundSM, Wells Fargo Advantage Dow Jones Target 2045 FundSM, Wells Fargo Advantage Dow Jones Target 2050 FundSM, Wells Fargo Advantage Dow Jones Target 2055 FundSM, Wells Fargo Advantage Heritage Money Market FundSM, Wells Fargo Advantage VT Discovery FundSM, and Wells Fargo Advantage VT Opportunity FundSM are referred to as the Discovery Fund, Endeavor Select Fund, Enterprise Fund, Opportunity Fund, WealthBuilder Conservative Allocation Portfolio, WealthBuilder Equity Portfolio, WealthBuilder Growth Allocation Portfolio, WealthBuilder Growth Balanced Portfolio, WealthBuilder Moderate Balanced Portfolio, WealthBuilder Tactical Equity Portfolio, Target Today Fund, Target 2010 Fund, Target 2015 Fund, Target 2020 Fund, Target 2025 Fund, Target 2030 Fund, Target 2035 Fund, Target 2040 Fund, Target 2045 Fund, Target 2050 Fund, Target 2055 Fund, Heritage Money Market Fund, VT Discovery Fund, and VT Opportunity Fund, respectively. |
Not part of the semi-annual report.
| | | | |
| 2 | | Wells Fargo Advantage Dow Jones Target Date Funds | | Letter to shareholders (unaudited) |

Karla M. Rabusch
President
Wells Fargo Advantage Funds
The beginning of the period was marked by increased confidence that the U.S. economy was staging a fragile recovery, but some of that positive momentum was offset by continued concerns about the possible effects that the ongoing European sovereign debt crisis would have on the global economy.
Dear Valued Shareholder:
We are pleased to offer you this semi-annual report for the Wells Fargo Advantage Dow Jones Target Date FundsSM for the six-month period that ended August 31, 2012. The beginning of the period was marked by increased confidence that the U.S. economy was staging a fragile recovery, but some of that positive momentum was offset by continued concerns about the possible effects that the ongoing European sovereign debt crisis—which began in Greece and later spread to the larger economies of Italy and Spain—would have on the global economy. As measured by various Russell Indexes, large-cap U.S. stocks posted solid gains for the period. However, indexes of small-cap stocks—which tend to be more economically sensitive—returned modest gains or minor losses. Major international stock indexes ended the period with losses in U.S. dollar terms. From a fixed-income perspective, both the U.S. and international bond markets realized positive total returns during the reporting period. Specifically, U.S. corporate debt—both investment-grade and high-yield—led the major bond sectors, outperforming both U.S. mortgage-backed securities and U.S. Treasury securities during the six-month period.
Macroeconomic optimism faded as global growth slowed and worries rose.
Early in the reporting period, global economic numbers supported the case for a gradual recovery. Real gross domestic product (GDP) growth for the U.S. remained positive in the first quarter of 2012, with GDP increasing by 2.0% on an annualized basis.
Concerns about the Greek credit crisis waxed and waned ahead of and throughout the six-month period. At the onset of the reporting period, in March 2012, the Greek government came to an agreement with its creditors, allowing the country to write down the principal on most of its bonds in exchange for increased financial austerity. By the end of the reporting period, however, the agreement appeared to be on the verge of unraveling. In May 2012, legislative elections left no single party with enough seats to form a government, and none of the parties were able to form a ruling coalition. Even more worrisome, Spain nationalized Bankia—the nation’s fourth-largest bank—putting more than
19 billion euros into the bank after it suffered heavy losses from property loans. The move refocused investor attention on Spain’s weak economy and depressed property sector, and Spanish bonds sold off.
By mid-June 2012, analysts were openly discussing the possibility of a crisis within the European banking system, a worry that remained near the forefront as the reporting period ended. During the final month of the six-month period, however, the European Central Bank (ECB) and several key members of the eurozone, including France and Germany, announced their commitment to maintaining the integrity of the single currency. Despite the progress made across Europe in further addressing its ongoing debt issues, there remains a prolonged uncertainty about the eurozone and global economic growth.
U.S. economic data remained mixed.
For most of the period, U.S. economic data remained tepid. Reported GDP came in at a 1.7% annualized rate in the second quarter of 2012. Although GDP growth slowed during the period, continued economic growth in the U.S. contrasted with the more uncertain picture in Europe.
| | | | | | |
| Letter to shareholders (unaudited) | | Wells Fargo Advantage Dow Jones Target Date Funds | | | 3 | |
The main piece of negative economic data was the unemployment rate, which remained at relatively high levels throughout the period. Although the unemployment rate declined—from 8.3% in February 2012 to 8.1% in August 2012—part of the decline could be attributed to a decline in the labor force. (Individuals are only counted as unemployed if they are officially looking for work.) Toward the end of the period, data indicated that the U.S. economy was adding fewer jobs than expected, leading to concerns that the country’s economic growth was slowing.
Central banks continued to provide stimulus.
Throughout the reporting period, the Federal Open Market Committee (FOMC) kept its key interest rates effectively at zero in order to support the economy and financial system. In early January 2012, prior to the reporting period, in response to extreme market volatility and signs of a weakening economy, the Federal Reserve (Fed) restated its intention to keep interest rates low until, at least, late 2014. After the reporting period, this timeline was revised to late 2015 following the FOMC meeting on September 13, 2012, based, in part, on the sluggish labor market.
At the beginning of the period, the ECB had a key rate of 1.00%, which it had lowered from its previous level of 1.25% in response to weakness in the southern European economies. In July 2012, the ECB again cut its main interest rate to a historic low of 0.75%, in hopes of offering relief to the eurozone’s sluggish economy amid signs that inflationary pressures were fading.
We use time-tested investment strategies, even as many variables are at work in the market.
The full effect of the credit crisis remains unknown. Elevated unemployment and debt defaults continue to pressure consumers and businesses alike. In our experience, strict adherence to time-tested investment strategies has its rewards. As a whole, Wells Fargo Advantage Funds represents investments across a range of asset classes and investment styles, giving you an opportunity to create a diversified investment portfolio. While diversification may not prevent losses in a downturn, we believe it helps to manage risk.
Thank you for choosing to invest with Wells Fargo Advantage Funds. We appreciate your confidence in us and remain committed to helping you meet your financial needs. For current information about your fund investments, contact your investment professional, visit our website at wellsfargoadvantagefunds.com, or call us directly at 1-800-222-8222. We are available 24 hours a day, 7 days a week.
Sincerely,

Karla M. Rabusch
President
Wells Fargo Advantage Funds
Throughout the reporting period, the Federal Open Market Committee (FOMC) kept its key interest rates effectively at zero in order to support the economy and financial system.
| | | | |
| 4 | | Wells Fargo Advantage Dow Jones Target Date Funds | | Letter to shareholders (unaudited) |
Notice to Shareholders
At a meeting held on August 14-15, 2012, the Board of Trustees approved the following changes to the Wells Fargo Advantage Dow Jones Target Date Funds series:
| | n | | The renaming and modification of Institutional Class shares to assume the features and attributes of Class R6 shares by May 31, 2013. | |
| | n | | The implementation of new expense caps for certain classes. | |
Please contact your investment professional or call us directly at 1-800-222-8222 if you have any questions on this Notice to Shareholders.
| | | | | | |
| Performance highlights (unaudited) | | Wells Fargo Advantage Dow Jones Target Date Funds | | | 5 | |
Wells Fargo Advantage Dow Jones Target Date Funds1
Investment objective
Each Fund’s objective is to approximate, before fees and expenses, the total return of the appropriate Dow Jones Target Date Index as specified in the following table:
| | |
Wells Fargo Advantage Dow
Jones Target Date Funds | | Corresponding Dow Jones
Target Date Index |
| Target Today Fund | | Dow Jones Target Today Index |
| Target 2010 Fund | | Dow Jones Target 2010 Index |
| Target 2015 Fund | | Dow Jones Target 2015 Index |
| Target 2020 Fund | | Dow Jones Target 2020 Index |
| Target 2025 Fund | | Dow Jones Target 2025 Index |
| Target 2030 Fund | | Dow Jones Target 2030 Index |
| Target 2035 Fund | | Dow Jones Target 2035 Index |
| Target 2040 Fund | | Dow Jones Target 2040 Index |
| Target 2045 Fund | | Dow Jones Target 2045 Index |
| Target 2050 Fund | | Dow Jones Target 2050 Index |
| Target 2055 Fund | | Dow Jones Target 2055 Index |
Adviser
Wells Fargo Funds Management, LLC
Subadviser
Global Index Advisors, Inc.
Portfolio managers
Rodney H. Alldredge
James P. Lauder
Paul T. Torregrosa, Ph.D
The target date represents the year in which investors may likely begin withdrawing assets. The Funds gradually seek to reduce market risk as the target date approaches and after it arrives by decreasing equity exposure and increasing fixed income exposure. The principal value is not guaranteed at any time, including at the target date.
Stock values fluctuate in response to the activities of individual companies and general market and economic conditions. Bond values fluctuate in response to the financial condition of individual issuers, general market and economic conditions, and changes in interest rates. In general, when interest rates rise, bond values fall and investors may lose principal value. The use of derivatives may reduce returns and/or increase volatility. Certain investment strategies tend to increase the total risk of an investment (relative to the broader market). These Funds are exposed to foreign investment risk, mortgage- and asset-backed securities risk, smaller-company investment risk and allocation methodology risk (risk that the allocation methodology of the Dow Jones Target Date Index, whose total returns the Funds seek to approximate, before fees and expenses, will not meet an investor’s goals). Consult the prospectus for additional information on these and other risks.
Please see footnotes on page 18.
| | | | |
| 6 | | Wells Fargo Advantage Dow Jones Target Date Funds | | Performance highlights (unaudited) |
Target Today Fund
Average annual total returns (%) as of August 31, 2012
| | | | | | | | | | | | | | | | | | | | | | | | | | | | | | | | | | |
| | | | | Including sales charge | | | Excluding sales charge | | | Expense ratios2 (%) | |
| | | Inception date | | 1 year | | | 5 year | | | 10 year | | | 1 year | | | 5 year | | | 10 year | | | Gross | | | Net3 | |
| Class A (STWRX)* | | 3-1-94 | | | (1.78 | ) | | | 3.42 | | | | 4.36 | | | | 4.23 | | | | 4.66 | | | | 4.98 | | | | 1.07 | | | | 0.96 | |
| Class B (WFOKX)** | | 8-1-98 | | | (1.61 | ) | | | 3.53 | | | | 4.45 | | | | 3.39 | | | | 3.87 | | | | 4.45 | | | | 1.82 | | | | 1.71 | |
| Class C (WFODX) | | 12-1-98 | | | 2.43 | | | | 3.86 | | | | 4.20 | | | | 3.43 | | | | 3.86 | | | | 4.20 | | | | 1.82 | | | | 1.71 | |
| Administrator Class (WFLOX) | | 11-8-99 | | | – | | | | – | | | | – | | | | 4.34 | | | | 4.84 | | | | 5.25 | | | | 0.91 | | | | 0.80 | |
| Institutional Class (WOTDX)4 | | 6-29-04 | | | – | | | | – | | | | – | | | | 4.70 | | | | 5.17 | | | | 5.48 | | | | 0.64 | | | | 0.45 | |
| Investor Class (WFBTX)4 | | 1-31-07 | | | – | | | | – | | | | – | | | | 4.31 | | | | 4.81 | | | | 5.22 | | | | 1.13 | | | | 0.86 | |
| Dow Jones Target Today Index5 | | – | | | – | | | | – | | | | – | | | | 5.03 | | | | 5.68 | | | | 6.31 | | | | – | | | | – | |
| Russell 3000® Index6 | | – | | | – | | | | – | | | | – | | | | 17.03 | | | | 1.50 | | | | 7.01 | | | | – | | | | – | |
| Barclays U.S. Aggregate Bond Index7 | | – | | | – | | | | – | | | | – | | | | 5.78 | | | | 6.66 | | | | 5.48 | | | | – | | | | – | |
| * | | Class A shares are closed to new investors. |
| ** | | Class B shares are closed to investment, except in connection with the reinvestment of any distributions and permitted exchanges. |
Figures quoted represent past performance, which is no guarantee of future results and do not reflect the deduction of taxes that a shareholder may pay on fund distributions or the redemption of fund shares. Investment return and principal value of an investment will fluctuate so that an investor’s shares, when redeemed, may be worth more or less than their original cost. Performance shown without sales charges would be lower if sales charges were reflected. Current performance may be lower or higher than the performance data quoted and assumes the reinvestment of dividends and capital gains. Current month-end performance is available on the Fund’s website, wellsfargoadvantagefunds.com.
Index returns do not include transaction costs associated with buying and selling securities, any mutual fund fees or expenses or any taxes. It is not possible to invest directly in an index.
For Class A shares, the maximum front-end sales charge is 5.75%. For Class B shares, the maximum contingent deferred sales charge is 5.00%. For Class C shares, the maximum contingent deferred sales charge is 1.00%. Performance including sales charge assumes the sales charge for the corresponding time period. Performance shown without sales charge would be lower if sales charges were reflected. Administrator Class, Institutional Class and Investor Class shares are sold without a front-end sales charge or contingent deferred sales charge.
Please see footnotes on page 18.
| | | | | | |
| Performance highlights (unaudited) | | Wells Fargo Advantage Dow Jones Target Date Funds | | | 7 | |
Target 2010 Fund
Average annual total returns (%) as of August 31, 2012
| | | | | | | | | | | | | | | | | | |
| | | | | Including sales charge | | Excluding sales charge | | Expense ratios2 (%) |
| | | Inception date | | 1 year | | 5 year | | 10 year | | 1 year | | 5 year | | 10 year | | Gross | | Net3 |
| Class A (STNRX)* | | 3-1-94 | | (1.36) | | 2.61 | | 4.66 | | 4.62 | | 3.83 | | 5.29 | | 1.08 | | 0.99 |
| Class B (SPTBX)** | | 3-1-97 | | (1.23) | | 2.70 | | 4.76 | | 3.77 | | 3.05 | | 4.76 | | 1.83 | | 1.74 |
| Class C (WFOCX) | | 12-1-98 | | 2.85 | | 3.06 | | 4.52 | | 3.85 | | 3.06 | | 4.52 | | 1.83 | | 1.74 |
| Administrator Class (WFLGX) | | 11-8-99 | | – | | – | | – | | 4.77 | | 4.05 | | 5.56 | | 0.92 | | 0.83 |
| Institutional Class (WFOAX)4 | | 6-29-04 | | – | | – | | – | | 5.20 | | 4.37 | | 5.78 | | 0.65 | | 0.48 |
| Investor Class (WFCTX)4 | | 1-31-07 | | – | | – | | – | | 4.78 | | 4.01 | | 5.52 | | 1.14 | | 0.89 |
| Dow Jones Target 2010 Index5 | | – | | – | | – | | – | | 5.49 | | 4.89 | | 7.24 | | – | | – |
| Russell 3000® Index6 | | – | | – | | – | | – | | 17.03 | | 1.50 | | 7.01 | | – | | – |
| Barclays U.S. Aggregate Bond Index7 | | – | | – | | – | | – | | 5.78 | | 6.66 | | 5.48 | | – | | – |
| * | | Class A shares are closed to new investors. |
| ** | | Class B shares are closed to investment, except in connection with the reinvestment of any distributions and permitted exchanges. |
Figures quoted represent past performance, which is no guarantee of future results and do not reflect the deduction of taxes that a shareholder may pay on fund distributions or the redemption of fund shares. Investment return and principal value of an investment will fluctuate so that an investor’s shares, when redeemed, may be worth more or less than their original cost. Performance shown without sales charges would be lower if sales charges were reflected. Current performance may be lower or higher than the performance data quoted and assumes the reinvestment of dividends and capital gains. Current month-end performance is available on the Fund’s website, wellsfargoadvantagefunds.com.
Index returns do not include transaction costs associated with buying and selling securities, any mutual fund fees or expenses or any taxes. It is not possible to invest directly in an index.
For Class A shares, the maximum front-end sales charge is 5.75%. For Class B shares, the maximum contingent deferred sales charge is 5.00%. For Class C shares, the maximum contingent deferred sales charge is 1.00%. Performance including sales charge assumes the sales charge for the corresponding time period. Performance shown without sales charge would be lower if sales charges were reflected. Administrator Class, Institutional Class and Investor Class shares are sold without a front-end sales charge or contingent deferred sales charge.
Please see footnotes on page 18.
| | | | |
| 8 | | Wells Fargo Advantage Dow Jones Target Date Funds | | Performance highlights (unaudited) |
Target 2015 Fund
Average annual total returns (%) as of August 31, 2012
| | | | | | | | | | | | | | | | | | | | | | |
| | | | | | | | Expense ratios2 (%) | |
| | | Inception date | | 1 year | | | 5 year | | | Since inception | | | Gross | | | Net3 | |
| Administrator Class (WFFFX) | | 6-29-07 | | | 5.25 | | | | 3.36 | | | | 3.26 | | | | 0.92 | | | | 0.84 | |
| Institutional Class (WFSCX) | | 6-29-07 | | | 5.57 | | | | 3.64 | | | | 3.53 | | | | 0.65 | | | | 0.49 | |
| Investor Class (WFQEX) | | 6-29-07 | | | 5.18 | | | | 3.32 | | | | 3.23 | | | | 1.14 | | | | 0.90 | |
| Dow Jones Target 2015 Index5 | | – | | | 5.93 | | | | 4.10 | | | | 4.04 | | | | – | | | | – | |
| Russell 3000® Index6 | | – | | | 17.03 | | | | 1.50 | | | | 1.05 | | | | – | | | | – | |
| Barclays U.S. Aggregate Bond Index7 | | – | | | 5.78 | | | | 6.66 | | | | 6.86 | | | | – | | | | – | |
Figures quoted represent past performance, which is no guarantee of future results and do not reflect the deduction of taxes that a shareholder may pay on fund distributions or the redemption of fund shares. Investment return and principal value of an investment will fluctuate so that an investor’s shares, when redeemed, may be worth more or less than their original cost. Current performance may be lower or higher than the performance data quoted and assumes the reinvestment of dividends and capital gains. Current month-end performance is available on the Fund’s website, wellsfargoadvantagefunds.com.
Index returns do not include transaction costs associated with buying and selling securities, any mutual fund fees or expenses or any taxes. It is not possible to invest directly in an index.
Administrator Class, Institutional Class and Investor Class shares are sold without a front-end sales charge or contingent deferred sales charge.
Please see footnotes on page 18.
| | | | | | |
| Performance highlights (unaudited) | | Wells Fargo Advantage Dow Jones Target Date Funds | | | 9 | |
Target 2020 Fund
Average annual total returns (%) as of August 31, 2012
| | | | | | | | | | | | | | | | | | | | | | | | | | | | | | | | | | |
| | | | | Including sales charge | | | Excluding sales charge | | | Expense ratios2 (%) | |
| | | Inception date | | 1 year | | | 5 year | | | 10 year | | | 1 year | | | 5 year | | | 10 year | | | Gross | | | Net3 | |
| Class A (STTRX)* | | 3-1-94 | | | (0.36 | ) | | | 1.20 | | | | 4.96 | | | | 5.72 | | | | 2.41 | | | | 5.58 | | | | 1.05 | | | | 1.01 | |
| Class B (STPBX)** | | 3-1-97 | | | (0.11 | ) | | | 1.26 | | | | 5.05 | | | | 4.89 | | | | 1.64 | | | | 5.05 | | | | 1.80 | | | | 1.76 | |
| Class C (WFLAX) | | 12-1-98 | | | 3.86 | | | | 1.63 | | | | 4.81 | | | | 4.86 | | | | 1.63 | | | | 4.81 | | | | 1.80 | | | | 1.76 | |
| Administrator Class (WFLBX) | | 11-8-99 | | | – | | | | – | | | | – | | | | 5.82 | | | | 2.63 | | | | 5.85 | | | | 0.89 | | | | 0.85 | |
| Institutional Class (WFOBX)4 | | 6-30-04 | | | – | | | | – | | | | – | | | | 6.25 | | | | 2.93 | | | | 6.09 | | | | 0.62 | | | | 0.50 | |
| Investor Class (WFDTX)4 | | 1-31-07 | | | – | | | | – | | | | – | | | | 5.76 | | | | 2.56 | | | | 5.82 | | | | 1.11 | | | | 0.91 | |
| Dow Jones Target 2020 Index5 | | – | | | – | | | | – | | | | – | | | | 6.54 | | | | 3.34 | | | | 8.09 | | | | – | | | | – | |
| Russell 3000® Index6 | | – | | | – | | | | – | | | | – | | | | 17.03 | | | | 1.50 | | | | 7.01 | | | | – | | | | – | |
| Barclays U.S. Aggregate Bond Index7 | | – | | | – | | | | – | | | | – | | | | 5.78 | | | | 6.66 | | | | 5.48 | | | | – | | | | – | |
| * | | Class A shares are closed to new investors. |
| ** | | Class B shares are closed to investment, except in connection with the reinvestment of any distributions and permitted exchanges. |
Figures quoted represent past performance, which is no guarantee of future results and do not reflect the deduction of taxes that a shareholder may pay on fund distributions or the redemption of fund shares. Investment return and principal value of an investment will fluctuate so that an investor’s shares, when redeemed, may be worth more or less than their original cost. Performance shown without sales charges would be lower if sales charges were reflected. Current performance may be lower or higher than the performance data quoted and assumes the reinvestment of dividends and capital gains. Current month-end performance is available on the Fund’s website, wellsfargoadvantagefunds.com.
Index returns do not include transaction costs associated with buying and selling securities, any mutual fund fees or expenses or any taxes. It is not possible to invest directly in an index.
For Class A shares, the maximum front-end sales charge is 5.75%. For Class B shares, the maximum contingent deferred sales charge is 5.00%. For Class C shares, the maximum contingent deferred sales charge is 1.00%. Performance including sales charge assumes the sales charge for the corresponding time period. Performance shown without sales charge would be lower if sales charges were reflected. Administrator Class, Institutional Class and Investor Class shares are sold without a front-end sales charge or contingent deferred sales charge.
Please see footnotes on page 18.
| | | | |
| 10 | | Wells Fargo Advantage Dow Jones Target Date Funds | | Performance highlights (unaudited) |
Target 2025 Fund
Average annual total returns (%) as of August 31, 2012
| | | | | | | | | | | | | | | | | | | | | | |
| | | | | | | | Expense ratios2 (%) | |
| | | Inception date | | 1 year | | | 5 year | | | Since inception | | | Gross | | | Net3 | |
| Administrator Class (WFTRX) | | 6-29-07 | | | 6.58 | | | | 2.17 | | | | 1.80 | | | | 0.91 | | | | 0.85 | |
| Institutional Class (WFTYX) | | 6-29-07 | | | 6.86 | | | | 2.42 | | | | 2.04 | | | | 0.64 | | | | 0.50 | |
| Investor Class (WFGYX) | | 6-29-07 | | | 6.41 | | | | 2.11 | | | | 1.74 | | | | 1.13 | | | | 0.91 | |
| Dow Jones Target 2025 Index5 | | – | | | 7.25 | | | | 2.73 | | | | 2.44 | | | | – | | | | – | |
| Russell 3000® Index6 | | – | | | 17.03 | | | | 1.50 | | | | 1.05 | | | | – | | | | – | |
| Barclays U.S. Aggregate Bond Index7 | | – | | | 5.78 | | | | 6.66 | | | | 6.86 | | | | – | | | | – | |
Figures quoted represent past performance, which is no guarantee of future results and do not reflect the deduction of taxes that a shareholder may pay on fund distributions or the redemption of fund shares. Investment return and principal value of an investment will fluctuate so that an investor’s shares, when redeemed, may be worth more or less than their original cost. Current performance may be lower or higher than the performance data quoted and assumes the reinvestment of dividends and capital gains. Current month-end performance is available on the Fund’s website, wellsfargoadvantagefunds.com.
Index returns do not include transaction costs associated with buying and selling securities, any mutual fund fees or expenses or any taxes. It is not possible to invest directly in an index.
Administrator Class, Institutional Class and Investor Class shares are sold without a front-end sales charge or contingent deferred sales charge.
Please see footnotes on page 18.
| | | | | | |
| Performance highlights (unaudited) | | Wells Fargo Advantage Dow Jones Target Date Funds | | | 11 | |
Target 2030 Fund
Average annual total returns (%) as of August 31, 2012
| | | | | | | | | | | | | | | | | | | | | | | | | | | | | | | | | | |
| | | | | Including sales charge | | | Excluding sales charge | | | Expense ratios2 (%) | |
| | | Inception date | | 1 year | | | 5 year | | | 10 year | | | 1 year | | | 5 year | | | 10 year | | | Gross | | | Net3 | |
| Class A (STHRX)* | | 3-1-94 | | | 0.76 | | | | 0.07 | | | | 5.18 | | | | 6.92 | | | | 1.26 | | | | 5.80 | | | | 1.07 | | | | 1.02 | |
| Class B (SGPBX)** | | 3-1-97 | | | 1.13 | | | | 0.11 | | | | 5.28 | | | | 6.13 | | | | 0.51 | | | | 5.28 | | | | 1.82 | | | | 1.77 | |
| Class C (WFDMX) | | 12-1-98 | | | 5.06 | | | | 0.50 | | | | 5.03 | | | | 6.06 | | | | 0.50 | | | | 5.03 | | | | 1.82 | | | | 1.77 | |
| Administrator Class (WFLIX) | | 11-8-99 | | | – | | | | – | | | | – | | | | 7.09 | | | | 1.48 | | | | 6.08 | | | | 0.91 | | | | 0.86 | |
| Institutional Class (WFOOX)4 | | 6-29-04 | | | – | | | | – | | | | – | | | | 7.47 | | | | 1.77 | | | | 6.30 | | | | 0.64 | | | | 0.51 | |
| Investor Class (WFETX)4 | | 1-31-07 | | | – | | | | – | | | | – | | | | 7.05 | | | | 1.43 | | | | 6.04 | | | | 1.13 | | | | 0.92 | |
| Dow Jones Target 2030 Index5 | | – | | | – | | | | – | | | | – | | | | 7.79 | | | | 2.13 | | | | 8.74 | | | | – | | | | – | |
| Russell 3000® Index6 | | – | | | – | | | | – | | | | – | | | | 17.03 | | | | 1.50 | | | | 7.01 | | | | – | | | | – | |
| Barclays U.S. Aggregate Bond Index7 | | – | | | – | | | | – | | | | – | | | | 5.78 | | | | 6.66 | | | | 5.48 | | | | – | | | | – | |
| * | | Class A shares are closed to new investors. |
| ** | | Class B shares are closed to investment, except in connection with the reinvestment of any distributions and permitted exchanges. |
Figures quoted represent past performance, which is no guarantee of future results and do not reflect the deduction of taxes that a shareholder may pay on fund distributions or the redemption of fund shares. Investment return and principal value of an investment will fluctuate so that an investor’s shares, when redeemed, may be worth more or less than their original cost. Performance shown without sales charges would be lower if sales charges were reflected. Current performance may be lower or higher than the performance data quoted and assumes the reinvestment of dividends and capital gains. Current month-end performance is available on the Fund’s website, wellsfargoadvantagefunds.com.
Index returns do not include transaction costs associated with buying and selling securities, any mutual fund fees or expenses or any taxes. It is not possible to invest directly in an index.
For Class A shares, the maximum front-end sales charge is 5.75%. For Class B shares, the maximum contingent deferred sales charge is 5.00%. For Class C shares, the maximum contingent deferred sales charge is 1.00%. Performance including sales charge assumes the sales charge for the corresponding time period. Performance shown without sales charge would be lower if sales charges were reflected. Administrator Class, Institutional Class and Investor Class shares are sold without a front-end sales charge or contingent deferred sales charge.
Please see footnotes on page 18.
| | | | |
| 12 | | Wells Fargo Advantage Dow Jones Target Date Funds | | Performance highlights (unaudited) |
Target 2035 Fund
Average annual total returns (%) as of August 31, 2012
| | | | | | | | | | | | | | | | | | | | | | |
| | | | | | | | Expense ratios2 (%) | |
| | | Inception date | | 1 year | | | 5 year | | | Since inception | | | Gross | | | Net3 | |
| Administrator Class (WFQWX) | | 6-29-07 | | | 7.44 | | | | 1.17 | | | | 0.66 | | | | 0.93 | | | | 0.87 | |
| Institutional Class (WFQRX) | | 6-29-07 | | | 7.84 | | | | 1.52 | | | | 0.99 | | | | 0.66 | | | | 0.52 | |
| Investor Class (WFQTX) | | 6-29-07 | | | 7.47 | | | | 1.13 | | | | 0.62 | | | | 1.15 | | | | 0.93 | |
| Dow Jones Target 2035 Index5 | | – | | | 8.19 | | | | 1.67 | | | | 1.22 | | | | – | | | | – | |
| Russell 3000® Index6 | | – | | | 17.03 | | | | 1.50 | | | | 1.05 | | | | – | | | | – | |
| Barclays U.S. Aggregate Bond Index7 | | – | | | 5.78 | | | | 6.66 | | | | 6.86 | | | | – | | | | – | |
Figures quoted represent past performance, which is no guarantee of future results and do not reflect the deduction of taxes that a shareholder may pay on fund distributions or the redemption of fund shares. Investment return and principal value of an investment will fluctuate so that an investor’s shares, when redeemed, may be worth more or less than their original cost. Current performance may be lower or higher than the performance data quoted and assumes the reinvestment of dividends and capital gains. Current month-end performance is available on the Fund’s website, wellsfargoadvantagefunds.com.
Index returns do not include transaction costs associated with buying and selling securities, any mutual fund fees or expenses or any taxes. It is not possible to invest directly in an index.
Administrator Class, Institutional Class and Investor Class shares are sold without a front-end sales charge or contingent deferred sales charge.
Please see footnotes on page 18.
| | | | | | |
| Performance highlights (unaudited) | | Wells Fargo Advantage Dow Jones Target Date Funds | | | 13 | |
Target 2040 Fund
Average annual total returns (%) as of August 31, 2012
| | | | | | | | | | | | | | | | | | | | | | | | | | | | | | | | | | |
| | | | | Including sales charge | | | Excluding sales charge | | | Expense ratios2 (%) | |
| | | Inception date | | 1 year | | | 5 year | | | 10 year | | | 1 year | | | 5 year | | | 10 year | | | Gross | | | Net3 | |
| Class A (STFRX)* | | 3-1-94 | | | 1.33 | | | | (0.57 | ) | | | 5.52 | | | | 7.54 | | | | 0.62 | | | | 6.15 | | | | 1.08 | | | | 1.03 | |
| Class B (SLPBX)** | | 3-1-97 | | | 1.77 | | | | (0.55 | ) | | | 5.62 | | | | 6.77 | | | | (0.14 | ) | | | 5.62 | | | | 1.83 | | | | 1.78 | |
| Class C (WFOFX) | | 7-1-98 | | | 5.79 | | | | (0.14 | ) | | | 5.38 | | | | 6.79 | | | | (0.14 | ) | | | 5.38 | | | | 1.83 | | | | 1.78 | |
| Administrator Class (WFLWX) | | 11-8-99 | | | – | | | | – | | | | – | | | | 7.73 | | | | 0.84 | | | | 6.43 | | | | 0.92 | | | | 0.87 | |
| Institutional Class (WFOSX)4 | | 6-30-04 | | | – | | | | – | | | | – | | | | 8.17 | | | | 1.14 | | | | 6.66 | | | | 0.65 | | | | 0.52 | |
| Investor Class (WFFTX)4 | | 1-31-07 | | | – | | | | – | | | | – | | | | 7.68 | | | | 0.77 | | | | 6.39 | | | | 1.14 | | | | 0.93 | |
| Dow Jones Target 2040 Index5 | | – | | | – | | | | – | | | | – | | | | 8.45 | | | | 1.43 | | | | 8.81 | | | | – | | | | – | |
| Russell 3000® Index6 | | – | | | – | | | | – | | | | – | | | | 17.03 | | | | 1.50 | | | | 7.01 | | | | – | | | | – | |
| Barclays U.S. Aggregate Bond Index7 | | – | | | – | | | | – | | | | – | | | | 5.78 | | | | 6.66 | | | | 5.48 | | | | – | | | | – | |
| * | | Class A shares are closed to new investors. |
| ** | | Class B shares are closed to investment, except in connection with the reinvestment of any distributions and permitted exchanges. |
Figures quoted represent past performance, which is no guarantee of future results and do not reflect the deduction of taxes that a shareholder may pay on fund distributions or the redemption of fund shares. Investment return and principal value of an investment will fluctuate so that an investor’s shares, when redeemed, may be worth more or less than their original cost. Performance shown without sales charges would be lower if sales charges were reflected. Current performance may be lower or higher than the performance data quoted and assumes the reinvestment of dividends and capital gains. Current month-end performance is available on the Fund’s website, wellsfargoadvantagefunds.com.
Index returns do not include transaction costs associated with buying and selling securities, any mutual fund fees or expenses or any taxes. It is not possible to invest directly in an index.
For Class A shares, the maximum front-end sales charge is 5.75%. For Class B shares, the maximum contingent deferred sales charge is 5.00%. For Class C shares, the maximum contingent deferred sales charge is 1.00%. Performance including sales charge assumes the sales charge for the corresponding time period. Performance shown without sales charge would be lower if sales charges were reflected. Administrator Class, Institutional Class and Investor Class shares are sold without a front-end sales charge or contingent deferred sales charge.
Please see footnotes on page 18.
| | | | |
| 14 | | Wells Fargo Advantage Dow Jones Target Date Funds | | Performance highlights (unaudited) |
Target 2045 Fund
Average annual total returns (%) as of August 31, 2012
| | | | | | | | | | | | | | | | | | | | | | |
| | | | | | | | Expense ratios2 (%) | |
| | | Inception date | | 1 year | | | 5 year | | | Since inception | | | Gross | | | Net3 | |
| Administrator Class (WFQYX) | | 6-29-07 | | | 7.85 | | | | 1.02 | | | | 0.51 | | | | 0.94 | | | | 0.87 | |
| Institutional Class (WFQPX) | | 6-29-07 | | | 8.19 | | | | 1.30 | | | | 0.78 | | | | 0.67 | | | | 0.52 | |
| Investor Class (WFQSX) | | 6-29-07 | | | 7.75 | | | | 0.96 | | | | 0.43 | | | | 1.16 | | | | 0.93 | |
| Dow Jones Target 2045 Index5 | | – | | | 8.57 | | | | 1.43 | | | | 0.95 | | | | – | | | | – | |
| Russell 3000® Index6 | | – | | | 17.03 | | | | 1.50 | | | | 1.05 | | | | – | | | | – | |
| Barclays U.S. Aggregate Bond Index7 | | – | | | 5.78 | | | | 6.66 | | | | 6.86 | | | | – | | | | – | |
Figures quoted represent past performance, which is no guarantee of future results and do not reflect the deduction of taxes that a shareholder may pay on fund distributions or the redemption of fund shares. Investment return and principal value of an investment will fluctuate so that an investor’s shares, when redeemed, may be worth more or less than their original cost. Current performance may be lower or higher than the performance data quoted and assumes the reinvestment of dividends and capital gains. Current month-end performance is available on the Fund’s website, wellsfargoadvantagefunds.com.
Index returns do not include transaction costs associated with buying and selling securities, any mutual fund fees or expenses or any taxes. It is not possible to invest directly in an index.
Administrator Class, Institutional Class and Investor Class shares are sold without a front-end sales charge or contingent deferred sales charge.
Please see footnotes on page 18.
| | | | | | |
| Performance highlights (unaudited) | | Wells Fargo Advantage Dow Jones Target Date Funds | | | 15 | |
Target 2050 Fund
Average annual total returns (%) as of August 31, 2012
| | | | | | | | | | | | | | | | | | | | | | |
| | | | | | | | | | | | | | Expense ratios2 (%) | |
| | | Inception date | | 1 year | | | 5 year | | | Since inception | | | Gross | | | Net3 | |
| Administrator Class (WFQDX) | | 6-29-07 | | | 7.90 | | | | 0.94 | | | | 0.45 | | | | 0.93 | | | | 0.87 | |
| Institutional Class (WFQFX) | | 6-29-07 | | | 8.26 | | | | 1.25 | | | | 0.76 | | | | 0.66 | | | | 0.52 | |
| Investor Class (WFQGX) | | 6-29-07 | | | 7.81 | | | | 0.89 | | | | 0.40 | | | | 1.15 | | | | 0.93 | |
| Dow Jones Target 2050 Index5 | | – | | | 8.57 | | | | 1.43 | | | | 0.95 | | | | – | | | | – | |
| Russell 3000® Index6 | | – | | | 17.03 | | | | 1.50 | | | | 1.05 | | | | – | | | | – | |
| Barclays U.S. Aggregate Bond Index7 | | – | | | 5.78 | | | | 6.66 | | | | 6.86 | | | | – | | | | – | |
Figures quoted represent past performance, which is no guarantee of future results and do not reflect the deduction of taxes that a shareholder may pay on fund distributions or the redemption of fund shares. Investment return and principal value of an investment will fluctuate so that an investor’s shares, when redeemed, may be worth more or less than their original cost. Current performance may be lower or higher than the performance data quoted and assumes the reinvestment of dividends and capital gains. Current month-end performance is available on the Fund’s website, wellsfargoadvantagefunds.com.
Index returns do not include transaction costs associated with buying and selling securities, any mutual fund fees or expenses or any taxes. It is not possible to invest directly in an index.
Administrator Class, Institutional Class and Investor Class shares are sold without a front-end sales charge or contingent deferred sales charge.
Please see footnotes on page 18.
| | | | |
| 16 | | Wells Fargo Advantage Dow Jones Target Date Funds | | Performance highlights (unaudited) |
Target 2055 Fund
Average annual total returns (%) as of August 31, 2012
| | | | | | | | | | | | | | | | | | |
| | | | | | | | | | | Expense ratios2 (%) | |
| | | Inception date | | 1 year | | | Since inception | | | Gross | | | Net3 | |
| Administrator Class (WFLHX) | | 6-30-11 | | | 7.86 | | | | (0.19 | ) | | | 4.08 | | | | 0.87 | |
| Institutional Class (WFQUX) | | 6-30-11 | | | 8.27 | | | | 0.13 | | | | 3.81 | | | | 0.52 | |
| Investor Class (WFQHX) | | 6-30-11 | | | 7.81 | | | | (0.24 | ) | | | 4.30 | | | | 0.93 | |
| Dow Jones Target 2055 Index5 | | – | | | 8.57 | | | | 0.02 | | | | – | | | | – | |
| Russell 3000® Index6 | | – | | | 17.03 | | | | 6.36 | | | | – | | | | – | |
| Barclays U.S. Aggregate Bond Index7 | | – | | | 5.78 | | | | 7.67 | | | | – | | | | – | |
Figures quoted represent past performance, which is no guarantee of future results and do not reflect the deduction of taxes that a shareholder may pay on fund distributions or the redemption of fund shares. Investment return and principal value of an investment will fluctuate so that an investor’s shares, when redeemed, may be worth more or less than their original cost. Current performance may be lower or higher than the performance data quoted and assumes the reinvestment of dividends and capital gains. Current month-end performance is available on the Fund’s website, wellsfargoadvantagefunds.com.
Index returns do not include transaction costs associated with buying and selling securities, any mutual fund fees or expenses or any taxes. It is not possible to invest directly in an index.
Administrator Class, Institutional Class and Investor Class shares are sold without a front-end sales charge or contingent deferred sales charge.
Please see footnotes on page 18.
| | | | | | |
| Performance highlights (unaudited) | | Wells Fargo Advantage Dow Jones Target Date Funds | | | 17 | |
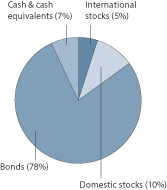
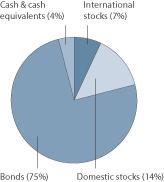
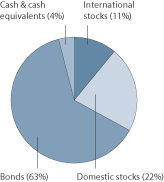
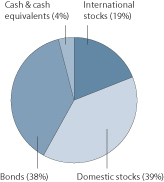
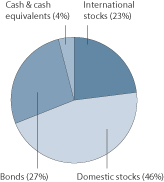
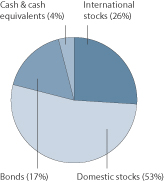
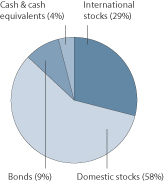
Portfolio allocations8 as of August 31, 2012
| | | | |
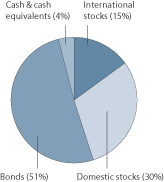
| Target Today Fund | | Target 2010 Fund | | Target 2015 Fund |
| | | |
 | |  | |  |
| | | | |
| Target 2020 Fund | | Target 2025 Fund | | Target 2030 Fund |
| | | |
 | |  | |  |
| | | | |
| Target 2035 Fund | | Target 2040 Fund | | Target 2045 Fund |
| | | |
 | |  | | 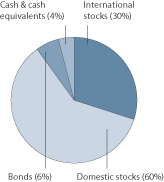 |
Please see footnotes on page 18.
| | | | |
| 18 | | Wells Fargo Advantage Dow Jones Target Date Funds | | Performance highlights (unaudited) |
| | |
| Target 2050 Fund | | Target 2055 Fund |
| | |
| | |
| 1. | The Funds are gateway funds that invest in various master portfolios which in turn invest in a combination of equity, fixed income and money market securities using an asset allocation strategy designed to replicate, before fees and expenses, the total return of the Dow Jones Target Date Indexes that have the same target year as the Funds. References to the investment activities of the Funds are intended to refer to the investment activities of the underlying master portfolios in which the Funds invest. |
| 2. | Reflects the expense ratios as stated in the most recent prospectuses. |
| 3. | The Adviser has committed through June 30, 2013 to waive fees and/or reimburse expenses to the extent necessary to cap the Fund’s Total Annual Fund Operating Expenses After Fee Waiver, excluding certain expenses, at the amounts shown. Brokerage commissions, stamp duty fees, interest, taxes, acquired fund fees and expenses and extraordinary expenses are excluded from the cap. Fees from the underlying master portfolio(s) are included in the cap. Without this cap, the Fund’s returns would have been lower. |
| 4. | Historical performance shown for the Institutional Class shares prior to their inception reflects the performance of the Administrator Class shares, and includes the higher expenses applicable to the Administrator Class shares. Historical performance shown for Investor Class shares prior to their inception reflects the performance of the Administrator Class shares, adjusted to reflect the higher expenses applicable to the Investor Class shares (except during those periods in which expenses of the Investor Class would have been lower than those of the Administrator Class no such adjustment is reflected). |
| 5. | The Dow Jones Target Date Indexes (each an “index” or collectively the “indexes”) are a series of indexes designed as benchmarks for multi-asset class portfolios with risk profiles that became more conservative over time. The index weightings among the major asset classes are adjusted monthly based on a published set of index rules. The indexes with longer time horizons have higher allocations to equity securities, while the indexes with shorter time horizons replace some of their stock allocations with allocations to fixed income securities and money market instruments. The index returns reflect hypothetical back-tested performance. You cannot invest directly in an index. |
| 6. | The Russell 3000® Index measures the performance of the 3,000 largest U.S. companies based on total market capitalization, which represents approximately 98% of the investable U.S. equity market. You cannot invest directly in an index. |
| 7. | The Barclays U.S. Aggregate Bond Index is composed of the Barclays Government/Credit Index and the Barclays U.S. Mortgage-Backed Securities Index and includes U.S. Treasury issues, agency issues, corporate bond issues, and mortgage-backed securities. You cannot invest directly in an index. |
| 8. | Each chart represents the composite of the portfolio allocations of the master portfolios in which the Fund invests and is calculated based on the total investments of the master portfolios. Portfolio holdings are subject to change and may have changed since the date specified. See Portfolio of investments of each master portfolio which is also included in this report. |
| | | | | | |
| Fund expenses (unaudited) | | Wells Fargo Advantage Dow Jones Target Date Funds | | | 19 | |
As a shareholder of the Fund, you incur two types of costs: (1) transaction costs, including sales charges (loads) on purchase payments, redemption fees (if any) and exchange fees (if any); and (2) ongoing costs, including management fees, distribution (12b-1) and/or shareholder service fees, and other Fund expenses. This example is intended to help you understand your ongoing costs (in dollars) of investing in the Fund and to compare these costs with the ongoing costs of investing in other mutual funds.
The example is based on an investment of $1,000 invested at the beginning of the six-month period and held for the entire period from March 1, 2012, to August 31, 2012.
Actual expenses
The “Actual” line of the table below provides information about actual account values and actual expenses. You may use the information in this line, together with the amount you invested, to estimate the expenses that you paid over the period. Simply divide your account value by $1,000 (for example, an $8,600 account value divided by $1,000 = 8.6), then multiply the result by the number in the “Actual” line under the heading entitled “Expenses paid during period” for your applicable class of shares to estimate the expenses you paid on your account during this period.
Hypothetical example for comparison purposes
The “Hypothetical” line of the table below provides information about hypothetical account values and hypothetical expenses based on the Fund’s actual expense ratio and an assumed rate of return of 5% per year before expenses, which is not the Fund’s actual return. The hypothetical account values and expenses may not be used to estimate the actual ending account balance or expenses you paid for the period. You may use this information to compare the ongoing costs of investing in the Fund and other funds. To do so, compare this 5% hypothetical example with the 5% hypothetical examples that appear in the shareholder reports of the other funds.
Please note that the expenses shown in the table are meant to highlight your ongoing costs only and do not reflect any transactional costs, such as sales charges (loads), redemption fees, or exchange fees. Therefore, the “Hypothetical” line of the table is useful in comparing ongoing costs only and will not help you determine the relative total costs of owning different funds. In addition, if these transactional costs were included, your costs would have been higher.
| | | | | | | | | | | | | | | | |
| Target Today Fund | | Beginning
account value
3-1-12 | | | Ending
account value
8-31-12 | | | Expenses
paid during
the period¹ | | | Net annual
expense ratio | |
Class A | | | | | | | | | | | | | | | | |
Actual | | $ | 1,000.00 | | | $ | 1,018.42 | | | $ | 4.88 | | | | 0.96 | % |
Hypothetical (5% return before expenses) | | $ | 1,000.00 | | | $ | 1,020.37 | | | $ | 4.89 | | | | 0.96 | % |
Class B | | | | | | | | | | | | | | | | |
Actual | | $ | 1,000.00 | | | $ | 1,014.26 | | | $ | 8.68 | | | | 1.71 | % |
Hypothetical (5% return before expenses) | | $ | 1,000.00 | | | $ | 1,016.59 | | | $ | 8.69 | | | | 1.71 | % |
Class C | | | | | | | | | | | | | | | | |
Actual | | $ | 1,000.00 | | | $ | 1,013.50 | | | $ | 8.68 | | | | 1.71 | % |
Hypothetical (5% return before expenses) | | $ | 1,000.00 | | | $ | 1,016.59 | | | $ | 8.69 | | | | 1.71 | % |
Administrator Class | | | | | | | | | | | | | | | | |
Actual | | $ | 1,000.00 | | | $ | 1,018.07 | | | $ | 4.07 | | | | 0.80 | % |
Hypothetical (5% return before expenses) | | $ | 1,000.00 | | | $ | 1,021.17 | | | $ | 4.08 | | | | 0.80 | % |
Institutional Class | | | | | | | | | | | | | | | | |
Actual | | $ | 1,000.00 | | | $ | 1,019.84 | | | $ | 2.29 | | | | 0.45 | % |
Hypothetical (5% return before expenses) | | $ | 1,000.00 | | | $ | 1,022.94 | | | $ | 2.29 | | | | 0.45 | % |
Investor Class | | | | | | | | | | | | | | | | |
Actual | | $ | 1,000.00 | | | $ | 1,019.00 | | | $ | 4.38 | | | | 0.86 | % |
Hypothetical (5% return before expenses) | | $ | 1,000.00 | | | $ | 1,020.87 | | | $ | 4.38 | | | | 0.86 | % |
Please see footnote on page 22.
| | | | |
| 20 | | Wells Fargo Advantage Dow Jones Target Date Funds | | Fund expenses (unaudited) |
| | | | | | | | | | | | | | | | |
| Target 2010 Fund | | Beginning
account value
3-1-12 | | | Ending
account value
8-31-12 | | | Expenses
paid during
the period¹ | | | Net annual
expense ratio | |
Class A | | | | | | | | | | | | | | | | |
Actual | | $ | 1,000.00 | | | $ | 1,016.66 | | | $ | 5.03 | | | | 0.99 | % |
Hypothetical (5% return before expenses) | | $ | 1,000.00 | | | $ | 1,020.21 | | | $ | 5.04 | | | | 0.99 | % |
Class B | | | | | | | | | | | | | | | | |
Actual | | $ | 1,000.00 | | | $ | 1,012.11 | | | $ | 8.82 | | | | 1.74 | % |
Hypothetical (5% return before expenses) | | $ | 1,000.00 | | | $ | 1,016.43 | | | $ | 8.84 | | | | 1.74 | % |
Class C | | | | | | | | | | | | | | | | |
Actual | | $ | 1,000.00 | | | $ | 1,012.80 | | | $ | 8.83 | | | | 1.74 | % |
Hypothetical (5% return before expenses) | | $ | 1,000.00 | | | $ | 1,016.43 | | | $ | 8.84 | | | | 1.74 | % |
Administrator Class | | | | | | | | | | | | | | | | |
Actual | | $ | 1,000.00 | | | $ | 1,017.47 | | | $ | 4.22 | | | | 0.83 | % |
Hypothetical (5% return before expenses) | | $ | 1,000.00 | | | $ | 1,021.02 | | | $ | 4.23 | | | | 0.83 | % |
Institutional Class | | | | | | | | | | | | | | | | |
Actual | | $ | 1,000.00 | | | $ | 1,019.01 | | | $ | 2.44 | | | | 0.48 | % |
Hypothetical (5% return before expenses) | | $ | 1,000.00 | | | $ | 1,022.79 | | | $ | 2.45 | | | | 0.48 | % |
Investor Class | | | | | | | | | | | | | | | | |
Actual | | $ | 1,000.00 | | | $ | 1,017.06 | | | $ | 4.52 | | | | 0.89 | % |
Hypothetical (5% return before expenses) | | $ | 1,000.00 | | | $ | 1,020.72 | | | $ | 4.53 | | | | 0.89 | % |
| Target 2015 Fund | | | | | | | | | | | | |
Administrator Class | | | | | | | | | | | | | | | | |
Actual | | $ | 1,000.00 | | | $ | 1,014.14 | | | $ | 4.26 | | | | 0.84 | % |
Hypothetical (5% return before expenses) | | $ | 1,000.00 | | | $ | 1,020.97 | | | $ | 4.28 | | | | 0.84 | % |
Institutional Class | | | | | | | | | | | | | | | | |
Actual | | $ | 1,000.00 | | | $ | 1,015.88 | | | $ | 2.49 | | | | 0.49 | % |
Hypothetical (5% return before expenses) | | $ | 1,000.00 | | | $ | 1,022.74 | | | $ | 2.50 | | | | 0.49 | % |
Investor Class | | | | | | | | | | | | | | | | |
Actual | | $ | 1,000.00 | | | $ | 1,013.82 | | | $ | 4.57 | | | | 0.90 | % |
Hypothetical (5% return before expenses) | | $ | 1,000.00 | | | $ | 1,020.67 | | | $ | 4.58 | | | | 0.90 | % |
| Target 2020 Fund | | | | | | | | | | | | |
Class A | | | | | | | | | | | | | | | | |
Actual | | $ | 1,000.00 | | | $ | 1,008.55 | | | $ | 5.11 | | | | 1.01 | % |
Hypothetical (5% return before expenses) | | $ | 1,000.00 | | | $ | 1,020.11 | | | $ | 5.14 | | | | 1.01 | % |
Class B | | | | | | | | | | | | | | | | |
Actual | | $ | 1,000.00 | | | $ | 1,005.06 | | | $ | 8.89 | | | | 1.76 | % |
Hypothetical (5% return before expenses) | | $ | 1,000.00 | | | $ | 1,016.33 | | | $ | 8.94 | | | | 1.76 | % |
Class C | | | | | | | | | | | | | | | | |
Actual | | $ | 1,000.00 | | | $ | 1,004.87 | | | $ | 8.89 | | | | 1.76 | % |
Hypothetical (5% return before expenses) | | $ | 1,000.00 | | | $ | 1,016.33 | | | $ | 8.94 | | | | 1.76 | % |
Administrator Class | | | | | | | | | | | | | | | | |
Actual | | $ | 1,000.00 | | | $ | 1,009.27 | | | $ | 4.30 | | | | 0.85 | % |
Hypothetical (5% return before expenses) | | $ | 1,000.00 | | | $ | 1,020.92 | | | $ | 4.33 | | | | 0.85 | % |
Institutional Class | | | | | | | | | | | | | | | | |
Actual | | $ | 1,000.00 | | | $ | 1,011.54 | | | $ | 2.54 | | | | 0.50 | % |
Hypothetical (5% return before expenses) | | $ | 1,000.00 | | | $ | 1,022.68 | | | $ | 2.55 | | | | 0.50 | % |
Investor Class | | | | | | | | | | | | | | | | |
Actual | | $ | 1,000.00 | | | $ | 1,008.96 | | | $ | 4.61 | | | | 0.91 | % |
Hypothetical (5% return before expenses) | | $ | 1,000.00 | | | $ | 1,020.62 | | | $ | 4.63 | | | | 0.91 | % |
Please see footnote on page 22.
| | | | | | |
| Fund expenses (unaudited) | | Wells Fargo Advantage Dow Jones Target Date Funds | | | 21 | |
| | | | | | | | | | | | | | | | |
| Target 2025 Fund | | Beginning
account value
3-1-12 | | | Ending
account value
8-31-12 | | | Expenses
paid during
the period¹ | | | Net annual
expense ratio | |
Administrator Class | | | | | | | | | | | | | | | | |
Actual | | $ | 1,000.00 | | | $ | 1,004.41 | | | $ | 4.29 | | | | 0.85 | % |
Hypothetical (5% return before expenses) | | $ | 1,000.00 | | | $ | 1,020.92 | | | $ | 4.33 | | | | 0.85 | % |
Institutional Class | | | | | | | | | | | | | | | | |
Actual | | $ | 1,000.00 | | | $ | 1,005.95 | | | $ | 2.53 | | | | 0.50 | % |
Hypothetical (5% return before expenses) | | $ | 1,000.00 | | | $ | 1,022.68 | | | $ | 2.55 | | | | 0.50 | % |
Investor Class | | | | | | | | | | | | | | | | |
Actual | | $ | 1,000.00 | | | $ | 1,004.10 | | | $ | 4.60 | | | | 0.91 | % |
Hypothetical (5% return before expenses) | | $ | 1,000.00 | | | $ | 1,020.62 | | | $ | 4.63 | | | | 0.91 | % |
| Target 2030 Fund | | | | | | | | | | | | |
Class A | | | | | | | | | | | | | | | | |
Actual | | $ | 1,000.00 | | | $ | 999.14 | | | $ | 5.14 | | | | 1.02 | % |
Hypothetical (5% return before expenses) | | $ | 1,000.00 | | | $ | 1,020.06 | | | $ | 5.19 | | | | 1.02 | % |
Class B | | | | | | | | | | | | | | | | |
Actual | | $ | 1,000.00 | | | $ | 995.64 | | | $ | 8.90 | | | | 1.77 | % |
Hypothetical (5% return before expenses) | | $ | 1,000.00 | | | $ | 1,016.28 | | | $ | 9.00 | | | | 1.77 | % |
Class C | | | | | | | | | | | | | | | | |
Actual | | $ | 1,000.00 | | | $ | 995.27 | | | $ | 8.90 | | | | 1.77 | % |
Hypothetical (5% return before expenses) | | $ | 1,000.00 | | | $ | 1,016.28 | | | $ | 9.00 | | | | 1.77 | % |
Administrator Class | | | | | | | | | | | | | | | | |
Actual | | $ | 1,000.00 | | | $ | 1,000.01 | | | $ | 4.34 | | | | 0.86 | % |
Hypothetical (5% return before expenses) | | $ | 1,000.00 | | | $ | 1,020.87 | | | $ | 4.38 | | | | 0.86 | % |
Institutional Class | | | | | | | | | | | | | | | | |
Actual | | $ | 1,000.00 | | | $ | 1,001.60 | | | $ | 2.57 | | | | 0.51 | % |
Hypothetical (5% return before expenses) | | $ | 1,000.00 | | | $ | 1,022.63 | | | $ | 2.60 | | | | 0.51 | % |
Investor Class | | | | | | | | | | | | | | | | |
Actual | | $ | 1,000.00 | | | $ | 999.74 | | | $ | 4.64 | | | | 0.92 | % |
Hypothetical (5% return before expenses) | | $ | 1,000.00 | | | $ | 1,020.57 | | | $ | 4.69 | | | | 0.92 | % |
| Target 2035 Fund | | | | | | | | | | | | |
Administrator Class | | | | | | | | | | | | | | | | |
Actual | | $ | 1,000.00 | | | $ | 996.35 | | | $ | 4.38 | | | | 0.87 | % |
Hypothetical (5% return before expenses) | | $ | 1,000.00 | | | $ | 1,020.82 | | | $ | 4.43 | | | | 0.87 | % |
Institutional Class | | | | | | | | | | | | | | | | |
Actual | | $ | 1,000.00 | | | $ | 997.86 | | | $ | 2.62 | | | | 0.52 | % |
Hypothetical (5% return before expenses) | | $ | 1,000.00 | | | $ | 1,022.58 | | | $ | 2.65 | | | | 0.52 | % |
Investor Class | | | | | | | | | | | | | | | | |
Actual | | $ | 1,000.00 | | | $ | 996.05 | | | $ | 4.68 | | | | 0.93 | % |
Hypothetical (5% return before expenses) | | $ | 1,000.00 | | | $ | 1,020.52 | | | $ | 4.74 | | | | 0.93 | % |
| Target 2040 Fund | | | | | | | | | | | | |
Class A | | | | | | | | | | | | | | | | |
Actual | | $ | 1,000.00 | | | $ | 992.66 | | | $ | 5.17 | | | | 1.03 | % |
Hypothetical (5% return before expenses) | | $ | 1,000.00 | | | $ | 1,020.01 | | | $ | 5.24 | | | | 1.03 | % |
Class B | | | | | | | | | | | | | | | | |
Actual | | $ | 1,000.00 | | | $ | 989.03 | | | $ | 8.92 | | | | 1.78 | % |
Hypothetical (5% return before expenses) | | $ | 1,000.00 | | | $ | 1,016.23 | | | $ | 9.05 | | | | 1.78 | % |
Class C | | | | | | | | | | | | | | | | |
Actual | | $ | 1,000.00 | | | $ | 988.96 | | | $ | 8.92 | | | | 1.78 | % |
Hypothetical (5% return before expenses) | | $ | 1,000.00 | | | $ | 1,016.23 | | | $ | 9.05 | | | | 1.78 | % |
Please see footnote on page 22.
| | | | |
| 22 | | Wells Fargo Advantage Dow Jones Target Date Funds | | Fund expenses (unaudited) |
| | | | | | | | | | | | | | | | |
| Target 2040 Fund | | Beginning
account value
3-1-12 | | | Ending
account value
8-31-12 | | | Expenses
paid during
the period¹ | | | Net annual
expense ratio | |
Administrator Class | | | | | | | | | | | | | | | | |
Actual | | $ | 1,000.00 | | | $ | 993.60 | | | $ | 4.37 | | | | 0.87 | % |
Hypothetical (5% return before expenses) | | $ | 1,000.00 | | | $ | 1,020.82 | | | $ | 4.43 | | | | 0.87 | % |
Institutional Class | | | | | | | | | | | | | | | | |
Actual | | $ | 1,000.00 | | | $ | 995.24 | | | $ | 2.62 | | | | 0.52 | % |
Hypothetical (5% return before expenses) | | $ | 1,000.00 | | | $ | 1,022.58 | | | $ | 2.65 | | | | 0.52 | % |
Investor Class | | | | | | | | | | | | | | | | |
Actual | | $ | 1,000.00 | | | $ | 993.35 | | | $ | 4.67 | | | | 0.93 | % |
Hypothetical (5% return before expenses) | | $ | 1,000.00 | | | $ | 1,020.52 | | | $ | 4.74 | | | | 0.93 | % |
| Target 2045 Fund | | | | | | | | | | | | |
Administrator Class | | | | | | | | | | | | | | | | |
Actual | | $ | 1,000.00 | | | $ | 992.04 | | | $ | 4.37 | | | | 0.87 | % |
Hypothetical (5% return before expenses) | | $ | 1,000.00 | | | $ | 1,020.82 | | | $ | 4.43 | | | | 0.87 | % |
Institutional Class | | | | | | | | | | | | | | | | |
Actual | | $ | 1,000.00 | | | $ | 994.05 | | | $ | 2.61 | | | | 0.52 | % |
Hypothetical (5% return before expenses) | | $ | 1,000.00 | | | $ | 1,022.58 | | | $ | 2.65 | | | | 0.52 | % |
Investor Class | | | | | | | | | | | | | | | | |
Actual | | $ | 1,000.00 | | | $ | 991.73 | | | $ | 4.67 | | | | 0.93 | % |
Hypothetical (5% return before expenses) | | $ | 1,000.00 | | | $ | 1,020.52 | | | $ | 4.74 | | | | 0.93 | % |
| Target 2050 Fund | | | | | | | | | | | | |
Administrator Class | | | | | | | | | | | | | | | | |
Actual | | $ | 1,000.00 | | | $ | 992.70 | | | $ | 4.37 | | | | 0.87 | % |
Hypothetical (5% return before expenses) | | $ | 1,000.00 | | | $ | 1,020.82 | | | $ | 4.43 | | | | 0.87 | % |
Institutional Class | | | | | | | | | | | | | | | | |
Actual | | $ | 1,000.00 | | | $ | 994.26 | | | $ | 2.61 | | | | 0.52 | % |
Hypothetical (5% return before expenses) | | $ | 1,000.00 | | | $ | 1,022.58 | | | $ | 2.65 | | | | 0.52 | % |
Investor Class | | | | | | | | | | | | | | | | |
Actual | | $ | 1,000.00 | | | $ | 992.44 | | | $ | 4.67 | | | | 0.93 | % |
Hypothetical (5% return before expenses) | | $ | 1,000.00 | | | $ | 1,020.52 | | | $ | 4.74 | | | | 0.93 | % |
| Target 2055 Fund | | | | | | | | | | | | |
Administrator Class | | | | | | | | | | | | | | | | |
Actual | | $ | 1,000.00 | | | $ | 991.77 | | | $ | 4.37 | | | | 0.87 | % |
Hypothetical (5% return before expenses) | | $ | 1,000.00 | | | $ | 1,020.82 | | | $ | 4.43 | | | | 0.87 | % |
Institutional Class | | | | | | | | | | | | | | | | |
Actual | | $ | 1,000.00 | | | $ | 993.52 | | | $ | 2.61 | | | | 0.52 | % |
Hypothetical (5% return before expenses) | | $ | 1,000.00 | | | $ | 1,022.58 | | | $ | 2.65 | | | | 0.52 | % |
Investor Class | | | | | | | | | | | | | | | | |
Actual | | $ | 1,000.00 | | | $ | 992.27 | | | $ | 4.67 | | | | 0.93 | % |
Hypothetical (5% return before expenses) | | $ | 1,000.00 | | | $ | 1,020.52 | | | $ | 4.74 | | | | 0.93 | % |
| 1. | Expenses paid is equal to the annualized expense ratio of each class multiplied by the average account value over the period, multiplied by the number of days in the most recent fiscal half-year divided by the number of days in the fiscal year (to reflect the one-half year period). |
| | | | | | |
| Portfolio of investments—August 31, 2012 (unaudited) | | Wells Fargo Advantage Dow Jones Target Date Funds | | | 23 | |
TARGET TODAY FUND
| | | | | | | | | | | | |
| Security name | | | | | | Shares | | | Value | |
| | | |
Affiliated Master Portfolios: 100.03% | | | | | | | | | | |
Wells Fargo Advantage Diversified Fixed Income Portfolio | | | | | | | N/A | | | $ | 771,838,130 | |
Wells Fargo Advantage Diversified Stock Portfolio | | | | | | | N/A | | | | 150,954,684 | |
Wells Fargo Advantage Short-Term Investment Portfolio | | | | | | | N/A | | | | 66,353,349 | |
| | | |
Total Affiliated Master Portfolios (Cost $930,841,937) | | | | | | | | | 989,146,163 | |
| | | | | | | | | | | | |
| | | | | | | | |
| Total investments in securities | | | | | | | | |
| (Cost $930,841,937) * | | | 100.03 | % | | | 989,146,163 | |
Other assets and liabilities, net | | | (0.03 | ) | | | (289,281 | ) |
| | | | | | | | |
| Total net assets | | | 100.00 | % | | $ | 988,856,882 | |
| | | | | | | | |
TARGET 2010 FUND
| | | | | | | | | | | | |
| Security name | | | | | | Shares | | | Value | |
| | | |
Affiliated Master Portfolios: 100.01% | | | | | | | | | | |
Wells Fargo Advantage Diversified Fixed Income Portfolio | | | | | | | N/A | | | $ | 636,795,743 | |
Wells Fargo Advantage Diversified Stock Portfolio | | | | | | | N/A | | | | 181,415,793 | |
Wells Fargo Advantage Short-Term Investment Portfolio | | | | | | | N/A | | | | 33,816,399 | |
| | | |
Total Affiliated Master Portfolios (Cost $779,850,967) | | | | | | | | | 852,027,935 | |
| | | | | | | | | | | | |
| | | | | | | | |
| Total investments in securities | | | | | | | | |
| (Cost $779,850,967) * | | | 100.01 | % | | | 852,027,935 | |
Other assets and liabilities, net | | | (0.01 | ) | | | (79,333 | ) |
| | | | | | | | |
| Total net assets | | | 100.00 | % | | $ | 851,948,602 | |
| | | | | | | | |
TARGET 2015 FUND
| | | | | | | | | | | | |
| Security name | | | | | | Shares | | | Value | |
| | | |
Affiliated Master Portfolios: 100.00% | | | | | | | | | | |
Wells Fargo Advantage Diversified Fixed Income Portfolio | | | | | | | N/A | | | $ | 542,044,186 | |
Wells Fargo Advantage Diversified Stock Portfolio | | | | | | | N/A | | | | 280,627,667 | |
Wells Fargo Advantage Short-Term Investment Portfolio | | | | | | | N/A | | | | 33,919,844 | |
| | | |
Total Affiliated Master Portfolios (Cost $803,109,040) | | | | | | | | | 856,591,697 | |
| | | | | | | | | | | | |
| | | | | | | | |
| Total investments in securities | | | | | | | | |
| (Cost $803,109,040) * | | | 100.00 | % | | | 856,591,697 | |
Other assets and liabilities, net | | | 0.00 | | | | (3,745 | ) |
| | | | | | | | |
| Total net assets | | | 100.00 | % | | $ | 856,587,952 | |
| | | | | | | | |
| * | Cost for federal income tax purposes is substantially the same as for financial reporting purposes. |
The accompanying notes are an integral part of these financial statements.
| | | | |
| 24 | | Wells Fargo Advantage Dow Jones Target Date Funds | | Portfolio of investments—August 31, 2012 (unaudited) |
TARGET 2020 FUND
| | | | | | | | | | | | |
| Security name | | | | | | Shares | | | Value | |
| | | |
Affiliated Master Portfolios: 100.14% | | | | | | | | | | |
Wells Fargo Advantage Diversified Fixed Income Portfolio | | | | | | | N/A | | | $ | 1,193,207,382 | |
Wells Fargo Advantage Diversified Stock Portfolio | | | | | | | N/A | | | | 1,052,661,494 | |
Wells Fargo Advantage Short-Term Investment Portfolio | | | | | | | N/A | | | | 92,364,120 | |
| | | |
Total Affiliated Master Portfolios (Cost $2,160,947,543) | | | | | | | | | 2,338,232,996 | |
| | | | | | | | | | | | |
| | | | | | | | |
| Total investments in securities | | | | | | | | |
| (Cost $2,160,947,543) * | | | 100.14 | % | | | 2,338,232,996 | |
Other assets and liabilities, net | | | (0.14 | ) | | | (3,221,941 | ) |
| | | | | | | | |
| Total net assets | | | 100.00 | % | | $ | 2,335,011,055 | |
| | | | | | | | |
TARGET 2025 FUND
| | | | | | | | | | | | |
| Security name | | | | | | Shares | | | Value | |
| | | | |
Affiliated Master Portfolios: 100.02% | | | | | | | | | | | | |
Wells Fargo Advantage Diversified Fixed Income Portfolio | | | | | | | N/A | | | $ | 745,640,151 | |
Wells Fargo Advantage Diversified Stock Portfolio | | | | | | | N/A | | | | 1,114,441,545 | |
Wells Fargo Advantage Short-Term Investment Portfolio | | | | | | | N/A | | | | 76,298,336 | |
| | | | |
Total Affiliated Master Portfolios (Cost $1,791,016,759) | | | | | | | | | | | 1,936,380,032 | |
| | | | | | | | | | | | |
| | | | | | | | |
| Total investments in securities | | | | | | | | |
| (Cost $1,791,016,759) * | | | 100.02 | % | | | 1,936,380,032 | |
Other assets and liabilities, net | | | (0.02 | ) | | | (339,789 | ) |
| | | | | | | | |
| Total net assets | | | 100.00 | % | | $ | 1,936,040,243 | |
| | | | | | | | |
TARGET 2030 FUND
| | | | | | | | | | | | |
| Security name | | | | | | Shares | | | Value | |
| | | | |
Affiliated Master Portfolios: 99.98% | | | | | | | | | | | | |
Wells Fargo Advantage Diversified Fixed Income Portfolio | | | | | | | N/A | | | $ | 537,357,728 | |
Wells Fargo Advantage Diversified Stock Portfolio | | | | | | | N/A | | | | 1,402,568,152 | |
Wells Fargo Advantage Short-Term Investment Portfolio | | | | | | | N/A | | | | 79,375,543 | |
| | | | |
Total Affiliated Master Portfolios (Cost $1,866,691,051) | | | | | | | | | | | 2,019,301,423 | |
| | | | | | | | | | | | |
| | | | | | | | |
| Total investments in securities | | | | | | | | |
| (Cost $1,866,691,051) * | | | 99.98 | % | | | 2,019,301,423 | |
Other assets and liabilities, net | | | 0.02 | | | | 478,557 | |
| | | | | | | | |
| Total net assets | | | 100.00 | % | | $ | 2,019,779,980 | |
| | | | | | | | |
| * | Cost for federal income tax purposes is substantially the same as for financial reporting purposes. |
The accompanying notes are an integral part of these financial statements.
| | | | | | |
| Portfolio of investments—August 31, 2012 (unaudited) | | Wells Fargo Advantage Dow Jones Target Date Funds | | | 25 | |
TARGET 2035 FUND
| | | | | | | | | | | | |
| Security name | | | | | | Shares | | | Value | |
| | | | |
Affiliated Master Portfolios: 100.01% | | | | | | | | | | | | |
Wells Fargo Advantage Diversified Fixed Income Portfolio | | | | | | | N/A | | | $ | 149,484,941 | |
Wells Fargo Advantage Diversified Stock Portfolio | | | | | | | N/A | | | | 717,553,209 | |
Wells Fargo Advantage Short-Term Investment Portfolio | | | | | | | N/A | | | | 35,401,731 | |
| | | | |
Total Affiliated Master Portfolios (Cost $839,411,302) | | | | | | | | | | | 902,439,881 | |
| | | | | | | | | | | | |
| | | | | | | | |
| Total investments in securities | | | | | | | | |
| (Cost $839,411,302) * | | | 100.01 | % | | | 902,439,881 | |
Other assets and liabilities, net | | | (0.01 | ) | | | (95,042 | ) |
| | | | | | | | |
| Total net assets | | | 100.00 | % | | $ | 902,344,839 | |
| | | | | | | | |
TARGET 2040 FUND
| | | | | | | | | | | | |
| Security name | | | | | | Shares | | | Value | |
| | | | |
Affiliated Master Portfolios: 99.86% | | | | | | | | | | | | |
Wells Fargo Advantage Diversified Fixed Income Portfolio | | | | | | | N/A | | | $ | 127,037,386 | |
Wells Fargo Advantage Diversified Stock Portfolio | | | | | | | N/A | | | | 1,164,070,945 | |
Wells Fargo Advantage Short-Term Investment Portfolio | | | | | | | N/A | | | | 52,638,086 | |
| | | | |
Total Affiliated Master Portfolios (Cost $1,241,106,038) | | | | | | | | | | | 1,343,746,417 | |
| | | | | | | | | | | | |
| | | | | | | | |
| Total investments in securities | | | | | | | | |
| (Cost $1,241,106,038) * | | | 99.86 | % | | | 1,343,746,417 | |
Other assets and liabilities, net | | | 0.14 | | | | 1,946,293 | |
| | | | | | | | |
| Total net assets | | | 100.00 | % | | $ | 1,345,692,710 | |
| | | | | | | | |
TARGET 2045 FUND
| | | | | | | | | | | | |
| Security name | | | | | | Shares | | | Value | |
| | | | | | | | | | | | |
| | | |
Affiliated Master Portfolios: 99.83% | | | | | | | | | | |
Wells Fargo Advantage Diversified Fixed Income Portfolio | | | | | | | N/A | | | $ | 26,962,568 | |
Wells Fargo Advantage Diversified Stock Portfolio | | | | | | | N/A | | | | 400,850,580 | |
Wells Fargo Advantage Short-Term Investment Portfolio | | | | | | | N/A | | | | 17,429,347 | |
| | | |
Total Affiliated Master Portfolios (Cost $415,977,709) | | | | | | | | | 445,242,495 | |
| | | | | | | | | | | | |
| | | | | | | | |
| Total investments in securities | | | | | | | | |
| (Cost $415,977,709) * | | | 99.83 | % | | | 445,242,495 | |
Other assets and liabilities, net | | | 0.17 | | | | 754,645 | |
| | | | | | | | |
| Total net assets | | | 100.00 | % | | $ | 445,997,140 | |
| | | | | | | | |
| * | Cost for federal income tax purposes is substantially the same as for financial reporting purposes. |
The accompanying notes are an integral part of these financial statements.
| | | | |
| 26 | | Wells Fargo Advantage Dow Jones Target Date Funds | | Portfolio of investments—August 31, 2012 (unaudited) |
TARGET 2050 FUND
| | | | | | | | | | | | |
| Security name | | | | | | Shares | | | Value | |
| | | | | | | | | | | | |
| | | |
Affiliated Master Portfolios: 99.72% | | | | | | | | | | |
Wells Fargo Advantage Diversified Fixed Income Portfolio | | | | | | | N/A | | | $ | 47,791,825 | |
Wells Fargo Advantage Diversified Stock Portfolio | | | | | | | N/A | | | | 740,501,882 | |
Wells Fargo Advantage Short-Term Investment Portfolio | | | | | | | N/A | | | | 32,113,970 | |
| | | |
Total Affiliated Master Portfolios (Cost $753,670,734) | | | | | | | | | 820,407,677 | |
| | | | | | | | | | | | |
| | | | | | | | |
| Total investments in securities | | | | | | | | |
| (Cost $753,670,734) * | | | 99.72 | % | | | 820,407,677 | |
Other assets and liabilities, net | | | 0.28 | | | | 2,290,774 | |
| | | | | | | | |
| Total net assets | | | 100.00 | % | | $ | 822,698,451 | |
| | | | | | | | |
TARGET 2055 FUND
| | | | | | | | | | | | |
| Security name | | | | | | Shares | | | Value | |
| | | | | | | | | | | | |
| | | |
Affiliated Master Portfolios: 100.59% | | | | | | | | | | |
Wells Fargo Advantage Diversified Fixed Income Portfolio | | | | | | | N/A | | | $ | 1,155,924 | |
Wells Fargo Advantage Diversified Stock Portfolio | | | | | | | N/A | | | | 17,910,251 | |
Wells Fargo Advantage Short-Term Investment Portfolio | | | | | | | N/A | | | | 776,729 | |
| | | |
Total Affiliated Master Portfolios (Cost $19,188,106) | | | | | | | | | 19,842,904 | |
| | | | | | | | | | | | |
| | | | | | | | |
| Total investments in securities | | | | | | | | |
| (Cost $19,188,106) * | | | 100.59 | % | | | 19,842,904 | |
Other assets and liabilities, net | | | (0.59 | ) | | | (115,601 | ) |
| | | | | | | | |
| Total net assets | | | 100.00 | % | | $ | 19,727,303 | |
| | | | | | | | |
| * | Cost for federal income tax purposes is substantially the same as for financial reporting purposes. |
The accompanying notes are an integral part of these financial statements.
This page is intentionally left blank.
| | | | |
| 28 | | Wells Fargo Advantage Dow Jones Target Date Funds | | Statements of assets and liabilities—August 31, 2012 (unaudited) |
| | | | | | | | | | | | | | | | |
| | | Target Today Fund | | | Target 2010 Fund | | | Target 2015 Fund | | | Target 2020 Fund | |
| | | | |
Assets | | | | | | | | | | | | | | | | |
Investments in affiliated Master Portfolios, at value (see cost below) | | $ | 989,146,163 | | | $ | 852,027,935 | | | $ | 856,591,697 | | | $ | 2,338,232,996 | |
Receivable for Fund shares sold | | | 1,117,188 | | | | 2,440,282 | | | | 1,810,717 | | | | 5,007,908 | |
Receivable from adviser | | | 0 | | | | 0 | | | | 0 | | | | 0 | |
Prepaid expenses and other assets | | | 47,660 | | | | 17,815 | | | | 50,693 | | | | 41,908 | |
| | | | | | | | | | | | | | | | |
Total assets | | | 990,311,011 | | | | 854,486,032 | | | | 858,453,107 | | | | 2,343,282,812 | |
| | | | | | | | | | | | | | | | |
| | | | |
Liabilities | | | | | | | | | | | | | | | | |
Payable for Fund shares redeemed | | | 1,161,509 | | | | 2,222,428 | | | | 1,558,587 | | | | 7,470,812 | |
Advisory fee payable | | | 44,467 | | | | 70,932 | | | | 55,041 | | | | 233,818 | |
Distribution fees payable | | | 3,607 | | | | 2,613 | | | | N/A | | | | 3,456 | |
Due to other related parties | | | 150,066 | | | | 127,483 | | | | 146,974 | | | | 338,174 | |
Shareholder servicing fees payable | | | 63,614 | | | | 73,876 | | | | 65,720 | | | | 169,708 | |
Accrued expenses and other liabilities | | | 30,866 | | | | 40,098 | | | | 38,833 | | | | 55,789 | |
| | | | | | | | | | | | | | | | |
Total liabilities | | | 1,454,129 | | | | 2,537,430 | | | | 1,865,155 | | | | 8,271,757 | |
| | | | | | | | | | | | | | | | |
Total net assets | | $ | 988,856,882 | | | $ | 851,948,602 | | | $ | 856,587,952 | | | $ | 2,335,011,055 | |
| | | | | | | | | | | | | | | | |
| | | | |
NET ASSETS CONSIST OF | | | | | | | | | | | | | | | | |
Paid-in capital | | $ | 914,143,357 | | | $ | 779,652,042 | | | $ | 794,478,850 | | | $ | 2,144,067,642 | |
Undistributed net investment income | | | 12,185,502 | | | | 2,841,240 | | | | 2,735,896 | | | | 6,618,264 | |
Accumulated net realized gains (losses) on investments | | | 4,223,797 | | | | (2,721,648 | ) | | | 5,890,549 | | | | 7,039,696 | |
Net unrealized gains on investments | | | 58,304,226 | | | | 72,176,968 | | | | 53,482,657 | | | | 177,285,453 | |
| | | | | | | | | | | | | | | | |
Total net assets | | $ | 988,856,882 | | | $ | 851,948,602 | | | $ | 856,587,952 | | | $ | 2,335,011,055 | |
| | | | | | | | | | | | | | | | |
| | | | |
COMPUTATION OF NET ASSET VALUE AND OFFERING PRICE PER SHARE1 | | | | | | | | | | | | | | | | |
Net assets – Class A | | $ | 20,769,884 | | | $ | 37,739,113 | | | | N/A | | | $ | 73,155,229 | |
Shares outstanding – Class A | | | 1,878,637 | | | | 2,820,741 | | | | N/A | | | | 5,127,639 | |
Net asset value per share – Class A | | | $11.06 | | | | $13.38 | | | | N/A | | | | $14.27 | |
Maximum offering price per share – Class A2 | | | $11.73 | | | | $14.20 | | | | N/A | | | | $15.14 | |
Net assets – Class B | | $ | 145,398 | | | $ | 563,226 | | | | N/A | | | $ | 726,511 | |
Shares outstanding – Class B | | | 12,781 | | | | 41,743 | | | | N/A | | | | 51,172 | |
Net asset value per share – Class B | | | $11.38 | | | | $13.49 | | | | N/A | | | | $14.20 | |
Net assets – Class C | | $ | 5,031,106 | | | $ | 3,264,814 | | | | N/A | | | $ | 4,205,284 | |
Shares outstanding – Class C | | | 446,774 | | | | 240,838 | | | | N/A | | | | 295,708 | |
Net asset value per share – Class C | | | $11.26 | | | | $13.56 | | | | N/A | | | | $14.22 | |
Net assets – Administrator Class | | $ | 137,250,601 | | | $ | 213,587,290 | | | $ | 92,328,707 | | | $ | 490,461,019 | |
Shares outstanding – Administrator Class | | | 12,173,185 | | | | 15,818,273 | | | | 9,100,834 | | | | 33,918,848 | |
Net asset value per share – Administrator Class | | | $11.27 | | | | $13.50 | | | | $10.15 | | | | $14.46 | |
Net assets – Institutional Class | | $ | 713,697,354 | | | $ | 534,531,124 | | | $ | 573,604,034 | | | $ | 1,608,809,385 | |
Shares outstanding – Institutional Class | | | 63,078,857 | | | | 39,569,542 | | | | 57,177,898 | | | | 110,982,092 | |
Net asset value per share – Institutional Class | | | $11.31 | | | | $13.51 | | | | $10.03 | | | | $14.50 | |
Net assets – Investor Class | | $ | 111,962,539 | | | $ | 62,263,035 | | | $ | 190,655,211 | | | $ | 157,653,627 | |
Shares outstanding – Investor Class | | | 9,947,389 | | | | 4,620,133 | | | | 18,769,126 | | | | 10,910,545 | |
Net asset value per share – Investor Class | | | $11.26 | | | | $13.48 | | | | $10.16 | | | | $14.45 | |
| | | | |
Investments in affiliated Master Portfolios, at cost | | $ | 930,841,937 | | | $ | 779,850,967 | | | $ | 803,109,040 | | | $ | 2,160,947,543 | |
| | | | | | | | | | | | | | | | |
| 1. | Each Fund has an unlimited number of authorized shares. |
| 2. | Maximum offering price is computed as 100/94.25 of net asset value. On investments of $50,000 or more, the offering price is reduced. |
The accompanying notes are an integral part of these financial statements.
| | | | | | |
| Statements of assets and liabilities—August 31, 2012 (unaudited) | | Wells Fargo Advantage Dow Jones Target Date Funds | | | 29 | |
| | | | | | | | | | | | | | | | | | | | | | | | | | |
Target 2025 Fund | | | Target 2030 Fund | | | Target 2035 Fund | | | Target 2040 Fund | | | Target 2045 Fund | | | Target 2050 Fund | | | Target 2055 Fund | |
| | | | | | |
| | | | | | | | | | | | | | | | | | | | | | | | | | |
| $ | 1,936,380,032 | | | $ | 2,019,301,423 | | | $ | 902,439,881 | | | $ | 1,343,746,417 | | | $ | 445,242,495 | | | $ | 820,407,677 | | | $ | 19,842,904 | |
| | 3,103,564 | | | | 6,084,702 | | | | 1,773,758 | | | | 5,200,328 | | | | 1,686,097 | | | | 3,942,956 | | | | 214,806 | |
| | 0 | | | | 0 | | | | 0 | | | | 0 | | | | 0 | | | | 0 | | | | 9,194 | |
| | 42,541 | | | | 64,629 | | | | 57,707 | | | | 83,856 | | | | 56,807 | | | | 40,752 | | | | 27,793 | |
| | | | | | | | | | | | | | | | | | | | | | | | | | |
| | 1,939,526,137 | | | | 2,025,450,754 | | | | 904,271,346 | | | | 1,349,030,601 | | | | 446,985,399 | | | | 824,391,385 | | | | 20,094,697 | |
| | | | | | | | | | | | | | | | | | | | | | | | | | |
| | | | | | |
| | | | | | | | | | | | | | | | | | | | | | | | | | |
| | 2,873,302 | | | | 4,977,405 | | | | 1,572,085 | | | | 2,849,825 | | | | 811,092 | | | | 1,445,687 | | | | 346,062 | |
| | 150,994 | | | | 207,067 | | | | 68,854 | | | | 144,740 | | | | 23,978 | | | | 77,855 | | | | 0 | |
| | N/A | | | | 2,710 | | | | N/A | | | | 3,157 | | | | N/A | | | | N/A | | | | N/A | |
| | 310,029 | | | | 291,526 | | | | 169,480 | | | | 200,083 | | | | 86,232 | | | | 108,173 | | | | 2,589 | |
| | 107,270 | | | | 143,861 | | | | 83,444 | | | | 102,321 | | | | 43,924 | | | | 31,240 | | | | 740 | |
| | 44,299 | | | | 48,205 | | | | 32,644 | | | | 37,765 | | | | 23,033 | | | | 29,979 | | | | 18,003 | |
| | | | | | | | | | | | | | | | | | | | | | | | | | |
| | 3,485,894 | | | | 5,670,774 | | | | 1,926,507 | | | | 3,337,891 | | | | 988,259 | | | | 1,692,934 | | | | 367,394 | |
| | | | | | | | | | | | | | | | | | | | | | | | | | |
| $ | 1,936,040,243 | | | $ | 2,019,779,980 | | | $ | 902,344,839 | | | $ | 1,345,692,710 | | | $ | 445,997,140 | | | $ | 822,698,451 | | | $ | 19,727,303 | |
| | | | | | | | | | | | | | | | | | | | | | | | | | |
| | | | | | |
| | | | | | | | | | | | | | | | | | | | | | | | | | |
| $ | 1,758,326,594 | | | $ | 1,850,158,370 | | | $ | 828,694,634 | | | $ | 1,229,959,307 | | | $ | 412,902,149 | | | $ | 745,504,615 | | | $ | 18,913,695 | |
| | 4,940,031 | | | | 4,650,886 | | | | 1,991,215 | | | | 2,468,750 | | | | 965,897 | | | | 1,612,985 | | | | 58,061 | |
| | 27,410,345 | | | | 12,360,352 | | | | 8,630,411 | | | | 10,624,274 | | | | 2,864,308 | | | | 8,843,908 | | | | 100,749 | |
| | 145,363,273 | | | | 152,610,372 | | | | 63,028,579 | | | | 102,640,379 | | | | 29,264,786 | | | | 66,736,943 | | | | 654,798 | |
| | | | | | | | | | | | | | | | | | | | | | | | | | |
| | $1,936,040,243 | | | $ | 2,019,779,980 | | | $ | 902,344,839 | | | $ | 1,345,692,710 | | | $ | 445,997,140 | | | $ | 822,698,451 | | | $ | 19,727,303 | |
| | | | | | | | | | | | | | | | | | | | | | | | | | |
| | | | | | |
| | | | | | | | | | | | | | | | | | | | | | | | | | |
| | N/A | | | $ | 57,118,807 | | | | N/A | | | $ | 98,694,238 | | | | N/A | | | | N/A | | | | N/A | |
| | N/A | | | | 3,904,412 | | | | N/A | | | | 6,225,269 | | | | N/A | | | | N/A | | | | N/A | |
| | N/A | | | | $14.63 | | | | N/A | | | | $15.85 | | | | N/A | | | | N/A | | | | N/A | |
| | N/A | | | | $15.52 | | | | N/A | | | | $16.82 | | | | N/A | | | | N/A | | | | N/A | |
| | N/A | | | $ | 610,013 | | | | N/A | | | $ | 943,159 | | | | N/A | | | | N/A | | | | N/A | |
| | N/A | | | | 42,365 | | | | N/A | | | | 62,190 | | | | N/A | | | | N/A | | | | N/A | |
| | N/A | | | | $14.40 | | | | N/A | | | | $15.17 | | | | N/A | | | | N/A | | | | N/A | |
| | N/A | | | $ | 3,289,769 | | | | N/A | | | $ | 3,587,254 | | | | N/A | | | | N/A | | | | N/A | |
| | N/A | | | | 229,531 | | | | N/A | | | | 238,511 | | | | N/A | | | | N/A | | | | N/A | |
| | N/A | | | | $14.33 | | | | N/A | | | | $15.04 | | | | N/A | | | | N/A | | | | N/A | |
| $ | 127,761,999 | | | $ | 417,132,954 | | | $ | 88,657,282 | | | $ | 262,777,976 | | | $ | 44,868,940 | | | $ | 100,657,161 | | | $ | 2,686,907 | |
| | 13,159,833 | | | | 28,182,151 | | | | 9,402,036 | | | | 16,300,396 | | | | 4,742,200 | | | | 11,060,450 | | | | 270,244 | |
| | $9.71 | | | | $14.80 | | | | $9.43 | | | | $16.12 | | | | $9.46 | | | | $9.10 | | | | $9.94 | |
| $ | 1,471,696,240 | | | $ | 1,403,058,680 | | | $ | 540,483,578 | | | $ | 906,906,016 | | | $ | 254,674,350 | | | $ | 688,482,861 | | | $ | 16,579,567 | |
| | 151,958,178 | | | | 94,790,045 | | | | 57,481,779 | | | | 56,156,545 | | | | 27,066,930 | | | | 75,912,782 | | | | 1,667,312 | |
| | $9.68 | | | | $14.80 | | | | $9.40 | | | | $16.15 | | | | $9.41 | | | | $9.07 | | | | $9.94 | |
| $ | 336,582,004 | | | $ | 138,569,757 | | | $ | 273,203,979 | | | $ | 72,784,067 | | | $ | 146,453,850 | | | $ | 33,558,429 | | | $ | 460,829 | |
| | 34,719,867 | | | | 9,383,133 | | | | 28,891,905 | | | | 4,521,570 | | | | 15,433,671 | | | | 3,697,240 | | | | 46,727 | |
| | $9.69 | | | | $14.77 | | | | $9.46 | | | | $16.10 | | | | $9.49 | | | | $9.08 | | | | $9.86 | |
| | | | | | |
| $ | 1,791,016,759 | | | $ | 1,866,691,051 | | | $ | 839,411,302 | | | $ | 1,241,106,038 | | | $ | 415,977,709 | | | $ | 753,670,734 | | | $ | 19,188,106 | |
| | | | | | | | | | | | | | | | | | | | | | | | | | |
The accompanying notes are an integral part of these financial statements.
| | | | |
| 30 | | Wells Fargo Advantage Dow Jones Target Date Funds | | Statements of operations—six months ended August 31, 2012 (unaudited) |
| | | | | | | | | | | | | | | | |
| | | Target Today
Fund | | | Target 2010
Fund | | | Target 2015
Fund | | | Target 2020
Fund | |
| | | | |
Investment income | | | | | | | | | | | | | | | | |
Dividends allocated from affiliated Master Portfolios* | | $ | 1,783,259 | | | $ | 2,222,428 | | | $ | 3,240,472 | | | $ | 12,542,107 | |
Interest allocated from affiliated Master Portfolios** | | | 10,291,994 | | | | 8,700,779 | | | | 7,165,955 | | | | 16,339,063 | |
Expenses allocated from affiliated Master Portfolios | | | (1,329,256 | ) | | | (1,206,151 | ) | | | (1,181,170 | ) | | | (3,369,660 | ) |
Waivers allocated from affiliated Master Portfolios | | | 92,005 | | | | 91,925 | | | | 103,628 | | | | 337,077 | |
| | | | | | | | | | | | | | | | |
Total investment income | | | 10,838,002 | | | | 9,808,981 | | | | 9,328,885 | | | | 25,848,587 | |
| | | | | | | | | | | | | | | | |
| | | | |
Expenses | | | | | | | | | | | | | | | | |
Advisory fee | | | 1,187,647 | | | | 1,055,364 | | | | 1,012,971 | | | | 2,601,394 | |
Administration fees | | | | | | | | | | | | | | | | |
Fund level | | | 247,046 | | | | 218,289 | | | | 209,074 | | | | 582,784 | |
Class A | | | 28,086 | | | | 51,236 | | | | N/A | | | | 97,667 | |
Class B | | | 251 | | | | 825 | | | | N/A | | | | 1,053 | |
Class C | | | 6,651 | | | | 4,300 | | | | N/A | | | | 5,706 | |
Administrator Class | | | 66,862 | | | | 103,984 | | | | 46,198 | | | | 247,586 | |
Institutional Class | | | 286,739 | | | | 223,891 | | | | 225,035 | | | | 641,556 | |
Investor Class | | | 178,916 | | | | 100,401 | | | | 292,891 | | | | 245,248 | |
Shareholder servicing fees | | | | | | | | | | | | | | | | |
Class A | | | 27,006 | | | | 49,265 | | | | N/A | | | | 93,084 | |
Class B | | | 242 | | | | 794 | | | | N/A | | | | 1,012 | |
Class C | | | 6,396 | | | | 4,135 | | | | N/A | | | | 5,487 | |
Administrator Class | | | 167,154 | | | | 259,961 | | | | 115,495 | | | | 618,965 | |
Investor Class | | | 138,376 | | | | 77,637 | | | | 226,639 | | | | 189,689 | |
Distribution fees | | | | | | | | | | | | | | | | |
Class B | | | 725 | | | | 2,381 | | | | N/A | | | | 3,037 | |
Class C | | | 19,187 | | | | 12,403 | | | | N/A | | | | 16,460 | |
Custody and accounting fees | | | 18,536 | | | | 16,499 | | | | 15,854 | | | | 44,528 | |
Professional fees | | | 8,626 | | | | 9,726 | | | | 11,222 | | | | 9,823 | |
Registration fees | | | 62,284 | | | | 45,710 | | | | 45,213 | | | | 64,835 | |
Shareholder report expenses | | | 20,972 | | | | 2,274 | | | | 14,506 | | | | 39,337 | |
Trustees’ fees and expenses | | | 6,388 | | | | 6,143 | | | | 6,143 | | | | 6,143 | |
Other fees and expenses | | | 9,247 | | | | 17,864 | | | | 11,437 | | | | 21,316 | |
| | | | | | | | | | | | | | | | |
Total expenses | | | 2,487,337 | | | | 2,263,082 | | | | 2,232,678 | | | | 5,536,710 | |
Less: Fee waivers and/or expense reimbursements | | | (952,043 | ) | | | (665,121 | ) | | | (727,917 | ) | | | (1,339,474 | ) |
| | | | | | | | | | | | | | | | |
Net expenses | | | 1,535,294 | | | | 1,597,961 | | | | 1,504,761 | | | | 4,197,236 | |
| | | | | | | | | | | | | | | | |
Net investment income | | | 9,302,708 | | | | 8,211,020 | | | | 7,824,124 | | | | 21,651,351 | |
| | | | | | | | | | | | | | | | |
| | | | |
REALIZED AND UNREALIZED GAINS (LOSSES) ON INVESTMENTS | | | | | | | | | | | | | | | | |
Net realized gains from securities transaction allocated from affiliated Master Portfolios | | | 4,719,304 | | | | 4,954,148 | | | | 5,783,831 | | | | 19,801,608 | |
Net change in unrealized gains (losses) from securities transactions allocated from affiliated Master Portfolios | | | 5,230,798 | | | | 2,292,570 | | | | (593,818 | ) | | | (16,942,157 | ) |
| | | | | | | | | | | | | | | | |
Net realized and unrealized gains (losses) on investments | | | 9,950,102 | | | | 7,246,718 | | | | 5,190,013 | | | | 2,859,451 | |
| | | | | | | | | | | | | | | | |
Net increase (decrease) in net assets resulting from operations | | $ | 19,252,810 | | | $ | 15,457,738 | | | $ | 13,014,137 | | | $ | 24,510,802 | |
| | �� | | | | | | | | | | | | | | |
| | | | |
* Net of foreign dividend withholding taxes allocated from affiliated Master Portfolios of | | | $104,076 | | | | $129,994 | | | | $188,950 | | | | $734,044 | |
| | | | |
** Net of foreign interest withholding taxes allocated from affiliated Master Portfolios of | | | $114,538 | | | | $96,279 | | | | $78,740 | | | | $176,720 | |
The accompanying notes are an integral part of these financial statements.
| | | | | | |
| Statements of operations—six months ended August 31, 2012 (unaudited) | | Wells Fargo Advantage Dow Jones Target Date Funds | | | 31 | |
| | | | | | | | | | | | | | | | | | | | | | | | |
Target 2025
Fund | | Target 2030
Fund | | | Target 2035
Fund | | | Target 2040
Fund | | | Target 2045
Fund | | | Target 2050
Fund | | | Target 2055
Fund | |
| | | | | | |
| | | | | | | | | | | | | | | | | | | | | | | | |
| $13,252,292 | | $ | 16,803,660 | | | $ | 8,267,249 | | | $ | 13,889,388 | | | $ | 4,461,648 | | | $ | 8,748,610 | | | $ | 178,400 | |
| 10,367,716 | | | 7,796,086 | | | | 2,244,616 | | | | 2,251,429 | | | | 526,653 | | | | 1,007,616 | | | | 20,769 | |
| (2,837,288) | | | (3,031,987 | ) | | | (1,328,104 | ) | | | (2,065,895 | ) | | | (646,764 | ) | | | (1,259,864 | ) | | | (26,157 | ) |
| 317,979 | | | 372,932 | | | | 175,104 | | | | 284,937 | | | | 90,968 | | | | 177,432 | | | | 3,681 | |
| | | | | | | | | | | | | | | | | | | | | | | | |
| 21,100,699 | | | 21,940,691 | | | | 9,358,865 | | | | 14,359,859 | | | | 4,432,505 | | | | 8,673,794 | | | | 176,693 | |
| | | | | | | | | | | | | | | | | | | | | | | | |
| | | | | | |
| | | | | | | | | | | | | | | | | | | | | | | | |
| 2,166,939 | | | 2,258,765 | | | | 1,042,624 | | | | 1,544,914 | | | | 514,979 | | | | 974,820 | | | | 20,783 | |
| | | | | | | | | | | | | | | | | | | | | | | | |
| 479,343 | | | 501,206 | | | | 215,520 | | | | 331,242 | | | | 102,996 | | | | 200,780 | | | | 4,156 | |
| N/A | | | 77,028 | | | | N/A | | | | 132,101 | | | | N/A | | | | N/A | | | | N/A | |
| N/A | | | 884 | | | | N/A | | | | 1,501 | | | | N/A | | | | N/A | | | | N/A | |
| N/A | | | 4,237 | | | | N/A | | | | 4,708 | | | | N/A | | | | N/A | | | | N/A | |
| 61,295 | | | 207,641 | | | | 41,748 | | | | 132,932 | | | | 21,214 | | | | 48,428 | | | | 1,207 | |
| 588,362 | | | 557,749 | | | | 207,193 | | | | 353,671 | | | | 95,392 | | | | 270,106 | | | | 5,524 | |
| 523,327 | | | 213,280 | | | | 421,106 | | | | 110,755 | | | | 211,699 | | | | 50,083 | | | | 652 | |
| | | | | | | | | | | | | | | | | | | | | | | | |
| N/A | | | 72,916 | | | | N/A | | | | 127,020 | | | | N/A | | | | N/A | | | | N/A | |
| N/A | | | 850 | | | | N/A | | | | 1,443 | | | | N/A | | | | N/A | | | | N/A | |
| N/A | | | 4,074 | | | | N/A | | | | 4,527 | | | | N/A | | | | N/A | | | | N/A | |
| 153,238 | | | 519,103 | | | | 104,370 | | | | 332,330 | | | | 53,035 | | | | 121,070 | | | | 3,017 | |
| 404,846 | | | 164,973 | | | | 325,751 | | | | 85,668 | | | | 163,844 | | | | 38,746 | | | | 505 | |
| | | | | | | | | | | | | | | | | | | | | | | | |
| N/A | | | 2,551 | | | | N/A | | | | 4,329 | | | | N/A | | | | N/A | | | | N/A | |
| N/A | | | 12,221 | | | | N/A | | | | 13,581 | | | | N/A | | | | N/A | | | | N/A | |
| 36,663 | | | 38,423 | | | | 16,310 | | | | 25,277 | | | | 8,371 | | | | 16,120 | | | | 1,021 | |
| 9,197 | | | 8,520 | | | | 9,144 | | | | 8,569 | | | | 10,797 | | | | 8,787 | | | | 9,466 | |
| 40,379 | | | 67,247 | | | | 50,383 | | | | 59,758 | | | | 45,020 | | | | 42,320 | | | | 30,875 | |
| 27,940 | | | 30,273 | | | | 17,301 | | | | 26,414 | | | | 12,560 | | | | 12,894 | | | | 7,989 | |
| 6,352 | | | 6,371 | | | | 5,419 | | | | 6,390 | | | | 6,631 | | | | 5,419 | | | | 6,381 | |
| 19,154 | | | 25,679 | | | | 7,224 | | | | 24,466 | | | | 5,625 | | | | 15,054 | | | | 4,064 | |
| | | | | | | | | | | | | | | | | | | | | | | | |
| 4,517,035 | | | 4,773,991 | | | | 2,464,093 | | | | 3,331,596 | | | | 1,252,163 | | | | 1,804,627 | | | | 95,640 | |
| (1,364,434) | | | (1,147,531 | ) | | | (695,336 | ) | | | (772,672 | ) | | | (393,851 | ) | | | (565,906 | ) | | | (69,837 | ) |
| | | | | | | | | | | | | | | | | | | | | | | | |
| 3,152,601 | | | 3,626,460 | | | | 1,768,757 | | | | 2,558,924 | | | | 858,312 | | | | 1,238,721 | | | | 25,803 | |
| | | | | | | | | | | | | | | | | | | | | | | | |
| 17,948,098 | | | 18,314,231 | | | | 7,590,108 | | | | 11,800,935 | | | | 3,574,193 | | | | 7,435,073 | | | | 150,890 | |
| | | | | | | | | | | | | | | | | | | | | | | | |
| | | | | | |
| | | | | | | | | | | | | | | | | | | | | | | | |
19,354,729 | | | 23,180,720 | | | | 10,920,952 | | | | 18,185,771 | | | | 5,652,228 | | | | 11,369,696 | | | | 196,734 | |
(25,065,652) | | | (38,310,123 | ) | | | (19,076,720 | ) | | | (36,148,295 | ) | | | (10,191,243 | ) | | | (22,704,058 | ) | | | (203,354 | ) |
| | | | | | | | | | | | | | | | | | | | | | | | |
| (5,710,923) | | | (15,129,403 | ) | | | (8,155,768 | ) | | | (17,962,524 | ) | | | (4,539,015 | ) | | | (11,334,362 | ) | | | (6,620 | ) |
| | | | | | | | | | | | | | | | | | | | | | | | |
| $12,237,175 | | $ | 3,184,828 | | | $ | (565,660 | ) | | $ | (6,161,589 | ) | | $ | (964,822 | ) | | $ | (3,899,289 | ) | | $ | 144,270 | |
| | | | | | | | | | | | | | | | | | | | | | | | |
| | | | | | |
$774,975 | | | $984,658 | | | | $482,847 | | | | $813,366 | | | | $259,893 | | | | $511,683 | | | | $10,373 | |
| | | | | | |
$109,711 | | | $79,124 | | | | $21,197 | | | | $18,556 | | | | $3,880 | | | | $7,201 | | | | $222 | |
The accompanying notes are an integral part of these financial statements.
| | | | |
| 32 | | Wells Fargo Advantage Dow Jones Target Date Funds | | Statements of changes in net assets |
| | | | | | | | | | | | | | | | |
| | | Target Today Fund | |
| | | Six months ended
August 31, 2012
(unaudited) | | | Year ended
February 29, 2012 | |
| | | | |
Operations | | | | | | | | | | | | | | | | |
Net investment income | | | | | | $ | 9,302,708 | | | | | | | $ | 18,103,832 | |
Net realized gains on investments | | | | | | | 4,719,304 | | | | | | | | 8,341,557 | |
Net change in unrealized gains (losses) on investments | | | | | | | 5,230,798 | | | | | | | | 24,384,374 | |
| | | | | | | | | | | | | | | | |
Net increase in net assets resulting from operations | | | | | | | 19,252,810 | | | | | | | | 50,829,763 | |
| | | | | | | | | | | | | | | | |
| | | | |
Distributions to shareholders from | | | | | | | | | | | | | | | | |
Net investment income | | | | | | | | | | | | | | | | |
Class A | | | | | | | 0 | | | | | | | | (441,335 | ) |
Class B | | | | | | | 0 | | | | | | | | (4,159 | ) |
Class C | | | | | | | 0 | | | | | | | | (64,594 | ) |
Administrator Class | | | | | | | 0 | | | | | | | | (2,169,932 | ) |
Institutional Class | | | | | | | 0 | | | | | | | | (15,982,869 | ) |
Investor Class | | | | | | | 0 | | | | | | | | (2,025,777 | ) |
Net realized gains | | | | | | | | | | | | | | | | |
Class A | | | | | | | 0 | | | | | | | | (104,048 | ) |
Class B | | | | | | | 0 | | | | | | | | (1,566 | ) |
Class C | | | | | | | 0 | | | | | | | | (20,300 | ) |
Administrator Class | | | | | | | 0 | | | | | | | | (576,823 | ) |
Institutional Class | | | | | | | 0 | | | | | | | | (3,244,184 | ) |
Investor Class | | | | | | | 0 | | | | | | | | (491,552 | ) |
| | | | | | | | | | | | | | | | |
Total distributions to shareholders | | | | | | | 0 | | | | | | | | (25,127,139 | ) |
| | | | | | | | | | | | | | | | |
| | | | |
Capital share transactions | | | Shares | | | | | | | | Shares | | | | | |
Proceeds from shares sold | | | | | | | | | | | | | | | | |
Class A | | | 40,466 | | | | 439,494 | | | | 168,406 | | | | 1,795,452 | |
Class B | | | 0 | | | | 0 | | | | 2,245 | | | | 24,943 | |
Class C | | | 10,145 | | | | 112,424 | | | | 45,022 | | | | 493,549 | |
Administrator Class | | | 4,184,374 | | | | 46,140,880 | | | | 7,057,884 | | | | 76,983,266 | |
Institutional Class | | | 9,966,373 | | | | 110,804,633 | | | | 24,106,220 | | | | 262,973,342 | |
Investor Class | | | 1,613,591 | | | | 17,838,958 | | | | 3,935,267 | | | | 42,864,180 | |
| | | | | | | | | | | | | | | | |
| | | | | | | 175,336,389 | | | | | | | | 385,134,732 | |
| | | | | | | | | | | | | | | | |
Reinvestment of distributions | | | | | | | | | | | | | | | | |
Class A | | | 0 | | | | 0 | | | | 49,084 | | | | 521,304 | |
Class B | | | 0 | | | | 0 | | | | 478 | | | | 5,247 | |
Class C | | | 0 | | | | 0 | | | | 6,518 | | | | 70,790 | |
Administrator Class | | | 0 | | | | 0 | | | | 252,838 | | | | 2,732,704 | |
Institutional Class | | | 0 | | | | 0 | | | | 1,771,367 | | | | 19,181,020 | |
Investor Class | | | 0 | | | | 0 | | | | 231,752 | | | | 2,503,548 | |
| | | | | | | | | | | | | | | | |
| | | | | | | 0 | | | | | | | | 25,014,613 | |
| | | | | | | | | | | | | | | | |
Payment for shares redeemed | | | | | | | | | | | | | | | | |
Class A | | | (170,922 | ) | | | (1,855,582 | ) | | | (374,359 | ) | | | (3,998,157 | ) |
Class B | | | (8,799 | ) | | | (98,804 | ) | | | (60,772 | ) | | | (665,251 | ) |
Class C | | | (22,561 | ) | | | (250,373 | ) | | | (112,210 | ) | | | (1,222,396 | ) |
Administrator Class | | | (3,023,108 | ) | | | (33,535,023 | ) | | | (3,480,359 | ) | | | (37,943,656 | ) |
Institutional Class | | | (10,083,298 | ) | | | (111,776,285 | ) | | | (16,593,030 | ) | | | (181,239,502 | ) |
Investor Class | | | (1,418,054 | ) | | | (15,690,018 | ) | | | (2,497,613 | ) | | | (27,176,832 | ) |
| | | | | | | | | | | | | | | | |
| | | | | | | (163,206,085 | ) | | | | | | | (252,245,794 | ) |
| | | | | | | | | | | | | | | | |
Net increase in net assets resulting from capital share transactions | | | | | | | 12,130,304 | | | | | | | | 157,903,551 | |
| | | | | | | | | | | | | | | | |
Total increase in net assets | | | | | | | 31,383,114 | | | | | | | | 183,606,175 | |
| | | | | | | | | | | | | | | | |
| | | | |
Net assets | | | | | | | | | | | | | | | | |
Beginning of period | | | | | | | 957,473,768 | | | | | | | | 773,867,593 | |
| | | | | | | | | | | | | | | | |
End of period | | | | | | $ | 988,856,882 | | | | | | | $ | 957,473,768 | |
| | | | | | | | | | | | | | | | |
Undistributed net investment income | | | | | | $ | 12,185,502 | | | | | | | $ | 2,882,794 | |
| | | | | | | | | | | | | | | | |
The accompanying notes are an integral part of these financial statements.
| | | | | | |
| Statements of changes in net assets | | Wells Fargo Advantage Dow Jones Target Date Funds | | | 33 | |
| | | | | | | | | | | | | | | | |
| | | Target 2010 Fund | |
| | | Six months ended August 31, 2012 (unaudited) | | | Year ended
February 29, 2012 | |
| | | | |
Operations | | | | | | | | | | | | | | | | |
Net investment income | | | | | | $ | 8,211,020 | | | | | | | $ | 16,483,214 | |
Net realized gains on investments | | | | | | | 4,954,148 | | | | | | | | 15,053,302 | |
Net change in unrealized gains (losses) on investments | | | | | | | 2,292,570 | | | | | | | | 12,894,935 | |
| | | | | | | | | | | | | | | | |
Net increase in net assets resulting from operations | | | | | | | 15,457,738 | | | | | | | | 44,431,451 | |
| | | | | | | | | | | | | | | | |
| | | | |
Distributions to shareholders from | | | | | | | | | | | | | | | | |
Net investment income | | | | | | | | | | | | | | | | |
Class A | | | | | | | (281,316 | ) | | | | | | | (749,683 | ) |
Class B | | | | | | | (1,808 | ) | | | | | | | (7,890 | ) |
Class C | | | | | | | (12,097 | ) | | | | | | | (34,986 | ) |
Administrator Class | | | | | | | (1,838,604 | ) | | | | | | | (3,902,589 | ) |
Institutional Class | | | | | | | (5,100,246 | ) | | | | | | | (12,535,694 | ) |
Investor Class | | | | | | | (478,907 | ) | | | | | | | (1,101,774 | ) |
| | | | | | | | | | | | | | | | |
Total distributions to shareholders | | | | | | | (7,712,978 | ) | | | | | | | (18,332,616 | ) |
| | | | | | | | | | | | | | | | |
| | | | |
Capital share transactions | | | Shares | | | | | | | | Shares | | | | | |
Proceeds from shares sold | | | | | | | | | | | | | | | | |
Class A | | | 45,484 | | | | 600,399 | | | | 280,753 | | | | 3,633,637 | |
Class B | | | 2,622 | | | | 35,109 | | | | 17,300 | | | | 225,174 | |
Class C | | | 17,443 | | | | 234,455 | | | | 53,291 | | | | 701,285 | |
Administrator Class | | | 4,417,541 | | | | 58,663,779 | | | | 4,708,663 | | | | 61,663,211 | |
Institutional Class | | | 6,524,246 | | | | 87,090,541 | | | | 18,322,991 | | | | 239,627,102 | |
Investor Class | | | 607,739 | | | | 8,091,839 | | | | 1,306,415 | | | | 17,057,568 | |
| | | | | | | | | | | | | | | | |
| | | | | | | 154,716,122 | | | | | | | | 322,907,977 | |
| | | | | | | | | | | | | | | | |
Reinvestment of distributions | | | | | | | | | | | | | | | | |
Class A | | | 20,918 | | | | 272,358 | | | | 55,380 | | | | 711,007 | |
Class B | | | 132 | | | | 1,734 | | | | 541 | | | | 6,994 | |
Class C | | | 891 | | | | 11,767 | | | | 2,538 | | | | 33,021 | |
Administrator Class | | | 140,031 | | | | 1,838,604 | | | | 301,246 | | | | 3,902,521 | |
Institutional Class | | | 386,114 | | | | 5,069,678 | | | | 962,393 | | | | 12,460,453 | |
Investor Class | | | 36,508 | | | | 478,618 | | | | 84,570 | | | | 1,093,167 | |
| | | | | | | | | | | | | | | | |
| | | | | | | 7,672,759 | | | | | | | | 18,207,163 | |
| | | | | | | | | | | | | | | | |
Payment for shares redeemed | | | | | | | | | | | | | | | | |
Class A | | | (238,535 | ) | | | (3,150,193 | ) | | | (657,988 | ) | | | (8,540,611 | ) |
Class B | | | (16,942 | ) | | | (225,134 | ) | | | (81,141 | ) | | | (1,052,552 | ) |
Class C | | | (24,741 | ) | | | (331,614 | ) | | | (47,676 | ) | | | (623,957 | ) |
Administrator Class | | | (2,999,360 | ) | | | (40,026,546 | ) | | | (5,545,086 | ) | | | (72,609,821 | ) |
Institutional Class | | | (9,422,029 | ) | | | (125,560,457 | ) | | | (12,306,521 | ) | | | (161,054,673 | ) |
Investor Class | | | (648,188 | ) | | | (8,625,535 | ) | | | (910,036 | ) | | | (11,906,175 | ) |
| | | | | | | | | | | | | | | | |
| | | | | | | (177,919,479 | ) | | | | | | | (255,787,789 | ) |
| | | | | | | | | | | | | | | | |
Net increase (decrease) in net assets resulting from capital share transactions | | | | | | | (15,530,598 | ) | | | | | | | 85,327,351 | |
| | | | | | | | | | | | | | | | |
Total increase (decrease) in net assets | | | | | | | (7,785,838 | ) | | | | | | | 111,426,186 | |
| | | | | | | | | | | | | | | | |
| | | | |
Net assets | | | | | | | | | | | | | | | | |
Beginning of period | | | | | | | 859,734,440 | | | | | | | | 748,308,254 | |
| | | | | | | | | | | | | | | | |
End of period | | | | | | $ | 851,948,602 | | | | | | | $ | 859,734,440 | |
| | | | | | | | | | | | | | | | |
Undistributed net investment income | | | | | | $ | 2,841,240 | | | | | | | $ | 2,343,198 | |
| | | | | | | | | | | | | | | | |
The accompanying notes are an integral part of these financial statements.
| | | | |
| 34 | | Wells Fargo Advantage Dow Jones Target Date Funds | | Statements of changes in net assets |
| | | | | | | | | | | | | | | | |
| | | Target 2015 Fund | |
| | | Six months ended August 31, 2012 (unaudited) | | | Year ended
February 29, 2012 | |
| | | | |
Operations | | | | | | | | | | | | | | | | |
Net investment income | | | | | | $ | 7,824,124 | | | | | | | $ | 12,922,382 | |
Net realized gains on investments | | | | | | | 5,783,831 | | | | | | | | 9,565,632 | |
Net change in unrealized gains (losses) on investments | | | | | | | (593,818 | ) | | | | | | | 12,592,961 | |
| | | | | | | | | | | | | | | | |
Net increase in net assets resulting from operations | | | | | | | 13,014,137 | | | | | | | | 35,080,975 | |
| | | | | | | | | | | | | | | | |
| | | | |
Distributions to shareholders from | | | | | | | | | | | | | | | | |
Net investment income | | | | | | | | | | | | | | | | |
Administrator Class | | | | | | | (845,298 | ) | | | | | | | (1,259,319 | ) |
Institutional Class | | | | | | | (5,806,352 | ) | | | | | | | (9,219,251 | ) |
Investor Class | | | | | | | (1,546,781 | ) | | | | | | | (2,530,897 | ) |
Net realized gains | | | | | | | | | | | | | | | | |
Administrator Class | | | | | | | 0 | | | | | | | | (873,622 | ) |
Institutional Class | | | | | | | 0 | | | | | | | | (5,124,567 | ) |
Investor Class | | | | | | | 0 | | | | | | | | (1,675,940 | ) |
| | | | | | | | | | | | | | | | |
Total distributions to shareholders | | | | | | | (8,198,431 | ) | | | | | | | (20,683,596 | ) |
| | | | | | | | | | | | | | | | |
| | | | |
Capital share transactions | | | Shares | | | | | | | | Shares | | | | | |
Proceeds from shares sold | | | | | | | | | | | | | | | | |
Administrator Class | | | 2,535,393 | | | | 25,263,652 | | | | 4,158,920 | | | | 41,140,441 | |
Institutional Class | | | 10,662,262 | | | | 105,604,143 | | | | 25,474,990 | | | | 249,645,896 | |
Investor Class | | | 3,824,899 | | | | 38,273,837 | | | | 4,599,362 | | | | 45,636,076 | |
| | | | | | | | | | | | | | | | |
| | | | | | | 169,141,632 | | | | | | | | 336,422,413 | |
| | | | | | | | | | | | | | | | |
Reinvestment of distributions | | | | | | | | | | | | | | | | |
Administrator Class | | | 85,358 | | | | 843,737 | | | | 218,572 | | | | 2,127,967 | |
Institutional Class | | | 588,997 | | | | 5,759,462 | | | | 1,475,197 | | | | 14,201,227 | |
Investor Class | | | 156,209 | | | | 1,545,702 | | | | 430,496 | | | | 4,198,009 | |
| | | | | | | | | | | | | | | | |
| | | | | | | 8,148,901 | | | | | | | | 20,527,203 | |
| | | | | | | | | | | | | | | | |
Payment for shares redeemed | | | | | | | | | | | | | | | | |
Administrator Class | | | (1,913,212 | ) | | | (19,198,400 | ) | | | (2,155,246 | ) | | | (21,400,770 | ) |
Institutional Class | | | (7,807,757 | ) | | | (77,159,962 | ) | | | (12,673,556 | ) | | | (124,251,499 | ) |
Investor Class | | | (1,608,704 | ) | | | (16,145,871 | ) | | | (2,991,375 | ) | | | (29,703,618 | ) |
| | | | | | | | | | | | | | | | |
| | | | | | | (112,504,233 | ) | | | | | | | (175,355,887 | ) |
| | | | | | | | | | | | | | | | |
Net increase in net assets resulting from capital share transactions | | | | | | | 64,786,300 | | | | | | | | 181,593,729 | |
| | | | | | | | | | | | | | | | |
Total increase in net assets | | | | | | | 69,602,006 | | | | | | | | 195,991,108 | |
| | | | | | | | | | | | | | | | |
| | | | |
Net assets | | | | | | | | | | | | | | | | |
Beginning of period | | | | | | | 786,985,946 | | | | | | | | 590,994,838 | |
| | | | | | | | | | | | | | | | |
End of period | | | | | | $ | 856,587,952 | | | | | | | $ | 786,985,946 | |
| | | | | | | | | | | | | | | | |
Undistributed net investment income | | | | | | $ | 2,735,896 | | | | | | | $ | 3,110,203 | |
| | | | | | | | | | | | | | | | |
The accompanying notes are an integral part of these financial statements.
| | | | | | |
| Statements of changes in net assets | | Wells Fargo Advantage Dow Jones Target Date Funds | | | 35 | |
| | | | | | | | | | | | | | | | |
| | | Target 2020 Fund | |
| | | Six months ended August 31, 2012 (unaudited) | | | Year ended
February 29, 2012 | |
| | | | |
Operations | | | | | | | | | | | | | | | | |
Net investment income | | | | | | $ | 21,651,351 | | | | | | | $ | 37,174,931 | |
Net realized gains on investments | | | | | | | 19,801,608 | | | | | | | | 38,699,684 | |
Net change in unrealized gains (losses) on investments | | | | | | | (16,942,157 | ) | | | | | | | 15,315,986 | |
| | | | | | | | | | | | | | | | |
Net increase in net assets resulting from operations | | | | | | | 24,510,802 | | | | | | | | 91,190,601 | |
| | | | | | | | | | | | | | | | |
| | | | |
Distributions to shareholders from | | | | | | | | | | | | | | | | |
Net investment income | | | | | | | | | | | | | | | | |
Class A | | | | | | | (507,174 | ) | | | | | | | (1,191,172 | ) |
Class B | | | | | | | (1,604 | ) | | | | | | | (7,738 | ) |
Class C | | | | | | | (14,329 | ) | | | | | | | (37,169 | ) |
Administrator Class | | | | | | | (3,828,098 | ) | | | | | | | (7,776,737 | ) |
Institutional Class | | | | | | | (14,057,290 | ) | | | | | | | (29,700,520 | ) |
Investor Class | | | | | | | (1,091,120 | ) | | | | | | | (2,184,199 | ) |
Net realized gains | | | | | | | | | | | | | | | | |
Class A | | | | | | | 0 | | | | | | | | (183,633 | ) |
Class B | | | | | | | 0 | | | | | | | | (2,784 | ) |
Class C | | | | | | | 0 | | | | | | | | (9,530 | ) |
Administrator Class | | | | | | | 0 | | | | | | | | (1,157,006 | ) |
Institutional Class | | | | | | | 0 | | | | | | | | (3,724,974 | ) |
Investor Class | | | | | | | 0 | | | | | | | | (343,302 | ) |
| | | | | | | | | | | | | | | | |
Total distributions to shareholders | | | | | | | (19,499,615 | ) | | | | | | | (46,318,764 | ) |
| | | | | | | | | | | | | | | | |
| | | | |
Capital share transactions | | | Shares | | | | | | | | Shares | | | | | |
Proceeds from shares sold | | | | | | | | | | | | | | | | |
Class A | | | 132,141 | | | | 1,861,363 | | | | 631,870 | | | | 8,829,853 | |
Class B | | | 649 | | | | 9,099 | | | | 2,115 | | | | 29,728 | |
Class C | | | 17,716 | | | | 248,770 | | | | 102,609 | | | | 1,403,302 | |
Administrator Class | | | 6,638,723 | | | | 94,327,027 | | | | 10,928,563 | | | | 153,132,354 | |
Institutional Class | | | 18,724,297 | | | | 268,274,896 | | | | 36,774,730 | | | | 519,301,696 | |
Investor Class | | | 1,903,552 | | | | 27,140,625 | | | | 3,144,337 | | | | 43,997,341 | |
| | | | | | | | | | | | | | | | |
| | | | | | | 391,861,780 | | | | | | | | 726,694,274 | |
| | | | | | | | | | | | | | | | |
Reinvestment of distributions | | | | | | | | | | | | | | | | |
Class A | | | 35,878 | | | | 491,526 | | | | 97,188 | | | | 1,316,845 | |
Class B | | | 110 | | | | 1,504 | | | | 714 | | | | 9,568 | |
Class C | | | 911 | | | | 12,465 | | | | 2,878 | | | | 38,879 | |
Administrator Class | | | 275,547 | | | | 3,827,343 | | | | 650,425 | | | | 8,931,789 | |
Institutional Class | | | 1,004,778 | | | | 13,976,475 | | | | 2,412,837 | | | | 33,191,509 | |
Investor Class | | | 78,444 | | | | 1,088,806 | | | | 183,756 | | | | 2,520,636 | |
| | | | | | | | | | | | | | | | |
| | | | | | | 19,398,119 | | | | | | | | 46,009,226 | |
| | | | | | | | | | | | | | | | |
Payment for shares redeemed | | | | | | | | | | | | | | | | |
Class A | | | (301,409 | ) | | | (4,239,461 | ) | | | (1,037,096 | ) | | | (14,293,065 | ) |
Class B | | | (23,591 | ) | | | (330,961 | ) | | | (104,146 | ) | | | (1,436,578 | ) |
Class C | | | (46,745 | ) | | | (659,919 | ) | | | (63,273 | ) | | | (871,300 | ) |
Administrator Class | | | (5,442,736 | ) | | | (77,501,043 | ) | | | (10,171,608 | ) | | | (142,872,859 | ) |
Institutional Class | | | (15,166,534 | ) | | | (216,673,467 | ) | | | (20,894,664 | ) | | | (292,952,998 | ) |
Investor Class | | | (1,084,905 | ) | | | (15,475,311 | ) | | | (1,748,805 | ) | | | (24,522,722 | ) |
| | | | | | | | | | | | | | | | |
| | | | | | | (314,880,162 | ) | | | | | | | (476,949,522 | ) |
| | | | | | | | | | | | | | | | |
Net increase in net assets resulting from capital share transactions | | | | | | | 96,379,737 | | | | | | | | 295,753,978 | |
| | | | | | | | | | | | | | | | |
Total increase in net assets | | | | | | | 101,390,924 | | | | | | | | 340,625,815 | |
| | | | | | | | | | | | | | | | |
| | | | |
Net assets | | | | | | | | | | | | | | | | |
Beginning of period | | | | | | | 2,233,620,131 | | | | | | | | 1,892,994,316 | |
| | | | | | | | | | | | | | | | |
End of period | | | | | | $ | 2,335,011,055 | | | | | | | $ | 2,233,620,131 | |
| | | | | | | | | | | | | | | | |
Undistributed net investment income | | | | | | $ | 6,618,264 | | | | | | | $ | 4,466,528 | |
| | | | | | | | | | | | | | | | |
The accompanying notes are an integral part of these financial statements.
| | | | |
| 36 | | Wells Fargo Advantage Dow Jones Target Date Funds | | Statements of changes in net assets |
| | | | | | | | | | | | | | | | |
| | | Target 2025 Fund | |
| | | Six months ended August 31, 2012 (unaudited) | | | Year ended
February 29, 2012 | |
| | | | |
Operations | | | | | | | | | | | | | | | | |
Net investment income | | | | | | $ | 17,948,098 | | | | | | | $ | 29,423,935 | |
Net realized gains on investments | | | | | | | 19,354,729 | | | | | | | | 48,010,089 | |
Net change in unrealized gains (losses) on investments | | | | | | | (25,065,652 | ) | | | | | | | (12,306,697 | ) |
| | | | | | | | | | | | | | | | |
Net increase in net assets resulting from operations | | | | | | | 12,237,175 | | | | | | | | 65,127,327 | |
| | | | | | | | | | | | | | | | |
| | | | |
Distributions to shareholders from | | | | | | | | | | | | | | | | |
Net investment income | | | | | | | | | | | | | | | | |
Administrator Class | | | | | | | (913,368 | ) | | | | | | | (1,438,716 | ) |
Institutional Class | | | | | | | (12,664,469 | ) | | | | | | | (25,612,058 | ) |
Investor Class | | | | | | | (2,250,123 | ) | | | | | | | (4,071,328 | ) |
Net realized gains | | | | | | | | | | | | | | | | |
Administrator Class | | | | | | | 0 | | | | | | | | (2,443,165 | ) |
Institutional Class | | | | | | | 0 | | | | | | | | (32,907,519 | ) |
Investor Class | | | | | | | 0 | | | | | | | | (6,747,046 | ) |
| | | | | | | | | | | | | | | | |
Total distributions to shareholders | | | | | | | (15,827,960 | ) | | | | | | | (73,219,832 | ) |
| | | | | | | | | | | | | | | | |
| | | | |
Capital share transactions | | | Shares | | | | | | | | Shares | | | | | |
Proceeds from shares sold | | | | | | | | | | | | | | | | |
Administrator Class | | | 3,515,257 | | | | 33,486,936 | | | | 6,405,861 | | | | 61,633,506 | |
Institutional Class | | | 16,686,325 | | | | 159,967,053 | | | | 34,405,149 | | | | 330,935,765 | |
Investor Class | | | 6,289,259 | | | | 60,124,686 | | | | 8,333,284 | | | | 79,658,298 | |
| | | | | | | | | | | | | | | | |
| | | | | | | 253,578,675 | | | | | | | | 472,227,569 | |
| | | | | | | | | | | | | | | | |
Reinvestment of distributions | | | | | | | | | | | | | | | | |
Administrator Class | | | 97,584 | | | | 913,368 | | | | 423,018 | | | | 3,881,881 | |
Institutional Class | | | 1,345,869 | | | | 12,602,295 | | | | 6,351,544 | | | | 58,229,396 | |
Investor Class | | | 240,546 | | | | 2,248,948 | | | | 1,177,391 | | | | 10,792,589 | |
| | | | | | | | | | | | | | | | |
| | | | | | | 15,764,611 | | | | | | | | 72,903,866 | |
| | | | | | | | | | | | | | | | |
Payment for shares redeemed | | | | | | | | | | | | | | | | |
Administrator Class | | | (1,923,663 | ) | | | (18,439,672 | ) | | | (2,449,180 | ) | | | (23,720,760 | ) |
Institutional Class | | | (13,468,170 | ) | | | (128,534,530 | ) | | | (25,183,744 | ) | | | (240,890,064 | ) |
Investor Class | | | (2,715,056 | ) | | | (25,964,443 | ) | | | (4,786,211 | ) | | | (45,849,039 | ) |
| | | | | | | | | | | | | | | | |
| | | | | | | (172,938,645 | ) | | | | | | | (310,459,863 | ) |
| | | | | | | | | | | | | | | | |
Net increase in net assets resulting from capital share transactions | | | | | | | 96,404,641 | | | | | | | | 234,671,572 | |
| | | | | | | | | | | | | | | | |
Total increase in net assets | | | | | | | 92,813,856 | | | | | | | | 226,579,067 | |
| | | | | | | | | | | | | | | | |
| | | | |
Net assets | | | | | | | | | | | | | | | | |
Beginning of period | | | | | | | 1,843,226,387 | | | | | | | | 1,616,647,320 | |
| | | | | | | | | | | | | | | | |
End of period | | | | | | $ | 1,936,040,243 | | | | | | | $ | 1,843,226,387 | |
| | | | | | | | | | | | | | | | |
Undistributed net investment income | | | | | | $ | 4,940,031 | | | | | | | $ | 2,819,893 | |
| | | | | | | | | | | | | | | | |
The accompanying notes are an integral part of these financial statements.
| | | | | | |
| Statements of changes in net assets | | Wells Fargo Advantage Dow Jones Target Date Funds | | | 37 | |
| | | | | | | | | | | | | | | | |
| | | Target 2030 Fund | |
| | | Six months ended August 31, 2012 (unaudited) | | | Year ended February 29, 2012 | |
| | | | |
Operations | | | | | | | | | | | | | | | | |
Net investment income | | | | | | $ | 18,314,231 | | | | | | | $ | 27,115,516 | |
Net realized gains on investments | | | | | | | 23,180,720 | | | | | | | | 34,051,829 | |
Net change in unrealized gains (losses) on investments | | | | | | | (38,310,123 | ) | | | | | | | (9,847,187 | ) |
| | | | | | | | | | | | | | | | |
Net increase in net assets resulting from operations | | | | | | | 3,184,828 | | | | | | | | 51,320,158 | |
| | | | | | | | | | | | | | | | |
| | | | |
Distributions to shareholders from | | | | | | | | | | | | | | | | |
Net investment income | | | | | | | | | | | | | | | | |
Class A | | | | | | | (366,752 | ) | | | | | | | (772,673 | ) |
Class B | | | | | | | (1,097 | ) | | | | | | | (4,327 | ) |
Class C | | | | | | | (11,292 | ) | | | | | | | (26,667 | ) |
Administrator Class | | | | | | | (2,975,177 | ) | | | | | | | (5,246,485 | ) |
Institutional Class | | | | | | | (11,508,226 | ) | | | | | | | (20,783,811 | ) |
Investor Class | | | | | | | (905,895 | ) | | | | | | | (1,460,166 | ) |
Net realized gains | | | | | | | | | | | | | | | | |
Class A | | | | | | | 0 | | | | | | | | (750,613 | ) |
Class B | | | | | | | 0 | | | | | | | | (11,291 | ) |
Class C | | | | | | | 0 | | | | | | | | (31,621 | ) |
Administrator Class | | | | | | | 0 | | | | | | | | (4,884,346 | ) |
Institutional Class | | | | | | | 0 | | | | | | | | (16,233,953 | ) |
Investor Class | | | | | | | 0 | | | | | | | | (1,489,261 | ) |
| | | | | | | | | | | | | | | | |
Total distributions to shareholders | | | | | | | (15,768,439 | ) | | | | | | | (51,695,214 | ) |
| | | | | | | | | | | | | | | | |
| | | | |
Capital share transactions | | | Shares | | | | | | | | Shares | | | | | |
Proceeds from shares sold | | | | | | | | | | | | | | | | |
Class A | | | 102,767 | | | | 1,483,332 | | | | 485,942 | | | | 7,057,216 | |
Class B | | | 1,740 | | | | 24,573 | | | | 4,456 | | | | 61,365 | |
Class C | | | 37,514 | | | | 529,188 | | | | 57,591 | | | | 820,045 | |
Administrator Class | | | 5,997,773 | | | | 87,266,007 | | | | 9,685,806 | | | | 140,322,433 | |
Institutional Class | | | 17,975,561 | | | | 263,347,301 | | | | 33,363,352 | | | | 486,113,377 | |
Investor Class | | | 1,862,510 | | | | 27,002,266 | | | | 2,858,201 | | | | 41,223,052 | |
| | | | | | | | | | | | | | | | |
| | | | | | | 379,652,667 | | | | | | | | 675,597,488 | |
| | | | | | | | | | | | | | | | |
Reinvestment of distributions | | | | | | | | | | | | | | | | |
Class A | | | 25,454 | | | | 353,047 | | | | 106,044 | | | | 1,454,839 | |
Class B | | | 79 | | | | 1,084 | | | | 1,090 | | | | 14,627 | |
Class C | | | 789 | | | | 10,734 | | | | 3,326 | | | | 44,636 | |
Administrator Class | | | 212,044 | | | | 2,974,989 | | | | 729,253 | | | | 10,130,072 | |
Institutional Class | | | 813,376 | | | | 11,403,534 | | | | 2,640,535 | | | | 36,665,586 | |
Investor Class | | | 64,660 | | | | 905,235 | | | | 212,158 | | | | 2,937,640 | |
| | | | | | | | | | | | | | | | |
| | | | | | | 15,648,623 | | | | | | | | 51,247,400 | |
| | | | | | | | | | | | | | | | |
Payment for shares redeemed | | | | | | | | | | | | | | | | |
Class A | | | (301,498 | ) | | | (4,340,247 | ) | | | (715,433 | ) | | | (10,355,181 | ) |
Class B | | | (19,651 | ) | | | (281,928 | ) | | | (80,331 | ) | | | (1,134,786 | ) |
Class C | | | (24,696 | ) | | | (349,909 | ) | | | (13,965 | ) | | | (194,454 | ) |
Administrator Class | | | (4,527,739 | ) | | | (65,952,554 | ) | | | (8,876,276 | ) | | | (128,685,126 | ) |
Institutional Class | | | (13,610,925 | ) | | | (198,091,894 | ) | | | (16,386,961 | ) | | | (235,278,754 | ) |
Investor Class | | | (889,680 | ) | | | (12,941,334 | ) | | | (1,363,828 | ) | | | (19,737,382 | ) |
| | | | | | | | | | | | | | | | |
| | | | | | | (281,957,866 | ) | | | | | | | (395,385,683 | ) |
| | | | | | | | | | | | | | | | |
Net increase in net assets resulting from capital share transactions | | | | | | | 113,343,424 | | | | | | | | 331,459,205 | |
| | | | | | | | | | | | | | | | |
Total increase in net assets | | | | | | | 100,759,813 | | | | | | | | 331,084,149 | |
| | | | | | | | | | | | | | | | |
| | | | |
Net assets | | | | | | | | | | | | | | | | |
Beginning of period | | | | | | | 1,919,020,167 | | | | | | | | 1,587,936,018 | |
| | | | | | | | | | | | | | | | |
End of period | | | | | | $ | 2,019,779,980 | | | | | | | $ | 1,919,020,167 | |
| | | | | | | | | | | | | | | | |
Undistributed net investment income | | | | | | $ | 4,650,886 | | | | | | | $ | 2,105,094 | |
| | | | | | | | | | | | | | | | |
The accompanying notes are an integral part of these financial statements.
| | | | |
| 38 | | Wells Fargo Advantage Dow Jones Target Date Funds | | Statements of changes in net assets |
| | | | | | | | | | | | | | | | |
| | | Target 2035 Fund | |
| | | Six months ended August 31, 2012 (unaudited) | | | Year ended February 29, 2012 | |
| | | | |
Operations | | | | | | | | | | | | | | | | |
Net investment income | | | | | | $ | 7,590,108 | | | | | | | $ | 9,638,691 | |
Net realized gains on investments | | | | | | | 10,920,952 | | | | | | | | 8,246,970 | |
Net change in unrealized gains (losses) on investments | | | | | | | (19,076,720 | ) | | | | | | | 1,151,064 | |
| | | | | | | | | | | | | | | | |
Net increase (decrease) in net assets resulting from operations | | | | | | | (565,660 | ) | | | | | | | 19,036,725 | |
| | | | | | | | | | | | | | | | |
| | | | |
Distributions to shareholders from | | | | | | | | | | | | | | | | |
Net investment income | | | | | | | | | | | | | | | | |
Administrator Class | | | | | | | (569,670 | ) | | | | | | | (750,692 | ) |
Institutional Class | | | | | | | (4,153,296 | ) | | | | | | | (5,781,114 | ) |
Investor Class | | | | | | | (1,639,539 | ) | | | | | | | (2,433,324 | ) |
Net realized gains | | | | | | | | | | | | | | | | |
Administrator Class | | | | | | | 0 | | | | | | | | (1,031,832 | ) |
Institutional Class | | | | | | | 0 | | | | | | | | (6,258,998 | ) |
Investor Class | | | | | | | 0 | | | | | | | | (3,315,052 | ) |
| | | | | | | | | | | | | | | | |
Total distributions to shareholders | | | | | | | (6,362,505 | ) | | | | | | | (19,571,012 | ) |
| | | | | | | | | | | | | | | | |
| | | | |
Capital share transactions | | | Shares | | | | | | | | Shares | | | | | |
Proceeds from shares sold | | | | | | | | | | | | | | | | |
Administrator Class | | | 2,590,654 | | | | 23,879,585 | | | | 4,970,249 | | | | 46,433,738 | |
Institutional Class | | | 11,532,444 | | | | 107,260,315 | | | | 23,050,944 | | | | 213,557,274 | |
Investor Class | | | 5,234,302 | | | | 48,862,411 | | | | 7,187,781 | | | | 66,379,605 | |
| | | | | | | | | | | | | | | | |
| | | | | | | 180,002,311 | | | | | | | | 326,370,617 | |
| | | | | | | | | | | | | | | | |
Reinvestment of distributions | | | | | | | | | | | | | | | | |
Administrator Class | | | 62,963 | | | | 569,670 | | | | 203,344 | | | | 1,782,524 | |
Institutional Class | | | 452,636 | | | | 4,101,313 | | | | 1,361,889 | | | | 11,893,990 | |
Investor Class | | | 180,440 | | | | 1,637,387 | | | | 652,519 | | | | 5,739,759 | |
| | | | | | | | | | | | | | | | |
| | | | | | | 6,308,370 | | | | | | | | 19,416,273 | |
| | | | | | | | | | | | | | | | |
Payment for shares redeemed | | | | | | | | | | | | | | | | |
Administrator Class | | | (1,336,116 | ) | | | (12,496,313 | ) | | | (2,295,179 | ) | | | (21,785,589 | ) |
Institutional Class | | | (5,216,475 | ) | | | (48,116,288 | ) | | | (8,919,127 | ) | | | (82,073,140 | ) |
Investor Class | | | (2,070,627 | ) | | | (19,386,141 | ) | | | (3,417,772 | ) | | | (31,600,228 | ) |
| | | | | | | | | | | | | | | | |
| | | | | | | (79,998,742 | ) | | | | | | | (135,458,957 | ) |
| | | | | | | | | | | | | | | | |
Net increase in net assets resulting from capital share transactions | | | | | | | 106,311,939 | | | | | | | | 210,327,933 | |
| | | | | | | | | | | | | | | | |
Total increase in net assets | | | | | | | 99,383,774 | | | | | | | | 209,793,646 | |
| | | | | | | | | | | | | | | | |
| | | | |
Net assets | | | | | | | | | | | | | | | | |
Beginning of period | | | | | | | 802,961,065 | | | | | | | | 593,167,419 | |
| | | | | | | | | | | | | | | | |
End of period | | | | | | $ | 902,344,839 | | | | | | | $ | 802,961,065 | |
| | | | | | | | | | | | | | | | |
Undistributed net investment income | | | | | | $ | 1,991,215 | | | | | | | $ | 763,612 | |
| | | | | | | | | | | | | | | | |
The accompanying notes are an integral part of these financial statements.
| | | | | | |
| Statements of changes in net assets | | Wells Fargo Advantage Dow Jones Target Date Funds | | | 39 | |
| | | | | | | | | | | | | | | | |
| | | Target 2040 Fund | |
| | | Six months ended August 31, 2012 (unaudited) | | | Year ended February 29, 2012 | |
| | | | |
Operations | | | | | | | | | | | | | | | | |
Net investment income | | | | | | $ | 11,800,935 | | | | | | | $ | 15,964,547 | |
Net realized gains on investments | | | | | | | 18,185,771 | | | | | | | | 23,556,443 | |
Net change in unrealized gains (losses) on investments | | | | | | | (36,148,295 | ) | | | | | | | (20,260,995 | ) |
| | | | | | | | | | | | | | | | |
Net increase (decrease) in net assets resulting from operations | | | | | | | (6,161,589 | ) | | | | | | | 19,259,995 | |
| | | | | | | | | | | | | | | | |
| | | | |
Distributions to shareholders from | | | | | | | | | | | | | | | | |
Net investment income | | | | | | | | | | | | | | | | |
Class A | | | | | | | (602,364 | ) | | | | | | | (1,102,225 | ) |
Class B | | | | | | | (1,384 | ) | | | | | | | (6,776 | ) |
Class C | | | | | | | (11,541 | ) | | | | | | | (22,294 | ) |
Administrator Class | | | | | | | (1,797,596 | ) | | | | | | | (2,941,627 | ) |
Institutional Class | | | | | | | (7,061,207 | ) | | | | | | | (11,077,151 | ) |
Investor Class | | | | | | | (446,666 | ) | | | | | | | (609,439 | ) |
Net realized gains | | | | | | | | | | | | | | | | |
Class A | | | | | | | 0 | | | | | | | | (1,674,412 | ) |
Class B | | | | | | | 0 | | | | | | | | (26,426 | ) |
Class C | | | | | | | 0 | | | | | | | | (55,987 | ) |
Administrator Class | | | | | | | 0 | | | | | | | | (3,924,109 | ) |
Institutional Class | | | | | | | 0 | | | | | | | | (12,787,455 | ) |
Investor Class | | | | | | | 0 | | | | | | | | (962,543 | ) |
| | | | | | | | | | | | | | | | |
Total distributions to shareholders | | | | | | | (9,920,758 | ) | | | | | | | (35,190,444 | ) |
| | | | | | | | | | | | | | | | |
| | | | |
Capital share transactions | | | Shares | | | | | | | | Shares | | | | | |
Proceeds from shares sold | | | | | | | | | | | | | | | | |
Class A | | | 112,995 | | | | 1,774,841 | | | | 385,565 | | | | 6,150,436 | |
Class B | | | 0 | | | | 0 | | | | 1,770 | | | | 27,341 | |
Class C | | | 27,267 | | | | 408,270 | | | | 72,352 | | | | 1,091,671 | |
Administrator Class | | | 3,621,796 | | | | 57,429,876 | | | | 6,594,449 | | | | 104,747,908 | |
Institutional Class | | | 12,889,185 | | | | 205,464,527 | | | | 21,402,909 | | | | 340,971,459 | |
Investor Class | | | 1,018,587 | | | | 16,118,281 | | | | 1,494,557 | | | | 23,650,060 | |
| | | | | | | | | | | | | | | | |
| | | | | | | 281,195,795 | | | | | | | | 476,638,875 | |
| | | | | | | | | | | | | | | | |
Reinvestment of distributions | | | | | | | | | | | | | | | | |
Class A | | | 39,816 | | | | 592,864 | | | | 183,673 | | | | 2,704,479 | |
Class B | | | 96 | | | | 1,367 | | | | 2,158 | | | | 30,135 | |
Class C | | | 762 | | | | 10,780 | | | | 4,938 | | | | 68,820 | |
Administrator Class | | | 118,723 | | | | 1,797,468 | | | | 457,843 | | | | 6,865,179 | |
Institutional Class | | | 463,211 | | | | 7,017,639 | | | | 1,579,969 | | | | 23,701,715 | |
Investor Class | | | 29,495 | | | | 445,957 | | | | 105,078 | | | | 1,569,513 | |
| | | | | | | | | | | | | | | | |
| | | | | | | 9,866,075 | | | | | | | | 34,939,841 | |
| | | | | | | | | | | | | | | | |
Payment for shares redeemed | | | | | | | | | | | | | | | | |
Class A | | | (388,824 | ) | | | (6,094,215 | ) | | | (1,028,279 | ) | | | (16,153,396 | ) |
Class B | | | (39,737 | ) | | | (601,982 | ) | | | (84,812 | ) | | | (1,286,454 | ) |
Class C | | | (26,973 | ) | | | (400,944 | ) | | | (34,593 | ) | | | (493,456 | ) |
Administrator Class | | | (3,129,689 | ) | | | (49,427,143 | ) | | | (6,992,963 | ) | | | (110,429,417 | ) |
Institutional Class | | | (8,917,815 | ) | | | (141,512,143 | ) | | | (10,482,716 | ) | | | (165,305,790 | ) |
Investor Class | | | (476,376 | ) | | | (7,607,501 | ) | | | (587,489 | ) | | | (9,252,261 | ) |
| | | | | | | | | | | | | | | | |
| | | | | | | (205,643,928 | ) | | | | | | | (302,920,774 | ) |
| | | | | | | | | | | | | | | | |
Net increase in net assets resulting from capital share transactions | | | | | | | 85,417,942 | | | | | | | | 208,657,942 | |
| | | | | | | | | | | | | | | | |
Total increase in net assets | | | | | | | 69,335,595 | | | | | | | | 192,727,493 | |
| | | | | | | | | | | | | | | | |
| | | | |
Net assets | | | | | | | | | | | | | | | | |
Beginning of period | | | | | | | 1,276,357,115 | | | | | | | | 1,083,629,622 | |
| | | | | | | | | | | | | | | | |
End of period | | | | | | $ | 1,345,692,710 | | | | | | | $ | 1,276,357,115 | |
| | | | | | | | | | | | | | | | |
Undistributed net investment income | | | | | | $ | 2,468,750 | | | | | | | $ | 588,573 | |
| | | | | | | | | | | | | | | | |
The accompanying notes are an integral part of these financial statements.
| | | | |
| 40 | | Wells Fargo Advantage Dow Jones Target Date Funds | | Statements of changes in net assets |
| | | | | | | | | | | | | | | | |
| | | Target 2045 Fund | |
| | | Six months ended August 31, 2012 (unaudited) | | | Year ended February 29, 2012 | |
| | | | |
Operations | | | | | | | | | | | | | | | | |
Net investment income | | | | | | $ | 3,574,193 | | | | | | | $ | 4,027,377 | |
Net realized gains on investments | | | | | | | 5,652,228 | | | | | | | | 20,438 | |
Net change in unrealized gains (losses) on investments | | | | | | | (10,191,243 | ) | | | | | | | 3,769,925 | |
| | | | | | | | | | | | | | | | |
Net increase (decrease) in net assets resulting from operations | | | | | | | (964,822 | ) | | | | | | | 7,817,740 | |
| | | | | | | | | | | | | | | | |
| | | | |
Distributions to shareholders from | | | | | | | | | | | | | | | | |
Net investment income | | | | | | | | | | | | | | | | |
Administrator Class | | | | | | | (233,185 | ) | | | | | | | (334,860 | ) |
Institutional Class | | | | | | | (1,989,168 | ) | | | | | | | (2,238,426 | ) |
Investor Class | | | | | | | (674,486 | ) | | | | | | | (952,893 | ) |
Net realized gains | | | | | | | | | | | | | | | | |
Administrator Class | | | | | | | 0 | | | | | | | | (172,327 | ) |
Institutional Class | | | | | | | 0 | | | | | | | | (917,408 | ) |
Investor Class | | | | | | | 0 | | | | | | | | (498,858 | ) |
| | | | | | | | | | | | | | | | |
Total distributions to shareholders | | | | | | | (2,896,839 | ) | | | | | | | (5,114,772 | ) |
| | | | | | | | | | | | | | | | |
| | | | |
Capital share transactions | | | Shares | | | | | | | | Shares | | | | | |
Proceeds from shares sold | | | | | | | | | | | | | | | | |
Administrator Class | | | 1,309,562 | | | | 12,183,962 | | | | 2,311,584 | | | | 21,505,695 | |
Institutional Class | | | 7,423,270 | | | | 69,244,666 | | | | 12,521,284 | | | | 114,806,260 | |
Investor Class | | | 4,542,985 | | | | 42,074,211 | | | | 4,874,575 | | | | 45,030,944 | |
| | | | | | | | | | | | | | | | |
| | | | | | | 123,502,839 | | | | | | | | 181,342,899 | |
| | | | | | | | | | | | | | | | |
Reinvestment of distributions | | | | | | | | | | | | | | | | |
Administrator Class | | | 25,546 | | | | 233,185 | | | | 58,104 | | | | 507,143 | |
Institutional Class | | | 218,688 | | | | 1,978,844 | | | | 361,910 | | | | 3,140,564 | |
Investor Class | | | 73,829 | | | | 674,425 | | | | 165,575 | | | | 1,451,257 | |
| | | | | | | | | | | | | | | | |
| | | | | | | 2,886,454 | | | | | | | | 5,098,964 | |
| | | | | | | | | | | | | | | | |
Payment for shares redeemed | | | | | | | | | | | | | | | | |
Administrator Class | | | (760,934 | ) | | | (7,163,679 | ) | | | (1,068,069 | ) | | | (10,147,921 | ) |
Institutional Class | | | (3,099,624 | ) | | | (28,687,609 | ) | | | (5,108,831 | ) | | | (46,290,482 | ) |
Investor Class | | | (1,199,170 | ) | | | (11,255,910 | ) | | | (1,782,836 | ) | | | (16,578,656 | ) |
| | | | | | | | | | | | | | | | |
| | | | | | | (47,107,198 | ) | | | | | | | (73,017,059 | ) |
| | | | | | | | | | | | | | | | |
Net increase in net assets resulting from capital share transactions | | | | | | | 79,282,095 | | | | | | | | 113,424,804 | |
| | | | | | | | | | | | | | | | |
Total increase in net assets | | | | | | | 75,420,434 | | | | | | | | 116,127,772 | |
| | | | | | | | | | | | | | | | |
| | | | |
Net assets | | | | | | | | | | | | | | | | |
Beginning of period | | | | | | | 370,576,706 | | | | | | | | 254,448,934 | |
| | | | | | | | | | | | | | | | |
End of period | | | | | | $ | 445,997,140 | | | | | | | $ | 370,576,706 | |
| | | | | | | | | | | | | | | | |
Undistributed net investment income | | | | | | $ | 965,897 | | | | | | | $ | 288,543 | |
| | | | | | | | | | | | | | | | |
The accompanying notes are an integral part of these financial statements.
| | | | | | |
| Statements of changes in net assets | | Wells Fargo Advantage Dow Jones Target Date Funds | | | 41 | |
| | | | | | | | | | | | | | | | |
| | | Target 2050 Fund | |
| | | Six months ended August 31, 2012 (unaudited) | | | Year ended February 29, 2012 | |
| | | | |
Operations | | | | | | | | | | | | | | | | |
Net investment income | | | | | | $ | 7,435,073 | | | | | | | $ | 10,070,892 | |
Net realized gains on investments | | | | | | | 11,369,696 | | | | | | | | 16,964,872 | |
Net change in unrealized gains (losses) on investments | | | | | | | (22,704,058 | ) | | | | | | | (14,861,405 | ) |
| | | | | | | | | | | | | | | | |
Net increase (decrease) in net assets resulting from operations | | | | | | | (3,899,289 | ) | | | | | | | 12,174,359 | |
| | | | | | | | | | | | | | | | |
| | | | |
Distributions to shareholders from | | | | | | | | | | | | | | | | |
Net investment income | | | | | | | | | | | | | | | | |
Administrator Class | | | | | | | (643,701 | ) | | | | | | | (784,638 | ) |
Institutional Class | | | | | | | (5,440,788 | ) | | | | | | | (7,793,105 | ) |
Investor Class | | | | | | | (195,478 | ) | | | | | | | (255,238 | ) |
Net realized gains | | | | | | | | | | | | | | | | |
Administrator Class | | | | | | | 0 | | | | | | | | (2,209,078 | ) |
Institutional Class | | | | | | | 0 | | | | | | | | (16,622,909 | ) |
Investor Class | | | | | | | 0 | | | | | | | | (721,604 | ) |
| | | | | | | | | | | | | | | | |
Total distributions to shareholders | | | | | | | (6,279,967 | ) | | | | | | | (28,386,572 | ) |
| | | | | | | | | | | | | | | | |
| | | | |
Capital share transactions | | | Shares | | | | | | | | Shares | | | | | |
Proceeds from shares sold | | | | | | | | | | | | | | | | |
Administrator Class | | | 3,123,887 | | | | 27,860,906 | | | | 5,831,652 | | | | 52,243,078 | |
Institutional Class | | | 15,111,553 | | | | 135,358,762 | | | | 26,532,137 | | | | 238,408,872 | |
Investor Class | | | 850,026 | | | | 7,508,876 | | | | 1,089,520 | | | | 9,835,817 | |
| | | | | | | | | | | | | | | | |
| | | | | | | 170,728,544 | | | | | | | | 300,487,767 | |
| | | | | | | | | | | | | | | | |
Reinvestment of distributions | | | | | | | | | | | | | | | | |
Administrator Class | | | 14,020 | | | | 643,686 | | | | 357,859 | | | | 2,993,632 | |
Institutional Class | | | 619,853 | | | | 5,422,739 | | | | 2,897,951 | | | | 24,322,029 | |
Investor Class | | | 22,353 | | | | 194,918 | | | | 115,833 | | | | 971,812 | |
| | | | | | | | | | | | | | | | |
| | | | | | | 6,261,343 | | | | | | | | 28,287,473 | |
| | | | | | | | | | | | | | | | |
Payment for shares redeemed | | | | | | | | | | | | | | | | |
Administrator Class | | | (1,874,484 | ) | | | (16,803,124 | ) | | | (3,719,855 | ) | | | (33,304,448 | ) |
Institutional Class | | | (10,607,906 | ) | | | (94,678,103 | ) | | | (17,696,508 | ) | | | (157,973,765 | ) |
Investor Class | | | (282,079 | ) | | | (2,538,278 | ) | | | (703,054 | ) | | | (6,386,504 | ) |
| | | | | | | | | | | | | | | | |
| | | | | | | (114,019,505 | ) | | | | | | | (197,664,717 | ) |
| | | | | | | | | | | | | | | | |
Net increase in net assets resulting from capital share transactions | | | | | | | 62,970,382 | | | | | | | | 131,110,523 | |
| | | | | | | | | | | | | | | | |
Total increase in net assets | | | | | | | 52,791,126 | | | | | | | | 114,898,310 | |
| | | | | | | | | | | | | | | | |
| | | | |
Net assets | | | | | | | | | | | | | | | | |
Beginning of period | | | | | | | 769,907,325 | | | | | | | | 655,009,015 | |
| | | | | | | | | | | | | | | | |
End of period | | | | | | $ | 822,698,451 | | | | | | | $ | 769,907,325 | |
| | | | | | | | | | | | | | | | |
Undistributed net investment income | | | | | | $ | 1,612,985 | | | | | | | $ | 457,879 | |
| | | | | | | | | | | | | | | | |
The accompanying notes are an integral part of these financial statements.
| | | | |
| 42 | | Wells Fargo Advantage Dow Jones Target Date Funds | | Statements of changes in net assets |
| | | | | | | | | | | | | | | | |
| | | Target 2055 Fund | |
| | | Six months ended August 31, 2012 (unaudited) | | | Year ended February 29, 20121 | |
| | | | |
Operations | | | | | | | | | | | | | | | | |
Net investment income | | | | | | $ | 150,890 | | | | | | | $ | 26,081 | |
Net realized gains (losses) on investments | | | | | | | 196,734 | | | | | | | | (95,617 | ) |
Net change in unrealized gains (losses) on investments | | | | | | | (203,354 | ) | | | | | | | 858,152 | |
| | | | | | | | | | | | | | | | |
Net increase in net assets resulting from operations | | | | | | | 144,270 | | | | | | | | 788,616 | |
| | | | | | | | | | | | | | | | |
| | | | |
Distributions to shareholders from | | | | | | | | | | | | | | | | |
Net investment income | | | | | | | | | | | | | | | | |
Administrator Class | | | | | | | (8,872 | ) | | | | | | | 0 | |
Institutional Class | | | | | | | (105,715 | ) | | | | | | | 0 | |
Investor Class | | | | | | | (4,553 | ) | | | | | | | 0 | |
| | | | | | | | | | | | | | | | |
Total distributions to shareholders | | | | | | | (119,140 | ) | | | | | | | 0 | |
| | | | | | | | | | | | | | | | |
| | | | |
Capital share transactions | | | Shares | | | | | | | | Shares | | | | | |
Proceeds from shares sold | | | | | | | | | | | | | | | | |
Administrator Class | | | 177,257 | | | | 1,746,988 | | | | 194,786 | | | | 1,768,579 | |
Institutional Class | | | 1,645,446 | | | | 16,084,766 | | | | 1,009,100 | | | | 9,505,271 | |
Investor Class | | | 45,230 | | | | 449,792 | | | | 41,455 | | | | 396,905 | |
| | | | | | | | | | | | | | | | |
| | | | | | | 18,281,546 | | | | | | | | 11,670,755 | |
| | | | | | | | | | | | | | | | |
Reinvestment of distributions | | | | | | | | | | | | | | | | |
Administrator Class | | | 952 | | | | 8,872 | | | | 0 | | | | 0 | |
Institutional Class | | | 11,352 | | | | 105,683 | | | | 0 | | | | 0 | |
Investor Class | | | 489 | | | | 4,521 | | | | 0 | | | | 0 | |
| | | | | | | | | | | | | | | | |
| | | | | | | 119,076 | | | | | | | | 0 | |
| | | | | | | | | | | | | | | | |
Payment for shares redeemed | | | | | | | | | | | | | | | | |
Administrator Class | | | (86,318 | ) | | | (847,359 | ) | | | (16,433 | ) | | | (160,556 | ) |
Institutional Class | | | (878,769 | ) | | | (8,620,594 | ) | | | (119,817 | ) | | | (1,132,852 | ) |
Investor Class | | | (24,493 | ) | | | (244,213 | ) | | | (15,954 | ) | | | (152,246 | ) |
| | | | | | | | | | | | | | | | |
| | | | | | | (9,712,166 | ) | | | | | | | (1,445,654 | ) |
| | | | | | | | | | | | | | | | |
Net increase in net assets resulting from capital share transactions | | | | | | | 8,688,456 | | | | | | | | 10,225,101 | |
| | | | | | | | | | | | | | | | |
Total increase in net assets | | | | | | | 8,713,586 | | | | | | | | 11,013,717 | |
| | | | | | | | | | | | | | | | |
| | | | |
Net assets | | | | | | | | | | | | | | | | |
Beginning of period | | | | | | | 11,013,717 | | | | | | | | 0 | |
| | | | | | | | | | | | | | | | |
End of period | | | | | | $ | 19,727,303 | | | | | | | $ | 11,013,717 | |
| | | | | | | | | | | | | | | | |
Undistributed net investment income | | | | | | $ | 58,061 | | | | | | | $ | 26,311 | |
| | | | | | | | | | | | | | | | |
| 1. | For the eight months ended February 29, 2012. The Fund commenced operations on June 30, 2011. |
The accompanying notes are an integral part of these financial statements.
This page is intentionally left blank.
| | | | |
| 44 | | Wells Fargo Advantage Dow Jones Target Date Funds | | Financial highlights |
| | | | | | | | | | | | | | | | | | | | |
| | | Beginning
net asset
value per
share | | | Net
investment
income¹ | | | Net realized
and unrealized
gains (losses)
on investments | | | Distributions
from net
investment
income | | | Distributions
from net
realized gains | |
| | | | | |
Target Today Fund | | | | | | | | | | | | | | | | | | | | |
Class A | | | | | | | | | | | | | | | | | | | | |
March 1, 2012 to August 31, 2012 (unaudited) | | $ | 10.86 | | | | 0.08 | 4 | | | 0.12 | | | | 0.00 | | | | 0.00 | |
March 1, 2011 to February 29, 2012 | | $ | 10.56 | | | | 0.18 | 4 | | | 0.39 | | | | (0.22 | ) | | | (0.05 | ) |
March 1, 2010 to February 28, 2011 | | $ | 10.04 | | | | 0.18 | 4 | | | 0.57 | | | | (0.23 | ) | | | 0.00 | |
March 1, 2009 to February 28, 2010 | | $ | 8.86 | | | | 0.22 | 4 | | | 1.20 | | | | (0.24 | ) | | | 0.00 | |
March 1, 2008 to February 28, 2009 | | $ | 10.10 | | | | 0.26 | 4 | | | (1.15 | ) | | | (0.29 | ) | | | (0.06 | ) |
March 1, 2007 to February 29, 2008 | | $ | 10.07 | | | | 0.35 | 4 | | | 0.15 | | | | (0.36 | ) | | | (0.11 | ) |
Class B | | | | | | | | | | | | | | | | | | | | |
March 1, 2012 to August 31, 2012 (unaudited) | | $ | 11.22 | | | | 0.04 | 4 | | | 0.12 | | | | 0.00 | | | | 0.00 | |
March 1, 2011 to February 29, 2012 | | $ | 10.87 | | | | 0.10 | 4 | | | 0.41 | | | | (0.11 | ) | | | (0.05 | ) |
March 1, 2010 to February 28, 2011 | | $ | 10.31 | | | | 0.11 | 4 | | | 0.58 | | | | (0.13 | ) | | | 0.00 | |
March 1, 2009 to February 28, 2010 | | $ | 9.08 | | | | 0.16 | 4 | | | 1.22 | | | | (0.15 | ) | | | 0.00 | |
March 1, 2008 to February 28, 2009 | | $ | 10.33 | | | | 0.19 | 4 | | | (1.17 | ) | | | (0.21 | ) | | | (0.06 | ) |
March 1, 2007 to February 29, 2008 | | $ | 10.29 | | | | 0.28 | 4 | | | 0.15 | | | | (0.28 | ) | | | (0.11 | ) |
Class C | | | | | | | | | | | | | | | | | | | | |
March 1, 2012 to August 31, 2012 (unaudited) | | $ | 11.11 | | | | 0.05 | | | | 0.10 | | | | 0.00 | | | | 0.00 | |
March 1, 2011 to February 29, 2012 | | $ | 10.78 | | | | 0.10 | 4 | | | 0.41 | | | | (0.13 | ) | | | (0.05 | ) |
March 1, 2010 to February 28, 2011 | | $ | 10.25 | | | | 0.11 | 4 | | | 0.57 | | | | (0.15 | ) | | | 0.00 | |
March 1, 2009 to February 28, 2010 | | $ | 9.04 | | | | 0.15 | 4 | | | 1.23 | | | | (0.17 | ) | | | 0.00 | |
March 1, 2008 to February 28, 2009 | | $ | 10.30 | | | | 0.19 | 4 | | | (1.18 | ) | | | (0.21 | ) | | | (0.06 | ) |
March 1, 2007 to February 29, 2008 | | $ | 10.26 | | | | 0.28 | 4 | | | 0.15 | | | | (0.28 | ) | | | (0.11 | ) |
Administrator Class | | | | | | | | | | | | | | | | | | | | |
March 1, 2012 to August 31, 2012 (unaudited) | | $ | 11.07 | | | | 0.09 | | | | 0.11 | | | | 0.00 | | | | 0.00 | |
March 1, 2011 to February 29, 2012 | | $ | 10.75 | | | | 0.20 | | | | 0.40 | | | | (0.23 | ) | | | (0.05 | ) |
March 1, 2010 to February 28, 2011 | | $ | 10.19 | | | | 0.20 | 4 | | | 0.58 | | | | (0.22 | ) | | | 0.00 | |
March 1, 2009 to February 28, 2010 | | $ | 9.03 | | | | 0.25 | 4 | | | 1.21 | | | | (0.30 | ) | | | 0.00 | |
March 1, 2008 to February 28, 2009 | | $ | 10.29 | | | | 0.29 | 4 | | | (1.17 | ) | | | (0.32 | ) | | | (0.06 | ) |
March 1, 2007 to February 29, 2008 | | $ | 10.25 | | | | 0.38 | 4 | | | 0.16 | | | | (0.39 | ) | | | (0.11 | ) |
Institutional Class | | | | | | | | | | | | | | | | | | | | |
March 1, 2012 to August 31, 2012 (unaudited) | | $ | 11.09 | | | | 0.11 | | | | 0.11 | | | | 0.00 | | | | 0.00 | |
March 1, 2011 to February 29, 2012 | | $ | 10.77 | | | | 0.24 | | | | 0.40 | | | | (0.27 | ) | | | (0.05 | ) |
March 1, 2010 to February 28, 2011 | | $ | 10.24 | | | | 0.24 | 4 | | | 0.58 | | | | (0.29 | ) | | | 0.00 | |
March 1, 2009 to February 28, 2010 | | $ | 9.03 | | | | 0.27 | 4 | | | 1.22 | | | | (0.28 | ) | | | 0.00 | |
March 1, 2008 to February 28, 2009 | | $ | 10.29 | | | | 0.32 | 4 | | | (1.18 | ) | | | (0.34 | ) | | | (0.06 | ) |
March 1, 2007 to February 29, 2008 | | $ | 10.26 | | | | 0.41 | 4 | | | 0.14 | | | | (0.41 | ) | | | (0.11 | ) |
Investor Class | | | | | | | | | | | | | | | | | | | | |
March 1, 2012 to August 31, 2012 (unaudited) | | $ | 11.05 | | | | 0.09 | | | | 0.12 | | | | 0.00 | | | | 0.00 | |
March 1, 2011 to February 29, 2012 | | $ | 10.74 | | | | 0.19 | | | | 0.40 | | | | (0.23 | ) | | | (0.05 | ) |
March 1, 2010 to February 28, 2011 | | $ | 10.21 | | | | 0.20 | 4 | | | 0.58 | | | | (0.25 | ) | | | 0.00 | |
March 1, 2009 to February 28, 2010 | | $ | 9.01 | | | | 0.24 | 4 | | | 1.22 | | | | (0.26 | ) | | | 0.00 | |
March 1, 2008 to February 28, 2009 | | $ | 10.28 | | | | 0.28 | 4 | | | (1.17 | ) | | | (0.32 | ) | | | (0.06 | ) |
March 1, 2007 to February 29, 2008 | | $ | 10.26 | | | | 0.37 | 4 | | | 0.15 | | | | (0.39 | ) | | | (0.11 | ) |
Please see footnotes on page 64.
The accompanying notes are an integral part of these financial statements.
| | | | | | |
| Financial highlights | | Wells Fargo Advantage Dow Jones Target Date Funds | | | 45 | |
| | | | | | | | | | | | | | | | | | | | | | | | | | | | |
| | | Ending
net asset
value
per
share | | | Ratio to average net assets (annualized) | | | | | | Portfolio
turnover
rate3 | | | Net assets at
end of period
(000s omitted) | |
| | | Net investment
income¹ | | | Gross
expenses1 | | | Net
expenses1 | | | Total
return2 | | | |
| | | | | | | |
| | | | | | | | | | | | | | | | | | | | | | | | | | | | | |
| | | | | | | | | | | | | | | | | | | | | | | | | | | | |
| | $ | 11.06 | | | | 1.48 | % | | | 1.08 | % | | | 0.96 | % | | | 1.84 | % | | | 18 | % | | $ | 20,770 | |
| | $ | 10.86 | | | | 1.69 | % | | | 1.08 | % | | | 0.96 | % | | | 5.47 | % | | | 46 | % | | $ | 21,822 | |
| | $ | 10.56 | | | | 1.82 | % | | | 1.10 | % | | | 0.97 | % | | | 7.56 | % | | | 51 | % | | $ | 22,862 | |
| | $ | 10.04 | | | | 2.29 | % | | | 1.24 | % | | | 1.13 | % | | | 16.13 | % | | | 91 | % | | $ | 22,145 | |
| | $ | 8.86 | | | | 2.71 | % | | | 1.27 | % | | | 1.15 | % | | | (9.06 | )% | | | 45 | % | | $ | 20,151 | |
| | $ | 10.10 | | | | 3.49 | % | | | 1.25 | % | | | 1.15 | % | | | 5.06 | % | | | 51 | % | | $ | 30,416 | |
| | | | | | | | | | | | | | | | | | | | | | | | | | | | |
| | $ | 11.38 | | | | 0.74 | % | | | 1.82 | % | | | 1.71 | % | | | 1.43 | % | | | 18 | % | | $ | 145 | |
| | $ | 11.22 | | | | 0.97 | % | | | 1.82 | % | | | 1.70 | % | | | 4.73 | % | | | 46 | % | | $ | 242 | |
| | $ | 10.87 | | | | 1.08 | % | | | 1.85 | % | | | 1.72 | % | | | 6.78 | % | | | 51 | % | | $ | 865 | |
| | $ | 10.31 | | | | 1.58 | % | | | 2.00 | % | | | 1.89 | % | | | 15.23 | % | | | 91 | % | | $ | 2,155 | |
| | $ | 9.08 | | | | 1.96 | % | | | 2.02 | % | | | 1.90 | % | | | (9.73 | )% | | | 45 | % | | $ | 3,563 | |
| | $ | 10.33 | | | | 2.74 | % | | | 2.00 | % | | | 1.90 | % | | | 4.21 | % | | | 51 | % | | $ | 8,411 | |
| | | | | | | | | | | | | | | | | | | | | | | | | | | | |
| | $ | 11.26 | | | | 0.73 | % | | | 1.83 | % | | | 1.71 | % | | | 1.35 | % | | | 18 | % | | $ | 5,031 | |
| | $ | 11.11 | | | | 0.94 | % | | | 1.83 | % | | | 1.71 | % | | | 4.81 | % | | | 46 | % | | $ | 5,100 | |
| | $ | 10.78 | | | | 1.07 | % | | | 1.85 | % | | | 1.72 | % | | | 6.69 | % | | | 51 | % | | $ | 5,605 | |
| | $ | 10.25 | | | | 1.56 | % | | | 1.93 | % | | | 1.82 | % | | | 15.30 | % | | | 91 | % | | $ | 5,498 | |
| | $ | 9.04 | | | | 1.97 | % | | | 2.01 | % | | | 1.90 | % | | | (9.80 | )% | | | 45 | % | | $ | 4,741 | |
| | $ | 10.30 | | | | 2.74 | % | | | 1.99 | % | | | 1.90 | % | | | 4.25 | % | | | 51 | % | | $ | 6,877 | |
| | | | | | | | | | | | | | | | | | | | | | | | | | | | |
| | $ | 11.27 | | | | 1.64 | % | | | 0.92 | % | | | 0.80 | % | | | 1.81 | % | | | 18 | % | | $ | 137,251 | |
| | $ | 11.07 | | | | 1.84 | % | | | 0.92 | % | | | 0.80 | % | | | 5.74 | % | | | 46 | % | | $ | 121,886 | |
| | $ | 10.75 | | | | 1.99 | % | | | 0.93 | % | | | 0.80 | % | | | 7.70 | % | | | 51 | % | | $ | 77,216 | |
| | $ | 10.19 | | | | 2.53 | % | | | 1.00 | % | | | 0.82 | % | | | 16.30 | % | | | 91 | % | | $ | 63,796 | |
| | $ | 9.03 | | | | 3.02 | % | | | 1.09 | % | | | 0.85 | % | | | (8.80 | )% | | | 45 | % | | $ | 43,072 | |
| | $ | 10.29 | | | | 3.71 | % | | | 1.08 | % | | | 0.85 | % | | | 5.39 | % | | | 51 | % | | $ | 48,453 | |
| | | | | | | | | | | | | | | | | | | | | | | | | | | | |
| | $ | 11.31 | | | | 2.00 | % | | | 0.65 | % | | | 0.45 | % | | | 1.98 | % | | | 18 | % | | $ | 713,697 | |
| | $ | 11.09 | | | | 2.20 | % | | | 0.65 | % | | | 0.45 | % | | | 6.09 | % | | | 46 | % | | $ | 700,645 | |
| | $ | 10.77 | | | | 2.31 | % | | | 0.66 | % | | | 0.45 | % | | | 8.14 | % | | | 51 | % | | $ | 580,536 | |
| | $ | 10.24 | | | | 2.73 | % | | | 0.72 | % | | | 0.53 | % | | | 16.67 | % | | | 91 | % | | $ | 254,513 | |
| | $ | 9.03 | | | | 3.26 | % | | | 0.82 | % | | | 0.62 | % | | | (8.60 | )% | | | 45 | % | | $ | 76,391 | |
| | $ | 10.29 | | | | 3.96 | % | | | 0.81 | % | | | 0.62 | % | | | 5.52 | % | | | 51 | % | | $ | 50,105 | |
| | | | | | | | | | | | | | | | | | | | | | | | | | | | |
| | $ | 11.26 | | | | 1.59 | % | | | 1.14 | % | | | 0.86 | % | | | 1.90 | % | | | 18 | % | | $ | 111,963 | |
| | $ | 11.05 | | | | 1.79 | % | | | 1.15 | % | | | 0.86 | % | | | 5.59 | % | | | 46 | % | | $ | 107,779 | |
| | $ | 10.74 | | | | 1.91 | % | | | 1.18 | % | | | 0.86 | % | | | 7.72 | % | | | 51 | % | | $ | 86,784 | |
| | $ | 10.21 | | | | 2.41 | % | | | 1.28 | % | | | 0.89 | % | | | 16.33 | % | | | 91 | % | | $ | 39,395 | |
| | $ | 9.01 | | | | 2.97 | % | | | 1.37 | % | | | 0.91 | % | | | (8.93 | )% | | | 45 | % | | $ | 12,397 | |
| | $ | 10.28 | | | | 3.58 | % | | | 1.40 | % | | | 0.91 | % | | | 5.21 | % | | | 51 | % | | $ | 2,719 | |
Please see footnotes on page 64.
The accompanying notes are an integral part of these financial statements.
| | | | |
| 46 | | Wells Fargo Advantage Dow Jones Target Date Funds | | Financial highlights |
| | | | | | | | | | | | | | | | | | | | |
| | | Beginning
net asset
value per
share | | | Net
investment
income¹ | | | Net realized
and unrealized
gains (losses)
on investments | | | Distributions
from net
investment
income | | | Distributions
from net
realized gains | |
| | | | | |
Target 2010 Fund | | | | | | | | | | | | | | | | | | | | |
Class A | | | | | | | | | | | | | | | | | | | | |
March 1, 2012 to August 31, 2012 (unaudited) | | $ | 13.26 | | | | 0.10 | 4 | | | 0.12 | | | | (0.10 | ) | | | 0.00 | |
March 1, 2011 to February 29, 2012 | | $ | 12.86 | | | | 0.21 | 4 | | | 0.43 | | | | (0.24 | ) | | | 0.00 | |
March 1, 2010 to February 28, 2011 | | $ | 12.04 | | | | 0.22 | 4 | | | 0.88 | | | | (0.28 | ) | | | 0.00 | |
March 1, 2009 to February 28, 2010 | | $ | 10.15 | | | | 0.25 | 4 | | | 1.93 | | | | (0.29 | ) | | | (0.00 | )5 |
March 1, 2008 to February 28, 2009 | | $ | 12.71 | | | | 0.31 | 4 | | | (2.42 | ) | | | (0.35 | ) | | | (0.10 | ) |
March 1, 2007 to February 29, 2008 | | $ | 12.68 | | | | 0.38 | 4 | | | 0.20 | | | | (0.39 | ) | | | (0.16 | ) |
Class B | | | | | | | | | | | | | | | | | | | | |
March 1, 2012 to August 31, 2012 (unaudited) | | $ | 13.37 | | | | 0.05 | | | | 0.11 | | | | (0.04 | ) | | | 0.00 | |
March 1, 2011 to February 29, 2012 | | $ | 12.93 | | | | 0.12 | 4 | | | 0.44 | | | | (0.12 | ) | | | 0.00 | |
March 1, 2010 to February 28, 2011 | | $ | 12.10 | | | | 0.12 | 4 | | | 0.88 | | | | (0.17 | ) | | | 0.00 | |
March 1, 2009 to February 28, 2010 | | $ | 10.18 | | | | 0.17 | 4 | | | 1.93 | | | | (0.18 | ) | | | (0.00 | )5 |
March 1, 2008 to February 28, 2009 | | $ | 12.73 | | | | 0.22 | 4 | | | (2.42 | ) | | | (0.25 | ) | | | (0.10 | ) |
March 1, 2007 to February 29, 2008 | | $ | 12.70 | | | | 0.29 | 4 | | | 0.18 | | | | (0.28 | ) | | | (0.16 | ) |
Class C | | | | | | | | | | | | | | | | | | | | |
March 1, 2012 to August 31, 2012 (unaudited) | | $ | 13.44 | | | | 0.05 | | | | 0.12 | | | | (0.05 | ) | | | 0.00 | |
March 1, 2011 to February 29, 2012 | | $ | 13.03 | | | | 0.12 | 4 | | | 0.43 | | | | (0.14 | ) | | | 0.00 | |
March 1, 2010 to February 28, 2011 | | $ | 12.19 | | | | 0.12 | 4 | | | 0.91 | | | | (0.19 | ) | | | 0.00 | |
March 1, 2009 to February 28, 2010 | | $ | 10.27 | | | | 0.16 | 4 | | | 1.96 | | | | (0.20 | ) | | | (0.00 | )5 |
March 1, 2008 to February 28, 2009 | | $ | 12.85 | | | | 0.22 | 4 | | | (2.45 | ) | | | (0.25 | ) | | | (0.10 | ) |
March 1, 2007 to February 29, 2008 | | $ | 12.82 | | | | 0.29 | 4 | | | 0.19 | | | | (0.29 | ) | | | (0.16 | ) |
Administrator Class | | | | | | | | | | | | | | | | | | | | |
March 1, 2012 to August 31, 2012 (unaudited) | | $ | 13.38 | | | | 0.11 | 4 | | | 0.12 | | | | (0.11 | ) | | | 0.00 | |
March 1, 2011 to February 29, 2012 | | $ | 12.97 | | | | 0.24 | | | | 0.43 | | | | (0.26 | ) | | | 0.00 | |
March 1, 2010 to February 28, 2011 | | $ | 12.14 | | | | 0.24 | | | | 0.89 | | | | (0.30 | ) | | | 0.00 | |
March 1, 2009 to February 28, 2010 | | $ | 10.24 | | | | 0.27 | 4 | | | 1.95 | | | | (0.32 | ) | | | (0.00 | )5 |
March 1, 2008 to February 28, 2009 | | $ | 12.82 | | | | 0.34 | 4 | | | (2.44 | ) | | | (0.38 | ) | | | (0.10 | ) |
March 1, 2007 to February 29, 2008 | | $ | 12.79 | | | | 0.42 | 4 | | | 0.20 | | | | (0.43 | ) | | | (0.16 | ) |
Institutional Class | | | | | | | | | | | | | | | | | | | | |
March 1, 2012 to August 31, 2012 (unaudited) | | $ | 13.39 | | | | 0.14 | | | | 0.11 | | | | (0.13 | ) | | | 0.00 | |
March 1, 2011 to February 29, 2012 | | $ | 12.97 | | | | 0.28 | | | | 0.45 | | | | (0.31 | ) | | | 0.00 | |
March 1, 2010 to February 28, 2011 | | $ | 12.15 | | | | 0.28 | | | | 0.88 | | | | (0.34 | ) | | | 0.00 | |
March 1, 2009 to February 28, 2010 | | $ | 10.24 | | | | 0.31 | 4 | | | 1.95 | | | | (0.35 | ) | | | (0.00 | )5 |
March 1, 2008 to February 28, 2009 | | $ | 12.81 | | | | 0.37 | 4 | | | (2.43 | ) | | | (0.41 | ) | | | (0.10 | ) |
March 1, 2007 to February 29, 2008 | | $ | 12.78 | | | | 0.44 | 4 | | | 0.21 | | | | (0.46 | ) | | | (0.16 | ) |
Investor Class | | | | | | | | | | | | | | | | | | | | |
March 1, 2012 to August 31, 2012 (unaudited) | | $ | 13.36 | | | | 0.11 | 4 | | | 0.12 | | | | (0.11 | ) | | | 0.00 | |
March 1, 2011 to February 29, 2012 | | $ | 12.95 | | | | 0.23 | | | | 0.43 | | | | (0.25 | ) | | | 0.00 | |
March 1, 2010 to February 28, 2011 | | $ | 12.12 | | | | 0.22 | 4 | | | 0.90 | | | | (0.29 | ) | | | 0.00 | |
March 1, 2009 to February 28, 2010 | | $ | 10.22 | | | | 0.27 | 4 | | | 1.94 | | | | (0.31 | ) | | | (0.00 | )5 |
March 1, 2008 to February 28, 2009 | | $ | 12.80 | | | | 0.33 | 4 | | | (2.43 | ) | | | (0.38 | ) | | | (0.10 | ) |
March 1, 2007 to February 29, 2008 | | $ | 12.78 | | | | 0.40 | 4 | | | 0.21 | | | | (0.43 | ) | | | (0.16 | ) |
Please see footnotes on page 64.
The accompanying notes are an integral part of these financial statements.
| | | | | | |
| Financial highlights | | Wells Fargo Advantage Dow Jones Target Date Funds | | | 47 | |
| | | | | | | | | | | | | | | | | | | | | | | | | | | | |
| | | Ending
net asset
value
per
share | | | Ratio to average net assets (annualized) | | | | | | Portfolio
turnover
rate3 | | | Net assets at
end of period
(000s omitted) | |
| | | Net investment
income¹ | | | Gross
expenses1 | | | Net
expenses1 | | | Total
return2 | | | |
| | | | | | | |
| | | | | | | | | | | | | | | | | | | | | | | | | | | | | |
| | | | | | | | | | | | | | | | | | | | | | | | | | | | |
| | $ | 13.38 | | | | 1.51 | % | | | 1.08 | % | | | 0.99 | % | | | 1.67 | % | | | 17 | % | | $ | 37,739 | |
| | $ | 13.26 | | | | 1.63 | % | | | 1.08 | % | | | 0.99 | % | | | 5.05 | % | | | 43 | % | | $ | 39,691 | |
| | $ | 12.86 | | | | 1.72 | % | | | 1.10 | % | | | 1.00 | % | | | 9.24 | % | | | 47 | % | | $ | 42,615 | |
| | $ | 12.04 | | | | 2.16 | % | | | 1.16 | % | | | 1.10 | % | | | 21.64 | % | | | 86 | % | | $ | 42,316 | |
| | $ | 10.15 | | | | 2.62 | % | | | 1.25 | % | | | 1.18 | % | | | (16.98 | )% | | | 43 | % | | $ | 39,175 | |
| | $ | 12.71 | | | | 2.99 | % | | | 1.25 | % | | | 1.18 | % | | | 4.67 | % | | | 61 | % | | $ | 60,969 | |
| | | | | | | | | | | | | | | | | | | | | | | | | | | | |
| | $ | 13.49 | | | | 0.77 | % | | | 1.83 | % | | | 1.74 | % | | | 1.21 | % | | | 17 | % | | $ | 563 | |
| | $ | 13.37 | | | | 0.90 | % | | | 1.83 | % | | | 1.74 | % | | | 4.35 | % | | | 43 | % | | $ | 748 | |
| | $ | 12.93 | | | | 0.98 | % | | | 1.85 | % | | | 1.75 | % | | | 8.45 | % | | | 47 | % | | $ | 1,542 | |
| | $ | 12.10 | | | | 1.45 | % | | | 1.92 | % | | | 1.86 | % | | | 20.69 | % | | | 86 | % | | $ | 2,716 | |
| | $ | 10.18 | | | | 1.87 | % | | | 2.00 | % | | | 1.93 | % | | | (17.58 | )% | | | 43 | % | | $ | 4,269 | |
| | $ | 12.73 | | | | 2.25 | % | | | 2.00 | % | | | 1.93 | % | | | 3.81 | % | | | 61 | % | | $ | 9,715 | |
| | | | | | | | | | | | | | | | | | | | | | | | | | | | |
| | $ | 13.56 | | | | 0.76 | % | | | 1.83 | % | | | 1.74 | % | | | 1.28 | % | | | 17 | % | | $ | 3,265 | |
| | $ | 13.44 | | | | 0.88 | % | | | 1.83 | % | | | 1.74 | % | | | 4.28 | % | | | 43 | % | | $ | 3,323 | |
| | $ | 13.03 | | | | 0.96 | % | | | 1.85 | % | | | 1.75 | % | | | 8.48 | % | | | 47 | % | | $ | 3,114 | |
| | $ | 12.19 | | | | 1.42 | % | | | 1.91 | % | | | 1.85 | % | | | 20.76 | % | | | 86 | % | | $ | 2,580 | |
| | $ | 10.27 | | | | 1.87 | % | | | 2.00 | % | | | 1.93 | % | | | (17.59 | )% | | | 43 | % | | $ | 2,464 | |
| | $ | 12.85 | | | | 2.23 | % | | | 2.00 | % | | | 1.93 | % | | | 3.81 | % | | | 61 | % | | $ | 3,609 | |
| | | | | | | | | | | | | | | | | | | | | | | | | | | | |
| | $ | 13.50 | | | | 1.66 | % | | | 0.92 | % | | | 0.83 | % | | | 1.75 | % | | | 17 | % | | $ | 213,587 | |
| | $ | 13.38 | | | | 1.79 | % | | | 0.92 | % | | | 0.83 | % | | | 5.25 | % | | | 43 | % | | $ | 190,863 | |
| | $ | 12.97 | | | | 1.88 | % | | | 0.93 | % | | | 0.83 | % | | | 9.44 | % | | | 47 | % | | $ | 191,943 | |
| | $ | 12.14 | | | | 2.36 | % | | | 0.98 | % | | | 0.86 | % | | | 21.86 | % | | | 86 | % | | $ | 172,322 | |
| | $ | 10.24 | | | | 2.92 | % | | | 1.07 | % | | | 0.88 | % | | | (16.73 | )% | | | 43 | % | | $ | 110,425 | |
| | $ | 12.82 | | | | 3.26 | % | | | 1.07 | % | | | 0.88 | % | | | 4.95 | % | | | 61 | % | | $ | 138,418 | |
| | | | | | | | | | | | | | | | | | | | | | | | | | | | |
| | $ | 13.51 | | | | 2.03 | % | | | 0.65 | % | | | 0.48 | % | | | 1.90 | % | | | 17 | % | | $ | 534,531 | |
| | $ | 13.39 | | | | 2.14 | % | | | 0.65 | % | | | 0.48 | % | | | 5.61 | % | | | 43 | % | | $ | 563,343 | |
| | $ | 12.97 | | | | 2.23 | % | | | 0.66 | % | | | 0.48 | % | | | 9.90 | % | | | 47 | % | | $ | 455,447 | |
| | $ | 12.15 | | | | 2.63 | % | | | 0.71 | % | | | 0.59 | % | | | 22.15 | % | | | 86 | % | | $ | 359,320 | |
| | $ | 10.24 | | | | 3.15 | % | | | 0.80 | % | | | 0.65 | % | | | (16.47 | )% | | | 43 | % | | $ | 239,731 | |
| | $ | 12.81 | | | | 3.45 | % | | | 0.81 | % | | | 0.65 | % | | | 5.18 | % | | | 61 | % | | $ | 206,461 | |
| | | | | | | | | | | | | | | | | | | | | | | | | | | | |
| | $ | 13.48 | | | | 1.61 | % | | | 1.14 | % | | | 0.89 | % | | | 1.71 | % | | | 17 | % | | $ | 62,263 | |
| | $ | 13.36 | | | | 1.73 | % | | | 1.15 | % | | | 0.89 | % | | | 5.21 | % | | | 43 | % | | $ | 61,766 | |
| | $ | 12.95 | | | | 1.79 | % | | | 1.18 | % | | | 0.89 | % | | | 9.40 | % | | | 47 | % | | $ | 53,646 | |
| | $ | 12.12 | | | | 2.27 | % | | | 1.26 | % | | | 0.92 | % | | | 21.86 | % | | | 86 | % | | $ | 25,103 | |
| | $ | 10.22 | | | | 2.86 | % | | | 1.36 | % | | | 0.94 | % | | | (16.78 | )% | | | 43 | % | | $ | 11,265 | |
| | $ | 12.80 | | | | 3.10 | % | | | 1.39 | % | | | 0.94 | % | | | 4.89 | % | | | 61 | % | | $ | 4,856 | |
Please see footnotes on page 64.
The accompanying notes are an integral part of these financial statements.
| | | | |
| 48 | | Wells Fargo Advantage Dow Jones Target Date Funds | | Financial highlights |
| | | | | | | | | | | | | | | | | | | | |
| | | Beginning
net asset
value per
share | | | Net
investment
income¹ | | | Net realized
and unrealized
gains (losses)
on investments | | | Distributions
from net
investment
income | | | Distributions
from net
realized gains | |
| | | | | |
Target 2015 Fund | | | | | | | | | | | | | | | | | | | | |
Administrator Class | | | | | | | | | | | | | | | | | | | | |
March 1, 2012 to August 31, 2012 (unaudited) | | $ | 10.10 | | | | 0.08 | | | | 0.06 | | | | (0.09 | ) | | | 0.00 | |
March 1, 2011 to February 29, 2012 | | $ | 9.92 | | | | 0.17 | | | | 0.29 | | | | (0.17 | ) | | | (0.11 | ) |
March 1, 2010 to February 28, 2011 | | $ | 9.15 | | | | 0.17 | | | | 0.85 | | | | (0.20 | ) | | | (0.05 | ) |
March 1, 2009 to February 28, 2010 | | $ | 7.31 | | | | 0.17 | 4 | | | 1.82 | | | | (0.15 | ) | | | 0.00 | |
March 1, 2008 to February 28, 2009 | | $ | 10.04 | | | | 0.24 | 4 | | | (2.37 | ) | | | (0.30 | ) | | | 0.00 | |
June 29, 20076 to February 29, 2008 | | $ | 10.00 | | | | 0.20 | 4 | | | (0.11 | ) | | | (0.05 | ) | | | 0.00 | |
Institutional Class | | | | | | | | | | | | | | | | | | | | |
March 1, 2012 to August 31, 2012 (unaudited) | | $ | 9.98 | | | | 0.10 | | | | 0.06 | | | | (0.11 | ) | | | 0.00 | |
March 1, 2011 to February 29, 2012 | | $ | 9.81 | | | | 0.19 | | | | 0.29 | | | | (0.20 | ) | | | (0.11 | ) |
March 1, 2010 to February 28, 2011 | | $ | 9.05 | | | | 0.19 | | | | 0.85 | | | | (0.23 | ) | | | (0.05 | ) |
March 1, 2009 to February 28, 2010 | | $ | 7.23 | | | | 0.21 | 4 | | | 1.77 | | | | (0.16 | ) | | | 0.00 | |
March 1, 2008 to February 28, 2009 | | $ | 9.92 | | | | 0.25 | 4 | | | (2.33 | ) | | | (0.31 | ) | | | 0.00 | |
June 29, 20076 to February 29, 2008 | | $ | 10.00 | | | | 0.19 | 4 | | | (0.10 | ) | | | (0.17 | ) | | | 0.00 | |
Investor Class | | | | | | | | | | | | | | | | | | | | |
March 1, 2012 to August 31, 2012 (unaudited) | | $ | 10.11 | | | | 0.08 | | | | 0.06 | | | | (0.09 | ) | | | 0.00 | |
March 1, 2011 to February 29, 2012 | | $ | 9.93 | | | | 0.16 | | | | 0.29 | | | | (0.16 | ) | | | (0.11 | ) |
March 1, 2010 to February 28, 2011 | | $ | 9.16 | | | | 0.16 | 4 | | | 0.85 | | | | (0.19 | ) | | | (0.05 | ) |
March 1, 2009 to February 28, 2010 | | $ | 7.32 | | | | 0.15 | 4 | | | 1.83 | | | | (0.14 | ) | | | 0.00 | |
March 1, 2008 to February 28, 2009 | | $ | 10.03 | | | | 0.22 | 4 | | | (2.34 | ) | | | (0.29 | ) | | | 0.00 | |
June 29, 20076 to February 29, 2008 | | $ | 10.00 | | | | 0.19 | 4 | | | (0.10 | ) | | | (0.06 | ) | | | 0.00 | |
Please see footnotes on page 64.
The accompanying notes are an integral part of these financial statements.
| | | | | | |
| Financial highlights | | Wells Fargo Advantage Dow Jones Target Date Funds | | | 49 | |
| | | | | | | | | | | | | | | | | | | | | | | | | | | | | | |
Distributions from tax basis
return of capital | | | Ending net asset
value
per
share | | | Ratio to average net assets (annualized) | | | | | | Portfolio turnover rate3 | | | Net assets at
end of period
(000s omitted) | |
| | | Net investment
income¹ | | | Gross expenses1 | | | Net expenses1 | | | Total return2 | | | |
| | | | | | | |
| | | | | | | | | | | | | | | | | | | | | | | | | | | | | | | |
| | | | | | | | | | | | | | | | | | | | | | | | | | | | | | |
| | 0.00 | | | $ | 10.15 | | | | 1.64 | % | | | 0.92 | % | | | 0.84 | % | | | 1.41 | % | | | 15 | % | | $ | 92,329 | |
| | 0.00 | | | $ | 10.10 | | | | 1.70 | % | | | 0.92 | % | | | 0.84 | % | | | 4.74 | % | | | 40 | % | | $ | 84,759 | |
| | 0.00 | | | $ | 9.92 | | | | 1.76 | % | | | 0.93 | % | | | 0.84 | % | | | 11.28 | % | | | 44 | % | | $ | 61,227 | |
| | 0.00 | | | $ | 9.15 | | | | 1.89 | % | | | 1.03 | % | | | 0.86 | % | | | 27.28 | % | | | 77 | % | | $ | 42,190 | |
| | (0.30 | ) | | $ | 7.31 | | | | 2.69 | % | | | 1.37 | % | | | 0.89 | % | | | (22.21 | )% | | | 41 | % | | $ | 12,138 | |
| | 0.00 | | | $ | 10.04 | | | | 2.90 | % | | | 3.58 | % | | | 0.56 | % | | | 0.88 | % | | | 54 | % | | $ | 9,354 | |
| | | | | | | | | | | | | | | | | | | | | | | | | | | | | | |
| | 0.00 | | | $ | 10.03 | | | | 2.01 | % | | | 0.65 | % | | | 0.49 | % | | | 1.59 | % | | | 15 | % | | $ | 573,604 | |
| | 0.00 | | | $ | 9.98 | | | | 2.05 | % | | | 0.65 | % | | | 0.49 | % | | | 5.06 | % | | | 40 | % | | $ | 536,453 | |
| | 0.00 | | | $ | 9.81 | | | | 2.11 | % | | | 0.66 | % | | | 0.49 | % | | | 11.68 | % | | | 44 | % | | $ | 387,146 | |
| | 0.00 | | | $ | 9.05 | | | | 2.43 | % | | | 0.72 | % | | | 0.54 | % | | | 27.56 | % | | | 77 | % | | $ | 235,807 | |
| | (0.30 | ) | | $ | 7.23 | | | | 2.91 | % | | | 1.06 | % | | | 0.66 | % | | | (22.00 | )% | | | 41 | % | | $ | 22,002 | |
| | 0.00 | | | $ | 9.92 | | | | 2.91 | % | | | 3.71 | % | | | 0.53 | % | | | 0.92 | % | | | 54 | % | | $ | 10,088 | |
| | | | | | | | | | | | | | | | | | | | | | | | | | | | | | |
| | 0.00 | | | $ | 10.16 | | | | 1.59 | % | | | 1.15 | % | | | 0.90 | % | | | 1.38 | % | | | 15 | % | | $ | 190,655 | |
| | 0.00 | | | $ | 10.11 | | | | 1.65 | % | | | 1.15 | % | | | 0.90 | % | | | 4.67 | % | | | 40 | % | | $ | 165,774 | |
| | 0.00 | | | $ | 9.93 | | | | 1.69 | % | | | 1.18 | % | | | 0.90 | % | | | 11.22 | % | | | 44 | % | | $ | 142,622 | |
| | 0.00 | | | $ | 9.16 | | | | 1.75 | % | | | 1.31 | % | | | 0.93 | % | | | 27.19 | % | | | 77 | % | | $ | 43,004 | |
| | (0.30 | ) | | $ | 7.32 | | | | 2.62 | % | | | 1.60 | % | | | 0.95 | % | | | (22.15 | )% | | | 41 | % | | $ | 8,959 | |
| | 0.00 | | | $ | 10.03 | | | | 2.85 | % | | | 3.79 | % | | | 0.60 | % | | | 0.85 | % | | | 54 | % | | $ | 2,249 | |
Please see footnotes on page 64.
The accompanying notes are an integral part of these financial statements.
| | | | |
| 50 | | Wells Fargo Advantage Dow Jones Target Date Funds | | Financial highlights |
| | | | | | | | | | | | | | | | | | | | |
| | | Beginning
net asset
value per
share | | | Net investment
income¹ | | | Net realized and unrealized
gains (losses) on investments | | | Distributions from net investment income | | | Distributions
from net
realized gains | |
| | | | | |
Target 2020 Fund | | | | | | | | | | | | | | | | | | | | |
Class A | | | | | | | | | | | | | | | | | | | | |
March 1, 2012 to August 31, 2012 (unaudited) | | $ | 14.25 | | | | 0.11 | | | | 0.01 | | | | (0.10 | ) | | | 0.00 | |
March 1, 2011 to February 29, 2012 | | $ | 13.97 | | | | 0.21 | | | | 0.33 | | | | (0.22 | ) | | | (0.04 | ) |
March 1, 2010 to February 28, 2011 | | $ | 12.54 | | | | 0.20 | | | | 1.46 | | | | (0.23 | ) | | | 0.00 | |
March 1, 2009 to February 28, 2010 | | $ | 9.58 | | | | 0.21 | 4 | | | 2.97 | | | | (0.22 | ) | | | (0.00 | )5 |
March 1, 2008 to February 28, 2009 | | $ | 13.78 | | | | 0.26 | 4 | | | (4.04 | ) | | | (0.27 | ) | | | (0.15 | ) |
March 1, 2007 to February 29, 2008 | | $ | 14.22 | | | | 0.33 | 4 | | | (0.08 | ) | | | (0.32 | ) | | | (0.37 | ) |
Class B | | | | | | | | | | | | | | | | | | | | |
March 1, 2012 to August 31, 2012 (unaudited) | | $ | 14.16 | | | | 0.05 | 4 | | | 0.02 | | | | (0.03 | ) | | | 0.00 | |
March 1, 2011 to February 29, 2012 | | $ | 13.85 | | | | 0.10 | 4 | | | 0.33 | | | | (0.08 | ) | | | (0.04 | ) |
March 1, 2010 to February 28, 2011 | | $ | 12.41 | | | | 0.09 | 4 | | | 1.46 | | | | (0.11 | ) | | | 0.00 | |
March 1, 2009 to February 28, 2010 | | $ | 9.50 | | | | 0.12 | 4 | | | 2.95 | | | | (0.16 | ) | | | (0.00 | )5 |
March 1, 2008 to February 28, 2009 | | $ | 13.66 | | | | 0.17 | 4 | | | (4.01 | ) | | | (0.17 | ) | | | (0.15 | ) |
March 1, 2007 to February 29, 2008 | | $ | 14.09 | | | | 0.20 | 4 | | | (0.06 | ) | | | (0.20 | ) | | | (0.37 | ) |
Class C | | | | | | | | | | | | | | | | | | | | |
March 1, 2012 to August 31, 2012 (unaudited) | | $ | 14.20 | | | | 0.06 | | | | 0.01 | | | | (0.05 | ) | | | 0.00 | |
March 1, 2011 to February 29, 2012 | | $ | 13.93 | | | | 0.08 | | | | 0.35 | | | | (0.12 | ) | | | (0.04 | ) |
March 1, 2010 to February 28, 2011 | | $ | 12.51 | | | | 0.08 | | | | 1.48 | | | | (0.14 | ) | | | 0.00 | |
March 1, 2009 to February 28, 2010 | | $ | 9.58 | | | | 0.12 | 4 | | | 2.98 | | | | (0.17 | ) | | | (0.00 | )5 |
March 1, 2008 to February 28, 2009 | | $ | 13.78 | | | | 0.17 | 4 | | | (4.05 | ) | | | (0.17 | ) | | | (0.15 | ) |
March 1, 2007 to February 29, 2008 | | $ | 14.21 | | | | 0.21 | 4 | | | (0.06 | ) | | | (0.21 | ) | | | (0.37 | ) |
Administrator Class | | | | | | | | | | | | | | | | | | | | |
March 1, 2012 to August 31, 2012 (unaudited) | | $ | 14.44 | | | | 0.12 | 4 | | | 0.01 | | | | (0.11 | ) | | | 0.00 | |
March 1, 2011 to February 29, 2012 | | $ | 14.15 | | | | 0.23 | | | | 0.35 | | | | (0.25 | ) | | | (0.04 | ) |
March 1, 2010 to February 28, 2011 | | $ | 12.70 | | | | 0.21 | | | | 1.50 | | | | (0.26 | ) | | | 0.00 | |
March 1, 2009 to February 28, 2010 | | $ | 9.71 | | | | 0.23 | 4 | | | 3.01 | | | | (0.25 | ) | | | (0.00 | )5 |
March 1, 2008 to February 28, 2009 | | $ | 13.96 | | | | 0.30 | 4 | | | (4.09 | ) | | | (0.31 | ) | | | (0.15 | ) |
March 1, 2007 to February 29, 2008 | | $ | 14.39 | | | | 0.36 | 4 | | | (0.06 | ) | | | (0.36 | ) | | | (0.37 | ) |
Institutional Class | | | | | | | | | | | | | | | | | | | | |
March 1, 2012 to August 31, 2012 (unaudited) | | $ | 14.47 | | | | 0.15 | | | | 0.01 | | | | (0.13 | ) | | | 0.00 | |
March 1, 2011 to February 29, 2012 | | $ | 14.19 | | | | 0.27 | 4 | | | 0.35 | | | | (0.30 | ) | | | (0.04 | ) |
March 1, 2010 to February 28, 2011 | | $ | 12.73 | | | | 0.26 | | | | 1.50 | | | | (0.30 | ) | | | 0.00 | |
March 1, 2009 to February 28, 2010 | | $ | 9.73 | | | | 0.27 | 4 | | | 3.01 | | | | (0.28 | ) | | | (0.00 | )5 |
March 1, 2008 to February 28, 2009 | | $ | 13.98 | | | | 0.32 | 4 | | | (4.08 | ) | | | (0.34 | ) | | | (0.15 | ) |
March 1, 2007 to February 29, 2008 | | $ | 14.41 | | | | 0.39 | 4 | | | (0.06 | ) | | | (0.39 | ) | | | (0.37 | ) |
Investor Class | | | | | | | | | | | | | | | | | | | | |
March 1, 2012 to August 31, 2012 (unaudited) | | $ | 14.43 | | | | 0.11 | | | | 0.02 | | | | (0.11 | ) | | | 0.00 | |
March 1, 2011 to February 29, 2012 | | $ | 14.14 | | | | 0.22 | | | | 0.35 | | | | (0.24 | ) | | | (0.04 | ) |
March 1, 2010 to February 28, 2011 | | $ | 12.70 | | | | 0.20 | 4 | | | 1.49 | | | | (0.25 | ) | | | 0.00 | |
March 1, 2009 to February 28, 2010 | | $ | 9.71 | | | | 0.22 | 4 | | | 3.02 | | | | (0.25 | ) | | | (0.00 | )5 |
March 1, 2008 to February 28, 2009 | | $ | 13.96 | | | | 0.29 | 4 | | | (4.08 | ) | | | (0.31 | ) | | | (0.15 | ) |
March 1, 2007 to February 29, 2008 | | $ | 14.40 | | | | 0.33 | 4 | | | (0.03 | ) | | | (0.37 | ) | | | (0.37 | ) |
Please see footnotes on page 64.
The accompanying notes are an integral part of these financial statements.
| | | | | | |
| Financial highlights | | Wells Fargo Advantage Dow Jones Target Date Funds | | | 51 | |
| | | | | | | | | | | | | | | | | | | | | | | | | | | | |
| | | Ending
net asset
value
per
share | | | Ratio to average net assets (annualized) | | | | | | Portfolio turnover rate3 | | | Net assets at
end of period
(000s omitted) | |
| | | Net investment
income¹ | | | Gross expenses1 | | | Net expenses1 | | | Total return2 | | | |
| | | | | | | |
| | | | | | | | | | | | | | | | | | | | | | | | | | | | | |
| | | | | | | | | | | | | | | | | | | | | | | | | | | | |
| | $ | 14.27 | | | | 1.47 | % | | | 1.06 | % | | | 1.01 | % | | | 0.86 | % | | | 14 | % | | $ | 73,155 | |
| | $ | 14.25 | | | | 1.45 | % | | | 1.05 | % | | | 1.01 | % | | | 3.97 | % | | | 35 | % | | $ | 74,955 | |
| | $ | 13.97 | | | | 1.46 | % | | | 1.08 | % | | | 1.02 | % | | | 13.41 | % | | | 39 | % | | $ | 77,784 | |
| | $ | 12.54 | | | | 1.77 | % | | | 1.15 | % | | | 1.11 | % | | | 33.45 | % | | | 66 | % | | $ | 72,653 | |
| | $ | 9.58 | | | | 2.10 | % | | | 1.25 | % | | | 1.20 | % | | | (27.90 | )% | | | 38 | % | | $ | 59,671 | |
| | $ | 13.78 | | | | 2.17 | % | | | 1.27 | % | | | 1.20 | % | | | 1.60 | % | | | 48 | % | | $ | 124,555 | |
| | | | | | | | | | | | | | | | | | | | | | | | | | | | |
| | $ | 14.20 | | | | 0.73 | % | | | 1.81 | % | | | 1.76 | % | | | 0.51 | % | | | 14 | % | | $ | 727 | |
| | $ | 14.16 | | | | 0.78 | % | | | 1.80 | % | | | 1.76 | % | | | 3.11 | % | | | 35 | % | | $ | 1,048 | |
| | $ | 13.85 | | | | 0.73 | % | | | 1.83 | % | | | 1.77 | % | | | 12.57 | % | | | 39 | % | | $ | 2,428 | |
| | $ | 12.41 | | | | 1.04 | % | | | 1.90 | % | | | 1.86 | % | | | 32.44 | % | | | 66 | % | | $ | 5,030 | |
| | $ | 9.50 | | | | 1.36 | % | | | 2.00 | % | | | 1.95 | % | | | (28.43 | )% | | | 38 | % | | $ | 5,495 | |
| | $ | 13.66 | | | | 1.43 | % | | | 2.02 | % | | | 1.95 | % | | | 0.87 | % | | | 48 | % | | $ | 11,516 | |
| | | | | | | | | | | | | | | | | | | | | | | | | | | | |
| | $ | 14.22 | | | | 0.72 | % | | | 1.81 | % | | | 1.76 | % | | | 0.49 | % | | | 14 | % | | $ | 4,205 | |
| | $ | 14.20 | | | | 0.68 | % | | | 1.81 | % | | | 1.76 | % | | | 3.14 | % | | | 35 | % | | $ | 4,600 | |
| | $ | 13.93 | | | | 0.70 | % | | | 1.83 | % | | | 1.77 | % | | | 12.65 | % | | | 39 | % | | $ | 3,922 | |
| | $ | 12.51 | | | | 1.00 | % | | | 1.90 | % | | | 1.86 | % | | | 32.35 | % | | | 66 | % | | $ | 2,752 | |
| | $ | 9.58 | | | | 1.36 | % | | | 2.00 | % | | | 1.95 | % | | | (28.46 | )% | | | 38 | % | | $ | 1,840 | |
| | $ | 13.78 | | | | 1.42 | % | | | 2.02 | % | | | 1.95 | % | | | 0.90 | % | | | 48 | % | | $ | 3,318 | |
| | | | | | | | | | | | | | | | | | | | | | | | | | | | |
| | $ | 14.46 | | | | 1.62 | % | | | 0.90 | % | | | 0.85 | % | | | 0.93 | % | | | 14 | % | | $ | 490,461 | |
| | $ | 14.44 | | | | 1.63 | % | | | 0.90 | % | | | 0.85 | % | | | 4.17 | % | | | 35 | % | | $ | 468,494 | |
| | $ | 14.15 | | | | 1.62 | % | | | 0.91 | % | | | 0.85 | % | | | 13.60 | % | | | 39 | % | | $ | 439,314 | |
| | $ | 12.70 | | | | 1.96 | % | | | 0.97 | % | | | 0.88 | % | | | 33.64 | % | | | 66 | % | | $ | 342,078 | |
| | $ | 9.71 | | | | 2.42 | % | | | 1.07 | % | | | 0.90 | % | | | (27.66 | )% | | | 38 | % | | $ | 196,606 | |
| | $ | 13.96 | | | | 2.44 | % | | | 1.09 | % | | | 0.90 | % | | | 1.96 | % | | | 48 | % | | $ | 234,169 | |
| | | | | | | | | | | | | | | | | | | | | | | | | | | | |
| | $ | 14.50 | | | | 1.98 | % | | | 0.63 | % | | | 0.50 | % | | | 1.15 | % | | | 14 | % | | $ | 1,608,809 | |
| | $ | 14.47 | | | | 1.95 | % | | | 0.63 | % | | | 0.50 | % | | | 4.47 | % | | | 35 | % | | $ | 1,540,045 | |
| | $ | 14.19 | | | | 1.96 | % | | | 0.64 | % | | | 0.50 | % | | | 14.03 | % | | | 39 | % | | $ | 1,250,249 | |
| | $ | 12.73 | | | | 2.22 | % | | | 0.69 | % | | | 0.60 | % | | | 33.98 | % | | | 66 | % | | $ | 822,479 | |
| | $ | 9.73 | | | | 2.63 | % | | | 0.81 | % | | | 0.67 | % | | | (27.46 | )% | | | 38 | % | | $ | 414,090 | |
| | $ | 13.98 | | | | 2.63 | % | | | 0.82 | % | | | 0.67 | % | | | 2.18 | % | | | 48 | % | | $ | 367,360 | |
| | | | | | | | | | | | | | | | | | | | | | | | | | | | |
| | $ | 14.45 | | | | 1.57 | % | | | 1.12 | % | | | 0.91 | % | | | 0.90 | % | | | 14 | % | | $ | 157,654 | |
| | $ | 14.43 | | | | 1.54 | % | | | 1.13 | % | | | 0.91 | % | | | 4.12 | % | | | 35 | % | | $ | 144,478 | |
| | $ | 14.14 | | | | 1.53 | % | | | 1.15 | % | | | 0.91 | % | | | 13.56 | % | | | 39 | % | | $ | 119,297 | |
| | $ | 12.70 | | | | 1.84 | % | | | 1.24 | % | | | 0.94 | % | | | 33.51 | % | | | 66 | % | | $ | 53,535 | |
| | $ | 9.71 | | | | 2.34 | % | | | 1.36 | % | | | 0.96 | % | | | (27.70 | )% | | | 38 | % | | $ | 15,254 | |
| | $ | 13.96 | | | | 2.27 | % | | | 1.41 | % | | | 0.96 | % | | | 1.91 | % | | | 48 | % | | $ | 12,140 | |
Please see footnotes on page 64.
The accompanying notes are an integral part of these financial statements.
| | | | |
| 52 | | Wells Fargo Advantage Dow Jones Target Date Funds | | Financial highlights |
| | | | | | | | | | | | | | | | |
| | | Beginning
net asset
value per
share | | | Net
investment
income (loss)1 | | | Net realized
and unrealized
gains (losses)
on investments | | | Distributions
from net
investment
income | |
| | | | |
Target 2025 Fund | | | | | | | | | | | | | | | | |
Administrator Class | | | | | | | | | | | | | | | | |
March 1, 2012 to August 31, 2012 (unaudited) | | $ | 9.74 | | | | 0.08 | | | | (0.04 | ) | | | (0.07 | ) |
March 1, 2011 to February 29, 2012 | | $ | 9.81 | | | | 0.14 | 4 | | | 0.17 | | | | (0.15 | ) |
March 1, 2010 to February 28, 2011 | | $ | 8.69 | | | | 0.13 | 4 | | | 1.26 | | | | (0.15 | ) |
March 1, 2009 to February 28, 2010 | | $ | 6.25 | | | | (0.04 | )4 | | | 2.61 | | | | (0.13 | ) |
March 1, 2008 to February 28, 2009 | | $ | 9.53 | | | | 0.20 | 4 | | | (3.29 | ) | | | (0.19 | ) |
June 29, 20076 to February 29, 2008 | | $ | 10.00 | | | | 0.14 | 4 | | | (0.57 | ) | | | (0.04 | ) |
Institutional Class | | | | | | | | | | | | | | | | |
March 1, 2012 to August 31, 2012 (unaudited) | | $ | 9.71 | | | | 0.10 | | | | (0.05 | ) | | | (0.08 | ) |
March 1, 2011 to February 29, 2012 | | $ | 9.79 | | | | 0.17 | 4 | | | 0.16 | | | | (0.18 | ) |
March 1, 2010 to February 28, 2011 | | $ | 8.68 | | | | 0.16 | | | | 1.26 | | | | (0.19 | ) |
March 1, 2009 to February 28, 2010 | | $ | 6.24 | | | | 0.18 | 4 | | | 2.39 | | | | (0.13 | ) |
March 1, 2008 to February 28, 2009 | | $ | 9.49 | | | | 0.20 | 4 | | | (3.26 | ) | | | (0.19 | ) |
June 29, 20076 to February 29, 2008 | | $ | 10.00 | | | | 0.14 | 4 | | | (0.55 | ) | | | (0.10 | ) |
Investor Class | | | | | | | | | | | | | | | | |
March 1, 2012 to August 31, 2012 (unaudited) | | $ | 9.72 | | | | 0.08 | | | | (0.04 | ) | | | (0.07 | ) |
March 1, 2011 to February 29, 2012 | | $ | 9.80 | | | | 0.14 | 4 | | | 0.15 | | | | (0.14 | ) |
March 1, 2010 to February 28, 2011 | | $ | 8.68 | | | | 0.13 | 4 | | | 1.25 | | | | (0.14 | ) |
March 1, 2009 to February 28, 2010 | | $ | 6.25 | | | | (0.08 | )4 | | | 2.64 | | | | (0.13 | ) |
March 1, 2008 to February 28, 2009 | | $ | 9.51 | | | | 0.18 | 4 | | | (3.26 | ) | | | (0.18 | ) |
June 29, 20076 to February 29, 2008 | | $ | 10.00 | | | | 0.14 | 4 | | | (0.57 | ) | | | (0.06 | ) |
Please see footnotes on page 64.
The accompanying notes are an integral part of these financial statements.
| | | | | | |
| Financial highlights | | Wells Fargo Advantage Dow Jones Target Date Funds | | | 53 | |
| | | | | | | | | | | | | | | | | | | | | | | | | | | | |
Distributions
from net
realized
gains | | Ending net asset
value
per share | | | Ratio to average net assets (annualized) | | | | | | Portfolio
turnover
rate3 | | | Net assets at
end of period
(000s omitted) | |
| | | Net investment
income (loss)1 | | | Gross
expenses1 | | | Net
expenses1 | | | Total
return2 | | | |
| | | | | | | |
| | | | | | | | | | | | | | | | | | | | | | | | | | | | | |
| | | | | | | | | | | | | | | | | | | | | | | | | | | | |
| 0.00 | | $ | 9.71 | | | | 1.60 | % | | | 0.90 | % | | | 0.85 | % | | | 0.44 | % | | | 12 | % | | $ | 127,762 | |
| (0.23) | | $ | 9.74 | | | | 1.47 | % | | | 0.91 | % | | | 0.85 | % | | | 3.49 | % | | | 31 | % | | $ | 111,673 | |
| (0.12) | | $ | 9.81 | | | | 1.46 | % | | | 0.91 | % | | | 0.85 | % | | | 16.32 | % | | | 33 | % | | $ | 69,590 | |
| 0.00 | | $ | 8.69 | | | | (0.51 | )% | | | 1.01 | % | | | 0.89 | % | | | 41.33 | % | | | 54 | % | | $ | 39,111 | |
| 0.00 | | $ | 6.25 | | | | 2.42 | % | | | 1.35 | % | | | 0.63 | % | | | (32.95 | )% | | | 35 | % | | $ | 9,410 | |
| 0.00 | | $ | 9.53 | | | | 2.13 | % | | | 3.68 | % | | | 0.51 | % | | | (4.30 | )% | | | 42 | % | | $ | 7,206 | |
| | | | | | | | | | | | | | | | | | | | | | | | | | | | |
| 0.00 | | $ | 9.68 | | | | 1.96 | % | | | 0.63 | % | | | 0.50 | % | | | 0.60 | % | | | 12 | % | | $ | 1,471,696 | |
| (0.23) | | $ | 9.71 | | | | 1.83 | % | | | 0.64 | % | | | 0.50 | % | | | 3.77 | % | | | 31 | % | | $ | 1,431,120 | |
| (0.12) | | $ | 9.79 | | | | 1.83 | % | | | 0.64 | % | | | 0.50 | % | | | 16.75 | % | | | 33 | % | | $ | 1,290,513 | |
| 0.00 | | $ | 8.68 | | | | 2.07 | % | | | 0.66 | % | | | 0.53 | % | | | 41.46 | % | | | 54 | % | | $ | 1,057,514 | |
| 0.00 | | $ | 6.24 | | | | 2.50 | % | | | 1.07 | % | | | 0.53 | % | | | (32.81 | )% | | | 35 | % | | $ | 26,335 | |
| 0.00 | | $ | 9.49 | | | | 2.09 | % | | | 3.41 | % | | | 0.47 | % | | | (4.16 | )% | | | 42 | % | | $ | 17,248 | |
| | | | | | | | | | | | | | | | | | | | | | | | | | | | |
| 0.00 | | $ | 9.69 | | | | 1.55 | % | | | 1.13 | % | | | 0.91 | % | | | 0.41 | % | | | 12 | % | | $ | 336,582 | |
| (0.23) | | $ | 9.72 | | | | 1.42 | % | | | 1.14 | % | | | 0.91 | % | | | 3.32 | % | | | 31 | % | | $ | 300,434 | |
| (0.12) | | $ | 9.80 | | | | 1.39 | % | | | 1.15 | % | | | 0.91 | % | | | 16.22 | % | | | 33 | % | | $ | 256,544 | |
| 0.00 | | $ | 8.68 | | | | (0.93 | )% | | | 1.29 | % | | | 0.95 | % | | | 41.19 | % | | | 54 | % | | $ | 70,228 | |
| 0.00 | | $ | 6.25 | | | | 2.32 | % | | | 1.60 | % | | | 0.70 | % | | | (32.90 | )% | | | 35 | % | | $ | 9,564 | |
| 0.00 | | $ | 9.51 | | | | 2.19 | % | | | 4.33 | % | | | 0.52 | % | | | (4.29 | )% | | | 42 | % | | $ | 2,432 | |
Please see footnotes on page 64.
The accompanying notes are an integral part of these financial statements.
| | | | |
| 54 | | Wells Fargo Advantage Dow Jones Target Date Funds | | Financial highlights |
| | | | | | | | | | | | | | | | | | | | |
| | |
Beginning
net asset
value per
share | | | Net
investment
income¹ | | | Net realized
and unrealized
gains (losses)
on investments | | | Distributions
from net
investment
income | | | Distributions
from net
realized gains | |
| | | | | |
Target 2030 Fund | | | | | | | | | | | | | | | | | | | | |
Class A | | | | | | | | | | | | | | | | | | | | |
March 1, 2012 to August 31, 2012 (unaudited) | | $ | 14.74 | | | | 0.10 | 4 | | | (0.12 | ) | | | (0.09 | ) | | | 0.00 | |
March 1, 2011 to February 29, 2012 | | $ | 14.81 | | | | 0.17 | 4 | | | 0.13 | | | | (0.18 | ) | | | (0.19 | ) |
March 1, 2010 to February 28, 2011 | | $ | 12.65 | | | | 0.15 | 4 | | | 2.19 | | | | (0.18 | ) | | | 0.00 | |
March 1, 2009 to February 28, 2010 | | $ | 8.65 | | | | 0.15 | 4 | | | 4.00 | | | | (0.15 | ) | | | (0.00 | ) 5 |
March 1, 2008 to February 28, 2009 | | $ | 14.36 | | | | 0.21 | 4 | | | (5.55 | ) | | | (0.20 | ) | | | (0.17 | ) |
March 1, 2007 to February 29, 2008 | | $ | 15.16 | | | | 0.24 | 4 | | | (0.32 | ) | | | (0.23 | ) | | | (0.49 | ) |
Class B | | | | | | | | | | | | | | | | | | | | |
March 1, 2012 to August 31, 2012 (unaudited) | | $ | 14.49 | | | | 0.05 | 4 | | | (0.11 | ) | | | (0.03 | ) | | | 0.00 | |
March 1, 2011 to February 29, 2012 | | $ | 14.53 | | | | 0.07 | 4 | | | 0.12 | | | | (0.04 | ) | | | (0.19 | ) |
March 1, 2010 to February 28, 2011 | | $ | 12.41 | | | | 0.06 | 4 | | | 2.14 | | | | (0.08 | ) | | | 0.00 | |
March 1, 2009 to February 28, 2010 | | $ | 8.49 | | | | 0.07 | 4 | | | 3.91 | | | | (0.06 | ) | | | (0.00 | ) 5 |
March 1, 2008 to February 28, 2009 | | $ | 14.09 | | | | 0.11 | 4 | | | (5.44 | ) | | | (0.10 | ) | | | (0.17 | ) |
March 1, 2007 to February 29, 2008 | | $ | 14.88 | | | | 0.12 | 4 | | | (0.31 | ) | | | (0.11 | ) | | | (0.49 | ) |
Class C | | | | | | | | | | | | | | | | | | | | |
March 1, 2012 to August 31, 2012 (unaudited) | | $ | 14.45 | | | | 0.05 | | | | (0.12 | ) | | | (0.05 | ) | | | 0.00 | |
March 1, 2011 to February 29, 2012 | | $ | 14.53 | | | | 0.06 | 4 | | | 0.14 | | | | (0.09 | ) | | | (0.19 | ) |
March 1, 2010 to February 28, 2011 | | $ | 12.43 | | | | 0.05 | 4 | | | 2.14 | | | | (0.09 | ) | | | 0.00 | |
March 1, 2009 to February 28, 2010 | | $ | 8.50 | | | | 0.06 | 4 | | | 3.93 | | | | (0.06 | ) | | | (0.00 | ) 5 |
March 1, 2008 to February 28, 2009 | | $ | 14.11 | | | | 0.11 | 4 | | | (5.45 | ) | | | (0.10 | ) | | | (0.17 | ) |
March 1, 2007 to February 29, 2008 | | $ | 14.91 | | | | 0.12 | 4 | | | (0.32 | ) | | | (0.11 | ) | | | (0.49 | ) |
Administrator Class | | | | | | | | | | | | | | | | | | | | |
March 1, 2012 to August 31, 2012 (unaudited) | | $ | 14.91 | | | | 0.11 | | | | (0.12 | ) | | | (0.10 | ) | | | 0.00 | |
March 1, 2011 to February 29, 2012 | | $ | 14.98 | | | | 0.20 | 4 | | | 0.13 | | | | (0.21 | ) | | | (0.19 | ) |
March 1, 2010 to February 28, 2011 | | $ | 12.79 | | | | 0.18 | 4 | | | 2.21 | | | | (0.20 | ) | | | 0.00 | |
March 1, 2009 to February 28, 2010 | | $ | 8.74 | | | | 0.17 | 4 | | | 4.06 | | | | (0.18 | ) | | | (0.00 | ) 5 |
March 1, 2008 to February 28, 2009 | | $ | 14.50 | | | | 0.24 | 4 | | | (5.59 | ) | | | (0.24 | ) | | | (0.17 | ) |
March 1, 2007 to February 29, 2008 | | $ | 15.31 | | | | 0.28 | 4 | | | (0.32 | ) | | | (0.28 | ) | | | (0.49 | ) |
Institutional Class | | | | | | | | | | | | | | | | | | | | |
March 1, 2012 to August 31, 2012 (unaudited) | | $ | 14.91 | | | | 0.15 | 4 | | | (0.13 | ) | | | (0.13 | ) | | | 0.00 | |
March 1, 2011 to February 29, 2012 | | $ | 14.98 | | | | 0.25 | 4 | | | 0.12 | | | | (0.25 | ) | | | (0.19 | ) |
March 1, 2010 to February 28, 2011 | | $ | 12.79 | | | | 0.23 | 4 | | | 2.21 | | | | (0.25 | ) | | | 0.00 | |
March 1, 2009 to February 28, 2010 | | $ | 8.75 | | | | 0.21 | 4 | | | 4.03 | | | | (0.20 | ) | | | (0.00 | ) 5 |
March 1, 2008 to February 28, 2009 | | $ | 14.51 | | | | 0.26 | 4 | | | (5.58 | ) | | | (0.27 | ) | | | (0.17 | ) |
March 1, 2007 to February 29, 2008 | | $ | 15.31 | | | | 0.31 | 4 | | | (0.31 | ) | | | (0.31 | ) | | | (0.49 | ) |
Investor Class | | | | | | | | | | | | | | | | | | | | |
March 1, 2012 to August 31, 2012 (unaudited) | | $ | 14.88 | | | | 0.11 | | | | (0.12 | ) | | | (0.10 | ) | | | 0.00 | |
March 1, 2011 to February 29, 2012 | | $ | 14.95 | | | | 0.19 | 4 | | | 0.13 | | | | (0.20 | ) | | | (0.19 | ) |
March 1, 2010 to February 28, 2011 | | $ | 12.77 | | | | 0.17 | 4 | | | 2.21 | | | | (0.20 | ) | | | 0.00 | |
March 1, 2009 to February 28, 2010 | | $ | 8.74 | | | | 0.16 | 4 | | | 4.04 | | | | (0.17 | ) | | | (0.00 | ) 5 |
March 1, 2008 to February 28, 2009 | | $ | 14.50 | | | | 0.22 | 4 | | | (5.58 | ) | | | (0.23 | ) | | | (0.17 | ) |
March 1, 2007 to February 29, 2008 | | $ | 15.31 | | | | 0.25 | 4 | | | (0.29 | ) | | | (0.28 | ) | | | (0.49 | ) |
Please see footnotes on page 64.
The accompanying notes are an integral part of these financial statements.
| | | | | | |
| Financial highlights | | Wells Fargo Advantage Dow Jones Target Date Funds | | | 55 | |
| | | | | | | | | | | | | | | | | | | | | | | | | | | | |
| | | Ending
net asset
value per share | | | Ratio to average net assets (annualized) | | | | | | Portfolio
turnover
rate3 | | | Net assets at
end of period
(000s omitted) | |
| | | Net investment
income¹ | | | Gross
expenses1 | | | Net
expenses1 | | | Total
return2 | | | |
| | | | | | | |
| | | | | | | | | | | | | | | | | | | | | | | | | | | | | |
| | | | | | | | | | | | | | | | | | | | | | | | | | | | |
| | $ | 14.63 | | | | 1.43 | % | | | 1.06 | % | | | 1.02 | % | | | (0.09 | )% | | | 10 | % | | $ | 57,119 | |
| | $ | 14.74 | | | | 1.21 | % | | | 1.06 | % | | | 1.02 | % | | | 2.27 | % | | | 26 | % | | $ | 60,087 | |
| | $ | 14.81 | | | | 1.15 | % | | | 1.09 | % | | | 1.03 | % | | | 18.71 | % | | | 28 | % | | $ | 62,209 | |
| | $ | 12.65 | | | | 1.32 | % | | | 1.16 | % | | | 1.12 | % | | | 48.17 | % | | | 43 | % | | $ | 55,735 | |
| | $ | 8.65 | | | | 1.64 | % | | | 1.28 | % | | | 1.21 | % | | | (37.78 | )% | | | 33 | % | | $ | 45,556 | |
| | $ | 14.36 | | | | 1.53 | % | | | 1.29 | % | | | 1.21 | % | | | (0.77 | )% | | | 36 | % | | $ | 95,985 | |
| | | | | | | | | | | | | | | | | | | | | | | | | | | | |
| | $ | 14.40 | | | | 0.70 | % | | | 1.82 | % | | | 1.77 | % | | | (0.44 | )% | | | 10 | % | | $ | 610 | |
| | $ | 14.49 | | | | 0.50 | % | | | 1.81 | % | | | 1.77 | % | | | 1.43 | % | | | 26 | % | | $ | 872 | |
| | $ | 14.53 | | | | 0.42 | % | | | 1.84 | % | | | 1.78 | % | | | 17.88 | % | | | 28 | % | | $ | 1,962 | |
| | $ | 12.41 | | | | 0.60 | % | | | 1.92 | % | | | 1.88 | % | | | 46.98 | % | | | 43 | % | | $ | 3,173 | |
| | $ | 8.49 | | | | 0.90 | % | | | 2.03 | % | | | 1.96 | % | | | (38.22 | )% | | | 33 | % | | $ | 3,233 | |
| | $ | 14.09 | | | | 0.79 | % | | | 2.04 | % | | | 1.96 | % | | | (1.50 | )% | | | 36 | % | | $ | 7,358 | |
| | | | | | | | | | | | | | | | | | | | | | | | | | | | |
| | $ | 14.33 | | | | 0.68 | % | | | 1.82 | % | | | 1.77 | % | | | (0.47 | )% | | | 10 | % | | $ | 3,290 | |
| | $ | 14.45 | | | | 0.45 | % | | | 1.82 | % | | | 1.77 | % | | | 1.47 | % | | | 26 | % | | $ | 3,120 | |
| | $ | 14.53 | | | | 0.38 | % | | | 1.84 | % | | | 1.78 | % | | | 17.80 | % | | | 28 | % | | $ | 2,456 | |
| | $ | 12.43 | | | | 0.58 | % | | | 1.91 | % | | | 1.87 | % | | | 47.11 | % | | | 43 | % | | $ | 1,671 | |
| | $ | 8.50 | | | | 0.89 | % | | | 2.02 | % | | | 1.96 | % | | | (38.22 | )% | | | 33 | % | | $ | 1,261 | |
| | $ | 14.11 | | | | 0.77 | % | | | 2.04 | % | | | 1.96 | % | | | (1.53 | )% | | | 36 | % | | $ | 2,385 | |
| | | | | | | | | | | | | | | | | | | | | | | | | | | | |
| | $ | 14.80 | | | | 1.59 | % | | | 0.91 | % | | | 0.86 | % | | | 0.00 | % | | | 10 | % | | $ | 417,133 | |
| | $ | 14.91 | | | | 1.37 | % | | | 0.91 | % | | | 0.86 | % | | | 2.41 | % | | | 26 | % | | $ | 395,067 | |
| | $ | 14.98 | | | | 1.30 | % | | | 0.92 | % | | | 0.86 | % | | | 18.85 | % | | | 28 | % | | $ | 373,853 | |
| | $ | 12.79 | | | | 1.49 | % | | | 0.98 | % | | | 0.89 | % | | | 48.60 | % | | | 43 | % | | $ | 254,340 | |
| | $ | 8.74 | | | | 1.93 | % | | | 1.10 | % | | | 0.91 | % | | | (37.56 | )% | | | 33 | % | | $ | 117,363 | |
| | $ | 14.50 | | | | 1.79 | % | | | 1.11 | % | | | 0.91 | % | | | (0.53 | )% | | | 36 | % | | $ | 162,897 | |
| | | | | | | | | | | | | | | | | | | | | | | | | | | | |
| | $ | 14.80 | | | | 1.95 | % | | | 0.64 | % | | | 0.51 | % | | | 0.16 | % | | | 10 | % | | $ | 1,403,059 | |
| | $ | 14.91 | | | | 1.71 | % | | | 0.64 | % | | | 0.51 | % | | | 2.78 | % | | | 26 | % | | $ | 1,335,729 | |
| | $ | 14.98 | | | | 1.65 | % | | | 0.65 | % | | | 0.51 | % | | | 19.35 | % | | | 28 | % | | $ | 1,048,222 | |
| | $ | 12.79 | | | | 1.74 | % | | | 0.71 | % | | | 0.61 | % | | | 48.76 | % | | | 43 | % | | $ | 639,598 | |
| | $ | 8.75 | | | | 2.15 | % | | | 0.83 | % | | | 0.68 | % | | | (37.38 | )% | | | 33 | % | | $ | 265,829 | |
| | $ | 14.51 | | | | 1.97 | % | | | 0.85 | % | | | 0.68 | % | | | (0.24 | )% | | | 36 | % | | $ | 263,663 | |
| | | | | | | | | | | | | | | | | | | | | | | | | | | | |
| | $ | 14.77 | | | | 1.53 | % | | | 1.13 | % | | | 0.92 | % | | | (0.03 | )% | | | 10 | % | | $ | 138,570 | |
| | $ | 14.88 | | | | 1.30 | % | | | 1.14 | % | | | 0.92 | % | | | 2.36 | % | | | 26 | % | | $ | 124,145 | |
| | $ | 14.95 | | | | 1.21 | % | | | 1.17 | % | | | 0.92 | % | | | 18.84 | % | | | 28 | % | | $ | 99,234 | |
| | $ | 12.77 | | | | 1.36 | % | | | 1.25 | % | | | 0.94 | % | | | 48.33 | % | | | 43 | % | | $ | 46,963 | |
| | $ | 8.74 | | | | 1.84 | % | | | 1.39 | % | | | 0.97 | % | | | (37.58 | )% | | | 33 | % | | $ | 13,400 | |
| | $ | 14.50 | | | | 1.62 | % | | | 1.43 | % | | | 0.97 | % | | | (0.52 | )% | | | 36 | % | | $ | 9,799 | |
Please see footnotes on page 64.
The accompanying notes are an integral part of these financial statements.
| | | | |
| 56 | | Wells Fargo Advantage Dow Jones Target Date Funds | | Financial highlights |
| | | | | | | | | | | | | | | | |
| | |
Beginning
net asset
value per
share | | | Net
investment
income1 | | | Net realized
and unrealized
gains (losses)
on investments | | | Distributions
from net
investment
income | |
| | | | |
Target 2035 Fund | | | | | | | | | | | | | | | | |
Administrator Class | | | | | | | | | | | | | | | | |
March 1, 2012 to August 31, 2012 (unaudited) | | $ | 9.53 | | | | 0.07 | | | | (0.11 | ) | | | (0.06 | ) |
March 1, 2011 to February 29, 2012 | | $ | 9.65 | | | | 0.12 | 4 | | | 0.01 | | | | (0.11 | ) |
March 1, 2010 to February 28, 2011 | | $ | 8.22 | | | | 0.10 | | | | 1.59 | | | | (0.13 | ) |
March 1, 2009 to February 28, 2010 | | $ | 5.40 | | | | 0.09 | 4 | | | 2.81 | | | | (0.08 | ) |
March 1, 2008 to February 28, 2009 | | $ | 9.24 | | | | 0.14 | 4 | | | (3.84 | ) | | | (0.14 | ) |
June 29, 20076 to February 29, 2008 | | $ | 10.00 | | | | 0.10 | 4 | | | (0.85 | ) | | | (0.01 | ) |
Institutional Class | | | | | | | | | | | | | | | | |
March 1, 2012 to August 31, 2012 (unaudited) | | $ | 9.50 | | | | 0.09 | | | | (0.11 | ) | | | (0.08 | ) |
March 1, 2011 to February 29, 2012 | | $ | 9.61 | | | | 0.15 | 4 | | | 0.02 | | | | (0.14 | ) |
March 1, 2010 to February 28, 2011 | | $ | 8.19 | | | | 0.13 | | | | 1.58 | | | | (0.16 | ) |
March 1, 2009 to February 28, 2010 | | $ | 5.36 | | | | 0.11 | 4 | | | 2.82 | | | | (0.10 | ) |
March 1, 2008 to February 28, 2009 | | $ | 9.15 | | | | 0.14 | 4 | | | (3.80 | ) | | | (0.13 | ) |
June 29, 20076 to February 29, 2008 | | $ | 10.00 | | | | 0.10 | 4 | | | (0.84 | ) | | | (0.11 | ) |
Investor Class | | | | | | | | | | | | | | | | |
March 1, 2012 to August 31, 2012 (unaudited) | | $ | 9.56 | | | | 0.07 | | | | (0.11 | ) | | | (0.06 | ) |
March 1, 2011 to February 29, 2012 | | $ | 9.67 | | | | 0.11 | 4 | | | 0.02 | | | | (0.10 | ) |
March 1, 2010 to February 28, 2011 | | $ | 8.24 | | | | 0.10 | | | | 1.58 | | | | (0.12 | ) |
March 1, 2009 to February 28, 2010 | | $ | 5.42 | | | | 0.08 | 4 | | | 2.82 | | | | (0.08 | ) |
March 1, 2008 to February 28, 2009 | | $ | 9.24 | | | | 0.12 | 4 | | | (3.82 | ) | | | (0.12 | ) |
June 29, 20076 to February 29, 2008 | | $ | 10.00 | | | | 0.10 | 4 | | | (0.86 | ) | | | (0.00 | )5 |
Please see footnotes on page 64.
The accompanying notes are an integral part of these financial statements.
| | | | | | |
| Financial highlights | | Wells Fargo Advantage Dow Jones Target Date Funds | | | 57 | |
| | | | | | | | | | | | | | | | | | | | | | | | | | | | | | |
Distributions
from net
realized
gains | | | Ending net asset
value
per
share | | | Ratio to average net assets (annualized) | | | | | | Portfolio
turnover
rate3 | | | Net assets at
end of period
(000s omitted) | |
| | | Net investment
income¹ | | | Gross
expenses1 | | | Net
expenses1 | | | Total
return2 | | | |
| | | | | | | |
| | | | | | | | | | | | | | | | | | | | | | | | | | | | | | | |
| | | | | | | | | | | | | | | | | | | | | | | | | | | | | | |
| | 0.00 | | | $ | 9.43 | | | | 1.55 | % | | | 0.93 | % | | | 0.87 | % | | | (0.37 | )% | | | 9 | % | | $ | 88,657 | |
| | (0.14 | ) | | $ | 9.53 | | | | 1.26 | % | | | 0.93 | % | | | 0.87 | % | | | 1.55 | % | | | 22 | % | | $ | 77,039 | |
| | (0.13 | ) | | $ | 9.65 | | | | 1.17 | % | | | 0.94 | % | | | 0.87 | % | | | 20.87 | % | | | 24 | % | | $ | 50,226 | |
| | 0.00 | | | $ | 8.22 | | | | 1.20 | % | | | 1.06 | % | | | 0.89 | % | | | 53.96 | % | | | 34 | % | | $ | 25,950 | |
| | 0.00 | | | $ | 5.40 | | | | 1.83 | % | | | 1.60 | % | | | 0.83 | % | | | (40.58 | )% | | | 30 | % | | $ | 4,101 | |
| | 0.00 | | | $ | 9.24 | | | | 1.58 | % | | | 5.39 | % | | | 0.53 | % | | | (7.52 | )% | | | 33 | % | | $ | 3,524 | |
| | | | | | | | | | | | | | | | | | | | | | | | | | | | | | |
| | 0.00 | | | $ | 9.40 | | | | 1.92 | % | | | 0.66 | % | | | 0.52 | % | | | (0.21 | )% | | | 9 | % | | $ | 540,484 | |
| | (0.14 | ) | | $ | 9.50 | | | | 1.60 | % | | | 0.66 | % | | | 0.52 | % | | | 1.96 | % | | | 22 | % | | $ | 481,784 | |
| | (0.13 | ) | | $ | 9.61 | | | | 1.52 | % | | | 0.68 | % | | | 0.52 | % | | | 21.21 | % | | | 24 | % | | $ | 338,577 | |
| | 0.00 | | | $ | 8.19 | | | | 1.40 | % | | | 0.75 | % | | | 0.57 | % | | | 54.85 | % | | | 34 | % | | $ | 170,172 | |
| | 0.00 | | | $ | 5.36 | | | | 1.97 | % | | | 1.31 | % | | | 0.64 | % | | | (40.44 | )% | | | 30 | % | | $ | 16,279 | |
| | 0.00 | | | $ | 9.15 | | | | 1.52 | % | | | 5.64 | % | | | 0.49 | % | | | (7.48 | )% | | | 33 | % | | $ | 8,983 | |
| | | | | | | | | | | | | | | | | | | | | | | | | | | | | | |
| | 0.00 | | | $ | 9.46 | | | | 1.51 | % | | | 1.16 | % | | | 0.93 | % | | | (0.39 | )% | | | 9 | % | | $ | 273,204 | |
| | (0.14 | ) | | $ | 9.56 | | | | 1.21 | % | | | 1.16 | % | | | 0.93 | % | | | 1.60 | % | | | 22 | % | | $ | 244,138 | |
| | (0.13 | ) | | $ | 9.67 | | | | 1.09 | % | | | 1.19 | % | | | 0.93 | % | | | 20.74 | % | | | 24 | % | | $ | 204,364 | |
| | 0.00 | | | $ | 8.24 | | | | 1.09 | % | | | 1.34 | % | | | 0.95 | % | | | 53.70 | % | | | 34 | % | | $ | 60,611 | |
| | 0.00 | | | $ | 5.42 | | | | 1.69 | % | | | 1.82 | % | | | 0.92 | % | | | (40.50 | )% | | | 30 | % | | $ | 7,025 | |
| | 0.00 | | | $ | 9.24 | | | | 1.59 | % | | | 5.74 | % | | | 0.50 | % | | | (7.59 | )% | | | 33 | % | | $ | 1,736 | |
Please see footnotes on page 64.
The accompanying notes are an integral part of these financial statements.
| | | | |
| 58 | | Wells Fargo Advantage Dow Jones Target Date Funds | | Financial highlights |
| | | | | | | | | | | | | | | | | | | | |
| | |
Beginning
net asset
value per
share | | | Net
investment
income¹ | | | Net realized
and unrealized
gains (losses)
on investments | | | Distributions
from net
investment
income | | | Distributions
from net
realized gains | |
| | | | | |
Target 2040 Fund | | | | | | | | | | | | | | | | | | | | |
Class A | | | | | | | | | | | | | | | | | | | | |
March 1, 2012 to August 31, 2012 (unaudited) | | $ | 16.07 | | | | 0.12 | | | | (0.24 | ) | | | (0.10 | ) | | | 0.00 | |
March 1, 2011 to February 29, 2012 | | $ | 16.40 | | | | 0.17 | | | | (0.07 | ) | | | (0.16 | ) | | | (0.27 | ) |
March 1, 2010 to February 28, 2011 | | $ | 13.60 | | | | 0.15 | | | | 2.81 | | | | (0.16 | ) | | | 0.00 | |
March 1, 2009 to February 28, 2010 | | $ | 8.73 | | | | 0.12 | 4 | | | 4.87 | | | | (0.12 | ) | | | (0.00 | )5 |
March 1, 2008 to February 28, 2009 | | $ | 16.04 | | | | 0.19 | 4 | | | (6.92 | ) | | | (0.18 | ) | | | (0.40 | ) |
March 1, 2007 to February 29, 2008 | | $ | 17.42 | | | | 0.22 | 4 | | | (0.49 | ) | | | (0.22 | ) | | | (0.89 | ) |
Class B | | | | | | | | | | | | | | | | | | | | |
March 1, 2012 to August 31, 2012 (unaudited) | | $ | 15.36 | | | | 0.05 | 4 | | | (0.22 | ) | | | (0.02 | ) | | | 0.00 | |
March 1, 2011 to February 29, 2012 | | $ | 15.67 | | | | 0.05 | 4 | | | (0.06 | ) | | | (0.03 | ) | | | (0.27 | ) |
March 1, 2010 to February 28, 2011 | | $ | 12.99 | | | | 0.03 | 4 | | | 2.70 | | | | (0.05 | ) | | | 0.00 | |
March 1, 2009 to February 28, 2010 | | $ | 8.35 | | | | 0.10 | 4 | | | 4.57 | | | | (0.03 | ) | | | (0.00 | )5 |
March 1, 2008 to February 28, 2009 | | $ | 15.40 | | | | 0.09 | 4 | | | (6.64 | ) | | | (0.10 | ) | | | (0.40 | ) |
March 1, 2007 to February 29, 2008 | | $ | 16.75 | | | | 0.09 | 4 | | | (0.47 | ) | | | (0.08 | ) | | | (0.89 | ) |
Class C | | | | | | | | | | | | | | | | | | | | |
March 1, 2012 to August 31, 2012 (unaudited) | | $ | 15.26 | | | | 0.05 | | | | (0.22 | ) | | | (0.05 | ) | | | 0.00 | |
March 1, 2011 to February 29, 2012 | | $ | 15.60 | | | | 0.04 | 4 | | | (0.05 | ) | | | (0.06 | ) | | | (0.27 | ) |
March 1, 2010 to February 28, 2011 | | $ | 12.95 | | | | 0.03 | 4 | | | 2.69 | | | | (0.07 | ) | | | 0.00 | |
March 1, 2009 to February 28, 2010 | | $ | 8.33 | | | | 0.05 | 4 | | | 4.61 | | | | (0.04 | ) | | | (0.00 | )5 |
March 1, 2008 to February 28, 2009 | | $ | 15.36 | | | | 0.09 | 4 | | | (6.62 | ) | | | (0.10 | ) | | | (0.40 | ) |
March 1, 2007 to February 29, 2008 | | $ | 16.73 | | | | 0.08 | 4 | | | (0.47 | ) | | | (0.09 | ) | | | (0.89 | ) |
Administrator Class | | | | | | | | | | | | | | | | | | | | |
March 1, 2012 to August 31, 2012 (unaudited) | | $ | 16.34 | | | | 0.13 | 4 | | | (0.24 | ) | | | (0.11 | ) | | | 0.00 | |
March 1, 2011 to February 29, 2012 | | $ | 16.67 | | | | 0.19 | | | | (0.06 | ) | | | (0.19 | ) | | | (0.27 | ) |
March 1, 2010 to February 28, 2011 | | $ | 13.82 | | | | 0.16 | | | | 2.88 | | | | (0.19 | ) | | | 0.00 | |
March 1, 2009 to February 28, 2010 | | $ | 8.88 | | | | 0.16 | 4 | | | 4.93 | | | | (0.15 | ) | | | (0.00 | )5 |
March 1, 2008 to February 28, 2009 | | $ | 16.29 | | | | 0.23 | 4 | | | (7.02 | ) | | | (0.22 | ) | | | (0.40 | ) |
March 1, 2007 to February 29, 2008 | | $ | 17.67 | | | | 0.27 | 4 | | | (0.49 | ) | | | (0.27 | ) | | | (0.89 | ) |
Institutional Class | | | | | | | | | | | | | | | | | | | | |
March 1, 2012 to August 31, 2012 (unaudited) | | $ | 16.37 | | | | 0.16 | | | | (0.25 | ) | | | (0.13 | ) | | | 0.00 | |
March 1, 2011 to February 29, 2012 | | $ | 16.69 | | | | 0.24 | | | | (0.05 | ) | | | (0.24 | ) | | | (0.27 | ) |
March 1, 2010 to February 28, 2011 | | $ | 13.84 | | | | 0.22 | | | | 2.87 | | | | (0.24 | ) | | | 0.00 | |
March 1, 2009 to February 28, 2010 | | $ | 8.88 | | | | 0.18 | 4 | | | 4.95 | | | | (0.17 | ) | | | (0.00 | )5 |
March 1, 2008 to February 28, 2009 | | $ | 16.29 | | | | 0.25 | 4 | | | (7.02 | ) | | | (0.24 | ) | | | (0.40 | ) |
March 1, 2007 to February 29, 2008 | | $ | 17.67 | | | | 0.30 | 4 | | | (0.48 | ) | | | (0.31 | ) | | | (0.89 | ) |
Investor Class | | | | | | | | | | | | | | | | | | | | |
March 1, 2012 to August 31, 2012 (unaudited) | | $ | 16.32 | | | | 0.12 | | | | (0.23 | ) | | | (0.11 | ) | | | 0.00 | |
March 1, 2011 to February 29, 2012 | | $ | 16.65 | | | | 0.18 | | | | (0.06 | ) | | | (0.18 | ) | | | (0.27 | ) |
March 1, 2010 to February 28, 2011 | | $ | 13.81 | | | | 0.16 | | | | 2.86 | | | | (0.18 | ) | | | 0.00 | |
March 1, 2009 to February 28, 2010 | | $ | 8.87 | | | | 0.15 | 4 | | | 4.93 | | | | (0.14 | ) | | | (0.00 | )5 |
March 1, 2008 to February 28, 2009 | | $ | 16.28 | | | | 0.21 | 4 | | | (7.01 | ) | | | (0.21 | ) | | | (0.40 | ) |
March 1, 2007 to February 29, 2008 | | $ | 17.67 | | | | 0.23 | 4 | | | (0.46 | ) | | | (0.27 | ) | | | (0.89 | ) |
Please see footnotes on page 64.
The accompanying notes are an integral part of these financial statements.
| | | | | | |
| Financial highlights | | Wells Fargo Advantage Dow Jones Target Date Funds | | | 59 | |
| | | | | | | | | | | | | | | | | | | | | | | | | | | | |
| | | Ending
net asset
value
per
share | | | Ratio to average net assets (annualized) | | | | | | Portfolio
turnover
rate3 | | | Net assets at
end of period
(000s omitted) | |
| | | Net investment
income¹ | | | Gross
expenses1 | | | Net
expenses1 | | | Total
return2 | | | |
| | | | | | | |
| | | | | | | | | | | | | | | | | | | | | | | | | | | | | |
| | | | | | | | | | | | | | | | | | | | | | | | | | | | |
| | $ | 15.85 | | | | 1.41 | % | | | 1.08 | % | | | 1.03 | % | | | (0.73 | )% | | | 8 | % | | $ | 98,694 | |
| | $ | 16.07 | | | | 1.06 | % | | | 1.08 | % | | | 1.03 | % | | | 0.85 | % | | | 20 | % | | $ | 103,841 | |
| | $ | 16.40 | | | | 0.95 | % | | | 1.10 | % | | | 1.04 | % | | | 21.98 | % | | | 21 | % | | $ | 113,494 | |
| | $ | 13.60 | | | | 1.03 | % | | | 1.17 | % | | | 1.12 | % | | | 57.33 | % | | | 29 | % | | $ | 100,278 | |
| | $ | 8.73 | | | | 1.39 | % | | | 1.30 | % | | | 1.22 | % | | | (42.65 | )% | | | 29 | % | | $ | 67,928 | |
| | $ | 16.04 | | | | 1.22 | % | | | 1.29 | % | | | 1.22 | % | | | (2.02 | )% | | | 31 | % | | $ | 142,158 | |
| | | | | | | | | | | | | | | | | | | | | | | | | | | | |
| | $ | 15.17 | | | | 0.67 | % | | | 1.83 | % | | | 1.78 | % | | | (1.10 | )% | | | 8 | % | | $ | 943 | |
| | $ | 15.36 | | | | 0.34 | % | | | 1.83 | % | | | 1.78 | % | | | 0.12 | % | | | 20 | % | | $ | 1,564 | |
| | $ | 15.67 | | | | 0.23 | % | | | 1.86 | % | | | 1.79 | % | | | 21.08 | % | | | 21 | % | | $ | 2,863 | |
| | $ | 12.99 | | | | 0.86 | % | | | 1.93 | % | | | 1.89 | % | | | 56.01 | % | | | 29 | % | | $ | 3,876 | |
| | $ | 8.35 | | | | 0.65 | % | | | 2.05 | % | | | 1.97 | % | | | (43.10 | )% | | | 29 | % | | $ | 3,623 | |
| | $ | 15.40 | | | | 0.50 | % | | | 2.04 | % | | | 1.97 | % | | | (2.69 | )% | | | 31 | % | | $ | 9,899 | |
| | | | | | | | | | | | | | | | | | | | | | | | | | | | |
| | $ | 15.04 | | | | 0.66 | % | | | 1.83 | % | | | 1.78 | % | | | (1.10 | )% | | | 8 | % | | $ | 3,587 | |
| | $ | 15.26 | | | | 0.30 | % | | | 1.83 | % | | | 1.78 | % | | | 0.14 | % | | | 20 | % | | $ | 3,623 | |
| | $ | 15.60 | | | | 0.19 | % | | | 1.85 | % | | | 1.79 | % | | | 21.08 | % | | | 21 | % | | $ | 3,038 | |
| | $ | 12.95 | | | | 0.41 | % | | | 1.92 | % | | | 1.87 | % | | | 56.02 | % | | | 29 | % | | $ | 2,226 | |
| | $ | 8.33 | | | | 0.65 | % | | | 2.05 | % | | | 1.97 | % | | | (43.07 | )% | | | 29 | % | | $ | 1,362 | |
| | $ | 15.36 | | | | 0.46 | % | | | 2.04 | % | | | 1.97 | % | | | (2.75 | )% | | | 31 | % | | $ | 3,023 | |
| | | | | | | | | | | | | | | | | | | | | | | | | | | | |
| | $ | 16.12 | | | | 1.56 | % | | | 0.92 | % | | | 0.87 | % | | | (0.64 | )% | | | 8 | % | | $ | 262,778 | |
| | $ | 16.34 | | | | 1.22 | % | | | 0.92 | % | | | 0.87 | % | | | 1.00 | % | | | 20 | % | | $ | 256,378 | |
| | $ | 16.67 | | | | 1.11 | % | | | 0.94 | % | | | 0.87 | % | | | 22.21 | % | | | 21 | % | | $ | 260,524 | |
| | $ | 13.82 | | | | 1.26 | % | | | 0.99 | % | | | 0.90 | % | | | 57.54 | % | | | 29 | % | | $ | 176,917 | |
| | $ | 8.88 | | | | 1.67 | % | | | 1.12 | % | | | 0.92 | % | | | (42.46 | )% | | | 29 | % | | $ | 72,233 | |
| | $ | 16.29 | | | | 1.49 | % | | | 1.11 | % | | | 0.92 | % | | | (1.69 | )% | | | 31 | % | | $ | 117,859 | |
| | | | | | | | | | | | | | | | | | | | | | | | | | | | |
| | $ | 16.15 | | | | 1.92 | % | | | 0.65 | % | | | 0.52 | % | | | (0.48 | )% | | | 8 | % | | $ | 906,906 | |
| | $ | 16.37 | | | | 1.55 | % | | | 0.65 | % | | | 0.52 | % | | | 1.37 | % | | | 20 | % | | $ | 846,499 | |
| | $ | 16.69 | | | | 1.44 | % | | | 0.67 | % | | | 0.52 | % | | | 22.66 | % | | | 21 | % | | $ | 654,804 | |
| | $ | 13.84 | | | | 1.42 | % | | | 0.72 | % | | | 0.62 | % | | | 58.11 | % | | | 29 | % | | $ | 377,937 | |
| | $ | 8.88 | | | | 1.88 | % | | | 0.85 | % | | | 0.69 | % | | | (42.36 | )% | | | 29 | % | | $ | 136,386 | |
| | $ | 16.29 | | | | 1.66 | % | | | 0.85 | % | | | 0.69 | % | | | (1.47 | )% | | | 31 | % | | $ | 125,256 | |
| | | | | | | | | | | | | | | | | | | | | | | | | | | | |
| | $ | 16.10 | | | | 1.50 | % | | | 1.15 | % | | | 0.93 | % | | | (0.66 | )% | | | 8 | % | | $ | 72,784 | |
| | $ | 16.32 | | | | 1.14 | % | | | 1.15 | % | | | 0.93 | % | | | 0.96 | % | | | 20 | % | | $ | 64,452 | |
| | $ | 16.65 | | | | 1.01 | % | | | 1.18 | % | | | 0.93 | % | | | 22.10 | % | | | 21 | % | | $ | 48,906 | |
| | $ | 13.81 | | | | 1.16 | % | | | 1.27 | % | | | 0.96 | % | | | 57.54 | % | | | 29 | % | | $ | 20,959 | |
| | $ | 8.87 | | | | 1.58 | % | | | 1.41 | % | | | 0.98 | % | | | (42.51 | )% | | | 29 | % | | $ | 6,970 | |
| | $ | 16.28 | | | | 1.29 | % | | | 1.43 | % | | | 0.98 | % | | | (1.74 | )% | | | 31 | % | | $ | 5,133 | |
Please see footnotes on page 64.
The accompanying notes are an integral part of these financial statements.
| | | | |
| 60 | | Wells Fargo Advantage Dow Jones Target Date Funds | | Financial highlights |
| | | | | | | | | | | | | | | | | | | | |
| | | Beginning
net asset
value per
share | | | Net
investment
income¹ | | | Net realized
and unrealized
gains (losses)
on investments | | | Distributions
from net
investment
income | | | Distributions
from net
realized gains | |
| | | | | |
Target 2045 Fund | | | | | | | | | | | | | | | | | | | | |
Administrator Class | | | | | | | | | | | | | | | | | | | | |
March 1, 2012 to August 31, 2012 (unaudited) | | $ | 9.59 | | | | 0.07 | | | | (0.15 | ) | | | (0.05 | ) | | | 0.00 | |
March 1, 2011 to February 29, 2012 | | $ | 9.66 | | | | 0.11 | | | | (0.05 | ) | | | (0.09 | ) | | | (0.04 | ) |
March 1, 2010 to February 28, 2011 | | $ | 8.12 | | | | 0.09 | | | | 1.72 | | | | (0.16 | ) | | | (0.11 | ) |
March 1, 2009 to February 28, 2010 | | $ | 5.21 | | | | 0.08 | 4 | | | 2.92 | | | | (0.07 | ) | | | (0.02 | ) |
March 1, 2008 to February 28, 2009 | | $ | 9.18 | | | | 0.12 | 4 | | | (3.94 | ) | | | (0.15 | ) | | | 0.00 | |
June 29, 20076 to February 29, 2008 | | $ | 10.00 | | | | 0.09 | 4 | | | (0.91 | ) | | | 0.00 | | | | 0.00 | |
Institutional Class | | | | | | | | | | | | | | | | | | | | |
March 1, 2012 to August 31, 2012 (unaudited) | | $ | 9.55 | | | | 0.09 | | | | (0.15 | ) | | | (0.08 | ) | | | 0.00 | |
March 1, 2011 to February 29, 2012 | | $ | 9.62 | | | | 0.14 | | | | (0.05 | ) | | | (0.12 | ) | | | (0.04 | ) |
March 1, 2010 to February 28, 2011 | | $ | 8.08 | | | | 0.13 | | | | 1.70 | | | | (0.18 | ) | | | (0.11 | ) |
March 1, 2009 to February 28, 2010 | | $ | 5.19 | | | | 0.10 | 4 | | | 2.90 | | | | (0.09 | ) | | | (0.02 | ) |
March 1, 2008 to February 28, 2009 | | $ | 9.09 | | | | 0.13 | 4 | | | (3.91 | ) | | | (0.12 | ) | | | 0.00 | |
June 29, 20076 to February 29, 2008 | | $ | 10.00 | | | | 0.09 | 4 | | | (0.90 | ) | | | (0.10 | ) | | | 0.00 | |
Investor Class | | | | | | | | | | | | | | | | | | | | |
March 1, 2012 to August 31, 2012 (unaudited) | | $ | 9.62 | | | | 0.07 | | | | (0.15 | ) | | | (0.05 | ) | | | 0.00 | |
March 1, 2011 to February 29, 2012 | | $ | 9.69 | | | | 0.11 | | | | (0.05 | ) | | | (0.09 | ) | | | (0.04 | ) |
March 1, 2010 to February 28, 2011 | | $ | 8.14 | | | | 0.08 | | | | 1.73 | | | | (0.15 | ) | | | (0.11 | ) |
March 1, 2009 to February 28, 2010 | | $ | 5.23 | | | | 0.09 | 4 | | | 2.91 | | | | (0.07 | ) | | | (0.02 | ) |
March 1, 2008 to February 28, 2009 | | $ | 9.17 | | | | 0.11 | 4 | | | (3.95 | ) | | | (0.10 | ) | | | 0.00 | |
June 29, 20076 to February 29, 2008 | | $ | 10.00 | | | | 0.09 | 4 | | | (0.92 | ) | | | 0.00 | | | | 0.00 | |
Please see footnotes on page 64.
The accompanying notes are an integral part of these financial statements.
| | | | | | |
| Financial highlights | | Wells Fargo Advantage Dow Jones Target Date Funds | | | 61 | |
| | | | | | | | | | | | | | | | | | | | | | | | | | | | |
| | | Ending
net asset
value
per
share | | | Ratio to average net assets (annualized) | | | | | | Portfolio
turnover
rate3 | | | Net assets at
end of period
(000s omitted) | |
| | | Net investment
income¹ | | | Gross
expenses1 | | | Net
expenses1 | | | Total
return2 | | | |
| | | | | | | |
| | | | | | | | | | | | | | | | | | | | | | | | | | | | | |
| | | | | | | | | | | | | | | | | | | | | | | | | | | | |
| | $ | 9.46 | | | | 1.55 | % | | | 0.96 | % | | | 0.87 | % | | | (0.80 | )% | | | 7 | % | | $ | 44,869 | |
| | $ | 9.59 | | | | 1.18 | % | | | 0.94 | % | | | 0.87 | % | | | 0.85 | % | | | 19 | % | | $ | 39,964 | |
| | $ | 9.66 | | | | 1.02 | % | | | 0.97 | % | | | 0.87 | % | | | 22.56 | % | | | 20 | % | | $ | 27,698 | |
| | $ | 8.12 | | | | 1.11 | % | | | 1.22 | % | | | 0.89 | % | | | 57.87 | % | | | 27 | % | | $ | 14,948 | |
| | $ | 5.21 | | | | 1.62 | % | | | 2.34 | % | | | 0.92 | % | | | (42.22 | )% | | | 29 | % | | $ | 1,656 | |
| | $ | 9.18 | | | | 1.45 | % | | | 13.36 | % | | | 0.56 | % | | | (8.20 | )% | | | 30 | % | | $ | 948 | |
| | | | | | | | | | | | | | | | | | | | | | | | | | | | |
| | $ | 9.41 | | | | 1.91 | % | | | 0.69 | % | | | 0.52 | % | | | (0.59 | )% | | | 7 | % | | $ | 254,674 | |
| | $ | 9.55 | | | | 1.51 | % | | | 0.67 | % | | | 0.52 | % | | | 1.16 | % | | | 19 | % | | $ | 215,067 | |
| | $ | 9.62 | | | | 1.26 | % | | | 0.70 | % | | | 0.52 | % | | | 23.08 | % | | | 20 | % | | $ | 141,871 | |
| | $ | 8.08 | | | | 1.26 | % | | | 0.95 | % | | | 0.59 | % | | | 58.02 | % | | | 27 | % | | $ | 51,776 | |
| | $ | 5.19 | | | | 1.84 | % | | | 2.02 | % | | | 0.69 | % | | | (42.06 | )% | | | 29 | % | | $ | 8,287 | |
| | $ | 9.09 | | | | 1.46 | % | | | 12.60 | % | | | 0.53 | % | | | (8.12 | )% | | | 30 | % | | $ | 4,339 | |
| | | | | | | | | | | | | | | | | | | | | | | | | | | | |
| | $ | 9.49 | | | | 1.48 | % | | | 1.19 | % | | | 0.93 | % | | | (0.83 | )% | | | 7 | % | | $ | 146,454 | |
| | $ | 9.62 | | | | 1.12 | % | | | 1.17 | % | | | 0.93 | % | | | 0.80 | % | | | 19 | % | | $ | 115,546 | |
| | $ | 9.69 | | | | 0.98 | % | | | 1.21 | % | | | 0.93 | % | | | 22.58 | % | | | 20 | % | | $ | 84,881 | |
| | $ | 8.14 | | | | 1.12 | % | | | 1.51 | % | | | 0.95 | % | | | 57.49 | % | | | 27 | % | | $ | 12,352 | |
| | $ | 5.23 | | | | 1.55 | % | | | 2.58 | % | | | 0.98 | % | | | (42.22 | )% | | | 29 | % | | $ | 1,205 | |
| | $ | 9.17 | | | | 1.43 | % | | | 12.57 | % | | | 0.56 | % | | | (8.30 | )% | | | 30 | % | | $ | 547 | |
Please see footnotes on page 64.
The accompanying notes are an integral part of these financial statements.
| | | | |
| 62 | | Wells Fargo Advantage Dow Jones Target Date Funds | | Financial highlights |
| | | | | | | | | | | | | | | | | | | | |
| | |
Beginning
net asset
value per
share | | | Net
investment
income¹ | | | Net realized
and unrealized
gains (losses)
on investments | | | Distributions
from net
investment
income | | | Distributions
from net
realized gains | |
| | | | | |
Target 2050 Fund | | | | | | | | | | | | | | | | | | | | |
Administrator Class | | | | | | | | | | | | | | | | | | | | |
March 1, 2012 to August 31, 2012 (unaudited) | | $ | 9.18 | | | | 0.07 | 4 | | | (0.09 | ) | | | (0.06 | ) | | | 0.00 | |
March 1, 2011 to February 29, 2012 | | $ | 9.48 | | | | 0.11 | | | | (0.07 | ) | | | (0.09 | ) | | | (0.25 | ) |
March 1, 2010 to February 28, 2011 | | $ | 8.10 | | | | 0.09 | 4 | | | 1.71 | | | | (0.15 | ) | | | (0.27 | ) |
March 1, 2009 to February 28, 2010 | | $ | 5.20 | | | | 0.09 | | | | 2.91 | | | | (0.07 | ) | | | (0.03 | ) |
March 1, 2008 to February 28, 2009 | | $ | 9.14 | | | | 0.12 | 4 | | | (3.96 | ) | | | (0.10 | ) | | | 0.00 | |
June 29, 20076 to February 29, 2008 | | $ | 10.00 | | | | 0.08 | 4 | | | (0.92 | ) | | | (0.02 | ) | | | 0.00 | |
Institutional Class | | | | | | | | | | | | | | | | | | | | |
March 1, 2012 to August 31, 2012 (unaudited) | | $ | 9.20 | | | | 0.09 | | | | (0.15 | ) | | | (0.07 | ) | | | 0.00 | |
March 1, 2011 to February 29, 2012 | | $ | 9.50 | | | | 0.14 | | | | (0.07 | ) | | | (0.12 | ) | | | (0.25 | ) |
March 1, 2010 to February 28, 2011 | | $ | 8.10 | | | | 0.12 | 4 | | | 1.72 | | | | (0.17 | ) | | | (0.27 | ) |
March 1, 2009 to February 28, 2010 | | $ | 5.20 | | | | 0.10 | | | | 2.92 | | | | (0.09 | ) | | | (0.03 | ) |
March 1, 2008 to February 28, 2009 | | $ | 9.13 | | | | 0.13 | 4 | | | (3.94 | ) | | | (0.12 | ) | | | 0.00 | |
June 29, 20076 to February 29, 2008 | | $ | 10.00 | | | | 0.08 | 4 | | | (0.90 | ) | | | (0.05 | ) | | | 0.00 | |
Investor Class | | | | | | | | | | | | | | | | | | | | |
March 1, 2012 to August 31, 2012 (unaudited) | | $ | 9.21 | | | | 0.07 | | | | (0.14 | ) | | | (0.06 | ) | | | 0.00 | |
March 1, 2011 to February 29, 2012 | | $ | 9.51 | | | | 0.10 | | | | (0.06 | ) | | | (0.09 | ) | | | (0.25 | ) |
March 1, 2010 to February 28, 2011 | | $ | 8.11 | | | | 0.09 | 4 | | | 1.71 | | | | (0.13 | ) | | | (0.27 | ) |
March 1, 2009 to February 28, 2010 | | $ | 5.21 | | | | 0.07 | | | | 2.93 | | | | (0.07 | ) | | | (0.03 | ) |
March 1, 2008 to February 28, 2009 | | $ | 9.16 | | | | 0.11 | 4 | | | (3.96 | ) | | | (0.10 | ) | | | 0.00 | |
June 29, 20076 to February 29, 2008 | | $ | 10.00 | | | | 0.07 | 4 | | | (0.91 | ) | | | 0.00 | | | | 0.00 | |
Please see footnotes on page 64.
The accompanying notes are an integral part of these financial statements.
| | | | | | |
| Financial highlights | | Wells Fargo Advantage Dow Jones Target Date Funds | | | 63 | |
| | | | | | | | | | | | | | | | | | | | | | | | | | | | |
| | | Ending
net asset
value
per
share | | | Ratio to average net assets (annualized) | | | | | | Portfolio
turnover
rate3 | | | Net assets at
end of period
(000s omitted) | |
| | | Net investment
income¹ | | | Gross
expenses1 | | | Net
expenses1 | | | Total
return2 | | | |
| | | | | | | |
| | | | | | | | | | | | | | | | | | | | | | | | | | | | | |
| | | | | | | | | | | | | | | | | | | | | | | | | | | | |
| | $ | 9.10 | | | | 1.55 | % | | | 0.94 | % | | | 0.87 | % | | | (0.73 | )% | | | 7 | % | | $ | 100,657 | |
| | $ | 9.18 | | | | 1.18 | % | | | 0.93 | % | | | 0.87 | % | | | 0.81 | % | | | 19 | % | | $ | 89,984 | |
| | $ | 9.48 | | | | 1.07 | % | | | 0.94 | % | | | 0.87 | % | | | 22.58 | % | | | 20 | % | | $ | 69,492 | |
| | $ | 8.10 | | | | 1.49 | % | | | 1.04 | % | | | 0.90 | % | | | 57.99 | % | | | 27 | % | | $ | 37,853 | |
| | $ | 5.20 | | | | 1.60 | % | | | 1.48 | % | | | 0.92 | % | | | (42.36 | )% | | | 29 | % | | $ | 10,984 | |
| | $ | 9.14 | | | | 1.18 | % | | | 5.13 | % | | | 0.87 | % | | | (8.37 | )% | | | 30 | % | | $ | 5,420 | |
| | | | | | | | | | | | | | | | | | | | | | | | | | | | |
| | $ | 9.07 | | | | 1.91 | % | | | 0.67 | % | | | 0.52 | % | | | (0.57 | )% | | | 7 | % | | $ | 688,483 | |
| | $ | 9.20 | | | | 1.53 | % | | | 0.66 | % | | | 0.52 | % | | | 1.11 | % | | | 19 | % | | $ | 651,308 | |
| | $ | 9.50 | | | | 1.43 | % | | | 0.67 | % | | | 0.52 | % | | | 23.17 | % | | | 20 | % | | $ | 560,746 | |
| | $ | 8.10 | | | | 1.19 | % | | | 0.71 | % | | | 0.57 | % | | | 58.33 | % | | | 27 | % | | $ | 389,918 | |
| | $ | 5.20 | | | | 1.80 | % | | | 1.19 | % | | | 0.69 | % | | | (42.19 | )% | | | 29 | % | | $ | 26,763 | |
| | $ | 9.13 | | | | 1.32 | % | | | 5.32 | % | | | 0.67 | % | | | (8.26 | )% | | | 30 | % | | $ | 8,102 | |
| | | | | | | | | | | | | | | | | | | | | | | | | | | | |
| | $ | 9.08 | | | | 1.49 | % | | | 1.16 | % | | | 0.93 | % | | | (0.76 | )% | | | 7 | % | | $ | 33,558 | |
| | $ | 9.21 | | | | 1.12 | % | | | 1.16 | % | | | 0.93 | % | | | 0.75 | % | | | 19 | % | | $ | 28,615 | |
| | $ | 9.51 | | | | 1.02 | % | | | 1.19 | % | | | 0.93 | % | | | 22.54 | % | | | 20 | % | | $ | 24,771 | |
| | $ | 8.11 | | | | 1.00 | % | | | 1.28 | % | | | 0.95 | % | | | 57.89 | % | | | 27 | % | | $ | 19,359 | |
| | $ | 5.21 | | | | 1.48 | % | | | 1.73 | % | | | 0.98 | % | | | (42.39 | )% | | | 29 | % | | $ | 983 | |
| | $ | 9.16 | | | | 1.06 | % | | | 5.27 | % | | | 0.94 | % | | | (8.40 | )% | | | 30 | % | | $ | 335 | |
Please see footnotes on page 64.
The accompanying notes are an integral part of these financial statements.
| | | | |
| 64 | | Wells Fargo Advantage Dow Jones Target Date Funds | | Financial highlights |
| | | | | | | | | | | | | | | | |
| | | Beginning
net asset
value per
share | | | Net
investment
income1 | | | Net realized
and unrealized
gains (losses)
on investments | | | Distributions
from net
investment
income | |
| | | | |
Target 2055 Fund | | | | | | | | | | | | | | | | |
Administrator Class | | | | | | | | | | | | | | | | |
March 1, 2012 to August 31, 2012 (unaudited) | | $ | 10.06 | | | | 0.07 | | | | (0.16 | ) | | | (0.03 | ) |
June 30, 20116 to February 29, 2012 | | $ | 10.00 | | | | 0.06 | 4 | | | 0.00 | 5 | | | 0.00 | |
Institutional Class | | | | | | | | | | | | | | | | |
March 1, 2012 to August 31, 2012 (unaudited) | | $ | 10.08 | | | | 0.09 | 4 | | | (0.16 | ) | | | (0.07 | ) |
June 30, 20116 to February 29, 2012 | | $ | 10.00 | | | | 0.08 | 4 | | | 0.00 | 5 | | | 0.00 | |
Investor Class | | | | | | | | | | | | | | | | |
March 1, 2012 to August 31, 2012 (unaudited) | | $ | 10.05 | | | | 0.06 | | | | (0.14 | ) | | | (0.11 | ) |
June 30, 20116 to February 29, 2012 | | $ | 10.00 | | | | 0.06 | 4 | | | (0.01 | ) | | | 0.00 | |
| 1. | Includes net expenses allocated from affiliated Master Portfolios in which the Fund invests. |
| 2. | Total return calculations do not include any sales charges. Returns for periods less than one year are not annualized. |
| 3. | Portfolio turnover rate represents the weighted average portfolio turnover in each respective Master Portfolio. |
| 4. | Calculated based upon average shares outstanding. |
| 5. | Amount is less than $0.005. |
| 6. | Commencement of class operations. |
The accompanying notes are an integral part of these financial statements.
| | | | | | |
| Financial highlights | | Wells Fargo Advantage Dow Jones Target Date Funds | | | 65 | |
| | | | | | | | | | | | | | | | | | | | | | | | | | |
Ending
net asset
value
per
share | | | Ratio to average net assets (annualized) | | | | | | Portfolio
turnover
rate3 | | | Net assets at
end of period
(000s omitted) | |
| | Net investment
income¹ | | | Gross
expenses1 | | | Net
expenses1 | | | Total
return2 | | | |
| | | | | | |
| | | | | | | | | | | | | | | | | | | | | | | | | | | |
| | | | | | | | | | | | | | | | | | | | | | | | | | |
| $ | 9.94 | | | | 1.55 | % | | | 1.65 | % | | | 0.87 | % | | | (0.82 | )% | | | 7 | % | | $ | 2,687 | |
| $ | 10.06 | | | | 0.87 | % | | | 2.14 | % | | | 0.87 | % | | | 0.60 | % | | | 19 | % | | $ | 1,794 | |
| | | | | | | | | | | | | | | | | | | | | | | | | | |
| $ | 9.94 | | | | 1.87 | % | | | 1.37 | % | | | 0.52 | % | | | (0.65 | )% | | | 7 | % | | $ | 16,580 | |
| $ | 10.08 | | | | 1.33 | % | | | 4.06 | % | | | 0.52 | % | | | 0.80 | % | | | 19 | % | | $ | 8,963 | |
| | | | | | | | | | | | | | | | | | | | | | | | | | |
| $ | 9.86 | | | | 1.46 | % | | | 1.87 | % | | | 0.93 | % | | | (0.77 | )% | | | 7 | % | | $ | 461 | |
| $ | 10.05 | | | | 0.94 | % | | | 6.32 | % | | | 0.93 | % | | | 0.50 | % | | | 19 | % | | $ | 256 | |
Please see footnotes on page 64.
The accompanying notes are an integral part of these financial statements.
| | | | |
| 66 | | Wells Fargo Advantage Dow Jones Target Date Funds | | Notes to financial statements (unaudited) |
1. ORGANIZATION
Wells Fargo Funds Trust (the “Trust”), a Delaware statutory trust organized on March 10, 1999, is an open-end management investment company registered under the Investment Company Act of 1940, as amended (the “1940 Act”). These financial statements report on the following funds: Wells Fargo Advantage Dow Jones Target Today Fund (“Target Today Fund”), Wells Fargo Advantage Dow Jones Target 2010 Fund (“Target 2010 Fund”), Wells Fargo Advantage Dow Jones Target 2015 Fund (“Target 2015 Fund”), Wells Fargo Advantage Dow Jones Target 2020 Fund (“Target 2020 Fund”), Wells Fargo Advantage Dow Jones Target 2025 Fund (“Target 2025 Fund”), Wells Fargo Advantage Dow Jones Target 2030 Fund (“Target 2030 Fund”), Wells Fargo Advantage Dow Jones Target 2035 Fund (“Target 2035 Fund”), Wells Fargo Advantage Dow Jones Target 2040 Fund (“Target 2040 Fund”), Wells Fargo Advantage Dow Jones Target 2045 Fund (“Target 2045 Fund”), Wells Fargo Advantage Dow Jones Target 2050 Fund (“Target 2050 Fund”) and Wells Fargo Advantage Dow Jones Target 2055 Fund (“Target 2055 Fund”) (each, a “Fund”, collectively, the “Funds”). Each Fund is a diversified series of the Trust.
The Funds each seek to achieve their investment objective by investing all investable assets in one or more separate diversified portfolios (each, a “Master Portfolio”, collectively, the “Master Portfolios”) of Wells Fargo Master Trust, a registered open-end management investment company. Each Master Portfolio directly acquires portfolio securities, and a Fund investing in a Master Portfolio acquires an indirect interest in those securities. Each Fund accounts for its investment in the Master Portfolios as partnership investments and records daily its share of the Master Portfolio’s income, expense and realized and unrealized gains and losses. The financial statements of the Master Portfolios for the six months ended August 31, 2012 are included in this report and should be read in conjunction with each Fund’s financial statements. As of August 31, 2012, the Funds own the following percentages of the Master Portfolios:
| | | | | | | | | | | | | | | | | | | | | | |
| | | Target
Today
Fund | | Target
2010
Fund | | Target
2015
Fund | | Target
2020
Fund | | Target
2025
Fund | | Target
2030
Fund | | Target
2035
Fund | | Target
2040
Fund | | Target
2045
Fund | | Target
2050
Fund | | Target
2055
Fund |
Wells Fargo Advantage Diversified Fixed Income Portfolio | | 16% | | 13% | | 11% | | 25% | | 16% | | 11% | | 3% | | 3% | | 1% | | 1% | | 0%* |
Wells Fargo Advantage Diversified Stock Portfolio | | 2% | | 3% | | 4% | | 15% | | 15% | | 19% | | 10% | | 16% | | 6% | | 10% | | 0%* |
Wells Fargo Advantage Short-Term Investment Portfolio | | 13% | | 6% | | 7% | | 18% | | 15% | | 15% | | 7% | | 10% | | 3% | | 6% | | 0%* |
| * | The amount invested is less than 1%. |
2. SIGNIFICANT ACCOUNTING POLICIES
The following significant accounting policies, which are consistently followed in the preparation of the financial statements of each Fund, are in conformity with U.S. generally accepted accounting principles which require management to make estimates and assumptions that affect the reported amounts of assets and liabilities, disclosure of contingent assets and liabilities at the date of the financial statements, and the reported amounts of revenues and expenses during the reporting period. Actual results could differ from those estimates.
Securities valuation
Investments in the Master Portfolios are valued daily based on each Fund’s proportionate share of each Master Portfolio’s net assets, which are also valued daily. Securities held in the Master Portfolios are valued as discussed in the Notes to Financial Statements of the Master Portfolios, which are included elsewhere in this report.
Investments which are not valued using the method discussed above are valued at their fair value, as determined by procedures established in good faith and approved by the Board of Trustees. The Board of Trustees has established a Valuation Committee comprised of the Trustees and has delegated to it the authority to take any actions regarding the valuation of portfolio securities that the Valuation Committee deems necessary in determining the fair value of portfolio securities, unless the responsibility has been delegated to the Management Valuation Team of Wells Fargo Funds Management, LLC (“Funds Management”). The Board of Trustees retains the authority to make any valuation decisions or approve any changes to the Valuation Procedures as it deems appropriate. On a quarterly basis, the Board of Trustees receives a report on any valuation actions taken by the Valuation Committee or the Management Valuation Team.
Security transactions and income recognition
Securities transactions are recorded on a trade date basis in each Master Portfolio. Realized gains or losses in each Master Portfolio are reported on the basis of identified cost of securities delivered.
Interest income is accrued daily and bond discounts are accreted and premiums are amortized daily based on the effective interest method by each Master Portfolio. To the extent debt obligations are placed on non-accrual status, any related interest income may be reduced by writing off interest receivables when the collection of all or a portion of interest has
| | | | | | |
| Notes to financial statements (unaudited) | | Wells Fargo Advantage Dow Jones Target Date Funds | | | 67 | |
become doubtful based on consistently applied procedures. If the issuer subsequently resumes interest payments or when the collectability of interest is reasonably assured, the debt obligation is removed from non-accrual status.
Dividend income in each Master Portfolio is recognized on the ex-dividend date, except for certain dividends from foreign securities, which are recorded as soon as the Master Portfolio is informed of the ex-dividend date.
Income from foreign securities in each Master Portfolio is recorded net of foreign taxes withheld where recovery of such taxes is not assured.
Each Fund records daily its proportionate share of each Master Portfolio’s interest and dividend income and realized and unrealized gains or losses.
Distributions to shareholders
Distributions to shareholders from net investment income and net realized gains, if any, are recorded on the ex-dividend date. Such distributions are determined in conformity with income tax regulations, which may differ from generally accepted accounting principles.
Federal and other taxes
Each Fund is treated as a separate entity for federal income tax purposes. Each Fund intends to continue to qualify as a regulated investment company by distributing substantially all of its investment company taxable income and any net realized capital gains (after reduction for capital loss carryforwards) sufficient to relieve it from all, or substantially all, federal income taxes. Accordingly, no provision for federal income taxes was required.
Each Fund’s income and federal excise tax returns and all financial records supporting those returns for the prior three fiscal years are subject to examination by the federal and Delaware revenue authorities. Management has analyzed each Fund’s tax positions taken on federal, state, and foreign tax returns for all open tax years and does not believe that there are any uncertain tax positions that require recognition of a tax liability.
As of February 29, 2012, Target 2055 Fund had post-enactment capital loss carryforwards (losses incurred on taxable years which began after December 22, 2010) which consist of $51,204 in long-term capital losses.
Class allocations
The separate classes of shares offered by each Fund differ principally in applicable sales charges, distribution, shareholder servicing, and administration fees. Shareholders of each class bear certain expenses that pertain to that particular class. All shareholders bear the common expenses of a Fund, earn income from the portfolios, and are allocated unrealized gains and losses pro rata based on the average daily net assets of each class, without distinction between share classes. Dividends are determined separately for each class based on income and expenses allocable to each class. Realized gains and losses are allocated to each class pro rata based upon the net assets of each class on the date realized. Differences in per share dividend rates generally result from the relative weightings of pro rata income and realized gain allocations and from differences in separate class expenses, including applicable distribution, shareholder servicing, and administration fees.
3. FAIR VALUATION MEASUREMENTS
Fair value measurements of investments are determined within a framework that has established a fair value hierarchy based upon the various data inputs utilized in determining the value of each Fund’s investments. The three-level hierarchy gives the highest priority to unadjusted quoted prices in active markets for identical assets or liabilities (Level 1) and the lowest priority to significant unobservable inputs (Level 3). Each Fund’s investments are classified within the fair value hierarchy based on the lowest level of input that is significant to the fair value measurement. The inputs are summarized into three broad levels as follows:
| n | | Level 1 – quoted prices in active markets for identical securities |
| n | | Level 2 – other significant observable inputs (including quoted prices for similar securities, interest rates, prepayment speeds, credit risk, etc.) |
| n | | Level 3 – significant unobservable inputs (including the Fund’s own assumptions in determining the fair value of investments) |
The inputs or methodologies used for valuing securities are not necessarily an indication of the risk associated with investing in those securities.
At August 31, 2012, each Fund’s investment in an affiliated Master Portfolio is carried at fair value with Level 2 inputs. Further details on the investments of the affiliated Master Portfolios can be found in the Summary Portfolio of Investments or Portfolio of Investments of each affiliated Master Portfolio which is contained elsewhere in this report.
| | | | |
| 68 | | Wells Fargo Advantage Dow Jones Target Date Funds | | Notes to financial statements (unaudited) |
Transfers in and transfers out are recognized at the end of the reporting period. For the six months ended August 31, 2012, the Funds did not have any transfers into/out of Level 1 and Level 2.
4. TRANSACTIONS WITH AFFILIATES AND OTHER EXPENSES
Advisory fees
The Trust has entered into an advisory contract with Funds Management, an indirect wholly owned subsidiary of Wells Fargo & Company (“Wells Fargo”). The adviser is responsible for implementing investment policies and guidelines and for supervising the sub-adviser, who is responsible for day-to-day portfolio management of the Funds.
Funds Management is the adviser for each Fund and is entitled to receive an advisory fee for providing such advisory services, including the determination of the asset allocations of each Fund’s investments in the various Master Portfolios. Funds Management is entitled to receive an annual advisory fee starting at 0.25% and declining to 0.19% as the average daily net assets of each Fund increase. For the six months ended August 31, 2012, the advisory fee was equivalent to an annual rate for each Fund as follows:
| | | | |
| | | Advisory fee | |
Target Today Fund | | | 0.24 | % |
Target 2010 Fund | | | 0.24 | |
Target 2015 Fund | | | 0.24 | |
Target 2020 Fund | | | 0.22 | |
Target 2025 Fund | | | 0.23 | |
Target 2030 Fund | | | 0.23 | |
Target 2035 Fund | | | 0.24 | |
Target 2040 Fund | | | 0.23 | |
Target 2045 Fund | | | 0.25 | |
Target 2050 Fund | | | 0.24 | |
Target 2055 Fund | | | 0.25 | |
Funds Management also serves as the adviser to each Master Portfolio and is entitled to receive a fee from each Master Portfolio for those services.
Funds Management has retained the services of a subadviser to provide daily portfolio management to the Funds. The fees for subadvisory services are borne by Funds Management. Global Index Advisors, Incorporated, is the subadviser to each Fund and is entitled to receive a fee from Funds Management at an annual rate starting at 0.06% and declining to 0.04% as the average daily net assets of each Fund increase.
Administration and transfer agent fees
The Trust has entered into an administration agreement with Funds Management. Under this agreement, for providing administrative services, which includes paying fees and expenses for services provided by the transfer agent, sub-transfer agents, omnibus account servicers and record-keepers, Funds Management is entitled to receive from each Fund an annual fund level administration fee starting at 0.05% and declining to 0.03% as the average daily net assets of each Fund increase and a class level administration fee which is calculated based on the average daily net assets of each class as follows:
| | |
| | | Class level administration fee |
| Class A, Class B, Class C | | 0.26% |
| Administrator Class | | 0.10 |
| Institutional Class | | 0.08 |
| Investor Class | | 0.32* |
| * | Prior to May 1, 2012, the class level administration fee for Investor Class was 0.33%. |
| | | | | | |
| Notes to financial statements (unaudited) | | Wells Fargo Advantage Dow Jones Target Date Funds | | | 69 | |
Funds Management has contractually waived and/or reimbursed advisory and administration fees to the extent necessary to maintain certain net operating expense ratios for the Funds. Waiver of fees and/or reimbursement of expenses by Funds Management were made first from fund level expenses on a proportionate basis and then from class specific expenses. Funds Management has committed through June 30, 2013 to waive fees and/or reimburse expenses to the extent necessary to cap each Fund’s expenses as follows:
| | | | | | | | | | | | | | | | | | | | | | | | |
| | | Class A | | | Class B | | | Class C | | | Administrator
Class | | | Institutional
Class | | | Investor
Class | |
Target Today Fund | | | 0.96% | | | | 1.71% | | | | 1.71% | | | | 0.80% | | | | 0.45% | | | | 0.86% | |
Target 2010 Fund | | | 0.99 | | | | 1.74 | | | | 1.74 | | | | 0.83 | | | | 0.48 | | | | 0.89 | |
Target 2015 Fund | | | N/A | | | | N/A | | | | N/A | | | | 0.84 | | | | 0.49 | | | | 0.90 | |
Target 2020 Fund | | | 1.01 | | | | 1.76 | | | | 1.76 | | | | 0.85 | | | | 0.50 | | | | 0.91 | |
Target 2025 Fund | | | N/A | | | | N/A | | | | N/A | | | | 0.85 | | | | 0.50 | | | | 0.91 | |
Target 2030 Fund | | | 1.02 | | | | 1.77 | | | | 1.77 | | | | 0.86 | | | | 0.51 | | | | 0.92 | |
Target 2035 Fund | | | N/A | | | | N/A | | | | N/A | | | | 0.87 | | | | 0.52 | | | | 0.93 | |
Target 2040 Fund | | | 1.03 | | | | 1.78 | | | | 1.78 | | | | 0.87 | | | | 0.52 | | | | 0.93 | |
Target 2045 Fund | | | N/A | | | | N/A | | | | N/A | | | | 0.87 | | | | 0.52 | | | | 0.93 | |
Target 2050 Fund | | | N/A | | | | N/A | | | | N/A | | | | 0.87 | | | | 0.52 | | | | 0.93 | |
Target 2055 Fund | | | N/A | | | | N/A | | | | N/A | | | | 0.87 | | | | 0.52 | | | | 0.93 | |
Distribution fees
The Trust has adopted a Distribution Plan for Class B and Class C shares of the applicable Funds pursuant to Rule 12b-1 under the 1940 Act. Distribution fees are charged to the Class B and Class C shares and paid to Wells Fargo Funds Distributor, LLC, the principal underwriter of each Fund, at an annual rate of 0.75% of the average daily net assets of Class B and Class C shares.
For the six months ended August 31, 2012, Wells Fargo Funds Distributor, LLC received the following amounts in front-end sales charges and contingent deferred sales charges:
| | | | | | | | | | | | |
| | | Front-end
sales charges Class A | | | Contingent deferred sales charges | |
| | | | Class B | | | Class C | |
Target Today Fund | | $ | 121 | | | $ | 0 | | | $ | 0 | |
Target 2010 Fund | | | 382 | | | | 0 | | | | 0 | |
Target 2020 Fund | | | 511 | | | | 16 | | | | 0 | |
Target 2030 Fund | | | 278 | | | | 29 | | | | 0 | |
Target 2040 Fund | | | 1,258 | | | | 46 | | | | 182 | |
Shareholder servicing fees
The Trust has entered into contracts with one or more shareholder servicing agents, whereby Class A, Class B, Class C, Administrator Class and Investor Class of each applicable Fund is charged a fee at an annual rate of 0.25% of the average daily net assets of each respective class.
A portion of these total shareholder servicing fees were paid to affiliates of Wells Fargo.
| | | | |
| 70 | | Wells Fargo Advantage Dow Jones Target Date Funds | | Notes to financial statements (unaudited) |
5. INVESTMENT PORTFOLIO TRANSACTIONS
Purchases and sales of investments, excluding U.S. Government obligations (if any) and short-term securities, for the six months ended August 31, 2012 were as follows:
| | | | | | | | |
| | | Purchases at cost* | | | Sales proceeds* | |
Target Today Fund | | $ | 219,379,102 | | | $ | 157,813,912 | |
Target 2010 Fund | | | 189,383,722 | | | | 133,691,380 | |
Target 2015 Fund | | | 179,817,496 | | | | 121,541,108 | |
Target 2020 Fund | | | 459,975,731 | | | | 294,229,975 | |
Target 2025 Fund | | | 354,785,085 | | | | 211,878,010 | |
Target 2030 Fund | | | 344,086,194 | | | | 189,466,007 | |
Target 2035 Fund | | | 144,002,126 | | | | 72,790,153 | |
Target 2040 Fund | | | 204,122,491 | | | | 95,861,945 | |
Target 2045 Fund | | | 66,003,917 | | | | 29,780,102 | |
Target 2050 Fund | | | 121,415,711 | | | | 54,625,395 | |
Target 2055 Fund | | | 2,936,638 | | | | 1,321,205 | |
| * | Each Fund seeks to achieve its investment objective by investing all of its investable assets in multiple Master Portfolios. Purchases and sales related to these investments have been calculated by aggregating the results of multiplying each Fund’s ownership percentage of the respective Master Portfolio by the corresponding Master Portfolio’s purchases and sales. |
6. BANK BORROWINGS
Each Fund and certain funds in the Trust are party to a $25,000,000 revolving credit agreement with the Bank of New York Mellon, whereby the Funds are permitted to use bank borrowings for temporary or emergency purposes, such as to fund shareholder redemption requests. Interest under the credit agreement is charged to each Fund based on a borrowing rate equal to the higher of the Federal Funds rate in effect on that day plus 1.25% or the overnight LIBOR rate in effect on that day plus 1.25%. In addition, an annual commitment fee equal to 0.15% of the unused balance is allocated to each participating fund. For the six months ended August 31, 2012, the Funds paid the following amounts in commitment fees:
| | | | |
| | | Commitment fee | |
Target Today Fund | | $ | 1,187 | |
Target 2010 Fund | | | 1,068 | |
Target 2015 Fund | | | 975 | |
Target 2020 Fund | | | 2,772 | |
Target 2025 Fund | | | 3,034 | |
Target 2030 Fund | | | 3,154 | |
Target 2035 Fund | | | 1,320 | |
Target 2040 Fund | | | 2,081 | |
Target 2045 Fund | | | 612 | |
Target 2050 Fund | | | 1,258 | |
Target 2055 Fund | | | 19 | |
For the six months ended August 31, 2012, there were no borrowings by the Funds under the agreement.
7. INDEMNIFICATION
Under the Trust’s organizational documents, the officers and directors are indemnified against certain liabilities that may arise out of performance of their duties to the Trust. Additionally, in the normal course of business, the Trust may enter into contracts with service providers that contain a variety of indemnification clauses. The Trust’s maximum exposure under these arrangements is dependent on future claims that may be made against the Funds and, therefore, cannot be estimated.
| | | | | | |
| Notes to financial statements (unaudited) | | Wells Fargo Advantage Dow Jones Target Date Funds | | | 71 | |
8. NEW ACCOUNTING PRONOUNCEMENT
In December 2011, the Financial Accounting Standards Board (“FASB”) issued Accounting Standard Update (“ASU”) No. 2011-11, Disclosures about Offsetting Assets and Liabilities. ASU 2011-11, which amends FASB ASC Topic 210, Balance Sheet, creates new disclosure requirements which require entities to disclose both gross and net information for derivatives and other financial instruments that are either offset in the Statement of Assets and Liabilities or subject to an enforceable master netting arrangement or similar agreement. The disclosure requirements are effective for interim and annual reporting periods beginning on or after January 1, 2013. Management is currently assessing the potential impact, in addition to expanded financial statement disclosure, that may result from adopting this ASU.
9. SUBSEQUENT DISTRIBUTIONS
On September 24, 2012, the Funds declared distributions from net investment income to shareholders of record on September 21, 2012. The per share amounts payable on September 25, 2012 were as follows:
| | | | | | | | | | | | | | | | | | | | | | | | | | | | | | |
| Net investment income | | Target
Today Fund | | Target
2010 Fund | | | Target
2015
Fund | | | Target
2020
Fund | | | Target 2025 Fund | | | Target
2030 Fund | | | Target
2035 Fund | | | Target
2040 Fund | |
Class A | | $0.11761 | | $ | 0.04722 | | | | N/A | | | $ | 0.04559 | | | | N/A | | | $ | 0.04267 | | | | N/A | | | $ | 0.04350 | |
Class B | | 0.00505 | | | 0.01417 | | | | N/A | | | | 0.01650 | | | | N/A | | | | 0.01189 | | | | N/A | | | | 0.01324 | |
Class C | | 0.05942 | | | 0.02257 | | | | N/A | | | | 0.01744 | | | | N/A | | | | 0.01565 | | | | N/A | | | | 0.01871 | |
Administrator Class | | 0.13149 | | | 0.05251 | | | $ | 0.03684 | | | | 0.05120 | | | $ | 0.03330 | | | | 0.04849 | | | $ | 0.02951 | | | | 0.04959 | |
Institutional Class | | 0.15830 | | | 0.06431 | | | | 0.04572 | | | | 0.06368 | | | | 0.04170 | | | | 0.06118 | | | | 0.03754 | | | | 0.06352 | |
Investor Class | | 0.12686 | | | 0.05077 | | | | 0.03565 | | | | 0.04927 | | | | 0.03215 | | | | 0.04651 | | | | 0.02825 | | | | 0.04772 | |
| | | | | | | | | | |
| Net investment income | | Target 2045 Fund | | Target 2050 Fund | | | Target 2055 Fund | |
Administrator Class | | $0.02825 | | $ | 0.02781 | | | $ | 0.02866 | |
Institutional Class | | 0.03616 | | | 0.03549 | | | | 0.03659 | |
Investor Class | | 0.02701 | | | 0.02639 | | | | 0.02649 | |
These distributions are not reflected in the accompanying financial statements.
| | | | |
| 72 | | Wells Fargo Advantage Dow Jones Target Date Funds | | Summary portfolio of investments—August 31, 2012 (unaudited) |
DIVERSIFIED FIXED INCOME PORTFOLIO
The Summary Portfolio of Investments shows the 50 largest portfolio holdings in unaffiliated issuers and any holdings exceeding 1% of the total net assets as of the report date. The remaining securities held are grouped as “Other securities” in each category. You can request a complete schedule of portfolio holdings as of the report date, free of charge, by accessing the following website:
http://a584.g.akamai.net/f/584/1326/1d/www.wellsfargoadvantagefunds.com/pdf/semi/holdings/diversifiedfixedincome.pdf or by calling Wells Fargo Advantage Funds at 1-800-222-8222. This complete schedule, filed on Form N-CSR, is also available on the SEC’s website at sec.gov.
| | | | | | | | | | | | | | | | | | | | |
| Security name | | Interest rate | | | Maturity date | | | Principal | | | Value | | | Percent of
net assets | |
| | | | | | | | | | | | | | | | | | | | |
| | | | | |
Agency Securities: 28.00% | | | | | | | | | | | | | | | | | | | | |
FHLB | | | 2.86-6.50 | % | | | 3-1-14 to 10-1-41 | | | $ | 232,472,913 | | | $ | 253,083,040 | | | | 5.28 | % |
FHLB | | | 4.50 | | | | 2-1-41 | | | | 9,441,945 | | | | 10,630,952 | | | | 0.22 | |
FHLB | | | 0.40-6.75 | | | | 9-27-13 to 7-15-32 | | | | 46,480,000 | | | | 50,329,289 | | | | 1.01 | |
FHLMC %% | | | 3.00 | | | | 9-1-27 | | | | 18,000,000 | | | | 18,914,062 | | | | 0.40 | |
FHLMC %% | | | 3.50 | | | | 9-1-42 | | | | 33,000,000 | | | | 34,923,280 | | | | 0.73 | |
FHLMC | | | 4.50 | | | | 2-1-40 | | | | 11,728,791 | | | | 12,865,549 | | | | 0.27 | |
FHLMC | | | 5.00 | | | | 8-1-39 | | | | 10,964,056 | | | | 11,912,952 | | | | 0.25 | |
FNMA | | | 0.00-7.25 | | | | 9-17-13 to 8-6-38 | | | | 50,600,000 | | | | 54,863,125 | | | | 1.14 | |
FNMA | | | 2.68-7.00 | | | | 12-1-12 to 5-25-42 | | | | 408,812,962 | | | | 444,872,122 | | | | 9.32 | |
FNMA %% | | | 3.00 | | | | 9-1-27 | | | | 12,000,000 | | | | 12,658,126 | | | | 0.27 | |
FNMA | | | 3.50 | | | | 12-1-25 | | | | 9,750,970 | | | | 10,521,352 | | | | 0.22 | |
FNMA | | | 3.50 | | | | 12-1-26 | | | | 16,426,528 | | | | 17,477,889 | | | | 0.37 | |
FNMA %% | | | 3.50 | | | | 9-1-42 | | | | 30,500,000 | | | | 32,334,664 | | | | 0.68 | |
FNMA | | | 3.50 | | | | 9-1-42 | | | | 14,868,425 | | | | 15,772,427 | | | | 0.33 | |
FNMA | | | 4.00 | | | | 5-1-41 | | | | 9,144,356 | | | | 9,819,582 | | | | 0.21 | |
FNMA | | | 4.50 | | | | 5-1-29 | | | | 12,072,262 | | | | 13,095,849 | | | | 0.27 | |
FNMA | | | 4.50 | | | | 2-1-41 | | | | 12,883,601 | | | | 14,008,188 | | | | 0.29 | |
FNMA | | | 5.00 | | | | 7-1-40 | | | | 12,323,160 | | | | 13,726,161 | | | | 0.29 | |
GNMA | | | 3.50-7.00 | | | | 11-15-23 to 7-15-42 | | | | 196,432,652 | | | | 217,452,146 | | | | 4.55 | |
GNMA | | | 3.50 | | | | 6-15-42 | | | | 13,916,107 | | | | 15,085,438 | | | | 0.32 | |
GNMA | | | 4.00 | | | | 9-15-40 | | | | 11,058,572 | | | | 12,160,416 | | | | 0.26 | |
GNMA | | | 4.50 | | | | 3-15-39 | | | | 9,676,657 | | | | 10,662,905 | | | | 0.22 | |
GNMA | | | 5.00 | | | | 9-15-39 | | | | 9,213,469 | | | | 10,373,929 | | | | 0.22 | |
Other securities | | | | | | | | | | | | | | | 40,649,589 | | | | 0.88 | |
| | | | | |
Total Agency Securities (Cost $1,274,633,629) | | | | | | | | | | | | | | | 1,338,193,032 | | | | 28.00 | |
| | | | | | | | | | | | | | | | | | | | |
| | | | | |
Corporate Bonds and Notes: 21.08% | | | | | | | | | | | | | | | | | | | | |
| | | | | |
Consumer Discretionary: 2.04% | | | | | | | | | | | | | | | | | | | | |
| | | | | |
| Auto Components: 0.04% | | | | | | | | | | | | | | | | | | | | |
Other securities | | | | | | | | | | | | | | | 2,125,783 | | | | 0.04 | |
| | | | | | | | | | | | | | | | | | | | |
| | | | | |
| Automobiles: 0.03% | | | | | | | | | | | | | | | | | | | | |
Other securities | | | | | | | | | | | | | | | 1,235,000 | | | | 0.03 | |
| | | | | | | | | | | | | | | | | | | | |
| | | | | |
| Diversified Consumer Services: 0.07% | | | | | | | | | | | | | | | | | | | | |
Other securities | | | | | | | | | | | | | | | 3,422,181 | | | | 0.07 | |
| | | | | | | | | | | | | | | | | | | | |
| | | | | |
| Hotels, Restaurants & Leisure: 0.17% | | | | | | | | | | | | | | | | | | | | |
Other securities | | | | | | | | | | | | | | | 8,246,754 | | | | 0.17 | |
| | | | | | | | | | | | | | | | | | | | |
| | | | | |
| Household Durables: 0.04% | | | | | | | | | | | | | | | | | | | | |
Other securities | | | | | | | | | | | | | | | 1,667,494 | | | | 0.04 | |
| | | | | | | | | | | | | | | | | | | | |
The accompanying notes are an integral part of these financial statements.
| | | | | | |
| Summary portfolio of investments—August 31, 2012 (unaudited) | | Wells Fargo Advantage Dow Jones Target Date Funds | | | 73 | |
DIVERSIFIED FIXED INCOME PORTFOLIO
| | | | | | | | | | | | | | | | | | | | |
| Security name | | | | | | | | | | | Value | | | Percent of
net assets | |
| | | | | | | | | | | | | | | | | | | | |
| | | | | |
| Internet & Catalog Retail: 0.01% | | | | | | | | | | | | | | | | | | | | |
Other securities | | | | | | | | | | | | | | $ | 657,412 | | | | 0.01 | % |
| | | | | | | | | | | | | | | | | | | | |
| | | | | |
| Leisure Equipment & Products: 0.02% | | | | | | | | | | | | | | | | | | | | |
Other securities | | | | | | | | | | | | | | | 1,030,843 | | | | 0.02 | |
| | | | | | | | | | | | | | | | | | | | |
| | | | | |
| Media: 1.24% | | | | | | | | | | | | | | | | | | | | |
Other securities | | | | | | | | | | | | | | | 59,440,844 | | | | 1.24 | |
| | | | | | | | | | | | | | | | | | | | |
| | | | | |
| Multiline Retail: 0.19% | | | | | | | | | | | | | | | | | | | | |
Other securities | | | | | | | | | | | | | | | 9,174,922 | | | | 0.19 | |
| | | | | | | | | | | | | | | | | | | | |
| | | | | |
| Specialty Retail: 0.22% | | | | | | | | | | | | | | | | | | | | |
Other securities | | | | | | | | | | | | | | | 10,287,128 | | | | 0.22 | |
| | | | | | | | | | | | | | | | | | | | |
| | | | | |
| Textiles, Apparel & Luxury Goods: 0.01% | | | | | | | | | | | | | | | | | | | | |
Other securities | | | | | | | | | | | | | | | 328,508 | | | | 0.01 | |
| | | | | | | | | | | | | | | | | | | | |
| | | | | |
Consumer Staples: 1.96% | | | | | | | | | | | | | | | | | | | | |
| | | | | |
| Beverages: 0.53% | | | | | | | | | | | | | | | | | | | | |
Other securities | | | | | | | | | | | | | | | 25,039,392 | | | | 0.53 | |
| | | | | | | | | | | | | | | | | | | | |
| | | | | |
| Food & Staples Retailing: 0.48% | | | | | | | | | | | | | | | | | | | | |
Other securities | | | | | | | | | | | | | | | 22,880,608 | | | | 0.48 | |
| | | | | | | | | | | | | | | | | | | | |
| | | | | |
| Food Products: 0.46% | | | | | | | | | | | | | | | | | | | | |
Other securities | | | | | | | | | | | | | | | 22,137,790 | | | | 0.46 | |
| | | | | | | | | | | | | | | | | | | | |
| | | | | |
| Household Products: 0.17% | | | | | | | | | | | | | | | | | | | | |
Other securities | | | | | | | | | | | | | | | 8,136,551 | | | | 0.17 | |
| | | | | | | | | | | | | | | | | | | | |
| | | | | |
| Personal Products: 0.02% | | | | | | | | | | | | | | | | | | | | |
Other securities | | | | | | | | | | | | | | | 1,134,815 | | | | 0.02 | |
| | | | | | | | | | | | | | | | | | | | |
| | | | | |
| Tobacco: 0.30% | | | | | | | | | | | | | | | | | | | | |
Other securities | | | | | | | | | | | | | | | 14,119,426 | | | | 0.30 | |
| | | | | | | | | | | | | | | | | | | | |
| | | | | |
Energy: 1.56% | | | | | | | | | | | | | | | | | | | | |
| | | | | |
| Energy Equipment & Services: 0.12% | | | | | | | | | | | | | | | | | | | | |
Other securities | | | | | | | | | | | | | | | 6,007,576 | | | | 0.12 | |
| | | | | | | | | | | | | | | | | | | | |
| | | | | |
| Oil, Gas & Consumable Fuels: 1.44% | | | | | | | | | | | | | | | | | | | | |
Other securities | | | | | | | | | | | | | | | 68,768,989 | | | | 1.44 | |
| | | | | | | | | | | | | | | | | | | | |
| | | | | |
Financials: 7.42% | | | | | | | | | | | | | | | | | | | | |
| | | | | |
| Capital Markets: 1.33% | | | | | | | | | | | | | | | | | | | | |
Other securities | | | | | | | | | | | | | | | 63,655,601 | | | | 1.33 | |
| | | | | | | | | | | | | | | | | | | | |
| | | | | |
| | | Interest rate | | | Maturity date | | | Principal | | | | | | | |
| | | | | |
| Commercial Banks: 0.94% | | | | | | | | | | | | | | | | | | | | |
Wachovia Bank NA (l) | | | 5.85-6.60 | % | | | 2 -1-37 to 1-15-38 | | | $ | 1,600,000 | | | | 2,060,198 | | | | 0.05 | |
Wachovia Corporation (l) | | | 5.25-5.75 | | | | 8 -1-14 to 8-1-35 | | | | 4,900,000 | | | | 5,655,847 | | | | 0.13 | |
The accompanying notes are an integral part of these financial statements.
| | | | |
| 74 | | Wells Fargo Advantage Dow Jones Target Date Funds | | Summary portfolio of investments—August 31, 2012 (unaudited) |
DIVERSIFIED FIXED INCOME PORTFOLIO
| | | | | | | | | | | | | | | | | | | | |
| Security name | | Interest rate | | | Maturity date | | | Principal | | | Value | | | Percent of
net assets | |
| | | | | | | | | | | | | | | | | | | | |
| | | | | |
| Commercial Banks (continued) | | | | | | | | | | | | | | | | | | | | |
Wells Fargo & Company (l) | | | 1.50-5.63 | % | | | 10 -16-13 to 4-1-21 | | | $ | 7,300,000 | | | $ | 8,047,354 | | | | 0.17 | % |
Wells Fargo Bank NA (l) | | | 5.95 | | | | 8-26-36 | | | | 350,000 | | | | 444,718 | | | | 0.01 | |
Wells Fargo Capital X (l) | | | 5.95 | | | | 12-15-36 | | | | 500,000 | | | | 507,500 | | | | 0.01 | |
Other securities | | | | | | | | | | | | | | | 28,091,147 | | | | 0.57 | |
| | | | | |
| | | | | | | | | | | | | | | 44,806,764 | | | | 0.94 | |
| | | | | | | | | | | | | | | | | | | | |
| | | | | |
| Consumer Finance: 0.97% | | | | | | | | | | | | | | | | | | | | |
Other securities | | | | | | | | | | | | | | | 46,188,407 | | | | 0.97 | |
| | | | | | | | | | | | | | | | | | | | |
| | | | | |
| Diversified Financial Services: 2.61% | | | | | | | | | | | | | | | | | | | | |
Other securities | | | | | | | | | | | | | | | 124,957,738 | | | | 2.61 | |
| | | | | | | | | | | | | | | | | | | | |
| | | | | |
| Insurance: 1.03% | | | | | | | | | | | | | | | | | | | | |
Other securities | | | | | | | | | | | | | | | 49,034,680 | | | | 1.03 | |
| | | | | | | | | | | | | | | | | | | | |
| | | | | |
| Real Estate Management & Development: 0.02% | | | | | | | | | | | | | | | | | | | | |
Other securities | | | | | | | | | | | | | | | 932,494 | | | | 0.02 | |
| | | | | | | | | | | | | | | | | | | | |
| | | | | |
| REITs: 0.52% | | | | | | | | | | | | | | | | | | | | |
Other securities | | | | | | | | | | | | | | | 24,805,621 | | | | 0.52 | |
| | | | | | | | | | | | | | | | | | | | |
| | | | | |
| Thrifts & Mortgage Finance: 0.00% | | | | | | | | | | | | | | | | | | | | |
Other securities | | | | | | | | | | | | | | | 102,422 | | | | 0.00 | |
| | | | | | | | | | | | | | | | | | | | |
| | | | | |
Health Care: 1.64% | | | | | | | | | | | | | | | | | | | | |
| | | | | |
| Biotechnology: 0.23% | | | | | | | | | | | | | | | | | | | | |
Other securities | | | | | | | | | | | | | | | 11,037,842 | | | | 0.23 | |
| | | | | | | | | | | | | | | | | | | | |
| | | | | |
| Health Care Equipment & Supplies: 0.23% | | | | | | | | | | | | | | | | | | | | |
Other securities | | | | | | | | | | | | | | | 11,080,975 | | | | 0.23 | |
| | | | | | | | | | | | | | | | | | | | |
| | | | | |
| Health Care Providers & Services: 0.42% | | | | | | | | | | | | | | | | | | | | |
Other securities | | | | | | | | | | | | | | | 20,085,055 | | | | 0.42 | |
| | | | | | | | | | | | | | | | | | | | |
| | | | | |
| Life Sciences Tools & Services: 0.07% | | | | | | | | | | | | | | | | | | | | |
Other securities | | | | | | | | | | | | | | | 3,265,028 | | | | 0.07 | |
| | | | | | | | | | | | | | | | | | | | |
| | | | | |
| Pharmaceuticals: 0.69% | | | | | | | | | | | | | | | | | | | | |
Other securities | | | | | | | | | | | | | | | 32,816,571 | | | | 0.69 | |
| | | | | | | | | | | | | | | | | | | | |
| | | | | |
Industrials: 1.60% | | | | | | | | | | | | | | | | | | | | |
| | | | | |
| Aerospace & Defense: 0.46% | | | | | | | | | | | | | | | | | | | | |
Other securities | | | | | | | | | | | | | | | 21,922,466 | | | | 0.46 | |
| | | | | | | | | | | | | | | | | | | | |
| | | | | |
| Air Freight & Logistics: 0.08% | | | | | | | | | | | | | | | | | | | | |
Other securities | | | | | | | | | | | | | | | 3,852,784 | | | | 0.08 | |
| | | | | | | | | | | | | | | | | | | | |
| | | | | |
| Airlines: 0.07% | | | | | | | | | | | | | | | | | | | | |
Other securities | | | | | | | | | | | | | | | 3,157,821 | | | | 0.07 | |
| | | | | | | | | | | | | | | | | | | | |
The accompanying notes are an integral part of these financial statements.
| | | | | | |
| Summary portfolio of investments—August 31, 2012 (unaudited) | | Wells Fargo Advantage Dow Jones Target Date Funds | | | 75 | |
DIVERSIFIED FIXED INCOME PORTFOLIO
| | | | | | | | | | | | | | |
| Security name | | | | | | | | Value | | | Percent of
net assets | |
| | | | | | | | | | | | | | |
| | | | | |
| Building Products: 0.01% | | | | | | | | | | | | | | |
Other securities | | | | | | | | $ | 557,858 | | | | 0.01 | % |
| | | | | | | | | | | | | | |
| | | | | |
| Commercial Services & Supplies: 0.22% | | | | | | | | | | | | | | |
Other securities | | | | | | | | | 10,257,205 | | | | 0.22 | |
| | | | | | | | | | | | | | |
| | | | | |
| Construction & Engineering: 0.01% | | | | | | | | | | | | | | |
Other securities | | | | | | | | | 502,007 | | | | 0.01 | |
| | | | | | | | | | | | | | |
| | | | | |
| Electrical Equipment: 0.06% | | | | | | | | | | | | | | |
Other securities | | | | | | | | | 2,864,841 | | | | 0.06 | |
| | | | | | | | | | | | | | |
| | | | | |
| Industrial Conglomerates: 0.11% | | | | | | | | | | | | | | |
Other securities | | | | | | | | | 5,159,823 | | | | 0.11 | |
| | | | | | | | | | | | | | |
| | | | | |
| Machinery: 0.24% | | | | | | | | | | | | | | |
Other securities | | | | | | | | | 11,619,421 | | | | 0.24 | |
| | | | | | | | | | | | | | |
| | | | | |
| Road & Rail: 0.34% | | | | | | | | | | | | | | |
Other securities | | | | | | | | | 16,425,875 | | | | 0.34 | |
| | | | | | | | | | | | | | |
| | | | | |
Information Technology: 1.14% | | | | | | | | | | | | | | |
| | | | | |
| Communications Equipment: 0.17% | | | | | | | | | | | | | | |
Other securities | | | | | | | | | 8,089,445 | | | | 0.17 | |
| | | | | | | | | | | | | | |
| | | | | |
| Computers & Peripherals: 0.20% | | | | | | | | | | | | | | |
Other securities | | | | | | | | | 9,673,622 | | | | 0.20 | |
| | | | | | | | | | | | | | |
| | | | | |
| Electronic Equipment, Instruments & Components: 0.06% | | | | | | | | | | | | | | |
Other securities | | | | | | | | | 2,730,379 | | | | 0.06 | |
| | | | | | | | | | | | | | |
| | | | | |
| Internet Software & Services: 0.04% | | | | | | | | | | | | | | |
Other securities | | | | | | | | | 1,782,543 | | | | 0.04 | |
| | | | | | | | | | | | | | |
| | | | | |
| IT Services: 0.22% | | | | | | | | | | | | | | |
Other securities | | | | | | | | | 10,583,846 | | | | 0.22 | |
| | | | | | | | | | | | | | |
| | | | | |
| Office Electronics: 0.07% | | | | | | | | | | | | | | |
Other securities | | | | | | | | | 3,578,631 | | | | 0.07 | |
| | | | | | | | | | | | | | |
| | | | | |
| Semiconductors & Semiconductor Equipment: 0.11% | | | | | | | | | | | | | | |
Other securities | | | | | | | | | 5,521,870 | | | | 0.11 | |
| | | | | | | | | | | | | | |
| | | | | |
| Software: 0.27% | | | | | | | | | | | | | | |
Other securities | | | | | | | | | 12,735,810 | | | | 0.27 | |
| | | | | | | | | | | | | | |
| | | | | |
Materials: 0.82% | | | | | | | | | | | | | | |
| | | | | |
| Chemicals: 0.41% | | | | | | | | | | | | | | |
Other securities | | | | | | | | | 19,504,300 | | | | 0.41 | |
| | | | | | | | | | | | | | |
| | | | | |
| Construction Materials: 0.00% | | | | | | | | | | | | | | |
Other securities | | | | | | | | | 138,675 | | | | 0.00 | |
| | | | | | | | | | | | | | |
The accompanying notes are an integral part of these financial statements.
| | | | |
| 76 | | Wells Fargo Advantage Dow Jones Target Date Funds | | Summary portfolio of investments—August 31, 2012 (unaudited) |
DIVERSIFIED FIXED INCOME PORTFOLIO
| | | | | | | | | | | | | | | | | | | | |
| Security name | | | | | | | | | | | Value | | | Percent of
net assets | |
| | | | | | | | | | | | | | | | | | | | |
| | | | | |
| Containers & Packaging: 0.02% | | | | | | | | | | | | | | | | | | | | |
Other securities | | | | | | | | | | | | | | $ | 777,894 | | | | 0.02 | % |
| | | | | | | | | | | | | | | | | | | | |
| | | | | |
| Metals & Mining: 0.28% | | | | | | | | | | | | | | | | | | | | |
Other securities | | | | | | | | | | | | | | | 13,522,110 | | | | 0.28 | |
| | | | | | | | | | | | | | | | | | | | |
| | | | | |
| Paper & Forest Products: 0.11% | | | | | | | | | | | | | | | | | | | | |
Other securities | | | | | | | | | | | | | | | 5,232,100 | | | | 0.11 | |
| | | | | | | | | | | | | | | | | | | | |
| | | | | |
Telecommunication Services: 0.95% | | | | | | | | | | | | | | | | | | | | |
| | | | | |
| Diversified Telecommunication Services: 0.95% | | | | | | | | | | | | | | | | | | | | |
Other securities | | | | | | | | | | | | | | | 45,333,956 | | | | 0.95 | |
| | | | | | | | | | | | | | | | | | | | |
| | | | | |
Utilities: 1.95% | | | | | | | | | | | | | | | | | | | | |
| | | | | |
| Electric Utilities: 1.54% | | | | | | | | | | | | | | | | | | | | |
Other securities | | | | | | | | | | | | | | | 73,557,274 | | | | 1.54 | |
| | | | | | | | | | | | | | | | | | | | |
| | | | | |
| Gas Utilities: 0.10% | | | | | | | | | | | | | | | | | | | | |
Other securities | | | | | | | | | | | | | | | 5,067,360 | | | | 0.10 | |
| | | | | | | | | | | | | | | | | | | | |
| | | | | |
Independent Power Producers & Energy Traders: 0.02% | | | | | | | | | | | | | | | | | | | | |
Other securities | | | | | | | | | | | | | | | 908,082 | | | | 0.02 | |
| | | | | | | | | | | | | | | | | | | | |
| | | | | |
| Multi-Utilities: 0.27% | | | | | | | | | | | | | | | | | | | | |
Other securities | | | | | | | | | | | | | | | 12,732,636 | | | | 0.27 | |
| | | | | | | | | | | | | | | | | | | | |
| | | | | |
| Water Utilities: 0.02% | | | | | | | | | | | | | | | | | | | | |
Other securities | | | | | | | | | | | | | | | 892,714 | | | | 0.02 | |
| | | | | | | | | | | | | | | | | | | | |
| | | | |
Total Corporate Bonds and Notes (Cost $901,780,216) | | | | | | | | | | | | 1,007,294,562 | | | | 21.08 | |
| | | | | | | | | | | | | | | | | | | | |
| | | | | |
| | | Interest rate | | | Maturity date | | | Principal | | | | | | | |
| Foreign Government Bonds @: 24.44% | | | | | | | | | | | | | | | | | | | | |
Germany Government Bond (EUR) | | | 2.25-6.50 | % | | | 1- 4-14 to 7-4-42 | | | | 44,855,000 | | | | 69,743,088 | | | | 1.47 | |
France Government Bond (EUR) | | | 2.50-8.50 | | | | 10-25-13 to 4-25-60 | | | | 57,900,000 | | | | 84,931,689 | | | | 1.78 | |
Italy Buoni Poliennali del Tesoro (EUR) 144A | | | 2.25-9.00 | | | | 8-1-13 to 9-1-40 | | | | 77,630,000 | | | | 94,363,410 | | | | 2.01 | |
Japan Government Five Year Bond Series 66 (JPY) | | | 0.40 | | | | 9-20-16 | | | | 1,525,000,000 | | | | 19,667,212 | | | | 0.41 | |
Japan Government Five Year Bond Series 78 (JPY) | | | 0.90 | | | | 12-20-13 | | | | 880,000,000 | | | | 11,354,838 | | | | 0.24 | |
Japan Government Ten Year Bond Series 253 (JPY) | | | 1.60 | | | | 9-20-13 | | | | 1,037,000,000 | | | | 13,452,285 | | | | 0.28 | |
Japan Government Ten Year Bond Series 308 (JPY) | | | 1.30 | | | | 6-20-20 | | | | 758,000,000 | | | | 10,237,923 | | | | 0.21 | |
Japan Government Two Year Bond Series 315 (JPY) | | | 1.20 | | | | 6-20-21 | | | | 865,000,000 | | | | 11,540,456 | | | | 0.24 | |
Other securities | | | | | | | | | | | | | | | 852,930,113 | | | | 17.80 | |
| | | | | | | | | | | | | | | | | | | | |
| | | | |
Total Foreign Government Bonds (Cost $1,102,379,517) | | | | | | | | | | | | 1,168,221,014 | | | | 24.44 | |
| | | | | | | | | | | | | | | | | | | | |
| | | | | |
| U.S. Treasury Securities: 21.66% | | | | | | | | | | | | | | | | | | | | |
U.S. Treasury Bond | | | 2.75-8.50 | | | | 2-15-20 to 5-15-42 | | | $ | 105,100,000 | | | | 140,704,973 | | | | 2.84 | |
U.S. Treasury Bond | | | 3.63 | | | | 2-15-20 | | | | 13,000,000 | | | | 15,380,625 | | | | 0.32 | |
U.S. Treasury Bond | | | 4.25 | | | | 11-15-40 | | | | 9,500,000 | | | | 12,688,438 | | | | 0.27 | |
U.S. Treasury Bond | | | 4.38 | | | | 11-15-39 | | | | 7,800,000 | | | | 10,599,467 | | | | 0.22 | |
U.S. Treasury Note | | | 0.25-11.25 | | | | 9-30-13 to 8-15-42 | | | | 465,145,000 | | | | 502,532,068 | | | | 10.62 | |
The accompanying notes are an integral part of these financial statements.
| | | | | | |
| Summary portfolio of investments—August 31, 2012 (unaudited) | | Wells Fargo Advantage Dow Jones Target Date Funds | | | 77 | |
DIVERSIFIED FIXED INCOME PORTFOLIO
| | | | | | | | | | | | | | | | | | | | |
| Security name | | Interest rate | | | Maturity date | | | Principal | | | Value | | | Percent of
net assets | |
| | | | | |
| U.S. Treasury Securities (continued) | | | | | | | | | | | | | | | | | | | | |
| | | | | | | | | | | | | | | | | | | | |
U.S. Treasury Note | | | 0.13 | % | | | 12-31-13 | | | $ | 20,000,000 | | | $ | 19,978,120 | | | | 0.42 | % |
U.S. Treasury Note | | | 0.25 | | | | 11-30-13 | | | | 10,000,000 | | | | 10,005,470 | | | | 0.21 | |
U.S. Treasury Note | | | 0.25 | | | | 2-28-14 | | | | 20,000,000 | | | | 20,010,940 | | | | 0.42 | |
U.S. Treasury Note | | | 0.25 | | | | 4-30-14 | | | | 15,000,000 | | | | 15,005,865 | | | | 0.31 | |
U.S. Treasury Note | | | 0.25 | | | | 6-30-14 | | | | 20,000,000 | | | | 20,008,600 | | | | 0.42 | |
U.S. Treasury Note | | | 0.25 | | | | 7-15-15 | | | | 15,000,000 | | | | 14,984,760 | | | | 0.31 | |
U.S. Treasury Note | | | 0.38 | | | | 3-15-15 | | | | 30,000,000 | | | | 30,084,360 | | | | 0.63 | |
U.S. Treasury Note | | | 0.63 | | | | 7-15-14 | | | | 10,000,000 | | | | 10,072,660 | | | | 0.21 | |
U.S. Treasury Note | | | 0.75 | | | | 9-15-13 | | | | 11,000,000 | | | | 11,062,733 | | | | 0.23 | |
U.S. Treasury Note | | | 0.75 | | | | 6-30-17 | | | | 15,000,000 | | | | 15,126,570 | | | | 0.32 | |
U.S. Treasury Note | | | 1.00 | | | | 3-31-17 | | | | 12,000,000 | | | | 12,255,000 | | | | 0.26 | |
U.S. Treasury Note | | | 1.25 | | | | 2-15-14 | | | | 15,000,000 | | | | 15,223,245 | | | | 0.32 | |
U.S. Treasury Note | | | 1.25 | | | | 4-30-19 | | | | 12,000,000 | | | | 12,244,692 | | | | 0.26 | |
U.S. Treasury Note | | | 1.38 | | | | 12-31-18 | | | | 10,000,000 | | | | 10,313,280 | | | | 0.22 | |
U.S. Treasury Note | | | 1.75 | | | | 3-31-14 | | | | 10,000,000 | | | | 10,239,060 | | | | 0.21 | |
U.S. Treasury Note | | | 2.00 | | | | 11-15-21 | | | | 21,000,000 | | | | 22,036,875 | | | | 0.46 | |
U.S. Treasury Note | | | 2.13 | | | | 8-15-21 | | | | 10,000,000 | | | | 10,632,810 | | | | 0.22 | |
U.S. Treasury Note | | | 2.25 | | | | 5-31-14 | | | | 13,500,000 | | | | 13,973,553 | | | | 0.29 | |
U.S. Treasury Note | | | 2.38 | | | | 2-28-15 | | | | 10,000,000 | | | | 10,524,220 | | | | 0.22 | |
U.S. Treasury Note | | | 2.63 | | | | 8-15-20 | | | | 12,000,000 | | | | 13,315,308 | | | | 0.28 | |
U.S. Treasury Note | | | 2.63 | | | | 11-15-20 | | | | 10,000,000 | | | | 11,087,500 | | | | 0.23 | |
U.S. Treasury Note | | | 2.75 | | | | 2-15-19 | | | | 8,950,000 | | | | 9,998,833 | | | | 0.21 | |
U.S. Treasury Note | | | 3.63 | | | | 8-15-19 | | | | 9,500,000 | | | | 11,203,322 | | | | 0.23 | |
U.S. Treasury Note | | | 3.63 | | | | 2-15-21 | | | | 20,000,000 | | | | 23,787,500 | | | | 0.50 | |
| | | | | | | | | | | | | | | | | | | | |
| | | | |
Total U.S. Treasury Securities (Cost $966,152,754) | | | | | | | | | | | | 1,035,080,847 | | | | 21.66 | |
| | | | | | | | | | | | | | | | | | | | |
| | | | | |
Yankee Corporate Bonds and Notes: 3.68% | | | | | | | | | | | | | | | | | | | | |
| | | | | |
Consumer Discretionary: 0.05% | | | | | | | | | | | | | | | | | | | | |
| | | | | |
| Media: 0.05% | | | | | | | | | | | | | | | | | | | | |
Other securities | | | | | | | | | | | | | | | 2,271,116 | | | | 0.05 | |
| | | | | | | | | | | | | | | | | | | | |
| | | | | |
Consumer Staples: 0.06% | | | | | | | | | | | | | | | | | | | | |
| | | | | |
| Beverages: 0.06% | | | | | | | | | | | | | | | | | | | | |
Other securities | | | | | | | | | | | | | | | 2,797,831 | | | | 0.06 | |
| | | | | | | | | | | | | | | | | | | | |
| | | | | |
Energy: 0.66% | | | | | | | | | | | | | | | | | | | | |
| | | | | |
| Energy Equipment & Services: 0.04% | | | | | | | | | | | | | | | | | | | | |
Other securities | | | | | | | | | | | | | | | 1,895,871 | | | | 0.04 | |
| | | | | | | | | | | | | | | | | | | | |
| | | | | |
| Oil, Gas & Consumable Fuels: 0.62% | | | | | | | | | | | | | | | | | | | | |
Other securities | | | | | | | | | | | | | | | 29,751,723 | | | | 0.62 | |
| | | | | | | | | | | | | | | | | | | | |
| | | | | |
Financials: 1.65% | | | | | | | | | | | | | | | | | | | | |
| | | | | |
| Capital Markets: 0.18% | | | | | | | | | | | | | | | | | | | | |
Other securities | | | | | | | | | | | | | | | 8,731,648 | | | | 0.18 | |
| | | | | | | | | | | | | | | | | | | | |
| | | | | |
| Commercial Banks: 0.77% | | | | | | | | | | | | | | | | | | | | |
Other securities | | | | | | | | | | | | | | | 36,839,732 | | | | 0.77 | |
| | | | | | | | | | | | | | | | | | | | |
The accompanying notes are an integral part of these financial statements.
| | | | |
| 78 | | Wells Fargo Advantage Dow Jones Target Date Funds | | Summary portfolio of investments—August 31, 2012 (unaudited) |
DIVERSIFIED FIXED INCOME PORTFOLIO
| | | | | | | | | | | | | | |
| Security name | | | | | | | | Value | | | Percent of
net assets | |
| | | | | | | | | | | | | | |
| | | | | |
| Diversified Financial Services: 0.65% | | | | | | | | | | | | | | |
Other securities | | | | | | | | $ | 30,951,257 | | | | 0.65 | % |
| | | | | | | | | | | | | | |
| | | | | |
| Insurance: 0.05% | | | | | | | | | | | | | | |
Other securities | | | | | | | | | 2,106,641 | | | | 0.05 | |
| | | | | | | | | | | | | | |
| | | | | |
| Real Estate Management & Development: 0.00% | | | | | | | | | | | | | | |
Other securities | | | | | | | | | 137,407 | | | | 0.00 | |
| | | | | | | | | | | | | | |
| | | | | |
Health Care: 0.15% | | | | | | | | | | | | | | |
| | | | | |
| Pharmaceuticals: 0.15% | | | | | | | | | | | | | | |
Other securities | | | | | | | | | 7,066,610 | | | | 0.15 | |
| | | | | | | | | | | | | | |
| | | | | |
Industrials: 0.12% | | | | | | | | | | | | | | |
| | | | | |
| Aerospace & Defense: 0.01% | | | | | | | | | | | | | | |
Other securities | | | | | | | | | 774,500 | | | | 0.01 | |
| | | | | | | | | | | | | | |
| | | | | |
| Commercial Services & Supplies: 0.02% | | | | | | | | | | | | | | |
Other securities | | | | | | | | | 870,789 | | | | 0.02 | |
| | | | | | | | | | | | | | |
| | | | | |
| Industrial Conglomerates: 0.06% | | | | | | | | | | | | | | |
Other securities | | | | | | | | | 2,719,694 | | | | 0.06 | |
| | | | | | | | | | | | | | |
| | | | | |
| Road & Rail: 0.03% | | | | | | | | | | | | | | |
Other securities | | | | | | | | | 1,599,871 | | | | 0.03 | |
| | | | | | | | | | | | | | |
| | | | | |
Materials: 0.34% | | | | | | | | | | | | | | |
| | | | | |
| Chemicals: 0.04% | | | | | | | | | | | | | | |
Other securities | | | | | | | | | 1,973,142 | | | | 0.04 | |
| | | | | | | | | | | | | | |
| | | | | |
| Metals & Mining: 0.28% | | | | | | | | | | | | | | |
Other securities | | | | | | | | | 13,353,525 | | | | 0.28 | |
| | | | | | | | | | | | | | |
| | | | | |
| Paper & Forest Products: 0.02% | | | | | | | | | | | | | | |
Other securities | | | | | | | | | 1,017,286 | | | | 0.02 | |
| | | | | | | | | | | | | | |
| | | | | |
Telecommunication Services: 0.60% | | | | | | | | | | | | | | |
| | | | | |
| Diversified Telecommunication Services: 0.37% | | | | | | | | | | | | | | |
Other securities | | | | | | | | | 17,635,306 | | | | 0.37 | |
| | | | | | | | | | | | | | |
| | | | | |
| Wireless Telecommunication Services: 0.23% | | | | | | | | | | | | | | |
Other securities | | | | | | | | | 11,131,677 | | | | 0.23 | |
| | | | | | | | | | | | | | |
| | | | | |
Utilities: 0.05% | | | | | | | | | | | | | | |
| | | | | |
| Electric Utilities: 0.01% | | | | | | | | | | | | | | |
Other securities | | | | | | | | | 266,764 | | | | 0.01 | |
| | | | | | | | | | | | | | |
| | | | | |
| Independent Power Producers & Energy Traders: 0.01% | | | | | | | | | | | | | | |
Other securities | | | | | | | | | 510,527 | | | | 0.01 | |
| | | | | | | | | | | | | | |
The accompanying notes are an integral part of these financial statements.
| | | | | | |
| Summary portfolio of investments—August 31, 2012 (unaudited) | | Wells Fargo Advantage Dow Jones Target Date Funds | | | 79 | |
DIVERSIFIED FIXED INCOME PORTFOLIO
| | | | | | | | | | | | | | | | | | |
| Security name | | | | | | | | | | Value | | | Percent of
net assets | |
| | | | | | | | | | | | | | | | | | |
| | | | | |
| Multi-Utilities: 0.02% | | | | | | | | | | | | | | | | | | |
Other securities | | | | | | | | | | | | $ | 1,270,674 | | | | 0.02 | % |
| | | | | | | | | | | | | | | | | | |
| | | | | |
| Water Utilities: 0.01% | | | | | | | | | | | | | | | | | | |
Other securities | | | | | | | | | | | | | 269,870 | | | | 0.01 | |
| | | | | | | | | | | | | | | | | | |
| | | | |
Total Yankee Corporate Bonds and Notes (Cost $161,537,695) | | | | | | | | | | 175,943,461 | | | | 3.68 | |
| | | | | | | | | | | | | | | | | | |
| | | | | |
| Other: 0.01% | | | | | | | | | | | | | | | | | | |
Other securities | | | | | | | | | | | | | 385,167 | | | | 0.01 | |
| | | | | | | | | | | | | | | | | | |
| | | | | |
| | | Yield | | | | | Shares | | | | | | | |
| Short-Term Investments: 3.69% | | | | | | | | | | | | | | | | | | |
| | | | | |
| Investment Companies: 3.69% | | | | | | | | | | | | | | | | | | |
Wells Fargo Advantage Cash Investment Money Market Fund, Select
Class (l)(u)## | | | 0.16 | % | | | | | 169,874,378 | | | | 169,874,378 | | | | 3.55 | |
Wells Fargo Securities Lending Cash Investments, LLC (l)(u)(v)(r) | | | 0.19 | | | | | | 6,632,384 | | | | 6,632,384 | | | | 0.14 | |
| | | | | |
Total Short-Term Investments (Cost $176,506,762) | | | | | | | | | | | | | 176,506,762 | | | | 3.69 | |
| | | | | | | | | | | | | | | | | | |
Total investments in securities (Cost $4,583,152,627)* | | | | | | | | | | | | | 4,901,624,845 | | | | 102.56 | |
Other assets and liabilities, net | | | | | | | | | | | | | (122,308,881 | ) | | | (2.56 | ) |
| | | | | | | | | | | | | | | | | | |
| Total Net Assets | | | | | | | | | | | | $ | 4,779,315,964 | | | | 100.00 | % |
| | | | | | | | | | | | | | | | | | |
| %% | Security issued on a when-issued basis |
| (l) | Investment in an affiliate |
| @ | Foreign bond principal is denominated in local currency. |
| (v) | Security represents investment of cash collateral received from securities on loan. |
| (u) | Rate shown is the 7-day annualized yield at period end. |
| ## | All or a portion of this security has been segregated for when-issued securities. |
| (r) | The investment company is exempt from registration under Section 3(c)(7) of the 1940 Act. |
| * | Cost for federal income tax purposes is $4,585,180,634 and unrealized appreciation (depreciation) consists of: |
| | | | |
Gross unrealized appreciation | | $ | 345,632,197 | |
Gross unrealized depreciation | | | (29,187,986 | ) |
| | | | |
Net unrealized appreciation | | $ | 316,444,211 | |
The following table shows the percent of total long-term investments by geographic location as of August 31, 2012:
| | | | |
United States | | | 71.22 | % |
Japan | | | 12.31 | % |
United Kingdom | | | 3.70 | % |
France | | | 2.50 | % |
Germany | | | 2.07 | % |
Italy | | | 2.05 | % |
Canada | | | 1.68 | % |
Netherlands | | | 0.97 | % |
Spain | | | 0.95 | % |
Other | | | 2.55 | % |
| | | | |
| | | 100.00 | % |
| | | | |
The accompanying notes are an integral part of these financial statements.
| | | | |
| 80 | | Wells Fargo Advantage Dow Jones Target Date Funds | | Summary portfolio of investments—August 31, 2012 (unaudited) |
DIVERSIFIED STOCK PORTFOLIO
The Summary portfolio of investments shows the 50 largest portfolio holdings in unaffiliated issuers and any holdings exceeding 1% of the total net assets as of the report date. The remaining securities held are grouped as “Other securities” in each category. You can request a complete schedule of portfolio holdings as of the report date, free of charge, by accessing the following website: http://a584.g.akamai.net/f/584/1326/1d/www.wellsfargoadvantagefunds.com/pdf/semi/holdings/diversifiedstock.pdf or by calling Wells Fargo Advantage Funds at 1-800-222-8222. This complete schedule, filed on Form N-CSR, is also available on the SEC’s website at sec.gov.
| | | | | | | | | | | | | | | | |
| Security name | | | | | | Shares | | | Value | | | Percent of
net assets | |
| | | | | | | | | | | | | | | | |
| | | | | |
Common Stocks: 96.21% | | | | | | | | | | | | | | | | |
| | | | | |
Consumer Discretionary: 12.54% | | | | | | | | | | | | | | | | |
| | | | | |
| Auto Components: 0.71% | | | | | | | | | | | | | | | | |
Other securities | | | | | | | | | | $ | 51,060,014 | | | | 0.71 | % |
| | | | | | | | | | | | | | | | |
| | | | | |
| Automobiles: 0.99% | | | | | | | | | | | | | | | | |
Toyota Motor Corporation | | | | | | | 520,714 | | | | 20,583,815 | | | | 0.29 | |
Other securities | | | | | | | | | | | 51,239,122 | | | | 0.70 | |
| | | | | |
| | | | | | | | | | | 71,822,937 | | | | 0.99 | |
| | | | | | | | | | | | | | | | |
| | | | | |
| Distributors: 0.22% | | | | | | | | | | | | | | | | |
Other securities | | | | | | | | | | | 15,653,222 | | | | 0.22 | |
| | | | | | | | | | | | | | | | |
| | | | | |
| Diversified Consumer Services: 0.42% | | | | | | | | | | | | | | | | |
Other securities | | | | | | | | | | | 30,131,814 | | | | 0.42 | |
| | | | | | | | | | | | | | | | |
| | | | | |
| Hotels, Restaurants & Leisure: 1.86% | | | | | | | | | | | | | | | | |
McDonald’s Corporation | | | | | | | 127,314 | | | | 11,393,330 | | | | 0.16 | |
Other securities | | | | | | | | | | | 122,675,276 | | | | 1.70 | |
| | | | | |
| | | | | | | | | | | 134,068,606 | | | | 1.86 | |
| | | | | | | | | | | | | | | | |
| | | | | |
| Household Durables: 0.88% | | | | | | | | | | | | | | | | |
Other securities | | | | | | | | | | | 63,683,669 | | | | 0.88 | |
| | | | | | | | | | | | | | | | |
| | | | | |
| Internet & Catalog Retail: 0.67% | | | | | | | | | | | | | | | | |
Amazon.com Incorporated † | | | | | | | 73,327 | | | | 18,201,961 | | | | 0.25 | |
Other securities | | | | | | | | | | | 30,379,592 | | | | 0.42 | |
| | | | | |
| | | | | | | | | | | 48,581,553 | | | | 0.67 | |
| | | | | | | | | | | | | | | | |
| | | | | |
| Leisure Equipment & Products: 0.35% | | | | | | | | | | | | | | | | |
Other securities | | | | | | | | | | | 25,592,528 | | | | 0.35 | |
| | | | | | | | | | | | | | | | |
| | | | | |
| Media: 2.47% | | | | | | | | | | | | | | | | |
Other securities | | | | | | | | | | | 178,126,604 | | | | 2.47 | |
| | | | | | | | | | | | | | | | |
| | | | | |
| Multiline Retail: 0.71% | | | | | | | | | | | | | | | | |
Other securities | | | | | | | | | | | 51,278,278 | | | | 0.71 | |
| | | | | | | | | | | | | | | | |
| | | | | |
| Specialty Retail: 2.02% | | | | | | | | | | | | | | | | |
Other securities | | | | | | | | | | | 146,104,471 | | | | 2.02 | |
| | | | | | | | | | | | | | | | |
| | | | | |
| Textiles, Apparel & Luxury Goods: 1.24% | | | | | | | | | | | | | | | | |
Other securities | | | | | | | | | | | 89,936,439 | | | | 1.24 | |
| | | | | | | | | | | | | | | | |
The accompanying notes are an integral part of these financial statements.
| | | | | | |
| Summary portfolio of investments—August 31, 2012 (unaudited) | | Wells Fargo Advantage Dow Jones Target Date Funds | | | 81 | |
DIVERSIFIED STOCK PORTFOLIO
| | | | | | | | | | | | | | | | |
| Security name | | | | | | Shares | | | Value | | | Percent of
net assets | |
| | | | | | | | | | | | | | | | |
| | | | | |
Consumer Staples: 7.43% | | | | | | | | | | | | | | | | |
| | | | | |
| Beverages: 1.61% | | | | | | | | | | | | | | | | |
Coca-Cola Company | | | | | | | 520,266 | | | $ | 19,457,948 | | | | 0.27 | % |
PepsiCo Incorporated | | | | | | | 325,163 | | | | 23,551,556 | | | | 0.33 | |
Other securities | | | | | | | | | | | 73,119,680 | | | | 1.01 | |
| | | | | |
| | | | | | | | | | | 116,129,184 | | | | 1.61 | |
| | | | | | | | | | | | | | | | |
| | | | | |
| Food & Staples Retailing: 1.57% | | | | | | | | | | | | | | | | |
Wal-Mart Stores Incorporated | | | | | | | 216,943 | | | | 15,750,062 | | | | 0.22 | |
Other securities | | | | | | | | | | | 97,749,348 | | | | 1.35 | |
| | | | | |
| | | | | | | | | | | 113,499,410 | | | | 1.57 | |
| | | | | | | | | | | | | | | | |
| | | | | |
| Food Products: 2.02% | | | | | | | | | | | | | | | | |
Nestle SA | | | | | | | 306,956 | | | | 19,082,265 | | | | 0.26 | |
Other securities | | | | | | | | | | | 126,446,964 | | | | 1.76 | |
| | | | | |
| | | | | | | | | | | 145,529,229 | | | | 2.02 | |
| | | | | | | | | | | | | | | | |
| | | | | |
| Household Products: 0.90% | | | | | | | | | | | | | | | | |
Procter & Gamble Company | | | | | | | 571,582 | | | | 38,404,595 | | | | 0.53 | |
Other securities | | | | | | | | | | | 26,882,650 | | | | 0.37 | |
| | | | | |
| | | | | | | | | | | 65,287,245 | | | | 0.90 | |
| | | | | | | | | | | | | | | | |
| | | | | |
| Personal Products: 0.53% | | | | | | | | | | | | | | | | |
Other securities | | | | | | | | | | | 38,345,432 | | | | 0.53 | |
| | | | | | | | | | | | | | | | |
| | | | | |
| Tobacco: 0.80% | | | | | | | | | | | | | | | | |
Philip Morris International Incorporated | | | | | | | 214,250 | | | | 19,132,525 | | | | 0.26 | |
Other securities | | | | | | | | | | | 38,594,114 | | | | 0.54 | |
| | | | | |
| | | | | | | | | | | 57,726,639 | | | | 0.80 | |
| | | | | | | | | | | | | | | | |
| | | | | |
Energy: 7.58% | | | | | | | | | | | | | | | | |
| | | | | |
| Energy Equipment & Services: 1.36% | | | | | | | | | | | | | | | | |
Schlumberger Limited | | | | | | | 277,605 | | | | 20,093,050 | | | | 0.28 | |
Other securities | | | | | | | | | | | 78,634,664 | | | | 1.08 | |
| | | | | |
| | | | | | | | | | | 98,727,714 | | | | 1.36 | |
| | | | | | | | | | | | | | | | |
| | | | | |
| Oil, Gas & Consumable Fuels: 6.22% | | | | | | | | | | | | | | | | |
BP plc | | | | | | | 1,804,655 | | | | 12,646,987 | | | | 0.18 | |
Chevron Corporation | | | | | | | 245,723 | | | | 27,560,292 | | | | 0.38 | |
Exxon Mobil Corporation | | | | | | | 585,831 | | | | 51,143,046 | | | | 0.71 | |
Gazprom ADR | | | | | | | 1,894,171 | | | | 18,447,331 | | | | 0.26 | |
Occidental Petroleum Corporation | | | | | | | 168,462 | | | | 14,320,955 | | | | 0.20 | |
Other securities | | | | | | | | | | | 325,097,981 | | | | 4.49 | |
| | | | | |
| | | | | | | | | | | 449,216,592 | | | | 6.22 | |
| | | | | | | | | | | | | | | | |
| | | | | |
Financials: 19.75% | | | | | | | | | | | | | | | | |
| | | | | |
| Capital Markets: 1.08% | | | | | | | | | | | | | | | | |
Other securities | | | | | | | | | | | 78,026,197 | | | | 1.08 | |
| | | | | | | | | | | | | | | | |
The accompanying notes are an integral part of these financial statements.
| | | | |
| 82 | | Wells Fargo Advantage Dow Jones Target Date Funds | | Summary portfolio of investments—August 31, 2012 (unaudited) |
DIVERSIFIED STOCK PORTFOLIO
| | | | | | | | | | | | | | | | |
| Security name | | | | | | Shares | | | Value | | | Percent of
net assets | |
| | | | | | | | | | | | | | | | |
| | | | | |
| Commercial Banks: 7.20% | | | | | | | | | | | | | | | | |
Australia & New Zealand Banking Group Limited « | | | | | | | 485,220 | | | $ | 12,442,387 | | | | 0.17 | % |
Commonwealth Bank of Australia | | | | | | | 280,103 | | | | 15,841,116 | | | | 0.22 | |
HSBC Holdings plc | | | | | | | 1,710,701 | | | | 14,861,087 | | | | 0.21 | |
Mitsubishi UFJ Financial Group Incorporated | | | | | | | 2,483,270 | | | | 11,291,195 | | | | 0.16 | |
Wells Fargo & Company (l) | | | | | | | 620,620 | | | | 21,119,699 | | | | 0.29 | |
Westpac Banking Corporation | | | | | | | 552,138 | | | | 14,129,828 | | | | 0.20 | |
Other securities | | | | | | | | | | | 430,228,121 | | | | 5.95 | |
| | | | | |
| | | | | | | | | | | 519,913,433 | | | | 7.20 | |
| | | | | | | | | | | | | | | | |
| | | | | |
| Consumer Finance: 0.28% | | | | | | | | | | | | | | | | |
Other securities | | | | | | | | | | | 20,140,359 | | | | 0.28 | |
| | | | | | | | | | | | | | | | |
| | | | | |
| Diversified Financial Services: 1.55% | | | | | | | | | | | | | | | | |
Bank of America Corporation | | | | | | | 2,232,466 | | | | 17,837,403 | | | | 0.25 | |
JPMorgan Chase & Company | | | | | | | 472,477 | | | | 17,547,796 | | | | 0.24 | |
Other securities | | | | | | | | | | | 76,487,602 | | | | 1.06 | |
| | | | | |
| | | | | | | | | | | 111,872,801 | | | | 1.55 | |
| | | | | | | | | | | | | | | | |
| | | | | |
| Insurance: 3.30% | | | | | | | | | | | | | | | | |
Other securities | | | | | | | | | | | 238,844,128 | | | | 3.30 | |
| | | | | | | | | | | | | | | | |
| | | | | |
| Real Estate Management & Development: 0.96% | | | | | | | | | | | | | | | | |
Other securities | | | | | | | | | | | 69,460,430 | | | | 0.96 | |
| | | | | | | | | | | | | | | | |
| | | | | |
| REITs: 4.97% | | | | | | | | | | | | | | | | |
Other securities | | | | | | | | | | | 358,878,508 | | | | 4.97 | |
| | | | | | | | | | | | | | | | |
| | | | | |
| Thrifts & Mortgage Finance: 0.41% | | | | | | | | | | | | | | | | |
Other securities | | | | | | | | | | | 29,368,940 | | | | 0.41 | |
| | | | | | | | | | | | | | | | |
| | | | | |
Health Care: 8.89% | | | | | | | | | | | | | | | | |
| | | | | |
| Biotechnology: 1.04% | | | | | | | | | | | | | | | | |
Other securities | | | | | | | | | | | 75,104,999 | | | | 1.04 | |
| | | | | | | | | | | | | | | | |
| | | | | |
| Health Care Equipment & Supplies: 1.37% | | | | | | | | | | | | | | | | |
Other securities | | | | | | | | | | | 99,156,875 | | | | 1.37 | |
| | | | | | | | | | | | | | | | |
| | | | | |
| Health Care Providers & Services: 1.92% | | | | | | | | | | | | | | | | |
Other securities | | | | | | | | | | | 138,382,225 | | | | 1.92 | |
| | | | | | | | | | | | | | | | |
| | | | | |
| Health Care Technology: 0.15% | | | | | | | | | | | | | | | | |
Other securities | | | | | | | | | | | 11,062,447 | | | | 0.15 | |
| | | | | | | | | | | | | | | | |
| | | | | |
| Life Sciences Tools & Services: 0.45% | | | | | | | | | | | | | | | | |
Other securities | | | | | | | | | | | 32,104,711 | | | | 0.45 | |
| | | | | | | | | | | | | | | | |
| | | | | |
| Pharmaceuticals: 3.96% | | | | | | | | | | | | | | | | |
Abbott Laboratories | | | | | | | 196,294 | | | | 12,865,109 | | | | 0.18 | |
GlaxoSmithKline plc | | | | | | | 490,873 | | | | 11,106,923 | | | | 0.15 | |
The accompanying notes are an integral part of these financial statements.
| | | | | | |
| Summary portfolio of investments—August 31, 2012 (unaudited) | | Wells Fargo Advantage Dow Jones Target Date Funds | | | 83 | |
DIVERSIFIED STOCK PORTFOLIO
| | | | | | | | | | | | | | | | |
| Security name | | | | | | Shares | | | Value | | | Percent of
net assets | |
| | | | | | | | | | | | | | | | |
| | | | | |
| Pharmaceuticals (continued) | | | | | | | | | | | | | | | | |
Johnson & Johnson | | | | | | | 340,676 | | | $ | 22,971,783 | | | | 0.32 | % |
Merck & Company Incorporated | | | | | | | 377,858 | | | | 16,266,787 | | | | 0.23 | |
Novartis AG | | | | | | | 251,316 | | | | 14,807,295 | | | | 0.21 | |
Pfizer Incorporated | | | | | | | 932,550 | | | | 22,250,643 | | | | 0.31 | |
Roche Holding AG Genusschein | | | | | | | 67,552 | | | | 12,297,620 | | | | 0.17 | |
Other securities | | | | | | | | | | | 173,550,500 | | | | 2.39 | |
| | | | | |
| | | | | | | | | | | 286,116,660 | | | | 3.96 | |
| | | | | | | | | | | | | | | | |
| | | | | |
Industrials: 11.77% | | | | | | | | | | | | | | | | |
| | | | | |
| Aerospace & Defense: 1.31% | | | | | | | | | | | | | | | | |
United Technologies Corporation | | | | | | | 164,459 | | | | 13,132,051 | | | | 0.18 | |
Other securities | | | | | | | | | | | 81,339,876 | | | | 1.13 | |
| | | | | |
| | | | | | | | | | | 94,471,927 | | | | 1.31 | |
| | | | | | | | | | | | | | | | |
| | | | | |
| Air Freight & Logistics: 0.48% | | | | | | | | | | | | | | | | |
United Parcel Service Incorporated Class B | | | | | | | 151,300 | | | | 11,167,453 | | | | 0.15 | |
Other securities | | | | | | | | | | | 23,865,762 | | | | 0.33 | |
| | | | | |
| | | | | | | | | | | 35,033,215 | | | | 0.48 | |
| | | | | | | | | | | | | | | | |
| | | | | |
| Airlines: 0.42% | | | | | | | | | | | | | | | | |
Other securities | | | | | | | | | | | 30,200,382 | | | | 0.42 | |
| | | | | | | | | | | | | | | | |
| | | | | |
| Building Products: 0.36% | | | | | | | | | | | | | | | | |
Other securities | | | | | | | | | | | 26,447,350 | | | | 0.36 | |
| | | | | | | | | | | | | | | | |
| | | | | |
| Commercial Services & Supplies: 1.38% | | | | | | | | | | | | | | | | |
Other securities | | | | | | | | | | | 99,552,353 | | | | 1.38 | |
| | | | | | | | | | | | | | | | |
| | | | | |
| Construction & Engineering: 0.77% | | | | | | | | | | | | | | | | |
Other securities | | | | | | | | | | | 55,640,466 | | | | 0.77 | |
| | | | | | | | | | | | | | | | |
| | | | | |
| Electrical Equipment: 1.06% | | | | | | | | | | | | | | | | |
Other securities | | | | | | | | | | | 76,429,101 | | | | 1.06 | |
| | | | | | | | | | | | | | | | |
| | | | | |
| Industrial Conglomerates: 1.00% | | | | | | | | | | | | | | | | |
General Electric Company | | | | | | | 1,322,607 | | | | 27,391,191 | | | | 0.38 | |
Other securities | | | | | | | | | | | 44,835,042 | | | | 0.62 | |
| | | | | |
| | | | | | | | | | | 72,226,233 | | | | 1.00 | |
| | | | | | | | | | | | | | | | |
| | | | | |
| Machinery: 2.68% | | | | | | | | | | | | | | | | |
Other securities | | | | | | | | | | | 193,522,125 | | | | 2.68 | |
| | | | | | | | | | | | | | | | |
| | | | | |
| Marine: 0.14% | | | | | | | | | | | | | | | | |
Other securities | | | | | | | | | | | 9,924,456 | | | | 0.14 | |
| | | | | | | | | | | | | | | | |
| | | | | |
| Professional Services: 0.07% | | | | | | | | | | | | | | | | |
Other securities | | | | | | | | | | | 5,052,092 | | | | 0.07 | |
| | | | | | | | | | | | | | | | |
The accompanying notes are an integral part of these financial statements.
| | | | |
| 84 | | Wells Fargo Advantage Dow Jones Target Date Funds | | Summary portfolio of investments—August 31, 2012 (unaudited) |
DIVERSIFIED STOCK PORTFOLIO
| | | | | | | | | | | | | | | | |
| Security name | | | | | | Shares | | | Value | | | Percent of
net assets | |
| | | | | | | | | | | | | | | | |
| | | | | |
| Road & Rail: 1.15% | | | | | | | | | | | | | | | | |
Union Pacific Corporation | | | | | | | 99,100 | | | $ | 12,034,704 | | | | 0.17 | % |
Other securities | | | | | | | | | | | 71,043,890 | | | | 0.98 | |
| | | | | |
| | | | | | | | | | | 83,078,594 | | | | 1.15 | |
| | | | | | | | | | | | | | | | |
| | | | | |
| Trading Companies & Distributors: 0.79% | | | | | | | | | | | | | | | | |
Other securities | | | | | | | | | | | 57,315,686 | | | | 0.79 | |
| | | | | | | | | | | | | | | | |
| | | | | |
| Transportation Infrastructure: 0.16% | | | | | | | | | | | | | | | | |
Other securities | | | | | | | | | | | 11,345,635 | | | | 0.16 | |
| | | | | | | | | | | | | | | | |
| | | | | |
Information Technology: 14.51% | | | | | | | | | | | | | | | | |
| | | | | |
| Communications Equipment: 1.29% | | | | | | | | | | | | | | | | |
Cisco Systems Incorporated | | | | | | | 1,118,249 | | | | 21,336,191 | | | | 0.30 | |
Qualcomm Incorporated | | | | | | | 356,597 | | | | 21,916,452 | | | | 0.30 | |
Other securities | | | | | | | | | | | 49,584,861 | | | | 0.69 | |
| | | | | |
| | | | | | | | | | | 92,837,504 | | | | 1.29 | |
| | | | | | | | | | | | | | | | |
| | | | | |
| Computers & Peripherals: 2.67% | | | | | | | | | | | | | | | | |
Apple Incorporated | | | | | | | 193,588 | | | | 128,782,481 | | | | 1.78 | |
EMC Corporation † | | | | | | | 438,420 | | | | 11,526,062 | | | | 0.16 | |
Other securities | | | | | | | | | | | 52,815,189 | | | | 0.73 | |
| | | | | |
| | | | | | | | | | | 193,123,732 | | | | 2.67 | |
| | | | | | | | | | | | | | | | |
| | | | | |
| Electronic Equipment, Instruments & Components: 1.43% | | | | | | | | | | | | | | | | |
Other securities | | | | | | | | | | | 103,114,726 | | | | 1.43 | |
| | | | | | | | | | | | | | | | |
| | | | | |
| Internet Software & Services: 1.54% | | | | | | | | | | | | | | | | |
Google Incorporated Class A † | | | | | | | 53,642 | | | | 36,749,598 | | | | 0.51 | |
Other securities | | | | | | | | | | | 74,328,205 | | | | 1.03 | |
| | | | | |
| | | | | | | | | | | 111,077,803 | | | | 1.54 | |
| | | | | | | | | | | | | | | | |
| | | | | |
| IT Services: 2.28% | | | | | | | | | | | | | | | | |
International Business Machines Corporation | | | | | | | 229,846 | | | | 44,785,493 | | | | 0.62 | |
Visa Incorporated « | | | | | | | 108,811 | | | | 13,955,011 | | | | 0.19 | |
Other securities | | | | | | | | | | | 105,983,575 | | | | 1.47 | |
| | | | | |
| | | | | | | | | | | 164,724,079 | | | | 2.28 | |
| | | | | | | | | | | | | | | | |
| | | | | |
| Office Electronics: 0.14% | | | | | | | | | | | | | | | | |
Other securities | | | | | | | | | | | 10,239,372 | | | | 0.14 | |
| | | | | | | | | | | | | | | | |
| | | | | |
| Semiconductors & Semiconductor Equipment: 2.57% | | | | | | | | | | | | | | | | |
Intel Corporation | | | | | | | 626,534 | | | | 15,556,839 | | | | 0.22 | |
Samsung Electronics Company Limited | | | | | | | 22,630 | | | | 24,592,081 | | | | 0.34 | |
Taiwan Semiconductor Manufacturing Company Limited | | | | | | | 5,166,298 | | | | 14,368,556 | | | | 0.20 | |
Other securities | | | | | | | | | | | 131,277,361 | | | | 1.81 | |
| | | | | |
| | | | | | | | | | | 185,794,837 | | | | 2.57 | |
| | | | | | | | | | | | | | | | |
The accompanying notes are an integral part of these financial statements.
| | | | | | |
| Summary portfolio of investments—August 31, 2012 (unaudited) | | Wells Fargo Advantage Dow Jones Target Date Funds | | | 85 | |
DIVERSIFIED STOCK PORTFOLIO
| | | | | | | | | | | | | | | | |
| Security name | | | | | | Shares | | | Value | | | Percent of
net assets | |
| | | | | | | | | | | | | | | | |
| | | | | |
| Software: 2.59% | | | | | | | | | | | | | | | | |
Microsoft Corporation | | | | | | | 936,171 | | | $ | 28,852,790 | | | | 0.40 | % |
Oracle Corporation | | | | | | | 794,615 | | | | 25,149,565 | | | | 0.35 | |
Other securities | | | | | | | | | | | 133,035,518 | | | | 1.84 | |
| | | | | |
| | | | | | | | | | | 187,037,873 | | | | 2.59 | |
| | | | | | | | | | | | | | | | |
| | | | | |
Materials: 6.56% | | | | | | | | | | | | | | | | |
| | | | | |
| Chemicals: 2.74% | | | | | | | | | | | | | | | | |
Other securities | | | | | | | | | | | 197,756,344 | | | | 2.74 | |
| | | | | | | | | | | | | | | | |
| | | | | |
| Construction Materials: 0.39% | | | | | | | | | | | | | | | | |
Other securities | | | | | | | | | | | 27,979,793 | | | | 0.39 | |
| | | | | | | | | | | | | | | | |
| | | | | |
| Containers & Packaging: 0.43% | | | | | | | | | | | | | | | | |
Other securities | | | | | | | | | | | 31,475,476 | | | | 0.43 | |
| | | | | | | | | | | | | | | | |
| | | | | |
| Metals & Mining: 2.68% | | | | | | | | | | | | | | | | |
BHP Billiton Limited | | | | | | | 570,695 | | | | 18,743,808 | | | | 0.26 | |
Other securities | | | | | | | | | | | 174,639,097 | | | | 2.42 | |
| | | | | |
| | | | | | | | | | | 193,382,905 | | | | 2.68 | |
| | | | | | | | | | | | | | | | |
| | | | | |
| Paper & Forest Products: 0.32% | | | | | | | | | | | | | | | | |
Other securities | | | | | | | | | | | 23,028,614 | | | | 0.32 | |
| | | | | | | | | | | | | | | | |
| | | | | |
Telecommunication Services: 2.87% | | | | | | | | | | | | | | | | |
| | | | | |
| Diversified Telecommunication Services: 1.59% | | | | | | | | | | | | | | | | |
AT&T Incorporated | | | | | | | 734,498 | | | | 26,912,007 | | | | 0.37 | |
Verizon Communications Incorporated | | | | | | | 351,224 | | | | 15,081,559 | | | | 0.21 | |
Other securities | | | | | | | | | | | 73,095,703 | | | | 1.01 | |
| | | | | |
| | | | | | | | | | | 115,089,269 | | | | 1.59 | |
| | | | | | | | | | | | | | | | |
| | | | | |
| Wireless Telecommunication Services: 1.28% | | | | | | | | | | | | | | | | |
China Mobile Limited | | | | | | | 1,093,500 | | | | 11,673,850 | | | | 0.16 | |
Vodafone Group plc | | | | | | | 4,524,924 | | | | 13,040,603 | | | | 0.18 | |
Other securities | | | | | | | | | | | 67,782,559 | | | | 0.94 | |
| | | | | |
| | | | | | | | | | | 92,497,012 | | | | 1.28 | |
| | | | | | | | | | | | | | | | |
| | | | | |
Utilities: 4.31% | | | | | | | | | | | | | | | | |
| | | | | |
| Electric Utilities: 1.83% | | | | | | | | | | | | | | | | |
Other securities | | | | | | | | | | | 132,347,504 | | | | 1.83 | |
| | | | | | | | | | | | | | | | |
| | | | | |
| Gas Utilities: 0.78% | | | | | | | | | | | | | | | | |
Other securities | | | | | | | | | | | 56,018,145 | | | | 0.78 | |
| | | | | | | | | | | | | | | | |
| | | | | |
| Independent Power Producers & Energy Traders: 0.27% | | | | | | | | | | | | | | | | |
Other securities | | | | | | | | | | | 19,677,971 | | | | 0.27 | |
| | | | | | | | | | | | | | | | |
| | | | | |
| Multi-Utilities: 1.28% | | | | | | | | | | | | | | | | |
Other securities | | | | | | | | | | | 92,540,439 | | | | 1.28 | |
| | | | | | | | | | | | | | | | |
The accompanying notes are an integral part of these financial statements.
| | | | |
| 86 | | Wells Fargo Advantage Dow Jones Target Date Funds | | Summary portfolio of investments—August 31, 2012 (unaudited) |
DIVERSIFIED STOCK PORTFOLIO
| | | | | | | | | | | | | | |
| Security name | | | | | | | | Value | | | Percent of
net assets | |
| | | | | | | | | | | | | | |
| | | | | |
| Water Utilities: 0.15% | | | | | | | | | | | | | | |
Other securities | | | | | | | | $ | 10,485,149 | | | | 0.15 | % |
| | | | | | | | | | | | | | |
| | | | | |
Total Common Stocks (Cost $6,353,480,085) | | | | | | | | | 6,949,402,455 | | | | 96.21 | |
| | | | | | | | | | | | | | |
| | | | | |
Foreign Corporate Bonds and Notes: 0.00% | | | | | | | | | | | | | | |
| | | | | |
Materials: 0.00% | | | | | | | | | | | | | | |
| | | | | |
| Chemicals: 0.00% | | | | | | | | | | | | | | |
Other securities | | | | | | | | | 6,757 | | | | 0.00 | |
| | | | | | | | | | | | | | |
| | | | | |
Total Foreign Corporate Bonds and Notes (Cost $7,063) | | | | | | | | | 6,757 | | | | 0.00 | |
| | | | | | | | | | | | | | |
| | | | | |
Foreign Government Bonds: 0.00% | | | | | | | | | | | | | | |
Other securities | | | | | | | | | 10,027 | | | | 0.00 | |
| | | | | |
Total Foreign Government Bonds (Cost $34,489) | | | | | | | | | 10,027 | | | | 0.00 | |
| | | | | | | | | | | | | | |
| | | | | |
Investment Companies: 0.01% | | | | | | | | | | | | | | |
Other securities | | | | | | | | | 581,002 | | | | 0.01 | |
| | | | | |
Total Investment Companies (Cost $421,726) | | | | | | | | | 581,002 | | | | 0.01 | |
| | | | | | | | | | | | | | |
| | | | | |
Preferred Stocks: 0.75% | | | | | | | | | | | | | | |
| | | | | |
Consumer Discretionary: 0.05% | | | | | | | | | | | | | | |
| | | | | |
| Automobiles: 0.05% | | | | | | | | | | | | | | |
Other securities | | | | | | | | | 3,554,994 | | | | 0.05 | |
| | | | | | | | | | | | | | |
| | | | | |
| Media: 0.00% | | | | | | | | | | | | | | |
Other securities | | | | | | | | | 303,068 | | | | 0.00 | |
| | | | | | | | | | | | | | |
| | | | | |
Consumer Staples: 0.11% | | | | | | | | | | | | | | |
| | | | | |
| Beverages: 0.09% | | | | | | | | | | | | | | |
Other securities | | | | | | | | | 6,541,809 | | | | 0.09 | |
| | | | | | | | | | | | | | |
| | | | | |
| Household Products: 0.02% | | | | | | | | | | | | | | |
Other securities | | | | | | | | | 1,244,747 | | | | 0.02 | |
| | | | | | | | | | | | | | |
| | | | | |
Energy: 0.12% | | | | | | | | | | | | | | |
| | | | | |
| Oil, Gas & Consumable Fuels: 0.12% | | | | | | | | | | | | | | |
Other securities | | | | | | | | | 9,049,265 | | | | 0.12 | |
| | | | | | | | | | | | | | |
| | | | | |
Financials: 0.24% | | | | | | | | | | | | | | |
| | | | | |
| Capital Markets: 0.00% | | | | | | | | | | | | | | |
Other securities | | | | | | | | | 42,238 | | | | 0.00 | |
| | | | | | | | | | | | | | |
| | | | | |
| Commercial Banks: 0.24% | | | | | | | | | | | | | | |
Other securities | | | | | | | | | 17,721,266 | | | | 0.24 | |
| | | | | | | | | | | | | | |
| | | | | |
| Insurance: 0.00% | | | | | | | | | | | | | | |
Other securities | | | | | | | | | 263 | | | | 0.00 | |
| | | | | | | | | | | | | | |
The accompanying notes are an integral part of these financial statements.
| | | | | | |
| Summary portfolio of investments—August 31, 2012 (unaudited) | | Wells Fargo Advantage Dow Jones Target Date Funds | | | 87 | |
DIVERSIFIED STOCK PORTFOLIO
| | | | | | | | | | | | | | |
| Security name | | | | | | | | Value | | | Percent of
net assets | |
| | | | | | | | | | | | | | |
| | | | | |
Materials: 0.17% | | | | | | | | | | | | | | |
| | | | | |
| Chemicals: 0.03% | | | | | | | | | | | | | | |
Other securities | | | | | | | | $ | 1,847,553 | | | | 0.03 | % |
| | | | | | | | | | | | | | |
| | | | | |
| Metals & Mining: 0.14% | | | | | | | | | | | | | | |
Other securities | | | | | | | | | 10,138,439 | | | | 0.14 | |
| | | | | | | | | | | | | | |
| | | | | |
Telecommunication Services: 0.03% | | | | | | | | | | | | | | |
| | | | | |
| Diversified Telecommunication Services: 0.03% | | | | | | | | | | | | | | |
Other securities | | | | | | | | | 1,899,471 | | | | 0.03 | |
| | | | | | | | | | | | | | |
| | | | | |
Utilities: 0.03% | | | | | | | | | | | | | | |
| | | | | |
| Electric Utilities: 0.03% | | | | | | | | | | | | | | |
Other securities | | | | | | | | | 2,129,948 | | | | 0.03 | |
| | | | | | | | | | | | | | |
| | | | | |
Total Preferred Stocks (Cost $58,673,342) | | | | | | | | | 54,473,061 | | | | 0.75 | |
| | | | | | | | | | | | | | |
| | | | | |
Rights: 0.00% | | | | | | | | | | | | | | |
| | | | | |
Consumer Discretionary: 0.00% | | | | | | | | | | | | | | |
| | | | | |
| Internet & Catalog Retail: 0.00% | | | | | | | | | | | | | | |
Other securities | | | | | | | | | 69,156 | | | | 0.00 | |
| | | | | | | | | | | | | | |
| | | | | |
Financials: 0.00% | | | | | | | | | | | | | | |
| | | | | |
| Commercial Banks: 0.00% | | | | | | | | | | | | | | |
Other securities | | | | | | | | | 11,071 | | | | 0.00 | |
| | | | | | | | | | | | | | |
| | | | | |
| Real Estate Management & Development: 0.00% | | | | | | | | | | | | | | |
Other securities | | | | | | | | | 8,322 | | | | 0.00 | |
| | | | | | | | | | | | | | |
| | | | | |
Industrials: 0.00% | | | | | | | | | | | | | | |
| | | | | |
| Road & Rail: 0.00% | | | | | | | | | | | | | | |
Other securities | | | | | | | | | 1,071 | | | | 0.00 | |
| | | | | | | | | | | | | | |
| | | | | |
Information Technology: 0.00% | | | | | | | | | | | | | | |
| | | | | |
| Semiconductors & Semiconductor Equipment: 0.00% | | | | | | | | | | | | | | |
Other securities | | | | | | | | | 575 | | | | 0.00 | |
| | | | | | | | | | | | | | |
| | | | | |
Materials: 0.00% | | | | | | | | | | | | | | |
| | | | | |
| Metals & Mining: 0.00% | | | | | | | | | | | | | | |
Other securities | | | | | | | | | 0 | | | | 0.00 | |
| | | | | | | | | | | | | | |
| | | | | |
Total Rights (Cost $31,368) | | | | | | | | | 90,195 | | | | 0.00 | |
| | | | | | | | | | | | | | |
The accompanying notes are an integral part of these financial statements.
| | | | |
| 88 | | Wells Fargo Advantage Dow Jones Target Date Funds | | Summary portfolio of investments—August 31, 2012 (unaudited) |
DIVERSIFIED STOCK PORTFOLIO
| | | | | | | | | | | | | | | | | | |
| Security name | | | | | | | | | | Value | | | Percent of net assets | |
| | | | | | | | | | | | | | | | | | |
| | | | | |
Warrants: 0.00% | | | | | | | | | | | | | | | | | | |
| | | | | |
Consumer Discretionary: 0.00% | | | | | | | | | | | | | | | | | | |
| | | | | |
| Distributors: 0.00% | | | | | | | | | | | | | | | | | | |
Other securities | | | | | | | | | | | | $ | 146 | | | | 0.00 | % |
| | | | | | | | | | | | | | | | | | |
| | | | | |
| Hotels, Restaurants & Leisure: 0.00% | | | | | | | | | | | | | | | | | | |
Other securities | | | | | | | | | | | | | 1,032 | | | | 0.00 | |
| | | | | | | | | | | | | | | | | | |
| | | | | |
| Media: 0.00% | | | | | | | | | | | | | | | | | | |
Other securities | | | | | | | | | | | | | 1 | | | | 0.00 | |
| | | | | | | | | | | | | | | | | | |
| | | | | |
Consumer Staples: 0.00% | | | | | | | | | | | | | | | | | | |
| | | | | |
| Food & Staples Retailing: 0.00% | | | | | | | | | | | | | | | | | | |
Other securities | | | | | | | | | | | | | 5,728 | | | | 0.00 | |
| | | | | | | | | | | | | | | | | | |
| | | | | |
| Food Products: 0.00% | | | | | | | | | | | | | | | | | | |
Other securities | | | | | | | | | | | | | 3,110 | | | | 0.00 | |
| | | | | | | | | | | | | | | | | | |
| | | | | |
Energy: 0.00% | | | | | | | | | | | | | | | | | | |
| | | | | |
| Oil, Gas & Consumable Fuels: 0.00% | | | | | | | | | | | | | | | | | | |
Other securities | | | | | | | | | | | | | 1,200 | | | | 0.00 | |
| | | | | | | | | | | | | | | | | | |
| | | | | |
Industrials: 0.00% | | | | | | | | | | | | | | | | | | |
| | | | | |
| Construction & Engineering: 0.00% | | | | | | | | | | | | | | | | | | |
Other securities | | | | | | | | | | | | | 5,123 | | | | 0.00 | |
| | | | | | | | | | | | | | | | | | |
| | | | | |
Materials: 0.00% | | | | | | | | | | | | | | | | | | |
| | | | | |
| Metals & Mining: 0.00% | | | | | | | | | | | | | | | | | | |
Other securities | | | | | | | | | | | | | 753 | | | | 0.00 | |
| | | | | | | | | | | | | | | | | | |
| | | | | |
Total Warrants (Cost $16,964) | | | | | | | | | | | | | 17,093 | | | | 0.00 | |
| | | | | | | | | | | | | | | | | | |
| | | | | |
| Other: 0.02% | | | | | | | | | | | | | | | | | | |
Other securities | | | | | | | | | | | | | 1,373,516 | | | | 0.02 | |
| | | | | |
Total Other (Cost $577,889) | | | | | | | | | | | | | 1,373,516 | | | | 0.02 | |
| | | | | | | | | | | | | | | | | | |
| | | | | |
| | | | | Yield | | | Shares | | | | | | | |
| Short-Term Investments: 14.76% | | | | | | | | | | | | | | | | | | |
| | | | | |
| Investment Companies: 14.76% | | | | | | | | | | | | | | | | | | |
Wells Fargo Advantage Cash Investment Fund, Select Class (l)(u) | | | | | 0.16 | % | | | 169,049,881 | | | | 169,049,881 | | | | 2.34 | |
Wells Fargo Securities Lending Cash Investments, LLC (l)(v)(u)(r) | | | | | 0.19 | | | | 897,043,281 | | | | 897,043,281 | | | | 12.42 | |
| | | | | |
Total Short-Term Investments (Cost $1,066,093,162) | | | | | | | | | | | | | 1,066,093,162 | | | | 14.76 | |
| | | | | | | | | | | | | | | | | | |
Total investments in securities (Cost $7,479,336,088)* | | | | | | | | | | | | | 8,072,047,268 | | | | 111.75 | % |
Other assets and liabilities, net | | | | | | | | | | | | | (848,491,067 | ) | | | (11.75 | ) |
| | | | | | | | | | | | | | | | | | |
| Total net assets | | | | | | | | | | | | $ | 7,223,556,201 | | | | 100.00 | % |
| | | | | | | | | | | | | | | | | | |
The accompanying notes are an integral part of these financial statements.
| | | | | | |
| Summary portfolio of investments—August 31, 2012 (unaudited) | | Wells Fargo Advantage Dow Jones Target Date Funds | | | 89 | |
DIVERSIFIED STOCK PORTFOLIO
| † | Non-income-earning security |
| « | All or a portion of this security is on loan. |
| (l) | Investment in an affiliate |
| (v) | Security represents investment of cash collateral received from securities on loan. |
| (u) | Rate shown is the 7-day annualized yield at period end. |
| (r) | The investment company is exempt from registration under Section 3(c)(7) of the 1940 Act. |
| * | Cost for federal income tax purposes is $7,563,760,199 and unrealized appreciation (depreciation) consists of: |
| | | | |
Gross unrealized appreciation | | $ | 1,091,786,180 | |
Gross unrealized depreciation | | | (583,499,111 | ) |
| | | | |
Net unrealized appreciation | | $ | 508,287,069 | |
The following table shows percent of total long-term investments by geographic locations as of August 31, 2012:
| | | | |
United States | | | 65.67 | % |
Japan | | | 6.52 | % |
United Kingdom | | | 3.48 | % |
Australia | | | 2.52 | % |
Canada | | | 2.00 | % |
Sourth Korea | | | 1.61 | % |
Switzerland | | | 1.50 | % |
Taiwan | | | 1.33 | % |
France | | | 1.30 | % |
Brazil | | | 1.25 | % |
Germany | | | 1.19 | % |
Hong Kong | | | 1.04 | % |
Other | | | 10.59 | % |
| | | | |
| | | 100.00 | % |
| | | | |
The accompanying notes are an integral part of these financial statements.
| | | | |
| 90 | | Wells Fargo Advantage Dow Jones Target Date Funds | | Portfolio of investments—August 31, 2012 (unaudited) |
SHORT-TERM INVESTMENT PORTFOLIO
| | | | | | | | | | | | | | | | |
| Security name | | Interest rate | | | Maturity date | | | Principal | | | Value | |
| | | | | | | | | | | | | | | | |
| | | | |
Agency Securities: 1.15% | | | | | | | | | | | | | | | | |
FHLB ± | | | 0.29 | % | | | 2-5-13 | | | $ | 1,000,000 | | | $ | 999,830 | |
FHLB ± | | | 0.30 | | | | 3-7-13 | | | | 1,000,000 | | | | 999,847 | |
FHLB ± | | | 0.32 | | | | 3-28-13 | | | | 1,000,000 | | | | 999,882 | |
FHLB ± | | | 0.32 | | | | 5-2-13 | | | | 1,000,000 | | | | 999,866 | |
FHLB ± | | | 0.34 | | | | 4-1-13 | | | | 1,000,000 | | | | 1,000,000 | |
FHLB ± | | | 0.34 | | | | 5-17-13 | | | | 1,000,000 | | | | 1,000,000 | |
| | | | |
Total Agency Securities (Cost $5,999,425) | | | | | | | | | | | | | | | 5,999,425 | |
| | | | | | | | | | | | | | | | |
| | | | |
Certificates of Deposit: 20.17% | | | | | | | | | | | | | | | | |
Banco Del Estado De Chile | | | 0.27 | | | | 9-27-12 | | | | 4,000,000 | | | | 4,000,000 | |
Banco Del Estado De Chile | | | 0.37 | | | | 10-22-12 | | | | 1,000,000 | | | | 1,000,000 | |
Bank Of Montreal | | | 0.18 | | | | 10-10-12 | | | | 3,000,000 | | | | 3,000,000 | |
Bank Of Montreal | | | 0.18 | | | | 10-23-12 | | | | 4,000,000 | | | | 4,000,000 | |
Bank of Montreal | | | 0.23 | | | | 9-20-12 | | | | 1,000,000 | | | | 1,000,000 | |
Bank of Nova Scotia ± | | | 0.29 | | | | 10-18-12 | | | | 1,000,000 | | | | 1,000,000 | |
Bank of Tokyo Mitsubishi LLC | | | 0.18 | | | | 9-4-12 | | | | 4,000,000 | | | | 4,000,000 | |
Bank of Tokyo Mitsubishi LLC | | | 0.18 | | | | 9-28-12 | | | | 1,000,000 | | | | 1,000,000 | |
Bank of Tokyo Mitsubishi LLC | | | 0.19 | | | | 9-5-12 | | | | 2,000,000 | | | | 2,000,000 | |
Barclays Bank plc ± | | | 0.92 | | | | 3-15-13 | | | | 5,000,000 | | | | 5,000,000 | |
Citibank NA | | | 0.33 | | | | 9-11-12 | | | | 3,000,000 | | | | 3,000,000 | |
Citibank NA | | | 0.33 | | | | 9-17-12 | | | | 2,000,000 | | | | 2,000,000 | |
DNB Nor Bank ASA | | | 0.31 | | | | 9-13-12 | | | | 2,000,000 | | | | 2,000,000 | |
DNB Nor Bank ASA 144A (z) | | | 0.31 | | | | 9-11-12 | | | | 2,000,000 | | | | 1,999,879 | |
Mitsubishi Trust & Bank Company | | | 0.20 | | | | 9-14-12 | | | | 4,000,000 | | | | 4,000,000 | |
Mitsubishi Trust & Bank Company | | | 0.20 | | | | 9-20-12 | | | | 2,000,000 | | | | 2,000,000 | |
National Bank of Australia Limited | | | 0.24 | | | | 11-13-12 | | | | 1,000,000 | | | | 1,000,117 | |
National Bank of Canada | | | 0.18 | | | | 10-15-12 | | | | 4,000,000 | | | | 4,000,000 | |
National Bank of Kuwait | | | 0.18 | | | | 9-4-12 | | | | 3,000,000 | | | | 3,000,000 | |
Nordea Bank plc (Finland) | | | 0.87 | | | | 9-13-12 | | | | 1,000,000 | | | | 1,000,025 | |
Norinchukin Bank | | | 0.17 | | | | 9-4-12 | | | | 4,000,000 | | | | 4,000,000 | |
Norinchukin Bank | | | 0.17 | | | | 9-7-12 | | | | 4,000,000 | | | | 4,000,000 | |
Norinchukin Bank | | | 0.40 | | | | 9-11-12 | | | | 1,000,000 | | | | 1,000,039 | |
Oversea-Chinese Banking Corporation Limited | | | 0.26 | | | | 9-4-12 | | | | 1,000,000 | �� | | | 1,000,000 | |
Oversea-Chinese Banking Corporation Limited | | | 0.27 | | | | 9-28-12 | | | | 1,000,000 | | | | 1,000,000 | |
Royal Bank of Canada ± | | | 0.49 | | | | 8-12-13 | | | | 2,000,000 | | | | 2,000,000 | |
Royal Bank of Canada ± | | | 0.49 | | | | 8-6-13 | | | | 1,000,000 | | | | 1,000,000 | |
Royal Bank of Canada ± | | | 0.50 | | | | 7-26-13 | | | | 2,000,000 | | | | 2,000,000 | |
Royal Bank of Canada ± | | | 0.74 | | | | 12-17-12 | | | | 1,000,000 | | | | 1,000,000 | |
Skandinaviska Enskilda Banken AG | | | 0.50 | | | | 10-15-12 | | | | 4,000,000 | | | | 4,000,000 | |
Skandinaviska Enskilda Banken AG | | | 0.70 | | | | 11-28-12 | | | | 5,000,000 | | | | 5,000,000 | |
Skandinaviska Enskilda Banken AG | | | 0.75 | | | | 10-12-12 | | | | 1,000,000 | | | | 1,000,221 | |
State Street Bank & Trust | | | 0.25 | | | | 9-17-12 | | | | 2,000,000 | | | | 2,000,000 | |
State Street Bank & Trust | | | 0.18 | | | | 10-16-12 | | | | 7,000,000 | | | | 7,000,000 | |
State Street Bank & Trust | | | 0.18 | | | | 10-18-12 | | | | 4,000,000 | | | | 4,000,000 | |
Sumitomo Mitsui Banking Corporation | | | 0.16 | | | | 9-6-12 | | | | 5,000,000 | | | | 5,000,000 | |
Toronto-Dominion Bank | | | 0.17 | | | | 10-30-12 | | | | 3,000,000 | | | | 3,000,000 | |
Toronto-Dominion Bank | | | 0.17 | | | | 11-2-12 | | | | 3,000,000 | | | | 3,000,000 | |
Toronto-Dominion Bank ± | | | 0.29 | | | | 2-4-13 | | | | 3,000,000 | | | | 3,000,000 | |
Toronto-Dominion Bank ± | | | 0.45 | | | | 7-26-13 | | | | 1,000,000 | | | | 1,000,000 | |
| | | | |
Total Certificates of Deposit (Cost $105,000,281) | | | | | | | | | | | | | | | 105,000,281 | |
| | | | | | | | | | | | | | | | |
The accompanying notes are an integral part of these financial statements.
| | | | | | |
| Portfolio of investments—August 31, 2012 (unaudited) | | Wells Fargo Advantage Dow Jones Target Date Funds | | | 91 | |
SHORT-TERM INVESTMENT PORTFOLIO
| | | | | | | | | | | | | | | | |
| Security name | | Interest rate | | | Maturity date | | | Principal | | | Value | |
| | | | | | | | | | | | | | | | |
| | | | |
Commercial Paper: 42.45% | | | | | | | | | | | | | | | | |
ANZ National Limited 144A (z) | | | 0.28 | % | | | 9-20-12 | | | $ | 2,000,000 | | | $ | 1,999,751 | |
ANZ National Limited 144A (z) | | | 0.29 | | | | 9-25-12 | | | | 2,000,000 | | | | 1,999,662 | |
ANZ National Limited 144A (z) | | | 0.29 | | | | 10-2-12 | | | | 1,000,000 | | | | 999,774 | |
ASB Finance Limited ±144A | | | 0.50 | | | | 2-25-13 | | | | 2,000,000 | | | | 2,000,000 | |
ASB Finance Limited ±144A | | | 0.54 | | | | 9-5-13 | | | | 1,000,000 | | | | 1,000,000 | |
ASB Finance Limited ±144A | | | 0.64 | | | | 4-8-13 | | | | 1,000,000 | | | | 1,000,000 | |
Axis Bank Limited (Dubai) (z) | | | 0.65 | | | | 9-28-12 | | | | 2,000,000 | | | | 1,999,133 | |
Banco De Chile 144A (z) | | | 0.66 | | | | 9-25-12 | | | | 1,000,000 | | | | 999,615 | |
Barclays Bank plc 144A (z) | | | 0.31 | | | | 10-25-12 | | | | 2,000,000 | | | | 1,999,122 | |
BNZ International Funding Limited 144A (z) | | | 0.28 | | | | 9-12-12 | | | | 1,000,000 | | | | 999,938 | |
BNZ International Funding Limited 144A (z) | | | 0.28 | | | | 9-14-12 | | | | 1,000,000 | | | | 999,922 | |
BNZ International Funding Limited 144A | | | 0.52 | | | | 2-28-13 | | | | 1,000,000 | | | | 1,000,006 | |
CAFCO LLC 144A (z) | | | 0.42 | | | | 9-19-12 | | | | 1,000,000 | | | | 999,825 | |
Caisse Centrale Desjardins du Quebec 144A (z) | | | 0.18 | | | | 9-7-12 | | | | 1,000,000 | | | | 999,985 | |
Caisse Centrale Desjardins du Quebec 144A (z) | | | 0.18 | | | | 9-19-12 | | | | 5,000,000 | | | | 4,999,625 | |
Caisse Centrale Desjardins du Quebec 144A (z) | | | 0.19 | | | | 9-27-12 | | | | 1,000,000 | | | | 999,879 | |
Caisse Centrale Desjardins du Quebec 144A (z) | | | 0.22 | | | | 10-22-12 | | | | 1,000,000 | | | | 999,707 | |
Caisse Centrale Desjardins du Quebec 144A (z) | | | 0.22 | | | | 10-16-12 | | | | 1,000,000 | | | | 999,743 | |
Caisse Centrale Desjardins du Quebec 144A (z) | | | 0.22 | | | | 11-6-12 | | | | 1,000,000 | | | | 999,615 | |
Caisse Centrale Desjardins du Quebec 144A (z) | | | 0.22 | | | | 11-7-12 | | | | 1,000,000 | | | | 999,609 | |
Caisse Centrale Desjardins du Quebec 144A (z) | | | 0.22 | | | | 11-16-12 | | | | 1,000,000 | | | | 999,554 | |
Caisse Centrale Desjardins du Quebec 144A (z) | | | 0.23 | | | | 11-8-12 | | | | 1,000,000 | | | | 999,585 | |
Caisse Centrale Desjardins du Quebec 144A (z) | | | 0.25 | | | | 9-4-12 | | | | 1,000,000 | | | | 1,000,000 | |
Chariot Funding LLC 144A (z)(p) | | | 0.18 | | | | 9-12-12 | | | | 3,000,000 | | | | 2,999,873 | |
Ciesco LLC 144A (z)(p) | | | 0.52 | | | | 9-6-12 | | | | 1,000,000 | | | | 999,971 | |
CNPC Finance 144A (z) | | | 0.32 | | | | 10-9-12 | | | | 2,000,000 | | | | 1,999,378 | |
CNPC Finance 144A (z) | | | 0.37 | | | | 10-22-12 | | | | 1,000,000 | | | | 999,507 | |
CNPC Finance 144A (z) | | | 0.37 | | | | 10-23-12 | | | | 1,000,000 | | | | 999,496 | |
CNPC Finance 144A (z) | | | 0.38 | | | | 9-17-12 | | | | 2,000,000 | | | | 1,999,726 | |
CNPC Finance 144A (z) | | | 0.39 | | | | 9-24-12 | | | | 1,000,000 | | | | 999,783 | |
Commonwealth Bank of Australia 144A (z) | | | 0.19 | | | | 10-3-12 | | | | 1,000,000 | | | | 999,847 | |
Commonwealth Bank of Australia (New York) | | | 0.32 | | | | 9-27-12 | | | | 1,000,000 | | | | 1,000,089 | |
CRC Funding LLC 144A (z)(p) | | | 0.35 | | | | 9-7-12 | | | | 1,000,000 | | | | 999,971 | |
CRC Funding LLC 144A (z)(p) | | | 0.50 | | | | 9-4-12 | | | | 2,000,000 | | | | 2,000,000 | |
DBS Bank Limited 144A (z) | | | 0.22 | | | | 9-4-12 | | | | 1,000,000 | | | | 1,000,000 | |
DBS Bank Limited 144A (z) | | | 0.26 | | | | 9-13-12 | | | | 1,000,000 | | | | 999,935 | |
DBS Bank Limited 144A (z) | | | 0.26 | | | | 10-5-12 | | | | 1,000,000 | | | | 999,776 | |
DBS Bank Limited 144A (z) | | | 0.26 | | | | 10-25-12 | | | | 2,000,000 | | | | 1,999,263 | |
DBS Bank Limited 144A (z) | | | 0.26 | | | | 10-29-12 | | | | 1,000,000 | | | | 999,603 | |
Fairway Finance Corporation 144A (z)(p) | | | 0.19 | | | | 10-26-12 | | | | 1,000,000 | | | | 999,726 | |
Fairway Finance Corporation 144A (z)(p) | | | 0.20 | | | | 9-5-12 | | | | 1,000,000 | | | | 999,994 | |
Fairway Finance Corporation 144A (z)(p) | | | 0.21 | | | | 10-2-12 | | | | 1,000,000 | | | | 999,837 | |
General Electric Capital Company (z) | | | 0.17 | | | | 9-26-12 | | | | 4,000,000 | | | | 3,999,584 | |
General Electric Capital Company (z) | | | 0.23 | | | | 12-27-12 | | | | 2,000,000 | | | | 1,998,543 | |
General Electric Capital Company (z) | | | 0.28 | | | | 12-26-12 | | | | 2,000,000 | | | | 1,998,242 | |
General Electric Capital Company (z) | | | 0.28 | | | | 12-28-12 | | | | 1,000,000 | | | | 999,106 | |
Gotham Funding Corporation 144A (z)(p) | | | 0.21 | | | | 9-7-12 | | | | 1,000,000 | | | | 999,983 | |
Gotham Funding Corporation 144A (z)(p) | | | 0.21 | | | | 9-11-12 | | | | 1,000,000 | | | | 999,959 | |
Gotham Funding Corporation 144A (z)(p) | | | 0.21 | | | | 9-13-12 | | | | 1,000,000 | | | | 999,948 | |
Gotham Funding Corporation 144A (z)(p) | | | 0.21 | | | | 9-18-12 | | | | 1,000,000 | | | | 999,918 | |
The accompanying notes are an integral part of these financial statements.
| | | | |
| 92 | | Wells Fargo Advantage Dow Jones Target Date Funds | | Portfolio of investments—August 31, 2012 (unaudited) |
SHORT-TERM INVESTMENT PORTFOLIO
| | | | | | | | | | | | | | | | |
| Security name | | Interest rate | | | Maturity date | | | Principal | | | Value | |
| | | | | | | | | | | | | | | | |
| | | | |
Commercial Paper (continued) | | | | | | | | | | | | | | | | |
Gotham Funding Corporation 144A (z)(p) | | | 0.21 | % | | | 9-19-12 | | | $ | 1,000,000 | | | $ | 999,913 | |
Gotham Funding Corporation 144A (z)(p) | | | 0.21 | | | | 9-20-12 | | | | 1,000,000 | | | | 999,907 | |
Gotham Funding Corporation 144A (z)(p) | | | 0.21 | | | | 9-21-12 | | | | 2,000,000 | | | | 1,999,802 | |
Govco LLC 144A (z)(p) | | | 0.35 | | | | 9-10-12 | | | | 1,000,000 | | | | 999,942 | |
Govco LLC 144A (z)(p) | | | 0.50 | | | | 9-5-12 | | | | 1,000,000 | | | | 999,986 | |
Govco LLC 144A (z)(p) | | | 0.50 | | | | 9-6-12 | | | | 2,000,000 | | | | 1,999,944 | |
ICICI Bank Limited (z) | | | 0.64 | | | | 9-10-12 | | | | 1,000,000 | | | | 999,893 | |
JPMorgan Chase & Company (z) | | | 0.28 | | | | 10-30-12 | | | | 5,000,000 | | | | 4,997,822 | |
Jupiter Securitization Company LLC 144A (z)(p) | | | 0.18 | | | | 9-12-12 | | | | 3,000,000 | | | | 2,999,873 | |
Legacy Capital Company 144A (z)(p) | | | 0.48 | | | | 10-19-12 | | | | 1,000,000 | | | | 999,400 | |
Legacy Capital Company 144A (z)(p) | | | 0.48 | | | | 11-7-12 | | | | 2,000,000 | | | | 1,998,293 | |
Lexington Parker Capital Company LLC 144A (z)(p) | | | 0.48 | | | | 10-19-12 | | | | 2,000,000 | | | | 1,998,800 | |
Lexington Parker Capital Company LLC 144A (z)(p) | | | 0.48 | | | | 11-9-12 | | | | 2,000,000 | | | | 1,998,240 | |
Liberty Street Funding LLC 144A (z)(p) | | | 0.18 | | | | 9-17-12 | | | | 2,000,000 | | | | 1,999,870 | |
Liberty Street Funding LLC 144A (z)(p) | | | 0.18 | | | | 9-18-12 | | | | 4,000,000 | | | | 3,999,720 | |
Liberty Street Funding LLC 144A (z)(p) | | | 0.19 | | | | 9-13-12 | | | | 1,000,000 | | | | 999,953 | |
Liberty Street Funding LLC 144A (z)(p) | | | 0.22 | | | | 10-25-12 | | | | 1,000,000 | | | | 999,688 | |
Liberty Street Funding LLC 144A (z)(p) | | | 0.22 | | | | 11-15-12 | | | | 1,000,000 | | | | 999,560 | |
Liberty Street Funding LLC 144A (z)(p) | | | 0.23 | | | | 10-26-12 | | | | 1,000,000 | | | | 999,668 | |
Liberty Street Funding LLC 144A (z)(p) | | | 0.23 | | | | 11-13-12 | | | | 2,000,000 | | | | 1,999,106 | |
Louis Dreyfus Commodities LLC (z) | | | 0.50 | | | | 9-7-12 | | | | 1,000,000 | | | | 999,958 | |
Louis Dreyfus Commodities LLC (z) | | | 0.53 | | | | 9-4-12 | | | | 1,000,000 | | | | 1,000,000 | |
Market Street Funding Corporation 144A (z)(p) | | | 0.26 | | | | 10-17-12 | | | | 1,000,000 | | | | 999,689 | |
Market Street Funding Corporation 144A (z)(p) | | | 0.26 | | | | 10-18-12 | | | | 1,000,000 | | | | 999,682 | |
MetLife Short Term Funding LLC 144A (z)(p) | | | 0.20 | | | | 10-10-12 | | | | 1,000,000 | | | | 999,800 | |
MetLife Short Term Funding LLC 144A (z)(p) | | | 0.21 | | | | 9-12-12 | | | | 1,000,000 | | | | 999,953 | |
MetLife Short Term Funding LLC 144A (z)(p) | | | 0.22 | | | | 10-4-12 | | | | 1,000,000 | | | | 999,817 | |
MetLife Short Term Funding LLC 144A (z)(p) | | | 0.24 | | | | 11-5-12 | | | | 1,000,000 | | | | 999,587 | |
MetLife Short Term Funding LLC 144A (z)(p) | | | 0.24 | | | | 10-24-12 | | | | 1,000,000 | | | | 999,667 | |
MetLife Short Term Funding LLC 144A (z)(p) | | | 0.25 | | | | 9-6-12 | | | | 1,000,000 | | | | 999,986 | |
MetLife Short Term Funding LLC 144A (z)(p) | | | 0.25 | | | | 10-15-12 | | | | 1,000,000 | | | | 999,715 | |
Mitsubishi UFJ Trust & Banking Corporation 144A (z) | | | 0.20 | | | | 9-12-12 | | | | 1,000,000 | | | | 999,956 | |
Nationwide Building Society 144A (z) | | | 0.42 | | | | 12-5-12 | | | | 2,000,000 | | | | 1,997,853 | |
Nationwide Building Society 144A (z) | | | 0.42 | | | | 12-6-12 | | | | 1,000,000 | | | | 998,915 | |
Nationwide Building Society 144A (z) | | | 0.42 | | | | 12-12-12 | | | | 1,000,000 | | | | 998,845 | |
Nationwide Building Society 144A (z) | | | 0.42 | | | | 12-19-12 | | | | 1,000,000 | | | | 998,763 | |
Nationwide Building Society 144A (z) | | | 0.55 | | | | 10-1-12 | | | | 1,000,000 | | | | 999,588 | |
Nationwide Building Society 144A (z) | | | 0.58 | | | | 10-12-12 | | | | 1,000,000 | | | | 999,388 | |
Nordea North America (z) | | | 0.30 | | | | 9-7-12 | | | | 2,000,000 | | | | 1,999,950 | |
Old Line Funding LLC 144A (z)(p) | | | 0.18 | | | | 10-22-12 | | | | 1,000,000 | | | | 999,760 | |
Old Line Funding LLC 144A (z)(p) | | | 0.20 | | | | 12-3-12 | | | | 1,000,000 | | | | 999,500 | |
Old Line Funding LLC 144A (z)(p) | | | 0.35 | | | | 2-8-13 | | | | 2,000,000 | | | | 1,996,948 | |
Oversea Chinese Banking Corporation Limited (z) | | | 0.22 | | | | 10-30-12 | | | | 1,000,000 | | | | 999,658 | |
Oversea-Chinese Banking Corporation Limited (z)(p) | | | 0.23 | | | | 9-18-12 | | | | 2,000,000 | | | | 1,999,821 | |
Oversea-Chinese Banking Corporation Limited (z) | | | 0.27 | | | | 9-26-12 | | | | 2,000,000 | | | | 1,999,676 | |
Oversea-Chinese Banking Corporation Limited (z) | | | 0.27 | | | | 10-11-12 | | | | 1,000,000 | | | | 999,723 | |
Principal Life Insurance Company 144A (z)(p) | | | 0.20 | | | | 9-7-12 | | | | 1,000,000 | | | | 999,983 | |
Prudential plc 144A (z) | | | 0.40 | | | | 11-1-12 | | | | 1,000,000 | | | | 999,356 | |
Prudential plc 144A (z) | | | 0.40 | | | | 11-5-12 | | | | 1,000,000 | | | | 999,311 | |
Regency Markets No. 1 LLC 144A (z)(p) | | | 0.21 | | | | 9-6-12 | | | | 1,000,000 | | | | 999,988 | |
The accompanying notes are an integral part of these financial statements.
| | | | | | |
| Portfolio of investments—August 31, 2012 (unaudited) | | Wells Fargo Advantage Dow Jones Target Date Funds | | | 93 | |
SHORT-TERM INVESTMENT PORTFOLIO
| | | | | | | | | | | | | | | | |
| Security name | | Interest rate | | | Maturity date | | | Principal | | | Value | |
| | | | | | | | | | | | | | | | |
| | | | |
Commercial Paper (continued) | | | | | | | | | | | | | | | | |
Regency Markets No. 1 LLC 144A (z)(p) | | | 0.21 | % | | | 9-25-12 | | | $ | 1,000,000 | | | $ | 999,878 | |
Salisbury Receivables Company 144A (z)(p) | | | 0.24 | | | | 9-10-12 | | | | 1,000,000 | | | | 999,960 | |
Salisbury Receivables Company 144A (z)(p) | | | 0.27 | | | | 9-25-12 | | | | 1,000,000 | | | | 999,843 | |
Salisbury Receivables Company 144A (z)(p) | | | 0.27 | | | | 9-26-12 | | | | 1,000,000 | | | | 999,835 | |
Salisbury Receivables Company 144A (z)(p) | | | 0.27 | | | | 9-27-12 | | | | 1,000,000 | | | | 999,828 | |
Salisbury Receivables Company 144A (z)(p) | | | 0.28 | | | | 9-6-12 | | | | 1,000,000 | | | | 999,984 | |
Salisbury Receivables Company 144A (z)(p) | | | 0.33 | | | | 11-7-12 | | | | 1,000,000 | | | | 999,413 | |
Sheffield Receivables Corporation 144A (z)(p) | | | 0.27 | | | | 10-4-12 | | | | 1,000,000 | | | | 999,775 | |
Sheffield Receivables Corporation 144A (z)(p) | | | 0.27 | | | | 10-5-12 | | | | 2,000,000 | | | | 1,999,536 | |
Sheffield Receivables Corporation 144A (z)(p) | | | 0.27 | | | | 10-12-12 | | | | 1,000,000 | | | | 999,715 | |
Sheffield Receivables Corporation 144A (z)(p) | | | 0.27 | | | | 10-15-12 | | | | 2,000,000 | | | | 1,999,385 | |
Sheffield Receivables Corporation 144A (z)(p) | | | 0.27 | | | | 10-16-12 | | | | 2,000,000 | | | | 1,999,370 | |
Sheffield Receivables Corporation 144A (z)(p) | | | 0.27 | | | | 10-18-12 | | | | 1,000,000 | | | | 999,670 | |
Straight-A Funding LLC 144A (z)(p) | | | 0.18 | | | | 10-3-12 | | | | 1,000,000 | | | | 999,855 | |
Straight-A Funding LLC 144A (z)(p) | | | 0.18 | | | | 10-15-12 | | | | 2,000,000 | | | | 1,999,590 | |
Straight-A Funding LLC 144A (z)(p) | | | 0.18 | | | | 10-17-12 | | | | 2,000,000 | | | | 1,999,570 | |
Straight-A Funding LLC 144A (z)(p) | | | 0.18 | | | | 10-18-12 | | | | 3,000,000 | | | | 2,999,340 | |
Straight-A Funding LLC 144A (z)(p) | | | 0.18 | | | | 10-23-12 | | | | 2,000,000 | | | | 1,999,510 | |
Sumitomo Trust & Banking Corporation | | | 0.16 | | | | 9-5-12 | | | | 4,000,000 | | | | 4,000,000 | |
Suncorp Group Limited 144A (z) | | | 0.45 | | | | 9-13-12 | | | | 2,000,000 | | | | 1,999,775 | |
Suncorp Group Limited 144A (z) | | | 0.45 | | | | 10-18-12 | | | | 1,000,000 | | | | 999,450 | |
Suncorp Group Limited 144A (z) | | | 0.45 | | | | 9-12-12 | | | | 1,000,000 | | | | 999,900 | |
Suncorp Group Limited 144A (z) | | | 0.45 | | | | 9-17-12 | | | | 1,000,000 | | | | 999,838 | |
Surrey Funding Corporation 144A (z) | | | 0.27 | | | | 10-2-12 | | | | 1,000,000 | | | | 999,790 | |
Surrey Funding Corporation 144A (z) | | | 0.27 | | | | 10-5-12 | | | | 1,000,000 | | | | 999,768 | |
Surrey Funding Corporation 144A (z) | | | 0.28 | | | | 9-18-12 | | | | 1,000,000 | | | | 999,891 | |
Swedbank (z) | | | 0.30 | | | | 11-14-12 | | | | 1,000,000 | | | | 999,408 | |
Swedbank (z) | | | 0.31 | | | | 11-9-12 | | | | 1,000,000 | | | | 1,000,000 | |
Swedbank (z) | | | 0.31 | | | | 11-8-12 | | | | 2,000,000 | | | | 1,998,881 | |
Swedbank (z) | | | 0.31 | | | | 11-13-12 | | | | 1,000,000 | | | | 999,397 | |
Swedbank (z) | | | 0.42 | | | | 9-10-12 | | | | 2,000,000 | | | | 1,999,860 | |
Swedbank (z) | | | 0.42 | | | | 9-11-12 | | | | 1,000,000 | | | | 999,918 | |
Sydney Capital Corporation 144A (z)(p) | | | 0.30 | | | | 9-13-12 | | | | 1,000,000 | | | | 999,925 | |
Sydney Capital Corporation 144A (z)(p) | | | 0.30 | | | | 11-14-12 | | | | 1,000,000 | | | | 999,408 | |
Thunder Bay Funding LLC 144A (z)(p) | | | 0.18 | | | | 10-22-12 | | | | 1,000,000 | | | | 999,760 | |
Thunder Bay Funding LLC 144A (z)(p) | | | 0.20 | | | | 11-20-12 | | | | 1,000,000 | | | | 999,572 | |
Thunder Bay Funding LLC 144A (z)(p) | | | 0.20 | | | | 12-3-12 | | | | 1,000,000 | | | | 999,500 | |
Thunder Bay Funding LLC 144A (z)(p) | | | 0.35 | | | | 2-1-13 | | | | 1,000,000 | | | | 998,542 | |
Thunder Bay Funding LLC 144A (z)(p) | | | 0.35 | | | | 2-7-13 | | | | 1,000,000 | | | | 998,483 | |
Toyota Credit Canada Incorporated (z) | | | 0.20 | | | | 9-25-12 | | | | 1,000,000 | | | | 999,883 | |
Toyota Motor Credit Corporation (z) | | | 0.35 | | | | 2-25-13 | | | | 3,000,000 | | | | 2,994,925 | |
UOB Funding LLC (z) | | | 0.25 | | | | 9-13-12 | | | | 1,000,000 | | | | 999,938 | |
UOB Funding LLC (z) | | | 0.25 | | | | 12-4-12 | | | | 1,000,000 | | | | 999,368 | |
Victory Receivables 144A (p) | | | 0.01 | | | | 9-18-12 | | | | 1,000,000 | | | | 999,918 | |
Victory Receivables 144A (p) | | | 0.21 | | | | 9-18-12 | | | | 1,000,000 | | | | 999,918 | |
Victory Receivables 144A (p) | | | 0.21 | | | | 9-21-12 | | | | 1,000,000 | | | | 999,901 | |
Victory Receivables 144A (z)(p) | | | 0.21 | | | | 9-12-12 | | | | 4,000,000 | | | | 3,999,813 | |
Victory Receivables 144A (z)(p) | | | 0.21 | | | | 9-13-12 | | | | 1,000,000 | | | | 999,948 | |
Victory Receivables 144A (z)(p) | | | 0.21 | | | | 9-20-12 | | | | 1,000,000 | | | | 999,907 | |
Victory Receivables 144A(z)(p) | | | 0.21 | | | | 9-25-12 | | | | 1,000,000 | | | | 999,878 | |
The accompanying notes are an integral part of these financial statements.
| | | | |
| 94 | | Wells Fargo Advantage Dow Jones Target Date Funds | | Portfolio of investments—August 31, 2012 (unaudited) |
SHORT-TERM INVESTMENT PORTFOLIO
| | | | | | | | | | | | | | | | |
| Security name | | Interest rate | | | Maturity date | | | Principal | | | Value | |
| | | | | | | | | | | | | | | | |
| | | | |
Commercial Paper (continued) | | | | | | | | | | | | | | | | |
Westpac Banking Corporation 144A (z) | | | 0.26 | % | | | 9-17-12 | | | $ | 1,000,000 | | | $ | 999,906 | |
Westpac Securities NZ Limited 144A (z) | | | 0.30 | | | | 9-21-12 | | | | 1,000,000 | | | | 999,858 | |
Westpac Securities NZ Limited 144A (z) | | | 0.30 | | | | 9-17-12 | | | | 1,000,000 | | | | 999,892 | |
Westpac Securities NZ Limited ±144A | | | 0.50 | | | | 2-25-13 | | | | 1,000,000 | | | | 1,000,000 | |
Westpac Securities NZ Limited ±144A | | | 0.50 | | | | 2-22-13 | | | | 2,000,000 | | | | 2,000,000 | |
Westpac Securities NZ Limited 144A | | | 0.61 | | | | 7-22-13 | | | | 1,000,000 | | | | 1,000,000 | |
Westpac Securities NZ Limited 144A | | | 0.64 | | | | 4-8-13 | | | | 1,000,000 | | | | 1,000,000 | |
Westpac Securities NZ Limited ±144A | | | 0.66 | | | | 4-15-13 | | | | 1,000,000 | | | | 1,000,308 | |
White Point Funding Incorporated 144A (z)(p) | | | 0.52 | | | | 11-19-12 | | | | 1,000,000 | | | | 998,902 | |
Working Capital Management Company 144A (z)(p) | | | 0.22 | | | | 9-6-12 | | | | 1,000,000 | | | | 999,988 | |
| | | | |
Total Commercial Paper (Cost $220,936,698) | | | | | | | | | | | | | | | 220,936,698 | |
| | | | | | | | | | | | | | | | |
| | | | |
Corporate Bonds and Notes: 1.85% | | | | | | | | | | | | | | | | |
| | | | |
Financials: 1.61% | | | | | | | | | | | | | | | | |
| | | | |
| Commercial Banks: 0.19% | | | | | | | | | | | | | | | | |
JPMorgan Chase Bank NA ± | | | 0.36 | | | | 11-21-12 | | | | 1,000,000 | | | | 1,000,155 | |
| | | | | | | | | | | | | | | | |
| | | | |
| Consumer Finance: 0.39% | | | | | | | | | | | | | | | | |
Toyota Motor Credit Corporation ± | | | 0.53 | | | | 7-19-13 | | | | 2,000,000 | | | | 2,000,000 | |
| | | | | | | | | | | | | | | | |
| | | | |
| Diversified Financial Services: 1.03% | | | | | | | | | | | | | | | | |
JPMorgan Chase & Company ± | | | 0.53 | | | | 1-18-13 | | | | 1,000,000 | | | | 999,926 | |
JPMorgan Chase & Company ± | | | 0.59 | | | | 11-1-12 | | | | 1,000,000 | | | | 1,000,365 | |
JPMorgan Chase & Company ± | | | 0.97 | | | | 9-21-12 | | | | 1,000,000 | | | | 1,000,232 | |
JPMorgan Chase & Company ± | | | 1.08 | | | | 2-26-13 | | | | 1,000,000 | | | | 1,002,215 | |
LTF Real Estate LLC ±144A§ | | | 0.30 | | | | 6-1-33 | | | | 380,000 | | | | 380,000 | |
Overseas Private Investment Corporation ±§ | | | 0.19 | | | | 7-9-26 | | | | 1,000,000 | | | | 1,000,000 | |
| | | | |
| | | | | | | | | | | | | | | 5,382,738 | |
| | | | | | | | | | | | | | | | |
| | | | |
Health Care: 0.24% | | | | | | | | | | | | | | | | |
| | | | |
| Health Care Providers & Services: 0.24% | | | | | | | | | | | | | | | | |
Acts Retirement Life Communities Incorporated ±§ | | | 0.22 | | | | 11-15-29 | | | | 225,000 | | | | 225,000 | |
Providence Health & Services ±§ | | | 0.24 | | | | 10-1-42 | | | | 1,000,000 | | | | 1,000,000 | |
| | | | |
| | | | | | | | | | | | | | | 1,225,000 | |
| | | | | | | | | | | | | | | | |
| | | | |
Total Corporate Bonds and Notes (Cost $9,607,893) | | | | | | | | | | | | | | | 9,607,893 | |
| | | | | | | | | | | | | | | | |
| | | | |
Municipal Obligations: 21.14% | | | | | | | | | | | | | | | | |
| | | | |
| Alabama: 0.19% | | | | | | | | | | | | | | | | |
Birmingham AL Special Care Facilities Finance Authority Ascension Health Series 2006-C (Hospital Revenue) ±144A§ | | | 0.24 | | | | 11-15-46 | | | | 1,000,000 | | | | 1,000,000 | |
| | | | | | | | | | | | | | | | |
| | | | |
| Arizona: 0.19% | | | | | | | | | | | | | | | | |
Arizona Health Facilities Authority Catholic Healthcare West Loan Program (Health Revenue, Citibank NA LOC) ±§ | | | 0.21 | | | | 7-1-35 | | | | 1,000,000 | | | | 1,000,000 | |
| | | | | | | | | | | | | | | | |
| | | | |
| California: 2.17% | | | | | | | | | | | | | | | | |
California HFFA Series H (Health Revenue, Bank of America NA LOC) ±§ | | | 0.22 | | | | 7-1-35 | | | | 1,200,000 | | | | 1,200,000 | |
California Infrastructure & Economic Development Bank Contemporary Jewish Museum (Miscellaneous Revenue, Bank of America NA LOC) ±§ | | | 0.23 | | | | 12-1-36 | | | | 1,000,000 | | | | 1,000,000 | |
The accompanying notes are an integral part of these financial statements.
| | | | | | |
| Portfolio of investments—August 31, 2012 (unaudited) | | Wells Fargo Advantage Dow Jones Target Date Funds | | | 95 | |
SHORT-TERM INVESTMENT PORTFOLIO
| | | | | | | | | | | | | | | | |
| Security name | | Interest rate | | | Maturity date | | | Principal | | | Value | |
| | | | | | | | | | | | | | | | |
| | | | |
| California (continued) | | | | | | | | | | | | | | | | |
California Stanford Hospital Series B (Health Revenue, FNMA LOC) ±§ | | | 0.17 | % | | | 8-1-36 | | | $ | 150,000 | | | $ | 150,000 | |
California State (Tax Revenue, GO - State) | | | 0.17 | | | | 9-17-12 | | | | 1,000,000 | | | | 1,000,000 | |
JPMorgan Chase PUTTER Trust (Miscellaneous Revenue) ±144A | | | 0.21 | | | | 5-30-13 | | | | 3,000,000 | | | | 3,000,000 | |
Roseville CA Electric System Series A (Utilities Revenue, Morgan Stanley Bank LOC) ±§ | | | 0.18 | | | | 2-1-35 | | | | 2,000,000 | | | | 2,000,000 | |
San Bernardino County CA COP Series B (Miscellaneous Revenue) ±§ | | | 0.27 | | | | 3-1-17 | | | | 459,000 | | | | 459,000 | |
San Bernardino County CA Flood Control District (Tax Revenue, Bank of America NA LOC) ±§ | | | 0.20 | | | | 8-1-37 | | | | 500,000 | | | | 500,000 | |
San Francisco CA City & County RDA Notre Dame Apartments Series G (Housing Revenue, Citibank NA LOC) ±§ | | | 0.23 | | | | 12-1-33 | | | | 985,000 | | | | 985,000 | |
San Francisco City and County CA Public Utilities Commission (Utilities Revenue) | | | 0.19 | | | | 10-2-12 | | | | 1,000,000 | | | | 1,000,000 | |
| | | | |
| | | | | | | | | | | | | | | 11,294,000 | |
| | | | | | | | | | | | | | | | |
| | | | |
| Colorado: 0.81% | | | | | | | | | | | | | | | | |
Colorado HFA Class I Series B-2 (Housing Revenue) ±§ | | | 0.18 | | | | 5-1-38 | | | | 1,000,000 | | | | 1,000,000 | |
Colorado HFA Taxable MFHR Project Series A1 (Housing Revenue) ±§ | | | 0.19 | | | | 10-1-33 | | | | 965,000 | | | | 965,000 | |
Colorado HFA Taxable MFHR Project Series B2 (Housing Revenue) ±§ | | | 0.18 | | | | 5-1-50 | | | | 250,000 | | | | 250,000 | |
Denver CO City & County Subseries G1 (Airport Revenue, Assured Guaranty Insured) ±§ | | | 0.21 | | | | 11-15-25 | | | | 1,000,000 | | | | 1,000,000 | |
Denver CO City & County Subseries G2 (Airport Revenue, Assured Guaranty Insured) ±§ | | | 0.21 | | | | 11-15-25 | | | | 1,000,000 | | | | 1,000,000 | |
| | | | |
| | | | | | | | | | | | | | | 4,215,000 | |
| | | | | | | | | | | | | | | | |
| | | | |
| Delaware: 0.20% | | | | | | | | | | | | | | | | |
PFOTER Series TNP-1002 (Miscellaneous Revenue) ±144A§ | | | 0.90 | | | | 9-1-34 | | | | 1,060,000 | | | | 1,060,000 | |
| | | | | | | | | | | | | | | | |
| | | | |
| District of Columbia: 0.19% | | | | | | | | | | | | | | | | |
Metro Washington DC Airport Authority (Airport Revenue) | | | 0.18 | | | | 9-4-12 | | | | 1,000,000 | | | | 1,000,000 | |
| | | | | | | | | | | | | | | | |
| | | | |
| Florida: 0.76% | | | | | | | | | | | | | | | | |
Jacksonville FL Capital Projects Series A (Utilities Revenue, Bank of America NA LOC) ±§ | | | 0.21 | | | | 10-1-34 | | | | 1,955,000 | | | | 1,955,000 | |
JPMorgan Chase PUTTER Trust Series 4128 (Miscellaneous Revenue, JPMorgan Chase Bank LIQ) ±144A§ | | | 0.19 | | | | 3-1-21 | | | | 1,000,000 | | | | 1,000,000 | |
Miami-Dade County FL Eclipse Funding Trust (Tax Revenue, U.S. Bank NA) ±§ | | | 0.17 | | | | 7-1-13 | | | | 995,000 | | | | 995,000 | |
| | | | |
| | | | | | | | | | | | | | | 3,950,000 | |
| | | | | | | | | | | | | | | | |
| | | | |
| Georgia: 0.19% | | | | | | | | | | | | | | | | |
Richmond County GA Development Authority (Education Revenue) ±§ | | | 0.18 | | | | 7-1-37 | | | | 975,000 | | | | 975,000 | |
| | | | | | | | | | | | | | | | |
| | | | |
| Illinois: 0.58% | | | | | | | | | | | | | | | | |
Chicago IL Deutsche Bank PFOTER Trust Series DB-393 (GO, JPMorgan Chase Bank SPA) ±§ | | | 0.19 | | | | 1-1-34 | | | | 1,000,000 | | | | 1,000,000 | |
Illinois Educational Facilities Authority Field Museum National History (Miscellaneous Revenue, Bank of America NA LOC) ±§ | | | 0.27 | | | | 11-1-32 | | | | 1,000,000 | | | | 1,000,000 | |
Springfield IL PUTTER Series 1314 (Utilities Revenue, BHAC-CR, MBIA Insured) ±§ | | | 0.18 | | | | 3-1-14 | | | | 1,000,000 | | | | 1,000,000 | |
| | | | |
| | | | | | | | | | | | | | | 3,000,000 | |
| | | | | | | | | | | | | | | | |
The accompanying notes are an integral part of these financial statements.
| | | | |
| 96 | | Wells Fargo Advantage Dow Jones Target Date Funds | | Portfolio of investments—August 31, 2012 (unaudited) |
SHORT-TERM INVESTMENT PORTFOLIO
| | | | | | | | | | | | | | | | |
| Security name | | Interest rate | | | Maturity date | | | Principal | | | Value | |
| | | | | | | | | | | | | | | | |
| | | | |
| Indiana: 0.82% | | | | | | | | | | | | | | | | |
Indiana Finance Authority Parkview Health System Obligation Group Project Series 2009 C (Health Revenue, PNC Bank NA LOC) ±§ | | | 0.14 | % | | | 11-1-39 | | | $ | 3,000,000 | | | $ | 3,000,000 | |
Indiana Housing & CDA (Housing Revenue) ±§ | | | 0.22 | | | | 7-1-36 | | | | 1,000,000 | | | | 1,000,000 | |
Richmond IN Reid Hospital & Health Care Services Incorporated Hospital Authority Series A (Health Revenue, AGM Insured) ±§ | | | 0.20 | | | | 1-1-40 | | | | 240,000 | | | | 240,000 | |
| | | | |
| | | | | | | | | | | | | | | 4,240,000 | |
| | | | | | | | | | | | | | | | |
| | | | |
| Louisiana: 0.87% | | | | | | | | | | | | | | | | |
East Baton Rouge Parish LA IDR Series A (IDR) ±§ | | | 0.19 | | | | 8-1-35 | | | | 1,000,000 | | | | 1,000,000 | |
East Baton Rouge Parish LA Road and Street Improvement Project Series A (Transportation Revenue, JPMorgan Chase Bank LOC) ±§ | | | 0.19 | | | | 8-1-30 | | | | 2,000,000 | | | | 2,000,000 | |
Louisiana State GO JPMorgan Chase PUTTER Series 4049 (GO, AGM Insured, JPMorgan Chase Bank LIQ) ±144A§ | | | 0.22 | | | | 5-1-13 | | | | 1,000,000 | | | | 1,000,000 | |
St. James Parish LA Series A-1 (IDR) ±§ | | | 0.18 | | | | 11-1-40 | | | | 500,000 | | | | 500,000 | |
| | | | |
| | | | | | | | | | | | | | | 4,500,000 | |
| | | | | | | | | | | | | | | | |
| | | | |
| Maryland: 0.83% | | | | | | | | | | | | | | | | |
Baltimore MD Package Systems Facilities (Transportation Revenue, Bank of America NA LOC) ±§ | | | 0.24 | | | | 7-1-32 | | | | 970,000 | | | | 970,000 | |
Maryland CDA Department Housing & Community Development Series 2006-G (Housing Revenue) ±§ | | | 0.20 | | | | 9-1-40 | | | | 500,000 | | | | 500,000 | |
Maryland Health & HEFAR Series D (Miscellaneous Revenue, Bank of
America NA LOC) ±§ | | | 0.23 | | | | 1-1-29 | | | | 845,000 | | | | 845,000 | |
Maryland State Housing & Community Development Residential Series 2007-F (Housing Revenue, PNC Bank NA LOC) ±§ | | | 0.15 | | | | 9-1-31 | | | | 1,000,000 | | | | 1,000,000 | |
Montgomery County MD Series 2009 (Tax Revenue) | | | 0.18 | | | | 9-5-12 | | | | 1,000,000 | | | | 1,000,000 | |
| | | | |
| | | | | | | | | | | | | | | 4,315,000 | |
| | | | | | | | | | | | | | | | |
| | | | |
| Massachusetts: 0.06% | | | | | | | | | | | | | | | | |
Massachusetts Development Finance Agency Babson College Series B (Education Revenue, Citizens Bank LOC) ±§ | | | 0.18 | | | | 10-1-31 | | | | 325,000 | | | | 325,000 | |
| | | | | | | | | | | | | | | | |
| | | | |
| Michigan: 0.19% | | | | | | | | | | | | | | | | |
RBC Municipal Products Incorporated (Education Revenue) ±§ | | | 0.22 | | | | 9-1-33 | | | | 1,000,000 | | | | 1,000,000 | |
| | | | | | | | | | | | | | | | |
| | | | |
| Minnesota: 0.03% | | | | | | | | | | | | | | | | |
Minnesota State HFA Residential Housing Series T (Housing Revenue, GO of Agency Insured) ±§ | | | 0.21 | | | | 7-1-48 | | | | 170,000 | | | | 170,000 | |
| | | | | | | | | | | | | | | | |
| | | | |
| Missouri: 0.19% | | | | | | | | | | | | | | | | |
Missouri Joint Municipal Electric Utility Commission Power Prairie Eclipse Funding Trust Series 2007-0111 (Miscellaneous Revenue, U.S. Bank NA LOC) ±§ | | | 0.17 | | | | 1-1-32 | | | | 995,000 | | | | 995,000 | |
| | | | | | | | | | | | | | | | |
| | | | |
| Nebraska: 0.19% | | | | | | | | | | | | | | | | |
Central Plains NE Nebraska Gas Project #2 Series 2009 (Utilities Revenue, Royal Bank of Canada SPA) ±§ | | | 0.18 | | | | 8-1-39 | | | | 995,000 | | | | 995,000 | |
| | | | | | | | | | | | | | | | |
| | | | |
| Nevada: 0.10% | | | | | | | | | | | | | | | | |
Las Vegas NV EDA Revenue Keep Memory Alive Project (Miscellaneous Revenue, PNC Bank NA LOC) ±§ | | | 0.15 | | | | 5-1-37 | | | | 500,000 | | | | 500,000 | |
| | | | | | | | | | | | | | | | |
The accompanying notes are an integral part of these financial statements.
| | | | | | |
| Portfolio of investments—August 31, 2012 (unaudited) | | Wells Fargo Advantage Dow Jones Target Date Funds | | | 97 | |
SHORT-TERM INVESTMENT PORTFOLIO
| | | | | | | | | | | | | | | | |
| Security name | | Interest rate | | | Maturity date | | | Principal | | | Value | |
| | | | | | | | | | | | | | | | |
| | | | |
| New Jersey: 0.87% | | | | | | | | | | | | | | | | |
New Jersey Housing & Mortgage Finance Agency AMT SFMR Series Y (Housing Revenue, Royal Bank of Canada SPA) ±§ | | | 0.16 | % | | | 10-1-39 | | | $ | 1,000,000 | | | $ | 1,000,000 | |
New Jersey TRAN Series A (Miscellaneous Revenue) ± | | | 0.50 | | | | 6-27-13 | | | | 2,500,000 | | | | 2,500,420 | |
Salem County NJ PCFA Atlantic City Electric (Utilities Revenue, JPMorgan Chase Bank LOC) ±§ | | | 0.20 | | | | 4-15-14 | | | | 1,000,000 | | | | 1,000,000 | |
| | | | |
| | | | | | | | | | | | | | | 4,500,420 | |
| | | | | | | | | | | | | | | | |
| | | | |
| New Mexico: 0.19% | | | | | | | | | | | | | | | | |
New Mexico Municipal Energy Acquisition Authority Gas Supply Series 2009 (Utilities Revenue, Royal Bank of Canada SPA) ±§ | | | 0.18 | | | | 11-1-39 | | | | 1,000,000 | | | | 1,000,000 | |
| | | | | | | | | | | | | | | | |
| | | | |
| New York: 2.66% | | | | | | | | | | | | | | | | |
JPMorgan Chase PUTTER/DRIVER (Miscellaneous Revenue) ±144A | | | 0.19 | | | | 10-1-13 | | | | 1,000,000 | | | | 1,000,000 | |
Nassau County NY Interim Finance Authority Series E
(Tax Revenue) ±§ | | | 0.17 | | | | 11-15-14 | | | | 1,000,000 | | | | 1,000,000 | |
New York City NY Abraham Joshua Hesehal School (Miscellaneous Revenue, TD Bank NA LOC) ±§ | | | 0.18 | | | | 1-1-40 | | | | 250,000 | | | | 250,000 | |
New York City NY Transitional Finance Authority Revenue Subseries A-7 (Miscellaneous Revenue) ±§ | | | 0.16 | | | | 8-1-39 | | | | 1,000,000 | | | | 1,000,000 | |
New York Dormitory Authority Revenue (Education Revenue, JPMorgan Chase Bank SPA) ±§ | | | 0.17 | | | | 7-1-39 | | | | 1,000,000 | | | | 1,000,000 | |
New York HFA 50th Street Housing Series 1999-A (Housing Revenue, FNMA Insured) ±§ | | | 0.17 | | | | 5-1-29 | | | | 500,000 | | | | 500,000 | |
New York HFA Biltmore Tower Housing Project Series A (Housing Revenue, FNMA Insured) ±§ | | | 0.18 | | | | 5-15-34 | | | | 1,000,000 | | | | 1,000,000 | |
New York HFA Victory Housing Series 2004-A (Housing Revenue, FHLMC Insured) ±§ | | | 0.18 | | | | 11-1-33 | | | | 500,000 | | | | 500,000 | |
New York Housing Finance Agency Eleventh Avenue Housing Project Series A (Housing Revenue, FNMA Insured) ±§ | | | 0.18 | | | | 5-15-41 | | | | 2,000,000 | | | | 2,000,000 | |
New York Mortgage Agency Homeowner Mortgage Series 132 (Housing Revenue) ±§ | | | 0.22 | | | | 4-1-37 | | | | 1,000,000 | | | | 1,000,000 | |
New York Mortgage Agency Homeowner ROC RR-II-R-11703 (Housing Revenue, CitiBank NA LIQ) ±144A§ | | | 0.37 | | | | 10-1-31 | | | | 920,000 | | | | 920,000 | |
New York NY Municipal Water Finance Authority Series DD-1 (Water & Sewer Revenue) ±§ | | | 0.18 | | | | 6-15-43 | | | | 1,000,000 | | | | 1,000,000 | |
New York NY Municipal Water Finance Authority Series CC-1 (Water & Sewer Revenue) ±§ | | | 0.18 | | | | 6-15-38 | | | | 1,000,000 | | | | 1,000,000 | |
New York PFOTER (Miscellaneous Revenue) ±144A§ | | | 0.48 | | | | 6-15-53 | | | | 1,000,000 | | | | 1,000,000 | |
PFOTER Series TNP-1004 (Resource Recovery Revenue, AMBAC Insured) ±144A§ | | | 0.75 | | | | 1-29-46 | | | | 670,000 | | | | 670,000 | |
| | | | |
| | | | | | | | | | | | | | | 13,840,000 | |
| | | | | | | | | | | | | | | | |
| | | | |
| North Carolina: 0.09% | | | | | | | | | | | | | | | | |
North Carolina Medical Care Commission University Health System Series B-2 (Health Revenue, Branch Banking & Trust LOC) ±§ | | | 0.15 | | | | 12-1-36 | | | | 475,000 | | | | 475,000 | |
| | | | | | | | | | | | | | | | |
| | | | |
| Ohio: 0.79% | | | | | | | | | | | | | | | | |
Lancaster OH Port Authority Gas Supply Series 2008 (Utilities Revenue, Royal Bank of Canada SPA) ±§ | | | 0.18 | | | | 5-1-38 | | | | 1,990,000 | | | | 1,990,000 | |
Montgomery County OH Catholic Health Series C-2 (Health
Revenue) ±§ | | | 0.15 | | | | 10-1-41 | | | | 1,000,000 | | | | 1,000,000 | |
Ohio State HFA Residential Management Taxable Series I (Housing Revenue, FNMA Insured) ±§ | | | 0.19 | | | | 9-1-39 | | | | 204,000 | | | | 204,000 | |
Warren County OH Health Care Facilities Otterbein Homes Series 1998 B (Health Revenue, U.S. Bank NA LOC) ±§ | | | 0.14 | | | | 7-1-23 | | | | 925,000 | | | | 925,000 | |
| | | | |
| | | | | | | | | | | | | | | 4,119,000 | |
| | | | | | | | | | | | | | | | |
The accompanying notes are an integral part of these financial statements.
| | | | |
| 98 | | Wells Fargo Advantage Dow Jones Target Date Funds | | Portfolio of investments—August 31, 2012 (unaudited) |
SHORT-TERM INVESTMENT PORTFOLIO
| | | | | | | | | | | | | | | | |
| Security name | | Interest rate | | | Maturity date | | | Principal | | | Value | |
| | | | | | | | | | | | | | | | |
| | | | |
| Oregon: 0.38% | | | | | | | | | | | | | | | | |
Oregon State Department PFOTER (Miscellaneous Revenue, Bank of America NA LIQ) ±144A§ | | | 0.48 | % | | | 5-1-35 | | | $ | 1,000,000 | | | $ | 1,000,000 | |
Oregon State Housing & Community Services Pearl Family Housing Project 2009 Series B-1 (Housing Revenue, U.S. Bank NA LOC) ±§ | | | 0.15 | | | | 2-1-42 | | | | 1,000,000 | | | | 1,000,000 | |
| | | | |
| | | | | | | | | | | | | | | 2,000,000 | |
| | | | | | | | | | | | | | | | |
| | | | |
| Pennsylvania: 1.20% | | | | | | | | | | | | | | | | |
Doylestown PA Hospital Authority Series B (Health Revenue, PNC Bank NA LOC) ±§ | | | 0.15 | | | | 7-1-37 | | | | 500,000 | | | | 500,000 | |
Montgomery County PA Lower Merion School District Series 2009 A (GO, State Street Bank & Trust Company LOC, State Aid Withholding Insured) ±§ | | | 0.15 | | | | 4-1-27 | | | | 1,000,000 | | | | 1,000,000 | |
Pennsylvania Housing Finance PUTTER Series PT-4653 (Housing Revenue, Bank of America NA LIQ) ±144A§ | | | 0.20 | | | | 10-1-39 | | | | 1,000,000 | | | | 1,000,000 | |
Pennsylvania State Public School Building Authority (Education Revenue, FSA Insured) ±§ | | | 0.24 | | | | 6-1-32 | | | | 1,000,000 | | | | 1,000,000 | |
Philadelphia PA Airport Revenue Series 2005 C-2 (Airport Revenue, Royal Bank of Canada LOC) ±§ | | | 0.17 | | | | 6-15-25 | | | | 960,000 | | | | 960,000 | |
Pittsburgh and Allegheny Counties PA Sports and Exhibition Authority Series B (Miscellaneous Revenue, AGM Insured, PNC Bank
NA SPA) ±§ | | | 0.39 | | | | 11-1-39 | | | | 1,000,000 | | | | 1,000,000 | |
PFOTER Notes Series TNP-1003 (Education Revenue) ±144A§ | | | 0.75 | | | | 6-1-47 | | | | 800,000 | | | | 800,000 | |
| | | | |
| | | | | | | | | | | | | | | 6,260,000 | |
| | | | | | | | | | | | | | | | |
| | | | |
| Puerto Rico: 0.19% | | | | | | | | | | | | | | | | |
Puerto Rico Sales Tax Financing Corporation Series 3036 (Tax Revenue, Morgan Stanley Bank LIQ) ± | | | 0.17 | | | | 8-1-57 | | | | 1,000,000 | | | | 1,000,000 | |
| | | | | | | | | | | | | | | | |
| | | | |
| South Carolina: 1.06% | | | | | | | | | | | | | | | | |
PFOTER Series 730 (Lease Revenue) ±144A§ | | | 0.20 | | | | 12-1-28 | | | | 500,000 | | | | 500,000 | |
South Carolina Public Service Authority (Miscellaneous Revenue) | | | 0.17 | | | | 9-5-12 | | | | 1,000,000 | | | | 1,000,000 | |
South Carolina Public Service Authority (Miscellaneous Revenue) | | | 0.18 | | | | 9-18-12 | | | | 1,000,000 | | | | 1,000,000 | |
South Carolina Public Service Authority (Miscellaneous Revenue) | | | 0.19 | | | | 9-19-12 | | | | 1,000,000 | | | | 1,000,000 | |
South Carolina Public Service Authority (Miscellaneous Revenue) ±144A§ | | | 0.21 | | | | 1-1-50 | | | | 1,000,000 | | | | 1,000,000 | |
South Carolina Public Service Authority JPMorgan Chase PUTTER Series 4046 (Miscellaneous Revenue, AMBAC Insured, JPMorgan Chase Bank LIQ) ±144A§ | | | 0.19 | | | | 7-1-13 | | | | 1,000,000 | | | | 1,000,000 | |
| | | | |
| | | | | | | | | | | | | | | 5,500,000 | |
| | | | | | | | | | | | | | | | |
| | | | |
| Tennessee: 0.94% | | | | | | | | | | | | | | | | |
Johnson City TN Health & Educational Facilities Board (Health Revenue, PNC Bank NA LOC) ±§ | | | 0.19 | | | | 7-1-33 | | | | 480,000 | | | | 480,000 | |
JPMorgan Chase PUTTER Trust Series 4149 (Tax Revenue, JPMorgan Chase Bank LOC) ±144A§ | | | 0.22 | | | | 10-1-13 | | | | 2,000,000 | | | | 2,000,000 | |
Montgomery County TN Public Building Authority (Miscellaneous Revenue, Bank of America NA LOC) ± | | | 0.25 | | | | 2-1-36 | | | | 410,000 | | | | 410,000 | |
Montgomery County TN Public Building Authority Pooled Financing Revenue (Miscellaneous Revenue, Bank of America NA LOC) ±§ | | | 0.25 | | | | 7-1-34 | | | | 2,000,000 | | | | 2,000,000 | |
| | | | |
| | | | | | | | | | | | | | | 4,890,000 | |
| | | | | | | | | | | | | | | | |
| | | | |
| Texas: 2.94% | | | | | | | | | | | | | | | | |
Bexar County TX Health Facilities Development (Health Revenue, JPMorgan Chase Bank LOC) ±§ | | | 0.19 | | | | 12-1-32 | | | | 1,920,000 | | | | 1,920,000 | |
Harris County TX Cultural Education Facilities Finance Corporation Hermann Health Series D1 (Health Revenue, JPMorgan Chase Bank LOC) ±§ | | | 0.17 | | | | 6-1-29 | | | | 1,000,000 | | | | 1,000,000 | |
JPMorgan Chase PUTTER Trust (Miscellaneous Revenue) ±144A | | | 0.20 | | | | 8-30-13 | | | | 4,000,000 | | | | 4,000,000 | |
The accompanying notes are an integral part of these financial statements.
| | | | | | |
| Portfolio of investments—August 31, 2012 (unaudited) | | Wells Fargo Advantage Dow Jones Target Date Funds | | | 99 | |
SHORT-TERM INVESTMENT PORTFOLIO
| | | | | | | | | | | | | | | | |
| Security name | | Interest rate | | | Maturity date | | | Principal | | | Value | |
| | | | | | | | | | | | | | | | |
| | | | |
| Texas: (continued) | | | | | | | | | | | | | | | | |
Pasadena TX Independent School District Series B (Tax Revenue, AGM Insured, Bank of America NA SPA) ±§ | | | 0.46 | % | | | 2-1-35 | | | $ | 1,000,000 | | | $ | 1,000,000 | |
PFOTER (Miscellaneous Revenue) ±144A§ | | | 0.49 | | | | 8-1-15 | | | | 4,000,000 | | | | 4,000,000 | |
Port Arthur TX Navigation District Environmental Facilities Motiva Enterprises Project Subseries 2009C (Resource Recovery
Revenue) ±§ | | | 0.18 | | | | 12-1-39 | | | | 1,000,000 | | | | 1,000,000 | |
Royal Bank of Canada Municipal Products Incorporated Trust Certificates Series E-18 (Miscellaneous Revenue, Royal Bank of Canada LOC & SPA) ±144A§ | | | 0.17 | | | | 6-1-32 | | | | 1,000,000 | | | | 1,000,000 | |
Texas Municipal Gas Acquisition & Supply Corporation Series 2848 (Miscellaneous Revenue, Morgan Stanley Bank LIQ) ±§ | | | 0.47 | | | | 12-15-26 | | | | 1,000,000 | | | | 1,000,000 | |
Texas State Taxable Product Development Program Series A (Miscellaneous Revenue, Nations Bank NA LOC) ±§ | | | 0.21 | | | | 6-1-45 | | | | 100,000 | | | | 100,000 | |
Tyler TX Health Facilities Development Corporation Mother Frances Hospital Series B (Health Revenue, Bank of America NA LOC) ±§ | | | 0.21 | | | | 7-1-20 | | | | 300,000 | | | | 300,000 | |
| | | | |
| | | | | | | | | | | | | | | 15,320,000 | |
| | | | | | | | | | | | | | | | |
| | | | |
| Utah: 0.18% | | | | | | | | | | | | | | | | |
Utah State Board of Regents Series A (Education Revenue, Royal Bank of Canada LOC) ±§ | | | 0.20 | | | | 11-1-45 | | | | 923,000 | | | | 923,000 | |
| | | | | | | | | | | | | | | | |
| | | | | | | | | | | | | | | | |
| | | | |
| Vermont: 0.19% | | | | | | | | | | | | | | | | |
Vermont Educational & Health Buildings Financing Agency Various Norwich University Project Series 2008 (Education Revenue, TD Bank NA LOC) ±§ | | | 0.14 | | | | 9-1-38 | | | | 975,000 | | | | 975,000 | |
| | | | | | | | | | | | | | | | |
| | | | |
| Washington: 0.38% | | | | | | | | | | | | | | | | |
Seattle WA Eclipse Funding Trust (Port Authority Revenue, U.S. Bank NA LOC) ±144A§ | | | 0.17 | | | | 3-1-35 | | | | 1,995,000 | | | | 1,995,000 | |
| | | | | | | | | | | | | | | | |
| | | | |
| Wisconsin: 0.48% | | | | | | | | | | | | | | | | |
Wisconsin Housing & EDA Series F (Housing Revenue, GO of Authority Insured) ±§ | | | 0.23 | | | | 5-1-30 | | | | 485,000 | | | | 485,000 | |
Wisconsin PFA Cleveland State University Housing Project Series 2011 (Housing Revenue, Bank of America NA LOC) ±§ | | | 0.36 | | | | 1-1-42 | | | | 1,000,000 | | | | 1,000,000 | |
Wisconsin Public Power PUTTER Series 1232 (Utilities Revenue, BHAC-CR, AMBAC Insured, JPMorgan Chase Bank LIQ) ±§ | | | 0.21 | | | | 7-1-13 | | | | 1,000,000 | | | | 1,000,000 | |
| | | | |
| | | | | | | | | | | | | | | 2,485,000 | |
| | | | | | | | | | | | | | | | |
| | | | |
| Wyoming: 0.04% | | | | | | | | | | | | | | | | |
Wyoming Student Loan Corporation Series A (Education Revenue, Royal Bank of Canada LOC) ±§ | | | 0.18 | | | | 6-1-35 | | | | 225,000 | | | | 225,000 | |
| | | | | | | | | | | | | | | | |
| | | | |
Total Municipal Obligations (Cost $110,041,420) | | | | | | | | | | | | | | | 110,041,420 | |
| | | | | | | | | | | | | | | | |
| | | | |
Other Instruments: 1.00% | | | | | | | | | | | | | | | | |
City of Austin Texas Municipal Commercial Paper (z) | | | 0.19 | | | | 10-3-12 | | | | 1,000,000 | | | | 999,847 | |
District Of Columbia Variable Rate Demand Note | | | 0.18 | | | | 9-17-12 | | | | 1,000,000 | | | | 1,000,000 | |
GBG LLC Custody Receipts Special Purpose Entity ±144A§ | | | 0.22 | | | | 9-1-27 | | | | 179,000 | | | | 179,000 | |
HSBC Bank plc Private Placement ±144A | | | 0.86 | | | | 1-18-13 | | | | 1,000,000 | | | | 1,001,660 | |
Oakland-Alameda County Series A-2 Other Commercial Paper | | | 0.23 | | | | 9-5-12 | | | | 1,000,000 | | | | 1,000,000 | |
University of Chicago Municipal Commercial Paper (z) | | | 0.20 | | | | 10-23-12 | | | | 1,000,000 | | | | 999,728 | |
| | | | |
Total Other Instruments (Cost $5,180,235) | | | | | | | | | | | | | | | 5,180,235 | |
| | | | | | | | | | | | | | | | |
The accompanying notes are an integral part of these financial statements.
| | | | |
| 100 | | Wells Fargo Advantage Dow Jones Target Date Funds | | Portfolio of investments—August 31, 2012 (unaudited) |
SHORT-TERM INVESTMENT PORTFOLIO
| | | | | | | | | | | | | | | | |
| Security name | | Interest rate | | | Maturity date | | | Principal | | | Value | |
| | | | | | | | | | | | | | | | |
| | | | |
Repurchase Agreements ^^: 10.51% | | | | | | | | | | | | | | | | |
Barclays Capital Incorporated, dated 8/31/2012, maturity value $24,000,533 (1) | | | 0.20 | % | | | 9-4-12 | | | $ | 24,000,000 | | | $ | 24,000,000 | |
BNP Paribas Securities Corporation, dated 08/31/2012, maturity value $6,000,153 (2) | | | 0.23 | | | | 9-4-12 | | | | 6,000,000 | | | | 6,000,000 | |
GX Clarke & Company, dated 08/31/12, maturity value
$2,000,064 (3) | | | 0.29 | | | | 9-4-12 | | | | 2,000,000 | | | | 2,000,000 | |
Societe Generale New York, dated 08/31/2012, maturity value $22,699,124 (4) | | | 0.20 | | | | 9-4-12 | | | | 22,698,220 | | | | 22,698,220 | |
| | | | |
Total Repurchase Agreements (Cost $54,698,220) | | | | | | | | | | | | | | | 54,698,220 | |
| | | | | | | | | | | | | | | | |
| | | | |
| | | Yield | | | | | | | | | | |
| U.S. Treasury Securities: 1.73% | | | | | | | | | | | | | | | | |
U.S. Treasury Bill (z) | | | 0.12 | | | | 10-4-12 | | | | 2,000,000 | | | | 1,999,765 | |
U.S. Treasury Bill (z) | | | 0.13 | | | | 10-11-12 | | | | 2,000,000 | | | | 1,999,702 | |
U.S. Treasury Bill (z) | | | 0.14 | | | | 2-21-13 | | | | 3,000,000 | | | | 3,018,585 | |
U.S. Treasury Bill (z) | | | 0.14 | | | | 2-28-13 | | | | 2,000,000 | | | | 1,998,623 | |
| | | | |
Total U.S. Treasury Securities (Cost $8,996,071) | | | | | | | | | | | | | | | 9,016,675 | |
| | | | | | | | | | | | | | | | |
| | | | | | | | |
| Total investments in securities | | | | | | | | |
| (Cost $520,460,243)* | | | 100.00 | % | | | 520,480,847 | |
Other assets and liabilities, net | | | 0.00 | | | | 6,612 | |
| | | | | | | | |
| Total net assets | | | 100.00 | % | | $ | 520,487,459 | |
| | | | | | | | |
| ± | Variable rate investment |
| 144A | Security that may be resold to “qualified institutional buyers” under Rule 144A or security offered pursuant to Section 4(2) of the Securities Act of 1933, as amended. |
| (z) | Zero coupon security. Rate represents yield to maturity at time of purchase. |
| (p) | Asset-backed commercial paper |
| § | These securities are subject to a demand feature which reduces the effective maturity. |
| | (1) | U.S. government securities, 2.35% to 5.22%, 4-1-38 to 7-1-42, fair value including accrued interest is $24,720,000. |
| | (2) | U.S. government securities, 0.25% to 4.00%, 2-15-15 to 8-15-15, fair value including accrued interest is $6,120,001. |
| | (3) | U.S. government securities, 0.50% to 10.00%, 11-15-12 to 8-1-42, fair value including accrued interest is $2,053,388. |
| | (4) | U.S. government securities, 1.35% to 7.00%, 11-1-15 to 3-1-48, fair value including accrued interest is $23,379,167. |
| * | Cost for federal income tax purposes is $520,460,243 and unrealized appreciation (depreciation) consists of: |
| | | | |
Gross unrealized appreciation | | $ | 29,811 | |
Gross unrealized depreciation | | | (9,207 | ) |
| | | | |
Net unrealized appreciation | | $ | 20,604 | |
The accompanying notes are an integral part of these financial statements.
| | | | | | |
| Statements of assets and liabilities—August 31, 2012 (unaudited) | | Wells Fargo Advantage Dow Jones Target Date Funds | | | 101 | |
| | | | | | | | | | | | |
| | | Diversified Fixed
Income Portfolio | | | Diversified Stock Portfolio | | | Short-Term
Investment Portfolio | |
| | | |
Assets | | | | | | | | | | | | |
Investments | | | | | | | | | | | | |
In unaffiliated securities (including securities on loan), at value (see cost below) | | $ | 4,708,402,466 | | | $ | 6,984,834,407 | | | $ | 465,782,627 | |
In affiliated securities, at value (see cost below) | | | 193,222,379 | | | | 1,087,212,861 | | | | 0 | |
In repurchase agreements, at amortized cost | | | 0 | | | | 0 | | | | 54,698,220 | |
| | | | | | | | | | | | |
Total investments, at value (see cost below) | | | 4,901,624,845 | | | | 8,072,047,268 | | | | 520,480,847 | |
Segregated cash | | | 0 | | | | 9,779,800 | | | | 0 | |
Foreign currency, at value (see cost below) | | | 18,118,342 | | | | 23,540,846 | | | | 0 | |
Receivable for investments sold | | | 10,243,187 | | | | 252,197 | | | | 981,000 | |
Principal paydown receivable | | | 87,890 | | | | 0 | | | | 0 | |
Receivable for dividends and interest | | | 36,300,065 | | | | 14,655,584 | | | | 99,952 | |
Receivable for daily variation margin on open futures contracts | | | 0 | | | | 2,356,615 | | | | 0 | |
Receivable for securities lending income | | | 372 | | | | 459,153 | | | | 0 | |
Prepaid expenses and other assets | | | 0 | | | | 1,297 | | | | 3,040 | |
| | | | | | | | | | | | |
Total assets | | | 4,966,374,701 | | | | 8,123,092,760 | | | | 521,564,839 | |
| | | | | | | | | | | | |
| | | |
Liabilities | | | | | | | | | | | | |
Payable for investments purchased | | | 179,081,146 | | | | 22,447 | | | | 1,000,000 | |
Payable upon receipt of securities loaned | | | 6,794,438 | | | | 897,621,170 | | | | 0 | |
Due to custodian bank | | | 0 | | | | 0 | | | | 396 | |
Advisory fee payable | | | 1,080,820 | | | | 1,710,292 | | | | 48,349 | |
Accrued expenses and other liabilities | | | 102,333 | | | | 182,650 | | | | 28,635 | |
| | | | | | | | | | | | |
Total liabilities | | | 187,058,737 | | | | 899,536,559 | | | | 1,077,380 | |
| | | | | | | | | | | | |
Total net assets | | $ | 4,779,315,964 | | | $ | 7,223,556,201 | | | $ | 520,487,459 | |
| | | | | | | | | | | | |
| | | |
Investments in unaffiliated securities, at cost | | $ | 4,391,768,906 | | | $ | 6,395,642,283 | | | $ | 465,762,023 | |
| | | | | | | | | | | | |
Investments in affiliated securities, at cost | | $ | 191,383,721 | | | $ | 1,083,693,805 | | | $ | 0 | |
| | | | | | | | | | | | |
Total investments, at cost | | $ | 4,583,152,627 | | | $ | 7,479,336,088 | | | $ | 520,460,243 | |
| | | | | | | | | | | | |
Securities on loan, at value | | $ | 6,658,126 | | | $ | 872,530,000 | | | $ | 0 | |
| | | | | | | | | | | | |
Foreign currency, at cost | | $ | 18,009,276 | | | $ | 23,323,445 | | | $ | 0 | |
| | | | | | | | | | | | |
The accompanying notes are an integral part of these financial statements.
| | | | |
| 102 | | Wells Fargo Advantage Dow Jones Target Date Funds | | Statements of operations—six months ended August 31, 2012 (unaudited) |
| | | | | | | | | | | | |
| | | Diversified Fixed
Income Portfolio | | | Diversified
Stock Portfolio | | | Short-Term
Investment Portfolio | |
| | | |
Investment income | | | | | | | | | | | | |
Dividends* | | $ | 0 | | | $ | 85,129,464 | | | $ | 0 | |
Interest** | | | 62,115,650 | | | | 17,927 | | | | 644,037 | |
Securities lending income, net | | | 17,890 | | | | 3,140,047 | | | | 0 | |
Income from affiliated securities | | | 658,552 | | | | 377,135 | | | | 0 | |
| | | | | | | | | | | | |
Total investment income | | | 62,792,092 | | | | 88,664,573 | | | | 644,037 | |
| | | | | | | | | | | | |
| | | |
Expenses | | | | | | | | | | | | |
Advisory fee | | | 6,215,929 | | | | 10,688,782 | | | | 261,737 | |
Custody and accounting fees | | | 194,243 | | | | 661,893 | | | | 22,582 | |
Professional fees | | | 29,624 | | | | 24,974 | | | | 18,524 | |
Shareholder report expenses | | | 6,949 | | | | 6,311 | | | | 4,666 | |
Trustees’ fees and expenses | | | 6,154 | | | | 6,150 | | | | 6,371 | |
Other fees and expenses | | | 40,098 | | | | 79,047 | | | | 8,260 | |
| | | | | | | | | | | | |
Total expenses | | | 6,492,997 | | | | 11,467,157 | | | | 322,140 | |
Less: Fee waivers and/or expense reimbursements | | | (349,714 | ) | | | (1,697,953 | ) | | | 0 | |
| | | | | | | | | | | | |
Net expenses | | | 6,143,283 | | | | 9,769,204 | | | | 322,140 | |
| | | | | | | | | | | | |
Net investment income | | | 56,648,809 | | | | 78,895,369 | | | | 321,897 | |
| | | | | | | | | | | | |
| | | |
REALIZED AND UNREALIZED GAINS (LOSSES) ON INVESTMENTS | | | | | | | | | | | | |
| | | |
Net realized gains on: | | | | | | | | | | | | |
Unaffiliated securities | | | 14,830,126 | | | | 103,178,641 | | | | 25,960 | |
Affiliated securities | | | 133,664 | | | | 117,510 | | | | 0 | |
Futures transactions | | | 0 | | | | 5,793,464 | | | | 0 | |
| | | | | | | | | | | | |
Net realized gains on investments | | | 14,963,790 | | | | 109,089,615 | | | | 25,960 | |
| | | | | | | | | | | | |
| | | |
Net change in unrealized gains (losses) on: | | | | | | | | | | | | |
Unaffiliated securities | | | 60,295,460 | | | | (218,583,833 | ) | | | 17,605 | |
Affiliated securities | | | 518,642 | | | | 1,518,231 | | | | 0 | |
Futures transactions | | | 0 | | | | (5,478,162 | ) | | | 0 | |
| | | | | | | | | | | | |
Net change in unrealized gains (losses) on investments | | | 60,814,102 | | | | (222,543,764 | ) | | | 17,605 | |
| | | | | | | | | | | | |
Net realized and unrealized gains (losses) on investments | | | 75,777,892 | | | | (113,454,149 | ) | | | 43,565 | |
| | | | | | | | | | | | |
Net increase (decrease) in net assets resulting from operations | | $ | 132,426,701 | | | $ | (34,558,780 | ) | | $ | 365,462 | |
| | | | | | | | | | | | |
| | | |
* Net of foreign dividend withholding taxes of | | | $0 | | | | $4,998,300 | | | | $0 | |
** Net of foreign interest withholding taxes of | | | $706,159 | | | | $11 | | | | $13 | |
The accompanying notes are an integral part of these financial statements.
| | | | | | |
| Statements of changes in net assets | | Wells Fargo Advantage Dow Jones Target Date Funds | | | 103 | |
| | | | | | | | |
| | | Diversified Fixed Income Portfolio | |
| | | Six months ended
August 31, 2012
(unaudited) | | | Year ended
February 29, 2012 | |
| | |
Operations | | | | | | | | |
Net investment income | | $ | 56,648,809 | | | $ | 113,360,487 | |
Net realized gains on investments | | | 14,963,790 | | | | 40,793,256 | |
Net change in unrealized gains (losses) on investments | | | 60,814,102 | | | | 154,825,020 | |
| | | | | | | | |
Net increase in net assets resulting from operations | | | 132,426,701 | | | | 308,978,763 | |
| | | | | | | | |
| | |
Capital share transactions | | | | | | | | |
Contributions | | | 495,754,388 | | | | 1,188,403,780 | |
Withdrawals | | | (446,265,733 | ) | | | (692,293,729 | ) |
| | | | | | | | |
Net increase in net assets resulting from capital share transactions | | | 49,488,655 | | | | 496,110,051 | |
| | | | | | | | |
Total increase in net assets | | | 181,915,356 | | | | 805,088,814 | |
| | | | | | | | |
| | |
Net assets | | | | | | | | |
Beginning of period | | | 4,597,400,608 | | | | 3,792,311,794 | |
| | | | | | | | |
End of period | | $ | 4,779,315,964 | | | $ | 4,597,400,608 | |
| | | | | | | | |
The accompanying notes are an integral part of these financial statements.
| | | | |
| 104 | | Wells Fargo Advantage Dow Jones Target Date Funds | | Statements of changes in net assets |
| | | | | | | | |
| | | Diversified Stock Portfolio | |
| | | Six months ended
August 31, 2012
(unaudited) | | | Year ended
February 29, 2012 | |
| | |
Operations | | | | | | | | |
Net investment income | | $ | 78,895,369 | | | $ | 105,026,738 | |
Net realized gains on investments | | | 109,089,615 | | | | 161,685,813 | |
Net change in unrealized gains (losses) on investments | | | (222,543,764 | ) | | | (141,258,476 | ) |
| | | | | | | | |
Net increase (decrease) in net assets resulting from operations | | | (34,558,780 | ) | | | 125,454,075 | |
| | | | | | | | |
| | |
Capital share transactions | | | | | | | | |
Contributions | | | 902,408,249 | | | | 1,725,737,499 | |
Withdrawals | | | (411,764,372 | ) | | | (704,510,357 | ) |
| | | | | | | | |
Net increase in net assets resulting from capital share transactions | | | 490,643,877 | | | | 1,021,227,142 | |
| | | | | | | | |
Total increase in net assets | | | 456,085,097 | | | | 1,146,681,217 | |
| | | | | | | | |
| | |
Net assets | | | | | | | | |
Beginning of period | | | 6,767,471,104 | | | | 5,620,789,887 | |
| | | | | | | | |
End of period | | $ | 7,223,556,201 | | | $ | 6,767,471,104 | |
| | | | | | | | |
The accompanying notes are an integral part of these financial statements.
| | | | | | |
| Statements of changes in net assets | | Wells Fargo Advantage Dow Jones Target Date Funds | | | 105 | |
| | | | | | | | |
| | | Short-Term Investment Portfolio | |
| | | Six months ended
August 31, 2012
(unaudited) | | | Year ended
February 29, 2012 | |
| | |
Operations | | | | | | | | |
Net investment income | | $ | 321,897 | | | $ | 577,464 | |
Net realized gains on investments | | | 25,960 | | | | 3,474 | |
Net change in unrealized gains (losses) on investments | | | 17,605 | | | | (4,578 | ) |
| | | | | | | | |
Net increase in net assets resulting from operations | | | 365,462 | | | | 576,360 | |
| | | | | | | | |
| | |
Capital share transactions | | | | | | | | |
Contributions | | | 135,403,375 | | | | 172,320,496 | |
Withdrawals | | | (87,732,214 | ) | | | (93,094,375 | ) |
| | | | | | | | |
Net increase in net assets resulting from capital share transactions | | | 47,671,161 | | | | 79,226,121 | |
| | | | | | | | |
Total increase in net assets | | | 48,036,623 | | | | 79,802,481 | |
| | | | | | | | |
| | |
Net assets | | | | | | | | |
Beginning of period | | | 472,450,836 | | | | 392,648,355 | |
| | | | | | | | |
End of period | | $ | 520,487,459 | | | $ | 472,450,836 | |
| | | | | | | | |
The accompanying notes are an integral part of these financial statements.
| | | | |
| 106 | | Wells Fargo Advantage Dow Jones Target Date Funds | | Financial highlights |
| | | | | | | | | | | | | | | | | | | | |
| | | Ratio to average net assets (annualized) | | | Total
return1 | | | Portfolio turnover
rate | |
| | Net investment
income | | | Gross
expenses | | | Net
expenses | | | |
| | | | | |
Diversified Fixed Income Portfolio | | | | | | | | | | | | | | | | | | | | |
March 1, 2012 to August 31, 2012 (unaudited) | | | 2.39 | % | | | 0.27 | % | | | 0.26 | % | | | 2.80 | % | | | 20 | % |
March 1, 2011 to February 29, 2012 | | | 2.66 | % | | | 0.27 | % | | | 0.26 | % | | | 7.41 | % | | | 52 | % |
March 1, 2010 to February 28, 2011 | | | 2.84 | % | | | 0.28 | % | | | 0.26 | % | | | 5.58 | % | | | 57 | % |
March 1, 2009 to February 28, 2010 | | | 3.47 | % | | | 0.31 | % | | | 0.28 | % | | | 10.44 | % | | | 113 | % |
March 1, 2008 to February 28, 2009 | | | 4.18 | % | | | 0.35 | % | | | 0.35 | % | | | 0.00 | % | | | 51 | % |
March 1, 2007 to February 29, 2008 | | | 4.54 | % | | | 0.35 | % | | | 0.35 | % | | | 9.56 | % | | | 84 | % |
| | | | | |
Diversified Stock Portfolio | | | | | | | | | | | | | | | | | | | | |
March 1, 2012 to August 31, 2012 (unaudited) | | | 2.24 | % | | | 0.33 | % | | | 0.28 | % | | | (0.77 | )% | | | 7 | % |
March 1, 2011 to February 29, 2012 | | | 1.79 | % | | | 0.33 | % | | | 0.28 | % | | | 0.86 | % | | | 17 | % |
March 1, 2010 to February 28, 2011 | | | 1.65 | % | | | 0.34 | % | | | 0.28 | % | | | 25.76 | % | | | 18 | % |
March 1, 2009 to February 28, 2010 | | | 1.66 | % | | | 0.38 | % | | | 0.31 | % | | | 66.83 | % | | | 22 | % |
March 1, 2008 to February 28, 2009 | | | 2.02 | % | | | 0.43 | % | | | 0.42 | % | | | (46.36 | )% | | | 29 | % |
March 1, 2007 to February 29, 2008 | | | 1.66 | % | | | 0.43 | % | | | 0.43 | % | | | (2.23 | )% | | | 29 | % |
| | | | | |
Short-Term Investment Portfolio | | | | | | | | | | | | | | | | | | | | |
March 1, 2012 to August 31, 2012 (unaudited) | | | 0.12 | % | | | 0.12 | % | | | 0.12 | % | | | 0.00 | % | | | N/A | |
March 1, 2011 to February 29, 2012 | | | 0.13 | % | | | 0.12 | % | | | 0.12 | % | | | 0.00 | % | | | N/A | |
March 1, 2010 to February 28, 2011 | | | 0.20 | % | | | 0.14 | % | | | 0.14 | % | | | 0.00 | % | | | N/A | |
March 1, 2009 to February 28, 2010 | | | 0.24 | % | | | 0.17 | % | | | 0.16 | % | | | 0.45 | % | | | N/A | |
March 1, 2008 to February 28, 2009 | | | 2.32 | % | | | 0.19 | % | | | 0.18 | % | | | 0.92 | % | | | N/A | |
March 1, 2007 to February 29, 2008 | | | 4.99 | % | | | 0.17 | % | | | 0.16 | % | | | 4.81 | % | | | N/A | |
| 1. | Returns for periods of less than one year are not annualized. |
The accompanying notes are an integral part of these financial statements.
| | | | | | |
| Notes to financial statements (unaudited) | | Wells Fargo Advantage Dow Jones Target Date Funds | | | 107 | |
1. ORGANIZATION
Wells Fargo Master Trust (the “Trust”), a Delaware statutory trust organized on March 10, 1999, is an open-end management investment company registered under the Investment Company Act of 1940, as amended (the “1940 Act”). These financial statements report on the following funds: Wells Fargo Advantage Diversified Fixed Income Portfolio (“Diversified Fixed Income Portfolio”), Wells Fargo Advantage Diversified Stock Portfolio (“Diversified Stock Portfolio”) and Wells Fargo Advantage Short-Term Investment Portfolio (“Short-Term Investment Portfolio”) (each, a “Portfolio”, collectively, the “Portfolios”).
The Portfolios, which are master portfolios in a master/feeder structure, offer their shares to multiple feeder funds and other master portfolios rather than directly to the public.
2. SIGNIFICANT ACCOUNTING POLICIES
The following significant accounting policies, which are consistently followed in the preparation of the financial statements of each Portfolio, are in conformity with U.S. generally accepted accounting principles which require management to make estimates and assumptions that affect the reported amounts of assets and liabilities, disclosure of contingent assets and liabilities at the date of the financial statements, and the reported amounts of revenues and expenses during the reporting period. Actual results could differ from those estimates.
Securities valuation
Investments in equity securities are valued each business day as of the close of regular trading on the New York Stock Exchange, which is usually 4:00 p.m. (Eastern Time). Securities which are traded on a national or foreign securities exchange are valued at the last reported sales price, except that securities listed on The Nasdaq Stock Market, Inc. (“Nasdaq”) are valued at the Nasdaq Official Closing Price (“NOCP”), and if no NOCP is available, then at the last reported sales price. If no sales price is shown on the Nasdaq, the bid price will be used. In the absence of any sale of securities listed on the Nasdaq, and in the case of other securities (including U.S. Government obligations, but excluding debt securities maturing in 60 days or less), the price will be deemed “stale” and the valuations will be determined in accordance with the Portfolios’ Valuation Procedures.
Securities denominated in foreign currencies are translated into U.S. dollars using the closing rates of exchange in effect on the day of valuation.
Many securities markets and exchanges outside the U.S. close prior to the close of the New York Stock Exchange and therefore may not fully reflect trading or events that occur after the close of the principal exchange in which the foreign securities are traded, but before the close of the New York Stock Exchange. If such trading or events are expected to materially affect the value of securities, then fair value pricing procedures approved by the Board of Trustees are applied. These procedures take into account multiple factors including movements in U.S. securities markets after foreign exchanges close. As a result of the fair value pricing procedures, these securities which are normally categorized as Level 1 in the fair value hierarchy will represent a transfer from a Level 1 to a Level 2 security and will be categorized as Level 2. Depending on market activity, such fair valuations may be frequent. Such fair value pricing may result in NAVs that are higher or lower than NAVs based on the last reported sales price or latest quoted bid price. On August 31, 2012, fair value pricing was not used in pricing foreign securities.
Fixed income securities acquired with maturities exceeding 60 days are valued based on evaluated prices received from an independent pricing service which may utilize both transaction data and market information such as yield, prices of securities of comparable quality, coupon rate, maturity, type of issue, trading characteristics and other market data. If valuations are not available from the independent pricing service or values received are deemed not representative of market value, values will be obtained from a broker-dealer or otherwise determined based on the Portfolios’ Valuation Procedures.
Debt securities of sufficient credit quality acquired with maturities of 60 days or less generally are valued at amortized cost which approximates fair value. The amortized cost method involves valuing a security at its cost, plus accretion of discount or minus amortization of premium over the period until maturity.
Investments in registered open-end mutual funds are valued at net asset value. Non-registered investment companies are fair valued at net asset value.
Investments which are not valued using any of the methods discussed above are valued at their fair value, as determined by procedures established in good faith and approved by the Board of Trustees. The Board of Trustees has established a Valuation Committee comprised of the Trustees and has delegated to it the authority to take any actions regarding the
| | | | |
| 108 | | Wells Fargo Advantage Dow Jones Target Date Funds | | Notes to financial statements (unaudited) |
valuation of portfolio securities that the Valuation Committee deems necessary in determining the fair value of portfolio securities, unless the responsibility has been delegated to the Management Valuation Team of Wells Fargo Funds Management, LLC (“Funds Management”). The Board of Trustees retains the authority to make any valuation decisions or approve any changes to the Valuation Procedures as it deems appropriate. On a quarterly basis, the Board of Trustees receives a report on any valuation actions taken by the Valuation Committee or the Management Valuation Team.
Valuations of fair valued securities are compared to the next actual sales price when available, or other appropriate market information to assess the continued appropriateness of the fair valuation methodology used. These securities are fair valued on a day-to-day basis, taking into consideration changes to appropriate market information and any significant changes to the input factors considered in the valuation process until there is a readily available price provided on the exchange or by an independent pricing service. Valuations received from an independent pricing service or broker quotes are periodically validated by comparisons to most recent trades and valuations provided by other independent pricing services in addition to the review of prices by the adviser and/or subadviser. Unobservable inputs used in determining fair valuations are identified based on the type of security, taking into consideration factors utilized by market participants in valuing the investment, knowledge about the issuer and the current market environment.
Foreign currency translation
The accounting records of the Portfolios are maintained in U.S. dollars. Assets, including investment securities, and liabilities denominated in foreign currency are translated into U.S. dollars at the prevailing rates of exchange at the date of valuation. Purchases and sales of securities, and income and expenses are translated at the prevailing rate of exchange on the respective dates of such transactions. Reported net realized foreign exchange gains or losses arise from sales of foreign currencies, currency gains or losses realized between the trade and settlement dates on securities transactions, and the difference between the amounts of dividends, interest and foreign withholding taxes recorded and the U.S. dollar equivalent of the amounts actually paid or received. Net unrealized foreign exchange gains and losses arise from changes in the fair value of assets and liabilities other than investments in securities resulting in changes in exchange rates.
The changes in net assets arising from changes in exchange rates and the changes in net assets resulting from changes in market prices of securities are not separately presented. Such changes are recorded with net realized and unrealized gains or losses from investments. Gains and losses from certain foreign currency transactions are treated as ordinary income for U.S. federal income tax purposes.
Repurchase agreements
The Portfolios may invest in repurchase agreements and may participate in pooled repurchase agreement transactions with other funds advised by Funds Management. The repurchase agreements must be fully collateralized based on values that are marked-to-market daily. The collateral may be held by an agent bank under a tri-party agreement. It is the custodian’s responsibility to value collateral daily and to take action to obtain additional collateral as necessary to maintain market value equal to or greater than the resale price. The repurchase agreements are collateralized by instruments such as U.S. Treasury, federal agency, or high-grade corporate obligations. There could be potential loss to a Portfolio in the event that such Portfolio is delayed or prevented from exercising its rights to dispose of the collateral, including the risk of a possible decline in the value of the underlying obligations during the period in which a Portfolio seeks to assert its rights.
Security loans
The Portfolios may lend their securities from time to time in order to earn additional income in the form of fees or interest on securities received as collateral or the investment of any cash received as collateral. The Portfolios continue to receive interest or dividends on the securities loaned. The Portfolios receive collateral in the form of cash or securities with a value at least equal to the value of the securities on loan. The value of the loaned securities is determined at the close of each business day and any additional required collateral is delivered to the Portfolios on the next business day. In a securities lending transaction, the net asset value of the Portfolios will be affected by an increase or decrease in the value of the securities loaned and by an increase or decrease in the value of the instrument in which collateral is invested. The amount of securities lending activity undertaken by the Portfolios fluctuate from time to time, In the event of default or bankruptcy by the borrower, the Portfolios may be prevented from recovering the loaned securities or gaining access to the collateral or may experience delays or costs in doing so. In addition, the investment of any cash collateral received may lose all or part of its value. The Portfolios have the right under the lending agreement to recover the securities from the borrower on demand.
The Portfolios lend their securities through an unaffiliated securities lending agent. Cash collateral received in connection with its securities lending transactions is invested in Wells Fargo Securities Lending Cash Investments, LLC (the “Cash Collateral Fund”). The Cash Collateral Fund is exempt from registration under Section 3(c)(7) of the 1940 Act and is managed by Funds Management and is subadvised by Wells Capital Management Incorporated (“WellsCap”). Funds Management receives an advisory fee starting at 0.05% and declining to 0.01% as the average daily net assets of the Cash
| | | | | | |
| Notes to financial statements (unaudited) | | Wells Fargo Advantage Dow Jones Target Date Funds | | | 109 | |
Collateral Fund increase. All of the fees received by Funds Management are paid to Wells Capital Management for its services as subadviser. The Cash Collateral Fund seeks to provide a positive return compared to the daily Fed Funds Open rate by investing in high-quality, U.S. dollar-denominated short-term money market instruments. Cash Collateral Fund investments are fair valued based upon the amortized cost valuation technique. Income earned from investment in the Cash Collateral Fund is included in securities lending income on the Statements of Operations.
When-issued transactions
Each Portfolio may purchase securities on a forward commitment or ‘when-issued’ basis. A Portfolio records a when-issued transaction on the trade date and will segregate assets in an amount at least equal in value to the Portfolio’s commitment to purchase when-issued securities. Securities purchased on a when-issued basis are marked-to-market daily and the Portfolio begins earning interest on the settlement date. Losses may arise due to changes in the market value of the underlying securities or if the counterparty does not perform under the contract.
Futures contracts
Each Portfolio may be subject to equity price risk in the normal course of pursuing its investment objectives. The Portfolio may buy and sell futures contracts in order to gain exposure to, or protect against, changes in security values and interest rates. The primary risks associated with the use of futures contracts are the imperfect correlation between changes in market values of securities held by the Portfolio and the prices of futures contracts, and the possibility of an illiquid market.
Futures contracts are valued based upon their quoted daily settlement prices when available. The aggregate principal amounts of the contracts are not recorded in the financial statements. Fluctuations in the value of the contracts are recorded in the Statements of Assets and Liabilities as an asset or liability and in the Statements of Operations as unrealized gains or losses until the contracts are closed, at which point they are recorded as net realized gains or losses on futures contracts. With futures contracts, there is minimal counterparty risk to the Portfolio since futures are exchange traded and the exchange’s clearinghouse, as counterparty to all exchange traded futures, guarantees the futures against default.
Mortgage dollar roll transactions
The Portfolios may engage in mortgage dollar roll transactions with respect to mortgage-backed securities issued by Government National Mortgage Association (GNMA), Federal National Mortgage Association (FNMA) and Federal Home Loan Mortgage Corporation (FHLMC). In a mortgage dollar roll transaction, a Portfolio sells a mortgage-backed security to a financial institution, such as a bank or broker-dealer and simultaneously agrees to repurchase a substantially similar security from the institution at a later date at an agreed upon price. The mortgage-backed securities that are repurchased will bear the same interest rate as those sold, but generally will be collateralized by different pools of mortgages with different pre-payment histories. During the roll period, a Portfolio foregoes principal and interest paid on the securities. A Portfolio is compensated by the difference between the current sales price and the forward price for the future purchase as well as by the earnings on the cash proceeds of the initial sale. Mortgage dollar rolls may be renewed without physical delivery of the securities subject to the contract. The Portfolios account for TBA dollar roll transactions as purchases and sales.
Security transactions and income recognition
Securities transactions are recorded on a trade date basis. Realized gains or losses are reported on the basis of identified cost of securities delivered.
Interest income is accrued daily and bond discounts are accreted and premiums are amortized daily based on the effective interest method. To the extent debt obligations are placed on non-accrual status, any related interest income may be reduced by writing off interest receivables when the collection of all or a portion of interest has become doubtful based on consistently applied procedures. If the issuer subsequently resumes interest payments or when the collectability of interest is reasonably assured, the debt obligation is removed from non-accrual status.
Dividend income is recognized on the ex-dividend date, except for certain dividends from foreign securities, which are recorded as soon as the Portfolio is informed of the ex-dividend date.
Income from foreign securities is recorded net of foreign taxes withheld where recovery of such taxes is not assured.
Federal and other taxes
Each Portfolio is treated as a separate entity for federal income tax purposes. The Portfolios are not required to pay federal income taxes on their net investment income and net capital gain as they are treated as partnerships for federal income tax purposes. All interest, dividends, gains and losses of a Portfolio are deemed to have been “passed through” to the interestholders in proportion to their holdings of the Portfolio regardless of whether such interest, dividends and gains have been distributed by the Portfolio.
| | | | |
| 110 | | Wells Fargo Advantage Dow Jones Target Date Funds | | Notes to financial statements (unaudited) |
Each Portfolio’s income and federal excise tax returns and all financial records supporting those returns for the prior three fiscal years are subject to examination by the federal and Delaware revenue authorities. Management has analyzed each Portfolio’s tax positions taken on federal, state, and foreign tax returns for all open tax years and does not believe that there are any uncertain tax positions that require recognition of a tax liability.
3. FAIR VALUATION MEASUREMENTS
Fair value measurements of investments are determined within a framework that has established a fair value hierarchy based upon the various data inputs utilized in determining the value of each Portfolio’s investments. The three-level hierarchy gives the highest priority to unadjusted quoted prices in active markets for identical assets or liabilities (Level 1) and the lowest priority to significant unobservable inputs (Level 3). Each Portfolio’s investments are classified within the fair value hierarchy based on the lowest level of input that is significant to the fair value measurement. The inputs are summarized into three broad levels as follows:
| n | | Level 1 – quoted prices in active markets for identical securities |
| n | | Level 2 – other significant observable inputs (including quoted prices for similar securities, interest rates, prepayment speeds, credit risk, etc.) |
| n | | Level 3 – significant unobservable inputs (including the Portfolio’s own assumptions in determining the fair value of investments) |
The inputs or methodologies used for valuing securities are not necessarily an indication of the risk associated with investing in those securities.
As of August 31, 2012, the inputs used in valuing each Portfolio’s assets, which were carried at fair value, were as follows:
| | | | | | | | | | | | | | | | |
| Investments in Securities | | Quoted prices (Level 1) | | | Significant other
observable Inputs (Level 2) | | | Significant unobservable Inputs (Level 3) | | | Total | |
Diversified Fixed Income Portfolio | | | | | | | | | | | | | | | | |
| | | | |
Agency securities | | $ | 0 | | | $ | 1,338,193,032 | | | $ | 0 | | | $ | 1,338,193,032 | |
| | | | |
Corporate bonds and notes | | | 0 | | | | 1,007,294,562 | | | | 0 | | | | 1,007,294,562 | |
| | | | |
Foreign government bonds | | | 0 | | | | 1,168,221,014 | | | | 0 | | | | 1,168,221,014 | |
| | | | |
U.S. Treasury securities | | | 1,035,080,847 | | | | 0 | | | | 0 | | | | 1,035,080,847 | |
| | | | |
Yankee corporate bonds and notes | | | 0 | | | | 175,943,461 | | | | 0 | | | | 175,943,461 | |
| | | | |
Other | | | 0 | | | | 0 | | | | 385,167 | | | | 385,167 | |
| | | | |
Short-term investments | | | | | | | | | | | | | | | | |
Investment companies | | | 169,874,378 | | | | 6,632,384 | | | | 0 | | | | 176,506,762 | |
| | | $ | 1,204,955,225 | | | $ | 3,696,284,453 | | | $ | 385,167 | | | $ | 4,901,624,845 | |
Diversified Stock Portfolio | | | | | | | | | | | | | | | | |
| | | | |
Equity securities | | | | | | | | | | | | | | | | |
| | | | |
Common stocks | | $ | 6,921,503,218 | | | $ | 27,883,541 | | | $ | 15,696 | | | $ | 6,949,402,455 | |
| | | | |
Investment companies | | | 581,002 | | | | 0 | | | | 0 | | | | 581,002 | |
| | | | |
Preferred stocks | | | 54,473,061 | | | | 0 | | | | 0 | | | | 54,473,061 | |
| | | | |
Rights | | | 0 | | | | 90,195 | | | | 0 | | | | 90,195 | |
| | | | |
Warrants | | | 0 | | | | 17,093 | | | | 0 | | | | 17,093 | |
| | | | |
Foreign corporate bonds | | | 0 | | | | 6,757 | | | | 0 | | | | 6,757 | |
| | | | |
Foreign government bonds | | | 0 | | | | 10,027 | | | | 0 | | | | 10,027 | |
| | | | |
Other | | | 0 | | | | 0 | | | | 1,373,516 | | | | 1,373,516 | |
| | | | |
Short-term investments | | | | | | | | | | | | | | | | |
Investment companies | | | 169,049,881 | | | | 897,043,281 | | | | 0 | | | | 1,066,093,162 | |
| | | $ | 7,145,607,162 | | | $ | 925,050,894 | | | $ | 1,389,212 | | | $ | 8,072,047,268 | |
| | | | | | |
| Notes to financial statements (unaudited) | | Wells Fargo Advantage Dow Jones Target Date Funds | | | 111 | |
| | | | | | | | | | | | | | | | |
| Investments in Securities | | Quoted prices (Level 1) | | | Significant other
observable inputs (Level 2) | | | Significant unobservable inputs (Level 3) | | | Total | |
Short-Term Investment Portfolio | | | | | | | | | | | | | | | | |
| | | | |
Agency securities | | $ | 0 | | | $ | 5,999,425 | | | $ | 0 | | | $ | 5,999,425 | |
| | | | |
Certificates of deposit | | | 0 | | | | 105,000,281 | | | | 0 | | | | 105,000,281 | |
| | | | |
Commercial paper | | | 0 | | | | 220,936,698 | | | | 0 | | | | 220,936,698 | |
| | | | |
Corporate bonds and notes | | | 0 | | | | 9,607,893 | | | | 0 | | | | 9,607,893 | |
| | | | |
Municipal obligations | | | 0 | | | | 110,041,420 | | | | 0 | | | | 110,041,420 | |
| | | | |
Other instruments | | | 0 | | | | 5,180,235 | | | | 0 | | | | 5,180,235 | |
| | | | |
Repurchase agreements | | | 0 | | | | 54,698,220 | | | | 0 | | | | 54,698,220 | |
| | | | |
U.S. Treasury securities | | | 9,016,675 | | | | 0 | | | | 0 | | | | 9,016,675 | |
| | | $ | 9,016,675 | | | $ | 511,464,172 | | | $ | 0 | | | $ | 520,480,847 | |
Further details on the major security types listed above can be found in the Summary Portfolio of Investments or Portfolio of Investments.
As of August 31, 2012, the inputs used in valuing Diversified Stock Portfolio’s other financial instruments, which are carried at fair value, were as follows:
| | | | | | | | | | | | | | | | |
| Futures contracts + | | Quoted prices (Level 1) | | | Significant other
observable inputs (Level 2) | | | Significant unobservable inputs (Level 3) | | | Total | |
Diversified Stock Portfolio | | $ | 10,024,379 | | | $ | 0 | | | $ | 0 | | | $ | 10,024,379 | |
| + | Futures contracts are presented at the unrealized gains or losses on the instruments. |
Transfers in and transfers out are recognized at the end of the reporting period. For the six months ended August 31, 2012, the Portfolios did not have any transfers into/out of Level 1 and Level 2.
4. TRANSACTIONS WITH AFFILIATES AND OTHER EXPENSES
Advisory Fees
The Trust has entered into an advisory contract with Funds Management, an indirect wholly owned subsidiary of Wells Fargo & Company (“Wells Fargo”). The adviser is responsible for implementing investment policies and guidelines and for supervising the subadvisers, who are responsible for day-to-day portfolio management of the Portfolios.
Pursuant to the contract, Funds Management is entitled to receive an annual advisory fee starting at 0.30% and declining to 0.24% as the average daily net assets of Diversified Fixed Income Portfolio increase. Funds Management is entitled to receive an annual advisory fee starting at 0.35% and declining to 0.29% as the average daily net assets of Diversified Stock Portfolio increase. Funds Management is entitled to receive an annual advisory fee of 0.10% of the average daily net assets of Short-Term Investment Portfolio. For the six months ended August 31, 2012, the advisory fee was equivalent to an annual rate for each Portfolio as follows:
| | | | |
| | | Advisory Fee | |
Diversified Fixed Income Portfolio | | | 0.26 | % |
Diversified Stock Portfolio | | | 0.30 | |
Short-Term Investment Portfolio | | | 0.10 | |
Funds Management has voluntarily waived and/or reimbursed advisory fees to the extent necessary to maintain certain net operating expense ratios for the Portfolios.
Funds Management has retained the services of certain subadvisers to provide daily portfolio management to the Portfolios. The fees related to subadvisory services are borne directly by Funds Management. WellsCap, an affiliate of Funds Management, is the subadviser to Short-Term Investment Portfolio and is entitled to receive a fee from Funds Management at an annual rate starting at 0.05% and declining to 0.01% as the average daily net assets of Short-Term Investment Portfolio increase. SSgA Funds Management Incorporated, is the subadviser to both Diversified Fixed Income Portfolio and Diversified Stock Portfolio and is entitled to receive an annual subadvisory fee starting at 0.10% and declining to 0.05% as the average daily net assets of each respective Portfolio increases.
| | | | |
| 112 | | Wells Fargo Advantage Dow Jones Target Date Funds | | Notes to financial statements (unaudited) |
5. INVESTMENT PORTFOLIO TRANSACTIONS
Purchases and sales of investments, excluding short-term securities, for the six months ended August 31, 2012 were as follows:
| | | | | | | | | | | | | | | | |
| | | Purchases at cost | | | Sales proceeds | |
| | | U.S.
Government | | | Non-U.S.
Government | | | U.S.
Government | | | Non-U.S.
Government | |
Diversified Fixed Income Portfolio | | $ | 945,976,310 | | | $ | 274,590,452 | | | $ | 715,376,388 | | | $ | 204,484,423 | |
Diversified Stock Portfolio | | | 0 | | | | 1,065,341,451 | | | | 0 | | | | 443,138,381 | |
6. DERIVATIVE TRANSACTIONS
During the six months ended August 31, 2012, Diversified Stock Portfolio used uninvested cash to enter into futures contracts to gain market exposure.
At August 31, 2012, Diversified Stock Portfolio had long futures contracts outstanding as follows:
| | | | | | | | |
| Expiration date | | Contracts | | Type | | Contract value at August 31, 2012 | | Unrealized gains |
9-21-12 | | 629 Long | | MSCI EAFE E-Mini Index | | $46,184,325 | | $3,428,079 |
9-21-12 | | 514 Long | | Russell 2000 E-Mini Index | | 41,690,540 | | 2,128,550 |
9-21-12 | | 572 Long | | S&P 500 E-Mini Index | | 40,185,860 | | 2,449,460 |
9-21-12 | | 456 Long | | S&P Midcap 400 E-Mini Index | | 44,268,480 | | 2,018,290 |
Diversified Stock Portfolio had an average notional amount of $169,970,831 in long futures contracts during the six months ended August 31, 2012. As of August 31, 2012, Diversified Stock Portfolio had segregated $9,779,800 as cash collateral for open futures contracts.
The receivable for daily variation margin on open futures contracts reflected in the Statements of Assets and Liabilities only represents the current day’s variation margin. The realized gains and change in unrealized losses on futures contracts are reflected in the Statements of Operations.
7. INDEMNIFICATION
Under the Trust’s organizational documents, the officers and directors are indemnified against certain liabilities that may arise out of performance of their duties to the Trust. Additionally, in the normal course of business, the Trust may enter into contracts with service providers that contain a variety of indemnification clauses. The Trust’s maximum exposure under these arrangements is dependent on future claims that may be made against the Portfolios and, therefore, cannot be estimated.
8. NEW ACCOUNTING PRONOUNCEMENT
In December 2011, the Financial Accounting Standards Board (“FASB”) issued Accounting Standard Update (“ASU”) No. 2011-11, Disclosures about Offsetting Assets and Liabilities. ASU 2011-11, which amends FASB ASC Topic 210, Balance Sheet, creates new disclosure requirements which require entities to disclose both gross and net information for derivatives and other financial instruments that are either offset in the Statement of Assets and Liabilities or subject to an enforceable master netting arrangement or similar agreement. The disclosure requirements are effective for interim and annual reporting periods beginning on or after January 1, 2013. Management is currently assessing the potential impact, in addition to expanded financial statement disclosure, that may result from adopting this ASU.
| | | | | | |
| Other information (unaudited) | | Wells Fargo Advantage Dow Jones Target Date Funds | | | 113 | |
TAX INFORMATION
Current tax law generally provides for a maximum tax rate for individual taxpayers of 15% on long-term capital gains and qualifying dividends on corporate stocks. This rate is scheduled to expire at the end of 2012. In the absence of further Congressional action, the maximum tax rate on long-term capital gains for individual taxpayers would increase to 20% and income from dividends would be taxed at the rates applicable to ordinary income.
In addition, for taxable years beginning after December 31, 2012, absent further Congressional action, an additional 3.8% Medicare tax will be imposed on certain net investment income (including ordinary dividends and capital gain distributions received from a Fund and net gains from redemptions or other taxable dispositions of Fund shares) of U.S. individuals, estates and trusts to the extent that such person’s “modified adjusted gross income” (in the case of an individual) or “adjusted gross income” (in the case of an estate or trust) exceed certain threshold amounts.
PROXY VOTING INFORMATION
A description of the policies and procedures used to determine how to vote proxies relating to portfolio securities is available without charge, upon request, by calling 1-800-222-8222, visiting our website at wellsfargoadvantagefunds.com, or visiting the SEC website at sec.gov. Information regarding how the Funds voted proxies relating to portfolio securities during the most recent 12-month period ended June 30 is available without charge on the Funds’ website at wellsfargoadvantagefunds.com or by visiting the SEC website at sec.gov.
PORTFOLIO HOLDINGS INFORMATION
The complete portfolio holdings for the Funds are publicly available on the website (wellsfargoadvantagefunds.com) on a monthly, 30-day or more delayed basis. In addition, top ten holdings information is publicly available on the website on a monthly, seven-day or more delayed basis. Each Fund and Portfolio files its complete schedule of portfolio holdings with the SEC for the first and third quarters of each fiscal year on Form N-Q, which is available without charge by visiting the SEC website at sec.gov. In addition, each Fund’s and Portfolio’s Form N-Q may be reviewed and copied at the SEC’s Public Reference Room in Washington, DC, and at regional offices in New York City, at 233 Broadway, and in Chicago, at 175 West Jackson Boulevard, Suite 900. Information about the Public Reference Room may be obtained by calling 1-800-SEC-0330.
| | | | |
| 114 | | Wells Fargo Advantage Dow Jones Target Date Funds | | Other information (unaudited) |
BOARD OF TRUSTEES AND OFFICERS
Each of the Trustees and Officers listed in the table below acts in identical capacities for the Wells Fargo Advantage family of funds, which consists of 138 funds comprising the Wells Fargo Funds Trust, Wells Fargo Variable Trust, Wells Fargo Master Trust and four closed-end funds (collectively the “Fund Complex”). This table should be read in conjunction with the Prospectus and the Statement of Additional Information1. All of the Trustees are also Members of the Audit and Governance Committees of each Trust in the Fund Complex. The mailing address of each Trustee and Officer is 525 Market Street, 12th Floor, San Francisco, CA 94105. Each Trustee and Officer serves an indefinite term, however, each Trustee serves such term until reaching the mandatory retirement age established by the Trustees.
Independent Trustees
| | | | | | |
Name and year of birth | | Position held and length of service* | | Principal occupations during past five years | | Other directorships during
past five years |
Peter G. Gordon
(Born 1942) | | Trustee, since 1998; Chairman, since 2005 | | Co-Founder, Retired Chairman, President and CEO of Crystal Geyser Water Company. Trustee Emeritus, Colby College | | Asset Allocation Trust |
Isaiah Harris, Jr.
(Born 1952) | | Trustee, since 2009 | | Retired. Prior thereto, President and CEO of BellSouth Advertising and Publishing Corp. from 2005 to 2007, President and CEO of BellSouth Enterprises from 2004 to 2005 and President of BellSouth Consumer Services from 2000 to 2003. Emeritus member of the Iowa State University Foundation Board of Governors. Emeritus Member of the Advisory Board of Iowa State University School of Business. Mr. Harris is a certified public accountant. | | CIGNA Corporation; Deluxe Corporation; Asset Allocation Trust |
Judith M. Johnson
(Born 1949) | | Trustee, since 2008; Audit Committee Chairman, since 2008 | | Retired. Prior thereto, Chief Executive Officer and Chief Investment Officer of Minneapolis Employees Retirement Fund from 1996 to 2008. Ms. Johnson is an attorney, certified public accountant and a certified managerial accountant. | | Asset Allocation Trust |
Leroy Keith, Jr.
(Born 1939) | | Trustee, since 2010 | | Chairman, Bloc Global Services (development and construction). Trustee of the Evergreen Funds from 1983 to 2010. Former Managing Director, Almanac Capital Management (commodities firm), former Partner, Stonington Partners, Inc. (private equity fund), former Director, Obagi Medical Products Co. and former Director, Lincoln Educational Services. | | Trustee, Virtus Fund Complex (consisting of 40 portfolios as of 12/31/11); Asset Allocation Trust |
David F. Larcker
(Born 1950) | | Trustee, since 2009 | | James Irvin Miller Professor of Accounting at the Graduate School of Business, Stanford University, Director of Corporate Governance Research Program and Senior Faculty of The Rock Center for Corporate Governance since 2006. From 2005 to 2008, Professor of Accounting at the Graduate School of Business, Stanford University. Prior thereto, Ernst & Young Professor of Accounting at The Wharton School, University of Pennsylvania from 1985 to 2005. | | Asset Allocation Trust |
Olivia S. Mitchell
(Born 1953) | | Trustee, since 2006 | | International Foundation of Employee Benefit Plans Professor, Wharton School of the University of Pennsylvania since 1993. Director of Wharton’s Pension Research Council and Boettner Center on Pensions & Retirement Research, and Research Associate at the National Bureau of Economic Research. Previously, Cornell University Professor from 1978 to 1993. | | Asset Allocation Trust |
Timothy J. Penny
(Born 1951) | | Trustee, since 1996 | | President and CEO of Southern Minnesota Initiative Foundation, a non-profit organization, since 2007 and Senior Fellow at the Humphrey Institute Policy Forum at the University of Minnesota since 1995. Member of the Board of Trustees of NorthStar Education Finance, Inc., a non-profit organization, since 2007. | | Asset Allocation Trust |
| | | | | | |
| Other information (unaudited) | | Wells Fargo Advantage Dow Jones Target Date Funds | | | 115 | |
| | | | | | |
Name and year of birth | | Position held and length of service* | | Principal occupations during past five years | | Other directorships during
past five years |
Michael S. Scofield
(Born 1943) | | Trustee, since 2010 | | Served on the Investment Company Institute’s Board of Governors and Executive Committee from 2008-2011 as well the Governing Council of the Independent Directors Council from 2006-2011 and the Independent Directors Council Executive Committee from 2008-2011. Chairman of the IDC from 2008-2010. Institutional Investor (Fund Directions) Trustee of Year in 2007. Trustee of the Evergreen Funds (and its predecessors) from 1984 to 2010. Chairman of the Evergreen Funds from 2000-2010. Former Trustee of the Mentor Funds. Retired Attorney, Law Offices of Michael S. Scofield. | | Asset Allocation
Trust |
Donald C. Willeke
(Born 1940) | | Trustee, since 1996 | | Principal of the law firm of Willeke & Daniels. General Counsel of the Minneapolis Employees Retirement Fund from 1984 until its consolidation into the Minnesota Public Employees Retirement Association on June 30, 2010. Director and Vice Chair of The Free Trust (non-profit corporation). Director of the American Chestnut Foundation (non-profit corporation). | | Asset Allocation
Trust |
| * | Length of service dates reflect the Trustee’s commencement of service with the Trust’s predecessor entities, where applicable. |
Officers
| | | | | | |
Name and year of birth | | Position held and
length of service | | Principal occupations during past five years | | |
Karla M. Rabusch
(Born 1959) | | President, since 2003 | | Executive Vice President of Wells Fargo Bank, N.A. and President of Wells Fargo Funds Management, LLC since 2003. Senior Vice President and Chief Administrative Officer of Wells Fargo Funds Management, LLC from 2001 to 2003. | | |
C. David Messman
(Born 1960) | | Secretary, since 2000; Chief Legal Officer, since 2003 | | Senior Vice President and Secretary of Wells Fargo Funds Management, LLC since 2001. Vice President and Managing Senior Counsel of Wells Fargo Bank, N.A. since 1996. | | |
Nancy Wiser (Born 1967) | | Treasurer, since 2012 | | Executive Vice President of Wells Fargo Funds Management, LLC since 2011. Chief Operating Officer and Chief Compliance Officer at LightBox Capital Management LLC, from 2008 to 2011. Owned and operated a consulting business providing services to various hedge funds including acting as Chief Operating Officer and Chief Compliance Officer for a hedge fund from 2007 to 2008. Chief Operating Officer and Chief Compliance Officer of GMN Capital LLC from 2006 to 2007. | | |
David Berardi
(Born 1975) | | Assistant Treasurer, since 2009 | | Vice President of Wells Fargo Funds Management, LLC since 2009. Vice President of Evergreen Investment Management Company, LLC from 2008 to 2010. Assistant Vice President of Evergreen Investment Services, Inc. from 2004 to 2008. Manager of Fund Reporting and Control for Evergreen Investment Management Company, LLC from 2004 to 2010. | | |
Jeremy DePalma
(Born 1974) | | Assistant Treasurer, since 2009 | | Senior Vice President of Wells Fargo Funds Management, LLC since 2009. Senior Vice President of Evergreen Investment Management Company, LLC from 2008 to 2010. Vice President, Evergreen Investment Services, Inc. from 2004 to 2007. Head of the Fund Reporting and Control Team within Fund Administration from 2005 to 2010. | | |
Debra Ann Early
(Born 1964) | | Chief Compliance Officer, since 2007 | | Chief Compliance Officer of Wells Fargo Funds Management, LLC since 2007. Chief Compliance Officer of Parnassus Investments from 2005 to 2007. Chief Financial Officer of Parnassus Investments from 2004 to 2007 and Senior Audit Manager of PricewaterhouseCoopers LLP from 1998 to 2004. | | |
| 1. | The Statement of Additional Information includes additional information about the Trustees and is available, without charge, upon request, by calling 1-800-222-8222 or by visiting the website at wellsfargoadvantagefunds.com. |
| | | | |
| 116 | | Wells Fargo Advantage Dow Jones Target Date Funds | | Other information (unaudited) |
BOARD CONSIDERATION OF INVESTMENT ADVISORY AND SUBADVISORY AGREEMENTS:
Target Today Fund, Target 2010 Fund, Target 2015 Fund, Target 2020 Fund, Target 2025 Fund, Target 2030 Fund, Target 2035 Fund, Target 2040 Fund, Target 2045 Fund, Target 2050 Fund, Target 2055, Diversified Stock Portfolio, Diversified Fixed Income Portfolio and Short-Term Investment Portfolio
Under Section 15 of the Investment Company Act of 1940 (the “1940 Act”), the Board of Trustees (each, a “Board” and collectively, the “Boards”) of each of Wells Fargo Funds Trust (“Funds Trust”) and Wells Fargo Master Trust (“Master Trust”) (collectively, the “Trusts”), all the members of which have no direct or indirect interest in the investment advisory and subadvisory agreements and are not “interested persons” of the Trusts, as defined in the 1940 Act (the “Independent Trustees”), must determine whether to approve the continuation of the Trusts’ investment advisory and subadvisory agreements. In this regard, at an in person meeting held on March 29-30, 2012 (the “Meeting”), the Funds Trust Board reviewed and re-approved investment advisory agreements with Wells Fargo Funds Management, LLC (“Funds Management”) for each of the Target Today Fund, Target 2010 Fund, Target 2015 Fund, Target 2020 Fund, Target 2025 Fund, Target 2030 Fund, Target 2035 Fund, Target 2040 Fund, Target 2045 Fund, Target 2050 Fund and Target 2055 Fund (the “Target Date Funds”). The Master Trust Board reviewed and re-approved an investment advisory agreement with Funds Management for each of the Diversified Stock Portfolio, Diversified Fixed Income Portfolio and Short-Term Investment Portfolio (the “Master Portfolios”). The Target Date Funds and the Master Portfolios are, collectively, the “Funds.”
The Funds Trust Board also reviewed and re-approved an investment subadvisory agreement with Global Index Advisors, Inc. (“GIA”) for the Target Date Funds. The Master Trust Board also reviewed and re-approved: an investment subadvisory agreement with (i) SSgA Funds Management, Inc. (“SSgA”) for the Diversified Stock Portfolio and Diversified Fixed Income Portfolio; and (ii) Wells Capital Management Incorporated (“WellsCap”) for the Short-Term Investment Portfolio. The investment advisory agreements with Funds Management and the investment subadvisory agreements with WellsCap, GIA and SSgA (the “Subadvisers”) are collectively referred to as the “Advisory Agreements.”
The Target Date Funds are gateway blended funds that invest all of their assets in the Master Portfolios.
At the Meeting, the Boards considered the factors and reached the conclusions described below relating to the selection of Funds Management and the Subadvisers and the continuation of the Advisory Agreements. Prior to the Meeting, the Trustees conferred extensively among themselves and with representatives of Funds Management about these matters. The Boards also met throughout the year and received information that was useful to them in considering the continuation of the Advisory Agreements. The Independent Trustees were assisted in their evaluation of the Advisory Agreements by independent legal counsel, from whom they received separate legal advice and with whom they met separately from Funds Management.
In providing information to the Boards, Funds Management was guided by a detailed set of requests submitted by the Independent Trustees’ independent legal counsel on their behalf at the start of the Boards’ annual contract renewal process earlier in 2012. In approving the Advisory Agreements, the Boards did not identify any particular information or consideration that was all-important or controlling, and each Trustee likely attributed different weights to various factors.
Nature, extent and quality of services
The Boards received and considered various information regarding the nature, extent and quality of services provided to the Funds by Funds Management and the Subadvisers under the Advisory Agreements. The Boards also received and considered, among other things, information about the background and experience of senior management of Funds Management, and the qualifications, backgrounds, tenures and responsibilities of the portfolio managers primarily responsible for the day-to-day portfolio management of the Funds.
The Boards evaluated the ability of Funds Management and the Subadvisers, based on their respective financial condition, resources, reputation and other attributes, to attract and retain qualified investment professionals, including research, advisory, and supervisory personnel. The Boards further considered the compliance programs and compliance records of Funds Management and the Subadvisers. In addition, the Boards took into account the administrative services provided to the Funds by Funds Management and its affiliates.
The Boards’ decision to approve the continuation of the Advisory Agreements was based on a comprehensive evaluation of information provided to them. In considering these matters, the Boards considered not only the specific information presented in connection with the Meeting, but also the knowledge gained over time through interaction with Funds Management and the Subadvisers about various topics, including Funds Management’s oversight of service providers.
| | | | | | |
| Other information (unaudited) | | Wells Fargo Advantage Dow Jones Target Date Funds | | | 117 | |
The above factors, together with those referenced below, are some of the most important, but not necessarily all, factors considered by the Boards in concluding that the nature, extent and quality of the investment advisory services provided to the Funds by Funds Management and the Subadvisers supported the re-approval of the Advisory Agreements. Although the Boards considered the continuation of the Advisory Agreements for the Funds as part of the larger process of considering the continuation of the advisory agreements for all of the funds, their decision to continue the Advisory Agreements for the Funds was ultimately made on a fund-by-fund basis.
Fund performance and expenses
The Boards considered the performance results for each of the Funds over various time periods ended December 31, 2011. The Boards also considered these results in comparison to the median performance of a universe of relevant funds (the “Universe”) that was determined by Lipper Inc. (“Lipper”) to be similar to the Funds, and in comparison to each Fund’s benchmark index and to other comparative data. Lipper is an independent provider of investment company data. The Boards received a description of the methodology used by Lipper to select the mutual funds in the Universe.
The Funds Trust Board noted that the performance of the Target Date Funds was higher than or in range of the median performance of each Fund’s respective Universe for the periods under review except for the three-year period of the Dow Jones Target Today Fund, Dow Jones Target 2010 Fund, Dow Jones Target 2015 Fund, Dow Jones Target 2020 Fund and Dow Jones Target 2025 Fund. The Funds Trust Board further noted that the performance results for the three-year period for these Target Date Funds warranted further discussion. As part of its further review, the Funds Trust Board received an analysis of, and discussed factors contributing to, the underperformance of these Target Date Funds for the three-year period. The Funds Trust Board noted that the nearer-dated Target Date Funds had a greater allocation of assets to bonds and cash compared to funds in each respective Target Date Fund’s Universe. The Funds Trust Board was satisfied that Funds Management was taking appropriate actions with respect to each of these Target Date Funds’ investment performance.
The Master Trust Board took note of the performance of the Master Portfolios in the context of reviewing the performance of the Target Date Funds that invest substantially all of their assets in the Master Portfolios.
The Funds Trust Board received and considered information regarding the Target Date Funds’ contractual advisory fee and net operating expense ratios and their various components, including actual management fees (which reflect fee waivers, if any), transfer agent, custodian and other non-management fees, Rule 12b-1 and non-Rule 12b-1 fees, service fees and fee waiver and expense reimbursement arrangements. The Funds Trust Board also considered these ratios in comparison to the median ratios of an expense Universe and a narrower expense group of mutual funds (each, an “Expense Group”) that was determined by Lipper to be similar to each Target Date Fund. The Funds Trust Board received a description of the methodology used by Lipper to select the mutual funds in each Target Date Fund’s Expense Group. The Funds Trust Board noted that the net operating expense ratios of each of the Target Date Funds were in range of or lower than each Target Date Fund’s respective Expense Group’s median net operating expense ratios. The Funds Trust Board further noted that Funds Management had agreed to continue contractual fee cap arrangements for the Target Date Funds designed to lower the Funds’ expenses.
With respect to the Master Portfolios, the Master Trust Board reviewed the fee rates that are payable to Funds Management for investment advisory services (as discussed below) relative to an Expense Group.
Based on the above-referenced considerations and other factors, the Boards concluded that the overall performance and expense structure of the Funds supported the re-approval of the Advisory Agreements.
Investment advisory and subadvisory fee rates
The Boards reviewed and considered the contractual investment advisory fee rates that are payable by the Funds to Funds Management for investment advisory services (the “Advisory Agreement Rates”), both on a stand-alone basis and, with respect to the Target Date Funds, on a combined basis with the Funds’ administration fee rates. The Funds Trust Board took into account the separate administrative and other services covered by the administration fee rates. The Funds Trust Board also reviewed and considered the contractual investment subadvisory fee rates that are payable by Funds Management to the Subadvisers for investment subadvisory services (the “Subadvisory Agreement Rates”). In addition, the Funds Trust Board reviewed and considered the existing fee waiver/cap arrangements applicable to the Advisory Agreement Rates and considered the Advisory Agreement Rates after taking the waivers/caps into account (the “Net Advisory Rates”).
The Funds Trust Board received and considered information comparing the Advisory Agreement Rates and Net Advisory Rates, combined with the administration fee rates, with those of other funds in each Target Date Fund’s Expense Group. The Funds Trust Board noted that the Advisory Agreement Rates and Net Advisory Rates for each of the Target Date Funds were in range of or lower than the median rates of each Fund’s respective Expense Group.
| | | | |
| 118 | | Wells Fargo Advantage Dow Jones Target Date Funds | | Other information (unaudited) |
The Funds Trust Board also received and considered information about the portion of the total management fee that was retained by Funds Management after payment of the fee to certain Subadvisers for subadvisory services. The Boards also considered these amounts in comparison to the median amount paid by a sub-advised expense Universe that was determined by Lipper to be similar to the Target Date Funds.
The Boards also received and considered information about the nature and extent of services offered and fee rates charged by Funds Management and the Subadvisers to other types of clients. In this regard, the Boards received information about differences between the services, and the compliance, reporting, and other legal burdens and risks of providing investment advice to mutual funds and those associated with providing advice to non-mutual fund clients such as collective funds or institutional separate accounts.
In each case, the Funds Trust Board determined, with respect to the Target Date Funds, that the Advisory Agreement Rates, both with and without the administration fee rate and before and after waivers, were reasonable in light of the Target Date Funds’ Expense Group information, the net expense ratio commitments, the services covered by the Advisory Agreements and other information provided.
The Master Trust Board received and considered information comparing the Advisory Agreement Rate with the median rate of other funds in each Master Portfolio’s Expense Group. The Master Trust Board noted that the Master Portfolios’ Advisory Agreement Rates were in range of each Master Portfolio’s respective Expense Group median.
The Master Trust Board concluded that the Advisory Agreement Rates were reasonable in light of the Master Portfolios’ Expense Group information and the services covered by the Advisory Agreements.
Both the Funds Trust Board and the Master Trust Board also reviewed and considered the Subadvisory Agreement Rates and concluded that the Subadvisory Agreement Rates were reasonable in light of the services covered by the subadvisory agreements, the sub-advised expense information provided by Lipper, and other information provided.
Profitability
The Boards received and considered a profitability analysis of Funds Management, as well as an analysis of the profitability to the collective Wells Fargo businesses that provide services to the Funds. They considered that the information provided to them was necessarily estimated, and that the profitability information provided to them, especially on a fund-by-fund basis, did not necessarily provide a precise tool for evaluating the appropriateness of each Fund’s Advisory Agreement Rates in isolation. They noted that the levels of profitability reported on a fund-by-fund basis varied widely, depending on, among other things, the size and type of fund. The Boards concluded that the profitability reported by Funds Management was not unreasonable.
The Boards did not consider separate profitability information with respect to WellsCap, because, as an affiliate of Funds Management, its profitability information was subsumed in the collective Wells Fargo profitability analysis provided by Funds Management. The Master Trust Board did not consider separate profitability information with respect to GIA and SSgA, which are not affiliated with Funds Management. The Master Trust Board considered that the subadvisory fees paid to these Subadvisers had been negotiated by Funds Management on an arm’s-length basis and concluded that GIA’s and SSgA’s profitability from their relationships with the Master Portfolios managed by them was not a material factor in determining whether to renew their subadvisory agreements.
Economies of scale
With respect to possible economies of scale, the Boards reviewed the breakpoints in each Fund’s advisory fee and/or administration fee structure (except Short-Term Investment Portfolio), which operate generally to reduce the expenses of the Funds (as a percentage of Fund assets) as the Funds grow in size. They considered that, as a fund shrinks in size, breakpoints conversely result in increasing fee levels. The Boards noted that they would have on-going opportunities to review the appropriate levels of breakpoints in the future, and concluded that the breakpoints as implemented appeared to be a reasonable step toward sharing economies of scale, if any, with the Funds. However, the Boards acknowledged the inherent limitations of any analysis of economies of scale and of any attempt to correlate breakpoints with such economies, stemming largely from the Boards’ understanding that economies of scale are realized, if at all, across a variety of products and services, not just with respect to a single fund.
Other benefits to Funds Management and the Subadvisers
The Boards received and considered information regarding potential “fall-out” or ancillary benefits received by Funds Management and its affiliates and the Subadvisers as a result of their relationship with the Funds. Ancillary benefits could include, among others, benefits directly attributable to the relationship of Funds Management and the Subadvisers with the Funds and benefits potentially derived from an increase in Funds Management’s and each Subadviser’s business as a
| | | | | | |
| Other information (unaudited) | | Wells Fargo Advantage Dow Jones Target Date Funds | | | 119 | |
result of their relationship with the Funds (such as the ability to market to shareholders other financial products offered by Funds Management and its affiliates or the Subadvisers).
The Boards considered that Wells Fargo Funds Distributor, LLC, an affiliate of Funds Management, serves as distributor to the Funds and receives certain compensation for those services. The Boards noted that various financial institutions, including affiliates of Funds Management, may receive distribution-related fees, shareholder servicing payments (including amounts derived from payments under Rule 12b-1 plans) and sub-transfer agency fees in respect of shares sold or held through them and services provided.
The Boards also reviewed information about whether and to what extent soft dollar credits are sought and how any such credits are utilized and any benefits that may be realized by using an affiliated broker.
Other factors and broader review
The Boards also considered the markets for distribution of the Target Date Funds’ shares, including the channels through which the Target Date Funds’ shares are offered and sold. The Boards noted that the Target Date Funds are part of one of the few fund families that have both direct-to-fund and intermediary distribution channels. As discussed above, the Boards review detailed materials received from Funds Management and the Subadvisers annually as part of the re-approval process under Section 15 of the 1940 Act and also review and assess information about the quality of the services that the Funds receive throughout the year. In this regard, the Boards have reviewed reports of Funds Management at each of its quarterly meetings, which include, among other things, portfolio reviews and performance reports. In addition, the Boards confer with portfolio managers at various times throughout the year.
Conclusion
After considering the above-described factors and based on their deliberations and their evaluation of the information described above, the Boards unanimously approved the continuation of the Advisory Agreements for an additional one-year period.
| | | | |
| 120 | | Wells Fargo Advantage Dow Jones Target Date Funds | | List of abbreviations |
The following is a list of common abbreviations for terms and entities that may have appeared in this report.
| ACB | — Agricultural Credit Bank |
| ADR | — American depositary receipt |
| ADS | — American depositary shares |
| AGC-ICC | — Assured Guaranty Corporation - Insured Custody Certificates |
| AGM | — Assured Guaranty Municipal |
| AMBAC | — American Municipal Bond Assurance Corporation |
| AMT | — Alternative minimum tax |
| BAN | — Bond anticipation notes |
| BHAC | — Berkshire Hathaway Assurance Corporation |
| CAB | — Capital appreciation bond |
| CCAB | — Convertible capital appreciation bond |
| CDA | — Community Development Authority |
| CDO | — Collateralized debt obligation |
| COP | — Certificate of participation |
| DRIVER | — Derivative inverse tax-exempt receipts |
| DW&P | — Department of Water & Power |
| DWR | — Department of Water Resources |
| ECFA | — Educational & Cultural Facilities Authority |
| EDA | — Economic Development Authority |
| EDFA | — Economic Development Finance Authority |
| ETF | — Exchange-traded fund |
| FFCB | — Federal Farm Credit Banks |
| FGIC | — Financial Guaranty Insurance Corporation |
| FGLMC | — Federal Government Loan Mortgage Corporation |
| FHA | — Federal Housing Administration |
| FHLB | — Federal Home Loan Bank |
| FHLMC | — Federal Home Loan Mortgage Corporation |
| FICO | — The Financing Corporation |
| FNMA | — Federal National Mortgage Association |
| GDR | — Global depositary receipt |
| GNMA | — Government National Mortgage Association |
| HCFR | — Healthcare facilities revenue |
| HEFA | — Health & Educational Facilities Authority |
| HEFAR | — Higher education facilities authority revenue |
| HFA | — Housing Finance Authority |
| HFFA | — Health Facilities Financing Authority |
| IBC | — Insured bond certificate |
| IDA | — Industrial Development Authority |
| IDAG | — Industrial Development Agency |
| IDR | — Industrial development revenue |
| KRW | — Republic of Korea won |
| LIBOR | — London Interbank Offered Rate |
| LLC | — Limited liability company |
| LLP | — Limited liability partnership |
| MBIA | — Municipal Bond Insurance Association |
| MFHR | — Multifamily housing revenue |
| MSTR | — Municipal securities trust receipts |
| MUD | — Municipal Utility District |
| NATL-RE | — National Public Finance Guarantee Corporation |
| PCFA | — Pollution Control Financing Authority |
| PCR | — Pollution control revenue |
| PFA | — Public Finance Authority |
| PFFA | — Public Facilities Financing Authority |
| PFOTER | — Puttable floating option tax-exempt receipts |
| plc | — Public limited company |
| PUTTER | — Puttable tax-exempt receipts |
| R&D | — Research & development |
| RDA | — Redevelopment Authority |
| RDFA | — Redevelopment Finance Authority |
| REIT | — Real estate investment trust |
| ROC | — Reset option certificates |
| SAVRS | — Select auction variable rate securities |
| SBA | — Small Business Authority |
| SFHR | — Single-family housing revenue |
| SFMR | — Single-family mortgage revenue |
| SPA | — Standby purchase agreement |
| SPDR | — Standard & Poor’s Depositary Receipts |
| STRIPS | — Separate trading of registered interest and principal securities |
| TAN | — Tax anticipation notes |
| TIPS | — Treasury inflation-protected securities |
| TRAN | — Tax revenue anticipation notes |
| TCR | — Transferable custody receipts |
| TTFA | — Transportation Trust Fund Authority |
| TVA | — Tennessee Valley Authority |
| XLCA | — XL Capital Assurance |
This page is intentionally left blank.
This page is intentionally left blank.


For more information
More information about Wells Fargo Advantage Funds is available free upon request. To obtain literature, please write, email, visit the Fund’s website, or call:
Wells Fargo Advantage Funds
P.O. Box 8266
Boston, MA 02266-8266
Email: wfaf@wellsfargo.com
Website: wellsfargoadvantagefunds.com
Individual investors: 1-800-222-8222
Retail investment professionals: 1-888-877-9275
Institutional investment professionals: 1-866-765-0778
This report and the financial statements contained herein are submitted for the general information of the shareholders of Wells Fargo Advantage Funds. If this report is used for promotional purposes, distribution of the report must be accompanied or preceded by a current prospectus. For a current prospectus and, if available, a summary prospectus containing more complete information, including charges and expenses, call 1-800-222-8222 or visit the Fund’s website at wellsfargoadvantagefunds.com. Please consider the investment objectives, risks, charges, and expenses of the investment carefully before investing. This and other information about Wells Fargo Advantage Funds can be found in the current prospectus. Read the prospectus carefully before you invest or send money.
Wells Fargo Funds Management, LLC, a wholly owned subsidiary of Wells Fargo & Company, provides investment advisory and administrative services for Wells Fargo Advantage Funds. Other affiliates of Wells Fargo & Company provide subadvisory and other services for the Funds. The Funds are distributed by Wells Fargo Funds Distributor, LLC, Member FINRA/SIPC, an affiliate of Wells Fargo & Company.
NOT FDIC INSURED ¡ NO BANK GUARANTEE ¡ MAY LOSE VALUE
© 2012 Wells Fargo Funds Management, LLC. All rights reserved.
| | |
 | | 211738 10-12 SOFLD/SAR101 08-12 |
ITEM 2. CODE OF ETHICS
Not required in this filing
ITEM 3. AUDIT COMMITTEE FINANCIAL EXPERT
Not required in this filing.
ITEM 4. PRINCIPAL ACCOUNTANT FEES AND SERVICES
Not required in this filing.
ITEM 5. AUDIT COMMITTEE OF LISTED REGISTRANTS
Not required in this filing.
ITEM 6. PORTFOLIO OF INVESTMENTS
The Portfolio of investments is included as part of the report to shareholders filed under Item 1 of this Form.
ITEM 7. DISCLOSURE OF PROXY VOTING POLICIES AND PROCEDURES FOR CLOSED-END MANAGEMENT INVESTMENT COMPANIES
Not applicable.
ITEM 8. PORTFOLIO MANAGERS OF CLOSED-END MANAGEMENT INVESTMENT COMPANIES
Not applicable.
ITEM 9. PURCHASES OF EQUITY SECURITIES BY CLOSED-END MANAGEMENT INVESTMENT COMPANY AND AFFILIATED PURCHASES
Not applicable.
ITEM 10. SUBMISSION OF MATTERS TO A VOTE OF SECURITY HOLDERS
The Governance Committee (the “Committee”) of the Board of Trustees of the registrant (the “Trust”) has adopted procedures by which a shareholder of any series of the Trust may submit properly a nominee recommendation for the Committee’s consideration.
The shareholder must submit any such recommendation (a “Shareholder Recommendation”) in writing to the Trust, to the attention of the Trust’s Secretary, at the address of the principal executive offices of the Trust.
The Shareholder Recommendation must be delivered to, or mailed and received at, the principal executive offices of the Trust not less than forty-five (45) calendar days nor more than seventy-five (75) calendar days prior to the date of the Committee meeting at which the nominee would be considered.
The Shareholder Recommendation must include: (i) a statement in writing setting forth (A) the name, age, date of birth, business address, residence address and nationality of the person recommended by the shareholder (the “candidate”); (B) the series (and, if applicable, class) and number of all shares of the Trust owned of record or beneficially by the candidate, as reported to such shareholder by the candidate; (C) any other information regarding the candidate called for with respect to director nominees by paragraphs (a), (d), (e) and (f) of Item 401 of Regulation S-K or paragraph (b) of Item 22 of Rule 14a-101 (Schedule 14A) under the Securities Exchange Act of 1934, as amended (the “Exchange Act”), adopted by the Securities and Exchange Commission (or the corresponding provisions of any regulation or rule subsequently adopted by the Securities and Exchange Commission or any successor agency applicable to the Trust); (D) any other information regarding the candidate that would be required to be disclosed if the candidate were a nominee in a proxy statement or other filing required to be made in connection with solicitation of proxies for election of directors pursuant to Section 14 of the Exchange Act and the rules and regulations promulgated thereunder; and (E) whether the recommending shareholder believes that the candidate is or will be an “interested person” of the Trust (as defined in the Investment Company Act of 1940, as amended) and, if not an “interested person,” information regarding the candidate that will be sufficient for the Trust to make such determination; (ii) the written and signed consent of the candidate to be named as a nominee and to serve as a Trustee if elected; (iii) the recommending shareholder’s name as it appears on the Trust’s books; (iv) the series (and, if applicable, class) and number of all shares of the Trust owned beneficially and of record by the recommending shareholder; and (v) a description of all arrangements or understandings between the recommending shareholder and the candidate and any other person or persons (including their names) pursuant to which the recommendation is being made by the recommending shareholder. In addition, the Committee may require the candidate to interview in person and furnish such other information as it may reasonably require or deem necessary to determine the eligibility of such candidate to serve as a Trustee of the Trust.
ITEM 11. CONTROLS AND PROCEDURES
(a) The President and Treasurer have concluded that the Wells Fargo Funds Trust (the “Trust”) disclosure controls and procedures (as defined in Rule 30a-3(c) under the Investment Company Act of 1940) provide reasonable assurances that material information relating to the Trust is made known to them by the appropriate persons, based on their evaluation of these controls and procedures as of a date within 90 days of the filing of this report.
(b) There were no significant changes in the Trust’s internal controls over financial reporting (as defined in Rule 30a-3(d) under the Investment Company Act of 1940) that occurred during the second quarter of the period covered by this report that materially affected, or is reasonably likely to materially affect, the registrant’s internal control over financial reporting.
ITEM 12. EXHIBITS
(a)(1) Not required in this filing.
(a)(2) Certification pursuant to Rule 30a-2(a) under the Investment Company Act of 1940 (17 CFR 270.30a-2(a)) is filed and attached hereto as Exhibit 99.CERT.
(a)(3) Not applicable.
(b) Certification pursuant to Rule 30a-2(b) under the Investment Company Act of 1940 (17 CFR 270.30a-2(b)) is filed and attached hereto as Exhibit 99.906CERT.
SIGNATURES
Pursuant to the requirements of the Securities Exchange Act of 1934 and the Investment Company Act of 1940, the registrant has duly caused this report to be signed on its behalf by the undersigned, thereunto duly authorized.
| | |
| Wells Fargo Funds Trust |
| |
By: | | /s/ Karla M. Rabusch |
| |
| | Karla M. Rabusch |
| | President |
| |
Date: | | October 26, 2012 |
Pursuant to the requirements of the Securities Exchange Act of 1934 and the Investment Company Act of 1940, this report has been signed below by the following persons on behalf of the registrant and in the capacities and on the date indicated.
| | |
| By: | | /s/ Karla M. Rabusch |
| |
| | Karla M. Rabusch |
| | President |
| |
| Date: | | October 26, 2012 |
| | |
| By: | | /s/ Nancy Wiser |
| |
| | Nancy Wiser |
| | Treasurer |
| |
| Date: | | October 26, 2012 |