
UNITED STATES
SECURITIES AND EXCHANGE COMMISSION
Washington, D.C. 20549
FORM N-CSRS
CERTIFIED SHAREHOLDER REPORT OF REGISTERED
MANAGEMENT INVESTMENT COMPANIES
Investment Company Act file number: 811-09253
Wells Fargo Funds Trust
(Exact name of registrant as specified in charter)
525 Market St., San Francisco, CA 94105
(Address of principal executive offices) (Zip code)
C. David Messman
Wells Fargo Funds Management, LLC
525 Market St., San Francisco, CA 94105
(Name and address of agent for service)
Registrant’s telephone number, including area code: 800-222-8222
Date of fiscal year end: September 30, 2011
Date of reporting period: March 31, 2012
ITEM 1. REPORT TO SHAREHOLDERS

Wells Fargo Advantage Absolute Return Fund

Semi-Annual Report
March 31, 2012

Reduce clutter. Save trees.
Sign up for electronic delivery of prospectuses and shareholder reports at wellsfargo.com/advantagedelivery
Contents
The views expressed and any forward-looking statements are as of March 31, 2012, unless otherwise noted, and are those of the Fund managers and/or Wells Fargo Funds Management, LLC. Discussions of individual securities, or the markets generally, or any Wells Fargo Advantage Fund are not intended as individual recommendations. Future events or results may vary significantly from those expressed in any forward-looking statements; the views expressed are subject to change at any time in response to changing circumstances in the market. Wells Fargo Funds Management, LLC, disclaims any obligation to publicly update or revise any views expressed or forward-looking statements.
NOT FDIC INSURED ¡ NO BANK GUARANTEE ¡ MAY LOSE VALUE

WELLS FARGO INVESTMENT HISTORY
| | |
| |
| 1932 | | Keystone creates one of the first mutual fund families. |
| |
| 1971 | | Wells Fargo & Company introduces one of the first institutional index funds. |
| |
| 1978 | | Wells Fargo applies Markowitz and Sharpe’s research on Modern Portfolio Theory to introduce one of the industry’s first Tactical Asset Allocation (TAA) models in institutional separately managed accounts. |
| |
| 1984 | | Wells Fargo Stagecoach Funds launches its first asset allocation fund. |
| |
| 1989 | | The Tactical Asset Allocation (TAA) Model is first applied to Wells Fargo’s asset allocation mutual funds. |
| |
| 1994 | | Wells Fargo introduces the LifePath Funds, one of the first suites of target date funds (now the Wells Fargo Advantage Dow Jones Target Date FundsSM). |
| |
| 1996 | | Evergreen Investments and Keystone Funds merge. |
| |
| 1997 | | Wells Fargo launches Wells Fargo Advantage WealthBuilder PortfoliosSM, a fund-of-funds suite of products that includes the use of quantitative models to shift assets among investment styles. |
| |
| 1999 | | Norwest Advantage Funds and Stagecoach Funds are reorganized into Wells Fargo Funds after the merger of Norwest and Wells Fargo. |
| |
| 2002 | | Evergreen Retail and Evergreen Institutional companies form the umbrella asset management company, Evergreen Investments. |
| |
| 2005 | | The integration of Strong Funds with Wells Fargo Funds creates Wells Fargo Advantage Funds, resulting in one of the top 20 mutual fund companies in the United States. |
| |
| 2006 | | Wells Fargo Advantage Funds relaunches the target date product line as Wells Fargo Advantage Dow Jones Target Date Funds. |
| |
| 2010 | | The mergers and reorganizations of Evergreen and Wells Fargo Advantage mutual funds are completed, unifying the families under the brand of Wells Fargo Advantage Funds. |
Wells Fargo Advantage Funds®
Wells Fargo Advantage Funds skillfully guides institutions, financial advisors, and individuals through the investment terrain to help them reach their financial objectives. Everything we do on behalf of investors is backed by our unique combination of qualifications.
Strength
Our organization is built on the standards of integrity and service established by our parent company—Wells Fargo & Company—more than 150 years ago. And, because we’re part of a highly diversified financial enterprise, we offer the depth of resources to help investors succeed.
Expertise
Our multi-boutique model offers investors access to the independent thinking of premier investment managers that have been chosen for their time-tested strategies. While each team specializes in a specific investment strategy, collectively they provide investors a wide choice of distinct investment styles. Our dedication to investment excellence doesn’t end with our expertise in manager selection—risk management, analysis, and rigorous ongoing review seek to ensure each manager’s investment process remains consistent.
Partnership
Our collaborative approach is built around understanding the needs and goals of our clients. By adhering to core principles of sound judgment and steady guidance, we support you through every stage of the investment decision process.
Carefully consider a fund’s investment objectives, risks, charges, and expenses before investing. For a current prospectus and, if available, a summary prospectus, containing this and other information, visit wellsfargoadvantagefunds.com. Read it carefully before investing.
Wells Fargo Funds Management, LLC, a wholly owned subsidiary of Wells Fargo & Company, provides investment advisory and administrative services for Wells Fargo Advantage Funds®. Other affiliates of Wells Fargo & Company provide subadvisory and other services for the Funds. The Funds are distributed by Wells Fargo Funds Distributor, LLC, Member FINRA/SIPC, an affiliate of Wells Fargo & Company.
“Dow Jones®” and “Dow Jones Target Date IndexesSM” are service marks of Dow Jones Trademark Holdings, LLC (“Dow Jones”), have been licensed to CME Group Index Services LLC (“CME Indexes”) and have been sublicensed for use for certain purposes by Global Index Advisors, Inc, and Wells Fargo Funds Management, LLC. The Wells Fargo Advantage Dow Jones Target Date FundsSM based on the Dow Jones Target Date IndexesSM, are not sponsored, endorsed, sold or promoted by Dow Jones, CME Indexes or their respective affiliates and none of them makes any representation regarding the advisability of investing in such product(s).
NOT FDIC INSURED ¡ NO BANK GUARANTEE ¡ MAY LOSE VALUE
Not part of the semi-annual report.
Wells Fargo Advantage Funds offers more than 110 mutual funds across a wide range of asset classes, representing over $213 billion in assets under management, as of March 31, 2012.
| | | | |
| Equity Funds | | | | |
Asia Pacific Fund | | Equity Value Fund | | Precious Metals Fund |
C&B Large Cap Value Fund | | Global Opportunities Fund | | Premier Large Company Growth Fund |
C&B Mid Cap Value Fund | | Growth Fund | | Small Cap Opportunities Fund |
Capital Growth Fund | | Index Fund | | Small Cap Value Fund |
Common Stock Fund | | International Equity Fund | | Small Company Growth Fund |
Disciplined U.S. Core Fund | | International Value Fund | | Small Company Value Fund |
Discovery Fund† | | Intrinsic Small Cap Value Fund | | Small/Mid Cap Core Fund |
Diversified Equity Fund | | Intrinsic Value Fund | | Small/Mid Cap Value Fund |
Diversified International Fund | | Intrinsic World Equity Fund | | Special Mid Cap Value Fund |
Diversified Small Cap Fund | | Large Cap Core Fund | | Special Small Cap Value Fund |
Emerging Growth Fund | | Large Cap Growth Fund | | Specialized Technology Fund |
Emerging Markets Equity Fund | | Large Company Value Fund | | Strategic Large Cap Growth Fund |
Endeavor Select Fund† | | Omega Growth Fund | | Traditional Small Cap Growth Fund |
Enterprise Fund† | | Opportunity Fund† | | Utility and Telecommunications Fund |
| Bond Funds | | | | |
Adjustable Rate Government Fund | | Inflation-Protected Bond Fund | | Short-Term Bond Fund |
California Limited-Term Tax-Free Fund | | Intermediate Tax/AMT-Free Fund | | Short-Term High Yield Bond Fund |
California Tax-Free Fund | | International Bond Fund | | Short-Term Municipal Bond Fund |
Colorado Tax-Free Fund | | Minnesota Tax-Free Fund | | Strategic Municipal Bond Fund |
Government Securities Fund | | Municipal Bond Fund | | Total Return Bond Fund |
High Income Fund | | North Carolina Tax-Free Fund | | Ultra Short-Term Income Fund |
High Yield Bond Fund | | Pennsylvania Tax-Free Fund | | Ultra Short-Term Municipal Income Fund |
Income Plus Fund | | Short Duration Government Bond Fund | | Wisconsin Tax-Free Fund |
| Asset Allocation Funds | | | | |
Absolute Return Fund | | WealthBuilder Equity Portfolio† | | Target 2020 Fund† |
Asset Allocation Fund | | WealthBuilder Growth Allocation Portfolio† | | Target 2025 Fund† |
Conservative Allocation Fund | | WealthBuilder Growth Balanced Portfolio† | | Target 2030 Fund† |
Diversified Capital Builder Fund | | WealthBuilder Moderate Balanced Portfolio† | | Target 2035 Fund† |
Diversified Income Builder Fund | | WealthBuilder Tactical Equity Portfolio† | | Target 2040 Fund† |
Growth Balanced Fund | | Target Today Fund† | | Target 2045 Fund† |
Index Asset Allocation Fund | | Target 2010 Fund† | | Target 2050 Fund† |
Moderate Balanced Fund | | Target 2015 Fund† | | Target 2055 Fund† |
WealthBuilder Conservative Allocation Portfolio† | | | | |
| Money Market Funds | | | | |
100% Treasury Money Market Fund | | Heritage Money Market Fund† | | National Tax-Free Money Market Fund |
California Municipal Money Market Fund | | Money Market Fund | | Prime Investment Money Market Fund |
Cash Investment Money Market Fund | | Municipal Cash Management Money Market Fund | | Treasury Plus Money Market Fund |
Government Money Market Fund | | Municipal Money Market Fund | | |
| Variable Trust Funds1 | | | | |
VT Discovery Fund† | | VT Intrinsic Value Fund | | VT Small Cap Growth Fund |
VT Index Asset Allocation Fund | | VT Omega Growth Fund | | VT Small Cap Value Fund |
VT International Equity Fund | | VT Opportunity Fund† | | VT Total Return Bond Fund |
An investment in a money market fund is not insured or guaranteed by the Federal Deposit Insurance Corporation or any other government agency. Although the Wells Fargo Advantage Money Market Funds seek to preserve the value of your investment at $1.00 per share, it is possible to lose money by investing in a money market fund.
| 1. | The Variable Trust Funds are generally available only through insurance company variable contracts. |
| † | In this report, the Wells Fargo Advantage Discovery FundSM, Wells Fargo Advantage Endeavor Select FundSM, Wells Fargo Advantage Enterprise FundSM, Wells Fargo Advantage Opportunity FundSM, Wells Fargo Advantage WealthBuilder Conservative Allocation PortfolioSM, Wells Fargo Advantage WealthBuilder Equity PortfolioSM, Wells Fargo Advantage WealthBuilder Growth Allocation PortfolioSM, Wells Fargo Advantage WealthBuilder Growth Balanced PortfolioSM, Wells Fargo Advantage WealthBuilder Moderate Balanced PortfolioSM, Wells Fargo Advantage WealthBuilder Tactical Equity PortfolioSM, Wells Fargo Advantage Dow Jones Target Today FundSM, Wells Fargo Advantage Dow Jones Target 2010 FundSM, Wells Fargo Advantage Dow Jones Target 2015 FundSM, Wells Fargo Advantage Dow Jones Target 2020 FundSM, Wells Fargo Advantage Dow Jones Target 2025 FundSM, Wells Fargo Advantage Dow Jones Target 2030 FundSM, Wells Fargo Advantage Dow Jones Target 2035 FundSM, Wells Fargo Advantage Dow Jones Target 2040 FundSM, Wells Fargo Advantage Dow Jones Target 2045 FundSM, Wells Fargo Advantage Dow Jones Target 2050 FundSM, Wells Fargo Advantage Dow Jones Target 2055 FundSM, Wells Fargo Advantage Heritage Money Market FundSM, Wells Fargo Advantage VT Discovery FundSM, and Wells Fargo Advantage VT Opportunity FundSM are referred to as the Discovery Fund, Endeavor Select Fund, Enterprise Fund, Opportunity Fund, WealthBuilder Conservative Allocation Portfolio, WealthBuilder Equity Portfolio, WealthBuilder Growth Allocation Portfolio, WealthBuilder Growth Balanced Portfolio, WealthBuilder Moderate Balanced Portfolio, WealthBuilder Tactical Equity Portfolio, Target Today Fund, Target 2010 Fund, Target 2015 Fund, Target 2020 Fund, Target 2025 Fund, Target 2030 Fund, Target 2035 Fund, Target 2040 Fund, Target 2045 Fund, Target 2050 Fund, Target 2055 Fund, Heritage Money Market Fund, VT Discovery Fund, and VT Opportunity Fund, respectively. |
Not part of the semi-annual report.
| | | | |
| 2 | | Wells Fargo Advantage Absolute Return Fund | | Letter to Shareholders |

Karla M. Rabusch,
President
Wells Fargo Advantage Funds
The financial markets throughout most of the past six months may best be described as a risk-on/risk-off trading environment in response to the uncertainty about the sustainability of the U.S. economic recovery, ongoing concerns about the Greek debt crisis, and the overall health of the eurozone.
Positive global developments encouraged investors to refocus on underlying fundamentals and a longer-term investment perspective, sparking the first-quarter equity rally that extended into March for the U.S. equity markets.
Dear Valued Shareholder:
We’re pleased to offer you this semi-annual report for the Wells Fargo Advantage Absolute Return Fund for the one-month period that ended March 31, 2012.
The financial markets throughout most of the past six months may best be described as a risk-on/risk-off trading environment in response to the uncertainty about the sustainability of the U.S. economic recovery, ongoing concerns about the Greek debt crisis, and the overall health of the eurozone. When volatility and uncertainty were high, investors sold risky assets such as high-beta1 equities, commodities, emerging markets securities, and high-yield bonds, in preference for the relative safety of U.S. Treasuries. In periods of low volatility, investor risk tolerance sharply rose, and the markets sought out the higher yield and return potential of those riskier investments.
During the first quarter of 2012, investor sentiment appeared to be more positive and balanced. This recent shift in sentiment was the result of improvement in the global macroeconomic backdrop, which contributed to a less volatile market environment and a more stable consensus earnings growth outlook. These developments also encouraged investors to refocus on underlying fundamentals and a longer-term investment perspective, sparking the first-quarter equity rally that extended into March for the U.S. equity markets led by stocks and sectors that were shunned at points in 2011, notably retail and higher-growth technology names.
During the one-month period, the S&P 500 Index2 and the Russell 3000® Index3 posted returns of 3.29% and 3.08%, respectively, while the Barclays U.S. Aggregate Bond Index4, representing the universe of investment-grade U.S. bonds, posted a negative total return of (0.55)%. By comparison, the Barclays U.S. Corporate High Yield Bond Index5 lost 0.14%, and the Barclays U.S. Treasury Index6 returned (0.41)%.
On the international front, the MSCI EAFE Index7 returned (0.91)% during the one-month period, while the BofA Merrill Lynch Global Broad Market Ex. U.S. Index8, representative of the international investment-grade bond market, returned (0.82)%.
The developed global economies have regained some momentum so far in 2012.
Early in 2012, the U.S. Bureau of Economic Analysis reported that U.S. gross domestic product (GDP) expanded to an annual growth rate of 3.0% in the fourth quarter, building on the 1.8% annual growth rate reported for the third quarter of 2011, re-igniting hopes of a sustainable economic recovery. While few economists now believe that the U.S. economy is in danger of sliding back into recession, many continue to expect a tepid economic growth environment in 2012.
| 1. | Beta measures fund volatility relative to general market movements. It is a standardized measure of systematic risk in comparison to a specified index. The benchmark beta is 1.00 by definition. Beta is based on historical performance and does not represent future results. |
| 2. | The S&P 500 Index consists of 500 stocks chosen for market size, liquidity, and industry group representation. It is a market-value weighted index with each stock’s weight in the index proportionate to its market value. You cannot invest directly in an index. |
| 3. | The Russell 3000® Index measures the performance of the 3,000 largest U.S. companies based on total market capitalization, which represents approximately 98% of the investable U.S. equity market. You cannot invest directly in an index. |
| 4. | The Barclays U.S. Aggregate Bond Index is composed of the Barclays Government/Credit Index and the Mortgage-Backed Securities Index and includes U.S. Treasury issues, agency issues, corporate bond issues, and mortgage-backed securities. You cannot invest directly in an index. |
| 5. | The Barclays U.S. Corporate High Yield Bond Index is an unmanaged, U.S. dollar denominated, non-convertible, non-investment grade debt index. The index consists of domestic and corporate bonds rated Ba and below with a minimum outstanding amount of $150 million. You cannot invest directly in an index. |
| 6. | The Barclays U.S. Treasury Index is an index of U.S. Treasury securities. You cannot invest directly in an index. |
| | | | | | |
| Letter to Shareholders | | Wells Fargo Advantage Absolute Return Fund | | | 3 | |
Within the eurozone, GDP grew at an annualized rate of 1.5% for 2011, which was modestly weaker from a year earlier when eurozone GDP was reported at an annualized rate of 2.0% in the fourth quarter of 2010. Considering the fiscal challenges that faced European countries throughout 2011—stemming, primarily, from the reemergence of the Greek debt crisis—most economists had expected weaker economic conditions in 2011. While several steps have been taken by the International Monetary Fund and the European Central Bank to address the ongoing fiscal challenges in Europe, economic conditions of many countries in the eurozone are likely to remain weak throughout 2012.
Central banks across the globe remain committed to accommodative policies.
With inflation in check, the U.S. Federal Reserve (Fed) held its target range for the federal funds rate—a proxy for short-term interest rates—steady at 0% to 0.25%. Last summer, the Federal Open Market Committee (FOMC) issued a statement explaining that economic conditions were likely to warrant exceptionally low levels for the federal funds rate through at least mid-2013—a timetable that was later revised to late 2014 following the FOMC meeting on January 25, 2012.
The European Central Bank (ECB) also continued to maintain an accommodative monetary policy throughout the period, primarily in efforts to stave off the contagion risk stemming from the ongoing concerns about the potential of Greece defaulting on its sovereign bonds. Fortunately Greece received another bailout and was able to restructure its outstanding debt in February 2012, which alleviated near-term contagion risks and the possibility of the euro collapsing. However, the agreement does not fully address longer-term structural issues that affect not only Greece, but several other countries across the eurozone. Recognizing the drag the persistent sovereign debt crisis has had on financial stability across the eurozone, the ECB introduced additional liquidity into the European banking system through its long-term refinancing operations (LTRO). The LTRO program effectively encourages European banks to buy sovereign bonds of the eurozone governments, helping to push yields lower on bonds from financially fragile countries like Spain and Italy. This type of activity helps to reduce the near-term risk that those countries would experience funding issues. From a global credit market perspective, this additional liquidity further helps alleviate fears of contagion and causes risk premiums to decline—an ideal scenario for equities and high-yield bonds.
Recent events have not altered our message to shareholders.
The heightened volatility across the global financial markets during 2011 and lingering uncertainties about the outlook going forward have left many investors questioning their resolve—and their investments. Yet it is precisely at such times that the market may present opportunities—as well as challenges—for prudent investors. For many investors, simply building and maintaining a well-diversified9 investment plan focused on clear financial objectives is the best long-term strategy.
| 7. | The Morgan Stanley Capital International Europe, Australasia, and Far East (“MSCI EAFE”) Index is an unmanaged group of securities widely regarded by investors to be representations of the stock markets of Europe, Australasia, and the Far East. You cannot invest directly in an index. Source: MSCI. MSCI makes no express or implied warranties or representations and shall have no liability whatsoever with respect to any MSCI data contained herein. The MSCI data may not be further redistributed or used as a basis for other indexes or any securities or financial products. This report is not approved, reviewed or produced by MSCI. |
| 8. | The BofA Merrill Lynch Global Broad Market Ex. U.S. Index tracks the performance of investment grade debt publicly issued in the major domestic and euro bond markets, including sovereign, quasi-government, corporate, securitized and collateralized securities and excludes all securities denominated in U.S. dollars. You cannot invest directly in an index. |
| | | | |
| 4 | | Wells Fargo Advantage Absolute Return Fund | | Letter to Shareholders |
Thank you for choosing to invest with Wells Fargo Advantage Funds. We appreciate your confidence in us and remain committed to helping you meet your financial needs. For current information about your fund investments, contact your investment professional, visit our Web site at wellsfargoadvantagefunds.com, or call us directly at 1-800-222-8222. We are available 24 hours a day, 7 days a week.
Sincerely,

Karla M. Rabusch
President
Wells Fargo Advantage Funds
| 9. | Diversification does not assure or guarantee better performance and cannot eliminate the risk of investment losses. |
| | | | | | |
| Performance Highlights (Unaudited) | | Wells Fargo Advantage Absolute Return Fund | | | 5 | |
INVESTMENT OBJECTIVE
The Fund seeks a positive total return.
ADVISER
Wells Fargo Funds Management, LLC
PORTFOLIO MANAGER
Ben Inker, CFA1
FUND INCEPTION
March 1, 2012
| | |
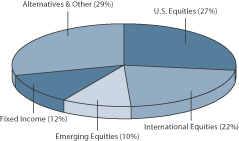
PORTFOLIO ALLOCATION2
(AS OF MARCH 31, 2012) | | |
|
 |
Absolute return funds are not intended to outperform stocks and bonds in strong markets, and there is no guarantee of positive returns or that the Fund’s objectives will be achieved. Stock values fluctuate in response to the activities of individual companies and general market and economic conditions. Bond values fluctuate in response to the financial condition of individual issuers, general market and economic conditions, and changes in interest rates. In general, when interest rates rise, bond values fall and investors may lose principal value. Alternative investments such as, commodities, real estate, and short strategies are speculative and entail a high degree of risk. Foreign investments are especially volatile and can rise or fall dramatically due to differences in the political and economic conditions of the host country. The Fund will indirectly be exposed to all of the risks of an investment in the underlying funds and will indirectly bear expenses of the underlying funds. The use of derivatives may reduce returns and/or increase volatility. Certain investment strategies tend to increase the total risk of an investment (relative to the broader market). This Fund is exposed to high-yield risk, mortgage- and asset-backed securities risk, and smaller-company securities risk. Consult the Fund’s prospectus for additional information on these and other risks.
| 1. | The Fund invests substantially all of its assets directly in GMO Benchmark-Free Allocation Fund, an investment company advised by Grantham, Mayo, Van Otterloo & Co. LLC (GMO). Mr. Inker, senior member of GMO’s Asset Allocation Division, has been responsible for coordinating the portfolio management of GMO Benchmark-Free Allocation Fund since 2003. |
| 2. | Portfolio allocation is subject to change and represents the portfolio allocation of the GMO Benchmark-Free Allocation Fund, which is calculated based on the total long-term investments of the GMO Benchmark-Free Allocation Fund. |
| | | | |
| 6 | | Wells Fargo Advantage Absolute Return Fund | | Performance Highlights (Unaudited) |
AVERAGE ANNUAL TOTAL RETURN3 (%) (AS OF MARCH 31, 2012)
| | | | | | | | | | | | | | | | | | | | | | | | | | | | | | | | | | | | | | | | | | | | |
| | | | | | Including Sales Charge | | | Excluding Sales Charge | | | | | | | |
| | | | | | | | | | | | | | | Since | | | | | | | | | | | | Since | | | Expense Ratios4 | |
| | | Inception Date | | | 6 Months* | | | 1 Year | | | 5 Year | | | 07/23/2003 | | | 6 Months* | | | 1 Year | | | 5 Year | | | 07/23/2003 | | | Gross | | | Net5 | |
Class A (WARAX) | | | 03/01/2012 | | | | 2.47 | | | | 0.31 | | | | 3.84 | | | | 9.46 | | | | 8.73 | | | | 6.42 | | | | 5.08 | | | | 10.21 | | | | 1.66% | | | | 1.66% | |
Class C (WARCX) | | | 03/01/2012 | | | | 7.29 | | | | 4.59 | | | | 4.29 | | | | 9.38 | | | | 8.29 | | | | 5.59 | | | | 4.29 | | | | 9.38 | | | | 2.41% | | | | 2.41% | |
Administrator Class (WARDX) | | | 03/01/2012 | | | | | | | | | | | | | | | | | | | | 8.81 | | | | 6.58 | | | | 5.25 | | | | 10.38 | | | | 1.50% | | | | 1.48% | |
MSCI World Index (Net)6 | | | | | | | | | | | | | | | | | | | | | | | 20.03 | | | | 0.56 | | | | (0.70 | ) | | | 6.73 | | | | | | | | | |
Consumer Price Index7 | | | | | | | | | | | | | | | | | | | | | | | 2.21 | | | | 2.65 | | | | 2.24 | | | | 2.58 | | | | | | | | | |
| * | Returns for periods of less than one year are not annualized. |
Figures quoted represent past performance, which is no guarantee of future results and do not reflect the deduction of taxes that a shareholder may pay on fund distributions or the redemption of fund shares. Investment return and principal value of an investment will fluctuate so that an investor’s shares, when redeemed, may be worth more or less than their original cost. Performance shown without sales charges would be lower if sales charges were reflected. Current performance may be lower or higher than the performance data quoted and assumes the reinvestment of dividends and capital gains. Current month-end performance is available on the Fund’s Web site – wellsfargoadvantagefunds.com
Index returns do not include transaction costs associated with buying and selling securities, any mutual fund fees or expenses or any taxes. It is not possible to invest directly in an index.
For Class A shares, the maximum front-end sales charge is 5.75%. For Class C shares, the maximum contingent deferred sales charge is 1.00%. Performance including sales charge assumes the sales charge for the corresponding time period. Administrator Class shares are sold without a front-end sales charge or contingent deferred sales charge.
| 3. | Historical performance shown for Class A, Class C and Administrator Class prior to their inception is based on the performance of the Class III shares of GMO Benchmark- Free Allocation Fund (GBMFX), in which the Fund invests substantially all of its investable assets. Returns for the Class III shares do not reflect GMO Benchmark- Free Allocation Fund’s current fee arrangement and have been adjusted downward to reflect the higher expense ratios applicable to Class A, Class C and Administrator Class at their inception. These ratios were 1.66% for Class A, 2.41% for Class C and 1.50% for the Administrator Class. |
| 4. | Reflects the expense ratios as stated in the most recent prospectuses. |
| 5. | The Adviser has committed through February 28, 2014 to waive fees and/or reimburse expenses to the extent necessary to cap the Fund’s Total Annual Fund Operating Expenses After Fee Waiver, excluding brokerage commissions, interest, taxes, extraordinary expenses and the expenses of any money market fund or other fund held by the Fund (including the expenses of GMO Benchmark-Free Allocation Fund), at 0.80% for Class A, 1.55% for Class C and 0.60% for Administrator Class. Without these caps, the Fund’s returns would have been lower. |
| 6. | The Morgan Stanley Capital International World Index (Net) (“MSCI World Index (Net)”) is a free float-adjusted market capitalization weighted index that is designed to measure the equity market performance of developed markets. You cannot invest directly in an index. |
| 7. | The Consumer Price Index for All Urban Consumers U.S. All Items is published monthly by the U.S. government as an indicator of changes in price levels (or inflation) paid by urban consumers for a representative basket of goods and services. You cannot invest directly in an index. |
| | | | | | |
| Fund Expenses (Unaudited) | | Wells Fargo Advantage Absolute Return Fund | | | 7 | |
As a shareholder of the Fund, you incur two types of costs: (1) transaction costs, including sales charges (loads) on purchase payments and contingent deferred sales charges (if any) on redemptions and (2) ongoing costs, including management fees; distribution (12b-1) and/or shareholder service fees; and other Fund expenses. This example is intended to help you understand your ongoing costs (in dollars) of investing in the Fund and to compare these costs with the ongoing costs of investing in other mutual funds.
The example is based on an investment of $1,000 invested at the beginning of the six-month period and held for the entire period from October 1, 2011 to March 31, 2012.
Actual Expenses
The “Actual” line of the table below provides information about actual account values and actual expenses. You may use the information in this line, together with the amount you invested, to estimate the expenses that you paid over the period. Simply divide your account value by $1,000 (for example, an $8,600 account value divided by $1,000 = 8.6), then multiply the result by the number in the “Actual” line under the heading entitled “Expenses Paid During Period” for your applicable class of shares to estimate the expenses you paid on your account during this period.
Hypothetical Example for Comparison Purposes
The “Hypothetical” line of the table below provides information about hypothetical account values and hypothetical expenses based on the Fund’s actual expense ratio and an assumed rate of return of 5% per year before expenses, which is not the Fund’s actual return. The hypothetical account values and expenses may not be used to estimate the actual ending account balance or expenses you paid for the period. You may use this information to compare the ongoing costs of investing in the Fund and other funds. To do so, compare this 5% hypothetical example with the 5% hypothetical examples that appear in the shareholder reports of the other funds.
Please note that the expenses shown in the table are meant to highlight your ongoing costs only and do not reflect any transactional costs, such as sales charges (loads) and contingent deferred sales charges. Therefore, the “Hypothetical” line of the table is useful in comparing ongoing costs only, and will not help you determine the relative total costs of owning different funds. In addition, if these transactional costs were included, your costs would have been higher.
| | | | | | | | | | | | | | | | |
| | | Beginning
Account Value
10-01-2011 | | | Ending
Account Value
03-31-2012 | | | Expenses
Paid During
the Period¹ | | | Net Annual
Expense Ratio | |
Class A | | | | | | | | | | | | | | | | |
Actual | | $ | 1,000.00 | | | $ | 1,003.00 | | | $ | 4.01 | | | | 0.80 | % |
Hypothetical (5% return before expenses) | | $ | 1,000.00 | | | $ | 1,021.00 | | | $ | 4.04 | | | | 0.80 | % |
Class C | | | | | | | | | | | | | | | | |
Actual | | $ | 1,000.00 | | | $ | 1,002.00 | | | $ | 7.76 | | | | 1.55 | % |
Hypothetical (5% return before expenses) | | $ | 1,000.00 | | | $ | 1,017.25 | | | $ | 7.82 | | | | 1.55 | % |
Administrator Class | | | | | | | | | | | | | | | | |
Actual | | $ | 1,000.00 | | | $ | 1,003.00 | | | $ | 3.00 | | | | 0.60 | % |
Hypothetical (5% return before expenses) | | $ | 1,000.00 | | | $ | 1,022.00 | | | $ | 3.03 | | | | 0.60 | % |
| Expenses Including GMO Benchmark-Free Allocation Fund | | | | | | | | | | | | |
Class A | | | | | | | | | | | | | | | | |
Actual | | $ | 1,000.00 | | | $ | 1,003.00 | | | $ | 8.66 | | | | 1.73 | % |
Hypothetical (5% return before expenses) | | $ | 1,000.00 | | | $ | 1,016.35 | | | $ | 8.72 | | | | 1.73 | % |
Class C | | | | | | | | | | | | | | | | |
Actual | | $ | 1,000.00 | | | $ | 1,002.00 | | | $ | 12.41 | | | | 2.48 | % |
Hypothetical (5% return before expenses) | | $ | 1,000.00 | | | $ | 1,012.60 | | | $ | 12.48 | | | | 2.48 | % |
Administrator Class | | | | | | | | | | | | | | | | |
Actual | | $ | 1,000.00 | | | $ | 1,003.00 | | | $ | 7.66 | | | | 1.53 | % |
Hypothetical (5% return before expenses) | | $ | 1,000.00 | | | $ | 1,017.35 | | | $ | 7.72 | | | | 1.53 | % |
| 1. | Expenses paid is equal to the annualized expense ratio of each class multiplied by the average account value over the period, multiplied by the number of days in the most recent fiscal half-year divided by the number of days in the fiscal year (to reflect the one-half year period). |
| | | | |
| 8 | | Wells Fargo Advantage Absolute Return Fund | | Statement of Assets and Liabilities—March 31, 2012 (Unaudited) |
| | | | |
| | | | |
| |
Assets | | | | |
Investment in GMO Benchmark–Free Allocation Fund (Class MF), at value (see cost below) | | $ | 202,862,787 | |
Cash | | | 6,712,761 | |
Receivable for Fund shares sold | | | 33,707,338 | |
Receivable from adviser | | | 1,825 | |
Prepaid expenses and other assets | | | 46,648 | |
| | | | |
Total assets | | | 243,331,359 | |
| | | | |
| |
Liabilities | | | | |
Payable for investments purchased | | | 6,512,761 | |
Payable for Fund shares redeemed | | | 131,432 | |
Distribution fees payable | | | 7,665 | |
Due to other related parties | | | 15,812 | |
Accrued expenses and other liabilities | | | 24,226 | |
| | | | |
Total liabilities | | | 6,691,896 | |
| | | | |
Total net assets | | $ | 236,639,463 | |
| | | | |
| |
NET ASSETS CONSIST OF | | | | |
Paid-in capital | | $ | 236,313,675 | |
Undistributed net investment loss | | | (75,374 | ) |
Net unrealized gains on investments | | | 401,162 | |
| | | | |
Total net assets | | $ | 236,639,463 | |
| | | | |
| |
COMPUTATION OF NET ASSET VALUE AND OFFERING PRICE PER SHARE1 | | | | |
Net assets – Class A | | $ | 73,324,710 | |
Shares outstanding – Class A | | | 7,308,684 | |
Net asset value per share – Class A | | | $10.03 | |
Maximum offering price per share – Class A2 | | | $10.64 | |
Net assets – Class C | | $ | 30,580,388 | |
Shares outstanding – Class C | | | 3,052,752 | |
Net asset value per share – Class C | | | $10.02 | |
Net assets – Administrator Class | | $ | 132,734,365 | |
Shares outstanding – Administrator Class | | | 13,234,418 | |
Net asset value per share – Administrator Class | | | $10.03 | |
| |
Investment in GMO Benchmark–Free Allocation Fund (Class MF), at cost | | $ | 202,461,625 | |
| | | | |
| 1. | The Fund has an unlimited number of authorized shares. |
| 2. | Maximum offering price is computed as 100/94.25 of net asset value. On investments of $50,000 or more, the offering price is reduced. |
The accompanying notes are an integral part of these financial statements.
| | | | | | |
| Statement of Operations—Period Ended March 31, 2012 (Unaudited)1 | | Wells Fargo Advantage Absolute Return Fund | | | 9 | |
| | | | |
| | | | |
| |
Investment income | | $ | 0 | |
| | | | |
| |
Expenses | | | | |
Advisory and fund level administration fee | | | 22,710 | |
Administration fees | | | | |
Class A | | | 6,635 | |
Class C | | | 2,657 | |
Administrator Class | | | 6,519 | |
Shareholder servicing fees | | | | |
Class A | | | 6,380 | |
Class C | | | 2,555 | |
Administrator Class | | | 16,298 | |
Distribution fees | | | | |
Class C | | | 7,665 | |
Custody and accounting fees | | | 1,832 | |
Professional fees | | | 5,271 | |
Registration fees | | | 4,758 | |
Shareholder report expenses | | | 13,563 | |
Trustees’ fees and expenses | | | 1,047 | |
Other fees and expenses | | | 2,019 | |
| | | | |
Total expenses | | | 99,909 | |
Less: Fee waivers and/or expense reimbursements | | | (24,535 | ) |
| | | | |
Net expenses | | | 75,374 | |
| | | | |
Net investment loss | | | (75,374 | ) |
| | | | |
Net change in unrealized gains (losses) from investments | | | 401,162 | |
| | | | |
Net increase in net assets resulting from operations | | $ | 325,788 | |
| | | | |
| 1. | For the one month ended March 31, 2012. The Fund commenced operations on March 1, 2012. |
The accompanying notes are an integral part of these financial statements.
| | | | |
| 10 | | Wells Fargo Advantage Absolute Return Fund | | Statement of Changes in Net Assets |
| | | | | | | | |
| | | Period Ended March 31, 2012
(Unaudited)1 | |
| | |
Operations | | | | | | | | |
Net investment loss | | | | | | $ | (75,374 | ) |
Net change in unrealized gains (losses) from investments | | | | | | | 401,162 | |
| | | | | | | | |
Net increase in net assets resulting from operations | | | | | | | 325,788 | |
| | | | | | | | |
| | |
Capital share transactions | | | Shares | | | | | |
Proceeds from shares sold | | | | | | | | |
Class A | | | 7,397,552 | | | | 74,048,187 | |
Class C | | | 3,063,553 | | | | 30,652,051 | |
Administrator Class | | | 13,249,831 | | | | 132,767,202 | |
| | | | | | | | |
| | | | | | | 237,467,440 | |
| | | | | | | | |
Payment for shares redeemed | | | | | | | | |
Class A | | | (88,868 | ) | | | (891,221 | ) |
Class C | | | (10,801 | ) | | | (108,183 | ) |
Administrator Class | | | (15,413 | ) | | | (154,361 | ) |
| | | | | | | | |
| | | | | | | (1,153,765 | ) |
| | | | | | | | |
Net increase in net assets resulting
from capital share transactions | | | | | | | 236,313,675 | |
| | | | | | | | |
Total increase in net assets | | | | | | | 236,639,463 | |
| | | | | | | | |
| | |
Net assets | | | | | | | | |
Beginning of period | | | | | | | 0 | |
| | | | | | | | |
End of period | | | | | | $ | 236,639,463 | |
| | | | | | | | |
Undistributed net investment loss | | | | | | $ | (75,374 | ) |
| | | | | | | | |
| 1. | For the one month ended March 31, 2012. The Fund commenced operations on March 1, 2012. |
The accompanying notes are an integral part of these financial statements.
| | | | | | |
| Financial Highlights | | Wells Fargo Advantage Absolute Return Fund | | | 11 | |
(For a share outstanding throughout the period)
| | | | |
| Class A | | Period Ended
March 31, 2012
(Unaudited)1 | |
Net asset value, beginning of period | | $ | 10.00 | |
Net investment loss | | | (0.01 | )2 |
Net unrealized gains on investments | | | 0.04 | |
| | | | |
Total from investment operations | | | 0.03 | |
Net asset value, end of period | | $ | 10.03 | |
Total return3 | | | 0.30 | % |
Ratios to average net assets (annualized) | | | | |
Gross expenses | | | 1.00 | % |
Net expenses | | | 0.80 | % |
Net investment loss | | | (0.80 | )% |
Supplemental data | | | | |
Portfolio turnover rate | | | 0 | % |
Net assets, end of period (000’s omitted) | | | $73,325 | |
| 1. | For the period from March 1, 2012 (commencement of class operations) to March 31, 2012 |
| 2. | Calculated based upon average shares outstanding |
| 3. | Total return calculations do not include any sales charges. Returns for periods of less than one year are not annualized. |
The accompanying notes are an integral part of these financial statements.
| | | | |
| 12 | | Wells Fargo Advantage Absolute Return Fund | | Financial Highlights |
(For a share outstanding throughout the period)
| | | | |
| Class C | | Period Ended
March 31, 2012
(Unaudited)1 | |
Net asset value, beginning of period | | $ | 10.00 | |
Net investment loss | | | (0.01 | )2 |
Net unrealized gains on investments | | | 0.03 | |
| | | | |
Total from investment operations | | | 0.02 | |
Net asset value, end of period | | $ | 10.02 | |
Total return3 | | | 0.20 | % |
Ratios to average net assets (annualized) | | | | |
Gross expenses | | | 1.72 | % |
Net expenses | | | 1.55 | % |
Net investment loss | | | (1.55 | )% |
Supplemental data | | | | |
Portfolio turnover rate | | | 0 | % |
Net assets, end of period (000’s omitted) | | | $30,580 | |
| 1. | For the period from March 1, 2012 (commencement of class operations) to March 31, 2012 |
| 2. | Calculated based upon average shares outstanding |
| 3. | Total return calculations do not include any sales charges. Returns for periods of less than one year are not annualized. |
The accompanying notes are an integral part of these financial statements.
| | | | | | |
| Financial Highlights | | Wells Fargo Advantage Absolute Return Fund | | | 13 | |
(For a share outstanding throughout the period)
| | | | |
| Administrator Class | | Period Ended
March 31, 2012
(Unaudited)1 | |
Net asset value, beginning of period | | $ | 10.00 | |
Net investment loss | | | (0.01 | )2 |
Net unrealized gains on investments | | | 0.04 | |
| | | | |
Total from investment operations | | | 0.03 | |
Net asset value, end of period | | $ | 10.03 | |
Total return3 | | | 0.30 | % |
Ratios to average net assets (annualized) | | | | |
Gross expenses | | | 0.87 | % |
Net expenses | | | 0.60 | % |
Net investment loss | | | (0.60 | )% |
Supplemental data | | | | |
Portfolio turnover rate | | | 0 | % |
Net assets, end of period (000’s omitted) | | | $132,734 | |
| 1. | For the period from March 1, 2012 (commencement of class operations) to March 31, 2012 |
| 2. | Calculated based upon average shares outstanding |
| 3. | Returns for periods of less than one year are not annualized. |
The accompanying notes are an integral part of these financial statements.
| | | | |
| 14 | | Wells Fargo Advantage Absolute Return Fund | | Notes to Financial Statements (Unaudited) |
1. ORGANIZATION
Wells Fargo Funds Trust (the “Trust”), a Delaware statutory trust organized on March 10, 1999, is an open-end management investment company registered under the Investment Company Act of 1940, as amended (the “1940 Act”). These financial statements report on Wells Fargo Advantage Absolute Return Fund (the “Fund”) which is a diversified series of the Trust.
The Fund invests substantially all of its investable assets in the GMO Benchmark-Free Allocation Fund (the “Benchmark-Free Allocation Fund”), an investment company managed by Grantham, Mayo, Van Otterloo & Co. LLC (“GMO”). Benchmark-Free Allocation Fund is a fund-of-funds that invests primarily in shares of other GMO-managed mutual funds (“underlying funds”), which may include U.S. and foreign equity funds, U.S. and foreign fixed income funds and funds with various specialized investment programs, including funds that invest in alternative asset classes, funds that pursue “real return” strategies that seek to outperform cash benchmarks, and funds designed to complement broader asset allocation strategies rather than serving as standalone investments. Benchmark-Free Allocation Fund may also hold securities (particularly asset-backed securities) directly or through one or more subsidiaries or other entities. As of March 31, 2012, the Fund owned 51% of Benchmark-Free Allocation Fund.
2. SIGNIFICANT ACCOUNTING POLICIES
The following significant accounting policies, which are consistently followed in the preparation of the financial statements of the Fund, are in conformity with U.S. generally accepted accounting principles which require management to make estimates and assumptions that affect the reported amounts of assets and liabilities, disclosure of contingent assets and liabilities at the date of the financial statements, and the reported amounts of revenues and expenses during the reporting period. Actual results could differ from those estimates.
Securities valuation
The Fund values its investment in Benchmark-Free Allocation Fund at net asset value. The valuation of investments in securities and the underlying funds held by Benchmark-Free Allocation Fund is discussed in the annual report of Benchmark-Free Allocation Fund which is included in the mailing of this shareholder report. An unaudited Statement of Assets and Liabilities and unaudited Schedule of Investments for Benchmark-Free Allocation Fund as of March 31, 2012 has also been included as an Appendix in the Fund’s semi- annual report for your reference.
Investments which are not valued using the method discussed above, are valued at their fair value, as determined by procedures established in good faith and approved by the Board of Trustees. The Board of Trustees has established a Valuation Committee comprised of the Trustees and has delegated to it the authority to take any actions regarding the valuation of portfolio holdings that the Valuation Committee deems necessary in determining the fair value of portfolio holdings, unless the responsibility has been delegated to the Management Valuation Team of Wells Fargo Funds Management, LLC (“Funds Management”). The Board of Trustees retains the authority to make or ratify any valuation decisions or approve any changes to the Fair Value Procedures as it deems appropriate. On a quarterly basis, the Board of Trustees considers for ratification any valuation actions taken by the Valuation Committee or the Management Valuation Team.
Investment transactions and income recognition
Income dividends and capital gain distributions from Benchmark-Free Allocation Fund are recorded on the ex-dividend date. Capital gain distributions from Benchmark-Free Allocation Fund are treated as realized gains.
Distributions to shareholders
Distributions to shareholders from net investment income and net realized gains, if any, are recorded on the ex-dividend date. Such distributions are determined in conformity with income tax regulations, which may differ from generally accepted accounting principles.
Federal and other taxes
The Fund intends to qualify as a regulated investment company by distributing substantially all of its investment company taxable income and any net realized capital gains (after reduction for capital loss carryforwards) sufficient to relieve it from all, or substantially all, federal income taxes.
The Fund’s income and federal excise tax returns and all financial records supporting those returns since the Fund’s commencement of operations will be subject to examination by the federal and Delaware revenue authorities.
| | | | | | |
| Notes to Financial Statements (Unaudited) | | Wells Fargo Advantage Absolute Return Fund | | | 15 | |
The Fund is permitted to carry forward capital losses for an unlimited period. Additionally, capital losses that are carried forward will retain their character as either short-term or long-term capital losses.
Class allocations
The separate classes of shares offered by the Fund differ principally in applicable sales charges, distribution, shareholder servicing and administration fees. Shareholders of each class bear certain expenses that pertain to that particular class. All shareholders bear the common expenses of the Fund, earn income from the portfolio, and are allocated unrealized gains and losses pro rata based on the average daily net assets of each class, without distinction between share classes. Dividends are determined separately for each class based on income and expenses allocable to each class. Realized gains and losses are allocated to each class pro rata based upon the net assets of each class on the date realized. Differences in per share dividend rates generally result from the relative weightings of pro rata income and realized gain allocations and from differences in separate class expenses, including distribution, shareholder servicing and administration fees.
3. FAIR VALUATION MEASUREMENTS
Fair value measurements of investments are determined within a framework that has established a fair value hierarchy based upon the various data inputs utilized in determining the value of the Fund’s investments. The three-level hierarchy gives the highest priority to unadjusted quoted prices in active markets for identical assets or liabilities (Level 1) and the lowest priority to significant unobservable inputs (Level 3). The Fund’s investments are classified within the fair value hierarchy based on the lowest level of input that is significant to the fair value measurement. The inputs are summarized into three broad levels as follows:
| n | | Level 1 – quoted prices in active markets for identical securities |
| n | | Level 2 – other significant observable inputs (including quoted prices for similar securities, interest rates, prepayment speeds, credit risk, etc.) |
| n | | Level 3 – significant unobservable inputs (including the Fund’s own assumptions in determining the fair value of investments) |
The inputs or methodologies used for valuing securities are not necessarily an indication of the risk associated with investing in those securities.
At March 31, 2012, the Fund’s investment in Benchmark-Free Allocation Fund carried at fair value was designated as Level 2 input.
Transfers in and transfers out are recognized at the end of the reporting period. For the one month ended March 31, 2012, the Fund did not have any transfers into/out of Level 1 and Level 2.
4. TRANSACTIONS WITH AFFILIATES AND OTHER EXPENSES
Advisory and administration fees
The Trust has entered into an advisory and administration contract with Funds Management, an indirect wholly owned subsidiary of Wells Fargo & Company (“Wells Fargo”). The adviser is responsible for implementing investment policies and guidelines.
Pursuant to the contract, Funds Management is entitled to receive an annual advisory and fund level administration fee starting at 0.225% and declining to 0.175% as the average daily net assets of the Fund increase. For the one month ended March 31, 2012, the advisory and fund level administration fee was equivalent to an annual rate of 0.225% of the Fund’s average daily net assets.
Funds Management also provides class level administration services which includes paying fees and expenses for services provided by the transfer agent, sub-transfer agents, omnibus account servicers and record-keepers. Funds Management is entitled to receive from the Fund an annual class level administration fee of 0.26% of the average daily net assets of each of Class A and Class C shares and an annual fee of 0.10% of the average daily net assets of Administrator Class shares.
Funds Management has contractually waived and/or reimbursed advisory and administration fees to the extent necessary to maintain certain net operating expense ratios for the Fund. Waiver of fees and/or reimbursement of
| | | | |
| 16 | | Wells Fargo Advantage Absolute Return Fund | | Notes to Financial Statements (Unaudited) |
expenses by Funds Management were made first from fund level expenses on a proportionate basis and then from class specific expenses. Funds Management has committed through February 28, 2014 to waive fees and/or reimburse expenses to the extent necessary to cap the Fund’s expenses at 0.80% for Class A, 1.55% for Class C and 0.60% for Administrator Class.
Distribution fees
The Trust has adopted a Distribution Plan for Class C shares of the Fund pursuant to Rule 12b-1 under the 1940 Act. Distribution fees are charged to Class C and paid to Wells Fargo Funds Distributor, LLC, the principal underwriter, at an annual rate of 0.75% of its average daily net assets.
For the one month ended March 31, 2012, Wells Fargo Funds Distributor, LLC received $52,741 from the sale of Class A shares and $30 in contingent deferred sales charges from redemptions of Class C shares.
Shareholder servicing fees
The Trust has entered into contracts with one or more shareholder servicing agents, whereby each class is charged a fee at an annual rate of 0.25% of its average daily net assets.
A portion of these total shareholder servicing fees were paid to affiliates of Wells Fargo.
5. INVESTMENT TRANSACTIONS
For the one month ended March 31, 2012, the Fund made aggregate purchases and sales of $202,461,625 and $0, respectively, in its investment in Benchmark-Free Allocation Fund.
As a result of its investment in Benchmark-Free Allocation Fund, the Fund incurs purchase premium and redemption fees. These purchase premium and redemption fees are paid by the Fund to Benchmark-Free Allocation Fund to help offset estimated portfolio transaction and related costs incurred as a result of a purchase or redemption order by allocating estimated transaction costs to the purchasing or redeeming shareholder. For the one month ended March 31, 2012, the Fund was charged 0.09% for purchases and redemptions which are reflected in paid in capital. GMO reassesses these fees annually.
6. INDEMNIFICATION
Under the Trust’s organizational documents, the officers and directors are indemnified against certain liabilities that may arise out of performance of their duties to the Trust. Additionally, in the normal course of business, the Trust may enter into contracts with service providers that contain a variety of indemnification clauses. The Trust’s maximum exposure under these arrangements is dependent on future claims that may be made against the Fund and, therefore, cannot be estimated.
7. NEW ACCOUNTING PRONOUNCEMENT
In December 2011, the Financial Accounting Standards Board (“FASB”) issued Accounting Standard Update (“ASU”) No. 2011-11, Disclosures about Offsetting Assets and Liabilities. ASU 2011-11, which amends FASB ASC Topic 210 Balance Sheet, creates new disclosure requirements which require entities to disclose both gross and net information for derivatives and other financial instruments that are either offset in the Statement of Assets and Liabilities or subject to an enforceable master netting arrangement or similar agreement. The disclosure requirements are effective for interim and annual reporting periods beginning on or after January 1, 2013. Management is currently evaluating the impact of the update’s adoption on the Fund’s financial statement disclosures.
| | | | | | |
| Other Information (Unaudited) | | Wells Fargo Advantage Absolute Return Fund | | | 17 | |
PROXY VOTING INFORMATION
A description of the policies and procedures that the Fund uses to determine how to vote proxies relating to portfolio securities is available without charge, upon request, by calling 1-800-222-8222, visiting our Web site at wellsfargoadvantagefunds.com, or visiting the SEC Web site at sec.gov. Information regarding how the Fund voted proxies relating to portfolio securities during the most recent 12-month period ended June 30 will be available without charge on the Fund’s Web site at wellsfargoadvantagefunds.com or by visiting the SEC Web site at sec.gov.
PORTFOLIO HOLDINGS INFORMATION
The Fund files its complete schedule of portfolio holdings with the SEC for the first and third quarters of each fiscal year on Form N-Q, which is available without charge by visiting the SEC Web site at sec.gov. In addition, the Fund’s Form N-Q may be reviewed and copied at the SEC’s Public Reference Room in Washington, DC, and at regional offices in New York City, at 233 Broadway, and in Chicago, at 175 West Jackson Boulevard, Suite 900. Information about the Public Reference Room may be obtained by calling 1-800-SEC-0330.
| | | | |
| 18 | | Wells Fargo Advantage Absolute Return Fund | | Other Information (Unaudited) |
BOARD OF TRUSTEES
The following table provides basic information about the Board of Trustees (the “Trustees”) of the Trust and Officers of the Trust. This table should be read in conjunction with the Prospectus and the Statement of Additional Information1 of the Fund. Each of the Trustees and Officers listed below acts in identical capacities for the Wells Fargo Advantage family of funds, which consists of 137 funds comprising the Wells Fargo Funds Trust, Wells Fargo Variable Trust, Wells Fargo Master Trust and four closed-end funds (collectively the “Fund Complex”). All of the Trustees are also Members of the Audit and Governance Committees of each Trust in the Fund Complex. The mailing address of each Trustee and Officer is 525 Market Street, 12th Floor, San Francisco, CA 94105. Each Trustee and Officer serves an indefinite term, however, each Trustee serves such term until reaching the mandatory retirement age established by the Trustees.
Independent Trustees
| | | | | | |
Name and Year of Birth | | Position Held and Length of Service | | Principal Occupations During Past Five Years | | Other Directorships During
Past Five Years |
Peter G. Gordon
(Born 1942) | | Trustee, since 1998; Chairman, since 2005 (Lead Trustee since 2001) | | Co-Founder, Retired Chairman, President and CEO of Crystal Geyser Water Company. Trustee Emeritus, Colby College | | Asset Allocation Trust |
Isaiah Harris, Jr.
(Born 1952) | | Trustee, since 2009 | | Retired. Prior thereto, President and CEO of BellSouth Advertising and Publishing Corp. from 2005 to 2007, President and CEO of BellSouth Enterprises from 2004 to 2005 and President of BellSouth Consumer Services from 2000 to 2003. Emeritus member of the Iowa State University Foundation Board of Governors. Emeritus Member of the Advisory Board of Iowa State University School of Business. Mr. Harris is a certified public accountant. | | CIGNA Corporation; Deluxe Corporation; Asset Allocation Trust |
Judith M. Johnson
(Born 1949) | | Trustee, since 2008 | | Retired. Prior thereto, Chief Executive Officer and Chief Investment Officer of Minneapolis Employees Retirement Fund from 1996 to 2008. Ms. Johnson is an attorney, certified public accountant and a certified managerial accountant. | | Asset Allocation Trust |
Leroy Keith, Jr.
(Born 1939) | | Trustee, since 2010 | | Chairman, Bloc Global Services (development and construction). Trustee of the Evergreen Funds from 1983 to 2010. Former Managing Director, Almanac Capital Management (commodities firm), former Partner, Stonington Partners, Inc. (private equity fund), former Director, Obagi Medical Products Co. and former Director, Lincoln Educational Services. | | Trustee, Virtus Fund Complex (consisting of 40 portfolios as of 12/31/11); Asset Allocation Trust |
David F. Larcker
(Born 1950) | | Trustee, since 2009 | | James Irvin Miller Professor of Accounting at the Graduate School of Business, Stanford University, Director of Corporate Governance Research Program and Senior Faculty of The Rock Center for Corporate Governance since 2006. From 2005 to 2008, Professor of Accounting at the Graduate School of Business, Stanford University. Prior thereto, Ernst & Young Professor of Accounting at The Wharton School, University of Pennsylvania from 1985 to 2005. | | Asset Allocation Trust |
Olivia S. Mitchell
(Born 1953) | | Trustee, since 2006 | | International Foundation of Employee Benefit Plans Professor, Wharton School of the University of Pennsylvania since 1993. Director of Wharton’s Pension Research Council and Boettner Center on Pensions & Retirement Research, and Research Associate at the National Bureau of Economic Research. Previously, Cornell University Professor from 1978 to 1993. | | Asset Allocation Trust |
| | | | | | |
| Other Information (Unaudited) | | Wells Fargo Advantage Absolute Return Fund | | | 19 | |
| | | | | | |
Name and Year of Birth | | Position Held and Length of Service | | Principal Occupations During Past Five Years | | Other Directorships During
Past Five Years |
Timothy J. Penny
(Born 1951) | | Trustee, since 1996 | | President and CEO of Southern Minnesota Initiative Foundation, a non-profit organization, since 2007 and Senior Fellow at the Humphrey Institute Policy Forum at the University of Minnesota since 1995. Member of the Board of Trustees of NorthStar Education Finance, Inc., a non-profit organization, since 2007. | | Asset Allocation Trust |
Michael S. Scofield
(Born 1943) | | Trustee, since 2010 | | Served on the Investment Company Institute’s Board of Governors and Executive Committee from 2008-2011 as well the Governing Council of the Independent Directors Council from 2006-2011 and the Independent Directors Council Executive Committee from 2008-2011. Chairman of the IDC from 2008-2010. Institutional Investor (Fund Directions) Trustee of Year in 2007. Trustee of the Evergreen Funds (and its predecessors) from 1984 to 2010. Chairman of the Evergreen Funds from 2000-2010. Former Trustee of the Mentor Funds. Retired Attorney, Law Offices of Michael S. Scofield and former Director and Chairman, Branded Media Corporation (multi-media branding company). | | Asset Allocation Trust |
Donald C. Willeke
(Born 1940) | | Trustee, since 1996 | | Principal of the law firm of Willeke & Daniels. General Counsel of the Minneapolis Employees Retirement Fund from 1984 until its consolidation into the Minnesota Public Employees Retirement Association on June 30, 2010. Director and Vice Chair of The Free Trust (non-profit corporation). Director of the American Chestnut Foundation (non-profit corporation). | | Asset Allocation Trust |
Officers
| | | | | | |
Name and Year of Birth | | Position Held and
Length of Service | | Principal Occupations During Past Five Years | | |
Karla M. Rabusch
(Born 1959) | | President, since 2003 | | Executive Vice President of Wells Fargo Bank, N.A. and President of Wells Fargo Funds Management, LLC since 2003. Senior Vice President and Chief Administrative Officer of Wells Fargo Funds Management, LLC from 2001 to 2003. | | |
C. David Messman
(Born 1960) | | Secretary, since 2000; Chief Legal Counsel, since 2003 | | Senior Vice President and Secretary of Wells Fargo Funds Management, LLC since 2001. Vice President and Managing Senior Counsel of Wells Fargo Bank, N.A. since 1996. | | |
Kasey Phillips
(Born 1970) | | Treasurer, since 2009 | | Senior Vice President of Wells Fargo Funds Management, LLC since 2009. Senior Vice President of Evergreen Investment Management Company, LLC from 2006 to 2010. Treasurer of the Evergreen Funds from 2005 to 2010. | | |
David Berardi
(Born 1975) | | Assistant Treasurer, since 2009 | | Vice President of Wells Fargo Funds Management, LLC since 2009. Vice President of Evergreen Investment Management Company, LLC from 2008 to 2010. Assistant Vice President of Evergreen Investment Services, Inc. from 2004 to 2008. Manager of Fund Reporting and Control for Evergreen Investment Management Company, LLC from 2004 to 2010. | | |
Jeremy DePalma
(Born 1974) | | Assistant Treasurer, since 2009 | | Senior Vice President of Wells Fargo Funds Management, LLC since 2009. Senior Vice President of Evergreen Investment Management Company, LLC from 2008 to 2010. Vice President, Evergreen Investment Services, Inc. from 2004 to 2007. Head of the Fund Reporting and Control Team within Fund Administration from 2005 to 2010. | | |
Debra Ann Early
(Born 1964) | | Chief Compliance Officer, since 2007 | | Chief Compliance Officer of Wells Fargo Funds Management, LLC since 2007. Chief Compliance Officer of Parnassus Investments from 2005 to 2007. Chief Financial Officer of Parnassus Investments from 2004 to 2007 and Senior Audit Manager of PricewaterhouseCoopers LLP from 1998 to 2004. | | |
| 1. | The Statement of Additional Information includes additional information about the Trustees and is available, without charge, upon request, by calling 1-800-222-8222 or by visiting the Web site at wellsfargoadvantagefunds.com. |
| | | | |
| 20 | | Wells Fargo Advantage Absolute Return Fund | | Other Information (Unaudited) |
BOARD CONSIDERATION OF INVESTMENT MANAGEMENT AGREEMENT:
Under Section 15 of the Investment Company Act of 1940 (the “1940 Act”), the Board of Trustees (the “Board”) of Wells Fargo Funds Trust (the “Trust”), all the members of which have no direct or indirect interest in the investment advisory agreement and are not “interested persons” of the Trust, as defined in the 1940 Act (the “Independent Trustees”), must determine whether to approve the investment advisory agreement for any new fund of the Trust. In this regard, at an in-person meeting held on November 15-16, 2011 (the “Meeting”), the Board reviewed and approved an investment management agreement with Wells Fargo Funds Management, LLC (“Funds Management”) for the Wells Fargo Advantage Absolute Return Fund (the “Fund”) (the “Investment Management Agreement”).
The Fund is a gateway feeder fund that invests substantially all of its assets in the GMO Benchmark-Free Allocation Fund (the “GMO Fund”), a series of GMO Trust that is managed by Grantham Mayo Van Otterloo & Co. LLC. The Fund has a substantially similar investment objective and substantially similar investment strategies to the GMO Fund.
At the Meeting, the Board considered the factors and reached the conclusions described below relating to selecting Funds Management and entering into the Investment Management Agreement. Prior to the Meeting, including at an in-person Board meeting in August 2011, the Trustees conferred extensively among themselves and with representatives of Funds Management about these matters. The Independent Trustees were assisted in their evaluation of the Investment Management Agreement by independent legal counsel, from whom they received separate legal advice and with whom they met separately from Funds Management.
In providing information to the Board, Funds Management was guided by a detailed set of requests previously submitted by the Independent Trustees’ independent legal counsel on their behalf at the start of the Board’s annual contract renewal process earlier in 2011. In approving the Investment Management Agreement, the Board did not identify any particular information or consideration that was all-important or controlling, and each Trustee likely attributed different weights to various factors.
Nature, extent and quality of services
The Board received and considered various information regarding the nature, extent and quality of services to be provided to the Fund by Funds Management under the Investment Management Agreement. In this regard, the Board was advised that, in light of the gateway feeder nature of the Fund, the scope of services under the Investment Management Agreement would include various responsibilities related to the oversight of the GMO Fund and its performance and investment management activities, as well as fund-level administrative services typically provided by Funds Management under a separate administration agreement for which Funds Management typically charges a separate fee. Funds Management provided a comprehensive description of the various advisory and administrative responsibilities and services that would be provided under the Investment Management Agreement.
The Board received and considered, among other things, information about the background and experience of senior management of Funds Management. The Board evaluated the ability of Funds Management, based on Funds Management’s financial condition, resources, reputation and other attributes, to attract and retain qualified investment professionals, including research, advisory and supervisory personnel. The Board further considered the compliance program and compliance record of Funds Management.
The Board’s decision to approve the Investment Management Agreement was based on a comprehensive evaluation of all of the information provided to it. In considering these matters, the Board considered not only the specific information presented in connection with the Meeting and the August 2011 meeting and in connection with the contract renewal process earlier in 2011, but also the knowledge gained over time through interaction with Funds Management about various topics, such as Funds Management’s oversight of service providers. The above factors, together with those referenced below, are some of the most important, but not necessarily all, factors considered by the Board in concluding that the nature, extent and quality of the investment advisory and administrative services anticipated to be provided by Funds Management support the approval of the Investment Management Agreement.
Fund performance and expense structure
The Board acknowledged that the Fund is newly formed and has no performance record. The Board, however, took note of the performance of the GMO Fund in which the Fund will invest substantially all of its assets. The Board considered the anticipated expense ratios for the Fund, including the expense ratio of the GMO Fund. The Board also took note of the
| | | | | | |
| Other Information (Unaudited) | | Wells Fargo Advantage Absolute Return Fund | | | 21 | |
expertise of Funds Management in identifying, analyzing and evaluating various performance metrics, which would be among its duties under the proposed Investment Management Agreement.
The Board also reviewed the fee rate payable to Funds Management under the Investment Management Agreement, as well as the combined fee rate including the advisory fees payable by the GMO Fund, relative to an Expense Group (as discussed below). They noted that the proposed fee rates that they were being asked to approve at the Meeting were lower, and that the scope of services was greater, than those that had been previewed with the Board at the August 2011 meeting.
Based on the above-referenced considerations and other factors, the Board concluded that the overall performance and expense structure supported the approval of the Investment Management Agreement.
Investment advisory fee rates
The Board reviewed and considered the contractual investment advisory fee rates that would be payable by the Fund to Funds Management for investment advisory and fund-level administrative services (the “Investment Management Agreement Rates”).
The Board received and considered information regarding the proposed Investment Management Agreement Rates and gross and net operating expense ratios and their various components, including actual management fees (which reflect fee waivers, if any), transfer agent, custodian and other non-management fees, Rule 12b-1 and non-Rule 12b-1 fees, service fees and fee waiver and expense reimbursement arrangements at both the Fund level and the GMO Fund level. The Board also considered these ratios in comparison to the median ratios of an expense universe and expense group of relevant funds (collectively, the “Expense Group”) that was selected by Lipper Inc. (“Lipper”), an independent provider of investment company data. The Board received a description of the methodology used by Lipper to select the Expense Group.
The Board determined that the Investment Management Agreement Rates were reasonable in light of the Expense Group information, the net expense ratio commitments, the services covered by the Investment Management Agreement, including the fund-level administrative services, and other information provided.
Profitability
As part of the annual contract review process earlier in 2011, the Board had received and considered a detailed profitability analysis of Funds Management, as well as an analysis of the profitability to the collective Wells Fargo businesses that would be involved in the provision of services to the Fund. Because the Fund is new, the Board considered that any information provided to it with respect to the Fund would necessarily be estimated and speculative and, accordingly, concluded that profitability information with respect to the Fund was not necessary for it to evaluate the appropriateness of the Fund’s proposed Investment Management Agreement Rates. It noted that the levels of profitability previously reported on a fund-by-fund basis varied widely, depending on, among other things, the size and type of fund, and that it had previously concluded that the overall profitability to Funds Management and the collective Wells Fargo businesses was not unreasonable. It further noted that it would have an opportunity to review actual profitability earned by Funds Management from the Fund in the context of future annual contract renewals.
Economies of scale
With respect to potential future economies of scale, the Board reviewed the proposed breakpoints in the Investment Management Agreement Rates, which would operate to reduce the effective Investment Management Agreement Rate as a percentage of Fund assets as the Fund grows in size. The Board noted that it would have opportunities to review the appropriate levels of breakpoints in the future, and concluded that the breakpoints as proposed appeared to be a reasonable step toward sharing economies of scale, if any, with the Fund. However, the Board acknowledged the inherent limitations of any analysis of an investment adviser’s economies of scale and of any attempt to correlate breakpoints with such economies, stemming largely from the Board’s understanding that economies of scale are realized, if at all, by an investment adviser across a variety of products and services, not just with respect to a single fund.
Other benefits to Funds Management
The Board received and considered information regarding potential “fall-out” or ancillary benefits to be received by Funds Management and its affiliates as a result of their proposed relationships with the Fund. Ancillary benefits could include, among others, benefits directly attributable to the relationship of Funds Management with the Fund and
| | | | |
| 22 | | Wells Fargo Advantage Absolute Return Fund | | Other Information (Unaudited) |
benefits potentially derived from an increase in Funds Management’s business as a result of its relationship with the Fund (such as the ability to market to shareholders other financial products offered by Funds Management and its affiliates).
The Board considered that Wells Fargo Funds Distributor, LLC, an affiliate of Funds Management, would serve as distributor to the Fund and would receive certain compensation for those services. The Board also noted that various financial institutions, including affiliates of Funds Management that hold fund shares in omnibus accounts, would be entitled to receive sub-transfer agency fees from the Fund. The Board also considered that these entities may receive distribution-related fees and shareholder servicing payments (including amounts derived from payments under Rule 12b-1 plans) in respect of shares sold or held through them.
Conclusion
After considering the above-described factors and based on its deliberations and its evaluation of the information described above, the Board unanimously approved entering into the Investment Management Agreement for an initial two-year period.
| | | | | | |
| List of Abbreviations | | Wells Fargo Advantage Absolute Return Fund | | | 23 | |
The following is a list of common abbreviations for terms and entities which may have appeared in this report.
| ACB | — Agricultural Credit Bank |
| ADR | — American Depository Receipt |
| ADS | — American Depository Shares |
| AGC-ICC | — Assured Guaranty Corporation - Insured Custody Certificates |
| AGM | — Assured Guaranty Municipal |
| AMBAC | — American Municipal Bond Assurance Corporation |
| AMT | — Alternative Minimum Tax |
| BAN | — Bond Anticipation Notes |
| BHAC | — Berkshire Hathaway Assurance Corporation |
| CAB | — Capital Appreciation Bond |
| CCAB | — Convertible Capital Appreciation Bond |
| CDA | — Community Development Authority |
| CDO | — Collateralized Debt Obligation |
| COP | — Certificate of Participation |
| DRIVER | — Derivative Inverse Tax-Exempt Receipts |
| DW&P | — Department of Water & Power |
| DWR | — Department of Water Resources |
| ECFA | — Educational & Cultural Facilities Authority |
| EDA | — Economic Development Authority |
| EDFA | — Economic Development Finance Authority |
| ETF | — Exchange-Traded Fund |
| FFCB | — Federal Farm Credit Bank |
| FGIC | — Financial Guaranty Insurance Corporation |
| FHA | — Federal Housing Authority |
| FHLB | — Federal Home Loan Bank |
| FHLMC | — Federal Home Loan Mortgage Corporation |
| FICO | — The Financing Corporation |
| FNMA | — Federal National Mortgage Association |
| GDR | — Global Depository Receipt |
| GNMA | — Government National Mortgage Association |
| HCFR | — Healthcare Facilities Revenue |
| HEFA | — Health & Educational Facilities Authority |
| HEFAR | — Higher Education Facilities Authority Revenue |
| HFA | — Housing Finance Authority |
| HFFA | — Health Facilities Financing Authority |
| IBC | — Insured Bond Certificate |
| IDA | — Industrial Development Authority |
| IDAG | — Industrial Development Agency |
| IDR | — Industrial Development Revenue |
| KRW | — Republic of Korea Won |
| LIBOR | — London Interbank Offered Rate |
| LLC | — Limited Liability Company |
| LLP | — Limited Liability Partnership |
| MBIA | — Municipal Bond Insurance Association |
| MFHR | — Multi-Family Housing Revenue |
| MSTR | — Municipal Securities Trust Receipts |
| MUD | — Municipal Utility District |
| NATL-RE | — National Public Finance Guarantee Corporation |
| PCFA | — Pollution Control Finance Authority |
| PCR | — Pollution Control Revenue |
| PFA | — Public Finance Authority |
| PFFA | — Public Facilities Financing Authority |
| PFOTER | — Puttable Floating Option Tax-Exempt Receipts |
| plc | — Public Limited Company |
| PUTTER | — Puttable Tax-Exempt Receipts |
| R&D | — Research & Development |
| RDA | — Redevelopment Authority |
| RDFA | — Redevelopment Finance Authority |
| REIT | — Real Estate Investment Trust |
| ROC | — Reset Option Certificates |
| SAVRS | — Select Auction Variable Rate Securities |
| SBA | — Small Business Authority |
| SFHR | — Single Family Housing Revenue |
| SFMR | — Single Family Mortgage Revenue |
| SPDR | — Standard & Poor’s Depositary Receipts |
| STRIPS | — Separate Trading of Registered Interest and Principal Securities |
| TAN | — Tax Anticipation Notes |
| TIPS | — Treasury Inflation-Protected Securities |
| TRAN | — Tax Revenue Anticipation Notes |
| TCR | — Transferable Custody Receipts |
| TTFA | — Transportation Trust Fund Authority |
| TVA | — Tennessee Valley Authority |
| XLCA | — XL Capital Assurance |
This page is intentionally left blank.
APPENDIX
A-1
APPENDIX
GMO Benchmark-Free Allocation Fund
(A Series of GMO Trust)
Schedule of Investments
(showing percentage of total net assets)
March 31, 2012 (Unaudited)
| | | | | | | | | | |
Par Value ($) /
Shares | | | Description | | Value ($) | |
| | | | | | | | | | |
| | | | | | MUTUAL FUNDS — 100.0% | |
| | |
| | | | | | Affiliated Issuers — 100.0% | |
| | | 3,115,991 | | | GMO Alpha Only Fund, Class IV | | | 75,313,502 | |
| | | 328,194 | | | GMO Alternative Asset Opportunity Fund | | | 9,878,626 | |
| | | 528,883 | | | GMO Debt Opportunities Fund, Class VI | | | 13,433,638 | |
| | | 751,097 | | | GMO Emerging Country Debt Fund, Class IV | | | 7,233,067 | |
| | | 1,032,526 | | | GMO Emerging Markets Fund, Class VI | | | 12,059,909 | |
| | | 1,390,749 | | | GMO Flexible Equities Fund, Class VI | | | 26,938,798 | |
| | | 20,470,202 | | | GMO Implementation Fund | | | 207,158,447 | |
| | | 639,008 | | | GMO Special Situations Fund, Class VI | | | 17,119,030 | |
| | | 771,777 | | | GMO Strategic Fixed Income Fund, Class VI | | | 12,695,727 | |
| | | | | | | | | | |
| | | |
| | | | | | TOTAL MUTUAL FUNDS (COST $389,394,942) | | | 381,830,744 | |
| | | | | | | | | | |
| | |
| | | | | | DEBT OBLIGATIONS — 0.0% | |
| | |
| | | | | | Asset-Backed Securities — 0.0% | |
| | | | | | CMBS Collateralized Debt Obligations — 0.0% | |
| | | 1,599,399 | | | American Capital Strategies Ltd. Commercial Real Estate CDO Trust, Series 07-1A, Class A, 144A, 3 mo. LIBOR + .80%, 1.29%, due 11/23/52 | | | 3,999 | |
| | | | | | | | | | |
| | |
| | | | | | Insured Other — 0.0% | |
| | | 2,500,000 | | | Toll Road Investment Part II, Series C, 144A, MBIA, Zero Coupon, due 02/15/37 | | | 160,625 | |
| | | | | | | | | | |
| | | | | | Total Asset-Backed Securities | | | 164,624 | |
| | | | | | | | | | |
| | | |
| | | | | | TOTAL DEBT OBLIGATIONS (COST $599,937) | | | 164,624 | |
| | | | | | | | | | |
A-2
APPENDIX
GMO Benchmark-Free Allocation Fund
(A Series of GMO Trust)
Schedule of Investments — (Continued)
(showing percentage of total net assets)
March 31, 2012 (Unaudited)
| | | | | | | | | | |
Shares | | | Description | | Value ($) | |
| | | | | | | | | | |
| | | | | | SHORT-TERM INVESTMENTS — 0.0% | |
| | |
| | | | | | Money Market Funds — 0.0% | |
| | | 27,051 | | | State Street Institutional Treasury Money Market Fund-Institutional
Class, 0.00% (a) | | | 27,051 | |
| | | | | | | | | | |
| | | |
| | | | | | TOTAL SHORT-TERM INVESTMENTS (COST $27,051) | | | 27,051 | |
| | | | | | | | | | |
| | | |
| | | | | | TOTAL INVESTMENTS — 100.0%
(Cost $390,021,930) | | | 382,022,419 | |
| | | | | | Other Assets and Liabilities (net) — (0.0%) | | | (173,677 | ) |
| | | | | | | | | | |
| | | |
| | | | | | TOTAL NET ASSETS — 100.0% | | | $381,848,742 | |
| | | | | | | | | | |
Notes to Schedule of Investments:
144A - Securities exempt from registration under Rule 144A of the Securities Act of 1933. These securities may be resold in transactions exempt from registration, normally to qualified institutional investors.
CDO - Collateralized Debt Obligation
CMBS - Commercial Mortgage Backed Security
LIBOR - London Interbank Offered Rate
MBIA - Insured as to the payment of principal and interest by MBIA Insurance Corp.
| (a) | The rate disclosed is the 7 day net yield as of March 31, 2012. Note: Yield rounds to 0.00%. |
A-3
APPENDIX
GMO Benchmark-Free Allocation Fund
(A Series of GMO Trust)
Statement of Assets and Liabilities — March 31, 2012 (Unaudited)
| | | | |
Assets: | | | | |
Investments in affiliated issuers, at value (cost $389,394,942) | | $ | 381,830,744 | |
Investments in unaffiliated issuers, at value (cost $626,988) | | | 191,675 | |
Interest receivable | | | 2,125 | |
Receivable for expenses reimbursed by the Manager | | | 10,042 | |
| | | | |
Total assets | | | 382,034,586 | |
| | | | |
Liabilities: | | | | |
Payable to affiliate for: | | | | |
Management fee | | | 79,702 | |
Shareholder service fee | | | 9,933 | |
Trustees and Trust Officers or agents unaffiliated with the Manager | | | 741 | |
Accrued expenses | | | 95,468 | |
| | | | |
Total liabilities | | | 185,844 | |
| | | | |
Net assets | | $ | 381,848,742 | |
| | | | |
Net assets consist of: | | | | |
Paid-in capital | | $ | 439,319,508 | |
Accumulated undistributed net investment income | | | 2,043,535 | |
Accumulated net realized loss | | | (51,514,790 | ) |
Net unrealized depreciation | | | (7,999,511 | ) |
| | | | |
| | $ | 381,848,742 | |
| | | | |
Net assets attributable to: | | | | |
Class III shares | | $ | 185,462,255 | |
| | | | |
Class MF shares | | $ | 196,386,487 | |
| | | | |
Shares outstanding: | | | | |
Class III | | | 7,641,989 | |
| | | | |
Class MF | | | 8,093,812 | |
| | | | |
Net asset value per share: | | | | |
Class III | | $ | 24.27 | |
| | | | |
Class MF | | $ | 24.26 | |
| | | | |
A-4


FOR MORE INFORMATION
More information about Wells Fargo Advantage Funds is available free upon request. To obtain literature, please write, e-mail, visit the Fund’s Web site, or call:
Wells Fargo Advantage Funds
P.O. Box 8266
Boston, MA 02266-8266
E-mail: wfaf@wellsfargo.com
Web site: wellsfargoadvantagefunds.com
Individual investors: 1-800-222-8222
Retail investment professionals: 1-888-877-9275
Institutional investment professionals: 1-866-765-0778
This report and the financial statements contained herein are submitted for the general information of the shareholders of Wells Fargo Advantage Funds. If this report is used for promotional purposes, distribution of the report must be accompanied or preceded by a current prospectus. For a prospectus containing more complete information, including charges and expenses, call 1-800-222-8222 or visit the Fund’s Web site at wellsfargoadvantagefunds.com. Please consider the investment objectives, risks, charges, and expenses of the investment carefully before investing. This and other information about Wells Fargo Advantage Funds can be found in the current prospectus. Read the prospectus carefully before you invest or send money.
Wells Fargo Funds Management, LLC, a wholly owned subsidiary of Wells Fargo & Company, provides investment advisory and administrative services for Wells Fargo Advantage Funds. Other affiliates of Wells Fargo & Company provide subadvisory and other services for the Funds. The Funds are distributed by Wells Fargo Funds Distributor, LLC, Member FINRA/SIPC, an affiliate of Wells Fargo & Company.
NOT FDIC INSURED ¡ NO BANK GUARANTEE ¡ MAY LOSE VALUE
© 2012 Wells Fargo Funds Management, LLC. All rights reserved.
| | |
 | | 208982 05-12 SA260/SAR260 3-12 |

Wells Fargo Advantage Asset Allocation Fund

Semi-Annual Report
March 31, 2012

Reduce clutter. Save trees.
Sign up for electronic delivery of prospectuses and shareholder reports at www.wellsfargo.com/advantagedelivery
Contents
The views expressed and any forward-looking statements are as of March 31, 2012, unless otherwise noted, and are those of the Fund managers and/or Wells Fargo Funds Management, LLC. Discussions of individual securities, or the markets generally, or any Wells Fargo Advantage Fund are not intended as individual recommendations. Future events or results may vary significantly from those expressed in any forward-looking statements; the views expressed are subject to change at any time in response to changing circumstances in the market. Wells Fargo Funds Management, LLC, disclaims any obligation to publicly update or revise any views expressed or forward-looking statements.
NOT FDIC INSURED ¡ NO BANK GUARANTEE ¡ MAY LOSE VALUE

WELLS FARGO INVESTMENT HISTORY
| | |
| |
| 1932 | | Keystone creates one of the first mutual fund families. |
| |
| 1971 | | Wells Fargo & Company introduces one of the first institutional index funds. |
| |
| 1978 | | Wells Fargo applies Markowitz and Sharpe’s research on Modern Portfolio Theory to introduce one of the industry’s first Tactical Asset Allocation (TAA) models in institutional separately managed accounts. |
| |
| 1984 | | Wells Fargo Stagecoach Funds launches its first asset allocation fund. |
| |
| 1989 | | The Tactical Asset Allocation (TAA) Model is first applied to Wells Fargo’s asset allocation mutual funds. |
| |
| 1994 | | Wells Fargo introduces the LifePath Funds, one of the first suites of target date funds (now the Wells Fargo Advantage Dow Jones Target Date FundsSM). |
| |
| 1996 | | Evergreen Investments and Keystone Funds merge. |
| |
| 1997 | | Wells Fargo launches Wells Fargo Advantage WealthBuilder PortfoliosSM, a fund-of-funds suite of products that includes the use of quantitative models to shift assets among investment styles. |
| |
| 1999 | | Norwest Advantage Funds and Stagecoach Funds are reorganized into Wells Fargo Funds after the merger of Norwest and Wells Fargo. |
| |
| 2002 | | Evergreen Retail and Evergreen Institutional companies form the umbrella asset management company, Evergreen Investments. |
| |
| 2005 | | The integration of Strong Funds with Wells Fargo Funds creates Wells Fargo Advantage Funds, resulting in one of the top 20 mutual fund companies in the United States. |
| |
| 2006 | | Wells Fargo Advantage Funds relaunches the target date product line as Wells Fargo Advantage Dow Jones Target Date Funds. |
| |
| 2010 | | The mergers and reorganizations of Evergreen and Wells Fargo Advantage mutual funds are completed, unifying the families under the brand of Wells Fargo Advantage Funds. |
Wells Fargo Advantage Funds®
Wells Fargo Advantage Funds skillfully guides institutions, financial advisors, and individuals through the investment terrain to help them reach their financial objectives. Everything we do on behalf of investors is backed by our unique combination of qualifications.
Strength
Our organization is built on the standards of integrity and service established by our parent company—Wells Fargo & Company—more than 150 years ago. And, because we’re part of a highly diversified financial enterprise, we offer the depth of resources to help investors succeed.
Expertise
Our multi-boutique model offers investors access to the independent thinking of premier investment managers that have been chosen for their time-tested strategies. While each team specializes in a specific investment strategy, collectively they provide investors a wide choice of distinct investment styles. Our dedication to investment excellence doesn’t end with our expertise in manager selection—risk management, analysis, and rigorous ongoing review seek to ensure each manager’s investment process remains consistent.
Partnership
Our collaborative approach is built around understanding the needs and goals of our clients. By adhering to core principles of sound judgment and steady guidance, we support you through every stage of the investment decision process.
Carefully consider a fund’s investment objectives, risks, charges, and expenses before investing. For a current prospectus and, if available, a summary prospectus, containing this and other information, visit wellsfargoadvantagefunds.com. Read it carefully before investing.
Wells Fargo Funds Management, LLC, a wholly owned subsidiary of Wells Fargo & Company, provides investment advisory and administrative services for Wells Fargo Advantage Funds®. Other affiliates of Wells Fargo & Company provide subadvisory and other services for the Funds. The Funds are distributed by Wells Fargo Funds Distributor, LLC, Member FINRA/SIPC, an affiliate of Wells Fargo & Company.
“Dow Jones®” and “Dow Jones Target Date IndexesSM” are service marks of Dow Jones Trademark Holdings, LLC (“Dow Jones”), have been licensed to CME Group Index Services LLC (“CME Indexes”) and have been sublicensed for use for certain purposes by Global Index Advisors, Inc, and Wells Fargo Funds Management, LLC. The Wells Fargo Advantage Dow Jones Target Date FundsSM based on the Dow Jones Target Date IndexesSM, are not sponsored, endorsed, sold or promoted by Dow Jones, CME Indexes or their respective affiliates and none of them makes any representation regarding the advisability of investing in such product(s).
NOT FDIC INSURED ¡ NO BANK GUARANTEE ¡ MAY LOSE VALUE
Not part of the semi-annual report.
Wells Fargo Advantage Funds offers more than 110 mutual funds across a wide range of asset classes, representing over $213 billion in assets under management, as of March 31, 2012.
| | | | |
| Equity Funds | | | | |
Asia Pacific Fund | | Equity Value Fund | | Precious Metals Fund |
C&B Large Cap Value Fund | | Global Opportunities Fund | | Premier Large Company Growth Fund |
C&B Mid Cap Value Fund | | Growth Fund | | Small Cap Opportunities Fund |
Capital Growth Fund | | Index Fund | | Small Cap Value Fund |
Common Stock Fund | | International Equity Fund | | Small Company Growth Fund |
Disciplined U.S. Core Fund | | International Value Fund | | Small Company Value Fund |
Discovery Fund† | | Intrinsic Small Cap Value Fund | | Small/Mid Cap Core Fund |
Diversified Equity Fund | | Intrinsic Value Fund | | Small/Mid Cap Value Fund |
Diversified International Fund | | Intrinsic World Equity Fund | | Special Mid Cap Value Fund |
Diversified Small Cap Fund | | Large Cap Core Fund | | Special Small Cap Value Fund |
Emerging Growth Fund | | Large Cap Growth Fund | | Specialized Technology Fund |
Emerging Markets Equity Fund | | Large Company Value Fund | | Strategic Large Cap Growth Fund |
Endeavor Select Fund† | | Omega Growth Fund | | Traditional Small Cap Growth Fund |
Enterprise Fund† | | Opportunity Fund† | | Utility and Telecommunications Fund |
| Bond Funds | | | | |
Adjustable Rate Government Fund | | Inflation-Protected Bond Fund | | Short-Term Bond Fund |
California Limited-Term Tax-Free Fund | | Intermediate Tax/AMT-Free Fund | | Short-Term High Yield Bond Fund |
California Tax-Free Fund | | International Bond Fund | | Short-Term Municipal Bond Fund |
Colorado Tax-Free Fund | | Minnesota Tax-Free Fund | | Strategic Municipal Bond Fund |
Government Securities Fund | | Municipal Bond Fund | | Total Return Bond Fund |
High Income Fund | | North Carolina Tax-Free Fund | | Ultra Short-Term Income Fund |
High Yield Bond Fund | | Pennsylvania Tax-Free Fund | | Ultra Short-Term Municipal Income Fund |
Income Plus Fund | | Short Duration Government Bond Fund | | Wisconsin Tax-Free Fund |
| Asset Allocation Funds | | | | |
Absolute Return Fund | | WealthBuilder Equity Portfolio† | | Target 2020 Fund† |
Asset Allocation Fund | | WealthBuilder Growth Allocation Portfolio† | | Target 2025 Fund† |
Conservative Allocation Fund | | WealthBuilder Growth Balanced Portfolio† | | Target 2030 Fund† |
Diversified Capital Builder Fund | | WealthBuilder Moderate Balanced Portfolio† | | Target 2035 Fund† |
Diversified Income Builder Fund | | WealthBuilder Tactical Equity Portfolio† | | Target 2040 Fund† |
Growth Balanced Fund | | Target Today Fund† | | Target 2045 Fund† |
Index Asset Allocation Fund | | Target 2010 Fund† | | Target 2050 Fund† |
Moderate Balanced Fund | | Target 2015 Fund† | | Target 2055 Fund† |
WealthBuilder Conservative Allocation Portfolio† | | | | |
| Money Market Funds | | | | |
100% Treasury Money Market Fund | | Heritage Money Market Fund† | | National Tax-Free Money Market Fund |
California Municipal Money Market Fund | | Money Market Fund | | Prime Investment Money Market Fund |
Cash Investment Money Market Fund | | Municipal Cash Management Money Market Fund | | Treasury Plus Money Market Fund |
Government Money Market Fund | | Municipal Money Market Fund | | |
| Variable Trust Funds1 | | | | |
VT Discovery Fund† | | VT Intrinsic Value Fund | | VT Small Cap Growth Fund |
VT Index Asset Allocation Fund | | VT Omega Growth Fund | | VT Small Cap Value Fund |
VT International Equity Fund | | VT Opportunity Fund† | | VT Total Return Bond Fund |
An investment in a money market fund is not insured or guaranteed by the Federal Deposit Insurance Corporation or any other government agency. Although the Wells Fargo Advantage Money Market Funds seek to preserve the value of your investment at $1.00 per share, it is possible to lose money by investing in a money market fund.
| 1. | The Variable Trust Funds are generally available only through insurance company variable contracts. |
| † | In this report, the Wells Fargo Advantage Discovery FundSM, Wells Fargo Advantage Endeavor Select FundSM, Wells Fargo Advantage Enterprise FundSM, Wells Fargo Advantage Opportunity FundSM, Wells Fargo Advantage WealthBuilder Conservative Allocation PortfolioSM, Wells Fargo Advantage WealthBuilder Equity PortfolioSM, Wells Fargo Advantage WealthBuilder Growth Allocation PortfolioSM, Wells Fargo Advantage WealthBuilder Growth Balanced PortfolioSM, Wells Fargo Advantage WealthBuilder Moderate Balanced PortfolioSM, Wells Fargo Advantage WealthBuilder Tactical Equity PortfolioSM, Wells Fargo Advantage Dow Jones Target Today FundSM, Wells Fargo Advantage Dow Jones Target 2010 FundSM, Wells Fargo Advantage Dow Jones Target 2015 FundSM, Wells Fargo Advantage Dow Jones Target 2020 FundSM, Wells Fargo Advantage Dow Jones Target 2025 FundSM, Wells Fargo Advantage Dow Jones Target 2030 FundSM, Wells Fargo Advantage Dow Jones Target 2035 FundSM, Wells Fargo Advantage Dow Jones Target 2040 FundSM, Wells Fargo Advantage Dow Jones Target 2045 FundSM, Wells Fargo Advantage Dow Jones Target 2050 FundSM, Wells Fargo Advantage Dow Jones Target 2055 FundSM, Wells Fargo Advantage Heritage Money Market FundSM, Wells Fargo Advantage VT Discovery FundSM, and Wells Fargo Advantage VT Opportunity FundSM are referred to as the Discovery Fund, Endeavor Select Fund, Enterprise Fund, Opportunity Fund, WealthBuilder Conservative Allocation Portfolio, WealthBuilder Equity Portfolio, WealthBuilder Growth Allocation Portfolio, WealthBuilder Growth Balanced Portfolio, WealthBuilder Moderate Balanced Portfolio, WealthBuilder Tactical Equity Portfolio, Target Today Fund, Target 2010 Fund, Target 2015 Fund, Target 2020 Fund, Target 2025 Fund, Target 2030 Fund, Target 2035 Fund, Target 2040 Fund, Target 2045 Fund, Target 2050 Fund, Target 2055 Fund, Heritage Money Market Fund, VT Discovery Fund, and VT Opportunity Fund, respectively. |
Not part of the semi-annual report.
| | | | |
| 2 | | Wells Fargo Advantage Asset Allocation Fund | | Letter to Shareholders |

Karla M. Rabusch,
President
Wells Fargo Advantage Funds
The financial markets throughout most of the past six months may best be described as a risk-on/risk-off trading environment in response to the uncertainty about the sustainability of the U.S. economic recovery, ongoing concerns about the Greek debt crisis, and the overall health of the eurozone.
After struggling in the early part of the six-month period, most equity markets rallied to post extraordinary total returns on the whole. In fact, most of the major U.S. equity indexes realized the strongest first-quarter performance in over 10 years during the first three months of 2012.
Dear Valued Shareholder:
We’re pleased to offer you this semi-annual report for the Wells Fargo Advantage Asset Allocation Fund for the six-month period that ended March 31, 2012.
The financial markets throughout most of the past six months may best be described as a risk-on/risk-off trading environment in response to the uncertainty about the sustainability of the U.S. economic recovery, ongoing concerns about the Greek debt crisis, and the overall health of the eurozone. When volatility and uncertainty were high, investors sold risky assets such as high-beta1 equities, commodities, emerging markets securities, and high-yield bonds, in preference for the relative safety of U.S. Treasuries. In periods of low volatility, investor risk tolerance sharply rose, and the markets sought out the higher yield and return potential of those riskier investments.
During the first quarter of 2012, investor sentiment appeared to be more positive and balanced. This recent shift in sentiment was the result of improvement in the global macroeconomic backdrop, which contributed to a less volatile market environment and more stable consensus earnings growth outlook. These developments also encouraged investors to refocus on underlying fundamentals and a longer-term investment perspective, which may have sparked the first-quarter equity rally led by stocks and sectors that were shunned at points in 2011, notably retail and higher-growth technology names. In addition, as investors’ risk tolerance increased during the period, corporate bonds, including high-yield bonds, were favored over the relative safety and lower yields offered by U.S. Treasuries.
After struggling in the early part of the six-month period, most equity markets rallied to post extraordinary total returns on the whole. In fact, most of the major U.S. equity indexes realized the strongest first-quarter performance in over 10 years during the first three months of 2012.
During the six-month period, the S&P 500 Index2 and the Russell 3000® Index3 posted returns of 25.89% and 26.55%, respectively, while the Barclays U.S. Aggregate Bond Index4, representing the universe of investment-grade U.S. bonds, posted a total return of 1.43%. By comparison, the Barclays U.S. Treasury Index5 and Barclays 20+ Year U.S. Treasury Index6 returned (0.41)% and (5.02)%, respectively, while the Barclays U.S. Corporate High Yield Bond Index7 added 12.14% during the period.
On the international front, the MSCI EAFE Index8 returned 13.12% during the six-month period, while the BofA Merrill Lynch Global Broad Market Ex. U.S. Index9, representative of the international investment-grade bond market, returned 0.78%.
The developed global economies regained some momentum during the period.
Most global economies modestly improved during the six-month period, but their paths were uneven, primarily due to persistently sluggish jobs growth and a flat housing market affecting the U.S. and the ongoing sovereign debt concerns impacting the eurozone.
The U.S. Bureau of Economic Analysis reported that U.S. gross domestic product (GDP) expanded to an annual growth rate of 1.8% in the third quarter of 2011, re-igniting hopes of a sustainable economic recovery. Those hopes were buoyed
| | | | | | |
| Letter to Shareholders | | Wells Fargo Advantage Asset Allocation Fund | | | 3 | |
further by the final estimate of fourth-quarter of 2011 GDP, which showed that growth accelerated to a 3.0% annual rate. While few economists now believe that the U.S. economy is in danger of sliding back into recession, many continue to expect a tepid economic growth environment in 2012.
Within the eurozone, GDP grew at an annualized rate of 1.5% for 2011, which was modestly weaker from a year earlier when eurozone GDP was reported at an annualized rate of 2.0% in the fourth quarter of 2010. Considering the fiscal challenges that faced European countries throughout 2011—stemming, primarily, from the reemergence of the Greek debt crisis—most economists had expected weaker economic conditions in 2011. While several steps have been taken by the International Monetary Fund and the European Central Bank (ECB) to address the ongoing fiscal challenges in Europe, economic conditions of many countries in the eurozone are likely to remain weak throughout 2012.
Central banks across the globe remain committed to accommodative policies.
With inflation in check, the U.S. Federal Reserve (Fed) held its target range for the federal funds rate—a proxy for short-term interest rates—steady at 0% to 0.25%. Last summer, the Federal Open Market Committee (FOMC) issued a statement explaining that economic conditions were likely to warrant exceptionally low levels for the federal funds rate through at least mid-2013—a timetable that was later revised to late 2014 following the FOMC meeting on January 25, 2012.
The ECB also continued to maintain an accommodative monetary policy throughout the period, primarily in efforts to stave off the contagion risk stemming from the ongoing concerns about the potential of Greece defaulting on its sovereign bonds. Fortunately, Greece received another bailout and was able to restructure its outstanding debt in February 2012, which alleviated near-term contagion risks and the possibility of the euro collapsing. However, the agreement does not fully address longer-term structural issues that affect not only Greece, but several other countries across the eurozone. Recognizing the drag the persistent sovereign debt crisis has had on financial stability across the eurozone, the ECB-introduced additional liquidity into the European banking system through its long-term refinancing operations (LTRO). The LTRO program
| 1. | Beta measures fund volatility relative to general market movements. It is a standardized measure of systematic risk in comparison to a specified index. The benchmark beta is 1.00 by definition. Beta is based on historical performance and does not represent future results. |
| 2. | The S&P 500 Index consists of 500 stocks chosen for market size, liquidity, and industry group representation. It is a market-value weighted index with each stock’s weight in the index proportionate to its market value. You cannot invest directly in an index. |
| 3. | The Russell 3000® Index measures the performance of the 3,000 largest U.S. companies based on total market capitalization, which represents approximately 98% of the investable U.S. equity market. You cannot invest directly in an index. |
| 4. | The Barclays U.S. Aggregate Bond Index is composed of the Barclays Government/Credit Index and the Mortgage-Backed Securities Index and includes U.S. Treasury issues, agency issues, corporate bond issues, and mortgage-backed securities. You cannot invest directly in an index. |
| 5. | The Barclays U.S. Treasury Index is an index of U.S. Treasury securities. You cannot invest directly in an index. |
| 6. | The Barclays 20+ Year U. S. Treasury Index is an unmanaged index composed of securities in the U.S. Treasury Index with maturities of 20 years or greater. You cannot invest directly in an Index. |
| 7. | The Barclays U.S. Corporate High Yield Bond Index is an unmanaged, U.S. dollar denominated, nonconvertible, non-investment grade debt index. The index consists of domestic and corporate bonds rated Ba and below with a minimum outstanding amount of $150 million. You cannot invest directly in an index. |
| 8. | The Morgan Stanley Capital International Europe, Australasia, and Far East (“MSCI EAFE”) Index is an unmanaged group of securities widely regarded by investors to be representations of the stock markets of Europe, Australasia, and the Far East. You cannot invest directly in an index. Source: MSCI. MSCI makes no express or implied warranties or representations and shall have no liability whatsoever with respect to any MSCI data contained herein. The MSCI data may not be further redistributed or used as a basis for other indexes or any securities or financial products. This report is not approved, reviewed or produced by MSCI. |
| 9. | The BofA Merrill Lynch Global Broad Market Ex. U.S. Index tracks the performance of investment grade debt publicly issued in the major domestic and euro bond markets, including sovereign, quasi-government, corporate, securitized and collateralized securities and excludes all securities denominated in U.S. dollars. You cannot invest directly in an index. |
| | | | |
| 4 | | Wells Fargo Advantage Asset Allocation Fund | | Letter to Shareholders |
effectively encourages European banks to buy sovereign bonds of the eurozone governments, helping to push yields lower on bonds from financially fragile countries like Spain and Italy. This type of activity helps to reduce the near-term risk that those countries would experience funding issues. From a global credit market perspective, this additional liquidity further helps alleviate fears of contagion and causes risk premiums to decline—an ideal scenario for equities and high-yield bonds.
Recent events have not altered our message to shareholders.
The heightened volatility across the global financial markets during 2011 and lingering uncertainties about the outlook going forward have left many investors questioning their resolve—and their investments. Yet it is precisely at such times that the market may present opportunities—as well as challenges—for prudent investors. For many investors, simply building and maintaining a well-diversified10 investment plan focused on clear financial objectives is the best long-term strategy.
Thank you for choosing to invest with Wells Fargo Advantage Funds. We appreciate your confidence in us and remain committed to helping you meet your financial needs. For current information about your fund investments, contact your investment professional, visit our Web site at wellsfargoadvantagefunds.com, or call us directly at 1-800-222-8222. We are available 24 hours a day, 7 days a week.
Sincerely,

Karla M. Rabusch
President
Wells Fargo Advantage Funds
Notice to Shareholders
The Board of Trustees for Wells Fargo Advantage Funds has unanimously approved the following modifications to certain net asset value (NAV) waiver privileges and commission schedules:
| | n | | Effective May 1, 2012, automatic investment plan (AIP) purchases and proceeds received from systematic withdrawals will no longer qualify for NAV repurchase privileges. | |
| | n | | Effective May 1, 2012, discretionary rights to waive the upfront commission for Class C and “jumbo” Class A share purchases will no longer be granted to broker/dealers. However, we will continue to waive the Class C shares contingent deferred sales charge for redemptions by employer-sponsored retirement plans where the dealer of record waived its commission at the time of purchase. | |
| | n | | Effective July 31, 2012, NAV purchase privileges for former Evergreen Class IS and Class R shareholders are being modified to remove the ability to purchase Class A shares at NAV unless those shares are held directly with the Fund on or after July 31, 2012. | |
Please contact your investment professional or call us directly at 1-800-222-8222 if you have any questions on this Notice to Shareholders.
| 10. | Diversification does not assure or guarantee better performance and cannot eliminate the risk of investment losses. |
| | | | | | |
| Performance Highlights (Unaudited) | | Wells Fargo Advantage Asset Allocation Fund | | | 5 | |
INVESTMENT OBJECTIVE
The Fund seeks long-term total return, consisting of capital appreciation and current income.
ADVISER
Wells Fargo Funds Management, LLC
PORTFOLIO MANAGER
Ben Inker, CFA1
FUND INCEPTION
July 29, 1996
| | | | |
TEN LARGEST HOLDINGS2 (AS OF MARCH 31, 2012) | | | |
GMO Quality Equity Fund Class VI | | | 27.16% | |
GMO Strategic Fixed Income Fund Class VI | | | 15.64% | |
GMO Alpha Only Fund Class IV | | | 11.16% | |
GMO International Core Equity Fund Class VI | | | 10.58% | |
GMO Emerging Markets Fund Class VI | | | 8.64% | |
GMO Currency Hedged International Equity Fund Class III | | | 7.89% | |
GMO International Intrinsic Value Fund Class IV | | | 4.24% | |
GMO Special Situations Fund Class VI | | | 4.01% | |
GMO Flexible Equities Fund Class VI | | | 3.73% | |
GMO Domestic Bond Fund Class VI | | | 2.03% | |
| | |
PORTFOLIO ALLOCATION3 (AS OF MARCH 31, 2012) | | |
|
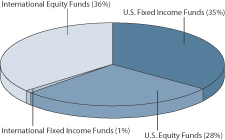 |
| 1. | The Fund invests substantially all of its assets directly in Asset Allocation Trust, an investment company advised by Grantham, Mayo, Van Otterloo & Co. LLC (GMO). Mr. Inker, senior member of GMO’s Asset Allocation Division, is responsible for coordinating the portfolio management of Asset Allocation Trust. |
| 2. | The ten largest holdings are calculated based on the value of the securities of the Asset Allocation Trust divided by the total net assets of the Fund. Holdings are subject to change and may have changed since the date specified. |
| 3. | Portfolio allocation is subject to change and represents the portfolio allocation of the Asset Allocation Trust which is calculated based on the total long-term investments of the Asset Allocation Trust. |
| | | | |
| 6 | | Wells Fargo Advantage Asset Allocation Fund | | Performance Highlights (Unaudited) |
AVERAGE ANNUAL TOTAL RETURN4 (%) (AS OF MARCH 31, 2012)
| | | | | | | | | | | | | | | | | | | | | | | | | | | | | | | | | | | | | | | | | | | | |
| | | | | | Including Sales Charge | | | Excluding Sales Charge | | | Expense Ratios5 | |
| | | Inception Date | | | 6 Months* | | | 1 Year | | | 5 Year | | | 10 Year | | | 6 Months* | | | 1 Year | | | 5 Year | | | 10 Year | | | Gross | | | Net6 | |
Class A (EAAFX) | | | 07/29/1996 | | | | 3.91 | | | | (1.33 | ) | | | 2.04 | | | | 6.10 | | | | 10.22 | | | | 4.67 | | | | 3.26 | | | | 6.72 | | | | 1.33% | | | | 1.33% | |
Class B (EABFX)** | | | 10/03/2002 | | | | 4.84 | | | | (1.10 | ) | | | 2.18 | | | | 6.20 | | | | 9.84 | | | | 3.90 | | | | 2.50 | | | | 6.20 | | | | 2.08% | | | | 2.08% | |
Class C (EACFX) | | | 10/03/2002 | | | | 8.75 | | | | 2.87 | | | | 2.48 | | | | 5.97 | | | | 9.75 | | | | 3.87 | | | | 2.48 | | | | 5.97 | | | | 2.08% | | | | 2.08% | |
Class R (EAXFX) | | | 10/10/2003 | | | | | | | | | | | | | | | | | | | | 10.05 | | | | 4.46 | | | | 3.00 | | | | 6.49 | | | | 1.58% | | | | 1.58% | |
Administrator Class (EAIFX) | | | 10/03/2002 | | | | | | | | | | | | | | | | | | | | 10.32 | | | | 4.88 | | | | 3.51 | | | | 6.99 | | | | 1.17% | | | | 1.13% | |
GMO Global Balanced Index7 | | | | | | | | | | | | | | | | | | | | | | | 13.29 | | | | 2.60 | | | | 2.56 | | | | 5.18 | | | | | | | | | |
Barclays U.S. Aggregate Bond Index8 | | | | | | | | | | | | | | | | | | | | | | | 1.43 | | | | 7.71 | | | | 6.25 | | | | 5.80 | | | | | | | | | |
MSCI ACWI Index (Net)9 | | | | | | | | | | | | | | | | | | | | | | | 19.91 | | | | (0.73 | ) | | | (0.19 | ) | | | 5.33 | | | | | | | | | |
| * | Returns for periods of less than one year are not annualized. |
| ** | Class B shares are closed to investment, except in connection with the reinvestment of any distributions and permitted exchanges. |
Figures quoted represent past performance, which is no guarantee of future results and do not reflect the deduction of taxes that a shareholder may pay on fund distributions or the redemption of fund shares. Investment return and principal value of an investment will fluctuate so that an investor’s shares, when redeemed, may be worth more or less than their original cost. Performance shown without sales charges would be lower if sales charges were reflected. Current performance may be lower or higher than the performance data quoted and assumes the reinvestment of dividends and capital gains. Current month-end performance is available on the Fund’s Web site – wellsfargoadvantagefunds.com
Index returns do not include transaction costs associated with buying and selling securities, any mutual fund fees or expenses or any taxes. It is not possible to invest directly in an index.
For Class A shares, the maximum front-end sales charge is 5.75%. For Class B shares, the maximum contingent deferred sales charge is 5.00%. For Class C shares, the maximum contingent deferred sales charge is 1.00%. Performance including sales charge assumes the sales charge for the corresponding time period. Class R and Administrator Class shares are sold without a front-end sales charge or contingent deferred sales charge.
| 4. | Historical performance shown for all classes of the Fund prior to July 19, 2010 is based on the performance of the Fund’s predecessor, Evergreen Asset Allocation Fund. Historical performance shown for Class B, Class C and Class R shares prior to their inception reflects the performance of Class A, adjusted to reflect the higher expenses applicable to Class B, Class C and Class R shares. Historical performance shown for the Administrator Class shares prior to their inception reflects the performance of the Class A shares, and includes the higher expenses applicable to the Class A shares. If these expenses had not been included, returns would be higher. Historical performance for Class A prior to October 3, 2002 is based on the performance of Class III of the Evergreen Asset Allocation Fund’s predecessor, GMO Global Balanced Allocation Fund (the “GMO Fund”). Expenses of the GMO Fund were lower than the expenses the Fund incurs, in part because the GMO Fund did not pay 12b-1 fees. If the GMO Fund had incurred expenses at the same rate as the Fund does, the performance shown would have been lower. |
| 5. | Reflects the expense ratios as stated in the most recent prospectuses. |
| 6. | The Adviser has committed through July 18, 2013 to waive fees and/or reimburse expenses to the extent necessary to cap the Fund’s Total Annual Fund Operating Expenses After Fee Waiver, excluding brokerage commissions, interest, taxes, extraordinary expenses and the expenses of any money market fund or other Fund held by the Fund, at 0.87% for Class A, 1.62% for Class B, 1.62% for Class C, 1.12% for Class R and 0.64% for Administrator Class. Without this cap, the Fund’s returns would have been lower. |
| 7. | The GMO Global Balanced Index is a composite benchmark computed by GMO. Since May 1, 2007, the GMO Global Balanced Index is comprised of 65% MSCI All Country World Index (Net) and 35% Barclays U.S. Aggregate Bond Index. Prior to May 1, 2007, it was composed of 48.75% S&P 500 Index, 16.25% MSCI All Country World ex-US Index and 35% Barclays U.S. Aggregate Bond Index. You cannot invest directly in an index. |
| 8. | The Barclays U.S. Aggregate Bond Index is composed of the Barclays Government/Credit Index and the Mortgage-Backed Securities Index and includes U.S. Treasury issues, agency issues, corporate bond issues and mortgage-backed securities. You cannot invest directly in an index. |
| 9. | The MSCI All Country World Index (Net) (MSCI ACWI Index (Net)) is a free float-adjusted market capitalization weighted index that is designed to measure the equity market performance of developed and emerging markets. You cannot invest directly in an index. |
| | | | | | |
| Performance Highlights (Unaudited) | | Wells Fargo Advantage Asset Allocation Fund | | | 7 | |
Balanced funds may invest in stocks and bonds. Stock values fluctuate in response to the activities of individual companies and general market and economic conditions. Bond values fluctuate in response to the financial condition of individual issuers, general market and economic conditions, and changes in interest rates. In general, when interest rates rise, bond values fall and investors may lose principal value. Alternative investments such as, real estate, foreign currency and natural resources are speculative and entail a high degree of risk. Foreign investments are especially volatile and can rise or fall dramatically due to differences in the political and economic conditions of the host country. The Fund will indirectly be exposed to all of the risks of an investment in the underlying funds and will indirectly bear expenses of the underlying funds. The use of derivatives may reduce returns and/or increase volatility. Certain investment strategies tend to increase the total risk of an investment (relative to the broader market). This Fund is exposed to high yield securities risk, mortgage- and asset-backed securities risk, and smaller company securities risk. Consult the Fund’s prospectus for additional information on these and other risks. The Fund invests substantially all of its assets in Asset Allocation Trust, an open end management investment company having the same investment objective and strategy as the Fund. Any portfolio data shown for the fund represents that of the Asset Allocation Trust.
| | | | |
| 8 | | Wells Fargo Advantage Asset Allocation Fund | | Fund Expenses (Unaudited) |
As a shareholder of the Fund, you incur two types of costs: (1) transaction costs, including sales charges (loads) on purchase payments and contingent deferred sales charges (if any) on redemptions and (2) ongoing costs, including management fees; distribution (12b-1) and/or shareholder service fees; and other Fund expenses. This example is intended to help you understand your ongoing costs (in dollars) of investing in the Fund and to compare these costs with the ongoing costs of investing in other mutual funds.
The example is based on an investment of $1,000 invested at the beginning of the six-month period and held for the entire period from October 1, 2011 to March 31, 2012.
Actual Expenses
The “Actual” line of the table below provides information about actual account values and actual expenses. You may use the information in this line, together with the amount you invested, to estimate the expenses that you paid over the period. Simply divide your account value by $1,000 (for example, an $8,600 account value divided by $1,000 = 8.6), then multiply the result by the number in the “Actual” line under the heading entitled “Expenses Paid During Period” for your applicable class of shares to estimate the expenses you paid on your account during this period.
Hypothetical Example for Comparison Purposes
The “Hypothetical” line of the table below provides information about hypothetical account values and hypothetical expenses based on the Fund’s actual expense ratio and an assumed rate of return of 5% per year before expenses, which is not the Fund’s actual return. The hypothetical account values and expenses may not be used to estimate the actual ending account balance or expenses you paid for the period. You may use this information to compare the ongoing costs of investing in the Fund and other funds. To do so, compare this 5% hypothetical example with the 5% hypothetical examples that appear in the shareholder reports of the other funds.
Please note that the expenses shown in the table are meant to highlight your ongoing costs only and do not reflect any transactional costs, such as sales charges (loads) and contingent deferred sales charges. Therefore, the “Hypothetical” line of the table is useful in comparing ongoing costs only, and will not help you determine the relative total costs of owning different funds. In addition, if these transactional costs were included, your costs would have been higher.
| | | | | | | | | | | | | | | | |
| Wells Fargo Advantage Asset Allocation Fund | | Beginning
Account Value
10-01-2011 | | | Ending
Account Value
03-31-2012 | | | Expenses
Paid During
the Period1 | | | Net Annual
Expense Ratio | |
Class A | | | | | | | | | | | | | | | | |
Actual | | $ | 1,000.00 | | | $ | 1,102.18 | | | $ | 4.36 | | | | 0.83 | % |
Hypothetical (5% return before expenses) | | $ | 1,000.00 | | | $ | 1,020.85 | | | $ | 4.19 | | | | 0.83 | % |
Class B | | | | | | | | | | | | | | | | |
Actual | | $ | 1,000.00 | | | $ | 1,098.43 | | | $ | 8.29 | | | | 1.58 | % |
Hypothetical (5% return before expenses) | | $ | 1,000.00 | | | $ | 1,017.10 | | | $ | 7.97 | | | | 1.58 | % |
Class C | | | | | | | | | | | | | | | | |
Actual | | $ | 1,000.00 | | | $ | 1,097.52 | | | $ | 8.29 | | | | 1.58 | % |
Hypothetical (5% return before expenses) | | $ | 1,000.00 | | | $ | 1,017.10 | | | $ | 7.97 | | | | 1.58 | % |
Class R | | | | | | | | | | | | | | | | |
Actual | | $ | 1,000.00 | | | $ | 1,100.53 | | | $ | 5.72 | | | | 1.09 | % |
Hypothetical (5% return before expenses) | | $ | 1,000.00 | | | $ | 1,019.55 | | | $ | 5.50 | | | | 1.09 | % |
Administrator Class | | | | | | | | | | | | | | | | |
Actual | | $ | 1,000.00 | | | $ | 1,103.17 | | | $ | 3.26 | | | | 0.62 | % |
Hypothetical (5% return before expenses) | | $ | 1,000.00 | | | $ | 1,021.90 | | | $ | 3.13 | | | | 0.62 | % |
| | | | | | |
| Fund Expenses (Unaudited) | | Wells Fargo Advantage Asset Allocation Fund | | | 9 | |
| | | | | | | | | | | | | | | | |
Wells Fargo Advantage Asset Allocation Fund
Including Underlying Fund Expenses | | Beginning
Account Value
10-01-2011 | | | Ending
Account Value
03-31-2012 | | | Expenses
Paid During
the Period1 | | | Net Annual
Expense Ratio | |
Class A | | | | | | | | | | | | | | | | |
Actual | | $ | 1,000.00 | | | $ | 1,102.18 | | | $ | 6.83 | | | | 1.30 | % |
Hypothetical (5% return before expenses) | | $ | 1,000.00 | | | $ | 1,018.50 | | | $ | 6.56 | | | | 1.30 | % |
Class B | | | | | | | | | | | | | | | | |
Actual | | $ | 1,000.00 | | | $ | 1,098.43 | | | $ | 10.75 | | | | 2.05 | % |
Hypothetical (5% return before expenses) | | $ | 1,000.00 | | | $ | 1,014.75 | | | $ | 10.33 | | | | 2.05 | % |
Class C | | | | | | | | | | | | | | | | |
Actual | | $ | 1,000.00 | | | $ | 1,097.52 | | | $ | 10.75 | | | | 2.05 | % |
Hypothetical (5% return before expenses) | | $ | 1,000.00 | | | $ | 1,014.75 | | | $ | 10.33 | | | | 2.05 | % |
Class R | | | | | | | | | | | | | | | | |
Actual | | $ | 1,000.00 | | | $ | 1,100.53 | | | $ | 8.19 | | | | 1.56 | % |
Hypothetical (5% return before expenses) | | $ | 1,000.00 | | | $ | 1,017.20 | | | $ | 7.87 | | | | 1.56 | % |
Administrator Class | | | | | | | | | | | | | | | | |
Actual | | $ | 1,000.00 | | | $ | 1,103.17 | | | $ | 5.73 | | | | 1.09 | % |
Hypothetical (5% return before expenses) | | $ | 1,000.00 | | | $ | 1,019.55 | | | $ | 5.50 | | | | 1.09 | % |
| Asset Allocation Trust | | | | | | | |
Actual | | $ | 1,000.00 | | | $ | 1,105.67 | | | $ | 0.00 | | | | 0.00 | % |
Hypothetical (5% return before expenses) | | $ | 1,000.00 | | | $ | 1,025.00 | | | $ | 0.00 | | | | 0.00 | % |
| Asset Allocation Trust Including Underlying Fund Expenses | | | | | | | |
Actual | | $ | 1,000.00 | | | $ | 1,105.67 | | | $ | 2.47 | | | | 0.47 | % |
Hypothetical (5% return before expenses) | | $ | 1,000.00 | | | $ | 1,022.65 | | | $ | 2.38 | | | | 0.47 | % |
| 1. | Expenses paid is equal to the annualized expense ratio of each class multiplied by the average account value over the period, multiplied by the number of days in the most recent fiscal half-year divided by the number of days in the fiscal year (to reflect the one-half year period). |
| | | | |
| 10 | | Wells Fargo Advantage Asset Allocation Fund | | Statement of Assets and Liabilities—March 31, 2012 (Unaudited) |
| | | | |
| | | | |
| |
Assets | | | | |
Investment in Asset Allocation Trust, at value (see cost below) | | $ | 7,774,912,259 | |
Receivable for Fund shares sold | | | 16,166,544 | |
Prepaid expenses and other assets | | | 208,484 | |
| | | | |
Total assets | | | 7,791,287,287 | |
| | | | |
| |
Liabilities | | | | |
Payable for investments purchased | | | 1,148,694 | |
Payable for Fund shares redeemed | | | 17,886,354 | |
Advisory fee payable | | | 1,491,586 | |
Distribution fees payable | | | 2,480,607 | |
Due to other related parties | | | 2,244,197 | |
Shareholder servicing fees payable | | | 1,734,220 | |
Accrued expenses and other liabilities | | | 629,993 | |
| | | | |
Total liabilities | | | 27,615,651 | |
| | | | |
Total net assets | | $ | 7,763,671,636 | |
| | | | |
| |
NET ASSETS CONSIST OF | | | | |
Paid-in capital | | $ | 6,681,627,894 | |
Accumulated net investment loss | | | (181,806,180 | ) |
Accumulated net realized gains on investments | | | 97,806,942 | |
Net unrealized gains on investments | | | 1,166,042,980 | |
| | | | |
Total net assets | | $ | 7,763,671,636 | |
| | | | |
| |
COMPUTATION OF NET ASSET VALUE AND OFFERING PRICE PER SHARE1 | | | | |
Net assets – Class A | | $ | 2,432,492,076 | |
Shares outstanding – Class A | | | 192,317,459 | |
Net asset value per share – Class A | | | $12.65 | |
Maximum offering price per share – Class A2 | | | $13.42 | |
Net assets – Class B | | $ | 808,895,685 | |
Shares outstanding – Class B | | | 64,943,735 | |
Net asset value per share – Class B | | | $12.46 | |
Net assets – Class C | | $ | 2,803,952,367 | |
Shares outstanding – Class C | | | 229,957,267 | |
Net asset value per share – Class C | | | $12.19 | |
Net assets – Class R | | $ | 29,386,468 | |
Shares outstanding – Class R | | | 2,347,647 | |
Net asset value per share – Class R | | | $12.52 | |
Net assets – Administrator Class | | $ | 1,688,945,040 | |
Shares outstanding – Administrator Class | | | 132,646,060 | |
Net asset value per share – Administrator Class | | | $12.73 | |
| |
Investment in Asset Allocation Trust, at cost | | $ | 6,608,869,279 | |
| | | | |
| 1. | The Fund has an unlimited number of authorized shares. |
| 2. | Maximum offering price is computed as 100/94.25 of net asset value. On investments of $50,000 or more, the offering price is reduced. |
The accompanying notes are an integral part of these financial statements.
| | | | | | |
| Statement of Operations—Six Months Ended March 31, 2012 (Unaudited) | | Wells Fargo Advantage Asset Allocation Fund | | | 11 | |
| | | | |
| | | | |
| |
Investment income | | $ | 0 | |
| | | | |
| |
Expenses | | | | |
Advisory fee | | | 8,347,227 | |
Administration fees | | | | |
Fund level | | | 3,537,798 | |
Class A | | | 3,133,750 | |
Class B | | | 1,119,994 | |
Class C | | | 3,592,246 | |
Class R | | | 33,660 | |
Administrator Class | | | 770,028 | |
Shareholder servicing fees | | | | |
Class A | | | 3,013,221 | |
Class B | | | 1,074,198 | |
Class C | | | 3,454,083 | |
Class R | | | 32,365 | |
Administrator Class | | | 1,647,754 | |
Distribution fees | | | | |
Class B | | | 3,230,753 | |
Class C | | | 10,362,248 | |
Class R | | | 32,365 | |
Custody and accounting fees | | | 148,782 | |
Professional fees | | | 7,003 | |
Registration fees | | | 66,747 | |
Shareholder report expenses | | | 101,527 | |
Trustees’ fees and expenses | | | 6,845 | |
Other fees and expenses | | | 124,531 | |
| | | | |
Total expenses | | | 43,837,125 | |
Less: Fee waivers and/or expense reimbursements | | | (156,237 | ) |
| | | | |
Net expenses | | | 43,680,888 | |
| | | | |
Net investment loss | | | (43,680,888 | ) |
| | | | |
| |
REALIZED AND UNREALIZED GAINS (LOSSES) ON INVESTMENTS | | | | |
Net realized gains on investments | | | 97,982,535 | |
Net change in unrealized gains (losses) on investments | | | 674,046,185 | |
| | | | |
Net realized and unrealized gains (losses) on investments | | | 772,028,720 | |
| | | | |
Net increase in net assets resulting from operations | | $ | 728,347,832 | |
| | | | |
The accompanying notes are an integral part of these financial statements.
| | | | |
| 12 | | Wells Fargo Advantage Asset Allocation Fund | | Statements of Changes in Net Assets |
| | | | | | | | | | | | | | | | |
| | | Six Months Ended
March 31, 2012
(Unaudited) | | | Year Ended
September 30, 2011 | |
| | | | |
Operations | | | | | | | | | | | | | | | | |
Net investment loss | | | | | | $ | (43,680,888 | ) | | | | | | $ | (99,122,986 | ) |
Net realized gains on investments | | | | | | | 97,982,535 | | | | | | | | 183,667,716 | |
Net change in unrealized gains (losses) on investments | | | | | | | 674,046,185 | | | | | | | | 4,899,271 | |
| | | | | | | | | | | | | | | | |
Net increase in net assets resulting from operations | | | | | | | 728,347,832 | | | | | | | | 89,444,001 | |
| | | | | | | | | | | | | | | | |
| | | | |
Distributions to shareholders from | | | | | | | | | | | | | | | | |
Net investment income | | | | | | | | | | | | | | | | |
Class A | | | | | | | (45,876,954 | ) | | | | | | | (31,605,936 | ) |
Class B | | | | | | | (14,725,864 | ) | | | | | | | (6,042,152 | ) |
Class C | | | | | | | (46,825,513 | ) | | | | | | | (16,402,935 | ) |
Class R | | | | | | | (472,123 | ) | | | | | | | (237,503 | ) |
Administrator Class | | | | | | | (30,062,044 | ) | | | | | | | (19,306,658 | ) |
Tax basis return of capital | | | | | | | | | | | | | | | | |
Class A | | | | | | | 0 | | | | | | | | (5,254,770 | ) |
Class B | | | | | | | 0 | | | | | | | | (2,316,998 | ) |
Class C | | | | | | | 0 | | | | | | | | (6,485,273 | ) |
Class R | | | | | | | 0 | | | | | | | | (47,049 | ) |
Administrator Class | | | | | | | 0 | | | | | | | | (2,626,629 | ) |
| | | | | | | | | | | | | | | | |
Total distributions to shareholders | | | | | | | (137,962,498 | ) | | | | | | | (90,325,903 | ) |
| | | | | | | | | | | | | | | | |
| | | | |
Capital share transactions | | | Shares | | | | | | | | Shares | | | | | |
Proceeds from shares sold | | | | | | | | | | | | | | | | |
Class A | | | 21,041,839 | | | | 257,152,906 | | | | 36,452,037 | | | | 445,536,399 | |
Class B | | | 126,033 | | | | 1,514,808 | | | | 313,944 | | | | 3,787,270 | |
Class C | | | 9,893,855 | | | | 116,517,500 | | | | 18,849,205 | | | | 222,844,817 | |
Class R | | | 469,124 | | | | 5,706,421 | | | | 574,211 | | | | 6,964,858 | |
Administrator Class | | | 32,377,450 | | | | 400,133,528 | | | | 81,397,626 | | | | 995,135,771 | |
| | | | | | | | | | | | | | | | |
| | | | | | | 781,025,163 | | | | | | | | 1,674,269,115 | |
| | | | | | | | | | | | | | | | |
Reinvestment of distributions | | | | | | | | | | | | | | | | |
Class A | | | 3,440,604 | | | | 40,977,591 | | | | 2,695,299 | | | | 32,316,658 | |
Class B | | | 1,155,830 | | | | 13,592,564 | | | | 647,008 | | | | 7,692,926 | |
Class C | | | 2,952,848 | | | | 33,987,278 | | | | 1,402,058 | | | | 16,319,948 | |
Class R | | | 32,735 | | | | 386,274 | | | | 19,079 | | | | 226,859 | |
Administrator Class | | | 1,864,375 | | | | 22,353,857 | | | | 1,340,622 | | | | 16,141,091 | |
| | | | | | | | | | | | | | | | |
| | | | | | | 111,297,564 | | | | | | | | 72,697,482 | |
| | | | | | | | | | | | | | | | |
Payment for shares redeemed | | | | | | | | | | | | | | | | |
Class A | | | (31,809,943 | ) | | | (389,783,953 | ) | | | (91,092,267 | ) | | | (1,105,213,800 | ) |
Class B | | | (15,860,749 | ) | | | (190,785,238 | ) | | | (29,535,465 | ) | | | (357,644,777 | ) |
Class C | | | (25,013,867 | ) | | | (294,710,892 | ) | | | (67,919,375 | ) | | | (803,511,229 | ) |
Class R | | | (189,056 | ) | | | (2,275,305 | ) | | | (350,894 | ) | | | (4,260,047 | ) |
Administrator Class | | | (22,499,564 | ) | | | (278,507,276 | ) | | | (30,302,702 | ) | | | (371,641,483 | ) |
| | | | | | | | | | | | | | | | |
| | | | | | | (1,156,062,664 | ) | | | | | | | (2,642,271,336 | ) |
| | | | | | | | | | | | | | | | |
Net decrease in net assets resulting from capital share transactions | | | | | | | (263,739,937 | ) | | | | | | | (895,304,739 | ) |
| | | | | | | | | | | | | | | | |
Total increase (decrease) in net assets | | | | | | | 326,645,397 | | | | | | | | (896,186,641 | ) |
| | | | | | | | | | | | | | | | |
| | | | |
Net assets | | | | | | | | | | | | | | | | |
Beginning of period | | | | | | | 7,437,026,239 | | | | | | | | 8,333,212,880 | |
| | | | | | | | | | | | | | | | |
End of period | | | | | | $ | 7,763,671,636 | | | | | | | $ | 7,437,026,239 | |
| | | | | | | | | | | | | | | | |
Accumulated net investment loss | | | | | | $ | (181,806,180 | ) | | | | | | $ | (162,794 | ) |
| | | | | | | | | | | | | | | | |
The accompanying notes are an integral part of these financial statements.
| | | | | | |
| Financial Highlights | | Wells Fargo Advantage Asset Allocation Fund | | | 13 | |
(For a share outstanding throughout each period)
| | | | | | | | | | | | | | | | | | | | | | | | | | | | |
| | | Six Months Ended
March 31, 2012 (Unaudited) | | | Year Ended September 30, | | | Year Ended December 31, | |
| Class A | | | 2011 | | | 20101,2 | | | 20091 | | | 20081 | | | 20071 | | | 20061 | |
Net asset value, beginning of period | | $ | 11.70 | | | $ | 11.76 | | | $ | 11.37 | | | $ | 9.38 | | | $ | 14.91 | | | $ | 14.81 | | | $ | 14.09 | |
Net investment income (loss) | | | (0.05 | ) | | | (0.09 | ) | | | (0.08 | ) | | | (0.08 | ) | | | (0.11 | )3 | | | 0.27 | | | | 0.35 | 3 |
Net realized and unrealized gains (losses) on investments | | | 1.23 | | | | 0.20 | | | | 0.47 | | | | 2.34 | | | | (3.17 | ) | | | 0.77 | | | | 1.23 | |
| | | | | | | | | | | | | | | | | | | | | | | | | | | | |
Total from investment operations | | | 1.18 | | | | 0.11 | | | | 0.39 | | | | 2.26 | | | | (3.28 | ) | | | 1.04 | | | | 1.58 | |
Distributions to shareholders from | | | | | | | | | | | | | | | | | | | | | | | | | | | | |
Net investment income | | | (0.23 | ) | | | (0.14 | ) | | | (0.00 | )4 | | | (0.27 | ) | | | (1.08 | ) | | | (0.58 | ) | | | (0.44 | ) |
Net realized gains | | | 0.00 | | | | 0.00 | | | | 0.00 | | | | 0.00 | | | | (0.85 | ) | | | (0.36 | ) | | | (0.42 | ) |
Tax basis return of capital | | | 0.00 | | | | (0.03 | ) | | | 0.00 | | | | 0.00 | | | | (0.32 | ) | | | 0.00 | | | | 0.00 | |
| | | | | | | | | | | | | | | | | | | | | | | | | | | | |
Total distributions to shareholders | | | (0.23 | ) | | | (0.17 | ) | | | (0.00 | )4 | | | (0.27 | ) | | | (2.25 | ) | | | (0.94 | ) | | | (0.86 | ) |
Net asset value, end of period | | $ | 12.65 | | | $ | 11.70 | | | $ | 11.76 | | | $ | 11.37 | | | $ | 9.38 | | | $ | 14.91 | | | $ | 14.81 | |
Total return5 | | | 10.22 | % | | | 0.94 | % | | | 3.45 | % | | | 24.10 | % | | | (22.31 | )% | | | 7.09 | % | | | 11.32 | % |
Ratios to average net assets (annualized) | | | | | | | | | | | | | | | | | | | | | | | | | | | | |
Gross expenses6 | | | 0.83 | % | | | 0.85 | % | | | 0.85 | % | | | 0.87 | % | | | 0.82 | % | | | 0.84 | % | | | 0.89 | % |
Net expenses6 | | | 0.83 | % | | | 0.84 | % | | | 0.85 | % | | | 0.87 | % | | | 0.81 | % | | | 0.81 | % | | | 0.89 | % |
Net investment income (loss) | | | (0.83 | )% | | | (0.84 | )% | | | (0.85 | )% | | | (0.87 | )% | | | (0.81 | )% | | | 1.73 | % | | | 2.39 | % |
Supplemental data | | | | | | | | | | | | | | | | | | | | | | | | | | | | |
Portfolio turnover rate | | | 1 | % | | | 1 | % | | | 1 | % | | | 2 | % | | | 6 | % | | | 2 | % | | | 1 | % |
Net assets, end of period
(000’s omitted) | | | $2,432,492 | | | | $2,336,095 | | | | $2,957,689 | | | | $3,077,187 | | | | $2,640,410 | | | | $4,405,430 | | | | $3,873,495 | |
| 1. | After the close of business on July 16, 2010, the Fund acquired the net assets of Evergreen Asset Allocation Fund which became the accounting and performance survivor in the transaction. The information for the periods prior to July 19, 2010 is that of Class A of Evergreen Asset Allocation Fund. |
| 2. | For the nine months ended September 30, 2010. The Fund changed its fiscal year end from December 31 to September 30, effective September 30, 2010. |
| 3. | Calculated based on average shares outstanding during the period |
| 4. | Amount is less than $0.005. |
| 5. | Total return calculations do not include any sales charges. Returns for periods of less than one year are not annualized. |
| 6. | The Fund invests all of its investable assets in Asset Allocation Trust which does not have any net expenses. Expenses from Asset Allocation Trust, if any, would be included in these ratios. |
The accompanying notes are an integral part of these financial statements.
| | | | |
| 14 | | Wells Fargo Advantage Asset Allocation Fund | | Financial Highlights |
(For a share outstanding throughout each period)
| | | | | | | | | | | | | | | | | | | | | | | | | | | | |
| | | Six Months Ended
March 31, 2012 (Unaudited) | | | Year Ended September 30, | | | Year Ended December 31, | |
| Class B | | | 2011 | | | 20101,2 | | | 20091 | | | 20081 | | | 20071 | | | 20061 | |
Net asset value, beginning of period | | $ | 11.54 | | | $ | 11.60 | | | $ | 11.27 | | | $ | 9.30 | | | $ | 14.75 | | | $ | 14.65 | | | $ | 13.95 | |
Net investment income (loss) | | | (0.09 | )3 | | | (0.19 | )3 | | | (0.14 | ) | | | (0.17 | ) | | | (0.20 | )3 | | | 0.15 | | | | 0.23 | |
Net realized and unrealized gains (losses) on investments | | | 1.21 | | | | 0.21 | | | | 0.47 | | | | 2.32 | | | | (3.13 | ) | | | 0.77 | | | | 1.22 | |
| | | | | | | | | | | | | | | | | | | | | | | | | | | | |
Total from investment operations | | | 1.12 | | | | 0.02 | | | | 0.33 | | | | 2.15 | | | | (3.33 | ) | | | 0.92 | | | | 1.45 | |
Distributions to shareholders from | | | | | | | | | | | | | | | | | | | | | | | | | | | | |
Net investment income | | | (0.20 | ) | | | (0.07 | ) | | | (0.00 | )4 | | | (0.18 | ) | | | (0.95 | ) | | | (0.46 | ) | | | (0.33 | ) |
Net realized gains | | | 0.00 | | | | 0.00 | | | | 0.00 | | | | 0.00 | | | | (0.85 | ) | | | (0.36 | ) | | | (0.42 | ) |
Tax basis return of capital | | | 0.00 | | | | (0.01 | ) | | | 0.00 | | | | 0.00 | | | | (0.32 | ) | | | 0.00 | | | | 0.00 | |
| | | | | | | | | | | | | | | | | | | | | | | | | | | | |
Total distributions to shareholders | | | (0.20 | ) | | | (0.08 | ) | | | (0.00 | )4 | | | (0.18 | ) | | | (2.12 | ) | | | (0.82 | ) | | | (0.75 | ) |
Net asset value, end of period | | $ | 12.46 | | | $ | 11.54 | | | $ | 11.60 | | | $ | 11.27 | | | $ | 9.30 | | | $ | 14.75 | | | $ | 14.65 | |
Total return5 | | | 9.84 | % | | | 0.17 | % | | | 2.95 | % | | | 23.14 | % | | | (22.94 | )% | | | 6.33 | % | | | 10.53 | % |
Ratios to average net assets (annualized) | | | | | | | | | | | | | | | | | | | | | | | | | | | | |
Gross expenses6 | | | 1.58 | % | | | 1.60 | % | | | 1.60 | % | | | 1.62 | % | | | 1.56 | % | | | 1.54 | % | | | 1.59 | % |
Net expenses6 | | | 1.58 | % | | | 1.59 | % | | | 1.59 | % | | | 1.62 | % | | | 1.56 | % | | | 1.54 | % | | | 1.59 | % |
Net investment income (loss) | | | (1.58 | )% | | | (1.59 | )% | | | (1.59 | )% | | | (1.62 | )% | | | (1.56 | )% | | | 0.91 | % | | | 1.60 | % |
Supplemental data | | | | | | | | | | | | | | | | | | | | | | | | | | | | |
Portfolio turnover rate | | | 1 | % | | | 1 | % | | | 1 | % | | | 2 | % | | | 6 | % | | | 2 | % | | | 1 | % |
Net assets, end of period
(000’s omitted) | | | $808,896 | | | | $917,860 | | | | $1,253,485 | | | | $1,415,023 | | | | $1,369,657 | | | | $2,131,841 | | | | $2,050,316 | |
| 1. | After the close of business on July 16, 2010, the Fund acquired the net assets of Evergreen Asset Allocation Fund which became the accounting and performance survivor in the transaction. The information for the periods prior to July 19, 2010 is that of Class B of Evergreen Asset Allocation Fund. |
| 2. | For the nine months ended September 30, 2010. The Fund changed its fiscal year end from December 31 to September 30, effective September 30, 2010. |
| 3. | Calculated based on average shares outstanding during the period |
| 4. | Amount is less than $0.005. |
| 5. | Total return calculations do not include any sales charges. Returns for periods of less than one year are not annualized. |
| 6. | The Fund invests all of its investable assets in Asset Allocation Trust which does not have any net expenses. Expenses from Asset Allocation Trust, if any, would be included in these ratios. |
The accompanying notes are an integral part of these financial statements.
| | | | | | |
| Financial Highlights | | Wells Fargo Advantage Asset Allocation Fund | | | 15 | |
(For a share outstanding throughout each period)
| | | | | | | | | | | | | | | | | | | | | | | | | | | | |
| | | Six Months Ended
March 31, 2012 (Unaudited) | | | Year Ended September 30, | | | Year Ended December 31, | |
| Class C | | | 2011 | | | 20101,2 | | | 20091 | | | 20081 | | | 20071 | | | 20061 | |
Net asset value, beginning of period | | $ | 11.30 | | | $ | 11.36 | | | $ | 11.04 | | | $ | 9.12 | | | $ | 14.47 | | | $ | 14.39 | | | $ | 13.71 | |
Net investment income (loss) | | | (0.10 | ) | | | (0.19 | )3 | | | (0.14 | ) | | | (0.16 | ) | | | (0.20 | )3 | | | 0.16 | | | | 0.24 | |
Net realized and unrealized gains (losses) on investments | | | 1.19 | | | | 0.21 | | | | 0.46 | | | | 2.27 | | | | (3.06 | ) | | | 0.74 | | | | 1.19 | |
| | | | | | | | | | | | | | | | | | | | | | | | | | | | |
Total from investment operations | | | 1.09 | | | | 0.02 | | | | 0.32 | | | | 2.11 | | | | (3.26 | ) | | | 0.90 | | | | 1.43 | |
Distributions to shareholders from | | | | | | | | | | | | | | | | | | | | | | | | | | | | |
Net investment income | | | (0.20 | ) | | | (0.07 | ) | | | (0.00 | )4 | | | (0.19 | ) | | | (0.92 | ) | | | (0.46 | ) | | | (0.33 | ) |
Net realized gains | | | 0.00 | | | | 0.00 | | | | 0.00 | | | | 0.00 | | | | (0.85 | ) | | | (0.36 | ) | | | (0.42 | ) |
Tax basis return of capital | | | 0.00 | | | | (0.01 | ) | | | 0.00 | | | | 0.00 | | | | (0.32 | ) | | | 0.00 | | | | 0.00 | |
| | | | | | | | | | | | | | | | | | | | | | | | | | | | |
Total distributions to shareholders | | | (0.20 | ) | | | (0.08 | ) | | | (0.00 | )4 | | | (0.19 | ) | | | (2.09 | ) | | | (0.82 | ) | | | (0.75 | ) |
Net asset value, end of period | | $ | 12.19 | | | $ | 11.30 | | | $ | 11.36 | | | $ | 11.04 | | | $ | 9.12 | | | $ | 14.47 | | | $ | 14.39 | |
Total return5 | | | 9.75 | % | | | 0.18 | % | | | 2.92 | % | | | 23.08 | % | | | (22.85 | )% | | | 6.29 | % | | | 10.56 | % |
Ratios to average net assets (annualized) | | | | | | | | | | | | | | | | | | | | | | | | | | | | |
Gross expenses6 | | | 1.58 | % | | | 1.60 | % | | | 1.60 | % | | | 1.62 | % | | | 1.56 | % | | | 1.54 | % | | | 1.59 | % |
Net expenses6 | | | 1.58 | % | | | 1.59 | % | | | 1.60 | % | | | 1.62 | % | | | 1.56 | % | | | 1.54 | % | | | 1.59 | % |
Net investment income (loss) | | | (1.58 | )% | | | (1.59 | )% | | | (1.60 | )% | | | (1.62 | )% | | | (1.56 | )% | | | 1.01 | % | | | 1.76 | % |
Supplemental data | | | | | | | | | | | | | | | | | | | | | | | | | | | | |
Portfolio turnover rate | | | 1 | % | | | 1 | % | | | 1 | % | | | 2 | % | | | 6 | % | | | 2 | % | | | 1 | % |
Net assets, end of period
(000’s omitted) | | | $2,803,952 | | | | $2,736,064 | | | | $3,290,791 | | | | $3,490,657 | | | | $3,019,585 | | | | $4,666,033 | | | | $4,100,205 | |
| 1. | After the close of business on July 16, 2010, the Fund acquired the net assets of Evergreen Asset Allocation Fund which became the accounting and performance survivor in the transaction. The information for the periods prior to July 19, 2010 is that of Class C of Evergreen Asset Allocation Fund. |
| 2. | For the nine months ended September 30, 2010. The Fund changed its fiscal year end from December 31 to September 30, effective September 30, 2010. |
| 3. | Calculated based on average shares outstanding during the period |
| 4. | Amount is less than $0.005. |
| 5. | Total return calculations do not include any sales charges. Returns for periods of less than one year are not annualized. |
| 6. | The Fund invests all of its investable assets in Asset Allocation Trust which does not have any net expenses. Expenses from Asset Allocation Trust, if any, would be included in these ratios. |
The accompanying notes are an integral part of these financial statements.
| | | | |
| 16 | | Wells Fargo Advantage Asset Allocation Fund | | Financial Highlights |
(For a share outstanding throughout each period)
| | | | | | | | | | | | | | | | | | | | | | | | | | | | |
| | | Six Months Ended
March 31, 2012 (Unaudited) | | | Year Ended September 30, | | | Year Ended December 31, | |
| Class R | | | 2011 | | | 20101,2 | | | 20091 | | �� | 20081 | | | 20071 | | | 20061 | |
Net asset value, beginning of period | | $ | 11.59 | | | $ | 11.66 | | | $ | 11.29 | | | $ | 9.32 | | | $ | 14.82 | | | $ | 14.73 | | | $ | 14.02 | |
Net investment income (loss) | | | (0.07 | )3 | | | (0.10 | ) | | | (0.06 | ) | | | (0.11 | )3 | | | (0.14 | )3 | | | 0.25 | | | | 0.34 | 3 |
Net realized and unrealized gains
(losses) on investments | | | 1.22 | | | | 0.19 | | | | 0.43 | | | | 2.33 | | | | (3.15 | ) | | | 0.75 | | | | 1.20 | |
| | | | | | | | | | | | | | | | | | | | | | | | | | | | |
Total from investment operations | | | 1.15 | | | | 0.09 | | | | 0.37 | | | | 2.22 | | | | (3.29 | ) | | | 1.00 | | | | 1.54 | |
Distributions to shareholders from | | | | | | | | | | | | | | | | | | | | | | | | | | | | |
Net investment income | | | (0.22 | ) | | | (0.13 | ) | | | (0.00 | )4 | | | (0.25 | ) | | | (1.04 | ) | | | (0.55 | ) | | | (0.41 | ) |
Net realized gains | | | 0.00 | | | | 0.00 | | | | 0.00 | | | | 0.00 | | | | (0.85 | ) | | | (0.36 | ) | | | (0.42 | ) |
Tax basis return of capital | | | 0.00 | | | | (0.03 | ) | | | 0.00 | | | | 0.00 | | | | (0.32 | ) | | | 0.00 | | | | 0.00 | |
| | | | | | | | | | | | | | | | | | | | | | | | | | | | |
Total distributions to shareholders | | | (0.22 | ) | | | (0.16 | ) | | | (0.00 | )4 | | | (0.25 | ) | | | (2.21 | ) | | | (0.91 | ) | | | (0.83 | ) |
Net asset value, end of period | | $ | 12.52 | | | $ | 11.59 | | | $ | 11.66 | | | $ | 11.29 | | | $ | 9.32 | | | $ | 14.82 | | | $ | 14.73 | |
Total return5 | | | 10.05 | % | | | 0.71 | % | | | 3.30 | % | | | 23.77 | % | | | (22.52 | )% | | | 6.83 | % | | | 11.10 | % |
Ratios to average net assets (annualized) | | | | | | | | | | | | | | | | | | | | | | | | | | | | |
Gross expenses6 | | | 1.09 | % | | | 1.09 | % | | | 1.10 | % | | | 1.12 | % | | | 1.06 | % | | | 1.04 | % | | | 1.09 | % |
Net expenses6 | | | 1.09 | % | | | 1.09 | % | | | 1.09 | % | | | 1.12 | % | | | 1.06 | % | | | 1.04 | % | | | 1.09 | % |
Net investment income (loss) | | | (1.09 | )% | | | (1.09 | )% | | | (1.09 | )% | | | (1.12 | )% | | | (1.06 | )% | | | 1.61 | % | | | 2.33 | % |
Supplemental data | | | | | | | | | | | | | | | | | | | | | | | | | | | | |
Portfolio turnover rate | | | 1 | % | | | 1 | % | | | 1 | % | | | 2 | % | | | 6 | % | | | 2 | % | | | 1 | % |
Net assets, end of period
(000’s omitted) | | | $29,386 | | | | $23,580 | | | | $20,893 | | | | $16,279 | | | | $11,035 | | | | $12,935 | | | | $9,546 | |
| 1. | After the close of business on July 16, 2010, the Fund acquired the net assets of Evergreen Asset Allocation Fund which became the accounting and performance survivor in the transaction. The information for the periods prior to July 19, 2010 is that of Class R of Evergreen Asset Allocation Fund. |
| 2. | For the nine months ended September 30, 2010. The Fund changed its fiscal year end from December 31 to September 30, effective September 30, 2010. |
| 3. | Calculated based on average shares outstanding during the period |
| 4. | Amount is less than $0.005. |
| 5. | Returns for periods of less than one year are not annualized. |
| 6. | The Fund invests all of its investable assets in Asset Allocation Trust which does not have any net expenses. Expenses from Asset Allocation Trust, if any, would be included in these ratios. |
The accompanying notes are an integral part of these financial statements.
| | | | | | |
| Financial Highlights | | Wells Fargo Advantage Asset Allocation Fund | | | 17 | |
(For a share outstanding throughout each period)
| | | | | | | | | | | | | | | | | | | | | | | | | | | | |
| | | Six Months Ended
March 31, 2012 (Unaudited) | | | Year Ended September 30, | | | Year Ended December 31, | |
| Administrator Class | | | 2011 | | | 20101,2 | | | 20091 | | | 20081 | | | 20071 | | | 20061 | |
Net asset value, beginning of period | | $ | 11.77 | | | $ | 11.84 | | | $ | 11.42 | | | $ | 9.42 | | | $ | 14.99 | | | $ | 14.90 | | | $ | 14.16 | |
Net investment income (loss) | | | (0.04 | )3 | | | (0.08 | )3 | | | (0.01 | ) | | | (0.06 | )3 | | | (0.07 | )3 | | | 0.31 | | | | 0.39 | |
Net realized and unrealized gains
(losses) on investments | | | 1.24 | | | | 0.22 | | | | 0.43 | | | | 2.36 | | | | (3.20 | ) | | | 0.77 | | | | 1.25 | |
| | | | | | | | | | | | | | | | | | | | | | | | | | | | |
Total from investment operations | | | 1.20 | | | | 0.14 | | | | 0.42 | | | | 2.30 | | | | (3.27 | ) | | | 1.08 | | | | 1.64 | |
Distributions to shareholders from | | | | | | | | | | | | | | | | | | | | | | | | | | | | |
Net investment income | | | (0.24 | ) | | | (0.17 | ) | | | (0.00 | )4 | | | (0.30 | ) | | | (1.13 | ) | | | (0.63 | ) | | | (0.48 | ) |
Net realized gains | | | 0.00 | | | | 0.00 | | | | 0.00 | | | | 0.00 | | | | (0.85 | ) | | | (0.36 | ) | | | (0.42 | ) |
Tax basis return of capital | | | 0.00 | | | | (0.04 | ) | | | 0.00 | | | | 0.00 | | | | (0.32 | ) | | | 0.00 | | | | 0.00 | |
| | | | | | | | | | | | | | | | | | | | | | | | | | | | |
Total distributions to shareholders | | | (0.24 | ) | | | (0.21 | ) | | | (0.00 | )4 | | | (0.30 | ) | | | (2.30 | ) | | | (0.99 | ) | | | (0.90 | ) |
Net asset value, end of period | | $ | 12.73 | | | $ | 11.77 | | | $ | 11.84 | | | $ | 11.42 | | | $ | 9.42 | | | $ | 14.99 | | | $ | 14.90 | |
Total return5 | | | 10.32 | % | | | 1.12 | % | | | 3.70 | % | | | 24.40 | % | | | (22.12 | )% | | | 7.29 | % | | | 11.73 | % |
Ratios to average net assets (annualized) | | | | | | | | | | | | | | | | | | | | | | | | | | | | |
Gross expenses6 | | | 0.64 | % | | | 0.65 | % | | | 0.63 | % | | | 0.62 | % | | | 0.57 | % | | | 0.54 | % | | | 0.59 | % |
Net expenses6 | | | 0.62 | % | | | 0.63 | % | | | 0.60 | % | | | 0.62 | % | | | 0.57 | % | | | 0.54 | % | | | 0.59 | % |
Net investment income (loss) | | | (0.62 | )% | | | (0.63 | )% | | | (0.60 | )% | | | (0.62 | )% | | | (0.56 | )% | | | 2.18 | % | | | 2.98 | % |
Supplemental data | | | | | | | | | | | | | | | | | | | | | | | | | | | | |
Portfolio turnover rate | | | 1 | % | | | 1 | % | | | 1 | % | | | 2 | % | | | 6 | % | | | 2 | % | | | 1 | % |
Net assets, end of period
(000’s omitted) | | | $1,688,945 | | | | $1,423,427 | | | | $810,355 | | | | $639,903 | | | | $348,394 | | | | $337,645 | | | | $272,772 | |
| 1. | After the close of business on July 16, 2010, the Fund acquired the net assets of Evergreen Asset Allocation Fund which became the accounting and performance survivor in the transaction. The information for the periods prior to July 19, 2010 is that of Class I of Evergreen Asset Allocation Fund. |
| 2. | For the nine months ended September 30, 2010. The Fund changed its fiscal year end from December 31 to September 30, effective September 30, 2010. |
| 3. | Calculated based on average shares outstanding during the period |
| 4. | Amount is less than $0.005. |
| 5. | Returns for periods of less than one year are not annualized. |
| 6. | The Fund invests all of its investable assets in Asset Allocation Trust which does not have any net expenses. Expenses from Asset Allocation Trust, if any, would be included in these ratios. |
The accompanying notes are an integral part of these financial statements.
| | | | |
| 18 | | Wells Fargo Advantage Asset Allocation Fund | | Notes to Financial Statements (Unaudited) |
1. ORGANIZATION
Wells Fargo Funds Trust (the “Trust”), a Delaware statutory trust organized on March 10, 1999, is an open-end management investment company registered under the Investment Company Act of 1940, as amended (the “1940 Act”). These financial statements report on Wells Fargo Advantage Asset Allocation Fund (the “Fund”) which is a diversified series of the Trust.
The Fund invests all of its investable assets in Asset Allocation Trust, a fund-of-funds, which primarily allocates its investments among mutual funds advised by Grantham, Mayo, Van Otterloo & Co. LLC (“GMO”) investing in both U.S. and foreign equity and debt securities (“underlying funds”). At March 31, 2012, the Fund owned 100% of Asset Allocation Trust. The financial statements of Asset Allocation Trust, including the Portfolio of Investments, are included elsewhere in this report and should be read in conjunction with the Fund’s financial statements.
2. SIGNIFICANT ACCOUNTING POLICIES
The following significant accounting policies, which are consistently followed in the preparation of the financial statements of the Fund, are in conformity with U.S. generally accepted accounting principles which require management to make estimates and assumptions that affect the reported amounts of assets and liabilities, disclosure of contingent assets and liabilities at the date of the financial statements, and the reported amounts of revenues and expenses during the reporting period. Actual results could differ from those estimates.
Valuation
The Fund values its investment in Asset Allocation Trust at net asset value. The valuation of investments in securities and the underlying funds held by Asset Allocation Trust is discussed in its Notes to Financial Statements, which is included elsewhere in this report.
Investments which are not valued using the method discussed above, are valued at their fair value, as determined by procedures established in good faith and approved by the Board of Trustees. The Board of Trustees has established a Valuation Committee comprised of the Trustees and has delegated to it the authority to take any actions regarding the valuation of portfolio holdings that the Valuation Committee deems necessary in determining the fair value of portfolio holdings, unless the responsibility has been delegated to the Management Valuation Team of Wells Fargo Funds Management, LLC (“Funds Management”). The Board of Trustees retains the authority to make or ratify any valuation decisions or approve any changes to the Fair Value Procedures as it deems appropriate. On a quarterly basis, the Board of Trustees considers for ratification any valuation actions taken by the Valuation Committee or the Management Valuation Team.
Investment transactions and income recognition
Investment transactions are recorded on a trade date basis. Income dividends and capital gain distributions from Asset Allocation Trust are recorded on the ex-dividend date. Realized gains and losses resulting from investment transactions are determined on the identified cost basis.
Distributions to shareholders
Distributions to shareholders from net investment income and net realized gains, if any, are recorded on the ex-dividend date. Such distributions are determined in conformity with income tax regulations, which may differ from generally accepted accounting principles.
Federal and other taxes
The Fund intends to continue to qualify as a regulated investment company by distributing substantially all of its investment company taxable income and any net realized capital gains (after reduction for capital loss carryforwards) sufficient to relieve it from all, or substantially all, federal income taxes. Accordingly, no provision for federal income taxes was required.
The Fund’s income and federal excise tax returns and all financial records supporting those returns for the prior three fiscal years are subject to examination by the federal and Delaware revenue authorities. Management has analyzed the Fund’s tax positions taken on federal, state, and foreign tax returns for all open tax years and does not believe that there are any uncertain tax positions that require recognition of a tax liability.
Under the recently enacted Regulated Investment Company Modernization Act of 2010, the Fund is permitted to carry forward capital losses incurred in taxable years which began after December 22, 2010 for an unlimited period. However, any losses incurred are required to be utilized prior to the losses incurred in pre-enactment taxable years. As a result of this ordering rule, pre-enactment capital loss carryforwards may be more likely to expire unused. Additionally, post-
| | | | | | |
| Notes to Financial Statements (Unaudited) | | Wells Fargo Advantage Asset Allocation Fund | | | 19 | |
enactment capital losses that are carried forward will retain their character as either short-term or long-term capital losses rather than being considered all short-term as under previous law.
Class allocations
The separate classes of shares offered by the Fund differ principally in applicable sales charges, distribution, shareholder servicing and administration fees. Shareholders of each class bear certain expenses that pertain to that particular class. All shareholders bear the common expenses of the Fund, earn income from the portfolio, and are allocated unrealized gains and losses pro rata based on the average daily net assets of each class, without distinction between share classes. Dividends are determined separately for each class based on income and expenses allocable to each class. Realized gains and losses are allocated to each class pro rata based upon the net assets of each class on the date realized. Differences in per share dividend rates generally result from the relative weightings of pro rata income and realized gain allocations and from differences in separate class expenses, including distribution, shareholder servicing and administration fees.
3. FAIR VALUATION MEASUREMENTS
Fair value measurements of investments are determined within a framework that has established a fair value hierarchy based upon the various data inputs utilized in determining the value of the Fund’s investments. The three-level hierarchy gives the highest priority to unadjusted quoted prices in active markets for identical assets or liabilities (Level 1) and the lowest priority to significant unobservable inputs (Level 3). The Fund’s investments are classified within the fair value hierarchy based on the lowest level of input that is significant to the fair value measurement. The inputs are summarized into three broad levels as follows:
| n | | Level 1 – quoted prices in active markets for identical securities |
| n | | Level 2 – other significant observable inputs (including quoted prices for similar securities, interest rates, prepayment speeds, credit risk, etc.) |
| n | | Level 3 – significant unobservable inputs (including the Fund’s own assumptions in determining the fair value of investments) |
The inputs or methodologies used for valuing securities are not necessarily an indication of the risk associated with investing in those securities.
At March 31, 2012, the Fund’s investment in Asset Allocation Trust carried at fair value was designated as a Level 2 input.
Transfers in and transfers out are recognized at the end of the reporting period. For the six months ended March 31, 2012, the Fund did not have any significant transfers into/out of Level 1 and Level 2.
4. TRANSACTIONS WITH AFFILIATES AND OTHER EXPENSES
Advisory fee
The Trust has entered into an advisory contract with Wells Fargo Funds Management, LLC (“Funds Management”), an indirect wholly owned subsidiary of Wells Fargo & Company (“Wells Fargo”). The adviser is responsible for implementing investment policies and guidelines of the Fund.
Pursuant to the contract, Funds Management is entitled to receive an annual advisory fee starting at 0.25% and declining to 0.20% as the average daily net assets of the Fund increase. For the six months ended March 31, 2012, the advisory fee was equivalent to an annual rate of 0.22% of the Fund’s average daily net assets.
Administration and transfer agent fees
The Trust has entered into an administration agreement with Funds Management. Under this agreement, for providing administrative services, which includes paying fees and expenses for services provided by the transfer agent, sub-transfer agents, omnibus account servicers and record-keepers, Funds Management is entitled to receive from the Fund an annual fund level administration fee starting at 0.10% and declining to 0.06% as the average daily net assets of the Fund increase and a class level administration fee which is calculated based on the average daily net assets of each class as follows:
| | | | |
| | | Class Level Administration Fee | |
Class A, Class B, Class C, Class R | | | 0.26 | % |
Administrator Class | | | 0.10 | |
| | | | |
| 20 | | Wells Fargo Advantage Asset Allocation Fund | | Notes to Financial Statements (Unaudited) |
Funds Management has contractually waived and/or reimbursed advisory and administration fees to the extent necessary to maintain certain net operating expense ratios for the Fund. Waiver of fees and/or reimbursement of expenses by Funds Management were made first from fund level expenses on a proportionate basis and then from class specific expenses. Funds Management has committed through July 18, 2013 to waive fees and/or reimburse expenses to the extent necessary to cap the Fund’s expenses at 0.87% for Class A, 1.62% for Class B, 1.62% for Class C, 1.12% for Class R and 0.64% for Administrator Class.
Distribution fees
The Trust has adopted a Distribution Plan for Class B, Class C and Class R shares of the Fund pursuant to Rule 12b-1 under the 1940 Act. Distribution fees are charged to Class B, Class C and Class R shares and paid to Wells Fargo Funds Distributor, LLC, the principal underwriter, at an annual rate of 0.75% of the average daily net assets of Class B and Class C shares and 0.25% of the average daily net assets for Class R shares.
For the six months ended March 31, 2012, Wells Fargo Funds Distributor, LLC received $269,015 from the sale of Class A shares and $4,837, $358,866 and $38,386 in contingent deferred sales charges from redemptions of Class A, Class B and Class C shares, respectively.
Shareholder servicing fees
The Trust has entered into contracts with one or more shareholder servicing agents, whereby each class of the Fund is charged a fee at an annual rate of 0.25% of the average daily net assets of each respective class.
A portion of these total shareholder servicing fees were paid to affiliates of Wells Fargo.
5. INVESTMENT PORTFOLIO TRANSACTIONS
For the six months ended March 31, 2012, the Fund made aggregate purchases and sales of $73,387,676 and $518,396,386, respectively, in its investment into Asset Allocation Trust.
6. BANK BORROWINGS
The Trust (excluding the money market funds) and Wells Fargo Variable Trust are parties to a $150,000,000 revolving credit agreement with State Street Bank and Trust Company, whereby the Fund is permitted to use bank borrowings for temporary or emergency purposes, such as to fund shareholder redemption requests. Interest under the credit agreement is charged to the Fund based on a borrowing rate equal to the higher of the Federal Funds rate in effect on that day plus 1.25% or the overnight LIBOR rate in effect on that day plus 1.25%. In addition, an annual commitment fee equal to 0.10% of the unused balance is allocated to each participating fund. For the six months ended March 31, 2012, the Fund paid $7,784 in commitment fees.
During the six months ended March 31, 2012, the Fund had average borrowings outstanding of $81,655 (on an annualized basis) at a rate of 1.45% and paid interest in the amount of $1,184.
7. INDEMNIFICATION
Under the Trust’s organizational documents, the officers and directors are indemnified against certain liabilities that may arise out of performance of their duties to the Trust. Additionally, in the normal course of business, the Trust may enter into contracts with service providers that contain a variety of indemnification clauses. The Trust’s maximum exposure under these arrangements is dependent on future claims that may be made against the Fund and, therefore, cannot be estimated.
8. NEW ACCOUNTING PRONOUNCEMENTS
In December 2011, the Financial Accounting Standards Board (“FASB”) issued Accounting Standard Update (“ASU”) No. 2011-11, Disclosures about Offsetting Assets and Liabilities. ASU 2011-11, which amends FASB ASC Topic 210 Balance Sheet, creates new disclosure requirements requiring entities to disclose both gross and net information for derivatives and other financial instruments that are either offset in the Statement of Assets and Liabilities or subject to an enforceable master netting arrangement or similar agreement. The disclosure requirements are effective for interim and annual reporting periods beginning on or after January 1, 2013. Management is currently evaluating the impact of the update’s adoption on the Fund’s financial statement disclosures.
In May 2011, FASB issued ASU No. 2011-04 “Amendments to Achieve Common Fair Value Measurement and Disclosure Requirements in U.S. GAAP and IFRSs”. ASU No. 2011-04 amends FASB ASC Topic 820, Fair Value Measurements and
| | | | | | |
| Notes to Financial Statements (Unaudited) | | Wells Fargo Advantage Asset Allocation Fund | | | 21 | |
Disclosures, to establish common requirements for measuring fair value and for disclosing information about fair value measurements in accordance with GAAP. The ASU is effective prospectively for interim and annual periods beginning after December 15, 2011. Management expects that adoption of the ASU will result in additional disclosures in the financial statements, as applicable.
In April 2011, FASB issued ASU No. 2011-03 “Reconsideration of Effective Control for Repurchase Agreements”. ASU No. 2011-03 amends FASB ASC Topic 860, Transfers and Servicing, specifically the criteria required to determine whether a repurchase agreement (repo) and similar agreements should be accounted for as sales of financial assets or secured borrowings with commitments. ASU No. 2011-03 changes the assessment of effective control by focusing on the transferor’s contractual rights and obligations and removing the criterion to assess its ability to exercise those rights or honor those obligations. This could result in changes to the way entities account for certain transactions including repurchase agreements, mortgage dollar rolls and reverse repurchase agreements. The ASU will become effective on a prospective basis for new transfers and modifications to existing transactions as of the beginning of the first interim or annual period beginning on or after December 15, 2011. Management has evaluated the impact of adopting the ASU and expects no significant changes.
| | | | |
| 22 | | Wells Fargo Advantage Asset Allocation Fund | | Other Information (Unaudited) |
PROXY VOTING INFORMATION
A description of the policies and procedures that the Fund uses to determine how to vote proxies relating to portfolio securities is available without charge, upon request, by calling 1-800-222-8222, visiting our Web site at wellsfargoadvantagefunds.com, or visiting the SEC Web site at sec.gov. Information regarding how the Fund voted proxies relating to portfolio securities during the most recent 12-month period ended June 30 is available without charge on the Fund’s Web site at wellsfargoadvantagefunds.com or by visiting the SEC Web site at sec.gov.
PORTFOLIO HOLDINGS INFORMATION
The complete portfolio holdings for the Fund are publicly available on the Fund’s Web site (wellsfargoadvantagefunds.com) on a monthly, 30-day or more delayed basis. In addition, top ten holdings information for the Fund is publicly available on the Fund’s Web site on a monthly, seven-day or more delayed basis. The Fund files its complete schedule of portfolio holdings with the SEC for the first and third quarters of each fiscal year on Form N-Q, which is available without charge by visiting the SEC Web site at sec.gov. In addition, the Fund’s Form N-Q may be reviewed and copied at the SEC’s Public Reference Room in Washington, DC, and at regional offices in New York City, at 233 Broadway, and in Chicago, at 175 West Jackson Boulevard, Suite 900. Information about the Public Reference Room may be obtained by calling 1-800-SEC-0330.
| | | | | | |
| Other Information (Unaudited) | | Wells Fargo Advantage Asset Allocation Fund | | | 23 | |
BOARD OF TRUSTEES
The following table provides basic information about the Board of Trustees (the “Trustees”) of the Trust and Officers of the Trust. This table should be read in conjunction with the Prospectus and the Statement of Additional Information1 of the Fund. Each of the Trustees and Officers listed below acts in identical capacities for the Wells Fargo Advantage family of funds, which consists of 137 funds comprising the Wells Fargo Funds Trust, Wells Fargo Variable Trust, Wells Fargo Master Trust and four closed-end funds (collectively the “Fund Complex”). All of the Trustees are also Members of the Audit and Governance Committees of each Trust in the Fund Complex. The mailing address of each Trustee and Officer is 525 Market Street, 12th Floor, San Francisco, CA 94105. Each Trustee and Officer serves an indefinite term, however, each Trustee serves such term until reaching the mandatory retirement age established by the Trustees.
Independent Trustees
| | | | | | |
Name and Year of Birth | | Position Held and Length of Service | | Principal Occupations During Past Five Years | | Other Directorships During
Past Five Years |
Peter G. Gordon
(Born 1942) | | Trustee, since 1998; Chairman, since 2005 (Lead Trustee since 2001) | | Co-Founder, Retired Chairman, President and CEO of Crystal Geyser Water Company. Trustee Emeritus, Colby College | | Asset Allocation Trust |
Isaiah Harris, Jr.
(Born 1952) | | Trustee, since 2009 | | Retired. Prior thereto, President and CEO of BellSouth Advertising and Publishing Corp. from 2005 to 2007, President and CEO of BellSouth Enterprises from 2004 to 2005 and President of BellSouth Consumer Services from 2000 to 2003. Emeritus member of the Iowa State University Foundation Board of Governors. Emeritus Member of the Advisory Board of Iowa State University School of Business. Mr. Harris is a certified public accountant. | | CIGNA Corporation; Deluxe Corporation; Asset Allocation Trust |
Judith M. Johnson
(Born 1949) | | Trustee, since 2008 | | Retired. Prior thereto, Chief Executive Officer and Chief Investment Officer of Minneapolis Employees Retirement Fund from 1996 to 2008. Ms. Johnson is an attorney, certified public accountant and a certified managerial accountant. | | Asset Allocation Trust |
Leroy Keith, Jr.
(Born 1939) | | Trustee, since 2010 | | Chairman, Bloc Global Services (development and construction). Trustee of the Evergreen Funds from 1983 to 2010. Former Managing Director, Almanac Capital Management (commodities firm), former Partner, Stonington Partners, Inc. (private equity fund), former Director, Obagi Medical Products Co. and former Director, Lincoln Educational Services. | | Trustee, Virtus Fund Complex (consisting of 40 portfolios as of 12/31/11); Asset Allocation Trust |
David F. Larcker
(Born 1950) | | Trustee, since 2009 | | James Irvin Miller Professor of Accounting at the Graduate School of Business, Stanford University, Director of Corporate Governance Research Program and Senior Faculty of The Rock Center for Corporate Governance since 2006. From 2005 to 2008, Professor of Accounting at the Graduate School of Business, Stanford University. Prior thereto, Ernst & Young Professor of Accounting at The Wharton School, University of Pennsylvania from 1985 to 2005. | | Asset Allocation Trust |
Olivia S. Mitchell
(Born 1953) | | Trustee, since 2006 | | International Foundation of Employee Benefit Plans Professor, Wharton School of the University of Pennsylvania since 1993. Director of Wharton’s Pension Research Council and Boettner Center on Pensions & Retirement Research, and Research Associate at the National Bureau of Economic Research. Previously, Cornell University Professor from 1978 to 1993. | | Asset Allocation Trust |
| | | | |
| 24 | | Wells Fargo Advantage Asset Allocation Fund | | Other Information (Unaudited) |
| | | | | | |
Name and Year of Birth | | Position Held and Length of Service | | Principal Occupations During Past Five Years | | Other Directorships During
Past Five Years |
Timothy J. Penny
(Born 1951) | | Trustee, since 1996 | | President and CEO of Southern Minnesota Initiative Foundation, a non-profit organization, since 2007 and Senior Fellow at the Humphrey Institute Policy Forum at the University of Minnesota since 1995. Member of the Board of Trustees of NorthStar Education Finance, Inc., a non-profit organization, since 2007. | | Asset Allocation Trust |
Michael S. Scofield
(Born 1943) | | Trustee, since 2010 | | Served on the Investment Company Institute’s Board of Governors and Executive Committee from 2008-2011 as well the Governing Council of the Independent Directors Council from 2006-2011 and the Independent Directors Council Executive Committee from 2008-2011. Chairman of the IDC from 2008-2010. Institutional Investor (Fund Directions) Trustee of Year in 2007. Trustee of the Evergreen Funds (and its predecessors) from 1984 to 2010. Chairman of the Evergreen Funds from 2000-2010. Former Trustee of the Mentor Funds. Retired Attorney, Law Offices of Michael S. Scofield and former Director and Chairman, Branded Media Corporation (multi-media branding company). | | Asset Allocation Trust |
Donald C. Willeke
(Born 1940) | | Trustee, since 1996 | | Principal of the law firm of Willeke & Daniels. General Counsel of the Minneapolis Employees Retirement Fund from 1984 until its consolidation into the Minnesota Public Employees Retirement Association on June 30, 2010. Director and Vice Chair of The Free Trust (non-profit corporation). Director of the American Chestnut Foundation (non-profit corporation). | | Asset Allocation Trust |
Officers
| | | | | | |
Name and Year of Birth | | Position Held and
Length of Service | | Principal Occupations During Past Five Years | | |
Karla M. Rabusch
(Born 1959) | | President, since 2003 | | Executive Vice President of Wells Fargo Bank, N.A. and President of Wells Fargo Funds Management, LLC since 2003. Senior Vice President and Chief Administrative Officer of Wells Fargo Funds Management, LLC from 2001 to 2003. | | |
C. David Messman
(Born 1960) | | Secretary, since 2000; Chief Legal Counsel, since 2003 | | Senior Vice President and Secretary of Wells Fargo Funds Management, LLC since 2001. Vice President and Managing Senior Counsel of Wells Fargo Bank, N.A. since 1996. | | |
Kasey Phillips
(Born 1970) | | Treasurer, since 2009 | | Senior Vice President of Wells Fargo Funds Management, LLC since 2009. Senior Vice President of Evergreen Investment Management Company, LLC from 2006 to 2010. Treasurer of the Evergreen Funds from 2005 to 2010. | | |
David Berardi
(Born 1975) | | Assistant Treasurer, since 2009 | | Vice President of Wells Fargo Funds Management, LLC since 2009. Vice President of Evergreen Investment Management Company, LLC from 2008 to 2010. Assistant Vice President of Evergreen Investment Services, Inc. from 2004 to 2008. Manager of Fund Reporting and Control for Evergreen Investment Management Company, LLC from 2004 to 2010. | | |
Jeremy DePalma
(Born 1974) | | Assistant Treasurer, since 2009 | | Senior Vice President of Wells Fargo Funds Management, LLC since 2009. Senior Vice President of Evergreen Investment Management Company, LLC from 2008 to 2010. Vice President, Evergreen Investment Services, Inc. from 2004 to 2007. Head of the Fund Reporting and Control Team within Fund Administration from 2005 to 2010. | | |
Debra Ann Early
(Born 1964) | | Chief Compliance Officer, since 2007 | | Chief Compliance Officer of Wells Fargo Funds Management, LLC since 2007. Chief Compliance Officer of Parnassus Investments from 2005 to 2007. Chief Financial Officer of Parnassus Investments from 2004 to 2007 and Senior Audit Manager of PricewaterhouseCoopers LLP from 1998 to 2004. | | |
| 1. | The Statement of Additional Information includes additional information about the Trustees and is available, without charge, upon request, by calling 1-800-222-8222 or by visiting the Web site at wellsfargoadvantagefunds.com. |
| | | | | | |
| Portfolio of Investments—March 31, 2012 (Unaudited) | | Asset Allocation Trust | | | 25 | |
| | | | | | | | | | | | | | | | |
| Security Name | | | | | | | | Shares | | | Value | |
| | | | |
Investment Companies: 99.37% | | | | | | | | | | | | | | | | |
| | | | |
| International Equity Funds: 36.06% | | | | | | | | | | | | | | | | |
GMO Currency Hedged International Equity Fund Class III (t) | | | | | | | | | | | 27,554,141 | | | $ | 612,804,087 | |
GMO Emerging Markets Fund Class VI (t) | | | | | | | | | | | 57,428,566 | | | | 670,765,648 | |
GMO Flexible Equities Fund Class VI (t) | | | | | | | | | | | 14,944,898 | | | | 289,482,667 | |
GMO International Core Equity Fund Class VI (t) | | | | | | | | | | | 29,832,597 | | | | 821,589,733 | |
GMO International Growth Equity Fund Class IV (t) | | | | | | | | | | | 3,443,181 | | | | 79,399,754 | |
GMO International Intrinsic Value Fund Class IV (t) | | | | | | | | | | | 16,204,930 | | | | 329,446,233 | |
| | | | |
| | | | | | | | | | | | | | | 2,803,488,122 | |
| | | | | | | | | | | | | | | | |
| | | | |
| International Fixed Income Funds: 1.30% | | | | | | | | | | | | | | | | |
GMO Emerging Country Debt Fund Class IV (t) | | | | | | | | | | | 10,527,531 | | | | 101,380,124 | |
| | | | | | | | | | | | | | | | |
| | | | |
| U.S. Equity Funds: 27.13% | | | | | | | | | | | | | | | | |
GMO Quality Equity Fund Class VI (t) | | | | | | | | | | | 87,285,125 | | | | 2,108,808,610 | |
| | | | | | | | | | | | | | | | |
| | | | |
| U.S. Fixed Income Funds: 34.88% | | | | | | | | | | | | | | | | |
GMO Alpha Only Fund Class IV (t) | | | | | | | | | | | 35,850,464 | | | | 866,505,713 | |
GMO Debt Opportunities Fund (t) | | | | | | | | | | | 5,944,751 | | | | 150,996,672 | |
GMO Domestic Bond Fund Class VI (t) | | | | | | | | | | | 6,443,611 | | | | 157,675,167 | |
GMO Special Situations Fund Class VI (t) | | | | | | | | | | | 11,631,354 | | | | 311,603,985 | |
GMO Strategic Fixed Income Fund Class VI (t) | | | | | | | | | | | 73,812,212 | | | | 1,214,210,884 | |
GMO U.S. Treasury Fund Class IV (t) | | | | | | | | | | | 448,463 | | | | 11,211,579 | |
| | | | |
| | | | | | | | | | | | | | | 2,712,204,000 | |
| | | | | | | | | | | | | | | | |
| | | | |
Total Investment Companies (Cost $6,657,624,708) | | | | | | | | | | | | | | | 7,725,880,856 | |
| | | | | | | | | | | | | | | | |
| | | | |
| | | Interest Rate | | | Maturity Date | | | Principal | | | | |
| | | | |
Short-Term Investments: 0.59% | | | | | | | | | | | | | | | | |
| | | | |
| Time Deposit: 0.59% | | | | | | | | | | | | | | | | |
State Street Bank Euro Dollar | | | 0.01 | % | | | 04/02/2012 | | | $ | 45,897,768 | | | | 45,897,768 | |
| | | | | | | | | | | | | | | | |
| | | | |
Total Short-Term Investments (Cost $45,897,768) | | | | | | | | | | | | | | | 45,897,768 | |
| | | | | | | | | | | | | | | | |
| | | | | | | | |
| Total Investments in Securities | | | | | | | | |
| (Cost $6,703,522,476)* | | | 99.96 | % | | | 7,771,778,624 | |
Other Assets and Liabilities, Net | | | 0.04 | | | | 3,133,635 | |
| | | | | | | | |
| Total Net Assets | | | 100.00 | % | | $ | 7,774,912,259 | |
| | | | | | | | |
| (t) | Grantham, Mayo, Van Otterloo & Co. LLC (“GMO”) is the investment adviser to Asset Allocation Trust and the underlying fund. |
| * | Cost for federal income tax purposes is $7,249,361,040 and net unrealized appreciation (depreciation) consists of: |
| | | | |
Gross unrealized appreciation | | $ | 569,136,932 | |
Gross unrealized depreciation | | | (46,719,348 | ) |
| | | | |
Net unrealized appreciation | | $ | 522,417,584 | |
The accompanying notes are an integral part of these financial statements.
| | | | |
| 26 | | Asset Allocation Trust | | Statement of Assets and Liabilities—March 31, 2012 (Unaudited) |
| | | | |
| | | | |
| |
Assets | | | | |
Investments | | | | |
In affiliated investment company shares, at value (see cost below) | | $ | 7,725,880,856 | |
In unaffiliated securities, at value (see cost below) | | | 45,897,768 | |
| | | | |
Total investments, at value (see cost below) | | | 7,771,778,624 | |
Receivable for investments sold | | | 2,000,000 | |
Receivable for Trust shares sold | | | 1,147,585 | |
Receivable for dividends and interest | | | 673 | |
Receivable from adviser | | | 2,932 | |
Other assets | | | 161 | |
| | | | |
Total assets | | | 7,774,929,975 | |
| | | | |
| |
Liabilities | | | | |
Payable for investments purchased | | | 635 | |
Shareholder report expenses payable | | | 3,236 | |
Custodian and accounting fees payable | | | 3,096 | |
Professional fees payable | | | 10,749 | |
| | | | |
Total liabilities | | | 17,716 | |
| | | | |
Total net assets | | $ | 7,774,912,259 | |
| | | | |
| |
NET ASSETS CONSIST OF | | | | |
Paid-in capital | | $ | 8,012,327,970 | |
Undistributed net investment income | | | 147,660,723 | |
Accumulated net realized losses on investments | | | (1,453,332,582 | ) |
Net unrealized gains on investments | | | 1,068,256,148 | |
| | | | |
Total net assets | | $ | 7,774,912,259 | |
| | | | |
Shares outstanding (unlimited number of shares authorized) | | | 603,956,691 | |
Net asset value per share | | | $12.87 | |
| |
Investments in affiliated investment company shares, at cost | | $ | 6,657,624,708 | |
| | | | |
Investments in unaffiliated securities, at cost | | $ | 45,897,768 | |
| | | | |
Total investments, at cost | | $ | 6,703,522,476 | |
| | | | |
The accompanying notes are an integral part of these financial statements.
| | | | | | |
| Statement of Operations—Six Months Ended March 31, 2012 (Unaudited) | | Asset Allocation Trust | | | 27 | |
| | | | |
| | | | |
| |
Investment income | | | | |
Dividends from affiliated investment company shares | | $ | 147,659,048 | |
Interest | | | 1,675 | |
| | | | |
Total investment income | | | 147,660,723 | |
| | | | |
| |
Expenses | | | | |
Custody and accounting fees | | | 4,812 | |
Professional fees | | | 10,050 | |
Shareholder report expenses | | | 788 | |
Other fees and expenses | | | 1,028 | |
| | | | |
Total expenses | | | 16,678 | |
Less: Fee waivers and/or expense reimbursements | | | (16,678 | ) |
| | | | |
Net expenses | | | 0 | |
| | | | |
Net investment income | | | 147,660,723 | |
| | | | |
| |
REALIZED AND UNREALIZED GAINS (LOSSES) ON INVESTMENTS | | | | |
| |
Net realized gains (losses) on: | | | | |
Unaffiliated securities | | | (1,530,356 | ) |
Sale of affiliated investment company shares | | | 23,355,390 | |
Capital gain distributions from affiliated investment company shares | | | 41,434,443 | |
| | | | |
Net realized gains on investments | | | 63,259,477 | |
| | | | |
| |
Net change in unrealized gains (losses) on: | | | | |
Unaffiliated securities | | | 1,430,090 | |
Affiliated investment company shares | | | 559,612,493 | |
| | | | |
Net change in unrealized gains (losses) on investments | | | 561,042,583 | |
| | | | |
Net realized and unrealized gains (losses) on investments | | | 624,302,060 | |
| | | | |
Net increase in net assets resulting from operations | | $ | 771,962,783 | |
| | | | |
The accompanying notes are an integral part of these financial statements.
| | | | |
| 28 | | Asset Allocation Trust | | Statements of Changes in Net Assets |
| | | | | | | | | | | | | | | | |
| | | Six Months Ended
March 31, 2012
(Unaudited) | | | Year Ended
September 30, 2011 | |
| | | | |
Operations | | | | | | | | | | | | | | | | |
Net investment income | | | | | | $ | 147,660,723 | | | | | | | $ | 136,029,249 | |
Net realized gains (losses) on investments | | | | | | | 63,259,477 | | | | | | | | (104,421,865 | ) |
Net change in unrealized gains (losses) on investments | | | | | | | 561,042,583 | | | | | | | | 139,427,278 | |
| | | | | | | | | | | | | | | | |
Net increase in net assets resulting from operations | | | | | | | 771,962,783 | | | | | | | | 171,034,662 | |
| | | | | | | | | | | | | | | | |
| | | | |
Capital share transactions | | | Shares | | | | | | | | Shares | | | | | |
Contributions | | | 5,904,418 | | | | 73,647,425 | | | | 4,375,457 | | | | 52,431,056 | |
Withdrawals | | | (42,023,358 | ) | | | (518,396,386 | ) | | | (95,008,135 | ) | | | (1,125,526,095 | ) |
| | | | | | | | | | | | | | | | |
Net decrease in net assets resulting from capital share transactions | | | | | | | (444,748,961 | ) | | | | | | | (1,073,095,039 | ) |
| | | | | | | | | | | | | | | | |
Total increase (decrease) in net assets | | | | | | | 327,213,822 | | | | | | | | (902,060,377 | ) |
| | | | | | | | | | | | | | | | |
| | | | |
Net assets | | | | | | | | | | | | | | | | |
Beginning of period | | | | | | | 7,447,698,437 | | | | | | | | 8,349,758,814 | |
| | | | | | | | | | | | | | | | |
End of period | | | | | | $ | 7,774,912,259 | | | | | | | $ | 7,447,698,437 | |
| | | | | | | | | | | | | | | | |
Undistributed net investment income | | | | | | $ | 147,660,723 | | | | | | | $ | 0 | |
| | | | | | | | | | | | | | | | |
The accompanying notes are an integral part of these financial statements.
| | | | | | |
| Financial Highlights | | Asset Allocation Trust | | | 29 | |
(For a share outstanding throughout each period)
| | | | | | | | | | | | | | | | | | | | | | | | | | | | |
| | | Six Months Ended
March 31, 2012 (Unaudited) | | | Year Ended September 30, | | | Year Ended December 31, | |
| | | | 2011 | | | 20101 | | | 2009 | | | 2008 | | | 2007 | | | 2006 | |
Net asset value, beginning of period | | $ | 11.64 | | | $ | 11.43 | | | $ | 10.98 | | | $ | 8.77 | | | $ | 11.57 | | | $ | 11.57 | | | $ | 10.77 | |
Net investment income | | | 0.24 | | | | 0.21 | | | | 0.12 | 2 | | | 0.24 | | | | 0.70 | 2 | | | 0.42 | | | | 0.36 | |
Net realized and unrealized gains (losses) on investments | | | 0.99 | | | | 0.00 | 3 | | | 0.33 | | | | 1.97 | | | | (3.15 | ) | | | 0.47 | | | | 0.97 | |
| | | | | | | | | | | | | | | | | | | | | | | | | | | | |
Total from investment operations | | | 1.23 | | | | 0.21 | | | | 0.45 | | | | 2.21 | | | | (2.45 | ) | | | 0.89 | | | | 1.33 | |
Distributions to shareholders from | | | | | | | | | | | | | | | | | | | | | | | | | | | | |
Net investment income | | | 0.00 | | | | 0.00 | | | | 0.00 | | | | 0.00 | | | | 0.00 | | | | (0.29 | ) | | | (0.36 | ) |
Net realized gains | | | 0.00 | | | | 0.00 | | | | 0.00 | | | | 0.00 | | | | (0.35 | ) | | | (0.60 | ) | | | (0.17 | ) |
| | | | | | | | | | | | | | | | | | | | | | | | | | | | |
Total distributions to shareholders | | | 0.00 | | | | 0.00 | | | | 0.00 | | | | 0.00 | | | | (0.35 | ) | | | (0.89 | ) | | | (0.53 | ) |
Net asset value, end of period | | $ | 12.87 | | | $ | 11.64 | | | $ | 11.43 | | | $ | 10.98 | | | $ | 8.77 | | | $ | 11.57 | | | $ | 11.57 | |
Total return4 | | | 10.57 | % | | | 1.84 | % | | | 4.10 | % | | | 25.20 | % | | | (21.71 | )% | | | 7.96 | % | | | 12.34 | % |
Ratios to average net assets (annualized) | | | | | | | | | | | | | | | | | | | | | | | | | | | | |
Gross expenses5 | | | 0.00 | %3 | | | 0.00 | %3 | | | 0.00 | %3 | | | 0.00 | %3 | | | 0.00 | %3 | | | 0.00 | %3 | | | 0.00 | %3 |
Net expenses5 | | | 0.00 | % | | | 0.00 | % | | | 0.00 | % | | | 0.00 | % | | | 0.00 | % | | | 0.00 | % | | | 0.00 | % |
Net investment income | | | 3.88 | % | | | 1.64 | % | | | 1.48 | % | | | 2.48 | % | | | 6.78 | % | | | 3.69 | % | | | 3.19 | % |
Supplemental data | | | | | | | | | | | | | | | | | | | | | | | | | | | | |
Portfolio turnover rate | | | 17 | % | | | 22 | % | | | 15 | % | | | 22 | % | | | 63 | % | | | 55 | % | | | 19 | % |
Net assets, end of period (000’s omitted) | | | $7,774,912 | | | | $7,447,698 | | | | $8,349,759 | | | | $8,635,057 | | | | $7,399,817 | | | | $11,516,725 | | | | $10,269,513 | |
| 1. | For the nine months ended September 30, 2010. The Trust changed its fiscal year end from December 31 to September 30, effective September 30, 2010. |
| 2. | Calculated based on average shares outstanding during the period |
| 3. | Amount is less than 0.005 of the value indicated. |
| 4. | Returns for periods of less than one year are not annualized. |
| 5. | Excludes expenses incurred indirectly through investment in underlying funds. |
The accompanying notes are an integral part of these financial statements.
| | | | |
| 30 | | Asset Allocation Trust | | Notes to Financial Statements (Unaudited) |
1. ORGANIZATION
Asset Allocation Trust (the “Trust”) was organized as a statutory trust under the laws of the state of Delaware on June 14, 2005 and is registered under the Investment Company Act of 1940, as amended, as a no-load, open-end management investment company. The Trust issues its shares of beneficial interest solely in private placement transactions that do not involve any “public offering” within the meaning of Section 4(2) of the Securities Act of 1933, as amended. The Trust is only offered to Wells Fargo Advantage Asset Allocation Fund, a diversified series of Wells Fargo Funds Trust, an open-end management investment company, which was organized as a Delaware statutory trust on March 10, 1999.
The Trust operates as a “fund-of-funds” which primarily invests in shares of GMO managed open-end mutual funds (“underlying funds”). Each underlying fund’s accounting policies are outlined in the underlying fund’s financial statements, which are available upon request.
Prior to October 5, 2011, the Trust owned 100% of GMO Fixed Income Fund I, LLC (“GMO LLC”) and the financial statements and holdings of GMO LLC were consolidated with the Trust. As of the close of business on October 5, 2011, GMO Debt Opportunities Fund, a newly registered open-end management investment company created by Grantham, Mayo, Van Otterloo & Co. LLC (“GMO”), acquired all of the securities from GMO LLC. In exchange, the Trust received shares of GMO Debt Opportunities Fund in an amount equal to the value of the securities acquired. The securities held in GMO LLC had a value of $146,420,940 at the time of the transaction. As a result, instead of owning interests in GMO LLC, the Trust now owns shares of GMO Debt Opportunities Fund.
2. SIGNIFICANT ACCOUNTING POLICIES
The following significant accounting policies, which are consistently followed in the preparation of the financial statements of the Trust, are in conformity with U.S. generally accepted accounting principles which require management to make estimates and assumptions that affect the reported amounts of assets and liabilities, disclosure of contingent assets and liabilities at the date of the financial statements, and the reported amounts of revenues and expenses during the reporting period. Actual results could differ from those estimates.
Securities valuation
Investments in the underlying open-end mutual funds are valued at the net asset value per share as reported by the underlying funds.
Securities previously held by GMO LLC were valued by brokers which used prices provided by market makers or estimates of market value obtained from yield data relating to investments or securities with similar characteristics.
Debt securities of sufficient credit quality with original maturities of 60 days or less generally are valued at amortized cost which approximates fair value. The amortized cost method involves valuing a security at its cost, plus accretion of discount or minus amortization of premium over the period until maturity.
Investments which are not valued using any of the methods discussed above, are valued at their fair value, as determined by procedures established in good faith and approved by the Board of Trustees. The Board of Trustees has established a Valuation Committee comprised of the Trustees and has delegated to it the authority to take any actions regarding the valuation of portfolio securities that the Valuation Committee deems necessary in determining the fair value of portfolio securities, unless the responsibility has been delegated to the Management Valuation Team of Wells Fargo Funds Management, LLC (“Funds Management”). The Board of Trustees retains the authority to make or ratify any valuation decisions or approve any changes to the Fair Value Procedures as it deems appropriate. On a quarterly basis, the Board of Trustees considers for ratification any valuation actions taken by the Valuation Committee or the Management Valuation Team.
Valuations of fair valued prices are compared to the next actual sales price when available, or other appropriate market information to assess the continued appropriateness of the fair valuation methodology used. The securities are fair valued on a day-to-day basis, taking into consideration changes to appropriate market information and any significant changes to the input factors considered in the valuation process until there is a readily available price provided on the exchange or by an independent pricing service. Valuations received from an independent pricing service or broker quotes are periodically validated by comparisons to most recent trades and valuations provided by other independent
| | | | | | |
| Notes to Financial Statements (Unaudited) | | Asset Allocation Trust | | | 31 | |
pricing services in addition to the review of prices by the adviser. Unobservable inputs used in determining fair valuations are identified based on the type of security, taking into consideration factors utilized by market participants in valuing the investment, knowledge about the issuer and the current market environment.
Investment transactions and income recognition
Investment transactions are recorded on trade date. Income dividends and capital gain distributions from underlying funds are recorded on the ex-dividend date. Capital gain distributions from the underlying funds are treated as realized gains.
Interest income is accrued daily and bond discounts are accreted and premiums are amortized daily based on the effective interest method. To the extent debt obligations are placed on non-accrual status, any related interest income may be reduced by writing off interest receivables when the collection of all or a portion of interest has become doubtful based on consistently applied procedures. If the issuer subsequently resumes interest payments or when the collectability of interest is reasonably assured, the debt obligation is removed from non-accrual status.
Distributions to shareholders
Distributions to shareholders from net investment income and net realized gains, if any, are recorded on the ex-dividend date. Such distributions are determined in conformity with income tax regulations, which may differ from generally accepted accounting principles.
Federal and other taxes
The Trust intends to continue to qualify as a regulated investment company by distributing substantially all of its investment company taxable income and any net realized capital gains (after reduction for capital loss carryforwards) sufficient to relieve it from all, or substantially all, federal income taxes. Accordingly, no provision for federal income taxes was required.
The Trust’s income and federal excise tax returns and all financial records supporting those returns for the prior three fiscal years are subject to examination by the federal and Delaware revenue authorities. Management has analyzed the Trust’s tax positions taken on federal, state, and foreign tax returns for all open tax years and does not believe that there are any uncertain tax positions that require recognition of a tax liability.
Under the recently enacted Regulated Investment Company Modernization Act of 2010, the Trust is permitted to carry forward capital losses incurred in taxable years which began after December 22, 2010 for an unlimited period. However, any losses incurred are required to be utilized prior to the losses incurred in pre-enactment taxable years. As a result of this ordering rule, pre-enactment capital loss carryforwards may be more likely to expire unused. Additionally, post-enactment capital losses that are carried forward will retain their character as either short-term or long-term capital losses rather than being considered all short-term as under previous law.
As of September 30, 2011, the Trust had net capital loss carryforwards, which were available to offset future net realized capital gains, in the amount of $837,329,010 with $767,839,698 expiring in 2017, $65,386,905 expiring in 2018 and $4,102,407 expiring in 2019.
As of September 30, 2011, the Trust had $131,420,832 of current year deferred post-October capital losses, which was treated as realized for tax purposes on the first day of the succeeding year.
3. FAIR VALUATION MEASUREMENTS
Fair value measurements of investments are determined within a framework that has established a fair value hierarchy based upon the various data inputs utilized in determining the value of the Trust’s investments. The three-level hierarchy gives the highest priority to unadjusted quoted prices in active markets for identical assets or liabilities (Level 1) and the lowest priority to significant unobservable inputs (Level 3). The Trust’s investments are classified within the fair value hierarchy based on the lowest level of input that is significant to the fair value measurement. The inputs are summarized into three broad levels as follows:
| n | | Level 1 – quoted prices in active markets for identical securities |
| n | | Level 2 – other significant observable inputs (including quoted prices for similar securities, interest rates, prepayment speeds, credit risk, etc.) |
| n | | Level 3 – significant unobservable inputs (including the Trust’s own assumptions in determining the fair value of investments) |
| | | | |
| 32 | | Asset Allocation Trust | | Notes to Financial Statements (Unaudited) |
The inputs or methodologies used for valuing securities are not necessarily an indication of the risk associated with investing in those securities.
As of March 31, 2011, the inputs used in valuing the Trust’s assets, which are carried at fair value, were as follows:
| | | | | | | | | | | | | | | | |
| Investments in Securities | | Quoted Prices (Level 1) | | | Significant Other
Observable Inputs (Level 2) | | | Significant Unobservable Inputs (Level 3) | | | Total | |
Equity securities | | | | | | | | | | | | | | | | |
Investment companies | | $ | 7,263,280,199 | | | $ | 462,600,657 | | | $ | 0 | | | $ | 7,725,880,856 | |
Short-term investments | | | | | | | | | | | | | | | | |
Time deposit | | | 0 | | | | 45,897,768 | | | | 0 | | | | 45,897,768 | |
| | | $ | 7,263,280,199 | | | $ | 508,498,425 | | | $ | 0 | | | $ | 7,771,778,624 | |
Further details on the major security types listed above can be found in the Portfolio of Investments.
Transfers in and transfers out are recognized at the end of the reporting period. For the six months ended March 31, 2012, the Trust did not have any significant transfers into/out of Level 1 and Level 2.
4. TRANSACTIONS WITH AFFILIATES AND OTHER EXPENSES
GMO, a private company founded in 1977, is the adviser to the Trust. GMO also serves as adviser to each of the underlying funds. GMO does not receive a fee from the Trust for its advisory services. However, the Trust incurs fees and expenses indirectly as a shareholder of the underlying GMO–managed funds, including its indirect share of management or other fees paid to GMO.
Funds Management, an indirect wholly owned subsidiary of Wells Fargo & Company (“Wells Fargo”), serves as the administrator to the Trust. As administrator, Funds Management provides the Trust with facilities, equipment and personnel. Funds Management receives no compensation from the Trust for its services. During the six months ended March 31, 2012, Funds Management voluntarily reimbursed the Trust for expenses in the amount of $16,678.
5. INVESTMENT PORTFOLIO TRANSACTIONS
Purchases and sales of investments, excluding U.S. Government obligations (if any) and short term securities, for the six months ended March 31, 2012 were $1,272,186,619 and $1,445,864,643, respectively.
| | | | | | |
| Notes to Financial Statements (Unaudited) | | Asset Allocation Trust | | | 33 | |
6. INVESTMENTS IN AFFILIATES
A summary of the transactions with affiliates for the six months ended March 31, 2012 was as follows:
| | | | | | | | | | | | | | | | | | | | | | | | | | | | |
| | | Shares, Beginning
of Period | | | Shares
Purchased | | | Shares Sold | | | Shares, End of
Period | | | Value, End of
Period | | | Income from
Affiliated
Investment
Company Shares | | | Capital Gain
Distributions | |
GMO Alpha Only Fund Class IV | | | 33,333,819 | | | | 5,362,988 | | | | (2,846,343 | ) | | | 35,850,464 | | | $ | 866,505,713 | | | $ | 11,325,946 | | | $ | 0 | |
GMO Currency Hedged International Equity Fund Class III | | | 0 | | | | 31,208,438 | | | | (3,654,297 | ) | | | 27,554,141 | | | | 612,804,087 | | | | 4,828,798 | | | | 5,272,228 | |
GMO Debt Opportunities Fund | | | 0 | | | | 5,944,751 | | | | 0 | | | | 5,944,751 | | | | 150,996,672 | | | | 1,174,296 | | | | 982,192 | |
GMO Domestic Bond Fund Class VI | | | 57,992,507 | | | | 0 | | | | (51,548,896 | ) | | | 6,443,611 | | | | 157,675,167 | | | | 829,605 | | | | 0 | |
GMO Emerging Country Debt Fund Class IV | | | 9,629,410 | | | | 898,121 | | | | 0 | | | | 10,527,531 | | | | 101,380,124 | | | | 7,858,561 | | | | 0 | |
GMO Emerging Markets Fund Class VI | | | 75,279,899 | | | | 4,864,215 | | | | (22,715,548 | ) | | | 57,428,566 | | | | 670,765,648 | | | | 12,607,184 | | | | 35,177,733 | |
GMO Flexible Equities Fund Class VI | | | 15,750,490 | | | | 1,786,013 | | | | (2,591,605 | ) | | | 14,944,898 | | | | 289,482,667 | | | | 0 | | | | 0 | |
GMO International Core Equity Fund Class VI | | | 33,440,297 | | | | 1,027,233 | | | | (4,634,933 | ) | | | 29,832,597 | | | | 821,589,733 | | | | 19,485,459 | | | | 0 | |
GMO International Growth Equity Fund Class IV | | | 14,385,433 | | | | 42,839 | | | | (10,985,091 | ) | | | 3,443,181 | | | | 79,399,754 | | | | 862,367 | | | | 0 | |
GMO International Intrinsic Value Fund Class IV | | | 21,876,943 | | | | 5,570,750 | | | | (11,242,763 | ) | | | 16,204,930 | | | | 329,446,233 | | | | 4,698,849 | | | | 0 | |
GMO Quality Equity Fund Class VI | | | 96,494,722 | | | | 5,055,463 | | | | (14,265,060 | ) | | | 87,285,125 | | | | 2,108,808,610 | | | | 18,477,314 | | | | 0 | |
GMO Special Situations Fund Class VI | | | 11,298,523 | | | | 508,344 | | | | (175,513 | ) | | | 11,631,354 | | | | 311,603,985 | | | | 0 | | | | 0 | |
GMO Strategic Fixed Income Fund Class VI | | | 76,157,632 | | | | 4,046,269 | | | | (6,391,689 | ) | | | 73,812,212 | | | | 1,214,210,884 | | | | 65,509,089 | | | | 0 | |
GMO U.S. Treasury Fund Class IV | | | 449,051 | | | | 155 | | | | (743 | ) | | | 448,463 | | | | 11,211,579 | | | | 1,580 | | | | 2,290 | |
| | | | | | | | | | | | | | | | | | | $ | 7,725,880,856 | | | $ | 147,659,048 | | | $ | 41,434,443 | |
7. INDEMNIFICATION
Under the Trust’s organizational documents, the officers and directors are indemnified against certain liabilities that may arise out of performance of their duties to the Trust. Additionally, in the normal course of business, the Trust may enter into contracts with service providers that contain a variety of indemnification clauses. The Trust’s maximum exposure under these arrangements is dependent on future claims that may be made against the Trust and, therefore, cannot be estimated.
8. NEW ACCOUNTING PRONOUNCEMENTS
In December 2011, the Financial Accounting Standards Board (“FASB”) issued Accounting Standard Update (“ASU”) No. 2011-11, Disclosures about Offsetting Assets and Liabilities. ASU 2011-11, which amends FASB ASC Topic 210 Balance Sheet, creates new disclosure requirements requiring entities to disclose both gross and net information for derivatives and other financial instruments that are either offset in the Statement of Assets and Liabilities or subject to an enforceable master netting arrangement or similar agreement. The disclosure requirements are effective for interim and annual reporting periods beginning on or after January 1, 2013. Management is currently evaluating the impact of the update’s adoption on the Fund’s financial statement disclosures.
In May 2011, FASB issued ASU No. 2011-04 “Amendments to Achieve Common Fair Value Measurement and Disclosure Requirements in U.S. GAAP and IFRSs”. ASU No. 2011-04 amends FASB ASC Topic 820, Fair Value Measurements and Disclosures, to establish common requirements for measuring fair value and for disclosing information about fair value measurements in accordance with GAAP. The ASU is effective prospectively for interim and annual periods beginning after December 15, 2011. Management expects that adoption of the ASU will result in additional disclosures in the financial statements, as applicable.
| | | | |
| 34 | | Asset Allocation Trust | | Notes to Financial Statements (Unaudited) |
In April 2011, FASB issued ASU No. 2011-03 “Reconsideration of Effective Control for Repurchase Agreements”. ASU No. 2011-03 amends FASB ASC Topic 860, Transfers and Servicing, specifically the criteria required to determine whether a repurchase agreement (repo) and similar agreements should be accounted for as sales of financial assets or secured borrowings with commitments. ASU No. 2011-03 changes the assessment of effective control by focusing on the transferor’s contractual rights and obligations and removing the criterion to assess its ability to exercise those rights or honor those obligations. This could result in changes to the way entities account for certain transactions including repurchase agreements, mortgage dollar rolls and reverse repurchase agreements. The ASU will become effective on a prospective basis for new transfers and modifications to existing transactions as of the beginning of the first interim or annual period beginning on or after December 15, 2011. Management has evaluated the impact of adopting the ASU and expects no significant changes.
| | | | | | |
| Additional Information (Unaudited) | | Asset Allocation Trust | | | 35 | |
BOARD OF TRUSTEES
The following table provides basic information about the Board of Trustees (the “Trustees”) and Officers of Asset Allocation Trust. Each of the Trustees and Officers listed below acts in identical capacities. All of the Trustees are also Members of the Audit and Governance Committees of Asset Allocation Trust. The mailing address of each Trustee and Officer is 525 Market Street, 12th Floor, San Francisco, CA 94105. Each Trustee and Officer serves an indefinite term, however, each Trustee serves such term until reaching the mandatory retirement age established by the Trustees.
Independent Trustees
| | | | | | |
Name and Year of Birth | | Position Held and Length of Service | | Principal Occupations During Past Five Years | | Other Directorships During
Past Five Years |
Peter G. Gordon
(Born 1942) | | Trustee, since 2010; Chairman, since 2010 (Lead Trustee since 2010) | | Co-Founder, Retired Chairman, President and CEO of Crystal Geyser Water Company. Trustee Emeritus, Colby College | | Wells Fargo Advantage family of funds consisting of 137 funds. |
Isaiah Harris, Jr.
(Born 1952) | | Trustee, since 2010 | | Retired. Prior thereto, President and CEO of BellSouth Advertising and Publishing Corp. from 2005 to 2007, President and CEO of BellSouth Enterprises from 2004 to 2005 and President of BellSouth Consumer Services from 2000 to 2003. Emeritus member of the Iowa State University Foundation Board of Governors. Emeritus Member of the Advisory Board of Iowa State University School of Business. Mr. Harris is a certified public accountant. | | CIGNA Corporation; Deluxe Corporation; Wells Fargo Advantage family of funds consisting of 137 funds. |
Judith M. Johnson
(Born 1949) | | Trustee, since 2010 | | Retired. Prior thereto, Chief Executive Officer and Chief Investment Officer of Minneapolis Employees Retirement Fund from 1996 to 2008. Ms. Johnson is an attorney, certified public accountant and a certified managerial accountant. | | Wells Fargo Advantage family of funds consisting of 137 funds. |
Leroy Keith, Jr.
(Born 1939) | | Trustee, since 2005 | | Chairman, Bloc Global Services (development and construction). Trustee of the Evergreen Funds from 1983 to 2010. Former Managing Director, Almanac Capital Management (commodities firm), former Partner, Stonington Partners, Inc. (private equity fund), former Director, Obagi Medical Products Co. and former Director, Lincoln Educational Services. | | Trustee, Virtus Fund Complex (consisting of 40 portfolios as of 12/31/11); Wells Fargo Advantage family of funds consisting of 137 funds. |
David F. Larcker
(Born 1950) | | Trustee, since 2010 | | James Irvin Miller Professor of Accounting at the Graduate School of Business, Stanford University, Director of Corporate Governance Research Program and Senior Faculty of The Rock Center for Corporate Governance since 2006. From 2005 to 2008, Professor of Accounting at the Graduate School of Business, Stanford University. Prior thereto, Ernst & Young Professor of Accounting at The Wharton School, University of Pennsylvania from 1985 to 2005. | | Wells Fargo Advantage family of funds consisting of 137 funds. |
Olivia S. Mitchell
(Born 1953) | | Trustee, since 2010 | | International Foundation of Employee Benefit Plans Professor, Wharton School of the University of Pennsylvania since 1993. Director of Wharton’s Pension Research Council and Boettner Center on Pensions & Retirement Research, and Research Associate at the National Bureau of Economic Research. Previously, Cornell University Professor from 1978 to 1993. | | Wells Fargo Advantage family of funds consisting of 137 funds. |
Timothy J. Penny
(Born 1951) | | Trustee, since 2010 | | President and CEO of Southern Minnesota Initiative Foundation, a non-profit organization, since 2007 and Senior Fellow at the Humphrey Institute Policy Forum at the University of Minnesota since 1995. Member of the Board of Trustees of NorthStar Education Finance, Inc., a non-profit organization, since 2007. | | Wells Fargo Advantage family of funds consisting of 137 funds. |
| | | | |
| 36 | | Asset Allocation Trust | | Additional Information (Unaudited) |
| | | | | | |
Name and Year of Birth | | Position Held and Length of Service | | Principal Occupations During Past Five Years | | Other Directorships During
Past Five Years |
Michael S. Scofield
(Born 1943) | | Trustee, since 2005 | | Served on the Investment Company Institute’s Board of Governors and Executive Committee from 2008-2011 as well the Governing Council of the Independent Directors Council from 2006-2011 and the Independent Directors Council Executive Committee from 2008-2011. Chairman of the IDC from 2008-2010. Institutional Investor (Fund Directions) Trustee of Year in 2007. Trustee of the Evergreen Funds (and its predecessors) from 1984 to 2010. Chairman of the Evergreen Funds from 2000-2010. Former Trustee of the Mentor Funds. Retired Attorney, Law Offices of Michael S. Scofield and former Director and Chairman, Branded Media Corporation (multi-media branding company). | | Wells Fargo Advantage family of funds consisting of 137 funds. |
Donald C. Willeke
(Born 1940) | | Trustee, since 2010 | | Principal of the law firm of Willeke & Daniels. General Counsel of the Minneapolis Employees Retirement Fund from 1984 until its consolidation into the Minnesota Public Employees Retirement Association on June 30, 2010. Director and Vice Chair of The Free Trust (non-profit corporation). Director of the American Chestnut Foundation (non-profit corporation). | | Wells Fargo Advantage family of funds consisting of 137 funds. |
Officers
| | | | | | |
Name and Year of Birth | | Position Held and
Length of Service | | Principal Occupations During Past Five Years | | |
Karla M. Rabusch
(Born 1959) | | President, since 2010 | | Executive Vice President of Wells Fargo Bank, N.A. and President of Wells Fargo Funds Management, LLC since 2003. Senior Vice President and Chief Administrative Officer of Wells Fargo Funds Management, LLC from 2001 to 2003. | | |
C. David Messman
(Born 1960) | | Secretary, since 2010; Chief Legal Counsel, since 2010 | | Senior Vice President and Secretary of Wells Fargo Funds Management, LLC since 2001. Vice President and Managing Senior Counsel of Wells Fargo Bank, N.A. since 1996. | | |
Kasey Phillips
(Born 1970) | | Treasurer, since 2009 | | Senior Vice President of Wells Fargo Funds Management, LLC since 2009. Senior Vice President of Evergreen Investment Management Company, LLC from 2006 to 2010. Treasurer of the Evergreen Funds from 2005 to 2010. | | |
David Berardi
(Born 1975) | | Assistant Treasurer, since 2009 | | Vice President of Wells Fargo Funds Management, LLC since 2009. Vice President of Evergreen Investment Management Company, LLC from 2008 to 2010. Assistant Vice President of Evergreen Investment Services, Inc. from 2004 to 2008. Manager of Fund Reporting and Control for Evergreen Investment Management Company, LLC from 2004 to 2010. | | |
Jeremy DePalma
(Born 1974) | | Assistant Treasurer, since 2009 | | Senior Vice President of Wells Fargo Funds Management, LLC since 2009. Senior Vice President of Evergreen Investment Management Company, LLC from 2008 to 2010. Vice President, Evergreen Investment Services, Inc. from 2004 to 2007. Head of the Fund Reporting and Control Team within Fund Administration from 2005 to 2010. | | |
Debra Ann Early
(Born 1964) | | Chief Compliance Officer, since 2010 | | Chief Compliance Officer of Wells Fargo Funds Management, LLC since 2007. Chief Compliance Officer of Parnassus Investments from 2005 to 2007. Chief Financial Officer of Parnassus Investments from 2004 to 2007 and Senior Audit Manager of PricewaterhouseCoopers LLP from 1998 to 2004. | | |
| | | | | | |
| Other Information (Unaudited) | | | | | 37 | |
BOARD CONSIDERATION OF INVESTMENT ADVISORY AGREEMENTS:
Wells Fargo Advantage Asset Allocation Fund and Asset Allocation Trust
Under Section 15 of the Investment Company Act of 1940 (the “1940 Act”), each Board of Trustees (each, a “Board” and collectively, the “Boards”) of Wells Fargo Funds Trust (“Funds Trust”) and Asset Allocation Trust (collectively, the “Trusts”), all the members of which have no direct or indirect interest in the investment advisory agreements and are not “interested persons” of the Trusts, as defined in the 1940 Act (the “Independent Trustees”), must determine whether to approve the continuation of the Trusts’ investment advisory agreements. In this regard, at an in person meeting held on March 29-30, 2012 (the “Meeting”), the Funds Trust Board reviewed and re-approved an investment advisory agreement with Wells Fargo Funds Management, LLC (“Funds Management”) for the Wells Fargo Advantage Asset Allocation Fund (“Asset Allocation Trust”). The Asset Allocation Trust Board reviewed and re-approved an investment advisory agreement with Grantham, Mayo, Van Otterloo & Co. LLC (“GMO”) for the Asset Allocation Trust. The Asset Allocation Fund and the Asset Allocation Trust are collectively, the “Funds.” The investment advisory agreements with Funds Management and GMO are collectively referred to as the “Advisory Agreements.”
At the Meeting, the Boards considered the factors and reached the conclusions described below relating to the selection of Funds Management and GMO and continuation of the Advisory Agreements. Prior to the Meeting, the Trustees conferred extensively among themselves and with representatives of Funds Management about these matters. The Boards also met throughout the year and received information that was useful to them in considering the continuation of the Advisory Agreements. The Independent Trustees were assisted in their evaluation of the Advisory Agreements by independent legal counsel, from whom they received separate legal advice and with whom they met separately from Funds Management.
The Asset Allocation Fund is a gateway fund advised by Funds Management that invests substantially all of its assets in Asset Allocation Trust, which in turn invests in underlying funds that are advised by GMO. The Asset Allocation Trust has a substantially similar investment objective and substantially similar investment strategies to the Asset Allocation Fund. Information provided to the Boards regarding the Asset Allocation Fund is also applicable to the Asset Allocation Trust, as relevant.
In providing information to the Boards, funds Management and GMO were guided by a detailed set of requests submitted by the Independent Trustees’ independent legal counsel on their behalf at the start of the Boards’ annual contract renewal process earlier in 2012. In approving the Advisory Agreements, the Boards did not identify any particular information or consideration that was all important or controlling, and each Trustee likely attributed different weights to various factors. The Boards evaluated information provided to them both in terms of the funds generally and with respect to each Fund specifically as it considered appropriate.
Nature, extent and quality of services
The Boards received and considered various information regarding the nature, extent and quality of services provided to the Funds by Funds Management and GMO under the Advisory Agreements. The Boards also received and considered information provided in response to a detailed set of requests submitted by the Independent Trustees’ independent legal counsel on their behalf. The Boards received and considered, among other things, information about the background and experience of senior management of Funds Management, and the qualifications, backgrounds, tenures and responsibilities of the portfolio managers primarily responsible for the day-to-day portfolio management of the Funds.
The Boards evaluated the ability of Funds Management and GMO, based on their respective financial condition, resources, reputation and other attributes, to attract and retain qualified investment professionals, including research, advisory, and supervisory personnel. The Boards further considered the compliance programs and compliance records of Funds Management and GMO. In addition, the Boards took into account the administrative services provided to the Funds by Funds Management and its affiliates.
The Boards’ decision to approve the continuation of the Advisory Agreements was based on a comprehensive evaluation of all of the information provided to them. In considering these matters, the Boards considered not only the specific information presented in connection with the Meeting, but also the knowledge gained over time through interaction with Funds Management and GMO about various topics, including Funds Management’s oversight of service providers.
The above factors, together with those referenced below, are some of the most important, but not necessarily all, factors considered by the Boards in concluding that the nature, extent and quality of the investment advisory services provided
| | | | |
| 38 | | | |
Other Information (Unaudited) |
to each Fund by Funds Management and GMO supported the re-approval of the Advisory Agreements. Although the Boards considered the continuation of the Advisory Agreements for the Funds as part of the larger process of considering the continuation of the advisory agreements for all of the funds in the complex, their decision to continue the Advisory Agreements for the Funds was ultimately made on a fund-by-fund basis.
Fund performance and expenses
The Boards considered the performance results for the Asset Allocation Fund over various time periods ended December 31, 2011. The Boards also considered these results in comparison to the median performance of a universe of relevant funds (the “Universe”) that was determined by Lipper Inc. (“Lipper”) to be similar to the Asset Allocation Fund, and in comparison to the Fund’s benchmark index and to other comparative data. Lipper is an independent provider of investment company data. The Boards received a description of the methodology used by Lipper to select the mutual funds in the Universe.
The Funds Trust Board noted that the performance of the Asset Allocation Fund was higher than or in range of the median performance of the Universe for all periods under review. The Funds Trust Board also noted that the performance of the Asset Allocation Fund was higher than or in range of its benchmark index, the Lipper Global Flex Fund Index, for the periods under review.
With respect to the Asset Allocation Trust, the Asset Allocation Trust Board reviews performance on both an absolute basis and relative to a universe of relevant funds on a quarterly basis. The Asset Allocation Trust Board also took note of the performance of the Asset Allocation Trust in the context of reviewing the performance of the Asset Allocation Fund.
The Funds Trust Board received and considered information regarding the Asset Allocation Fund’s contractual advisory fee and net operating expense ratios and their various components, including actual management fees (which reflect fee waivers, if any), transfer agent, custodian and other non-management fees, Rule 12b-1 and non-Rule 12b-1 fees, service fees and fee waiver and expense reimbursement arrangements. The Funds Trust Board also considered these ratios in comparison to the median ratios of an expense Universe and a narrower expense group of mutual funds (each, an “Expense Group”) that was determined by Lipper to be similar to the Asset Allocation Fund. The Funds Trust Board received a description of the methodology used by Lipper to select the mutual funds in the Asset Allocation Fund’s Expense Group. The Funds Trust Board noted that the net operating expense ratios of the Asset Allocation Fund were in range of the Asset Allocation Fund’s respective Expense Group’s median net operating expense ratio.
The Asset Allocation Trust Board noted that the Asset Allocation Trust did not pay a fee to GMO for its advisory services. The Asset Allocation Trust Board further noted that GMO earns advisory fees from the underlying GMO funds in which the Asset Allocation Trust invests.
Based on the above-referenced considerations and other factors, the Boards concluded that the overall performance and expense structure of the Funds supported the re-approval of the Advisory Agreements for the Funds.
Investment advisory fee rates
The Boards reviewed and considered the contractual investment advisory fee rates that are payable by the Asset Allocation Fund to Funds Management for investment advisory services (the “Advisory Agreement Rates”), both on a stand-alone basis and on a combined basis with the Asset Allocation Fund’s administration fee rates. The Funds Trust Board took into account the separate administrative and other services covered by the administration fee rates. In addition, the Funds Trust Board reviewed and considered the existing fee waiver/cap arrangements applicable to the Advisory Agreement Rates and considered the Advisory Agreement Rates after taking the waivers/caps into account (the “Net Advisory Rates”).
The Funds Trust Board received and considered information comparing the Advisory Agreement Rates and Net Advisory Rates with those of other funds in the Asset Allocation Fund’s Expense Group median. The Funds Trust Board noted that the Advisory Agreement Rates and Net Advisory Rates for the Asset Allocation Fund were higher than the median rate of the Fund’s Expense Group.
The Funds Trust Board also received and considered information about the nature and extent of services offered and fee rates charged by Funds Management to other types of clients. In this regard, the Funds Trust Board received information about differences between the services, and the compliance, reporting, and other legal burdens and risks of providing
| | | | | | |
| Other Information (Unaudited) | | | | | 39 | |
investment advice to mutual funds and those associated with providing advice to non-mutual fund clients such as collective funds or institutional separate accounts.
The Board also received and considered information about the portion of the total management fee that was retained by Funds Management after payment of the fee to GMO for advisory services. The Board also considered this amount in comparison to the median amount paid by an expense Universe that was determined by Lipper to be similar to the Asset Allocation Fund.
The Funds Trust Board determined that the Advisory Agreement Rates for the Asset Allocation Fund, both with and without administration fee rates and before and after waivers, were reasonable in light of the Asset Allocation Fund’s Expense Group information, the net expense ratio commitments, the services covered by the Advisory Agreements, the sub-advised expense information provided by Lipper, and other information provided.
Profitability
The Boards received and considered a profitability analysis of Funds Management, as well as an analysis of the profitability to the collective Wells Fargo businesses that provide services to the Funds. They considered that the information provided to them was necessarily estimated, and that the profitability information provided to them, especially on a fund-by-fund basis, did not necessarily provide a precise tool for evaluating the appropriateness of the Asset Allocation Fund’s Advisory Agreement Rates in isolation. They noted that the levels of profitability of the Asset Allocation Fund to Funds Management varied widely, depending on, among other things, the size and type of fund. The Boards concluded that the profitability reported by Funds Management was not unreasonable.
The Asset Allocation Trust Board did not consider separate profitability information with respect to GMO, which is not affiliated with Funds Management. The Asset Allocation Trust Board noted that the Asset Allocation Trust did not pay fees to GMO for its advisory services and that GMO’s profitability from its relationships with the Asset Allocation Trust managed by them was not a material factor in determining whether to renew the Advisory Agreement with GMO.
Economies of scale
With respect to possible economies of scale, the Funds Trust Board reviewed the breakpoints in the Asset Allocation Fund’s advisory fee structure, which operate generally to reduce the effective Advisory Agreement Rates of the Asset Allocation Fund (as a percentage of Fund assets) as the Asset Allocation Fund grows in size. It considered that, as a fund shrinks in size, breakpoints conversely result in increasing fee levels. The Funds Trust Board noted that it would have on-going opportunities to review the appropriate levels of breakpoints in the future, and concluded that the breakpoints as implemented appeared to be a reasonable step toward sharing economies of scale with the Asset Allocation Fund. However, the Funds Trust Board acknowledged the inherent limitations of any analysis of an investment adviser’s economies of scale and of any attempt to correlate breakpoints with such economies, stemming largely from the Board’s understanding that economies of scale are realized, if at all, by an investment adviser across a variety of products and services, not just with respect to a single fund.
Other benefits to Funds Management and GMO
The Boards received and considered information regarding potential “fall-out” or ancillary benefits received by Funds Management and its affiliates and GMO as a result of their relationship with the Funds. Ancillary benefits could include, among others, benefits directly attributable to the relationship of Funds Management and GMO with the Funds and benefits potentially derived from an increase in Funds Management’s and GMO’s business as a result of their relationship with the Funds (such as the ability to market to shareholders other financial products offered by Funds Management and its affiliates or GMO).
The Funds Trust Board considered that Wells Fargo Funds Distributor, LLC, an affiliate of Funds Management, serves as distributor to the Asset Allocation Fund and receives certain compensation for those services. It also considered that these entities may receive distribution-related fees and shareholder servicing payments (including amounts derived from payments under the funds’ Rule 12b-1 plans) in respect of shares sold or held through them and services provided.
The Boards also reviewed information about whether and to what extent soft dollar credits are sought and how any such credits are utilized and any benefits that may be realized by using an affiliated broker.
| | | | |
| 40 | | | |
Other Information (Unaudited) |
Other factors and broader review
The Boards also considered the markets for distribution of the Asset Allocation Fund’s shares, including the channels through which the Asset Allocation Fund’s shares are offered and sold. The Boards noted that the Asset Allocation Fund is part of one of the few fund families that have both direct-to-fund and intermediary distribution channels. As discussed above, the Boards review detailed materials received from Funds Management and GMO annually as part of the re-approval process under Section 15 of the 1940 Act and also review and assess information about the quality of the services that the Funds receive throughout the year. In this regard, the Boards have reviewed reports of Funds Management at each of its quarterly meetings, which include, among other things, portfolio reviews and performance reports. In addition, the Boards confer with portfolio managers at various times throughout the year.
Conclusion
After considering the above-described factors and based on their deliberations and their evaluation of the information described above, the Boards unanimously approved the continuation of the Advisory Agreements for an additional one-year period.
The following is a list of common abbreviations for terms and entities which may have appeared in this report.
| ACB | — Agricultural Credit Bank |
| ADR | — American Depository Receipt |
| ADS | — American Depository Shares |
| AGC-ICC | — Assured Guaranty Corporation - Insured Custody Certificates |
| AGM | — Assured Guaranty Municipal |
| AMBAC | — American Municipal Bond Assurance Corporation |
| AMT | — Alternative Minimum Tax |
| BAN | — Bond Anticipation Notes |
| BHAC | — Berkshire Hathaway Assurance Corporation |
| CAB | — Capital Appreciation Bond |
| CCAB | — Convertible Capital Appreciation Bond |
| CDA | — Community Development Authority |
| CDO | — Collateralized Debt Obligation |
| COP | — Certificate of Participation |
| DRIVER | — Derivative Inverse Tax-Exempt Receipts |
| DW&P | — ��Department of Water & Power |
| DWR | — Department of Water Resources |
| ECFA | — Educational & Cultural Facilities Authority |
| EDA | — Economic Development Authority |
| EDFA | — Economic Development Finance Authority |
| ETF | — Exchange-Traded Fund |
| FFCB | — Federal Farm Credit Bank |
| FGIC | — Financial Guaranty Insurance Corporation |
| FHA | — Federal Housing Authority |
| FHLB | — Federal Home Loan Bank |
| FHLMC | — Federal Home Loan Mortgage Corporation |
| FICO | — The Financing Corporation |
| FNMA | — Federal National Mortgage Association |
| GDR | — Global Depository Receipt |
| GNMA | — Government National Mortgage Association |
| HCFR | — Healthcare Facilities Revenue |
| HEFA | — Health & Educational Facilities Authority |
| HEFAR | — Higher Education Facilities Authority Revenue |
| HFA | — Housing Finance Authority |
| HFFA | — Health Facilities Financing Authority |
| IBC | — Insured Bond Certificate |
| IDA | — Industrial Development Authority |
| IDAG | — Industrial Development Agency |
| IDR | — Industrial Development Revenue |
| KRW | — Republic of Korea Won |
| LIBOR | — London Interbank Offered Rate |
| LLC | — Limited Liability Company |
| LLP | — Limited Liability Partnership |
| MBIA | — Municipal Bond Insurance Association |
| MFHR | — Multi-Family Housing Revenue |
| MSTR | — Municipal Securities Trust Receipts |
| MUD | — Municipal Utility District |
| NATL-RE | — National Public Finance Guarantee Corporation |
| PCFA | — Pollution Control Finance Authority |
| PCR | — Pollution Control Revenue |
| PFA | — Public Finance Authority |
| PFFA | — Public Facilities Financing Authority |
| PFOTER | — Puttable Floating Option Tax-Exempt Receipts |
| plc | — Public Limited Company |
| PUTTER | — Puttable Tax-Exempt Receipts |
| R&D | — Research & Development |
| RDA | — Redevelopment Authority |
| RDFA | — Redevelopment Finance Authority |
| REIT | — Real Estate Investment Trust |
| ROC | — Reset Option Certificates |
| SAVRS | — Select Auction Variable Rate Securities |
| SBA | — Small Business Authority |
| SFHR | — Single Family Housing Revenue |
| SFMR | — Single Family Mortgage Revenue |
| SPDR | — Standard & Poor’s Depositary Receipts |
| STRIPS | — Separate Trading of Registered Interest and Principal Securities |
| TAN | — Tax Anticipation Notes |
| TIPS | — Treasury Inflation-Protected Securities |
| TRAN | — Tax Revenue Anticipation Notes |
| TCR | — Transferable Custody Receipts |
| TTFA | — Transportation Trust Fund Authority |
| TVA | — Tennessee Valley Authority |
| XLCA | — XL Capital Assurance |
This page is intentionally left blank.


FOR MORE INFORMATION
More information about Wells Fargo Advantage Funds is available free upon request. To obtain literature, please write, e-mail, visit the Fund’s Web site, or call:
Wells Fargo Advantage Funds
P.O. Box 8266
Boston, MA 02266-8266
E-mail: wfaf@wellsfargo.com
Web site: wellsfargoadvantagefunds.com
Individual investors: 1-800-222-8222
Retail investment professionals: 1-888-877-9275
Institutional investment professionals: 1-866-765-0778
This report and the financial statements contained herein are submitted for the general information of the shareholders of Wells Fargo Advantage Funds. If this report is used for promotional purposes, distribution of the report must be accompanied or preceded by a current prospectus. For a prospectus containing more complete information, including charges and expenses, call 1-800-222-8222 or visit the Fund’s Web site at wellsfargoadvantagefunds.com. Please consider the investment objectives, risks, charges, and expenses of the investment carefully before investing. This and other information about Wells Fargo Advantage Funds can be found in the current prospectus. Read the prospectus carefully before you invest or send money.
Wells Fargo Funds Management, LLC, a wholly owned subsidiary of Wells Fargo & Company, provides investment advisory and administrative services for Wells Fargo Advantage Funds. Other affiliates of Wells Fargo & Company provide subadvisory and other services for the Funds. The Funds are distributed by Wells Fargo Funds Distributor, LLC, Member FINRA/SIPC, an affiliate of Wells Fargo & Company.
NOT FDIC INSURED ¡ NO BANK GUARANTEE ¡ MAY LOSE VALUE
© 2012 Wells Fargo Funds Management, LLC. All rights reserved.
| | |
 | | 208983 05-12 SA224/SAR224 3-12 |

Wells Fargo Advantage
Diversified Capital Builder Fund

Semi-Annual Report
March 31, 2012

Reduce clutter. Save trees.
Sign up for electronic delivery of prospectuses and shareholder reports at wellsfargo.com/advantagedelivery
Contents
The views expressed and any forward-looking statements are as of March 31, 2012, unless otherwise noted, and are those of the Fund managers and/or Wells Fargo Funds Management, LLC. Discussions of individual securities, or the markets generally, or any Wells Fargo Advantage Fund are not intended as individual recommendations. Future events or results may vary significantly from those expressed in any forward-looking statements; the views expressed are subject to change at any time in response to changing circumstances in the market. Wells Fargo Funds Management, LLC, disclaims any obligation to publicly update or revise any views expressed or forward-looking statements.
NOT FDIC INSURED ¡ NO BANK GUARANTEE ¡ MAY LOSE VALUE

WELLS FARGO INVESTMENT HISTORY
| | |
| |
| 1932 | | Keystone creates one of the first mutual fund families. |
| |
| 1971 | | Wells Fargo & Company introduces one of the first institutional index funds. |
| |
| 1978 | | Wells Fargo applies Markowitz and Sharpe’s research on Modern Portfolio Theory to introduce one of the industry’s first Tactical Asset Allocation (TAA) models in institutional separately managed accounts. |
| |
| 1984 | | Wells Fargo Stagecoach Funds launches its first asset allocation fund. |
| |
| 1989 | | The Tactical Asset Allocation (TAA) Model is first applied to Wells Fargo’s asset allocation mutual funds. |
| |
| 1994 | | Wells Fargo introduces the LifePath Funds, one of the first suites of target date funds (now the Wells Fargo Advantage Dow Jones Target Date FundsSM). |
| |
| 1996 | | Evergreen Investments and Keystone Funds merge. |
| |
| 1997 | | Wells Fargo launches Wells Fargo Advantage WealthBuilder PortfoliosSM, a fund-of-funds suite of products that includes the use of quantitative models to shift assets among investment styles. |
| |
| 1999 | | Norwest Advantage Funds and Stagecoach Funds are reorganized into Wells Fargo Funds after the merger of Norwest and Wells Fargo. |
| |
| 2002 | | Evergreen Retail and Evergreen Institutional companies form the umbrella asset management company, Evergreen Investments. |
| |
| 2005 | | The integration of Strong Funds with Wells Fargo Funds creates Wells Fargo Advantage Funds, resulting in one of the top 20 mutual fund companies in the United States. |
| |
| 2006 | | Wells Fargo Advantage Funds relaunches the target date product line as Wells Fargo Advantage Dow Jones Target Date Funds. |
| |
| 2010 | | The mergers and reorganizations of Evergreen and Wells Fargo Advantage mutual funds are completed, unifying the families under the brand of Wells Fargo Advantage Funds. |
Wells Fargo Advantage Funds®
Wells Fargo Advantage Funds skillfully guides institutions, financial advisors, and individuals through the investment terrain to help them reach their financial objectives. Everything we do on behalf of investors is backed by our unique combination of qualifications.
Strength
Our organization is built on the standards of integrity and service established by our parent company—Wells Fargo & Company—more than 150 years ago. And, because we’re part of a highly diversified financial enterprise, we offer the depth of resources to help investors succeed.
Expertise
Our multi-boutique model offers investors access to the independent thinking of premier investment managers that have been chosen for their time-tested strategies. While each team specializes in a specific investment strategy, collectively they provide investors a wide choice of distinct investment styles. Our dedication to investment excellence doesn’t end with our expertise in manager selection—risk management, analysis, and rigorous ongoing review seek to ensure each manager’s investment process remains consistent.
Partnership
Our collaborative approach is built around understanding the needs and goals of our clients. By adhering to core principles of sound judgment and steady guidance, we support you through every stage of the investment decision process.
Carefully consider a fund’s investment objectives, risks, charges, and expenses before investing. For a current prospectus and, if available, a summary prospectus, containing this and other information, visit wellsfargoadvantagefunds.com. Read it carefully before investing.
Wells Fargo Funds Management, LLC, a wholly owned subsidiary of Wells Fargo & Company, provides investment advisory and administrative services for Wells Fargo Advantage Funds®. Other affiliates of Wells Fargo & Company provide subadvisory and other services for the Funds. The Funds are distributed by Wells Fargo Funds Distributor, LLC, Member FINRA/SIPC, an affiliate of Wells Fargo & Company.
“Dow Jones®” and “Dow Jones Target Date IndexesSM” are service marks of Dow Jones Trademark Holdings, LLC (“Dow Jones”), have been licensed to CME Group Index Services LLC (“CME Indexes”) and have been sublicensed for use for certain purposes by Global Index Advisors, Inc, and Wells Fargo Funds Management, LLC. The Wells Fargo Advantage Dow Jones Target Date FundsSM based on the Dow Jones Target Date IndexesSM, are not sponsored, endorsed, sold or promoted by Dow Jones, CME Indexes or their respective affiliates and none of them makes any representation regarding the advisability of investing in such product(s).
NOT FDIC INSURED ¡ NO BANK GUARANTEE ¡ MAY LOSE VALUE
Not part of the semi-annual report.
Wells Fargo Advantage Funds offers more than 110 mutual funds across a wide range of asset classes, representing over $213 billion in assets under management, as of March 31, 2012.
| | | | |
| Equity Funds | | | | |
Asia Pacific Fund | | Equity Value Fund | | Precious Metals Fund |
C&B Large Cap Value Fund | | Global Opportunities Fund | | Premier Large Company Growth Fund |
C&B Mid Cap Value Fund | | Growth Fund | | Small Cap Opportunities Fund |
Capital Growth Fund | | Index Fund | | Small Cap Value Fund |
Common Stock Fund | | International Equity Fund | | Small Company Growth Fund |
Disciplined U.S. Core Fund | | International Value Fund | | Small Company Value Fund |
Discovery Fund† | | Intrinsic Small Cap Value Fund | | Small/Mid Cap Core Fund |
Diversified Equity Fund | | Intrinsic Value Fund | | Small/Mid Cap Value Fund |
Diversified International Fund | | Intrinsic World Equity Fund | | Special Mid Cap Value Fund |
Diversified Small Cap Fund | | Large Cap Core Fund | | Special Small Cap Value Fund |
Emerging Growth Fund | | Large Cap Growth Fund | | Specialized Technology Fund |
Emerging Markets Equity Fund | | Large Company Value Fund | | Strategic Large Cap Growth Fund |
Endeavor Select Fund† | | Omega Growth Fund | | Traditional Small Cap Growth Fund |
Enterprise Fund† | | Opportunity Fund† | | Utility and Telecommunications Fund |
| Bond Funds | | | | |
Adjustable Rate Government Fund | | Inflation-Protected Bond Fund | | Short-Term Bond Fund |
California Limited-Term Tax-Free Fund | | Intermediate Tax/AMT-Free Fund | | Short-Term High Yield Bond Fund |
California Tax-Free Fund | | International Bond Fund | | Short-Term Municipal Bond Fund |
Colorado Tax-Free Fund | | Minnesota Tax-Free Fund | | Strategic Municipal Bond Fund |
Government Securities Fund | | Municipal Bond Fund | | Total Return Bond Fund |
High Income Fund | | North Carolina Tax-Free Fund | | Ultra Short-Term Income Fund |
High Yield Bond Fund | | Pennsylvania Tax-Free Fund | | Ultra Short-Term Municipal Income Fund |
Income Plus Fund | | Short Duration Government Bond Fund | | Wisconsin Tax-Free Fund |
| Asset Allocation Funds | | | | |
Absolute Return Fund | | WealthBuilder Equity Portfolio† | | Target 2020 Fund† |
Asset Allocation Fund | | WealthBuilder Growth Allocation Portfolio† | | Target 2025 Fund† |
Conservative Allocation Fund | | WealthBuilder Growth Balanced Portfolio† | | Target 2030 Fund† |
Diversified Capital Builder Fund | | WealthBuilder Moderate Balanced Portfolio† | | Target 2035 Fund† |
Diversified Income Builder Fund | | WealthBuilder Tactical Equity Portfolio† | | Target 2040 Fund† |
Growth Balanced Fund | | Target Today Fund† | | Target 2045 Fund† |
Index Asset Allocation Fund | | Target 2010 Fund† | | Target 2050 Fund† |
Moderate Balanced Fund | | Target 2015 Fund† | | Target 2055 Fund† |
WealthBuilder Conservative Allocation Portfolio† | | | | |
| Money Market Funds | | | | |
100% Treasury Money Market Fund | | Heritage Money Market Fund† | | National Tax-Free Money Market Fund |
California Municipal Money Market Fund | | Money Market Fund | | Prime Investment Money Market Fund |
Cash Investment Money Market Fund | | Municipal Cash Management Money Market Fund | | Treasury Plus Money Market Fund |
Government Money Market Fund | | Municipal Money Market Fund | | |
| Variable Trust Funds1 | | | | |
VT Discovery Fund† | | VT Intrinsic Value Fund | | VT Small Cap Growth Fund |
VT Index Asset Allocation Fund | | VT Omega Growth Fund | | VT Small Cap Value Fund |
VT International Equity Fund | | VT Opportunity Fund† | | VT Total Return Bond Fund |
An investment in a money market fund is not insured or guaranteed by the Federal Deposit Insurance Corporation or any other government agency. Although the Wells Fargo Advantage Money Market Funds seek to preserve the value of your investment at $1.00 per share, it is possible to lose money by investing in a money market fund.
| 1. | The Variable Trust Funds are generally available only through insurance company variable contracts. |
| † | In this report, the Wells Fargo Advantage Discovery FundSM, Wells Fargo Advantage Endeavor Select FundSM, Wells Fargo Advantage Enterprise FundSM, Wells Fargo Advantage Opportunity FundSM, Wells Fargo Advantage WealthBuilder Conservative Allocation PortfolioSM, Wells Fargo Advantage WealthBuilder Equity PortfolioSM, Wells Fargo Advantage WealthBuilder Growth Allocation PortfolioSM, Wells Fargo Advantage WealthBuilder Growth Balanced PortfolioSM, Wells Fargo Advantage WealthBuilder Moderate Balanced PortfolioSM, Wells Fargo Advantage WealthBuilder Tactical Equity PortfolioSM, Wells Fargo Advantage Dow Jones Target Today FundSM, Wells Fargo Advantage Dow Jones Target 2010 FundSM, Wells Fargo Advantage Dow Jones Target 2015 FundSM, Wells Fargo Advantage Dow Jones Target 2020 FundSM, Wells Fargo Advantage Dow Jones Target 2025 FundSM, Wells Fargo Advantage Dow Jones Target 2030 FundSM, Wells Fargo Advantage Dow Jones Target 2035 FundSM, Wells Fargo Advantage Dow Jones Target 2040 FundSM, Wells Fargo Advantage Dow Jones Target 2045 FundSM, Wells Fargo Advantage Dow Jones Target 2050 FundSM, Wells Fargo Advantage Dow Jones Target 2055 FundSM, Wells Fargo Advantage Heritage Money Market FundSM, Wells Fargo Advantage VT Discovery FundSM, and Wells Fargo Advantage VT Opportunity FundSM are referred to as the Discovery Fund, Endeavor Select Fund, Enterprise Fund, Opportunity Fund, WealthBuilder Conservative Allocation Portfolio, WealthBuilder Equity Portfolio, WealthBuilder Growth Allocation Portfolio, WealthBuilder Growth Balanced Portfolio, WealthBuilder Moderate Balanced Portfolio, WealthBuilder Tactical Equity Portfolio, Target Today Fund, Target 2010 Fund, Target 2015 Fund, Target 2020 Fund, Target 2025 Fund, Target 2030 Fund, Target 2035 Fund, Target 2040 Fund, Target 2045 Fund, Target 2050 Fund, Target 2055 Fund, Heritage Money Market Fund, VT Discovery Fund, and VT Opportunity Fund, respectively. |
Not part of the semi-annual report.
| | | | |
| 2 | | Wells Fargo Advantage Diversified Capital Builder Fund | | Letter to Shareholders |

Karla M. Rabusch,
President
Wells Fargo Advantage Funds
The financial markets throughout most of the past six months may best be described as a risk-on/risk-off trading environment in response to the uncertainty about the sustainability of the U.S. economic recovery, ongoing concerns about the Greek debt crisis, and the overall health of the eurozone.
After struggling in the early part of the six-month period, most equity markets rallied to post extraordinary total returns on the whole. In fact, most of the major U.S. equity indexes realized the strongest first-quarter performance in over 10 years during the first three months of 2012.
Dear Valued Shareholder:
We’re pleased to offer you this semi-annual report for the Wells Fargo Advantage Diversified Capital Builder Fund for the six-month period that ended March 31, 2012.
The financial markets throughout most of the past six months may best be described as a risk-on/risk-off trading environment in response to the uncertainty about the sustainability of the U.S. economic recovery, ongoing concerns about the Greek debt crisis, and the overall health of the eurozone. When volatility and uncertainty were high, investors sold risky assets such as high-beta1 equities, commodities, emerging markets securities, and high-yield bonds, in preference for the relative safety of U.S. Treasuries. In periods of low volatility, investor risk tolerance sharply rose, and the markets sought out the higher yield and return potential of those riskier investments.
During the first quarter of 2012, investor sentiment appeared to be more positive and balanced. This recent shift in sentiment was the result of improvement in the global macroeconomic backdrop, which contributed to a less volatile market environment and more stable consensus earnings growth outlook. These developments also encouraged investors to refocus on underlying fundamentals and a longer-term investment perspective, which may have sparked the first-quarter equity rally led by stocks and sectors that were shunned at points in 2011, notably retail and higher-growth technology names. In addition, as investors’ risk tolerance increased during the period, corporate bonds, including high-yield bonds, were favored over the relative safety and lower yields offered by U.S. Treasuries.
After struggling in the early part of the six-month period, most equity markets rallied to post extraordinary total returns on the whole. In fact, most of the major U.S. equity indexes realized the strongest first-quarter performance in over 10 years during the first three months of 2012.
During the six-month period, the S&P 500 Index2 and the Russell 3000® Index3 posted returns of 25.89% and 26.55%, respectively, while the Barclays U.S. Aggregate Bond Index4, representing the universe of investment-grade U.S. bonds, posted a total return of 1.43%. By comparison, the Barclays U.S. Treasury Index5 and Barclays 20+ Year U.S. Treasury Index6 returned (0.41)% and (5.02)%, respectively, while the Barclays U.S. Corporate High Yield Bond Index7 added 12.14% during the period.
On the international front, the MSCI EAFE Index8 returned 13.12% during the six-month period, while the BofA Merrill Lynch Global Broad Market Ex. U.S. Index9, representative of the international investment-grade bond market, returned 0.78%.
| 1. | Beta measures fund volatility relative to general market movements. It is a standardized measure of systematic risk in comparison to a specified index. The benchmark beta is 1.00 by definition. Beta is based on historical performance and does not represent future results. |
| 2. | The S&P 500 Index consists of 500 stocks chosen for market size, liquidity, and industry group representation. It is a market-value weighted index with each stock’s weight in the index proportionate to its market value. You cannot invest directly in an index. |
| 3. | The Russell 3000® Index measures the performance of the 3,000 largest U.S. companies based on total market capitalization, which represents approximately 98% of the investable U.S. equity market. You cannot invest directly in an index. |
| 4. | The Barclays U.S. Aggregate Bond Index is composed of the Barclays Government/Credit Index and the Mortgage-Backed Securities Index and includes U.S. Treasury issues, agency issues, corporate bond issues, and mortgage-backed securities. You cannot invest directly in an index. |
| 5. | The Barclays U.S. Treasury Index is an index of U.S. Treasury securities. You cannot invest directly in an index. |
| | | | | | |
| Letter to Shareholders | | Wells Fargo Advantage Diversified Capital Builder Fund | | | 3 | |
The developed global economies regained some momentum during the period.
Most global economies modestly improved during the six-month period, but their paths were uneven, primarily due to persistently sluggish jobs growth and a flat housing market affecting the U.S. and the ongoing sovereign debt concerns impacting the eurozone.
The U.S. Bureau of Economic Analysis reported that U.S. gross domestic product (GDP) expanded to an annual growth rate of 1.8% in the third quarter of 2011, re-igniting hopes of a sustainable economic recovery. Those hopes were buoyed further by the final estimate of fourth-quarter of 2011 GDP, which showed that growth accelerated to a 3.0% annual rate. While few economists now believe that the U.S. economy is in danger of sliding back into recession, many continue to expect a tepid economic growth environment in 2012.
Within the eurozone, GDP grew at an annualized rate of 1.5% for 2011, which was modestly weaker from a year earlier when eurozone GDP was reported at an annualized rate of 2.0% in the fourth quarter of 2010. Considering the fiscal challenges that faced European countries throughout 2011—stemming, primarily, from the reemergence of the Greek debt crisis—most economists had expected weaker economic conditions in 2011. While several steps have been taken by the International Monetary Fund and the European Central Bank to address the ongoing fiscal challenges in Europe, economic conditions of many countries in the eurozone are likely to remain weak throughout 2012.
Central banks across the globe remain committed to accommodative policies.
With inflation in check, the U.S. Federal Reserve (Fed) held its target range for the federal funds rate—a proxy for short-term interest rates—steady at 0% to 0.25%. Last summer, the Federal Open Market Committee (FOMC) issued a statement explaining that economic conditions were likely to warrant exceptionally low levels for the federal funds rate through at least mid-2013—a timetable that was later revised to late 2014 following the FOMC meeting on January 25, 2012.
The European Central Bank (ECB) also continued to maintain an accommodative monetary policy throughout the period, primarily in efforts to stave off the contagion risk stemming from the ongoing concerns about the potential of Greece defaulting on its sovereign bonds. Fortunately, Greece received another bailout and was able to restructure its outstanding debt in February 2012, which alleviated near-term contagion risks and the possibility of the euro collapsing. However, the agreement does not fully address longer-term structural issues that affect not only Greece, but several other countries across the eurozone.
| 6. | The Barclays 20+ Year U. S. Treasury Index is an unmanaged index composed of securities in the U.S. Treasury Index with maturities of 20 years or greater. You cannot invest directly in an index. |
| 7. | The Barclays U.S. Corporate High Yield Bond Index is an unmanaged, U.S. dollar denominated, nonconvertible, non-investment grade debt index. The index consists of domestic and corporate bonds rated Ba and below with a minimum outstanding amount of $150 million. You cannot invest directly in an index. |
| 8. | The Morgan Stanley Capital International Europe, Australasia, and Far East (“MSCI EAFE”) Index is an unmanaged group of securities widely regarded by investors to be representations of the stock markets of Europe, Australasia, and the Far East. You cannot invest directly in an index. Source: MSCI. MSCI makes no express or implied warranties or representations and shall have no liability whatsoever with respect to any MSCI data contained herein. The MSCI data may not be further redistributed or used as a basis for other indexes or any securities or financial products. This report is not approved, reviewed or produced by MSCI. |
| 9. | The BofA Merrill Lynch Global Broad Market Ex. U.S. Index tracks the performance of investment grade debt publicly issued in the major domestic and euro bond markets, including sovereign, quasi-government, corporate, securitized and collateralized securities and excludes all securities denominated in U.S. dollars. You cannot invest directly in an index. |
| | | | |
| 4 | | Wells Fargo Advantage Diversified Capital Builder Fund | | Letter to Shareholders |
Recognizing the drag the persistent sovereign debt crisis has had on financial stability across the eurozone, the ECB-introduced additional liquidity into the European banking system through its long-term refinancing operations (LTRO). The LTRO program effectively encourages European banks to buy sovereign bonds of the eurozone governments, helping to push yields lower on bonds from financially fragile countries like Spain and Italy. This type of activity helps to reduce the near-term risk that those countries would experience funding issues. From a global credit market perspective, this additional liquidity further helps alleviate fears of contagion and causes risk premiums to decline—an ideal scenario for equities and high-yield bonds.
Recent events have not altered our message to shareholders.
The heightened volatility across the global financial markets during 2011 and lingering uncertainties about the outlook going forward have left many investors questioning their resolve—and their investments. Yet it is precisely at such times that the market may present opportunities—as well as challenges—for prudent investors. For many investors, simply building and maintaining a well-diversified10 investment plan focused on clear financial objectives is the best long-term strategy.
Thank you for choosing to invest with Wells Fargo Advantage Funds. We appreciate your confidence in us and remain committed to helping you meet your financial needs. For current information about your fund investments, contact your investment professional, visit our Web site at wellsfargoadvantagefunds.com, or call us directly at 1-800-222-8222. We are available 24 hours a day, 7 days a week.
Sincerely,

Karla M. Rabusch
President
Wells Fargo Advantage Funds
Notice to Shareholders
The Board of Trustees for Wells Fargo Advantage Funds has unanimously approved the following modifications to certain net asset value (NAV) waiver privileges and commission schedules:
| | n | | Effective May 1, 2012, automatic investment plan (AIP) purchases and proceeds received from systematic withdrawals will no longer qualify for NAV repurchase privileges. | |
| | n | | Effective May 1, 2012, discretionary rights to waive the upfront commission for Class C and “jumbo” Class A share purchases will no longer be granted to broker/dealers. However, we will continue to waive the Class C shares contingent deferred sales charge for redemptions by employer-sponsored retirement plans where the dealer of record waived its commission at the time of purchase. | |
| | n | | Effective July 31, 2012, NAV purchase privileges for former Evergreen Class IS and Class R shareholders are being modified to remove the ability to purchase Class A shares at NAV unless those shares are held directly with the Fund on or after July 31, 2012. | |
Please contact your investment professional or call us directly at 1-800-222-8222 if you have any questions on this Notice to Shareholders.
| 10. | Diversification does not assure or guarantee better performance and cannot eliminate the risk of investment losses. |
| | | | | | |
| Performance Highlights (Unaudited) | | Wells Fargo Advantage Diversified Capital Builder Fund | | | 5 | |
INVESTMENT OBJECTIVE
The Fund seeks long-term total return, consisting of capital appreciation and current income.
ADVISER
Wells Fargo Funds Management, LLC
SUB-ADVISER
Wells Capital Management Incorporated
PORTFOLIO MANAGER
Margaret Patel
FUND INCEPTION
September 11, 1935
| | | | |
TEN LARGEST HOLDINGS1 (AS OF MARCH 31, 2012) | | | |
Kinder Morgan Incorporated | | | 4.98% | |
Valeant Pharmaceuticals International Incorporated, 7.00%, 10/01/2020 | | | 4.72% | |
American Tower Corporation | | | 4.64% | |
Freeport-McMoRan Copper & Gold Incorporated Class B | | | 4.20% | |
Cameron International Corporation | | | 3.50% | |
National Oilwell Varco Incorporated | | | 3.36% | |
Apple Incorporated | | | 3.09% | |
Agilent Technologies Incorporated | | | 2.74% | |
FLIR Systems Incorporated | | | 2.73% | |
Cliffs Natural Resources Incorporated | | | 2.68% | |
| | |
PORTFOLIO ALLOCATION2 (AS OF MARCH 31, 2012) | | |
|
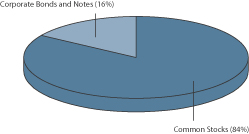 |
| 1. | The ten largest holdings are calculated based on the value of the securities divided by total net assets of the Fund. Holdings are subject to change and may have changed since the date specified. |
| 2. | Portfolio allocation is subject to change and is calculated based on the total long-term investments of the Fund. |
| | | | |
| 6 | | Wells Fargo Advantage Diversified Capital Builder Fund | | Performance Highlights (Unaudited) |
AVERAGE ANNUAL TOTAL RETURN3 (%) (AS OF MARCH 31, 2012)
| | | | | | | | | | | | | | | | | | | | | | | | | | | | | | | | | | | | | | | | | | | | |
| | | | | | Including Sales Charge | | | Excluding Sales Charge | | | Expense Ratios4 | |
| | | Inception Date | | | 6 Months* | | | 1 Year | | | 5 Year | | | 10 Year | | | 6 Months* | | | 1 Year | | | 5 Year | | | 10 Year | | | Gross | | | Net5 | |
Class A (EKBAX) | | | 01/20/1998 | | | | 15.31 | | | | (9.53 | ) | | | (0.79 | ) | | | 2.07 | | | | 22.25 | | | | (4.06 | ) | | | 0.39 | | | | 2.67 | | | | 1.21% | | | | 1.20% | |
Class B (EKBBX)** | | | 09/11/1935 | | | | 16.63 | | | | (9.46 | ) | | | (0.59 | ) | | | 2.15 | | | | 21.63 | | | | (4.76 | ) | | | (0.29 | ) | | | 2.15 | | | | 1.96% | | | | 1.95% | |
Class C (EKBCX) | | | 01/22/1998 | | | | 20.60 | | | | (5.84 | ) | | | (0.37 | ) | | | 1.91 | | | | 21.60 | | | | (4.84 | ) | | | (0.37 | ) | | | 1.91 | | | | 1.96% | | | | 1.95% | |
Administrator Class (EKBDX) | | | 07/30/2010 | | | | | | | | | | | | | | | | | | | | 22.35 | | | | (3.82 | ) | | | 0.54 | | | | 2.81 | | | | 1.05% | | | | 0.95% | |
Institutional Class (EKBYX) | | | 01/26/1998 | | | | | | | | | | | | | | | | | | | | 22.42 | | | | (3.65 | ) | | | 0.70 | | | | 2.98 | | | | 0.78% | | | | 0.78% | |
Diversified Capital Builder Blended Index6 | | | | | | | | | | | | | | | | | | | | | | | 22.47 | | | | 7.41 | | | | 3.70 | | | | 5.73 | | | | | | | | | |
BofA Merrill Lynch High Yield Master Index7 | | | | | | | | | | | | | | | | | | | | | | | 11.53 | | | | 5.71 | | | | 7.74 | | | | 8.86 | | | | | | | | | |
Russell 1000® Index8 | | | | | | | | | | | | | | | | | | | | | | | 26.27 | | | | 7.86 | | | | 2.19 | | | | 4.53 | | | | | | | | | |
| * | Returns for periods of less than one year are not annualized. |
| ** | Class B shares are closed to investment, except in connection with the reinvestment of any distributions and permitted exchanges. |
Figures quoted represent past performance, which is no guarantee of future results and do not reflect the deduction of taxes that a shareholder may pay on fund distributions or the redemption of fund shares. Investment return and principal value of an investment will fluctuate so that an investor’s shares, when redeemed, may be worth more or less than their original cost. Performance shown without sales charges would be lower if sales charges were reflected. Current performance may be lower or higher than the performance data quoted and assumes the reinvestment of dividends and capital gains. Current month-end performance is available on the Fund’s Web site – wellsfargoadvantagefunds.com
Index returns do not include transaction costs associated with buying and selling securities, any mutual fund fees or expenses or any taxes. It is not possible to invest directly in an index.
For Class A shares, the maximum front-end sales charge is 5.75%. For Class B shares, the maximum contingent deferred sales charge is 5.00%. For Class C shares, the maximum contingent deferred sales charge is 1.00%. Performance including sales charge assumes the sales charge for the corresponding time period. Administrator Class and Institutional Class shares are sold without a front-end sales charge or contingent deferred sales charge.
Balanced funds may invest in stocks and bonds. Stock values fluctuate in response to the activities of individual companies and general market and economic conditions. Bond values fluctuate in response to the financial condition of individual issuers, general market and economic conditions, and changes in interest rates. In general, when interest rates rise, bond values fall and investors may lose principal value. Certain investment strategies tend to increase the total risk of an investment (relative to the broader market). This Fund is exposed to foreign investment risk, high-yield risk securities, and smaller-company securities risk. Consult the Fund’s prospectus for additional information on these and other risks.
| 3. | Historical performance shown for the Administrator Class shares prior to their inception reflects the performance of the Institutional Class shares, adjusted to reflect the higher expenses applicable to the Administrator Class shares. Historical performance shown for all classes of the Fund prior to July 12, 2010 is based on the performance of the Fund’s predecessor, Evergreen Diversified Capital Builder Fund. |
| 4. | Reflects the expense ratios as stated in the most recent prospectuses. |
| 5. | The Adviser has committed through July 11, 2013 to waive fees and/or reimburse expenses to the extent necessary to cap the Fund’s Total Annual Fund Operating Expenses After Fee Waiver, excluding certain expenses, at the amounts shown above. Without this cap, the Fund’s returns would have been lower. |
| 6. | Source: Wells Fargo Funds Management, LLC. The Diversified Capital Builder Blended Index is composed of the following indexes: Russell 1000® Index (75%) and BofA Merrill Lynch High Yield Master Index (25%). You cannot invest directly in an index. |
| 7. | BofA Merrill Lynch High Yield Master Index is an unmanaged market index that provides a broad-based performance measure of the non-investment grade U.S. domestic bond index. You cannot invest directly in an index. |
| 8. | The Russell 1000® Index measures the performance of the 1,000 largest companies in the Russell 3000® Index, which represents approximately 92% of the total market capitalization of the Russell 3000 Index. You cannot invest directly in an index. |
| | | | | | |
| Fund Expenses (Unaudited) | | Wells Fargo Advantage Diversified Capital Builder Fund | | | 7 | |
As a shareholder of the Fund, you incur two types of costs: (1) transaction costs, including sales charges (loads) on purchase payments and contingent deferred sales charges (if any) on redemptions and (2) ongoing costs, including management fees; distribution (12b-1) and/or shareholder service fees; and other Fund expenses. This example is intended to help you understand your ongoing costs (in dollars) of investing in the Fund and to compare these costs with the ongoing costs of investing in other mutual funds.
The example is based on an investment of $1,000 invested at the beginning of the six-month period and held for the entire period from October 1, 2011 to March 31, 2012.
Actual Expenses
The “Actual” line of the table below provides information about actual account values and actual expenses. You may use the information in this line, together with the amount you invested, to estimate the expenses that you paid over the period. Simply divide your account value by $1,000 (for example, an $8,600 account value divided by $1,000 = 8.6), then multiply the result by the number in the “Actual” line under the heading entitled “Expenses Paid During Period” for your applicable class of shares to estimate the expenses you paid on your account during this period.
Hypothetical Example for Comparison Purposes
The “Hypothetical” line of the table below provides information about hypothetical account values and hypothetical expenses based on the Fund’s actual expense ratio and an assumed rate of return of 5% per year before expenses, which is not the Fund’s actual return. The hypothetical account values and expenses may not be used to estimate the actual ending account balance or expenses you paid for the period. You may use this information to compare the ongoing costs of investing in the Fund and other funds. To do so, compare this 5% hypothetical example with the 5% hypothetical examples that appear in the shareholder reports of the other funds.
Please note that the expenses shown in the table are meant to highlight your ongoing costs only and do not reflect any transactional costs, such as sales charges (loads) and contingent deferred sales charges. Therefore, the “Hypothetical” line of the table is useful in comparing ongoing costs only, and will not help you determine the relative total costs of owning different funds. In addition, if these transactional costs were included, your costs would have been higher.
| | | | | | | | | | | | | | | | |
| | | Beginning
Account Value
10-01-2011 | | | Ending
Account Value
03-31-2012 | | | Expenses
Paid During
the Period1 | | | Net Annual
Expense Ratio | |
Class A | | | | | | | | | | | | | | | | |
Actual | | $ | 1,000.00 | | | $ | 1,222.47 | | | $ | 6.67 | | | | 1.20 | % |
Hypothetical (5% return before expenses) | | $ | 1,000.00 | | | $ | 1,019.00 | | | $ | 6.06 | | | | 1.20 | % |
Class B | | | | | | | | | | | | | | | | |
Actual | | $ | 1,000.00 | | | $ | 1,216.34 | | | $ | 10.80 | | | | 1.95 | % |
Hypothetical (5% return before expenses) | | $ | 1,000.00 | | | $ | 1,015.25 | | | $ | 9.82 | | | | 1.95 | % |
Class C | | | | | | | | | | | | | | | | |
Actual | | $ | 1,000.00 | | | $ | 1,216.03 | | | $ | 10.80 | | | | 1.95 | % |
Hypothetical (5% return before expenses) | | $ | 1,000.00 | | | $ | 1,015.25 | | | $ | 9.82 | | | | 1.95 | % |
Administrator Class | | | | | | | | | | | | | | | | |
Actual | | $ | 1,000.00 | | | $ | 1,223.54 | | | $ | 5.23 | | | | 0.94 | % |
Hypothetical (5% return before expenses) | | $ | 1,000.00 | | | $ | 1,020.30 | | | $ | 4.75 | | | | 0.94 | % |
Institutional Class | | | | | | | | | | | | | | | | |
Actual | | $ | 1,000.00 | | | $ | 1,224.23 | | | $ | 4.34 | | | | 0.78 | % |
Hypothetical (5% return before expenses) | | $ | 1,000.00 | | | $ | 1,021.10 | | | $ | 3.94 | | | | 0.78 | % |
| 1. | Expenses paid is equal to the annualized expense ratio of each class multiplied by the average account value over the period, multiplied by the number of days in the most recent fiscal half-year divided by the number of days in the fiscal year (to reflect the one-half year period). |
| | | | |
| 8 | | Wells Fargo Advantage Diversified Capital Builder Fund | | Portfolio of Investments—March 31, 2012 (Unaudited) |
| | | | | | | | | | | | |
| Security Name | | | | | | Shares | | | Value | |
| | | | | | | | | | | | |
| | | | |
Common Stocks: 83.96% | | | | | | | | | | | | |
| | | | |
Consumer Discretionary: 3.46% | | | | | | | | | | | | |
| | | | |
| Hotels, Restaurants & Leisure: 3.46% | | | | | | | | | | | | |
Marriott International Incorporated Class A « | | | | | | | 315,000 | | | $ | 11,922,750 | |
McDonald’s Corporation | | | | | | | 70,000 | | | | 6,867,000 | |
| | | | |
| | | | | | | | | | | 18,789,750 | |
| | | | | | | | | | | | |
| | | | |
Consumer Staples: 4.71% | | | | | | | | | | | | |
| | | | |
| Food Products: 4.17% | | | | | | | | | | | | |
General Mills Incorporated | | | | | | | 350,000 | | | | 13,807,500 | |
H.J. Heinz Company | | | | | | | 165,000 | | | | 8,835,750 | |
| | | | |
| | | | | | | | | | | 22,643,250 | |
| | | | | | | | | | | | |
| | | | |
| Household Products: 0.54% | | | | | | | | | | | | |
Church & Dwight Company Incorporated | | | | | | | 60,000 | | | | 2,951,400 | |
| | | | | | | | | | | | |
| | | | |
Energy: 19.65% | | | | | | | | | | | | |
| | | | |
| Energy Equipment & Services: 8.84% | | | | | | | | | | | | |
Atwood Oceanics Incorporated Ǡ | | | | | | | 35,000 | | | | 1,571,150 | |
Cameron International Corporation † | | | | | | | 360,000 | | | | 19,018,800 | |
Dresser-Rand Group Incorporated † | | | | | | | 30,000 | | | | 1,391,700 | |
FMC Technologies Incorporated Ǡ | | | | | | | 70,000 | | | | 3,529,400 | |
Halliburton Company | | | | | | | 115,000 | | | | 3,816,850 | |
Heckmann Corporation † | | | | | | | 100,000 | | | | 431,000 | |
National Oilwell Varco Incorporated | | | | | | | 230,000 | | | | 18,278,100 | |
| | | | |
| | | | | | | | | | | 48,037,000 | |
| | | | | | | | | | | | |
| | | | |
| Oil, Gas & Consumable Fuels: 10.81% | | | | | | | | | | | | |
Alpha Natural Resources Incorporated † | | | | | | | 55,000 | | | | 836,550 | |
Anadarko Petroleum Corporation | | | | | | | 80,000 | | | | 6,267,200 | |
Cenovus Energy Incorporated | | | | | | | 30,000 | | | | 1,078,200 | |
CONSOL Energy Incorporated | | | | | | | 100,000 | | | | 3,410,000 | |
Devon Energy Corporation | | | | | | | 85,000 | | | | 6,045,200 | |
EOG Resources Incorporated | | | | | | | 40,000 | | | | 4,444,000 | |
Kinder Morgan Incorporated « | | | | | | | 700,000 | | | | 27,055,000 | |
Occidental Petroleum Corporation | | | | | | | 10,000 | | | | 952,300 | |
Peabody Energy Corporation | | | | | | | 80,000 | | | | 2,316,800 | |
Pioneer Natural Resources Company | | | | | | | 5,000 | | | | 557,950 | |
Suncor Energy Incorporated | | | | | | | 60,000 | | | | 1,962,000 | |
The Williams Companies Incorporated | | | | | | | 120,000 | | | | 3,697,200 | |
WPX Energy Incorporated † | | | | | | | 6,666 | | | | 120,055 | |
| | | | |
| | | | | | | | | | | 58,742,455 | |
| | | | | | | | | | | | |
| | | | |
Financials: 7.70% | | | | | | | | | | | | |
| | | | |
| Commercial Banks: 0.71% | | | | | | | | | | | | |
PNC Financial Services Group Incorporated | | | | | | | 60,000 | | | | 3,869,400 | |
| | | | | | | | | | | | |
The accompanying notes are an integral part of these financial statements.
| | | | | | |
| Portfolio of Investments—March 31, 2012 (Unaudited) | | Wells Fargo Advantage Diversified Capital Builder Fund | | | 9 | |
| | | | | | | | | | | | |
| Security Name | | | | | | Shares | | | Value | |
| | | | | | | | | | | | |
| | | | |
| REITs: 6.99% | | | | | | | | | | | | |
American Tower Corporation | | | | | | | 400,000 | | | $ | 25,208,000 | |
Plum Creek Timber Company « | | | | | | | 125,000 | | | | 5,195,000 | |
Saul Centers Incorporated | | | | | | | 55,000 | | | | 2,219,800 | |
Washington Real Estate Investment Trust « | | | | | | | 180,000 | | | | 5,346,000 | |
| | | | |
| | | | | | | | | | | 37,968,800 | |
| | | | | | | | | | | | |
| | | | |
Health Care: 5.39% | | | | | | | | | | | | |
| | | | |
| Health Care Equipment & Supplies: 2.71% | | | | | | | | | | | | |
Baxter International Incorporated | | | | | | | 40,000 | | | | 2,391,200 | |
C.R. Bard Incorporated | | | | | | | 125,000 | | | | 12,340,000 | |
| | | | |
| | | | | | | | | | | 14,731,200 | |
| | | | | | | | | | | | |
| | | | |
| Life Sciences Tools & Services: 0.29% | | | | | | | | | | | | |
Bio-Rad Laboratories Incorporated Class A † | | | | | | | 5,000 | | | | 518,450 | |
Illumina Incorporated Ǡ | | | | | | | 20,000 | | | | 1,052,200 | |
| | | | |
| | | | | | | | | | | 1,570,650 | |
| | | | | | | | | | | | |
| | | | |
| Pharmaceuticals: 2.39% | | | | | | | | | | | | |
Allergan Incorporated | | | | | | | 75,000 | | | | 7,157,250 | |
Endo Pharmaceuticals Holdings Incorporated † | | | | | | | 60,000 | | | | 2,323,800 | |
Mylan Laboratories Incorporated † | | | | | | | 150,000 | | | | 3,517,500 | |
| | | | |
| | | | | | | | | | | 12,998,550 | |
| | | | | | | | | | | | |
| | | | |
Industrials: 11.94% | | | | | | | | | | | | |
| | | | |
| Building Products: 0.65% | | | | | | | | | | | | |
Apogee Enterprises Incorporated « | | | | | | | 40,000 | | | | 518,000 | |
Lennox International Incorporated | | | | | | | 75,000 | | | | 3,022,500 | |
| | | | |
| | | | | | | | | | | 3,540,500 | |
| | | | | | | | | | | | |
| | | | |
| Electrical Equipment: 2.90% | | | | | | | | | | | | |
AMETEK Incorporated | | | | | | | 40,000 | | | | 1,940,400 | |
Emerson Electric Company | | | | | | | 10,000 | | | | 521,800 | |
FEI Company Ǡ | | | | | | | 200,000 | | | | 9,822,000 | |
Roper Industries Incorporated « | | | | | | | 35,000 | | | | 3,470,600 | |
| | | | |
| | | | | | | | | | | 15,754,800 | |
| | | | | | | | | | | | |
| | | | |
| Machinery: 8.39% | | | | | | | | | | | | |
Danaher Corporation | | | | | | | 40,000 | | | | 2,240,000 | |
Donaldson Company Incorporated « | | | | | | | 280,000 | | | | 10,004,400 | |
Eaton Corporation | | | | | | | 120,000 | | | | 5,979,600 | |
Flowserve Corporation « | | | | | | | 110,000 | | | | 12,706,100 | |
IDEX Corporation | | | | | | | 100,000 | | | | 4,213,000 | |
Pall Corporation | | | | | | | 175,000 | | | | 10,435,250 | |
| | | | |
| | | | | | | | | | | 45,578,350 | |
| | | | | | | | | | | | |
The accompanying notes are an integral part of these financial statements.
| | | | |
| 10 | | Wells Fargo Advantage Diversified Capital Builder Fund | | Portfolio of Investments—March 31, 2012 (Unaudited) |
| | | | | | | | | | | | |
| Security Name | | | | | | Shares | | | Value | |
| | | | | | | | | | | | |
| | | | |
Information Technology: 10.36% | | | | | | | | | | | | |
| | | | |
| Computers & Peripherals: 3.91% | | | | | | | | | | | | |
Apple Incorporated † | | | | | | | 28,000 | | | $ | 16,785,160 | |
EMC Corporation † | | | | | | | 150,000 | | | | 4,482,000 | |
| | | | |
| | | | | | | | | | | 21,267,160 | |
| | | | | | | | | | | | |
| | | | |
| Electronic Equipment, Instruments & Components: 6.24% | | | | | | | | | | | | |
Agilent Technologies Incorporated | | | | | | | 335,000 | | | | 14,910,850 | |
Amphenol Corporation Class A | | | | | | | 70,000 | | | | 4,183,900 | |
FLIR Systems Incorporated « | | | | | | | 585,000 | | | | 14,806,350 | |
| | | | |
| | | | | | | | | | | 33,901,100 | |
| | | | | | | | | | | | |
| | | | |
| Semiconductors & Semiconductor Equipment: 0.21% | | | | | | | | | | | | |
Microchip Technology Incorporated « | | | | | | | 30,000 | | | | 1,116,000 | |
| | | | | | | | | | | | |
| | | | |
Materials: 11.49% | | | | | | | | | | | | |
| | | | |
| Chemicals: 3.91% | | | | | | | | | | | | |
Celanese Corporation Class A | | | | | | | 10,000 | | | | 461,800 | |
Dow Chemical Company | | | | | | | 20,000 | | | | 692,800 | |
FMC Corporation | | | | | | | 60,000 | | | | 6,351,600 | |
Huntsman Corporation | | | | | | | 125,000 | | | | 1,751,250 | |
Kooper Holdings Incorporated | | | | | | | 130,000 | | | | 5,012,800 | |
Mosaic Company | | | | | | | 30,000 | | | | 1,658,700 | |
Valspar Corporation | | | | | | | 110,000 | | | | 5,311,900 | |
| | | | |
| | | | | | | | | | | 21,240,850 | |
| | | | | | | | | | | | |
| | | | |
| Containers & Packaging: 0.51% | | | | | | | | | | | | |
Greif Incorporated Class A « | | | | | | | 15,000 | | | | 838,800 | |
Sealed Air Corporation | | | | | | | 100,000 | | | | 1,931,000 | |
| | | | |
| | | | | | | | | | | 2,769,800 | |
| | | | | | | | | | | | |
| | | | |
| Metals & Mining: 7.07% | | | | | | | | | | | | |
Cliffs Natural Resources Incorporated | | | | | | | 210,000 | | | | 14,544,600 | |
Freeport-McMoRan Copper & Gold Incorporated Class B | | | | | | | 600,000 | | | | 22,824,000 | |
Steel Dynamics Incorporated | | | | | | | 50,000 | | | | 727,000 | |
United States Steel Corporation « | | | | | | | 10,000 | | | | 293,700 | |
| | | | |
| | | | | | | | | | | 38,389,300 | |
| | | | | | | | | | | | |
| | | | |
Utilities: 9.26% | | | | | | | | | | | | |
| | | | |
| Electric Utilities: 5.57% | | | | | | | | | | | | |
American Electric Power Company Incorporated | | | | | | | 230,000 | | | | 8,873,400 | |
Exelon Corporation | | | | | | | 230,000 | | | | 9,018,300 | |
FirstEnergy Corporation | | | | | | | 10,000 | | | | 455,900 | |
ITC Holdings Corporation | | | | | | | 20,000 | | | | 1,538,800 | |
Pepco Holdings Incorporated « | | | | | | | 550,000 | | | | 10,389,500 | |
| | | | |
| | | | | | | | | | | 30,275,900 | |
| | | | | | | | | | | | |
The accompanying notes are an integral part of these financial statements.
| | | | | | |
| Portfolio of Investments—March 31, 2012 (Unaudited) | | Wells Fargo Advantage Diversified Capital Builder Fund | | | 11 | |
| | | | | | | | | | | | | | | | |
| Security Name | | | | | | | | Shares | | | Value | |
| | | | | | | | | | | | | | | | |
| | | | |
| Gas Utilities: 3.69% | | | | | | | | | | | | | | | | |
Atmos Energy Corporation | | | | | | | | | | | 150,000 | | | $ | 4,719,000 | |
National Fuel Gas Company « | | | | | | | | | | | 110,000 | | | | 5,293,200 | |
Questar Corporation | | | | | | | | | | | 520,000 | | | | 10,015,200 | |
| | | | |
| | | | | | | | | | | | | | | 20,027,400 | |
| | | | | | | | | | | | | | | | |
| | | | |
Total Common Stocks (Cost $407,603,046) | | | | | | | | | | | | | | | 456,163,615 | |
| | | | | | | | | | | | | | | | |
| | | | |
| | | Interest Rate | | | Maturity Date | | | Principal | | | | |
| Corporate Bonds and Notes: 15.39% | | | | | | | | | | | | | | | | |
| | | | |
Energy: 2.94% | | | | | | | | | | | | | | | | |
| | | | |
| Energy Equipment & Services: 0.92% | | | | | | | | | | | | | | | | |
Hornbeck Offshore Services Incorporated 144A | | | 5.88 | % | | | 04/01/2020 | | | $ | 5,000,000 | | | | 5,012,500 | |
| | | | | | | | | | | | | | | | |
| | | | |
| Oil, Gas & Consumable Fuels: 2.02% | | | | | | | | | | | | | | | | |
Murray Energy Corporation 144A | | | 10.25 | | | | 10/15/2015 | | | | 11,250,000 | | | | 10,940,625 | |
| | | | | | | | | | | | | | | | |
| | | | |
Financials: 0.18% | | | | | | | | | | | | | | | | |
| | | | |
| REIT: 0.18% | | | | | | | | | | | | | | | | |
Host Hotels & Resorts Incorporated 144A | | | 5.25 | | | | 03/15/2022 | | | | 1,000,000 | | | | 995,000 | |
| | | | | | | | | | | | | | | | |
| | | | |
Health Care: 5.08% | | | | | | | | | | | | | | | | |
| | | | |
| Health Care Providers & Services: 0.18% | | | | | | | | | | | | | | | | |
HCA Incorporated | | | 5.88 | | | | 03/15/2022 | | | | 1,000,000 | | | | 1,001,250 | |
| | | | | | | | | | | | | | | | |
| | | | |
| Pharmaceuticals: 4.90% | | | | | | | | | | | | | | | | |
Valeant Pharmaceuticals International Incorporated 144A | | | 7.00 | | | | 10/01/2020 | | | | 25,753,000 | | | | 25,624,235 | |
Valeant Pharmaceuticals International Incorporated 144A | | | 7.25 | | | | 07/15/2022 | | | | 1,000,000 | | | | 990,000 | |
| | | | |
| | | | | | | | | | | | | | | 26,614,235 | |
| | | | | | | | | | | | | | | | |
| | | | |
Industrials: 0.43% | | | | | | | | | | | | | | | | |
| | | | |
| Building Products: 0.23% | | | | | | | | | | | | | | | | |
Dycom Investments Incorporated | | | 7.13 | | | | 01/15/2021 | | | | 1,200,000 | | | | 1,224,000 | |
| | | | | | | | | | | | | | | | |
| | | | |
| Machinery: 0.20% | | | | | | | | | | | | | | | | |
Oshkosh Corporation | | | 8.50 | | | | 03/01/2020 | | | | 1,000,000 | | | | 1,088,750 | |
| | | | | | | | | | | | | | | | |
| | | | |
Information Technology: 0.57% | | | | | | | | | | | | | | | | |
| | | | |
| Semiconductors & Semiconductor Equipment: 0.57% | | | | | | | | | | | | | | | | |
MEMC Electronics Materials Incorporated | | | 7.75 | | | | 04/01/2019 | | | | 3,875,000 | | | | 3,080,625 | |
| | | | | | | | | | | | | | | | |
| | | | |
Materials: 3.70% | | | | | | | | | | | | | | | | |
| | | | |
| Chemicals: 3.27% | | | | | | | | | | | | | | | | |
Huntsman International LLC « | | | 8.63 | | | | 03/15/2020 | | | | 5,100,000 | | | | 5,699,250 | |
Huntsman International LLC « | | | 8.63 | | | | 03/15/2021 | | | | 2,645,000 | | | | 2,969,013 | |
Koppers Incorporated | | | 7.88 | | | | 12/01/2019 | | | | 2,000,000 | | | | 2,135,000 | |
Krafton Polymers LLC | | | 6.75 | | | | 03/01/2019 | | | | 6,770,000 | | | | 6,990,024 | |
| | | | |
| | | | | | | | | | | | | | | 17,793,287 | |
| | | | | | | | | | | | | | | | |
The accompanying notes are an integral part of these financial statements.
| | | | |
| 12 | | Wells Fargo Advantage Diversified Capital Builder Fund | | Portfolio of Investments—March 31, 2012 (Unaudited) |
| | | | | | | | | | | | | | | | |
| Security Name | | Interest Rate | | | Maturity Date | | | Principal | | | Value | |
| | | | | | | | | | | | | | | | |
| | | | |
| Metals & Mining: 0.43% | | | | | | | | | | | | | | | | |
United States Steel Corporation | | | 7.38 | % | | | 04/01/2020 | | | $ | 2,270,000 | | | $ | 2,315,400 | |
| | | | | | | | | | | | | | | | |
| | | | |
Telecommunication Services: 0.90% | | | | | | | | | | | | | | | | |
| | | | |
| Diversified Telecommunication Services: 0.36% | | | | | | | | | | | | | | | | |
NII Capital Corporation | | | 7.63 | | | | 04/01/2021 | | | | 2,000,000 | | | | 1,955,000 | |
| | | | | | | | | | | | | | | | |
| | | | |
| Wireless Telecommunication Services: 0.54% | | | | | | | | | | | | | | | | |
Cricket Communications Incorporated | | | 7.75 | | | | 10/15/2020 | | | | 3,000,000 | | | | 2,947,500 | |
| | | | | | | | | | | | | | | | |
| | | | |
Utilities: 1.59% | | | | | | | | | | | | | | | | |
| | | | |
| Independent Power Producers & Energy Traders: 1.59% | | | | | | | | | | | | | | | | |
NRG Energy Incorporated | | | 7.63 | | | | 05/15/2019 | | | | 2,000,000 | | | | 1,930,000 | |
NRG Energy Incorporated | | | 7.88 | | | | 05/15/2021 | | | | 7,000,000 | | | | 6,720,000 | |
| | | | |
| | | | | | | | | | | | | | | 8,650,000 | |
| | | | | | | | | | | | | | | | |
| | | | |
Total Corporate Bonds and Notes (Cost $83,441,049) | | | | | | | | | | | | | | | 83,618,172 | |
| | | | | | | | | | | | | | | | |
| | | | |
Yankee Corporate Bonds and Notes: 0.18% | | | | | | | | | | | | | | | | |
| | | | |
Materials: 0.18% | | | | | | | | | | | | | | | | |
| | | | |
| Chemicals: 0.18% | | | | | | | | | | | | | | | | |
LyondellBasell Industries NV 144A | | | 5.75 | | | | 04/15/2024 | | | | 1,000,000 | | | | 997,500 | |
| | | | | | | | | | | | | | | | |
| | | | |
Total Yankee Corporate Bonds and Notes (Cost $1,000,000) | | | | | | | | | | | | | | | 997,500 | |
| | | | | | | | | | | | | | | | |
| | | | |
| | | Yield | | | | | | Shares | | | | |
| Short-Term Investments: 15.72% | | | | | | | | | | | | | | | | |
| | | | |
| Investment Companies: 15.72% | | | | | | | | | | | | | | | | |
Wells Fargo Advantage Cash Investment Money Market Fund, Select Class (l)(u) | | | 0.10 | | | | | | | | 669,556 | | | | 669,556 | |
Wells Fargo Securities Lending Cash Investments, LLC (l)(u)(v)(r) | | | 0.18 | | | | | | | | 84,732,750 | | | | 84,732,750 | |
| | | | |
Total Short-Term Investments (Cost $85,402,306) | | | | | | | | | | | | | | | 85,402,306 | |
| | | | | | | | | | | | | | | | |
| | | | | | | | |
| Total Investments in Securities | | | | | | | | |
| (Cost $577,446,401)* | | | 115.25 | % | | | 626,181,593 | |
Other Assets and Liabilities, Net | | | (15.25 | ) | | | (82,838,001 | ) |
| | | | | | | | |
| Total Net Assets | | | 100.00 | % | | $ | 543,343,592 | |
| | | | | | | | |
| « | All or a portion of this security is on loan. |
| † | Non-income earning security |
| 144A | Security that may be resold to “qualified institutional buyers” under Rule 144A or security offered pursuant to Section 4(2) of the Securities Act of 1933, as amended. |
| (l) | Investment in an affiliate |
| (u) | Rate shown is the 7-day annualized yield at period end. |
| (v) | Security represents investment of cash collateral received from securities on loan. |
| (r) | The investment company is exempt from registration under Section 3(c)(7) of the 1940 Act. |
| * | Cost for federal income tax purposes is $577,712,056 and net unrealized appreciation (depreciation) consists of: |
| | | | |
Gross unrealized appreciation | | $ | 65,044,528 | |
Gross unrealized depreciation | | | (16,574,991 | ) |
| | | | |
Net unrealized appreciation | | $ | 48,469,537 | |
The accompanying notes are an integral part of these financial statements.
| | | | | | |
| Statement of Assets and Liabilities—March 31, 2012 (Unaudited) | | Wells Fargo Advantage Diversified Capital Builder Fund | | | 13 | |
| | | | |
| | | | |
| |
Assets | | | | |
Investments | | | | |
In unaffiliated securities (including securities on loan), at value (see cost below) | | $ | 540,779,287 | |
In affiliated securities, at value (see cost below) | | | 85,402,306 | |
| | | | |
Total investments, at value (see cost below) | | | 626,181,593 | |
Receivable for investments sold | | | 1,477,818 | |
Receivable for Fund shares sold | | | 68,548 | |
Receivable for dividends and interest | | | 2,532,564 | |
Receivable for securities lending income | | | 430,306 | |
Prepaid expenses and other assets | | | 220,128 | |
| | | | |
Total assets | | | 630,910,957 | |
| | | | |
| |
Liabilities | | | | |
Payable for investments purchased | | | 1,440,190 | |
Payable for Fund shares redeemed | | | 608,215 | |
Payable upon receipt of securities loaned | | | 84,732,750 | |
Advisory fee payable | | | 238,880 | |
Distribution fees payable | | | 22,879 | |
Due to other related parties | | | 123,129 | |
Accrued expenses and other liabilities | | | 401,322 | |
| | | | |
Total liabilities | | | 87,567,365 | |
| | | | |
Total net assets | | $ | 543,343,592 | |
| | | | |
| |
NET ASSETS CONSIST OF | | | | |
Paid-in capital | | $ | 650,376,847 | |
Undistributed net investment income | | | 235,143 | |
Accumulated net realized losses on investments | | | (156,003,551 | ) |
Net unrealized gains on investments | | | 48,735,153 | |
| | | | |
Total net assets | | $ | 543,343,592 | |
| | | | |
| |
COMPUTATION OF NET ASSET VALUE AND OFFERING PRICE PER SHARE1 | | | | |
Net assets – Class A | | $ | 410,831,220 | |
Shares outstanding – Class A | | | 60,167,595 | |
Net asset value per share – Class A | | | $6.83 | |
Maximum offering price per share – Class A2 | | | $7.25 | |
Net assets – Class B | | $ | 9,815,184 | |
Shares outstanding – Class B | | | 1,428,599 | |
Net asset value per share – Class B | | | $6.87 | |
Net assets – Class C | | $ | 39,816,887 | |
Shares outstanding – Class C | | | 5,826,462 | |
Net asset value per share – Class C | | | $6.83 | |
Net assets – Administrator Class | | $ | 3,320,433 | |
Shares outstanding – Administrator Class | | | 485,747 | |
Net asset value per share – Administrator Class | | | $6.84 | |
Net assets – Institutional Class | | $ | 79,559,868 | |
Shares outstanding – Institutional Class | | | 11,713,702 | |
Net asset value per share – Institutional Class | | | $6.79 | |
| |
Investments in unaffiliated securities, at cost | | $ | 492,044,095 | |
| | | | |
Investments in affiliated securities, at cost | | $ | 85,402,306 | |
| | | | |
Total investments, at cost | | $ | 577,446,401 | |
| | | | |
Securities on loan, at value | | $ | 82,756,602 | |
| | | | |
| 1. | The Fund has an unlimited number of authorized shares. |
| 2. | Maximum offering price is computed as 100/94.25 of net asset value. On investments of $50,000 or more, the offering price is reduced. |
The accompanying notes are an integral part of these financial statements.
| | | | |
| 14 | | Wells Fargo Advantage Diversified Capital Builder Fund | | Statement of Operations—Six Months Ended March 31, 2012 (Unaudited) |
| | | | |
| | | | |
| |
Investment income | | | | |
Interest | | $ | 4,507,168 | |
Dividends* | | | 4,008,719 | |
Securities lending income, net | | | 1,064,962 | |
Income from affiliated securities | | | 2,853 | |
| | | | |
Total investment income | | | 9,583,702 | |
| | | | |
| |
Expenses | | | | |
Advisory fee | | | 1,592,067 | |
Administration fees | | | | |
Fund level | | | 133,440 | |
Class A | | | 522,994 | |
Class B | | | 13,476 | |
Class C | | | 51,036 | |
Administrator Class | | | 1,760 | |
Institutional Class | | | 31,325 | |
Shareholder servicing fees | | | | |
Class A | | | 502,878 | |
Class B | | | 12,958 | |
Class C | | | 49,072 | |
Administrator Class | | | 3,862 | |
Distribution fees | | | | |
Class B | | | 38,874 | |
Class C | | | 147,219 | |
Custody and accounting fees | | | 17,461 | |
Professional fees | | | 19,257 | |
Registration fees | | | 33,363 | |
Shareholder report expenses | | | 23,895 | |
Trustees’ fees and expenses | | | 31,394 | |
Other fees and expenses | | | 10,688 | |
| | | | |
Total expenses | | | 3,237,019 | |
Less: Fee waivers and/or expense reimbursements | | | (18,743 | ) |
| | | | |
Net expenses | | | 3,218,276 | |
| | | | |
Net investment income | | | 6,365,426 | |
| | | | |
| |
REALIZED AND UNREALIZED GAINS (LOSSES) ON INVESTMENTS | | | | |
Net realized gains on investments | | | 4,223,409 | |
Net change in unrealized gains (losses) on investments | | | 94,199,477 | |
| | | | |
Net realized and unrealized gains (losses) on investments | | | 98,422,886 | |
| | | | |
Net increase in net assets resulting from operations | | $ | 104,788,312 | |
| | | | |
| |
* Net of foreign dividend withholding taxes of | | | $3,851 | |
The accompanying notes are an integral part of these financial statements.
| | | | | | |
| Statements of Changes in Net Assets | | Wells Fargo Advantage Diversified Capital Builder Fund | | | 15 | |
| | | | | | | | | | | | | | | | |
| | | Six Months Ended
March 31, 2012
(Unaudited) | | | Year Ended
September 30, 2011 | |
| | | | |
Operations | | | | | | | | | | | | | | | | |
Net investment income | | | | | | $ | 6,365,426 | | | | | | | $ | 9,883,983 | |
Net realized gains on investments | | | | | | | 4,223,409 | | | | | | | | 28,652,802 | |
Net change in unrealized gains (losses) on investments | | | | | | | 94,199,477 | | | | | | | | (55,171,214 | ) |
| | | | | | | | | | | | | | | | |
Net increase (decrease) in net assets resulting from operations | | | | | | | 104,788,312 | | | | | | | | (16,634,429 | ) |
| | | | | | | | | | | | | | | | |
| | | | |
Distributions to shareholders from | | | | | | | | | | | | | | | | |
Net investment income | | | | | | | | | | | | | | | | |
Class A | | | | | | | (4,514,112 | ) | | | | | | | (7,267,329 | ) |
Class B | | | | | | | (73,191 | ) | | | | | | | (107,099 | ) |
Class C | | | | | | | (301,962 | ) | | | | | | | (380,693 | ) |
Administrator Class | | | | | | | (42,876 | ) | | | | | | | (38,530 | ) |
Institutional Class | | | | | | | (1,029,547 | ) | | | | | | | (1,814,509 | ) |
| | | | | | | | | | | | | | | | |
Total distributions to shareholders | | | | | | | (5,961,688 | ) | | | | | | | (9,608,160 | ) |
| | | | | | | | | | | | | | | | |
| | | | |
Capital share transactions | | | Shares | | | | | | | | Shares | | | | | |
Proceeds from shares sold | | | | | | | | | | | | | | | | |
Class A | | | 566,963 | | | | 3,674,536 | | | | 1,862,694 | | | | 12,876,057 | |
Class B | | | 9,977 | | | | 68,129 | | | | 128,793 | | | | 890,266 | |
Class C | | | 100,728 | | | | 658,746 | | | | 1,633,987 | | | | 11,235,993 | |
Administrator Class | | | 89,426 | | | | 577,317 | | | | 5,112,855 | | | | 36,818,692 | |
Institutional Class | | | 126,785 | | | | 818,296 | | | | 422,146 | | | | 2,904,503 | |
| | | | | | | | | | | | | | | | |
| | | | | | | 5,797,024 | | | | | | | | 64,725,511 | |
| | | | | | | | | | | | | | | | |
Reinvestment of distributions | | | | | | | | | | | | | | | | |
Class A | | | 620,994 | | | | 4,103,118 | | | | 1,014,518 | | | | 6,480,356 | |
Class B | | | 9,776 | | | | 64,898 | | | | 14,552 | | | | 94,371 | |
Class C | | | 40,035 | | | | 265,121 | | | | 48,090 | | | | 307,875 | |
Administrator Class | | | 4,055 | | | | 26,666 | | | | 3,827 | | | | 25,183 | |
Institutional Class | | | 134,899 | | | | 885,182 | | | | 240,516 | | | | 1,530,404 | |
| | | | | | | | | | | | | | | | |
| | | | | | | 5,344,985 | | | | | | | | 8,438,189 | |
| | | | | | | | | | | | | | | | |
Payment for shares redeemed | | | | | | | | | | | | | | | | |
Class A | | | (5,491,516 | ) | | | (35,798,623 | ) | | | (10,766,286 | ) | | | (73,340,247 | ) |
Class B | | | (412,296 | ) | | | (2,678,496 | ) | | | (1,023,366 | ) | | | (7,094,708 | ) |
Class C | | | (615,472 | ) | | | (4,020,564 | ) | | | (2,058,419 | ) | | | (14,211,213 | ) |
Administrator Class | | | (249,540 | ) | | | (1,595,727 | ) | | | (4,476,613 | ) | | | (28,927,444 | ) |
Institutional Class | | | (1,207,702 | ) | | | (7,916,842 | ) | | | (2,459,860 | ) | | | (16,544,458 | ) |
| | | | | | | | | | | | | | | | |
| | | | | | | (52,010,252 | ) | | | | | | | (140,118,070 | ) |
| | | | | | | | | | | | | | | | |
Net decrease in net assets resulting from capital share transactions | | | | | | | (40,868,243 | ) | | | | | | | (66,954,370 | ) |
| | | | | | | | | | | | | | | | |
Total increase (decrease) in net assets | | | | | | | 57,958,381 | | | | | | | | (93,196,959 | ) |
| | | | | | | | | | | | | | | | |
| | | | |
Net assets | | | | | | | | | | | | | | | | |
Beginning of period | | | | | | | 485,385,211 | | | | | | | | 578,582,170 | |
| | | | | | | | | | | | | | | | |
End of period | | | | | | $ | 543,343,592 | | | | | | | $ | 485,385,211 | |
| | | | | | | | | | | | | | | | |
Undistributed (overdistributed) net investment income | | | | | | $ | 235,143 | | | | | | | $ | (168,595 | ) |
| | | | | | | | | | | | | | | | |
The accompanying notes are an integral part of these financial statements.
| | | | |
| 16 | | Wells Fargo Advantage Diversified Capital Builder Fund | | Financial Highlights |
(For a share outstanding throughout each period)
| | | | | | | | | | | | | | | | | | | | | | | | | | | | |
| | | Six Months Ended
March 31, 2012 (Unaudited) | | | Year Ended September 30, | | | Year Ended March 31, | |
| Class A | | | 2011 | | | 20101,2 | | | 20101 | | | 20091 | | | 20081 | | | 20071 | |
Net asset value, beginning of period | | $ | 5.65 | | | $ | 6.02 | | | $ | 6.02 | | | $ | 4.18 | | | $ | 8.28 | | | $ | 9.35 | | | $ | 8.90 | |
Net investment income | | | 0.07 | | | | 0.10 | | | | 0.07 | | | | 0.05 | | | | 0.11 | | | | 0.18 | | | | 0.18 | |
Net realized and unrealized gains (losses) on investments | | | 1.18 | | | | (0.36 | ) | | | 0.00 | | | | 1.85 | | | | (3.33 | ) | | | (0.44 | ) | | | 0.43 | |
| | | | | | | | | | | | | | | | | | | | | | | | | | | | |
Total from investment operations | | | 1.25 | | | | (0.26 | ) | | | 0.07 | | | | 1.90 | | | | (3.22 | ) | | | (0.26 | ) | | | 0.61 | |
Distributions to shareholders from | | | | | | | | | | | | | | | | | | | | | | | | | | | | |
Net investment income | | | (0.07 | ) | | | (0.11 | ) | | | (0.07 | ) | | | (0.06 | ) | | | (0.13 | ) | | | (0.18 | ) | | | (0.16 | ) |
Net realized gains | | | 0.00 | | | | 0.00 | | | | 0.00 | | | | 0.00 | | | | (0.75 | ) | | | (0.63 | ) | | | 0.00 | |
| | | | | | | | | | | | | | | | | | | | | | | | | | | | |
Total distributions to shareholders | | | (0.07 | ) | | | (0.11 | ) | | | (0.07 | ) | | | (0.06 | ) | | | (0.88 | ) | | | (0.81 | ) | | | (0.16 | ) |
Net asset value, end of period | | $ | 6.83 | | | $ | 5.65 | | | $ | 6.02 | | | $ | 6.02 | | | $ | 4.18 | | | $ | 8.28 | | | $ | 9.35 | |
Total return3 | | | 22.25 | % | | | (4.53 | )% | | | 1.21 | % | | | 45.51 | % | | | (38.57 | )% | | | (3.45 | )% | | | 6.92 | % |
Ratios to average net assets (annualized) | | | | | | | | | | | | | | | | | | | | | | | | | | | | |
Gross expenses | | | 1.21 | % | | | 1.21 | % | | | 1.17 | % | | | 1.14 | % | | | 1.06 | % | | | 1.03 | % | | | 1.02 | % |
Net expenses | | | 1.20 | % | | | 1.20 | % | | | 1.15 | % | | | 1.14 | % | | | 1.04 | % | | | 0.96 | % | | | 0.99 | % |
Net investment income | | | 2.39 | % | | | 1.57 | % | | | 2.47 | % | | | 1.07 | % | | | 1.74 | % | | | 1.96 | % | | | 2.04 | % |
Supplemental data | | | | | | | | | | | | | | | | | | | | | | | | | | | | |
Portfolio turnover rate | | | 34 | % | | | 56 | % | | | 31 | % | | | 63 | % | | | 60 | % | | | 91 | % | | | 67 | % |
Net assets, end of period (000’s omitted) | | | $410,831 | | | | $364,533 | | | | $435,454 | | | | $467,224 | | | | $366,237 | | | | $741,701 | | | | $899,612 | |
| 1. | After the close of business on July 9, 2010, the Fund acquired the net assets of Evergreen Diversified Capital Builder Fund which became the accounting and performance survivor in the transaction. The information for the periods prior to July 12, 2010 is that of Class A of Evergreen Diversified Capital Builder Fund. |
| 2. | For the six months ended September 30, 2010. The Fund changed its fiscal year end from March 31 to September 30, effective September 30, 2010. |
| 3. | Total return calculations do not include any sales charges. Returns for periods of less than one year are not annualized. |
The accompanying notes are an integral part of these financial statements.
| | | | | | |
| Financial Highlights | | Wells Fargo Advantage Diversified Capital Builder Fund | | | 17 | |
(For a share outstanding throughout each period)
| | | | | | | | | | | | | | | | | | | | | | | | | | | | |
| | | Six Months Ended
March 31, 2012 (Unaudited) | | | Year Ended September 30, | | | Year Ended March 31, | |
| Class B | | | 2011 | | | 20101,2 | | | 20101 | | | 20091 | | | 20081 | | | 20071 | |
Net asset value, beginning of period | | $ | 5.69 | | | $ | 6.05 | | | $ | 6.05 | | | $ | 4.19 | | | $ | 8.29 | | | $ | 9.35 | | | $ | 8.90 | |
Net investment income | | | 0.05 | 3 | | | 0.06 | 3 | | | 0.05 | 3 | | | 0.02 | 3 | | | 0.06 | 3 | | | 0.12 | 3 | | | 0.12 | 3 |
Net realized and unrealized gains (losses)
on investments | | | 1.18 | | | | (0.37 | ) | | | 0.00 | | | | 1.86 | | | | (3.33 | ) | | | (0.45 | ) | | | 0.42 | |
| | | | | | | | | | | | | | | | | | | | | | | | | | | | |
Total from investment operations | | | 1.23 | | | | (0.31 | ) | | | 0.05 | | | | 1.88 | | | | (3.27 | ) | | | (0.33 | ) | | | 0.54 | |
Distributions to shareholders from | | | | | | | | | | | | | | | | | | | | | | | | | | | | |
Net investment income | | | (0.05 | ) | | | (0.05 | ) | | | (0.05 | ) | | | (0.02 | ) | | | (0.08 | ) | | | (0.10 | ) | | | (0.09 | ) |
Net realized gains | | | 0.00 | | | | 0.00 | | | | 0.00 | | | | 0.00 | | | | (0.75 | ) | | | (0.63 | ) | | | 0.00 | |
| | | | | | | | | | | | | | | | | | | | | | | | | | | | |
Total distributions to shareholders | | | (0.05 | ) | | | (0.05 | ) | | | (0.05 | ) | | | (0.02 | ) | | | (0.83 | ) | | | (0.73 | ) | | | (0.09 | ) |
Net asset value, end of period | | $ | 6.87 | | | $ | 5.69 | | | $ | 6.05 | | | $ | 6.05 | | | $ | 4.19 | | | $ | 8.29 | | | $ | 9.35 | |
Total return4 | | | 21.63 | % | | | (5.20 | )% | | | 0.83 | % | | | 45.17 | % | | | (39.13 | )% | | | (4.09 | )% | | | 6.12 | % |
Ratios to average net assets (annualized) | | | | | | | | | | | | | | | | | | | | | | | | | | | | |
Gross expenses | | | 1.96 | % | | | 1.96 | % | | | 1.92 | % | | | 1.89 | % | | | 1.80 | % | | | 1.73 | % | | | 1.72 | % |
Net expenses | | | 1.95 | % | | | 1.95 | % | | | 1.89 | % | | | 1.89 | % | | | 1.78 | % | | | 1.69 | % | | | 1.69 | % |
Net investment income | | | 1.63 | % | | | 0.81 | % | | | 1.72 | % | | | 0.34 | % | | | 0.96 | % | | | 1.25 | % | | | 1.34 | % |
Supplemental data | | | | | | | | | | | | | | | | | | | | | | | | | | | | |
Portfolio turnover rate | | | 34 | % | | | 56 | % | | | 31 | % | | | 63 | % | | | 60 | % | | | 91 | % | | | 67 | % |
Net assets, end of period (000’s omitted) | | | $9,815 | | | | $10,360 | | | | $16,329 | | | | $17,992 | | | | $18,115 | | | | $52,814 | | | | $103,629 | |
| 1. | After the close of business on July 9, 2010, the Fund acquired the net assets of Evergreen Diversified Capital Builder Fund which became the accounting and performance survivor in the transaction. The information for the periods prior to July 12, 2010 is that of Class B of Evergreen Diversified Capital Builder Fund. |
| 2. | For the six months ended September 30, 2010. The Fund changed its fiscal year end from March 31 to September 30, effective September 30, 2010. |
| 3. | Calculated based upon average shares outstanding |
| 4. | Total return calculations do not include any sales charges. Returns for periods of less than one year are not annualized. |
The accompanying notes are an integral part of these financial statements.
| | | | |
| 18 | | Wells Fargo Advantage Diversified Capital Builder Fund | | Financial Highlights |
(For a share outstanding throughout each period)
| | | | | | | | | | | | | | | | | | | | | | | | | | | | |
| | | Six Months Ended
March 31, 2012 (Unaudited) | | | Year Ended September 30, | | | Year Ended March 31, | |
| Class C | | | 2011 | | | 20101,2 | | | 20101 | | | 20091 | | | 20081 | | | 20071 | |
Net asset value, beginning of period | | $ | 5.66 | | | $ | 6.02 | | | $ | 6.03 | | | $ | 4.18 | | | $ | 8.29 | | | $ | 9.35 | | | $ | 8.90 | |
Net investment income | | | 0.05 | | | | 0.05 | | | | 0.05 | | | | 0.02 | | | | 0.06 | | | | 0.11 | | | | 0.12 | |
Net realized and unrealized gains (losses)
on investments | | | 1.17 | | | | (0.35 | ) | | | (0.01 | ) | | | 1.85 | | | | (3.34 | ) | | | (0.43 | ) | | | 0.42 | |
| | | | | | | | | | | | | | | | | | | | | | | | | | | | |
Total from investment operations | | | 1.22 | | | | (0.30 | ) | | | 0.04 | | | | 1.87 | | | | (3.28 | ) | | | (0.32 | ) | | | 0.54 | |
Distributions to shareholders from | | | | | | | | | | | | | | | | | | | | | | | | | | | | |
Net investment income | | | (0.05 | ) | | | (0.06 | ) | | | (0.05 | ) | | | (0.02 | ) | | | (0.08 | ) | | | (0.11 | ) | | | (0.09 | ) |
Net realized gains | | | 0.00 | | | | 0.00 | | | | 0.00 | | | | 0.00 | | | | (0.75 | ) | | | (0.63 | ) | | | 0.00 | |
| | | | | | | | | | | | | | | | | | | | | | | | | | | | |
Total distributions to shareholders | | | (0.05 | ) | | | (0.06 | ) | | | (0.05 | ) | | | (0.02 | ) | | | (0.83 | ) | | | (0.74 | ) | | | (0.09 | ) |
Net asset value, end of period | | $ | 6.83 | | | $ | 5.66 | | | $ | 6.02 | | | $ | 6.03 | | | $ | 4.18 | | | $ | 8.29 | | | $ | 9.35 | |
Total return3 | | | 21.60 | % | | | (5.14 | )% | | | 0.67 | % | | | 44.70 | % | | | (39.13 | )% | | | (4.03 | )% | | | 6.16 | % |
Ratios to average net assets (annualized) | | | | | | | | | | | | | | | | | | | | | | | | | | | | |
Gross expenses | | | 1.96 | % | | | 1.96 | % | | | 1.92 | % | | | 1.88 | % | | | 1.82 | % | | | 1.73 | % | | | 1.72 | % |
Net expenses | | | 1.95 | % | | | 1.95 | % | | | 1.90 | % | | | 1.88 | % | | | 1.80 | % | | | 1.69 | % | | | 1.69 | % |
Net investment income | | | 1.64 | % | | | 0.79 | % | | | 1.72 | % | | | 0.32 | % | | | 1.01 | % | | | 1.22 | % | | | 1.34 | % |
Supplemental data | | | | | | | | | | | | | | | | | | | | | | | | | | | | |
Portfolio turnover rate | | | 34 | % | | | 56 | % | | | 31 | % | | | 63 | % | | | 60 | % | | | 91 | % | | | 67 | % |
Net assets, end of period (000’s omitted) | | | $39,817 | | | | $35,665 | | | | $40,197 | | | | $43,558 | | | | $33,077 | | | | $61,029 | | | | $71,957 | |
| 1. | After the close of business on July 9, 2010, the Fund acquired the net assets of Evergreen Diversified Capital Builder Fund which became the accounting and performance survivor in the transaction. The information for the periods prior to July 12, 2010 is that of Class C of Evergreen Diversified Capital Builder Fund. |
| 2. | For the six months ended September 30, 2010. The Fund changed its fiscal year end from March 31 to September 30, effective September 30, 2010. |
| 3. | Total return calculations do not include any sales charges. Returns for periods of less than one year are not annualized. |
The accompanying notes are an integral part of these financial statements.
| | | | | | |
| Financial Highlights | | Wells Fargo Advantage Diversified Capital Builder Fund | | | 19 | |
(For a share outstanding throughout each period)
| | | | | | | | | | | | |
| | | Six Months Ended
March 31, 2012 (Unaudited) | | | Year Ended September 30, | |
| Administrator Class | | | 2011 | | | 20101 | |
Net asset value, beginning of period | | $ | 5.66 | | | $ | 5.99 | | | $ | 5.79 | |
Net investment income | | | 0.09 | 2 | | | 0.13 | 2 | | | 0.02 | 2 |
Net realized and unrealized gains (losses) on investments | | | 1.17 | | | | (0.37 | ) | | | 0.22 | |
| | | | | | | | | | | | |
Total from investment operations | | | 1.26 | | | | (0.24 | ) | | | 0.24 | |
Distributions to shareholders from | | | | | | | | | | | | |
Net investment income | | | (0.08 | ) | | | (0.09 | ) | | | (0.04 | ) |
Net asset value, end of period | | $ | 6.84 | | | $ | 5.66 | | | $ | 5.99 | |
Total return3 | | | 22.35 | % | | | (4.25 | )% | | | 4.08 | % |
Ratios to average net assets (annualized) | | | | | | | | | | | | |
Gross expenses | | | 1.02 | % | | | 1.04 | % | | | 1.14 | % |
Net expenses | | | 0.94 | % | | | 0.95 | % | | | 0.99 | % |
Net investment income | | | 2.64 | % | | | 1.86 | % | | | 2.26 | % |
Supplemental data | | | | | | | | | | | | |
Portfolio turnover rate | | | 34 | % | | | 56 | % | | | 31 | % |
Net assets, end of period (000’s omitted) | | | $3,320 | | | | $3,632 | | | | $10 | |
| 1. | For the period from July 30, 2010 (commencement of class operations) to September 30, 2010 |
| 2. | Calculated based upon average shares outstanding |
| 3. | Returns for periods of less than one year are not annualized. |
The accompanying notes are an integral part of these financial statements.
| | | | |
| 20 | | Wells Fargo Advantage Diversified Capital Builder Fund | | Financial Highlights |
(For a share outstanding throughout each period)
| | | | | | | | | | | | | | | | | | | | | | | | | | | | |
| | | Six Months Ended
March 31, 2012 (Unaudited) | | | Year Ended September 30, | | | Year Ended March 31, | |
| Institutional Class | | | 2011 | | | 20101,2 | | | 20101 | | | 20091 | | | 20081 | | | 20071 | |
Net asset value, beginning of period | | $ | 5.62 | | | $ | 5.99 | | | $ | 5.99 | | | $ | 4.16 | | | $ | 8.25 | | | $ | 9.31 | | | $ | 8.87 | |
Net investment income | | | 0.09 | | | | 0.14 | 3 | | | 0.08 | | | | 0.06 | | | | 0.13 | | | | 0.20 | | | | 0.21 | |
Net realized and unrealized gains (losses)
on investments | | | 1.17 | | | | (0.37 | ) | | | 0.00 | | | | 1.84 | | | | (3.32 | ) | | | (0.43 | ) | | | 0.42 | |
| | | | | | | | | | | | | | | | | | | | | | | | | | | | |
Total from investment operations | | | 1.26 | | | | (0.23 | ) | | | 0.08 | | | | 1.90 | | | | (3.19 | ) | | | (0.23 | ) | | | 0.63 | |
Distributions to shareholders from | | | | | | | | | | | | | | | | | | | | | | | | | | | | |
Net investment income | | | (0.09 | ) | | | (0.14 | ) | | | (0.08 | ) | | | (0.07 | ) | | | (0.15 | ) | | | (0.20 | ) | | | (0.19 | ) |
Net realized gains | | | 0.00 | | | | 0.00 | | | | 0.00 | | | | 0.00 | | | | (0.75 | ) | | | (0.63 | ) | | | 0.00 | |
| | | | | | | | | | | | | | | | | | | | | | | | | | | | |
Total distributions to shareholders | | | (0.09 | ) | | | (0.14 | ) | | | (0.08 | ) | | | (0.07 | ) | | | (0.90 | ) | | | (0.83 | ) | | | (0.19 | ) |
Net asset value, end of period | | $ | 6.79 | | | $ | 5.62 | | | $ | 5.99 | | | $ | 5.99 | | | $ | 4.16 | | | $ | 8.25 | | | $ | 9.31 | |
Total return4 | | | 22.42 | % | | | (4.08 | )% | | | 1.32 | % | | | 45.84 | % | | | (38.43 | )% | | | (3.08 | )% | | | 7.15 | % |
Ratios to average net assets (annualized) | | | | | | | | | | | | | | | | | | | | | | | | | | | | |
Gross expenses | | | 0.78 | % | | | 0.78 | % | | | 0.85 | % | | | 0.89 | % | | | 0.81 | % | | | 0.73 | % | | | 0.72 | % |
Net expenses | | | 0.78 | % | | | 0.77 | % | | | 0.83 | % | | | 0.89 | % | | | 0.79 | % | | | 0.69 | % | | | 0.69 | % |
Net investment income | | | 2.81 | % | | | 1.99 | % | | | 2.81 | % | | | 1.32 | % | | | 1.99 | % | | | 2.22 | % | | | 2.33 | % |
Supplemental data | | | | | | | | | | | | | | | | | | | | | | | | | | | | |
Portfolio turnover rate | | | 34 | % | | | 56 | % | | | 31 | % | | | 63 | % | | | 60 | % | | | 91 | % | | | 67 | % |
Net assets, end of period (000’s omitted) | | | $79,560 | | | | $71,195 | | | | $86,592 | | | | $104,142 | | | | $84,042 | | | | $168,764 | | | | $203,551 | |
| 1. | After the close of business on July 9, 2010, the Fund acquired the net assets of Evergreen Diversified Capital Builder Fund which became the accounting and performance survivor in the transaction. The information for the periods prior to July 12, 2010 is that of Class I of Evergreen Diversified Capital Builder Fund. |
| 2. | For the six months ended September 30, 2010. The Fund changed its fiscal year end from March 31 to September 30, effective September 30, 2010. |
| 3. | Calculated based upon average shares outstanding |
| 4. | Returns for periods of less than one year are not annualized. |
The accompanying notes are an integral part of these financial statements.
| | | | | | |
| Notes to Financial Statements (Unaudited) | | Wells Fargo Advantage Diversified Capital Builder Fund | | | 21 | |
1. ORGANIZATION
Wells Fargo Funds Trust (the “Trust”), a Delaware statutory trust organized on March 10, 1999, is an open-end management investment company registered under the Investment Company Act of 1940, as amended (the “1940 Act”). These financial statements report on Wells Fargo Advantage Diversified Capital Builder Fund (the “Fund”) which is a diversified series of the Trust.
2. SIGNIFICANT ACCOUNTING POLICIES
The following significant accounting policies, which are consistently followed in the preparation of the financial statements of the Fund, are in conformity with U.S. generally accepted accounting principles which require management to make estimates and assumptions that affect the reported amounts of assets and liabilities, disclosure of contingent assets and liabilities at the date of the financial statements, and the reported amounts of revenues and expenses during the reporting period. Actual results could differ from those estimates.
Securities valuation
Investments in equity securities are valued each business day as of the close of regular trading on the New York Stock Exchange, which is usually 4:00 p.m. (Eastern Time). Securities which are traded on a national or foreign securities exchange are valued at the last reported sales price, except that securities listed on The Nasdaq Stock Market, Inc. (“Nasdaq”) are valued at the Nasdaq Official Closing Price (“NOCP”), and if no NOCP is available, then at the last reported sales price. If no sales price is shown on the Nasdaq, the bid price will be used. In the absence of any sale of securities listed on the Nasdaq, and in the case of other securities (including U.S. Government obligations, but excluding debt securities maturing in 60 days or less), the price will be deemed “stale” and the valuations will be determined in accordance with the Fund’s Fair Value Procedures.
Securities denominated in foreign currencies are translated into U.S. dollars using the closing rates of exchange in effect on the day of valuation.
Many securities markets and exchanges outside the U.S. close prior to the close of the New York Stock Exchange and therefore may not fully reflect trading or events that occur after the close of the principal exchange in which the foreign investments are traded, but before the close of the New York Stock Exchange. If such trading or events are expected to materially affect the value of the investments, then those investments are fair valued following procedures approved by the Board of Trustees. These procedures take into account multiple factors including movements in U.S. securities markets after foreign exchanges close. Depending on market activity, such fair valuations may be frequent. Such fair value pricing may result in NAVs that are higher or lower than NAVs based on the closing price or latest quoted bid price.
Fixed income securities with original maturities exceeding 60 days are valued based on available evaluated prices received from an independent pricing service approved by the Board of Trustees which may utilize both transaction data and market information such as yield, prices of securities of comparable quality, coupon rate, maturity, type of issue, trading characteristics and other market data. If valuations are not available from the pricing service or values received are deemed not representative of market value, values will be obtained from a third party broker-dealer or determined based on the Fund’s Fair Value Procedures.
Debt securities of sufficient credit quality with original maturities of 60 days or less generally are valued at amortized cost which approximates fair value. The amortized cost method involves valuing a security at its cost, plus accretion of discount or minus amortization of premium over the period until maturity.
Investments in open-end mutual funds and non-registered investment companies are generally valued at net asset value.
Investments which are not valued using any of the methods discussed above, are valued at their fair value, as determined by procedures established in good faith and approved by the Board of Trustees. The Board of Trustees has established a Valuation Committee comprised of the Trustees and has delegated to it the authority to take any actions regarding the valuation of portfolio securities that the Valuation Committee deems necessary in determining the fair value of portfolio securities, unless the responsibility has been delegated to the Management Valuation Team of Wells Fargo Funds Management, LLC (“Funds Management”). The Board of Trustees retains the authority to make or ratify any valuation decisions or approve any changes to the Fair Value Procedures as it deems appropriate. On a quarterly basis, the Board of Trustees considers for ratification any valuation actions taken by the Valuation Committee or the Management Valuation Team.
| | | | |
| 22 | | Wells Fargo Advantage Diversified Capital Builder Fund | | Notes to Financial Statements (Unaudited) |
Valuations of fair valued prices are compared to the next actual sales price when available, or other appropriate market information to assess the continued appropriateness of the fair valuation methodology used. The securities are fair valued on a day-to-day basis, taking into consideration changes to appropriate market information and any significant changes to the input factors considered in the valuation process until there is a readily available price provided on the exchange or by an independent pricing service. Valuations received from an independent pricing service or broker quotes are periodically validated by comparisons to most recent trades and valuations provided by other independent pricing services in addition to the review of prices by the adviser and/or sub-adviser. Unobservable inputs used in determining fair valuations are identified based on the type of security, taking into consideration factors utilized by market participants in valuing the investment, knowledge about the issuer and the current market environment.
Foreign currency translation
The accounting records of the Fund are maintained in U.S. dollars. Assets, including investment securities, and liabilities denominated in foreign currency are translated into U.S. dollars at the prevailing rates of exchange at the date of valuation. Purchases and sales of securities, and income and expenses are translated at the prevailing rate of exchange on the respective dates of such transactions. Reported net realized foreign exchange gains or losses arise from sales of foreign currencies, currency gains or losses realized between the trade and settlement dates on securities transactions, and the difference between the amounts of dividends, interest and foreign withholding taxes recorded and the U.S. dollar equivalent of the amounts actually paid or received. Net unrealized foreign exchange gains and losses arise from changes in the fair value of assets and liabilities other than investments in securities resulting in changes in exchange rates.
The changes in net assets arising from changes in exchange rates and the changes in net assets resulting from changes in market prices of securities are not separately presented. Such changes are recorded with net realized and unrealized gains or losses from investments. Gains and losses from certain foreign currency transactions are treated as ordinary income for U.S. federal income tax purposes.
Security loans
The Fund may lend its securities from time to time in order to earn additional income in the form of fees or interest on securities received as collateral or the investment of any cash received as collateral. The Fund continues to receive interest or dividends on the securities loaned. The Fund receives collateral in the form of cash or securities with a value at least equal to the value of the securities on loan. The value of the loaned securities is determined at the close of each business day and any additional required collateral is delivered to the Fund on the next business day. In a securities lending transaction, the net asset value of the Fund will be affected by an increase or decrease in the value of the securities loaned and by an increase or decrease in the value of the instrument in which collateral is invested. The amount of securities lending activity undertaken by the Fund fluctuates from time to time. In the event of default or bankruptcy by the borrower, the Fund may be prevented from recovering the loaned securities or gaining access to the collateral or may experience delays or costs in doing so. In addition, the investment of any cash collateral received may lose all or part of its value. The Fund has the right under the lending agreement to recover the securities from the borrower on demand.
The Fund lends its securities through an unaffiliated securities lending agent. Cash collateral received in connection with its securities lending transactions is invested in Wells Fargo Securities Lending Cash Investments, LLC (the “Cash Collateral Fund”). The Cash Collateral Fund is exempt from registration under Section 3(c)(7) of the 1940 Act and is managed by Funds Management and is sub-advised by Wells Capital Management Incorporated (“Wells Capital Management”). Funds Management receives an advisory fee starting at 0.05% and declining to 0.01% as the average daily net assets of the Cash Collateral Fund increase. All of the fees received by Funds Management are paid to Wells Capital Management for its services as sub-adviser. The Cash Collateral Fund seeks to provide a positive return compared to the daily Fed Funds Open rate by investing in high-quality, U.S. dollar-denominated short-term money market instruments. Cash Collateral Fund investments are fair valued based upon the amortized cost valuation technique. Income earned from investment in the Cash Collateral Fund is included in securities lending income on the Statement of Operations.
Security transactions and income recognition
Securities transactions are recorded on a trade date basis. Realized gains or losses are reported on the basis of identified cost of securities delivered.
Interest income is accrued daily and bond discounts are accreted and premiums are amortized daily based on the effective interest method. To the extent debt obligations are placed on non-accrual status, any related interest income
| | | | | | |
| Notes to Financial Statements (Unaudited) | | Wells Fargo Advantage Diversified Capital Builder Fund | | | 23 | |
may be reduced by writing off interest receivables when the collection of all or a portion of interest has become doubtful based on consistently applied procedures. If the issuer subsequently resumes interest payments or when the collectability of interest is reasonably assured, the debt obligation is removed from non-accrual status.
Dividend income is recognized on the ex-dividend date, except for certain dividends from foreign securities, which are recorded as soon as the Fund is informed of the ex-dividend date. Dividend income from foreign securities is recorded net of foreign taxes withheld where recovery of such taxes is not assured.
Distributions to shareholders
Distributions to shareholders from net investment income and net realized gains, if any, are recorded on the ex-dividend date. Such distributions are determined in conformity with income tax regulations, which may differ from generally accepted accounting principles.
Federal and other taxes
The Fund intends to continue to qualify as a regulated investment company by distributing substantially all of its investment company taxable income and any net realized capital gains (after reduction for capital loss carryforwards) sufficient to relieve it from all, or substantially all, federal income taxes. Accordingly, no provision for federal income taxes was required.
The Fund’s income and federal excise tax returns and all financial records supporting those returns for the prior three fiscal years are subject to examination by the federal and Delaware revenue authorities. Management has analyzed the Fund’s tax positions taken on federal, state, and foreign tax returns for all open tax years and does not believe that there are any uncertain tax positions that require recognition of a tax liability.
Under the recently enacted Regulated Investment Company Modernization Act of 2010, the Fund is permitted to carry forward capital losses incurred in taxable years which began after December 22, 2010 for an unlimited period. However, any losses incurred are required to be utilized prior to the losses incurred in pre-enactment taxable years. As a result of this ordering rule, pre-enactment capital loss carryforwards may be more likely to expire unused. Additionally, post-enactment capital losses that are carried forward will retain their character as either short-term or long-term capital losses rather than being considered all short-term as under previous law.
As of September 30, 2011, the Fund had net capital loss carryforwards, which are available to offset future net realized capital gains, in the amount of $159,961,304 with $129,010,780 expiring in 2017 and $30,950,524 expiring in 2018.
Class allocations
The separate classes of shares offered by the Fund differ principally in applicable sales charges, distribution, shareholder servicing and administration fees. Shareholders of each class bear certain expenses that pertain to that particular class. All shareholders bear the common expenses of the Fund, earn income from the portfolio, and are allocated unrealized gains and losses pro rata based on the average daily net assets of each class, without distinction between share classes. Dividends are determined separately for each class based on income and expenses allocable to each class. Realized gains and losses are allocated to each class pro rata based upon the net assets of each class on the date realized. Differences in per share dividend rates generally result from the relative weightings of pro rata income and realized gain allocations and from differences in separate class expenses, including distribution, shareholder servicing and administration fees.
3. FAIR VALUATION MEASUREMENTS
Fair value measurements of investments are determined within a framework that has established a fair value hierarchy based upon the various data inputs utilized in determining the value of the Fund’s investments. The three-level hierarchy gives the highest priority to unadjusted quoted prices in active markets for identical assets or liabilities (Level 1) and the lowest priority to significant unobservable inputs (Level 3). The Fund’s investments are classified within the fair value hierarchy based on the lowest level of input that is significant to the fair value measurement. The inputs are summarized into three broad levels as follows:
| n | | Level 1 – quoted prices in active markets for identical securities |
| n | | Level 2 – other significant observable inputs (including quoted prices for similar securities, interest rates, prepayment speeds, credit risk, etc.) |
| n | | Level 3 – significant unobservable inputs (including the Fund’s own assumptions in determining the fair value of investments) |
| | | | |
| 24 | | Wells Fargo Advantage Diversified Capital Builder Fund | | Notes to Financial Statements (Unaudited) |
The inputs or methodologies used for valuing securities are not necessarily an indication of the risk associated with investing in those securities.
As of March 31, 2012, the inputs used in valuing the Fund’s assets, which are carried at fair value, were as follows:
| | | | | | | | | | | | | | | | |
| Investments in Securities | | Quoted Prices (Level 1) | | | Significant Other
Observable Inputs (Level 2) | | | Significant Unobservable Inputs (Level 3) | | | Total | |
Equity securities | | | | | | | | | | | | | | | | |
Common stocks | | $ | 456,163,615 | | | $ | 0 | | | $ | 0 | | | $ | 456,163,615 | |
Corporate bonds and notes | | | 0 | | | | 83,618,172 | | | | 0 | | | | 83,618,172 | |
Yankee corporate bonds and notes | | | 0 | | | | 997,500 | | | | 0 | | | | 997,500 | |
Short-term investments | | | | | | | | | | | | | | | | |
Investment companies | | | 669,556 | | | | 84,732,750 | | | | 0 | | | | 85,402,306 | |
| | | $ | 456,833,171 | | | $ | 169,348,422 | | | $ | 0 | | | $ | 626,181,593 | |
Further details on the major security types listed above can be found in the Portfolio of Investments.
Transfers in and transfers out are recognized at the end of the reporting period. For the six months ended March 31, 2012, the Fund did not have any significant transfers into/out of Level 1 and Level 2.
4. TRANSACTIONS WITH AFFILIATES AND OTHER EXPENSES
Advisory fee
The Trust has entered into an advisory contract with Funds Management, an indirect wholly owned subsidiary of Wells Fargo & Company (“Wells Fargo”). The adviser is responsible for implementing investment policies and guidelines and for supervising the sub-adviser, who is responsible for day-to-day portfolio management of the Fund.
Pursuant to the contract, Funds Management is entitled to receive an annual advisory fee starting at 0.60% and declining to 0.45% as the average daily net assets of the Fund increase. For the six months ended March 31, 2012, the advisory fee was equivalent to an annual rate of 0.60% of the Fund’s average daily net assets.
Funds Management has retained the services of certain sub-advisers to provide daily portfolio management to the Fund. The fees related to sub-advisory services are borne directly by Funds Management and do not increase the overall fees paid by the Fund. Wells Capital Management, an affiliate of Funds Management, is the sub-adviser to the Fund and is entitled to receive a fee from Funds Management at an annual rate starting at 0.35% and declining to 0.20% as the average daily net assets of the Fund increase.
Administration and transfer agent fees
The Trust has entered into an administration agreement with Funds Management. Under this agreement, for providing administrative services, which includes paying fees and expenses for services provided by the transfer agent, sub-transfer agents, omnibus account servicers and record-keepers, Funds Management is entitled to receive from the Fund an annual fund level administration fee starting at 0.05% and declining to 0.03% as the average daily net assets of the Fund increase and a class level administration fee which is calculated based on the average daily net assets of each class as follows:
| | | | |
| | | Class Level Administration Fee | |
Class A, Class B, Class C | | | 0.26 | % |
Administrator Class | | | 0.10 | |
Institutional Class | | | 0.08 | |
Funds Management has contractually waived and/or reimbursed advisory and administration fees to the extent necessary to maintain certain net operating expense ratios for the Fund. Waiver of fees and/or reimbursement of expenses by Funds Management were made first from fund level expenses on a proportionate basis and then from class
| | | | | | |
| Notes to Financial Statements (Unaudited) | | Wells Fargo Advantage Diversified Capital Builder Fund | | | 25 | |
specific expenses. Funds Management has committed through July 11, 2013 to waive fees and/or reimburse expenses to the extent necessary to cap the Fund’s expenses at 1.20% for Class A, 1.95% for Class B, 1.95% for Class C, 0.95% for Administrator Class and 0.78% for Institutional Class.
Distribution fees
The Trust has adopted a Distribution Plan for Class B and Class C shares of the Fund pursuant to Rule 12b-1 under the 1940 Act. Distribution fees are charged to Class B and Class C shares and paid to Wells Fargo Funds Distributor, LLC, the principal underwriter, at an annual rate of 0.75% of the average daily net assets of Class B and Class C shares.
For the six months ended March 31, 2012, Wells Fargo Funds Distributor, LLC received $4,752 from the sale of Class A shares and $45, $5,358 and $115 in contingent deferred sales charges from redemptions of Class A, Class B and Class C shares, respectively.
Shareholder servicing fees
The Trust has entered into contracts with one or more shareholder servicing agents, whereby Class A, Class B, Class C and Administrator Class of the Fund is charged a fee at an annual rate of 0.25% of the average daily net assets of each respective class.
A portion of these total shareholder servicing fees were paid to affiliates of Wells Fargo.
5. INVESTMENT PORTFOLIO TRANSACTIONS
Purchases and sales of investments, excluding U.S. Government obligations (if any) and short-term securities, for the six months ended March 31, 2012 were $178,563,379 and $204,462,730, respectively.
6. BANK BORROWINGS
The Trust (excluding the money market funds) and Wells Fargo Variable Trust are parties to a $150,000,000 revolving credit agreement with State Street Bank and Trust Company, whereby the Fund is permitted to use bank borrowings for temporary or emergency purposes, such as to fund shareholder redemption requests. Interest under the credit agreement is charged to the Fund based on a borrowing rate equal to the higher of the Federal Funds rate in effect on that day plus 1.25% or the overnight LIBOR rate in effect on that day plus 1.25%. In addition, an annual commitment fee equal to 0.10% of the unused balance is allocated to each participating fund. For the six months ended March 31, 2012, the Fund paid $577 in commitment fees.
For the six months ended March 31, 2012, there were no borrowings by the Fund under the agreement.
7. INDEMNIFICATION
Under the Trust’s organizational documents, the officers and directors are indemnified against certain liabilities that may arise out of performance of their duties to the Trust. Additionally, in the normal course of business, the Trust may enter into contracts with service providers that contain a variety of indemnification clauses. The Trust’s maximum exposure under these arrangements is dependent on future claims that may be made against the Fund and, therefore, cannot be estimated.
8. NEW ACCOUNTING PRONOUNCEMENTS
In December 2011, the Financial Accounting Standards Board (“FASB”) issued Accounting Standard Update (“ASU”) No. 2011-11, Disclosures about Offsetting Assets and Liabilities. ASU 2011-11, which amends FASB ASC Topic 210 Balance Sheet, creates new disclosure requirements requiring entities to disclose both gross and net information for derivatives and other financial instruments that are either offset in the Statement of Assets and Liabilities or subject to an enforceable master netting arrangement or similar agreement. The disclosure requirements are effective for interim and annual reporting periods beginning on or after January 1, 2013. Management is currently evaluating the impact of the update’s adoption on the Fund’s financial statement disclosures.
In May 2011, FASB issued ASU No. 2011-04 “Amendments to Achieve Common Fair Value Measurement and Disclosure Requirements in U.S. GAAP and IFRSs”. ASU No. 2011-04 amends FASB ASC Topic 820, Fair Value Measurements and Disclosures, to establish common requirements for measuring fair value and for disclosing information about fair value measurements in accordance with GAAP. The ASU is effective prospectively for interim and annual periods beginning
| | | | |
| 26 | | Wells Fargo Advantage Diversified Capital Builder Fund | | Notes to Financial Statements (Unaudited) |
after December 15, 2011. Management expects that adoption of the ASU will result in additional disclosures in the financial statements, as applicable.
In April 2011, FASB issued ASU No. 2011-03 “Reconsideration of Effective Control for Repurchase Agreements”. ASU No. 2011-03 amends FASB ASC Topic 860, Transfers and Servicing, specifically the criteria required to determine whether a repurchase agreement (repo) and similar agreements should be accounted for as sales of financial assets or secured borrowings with commitments. ASU No. 2011-03 changes the assessment of effective control by focusing on the transferor’s contractual rights and obligations and removing the criterion to assess its ability to exercise those rights or honor those obligations. This could result in changes to the way entities account for certain transactions including repurchase agreements, mortgage dollar rolls and reverse repurchase agreements. The ASU will become effective on a prospective basis for new transfers and modifications to existing transactions as of the beginning of the first interim or annual period beginning on or after December 15, 2011. Management has evaluated the impact of adopting the ASU and expects no significant changes.
| | | | | | |
| Other Information (Unaudited) | | Wells Fargo Advantage Diversified Capital Builder Fund | | | 27 | |
PROXY VOTING INFORMATION
A description of the policies and procedures that the Fund uses to determine how to vote proxies relating to portfolio securities is available without charge, upon request, by calling 1-800-222-8222, visiting our Web site at wellsfargoadvantagefunds.com, or visiting the SEC Web site at sec.gov. Information regarding how the Fund voted proxies relating to portfolio securities during the most recent 12-month period ended June 30 is available without charge on the Fund’s Web site at wellsfargoadvantagefunds.com or by visiting the SEC Web site at sec.gov.
PORTFOLIO HOLDINGS INFORMATION
The complete portfolio holdings for the Fund are publicly available on the Fund’s Web site (wellsfargoadvantagefunds.com) on a monthly, 30-day or more delayed basis. In addition, top ten holdings information for the Fund is publicly available on the Fund’s Web site on a monthly, seven-day or more delayed basis. The Fund files its complete schedule of portfolio holdings with the SEC for the first and third quarters of each fiscal year on Form N-Q, which is available without charge by visiting the SEC Web site at sec.gov. In addition, the Fund’s Form N-Q may be reviewed and copied at the SEC’s Public Reference Room in Washington, DC, and at regional offices in New York City, at 233 Broadway, and in Chicago, at 175 West Jackson Boulevard, Suite 900. Information about the Public Reference Room may be obtained by calling 1-800-SEC-0330.
| | | | |
| 28 | | Wells Fargo Advantage Diversified Capital Builder Fund | | Other Information (Unaudited) |
BOARD OF TRUSTEES
The following table provides basic information about the Board of Trustees (the “Trustees”) of the Trust and Officers of the Trust. This table should be read in conjunction with the Prospectus and the Statement of Additional Information1 of the Fund. Each of the Trustees and Officers listed below acts in identical capacities for the Wells Fargo Advantage family of funds, which consists of 137 funds comprising the Wells Fargo Funds Trust, Wells Fargo Variable Trust, Wells Fargo Master Trust and four closed-end funds (collectively the “Fund Complex”). All of the Trustees are also Members of the Audit and Governance Committees of each Trust in the Fund Complex. The mailing address of each Trustee and Officer is 525 Market Street, 12th Floor, San Francisco, CA 94105. Each Trustee and Officer serves an indefinite term, however, each Trustee serves such term until reaching the mandatory retirement age established by the Trustees.
Independent Trustees
| | | | | | |
Name and Year of Birth | | Position Held and Length of Service | | Principal Occupations During Past Five Years | | Other Directorships During
Past Five Years |
Peter G. Gordon
(Born 1942) | | Trustee, since 1998; Chairman, since 2005 (Lead Trustee since 2001) | | Co-Founder, Retired Chairman, President and CEO of Crystal Geyser Water Company. Trustee Emeritus, Colby College | | Asset Allocation Trust |
Isaiah Harris, Jr.
(Born 1952) | | Trustee, since 2009 | | Retired. Prior thereto, President and CEO of BellSouth Advertising and Publishing Corp. from 2005 to 2007, President and CEO of BellSouth Enterprises from 2004 to 2005 and President of BellSouth Consumer Services from 2000 to 2003. Emeritus member of the Iowa State University Foundation Board of Governors. Emeritus Member of the Advisory Board of Iowa State University School of Business. Mr. Harris is a certified public accountant. | | CIGNA Corporation; Deluxe Corporation; Asset Allocation Trust |
Judith M. Johnson
(Born 1949) | | Trustee, since 2008 | | Retired. Prior thereto, Chief Executive Officer and Chief Investment Officer of Minneapolis Employees Retirement Fund from 1996 to 2008. Ms. Johnson is an attorney, certified public accountant and a certified managerial accountant. | | Asset Allocation Trust |
Leroy Keith, Jr.
(Born 1939) | | Trustee, since 2010 | | Chairman, Bloc Global Services (development and construction). Trustee of the Evergreen Funds from 1983 to 2010. Former Managing Director, Almanac Capital Management (commodities firm), former Partner, Stonington Partners, Inc. (private equity fund), former Director, Obagi Medical Products Co. and former Director, Lincoln Educational Services. | | Trustee, Virtus Fund Complex (consisting of 40 portfolios as of 12/31/11); Asset Allocation Trust |
David F. Larcker
(Born 1950) | | Trustee, since 2009 | | James Irvin Miller Professor of Accounting at the Graduate School of Business, Stanford University, Director of Corporate Governance Research Program and Senior Faculty of The Rock Center for Corporate Governance since 2006. From 2005 to 2008, Professor of Accounting at the Graduate School of Business, Stanford University. Prior thereto, Ernst & Young Professor of Accounting at The Wharton School, University of Pennsylvania from 1985 to 2005. | | Asset Allocation Trust |
Olivia S. Mitchell
(Born 1953) | | Trustee, since 2006 | | International Foundation of Employee Benefit Plans Professor, Wharton School of the University of Pennsylvania since 1993. Director of Wharton’s Pension Research Council and Boettner Center on Pensions & Retirement Research, and Research Associate at the National Bureau of Economic Research. Previously, Cornell University Professor from 1978 to 1993. | | Asset Allocation Trust |
| | | | | | |
| Other Information (Unaudited) | | Wells Fargo Advantage Diversified Capital Builder Fund | | | 29 | |
| | | | | | |
Name and Year of Birth | | Position Held and Length of Service | | Principal Occupations During Past Five Years | | Other Directorships During
Past Five Years |
Timothy J. Penny
(Born 1951) | | Trustee, since 1996 | | President and CEO of Southern Minnesota Initiative Foundation, a non-profit organization, since 2007 and Senior Fellow at the Humphrey Institute Policy Forum at the University of Minnesota since 1995. Member of the Board of Trustees of NorthStar Education Finance, Inc., a non-profit organization, since 2007. | | Asset Allocation Trust |
Michael S. Scofield
(Born 1943) | | Trustee, since 2010 | | Served on the Investment Company Institute’s Board of Governors and Executive Committee from 2008-2011 as well the Governing Council of the Independent Directors Council from 2006-2011 and the Independent Directors Council Executive Committee from 2008-2011. Chairman of the IDC from 2008-2010. Institutional Investor (Fund Directions) Trustee of Year in 2007. Trustee of the Evergreen Funds (and its predecessors) from 1984 to 2010. Chairman of the Evergreen Funds from 2000-2010. Former Trustee of the Mentor Funds. Retired Attorney, Law Offices of Michael S. Scofield and former Director and Chairman, Branded Media Corporation (multi-media branding company). | | Asset Allocation Trust |
Donald C. Willeke
(Born 1940) | | Trustee, since 1996 | | Principal of the law firm of Willeke & Daniels. General Counsel of the Minneapolis Employees Retirement Fund from 1984 until its consolidation into the Minnesota Public Employees Retirement Association on June 30, 2010. Director and Vice Chair of The Free Trust (non-profit corporation). Director of the American Chestnut Foundation (non-profit corporation). | | Asset Allocation Trust |
Officers
| | | | | | |
Name and Year of Birth | | Position Held and
Length of Service | | Principal Occupations During Past Five Years | | |
Karla M. Rabusch
(Born 1959) | | President, since 2003 | | Executive Vice President of Wells Fargo Bank, N.A. and President of Wells Fargo Funds Management, LLC since 2003. Senior Vice President and Chief Administrative Officer of Wells Fargo Funds Management, LLC from 2001 to 2003. | | |
C. David Messman
(Born 1960) | | Secretary, since 2000; Chief Legal Counsel, since 2003 | | Senior Vice President and Secretary of Wells Fargo Funds Management, LLC since 2001. Vice President and Managing Senior Counsel of Wells Fargo Bank, N.A. since 1996. | | |
Kasey Phillips
(Born 1970) | | Treasurer, since 2009 | | Senior Vice President of Wells Fargo Funds Management, LLC since 2009. Senior Vice President of Evergreen Investment Management Company, LLC from 2006 to 2010. Treasurer of the Evergreen Funds from 2005 to 2010. | | |
David Berardi
(Born 1975) | | Assistant Treasurer, since 2009 | | Vice President of Wells Fargo Funds Management, LLC since 2009. Vice President of Evergreen Investment Management Company, LLC from 2008 to 2010. Assistant Vice President of Evergreen Investment Services, Inc. from 2004 to 2008. Manager of Fund Reporting and Control for Evergreen Investment Management Company, LLC from 2004 to 2010. | | |
Jeremy DePalma
(Born 1974) | | Assistant Treasurer, since 2009 | | Senior Vice President of Wells Fargo Funds Management, LLC since 2009. Senior Vice President of Evergreen Investment Management Company, LLC from 2008 to 2010. Vice President, Evergreen Investment Services, Inc. from 2004 to 2007. Head of the Fund Reporting and Control Team within Fund Administration from 2005 to 2010. | | |
Debra Ann Early
(Born 1964) | | Chief Compliance Officer, since 2007 | | Chief Compliance Officer of Wells Fargo Funds Management, LLC since 2007. Chief Compliance Officer of Parnassus Investments from 2005 to 2007. Chief Financial Officer of Parnassus Investments from 2004 to 2007 and Senior Audit Manager of PricewaterhouseCoopers LLP from 1998 to 2004. | | |
| 1. | The Statement of Additional Information includes additional information about the Trustees and is available, without charge, upon request, by calling 1-800-222-8222 or by visiting the Web site at wellsfargoadvantagefunds.com. |
| | | | |
| 30 | | Wells Fargo Advantage Diversified Capital Builder Fund | | Other Information (Unaudited) |
BOARD CONSIDERATION OF INVESTMENT ADVISORY AND SUB-ADVISORY AGREEMENTS:
Under Section 15 of the Investment Company Act of 1940 (the “1940 Act”), the Board of Trustees (the “Board”) of Wells Fargo Funds Trust (the “Trust”), all the members of which have no direct or indirect interest in the investment advisory and sub-advisory agreements and are not “interested persons” of the Trust, as defined in the 1940 Act (the “Independent Trustees”), must determine whether to approve the continuation of the Trust’s investment advisory and sub-advisory agreements. In this regard, at an in person meeting held on March 29-30, 2012 (the “Meeting”), the Board reviewed and re-approved: (i) an investment advisory agreement with Wells Fargo Funds Management, LLC (“Funds Management”) for Wells Fargo Advantage Diversified Capital Builder Fund (the “Fund”) and (ii) an investment sub-advisory agreement with Wells Capital Management Incorporated (“Wells Capital Management”) for the Fund. The investment advisory agreement with Funds Management and the investment sub-advisory agreement with Wells Capital Management are collectively referred to as the “Advisory Agreements.”
At the Meeting, the Board considered the factors and reached the conclusions described below relating to the selection of Funds Management and Wells Capital Management and the continuation of the Advisory Agreements. Prior to the Meeting, the Trustees conferred extensively among themselves and with representatives of Funds Management about these matters. The Board also met throughout the year and received information that was useful to them in considering the continuation of the Advisory Agreements. The Independent Trustees were assisted in their evaluation of the Advisory Agreements by independent legal counsel, from whom they received separate legal advice and with whom they met separately from Funds Management.
In providing information to the Board, Funds Management and Wells Capital Management were guided by a detailed set of requests submitted by the Independent Trustees’ independent legal counsel on their behalf at the start of the Board’s annual contract renewal process earlier in 2012. In approving the Advisory Agreements, the Board did not identify any particular information or consideration that was all-important or controlling, and each Trustee likely attributed different weights to various factors.
Nature, extent and quality of services
The Board received and considered various information regarding the nature, extent and quality of services provided to the Fund by Funds Management and Wells Capital Management under the Advisory Agreements. The Board also received and considered, among other things, information about the background and experience of senior management of Funds Management, and the qualifications, backgrounds, tenures and responsibilities of the portfolio managers primarily responsible for the day-to-day portfolio management of the Fund.
The Board evaluated the ability of Funds Management and Wells Capital Management, based on their respective financial condition, resources, reputation and other attributes, to attract and retain qualified investment professionals, including research, advisory, and supervisory personnel. The Board further considered the compliance programs and compliance records of Funds Management and Wells Capital Management. In addition, the Board took into account the administrative services provided to the Fund by Funds Management and its affiliates.
The Board’s decision to approve the continuation of the Advisory Agreements was based on a comprehensive evaluation of all of the information provided to it. In considering these matters, the Board considered not only the specific information presented in connection with the Meeting, but also the knowledge gained over time through interaction with Funds Management and Wells Capital Management about various topics, including Funds Management’s oversight of service providers. The above factors, together with those referenced below, are some of the most important, but not necessarily all, factors considered by the Board in concluding that the nature, extent and quality of the investment advisory services provided to the Fund by Funds Management and Wells Capital Management supported the re-approval of the Advisory Agreements. Although the Board considered the continuation of the Advisory Agreements for the Fund as part of the larger process of considering the continuation of the advisory agreements for all of the funds in the complex, its decision to continue the Advisory Agreements for the Fund was ultimately made on a fund-by-fund basis.
Fund performance and expenses
The Board considered the performance results for the Fund over various time periods ended December 31, 2011. The Board also considered these results in comparison to the median performance of a universe of relevant funds (the “Universe”) that was determined by Lipper Inc. (“Lipper”) to be similar to the Fund, and in comparison to the Fund’s
| | | | | | |
| Other Information (Unaudited) | | Wells Fargo Advantage Diversified Capital Builder Fund | | | 31 | |
benchmark index and to other comparative data. Lipper is an independent provider of investment company data. The Board received a description of the methodology used by Lipper to select the mutual funds in the Universe.
The Board noted that, while the performance of the Fund for the three-year period under review was higher than the median performance of the Universe, the performance of the Fund was lower than the median performance of the Universe for all other periods under review. The Board also noted that, while the performance of the Fund for the three-year period under review was higher than the performance of the Fund’s benchmark, the Lipper Mixed-Asset Target Allocation Growth Funds Index, the performance of the Fund was lower than the Lipper Mixed-Asset Target Allocation Growth Funds Index for all other periods under review.
The Board also noted that the Fund’s performance results warranted further discussion. As part of its further review, the Board received an analysis of, and discussed factors contributing to, the underperformance of the Fund relative to the Universe. The Board received a report that noted that a contributing factor to the Fund’s more recent underperformance was its heavy concentration in the cyclical sectors of the market. The Board was satisfied that Funds Management was taking appropriate actions with respect to the Fund’s investment performance.
The Board received and considered information regarding the Fund’s contractual advisory fee and net operating expense ratios and their various components, including actual management fees (which reflect fee waivers, if any), transfer agent, custodian and other non-management fees, Rule 12b-1 and non-Rule 12b-1 fees, service fees and fee waiver and expense reimbursement arrangements. The Board also considered these ratios in comparison to the median ratios of an expense Universe and a narrower expense group of mutual funds (each, an “Expense Group”) that was determined by Lipper to be similar to the Fund. The Board received a description of the methodology used by Lipper to select the mutual funds in the Fund’s Expense Group. The Board noted that the net operating expense ratios of the Fund were in range or lower than the median net operating expense ratios of the Fund’s Expense Group.
Based on the above-referenced considerations and other factors, the Board concluded that the overall performance and expense structure of the Fund supported the re-approval of the Advisory Agreements for the Fund.
Investment advisory and sub-advisory fee rates
The Board reviewed and considered the contractual investment advisory fee rate that is payable by the Fund to Funds Management for investment advisory services (the “Advisory Agreement Rate”), both on a stand-alone basis and on a combined basis with the Fund’s administration fee rate. The Board took into account the separate administrative and other services covered by the administration fee rate. The Board also reviewed and considered the contractual investment sub-advisory fee rate that is payable by Funds Management to Wells Capital Management for investment sub-advisory services (the “Sub-Advisory Agreement Rate”). In addition, the Board reviewed and considered the existing fee waiver/cap arrangements applicable to the Advisory Agreement Rate and considered the Advisory Agreement Rate after taking the waivers/caps into account (the “Net Advisory Rate”).
The Board received and considered information comparing the Advisory Agreement Rate and Net Advisory Rate with those of other funds in the Fund’s Expense Group median. The Board noted that the Advisory Agreement Rate and Net Advisory Rate for the Administrator and Institutional share classes of the Fund were in range of the median rates of their respective Expense Groups, while the Advisory Agreement Rate and Net Advisory Rate for the A share class of the Fund were higher than the median rates of its Expense Group. The Board viewed favorably that the Adviser agreed to maintain the existing fee waiver/cap arrangements.
The Board also received and considered information about the nature and extent of services offered and fee rates charged by Funds Management and Wells Capital Management to other types of clients. In this regard, the Board received information about differences between the services, and the compliance, reporting, and other legal burdens and risks of providing investment advice to mutual funds and those associated with providing advice to non-mutual fund clients such as collective funds or institutional separate accounts.
The Board determined that the Advisory Agreement Rate for the Fund, both with and without an administration fee rate and before and after waivers, was reasonable in light of the Fund’s Expense Group information, the net expense ratio commitments, the services covered by the Advisory Agreements and other information provided. The Board also reviewed and considered the Sub-Advisory Agreement Rate and concluded that the Sub-Advisory Agreement Rate was reasonable in light of the services covered by the sub-advisory agreement and other information provided.
| | | | |
| 32 | | Wells Fargo Advantage Diversified Capital Builder Fund | | Other Information (Unaudited) |
Profitability
The Board received and considered a profitability analysis of Funds Management, as well as an analysis of the profitability to the collective Wells Fargo businesses that provide services to the Fund. It considered that the information provided to it was necessarily estimated, and that the profitability information provided to it, especially on a fund-by-fund basis, did not necessarily provide a precise tool for evaluating the appropriateness of the Fund’s Advisory Agreement Rate in isolation. It noted that the levels of profitability reported on a fund-by-fund basis varied widely, depending on, among other things, the size and type of fund. The Board concluded that the profitability reported by Funds Management was not unreasonable.
The Board did not consider separate profitability information with respect to Wells Capital Management, because, as an affiliate of Funds Management, its profitability information was subsumed in the collective Wells Fargo profitability analysis provided by Funds Management.
Economies of scale
With respect to possible economies of scale, the Board reviewed the breakpoints in the Fund’s advisory fee structure, which operate generally to reduce the effective Advisory Agreement Rate of the Fund (as a percentage of Fund assets) as the Fund grows in size. It considered that, as a fund shrinks in size, breakpoints conversely result in increasing fee levels. The Board noted that it would have on-going opportunities to review the appropriate levels of breakpoints in the future, and concluded that the breakpoints as implemented appeared to be a reasonable step toward sharing economies of scale, if any, with the Fund. However, the Board acknowledged the inherent limitations of any analysis of an investment adviser’s economies of scale and of any attempt to correlate breakpoints with such economies, stemming largely from the Board’s understanding that economies of scale are realized, if at all, by an investment adviser across a variety of products and services, not just with respect to a single fund.
Other benefits to Funds Management and Wells Capital Management
The Board received and considered information regarding potential “fall-out” or ancillary benefits received by Funds Management and its affiliates, including Wells Capital Management, as a result of their relationship with the Fund. Ancillary benefits could include, among others, benefits directly attributable to the relationship of Funds Management and Wells Capital Management with the Fund and benefits potentially derived from an increase in Funds Management’s and Wells Capital Management’s business as a result of their relationship with the Fund (such as the ability to market to shareholders other financial products offered by Funds Management and its affiliates, including Wells Capital Management).
The Board considered that Wells Fargo Funds Distributor, LLC, an affiliate of Funds Management, serves as distributor to the Fund and receives certain compensation for those services. The Board noted that various financial institutions, including affiliates of Funds Management, may receive distribution-related fees, shareholder servicing payments (including amounts derived from payments under Rule 12b-1 plans) and sub-transfer agency fees in respect of shares sold or held through them and services provided.
The Board also reviewed information about whether and to what extent soft dollar credits are sought and how any such credits are utilized and any benefits that may be realized by using an affiliated broker.
Other factors and broader review
The Board also considered the markets for distribution of the Fund’s shares, including the channels through which the Fund’s shares are offered and sold. The Board noted that the Fund is part of one of the few fund families that have both direct-to-fund and intermediary distribution channels. As discussed above, the Board reviews detailed materials received from Funds Management and Wells Capital Management annually as part of the re-approval process under Section 15 of the 1940 Act and also reviews and assesses information about the quality of the services that the Fund receives throughout the year. In this regard, the Board has reviewed reports of Funds Management at each of its quarterly meetings, which include, among other things, portfolio reviews and performance reports. In addition, the Board confers with portfolio managers at various times throughout the year.
Conclusion
After considering the above-described factors and based on its deliberations and its evaluation of the information described above, the Board unanimously approved the continuation of the Advisory Agreements for an additional one-year period.
| | | | | | |
| List of Abbreviations | | Wells Fargo Advantage Diversified Capital Builder Fund | | | 33 | |
The following is a list of common abbreviations for terms and entities which may have appeared in this report.
| ACB | — Agricultural Credit Bank |
| ADR | — American Depository Receipt |
| ADS | — American Depository Shares |
| AGC-ICC | — Assured Guaranty Corporation - Insured Custody Certificates |
| AGM | — Assured Guaranty Municipal |
| AMBAC | — American Municipal Bond Assurance Corporation |
| AMT | — Alternative Minimum Tax |
| BAN | — Bond Anticipation Notes |
| BHAC | — Berkshire Hathaway Assurance Corporation |
| CAB | — Capital Appreciation Bond |
| CCAB | — Convertible Capital Appreciation Bond |
| CDA | — Community Development Authority |
| CDO | — Collateralized Debt Obligation |
| COP | — Certificate of Participation |
| DRIVER | — Derivative Inverse Tax-Exempt Receipts |
| DW&P | — Department of Water & Power |
| DWR | — Department of Water Resources |
| ECFA | — Educational & Cultural Facilities Authority |
| EDA | — Economic Development Authority |
| EDFA | — Economic Development Finance Authority |
| ETF | — Exchange-Traded Fund |
| FFCB | — Federal Farm Credit Bank |
| FGIC | — Financial Guaranty Insurance Corporation |
| FHA | — Federal Housing Authority |
| FHLB | — Federal Home Loan Bank |
| FHLMC | — Federal Home Loan Mortgage Corporation |
| FICO | — The Financing Corporation |
| FNMA | — Federal National Mortgage Association |
| GDR | — Global Depository Receipt |
| GNMA | — Government National Mortgage Association |
| HCFR | — Healthcare Facilities Revenue |
| HEFA | — Health & Educational Facilities Authority |
| HEFAR | — Higher Education Facilities Authority Revenue |
| HFA | — Housing Finance Authority |
| HFFA | — Health Facilities Financing Authority |
| IBC | — Insured Bond Certificate |
| IDA | — Industrial Development Authority |
| IDAG | — Industrial Development Agency |
| IDR | — Industrial Development Revenue |
| KRW | — Republic of Korea Won |
| LIBOR | — London Interbank Offered Rate |
| LLC | — Limited Liability Company |
| LLP | — Limited Liability Partnership |
| MBIA | — Municipal Bond Insurance Association |
| MFHR | — Multi-Family Housing Revenue |
| MSTR | — Municipal Securities Trust Receipts |
| MUD | — Municipal Utility District |
| NATL-RE | — National Public Finance Guarantee Corporation |
| PCFA | — Pollution Control Finance Authority |
| PCR | — Pollution Control Revenue |
| PFA | — Public Finance Authority |
| PFFA | — Public Facilities Financing Authority |
| PFOTER | — Puttable Floating Option Tax-Exempt Receipts |
| plc | — Public Limited Company |
| PUTTER | — Puttable Tax-Exempt Receipts |
| R&D | — Research & Development |
| RDA | — Redevelopment Authority |
| RDFA | — Redevelopment Finance Authority |
| REIT | — Real Estate Investment Trust |
| ROC | — Reset Option Certificates |
| SAVRS | — Select Auction Variable Rate Securities |
| SBA | — Small Business Authority |
| SFHR | — Single Family Housing Revenue |
| SFMR | — Single Family Mortgage Revenue |
| SPDR | — Standard & Poor’s Depositary Receipts |
| STRIPS | — Separate Trading of Registered Interest and Principal Securities |
| TAN | — Tax Anticipation Notes |
| TIPS | — Treasury Inflation-Protected Securities |
| TRAN | — Tax Revenue Anticipation Notes |
| TCR | — Transferable Custody Receipts |
| TTFA | — Transportation Trust Fund Authority |
| TVA | — Tennessee Valley Authority |
| XLCA | — XL Capital Assurance |
This page is intentionally left blank.


FOR MORE INFORMATION
More information about Wells Fargo Advantage Funds is available free upon request. To obtain literature, please write, e-mail, visit the Fund’s Web site, or call:
Wells Fargo Advantage Funds
P.O. Box 8266
Boston, MA 02266-8266
E-mail: wfaf@wellsfargo.com
Web site: wellsfargoadvantagefunds.com
Individual investors: 1-800-222-8222
Retail investment professionals: 1-888-877-9275
Institutional investment professionals: 1-866-765-0778
This report and the financial statements contained herein are submitted for the general information of the shareholders of Wells Fargo Advantage Funds. If this report is used for promotional purposes, distribution of the report must be accompanied or preceded by a current prospectus. For a prospectus containing more complete information, including charges and expenses, call 1-800-222-8222 or visit the Fund’s Web site at wellsfargoadvantagefunds.com. Please consider the investment objectives, risks, charges, and expenses of the investment carefully before investing. This and other information about Wells Fargo Advantage Funds can be found in the current prospectus. Read the prospectus carefully before you invest or send money.
Wells Fargo Funds Management, LLC, a wholly owned subsidiary of Wells Fargo & Company, provides investment advisory and administrative services for Wells Fargo Advantage Funds. Other affiliates of Wells Fargo & Company provide subadvisory and other services for the Funds. The Funds are distributed by Wells Fargo Funds Distributor, LLC, Member FINRA/SIPC, an affiliate of Wells Fargo & Company.
NOT FDIC INSURED ¡ NO BANK GUARANTEE ¡ MAY LOSE VALUE
© 2012 Wells Fargo Funds Management, LLC. All rights reserved.
| | |
 | | 208984 05-12 SA225/SAR225 3-12 |

Wells Fargo Advantage
Diversified Income Builder Fund

Semi-Annual Report
March 31, 2012

Reduce clutter. Save trees.
Sign up for electronic delivery of prospectuses and shareholder reports at wellsfargo.com/advantagedelivery
Contents
The views expressed and any forward-looking statements are as of March 31, 2012, unless otherwise noted, and are those of the Fund managers and/or Wells Fargo Funds Management, LLC. Discussions of individual securities, or the markets generally, or any Wells Fargo Advantage Fund are not intended as individual recommendations. Future events or results may vary significantly from those expressed in any forward-looking statements; the views expressed are subject to change at any time in response to changing circumstances in the market. Wells Fargo Funds Management, LLC, disclaims any obligation to publicly update or revise any views expressed or forward-looking statements.
NOT FDIC INSURED ¡ NO BANK GUARANTEE ¡ MAY LOSE VALUE

WELLS FARGO INVESTMENT HISTORY
| | |
| |
| 1932 | | Keystone creates one of the first mutual fund families. |
| |
| 1971 | | Wells Fargo & Company introduces one of the first institutional index funds. |
| |
| 1978 | | Wells Fargo applies Markowitz and Sharpe’s research on Modern Portfolio Theory to introduce one of the industry’s first Tactical Asset Allocation (TAA) models in institutional separately managed accounts. |
| |
| 1984 | | Wells Fargo Stagecoach Funds launches its first asset allocation fund. |
| |
| 1989 | | The Tactical Asset Allocation (TAA) Model is first applied to Wells Fargo’s asset allocation mutual funds. |
| |
| 1994 | | Wells Fargo introduces the LifePath Funds, one of the first suites of target date funds (now the Wells Fargo Advantage Dow Jones Target Date FundsSM). |
| |
| 1996 | | Evergreen Investments and Keystone Funds merge. |
| |
| 1997 | | Wells Fargo launches Wells Fargo Advantage WealthBuilder PortfoliosSM, a fund-of-funds suite of products that includes the use of quantitative models to shift assets among investment styles. |
| |
| 1999 | | Norwest Advantage Funds and Stagecoach Funds are reorganized into Wells Fargo Funds after the merger of Norwest and Wells Fargo. |
| |
| 2002 | | Evergreen Retail and Evergreen Institutional companies form the umbrella asset management company, Evergreen Investments. |
| |
| 2005 | | The integration of Strong Funds with Wells Fargo Funds creates Wells Fargo Advantage Funds, resulting in one of the top 20 mutual fund companies in the United States. |
| |
| 2006 | | Wells Fargo Advantage Funds relaunches the target date product line as Wells Fargo Advantage Dow Jones Target Date Funds. |
| |
| 2010 | | The mergers and reorganizations of Evergreen and Wells Fargo Advantage mutual funds are completed, unifying the families under the brand of Wells Fargo Advantage Funds. |
Wells Fargo Advantage Funds®
Wells Fargo Advantage Funds skillfully guides institutions, financial advisors, and individuals through the investment terrain to help them reach their financial objectives. Everything we do on behalf of investors is backed by our unique combination of qualifications.
Strength
Our organization is built on the standards of integrity and service established by our parent company—Wells Fargo & Company—more than 150 years ago. And, because we’re part of a highly diversified financial enterprise, we offer the depth of resources to help investors succeed.
Expertise
Our multi-boutique model offers investors access to the independent thinking of premier investment managers that have been chosen for their time-tested strategies. While each team specializes in a specific investment strategy, collectively they provide investors a wide choice of distinct investment styles. Our dedication to investment excellence doesn’t end with our expertise in manager selection—risk management, analysis, and rigorous ongoing review seek to ensure each manager’s investment process remains consistent.
Partnership
Our collaborative approach is built around understanding the needs and goals of our clients. By adhering to core principles of sound judgment and steady guidance, we support you through every stage of the investment decision process.
Carefully consider a fund’s investment objectives, risks, charges, and expenses before investing. For a current prospectus and, if available, a summary prospectus, containing this and other information, visit wellsfargoadvantagefunds.com. Read it carefully before investing.
Wells Fargo Funds Management, LLC, a wholly owned subsidiary of Wells Fargo & Company, provides investment advisory and administrative services for Wells Fargo Advantage Funds®. Other affiliates of Wells Fargo & Company provide subadvisory and other services for the Funds. The Funds are distributed by Wells Fargo Funds Distributor, LLC, Member FINRA/SIPC, an affiliate of Wells Fargo & Company.
“Dow Jones®” and “Dow Jones Target Date IndexesSM” are service marks of Dow Jones Trademark Holdings, LLC (“Dow Jones”), have been licensed to CME Group Index Services LLC (“CME Indexes”) and have been sublicensed for use for certain purposes by Global Index Advisors, Inc, and Wells Fargo Funds Management, LLC. The Wells Fargo Advantage Dow Jones Target Date FundsSM based on the Dow Jones Target Date IndexesSM, are not sponsored, endorsed, sold or promoted by Dow Jones, CME Indexes or their respective affiliates and none of them makes any representation regarding the advisability of investing in such product(s).
NOT FDIC INSURED ¡ NO BANK GUARANTEE ¡ MAY LOSE VALUE
Not part of the semi-annual report.
Wells Fargo Advantage Funds offers more than 110 mutual funds across a wide range of asset classes, representing over $213 billion in assets under management, as of March 31, 2012.
| | | | |
| Equity Funds | | | | |
Asia Pacific Fund | | Equity Value Fund | | Precious Metals Fund |
C&B Large Cap Value Fund | | Global Opportunities Fund | | Premier Large Company Growth Fund |
C&B Mid Cap Value Fund | | Growth Fund | | Small Cap Opportunities Fund |
Capital Growth Fund | | Index Fund | | Small Cap Value Fund |
Common Stock Fund | | International Equity Fund | | Small Company Growth Fund |
Disciplined U.S. Core Fund | | International Value Fund | | Small Company Value Fund |
Discovery Fund† | | Intrinsic Small Cap Value Fund | | Small/Mid Cap Core Fund |
Diversified Equity Fund | | Intrinsic Value Fund | | Small/Mid Cap Value Fund |
Diversified International Fund | | Intrinsic World Equity Fund | | Special Mid Cap Value Fund |
Diversified Small Cap Fund | | Large Cap Core Fund | | Special Small Cap Value Fund |
Emerging Growth Fund | | Large Cap Growth Fund | | Specialized Technology Fund |
Emerging Markets Equity Fund | | Large Company Value Fund | | Strategic Large Cap Growth Fund |
Endeavor Select Fund† | | Omega Growth Fund | | Traditional Small Cap Growth Fund |
Enterprise Fund† | | Opportunity Fund† | | Utility and Telecommunications Fund |
| Bond Funds | | | | |
Adjustable Rate Government Fund | | Inflation-Protected Bond Fund | | Short-Term Bond Fund |
California Limited-Term Tax-Free Fund | | Intermediate Tax/AMT-Free Fund | | Short-Term High Yield Bond Fund |
California Tax-Free Fund | | International Bond Fund | | Short-Term Municipal Bond Fund |
Colorado Tax-Free Fund | | Minnesota Tax-Free Fund | | Strategic Municipal Bond Fund |
Government Securities Fund | | Municipal Bond Fund | | Total Return Bond Fund |
High Income Fund | | North Carolina Tax-Free Fund | | Ultra Short-Term Income Fund |
High Yield Bond Fund | | Pennsylvania Tax-Free Fund | | Ultra Short-Term Municipal Income Fund |
Income Plus Fund | | Short Duration Government Bond Fund | | Wisconsin Tax-Free Fund |
| Asset Allocation Funds | | | | |
Absolute Return Fund | | WealthBuilder Equity Portfolio† | | Target 2020 Fund† |
Asset Allocation Fund | | WealthBuilder Growth Allocation Portfolio† | | Target 2025 Fund† |
Conservative Allocation Fund | | WealthBuilder Growth Balanced Portfolio† | | Target 2030 Fund† |
Diversified Capital Builder Fund | | WealthBuilder Moderate Balanced Portfolio† | | Target 2035 Fund† |
Diversified Income Builder Fund | | WealthBuilder Tactical Equity Portfolio† | | Target 2040 Fund† |
Growth Balanced Fund | | Target Today Fund† | | Target 2045 Fund† |
Index Asset Allocation Fund | | Target 2010 Fund† | | Target 2050 Fund† |
Moderate Balanced Fund | | Target 2015 Fund† | | Target 2055 Fund† |
WealthBuilder Conservative Allocation Portfolio† | | | | |
| Money Market Funds | | | | |
100% Treasury Money Market Fund | | Heritage Money Market Fund† | | National Tax-Free Money Market Fund |
California Municipal Money Market Fund | | Money Market Fund | | Prime Investment Money Market Fund |
Cash Investment Money Market Fund | | Municipal Cash Management Money Market Fund | | Treasury Plus Money Market Fund |
Government Money Market Fund | | Municipal Money Market Fund | | |
| Variable Trust Funds1 | | | | |
VT Discovery Fund† | | VT Intrinsic Value Fund | | VT Small Cap Growth Fund |
VT Index Asset Allocation Fund | | VT Omega Growth Fund | | VT Small Cap Value Fund |
VT International Equity Fund | | VT Opportunity Fund† | | VT Total Return Bond Fund |
An investment in a money market fund is not insured or guaranteed by the Federal Deposit Insurance Corporation or any other government agency. Although the Wells Fargo Advantage Money Market Funds seek to preserve the value of your investment at $1.00 per share, it is possible to lose money by investing in a money market fund.
| 1. | The Variable Trust Funds are generally available only through insurance company variable contracts. |
| † | In this report, the Wells Fargo Advantage Discovery FundSM, Wells Fargo Advantage Endeavor Select FundSM, Wells Fargo Advantage Enterprise FundSM, Wells Fargo Advantage Opportunity FundSM, Wells Fargo Advantage WealthBuilder Conservative Allocation PortfolioSM, Wells Fargo Advantage WealthBuilder Equity PortfolioSM, Wells Fargo Advantage WealthBuilder Growth Allocation PortfolioSM, Wells Fargo Advantage WealthBuilder Growth Balanced PortfolioSM, Wells Fargo Advantage WealthBuilder Moderate Balanced PortfolioSM, Wells Fargo Advantage WealthBuilder Tactical Equity PortfolioSM, Wells Fargo Advantage Dow Jones Target Today FundSM, Wells Fargo Advantage Dow Jones Target 2010 FundSM, Wells Fargo Advantage Dow Jones Target 2015 FundSM, Wells Fargo Advantage Dow Jones Target 2020 FundSM, Wells Fargo Advantage Dow Jones Target 2025 FundSM, Wells Fargo Advantage Dow Jones Target 2030 FundSM, Wells Fargo Advantage Dow Jones Target 2035 FundSM, Wells Fargo Advantage Dow Jones Target 2040 FundSM, Wells Fargo Advantage Dow Jones Target 2045 FundSM, Wells Fargo Advantage Dow Jones Target 2050 FundSM, Wells Fargo Advantage Dow Jones Target 2055 FundSM, Wells Fargo Advantage Heritage Money Market FundSM, Wells Fargo Advantage VT Discovery FundSM, and Wells Fargo Advantage VT Opportunity FundSM are referred to as the Discovery Fund, Endeavor Select Fund, Enterprise Fund, Opportunity Fund, WealthBuilder Conservative Allocation Portfolio, WealthBuilder Equity Portfolio, WealthBuilder Growth Allocation Portfolio, WealthBuilder Growth Balanced Portfolio, WealthBuilder Moderate Balanced Portfolio, WealthBuilder Tactical Equity Portfolio, Target Today Fund, Target 2010 Fund, Target 2015 Fund, Target 2020 Fund, Target 2025 Fund, Target 2030 Fund, Target 2035 Fund, Target 2040 Fund, Target 2045 Fund, Target 2050 Fund, Target 2055 Fund, Heritage Money Market Fund, VT Discovery Fund, and VT Opportunity Fund, respectively. |
Not part of the semi-annual report.
| | | | |
| 2 | | Wells Fargo Advantage Diversified Income Builder Fund | | Letter to Shareholders |

Karla M. Rabusch,
President
Wells Fargo Advantage Funds
The financial markets throughout most of the past six months may best be described as a risk-on/risk-off trading environment in response to the uncertainty about the sustainability of the U.S. economic recovery, ongoing concerns about the Greek debt crisis, and the overall health of the eurozone.
After struggling in the early part of the six-month period, most equity markets rallied to post extraordinary total returns on the whole. In fact, most of the major U.S. equity indexes realized the strongest first-quarter performance in over 10 years during the first three months of 2012.
Dear Valued Shareholder:
We’re pleased to offer you this semi-annual report for the Wells Fargo Advantage Diversified Income Builder Fund for the six-month period that ended March 31, 2012.
The financial markets throughout most of the past six months may best be described as a risk-on/risk-off trading environment in response to the uncertainty about the sustainability of the U.S. economic recovery, ongoing concerns about the Greek debt crisis, and the overall health of the eurozone. When volatility and uncertainty were high, investors sold risky assets such as high-beta1 equities, commodities, emerging markets securities, and high-yield bonds, in preference for the relative safety of U.S. Treasuries. In periods of low volatility, investor risk tolerance sharply rose, and the markets sought out the higher yield and return potential of those riskier investments.
During the first quarter of 2012, investor sentiment appeared to be more positive and balanced. This recent shift in sentiment was the result of improvement in the global macroeconomic backdrop, which contributed to a less volatile market environment and more stable consensus earnings growth outlook. These developments also encouraged investors to refocus on underlying fundamentals and a longer-term investment perspective, which may have sparked the first-quarter equity rally led by stocks and sectors that were shunned at points in 2011, notably retail and higher-growth technology names. In addition, as investors’ risk tolerance increased during the period, corporate bonds, including high-yield bonds, were favored over the relative safety and lower yields offered by U.S. Treasuries.
After struggling in the early part of the six-month period, most equity markets rallied to post extraordinary total returns on the whole. In fact, most of the major U.S. equity indexes realized the strongest first-quarter performance in over 10 years during the first three months of 2012.
During the six-month period, the S&P 500 Index2 and the Russell 3000® Index3 posted returns of 25.89% and 26.55%, respectively, while the Barclays U.S. Aggregate Bond Index4, representing the universe of investment-grade U.S. bonds, posted a total return of 1.43%. By comparison, the Barclays U.S. Treasury
| 1. | Beta measures fund volatility relative to general market movements. It is a standardized measure of systematic risk in comparison to a specified index. The benchmark beta is 1.00 by definition. Beta is based on historical performance and does not represent future results. |
| 2. | The S&P 500 Index consists of 500 stocks chosen for market size, liquidity, and industry group representation. It is a market-value weighted index with each stock’s weight in the index proportionate to its market value. You cannot invest directly in an index. |
| 3. | The Russell 3000® Index measures the performance of the 3,000 largest U.S. companies based on total market capitalization, which represents approximately 98% of the investable U.S. equity market. You cannot invest directly in an index. |
| 4. | The Barclays U.S. Aggregate Bond Index is composed of the Barclays Government/Credit Index and the Mortgage-Backed Securities Index and includes U.S. Treasury issues, agency issues, corporate bond issues, and mortgage-backed securities. You cannot invest directly in an index. |
| | | | | | |
| Letter to Shareholders | | Wells Fargo Advantage Diversified Income Builder Fund | | | 3 | |
Index5 and Barclays 20+ Year U.S. Treasury Index6 returned (0.41)% and (5.02)%, respectively, while the Barclays U.S. Corporate High Yield Bond Index7 added 12.14% during the period.
On the international front, the MSCI EAFE Index8 returned 13.12% during the six-month period, while the BofA Merrill Lynch Global Broad Market Ex. U.S. Index9, representative of the international investment-grade bond market, returned 0.78%.
The developed global economies regained some momentum during the period.
Most global economies modestly improved during the six-month period, but their paths were uneven, primarily due to persistently sluggish jobs growth and a flat housing market affecting the U.S. and the ongoing sovereign debt concerns impacting the eurozone.
The U.S. Bureau of Economic Analysis reported that U.S. gross domestic product (GDP) expanded to an annual growth rate of 1.8% in the third quarter of 2011, re-igniting hopes of a sustainable economic recovery. Those hopes were buoyed further by the final estimate of fourth-quarter of 2011 GDP, which showed that growth accelerated to a 3.0% annual rate. While few economists now believe that the U.S. economy is in danger of sliding back into recession, many continue to expect a tepid economic growth environment in 2012.
Within the eurozone, GDP grew at an annualized rate of 1.5% for 2011, which was modestly weaker from a year earlier when eurozone GDP was reported at an annualized rate of 2.0% in the fourth quarter of 2010. Considering the fiscal challenges that faced European countries throughout 2011—stemming, primarily, from the reemergence of the Greek debt crisis—most economists had expected weaker economic conditions in 2011. While several steps have been taken by the International Monetary Fund and the European Central Bank to address the ongoing fiscal challenges in Europe, economic conditions of many countries in the eurozone are likely to remain weak throughout 2012.
Central banks across the globe remain committed to accommodative policies.
With inflation in check, the U.S. Federal Reserve (Fed) held its target range for the federal funds rate—a proxy for short-term interest rates—steady at 0% to 0.25%. Last summer, the Federal Open Market Committee (FOMC) issued a statement explaining that economic conditions were likely to warrant exceptionally low levels for the federal funds rate through at least mid-2013—a timetable that was later revised to late 2014 following the FOMC meeting on January 25, 2012.
| 5. | The Barclays U.S. Treasury Index is an index of U.S. Treasury securities. You cannot invest directly in an index. |
| 6. | The Barclays 20+ Year U. S. Treasury Index is an unmanaged index composed of securities in the U.S. Treasury Index with maturities of 20 years or greater. You cannot invest directly in an index. |
| 7. | The Barclays U.S. Corporate High Yield Bond Index is an unmanaged, U.S. dollar denominated, nonconvertible, non-investment grade debt index. The index consists of domestic and corporate bonds rated Ba and below with a minimum outstanding amount of $150 million. You cannot invest directly in an index. |
| 8. | The Morgan Stanley Capital International Europe, Australasia, and Far East (“MSCI EAFE”) Index is an unmanaged group of securities widely regarded by investors to be representations of the stock markets of Europe, Australasia, and the Far East. You cannot invest directly in an index. Source: MSCI. MSCI makes no express or implied warranties or representations and shall have no liability whatsoever with respect to any MSCI data contained herein. The MSCI data may not be further redistributed or used as a basis for other indexes or any securities or financial products. This report is not approved, reviewed or produced by MSCI. |
| 9. | The BofA Merrill Lynch Global Broad Market Ex. U.S. Index tracks the performance of investment grade debt publicly issued in the major domestic and euro bond markets, including sovereign, quasi-government, corporate, securitized and collateralized securities and excludes all securities denominated in U.S. dollars. You cannot invest directly in an index. |
| | | | |
| 4 | | Wells Fargo Advantage Diversified Income Builder Fund | | Letter to Shareholders |
The European Central Bank (ECB) also continued to maintain an accommodative monetary policy throughout the period, primarily in efforts to stave off the contagion risk stemming from the ongoing concerns about the potential of Greece defaulting on its sovereign bonds. Fortunately, Greece received another bailout and was able to restructure its outstanding debt in February 2012, which alleviated near-term contagion risks and the possibility of the euro collapsing. However, the agreement does not fully address longer-term structural issues that affect not only Greece, but several other countries across the eurozone. Recognizing the drag the persistent sovereign debt crisis has had on financial stability across the eurozone, the ECB-introduced additional liquidity into the European banking system through its long-term refinancing operations (LTRO). The LTRO program effectively encourages European banks to buy sovereign bonds of the eurozone governments, helping to push yields lower on bonds from financially fragile countries like Spain and Italy. This type of activity helps to reduce the near-term risk that those countries would experience funding issues. From a global credit market perspective, this additional liquidity further helps alleviate fears of contagion and causes risk premiums to decline—an ideal scenario for equities and high-yield bonds.
Recent events have not altered our message to shareholders.
The heightened volatility across the global financial markets during 2011 and lingering uncertainties about the outlook going forward have left many investors questioning their resolve—and their investments. Yet it is precisely at such times that the market may present opportunities—as well as challenges—for prudent investors. For many investors, simply building and maintaining a well-diversified10 investment plan focused on clear financial objectives is the best long-term strategy.
Thank you for choosing to invest with Wells Fargo Advantage Funds. We appreciate your confidence in us and remain committed to helping you meet your financial needs. For current information about your fund investments, contact your investment professional, visit our Web site at wellsfargoadvantagefunds.com, or call us directly at 1-800-222-8222. We are available 24 hours a day, 7 days a week.
Sincerely,

Karla M. Rabusch
President
Wells Fargo Advantage Funds
| 10. | Diversification does not assure or guarantee better performance and cannot eliminate the risk of investment losses. |
| | | | | | |
| Letter to Shareholders | | Wells Fargo Advantage Diversified Income Builder Fund | | | 5 | |
Notice to Shareholders
The Board of Trustees for Wells Fargo Advantage Funds has unanimously approved the following modifications to certain net asset value (NAV) waiver privileges and commission schedules:
| | n | | Effective May 1, 2012, automatic investment plan (AIP) purchases and proceeds received from systematic withdrawals will no longer qualify for NAV repurchase privileges. | |
| | n | | Effective May 1, 2012, discretionary rights to waive the upfront commission for Class C and “jumbo” Class A share purchases will no longer be granted to broker/dealers. However, we will continue to waive the Class C shares contingent deferred sales charge for redemptions by employer-sponsored retirement plans where the dealer of record waived its commission at the time of purchase. | |
| | n | | Effective July 31, 2012, NAV purchase privileges for former Evergreen Class IS and Class R shareholders are being modified to remove the ability to purchase Class A shares at NAV unless those shares are held directly with the Fund on or after July 31, 2012. | |
Please contact your investment professional or call us directly at 1-800-222-8222 if you have any questions on this Notice to Shareholders.
| | | | |
| 6 | | Wells Fargo Advantage Diversified Income Builder Fund | | Performance Highlights (Unaudited) |
INVESTMENT OBJECTIVE
The Fund seeks long-term total return, consisting of capital appreciation and current income.
ADVISER
Wells Fargo Funds Management, LLC
SUB-ADVISER
Wells Capital Management Incorporated
PORTFOLIO MANAGER
Margaret Patel
FUND INCEPTION
April 14, 1987
| | | | |
TEN LARGEST HOLDINGS1 (AS OF MARCH 31, 2012) | | | |
NRG Energy Incorporated, 7.88%, 5/15/2021 | | | 4.62% | |
General Cable Corporation, 7.13%, 4/01/2017 | | | 3.95% | |
Valeant Phamaceuticals International Incorporated, 7.00%, 10/1/2020 | | | 3.42% | |
Dycom Investments Incorporated, 7.13%, 1/15/2021 | | | 3.32% | |
Kraton Polymers LLC, 6.75%, 3/1/2019 | | | 3.12% | |
United State Steel Corporation, 7.38%, 4/1/2020 | | | 3.08% | |
Valeant Phamaceuticals International Incorporated, 7.25%, 7/15/2022 | | | 2.87% | |
Koppers Holdings Incorporated, 7.88%, 12/1/2019 | | | 2.71% | |
NII Capital Corporation, 7.63%, 4/1/2021 | | | 2.50% | |
Endo Pharmaceuticals Holdings Incorporated, 7.00%, 12/15/2020 | | | 2.19% | |
| | |
PORTFOLIO ALLOCATION2 (AS OF MARCH 31, 2012) |
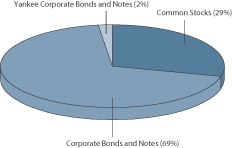
|
| 1. | The ten largest holdings are calculated based on the value of the securities divided by total net assets of the Fund. Holdings are subject to change and may have changed since the date specified. |
| 2. | Portfolio allocation is subject to change and is calculated based on the total long-term investments of the Fund. |
| | | | | | |
| Performance Highlights (Unaudited) | | Wells Fargo Advantage Diversified Income Builder Fund | | | 7 | |
AVERAGE ANNUAL TOTAL RETURN3 (%) (AS OF MARCH 31, 2012)
| | | | | | | | | | | | | | | | | | | | | | | | | | | | | | | | | | | | | | | | | | | | |
| | | | | | Including Sales Charge | | | Excluding Sales Charge | | | Expense Ratios4 | |
| | | Inception Date | | | 6 Months* | | | 1 Year | | | 5 Year | | | 10 Year | | | 6 Months* | | | 1 Year | | | 5 Year | | | 10 Year | | | Gross | | | Net5 | |
Class A (EKSAX) | | | 04/14/1987 | | | | 7.02 | | | | (2.83 | ) | | | 2.24 | | | | 5.32 | | | | 13.53 | | | | 3.03 | | | | 3.46 | | | | 5.95 | | | | 1.13% | | | | 1.08% | |
Class B (EKSBX)** | | | 02/01/1993 | | | | 8.07 | | | | (2.61 | ) | | | 2.37 | | | | 5.42 | | | | 13.07 | | | | 2.28 | | | | 2.70 | | | | 5.42 | | | | 1.88% | | | | 1.83% | |
Class C (EKSCX) | | | 02/01/1993 | | | | 12.09 | | | | 1.27 | | | | 2.69 | | | | 5.18 | | | | 13.09 | | | | 2.27 | | | | 2.69 | | | | 5.18 | | | | 1.88% | | | | 1.83% | |
Administrator Class (EKSDX) | | | 07/30/2010 | | | | | | | | | | | | | | | | | | | | 13.64 | | | | 3.03 | | | | 3.51 | | | | 6.03 | | | | 0.97% | | | | 0.90% | |
Institutional Class (EKSYX) | | | 01/13/1997 | | | | | | | | | | | | | | | | | | | | 13.75 | | | | 3.39 | | | | 3.71 | | | | 6.23 | | | | 0.70% | | | | 0.70% | |
Diversified Income Builder Blended Index6 | | | | | | | | | | | | | | | | | | | | | | | 15.10 | | | | 6.33 | | | | 6.47 | | | | 7.89 | | | | | | | | | |
BofA Merrill Lynch High Yield Master Index7 | | | | | | | | | | | | | | | | | | | | | | | 11.53 | | | | 5.71 | | | | 7.74 | | | | 8.86 | | | | | | | | | |
Russell 1000® Index8 | | | | | | | | | | | | | | | | | | | | | | | 26.27 | | | | 7.86 | | | | 2.19 | | | | 4.53 | | | | | | | | | |
| * | Returns for periods of less than one year are not annualized. |
| ** | Class B shares are closed to investment, except in connection with the reinvestment of any distributions and permitted exchanges. |
Figures quoted represent past performance, which is no guarantee of future results and do not reflect the deduction of taxes that a shareholder may pay on fund distributions or the redemption of fund shares. Investment return and principal value of an investment will fluctuate so that an investor’s shares, when redeemed, may be worth more or less than their original cost. Performance shown without sales charges would be lower if sales charges were reflected. Current performance may be lower or higher than the performance data quoted and assumes the reinvestment of dividends and capital gains. Current month-end performance is available on the Fund’s Web site – wellsfargoadvantagefunds.com
Index returns do not include transaction costs associated with buying and selling securities, any mutual fund fees or expenses or any taxes. It is not possible to invest directly in an index.
For Class A shares, the maximum front-end sales charge is 5.75%. For Class B shares, the maximum contingent deferred sales charge is 5.00%. For Class C shares, the maximum contingent deferred sales charge is 1.00%. Performance including sales charge assumes the sales charge for the corresponding time period. Administrator Class and Institutional Class shares are sold without a front-end sales charge or contingent deferred sales charge.
Balanced funds may invest in stocks and bonds. Stock values fluctuate in response to the activities of individual companies and general market and economic conditions. Bond values fluctuate in response to the financial condition of individual issuers, general market and economic conditions, and changes in interest rates. In general, when interest rates rise, bond values fall and investors may lose principal value. Certain investment strategies tend to increase the total risk of an investment (relative to the broader market). This Fund is exposed to foreign investment risk and high-yield securities risk. Consult the Fund’s prospectus for additional information on these and other risks.
| 3. | Historical performance shown for the Administrator Class shares prior to their inception reflects the performance of the Institutional Class shares, adjusted to reflect the higher expenses applicable to the Administrator Class shares. Historical performance shown for all classes of the Fund prior to July 12, 2010 is based on the performance of the Fund’s predecessor, Evergreen Diversified Income Builder Fund. |
| 4. | Reflects the expense ratios as stated in the most recent prospectuses. |
| 5. | The Adviser has committed through July 11, 2013 to waive fees and/or reimburse expenses to the extent necessary to cap the Fund’s Total Annual Fund Operating Expenses After Fee Waiver, excluding certain expenses, at 1.08% for Class A, 1.83% for Class B, 1.83% for Class C, 0.90% for Administrator Class and 0.71% for Institutional Class. Without this cap, the Fund’s returns would have been lower. |
| 6. | Source: Wells Fargo Funds Management, LLC. The Diversified Income Builder Blended Index is composed of the following indexes: BofA Merrill Lynch High Yield Master Index (75%) and the Russell 1000® Index (25%). You cannot invest directly in an index. |
| 7. | BofA Merrill Lynch High Yield Master Index is an unmanaged market index that provides a broad-based performance measure of the non-investment grade U.S. domestic bond index. You cannot invest directly in an index. |
| 8. | The Russell 1000® Index measures the performance of the 1,000 largest companies in the Russell 3000® Index, which represents approximately 92% of the total market capitalization of the Russell 3000 Index. You cannot invest directly in an index. |
| | | | |
| 8 | | Wells Fargo Advantage Diversified Income Builder Fund | | Fund Expenses (Unaudited) |
As a shareholder of the Fund, you incur two types of costs: (1) transaction costs, including sales charges (loads) on purchase payments and contingent deferred sales charges (if any) on redemptions and (2) ongoing costs, including management fees; distribution (12b-1) and/or shareholder service fees; and other Fund expenses. This example is intended to help you understand your ongoing costs (in dollars) of investing in the Fund and to compare these costs with the ongoing costs of investing in other mutual funds.
The example is based on an investment of $1,000 invested at the beginning of the six-month period and held for the entire period from October 1, 2011 to March 31, 2012.
Actual Expenses
The “Actual” line of the table below provides information about actual account values and actual expenses. You may use the information in this line, together with the amount you invested, to estimate the expenses that you paid over the period. Simply divide your account value by $1,000 (for example, an $8,600 account value divided by $1,000 = 8.6), then multiply the result by the number in the “Actual” line under the heading entitled “Expenses Paid During Period” for your applicable class of shares to estimate the expenses you paid on your account during this period.
Hypothetical Example for Comparison Purposes
The “Hypothetical” line of the table below provides information about hypothetical account values and hypothetical expenses based on the Fund’s actual expense ratio and an assumed rate of return of 5% per year before expenses, which is not the Fund’s actual return. The hypothetical account values and expenses may not be used to estimate the actual ending account balance or expenses you paid for the period. You may use this information to compare the ongoing costs of investing in the Fund and other funds. To do so, compare this 5% hypothetical example with the 5% hypothetical examples that appear in the shareholder reports of the other funds.
Please note that the expenses shown in the table are meant to highlight your ongoing costs only and do not reflect any transactional costs, such as sales charges (loads) and contingent deferred sales charges. Therefore, the “Hypothetical” line of the table is useful in comparing ongoing costs only, and will not help you determine the relative total costs of owning different funds. In addition, if these transactional costs were included, your costs would have been higher.
| | | | | | | | | | | | | | | | |
| | | Beginning
Account Value
10-01-2011 | | | Ending
Account Value
03-31-2012 | | | Expenses
Paid During
the Period¹ | | | Net Annual
Expense Ratio | |
Class A | | | | | | | | | | | | | | | | |
Actual | | $ | 1,000.00 | | | $ | 1,135.28 | | | $ | 5.77 | | | | 1.08 | % |
Hypothetical (5% return before expenses) | | $ | 1,000.00 | | | $ | 1,019.60 | | | $ | 5.45 | | | | 1.08 | % |
Class B | | | | | | | | | | | | | | | | |
Actual | | $ | 1,000.00 | | | $ | 1,130.68 | | | $ | 9.75 | | | | 1.83 | % |
Hypothetical (5% return before expenses) | | $ | 1,000.00 | | | $ | 1,015.85 | | | $ | 9.22 | | | | 1.83 | % |
Class C | | | | | | | | | | | | | | | | |
Actual | | $ | 1,000.00 | | | $ | 1,130.88 | | | $ | 9.75 | | | | 1.83 | % |
Hypothetical (5% return before expenses) | | $ | 1,000.00 | | | $ | 1,015.85 | | | $ | 9.22 | | | | 1.83 | % |
Administrator Class | | | | | | | | | | | | | | | | |
Actual | | $ | 1,000.00 | | | $ | 1,136.40 | | | $ | 4.81 | | | | 0.90 | % |
Hypothetical (5% return before expenses) | | $ | 1,000.00 | | | $ | 1,020.50 | | | $ | 4.55 | | | | 0.90 | % |
Institutional Class | | | | | | | | | | | | | | | | |
Actual | | $ | 1,000.00 | | | $ | 1,137.53 | | | $ | 3.74 | | | | 0.70 | % |
Hypothetical (5% return before expenses) | | $ | 1,000.00 | | | $ | 1,021.50 | | | $ | 3.54 | | | | 0.70 | % |
| 1. | Expenses paid is equal to the annualized expense ratio of each class multiplied by the average account value over the period, multiplied by the number of days in the most recent fiscal half-year divided by the number of days in the fiscal year (to reflect the one-half year period). |
| | | | | | |
| Portfolio of Investments—March 31, 2012 (Unaudited) | | Wells Fargo Advantage Diversified Income Builder Fund | | | 9 | |
| | | | | | | | | | | | |
| Security Name | | | | | | Shares | | | Value | |
| | | | | | | | | | | | |
| | | | |
Common Stocks: 28.66% | | | | | | | | | | | | |
| | | | |
Consumer Discretionary: 1.44% | | | | | | | | | | | | |
| | | | |
| Hotels, Restaurants & Leisure: 1.44% | | | | | | | | | | | | |
Marriott International Incorporated Class A « | | | | | | | 100,000 | | | $ | 3,785,000 | |
McDonald’s Corporation | | | | | | | 15,000 | | | | 1,471,500 | |
| | | | |
| | | | | | | | | | | 5,256,500 | |
| | | | | | | | | | | | |
| | | | |
Consumer Staples: 1.31% | | | | | | | | | | | | |
| | | | |
| Food Products: 1.31% | | | | | | | | | | | | |
General Mills Incorporated | | | | | | | 60,000 | | | | 2,367,000 | |
H.J. Heinz Company « | | | | | | | 45,000 | | | | 2,409,750 | |
| | | | |
| | | | | | | | | | | 4,776,750 | |
| | | | | | | | | | | | |
| | | | |
Energy: 7.83% | | | | | | | | | | | | |
| | | | |
| Energy Equipment & Services: 2.47% | | | | | | | | | | | | |
Cameron International Corporation Ǡ | | | | | | | 60,000 | | | | 3,169,800 | |
Dresser-Rand Group Incorporated † | | | | | | | 15,000 | | | | 695,850 | |
FMC Technologies Incorporated Ǡ | | | | | | | 20,000 | | | | 1,008,400 | |
Halliburton Company | | | | | | | 40,000 | | | | 1,327,600 | |
National Oilwell Varco Incorporated | | | | | | | 35,000 | | | | 2,781,450 | |
| | | | |
| | | | | | | | | | | 8,983,100 | |
| | | | | | | | | | | | |
| | | | |
| Oil, Gas & Consumable Fuels: 5.36% | | | | | | | | | | | | |
Alpha Natural Resources Incorporated † | | | | | | | 15,000 | | | | 228,150 | |
Anadarko Petroleum Corporation | | | | | | | 20,000 | | | | 1,566,800 | |
Atmos Energy Corporation | | | | | | | 40,000 | | | | 1,258,400 | |
Devon Energy Corporation | | | | | | | 18,000 | | | | 1,280,160 | |
EOG Resources Incorporated | | | | | | | 8,000 | | | | 888,800 | |
Kinder Morgan Incorporated « | | | | | | | 192,000 | | | | 7,420,800 | |
National Fuel Gas Company « | | | | | | | 35,000 | | | | 1,684,200 | |
Occidental Petroleum Corporation | | | | | | | 5,000 | | | | 476,150 | |
Pioneer Natural Resources Company | | | | | | | 2,000 | | | | 223,180 | |
Questar Corporation | | | | | | | 185,000 | | | | 3,563,100 | |
The Williams Companies Incorporated | | | | | | | 30,000 | | | | 924,300 | |
| | | | |
| | | | | | | | | | | 19,514,040 | |
| | | | | | | | | | | | |
| | | | |
Financials: 2.80% | | | | | | | | | | | | |
| | | | |
| Commercial Banks: 0.18% | | | | | | | | | | | | |
PNC Financial Services Group Incorporated | | | | | | | 10,000 | | | | 644,900 | |
| | | | | | | | | | | | |
| | | | |
| REITs: 2.62% | | | | | | | | | | | | |
American Tower Corporation | | | | | | | 100,000 | | | | 6,302,000 | |
Plum Creek Timber Company « | | | | | | | 35,000 | | | | 1,454,600 | |
Washington Real Estate Investment Trust « | | | | | | | 60,000 | | | | 1,782,000 | |
| | | | |
| | | | | | | | | | | 9,538,600 | |
| | | | | | | | | | | | |
The accompanying notes are an integral part of these financial statements.
| | | | |
| 10 | | Wells Fargo Advantage Diversified Income Builder Fund | | Portfolio of Investments—March 31, 2012 (Unaudited) |
| | | | | | | | | | | | |
| Security Name | | | | | | Shares | | | Value | |
| | | | | | | | | | | | |
| | | | |
Health Care: 3.14% | | | | | | | | | | | | |
| | | | |
| Health Care Equipment & Supplies: 1.28% | | | | | | | | | | | | |
Baxter International Incorporated | | | | | | | 20,000 | | | $ | 1,195,600 | |
C.R. Bard Incorporated | | | | | | | 35,000 | | | | 3,455,200 | |
| | | | |
| | | | | | | | | | | 4,650,800 | |
| | | | | | | | | | | | |
| | | | |
| Life Sciences Tools & Services: 0.73% | | | | | | | | | | | | |
Agilent Technologies Incorporated | | | | | | | 60,000 | | | | 2,670,600 | |
| | | | | | | | | | | | |
| | | | |
| Pharmaceuticals: 1.13% | | | | | | | | | | | | |
Allergan Incorporated | | | | | | | 20,000 | | | | 1,908,600 | |
Endo Pharmaceuticals Holdings Incorporated † | | | | | | | 20,000 | | | | 774,600 | |
Mylan Incorporated † | | | | | | | 60,000 | | | | 1,407,000 | |
| | | | |
| | | | | | | | | | | 4,090,200 | |
| | | | | | | | | | | | |
| | | | |
Industrials: 3.07% | | | | | | | | | | | | |
| | | | |
| Building Products: 0.11% | | | | | | | | | | | | |
Lennox International Incorporated « | | | | | | | 10,000 | | | | 403,000 | |
| | | | | | | | | | | | |
| | | | |
| Electrical Equipment: 0.41% | | | | | | | | | | | | |
AMETEK Incorporated | | | | | | | 10,000 | | | | 485,100 | |
Roper Industries Incorporated « | | | | | | | 10,000 | | | | 991,600 | |
| | | | |
| | | | | | | | | | | 1,476,700 | |
| | | | | | | | | | | | |
| | | | |
| Industrial Conglomerates: 0.15% | | | | | | | | | | | | |
Danaher Corporation | | | | | | | 10,000 | | | | 560,000 | |
| | | | | | | | | | | | |
| | | | |
| Machinery: 2.40% | | | | | | | | | | | | |
Donaldson Company Incorporated « | | | | | | | 26,000 | | | | 928,980 | |
Eaton Corporation | | | | | | | 38,000 | | | | 1,893,540 | |
Flowserve Corporation « | | | | | | | 10,000 | | | | 1,155,100 | |
IDEX Corporation | | | | | | | 35,000 | | | | 1,474,550 | |
Pall Corporation | | | | | | | 55,000 | | | | 3,279,650 | |
| | | | |
| | | | | | | | | | | 8,731,820 | |
| | | | | | | | | | | | |
| | | | |
Information Technology: 3.21% | | | | | | | | | | | | |
| | | | |
| Computers & Peripherals: 1.81% | | | | | | | | | | | | |
Apple Incorporated | | | | | | | 11,000 | | | | 6,594,170 | |
| | | | | | | | | | | | |
| | | | |
| Electronic Equipment, Instruments & Components: 0.84% | | | | | | | | | | | | |
FLIR Systems Incorporated « | | | | | | | 120,000 | | | | 3,037,200 | |
| | | | | | | | | | | | |
| | | | |
| Semiconductors & Semiconductor Equipment: 0.56% | | | | | | | | | | | | |
FEI Company Ǡ | | | | | | | 30,000 | | | | 1,473,300 | |
Microchip Technology Incorporated « | | | | | | | 15,000 | | | | 558,000 | |
| | | | |
| | | | | | | | | | | 2,031,300 | |
| | | | | | | | | | | | |
The accompanying notes are an integral part of these financial statements.
| | | | | | |
| Portfolio of Investments—March 31, 2012 (Unaudited) | | Wells Fargo Advantage Diversified Income Builder Fund | | | 11 | |
| | | | | | | | | | | | | | | | |
| Security Name | | | | | | | | Shares | | | Value | |
| | | | | | | | | | | | | | | | |
| | | | |
Materials: 3.59% | | | | | | | | | | | | | | | | |
| | | | |
| Chemicals: 1.16% | | | | | | | | | | | | | | | | |
Dow Chemical Company | | | | | | | | | | | 5,000 | | | $ | 173,200 | |
FMC Corporation | | | | | | | | | | | 2,900 | | | | 306,992 | |
Huntsman Corporation | | | | | | | | | | | 100,000 | | | | 1,401,000 | |
Mosaic Company | | | | | | | | | | | 20,000 | | | | 1,105,800 | |
Valspar Corporation | | | | | | | | | | | 25,000 | | | | 1,207,250 | |
| | | | |
| | | | | | | | | | | | | | | 4,194,242 | |
| | | | | | | | | | | | | | | | |
| | | | |
| Containers & Packaging: 0.16% | | | | | | | | | | | | | | | | |
Sealed Air Corporation | | | | | | | | | | | 30,000 | | | | 579,300 | |
| | | | | | | | | | | | | | | | |
| | | | |
| Metals & Mining: 2.27% | | | | | | | | | | | | | | | | |
Cliffs Natural Resources Incorporated | | | | | | | | | | | 37,000 | | | | 2,562,620 | |
Freeport-McMoRan Copper & Gold Incorporated | | | | | | | | | | | 150,000 | | | | 5,706,000 | |
| | | | |
| | | | | | | | | | | | | | | 8,268,620 | |
| | | | | | | | | | | | | | | | |
| | | | |
Utilities: 2.27% | | | | | | | | | | | | | | | | |
| | | | |
| Electric Utilities: 2.27% | | | | | | | | | | | | | | | | |
American Electric Power Company Incorporated | | | | | | | | | | | 65,000 | | | | 2,507,700 | |
Exelon Corporation | | | | | | | | | | | 65,000 | | | | 2,548,650 | |
Pepco Holdings Incorporated « | | | | | | | | | | | 170,000 | | | | 3,211,302 | |
| | | | |
| | | | | | | | | | | | | | | 8,267,652 | |
| | | | | | | | | | | | | | | | |
| | | | |
Total Common Stocks (Cost $97,016,178) | | | | | | | | | | | | | | | 104,269,494 | |
| | | | | | | | | | | | | | | | |
| | | | |
| | | Interest Rate | | | Maturity Date | | | Principal | | | | |
| Corporate Bonds and Notes: 67.16% | | | | | | | | | | | | | | | | |
| | | | |
Consumer Discretionary: 1.34% | | | | | | | | | | | | | | | | |
| | | | |
| Media: 1.34% | | | | | | | | | | | | | | | | |
Clear Channel Worldwide Holdings Incorporated Series A 144A | | | 7.63 | % | | | 03/15/2020 | | | $ | 625,000 | | | | 603,125 | |
Clear Channel Worldwide Holdings Incorporated Series B 144A | | | 7.63 | | | | 03/15/2020 | | | | 4,375,000 | | | | 4,287,500 | |
| | | | |
| | | | | | | | | | | | | | | 4,890,625 | |
| | | | | | | | | | | | | | | | |
| | | | |
Consumer Staples: 0.29% | | | | | | | | | | | | | | | | |
| | | | |
| Food Products: 0.29% | | | | | | | | | | | | | | | | |
Post Holdings Incorporated 144A | | | 7.38 | | | | 02/15/2022 | | | | 1,000,000 | | | | 1,047,500 | |
| | | | | | | | | | | | | | | | |
| | | | |
Energy: 8.50% | | | | | | | | | | | | | | | | |
| | | | |
| Energy Equipment & Services: 3.09% | | | | | | | | | | | | | | | | |
Atwood Oceanics Incorporated | | | 6.50 | | | | 02/01/2020 | | | | 1,500,000 | | | | 1,575,000 | |
Dresser-Rand Group Incorporated | | | 6.50 | | | | 05/01/2021 | | | | 3,485,000 | | | | 3,641,825 | |
Hornbeck Offshore Services 144A | | | 5.88 | | | | 04/01/2020 | | | | 6,000,000 | | | | 6,015,000 | |
| | | | |
| | | | | | | | | | | | | | | 11,231,825 | |
| | | | | | | | | | | | | | | | |
The accompanying notes are an integral part of these financial statements.
| | | | |
| 12 | | Wells Fargo Advantage Diversified Income Builder Fund | | Portfolio of Investments—March 31, 2012 (Unaudited) |
| | | | | | | | | | | | | | | | |
| Security Name | | Interest Rate | | | Maturity Date | | | Principal | | | Value | |
| | | | | | | | | | | | | | | | |
| | | | |
| Oil, Gas & Consumable Fuels: 5.41% | | | | | | | | | | | | | | | | |
Alpha Natural Resources Incorporated « | | | 6.25 | % | | | 06/01/2021 | | | $ | 2,000,000 | | | $ | 1,805,000 | |
Arch Coal Incorporated «144A | | | 7.25 | | | | 06/15/2021 | | | | 2,000,000 | | | | 1,845,000 | |
Consol Energy Incorporated | | | 8.25 | | | | 04/01/2020 | | | | 7,175,000 | | | | 7,497,875 | |
Murray Energy Corporation 144A | | | 10.25 | | | | 10/15/2015 | | | | 7,775,000 | | | | 7,561,188 | |
Range Resources Corporation | | | 5.00 | | | | 08/15/2022 | | | | 1,000,000 | | | | 987,500 | |
| | | | |
| | | | | | | | | | | | | | | 19,696,563 | |
| | | | | | | | | | | | | | | | |
| | | | |
Financials: 3.38% | | | | | | | | | | | | | | | | |
| | | | |
| Consumer Finance: 0.37% | | | | | | | | | | | | | | | | |
Qwest Capital Funding Incorporated | | | 6.50 | | | | 11/15/2018 | | | | 1,275,000 | | | | 1,361,063 | |
| | | | | | | | | | | | | | | | |
| | | | |
| REITs: 3.01% | | | | | | | | | | | | | | | | |
Host Hotels & Resorts LP 144A | | | 6.00 | | | | 10/01/2021 | | | | 5,600,000 | | | | 5,978,000 | |
Host Hotels & Resorts LP 144A | | | 5.25 | | | | 03/15/2022 | | | | 5,000,000 | | | | 4,975,000 | |
| | | | |
| | | | | | | | | | | | | | | 10,953,000 | |
| | | | | | | | | | | | | | | | |
| | | | |
Health Care: 9.72% | | | | | | | | | | | | | | | | |
| | | | |
| Health Care Providers & Services: 1.24% | | | | | | | | | | | | | | | | |
HCA Incorporated | | | 5.88 | | | | 03/15/2022 | | | | 4,500,000 | | | | 4,505,625 | |
| | | | | | | | | | | | | | | | |
| | | | |
| Pharmaceuticals: 8.48% | | | | | | | | | | | | | | | | |
Endo Pharmaceuticals Holdings Incorporated | | | 7.00 | | | | 12/15/2020 | | | | 7,440,000 | | | | 7,960,800 | |
Valeant Pharmaceuticals International Incorporated 144A | | | 7.00 | | | | 10/01/2020 | | | | 12,500,000 | | | | 12,437,500 | |
Valeant Pharmaceuticals International Incorporated 144A | | | 7.25 | | | | 07/15/2022 | | | | 10,560,000 | | | | 10,454,400 | |
| | | | |
| | | | | | | | | | | | | | | 30,852,700 | |
| | | | | | | | | | | | | | | | |
| | | | |
Industrials: 13.91% | | | | | | | | | | | | | | | | |
| | | | |
| Aerospace & Defense: 2.49% | | | | | | | | | | | | | | | | |
Alliant Techsystems Incorporated | | | 6.88 | | | | 09/15/2020 | | | | 5,000,000 | | | | 5,337,500 | |
Esterline Technologies Corporation | | | 7.00 | | | | 08/01/2020 | | | | 3,380,000 | | | | 3,734,900 | |
| | | | |
| | | | | | | | | | | | | | | 9,072,400 | |
| | | | | | | | | | | | | | | | |
| | | | |
| Commercial Services & Supplies: 0.90% | | | | | | | | | | | | | | | | |
Iron Mountain Incorporated | | | 7.75 | | | | 10/01/2019 | | | | 3,000,000 | | | | 3,277,500 | |
| | | | | | | | | | | | | | | | |
| | | | |
| Construction & Engineering: 3.32% | | | | | | | | | | | | | | | | |
Dycom Investments Incorporated | | | 7.13 | | | | 01/15/2021 | | | | 11,845,000 | | | | 12,081,900 | |
| | | | | | | | | | | | | | | | |
| | | | |
| Electrical Equipment: 5.55% | | | | | | | | | | | | | | | | |
Belden Incorporated | | | 7.00 | | | | 03/15/2017 | | | | 5,636,000 | | | | 5,812,125 | |
General Cable Corporation | | | 7.13 | | | | 04/01/2017 | | | | 13,950,000 | | | | 14,368,500 | |
| | | | |
| | | | | | | | | | | | | | | 20,180,625 | |
| | | | | | | | | | | | | | | | |
| | | | |
| Machinery: 1.65% | | | | | | | | | | | | | | | | |
Oshkosh Corporation | | | 8.50 | | | | 03/01/2020 | | | | 5,500,000 | | | | 5,988,125 | |
| | | | | | | | | | | | | | | | |
The accompanying notes are an integral part of these financial statements.
| | | | | | |
| Portfolio of Investments—March 31, 2012 (Unaudited) | | Wells Fargo Advantage Diversified Income Builder Fund | | | 13 | |
| | | | | | | | | | | | | | | | |
| Security Name | | Interest Rate | | | Maturity Date | | | Principal | | | Value | |
| | | | | | | | | | | | | | | | |
| | | | |
Information Technology: 2.08% | | | | | | | | | | | | | | | | |
| | | | |
| Semiconductors & Semiconductor Equipment: 2.08% | | | | | | | | | | | | | | | | |
MEMC Electronic Materials Incorporated | | | 7.75 | % | | | 04/01/2019 | | | $ | 9,500,000 | | | $ | 7,552,500 | |
| | | | | | | | | | | | | | | | |
| | | | |
Materials: 13.59% | | | | | | | | | | | | | | | | |
| | | | |
| Chemicals: 7.54% | | | | | | | | | | | | | | | | |
Celanese US Holdings LLC | | | 5.88 | | | | 06/15/2021 | | | | 1,000,000 | | | | 1,055,000 | |
Huntsman International LLC « | | | 8.63 | | | | 03/15/2020 | | | | 4,600,000 | | | | 5,140,500 | |
Koppers Holdings Incorporated | | | 7.88 | | | | 12/01/2019 | | | | 9,250,000 | | | | 9,874,375 | |
Kraton Polymers LLC | | | 6.75 | | | | 03/01/2019 | | | | 11,000,000 | | | | 11,357,500 | |
| | | | |
| | | | | | | | | | | | | | | 27,427,375 | |
| | | | | | | | | | | | | | | | |
| | | | |
| Containers & Packaging: 2.97% | | | | | | | | | | | | | | | | |
Ball Corporation | | | 5.00 | | | | 03/15/2022 | | | | 1,000,000 | | | | 1,002,500 | |
Greif Incorporated | | | 7.75 | | | | 08/01/2019 | | | | 6,676,000 | | | | 7,543,880 | |
Sealed Air Corporation 144A | | | 8.38 | | | | 09/15/2021 | | | | 2,000,000 | | | | 2,247,500 | |
| | | | |
| | | | | | | | | | | | | | | 10,793,880 | |
| | | | | | | | | | | | | | | | |
| | | | |
| Metals & Mining: 3.08% | | | | | | | | | | | | | | | | |
United States Steel Corporation « | | | 7.38 | | | | 04/01/2020 | | | | 11,000,000 | | | | 11,220,000 | |
| | | | | | | | | | | | | | | | |
| | | | |
Telecommunication Services: 5.25% | | | | | | | | | | | | | | | | |
| | | | |
| Diversified Telecommunication Services: 0.86% | | | | | | | | | | | | | | | | |
SBA Telecommunications Incorporated | | | 8.25 | | | | 08/15/2019 | | | | 2,825,000 | | | | 3,114,563 | |
| | | | | | | | | | | | | | | | |
| | | | |
| Wireless Telecommunication Services: 4.39% | | | | | | | | | | | | | | | | |
Cricket Communications Incorporated | | | 7.75 | | | | 10/15/2020 | | | | 7,000,000 | | | | 6,877,500 | |
NII Capital Corporation | | | 7.63 | | | | 04/01/2021 | | | | 9,300,000 | | | | 9,090,750 | |
| | | | |
| | | | | | | | | | | | | | | 15,968,250 | |
| | | | | | | | | | | | | | | | |
| | | | |
Utilities: 9.10% | | | | | | | | | | | | | | | | |
| | | | |
| Gas Utilities: 1.99% | | | | | | | | | | | | | | | | |
National Fuel Gas Company | | | 4.90 | | | | 12/01/2021 | | | | 7,000,000 | | | | 7,227,401 | |
| | | | | | | | | | | | | | | | |
| | | | |
| Independent Power Producers & Energy Traders: 7.11% | | | | | | | | | | | | | | | | |
AES Corporation | | | 8.00 | | | | 06/01/2020 | | | | 4,550,000 | | | | 5,221,125 | |
NRG Energy Incorporated | | | 7.63 | | | | 05/15/2019 | | | | 4,000,000 | | | | 3,860,000 | |
NRG Energy Incorporated | | | 7.88 | | | | 05/15/2021 | | | | 17,500,000 | | | | 16,800,000 | |
| | | | |
| | | | | | | | | | | | | | | 25,881,125 | |
| | | | | | | | | | | | | | | | |
| | | | |
Total Corporate Bonds and Notes (Cost $241,668,595) | | | | | | | | | | | | | | | 244,324,545 | |
| | | | | | | | | | | | | | | | |
| | | | |
Yankee Corporate Bonds and Notes: 1.96% | | | | | | | | | | | | | | | | |
| | | | |
Energy: 0.86% | | | | | | | | | | | | | | | | |
| | | | |
| Oil, Gas & Consumable Fuels: 0.86% | | | | | | | | | | | | | | | | |
Precision Drilling Corporation | | | 6.63 | | | | 11/15/2020 | | | | 3,000,000 | | | | 3,142,500 | |
| | | | | | | | | | | | | | | | |
The accompanying notes are an integral part of these financial statements.
| | | | |
| 14 | | Wells Fargo Advantage Diversified Income Builder Fund | | Portfolio of Investments—March 31, 2012 (Unaudited) |
| | | | | | | | | | | | | | | | |
| Security Name | | Interest Rate | | | Maturity Date | | | Principal | | | Value | |
| | | | | | | | | | | | | | | | |
| | | | |
Materials: 1.10% | | | | | | | | | | | | | | | | |
| | | | |
| Chemicals: 1.10% | | | | | | | | | | | | | | | | |
LyondellBasell Industries NV 144A | | | 5.75 | % | | | 04/15/2024 | | | $ | 4,000,000 | | | $ | 3,990,000 | |
| | | | | | | | | | | | | | | | |
| | | | |
Total Yankee Corporate Bonds and Notes (Cost $7,000,000) | | | | | | | | | | | | | | | 7,132,500 | |
| | | | | | | | | | | | | | | | |
| | | | |
| | | Yield | | | | | | Shares | | | | |
| Short-Term Investments: 10.69% | | | | | | | | | | | | | | | | |
| | | | |
| Investment Companies: 10.69% | | | | | | | | | | | | | | | | |
Wells Fargo Advantage Cash Investment Money Market Fund, Select Class (l)(u) | | | 0.10 | | | | | | | | 5,180,767 | | | | 5,180,767 | |
Wells Fargo Securities Lending Cash Investments, LLC (l)(u)(r)(v) | | | 0.18 | | | | | | | | 33,718,940 | | | | 33,718,940 | |
| | | | |
Total Short-Term Investments (Cost $38,899,707) | | | | | | | | | | | | | | | 38,899,707 | |
| | | | | | | | | | | | | | | | |
| | | | | | | | |
| Total Investments in Securities | | | | | | | | |
| (Cost $384,584,480) * | | | 108.47 | % | | | 394,626,246 | |
Other Assets and Liabilities, Net | | | (8.47 | ) | | | (30,815,008 | ) |
| | | | | | | | |
| Total Net Assets | | | 100.00 | % | | $ | 363,811,238 | |
| | | | | | | | |
| « | All or a portion of this security is on loan. |
| † | Non-income earning security |
| 144A | Security that may be resold to “qualified institutional buyers” under Rule 144A or security offered pursuant to Section 4(2) of the Securities Act of 1933, as amended. |
| (l) | Investment in an affiliate |
| (u) | Rate shown is the 7-day annualized yield at period end. |
| (r) | The investment company is exempt from registration under Section 3(c)(7) of the 1940 Act. |
| (v) | Security represents investment of cash collateral received from securities on loan. |
| * | Cost for federal income tax purposes is $384,831,673 and net unrealized appreciation (depreciation) consists of: |
| | | | |
Gross unrealized appreciation | | $ | 17,823,138 | |
Gross unrealized depreciation | | | (8,028,565 | ) |
| | | | |
Net unrealized appreciation | | $ | 9,794,573 | |
The accompanying notes are an integral part of these financial statements.
| | | | | | |
| Statement of Assets and Liabilities—March 31, 2012 (Unaudited) | | Wells Fargo Advantage Diversified Income Builder Fund | | | 15 | |
| | | | |
| | | | |
| |
Assets | | | | |
Investments | | | | |
In unaffiliated securities (including securities on loan), at value (see cost below) | | $ | 355,726,539 | |
In affiliated securities, at value (see cost below) | | | 38,899,707 | |
| | | | |
Total investments, at value (see cost below) | | | 394,626,246 | |
Receivable for investments sold | | | 2,025,852 | |
Receivable for Fund shares sold | | | 973,103 | |
Receivable for dividends and interest | | | 5,600,509 | |
Receivable for securities lending income | | | 122,584 | |
Prepaid expenses and other assets | | | 57,643 | |
| | | | |
Total assets | | | 403,405,937 | |
| | | | |
| |
Liabilities | | | | |
Dividends payable | | | 284,558 | |
Payable for investments purchased | | | 4,000,000 | |
Payable for Fund shares redeemed | | | 1,135,934 | |
Payable upon receipt of securities loaned | | | 33,718,940 | |
Advisory fee payable | | | 167,880 | |
Distribution fees payable | | | 83,883 | |
Due to other related parties | | | 86,460 | |
Accrued expenses and other liabilities | | | 117,044 | |
| | | | |
Total liabilities | | | 39,594,699 | |
| | | | |
Total net assets | | $ | 363,811,238 | |
| | | | |
| |
NET ASSETS CONSIST OF | | | | |
Paid-in capital | | $ | 363,218,035 | |
Overdistributed net investment income | | | (727,362 | ) |
Accumulated net realized losses on investments | | | (8,721,201 | ) |
Net unrealized gains on investments | | | 10,041,766 | |
| | | | |
Total net assets | | $ | 363,811,238 | |
| | | | |
| |
COMPUTATION OF NET ASSET VALUE AND OFFERING PRICE PER SHARE1 | | | | |
Net assets – Class A | | $ | 142,995,741 | |
Shares outstanding – Class A | | | 24,584,708 | |
Net asset value per share – Class A | | | $5.82 | |
Maximum offering price per share – Class A2 | | | $6.18 | |
Net assets – Class B | | $ | 7,262,476 | |
Shares outstanding – Class B | | | 1,243,951 | |
Net asset value per share – Class B | | | $5.84 | |
Net assets – Class C | | $ | 113,740,742 | |
Shares outstanding – Class C | | | 19,518,215 | |
Net asset value per share – Class C | | | $5.83 | |
Net assets – Administrator Class | | $ | 39,277,342 | |
Shares outstanding – Administrator Class | | | 6,879,024 | |
Net asset value per share – Administrator Class | | | $5.71 | |
Net assets – Institutional Class | | $ | 60,534,937 | |
Shares outstanding – Institutional Class | | | 10,610,941 | |
Net asset value per share – Institutional Class | | | $5.70 | |
| |
Investments in unaffiliated securities, at cost | | $ | 345,684,773 | |
| | | | |
Investments in affiliated securities, at cost | | $ | 38,899,707 | |
| | | | |
Total investments, at cost | | $ | 384,584,480 | |
| | | | |
Securities on loan, at value | | $ | 32,939,701 | |
| | | | |
| 1. | The Fund has an unlimited number of authorized shares. |
| 2. | Maximum offering price is computed as 100/94.25 of net asset value. On investments of $50,000 or more, the offering price is reduced. |
The accompanying notes are an integral part of these financial statements.
| | | | |
| 16 | | Wells Fargo Advantage Diversified Income Builder Fund | | Statement of Operations—Six Months Ended March 31, 2012 (Unaudited) |
| | | | |
| | | | |
| |
Investment income | | | | |
Interest | | $ | 9,734,767 | |
Dividends | | | 955,896 | |
Securities lending income, net | | | 326,557 | |
Income from affiliated securities | | | 1,272 | |
| | | | |
Total investment income | | | 11,018,492 | |
| | | | |
| |
Expenses | | | | |
Advisory fee | | | 893,807 | |
Administration fees | | | | |
Fund level | | | 89,381 | |
Class A | | | 183,318 | |
Class B | | | 10,049 | |
Class C | | | 141,324 | |
Administrator Class | | | 19,036 | |
Institutional Class | | | 24,799 | |
Shareholder servicing fees | | | | |
Class A | | | 176,267 | |
Class B | | | 9,662 | |
Class C | | | 135,888 | |
Administrator Class | | | 45,825 | |
Distribution fees | | | | |
Class B | | | 28,987 | |
Class C | | | 407,664 | |
Custody and accounting fees | | | 22,576 | |
Professional fees | | | 22,641 | |
Registration fees | | | 30,953 | |
Shareholder report expenses | | | 29,891 | |
Trustees’ fees and expenses | | | 14,151 | |
Other fees and expenses | | | 7,742 | |
| | | | |
Total expenses | | | 2,293,961 | |
Less: Fee waivers and/or expense reimbursements | | | (77,462 | ) |
| | | | |
Net expenses | | | 2,216,499 | |
| | | | |
Net investment income | | | 8,801,993 | |
| | | | |
| |
REALIZED AND UNREALIZED GAINS (LOSSES) ON INVESTMENTS | | | | |
Net realized gains on investments | | | 4,104,629 | |
Net change in unrealized gains (losses) on investments | | | 31,827,827 | |
| | | | |
Net realized and unrealized gains (losses) on investments | | | 35,932,456 | |
| | | | |
Net increase in net assets resulting from operations | | $ | 44,734,449 | |
| | | | |
The accompanying notes are an integral part of these financial statements.
| | | | | | |
| Statements of Changes in Net Assets | | Wells Fargo Advantage Diversified Income Builder Fund | | | 17 | |
| | | | | | | | | | | | | | | | |
| | | Six Months Ended
March 31, 2012
(Unaudited) | | | Year Ended
September 30, 2011 | |
| | | | |
Operations | | | | | | | | | | | | | | | | |
Net investment income | | | | | | $ | 8,801,993 | | | | | | | $ | 18,373,869 | |
Net realized gains on investments | | | | | | | 4,104,629 | | | | | | | | 20,334,066 | |
Net change in unrealized gains (losses) on investments | | | | | | | 31,827,827 | | | | | | | | (39,459,722 | ) |
| | | | | | | | | | | | | | | | |
Net increase (decrease) in net assets resulting from operations | | | | | | | 44,734,449 | | | | | | | | (751,787 | ) |
| | | | | | | | | | | | | | | | |
| | | | |
Distributions to shareholders from | | | | | | | | | | | | | | | | |
Net investment income | | | | | | | | | | | | | | | | |
Class A | | | | | | | (3,666,452 | ) | | | | | | | (7,847,668 | ) |
Class B | | | | | | | (172,538 | ) | | | | | | | (598,522 | ) |
Class C | | | | | | | (2,413,887 | ) | | | | | | | (5,083,460 | ) |
Administrator Class | | | | | | | (1,020,786 | ) | | | | | | | (2,657,680 | ) |
Institutional Class | | | | | | | (1,730,619 | ) | | | | | | | (4,469,481 | ) |
| | | | | | | | | | | | | | | | |
Total distributions to shareholders | | | | | | | (9,004,282 | ) | | | | | | | (20,656,811 | ) |
| | | | | | | | | | | | | | | | |
| | | | |
Capital share transactions | | | Shares | | | | | | | | Shares | | | | | |
Proceeds from shares sold | | | | | | | | | | | | | | | | |
Class A | | | 2,366,249 | | | | 13,364,387 | | | | 11,193,628 | | | | 65,587,626 | |
Class B | | | 141,847 | | | | 814,734 | | | | 301,732 | | | | 1,771,365 | |
Class C | | | 2,132,326 | | | | 12,141,716 | | | | 7,577,040 | | | | 44,516,848 | |
Administrator Class | | | 2,222,358 | | | | 12,424,017 | | | | 15,759,397 | | | | 89,913,934 | |
Institutional Class | | | 507,837 | | | | 2,835,719 | | | | 3,537,749 | | | | 20,342,611 | |
| | | | | | | | | | | | | | | | |
| | | | | | | 41,580,573 | | | | | | | | 222,132,384 | |
| | | | | | | | | | | | | | | | |
Reinvestment of distributions | | | | | | | | | | | | | | | | |
Class A | | | 510,345 | | | | 2,909,635 | | | | 986,861 | | | | 5,731,658 | |
Class B | | | 21,236 | | | | 121,440 | | | | 68,196 | | | | 398,837 | |
Class C | | | 278,714 | | | | 1,592,764 | | | | 545,705 | | | | 3,177,112 | |
Administrator Class | | | 42,086 | | | | 236,428 | | | | 40,289 | | | | 228,970 | |
Institutional Class | | | 305,039 | | | | 1,704,989 | | | | 774,860 | | | | 4,424,947 | |
| | | | | | | | | | | | | | | | |
| | | | | | | 6,565,256 | | | | | | | | 13,961,524 | |
| | | | | | | | | | | | | | | | |
Payment for shares redeemed | | | | | | | | | | | | | | | | |
Class A | | | (3,841,932 | ) | | | (21,689,168 | ) | | | (14,271,585 | ) | | | (82,739,796 | ) |
Class B | | | (429,498 | ) | | | (2,439,506 | ) | | | (1,737,086 | ) | | | (10,206,498 | ) |
Class C | | | (2,092,522 | ) | | | (11,857,955 | ) | | | (5,611,113 | ) | | | (32,693,389 | ) |
Administrator Class | | | (2,195,882 | ) | | | (12,393,453 | ) | | | (8,991,118 | ) | | | (52,207,757 | ) |
Institutional Class | | | (2,036,012 | ) | | | (11,320,801 | ) | | | (7,994,873 | ) | | | (45,245,183 | ) |
| | | | | | | | | | | | | | | | |
| | | | | | | (59,700,883 | ) | | | | | | | (223,092,623 | ) |
| | | | | | | | | | | | | | | | |
Net increase (decrease) in net assets resulting from capital share transactions | | | | | | | (11,555,054 | ) | | | | | | | 13,001,285 | |
| | | | | | | | | | | | | | | | |
Total increase (decrease) in net assets | | | | | | | 24,175,113 | | | | | | | | (8,407,313 | ) |
| | | | | | | | | | | | | | | | |
| | | | |
Net assets | | | | | | | | | | | | | | | | |
Beginning of period | | | | | | | 339,636,125 | | | | | | | | 348,043,438 | |
| | | | | | | | | | | | | | | | |
End of period | | | | | | $ | 363,811,238 | | | | | | | $ | 339,636,125 | |
| | | | | | | | | | | | | | | | |
Overdistributed net investment income | | | | | | $ | (727,362 | ) | | | | | | $ | (525,073 | ) |
| | | | | | | | | | | | | | | | |
The accompanying notes are an integral part of these financial statements.
| | | | |
| 18 | | Wells Fargo Advantage Diversified Income Builder Fund | | Financial Highlights |
(For a share outstanding throughout each period)
| | | | | | | | | | | | | | | | | | | | | | | | | | | | |
| | | Six Months Ended
March 31, 2012 (Unaudited) | | | Year Ended September 30, | | | Year Ended April 30, | |
| Class A | | | 2011 | | | 20101,2 | | | 20101 | | | 20091 | | | 20081 | | | 20071 | |
Net asset value, beginning of period | | $ | 5.26 | | | $ | 5.57 | | | $ | 5.46 | | | $ | 4.58 | | | $ | 6.06 | | | $ | 6.40 | | | $ | 6.32 | |
Net investment income | | | 0.14 | | | | 0.28 | | | | 0.13 | | | | 0.25 | | | | 0.26 | | | | 0.27 | 3 | | | 0.33 | 3 |
Net realized and unrealized gains (losses) on investments | | | 0.57 | | | | (0.27 | ) | | | 0.11 | | | | 0.87 | | | | (1.45 | ) | | | (0.35 | ) | | | 0.08 | |
| | | | | | | | | | | | | | | | | | | | | | | | | | | | |
Total from investment operations | | | 0.71 | | | | 0.01 | | | | 0.24 | | | | 1.12 | | | | (1.19 | ) | | | (0.08 | ) | | | 0.41 | |
Distributions to shareholders from | | | | | | | | | | | | | | | | | | | | | | | | | | | | |
Net investment income | | | (0.15 | ) | | | (0.32 | ) | | | (0.13 | ) | | | (0.24 | ) | | | (0.26 | ) | | | (0.26 | ) | | | (0.31 | ) |
Net realized gains | | | 0.00 | | | | 0.00 | | | | 0.00 | | | | 0.00 | | | | (0.03 | ) | | | 0.00 | | | | 0.00 | |
Tax basis return of capital | | | 0.00 | | | | 0.00 | | | | 0.00 | | | | 0.00 | | | | 0.00 | | | | 0.00 | | | | (0.02 | ) |
| | | | | | | | | | | | | | | | | | | | | | | | | | | | |
Total distributions to shareholders | | | (0.15 | ) | | | (0.32 | ) | | | (0.13 | ) | | | (0.24 | ) | | | (0.29 | ) | | | (0.26 | ) | | | (0.33 | ) |
Net asset value, end of period | | $ | 5.82 | | | $ | 5.26 | | | $ | 5.57 | | | $ | 5.46 | | | $ | 4.58 | | | $ | 6.06 | | | $ | 6.40 | |
Total return4 | | | 13.53 | % | | | (0.28 | )% | | | 4.42 | % | | | 24.93 | % | | | (19.64 | )% | | | (1.26 | )% | | | 6.71 | % |
Ratios to average net assets (annualized) | | | | | | | | | | | | | | | | | | | | | | | | | | | | |
Gross expenses | | | 1.13 | % | | | 1.13 | % | | | 1.10 | % | | | 1.07 | % | | | 1.07 | % | | | 1.16 | % | | | 1.20 | % |
Net expenses | | | 1.08 | % | | | 1.08 | % | | | 1.05 | % | | | 1.07 | % | | | 1.07 | % | | | 1.11 | % | | | 1.16 | % |
Net investment income | | | 5.09 | % | | | 4.86 | % | | | 5.74 | % | | | 4.96 | % | | | 5.15 | % | | | 4.41 | % | | | 5.17 | % |
Supplemental data | | | | | | | | | | | | | | | | | | | | | | | | | | | | |
Portfolio turnover rate | | | 35 | % | | | 65 | % | | | 21 | % | | | 55 | % | | | 57 | % | | | 125 | % | | | 128 | % |
Net assets, end of period (000’s omitted) | | | $142,996 | | | | $134,340 | | | | $154,005 | | | | $146,340 | | | | $108,773 | | | | $145,924 | | | | $170,804 | |
| 1. | After the close of business on July 9, 2010, the Fund acquired the net assets of Evergreen Diversified Income Builder Fund which became the accounting and performance survivor in the transaction. The information for the periods prior to July 12, 2010 is that of Class A of Evergreen Diversified Income Builder Fund. |
| 2. | For the five months ended September 30, 2010. The Fund changed its fiscal year end from April 30 to September 30, effective September 30, 2010. |
| 3. | Calculated based upon average shares outstanding |
| 4. | Total return calculations do not include any sales charges. Returns for periods of less than one year are not annualized. |
The accompanying notes are an integral part of these financial statements.
| | | | | | |
| Financial Highlights | | Wells Fargo Advantage Diversified Income Builder Fund | | | 19 | |
(For a share outstanding throughout each period)
| | | | | | | | | | | | | | | | | | | | | | | | | | | | |
| | | Six Months Ended
March 31, 2012 (Unaudited) | | | Year Ended September 30, | | | Year Ended April 30, | |
| Class B | | | 2011 | | | 20101,2 | | | 20101 | | | 20091 | | | 20081 | | | 20071 | |
Net asset value, beginning of period | | $ | 5.28 | | | $ | 5.59 | | | $ | 5.48 | | | $ | 4.60 | | | $ | 6.08 | | | $ | 6.42 | | | $ | 6.34 | |
Net investment income | | | 0.12 | 3 | | | 0.24 | 3 | | | 0.11 | 3 | | | 0.21 | 3 | | | 0.22 | 3 | | | 0.23 | 3 | | | 0.28 | 3 |
Net realized and unrealized gains (losses) on investments | | | 0.57 | | | | (0.27 | ) | | | 0.11 | | | | 0.87 | | | | (1.45 | ) | | | (0.36 | ) | | | 0.09 | |
| | | | | | | | | | | | | | | | | | | | | | | | | | | | |
Total from investment operations | | | 0.69 | | | | (0.03 | ) | | | 0.22 | | | | 1.08 | | | | (1.23 | ) | | | (0.13 | ) | | | 0.37 | |
Distributions to shareholders from | | | | | | | | | | | | | | | | | | | | | | | | | | | | |
Net investment income | | | (0.13 | ) | | | (0.28 | ) | | | (0.11 | ) | | | (0.20 | ) | | | (0.22 | ) | | | (0.21 | ) | | | (0.27 | ) |
Net realized gains | | | 0.00 | | | | 0.00 | | | | 0.00 | | | | 0.00 | | | | (0.03 | ) | | | 0.00 | | | | 0.00 | |
Tax basis return of capital | | | 0.00 | | | | 0.00 | | | | 0.00 | | | | 0.00 | | | | 0.00 | | | | 0.00 | | | | (0.02 | ) |
| | | | | | | | | | | | | | | | | | | | | | | | | | | | |
Total distributions to shareholders | | | (0.13 | ) | | | (0.28 | ) | | | (0.11 | ) | | | (0.20 | ) | | | (0.25 | ) | | | (0.21 | ) | | | (0.29 | ) |
Net asset value, end of period | | $ | 5.84 | | | $ | 5.28 | | | $ | 5.59 | | | $ | 5.48 | | | $ | 4.60 | | | $ | 6.08 | | | $ | 6.42 | |
Total return4 | | | 13.07 | % | | | (1.01 | )% | | | 4.09 | % | | | 23.65 | % | | | (19.99 | )% | | | (1.97 | )% | | | 5.94 | % |
Ratios to average net assets (annualized) | | | | | | | | | | | | | | | | | | | | | | | | | | | | |
Gross expenses | | | 1.88 | % | | | 1.88 | % | | | 1.85 | % | | | 1.82 | % | | | 1.81 | % | | | 1.86 | % | | | 1.90 | % |
Net expenses | | | 1.83 | % | | | 1.83 | % | | | 1.80 | % | | | 1.82 | % | | | 1.81 | % | | | 1.86 | % | | | 1.90 | % |
Net investment income | | | 4.34 | % | | | 4.11 | % | | | 5.01 | % | | | 4.18 | % | | | 4.33 | % | | | 3.68 | % | | | 4.43 | % |
Supplemental data | | | | | | | | | | | | | | | | | | | | | | | | | | | | |
Portfolio turnover rate | | | 35 | % | | | 65 | % | | | 21 | % | | | 55 | % | | | 57 | % | | | 125 | % | | | 128 | % |
Net assets, end of period (000’s omitted) | | | $7,262 | | | | $7,971 | | | | $16,089 | | | | $17,379 | | | | $19,309 | | | | $37,459 | | | | $54,955 | |
| 1. | After the close of business on July 9, 2010, the Fund acquired the net assets of Evergreen Diversified Income Builder Fund which became the accounting and performance survivor in the transaction. The information for the periods prior to July 12, 2010 is that of Class B of Evergreen Diversified Income Builder Fund. |
| 2. | For the five months ended September 30, 2010. The Fund changed its fiscal year end from April 30 to September 30, effective September 30, 2010. |
| 3. | Calculated based upon average shares outstanding |
| 4. | Total return calculations do not include any sales charges. Returns for periods of less than one year are not annualized. |
The accompanying notes are an integral part of these financial statements.
| | | | |
| 20 | | Wells Fargo Advantage Diversified Income Builder Fund | | Financial Highlights |
(For a share outstanding throughout each period)
| | | | | | | | | | | | | | | | | | | | | | | | | | | | |
| | | Six Months Ended
March 31, 2012 (Unaudited) | | | Year Ended September 30, | | | Year Ended April 30, | |
| Class C | | | 2011 | | | 20101,2 | | | 20101 | | | 20091 | | | 20081 | | | 20071 | |
Net asset value, beginning of period | | $ | 5.27 | | | $ | 5.58 | | | $ | 5.47 | | | $ | 4.60 | | | $ | 6.07 | | | $ | 6.41 | | | $ | 6.33 | |
Net investment income | | | 0.12 | | | | 0.24 | | | | 0.11 | | | | 0.22 | | | | 0.22 | 3 | | | 0.22 | 3 | | | 0.28 | 3 |
Net realized and unrealized gains (losses) on investments | | | 0.57 | | | | (0.27 | ) | | | 0.11 | | | | 0.85 | | | | (1.44 | ) | | | (0.35 | ) | | | 0.09 | |
| | | | | | | | | | | | | | | | | | | | | | | | | | | | |
Total from investment operations | | | 0.69 | | | | (0.03 | ) | | | 0.22 | | | | 1.07 | | | | (1.22 | ) | | | (0.13 | ) | | | 0.37 | |
Distributions to shareholders from | | | | | | | | | | | | | | | | | | | | | | | | | | | | |
Net investment income | | | (0.13 | ) | | | (0.28 | ) | | | (0.11 | ) | | | (0.20 | ) | | | (0.22 | ) | | | (0.21 | ) | | | (0.27 | ) |
Net realized gains | | | 0.00 | | | | 0.00 | | | | 0.00 | | | | 0.00 | | | | (0.03 | ) | | | 0.00 | | | | 0.00 | |
Tax basis return of capital | | | 0.00 | | | | 0.00 | | | | 0.00 | | | | 0.00 | | | | 0.00 | | | | 0.00 | | | | (0.02 | ) |
| | | | | | | | | | | | | | | | | | | | | | | | | | | | |
Total distributions to shareholders | | | (0.13 | ) | | | (0.28 | ) | | | (0.11 | ) | | | (0.20 | ) | | | (0.25 | ) | | | (0.21 | ) | | | (0.29 | ) |
Net asset value, end of period | | $ | 5.83 | | | $ | 5.27 | | | $ | 5.58 | | | $ | 5.47 | | | $ | 4.60 | | | $ | 6.07 | | | $ | 6.41 | |
Total return4 | | | 13.09 | % | | | (1.02 | )% | | | 4.09 | % | | | 23.69 | % | | | (20.03 | )% | | | (1.98 | )% | | | 5.94 | % |
Ratios to average net assets (annualized) | | | | | | | | | | | | | | | | | | | | | | | | | | | | |
Gross expenses | | | 1.88 | % | | | 1.88 | % | | | 1.85 | % | | | 1.82 | % | | | 1.82 | % | | | 1.85 | % | | | 1.90 | % |
Net expenses | | | 1.83 | % | | | 1.83 | % | | | 1.80 | % | | | 1.82 | % | | | 1.82 | % | | | 1.85 | % | | | 1.90 | % |
Net investment income | | | 4.33 | % | | | 4.12 | % | | | 5.01 | % | | | 4.22 | % | | | 4.41 | % | | | 3.63 | % | | | 4.43 | % |
Supplemental data | | | | | | | | | | | | | | | | | | | | | | | | | | | | |
Portfolio turnover rate | | | 35 | % | | | 65 | % | | | 21 | % | | | 55 | % | | | 57 | % | | | 125 | % | | | 128 | % |
Net assets, end of period (000’s omitted) | | | $113,741 | | | | $101,140 | | | | $93,159 | | | | $93,423 | | | | $57,096 | | | | $61,229 | | | | $55,110 | |
| 1. | After the close of business on July 9, 2010, the Fund acquired the net assets of Evergreen Diversified Income Builder Fund which became the accounting and performance survivor in the transaction. The information for the periods prior to July 12, 2010 is that of Class C of Evergreen Diversified Income Builder Fund. |
| 2. | For the five months ended September 30, 2010. The Fund changed its fiscal year end from April 30 to September 30, effective September 30, 2010. |
| 3. | Calculated based upon average shares outstanding |
| 4. | Total return calculations do not include any sales charges. Returns for periods of less than one year are not annualized. |
The accompanying notes are an integral part of these financial statements.
| | | | | | |
| Financial Highlights | | Wells Fargo Advantage Diversified Income Builder Fund | | | 21 | |
(For a share outstanding throughout each period)
| | | | | | | | | | | | |
| | | Six Months Ended
March 31, 2012 (Unaudited) | | | Year Ended September 30, | |
| Administrator Class | | | 2011 | | | 20101 | |
Net asset value, beginning of period | | $ | 5.16 | | | $ | 5.46 | | | $ | 5.33 | |
Net investment income | | | 0.15 | | | | 0.29 | 2 | | | 0.06 | 2 |
Net realized and unrealized gains (losses) on investments | | | 0.55 | | | | (0.26 | ) | | | 0.12 | |
| | | | | | | | | | | | |
Total from investment operations | | | 0.70 | | | | 0.03 | | | | 0.18 | |
Distributions to shareholders from | | | | | | | | | | | | |
Net investment income | | | (0.15 | ) | | | (0.33 | ) | | | (0.05 | ) |
Net asset value, end of period | | $ | 5.71 | | | $ | 5.16 | | | $ | 5.46 | |
Total return3 | | | 13.64 | % | | | 0.00 | % | | | 3.42 | % |
Ratios to average net assets (annualized) | | | | | | | | | | | | |
Gross expenses | | | 0.96 | % | | | 0.89 | % | | | 1.02 | % |
Net expenses | | | 0.90 | % | | | 0.87 | % | | | 0.90 | % |
Net investment income | | | 5.25 | % | | | 5.09 | % | | | 5.80 | % |
Supplemental data | | | | | | | | | | | | |
Portfolio turnover rate | | | 35 | % | | | 65 | % | | | 21 | % |
Net assets, end of period (000’s omitted) | | | $39,277 | | | | $35,157 | | | | $10 | |
| 1. | For the period from July 30, 2010 (commencement of class operations) to September 30, 2010. |
| 2. | Calculated based upon average shares outstanding |
| 3. | Returns for periods of less than one year are not annualized. |
The accompanying notes are an integral part of these financial statements.
| | | | |
| 22 | | Wells Fargo Advantage Diversified Income Builder Fund | | Financial Highlights |
(For a share outstanding throughout each period)
| | | | | | | | | | | | | | | | | | | | | | | | | | | | |
| | | Six Months Ended
March 31, 2012 (Unaudited) | | | Year Ended September 30, | | | Year Ended April 30, | |
| Institutional Class | | | 2011 | | | 20101,2 | | | 20101 | | | 20091 | | | 20081 | | | 20071 | |
Net asset value, beginning of period | | $ | 5.16 | | | $ | 5.46 | | | $ | 5.36 | | | $ | 4.48 | | | $ | 5.96 | | | $ | 6.30 | | | $ | 6.22 | |
Net investment income | | | 0.15 | | | | 0.30 | | | | 0.14 | | | | 0.27 | | | | 0.26 | | | | 0.28 | 3 | | | 0.34 | 3 |
Net realized and unrealized gains (losses) on investments | | | 0.54 | | | | (0.26 | ) | | | 0.09 | | | | 0.86 | | | | (1.45 | ) | | | (0.35 | ) | | | 0.08 | |
| | | | | | | | | | | | | | | | | | | | | | | | | | | | |
Total from investment operations | | | 0.69 | | | | 0.04 | | | | 0.23 | | | | 1.13 | | | | (1.19 | ) | | | (0.07 | ) | | | 0.42 | |
Distributions to shareholders from | | | | | | | | | | | | | | | | | | | | | | | | | | | | |
Net investment income | | | (0.15 | ) | | | (0.34 | ) | | | (0.13 | ) | | | (0.25 | ) | | | (0.26 | ) | | | (0.27 | ) | | | (0.32 | ) |
Net realized gains | | | 0.00 | | | | 0.00 | | | | 0.00 | | | | 0.00 | | | | (0.03 | ) | | | 0.00 | | | | 0.00 | |
Tax basis return of capital | | | 0.00 | | | | 0.00 | | | | 0.00 | | | | 0.00 | | | | 0.00 | | | | 0.00 | | | | (0.02 | ) |
| | | | | | | | | | | | | | | | | | | | | | | | | | | | |
Total distributions to shareholders | | | (0.15 | ) | | | (0.34 | ) | | | (0.13 | ) | | | (0.25 | ) | | | (0.29 | ) | | | (0.27 | ) | | | (0.34 | ) |
Net asset value, end of period | | $ | 5.70 | | | $ | 5.16 | | | $ | 5.46 | | | $ | 5.36 | | | $ | 4.48 | | | $ | 5.96 | | | $ | 6.30 | |
Total return4 | | | 13.75 | % | | | 0.18 | % | | | 4.41 | % | | | 25.68 | % | | | (19.85 | )% | | | (1.09 | )% | | | 7.02 | % |
Ratios to average net assets (annualized) | | | | | | | | | | | | | | | | | | | | | | | | | | | | |
Gross expenses | | | 0.70 | % | | | 0.70 | % | | | 0.76 | % | | | 0.82 | % | | | 0.84 | % | | | 0.85 | % | | | 0.90 | % |
Net expenses | | | 0.70 | % | | | 0.69 | % | | | 0.74 | % | | | 0.82 | % | | | 0.84 | % | | | 0.85 | % | | | 0.90 | % |
Net investment income | | | 5.47 | % | | | 5.27 | % | | | 6.10 | % | | | 5.31 | % | | | 5.65 | % | | | 4.66 | % | | | 5.43 | % |
Supplemental data | | | | | | | | | | | | | | | | | | | | | | | | | | | | |
Portfolio turnover rate | | | 35 | % | | | 65 | % | | | 21 | % | | | 55 | % | | | 57 | % | | | 125 | % | | | 128 | % |
Net assets, end of period (000’s omitted) | | | $60,535 | | | | $61,029 | | | | $84,780 | | | | $195,418 | | | | $58,710 | | | | $24,944 | | | | $17,861 | |
| 1. | After the close of business on July 9, 2010, the Fund acquired the net assets of Evergreen Diversified Income Builder Fund which became the accounting and performance survivor in the transaction. The information for the periods prior to July 12, 2010 is that of Class I of Evergreen Diversified Income Builder Fund. |
| 2. | For the five months ended September 30, 2010. The Fund changed its fiscal year end from April 30 to September 30, effective September 30, 2010. |
| 3. | Calculated based upon average shares outstanding |
| 4. | Returns for periods of less than one year are not annualized. |
The accompanying notes are an integral part of these financial statements.
| | | | | | |
| Notes to Financial Statements (Unaudited) | | Wells Fargo Advantage Diversified Income Builder Fund | | | 23 | |
1. ORGANIZATION
Wells Fargo Funds Trust (the “Trust”), a Delaware statutory trust organized on March 10, 1999, is an open-end management investment company registered under the Investment Company Act of 1940, as amended (the “1940 Act”). These financial statements report on Wells Fargo Advantage Diversified Income Builder Fund (the “Fund”) which is a diversified series of the Trust.
2. SIGNIFICANT ACCOUNTING POLICIES
The following significant accounting policies, which are consistently followed in the preparation of the financial statements of the Fund, are in conformity with U.S. generally accepted accounting principles which require management to make estimates and assumptions that affect the reported amounts of assets and liabilities, disclosure of contingent assets and liabilities at the date of the financial statements, and the reported amounts of revenues and expenses during the reporting period. Actual results could differ from those estimates.
Securities valuation
Fixed income securities with original maturities exceeding 60 days are valued based on evaluated prices received from an independent pricing service approved by the Board of Trustees which may utilize both transaction data and market information such as yield, prices of securities of comparable quality, coupon rate, maturity, type of issue, trading characteristics and other market data. If valuations are not available from the pricing service or values received are deemed not representative of market value, values will be obtained from a third party broker-dealer or determined based on the Fund’s Fair Value Procedures.
Investments in equity securities are valued each business day as of the close of regular trading on the New York Stock Exchange, which is usually 4:00 p.m. (Eastern Time). Securities which are traded on a national or foreign securities exchange are valued at the last reported sales price, except that securities listed on The Nasdaq Stock Market, Inc. (“Nasdaq”) are valued at the Nasdaq Official Closing Price (“NOCP”), and if no NOCP is available, then at the last reported sales price. If no sales price is shown on the Nasdaq, the bid price will be used. In the absence of any sale of securities listed on the Nasdaq, and in the case of other securities (including U.S. Government obligations, but excluding debt securities maturing in 60 days or less), the price will be deemed “stale” and the valuations will be determined in accordance with the Fund’s Fair Value Procedures.
Investments in open-end mutual funds and non-registered investment companies are generally valued at net asset value.
Investments which are not valued using any of the methods discussed above, are valued at their fair value, as determined by procedures established in good faith and approved by the Board of Trustees. The Board of Trustees has established a Valuation Committee comprised of the Trustees and has delegated to it the authority to take any actions regarding the valuation of portfolio securities that the Valuation Committee deems necessary in determining the fair value of portfolio securities, unless the responsibility has been delegated to the Management Valuation Team of Wells Fargo Funds Management, LLC (“Funds Management”). The Board of Trustees retains the authority to make or ratify any valuation decisions or approve any changes to the Fair Value Procedures as it deems appropriate. On a quarterly basis, the Board of Trustees considers for ratification any valuation actions taken by the Valuation Committee or the Management Valuation Team.
Valuations of fair valued prices are compared to the next actual sales price when available, or other appropriate market information to assess the continued appropriateness of the fair valuation methodology used. The securities are fair valued on a day-to-day basis, taking into consideration changes to appropriate market information and any significant changes to the input factors considered in the valuation process until there is a readily available price provided on the exchange or by an independent pricing service. Valuations received from an independent pricing service or broker quotes are periodically validated by comparisons to most recent trades and valuations provided by other independent pricing services in addition to the review of prices by the adviser and/or sub-adviser. Unobservable inputs used in determining fair valuations are identified based on the type of security, taking into consideration factors utilized by market participants in valuing the investment, knowledge about the issuer and the current market environment.
Security loans
The Fund may lend its securities from time to time in order to earn additional income in the form of fees or interest on securities received as collateral or the investment of any cash received as collateral. The Fund continues to receive interest or dividends on the securities loaned. The Fund receives collateral in the form of cash or securities with a value at
| | | | |
| 24 | | Wells Fargo Advantage Diversified Income Builder Fund | | Notes to Financial Statements (Unaudited) |
least equal to the value of the securities on loan. The value of the loaned securities is determined at the close of each business day and any additional required collateral is delivered to the Fund on the next business day. In a securities lending transaction, the net asset value of the Fund will be affected by an increase or decrease in the value of the securities loaned and by an increase or decrease in the value of the instrument in which collateral is invested. The amount of securities lending activity undertaken by the Fund fluctuates from time to time. In the event of default or bankruptcy by the borrower, the Fund may be prevented from recovering the loaned securities or gaining access to the collateral or may experience delays or costs in doing so. In addition, the investment of any cash collateral received may lose all or part of its value. The Fund has the right under the lending agreement to recover the securities from the borrower on demand.
The Fund lends its securities through an unaffiliated securities lending agent. Cash collateral received in connection with its securities lending transactions is invested in Wells Fargo Securities Lending Cash Investments, LLC (the “Cash Collateral Fund”). The Cash Collateral Fund is exempt from registration under Section 3(c)(7) of the 1940 Act and is managed by Funds Management and is sub-advised by Wells Capital Management Incorporated (“Wells Capital Management”). Funds Management receives an advisory fee starting at 0.05% and declining to 0.01% as the average daily net assets of the Cash Collateral Fund increase. All of the fees received by Funds Management are paid to Wells Capital Management for its services as sub-adviser. The Cash Collateral Fund seeks to provide a positive return compared to the daily Fed Funds Open rate by investing in high-quality, U.S. dollar-denominated short-term money market instruments. Cash Collateral Fund investments are fair valued based upon the amortized cost valuation technique. Income earned from investment in the Cash Collateral Fund is included in securities lending income on the Statement of Operations.
Security transactions and income recognition
Securities transactions are recorded on a trade date basis. Realized gains or losses are reported on the basis of identified cost of securities delivered.
Interest income is accrued daily and bond discounts are accreted and premiums are amortized daily based on the effective interest method. To the extent debt obligations are placed on non-accrual status, any related interest income may be reduced by writing off interest receivables when the collection of all or a portion of interest has become doubtful based on consistently applied procedures. If the issuer subsequently resumes interest payments or when the collectability of interest is reasonably assured, the debt obligation is removed from non-accrual status.
Dividend income is recognized on the ex-dividend date.
Distributions to shareholders
Distributions to shareholders from net investment income are accrued daily and paid monthly. Distributions from net realized gains, if any, are recorded on the ex-dividend date. Such distributions are determined in conformity with income tax regulations, which may differ from generally accepted accounting principles.
Federal and other taxes
The Fund intends to continue to qualify as a regulated investment company by distributing substantially all of its investment company taxable income and any net realized capital gains (after reduction for capital loss carryforwards) sufficient to relieve it from all, or substantially all, federal income taxes. Accordingly, no provision for federal income taxes was required.
The Fund’s income and federal excise tax returns and all financial records supporting those returns for the prior three fiscal years are subject to examination by the federal and Delaware revenue authorities. Management has analyzed the Fund’s tax positions taken on federal, state, and foreign tax returns for all open tax years and does not believe that there are any uncertain tax positions that require recognition of a tax liability.
Under the recently enacted Regulated Investment Company Modernization Act of 2010, the Fund is permitted to carry forward capital losses incurred in taxable years which began after December 22, 2010 for an unlimited period. However, any losses incurred are required to be utilized prior to the losses incurred in pre-enactment taxable years. As a result of this ordering rule, pre-enactment capital loss carryforwards may be more likely to expire unused. Additionally, post-enactment capital losses that are carried forward will retain their character as either short-term or long-term capital losses rather than being considered all short-term as under previous law.
As of September 30, 2011, the Fund had net capital loss carryforwards, which were available to offset future net realized capital gains, in the amount of $12,561,864 expiring in 2017.
| | | | | | |
| Notes to Financial Statements (Unaudited) | | Wells Fargo Advantage Diversified Income Builder Fund | | | 25 | |
As of September 30, 2011, the Fund had $117 of current year deferred post-October capital losses, which would be treated as realized for tax purposes on the first day of the succeeding year.
Class allocations
The separate classes of shares offered by the Fund differ principally in applicable sales charges, distribution, shareholder servicing and administration fees. Shareholders of each class bear certain expenses that pertain to that particular class. All shareholders bear the common expenses of the Fund, earn income from the portfolio, and are allocated unrealized gains and losses pro rata based on the average daily net assets of each class, without distinction between share classes. Dividends are determined separately for each class based on income and expenses allocable to each class. Realized gains and losses are allocated to each class pro rata based upon the net assets of each class on the date realized. Differences in per share dividend rates generally result from the relative weightings of pro rata income and realized gain allocations and from differences in separate class expenses, including distribution, shareholder servicing and administration fees.
3. FAIR VALUATION MEASUREMENTS
Fair value measurements of investments are determined within a framework that has established a fair value hierarchy based upon the various data inputs utilized in determining the value of the Fund’s investments. The three-level hierarchy gives the highest priority to unadjusted quoted prices in active markets for identical assets or liabilities (Level 1) and the lowest priority to significant unobservable inputs (Level 3). The Fund’s investments are classified within the fair value hierarchy based on the lowest level of input that is significant to the fair value measurement. The inputs are summarized into three broad levels as follows:
| n | | Level 1 – quoted prices in active markets for identical securities |
| n | | Level 2 – other significant observable inputs (including quoted prices for similar securities, interest rates, prepayment speeds, credit risk, etc.) |
| n | | Level 3 – significant unobservable inputs (including the Fund’s own assumptions in determining the fair value of investments) |
The inputs or methodologies used for valuing securities are not necessarily an indication of the risk associated with investing in those securities.
As of March 31, 2012, the inputs used in valuing the Fund’s assets, which are carried at fair value, were as follows:
| | | | | | | | | | | | | | | | |
| Investments in Securities | | Quoted Prices (Level 1) | | | Significant Other
Observable Inputs (Level 2) | | | Significant Unobservable Inputs (Level 3) | | | Total | |
Equity securities | | | | | | | | | | | | | | | | |
Common stocks | | $ | 104,269,494 | | | $ | 0 | | | $ | 0 | | | $ | 104,269,494 | |
Corporate bonds and notes | | | 0 | | | | 244,324,545 | | | | 0 | | | | 244,324,545 | |
Yankee bonds and notes | | | 0 | | | | 7,132,500 | | | | 0 | | | | 7,132,500 | |
Short-term investments | | | | | | | | | | | | | | | | |
Investment companies | | | 5,180,767 | | | | 33,718,940 | | | | 0 | | | | 38,899,707 | |
| | | $ | 109,450,261 | | | $ | 285,175,985 | | | $ | 0 | | | $ | 394,626,246 | |
Further details on the major security types listed above can be found in the Portfolio of Investments.
Transfers in and transfers out are recognized at the end of the reporting period. For the six months ended March 31, 2012, the Fund did not have any significant transfers into/out of Level 1 and Level 2.
4. TRANSACTIONS WITH AFFILIATES AND OTHER EXPENSES
Advisory fee
The Trust has entered into an advisory contract with Funds Management, an indirect wholly owned subsidiary of Wells Fargo & Company (“Wells Fargo”). The adviser is responsible for implementing investment policies and guidelines and for supervising the sub-adviser, who is responsible for day-to-day portfolio management of the Fund.
| | | | |
| 26 | | Wells Fargo Advantage Diversified Income Builder Fund | | Notes to Financial Statements (Unaudited) |
Pursuant to the contract, Funds Management is entitled to receive an annual advisory fee starting at 0.50% and declining to 0.40% as the average daily net assets of the Fund increase. For the six months ended March 31, 2012, the advisory fee was equivalent to an annual rate of 0.50% of the Fund’s average daily net assets.
Funds Management has retained the services of certain sub-advisers to provide daily portfolio management to the Fund. The fees related to sub-advisory services are borne directly by Funds Management and do not increase the overall fees paid by the Fund. Wells Capital Management, an affiliate of Funds Management, is the sub-adviser to the Fund and is entitled to receive a fee from Funds Management at an annual rate starting at 0.35% and declining to 0.20% as the average daily net assets of the Fund increase.
Administration and transfer agent fees
The Trust has entered into an administration agreement with Funds Management. Under this agreement, for providing administrative services, which includes paying fees and expenses for services provided by the transfer agent, sub-transfer agents, omnibus account servicers and record-keepers, Funds Management is entitled to receive from the Fund an annual fund level administration fee starting at 0.05% and declining to 0.03% as the average daily net assets of the Fund increase and a class level administration fee which is calculated based on the average daily net assets of each class as follows:
| | | | |
| | | Class Level Administration Fee | |
Class A, Class B, Class C | | | 0.26 | % |
Administrator Class | | | 0.10 | |
Institutional Class | | | 0.08 | |
Funds Management has contractually waived and/or reimbursed advisory and administration fees to the extent necessary to maintain certain net operating expense ratios for the Fund. Waiver of fees and/or reimbursement of expenses by Funds Management were made first from fund level expenses on a proportionate basis and then from class specific expenses. Funds Management has committed through July 11, 2013 to waive fees and/or reimburse expenses to the extent necessary to cap the Fund’s expenses at 1.08% for Class A, 1.83% for Class B, 1.83% for Class C, 0.90% for Administrator Class and 0.71% for Institutional Class.
Distribution fees
The Trust has adopted a Distribution Plan for Class B and Class C shares of the Fund pursuant to Rule 12b-1 under the 1940 Act. Distribution fees are charged to Class B and Class C shares and paid to Wells Fargo Funds Distributor, LLC, the principal underwriter, at an annual rate of 0.75% of the average daily net assets of Class B and Class C shares.
For the six months ended March 31, 2012, Wells Fargo Funds Distributor, LLC received $31,018 from the sale of Class A shares and $3,476 and $4,453 in contingent deferred sales charges from redemptions of Class B and Class C shares, respectively.
Shareholder servicing fees
The Trust has entered into contracts with one or more shareholder servicing agents, whereby Class A, Class B, Class C and Administrator Class of the Fund is charged a fee at an annual rate of 0.25% of the average daily net assets of each respective class.
A portion of these total shareholder servicing fees were paid to affiliates of Wells Fargo.
5. INVESTMENT PORTFOLIO TRANSACTIONS
Purchases and sales of investments, excluding U.S. Government obligations (if any) and short-term securities, for the six months ended March 31, 2012 were $124,146,312 and $136,086,360, respectively.
6. BANK BORROWINGS
The Trust (excluding the money market funds) and Wells Fargo Variable Trust are parties to a $150,000,000 revolving credit agreement with State Street Bank and Trust Company, whereby the Fund is permitted to use bank borrowings for temporary or emergency purposes, such as to fund shareholder redemption requests. Interest under the credit
| | | | | | |
| Notes to Financial Statements (Unaudited) | | Wells Fargo Advantage Diversified Income Builder Fund | | | 27 | |
agreement is charged to the Fund based on a borrowing rate equal to the higher of the Federal Funds rate in effect on that day plus 1.25% or the overnight LIBOR rate in effect on that day plus 1.25%. In addition, an annual commitment fee equal to 0.10% of the unused balance is allocated to each participating fund. For the six months ended March 31, 2012, the Fund paid $463 in commitment fees.
During the six months ended March 31, 2012, the Fund had average borrowings outstanding of $65,035 on an annualized basis at an average rate of 1.41% and paid interest of $917.
7. INDEMNIFICATION
Under the Trust’s organizational documents, the officers and directors are indemnified against certain liabilities that may arise out of performance of their duties to the Trust. Additionally, in the normal course of business, the Trust may enter into contracts with service providers that contain a variety of indemnification clauses. The Trust’s maximum exposure under these arrangements is dependent on future claims that may be made against the Fund and, therefore, cannot be estimated.
8. NEW ACCOUNTING PRONOUNCEMENTS
In December 2011, the Financial Accounting Standards Board (“FASB”) issued Accounting Standard Update (“ASU”) No. 2011-11, Disclosures about Offsetting Assets and Liabilities. ASU 2011-11, which amends FASB ASC Topic 210 Balance Sheet, creates new disclosure requirements requiring entities to disclose both gross and net information for derivatives and other financial instruments that are either offset in the Statement of Assets and Liabilities or subject to an enforceable master netting arrangement or similar agreement. The disclosure requirements are effective for interim and annual reporting periods beginning on or after January 1, 2013. Management is currently evaluating the impact of the update’s adoption on the Fund’s financial statement disclosures.
In May 2011, FASB issued ASU No. 2011-04 “Amendments to Achieve Common Fair Value Measurement and Disclosure Requirements in U.S. GAAP and IFRSs”. ASU No. 2011-04 amends FASB ASC Topic 820, Fair Value Measurements and Disclosures, to establish common requirements for measuring fair value and for disclosing information about fair value measurements in accordance with GAAP. The ASU is effective prospectively for interim and annual periods beginning after December 15, 2011. Management expects that adoption of the ASU will result in additional disclosures in the financial statements, as applicable.
In April 2011, FASB issued ASU No. 2011-03 “Reconsideration of Effective Control for Repurchase Agreements”. ASU No. 2011-03 amends FASB ASC Topic 860, Transfers and Servicing, specifically the criteria required to determine whether a repurchase agreement (repo) and similar agreements should be accounted for as sales of financial assets or secured borrowings with commitments. ASU No. 2011-03 changes the assessment of effective control by focusing on the transferor’s contractual rights and obligations and removing the criterion to assess its ability to exercise those rights or honor those obligations. This could result in changes to the way entities account for certain transactions including repurchase agreements, mortgage dollar rolls and reverse repurchase agreements. The ASU will become effective on a prospective basis for new transfers and modifications to existing transactions as of the beginning of the first interim or annual period beginning on or after December 15, 2011. Management has evaluated the impact of adopting the ASU and expects no significant changes.
| | | | |
| 28 | | Wells Fargo Advantage Diversified Income Builder Fund | | Other Information (Unaudited) |
PROXY VOTING INFORMATION
A description of the policies and procedures that the Fund uses to determine how to vote proxies relating to portfolio securities is available without charge, upon request, by calling 1-800-222-8222, visiting our Web site at wellsfargoadvantagefunds.com, or visiting the SEC Web site at sec.gov. Information regarding how the Fund voted proxies relating to portfolio securities during the most recent 12-month period ended June 30 is available without charge on the Fund’s Web site at wellsfargoadvantagefunds.com or by visiting the SEC Web site at sec.gov.
PORTFOLIO HOLDINGS INFORMATION
The complete portfolio holdings for the Fund are publicly available on the Fund’s Web site (wellsfargoadvantagefunds.com) on a monthly, 30-day or more delayed basis. In addition, top ten holdings information for the Fund is publicly available on the Fund’s Web site on a monthly, seven-day or more delayed basis. The Fund files its complete schedule of portfolio holdings with the SEC for the first and third quarters of each fiscal year on Form N-Q, which is available without charge by visiting the SEC Web site at sec.gov. In addition, the Fund’s Form N-Q may be reviewed and copied at the SEC’s Public Reference Room in Washington, DC, and at regional offices in New York City, at 233 Broadway, and in Chicago, at 175 West Jackson Boulevard, Suite 900. Information about the Public Reference Room may be obtained by calling 1-800-SEC-0330.
| | | | | | |
| Other Information (Unaudited) | | Wells Fargo Advantage Diversified Income Builder Fund | | | 29 | |
BOARD OF TRUSTEES
The following table provides basic information about the Board of Trustees (the “Trustees”) of the Trust and Officers of the Trust. This table should be read in conjunction with the Prospectus and the Statement of Additional Information1 of the Fund. Each of the Trustees and Officers listed below acts in identical capacities for the Wells Fargo Advantage family of funds, which consists of 137 funds comprising the Wells Fargo Funds Trust, Wells Fargo Variable Trust, Wells Fargo Master Trust and four closed-end funds (collectively the “Fund Complex”). All of the Trustees are also Members of the Audit and Governance Committees of each Trust in the Fund Complex. The mailing address of each Trustee and Officer is 525 Market Street, 12th Floor, San Francisco, CA 94105. Each Trustee and Officer serves an indefinite term, however, each Trustee serves such term until reaching the mandatory retirement age established by the Trustees.
Independent Trustees
| | | | | | |
Name and Year of Birth | | Position Held and Length of Service | | Principal Occupations During Past Five Years | | Other Directorships During
Past Five Years |
Peter G. Gordon
(Born 1942) | | Trustee, since 1998; Chairman, since 2005 (Lead Trustee since 2001) | | Co-Founder, Retired Chairman, President and CEO of Crystal Geyser Water Company. Trustee Emeritus, Colby College | | Asset Allocation Trust |
Isaiah Harris, Jr.
(Born 1952) | | Trustee, since 2009 | | Retired. Prior thereto, President and CEO of BellSouth Advertising and Publishing Corp. from 2005 to 2007, President and CEO of BellSouth Enterprises from 2004 to 2005 and President of BellSouth Consumer Services from 2000 to 2003. Emeritus member of the Iowa State University Foundation Board of Governors. Emeritus Member of the Advisory Board of Iowa State University School of Business. Mr. Harris is a certified public accountant. | | CIGNA Corporation; Deluxe Corporation; Asset Allocation Trust |
Judith M. Johnson
(Born 1949) | | Trustee, since 2008 | | Retired. Prior thereto, Chief Executive Officer and Chief Investment Officer of Minneapolis Employees Retirement Fund from 1996 to 2008. Ms. Johnson is an attorney, certified public accountant and a certified managerial accountant. | | Asset Allocation Trust |
Leroy Keith, Jr.
(Born 1939) | | Trustee, since 2010 | | Chairman, Bloc Global Services (development and construction). Trustee of the Evergreen Funds from 1983 to 2010. Former Managing Director, Almanac Capital Management (commodities firm), former Partner, Stonington Partners, Inc. (private equity fund), former Director, Obagi Medical Products Co. and former Director, Lincoln Educational Services. | | Trustee, Virtus Fund Complex (consisting of 40 portfolios as of 12/31/11); Asset Allocation Trust |
David F. Larcker
(Born 1950) | | Trustee, since 2009 | | James Irvin Miller Professor of Accounting at the Graduate School of Business, Stanford University, Director of Corporate Governance Research Program and Senior Faculty of The Rock Center for Corporate Governance since 2006. From 2005 to 2008, Professor of Accounting at the Graduate School of Business, Stanford University. Prior thereto, Ernst & Young Professor of Accounting at The Wharton School, University of Pennsylvania from 1985 to 2005. | | Asset Allocation Trust |
Olivia S. Mitchell
(Born 1953) | | Trustee, since 2006 | | International Foundation of Employee Benefit Plans Professor, Wharton School of the University of Pennsylvania since 1993. Director of Wharton’s Pension Research Council and Boettner Center on Pensions & Retirement Research, and Research Associate at the National Bureau of Economic Research. Previously, Cornell University Professor from 1978 to 1993. | | Asset Allocation Trust |
| | | | |
| 30 | | Wells Fargo Advantage Diversified Income Builder Fund | | Other Information (Unaudited) |
| | | | | | |
Name and Year of Birth | | Position Held and Length of Service | | Principal Occupations During Past Five Years | | Other Directorships During
Past Five Years |
Timothy J. Penny
(Born 1951) | | Trustee, since 1996 | | President and CEO of Southern Minnesota Initiative Foundation, a non-profit organization, since 2007 and Senior Fellow at the Humphrey Institute Policy Forum at the University of Minnesota since 1995. Member of the Board of Trustees of NorthStar Education Finance, Inc., a non-profit organization, since 2007. | | Asset Allocation Trust |
Michael S. Scofield
(Born 1943) | | Trustee, since 2010 | | Served on the Investment Company Institute’s Board of Governors and Executive Committee from 2008-2011 as well the Governing Council of the Independent Directors Council from 2006-2011 and the Independent Directors Council Executive Committee from 2008-2011. Chairman of the IDC from 2008-2010. Institutional Investor (Fund Directions) Trustee of Year in 2007. Trustee of the Evergreen Funds (and its predecessors) from 1984 to 2010. Chairman of the Evergreen Funds from 2000-2010. Former Trustee of the Mentor Funds. Retired Attorney, Law Offices of Michael S. Scofield and former Director and Chairman, Branded Media Corporation (multi-media branding company). | | Asset Allocation Trust |
Donald C. Willeke
(Born 1940) | | Trustee, since 1996 | | Principal of the law firm of Willeke & Daniels. General Counsel of the Minneapolis Employees Retirement Fund from 1984 until its consolidation into the Minnesota Public Employees Retirement Association on June 30, 2010. Director and Vice Chair of The Free Trust (non-profit corporation). Director of the American Chestnut Foundation (non-profit corporation). | | Asset Allocation Trust |
Officers
| | | | | | |
Name and Year of Birth | | Position Held and
Length of Service | | Principal Occupations During Past Five Years | | |
Karla M. Rabusch
(Born 1959) | | President, since 2003 | | Executive Vice President of Wells Fargo Bank, N.A. and President of Wells Fargo Funds Management, LLC since 2003. Senior Vice President and Chief Administrative Officer of Wells Fargo Funds Management, LLC from 2001 to 2003. | | |
C. David Messman
(Born 1960) | | Secretary, since 2000; Chief Legal Counsel, since 2003 | | Senior Vice President and Secretary of Wells Fargo Funds Management, LLC since 2001. Vice President and Managing Senior Counsel of Wells Fargo Bank, N.A. since 1996. | | |
Kasey Phillips
(Born 1970) | | Treasurer, since 2009 | | Senior Vice President of Wells Fargo Funds Management, LLC since 2009. Senior Vice President of Evergreen Investment Management Company, LLC from 2006 to 2010. Treasurer of the Evergreen Funds from 2005 to 2010. | | |
David Berardi
(Born 1975) | | Assistant Treasurer, since 2009 | | Vice President of Wells Fargo Funds Management, LLC since 2009. Vice President of Evergreen Investment Management Company, LLC from 2008 to 2010. Assistant Vice President of Evergreen Investment Services, Inc. from 2004 to 2008. Manager of Fund Reporting and Control for Evergreen Investment Management Company, LLC from 2004 to 2010. | | |
Jeremy DePalma
(Born 1974) | | Assistant Treasurer, since 2009 | | Senior Vice President of Wells Fargo Funds Management, LLC since 2009. Senior Vice President of Evergreen Investment Management Company, LLC from 2008 to 2010. Vice President, Evergreen Investment Services, Inc. from 2004 to 2007. Head of the Fund Reporting and Control Team within Fund Administration from 2005 to 2010. | | |
Debra Ann Early
(Born 1964) | | Chief Compliance Officer, since 2007 | | Chief Compliance Officer of Wells Fargo Funds Management, LLC since 2007. Chief Compliance Officer of Parnassus Investments from 2005 to 2007. Chief Financial Officer of Parnassus Investments from 2004 to 2007 and Senior Audit Manager of PricewaterhouseCoopers LLP from 1998 to 2004. | | |
| 1. | The Statement of Additional Information includes additional information about the Trustees and is available, without charge, upon request, by calling 1-800-222-8222 or by visiting the Web site at wellsfargoadvantagefunds.com. |
| | | | | | |
| Other Information (Unaudited) | | Wells Fargo Advantage Diversified Income Builder Fund | | | 31 | |
BOARD CONSIDERATION OF INVESTMENT ADVISORY AND SUB-ADVISORY AGREEMENTS:
Under Section 15 of the Investment Company Act of 1940 (the “1940 Act”), the Board of Trustees (the “Board”) of Wells Fargo Funds Trust (the “Trust”), all the members of which have no direct or indirect interest in the investment advisory and sub-advisory agreements and are not “interested persons” of the Trust, as defined in the 1940 Act (the “Independent Trustees”), must determine whether to approve the continuation of the Trust’s investment advisory and sub-advisory agreements. In this regard, at an in person meeting held on March 29-30, 2012 (the “Meeting”), the Board reviewed and re-approved: (i) an investment advisory agreement with Wells Fargo Funds Management, LLC (“Funds Management”) for Wells Fargo Advantage Diversified Income Builder Fund (the “Fund”) and (ii) an investment sub-advisory agreement with Wells Capital Management Incorporated (“Wells Capital Management”) for the Fund. The investment advisory agreement with Funds Management and the investment sub-advisory agreement with Wells Capital Management are collectively referred to as the “Advisory Agreements.”
At the Meeting, the Board considered the factors and reached the conclusions described below relating to the selection of Funds Management and Wells Capital Management and the continuation of the Advisory Agreements. Prior to the Meeting, the Trustees conferred extensively among themselves and with representatives of Funds Management about these matters. The Board also met throughout the year and received information that was useful to them in considering the continuation of the Advisory Agreements. The Independent Trustees were assisted in their evaluation of the Advisory Agreements by independent legal counsel, from whom they received separate legal advice and with whom they met separately from Funds Management.
In providing information to the Board, Funds Management and Wells Capital Management were guided by a detailed set of requests submitted by the Independent Trustees’ independent legal counsel on their behalf at the start of the Board’s annual contract renewal process earlier in 2012. In approving the Advisory Agreements, the Board did not identify any particular information or consideration that was all-important or controlling, and each Trustee likely attributed different weights to various factors.
Nature, extent and quality of services
The Board received and considered various information regarding the nature, extent and quality of services provided to the Fund by Funds Management and Wells Capital Management under the Advisory Agreements. The Board also received and considered, among other things, information about the background and experience of senior management of Funds Management, and the qualifications, backgrounds, tenures and responsibilities of the portfolio managers primarily responsible for the day-to-day portfolio management of the Fund.
The Board evaluated the ability of Funds Management and Wells Capital Management, based on their respective financial condition, resources, reputation and other attributes, to attract and retain qualified investment professionals, including research, advisory, and supervisory personnel. The Board further considered the compliance programs and compliance records of Funds Management and Wells Capital Management. In addition, the Board took into account the administrative services provided to the Fund by Funds Management and its affiliates.
The Board’s decision to approve the continuation of the Advisory Agreements was based on a comprehensive evaluation of all of the information provided to it. In considering these matters, the Board considered not only the specific information presented in connection with the Meeting, but also the knowledge gained over time through interaction with Funds Management and Wells Capital Management about various topics, including Funds Management’s oversight of service providers. The above factors, together with those referenced below, are some of the most important, but not necessarily all, factors considered by the Board in concluding that the nature, extent and quality of the investment advisory services provided to the Fund by Funds Management and Wells Capital Management supported the re-approval of the Advisory Agreements. Although the Board considered the continuation of the Advisory Agreements for the Fund as part of the larger process of considering the continuation of the advisory agreements for all of the funds in the complex, its decision to continue the Advisory Agreements for the Fund was ultimately made on a fund-by-fund basis.
Fund performance and expenses
The Board considered the performance results for the Fund over various time periods ended December 31, 2011. The Board also considered these results in comparison to the median performance of a universe of relevant funds (the “Universe”) that was determined by Lipper Inc. (“Lipper”) to be similar to the Fund, and in comparison to the Fund’s
| | | | |
| 32 | | Wells Fargo Advantage Diversified Income Builder Fund | | Other Information (Unaudited) |
benchmark index and to other comparative data. Lipper is an independent provider of investment company data. The Board received a description of the methodology used by Lipper to select the mutual funds in the Universe. The Board noted that, other than the one-year performance period for the A class, the performance of the Fund was higher than or in range with the median performance of the Universe for all periods under review. The Board also noted that, except for the one-year and five-year performance periods, the performance of the Fund was higher than its benchmark index, the Lipper Mixed-Asset Target Allocation Conservative Funds Index, for the periods under review.
The Board received and considered information regarding the Fund’s contractual advisory fee and net operating expense ratios and their various components, including actual management fees (which reflect fee waivers, if any), transfer agent, custodian and other non-management fees, Rule 12b-1 and non-Rule 12b-1 fees, service fees and fee waiver and expense reimbursement arrangements. The Board also considered these ratios in comparison to the median ratios of an expense Universe and a narrower expense group of mutual funds (each, an “Expense Group”) that was determined by Lipper to be similar to the Fund. The Board received a description of the methodology used by Lipper to select the mutual funds in the Fund’s Expense Group. The Board noted that the net operating expense ratios of the Fund were in range or lower than the median net operating expense ratios of the Fund’s Expense Group.
Based on the above-referenced considerations and other factors, the Board concluded that the overall performance and expense structure of the Fund supported the re-approval of the Advisory Agreements for the Fund.
Investment advisory and sub-advisory fee rates
The Board reviewed and considered the contractual investment advisory fee rate that is payable by the Fund to Funds Management for investment advisory services (the “Advisory Agreement Rate”), both on a stand-alone basis and on a combined basis with the Fund’s administration fee rate. The Board took into account the separate administrative and other services covered by the administration fee rate. The Board also reviewed and considered the contractual investment sub-advisory fee rate that is payable by Funds Management to Wells Capital Management for investment sub-advisory services (the “Sub-Advisory Agreement Rate”). In addition, the Board reviewed and considered the existing fee waiver/cap arrangements applicable to the Advisory Agreement Rate and considered the Advisory Agreement Rate after taking the waivers/caps into account (the “Net Advisory Rate”).
The Board received and considered information comparing the Advisory Agreement Rate and Net Advisory Rate with those of other funds in the Fund’s Expense Group median. The Board noted that while the Advisory Agreement Rate and Net Advisory Rate for the A share class of the Fund were higher than the Advisory Agreement Rate and Net Advisory Rate of its Expense Group, the Advisory Agreement Rate and Net Advisory Rate for Administrator and Institutional share classes of the Fund were in range of the median rates for their respective Expense Groups.
The Board also received and considered information about the nature and extent of services offered and fee rates charged by Funds Management and Wells Capital Management to other types of clients. In this regard, the Board received information about differences between the services, and the compliance, reporting, and other legal burdens and risks of providing investment advice to mutual funds and those associated with providing advice to non-mutual fund clients such as collective funds or institutional separate accounts.
The Board determined that the Advisory Agreement Rate for the Fund, both with and without an administration fee rate and before and after waivers, was reasonable in light of the Fund’s Expense Group information, the net expense ratio commitments, the services covered by the Advisory Agreements and other information provided. The Board also reviewed and considered the Sub-Advisory Agreement Rate and concluded that the Sub-Advisory Agreement Rate was reasonable in light of the services covered by the sub-advisory agreement and other information provided.
Profitability
The Board received and considered a profitability analysis of Funds Management, as well as an analysis of the profitability to the collective Wells Fargo businesses that provide services to the Fund. It considered that the information provided to it was necessarily estimated, and that the profitability information provided to it, especially on a fund-by-fund basis, did not necessarily provide a precise tool for evaluating the appropriateness of the Fund’s Advisory Agreement Rate in isolation. It noted that the levels of profitability reported on a fund-by-fund basis varied widely, depending on, among other things, the size and type of fund. The Board concluded that the profitability reported by Funds Management was not unreasonable.
| | | | | | |
| Other Information (Unaudited) | | Wells Fargo Advantage Diversified Income Builder Fund | | | 33 | |
The Board did not consider separate profitability information with respect to Wells Capital Management, because, as an affiliate of Funds Management, its profitability information was subsumed in the collective Wells Fargo profitability analysis provided by Funds Management.
Economies of scale
With respect to possible economies of scale, the Board reviewed the breakpoints in the Fund’s advisory fee structure, which operate generally to reduce the effective Advisory Agreement Rate of the Fund (as a percentage of Fund assets) as the Fund grows in size. It considered that, as a fund shrinks in size, breakpoints conversely result in increasing fee levels. The Board noted that it would have on-going opportunities to review the appropriate levels of breakpoints in the future, and concluded that the breakpoints as implemented appeared to be a reasonable step toward sharing economies of scale, if any, with the Fund. However, the Board acknowledged the inherent limitations of any analysis of an investment adviser’s economies of scale and of any attempt to correlate breakpoints with such economies, stemming largely from the Board’s understanding that economies of scale are realized, if at all, by an investment adviser across a variety of products and services, not just with respect to a single fund.
Other benefits to Funds Management and Wells Capital Management
The Board received and considered information regarding potential “fall-out” or ancillary benefits received by Funds Management and its affiliates, including Wells Capital Management, as a result of their relationship with the Fund. Ancillary benefits could include, among others, benefits directly attributable to the relationship of Funds Management and Wells Capital Management with the Fund and benefits potentially derived from an increase in Funds Management’s and Wells Capital Management’s business as a result of their relationship with the Fund (such as the ability to market to shareholders other financial products offered by Funds Management and its affiliates, including Wells Capital Management).
The Board considered that Wells Fargo Funds Distributor, LLC, an affiliate of Funds Management, serves as distributor to the Fund and receives certain compensation for those services. The Board noted that various financial institutions, including affiliates of Funds Management, may receive distribution-related fees, shareholder servicing payments (including amounts derived from payments under Rule 12b-1 plans) and sub-transfer agency fees in respect of shares sold or held through them and services provided.
The Board also reviewed information about whether and to what extent soft dollar credits are sought and how any such credits are utilized and any benefits that may be realized by using an affiliated broker.
Other factors and broader review
The Board also considered the markets for distribution of the Fund’s shares, including the channels through which the Fund’s shares are offered and sold. The Board noted that the Fund is part of one of the few fund families that have both direct-to-fund and intermediary distribution channels. As discussed above, the Board reviews detailed materials received from Funds Management and Wells Capital Management annually as part of the re-approval process under Section 15 of the 1940 Act and also reviews and assesses information about the quality of the services that the Fund receives throughout the year. In this regard, the Board has reviewed reports of Funds Management at each of its quarterly meetings, which include, among other things, portfolio reviews and performance reports. In addition, the Board confers with portfolio managers at various times throughout the year.
Conclusion
After considering the above-described factors and based on its deliberations and its evaluation of the information described above, the Board unanimously approved the continuation of the Advisory Agreements for an additional one-year period.
| | | | |
| 34 | | Wells Fargo Advantage Diversified Income Builder Fund | | List of Abbreviations |
The following is a list of common abbreviations for terms and entities which may have appeared in this report.
| ACB | — Agricultural Credit Bank |
| ADR | — American Depository Receipt |
| ADS | — American Depository Shares |
| AGC-ICC | — Assured Guaranty Corporation - Insured Custody Certificates |
| AGM | — Assured Guaranty Municipal |
| AMBAC | — American Municipal Bond Assurance Corporation |
| AMT | — Alternative Minimum Tax |
| BAN | — Bond Anticipation Notes |
| BHAC | — Berkshire Hathaway Assurance Corporation |
| CAB | — Capital Appreciation Bond |
| CCAB | — Convertible Capital Appreciation Bond |
| CDA | — Community Development Authority |
| CDO | — Collateralized Debt Obligation |
| COP | — Certificate of Participation |
| DRIVER | — Derivative Inverse Tax-Exempt Receipts |
| DW&P | — Department of Water & Power |
| DWR | — Department of Water Resources |
| ECFA | — Educational & Cultural Facilities Authority |
| EDA | — Economic Development Authority |
| EDFA | — Economic Development Finance Authority |
| ETF | — Exchange-Traded Fund |
| FFCB | — Federal Farm Credit Bank |
| FGIC | — Financial Guaranty Insurance Corporation |
| FHA | — Federal Housing Authority |
| FHLB | — Federal Home Loan Bank |
| FHLMC | — Federal Home Loan Mortgage Corporation |
| FICO | — The Financing Corporation |
| FNMA | — Federal National Mortgage Association |
| GDR | — Global Depository Receipt |
| GNMA | — Government National Mortgage Association |
| HCFR | — Healthcare Facilities Revenue |
| HEFA | — Health & Educational Facilities Authority |
| HEFAR | — Higher Education Facilities Authority Revenue |
| HFA | — Housing Finance Authority |
| HFFA | — Health Facilities Financing Authority |
| IBC | — Insured Bond Certificate |
| IDA | — Industrial Development Authority |
| IDAG | — Industrial Development Agency |
| IDR | — Industrial Development Revenue |
| KRW | — Republic of Korea Won |
| LIBOR | — London Interbank Offered Rate |
| LLC | — Limited Liability Company |
| LLP | — Limited Liability Partnership |
| MBIA | — Municipal Bond Insurance Association |
| MFHR | — Multi-Family Housing Revenue |
| MSTR | — Municipal Securities Trust Receipts |
| MUD | — Municipal Utility District |
| NATL-RE | — National Public Finance Guarantee Corporation |
| PCFA | — Pollution Control Finance Authority |
| PCR | — Pollution Control Revenue |
| PFA | — Public Finance Authority |
| PFFA | — Public Facilities Financing Authority |
| PFOTER | — Puttable Floating Option Tax-Exempt Receipts |
| plc | — Public Limited Company |
| PUTTER | — Puttable Tax-Exempt Receipts |
| R&D | — Research & Development |
| RDA | — Redevelopment Authority |
| RDFA | — Redevelopment Finance Authority |
| REIT | — Real Estate Investment Trust |
| ROC | — Reset Option Certificates |
| SAVRS | — Select Auction Variable Rate Securities |
| SBA | — Small Business Authority |
| SFHR | — Single Family Housing Revenue |
| SFMR | — Single Family Mortgage Revenue |
| SPDR | — Standard & Poor’s Depositary Receipts |
| STRIPS | — Separate Trading of Registered Interest and Principal Securities |
| TAN | — Tax Anticipation Notes |
| TIPS | — Treasury Inflation-Protected Securities |
| TRAN | — Tax Revenue Anticipation Notes |
| TCR | — Transferable Custody Receipts |
| TTFA | — Transportation Trust Fund Authority |
| TVA | — Tennessee Valley Authority |
| XLCA | — XL Capital Assurance |


FOR MORE INFORMATION
More information about Wells Fargo Advantage Funds is available free upon request. To obtain literature, please write, e-mail, visit the Fund’s Web site, or call:
Wells Fargo Advantage Funds
P.O. Box 8266
Boston, MA 02266-8266
E-mail: wfaf@wellsfargo.com
Web site: wellsfargoadvantagefunds.com
Individual investors: 1-800-222-8222
Retail investment professionals: 1-888-877-9275
Institutional investment professionals: 1-866-765-0778
This report and the financial statements contained herein are submitted for the general information of the shareholders of Wells Fargo Advantage Funds. If this report is used for promotional purposes, distribution of the report must be accompanied or preceded by a current prospectus. For a prospectus containing more complete information, including charges and expenses, call 1-800-222-8222 or visit the Fund’s Web site at wellsfargoadvantagefunds.com. Please consider the investment objectives, risks, charges, and expenses of the investment carefully before investing. This and other information about Wells Fargo Advantage Funds can be found in the current prospectus. Read the prospectus carefully before you invest or send money.
Wells Fargo Funds Management, LLC, a wholly owned subsidiary of Wells Fargo & Company, provides investment advisory and administrative services for Wells Fargo Advantage Funds. Other affiliates of Wells Fargo & Company provide subadvisory and other services for the Funds. The Funds are distributed by Wells Fargo Funds Distributor, LLC, Member FINRA/SIPC, an affiliate of Wells Fargo & Company.
NOT FDIC INSURED ¡ NO BANK GUARANTEE ¡ MAY LOSE VALUE
© 2012 Wells Fargo Funds Management, LLC. All rights reserved.
| | |
 | | 208985 05-12 SA226/SAR226 3-12 |

Wells Fargo Advantage
Index Asset Allocation Fund

Semi-Annual Report
March 31, 2012

Reduce clutter. Save trees.
Sign up for electronic delivery of prospectuses and shareholder reports at wellsfargo.com/advantagedelivery
Contents
The views expressed and any forward-looking statements are as of March 31, 2012, unless otherwise noted, and are those of the Fund managers and/or Wells Fargo Funds Management, LLC. Discussions of individual securities, or the markets generally, or any Wells Fargo Advantage Fund are not intended as individual recommendations. Future events or results may vary significantly from those expressed in any forward-looking statements; the views expressed are subject to change at any time in response to changing circumstances in the market. Wells Fargo Funds Management, LLC, disclaims any obligation to publicly update or revise any views expressed or forward-looking statements.
NOT FDIC INSURED ¡ NO BANK GUARANTEE ¡ MAY LOSE VALUE

WELLS FARGO INVESTMENT HISTORY
| | |
| |
| 1932 | | Keystone creates one of the first mutual fund families. |
| |
| 1971 | | Wells Fargo & Company introduces one of the first institutional index funds. |
| |
| 1978 | | Wells Fargo applies Markowitz and Sharpe’s research on Modern Portfolio Theory to introduce one of the industry’s first Tactical Asset Allocation (TAA) models in institutional separately managed accounts. |
| |
| 1984 | | Wells Fargo Stagecoach Funds launches its first asset allocation fund. |
| |
| 1989 | | The Tactical Asset Allocation (TAA) Model is first applied to Wells Fargo’s asset allocation mutual funds. |
| |
| 1994 | | Wells Fargo introduces the LifePath Funds, one of the first suites of target date funds (now the Wells Fargo Advantage Dow Jones Target Date FundsSM). |
| |
| 1996 | | Evergreen Investments and Keystone Funds merge. |
| |
| 1997 | | Wells Fargo launches Wells Fargo Advantage WealthBuilder PortfoliosSM, a fund-of-funds suite of products that includes the use of quantitative models to shift assets among investment styles. |
| |
| 1999 | | Norwest Advantage Funds and Stagecoach Funds are reorganized into Wells Fargo Funds after the merger of Norwest and Wells Fargo. |
| |
| 2002 | | Evergreen Retail and Evergreen Institutional companies form the umbrella asset management company, Evergreen Investments. |
| |
| 2005 | | The integration of Strong Funds with Wells Fargo Funds creates Wells Fargo Advantage Funds, resulting in one of the top 20 mutual fund companies in the United States. |
| |
| 2006 | | Wells Fargo Advantage Funds relaunches the target date product line as Wells Fargo Advantage Dow Jones Target Date Funds. |
| |
| 2010 | | The mergers and reorganizations of Evergreen and Wells Fargo Advantage mutual funds are completed, unifying the families under the brand of Wells Fargo Advantage Funds. |
Wells Fargo Advantage Funds®
Wells Fargo Advantage Funds skillfully guides institutions, financial advisors, and individuals through the investment terrain to help them reach their financial objectives. Everything we do on behalf of investors is backed by our unique combination of qualifications.
Strength
Our organization is built on the standards of integrity and service established by our parent company—Wells Fargo & Company—more than 150 years ago. And, because we’re part of a highly diversified financial enterprise, we offer the depth of resources to help investors succeed.
Expertise
Our multi-boutique model offers investors access to the independent thinking of premier investment managers that have been chosen for their time-tested strategies. While each team specializes in a specific investment strategy, collectively they provide investors a wide choice of distinct investment styles. Our dedication to investment excellence doesn’t end with our expertise in manager selection—risk management, analysis, and rigorous ongoing review seek to ensure each manager’s investment process remains consistent.
Partnership
Our collaborative approach is built around understanding the needs and goals of our clients. By adhering to core principles of sound judgment and steady guidance, we support you through every stage of the investment decision process.
Carefully consider a fund’s investment objectives, risks, charges, and expenses before investing. For a current prospectus and, if available, a summary prospectus, containing this and other information, visit wellsfargoadvantagefunds.com. Read it carefully before investing.
Wells Fargo Funds Management, LLC, a wholly owned subsidiary of Wells Fargo & Company, provides investment advisory and administrative services for Wells Fargo Advantage Funds®. Other affiliates of Wells Fargo & Company provide subadvisory and other services for the Funds. The Funds are distributed by Wells Fargo Funds Distributor, LLC, Member FINRA/SIPC, an affiliate of Wells Fargo & Company.
“Dow Jones®” and “Dow Jones Target Date IndexesSM” are service marks of Dow Jones Trademark Holdings, LLC (“Dow Jones”), have been licensed to CME Group Index Services LLC (“CME Indexes”) and have been sublicensed for use for certain purposes by Global Index Advisors, Inc, and Wells Fargo Funds Management, LLC. The Wells Fargo Advantage Dow Jones Target Date FundsSM based on the Dow Jones Target Date IndexesSM, are not sponsored, endorsed, sold or promoted by Dow Jones, CME Indexes or their respective affiliates and none of them makes any representation regarding the advisability of investing in such product(s).
NOT FDIC INSURED ¡ NO BANK GUARANTEE ¡ MAY LOSE VALUE
Not part of the semi-annual report.
Wells Fargo Advantage Funds offers more than 110 mutual funds across a wide range of asset classes, representing over $213 billion in assets under management, as of March 31, 2012.
| | | | |
| Equity Funds | | | | |
Asia Pacific Fund | | Equity Value Fund | | Precious Metals Fund |
C&B Large Cap Value Fund | | Global Opportunities Fund | | Premier Large Company Growth Fund |
C&B Mid Cap Value Fund | | Growth Fund | | Small Cap Opportunities Fund |
Capital Growth Fund | | Index Fund | | Small Cap Value Fund |
Common Stock Fund | | International Equity Fund | | Small Company Growth Fund |
Disciplined U.S. Core Fund | | International Value Fund | | Small Company Value Fund |
Discovery Fund† | | Intrinsic Small Cap Value Fund | | Small/Mid Cap Core Fund |
Diversified Equity Fund | | Intrinsic Value Fund | | Small/Mid Cap Value Fund |
Diversified International Fund | | Intrinsic World Equity Fund | | Special Mid Cap Value Fund |
Diversified Small Cap Fund | | Large Cap Core Fund | | Special Small Cap Value Fund |
Emerging Growth Fund | | Large Cap Growth Fund | | Specialized Technology Fund |
Emerging Markets Equity Fund | | Large Company Value Fund | | Strategic Large Cap Growth Fund |
Endeavor Select Fund† | | Omega Growth Fund | | Traditional Small Cap Growth Fund |
Enterprise Fund† | | Opportunity Fund† | | Utility and Telecommunications Fund |
| Bond Funds | | | | |
Adjustable Rate Government Fund | | Inflation-Protected Bond Fund | | Short-Term Bond Fund |
California Limited-Term Tax-Free Fund | | Intermediate Tax/AMT-Free Fund | | Short-Term High Yield Bond Fund |
California Tax-Free Fund | | International Bond Fund | | Short-Term Municipal Bond Fund |
Colorado Tax-Free Fund | | Minnesota Tax-Free Fund | | Strategic Municipal Bond Fund |
Government Securities Fund | | Municipal Bond Fund | | Total Return Bond Fund |
High Income Fund | | North Carolina Tax-Free Fund | | Ultra Short-Term Income Fund |
High Yield Bond Fund | | Pennsylvania Tax-Free Fund | | Ultra Short-Term Municipal Income Fund |
Income Plus Fund | | Short Duration Government Bond Fund | | Wisconsin Tax-Free Fund |
| Asset Allocation Funds | | | | |
Absolute Return Fund | | WealthBuilder Equity Portfolio† | | Target 2020 Fund† |
Asset Allocation Fund | | WealthBuilder Growth Allocation Portfolio† | | Target 2025 Fund† |
Conservative Allocation Fund | | WealthBuilder Growth Balanced Portfolio† | | Target 2030 Fund† |
Diversified Capital Builder Fund | | WealthBuilder Moderate Balanced Portfolio† | | Target 2035 Fund† |
Diversified Income Builder Fund | | WealthBuilder Tactical Equity Portfolio† | | Target 2040 Fund† |
Growth Balanced Fund | | Target Today Fund† | | Target 2045 Fund† |
Index Asset Allocation Fund | | Target 2010 Fund† | | Target 2050 Fund† |
Moderate Balanced Fund | | Target 2015 Fund† | | Target 2055 Fund† |
WealthBuilder Conservative Allocation Portfolio† | | | | |
| Money Market Funds | | | | |
100% Treasury Money Market Fund | | Heritage Money Market Fund† | | National Tax-Free Money Market Fund |
California Municipal Money Market Fund | | Money Market Fund | | Prime Investment Money Market Fund |
Cash Investment Money Market Fund | | Municipal Cash Management Money Market Fund | | Treasury Plus Money Market Fund |
Government Money Market Fund | | Municipal Money Market Fund | | |
| Variable Trust Funds1 | | | | |
VT Discovery Fund† | | VT Intrinsic Value Fund | | VT Small Cap Growth Fund |
VT Index Asset Allocation Fund | | VT Omega Growth Fund | | VT Small Cap Value Fund |
VT International Equity Fund | | VT Opportunity Fund† | | VT Total Return Bond Fund |
An investment in a money market fund is not insured or guaranteed by the Federal Deposit Insurance Corporation or any other government agency. Although the Wells Fargo Advantage Money Market Funds seek to preserve the value of your investment at $1.00 per share, it is possible to lose money by investing in a money market fund.
| 1. | The Variable Trust Funds are generally available only through insurance company variable contracts. |
| † | In this report, the Wells Fargo Advantage Discovery FundSM, Wells Fargo Advantage Endeavor Select FundSM, Wells Fargo Advantage Enterprise FundSM, Wells Fargo Advantage Opportunity FundSM, Wells Fargo Advantage WealthBuilder Conservative Allocation PortfolioSM, Wells Fargo Advantage WealthBuilder Equity PortfolioSM, Wells Fargo Advantage WealthBuilder Growth Allocation PortfolioSM, Wells Fargo Advantage WealthBuilder Growth Balanced PortfolioSM, Wells Fargo Advantage WealthBuilder Moderate Balanced PortfolioSM, Wells Fargo Advantage WealthBuilder Tactical Equity PortfolioSM, Wells Fargo Advantage Dow Jones Target Today FundSM, Wells Fargo Advantage Dow Jones Target 2010 FundSM, Wells Fargo Advantage Dow Jones Target 2015 FundSM, Wells Fargo Advantage Dow Jones Target 2020 FundSM, Wells Fargo Advantage Dow Jones Target 2025 FundSM, Wells Fargo Advantage Dow Jones Target 2030 FundSM, Wells Fargo Advantage Dow Jones Target 2035 FundSM, Wells Fargo Advantage Dow Jones Target 2040 FundSM, Wells Fargo Advantage Dow Jones Target 2045 FundSM, Wells Fargo Advantage Dow Jones Target 2050 FundSM, Wells Fargo Advantage Dow Jones Target 2055 FundSM, Wells Fargo Advantage Heritage Money Market FundSM, Wells Fargo Advantage VT Discovery FundSM, and Wells Fargo Advantage VT Opportunity FundSM are referred to as the Discovery Fund, Endeavor Select Fund, Enterprise Fund, Opportunity Fund, WealthBuilder Conservative Allocation Portfolio, WealthBuilder Equity Portfolio, WealthBuilder Growth Allocation Portfolio, WealthBuilder Growth Balanced Portfolio, WealthBuilder Moderate Balanced Portfolio, WealthBuilder Tactical Equity Portfolio, Target Today Fund, Target 2010 Fund, Target 2015 Fund, Target 2020 Fund, Target 2025 Fund, Target 2030 Fund, Target 2035 Fund, Target 2040 Fund, Target 2045 Fund, Target 2050 Fund, Target 2055 Fund, Heritage Money Market Fund, VT Discovery Fund, and VT Opportunity Fund, respectively. |
Not part of the semi-annual report.
| | | | |
| 2 | | Wells Fargo Advantage Index Asset Allocation Fund | | Letter to Shareholders |

Karla M. Rabusch,
President
Wells Fargo Advantage Funds
The financial markets throughout most of the past six months may best be described as a risk-on/risk-off trading environment in response to the uncertainty about the sustainability of the U.S. economic recovery, ongoing concerns about the Greek debt crisis, and the overall health of the eurozone.
After struggling in the early part of the six-month period, most equity markets rallied to post extraordinary total returns on the whole. In fact, most of the major U.S. equity indexes realized the strongest first-quarter performance in over 10 years during the first three months of 2012.
Dear Valued Shareholder:
We’re pleased to offer you this semi-annual report for the Wells Fargo Advantage Index Asset Allocation Fund for the six-month period that ended March 31, 2012.
The financial markets throughout most of the past six months may best be described as a risk-on/risk-off trading environment in response to the uncertainty about the sustainability of the U.S. economic recovery, ongoing concerns about the Greek debt crisis, and the overall health of the eurozone. When volatility and uncertainty were high, investors sold risky assets such as high-beta1 equities, commodities, emerging markets securities, and high-yield bonds, in preference for the relative safety of U.S. Treasuries. In periods of low volatility, investor risk tolerance sharply rose, and the markets sought out the higher yield and return potential of those riskier investments.
During the first quarter of 2012, investor sentiment appeared to be more positive and balanced. This recent shift in sentiment was the result of improvement in the global macroeconomic backdrop, which contributed to a less volatile market environment and more stable consensus earnings growth outlook. These developments also encouraged investors to refocus on underlying fundamentals and a longer-term investment perspective, which may have sparked the first-quarter equity rally led by stocks and sectors that were shunned at points in 2011, notably retail and higher-growth technology names. In addition, as investors’ risk tolerance increased during the period, corporate bonds, including high-yield bonds, were favored over the relative safety and lower yields offered by U.S. Treasuries.
After struggling in the early part of the six-month period, most equity markets rallied to post extraordinary total returns on the whole. In fact, most of the major U.S. equity indexes realized the strongest first-quarter performance in over 10 years during the first three months of 2012.
During the six-month period, the S&P 500 Index2 and the Russell 3000® Index3 posted returns of 25.89% and 26.55%, respectively, while the Barclays U.S. Aggregate Bond Index4, representing the universe of investment-grade U.S. bonds, posted a total return of 1.43%.
By comparison, the Barclays U.S. Treasury Index5 and Barclays 20+ Year U.S. Treasury Index6 returned (0.41)% and (5.02)%, respectively, while the Barclays U.S. Corporate High Yield Bond Index7 added 12.14% during the period.
The developed global economies regained some momentum during the period.
Most global economies modestly improved during the six-month period, but their paths were uneven, primarily due to persistently sluggish jobs growth and a flat housing market affecting the U.S. and the ongoing sovereign debt concerns impacting the eurozone.
| 1. | Beta measures fund volatility relative to general market movements. It is a standardized measure of systematic risk in comparison to a specified index. The benchmark beta is 1.00 by definition. Beta is based on historical performance and does not represent future results. |
| 2. | The S&P 500 Index consists of 500 stocks chosen for market size, liquidity, and industry group representation. It is a market-value weighted index with each stock’s weight in the index proportionate to its market value. You cannot invest directly in an index. |
| 3. | The Russell 3000® Index measures the performance of the 3,000 largest U.S. companies based on total market capitalization, which represents approximately 98% of the investable U.S. equity market. You cannot invest directly in an index. |
| 4. | The Barclays U.S. Aggregate Bond Index is composed of the Barclays Government/Credit Index and the Mortgage-Backed Securities Index and includes U.S. Treasury issues, agency issues, corporate bond issues, and mortgage-backed securities. You cannot invest directly in an index. |
| | | | | | |
| Letter to Shareholders | | Wells Fargo Advantage Index Asset Allocation Fund | | | 3 | |
The U.S. Bureau of Economic Analysis reported that U.S. gross domestic product (GDP) expanded to an annual growth rate of 1.8% in the third quarter of 2011, re-igniting hopes of a sustainable economic recovery. Those hopes were buoyed further by the final estimate of fourth-quarter of 2011 GDP, which showed that growth accelerated to a 3.0% annual rate. While few economists now believe that the U.S. economy is in danger of sliding back into recession, many continue to expect a tepid economic growth environment in 2012.
Within the eurozone, GDP grew at an annualized rate of 1.5% for 2011, which was modestly weaker from a year earlier when eurozone GDP was reported at an annualized rate of 2.0% in the fourth quarter of 2010. Considering the fiscal challenges that faced European countries throughout 2011—stemming, primarily, from the reemergence of the Greek debt crisis—most economists had expected weaker economic conditions in 2011. While several steps have been taken by the International Monetary Fund and the European Central Bank to address the ongoing fiscal challenges in Europe, economic conditions of many countries in the eurozone are likely to remain weak throughout 2012.
Central banks across the globe remain committed to accommodative policies.
With inflation in check, the U.S. Federal Reserve (Fed) held its target range for the federal funds rate—a proxy for short-term interest rates—steady at 0% to 0.25%. Last summer, the Federal Open Market Committee (FOMC) issued a statement explaining that economic conditions were likely to warrant exceptionally low levels for the federal funds rate through at least mid-2013—a timetable that was later revised to late 2014 following the FOMC meeting on January 25, 2012.
The European Central Bank (ECB) also continued to maintain an accommodative monetary policy throughout the period, primarily in efforts to stave off the contagion risk stemming from the ongoing concerns about the potential of Greece defaulting on its sovereign bonds. Fortunately, Greece received another bailout and was able to restructure its outstanding debt in February 2012, which alleviated near-term contagion risks and the possibility of the euro collapsing. However, the agreement does not fully address longer-term structural issues that affect not only Greece, but several other countries across the eurozone. Recognizing the drag the persistent sovereign debt crisis has had on financial stability across the eurozone, the ECB-introduced additional liquidity into the European banking system through its long-term refinancing operations (LTRO). The LTRO program effectively encourages European banks to buy sovereign bonds of the eurozone governments, helping to push yields lower on bonds from financially fragile countries like Spain and Italy. This type of activity helps to reduce the near-term risk that those countries would experience funding issues. From a global credit market perspective, this additional liquidity further helps alleviate fears of contagion and causes risk premiums to decline—an ideal scenario for equities and high-yield bonds.
| 5. | The Barclays U.S. Treasury Index is an index of U.S. Treasury securities. You cannot invest directly in an index. |
| 6. | The Barclays 20+ Year U. S. Treasury Index is an unmanaged index composed of securities in the U.S. Treasury Index with maturities of 20 years or greater. You cannot invest directly in an index. |
| 7. | The Barclays U.S. Corporate High Yield Bond Index is an unmanaged, U.S. dollar denominated, nonconvertible, non-investment grade debt index. The index consists of domestic and corporate bonds rated Ba and below with a minimum outstanding amount of $150 million. You cannot invest directly in an index. |
| | | | |
| 4 | | Wells Fargo Advantage Index Asset Allocation Fund | | Letter to Shareholders |
Recent events have not altered our message to shareholders.
The heightened volatility across the global financial markets during 2011 and lingering uncertainties about the outlook going forward have left many investors questioning their resolve—and their investments. Yet it is precisely at such times that the market may present opportunities—as well as challenges—for prudent investors. For many investors, simply building and maintaining a well-diversified8 investment plan focused on clear financial objectives is the best long-term strategy.
Thank you for choosing to invest with Wells Fargo Advantage Funds. We appreciate your confidence in us and remain committed to helping you meet your financial needs. For current information about your fund investments, contact your investment professional, visit our Web site at wellsfargoadvantagefunds.com, or call us directly at 1-800-222-8222. We are available 24 hours a day, 7 days a week.
Sincerely,

Karla M. Rabusch
President
Wells Fargo Advantage Funds
| 8. | Diversification does not assure or guarantee better performance and cannot eliminate the risk of investment losses. |
| | | | | | |
| Letter to Shareholders | | Wells Fargo Advantage Index Asset Allocation Fund | | | 5 | |
Notice to Shareholders
The Board of Trustees for Wells Fargo Advantage Funds has unanimously approved the following modifications to certain net asset value (NAV) waiver privileges and commission schedules:
| | n | | Effective May 1, 2012, automatic investment plan (AIP) purchases and proceeds received from systematic withdrawals will no longer qualify for NAV repurchase privileges. | |
| | n | | Effective May 1, 2012, discretionary rights to waive the upfront commission for Class C and “jumbo” Class A share purchases will no longer be granted to broker/dealers. However, we will continue to waive the Class C shares contingent deferred sales charge for redemptions by employer-sponsored retirement plans where the dealer of record waived its commission at the time of purchase. | |
| | n | | Effective July 31, 2012, NAV purchase privileges for former Evergreen Class IS and Class R shareholders are being modified to remove the ability to purchase Class A shares at NAV unless those shares are held directly with the Fund on or after July 31, 2012. | |
Please contact your investment professional or call us directly at 1-800-222-8222 if you have any questions on this Notice to Shareholders.
| | | | |
| 6 | | Wells Fargo Advantage Index Asset Allocation Fund | | Performance Highlights (Unaudited) |
INVESTMENT OBJECTIVE
The Fund seeks long-term total return, consisting of capital appreciation and current income.
ADVISER
Wells Fargo Funds Management, LLC
SUB-ADVISER
Wells Capital Management Incorporated
PORTFOLIO MANAGERS
Petros Bocray, CFA, FRM
Jeffrey P. Mellas, CAIA
FUND INCEPTION
November 13, 1986
| | | | |
TEN LARGEST HOLDINGS1 (AS OF MARCH 31, 2012) | | | |
Apple Incorporated | | | 2.69% | |
U.S. Treasury Bond, 4.38%, 05/15/2041 | | | 2.65% | |
U.S. Treasury Bond, 4.38%, 05/15/2040 | | | 2.55% | |
U.S. Treasury Bond, 3.75%, 08/15/2041 | | | 2.49% | |
U.S. Treasury Bond, 4.25%, 11/15/2040 | | | 2.47% | |
U.S. Treasury Bond, 4.38%, 11/15/2039 | | | 2.47% | |
U.S. Treasury Bond, 4.63%, 02/15/2040 | | | 2.43% | |
U.S. Treasury Bond, 4.75%, 02/15/2041 | | | 2.41% | |
U.S. Treasury Bond, 3.13%, 11/15/2041 | | | 2.28% | |
U.S. Treasury Bond, 3.88%, 08/15/2040 | | | 2.05% | |
| | |
SECTOR DISTRIBUTION2 (AS OF MARCH 31, 2012) | | |
|
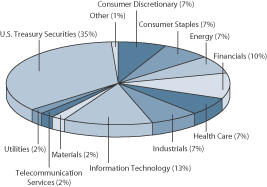 |
| | | | |
NEUTRAL ALLOCATION3 (AS OF MARCH 31, 2012) | | | |
Stocks | | | 60% | |
Bonds | | | 40% | |
| | | | |
CURRENT TARGET ALLOCATION3 (AS OF MARCH 31, 2012) | | | |
Stocks | | | 85% | |
Bonds | | | 15% | |
| 1. | The ten largest holdings are calculated based on the value of the securities divided by total net assets of the Fund. Holdings are subject to change and may have changed since the date specified. |
| 2. | Sector distribution is subject to change and is calculated based on the total long-term investments of the Fund. |
| 3. | Portfolio allocations are subject to change. Cash and cash equivalents are not reflected in the calculations of portfolio allocations. Neutral allocation is the target allocation of the Fund as stated in the Fund’s prospectus. Current target allocation is the current allocation of the Fund based on our Tactical Asset Allocation Model as of the date specified and is subject to change. |
| | | | | | |
| Performance Highlights (Unaudited) | | Wells Fargo Advantage Index Asset Allocation Fund | | | 7 | |
AVERAGE ANNUAL TOTAL RETURN (%) (AS OF MARCH 31, 2012)
| | | | | | | | | | | | | | | | | | | | | | | | | | | | | | | | | | | | | | | | | | | | |
| | | | | | Including Sales Charge | | | Excluding Sales Charge | | | Expense Ratios4 | |
| | | Inception Date | | | 6 Months* | | | 1 Year | | | 5 Year | | | 10 Year | | | 6 Months* | | | 1 Year | | | 5 Year | | | 10 Year | | | Gross | | | Net5 | |
Class A (SFAAX) | | | 11/13/1986 | | | | 11.62 | | | | 4.54 | | | | 1.55 | | | | 4.04 | | | | 18.46 | | | | 10.91 | | | | 2.76 | | | | 4.66 | | | | 1.19% | | | | 1.15% | |
Class B (SASBX)** | | | 01/01/1995 | | | | 12.91 | | | | 5.02 | | | | 1.61 | | | | 4.12 | | | | 17.91 | | | | 10.02 | | | | 1.99 | | | | 4.12 | | | | 1.94% | | | | 1.90% | |
Class C (WFALX) | | | 04/01/1998 | | | | 17.03 | | | | 9.06 | | | | 2.00 | | | | 3.88 | | | | 18.03 | | | | 10.06 | | | | 2.00 | | | | 3.88 | | | | 1.94% | | | | 1.90% | |
Administrator Class (WFAIX) | | | 11/08/1999 | | | | | | | | | | | | | | | | | | | | 18.59 | | | | 11.19 | | | | 3.03 | | | | 4.92 | | | | 1.03% | | | | 0.90% | |
Index Asset Allocation Composite Index6 | | | | | | | | | | | | | | | | | | | | | | | 12.96 | | | | 16.94 | | | | 5.95 | | | | 6.65 | | | | | | | | | |
S&P 500 Index7 | | | | | | | | | | | | | | | | | | | | | | | 25.89 | | | | 8.54 | | | | 2.01 | | | | 4.12 | | | | | | | | | |
Barclays 20+ Year Treasury Index8 | | | | | | | | | | | | | | | | | | | | | | | (5.02 | ) | | | 26.84 | | | | 9.46 | | | | 8.69 | | | | | | | | | |
| * | Returns for periods of less than one year are not annualized. |
| ** | Class B shares are closed to investment, except in connection with the reinvestment of any distributions and permitted exchanges. |
Figures quoted represent past performance, which is no guarantee of future results and do not reflect the deduction of taxes that a shareholder may pay on fund distributions or the redemption of fund shares. Investment return and principal value of an investment will fluctuate so that an investor’s shares, when redeemed, may be worth more or less than their original cost. Performance shown without sales charges would be lower if sales charges were reflected. Current performance may be lower or higher than the performance data quoted and assumes the reinvestment of dividends and capital gains. Current month-end performance is available on the Fund’s Web site – wellsfargoadvantagefunds.com
Index returns do not include transaction costs associated with buying and selling securities, any mutual fund fees or expenses or any taxes. It is not possible to invest directly in an index.
For Class A shares, the maximum front-end sales charge is 5.75%. For Class B shares, the maximum contingent deferred sales charge is 5.00%. For Class C shares, the maximum contingent deferred sales charge is 1.00%. Performance including sales charge assumes the sales charge for the corresponding time period. Administrator Class shares are sold without a front-end sales charge or contingent deferred sales charge.
Balanced funds may invest in stocks and bonds. Stock values fluctuate in response to the activities of individual companies and general market and economic conditions. Bond values fluctuate in response to the financial condition of individual issuers, general market and economic conditions, and changes in interest rates. In general, when interest rates rise, bond values fall and investors may lose principal value. The use of derivatives may reduce returns and/or increase volatility. Consult the Fund’s prospectus for additional information on these and other risks.
| 4. | Reflects the expense ratios as stated in the most recent prospectuses. |
| 5. | The Adviser has committed through January 31, 2013 to waive fees and/or reimburse expenses to the extent necessary to cap the Fund’s Total Annual Fund Operating Expenses After Fee Waiver, excluding certain expenses, at the amounts shown above. Without this cap, the Fund’s returns would have been lower. |
| 6. | Source: Wells Fargo Funds Management, LLC. The Index Asset Allocation Composite Index is weighted 60% in the S&P 500 Index and 40% in the Barclays 20+ Year Treasury Index (a subset of the Barclays U.S. Treasury Index, which contains public obligations of the U.S. Treasury with a remaining maturity of one year or more). You cannot invest directly in an index. |
| 7. | The S&P 500 Index consists of 500 stocks chosen for market size, liquidity, and industry group representation. It is a market-value weighted index with each stock’s weight in the index proportionate to its market value. You cannot invest directly in an index. |
| 8. | The Barclays 20+ Year Treasury Index is an unmanaged index composed of securities in the U.S. Treasury Index with maturities of 20 years or greater. You cannot invest directly in an index. |
| | | | |
| 8 | | Wells Fargo Advantage Index Asset Allocation Fund | | Fund Expenses (Unaudited) |
As a shareholder of the Fund, you incur two types of costs: (1) transaction costs, including sales charges (loads) on purchase payments and contingent deferred sales charges (if any) on redemptions and (2) ongoing costs, including management fees; distribution (12b-1) and/or shareholder service fees; and other Fund expenses. This example is intended to help you understand your ongoing costs (in dollars) of investing in the Fund and to compare these costs with the ongoing costs of investing in other mutual funds.
The example is based on an investment of $1,000 invested at the beginning of the six-month period and held for the entire period from October 1, 2011 to March 31, 2012.
Actual Expenses
The “Actual” line of the table below provides information about actual account values and actual expenses. You may use the information in this line, together with the amount you invested, to estimate the expenses that you paid over the period. Simply divide your account value by $1,000 (for example, an $8,600 account value divided by $1,000 = 8.6), then multiply the result by the number in the “Actual” line under the heading entitled “Expenses Paid During Period” for your applicable class of shares to estimate the expenses you paid on your account during this period.
Hypothetical Example for Comparison Purposes
The “Hypothetical” line of the table below provides information about hypothetical account values and hypothetical expenses based on the Fund’s actual expense ratio and an assumed rate of return of 5% per year before expenses, which is not the Fund’s actual return. The hypothetical account values and expenses may not be used to estimate the actual ending account balance or expenses you paid for the period. You may use this information to compare the ongoing costs of investing in the Fund and other funds. To do so, compare this 5% hypothetical example with the 5% hypothetical examples that appear in the shareholder reports of the other funds.
Please note that the expenses shown in the table are meant to highlight your ongoing costs only and do not reflect any transactional costs, such as sales charges (loads) and contingent deferred sales charges. Therefore, the “Hypothetical” line of the table is useful in comparing ongoing costs only, and will not help you determine the relative total costs of owning different funds. In addition, if these transactional costs were included, your costs would have been higher.
| | | | | | | | | | | | | | | | |
| | | Beginning
Account Value
10-01-2011 | | | Ending
Account Value
03-31-2012 | | | Expenses
Paid During
the Period¹ | | | Net Annual
Expense Ratio | |
Class A | | | | | | | | | | | | | | | | |
Actual | | $ | 1,000.00 | | | $ | 1,184.58 | | | $ | 6.28 | | | | 1.15 | % |
Hypothetical (5% return before expenses) | | $ | 1,000.00 | | | $ | 1,019.25 | | | $ | 5.81 | | | | 1.15 | % |
Class B | | | | | | | | | | | | | | | | |
Actual | | $ | 1,000.00 | | | $ | 1,179.12 | | | $ | 10.35 | | | | 1.90 | % |
Hypothetical (5% return before expenses) | | $ | 1,000.00 | | | $ | 1,015.50 | | | $ | 9.57 | | | | 1.90 | % |
Class C | | | | | | | | | | | | | | | | |
Actual | | $ | 1,000.00 | | | $ | 1,180.34 | | | $ | 10.36 | | | | 1.90 | % |
Hypothetical (5% return before expenses) | | $ | 1,000.00 | | | $ | 1,015.50 | | | $ | 9.57 | | | | 1.90 | % |
Administrator Class | | | | | | | | | | | | | | | | |
Actual | | $ | 1,000.00 | | | $ | 1,185.88 | | | $ | 4.92 | | | | 0.90 | % |
Hypothetical (5% return before expenses) | | $ | 1,000.00 | | | $ | 1,020.50 | | | $ | 4.55 | | | | 0.90 | % |
| 1. | Expenses paid is equal to the annualized expense ratio of each class multiplied by the average account value over the period, multiplied by the number of days in the most recent fiscal half-year divided by the number of days in the fiscal year (to reflect the one-half year period). |
| | | | | | |
| Portfolio of Investments—March 31, 2012 (Unaudited) | | Wells Fargo Advantage Index Asset Allocation Fund | | | 9 | |
| | | | | | | | | | | | | | | | |
| Security Name | | Interest Rate | | | Maturity Date | | | Principal | | | Value | |
| | | | | | | | | | | | | | | | |
| | | | |
| Agency Securities: 0.03% | | | | | | | | | | | | | �� | | | |
FHLMC | | | 10.50 | % | | | 01/01/2016 | | | $ | 459 | | | $ | 514 | |
FNMA Grantor Trust Series 2002-T1 Class A4 | | | 9.50 | | | | 11/25/2031 | | | | 149,142 | | | | 180,805 | |
| | | | |
Total Agency Securities (Cost $161,102) | | | | | | | | | | | | | | | 181,319 | |
| | | | | | | | | | | | | | | | |
| | | | |
| | | | | | | | | Shares | | | | |
| Common Stocks: 61.36% | | | | | | | | | | | | | | | | |
| | | | |
Consumer Discretionary: 6.78% | | | | | | | | | | | | | | | | |
| | | | |
| Auto Components: 0.17% | | | | | | | | | | | | | | | | |
BorgWarner Incorporated Ǡ | | | | | | | | | | | 3,636 | | | | 306,660 | |
Johnson Controls Incorporated | | | | | | | | | | | 22,682 | | | | 736,711 | |
The Goodyear Tire & Rubber Company † | | | | | | | | | | | 8,148 | | | | 91,421 | |
| | | | |
| | | | | | | | | | | | | | | 1,134,792 | |
| | | | | | | | | | | | | | | | |
| | | | |
| Automobiles: 0.28% | | | | | | | | | | | | | | | | |
Ford Motor Company « | | | | | | | | | | | 126,640 | | | | 1,581,734 | |
Harley-Davidson Incorporated | | | | | | | | | | | 7,615 | | | | 373,744 | |
| | | | |
| | | | | | | | | | | | | | | 1,955,478 | |
| | | | | | | | | | | | | | | | |
| | | | |
| Distributors: 0.05% | | | | | | | | | | | | | | | | |
Genuine Parts Company | | | | | | | | | | | 5,190 | | | | 325,673 | |
| | | | | | | | | | | | | | | | |
| | | | |
| Diversified Consumer Services: 0.05% | | | | | | | | | | | | | | | | |
Apollo Group Incorporated Class A † | | | | | | | | | | | 3,747 | | | | 144,784 | |
DeVry Incorporated | | | | | | | | | | | 1,990 | | | | 67,401 | |
H&R Block Incorporated « | | | | | | | | | | | 9,759 | | | | 160,731 | |
| | | | |
| | | | | | | | | | | | | | | 372,916 | |
| | | | | | | | | | | | | | | | |
| | | | |
| Hotels, Restaurants & Leisure: 1.21% | | | | | | | | | | | | | | | | |
Carnival Corporation | | | | | | | | | | | 15,091 | | | | 484,119 | |
Chipotle Mexican Grill Incorporated Ǡ | | | | | | | | | | | 1,041 | | | | 435,138 | |
Darden Restaurants Incorporated | | | | | | | | | | | 4,279 | | | | 218,914 | |
International Game Technology | | | | | | | | | | | 9,912 | | | | 166,422 | |
Marriott International Incorporated Class A | | | | | | | | | | | 8,899 | | | | 336,827 | |
McDonald’s Corporation | | | | | | | | | | | 33,938 | | | | 3,329,318 | |
Starbucks Corporation | | | | | | | | | | | 25,103 | | | | 1,403,007 | |
Starwood Hotels & Resorts Worldwide Incorporated | | | | | | | | | | | 6,534 | | | | 368,583 | |
Wyndham Worldwide Corporation | | | | | | | | | | | 4,862 | | | | 226,132 | |
Wynn Resorts Limited | | | | | | | | | | | 2,646 | | | | 330,432 | |
Yum! Brands Incorporated | | | | | | | | | | | 15,340 | | | | 1,091,901 | |
| | | | |
| | | | | | | | | | | | | | | 8,390,793 | |
| | | | | | | | | | | | | | | | |
| | | | |
| Household Durables: 0.20% | | | | | | | | | | | | | | | | |
D.R. Horton Incorporated | | | | | | | | | | | 9,290 | | | | 140,929 | |
Harman International Industries Incorporated | | | | | | | | | | | 2,338 | | | | 109,442 | |
Leggett & Platt Incorporated « | | | | | | | | | | | 4,665 | | | | 107,342 | |
Lennar Corporation « | | | | | | | | | | | 5,407 | | | | 146,962 | |
Newell Rubbermaid Incorporated | | | | | | | | | | | 9,609 | | | | 171,136 | |
The accompanying notes are an integral part of these financial statements.
| | | | |
| 10 | | Wells Fargo Advantage Index Asset Allocation Fund | | Portfolio of Investments—March 31, 2012 (Unaudited) |
| | | | | | | | | | | | |
| Security Name | | | | | | Shares | | | Value | |
| | | | | | | | | | | | |
| | | | |
| Household Durables (continued) | | | | | | | | | | | | |
Pulte Homes Incorporated † | | | | | | | 11,218 | | | $ | 99,279 | |
Stanley Black & Decker Incorporated | | | | | | | 5,649 | | | | 434,747 | |
Whirlpool Corporation « | | | | | | | 2,552 | | | | 196,147 | |
| | | | |
| | | | | | | | | | | 1,405,984 | |
| | | | | | | | | | | | |
| | | | |
| Internet & Catalog Retail: 0.59% | | | | | | | | | | | | |
Amazon.com Incorporated † | | | | | | | 12,130 | | | | 2,456,446 | |
Expedia Incorporated « | | | | | | | 3,161 | | | | 105,704 | |
Netflix Incorporated Ǡ | | | | | | | 1,846 | | | | 212,364 | |
priceline.com Incorporated † | | | | | | | 1,659 | | | | 1,190,333 | |
TripAdvisor Incorporated † | | | | | | | 3,157 | | | | 112,610 | |
| | | | |
| | | | | | | | | | | 4,077,457 | |
| | | | | | | | | | | | |
| | | | |
| Leisure Equipment & Products: 0.08% | | | | | | | | | | | | |
Hasbro Incorporated | | | | | | | 3,857 | | | | 141,629 | |
Mattel Incorporated | | | | | | | 11,295 | | | | 380,190 | |
| | | | |
| | | | | | | | | | | 521,819 | |
| | | | | | | | | | | | |
| | | | |
| Media: 1.95% | | | | | | | | | | | | |
Cablevision Systems Corporation New York Group Class A | | | | | | | 7,220 | | | | 105,990 | |
CBS Corporation Class B | | | | | | | 21,627 | | | | 733,372 | |
Comcast Corporation Class A | | | | | | | 89,846 | | | | 2,696,278 | |
DIRECTV Group Incorporated † | | | | | | | 22,533 | | | | 1,111,778 | |
Discovery Communications Incorporated Class C Ǡ | | | | | | | 8,613 | | | | 435,818 | |
Gannett Company Incorporated | | | | | | | 7,894 | | | | 121,015 | |
Interpublic Group of Companies Incorporated | | | | | | | 14,864 | | | | 169,598 | |
McGraw-Hill Companies Incorporated | | | | | | | 9,262 | | | | 448,929 | |
News Corporation Class A | | | | | | | 71,718 | | | | 1,412,127 | |
Omnicom Group Incorporated | | | | | | | 9,089 | | | | 460,358 | |
Scripps Networks Interactive Incorporated | | | | | | | 3,180 | | | | 154,834 | |
Time Warner Cable Incorporated | | | | | | | 10,466 | | | | 852,979 | |
Time Warner Incorporated | | | | | | | 32,308 | | | | 1,219,627 | |
Viacom Incorporated Class B | | | | | | | 17,997 | | | | 854,138 | |
Walt Disney Company | | | | | | | 59,721 | | | | 2,614,585 | |
Washington Post Company Class B « | | | | | | | 159 | | | | 59,398 | |
| | | | |
| | | | | | | | | | | 13,450,824 | |
| | | | | | | | | | | | |
| | | | |
| Multiline Retail: 0.51% | | | | | | | | | | | | |
Big Lots Incorporated † | | | | | | | 2,185 | | | | 93,999 | |
Dollar Tree Incorporated † | | | | | | | 3,965 | | | | 374,653 | |
Family Dollar Stores Incorporated | | | | | | | 3,923 | | | | 248,247 | |
JCPenney Company Incorporated « | | | | | | | 4,819 | | | | 170,737 | |
Kohl’s Corporation | | | | | | | 8,444 | | | | 422,453 | |
Macy’s Incorporated | | | | | | | 13,801 | | | | 548,314 | |
Nordstrom Incorporated | | | | | | | 5,326 | | | | 296,765 | |
Sears Holdings Corporation Ǡ | | | | | | | 1,275 | | | | 84,469 | |
Target Corporation | | | | | | | 22,377 | | | | 1,303,908 | |
| | | | |
| | | | | | | | | | | 3,543,545 | |
| | | | | | | | | | | | |
The accompanying notes are an integral part of these financial statements.
| | | | | | |
| Portfolio of Investments—March 31, 2012 (Unaudited) | | Wells Fargo Advantage Index Asset Allocation Fund | | | 11 | |
| | | | | | | | | | | | |
| Security Name | | | | | | Shares | | | Value | |
| | | | | | | | | | | | |
| | | | |
| Specialty Retail: 1.27% | | | | | | | | | | | | |
Abercrombie & Fitch Company Class A | | | | | | | 2,853 | | | $ | 141,537 | |
AutoNation Incorporated Ǡ | | | | | | | 1,494 | | | | 51,259 | |
AutoZone Incorporated † | | | | | | | 908 | | | | 337,594 | |
Bed Bath & Beyond Incorporated † | | | | | | | 7,888 | | | | 518,794 | |
Best Buy Company Incorporated « | | | | | | | 9,454 | | | | 223,871 | |
CarMax Incorporated † | | | | | | | 7,549 | | | | 261,573 | |
GameStop Corporation Class A « | | | | | | | 4,545 | | | | 99,263 | |
Gap Incorporated | | | | | | | 11,063 | | | | 289,187 | |
Home Depot Incorporated | | | | | | | 51,364 | | | | 2,584,123 | |
Limited Brands Incorporated | | | | | | | 8,195 | | | | 393,360 | |
Lowe’s Companies Incorporated | | | | | | | 41,349 | | | | 1,297,532 | |
O’Reilly Automotive Incorporated † | | | | | | | 4,242 | | | | 387,507 | |
Ross Stores Incorporated | | | | | | | 7,618 | | | | 442,606 | |
Staples Incorporated | | | | | | | 23,127 | | | | 374,195 | |
Tiffany & Company | | | | | | | 4,230 | | | | 292,420 | |
TJX Companies Incorporated | | | | | | | 25,132 | | | | 997,992 | |
Urban Outfitters Incorporated Ǡ | | | | | | | 3,699 | | | | 107,678 | |
| | | | |
| | | | | | | | | | | 8,800,491 | |
| | | | | | | | | | | | |
| | | | |
| Textiles, Apparel & Luxury Goods: 0.42% | | | | | | | | | | | | |
Coach Incorporated | | | | | | | 9,588 | | | | 740,961 | |
Nike Incorporated Class B | | | | | | | 12,232 | | | | 1,326,438 | |
Ralph Lauren Corporation | | | | | | | 2,153 | | | | 375,332 | |
VF Corporation | | | | | | | 2,911 | | | | 424,948 | |
| | | | |
| | | | | | | | | | | 2,867,679 | |
| | | | | | | | | | | | |
| | | | |
Consumer Staples: 6.60% | | | | | | | | | | | | |
| | | | |
| Beverages: 1.53% | | | | | | | | | | | | |
Beam Incorporated | | | | | | | 5,221 | | | | 305,794 | |
Brown-Forman Corporation Class B | | | | | | | 3,309 | | | | 275,938 | |
Coca-Cola Enterprises Incorporated | | | | | | | 10,006 | | | | 286,172 | |
Constellation Brands Incorporated Class A † | | | | | | | 5,721 | | | | 134,958 | |
Dr Pepper Snapple Group Incorporated « | | | | | | | 7,066 | | | | 284,124 | |
Molson Coors Brewing Company | | | | | | | 5,233 | | | | 236,793 | |
PepsiCo Incorporated | | | | | | | 52,334 | | | | 3,472,361 | |
The Coca-Cola Company | | | | | | | 75,409 | | | | 5,581,020 | |
| | | | |
| | | | | | | | | | | 10,577,160 | |
| | | | | | | | | | | | |
| | | | |
| Food & Staples Retailing: 1.37% | | | | | | | | | | | | |
Costco Wholesale Corporation | | | | | | | 14,491 | | | | 1,315,783 | |
CVS Caremark Corporation | | | | | | | 43,395 | | | | 1,944,096 | |
Kroger Company | | | | | | | 19,151 | | | | 464,029 | |
Safeway Incorporated « | | | | | | | 8,929 | | | | 180,455 | |
SUPERVALU Incorporated « | | | | | | | 7,072 | | | | 40,381 | |
Sysco Corporation | | | | | | | 19,477 | | | | 581,583 | |
Wal-Mart Stores Incorporated | | | | | | | 58,196 | | | | 3,561,595 | |
Walgreen Company | | | | | | | 29,104 | | | | 974,693 | |
Whole Foods Market Incorporated | | | | | | | 5,408 | | | | 449,946 | |
| | | | |
| | | | | | | | | | | 9,512,561 | |
| | | | | | | | | | | | |
The accompanying notes are an integral part of these financial statements.
| | | | |
| 12 | | Wells Fargo Advantage Index Asset Allocation Fund | | Portfolio of Investments—March 31, 2012 (Unaudited) |
| | | | | | | | | | | | |
| Security Name | | | | | | Shares | | | Value | |
| | | | | | | | | | | | |
| | | | | | | | | | | | |
| | | | |
| Food Products: 1.10% | | | | | | | | | | | | |
Archer Daniels Midland Company | | | | | | | 22,045 | | | $ | 697,945 | |
Campbell Soup Company « | | | | | | | 5,947 | | | | 201,306 | |
ConAgra Foods Incorporated | | | | | | | 13,747 | | | | 360,996 | |
Dean Foods Company † | | | | | | | 6,138 | | | | 74,331 | |
General Mills Incorporated | | | | | | | 21,479 | | | | 847,347 | |
H.J. Heinz Company « | | | | | | | 10,658 | | | | 570,736 | |
Hormel Foods Corporation « | | | | | | | 4,574 | | | | 135,024 | |
JM Smucker Company | | | | | | | 3,777 | | | | 307,297 | |
Kellogg Company | | | | | | | 8,211 | | | | 440,356 | |
Kraft Foods Incorporated Class A | | | | | | | 58,917 | | | | 2,239,435 | |
McCormick & Company Incorporated | | | | | | | 4,433 | | | | 241,288 | |
Mead Johnson & Company | | | | | | | 6,785 | | | | 559,627 | |
Sara Lee Corporation | | | | | | | 19,711 | | | | 424,378 | |
The Hershey Company | | | | | | | 5,109 | | | | 313,335 | |
Tyson Foods Incorporated Class A | | | | | | | 9,712 | | | | 185,985 | |
| | | | |
| | | | | | | | | | | 7,599,386 | |
| | | | | | | | | | | | |
| | | | |
| Household Products: 1.30% | | | | | | | | | | | | |
Clorox Company | | | | | | | 4,324 | | | | 297,275 | |
Colgate-Palmolive Company | | | | | | | 15,979 | | | | 1,562,427 | |
Kimberly-Clark Corporation | | | | | | | 13,117 | | | | 969,215 | |
Procter & Gamble Company | | | | | | | 91,776 | | | | 6,168,265 | |
| | | | |
| | | | | | | | | | | 8,997,182 | |
| | | | | | | | | | | | |
| | | | |
| Personal Products: 0.11% | | | | | | | | | | | | |
Avon Products Incorporated | | | | | | | 14,359 | | | | 277,990 | |
Estee Lauder Companies Incorporated Class A | | | | | | | 7,492 | | | | 464,054 | |
| | | | |
| | | | | | | | | | | 742,044 | |
| | | | | | | | | | | | |
| | | | |
| Tobacco: 1.19% | | | | | | | | | | | | |
Altria Group Incorporated | | | | | | | 68,161 | | | | 2,104,130 | |
Lorillard Incorporated | | | | | | | 4,398 | | | | 569,453 | |
Philip Morris International | | | | | | | 57,372 | | | | 5,083,733 | |
Reynolds American Incorporated | | | | | | | 11,134 | | | | 461,393 | |
| | | | |
| | | | | | | | | | | 8,218,709 | |
| | | | | | | | | | | | |
| | | | |
Energy: 6.90% | | | | | | | | | | | | |
| | | | |
| Energy Equipment & Services: 1.11% | | | | | | | | | | | | |
Baker Hughes Incorporated | | | | | | | 14,579 | | | | 611,443 | |
Cameron International Corporation † | | | | | | | 8,202 | | | | 433,312 | |
Diamond Offshore Drilling Incorporated « | | | | | | | 2,316 | | | | 154,593 | |
FMC Technologies Incorporated Ǡ | | | | | | | 7,966 | | | | 401,646 | |
Halliburton Company | | | | | | | 30,753 | | | | 1,020,692 | |
Helmerich & Payne Incorporated « | | | | | | | 3,578 | | | | 193,033 | |
Nabors Industries Limited † | | | | | | | 9,618 | | | | 168,219 | |
National Oilwell Varco Incorporated | | | | | | | 14,135 | | | | 1,123,308 | |
Noble Corporation « | | | | | | | 8,402 | | | | 314,823 | |
Rowan Companies Incorporated Ǡ | | | | | | | 4,117 | | | | 135,573 | |
Schlumberger Limited | | | | | | | 44,441 | | | | 3,107,759 | |
| | | | |
| | | | | | | | | | | 7,664,401 | |
| | | | | | | | | | | | |
The accompanying notes are an integral part of these financial statements.
| | | | | | |
| Portfolio of Investments—March 31, 2012 (Unaudited) | | Wells Fargo Advantage Index Asset Allocation Fund | | | 13 | |
| | | | | | | | | | | | |
| Security Name | | | | | | Shares | | | Value | |
| | | | | | | | | | | | |
| | | | |
| Oil, Gas & Consumable Fuels: 5.79% | | | | | | | | | | | | |
Alpha Natural Resources Incorporated † | | | | | | | 7,330 | | | $ | 111,489 | |
Anadarko Petroleum Corporation | | | | | | | 16,607 | | | | 1,300,992 | |
Apache Corporation | | | | | | | 12,805 | | | | 1,286,134 | |
Cabot Oil & Gas Corporation | | | | | | | 6,991 | | | | 217,909 | |
Chesapeake Energy Corporation « | | | | | | | 22,074 | | | | 511,455 | |
Chevron Corporation | | | | | | | 65,872 | | | | 7,064,113 | |
ConocoPhillips Company | | | | | | | 42,639 | | | | 3,240,990 | |
CONSOL Energy Incorporated | | | | | | | 7,566 | | | | 258,001 | |
Denbury Resources Incorporated † | | | | | | | 13,004 | | | | 237,063 | |
Devon Energy Corporation | | | | | | | 13,464 | | | | 957,560 | |
El Paso Corporation | | | | | | | 25,751 | | | | 760,942 | |
EOG Resources Incorporated | | | | | | | 8,965 | | | | 996,012 | |
EQT Corporation | | | | | | | 4,980 | | | | 240,086 | |
Exxon Mobil Corporation | | | | | | | 157,044 | | | | 13,620,426 | |
Hess Corporation | | | | | | | 10,081 | | | | 594,275 | |
Marathon Oil Corporation | | | | | | | 23,454 | | | | 743,492 | |
Marathon Petroleum Corporation | | | | | | | 11,582 | | | | 502,196 | |
Murphy Oil Corporation | | | | | | | 6,459 | | | | 363,448 | |
Newfield Exploration Company † | | | | | | | 4,414 | | | | 153,078 | |
Noble Energy Incorporated | | | | | | | 5,895 | | | | 576,413 | |
Occidental Petroleum Corporation | | | | | | | 27,024 | | | | 2,573,496 | |
Peabody Energy Corporation | | | | | | | 9,071 | | | | 262,696 | |
Pioneer Natural Resources Company | | | | | | | 4,107 | | | | 458,300 | |
QEP Resources Incorporated | | | | | | | 5,914 | | | | 180,377 | |
Range Resources Corporation | | | | | | | 5,259 | | | | 305,758 | |
Southwestern Energy Company † | | | | | | | 11,630 | | | | 355,878 | |
Spectra Energy Corporation | | | | | | | 21,696 | | | | 684,509 | |
Sunoco Incorporated | | | | | | | 3,559 | | | | 135,776 | |
Tesoro Petroleum Corporation † | | | | | | | 4,631 | | | | 124,296 | |
The Williams Companies Incorporated | | | | | | | 19,731 | | | | 607,912 | |
Valero Energy Corporation | | | | | | | 18,494 | | | | 476,590 | |
WPX Energy Incorporated † | | | | | | | 6,618 | | | | 119,190 | |
| | | | |
| | | | | | | | | | | 40,020,852 | |
| | | | | | | | | | | | |
| | | | |
Financials: 9.72% | | | | | | | | | | | | |
| | | | |
| Capital Markets: 1.24% | | | | | | | | | | | | |
Ameriprise Financial Incorporated | | | | | | | 7,393 | | | | 422,362 | |
Bank of New York Mellon Corporation | | | | | | | 40,143 | | | | 968,651 | |
BlackRock Incorporated | | | | | | | 3,344 | | | | 685,186 | |
Charles Schwab Corporation | | | | | | | 36,006 | | | | 517,406 | |
E*TRADE Financial Corporation † | | | | | | | 8,460 | | | | 92,637 | |
Federated Investors Incorporated Class B « | | | | | | | 3,076 | | | | 68,933 | |
Franklin Resources Incorporated | | | | | | | 4,748 | | | | 588,894 | |
Goldman Sachs Group Incorporated | | | | | | | 16,490 | | | | 2,050,861 | |
Invesco Limited | | | | | | | 14,865 | | | | 396,450 | |
Legg Mason Incorporated | | | | | | | 4,143 | | | | 115,714 | |
Morgan Stanley | | | | | | | 50,764 | | | | 997,005 | |
Northern Trust Corporation | | | | | | | 8,033 | | | | 381,166 | |
State Street Corporation | | | | | | | 16,255 | | | | 739,603 | |
T. Rowe Price Group Incorporated | | | | | | | 8,446 | | | | 551,524 | |
| | | | |
| | | | | | | | | | | 8,576,392 | |
| | | | | | | | | | | | |
The accompanying notes are an integral part of these financial statements.
| | | | |
| 14 | | Wells Fargo Advantage Index Asset Allocation Fund | | Portfolio of Investments—March 31, 2012 (Unaudited) |
| | | | | | | | | | | | |
| Security Name | | | | | | Shares | | | Value | |
| | | | | | | | | | | | |
| | | | |
| Commercial Banks: 1.78% | | | | | | | | | | | | |
Branch Banking & Trust Corporation | | | | | | | 23,231 | | | $ | 729,221 | |
Comerica Incorporated | | | | | | | 6,584 | | | | 213,058 | |
Fifth Third Bancorp | | | | | | | 30,650 | | | | 430,633 | |
First Horizon National Corporation | | | | | | | 8,543 | | | | 88,676 | |
Huntington Bancshares Incorporated | | | | | | | 28,800 | | | | 185,760 | |
KeyCorp | | | | | | | 31,754 | | | | 269,909 | |
M&T Bank Corporation « | | | | | | | 4,211 | | | | 365,852 | |
PNC Financial Services Group Incorporated | | | | | | | 17,579 | | | | 1,133,670 | |
Regions Financial Corporation | | | | | | | 46,917 | | | | 309,183 | |
SunTrust Banks Incorporated | | | | | | | 17,737 | | | | 428,703 | |
US Bancorp | | | | | | | 63,671 | | | | 2,017,097 | |
Wells Fargo & Company (l) | | | | | | | 175,704 | | | | 5,998,535 | |
Zions Bancorporation | | | | | | | 6,135 | | | | 131,657 | |
| | | | |
| | | | | | | | | | | 12,301,954 | |
| | | | | | | | | | | | |
| | | | |
| Consumer Finance: 1.11% | | | | | | | | | | | | |
American Express Company | | | | | | | 33,814 | | | | 1,956,478 | |
Capital One Financial Corporation | | | | | | | 18,440 | | | | 1,027,846 | |
Discover Financial Services | | | | | | | 17,659 | | | | 588,751 | |
MasterCard Incorporated | | | | | | | 3,540 | | | | 1,488,712 | |
SLM Corporation | | | | | | | 16,970 | | | | 267,447 | |
Visa Incorporated Class A | | | | | | | 16,574 | | | | 1,955,732 | |
Western Union Company | | | | | | | 20,669 | | | | 363,774 | |
| | | | |
| | | | | | | | | | | 7,648,740 | |
| | | | | | | | | | | | |
| | | | |
| Diversified Financial Services: 2.80% | | | | | | | | | | | | |
Bank of America Corporation | | | | | | | 357,602 | | | | 3,422,251 | |
Berkshire Hathaway Incorporated Class B † | | | | | | | 58,582 | | | | 4,753,929 | |
Citigroup Incorporated | | | | | | | 97,582 | | | | 3,566,622 | |
CME Group Incorporated | | | | | | | 2,213 | | | | 640,287 | |
InterContinental Exchange Incorporated † | | | | | | | 2,418 | | | | 332,282 | |
JPMorgan Chase & Company | | | | | | | 127,194 | | | | 5,848,380 | |
Leucadia National Corporation « | | | | | | | 6,601 | | | | 172,286 | |
Moody’s Corporation « | | | | | | | 6,535 | | | | 275,124 | |
NASDAQ Stock Market Incorporated † | | | | | | | 4,159 | | | | 107,718 | |
NYSE Euronext Incorporated | | | | | | | 8,606 | | | | 258,266 | |
| | | | |
| | | | | | | | | | | 19,377,145 | |
| | | | | | | | | | | | |
| | | | |
| Insurance: 1.49% | | | | | | | | | | | | |
ACE Limited | | | | | | | 11,233 | | | | 822,256 | |
AFLAC Incorporated | | | | | | | 15,563 | | | | 715,742 | |
Allstate Corporation | | | | | | | 16,603 | | | | 546,571 | |
American International Group Incorporated † | | | | | | | 17,926 | | | | 552,659 | |
AON Corporation † | | | | | | | 10,834 | | | | 531,516 | |
Assurant Incorporated | | | | | | | 2,915 | | | | 118,058 | |
Chubb Corporation | | | | | | | 9,033 | | | | 624,271 | |
Cincinnati Financial Corporation « | | | | | | | 5,407 | | | | 186,596 | |
Genworth Financial Incorporated † | | | | | | | 16,372 | | | | 136,215 | |
Hartford Financial Services Group Incorporated | | | | | | | 14,668 | | | | 309,201 | |
The accompanying notes are an integral part of these financial statements.
| | | | | | |
| Portfolio of Investments—March 31, 2012 (Unaudited) | | Wells Fargo Advantage Index Asset Allocation Fund | | | 15 | |
| | | | | | | | | | | | |
| Security Name | | | | | | Shares | | | Value | |
| | | | | | | | | | | | |
| | | | |
| Insurance (continued) | | | | | | | | | | | | |
Lincoln National Corporation | | | | | | | 9,707 | | | $ | 255,877 | |
Loews Corporation | | | | | | | 10,180 | | | | 405,877 | |
Marsh & McLennan Companies Incorporated | | | | | | | 18,106 | | | | 593,696 | |
MetLife Incorporated | | | | | | | 35,329 | | | | 1,319,538 | |
Principal Financial Group Incorporated | | | | | | | 10,044 | | | | 296,398 | |
Prudential Financial Incorporated | | | | | | | 15,660 | | | | 992,687 | |
The Progressive Corporation « | | | | | | | 20,375 | | | | 472,293 | |
The Travelers Companies Incorporated | | | | | | | 13,097 | | | | 775,342 | |
Torchmark Corporation | | | | | | | 3,338 | | | | 166,399 | |
UnumProvident Corporation | | | | | | | 9,683 | | | | 237,040 | |
XL Group plc | | | | | | | 10,517 | | | | 228,114 | |
| | | | |
| | | | | | | | | | | 10,286,346 | |
| | | | | | | | | | | | |
| | | | |
| Real Estate Management & Development: 0.03% | | | | | | | | | | | | |
CBRE Group Incorporated † | | | | | | | 10,927 | | | | 218,103 | |
| | | | | | | | | | | | |
| | | | |
| REITs: 1.23% | | | | | | | | | | | | |
American Tower Corporation | | | | | | | 13,118 | | | | 826,696 | |
Apartment Investment & Management Company Class A | | | | | | | 4,036 | | | | 106,591 | |
AvalonBay Communities Incorporated « | | | | | | | 3,172 | | | | 448,362 | |
Boston Properties Incorporated | | | | | | | 4,940 | | | | 518,651 | |
Equity Residential Corporation | | | | | | | 10,003 | | | | 626,388 | |
HCP Incorporated « | | | | | | | 13,645 | | | | 538,432 | |
Health Care REIT Incorporated | | | | | | | 7,006 | | | | 385,050 | |
Host Hotels & Resorts Incorporated « | | | | | | | 23,575 | | | | 387,102 | |
Kimco Realty Corporation « | | | | | | | 13,560 | | | | 261,166 | |
Plum Creek Timber Company « | | | | | | | 5,378 | | | | 223,510 | |
Prologis Incorporated | | | | | | | 15,292 | | | | 550,818 | |
Public Storage Incorporated | | | | | | | 4,737 | | | | 654,511 | |
Simon Property Group Incorporated | | | | | | | 10,205 | | | | 1,486,664 | |
Ventas Incorporated | | | | | | | 9,626 | | | | 549,645 | |
Vornado Realty Trust | | | | | | | 6,166 | | | | 519,177 | |
Weyerhaeuser Company | | | | | | | 17,876 | | | | 391,842 | |
| | | | |
| | | | | | | | | | | 8,474,605 | |
| | | | | | | | | | | | |
| | | | |
| Thrifts & Mortgage Finance: 0.04% | | | | | | | | | | | | |
Hudson City Bancorp Incorporated | | | | | | | 17,578 | | | | 128,495 | |
People’s United Financial Incorporated | | | | | | | 11,967 | | | | 158,443 | |
| | | | |
| | | | | | | | | | | 286,938 | |
| | | | | | | | | | | | |
| | | | |
Health Care: 6.94% | | | | | | | | | | | | |
| | | | |
| Biotechnology: 0.75% | | | | | | | | | | | | |
Amgen Incorporated | | | | | | | 26,370 | | | | 1,792,896 | |
Biogen Idec Incorporated † | | | | | | | 7,954 | | | | 1,001,965 | |
Celgene Corporation † | | | | | | | 14,621 | | | | 1,133,420 | |
Gilead Sciences Incorporated † | | | | | | | 25,233 | | | | 1,232,632 | |
| | | | |
| | | | | | | | | | | 5,160,913 | |
| | | | | | | | | | | | |
The accompanying notes are an integral part of these financial statements.
| | | | |
| 16 | | Wells Fargo Advantage Index Asset Allocation Fund | | Portfolio of Investments—March 31, 2012 (Unaudited) |
| | | | | | | | | | | | |
| Security Name | | | | | | Shares | | | Value | |
| | | | | | | | | | | | |
| | | | |
| Health Care Equipment & Supplies: 1.09% | | | | | | | | | | | | |
Baxter International Incorporated | | | | | | | 18,670 | | | $ | 1,116,093 | |
Becton Dickinson & Company « | | | | | | | 7,000 | | | | 543,550 | |
Boston Scientific Corporation † | | | | | | | 48,358 | | | | 289,181 | |
C.R. Bard Incorporated | | | | | | | 2,800 | | | | 276,416 | |
CareFusion Corporation † | | | | | | | 7,488 | | | | 194,164 | |
Covidien plc | | | | | | | 16,104 | | | | 880,567 | |
DENTSPLY International Incorporated « | | | | | | | 4,732 | | | | 189,895 | |
Edwards Lifesciences Corporation † | | | | | | | 3,831 | | | | 278,629 | |
Intuitive Surgical Incorporated † | | | | | | | 1,309 | | | | 709,151 | |
Medtronic Incorporated | | | | | | | 34,672 | | | | 1,358,796 | |
St. Jude Medical Incorporated | | | | | | | 10,677 | | | | 473,098 | |
Stryker Corporation | | | | | | | 10,791 | | | | 598,685 | |
Varian Medical Systems Incorporated Ǡ | | | | | | | 3,764 | | | | 259,565 | |
Zimmer Holdings Incorporated | | | | | | | 5,935 | | | | 381,502 | |
| | | | |
| | | | | | | | | | | 7,549,292 | |
| | | | | | | | | | | | |
| | | | |
| Health Care Providers & Services: 1.30% | | | | | | | | | | | | |
Aetna Incorporated | | | | | | | 11,675 | | | | 585,618 | |
AmerisourceBergen Corporation | | | | | | | 8,590 | | | | 340,851 | |
Cardinal Health Incorporated | | | | | | | 11,518 | | | | 496,541 | |
CIGNA Corporation | | | | | | | 9,546 | | | | 470,141 | |
Coventry Health Care Incorporated | | | | | | | 4,704 | | | | 167,321 | |
DaVita Incorporated † | | | | | | | 3,122 | | | | 281,511 | |
Express Scripts Incorporated † | | | | | | | 16,152 | | | | 875,115 | |
Humana Incorporated | | | | | | | 5,466 | | | | 505,496 | |
Laboratory Corporation of America Holdings Ǡ | | | | | | | 3,238 | | | | 296,407 | |
McKesson Corporation | | | | | | | 8,200 | | | | 719,714 | |
Medco Health Solutions Incorporated † | | | | | | | 12,932 | | | | 909,120 | |
Patterson Companies Incorporated | | | | | | | 2,917 | | | | 97,428 | |
Quest Diagnostics Incorporated | | | | | | | 5,275 | | | | 322,566 | |
Tenet Healthcare Corporation † | | | | | | | 13,660 | | | | 72,535 | |
UnitedHealth Group Incorporated | | | | | | | 34,818 | | | | 2,052,173 | |
WellPoint Incorporated | | | | | | | 11,153 | | | | 823,091 | |
| | | | |
| | | | | | | | | | | 9,015,628 | |
| | | | | | | | | | | | |
| | | | |
| Health Care Technology: 0.05% | | | | | | | | | | | | |
Cerner Corporation † | | | | | | | 4,862 | | | | 370,290 | |
| | | | | | | | | | | | |
| | | | |
| Life Sciences Tools & Services: 0.20% | | | | | | | | | | | | |
Life Technologies Corporation † | | | | | | | 5,939 | | | | 289,942 | |
PerkinElmer Incorporated | | | | | | | 3,780 | | | | 104,555 | |
Thermo Fisher Scientific Incorporated | | | | | | | 12,190 | | | | 687,272 | |
Waters Corporation † | | | | | | | 2,967 | | | | 274,922 | |
| | | | |
| | | | | | | | | | | 1,356,691 | |
| | | | | | | | | | | | |
| | | | |
| Pharmaceuticals: 3.55% | | | | | | | | | | | | |
Abbott Laboratories | | | | | | | 52,390 | | | | 3,210,983 | |
Allergan Incorporated | | | | | | | 10,143 | | | | 967,946 | |
Bristol-Myers Squibb Company | | | | | | | 56,247 | | | | 1,898,336 | |
The accompanying notes are an integral part of these financial statements.
| | | | | | |
| Portfolio of Investments—March 31, 2012 (Unaudited) | | Wells Fargo Advantage Index Asset Allocation Fund | | | 17 | |
| | | | | | | | | | | | |
| Security Name | | | | | | Shares | | | Value | |
| | | | | | | | | | | | |
| | | | |
| Pharmaceuticals (continued) | | | | | | | | | | | | |
Eli Lilly & Company | | | | | | | 34,024 | | | $ | 1,370,146 | |
Forest Laboratories Incorporated † | | | | | | | 8,847 | | | | 306,902 | |
Hospira Incorporated † | | | | | | | 5,489 | | | | 205,234 | |
Johnson & Johnson | | | | | | | 91,465 | | | | 6,033,031 | |
Merck & Company Incorporated | | | | | | | 101,426 | | | | 3,894,758 | |
Mylan Laboratories Incorporated † | | | | | | | 14,225 | | | | 333,576 | |
Perrigo Company « | | | | | | | 3,108 | | | | 321,087 | |
Pfizer Incorporated | | | | | | | 251,182 | | | | 5,691,784 | |
Watson Pharmaceuticals Incorporated † | | | | | | | 4,237 | | | | 284,133 | |
| | | | |
| | | | | | | | | | | 24,517,916 | |
| | | | | | | | | | | | |
| | | | |
Industrials: 6.41% | | | | | | | | | | | | |
| | | | |
| Aerospace & Defense: 1.53% | | | | | | | | | | | | |
Boeing Company | | | | | | | 24,847 | | | | 1,847,871 | |
General Dynamics Corporation | | | | | | | 11,889 | | | | 872,415 | |
Goodrich Corporation | | | | | | | 4,191 | | | | 525,719 | |
Honeywell International Incorporated | | | | | | | 25,834 | | | | 1,577,166 | |
L-3 Communications Holdings Incorporated | | | | | | | 3,297 | | | | 233,329 | |
Lockheed Martin Corporation | | | | | | | 8,882 | | | | 798,137 | |
Northrop Grumman Corporation | | | | | | | 8,417 | | | | 514,110 | |
Precision Castparts Corporation | | | | | | | 4,836 | | | | 836,144 | |
Raytheon Company | | | | | | | 11,324 | | | | 597,681 | |
Rockwell Collins Incorporated « | | | | | | | 4,952 | | | | 285,037 | |
United Technologies Corporation | | | | | | | 30,326 | | | | 2,515,238 | |
| | | | |
| | | | | | | | | | | 10,602,847 | |
| | | | | | | | | | | | |
| | | | |
| Air Freight & Logistics: 0.61% | | | | | | | | | | | | |
C.H. Robinson Worldwide Incorporated | | | | | | | 5,442 | | | | 356,397 | |
Expeditors International of Washington Incorporated | | | | | | | 7,066 | | | | 328,640 | |
FedEx Corporation | | | | | | | 10,478 | | | | 963,557 | |
United Parcel Service Incorporated Class B | | | | | | | 31,944 | | | | 2,578,520 | |
| | | | |
| | | | | | | | | | | 4,227,114 | |
| | | | | | | | | | | | |
| | | | |
| Airlines: 0.03% | | | | | | | | | | | | |
Southwest Airlines Company | | | | | | | 25,753 | | | | 212,205 | |
| | | | | | | | | | | | |
| | | | |
| Building Products: 0.02% | | | | | | | | | | | | |
Masco Corporation | | | | | | | 11,904 | | | | 159,156 | |
| | | | | | | | | | | | |
| | | | |
| Commercial Services & Supplies: 0.31% | | | | | | | | | | | | |
Avery Dennison Corporation | | | | | | | 3,545 | | | | 106,811 | |
Cintas Corporation « | | | | | | | 3,674 | | | | 143,727 | |
Dun & Bradstreet Corporation | | | | | | | 1,590 | | | | 134,721 | |
Equifax Incorporated | | | | | | | 3,993 | | | | 176,730 | |
Iron Mountain Incorporated | | | | | | | 5,700 | | | | 164,160 | |
Pitney Bowes Incorporated « | | | | | | | 6,656 | | | | 117,012 | |
Republic Services Incorporated | | | | | | | 10,481 | | | | 320,299 | |
Robert Half International Incorporated | | | | | | | 4,736 | | | | 143,501 | |
RR Donnelley & Sons Company « | | | | | | | 5,947 | | | | 73,683 | |
The accompanying notes are an integral part of these financial statements.
| | | | |
| 18 | | Wells Fargo Advantage Index Asset Allocation Fund | | Portfolio of Investments—March 31, 2012 (Unaudited) |
| | | | | | | | | | | | |
| Security Name | | | | | | Shares | | | Value | |
| | | | | | | | | | | | |
| | | | |
| Commercial Services & Supplies (continued) | | | | | | | | | | | | |
Stericycle Incorporated Ǡ | | | | | | | 2,824 | | | $ | 236,199 | |
Waste Management Incorporated « | | | | | | | 15,372 | | | | 537,405 | |
| | | | |
| | | | | | | | | | | 2,154,248 | |
| | | | | | | | | | | | |
| | | | |
| Construction & Engineering: 0.10% | | | | | | | | | | | | |
Fluor Corporation | | | | | | | 5,631 | | | | 338,085 | |
Jacobs Engineering Group Incorporated † | | | | | | | 4,281 | | | | 189,948 | |
Quanta Services Incorporated † | | | | | | | 7,041 | | | | 147,157 | |
| | | | |
| | | | | | | | | | | 675,190 | |
| | | | | | | | | | | | |
| | | | |
| Electrical Equipment: 0.33% | | | | | | | | | | | | |
Cooper Industries plc | | | | | | | 5,281 | | | | 337,720 | |
Emerson Electric Company | | | | | | | 24,471 | | | | 1,276,897 | |
Rockwell Automation Incorporated | | | | | | | 4,744 | | | | 378,097 | |
Roper Industries Incorporated « | | | | | | | 3,228 | | | | 320,088 | |
| | | | |
| | | | | | | | | | | 2,312,802 | |
| | | | | | | | | | | | |
| | | | |
| Industrial Conglomerates: 1.49% | | | | | | | | | | | | |
3M Company | | | | | | | 23,142 | | | | 2,064,498 | |
General Electric Company | | | | | | | 352,565 | | | | 7,075,980 | |
Textron Incorporated « | | | | | | | 9,317 | | | | 259,292 | |
Tyco International Limited | | | | | | | 15,359 | | | | 862,869 | |
| | | | |
| | | | | | | | | | | 10,262,639 | |
| | | | | | | | | | | | |
| | | | |
| Machinery: 1.37% | | | | | | | | | | | | |
Caterpillar Incorporated | | | | | | | 21,575 | | | | 2,298,169 | |
Cummins Incorporated | | | | | | | 6,395 | | | | 767,656 | |
Danaher Corporation | | | | | | | 19,062 | | | | 1,067,472 | |
Deere & Company | | | | | | | 13,388 | | | | 1,083,089 | |
Dover Corporation | | | | | | | 6,119 | | | | 385,130 | |
Eaton Corporation | | | | | | | 11,152 | | | | 555,704 | |
Flowserve Corporation | | | | | | | 1,815 | | | | 209,651 | |
Illinois Tool Works Incorporated | | | | | | | 16,119 | | | | 920,717 | |
Ingersoll-Rand plc « | | | | | | | 9,908 | | | | 409,696 | |
Joy Global Incorporated | | | | | | | 3,526 | | | | 259,161 | |
Paccar Incorporated | | | | | | | 11,891 | | | | 556,856 | |
Pall Corporation | | | | | | | 3,845 | | | | 229,277 | |
Parker Hannifin Corporation | | | | | | | 5,028 | | | | 425,117 | |
Snap-On Incorporated | | | | | | | 1,945 | | | | 118,587 | |
Xylem Incorporated « | | | | | | | 6,154 | | | | 170,774 | |
| | | | |
| | | | | | | | | | | 9,457,056 | |
| | | | | | | | | | | | |
| | | | |
| Road & Rail: 0.48% | | | | | | | | | | | | |
CSX Corporation | | | | | | | 35,061 | | | | 754,513 | |
Norfolk Southern Corporation | | | | | | | 11,000 | | | | 724,130 | |
Ryder System Incorporated | | | | | | | 1,704 | | | | 89,971 | |
Union Pacific Corporation | | | | | | | 15,995 | | | | 1,719,143 | |
| | | | |
| | | | | | | | | | | 3,287,757 | |
| | | | | | | | | | | | |
The accompanying notes are an integral part of these financial statements.
| | | | | | |
| Portfolio of Investments—March 31, 2012 (Unaudited) | | Wells Fargo Advantage Index Asset Allocation Fund | | | 19 | |
| | | | | | | | | | | | |
| Security Name | | | | | | Shares | | | Value | |
| | | | | | | | | | | | |
| | | | |
| Trading Companies & Distributors: 0.14% | | | | | | | | | | | | |
Fastenal Company « | | | | | | | 9,838 | | | $ | 532,236 | |
W.W. Grainger Incorporated | | | | | | | 2,032 | | | | 436,494 | |
| | | | |
| | | | | | | | | | | 968,730 | |
| | | | | | | | | | | | |
| | | | |
Information Technology: 12.12% | | | | | | | | | | | | |
| | | | |
| Communications Equipment: 1.38% | | | | | | | | | | | | |
Cisco Systems Incorporated | | | | | | | 179,458 | | | | 3,795,537 | |
F5 Networks Incorporated † | | | | | | | 2,638 | | | | 356,024 | |
Harris Corporation « | | | | | | | 3,794 | | | | 171,034 | |
JDS Uniphase Corporation † | | | | | | | 7,658 | | | | 110,964 | |
Juniper Networks Incorporated † | | | | | | | 17,538 | | | | 401,269 | |
Motorola Mobility Holdings Incorporated † | | | | | | | 8,782 | | | | 344,606 | |
Motorola Solutions Incorporated | | | | | | | 9,803 | | | | 498,286 | |
QUALCOMM Incorporated | | | | | | | 56,357 | | | | 3,833,403 | |
| | | | |
| | | | | | | | | | | 9,511,123 | |
| | | | | | | | | | | | |
| | | | |
| Computers & Peripherals: 3.53% | | | | | | | | | | | | |
Apple Incorporated † | | | | | | | 31,066 | | | | 18,623,135 | |
Dell Incorporated † | | | | | | | 50,880 | | | | 844,608 | |
EMC Corporation † | | | | | | | 68,408 | | | | 2,044,031 | |
Hewlett-Packard Company | | | | | | | 65,850 | | | | 1,569,206 | |
Lexmark International Incorporated | | | | | | | 2,360 | | | | 78,446 | |
NetApp Incorporated † | | | | | | | 12,094 | | | | 541,448 | |
SanDisk Corporation † | | | | | | | 8,076 | | | | 400,489 | |
Western Digital Corporation † | | | | | | | 7,794 | | | | 322,594 | |
| | | | |
| | | | | | | | | | | 24,423,957 | |
| | | | | | | | | | | | |
| | | | |
| Electronic Equipment, Instruments & Components: 0.36% | | | | | | | | | | | | |
Agilent Technologies Incorporated | | | | | | | 11,582 | | | | 515,515 | |
Amphenol Corporation Class A | | | | | | | 5,442 | | | | 325,268 | |
Corning Incorporated | | | | | | | 50,708 | | | | 713,969 | |
FLIR Systems Incorporated | | | | | | | 5,132 | | | | 129,891 | |
Jabil Circuit Incorporated | | | | | | | 6,143 | | | | 154,312 | |
Molex Incorporated « | | | | | | | 4,575 | | | | 128,649 | |
TE Connectivity Limited | | | | | | | 14,200 | | | | 521,850 | |
| | | | |
| | | | | | | | | | | 2,489,454 | |
| | | | | | | | | | | | |
| | | | |
| Internet Software & Services: 1.14% | | | | | | | | | | | | |
Akamai Technologies Incorporated † | | | | | | | 5,924 | | | | 217,411 | |
eBay Incorporated † | | | | | | | 38,162 | | | | 1,407,796 | |
Google Incorporated Class A † | | | | | | | 8,450 | | | | 5,418,478 | |
VeriSign Incorporated « | | | | | | | 5,315 | | | | 203,777 | |
Yahoo! Incorporated † | | | | | | | 40,441 | | | | 615,512 | |
| | | | |
| | | | | | | | | | | 7,862,974 | |
| | | | | | | | | | | | |
| | | | |
| IT Services: 1.85% | | | | | | | | | | | | |
Accenture plc | | | | | | | 21,564 | | | | 1,390,878 | |
Automatic Data Processing Incorporated | | | | | | | 16,345 | | | | 902,081 | |
The accompanying notes are an integral part of these financial statements.
| | | | |
| 20 | | Wells Fargo Advantage Index Asset Allocation Fund | | Portfolio of Investments—March 31, 2012 (Unaudited) |
| | | | | | | | | | | | |
| Security Name | | | | | | Shares | | | Value | |
| | | | | | | | | | | | |
| | | | |
| IT Services (continued) | | | | | | | | | | | | |
Cognizant Technology Solutions Corporation Class A † | | | | | | | 10,108 | | | $ | 777,811 | |
Computer Sciences Corporation | | | | | | | 5,167 | | | | 154,700 | |
Fidelity National Information Services Incorporated | | | | | | | 7,814 | | | | 258,800 | |
Fiserv Incorporated † | | | | | | | 4,617 | | | | 320,374 | |
International Business Machines Corporation | | | | | | | 38,606 | | | | 8,055,142 | |
Paychex Incorporated | | | | | | | 10,747 | | | | 333,050 | |
SAIC Incorporated « | | | | | | | 9,208 | | | | 121,546 | |
Teradata Corporation † | | | | | | | 5,577 | | | | 380,073 | |
Total System Services Incorporated | | | | | | | 5,349 | | | | 123,401 | |
| | | | |
| | | | | | | | | | | 12,817,856 | |
| | | | | | | | | | | | |
| | | | |
| Office Electronics: 0.05% | | | | | | | | | | | | |
Xerox Corporation | | | | | | | 44,378 | | | | 358,574 | |
| | | | | | | | | | | | |
| | | | |
| Semiconductors & Semiconductor Equipment: 1.48% | | | | | | | | | | | | |
Advanced Micro Devices Incorporated Ǡ | | | | | | | 19,549 | | | | 156,783 | |
Altera Corporation | | | | | | | 10,741 | | | | 427,707 | |
Analog Devices Incorporated | | | | | | | 9,923 | | | | 400,889 | |
Applied Materials Incorporated | | | | | | | 43,019 | | | | 535,156 | |
Broadcom Corporation Class A | | | | | | | 16,343 | | | | 642,280 | |
First Solar Incorporated Ǡ | | | | | | | 1,959 | | | | 49,073 | |
Intel Corporation | | | | | | | 166,465 | | | | 4,679,331 | |
KLA-Tencor Corporation | | | | | | | 5,555 | | | | 302,303 | |
Linear Technology Corporation | | | | | | | 7,629 | | | | 257,097 | |
LSI Corporation † | | | | | | | 18,884 | | | | 163,913 | |
Microchip Technology Incorporated « | | | | | | | 6,399 | | | | 238,043 | |
Micron Technology Incorporated † | | | | | | | 32,913 | | | | 266,595 | |
Novellus Systems Incorporated † | | | | | | | 2,353 | | | | 117,438 | |
NVIDIA Corporation † | | | | | | | 20,346 | | | | 313,125 | |
Teradyne Incorporated † | | | | | | | 6,212 | | | | 104,921 | |
Texas Instruments Incorporated | | | | | | | 38,150 | | | | 1,282,222 | |
Xilinx Incorporated | | | | | | | 8,724 | | | | 317,815 | |
| | | | |
| | | | | | | | | | | 10,254,691 | |
| | | | | | | | | | | | |
| | | | |
| Software: 2.33% | | | | | | | | | | | | |
Adobe Systems Incorporated † | | | | | | | 16,453 | | | | 564,502 | |
Autodesk Incorporated † | | | | | | | 7,526 | | | | 318,500 | |
BMC Software Incorporated † | | | | | | | 5,472 | | | | 219,756 | |
CA Incorporated | | | | | | | 12,136 | | | | 334,468 | |
Citrix Systems Incorporated † | | | | | | | 6,183 | | | | 487,901 | |
Electronic Arts Incorporated † | | | | | | | 11,041 | | | | 181,956 | |
Intuit Incorporated | | | | | | | 9,826 | | | | 590,837 | |
Microsoft Corporation | | | | | | | 248,825 | | | | 8,024,606 | |
Oracle Corporation | | | | | | | 130,619 | | | | 3,808,850 | |
Red Hat Incorporated † | | | | | | | 6,435 | | | | 385,392 | |
Salesforce.com Incorporated Ǡ | | | | | | | 4,531 | | | | 700,085 | |
Symantec Corporation † | | | | | | | 24,304 | | | | 454,485 | |
| | | | |
| | | | | | | | | | | 16,071,338 | |
| | | | | | | | | | | | |
The accompanying notes are an integral part of these financial statements.
| | | | | | |
| Portfolio of Investments—March 31, 2012 (Unaudited) | | Wells Fargo Advantage Index Asset Allocation Fund | | | 21 | |
| | | | | | | | | | | | |
| Security Name | | | | | | Shares | | | Value | |
| | | | | | | | | | | | |
| | | | |
Materials: 2.12% | | | | | | | | | | | | |
| | | | |
| Chemicals: 1.40% | | | | | | | | | | | | |
Air Products & Chemicals Incorporated | | | | | | | 7,017 | | | $ | 644,161 | |
Airgas Incorporated | | | | | | | 2,289 | | | | 203,652 | |
CF Industries Holdings Incorporated | | | | | | | 2,181 | | | | 398,360 | |
Dow Chemical Company | | | | | | | 39,496 | | | | 1,368,141 | |
E.I. du Pont de Nemours & Company | | | | | | | 31,062 | | | | 1,643,180 | |
Eastman Chemical Company | | | | | | | 4,563 | | | | 235,861 | |
Ecolab Incorporated | | | | | | | 9,705 | | | | 598,993 | |
FMC Corporation | | | | | | | 2,326 | | | | 246,230 | |
International Flavors & Fragrances Incorporated | | | | | | | 2,696 | | | | 157,986 | |
Monsanto Company | | | | | | | 17,839 | | | | 1,422,839 | |
Mosaic Company | | | | | | | 9,922 | | | | 548,587 | |
PPG Industries Incorporated | | | | | | | 5,064 | | | | 485,131 | |
Praxair Incorporated | | | | | | | 9,942 | | | | 1,139,751 | |
Sherwin-Williams Company | | | | | | | 2,880 | | | | 312,970 | |
Sigma-Aldrich Corporation « | | | | | | | 4,022 | | | | 293,847 | |
| | | | |
| | | | | | | | | | | 9,699,689 | |
| | | | | | | | | | | | |
| | | | |
| Construction Materials: 0.03% | | | | | | | | | | | | |
Vulcan Materials Company | | | | | | | 4,306 | | | | 183,995 | |
| | | | | | | | | | | | |
| | | | |
| Containers & Packaging: 0.08% | | | | | | | | | | | | |
Ball Corporation | | | | | | | 5,201 | | | | 223,019 | |
Bemis Company Incorporated | | | | | | | 3,434 | | | | 110,884 | |
Owens-Illinois Incorporated † | | | | | | | 5,478 | | | | 127,857 | |
Sealed Air Corporation | | | | | | | 6,399 | | | | 123,565 | |
| | | | |
| | | | | | | | | | | 585,325 | |
| | | | | | | | | | | | |
| | | | |
| Metals & Mining: 0.51% | | | | | | | | | | | | |
Alcoa Incorporated « | | | | | | | 35,522 | | | | 355,930 | |
Allegheny Technologies Incorporated | | | | | | | 3,555 | | | | 146,359 | |
Cliffs Natural Resources Incorporated | | | | | | | 4,731 | | | | 327,669 | |
Freeport-McMoRan Copper & Gold Incorporated Class B | | | | | | | 31,583 | | | | 1,201,417 | |
Newmont Mining Corporation | | | | | | | 16,495 | | | | 845,699 | |
Nucor Corporation | | | | | | | 10,558 | | | | 453,466 | |
Titanium Metals Corporation | | | | | | | 2,743 | | | | 37,195 | |
United States Steel Corporation « | | | | | | | 4,798 | | | | 140,917 | |
| | | | |
| | | | | | | | | | | 3,508,652 | |
| | | | | | | | | | | | |
| | | | |
| Paper & Forest Products: 0.10% | | | | | | | | | | | | |
International Paper Company « | | | | | | | 14,563 | | | | 511,161 | |
MeadWestvaco Corporation | | | | | | | 5,696 | | | | 179,937 | |
| | | | |
| | | | | | | | | | | 691,098 | |
| | | | | | | | | | | | |
| | | | |
Telecommunication Services: 1.70% | | | | | | | | | | | | |
| | | | |
| Diversified Telecommunication Services: 1.58% | | | | | | | | | | | | |
AT&T Incorporated | | | | | | | 197,545 | | | | 6,169,330 | |
CenturyTel Incorporated | | | | | | | 20,646 | | | | 797,968 | |
The accompanying notes are an integral part of these financial statements.
| | | | |
| 22 | | Wells Fargo Advantage Index Asset Allocation Fund | | Portfolio of Investments—March 31, 2012 (Unaudited) |
| | | | | | | | | | | | |
| Security Name | | | | | | Shares | | | Value | |
| | | | | | | | | | | | |
| | | | |
| Diversified Telecommunication Services (continued) | | | | | | | | | | | | |
Frontier Communications Corporation « | | | | | | | 33,154 | | | $ | 138,252 | |
Verizon Communications Incorporated | | | | | | | 94,479 | | | | 3,611,932 | |
Windstream Corporation « | | | | | | | 19,541 | | | | 228,825 | |
| | | | |
| | | | | | | | | | | 10,946,307 | |
| | | | | | | | | | | | |
| | | | |
| Wireless Telecommunication Services: 0.12% | | | | | | | | | | | | |
Crown Castle International Corporation † | | | | | | | 8,341 | | | | 444,909 | |
MetroPCS Communications Incorporated † | | | | | | | 9,783 | | | | 88,243 | |
Sprint Nextel Corporation † | | | | | | | 99,873 | | | | 284,638 | |
| | | | |
| | | | | | | | | | | 817,790 | |
| | | | | | | | | | | | |
| | | | |
Utilities: 2.07% | | | | | | | | | | | | |
| | | | |
| Electric Utilities: 1.23% | | | | | | | | | | | | |
American Electric Power Company Incorporated | | | | | | | 16,107 | | | | 621,408 | |
Consolidated Edison Incorporated « | | | | | | | 9,758 | | | | 570,062 | |
Duke Energy Corporation « | | | | | | | 44,509 | | | | 935,134 | |
Edison International | | | | | | | 10,855 | | | | 461,446 | |
Entergy Corporation | | | | | | | 5,884 | | | | 395,405 | |
Exelon Corporation | | | | | | | 28,358 | | | | 1,111,917 | |
FirstEnergy Corporation | | | | | | | 13,934 | | | | 635,251 | |
Nextera Energy Incorporated | | | | | | | 13,868 | | | | 847,057 | |
Northeast Utilities | | | | | | | 5,904 | | | | 219,156 | |
Pepco Holdings Incorporated « | | | | | | | 7,583 | | | | 143,243 | |
Pinnacle West Capital Corporation | | | | | | | 3,640 | | | | 174,356 | |
PPL Corporation | | | | | | | 19,300 | | | | 545,418 | |
Progress Energy Incorporated | | | | | | | 9,836 | | | | 522,390 | |
The Southern Company | | | | | | | 28,874 | | | | 1,297,309 | |
| | | | |
| | | | | | | | | | | 8,479,552 | |
| | | | | | | | | | | | |
| | | | |
| Gas Utilities: 0.06% | | | | | | | | | | | | |
AGL Resources Incorporated | | | | | | | 3,902 | | | | 153,036 | |
ONEOK Incorporated | | | | | | | 3,461 | | | | 282,625 | |
| | | | |
| | | | | | | | | | | 435,661 | |
| | | | | | | | | | | | |
| | | | |
| Independent Power Producers & Energy Traders: 0.06% | | | | | | | | | | | | |
AES Corporation † | | | | | | | 21,436 | | | | 280,169 | |
NRG Energy Incorporated † | | | | | | | 7,586 | | | | 118,873 | |
| | | | |
| | | | | | | | | | | 399,042 | |
| | | | | | | | | | | | |
| | | | |
| Multi-Utilities: 0.72% | | | | | | | | | | | | |
Ameren Corporation | | | | | | | 8,084 | | | | 263,377 | |
CenterPoint Energy Incorporated | | | | | | | 14,196 | | | | 279,945 | |
CMS Energy Corporation « | | | | | | | 8,572 | | | | 188,584 | |
Dominion Resources Incorporated | | | | | | | 18,996 | | | | 972,785 | |
DTE Energy Company | | | | | | | 5,644 | | | | 310,589 | |
Integrys Energy Group Incorporated « | | | | | | | 2,608 | | | | 138,198 | |
NiSource Incorporated « | | | | | | | 9,402 | | | | 228,939 | |
PG&E Corporation | | | | | | | 13,730 | | | | 596,019 | |
The accompanying notes are an integral part of these financial statements.
| | | | | | |
| Portfolio of Investments—March 31, 2012 (Unaudited) | | Wells Fargo Advantage Index Asset Allocation Fund | | | 23 | |
| | | | | | | | | | | | | | | | |
| Security Name | | | | | | | | Shares | | | Value | |
| | | | | | | | | | | | | | | | |
| | | | |
| Multi-Utilities (continued) | | | | | | | | | | | | | | | | |
Public Service Enterprise Group Incorporated | | | | | | | | | | | 16,861 | | | $ | 516,115 | |
SCANA Corporation « | | | | | | | | | | | 3,863 | | | | 176,191 | |
Sempra Energy | | | | | | | | | | | 8,016 | | | | 480,639 | |
TECO Energy Incorporated | | | | | | | | | | | 7,190 | | | | 126,185 | |
Wisconsin Energy Corporation | | | | | | | | | | | 7,678 | | | | 270,112 | |
Xcel Energy Incorporated | | | | | | | | | | | 16,221 | | | | 429,360 | |
| | | | |
| | | | | | | | | | | | | | | 4,977,038 | |
| | | | | | | | | | | | | | | | |
| | | | |
Total Common Stocks (Cost $334,002,414) | | | | | | | | | | | | | | | 424,154,559 | |
| | | | | | | | | | | | | | | | |
| | | | |
| | | Interest Rate | | | Maturity Date | | | Principal | | | | |
| Non-Agency Mortgage Backed Securities: 0.00% | | | | | | | | | | | | | | | | |
Citigroup Mortgage Loan Trust Incorporated Series 2004-HYB4 Class AA ± | | | 0.57 | % | | | 12/25/2034 | | | $ | 27,150 | | | | 23,667 | |
Terwin Mortgage Trust Series 2004-21HE Class 1A1 ± | | | 1.20 | | | | 12/25/2034 | | | | 10,277 | | | | 8,849 | |
| | | | |
Total Non-Agency Mortgage Backed Securities (Cost $37,427) | | | | | | | | | | | | | | | 32,516 | |
| | | | | | | | | | | | | | | | |
| | | | |
U.S. Treasury Securities: 32.82% | | | | | | | | | | | | | | | | |
U.S. Treasury Bond | | | 3.13 | | | | 11/15/2041 | | | | 16,507,000 | | | | 15,771,927 | |
U.S. Treasury Bond | | | 3.13 | | | | 02/15/2042 | | | | 6,258,000 | | | | 5,975,414 | |
U.S. Treasury Bond | | | 3.50 | | | | 02/15/2039 | | | | 9,195,000 | | | | 9,519,694 | |
U.S. Treasury Bond | | | 3.75 | | | | 08/15/2041 | | | | 15,975,000 | | | | 17,208,078 | |
U.S. Treasury Bond | | | 3.88 | | | | 08/15/2040 | | | | 12,868,000 | | | | 14,182,955 | |
U.S. Treasury Bond | | | 4.25 | | | | 05/15/2039 | | | | 10,503,000 | | | | 12,334,461 | |
U.S. Treasury Bond | | | 4.25 | | | | 11/15/2040 | | | | 14,576,000 | | | | 17,104,032 | |
U.S. Treasury Bond | | | 4.38 | | | | 02/15/2038 | | | | 5,198,000 | | | | 6,219,729 | |
U.S. Treasury Bond | | | 4.38 | | | | 11/15/2039 | | | | 14,262,000 | | | | 17,078,745 | |
U.S. Treasury Bond | | | 4.38 | | | | 05/15/2040 | | | | 14,734,000 | | | | 17,646,264 | |
U.S. Treasury Bond | | | 4.38 | | | | 05/15/2041 | | | | 15,277,000 | | | | 18,298,974 | |
U.S. Treasury Bond | | | 4.50 | | | | 02/15/2036 | | | | 7,751,000 | | | | 9,434,424 | |
U.S. Treasury Bond | | | 4.50 | | | | 05/15/2038 | | | | 6,588,000 | | | | 8,037,360 | |
U.S. Treasury Bond | | | 4.50 | | | | 08/15/2039 | | | | 9,999,000 | | | | 12,208,159 | |
U.S. Treasury Bond | | | 4.63 | | | | 02/15/2040 | | | | 13,479,000 | | | | 16,777,150 | |
U.S. Treasury Bond | | | 4.75 | | | | 02/15/2037 | | | | 4,118,000 | | | | 5,196,401 | |
U.S. Treasury Bond | | | 4.75 | | | | 02/15/2041 | | | | 13,138,000 | | | | 16,685,260 | |
U.S. Treasury Bond | | | 5.00 | | | | 05/15/2037 | | | | 5,500,000 | | | | 7,187,813 | |
| | | | |
Total U.S. Treasury Securities (Cost $200,528,247) | | | | | | | | | | | | | | | 226,866,840 | |
| | | | | | | | | | | | | | | | |
| | | | |
Other: 0.47% | | | | | | | | | | | | | | | | |
Gryphon Funding Limited, Pass-Through Entity (v)(a)(i) | | | | | | | | | | | 2,336,924 | | | | 654,339 | |
VFNC Corporation, Pass-Through Entity, 0.24% ±(v)(a)(i)144A | | | | | | | | | | | 6,102,798 | | | | 2,563,163 | |
| | | | |
Total Other (Cost $1,211,001) | | | | | | | | | | | | | | | 3,217,502 | |
| | | | | | | | | | | | | | | | |
| | | | |
| | | Yield | | | | | | Shares | | | | |
| Short-Term Investments: 7.93% | | | | | | | | | | | | | | | | |
| | | | |
| Investment Companies: 5.60% | | | | | | | | | | | | | | | | |
Wells Fargo Advantage Cash Investment Money Market Fund, Select Class (l)(u) | | | 0.10 | | | | | | | | 21,113,012 | | | | 21,113,012 | |
Wells Fargo Securities Lending Cash Investments, LLC (l)(v)(u)(r) | | | 0.18 | | | | | | | | 17,605,213 | | | | 17,605,213 | |
| | | | |
| | | | | | | | | | | | | | | 38,718,225 | |
| | | | | | | | | | | | | | | | |
The accompanying notes are an integral part of these financial statements.
| | | | |
| 24 | | Wells Fargo Advantage Index Asset Allocation Fund | | Portfolio of Investments—March 31, 2012 (Unaudited) |
| | | | | | | | | | | | | | | | |
| Security Name | | Yield | | | Maturity Date | | | Principal | | | Value | |
| | | | | | | | | | | | | | | | |
| | | | |
| U.S. Treasury Securities: 2.33% | | | | | | | | | | | | | | | | |
U.S. Treasury Bill (z)# | | | 0.01 | % | | | 04/05/2012 | | | $ | 425,000 | | | $ | 424,999 | |
U.S. Treasury Bill (z)# | | | 0.06 | | | | 05/03/2012 | | | | 6,530,000 | | | | 6,529,778 | |
U.S. Treasury Bill (z)# | | | 0.09 | | | | 08/02/2012 | | | | 9,185,000 | | | | 9,182,042 | |
| | | | |
| | | | | | | | | | | | | | | 16,136,819 | |
| | | | | | | | | | | | | | | | |
| | | | |
Total Short-Term Investments (Cost $54,855,536) | | | | | | | | | | | | | | | 54,855,044 | |
| | | | | | | | | | | | | | | | |
| | | | | | | | |
| Total Investments in Securities | | | | | | | | |
| (Cost $590,795,727) * | | | 102.61 | % | | | 709,307,780 | |
Other Assets and Liabilities, Net | | | (2.61 | ) | | | (18,021,037 | ) |
| | | | | | | | |
| Total Net Assets | | | 100.00 | % | | $ | 691,286,743 | |
| | | | | | | | |
| « | All or a portion of this security is on loan. |
| † | Non-income earning security |
| (l) | Investment in an affiliate |
| ± | Variable rate investment |
| (v) | Security represents investment of cash collateral received from securities on loan. |
| (a) | Security is fair valued by the Management Valuation Team, and in certain instances by the Board of Trustees, in accordance with procedures approved by the Board of Trustees. |
| 144A | Security that may be resold to “qualified institutional buyers” under Rule 144A or security offered pursuant to Section 4(2) of the Securities Act of 1933, as amended. |
| (u) | Rate shown is the 7-day annualized yield at period end. |
| (r) | The investment company is exempt from registration under Section 3(c)(7) of the 1940 Act. |
| (z) | Zero coupon security. Rate represents yield to maturity at time of purchase. |
| # | All or a portion of this security is segregated as collateral for investments in derivative instruments. |
| * | Cost for federal income tax purposes is $620,175,856 and net unrealized appreciation (depreciation) consists of: |
| | | | |
Gross unrealized appreciation | | $ | 119,033,663 | |
Gross unrealized depreciation | | | (29,901,739 | ) |
| | | | |
Net unrealized appreciation | | $ | 89,131,924 | |
The accompanying notes are an integral part of these financial statements.
| | | | | | |
| Statement of Assets and Liabilities—March 31, 2012 (Unaudited) | | Wells Fargo Advantage Index Asset Allocation Fund | | | 25 | |
| | | | |
| | | | |
| |
Assets | | | | |
Investments | | | | |
In unaffiliated securities (including securities on loan), at value (see cost below) | | $ | 664,591,020 | |
In affiliated securities, at value (see cost below) | | | 44,716,760 | |
| | | | |
Total investments, at value (see cost below) | | | 709,307,780 | |
Receivable for Fund shares sold | | | 66,398 | |
Receivable for dividends and interest | | | 2,663,742 | |
Receivable for daily variation margin on open futures contracts | | | 1,918,500 | |
Receivable for securities lending income | | | 6,405 | |
| | | | |
Total assets | | | 713,962,825 | |
| | | | |
| |
Liabilities | | | | |
Payable for Fund shares redeemed | | | 3,130,800 | |
Payable upon receipt of securities loaned | | | 18,816,214 | |
Advisory fee payable | | | 330,953 | |
Distribution fees payable | | | 13,336 | |
Due to other related parties | | | 148,361 | |
Accrued expenses and other liabilities | | | 236,418 | |
| | | | |
Total liabilities | | | 22,676,082 | |
| | | | |
Total net assets | | $ | 691,286,743 | |
| | | | |
| |
NET ASSETS CONSIST OF | | | | |
Paid-in capital | | $ | 690,734,483 | |
Undistributed net investment income | | | 200,371 | |
Accumulated net realized losses on investments | | | (130,086,951 | ) |
Net unrealized gains on investments | | | 130,438,840 | |
| | | | |
Total net assets | | $ | 691,286,743 | |
| | | | |
| |
COMPUTATION OF NET ASSET VALUE AND OFFERING PRICE PER SHARE1 | | | | |
Net assets – Class A | | $ | 644,005,822 | |
Shares outstanding – Class A | | | 30,220,445 | |
Net asset value per share – Class A | | | $21.31 | |
Maximum offering price per share – Class A2 | | | $22.61 | |
Net assets – Class B | | $ | 3,541,745 | |
Shares outstanding – Class B | | | 271,315 | |
Net asset value per share – Class B | | | $13.05 | |
Net assets – Class C | | $ | 16,784,975 | |
Shares outstanding – Class C | | | 1,290,462 | |
Net asset value per share – Class C | | | $13.01 | |
Net assets – Administrator Class | | $ | 26,954,201 | |
Shares outstanding – Administrator Class | | | 1,263,993 | |
Net asset value per share – Administrator Class | | | $21.32 | |
| |
Investments in unaffiliated securities, at cost | | $ | 544,887,677 | |
| | | | |
Investments in affiliated securities, at cost | | $ | 45,908,050 | |
| | | | |
Total investments, at cost | | $ | 590,795,727 | |
| | | | |
Securities on loan, at value | | $ | 18,385,354 | |
| | | | |
| 1. | The Fund has an unlimited number of authorized shares. |
| 2. | Maximum offering price is computed as 100/94.25 of net asset value. On investments of $50,000 or more, the offering price is reduced. |
The accompanying notes are an integral part of these financial statements.
| | | | |
| 26 | | Wells Fargo Advantage Index Asset Allocation Fund | | Statement of Operations—Six Months Ended March 31, 2012 (Unaudited) |
| | | | |
| | | | |
| |
Investment income | | | | |
Dividends | | $ | 4,304,963 | |
Interest | | | 4,098,763 | |
Securities lending income, net | | | 37,241 | |
Income from affiliated securities | | | 10,691 | |
| | | | |
Total investment income | | | 8,451,658 | |
| | | | |
| |
Expenses | | | | |
Advisory fee | | | 1,931,470 | |
Administration fees | | | | |
Fund level | | | 164,287 | |
Class A | | | 795,592 | |
Class B | | | 5,398 | |
Class C | | | 21,471 | |
Administrator Class | | | 12,242 | |
Shareholder servicing fees | | | | |
Class A | | | 764,992 | |
Class B | | | 5,190 | |
Class C | | | 20,646 | |
Administrator Class | | | 30,027 | |
Distribution fees | | | | |
Class B | | | 15,570 | |
Class C | | | 61,937 | |
Custody and accounting fees | | | 31,447 | |
Professional fees | | | 13,099 | |
Registration fees | | | 26,003 | |
Shareholder report expenses | | | 39,603 | |
Trustees’ fees and expenses | | | 7,992 | |
Other fees and expenses | | | 5,417 | |
| | | | |
Total expenses | | | 3,952,383 | |
Less: Fee waivers and/or expense reimbursements | | | (126,532 | ) |
| | | | |
Net expenses | | | 3,825,851 | |
| | | | |
Net investment income | | | 4,625,807 | |
| | | | |
| |
REALIZED AND UNREALIZED GAINS (LOSSES) ON INVESTMENTS | | | | |
| |
Net realized gains (losses) on: | | | | |
Unaffiliated securities | | | 8,421,371 | |
Affiliated securities | | | (2,424 | ) |
Futures transactions | | | 16,758,583 | |
| | | | |
Net realized gains on investments | | | 25,177,530 | |
| | | | |
| |
Net change in unrealized gains (losses) on: | | | | |
Unaffiliated securities | | | 52,247,215 | |
Affiliated securities | | | 1,705,890 | |
Futures transactions | | | 27,168,232 | |
| | | | |
Net change in unrealized gains (losses) on investments | | | 81,121,337 | |
| | | | |
Net realized and unrealized gains (losses) on investments | | | 106,298,867 | |
| | | | |
Net increase in net assets resulting from operations | | $ | 110,924,674 | |
| | | | |
The accompanying notes are an integral part of these financial statements.
| | | | | | |
| Statements of Changes in Net Assets | | Wells Fargo Advantage Index Asset Allocation Fund | | | 27 | |
| | | | | | | | | | | | | | | | |
| | | Six Months Ended March 31, 2012 (Unaudited) | | | Year Ended September 30, 2011 | |
| | | | |
Operations | | | | | | | | | | | | | | | | |
Net investment income | | | | | | $ | 4,625,807 | | | | | | | $ | 10,409,067 | |
Net realized gains on investments | | | | | | | 25,177,530 | | | | | | | | 9,854,572 | |
Net change in unrealized gains (losses) on investments | | | | | | | 81,121,337 | | | | | | | | 14,791,851 | |
| | | | | | | | | | | | | | | | |
Net increase in net assets resulting from operations | | | | | | | 110,924,674 | | | | | | | | 35,055,490 | |
| | | | | | | | | | | | | | | | |
| | | | |
Distributions to shareholders from | | | | | | | | | | | | | | | | |
Net investment income | | | | | | | | | | | | | | | | |
Class A | | | | | | | (4,449,169 | ) | | | | | | | (9,891,715 | ) |
Class B | | | | | | | (11,657 | ) | | | | | | | (45,066 | ) |
Class C | | | | | | | (56,463 | ) | | | | | | | (145,644 | ) |
Administrator Class | | | | | | | (212,732 | ) | | | | | | | (385,464 | ) |
| | | | | | | | | | | | | | | | |
Total distributions to shareholders | | | | | | | (4,730,021 | ) | | | | | | | (10,467,889 | ) |
| | | | | | | | | | | | | | | | |
| | | | |
Capital share transactions | | | Shares | | | | | | | | Shares | | | | | |
Proceeds from shares sold | | | | | | | | | | | | | | | | |
Class A | | | 195,385 | | | | 3,940,402 | | | | 393,599 | | | | 7,437,608 | |
Class B | | | 2,935 | | | | 35,621 | | | | 18,890 | | | | 213,219 | |
Class C | | | 66,550 | | | | 802,908 | | | | 86,012 | | | | 990,115 | |
Administrator Class | | | 318,747 | | | | 6,480,382 | | | | 239,079 | | | | 4,549,244 | |
| | | | | | | | | | | | | | | | |
| | | | | | | 11,259,313 | | | | | | | | 13,190,186 | |
| | | | | | | | | | | | | | | | |
Reinvestment of distributions | | | | | | | | | | | | | | | | |
Class A | | | 213,511 | | | | 4,286,106 | | | | 503,530 | | | | 9,431,383 | |
Class B | | | 844 | | | | 10,279 | | | | 3,522 | | | | 40,395 | |
Class C | | | 4,034 | | | | 49,491 | | | | 10,316 | | | | 118,090 | |
Administrator Class | | | 9,623 | | | | 193,456 | | | | 20,292 | | | | 380,596 | |
| | | | | | | | | | | | | | | | |
| | | | | | | 4,539,332 | | | | | | | | 9,970,464 | |
| | | | | | | | | | | | | | | | |
Payment for shares redeemed | | | | | | | | | | | | | | | | |
Class A | | | (1,928,740 | ) | | | (38,411,636 | ) | | | (4,811,734 | ) | | | (90,766,665 | ) |
Class B | | | (138,026 | ) | | | (1,695,739 | ) | | | (431,888 | ) | | | (4,981,864 | ) |
Class C | | | (217,104 | ) | | | (2,636,919 | ) | | | (324,037 | ) | | | (3,721,759 | ) |
Administrator Class | | | (207,180 | ) | | | (4,331,460 | ) | | | (119,704 | ) | | | (2,250,177 | ) |
| | | | | | | | | | | | | | | | |
| | | | | | | (47,075,754 | ) | | | | | | | (101,720,465 | ) |
| | | | | | | | | | | | | | | | |
Net decrease in net assets resulting
from capital share transactions | | | | | | | (31,277,109 | ) | | | | | | | (78,559,815 | ) |
| | | | | | | | | | | | | | | | |
Total increase (decrease) in net assets | | | | | | | 74,917,544 | | | | | | | | (53,972,214 | ) |
| | | | | | | | | | | | | | | | |
| | | | |
Net assets | | | | | | | | | | | | | | | | |
Beginning of period | | | | | | | 616,369,199 | | | | | | | | 670,341,413 | |
| | | | | | | | | | | | | | | | |
End of period | | | | | | $ | 691,286,743 | | | | | | | $ | 616,369,199 | |
| | | | | | | | | | | | | | | | |
Undistributed net investment income | | | | | | $ | 200,371 | | | | | | | $ | 304,585 | |
| | | | | | | | | | | | | | | | |
The accompanying notes are an integral part of these financial statements.
| | | | |
| 28 | | Wells Fargo Advantage Index Asset Allocation Fund | | Financial Highlights |
(For a share outstanding throughout each period)
| | | | | | | | | | | | | | | | | | | | | | | | |
Class A | | Six Months Ended
March 31, 2012 (Unaudited) | | | Year Ended September 30, | |
| | | 2011 | | | 2010 | | | 2009 | | | 2008 | | | 2007 | |
Net asset value, beginning of period | | $ | 18.12 | | | $ | 17.56 | | | $ | 16.42 | | | $ | 17.63 | | | $ | 23.12 | | | $ | 20.94 | |
Net investment income | | | 0.14 | | | | 0.30 | | | | 0.28 | | | | 0.31 | 1 | | | 0.44 | 1 | | | 0.47 | 1 |
Net realized and unrealized gains (losses) on investments | | | 3.19 | | | | 0.56 | | | | 1.14 | | | | (1.21 | ) | | | (4.36 | ) | | | 2.58 | |
| | | | | | | | | | | | | | | | | | | | | | | | |
Total from investment operations | | | 3.33 | | | | 0.86 | | | | 1.42 | | | | (0.90 | ) | | | (3.92 | ) | | | 3.05 | |
Distributions to shareholders from | | | | | | | | | | | | | | | | | | | | | | | | |
Net investment income | | | (0.14 | ) | | | (0.30 | ) | | | (0.28 | ) | | | (0.31 | ) | | | (0.44 | ) | | | (0.47 | ) |
Net realized gains | | | 0.00 | | | | 0.00 | | | | 0.00 | | | | (0.00 | )2 | | | (1.13 | ) | | | (0.40 | ) |
| | | | | | | | | | | | | | | | | | | | | | | | |
Total distributions to shareholders | | | (0.14 | ) | | | (0.30 | ) | | | (0.28 | ) | | | (0.31 | ) | | | (1.57 | ) | | | (0.87 | ) |
Net asset value, end of period | | $ | 21.31 | | | $ | 18.12 | | | $ | 17.56 | | | $ | 16.42 | | | $ | 17.63 | | | $ | 23.12 | |
Total return3 | | | 18.46 | % | | | 4.84 | % | | | 8.72 | % | | | (4.85 | )% | | | (17.92 | )% | | | 14.83 | % |
Ratios to average net assets (annualized) | | | | | | | | | | | | | | | | | | | | | | | | |
Gross expenses | | | 1.19 | % | | | 1.18 | % | | | 1.26 | % | | | 1.29 | % | | | 1.29 | % | | | 1.25 | % |
Net expenses | | | 1.15 | % | | | 1.15 | % | | | 1.14 | % | | | 1.15 | % | | | 1.15 | % | | | 1.15 | % |
Net investment income | | | 1.42 | % | | | 1.54 | % | | | 1.64 | % | | | 2.13 | % | | | 2.17 | % | | | 2.12 | % |
Supplemental data | | | | | | | | | | | | | | | | | | | | | | | | |
Portfolio turnover rate | | | 11 | % | | | 18 | % | | | 28 | % | | | 43 | % | | | 45 | % | | | 16 | % |
Net assets, end of period (000’s omitted) | | | $644,006 | | | | $575,248 | | | | $626,119 | | | | $646,445 | | | | $777,876 | | | | $914,716 | |
| 1. | Calculated based upon average shares outstanding |
| 2. | Amount is less than $0.005. |
| 3. | Total return calculations do not include any sales charges. Returns for periods of less than one year are not annualized. |
The accompanying notes are an integral part of these financial statements.
| | | | | | |
| Financial Highlights | | Wells Fargo Advantage Index Asset Allocation Fund | | | 29 | |
(For a share outstanding throughout each period)
| | | | | | | | | | | | | | | | | | | | | | | | |
| Class B | | Six Months Ended
March 31, 2012 (Unaudited) | | | Year Ended September 30, | |
| | | 2011 | | | 2010 | | | 2009 | | | 2008 | | | 2007 | |
Net asset value, beginning of period | | $ | 11.10 | | | $ | 10.74 | | | $ | 10.02 | | | $ | 10.74 | | | $ | 14.07 | | | $ | 12.73 | |
Net investment income | | | 0.04 | 1 | | | 0.09 | 1 | | | 0.09 | 1 | | | 0.13 | 1 | | | 0.18 | 1 | | | 0.19 | 1 |
Net realized and unrealized gains (losses) on investments | | | 1.95 | | | | 0.35 | | | | 0.70 | | | | (0.74 | ) | | | (2.66 | ) | | | 1.57 | |
| | | | | | | | | | | | | | | | | | | | | | | | |
Total from investment operations | | | 1.99 | | | | 0.44 | | | | 0.79 | | | | (0.61 | ) | | | (2.48 | ) | | | 1.76 | |
Distributions to shareholders from | | | | | | | | | | | | | | | | | | | | | | | | |
Net investment income | | | (0.04 | ) | | | (0.08 | ) | | | (0.07 | ) | | | (0.11 | ) | | | (0.16 | ) | | | (0.18 | ) |
Net realized gains | | | 0.00 | | | | 0.00 | | | | 0.00 | | | | (0.00 | )2 | | | (0.69 | ) | | | (0.24 | ) |
| | | | | | | | | | | | | | | | | | | | | | | | |
Total distributions to shareholders | | | (0.04 | ) | | | (0.08 | ) | | | (0.07 | ) | | | (0.11 | ) | | | (0.85 | ) | | | (0.42 | ) |
Net asset value, end of period | | $ | 13.05 | | | $ | 11.10 | | | $ | 10.74 | | | $ | 10.02 | | | $ | 10.74 | | | $ | 14.07 | |
Total return3 | | | 17.91 | % | | | 4.11 | % | | | 7.90 | % | | | (5.48 | )% | | | (18.56 | )% | | | 14.03 | % |
Ratios to average net assets (annualized) | | | | | | | | | | | | | | | | | | | | | | | | |
Gross expenses | | | 1.93 | % | | | 1.93 | % | | | 2.02 | % | | | 2.04 | % | | | 2.04 | % | | | 2.00 | % |
Net expenses | | | 1.90 | % | | | 1.90 | % | | | 1.89 | % | | | 1.90 | % | | | 1.90 | % | | | 1.90 | % |
Net investment income | | | 0.68 | % | | | 0.78 | % | | | 0.89 | % | | | 1.43 | % | | | 1.42 | % | | | 1.36 | % |
Supplemental data | | | | | | | | | | | | | | | | | | | | | | | | |
Portfolio turnover rate | | | 11 | % | | | 18 | % | | | 28 | % | | | 43 | % | | | 45 | % | | | 16 | % |
Net assets, end of period (000’s omitted) | | | $3,542 | | | | $4,500 | | | | $8,753 | | | | $15,201 | | | | $31,831 | | | | $85,203 | |
| 1. | Calculated based upon average shares outstanding |
| 2. | Amount is less than $0.005. |
| 3. | Total return calculations do not include any sales charges. Returns for periods of less than one year are not annualized. |
The accompanying notes are an integral part of these financial statements.
| | | | |
| 30 | | Wells Fargo Advantage Index Asset Allocation Fund | | Financial Highlights |
(For a share outstanding throughout each period)
| | | | | | | | | | | | | | | | | | | | | | | | |
| Class C | | Six Months Ended
March 31, 2012
(Unaudited) | | | Year Ended September 30, | |
| | | 2011 | | | 2010 | | | 2009 | | | 2008 | | | 2007 | |
Net asset value, beginning of period | | $ | 11.06 | | | $ | 10.72 | | | $ | 10.00 | | | $ | 10.73 | | | $ | 14.07 | | | $ | 12.75 | |
Net investment income | | | 0.04 | | | | 0.09 | | | | 0.09 | 1 | | | 0.12 | 1 | | | 0.18 | 1 | | | 0.18 | 1 |
Net realized and unrealized gains (losses) on investments | | | 1.95 | | | | 0.34 | | | | 0.71 | | | | (0.73 | ) | | | (2.66 | ) | | | 1.56 | |
| | | | | | | | | | | | | | | | | | | | | | | | |
Total from investment operations | | | 1.99 | | | | 0.43 | | | | 0.80 | | | | (0.61 | ) | | | (2.48 | ) | | | 1.74 | |
Distributions to shareholders from | | | | | | | | | | | | | | | | | | | | | | | | |
Net investment income | | | (0.04 | ) | | | (0.09 | ) | | | (0.08 | ) | | | (0.12 | ) | | | (0.17 | ) | | | (0.18 | ) |
Net realized gains | | | 0.00 | | | | 0.00 | | | | 0.00 | | | | (0.00 | )2 | | | (0.69 | ) | | | (0.24 | ) |
| | | | | | | | | | | | | | | | | | | | | | | | |
Total distributions to shareholders | | | (0.04 | ) | | | (0.09 | ) | | | (0.08 | ) | | | (0.12 | ) | | | (0.86 | ) | | | (0.42 | ) |
Net asset value, end of period | | $ | 13.01 | | | $ | 11.06 | | | $ | 10.72 | | | $ | 10.00 | | | $ | 10.73 | | | $ | 14.07 | |
Total return3 | | | 18.03 | % | | | 4.02 | % | | | 7.99 | % | | | (5.51 | )% | | | (18.56 | )% | | | 13.91 | % |
Ratios to average net assets (annualized) | | | | | | | | | | | | | | | | | | | | | | | | |
Gross expenses | | | 1.94 | % | | | 1.93 | % | | | 2.01 | % | | | 2.03 | % | | | 2.03 | % | | | 2.00 | % |
Net expenses | | | 1.90 | % | | | 1.90 | % | | | 1.89 | % | | | 1.90 | % | | | 1.90 | % | | | 1.90 | % |
Net investment income | | | 0.67 | % | | | 0.79 | % | | | 0.89 | % | | | 1.39 | % | | | 1.42 | % | | | 1.37 | % |
Supplemental data | | | | | | | | | | | | | | | | | | | | | | | | |
Portfolio turnover rate | | | 11 | % | | | 18 | % | | | 28 | % | | | 43 | % | | | 45 | % | | | 16 | % |
Net assets, end of period (000’s omitted) | | | $16,785 | | | | $15,895 | | | | $17,839 | | | | $19,162 | | | | $24,975 | | | | $36,028 | |
| 1. | Calculated based upon average shares outstanding |
| 2. | Amount is less than $0.005. |
| 3. | Total return calculations do not include any sales charges. Returns for periods of less than one year are not annualized. |
The accompanying notes are an integral part of these financial statements.
| | | | | | |
| Financial Highlights | | Wells Fargo Advantage Index Asset Allocation Fund | | | 31 | |
(For a share outstanding throughout each period)
| | | | | | | | | | | | | | | | | | | | | | | | |
| Administrator Class | | Six Months Ended
March 31, 2012
(Unaudited) | | | Year Ended September 30, | |
| | | 2011 | | | 2010 | | | 2009 | | | 2008 | | | 2007 | |
Net asset value, beginning of period | | $ | 18.14 | | | $ | 17.57 | | | $ | 16.44 | | | $ | 17.65 | | | $ | 23.15 | | | $ | 20.97 | |
Net investment income | | | 0.17 | | | | 0.34 | | | | 0.31 | | | | 0.34 | 1 | | | 0.50 | 1 | | | 0.54 | 1 |
Net realized and unrealized gains (losses) on investments | | | 3.18 | | | | 0.58 | | | | 1.16 | | | | (1.20 | ) | | | (4.38 | ) | | | 2.57 | |
| | | | | | | | | | | | | | | | | | | | | | | | |
Total from investment operations | | | 3.35 | | | | 0.92 | | | | 1.47 | | | | (0.86 | ) | | | (3.88 | ) | | | 3.11 | |
Distributions to shareholders from | | | | | | | | | | | | | | | | | | | | | | | | |
Net investment income | | | (0.17 | ) | | | (0.35 | ) | | | (0.34 | ) | | | (0.35 | ) | | | (0.49 | ) | | | (0.53 | ) |
Net realized gains | | | 0.00 | | | | 0.00 | | | | 0.00 | | | | (0.00 | )2 | | | (1.13 | ) | | | (0.40 | ) |
| | | | | | | | | | | | | | | | | | | | | | | | |
Total distributions to shareholders | | | (0.17 | ) | | | (0.35 | ) | | | (0.34 | ) | | | (0.35 | ) | | | (1.62 | ) | | | (0.93 | ) |
Net asset value, end of period | | $ | 21.32 | | | $ | 18.14 | | | $ | 17.57 | | | $ | 16.44 | | | $ | 17.65 | | | $ | 23.15 | |
Total return3 | | | 18.59 | % | | | 5.18 | % | | | 9.02 | % | | | (4.61 | )% | | | (17.73 | )% | | | 15.10 | % |
Ratios to average net assets (annualized) | | | | | | | | | | | | | | | | | | | | | | | | |
Gross expenses | | | 1.02 | % | | | 1.02 | % | | | 1.09 | % | | | 1.11 | % | | | 1.11 | % | | | 1.07 | % |
Net expenses | | | 0.90 | % | | | 0.90 | % | | | 0.89 | % | | | 0.90 | % | | | 0.90 | % | | | 0.90 | % |
Net investment income | | | 1.67 | % | | | 1.79 | % | | | 1.89 | % | | | 2.39 | % | | | 2.43 | % | | | 2.35 | % |
Supplemental data | | | | | | | | | | | | | | | | | | | | | | | | |
Portfolio turnover rate | | | 11 | % | | | 18 | % | | | 28 | % | | | 43 | % | | | 45 | % | | | 16 | % |
Net assets, end of period (000’s omitted) | | | $26,954 | | | | $20,726 | | | | $17,630 | | | | $27,455 | | | | $34,802 | | | | $49,620 | |
| 1. | Calculated based upon average shares outstanding |
| 2. | Amount is less than $0.005 per share. |
| 3. | Returns for periods of less than one year are not annualized. |
The accompanying notes are an integral part of these financial statements.
| | | | |
| 32 | | Wells Fargo Advantage Index Asset Allocation Fund | | Notes to Financial Statements (Unaudited) |
1. ORGANIZATION
Wells Fargo Fund Trust (the “Trust”), a Delaware statutory trust organized on March 10, 1999, is an open-end management investment company registered under the Investment Company Act of 1940, as amended (the “1940 Act”). These financial statements report on Wells Fargo Advantage Index Asset Allocation Fund (the “Fund”) which is a diversified series of the Trust.
2. SIGNIFICANT ACCOUNTING POLICIES
The following significant accounting policies, which are consistently followed in the preparation of the financial statements of the Fund, are in conformity with U.S. generally accepted accounting principles which require management to make estimates and assumptions that affect the reported amounts of assets and liabilities, disclosure of contingent assets and liabilities at the date of the financial statements, and the reported amounts of revenues and expenses during the reporting period. Actual results could differ from those estimates.
Securities valuation
Investments in equity securities are valued each business day as of the close of regular trading on the New York Stock Exchange, which is usually 4:00 p.m. (Eastern Time). Securities which are traded on a national or foreign securities exchange are valued at the last reported sales price, except that securities listed on The Nasdaq Stock Market, Inc. (“Nasdaq”) are valued at the Nasdaq Official Closing Price (“NOCP”), and if no NOCP is available, then at the last reported sales price. If no sales price is shown on the Nasdaq, the bid price will be used. In the absence of any sale of securities listed on the Nasdaq, and in the case of other securities (including U.S. Government obligations, but excluding debt securities maturing in 60 days or less), the price will be deemed “stale” and the valuations will be determined in accordance with the Fund’s Fair Value Procedures.
Fixed income securities with original maturities exceeding 60 days are valued based on evaluated prices received from an independent pricing service approved by the Board of Trustees which may utilize both transaction data and market information such as yield, prices of securities of comparable quality, coupon rate, maturity, type of issue, trading characteristics and other market data. If valuations are not available from the pricing service or values received are deemed not representative of market value, values will be obtained from a third party broker-dealer or determined based on the Fund’s Fair Value Procedures.
Debt securities of sufficient credit quality with original maturities of 60 days or less generally are valued at amortized cost which approximates fair value. The amortized cost method involves valuing a security at its cost, plus accretion of discount or minus amortization of premium over the period until maturity.
Investments in open-end mutual funds and non-registered investment companies are generally valued at net asset value.
Investments which are not valued using any of the methods discussed above, are valued at their fair value, as determined by procedures established in good faith and approved by the Board of Trustees. The Board of Trustees has established a Valuation Committee comprised of the Trustees and has delegated to it the authority to take any actions regarding the valuation of portfolio securities that the Valuation Committee deems necessary in determining the fair value of portfolio securities, unless the responsibility has been delegated to the Management Valuation Team of Wells Fargo Funds Management, LLC (“Funds Management”). The Board of Trustees retains the authority to make or ratify any valuation decisions or approve any changes to the Fair Value Procedures as it deems appropriate. On a quarterly basis, the Board of Trustees considers for ratification any valuation actions taken by the Valuation Committee or the Management Valuation Team.
Valuations of fair valued prices are compared to the next actual sales price when available, or other appropriate market information to assess the continued appropriateness of the fair valuation methodology used. The securities are fair valued on a day-to-day basis, taking into consideration changes to appropriate market information and any significant changes to the input factors considered in the valuation process until there is a readily available price provided on the exchange or by an independent pricing service. Valuations received from an independent pricing service or broker quotes are periodically validated by comparisons to most recent trades and valuations provided by other independent pricing services in addition to the review of prices by the adviser and/or sub-adviser. Unobservable inputs used in determining fair valuations are identified based on the type of security, taking into consideration factors utilized by market participants in valuing the investment, knowledge about the issuer and the current market environment.
| | | | | | |
| Notes to Financial Statements (Unaudited) | | Wells Fargo Advantage Index Asset Allocation Fund | | | 33 | |
Security loans
The Fund may lend its securities from time to time in order to earn additional income in the form of fees or interest on securities received as collateral or the investment of any cash received as collateral. The Fund continues to receive interest or dividends on the securities loaned. The Fund receives collateral in the form of cash or securities with a value at least equal to the value of the securities on loan. The value of the loaned securities is determined at the close of each business day and any additional required collateral is delivered to the Fund on the next business day. In a securities lending transaction, the net asset value of the Fund will be affected by an increase or decrease in the value of the securities loaned and by an increase or decrease in the value of the instrument in which collateral is invested. The amount of securities lending activity undertaken by the Fund fluctuates from time to time. In the event of default or bankruptcy by the borrower, the Fund may be prevented from recovering the loaned securities or gaining access to the collateral or may experience delays or costs in doing so. In addition, the investment of any cash collateral received may lose all or part of its value. The Fund has the right under the lending agreement to recover the securities from the borrower on demand.
The Fund lends its securities through an unaffiliated securities lending agent. Cash collateral received in connection with its securities lending transactions is invested in Wells Fargo Securities Lending Cash Investments, LLC (the “Cash Collateral Fund”). The Cash Collateral Fund is exempt from registration under Section 3(c)(7) of the 1940 Act and is managed by Funds Management and is sub-advised by Wells Capital Management Incorporated (“Wells Capital Management”). Funds Management receives an advisory fee starting at 0.05% and declining to 0.01% as the average daily net assets of the Cash Collateral Fund increase. All of the fees received by Funds Management are paid to Wells Capital Management for its services as sub-adviser. The Cash Collateral Fund seeks to provide a positive return compared to the daily Fed Funds Open rate by investing in high-quality, U.S. dollar-denominated short-term money market instruments. Cash Collateral Fund investments are fair valued based upon the amortized cost valuation technique. Income earned from investment in the Cash Collateral Fund is included in securities lending income on the Statement of Operations.
For Wells Fargo Advantage Funds that participated in securities lending activity prior to February 13, 2009, certain structured investment vehicles purchased in a joint account by the former securities lending agent defaulted or were impaired. Certain of the Wells Fargo Advantage Funds still hold ownership interest in these structured investment vehicles, which have since been restructured as pass-through securities. If the Fund holds an ownership interest in such pass-through securities, information regarding this ownership interest can be found in the Portfolio of Investments under the category “Other”.
Futures contracts
The Fund may be subject to interest rate risk and equity price risk in the normal course of pursuing its investment objectives. The Fund may buy and sell futures contracts in order to gain exposure to, or protect against, changes in security values and interest rates. The primary risks associated with the use of futures contracts are the imperfect correlation between changes in market values of securities held by the Fund and the prices of futures contracts, and the possibility of an illiquid market.
Futures contracts are valued based upon their quoted daily settlement prices when available. The aggregate principal amounts of the contracts are not recorded in the financial statements. Fluctuations in the value of the contracts are recorded in the Statement of Assets and Liabilities as an asset or liability and in the Statement of Operations as unrealized gains or losses until the contracts are closed, at which point they are recorded as net realized gains or losses on futures contracts. With futures contracts, there is minimal counterparty risk to the Fund since futures are exchange traded and the exchange’s clearinghouse, as counterparty to all exchange traded futures, guarantees the futures against default.
Security transactions and income recognition
Securities transactions are recorded on a trade date basis. Realized gains or losses are reported on the basis of identified cost of securities delivered.
Interest income is accrued daily and bond discounts are accreted and premiums are amortized daily based on the effective interest method. To the extent debt obligations are placed on non-accrual status, any related interest income may be reduced by writing off interest receivables when the collection of all or a portion of interest has become doubtful based on consistently applied procedures. If the issuer subsequently resumes interest payments or when the collectability of interest is reasonably assured, the debt obligation is removed from non-accrual status.
Dividend income is recognized on the ex-dividend date.
| | | | |
| 34 | | Wells Fargo Advantage Index Asset Allocation Fund | | Notes to Financial Statements (Unaudited) |
Distributions to shareholders
Distributions to shareholders from net investment income and net realized gains, if any, are recorded on the ex-dividend date. Such distributions are determined in conformity with income tax regulations, which may differ from generally accepted accounting principles.
Federal and other taxes
The Fund intends to continue to qualify as a regulated investment company by distributing substantially all of its investment company taxable income and any net realized capital gains (after reduction for capital loss carryforwards) sufficient to relieve it from all, or substantially all, federal income taxes. Accordingly, no provision for federal income taxes was required.
The Fund’s income and federal excise tax returns and all financial records supporting those returns for the prior three fiscal years are subject to examination by the federal and Delaware revenue authorities. Management has analyzed the Fund’s tax positions taken on federal, state, and foreign tax returns for all open tax years and does not believe that there are any uncertain tax positions that require recognition of a tax liability.
Under the recently enacted Regulated Investment Company Modernization Act of 2010, the Fund is permitted to carry forward capital losses incurred in taxable years which began after December 22, 2010 for an unlimited period. However, any losses incurred are required to be utilized prior to the losses incurred in pre-enactment taxable years. As a result of this ordering rule, pre-enactment capital loss carryforwards may be more likely to expire unused. Additionally, post-enactment capital losses that are carried forward will retain their character as either short-term or long-term capital losses rather than being considered all short-term as under previous law.
At September 30, 2011, net capital loss carryforwards, which were available to offset future net realized capital gains, were as follows:
| | | | | | | | | | | | | | |
| Expiration | |
| 2016 | | | 2017 | | | 2018 | | | 2019 | |
| $ | 4,414,660 | | | $ | 90,934,458 | | | $ | 5,544,373 | | | $ | 8,466,937 | |
As of September 30, 2011, the Fund had $378,553 of current year deferred post-October capital losses, which would be treated as realized for tax purposes on the first day of the succeeding year.
Class allocations
The separate classes of shares offered by the Fund differ principally in applicable sales charges, distribution, shareholder servicing and administration fees. Shareholders of each class bear certain expenses that pertain to that particular class. All shareholders bear the common expenses of the Fund, earn income from the portfolio, and are allocated unrealized gains and losses pro rata based on the average daily net assets of each class, without distinction between share classes. Dividends are determined separately for each class based on income and expenses allocable to each class. Realized gains and losses are allocated to each class pro rata based upon the net assets of each class on the date realized. Differences in per share dividend rates generally result from the relative weightings of pro rata income and realized gain allocations and from differences in separate class expenses, including distribution, shareholder servicing and administration fees.
3. FAIR VALUATION MEASUREMENTS
Fair value measurements of investments are determined within a framework that has established a fair value hierarchy based upon the various data inputs utilized in determining the value of the Fund’s investments. The three-level hierarchy gives the highest priority to unadjusted quoted prices in active markets for identical assets or liabilities (Level 1) and the lowest priority to significant unobservable inputs (Level 3). The Fund’s investments are classified within the fair value hierarchy based on the lowest level of input that is significant to the fair value measurement. The inputs are summarized into three broad levels as follows:
| n | | Level 1 – quoted prices in active markets for identical securities |
| n | | Level 2 – other significant observable inputs (including quoted prices for similar securities, interest rates, prepayment speeds, credit risk, etc.) |
| n | | Level 3 – significant unobservable inputs (including the Fund’s own assumptions in determining the fair value of investments) |
| | | | | | |
| Notes to Financial Statements (Unaudited) | | Wells Fargo Advantage Index Asset Allocation Fund | | | 35 | |
The inputs or methodologies used for valuing securities are not necessarily an indication of the risk associated with investing in those securities.
As of March 31, 2012, the inputs used in valuing the Fund’s assets, which are carried at fair value, were as follows:
| | | | | | | | | | | | | | | | |
| Investments in Securities | | Quoted Prices
(Level 1) | | | Significant Other
Observable Inputs
(Level 2) | | | Significant
Unobservable Inputs
(Level 3) | | | Total | |
Agency securities | | $ | 0 | | | $ | 181,319 | | | $ | 0 | | | $ | 181,319 | |
Equity securities | | | | | | | | | | | | | | | | |
Common stocks | | | 424,154,559 | | | | 0 | | | | 0 | | | | 424,154,559 | |
Non-agency mortgage backed securities | | | 0 | | | | 32,516 | | | | 0 | | | | 32,516 | |
U.S. Treasury securities | | | 226,866,840 | | | | 0 | | | | 0 | | | | 226,866,840 | |
Other | | | 0 | | | | 0 | | | | 3,217,502 | | | | 3,217,502 | |
Short-term investments | | | | | | | | | | | | | | | | |
Investment companies | | | 21,113,012 | | | | 17,605,213 | | | | 0 | | | | 38,718,225 | |
U.S. Treasury securities | | | 16,136,819 | | | | 0 | | | | 0 | | | | 16,136,819 | |
| | | $ | 688,271,230 | | | $ | 17,819,048 | | | $ | 3,217,502 | | | $ | 709,307,780 | |
Further details on the major security types listed above can be found in the Portfolio of Investments.
As of March 31, 2012, the inputs used in valuing the Fund’s other financial instruments, which are carried at fair value, were as follows:
| | | | | | | | | | | | | | | | |
| Other financial instruments | | Quoted Prices
(Level 1) | | | Significant Other
Observable Inputs
(Level 2) | | | Significant
Unobservable Inputs
(Level 3) | | | Total | |
Futures contracts+ | | $ | 11,926,787 | | | $ | 0 | | | $ | 0 | | | $ | 11,926,787 | |
| + | Futures contracts are presented at the unrealized gains or losses on the instrument. |
Transfers in and transfers out are recognized at the end of the reporting period. For the six months ended March 31, 2012, the Fund did not have any significant transfers into/out of Level 1 and Level 2.
4. TRANSACTIONS WITH AFFILIATES AND OTHER EXPENSES
Advisory fee
The Trust has entered into an advisory contract with Funds Management, an indirect wholly owned subsidiary of Wells Fargo & Company (“Wells Fargo”). The adviser is responsible for implementing investment policies and guidelines and for supervising the sub-adviser, who is responsible for day-to-day portfolio management of the Fund.
Pursuant to the contract, Funds Management is entitled to receive an annual advisory fee starting at 0.60% and declining to 0.45% as the average daily net assets of the Fund increase. For the six months ended March 31, 2012, the advisory fee was equivalent to an annual rate of 0.59% of the Fund’s average daily net assets.
Funds Management has retained the services of certain sub-advisers to provide daily portfolio management to the Fund. The fees related to sub-advisory services are borne directly by Funds Management and do not increase the overall fees paid by the Fund. Wells Capital Management, an affiliate of Funds Management, is the sub-adviser to the Fund and is entitled to receive a fee from Funds Management at an annual rate starting at 0.15% and declining to 0.10% as the average daily net assets of the Fund increase.
Administration and transfer agent fees
The Trust has entered into an administration agreement with Funds Management. Under this agreement, for providing administrative services, which includes paying fees and expenses for services provided by the transfer agent, sub-transfer agents, omnibus account servicers and record-keepers, Funds Management is entitled to receive from the Fund an
| | | | |
| 36 | | Wells Fargo Advantage Index Asset Allocation Fund | | Notes to Financial Statements (Unaudited) |
annual fund level administration fee starting at 0.05% and declining to 0.03% as the average daily net assets of the Fund increase and a class level administration fee which is calculated based on the average daily net assets of each class as follows:
| | | | |
| | | Class Level
Administration Fee | |
Class A, Class B, Class C | | | 0.26 | % |
Administrator Class | | | 0.10 | |
Funds Management has contractually waived and/or reimbursed advisory and administration fees to the extent necessary to maintain certain net operating expense ratios for the Fund. Waiver of fees and/or reimbursement of expenses by Funds Management were made first from fund level expenses on a proportionate basis and then from class specific expenses. Funds Management has committed through January 31, 2013 to waive fees and/or reimburse expenses to the extent necessary to cap the Fund’s expenses at 1.15% for Class A, 1.90% for Class B, 1.90% for Class C and 0.90% for Administrator Class.
Distribution fees
The Trust has adopted a Distribution Plan for Class B, and Class C shares of the Fund pursuant to Rule 12b-1 under the 1940 Act. Distribution fees are charged to Class B and Class C shares and paid to Wells Fargo Funds Distributor, LLC, the principal underwriter, at an annual rate of 0.75% of the average daily net assets of Class B and Class C shares.
For the six months ended March 31, 2012, Wells Fargo Funds Distributor, LLC received $3,531 from the sale of Class A shares and $1,569 and $1,035 in contingent deferred sales charges from redemptions of Class B and Class C shares, respectively.
Shareholder servicing fees
The Trust has entered into contracts with one or more shareholder servicing agents, whereby each class of the Fund is charged a fee at an annual rate of 0.25% of the average daily net assets of each respective class.
A portion of these total shareholder servicing fees were paid to affiliates of Wells Fargo.
5. INVESTMENT PORTFOLIO TRANSACTIONS
Purchases and sales of investments, excluding short-term securities, for the six months ended March 31, 2012 were as follows:
| | | | | | | | | | | | | | |
| Purchases at Cost | | | Sales Proceeds | |
U.S.
Government | | | Non-U.S.
Government | | | U.S.
Government | | | Non-U.S.
Government | |
| $ | 32,786,429 | | | $ | 40,849,875 | | | $ | 46,590,436 | | | $ | 23,734,844 | |
6. DERIVATIVE TRANSACTIONS
During the six months ended March 31, 2012, the Fund entered into futures contracts to gain market exposure in certain asset classes consistent with an active asset allocative strategy.
At March 31, 2012, the Fund had long and short futures contracts outstanding as follows:
| | | | | | | | | | | | | | | | | | |
| Expiration Date | | | Contracts | | | Type | | | Contract
Value at
March 31, 2012 | | | Net Unrealized
Gains (Losses) | |
| | June 2012 | | | | 543 Long | | | | S&P 500 Index | | | $ | 190,484,400 | | | $ | 7,626,696 | |
| | June 2012 | | | | 63 Long | | |
| 30 year U.S.
Treasury Bond |
| | | 8,678,250 | | | | (133,077 | ) |
| | June 2012 | | | | 1,165 Short | | |
| 30 year U.S.
Treasury Bond |
| | | 160,478,750 | | | | 4,433,168 | |
The Fund had an average notional amount of $177,125,719 and $159,514,463 in long futures and short futures contracts, respectively, during the six months ended March 31, 2012.
| | | | | | |
| Notes to Financial Statements (Unaudited) | | Wells Fargo Advantage Index Asset Allocation Fund | | | 37 | |
The fair value of derivative instruments as of March 31, 2012 was as follows for the Fund:
| | | | | | | | | | | | |
| | | Asset Derivatives | | | Liability Derivatives | |
| | | Balance Sheet Location | | Fair Value | | | Balance Sheet Location | | Fair Value | |
Interest rate contracts | | Net assets – Net unrealized gains on investments | | $ | 4,433,168 | * | | Net assets – Net unrealized gains on investments | | $ | (133,077 | )* |
Equity contracts | | Net assets – Net unrealized gains on investments | | | 7,626,696 | * | | Net assets – Net unrealized gains on investments | | | 0 | * |
| | | | | $ | 12,059,864 | | | | | $ | (133,077 | ) |
| * | Amount represents cumulative unrealized gains (losses) on futures contracts. Only the variation margin as of March 31, 2012 is reported separately on the Statement of Assets and Liabilities. |
The effect of derivative instruments on the Statement of Operations for the six months ended March 31, 2012 was as follows for the Fund:
| | | | | | | | |
| | | Amount of Realized
Gains (Losses) on
Derivatives | | | Change in Unrealized
Gains (Losses) on
Derivatives | |
Interest rate contracts | | $ | (8,884,545 | ) | | $ | 12,083,036 | |
Equity contracts | | | 25,643,128 | | | | 15,085,196 | |
| | | $ | 16,758,583 | | | $ | 27,168,232 | |
7. BANK BORROWINGS
The Trust (excluding the money market funds) and Wells Fargo Variable Trust are parties to a $150,000,000 revolving credit agreement with State Street Bank and Trust Company, whereby the Fund is permitted to use bank borrowings for temporary or emergency purposes, such as to fund shareholder redemption requests. Interest under the credit agreement is charged to the Fund based on a borrowing rate equal to the higher of the Federal Funds rate in effect on that day plus 1.25% or the overnight LIBOR rate in effect on that day plus 1.25%. In addition, an annual commitment fee equal to 0.10% of the unused balance is allocated to each participating fund. For the six months ended March 31, 2012, the Fund paid $651 in commitment fees.
For the six months ended March 31, 2012, there were no borrowings by the Fund under the agreement.
8. INDEMNIFICATION
Under the Trust’s organizational documents, the officers and directors are indemnified against certain liabilities that may arise out of performance of their duties to the Trust. Additionally, in the normal course of business, the Trust may enter into contracts with service providers that contain a variety of indemnification clauses. The Trust’s maximum exposure under these arrangements is dependent on future claims that may be made against the Fund and, therefore, cannot be estimated.
9. NEW ACCOUNTING PRONOUNCEMENTS
In December 2011, the Financial Accounting Standards Board (“FASB”) issued Accounting Standard Update (“ASU”) No. 2011-11, Disclosures about Offsetting Assets and Liabilities. ASU 2011-11, which amends FASB ASC Topic 210 Balance Sheet, creates new disclosure requirements which require entities to disclose both gross and net information for derivatives and other financial instruments that are either offset in the Statement of Assets and Liabilities or subject to an enforceable master netting arrangement or similar agreement. The disclosure requirements are effective for interim and annual reporting periods beginning on or after January 1, 2013. Management is currently evaluating the impact of the update’s adoption on the Fund’s financial statement disclosures.
In May 2011, FASB issued ASU No. 2011-04 “Amendments to Achieve Common Fair Value Measurement and Disclosure Requirements in U.S. GAAP and IFRSs”. ASU No. 2011-04 amends FASB ASC Topic 820, Fair Value Measurements and Disclosures, to establish common requirements for measuring fair value and for disclosing information about fair value measurements in accordance with GAAP. The ASU is effective prospectively for interim and annual periods beginning after December 15, 2011. Management expects that adoption of the ASU will result in additional disclosures in the financial statements, as applicable.
| | | | |
| 38 | | Wells Fargo Advantage Index Asset Allocation Fund | | Notes to Financial Statements (Unaudited) |
In April 2011, FASB issued ASU No. 2011-03 “Reconsideration of Effective Control for Repurchase Agreements”. ASU No. 2011-03 amends FASB ASC Topic 860, Transfers and Servicing, specifically the criteria required to determine whether a repurchase agreement (repo) and similar agreements should be accounted for as sales of financial assets or secured borrowings with commitments. ASU No. 2011-03 changes the assessment of effective control by focusing on the transferor’s contractual rights and obligations and removing the criterion to assess its ability to exercise those rights or honor those obligations. This could result in changes to the way entities account for certain transactions including repurchase agreements, mortgage dollar rolls and reverse repurchase agreements. The ASU will become effective on a prospective basis for new transfers and modifications to existing transactions as of the beginning of the first interim or annual period beginning on or after December 15, 2011. Management has evaluated the impact of adopting the ASU and expects no significant changes.
| | | | | | |
| Other Information (Unaudited) | | Wells Fargo Advantage Index Asset Allocation Fund | | | 39 | |
PROXY VOTING INFORMATION
A description of the policies and procedures that the Fund uses to determine how to vote proxies relating to portfolio securities is available without charge, upon request, by calling 1-800-222-8222, visiting our Web site at wellsfargoadvantagefunds.com, or visiting the SEC Web site at sec.gov. Information regarding how the Fund voted proxies relating to portfolio securities during the most recent 12-month period ended June 30 is available without charge on the Fund’s Web site at wellsfargoadvantagefunds.com or by visiting the SEC Web site at sec.gov.
PORTFOLIO HOLDINGS INFORMATION
The complete portfolio holdings for the Fund are publicly available on the Fund’s Web site (wellsfargoadvantagefunds.com) on a monthly, 30-day or more delayed basis. In addition, top ten holdings information for the Fund is publicly available on the Fund’s Web site on a monthly, seven-day or more delayed basis. The Fund files its complete schedule of portfolio holdings with the SEC for the first and third quarters of each fiscal year on Form N-Q, which is available without charge by visiting the SEC Web site at sec.gov. In addition, the Fund’s Form N-Q may be reviewed and copied at the SEC’s Public Reference Room in Washington, DC, and at regional offices in New York City, at 233 Broadway, and in Chicago, at 175 West Jackson Boulevard, Suite 900. Information about the Public Reference Room may be obtained by calling 1-800-SEC-0330.
| | | | |
| 40 | | Wells Fargo Advantage Index Asset Allocation Fund | | Other Information (Unaudited) |
BOARD OF TRUSTEES
The following table provides basic information about the Board of Trustees (the “Trustees”) of the Trust and Officers of the Trust. This table should be read in conjunction with the Prospectus and the Statement of Additional Information1 of the Fund. Each of the Trustees and Officers listed below acts in identical capacities for the Wells Fargo Advantage family of funds, which consists of 137 funds comprising the Wells Fargo Funds Trust, Wells Fargo Variable Trust, Wells Fargo Master Trust and four closed-end funds (collectively the “Fund Complex”). All of the Trustees are also Members of the Audit and Governance Committees of each Trust in the Fund Complex. The mailing address of each Trustee and Officer is 525 Market Street, 12th Floor, San Francisco, CA 94105. Each Trustee and Officer serves an indefinite term, however, each Trustee serves such term until reaching the mandatory retirement age established by the Trustees.
Independent Trustees
| | | | | | |
Name and Year of Birth | | Position Held and Length of Service | | Principal Occupations During Past Five Years | | Other Directorships During
Past Five Years |
Peter G. Gordon
(Born 1942) | | Trustee, since 1998; Chairman, since 2005 (Lead Trustee since 2001) | | Co-Founder, Retired Chairman, President and CEO of Crystal Geyser Water Company. Trustee Emeritus, Colby College | | Asset Allocation Trust |
Isaiah Harris, Jr.
(Born 1952) | | Trustee, since 2009 | | Retired. Prior thereto, President and CEO of BellSouth Advertising and Publishing Corp. from 2005 to 2007, President and CEO of BellSouth Enterprises from 2004 to 2005 and President of BellSouth Consumer Services from 2000 to 2003. Emeritus member of the Iowa State University Foundation Board of Governors. Emeritus Member of the Advisory Board of Iowa State University School of Business. Mr. Harris is a certified public accountant. | | CIGNA Corporation; Deluxe Corporation; Asset Allocation Trust |
Judith M. Johnson
(Born 1949) | | Trustee, since 2008 | | Retired. Prior thereto, Chief Executive Officer and Chief Investment Officer of Minneapolis Employees Retirement Fund from 1996 to 2008. Ms. Johnson is an attorney, certified public accountant and a certified managerial accountant. | | Asset Allocation Trust |
Leroy Keith, Jr.
(Born 1939) | | Trustee, since 2010 | | Chairman, Bloc Global Services (development and construction). Trustee of the Evergreen Funds from 1983 to 2010. Former Managing Director, Almanac Capital Management (commodities firm), former Partner, Stonington Partners, Inc. (private equity fund), former Director, Obagi Medical Products Co. and former Director, Lincoln Educational Services. | | Trustee, Virtus Fund Complex (consisting of 40 portfolios as of 12/31/11); Asset Allocation Trust |
David F. Larcker
(Born 1950) | | Trustee, since 2009 | | James Irvin Miller Professor of Accounting at the Graduate School of Business, Stanford University, Director of Corporate Governance Research Program and Senior Faculty of The Rock Center for Corporate Governance since 2006. From 2005 to 2008, Professor of Accounting at the Graduate School of Business, Stanford University. Prior thereto, Ernst & Young Professor of Accounting at The Wharton School, University of Pennsylvania from 1985 to 2005. | | Asset Allocation Trust |
Olivia S. Mitchell
(Born 1953) | | Trustee, since 2006 | | International Foundation of Employee Benefit Plans Professor, Wharton School of the University of Pennsylvania since 1993. Director of Wharton’s Pension Research Council and Boettner Center on Pensions & Retirement Research, and Research Associate at the National Bureau of Economic Research. Previously, Cornell University Professor from 1978 to 1993. | | Asset Allocation Trust |
| | | | | | |
| Other Information (Unaudited) | | Wells Fargo Advantage Index Asset Allocation Fund | | | 41 | |
| | | | | | |
Name and Year of Birth | | Position Held and Length of Service | | Principal Occupations During Past Five Years | | Other Directorships During
Past Five Years |
Timothy J. Penny
(Born 1951) | | Trustee, since 1996 | | President and CEO of Southern Minnesota Initiative Foundation, a non-profit organization, since 2007 and Senior Fellow at the Humphrey Institute Policy Forum at the University of Minnesota since 1995. Member of the Board of Trustees of NorthStar Education Finance, Inc., a non-profit organization, since 2007. | | Asset Allocation Trust |
Michael S. Scofield
(Born 1943) | | Trustee, since 2010 | | Served on the Investment Company Institute’s Board of Governors and Executive Committee from 2008-2011 as well the Governing Council of the Independent Directors Council from 2006-2011 and the Independent Directors Council Executive Committee from 2008-2011. Chairman of the IDC from 2008-2010. Institutional Investor (Fund Directions) Trustee of Year in 2007. Trustee of the Evergreen Funds (and its predecessors) from 1984 to 2010. Chairman of the Evergreen Funds from 2000-2010. Former Trustee of the Mentor Funds. Retired Attorney, Law Offices of Michael S. Scofield and former Director and Chairman, Branded Media Corporation (multi-media branding company). | | Asset Allocation Trust |
Donald C. Willeke
(Born 1940) | | Trustee, since 1996 | | Principal of the law firm of Willeke & Daniels. General Counsel of the Minneapolis Employees Retirement Fund from 1984 until its consolidation into the Minnesota Public Employees Retirement Association on June 30, 2010. Director and Vice Chair of The Free Trust (non-profit corporation). Director of the American Chestnut Foundation (non-profit corporation). | | Asset Allocation Trust |
Officers
| | | | | | |
Name and Year of Birth | | Position Held and
Length of Service | | Principal Occupations During Past Five Years | | |
Karla M. Rabusch
(Born 1959) | | President, since 2003 | | Executive Vice President of Wells Fargo Bank, N.A. and President of Wells Fargo Funds Management, LLC since 2003. Senior Vice President and Chief Administrative Officer of Wells Fargo Funds Management, LLC from 2001 to 2003. | | |
C. David Messman
(Born 1960) | | Secretary, since 2000; Chief Legal Counsel, since 2003 | | Senior Vice President and Secretary of Wells Fargo Funds Management, LLC since 2001. Vice President and Managing Senior Counsel of Wells Fargo Bank, N.A. since 1996. | | |
Kasey Phillips
(Born 1970) | | Treasurer, since 2009 | | Senior Vice President of Wells Fargo Funds Management, LLC since 2009. Senior Vice President of Evergreen Investment Management Company, LLC from 2006 to 2010. Treasurer of the Evergreen Funds from 2005 to 2010. | | |
David Berardi
(Born 1975) | | Assistant Treasurer, since 2009 | | Vice President of Wells Fargo Funds Management, LLC since 2009. Vice President of Evergreen Investment Management Company, LLC from 2008 to 2010. Assistant Vice President of Evergreen Investment Services, Inc. from 2004 to 2008. Manager of Fund Reporting and Control for Evergreen Investment Management Company, LLC from 2004 to 2010. | | |
Jeremy DePalma
(Born 1974) | | Assistant Treasurer, since 2009 | | Senior Vice President of Wells Fargo Funds Management, LLC since 2009. Senior Vice President of Evergreen Investment Management Company, LLC from 2008 to 2010. Vice President, Evergreen Investment Services, Inc. from 2004 to 2007. Head of the Fund Reporting and Control Team within Fund Administration from 2005 to 2010. | | |
Debra Ann Early
(Born 1964) | | Chief Compliance Officer, since 2007 | | Chief Compliance Officer of Wells Fargo Funds Management, LLC since 2007. Chief Compliance Officer of Parnassus Investments from 2005 to 2007. Chief Financial Officer of Parnassus Investments from 2004 to 2007 and Senior Audit Manager of PricewaterhouseCoopers LLP from 1998 to 2004. | | |
| 1. | The Statement of Additional Information includes additional information about the Trustees and is available, without charge, upon request, by calling 1-800-222-8222 or by visiting the Web site at wellsfargoadvantagefunds.com. |
| | | | |
| 42 | | Wells Fargo Advantage Index Asset Allocation Fund | | Other Information (Unaudited) |
BOARD CONSIDERATION OF INVESTMENT ADVISORY AND SUB-ADVISORY AGREEMENTS:
Under Section 15 of the Investment Company Act of 1940 (the “1940 Act”), the Board of Trustees (the “Board”) of Wells Fargo Funds Trust (the “Trust”), all the members of which have no direct or indirect interest in the investment advisory and sub-advisory agreements and are not “interested persons” of the Trust, as defined in the 1940 Act (the “Independent Trustees”), must determine whether to approve the continuation of the Trust’s investment advisory and sub-advisory agreements. In this regard, at an in person meeting held on March 29-30, 2012 (the “Meeting”), the Board reviewed and re-approved: (i) an investment advisory agreement with Wells Fargo Funds Management, LLC (“Funds Management”) for Wells Fargo Advantage Index Asset Allocation Fund (the “Fund”) and (ii) an investment sub-advisory agreement with Wells Capital Management Incorporated (“Wells Capital Management”) for the Fund. The investment advisory agreement with Funds Management and the investment sub-advisory agreement with Wells Capital Management are collectively referred to as the “Advisory Agreements.”
At the Meeting, the Board considered the factors and reached the conclusions described below relating to the selection of Funds Management and Wells Capital Management and the continuation of the Advisory Agreements. Prior to the Meeting, the Trustees conferred extensively among themselves and with representatives of Funds Management about these matters. The Board also met throughout the year and received information that was useful to them in considering the continuation of the Advisory Agreements. The Independent Trustees were assisted in their evaluation of the Advisory Agreements by independent legal counsel, from whom they received separate legal advice and with whom they met separately from Funds Management.
In providing information to the Board, Funds Management and Wells Capital Management were guided by a detailed set of requests submitted by the Independent Trustees’ independent legal counsel on their behalf at the start of the Board’s annual contract renewal process earlier in 2012. In approving the Advisory Agreements, the Board did not identify any particular information or consideration that was all-important or controlling, and each Trustee likely attributed different weights to various factors.
Nature, extent and quality of services
The Board received and considered various information regarding the nature, extent and quality of services provided to the Fund by Funds Management and Wells Capital Management under the Advisory Agreements. The Board also received and considered, among other things, information about the background and experience of senior management of Funds Management, and the qualifications, backgrounds, tenures and responsibilities of the portfolio managers primarily responsible for the day-to-day portfolio management of the Fund.
The Board evaluated the ability of Funds Management and Wells Capital Management, based on their respective financial condition, resources, reputation and other attributes, to attract and retain qualified investment professionals, including research, advisory, and supervisory personnel. The Board further considered the compliance programs and compliance records of Funds Management and Wells Capital Management. In addition, the Board took into account the administrative services provided to the Fund by Funds Management and its affiliates.
The Board’s decision to approve the continuation of the Advisory Agreements was based on a comprehensive evaluation of all of the information provided to it. In considering these matters, the Board considered not only the specific information presented in connection with the Meeting, but also the knowledge gained over time through interaction with Funds Management and Wells Capital Management about various topics, including Funds Management’s oversight of service providers. The above factors, together with those referenced below, are some of the most important, but not necessarily all, factors considered by the Board in concluding that the nature, extent and quality of the investment advisory services provided to the Fund by Funds Management and Wells Capital Management supported the re-approval of the Advisory Agreements. Although the Board considered the continuation of the Advisory Agreements for the Fund as part of the larger process of considering the continuation of the advisory agreements for all of the funds in the complex, its decision to continue the Advisory Agreements for the Fund was ultimately made on a fund-by-fund basis.
Fund performance and expenses
The Board considered the performance results for the Fund over various time periods ended December 31, 2011. The Board also considered these results in comparison to the median performance of a universe of relevant funds (the “Universe”) that was determined by Lipper Inc. (“Lipper”) to be similar to the Fund, and in comparison to the Fund’s
| | | | | | |
| Other Information (Unaudited) | | Wells Fargo Advantage Index Asset Allocation Fund | | | 43 | |
benchmark index and to other comparative data. Lipper is an independent provider of investment company data. The Board received a description of the methodology used by Lipper to select the mutual funds in the Universe. The Board noted that, other than the five-year performance period for class A, the performance of the Fund was higher than or in range of the median performance of the Universe for all periods under review. The Board also noted that the performance of the Fund was higher than or in range of its benchmark index, the Lipper Mixed-Asset Target Allocation Moderate Funds Index, for the periods under review.
The Board received and considered information regarding the Fund’s contractual advisory fee and net operating expense ratios and their various components, including actual management fees (which reflect fee waivers, if any), transfer agent, custodian and other non-management fees, Rule 12b-1 and non-Rule 12b-1 fees, service fees and fee waiver and expense reimbursement arrangements. The Board also considered these ratios in comparison to the median ratios of an expense Universe and a narrower expense group of mutual funds (each, an “Expense Group”) that was determined by Lipper to be similar to the Fund. The Board received a description of the methodology used by Lipper to select the mutual funds in the Fund’s Expense Group. The Board noted that the net operating expense ratios of the Fund were in range or lower than the median net operating expense ratios of the Fund’s Expense Group.
Based on the above-referenced considerations and other factors, the Board concluded that the overall performance and expense structure of the Fund supported the re-approval of the Advisory Agreements for the Fund.
Investment advisory and sub-advisory fee rates
The Board reviewed and considered the contractual investment advisory fee rate that is payable by the Fund to Funds Management for investment advisory services (the “Advisory Agreement Rate”), both on a stand-alone basis and on a combined basis with the Fund’s administration fee rate. The Board took into account the separate administrative and other services covered by the administration fee rate. The Board also reviewed and considered the contractual investment sub-advisory fee rate that is payable by Funds Management to Wells Capital Management for investment sub-advisory services (the “Sub-Advisory Agreement Rate”). In addition, the Board reviewed and considered the existing fee waiver/cap arrangements applicable to the Advisory Agreement Rate and considered the Advisory Agreement Rate after taking the waivers/caps into account (the “Net Advisory Rate”).
The Board received and considered information comparing the Advisory Agreement Rate and Net Advisory Rate with those of other funds in the Fund’s Expense Group median. The Board noted that while the Advisory Agreement Rate and Net Advisory Rate for the A share class of the Fund were higher than the median rates for its Expense Group, the Advisory Agreement Rate and Net Advisory Rate for the Administrator share class were in range of the median rates for its Expense Group.
The Board also received and considered information about the nature and extent of services offered and fee rates charged by Funds Management and Wells Capital Management to other types of clients. In this regard, the Board received information about differences between the services, and the compliance, reporting, and other legal burdens and risks of providing investment advice to mutual funds and those associated with providing advice to non-mutual fund clients such as collective funds or institutional separate accounts.
The Board determined that the Advisory Agreement Rate for the Fund, both with and without an administration fee rate and before and after waivers, was reasonable in light of the Fund’s Expense Group information, the net expense ratio commitments, the services covered by the Advisory Agreements and other information provided. The Board also reviewed and considered the Sub-Advisory Agreement Rate and concluded that the Sub-Advisory Agreement Rate was reasonable in light of the services covered by the sub-advisory agreement and other information provided.
Profitability
The Board received and considered a profitability analysis of Funds Management, as well as an analysis of the profitability to the collective Wells Fargo businesses that provide services to the Fund. It considered that the information provided to it was necessarily estimated, and that the profitability information provided to it, especially on a fund-by-fund basis, did not necessarily provide a precise tool for evaluating the appropriateness of the Fund’s Advisory Agreement Rate in isolation. It noted that the levels of profitability reported on a fund-by-fund basis varied widely, depending on, among other things, the size and type of fund. The Board concluded that the profitability reported by Funds Management was not unreasonable.
| | | | |
| 44 | | Wells Fargo Advantage Index Asset Allocation Fund | | Other Information (Unaudited) |
The Board did not consider separate profitability information with respect to Wells Capital Management, because, as an affiliate of Funds Management, its profitability information was subsumed in the collective Wells Fargo profitability analysis provided by Funds Management.
Economies of scale
With respect to possible economies of scale, the Board reviewed the breakpoints in the Fund’s advisory fee structure, which operate generally to reduce the effective Advisory Agreement Rate of the Fund (as a percentage of Fund assets) as the Fund grows in size. It considered that, as a fund shrinks in size, breakpoints conversely result in increasing fee levels. The Board noted that it would have on-going opportunities to review the appropriate levels of breakpoints in the future, and concluded that the breakpoints as implemented appeared to be a reasonable step toward sharing economies of scale, if any, with the Fund. However, the Board acknowledged the inherent limitations of any analysis of an investment adviser’s economies of scale and of any attempt to correlate breakpoints with such economies, stemming largely from the Board’s understanding that economies of scale are realized, if at all, by an investment adviser across a variety of products and services, not just with respect to a single fund.
Other benefits to Funds Management and Wells Capital Management
The Board received and considered information regarding potential “fall-out” or ancillary benefits received by Funds Management and its affiliates, including Wells Capital Management, as a result of their relationship with the Fund. Ancillary benefits could include, among others, benefits directly attributable to the relationship of Funds Management and Wells Capital Management with the Fund and benefits potentially derived from an increase in Funds Management’s and Wells Capital Management’s business as a result of their relationship with the Fund (such as the ability to market to shareholders other financial products offered by Funds Management and its affiliates, including Wells Capital Management).
The Board considered that Wells Fargo Funds Distributor, LLC, an affiliate of Funds Management, serves as distributor to the Fund and receives certain compensation for those services. The Board noted that various financial institutions, including affiliates of Funds Management, may receive distribution-related fees, shareholder servicing payments (including amounts derived from payments under Rule 12b-1 plans) and sub-transfer agency fees in respect of shares sold or held through them and services provided.
The Board also reviewed information about whether and to what extent soft dollar credits are sought and how any such credits are utilized and any benefits that may be realized by using an affiliated broker.
Other factors and broader review
The Board also considered the markets for distribution of the Fund’s shares, including the channels through which the Fund’s shares are offered and sold. The Board noted that the Fund is part of one of the few fund families that have both direct-to-fund and intermediary distribution channels. As discussed above, the Board reviews detailed materials received from Funds Management and Wells Capital Management annually as part of the re-approval process under Section 15 of the 1940 Act and also reviews and assesses information about the quality of the services that the Fund receives throughout the year. In this regard, the Board has reviewed reports of Funds Management at each of its quarterly meetings, which include, among other things, portfolio reviews and performance reports. In addition, the Board confers with portfolio managers at various times throughout the year.
Conclusion
After considering the above-described factors and based on its deliberations and its evaluation of the information described above, the Board unanimously approved the continuation of the Advisory Agreements for an additional one-year period.
| | | | | | |
| List of Abbreviations | | Wells Fargo Advantage Index Asset Allocation Fund | | | 45 | |
The following is a list of common abbreviations for terms and entities which may have appeared in this report.
| ACB | — Agricultural Credit Bank |
| ADR | — American Depository Receipt |
| ADS | — American Depository Shares |
| AGC-ICC | — Assured Guaranty Corporation - Insured Custody Certificates |
| AGM | — Assured Guaranty Municipal |
| AMBAC | — American Municipal Bond Assurance Corporation |
| AMT | — Alternative Minimum Tax |
| BAN | — Bond Anticipation Notes |
| BHAC | — Berkshire Hathaway Assurance Corporation |
| CAB | — Capital Appreciation Bond |
| CCAB | — Convertible Capital Appreciation Bond |
| CDA | — Community Development Authority |
| CDO | — Collateralized Debt Obligation |
| COP | — Certificate of Participation |
| DRIVER | — Derivative Inverse Tax-Exempt Receipts |
| DW&P | — Department of Water & Power |
| DWR | — Department of Water Resources |
| ECFA | — Educational & Cultural Facilities Authority |
| EDA | — Economic Development Authority |
| EDFA | — Economic Development Finance Authority |
| ETF | — Exchange-Traded Fund |
| FFCB | — Federal Farm Credit Bank |
| FGIC | — Financial Guaranty Insurance Corporation |
| FHA | — Federal Housing Authority |
| FHLB | — Federal Home Loan Bank |
| FHLMC | — Federal Home Loan Mortgage Corporation |
| FICO | — The Financing Corporation |
| FNMA | — Federal National Mortgage Association |
| GDR | — Global Depository Receipt |
| GNMA | — Government National Mortgage Association |
| HCFR | — Healthcare Facilities Revenue |
| HEFA | — Health & Educational Facilities Authority |
| HEFAR | — Higher Education Facilities Authority Revenue |
| HFA | — Housing Finance Authority |
| HFFA | — Health Facilities Financing Authority |
| IBC | — Insured Bond Certificate |
| IDA | — Industrial Development Authority |
| IDAG | — Industrial Development Agency |
| IDR | — Industrial Development Revenue |
| KRW | — Republic of Korea Won |
| LIBOR | — London Interbank Offered Rate |
| LLC | — Limited Liability Company |
| LLP | — Limited Liability Partnership |
| MBIA | — Municipal Bond Insurance Association |
| MFHR | — Multi-Family Housing Revenue |
| MSTR | — Municipal Securities Trust Receipts |
| MUD | — Municipal Utility District |
| NATL-RE | — National Public Finance Guarantee Corporation |
| PCFA | — Pollution Control Finance Authority |
| PCR | — Pollution Control Revenue |
| PFA | — Public Finance Authority |
| PFFA | — Public Facilities Financing Authority |
| PFOTER | — Puttable Floating Option Tax-Exempt Receipts |
| plc | — Public Limited Company |
| PUTTER | — Puttable Tax-Exempt Receipts |
| R&D | — Research & Development |
| RDA | — Redevelopment Authority |
| RDFA | — Redevelopment Finance Authority |
| REIT | — Real Estate Investment Trust |
| ROC | — Reset Option Certificates |
| SAVRS | — Select Auction Variable Rate Securities |
| SBA | — Small Business Authority |
| SFHR | — Single Family Housing Revenue |
| SFMR | — Single Family Mortgage Revenue |
| SPDR | — Standard & Poor’s Depositary Receipts |
| STRIPS | — Separate Trading of Registered Interest and Principal Securities |
| TAN | — Tax Anticipation Notes |
| TIPS | — Treasury Inflation-Protected Securities |
| TRAN | — Tax Revenue Anticipation Notes |
| TCR | — Transferable Custody Receipts |
| TTFA | — Transportation Trust Fund Authority |
| TVA | — Tennessee Valley Authority |
| XLCA | — XL Capital Assurance |
This page is intentionally left blank.


FOR MORE INFORMATION
More information about Wells Fargo Advantage Funds is available free upon request. To obtain literature, please write, e-mail, visit the Fund’s Web site, or call:
Wells Fargo Advantage Funds
P.O. Box 8266
Boston, MA 02266-8266
E-mail: wfaf@wellsfargo.com
Web site: wellsfargoadvantagefunds.com
Individual investors: 1-800-222-8222
Retail investment professionals: 1-888-877-9275
Institutional investment professionals: 1-866-765-0778
This report and the financial statements contained herein are submitted for the general information of the shareholders of Wells Fargo Advantage Funds. If this report is used for promotional purposes, distribution of the report must be accompanied or preceded by a current prospectus. For a prospectus containing more complete information, including charges and expenses, call 1-800-222-8222 or visit the Fund’s Web site at wellsfargoadvantagefunds.com. Please consider the investment objectives, risks, charges, and expenses of the investment carefully before investing. This and other information about Wells Fargo Advantage Funds can be found in the current prospectus. Read the prospectus carefully before you invest or send money.
Wells Fargo Funds Management, LLC, a wholly owned subsidiary of Wells Fargo & Company, provides investment advisory and administrative services for Wells Fargo Advantage Funds. Other affiliates of Wells Fargo & Company provide subadvisory and other services for the Funds. The Funds are distributed by Wells Fargo Funds Distributor, LLC, Member FINRA/SIPC, an affiliate of Wells Fargo & Company.
NOT FDIC INSURED ¡ NO BANK GUARANTEE ¡ MAY LOSE VALUE
© 2012 Wells Fargo Funds Management, LLC. All rights reserved.
| | |
 | | 208986 05-12 SA227/SAR227 3-12 |

Wells Fargo Advantage
C&B Mid Cap Value Fund

Semi-Annual Report
March 31, 2012

Reduce clutter. Save trees.
Sign up for electronic delivery of prospectuses and shareholder reports at wellsfargo.com/advantagedelivery
Contents
The views expressed and any forward-looking statements are as of March 31, 2012, unless otherwise noted, and are those of the Fund managers and/or Wells Fargo Funds Management, LLC. Discussions of individual securities, or the markets generally, or any Wells Fargo Advantage Fund are not intended as individual recommendations. Future events or results may vary significantly from those expressed in any forward-looking statements; the views expressed are subject to change at any time in response to changing circumstances in the market. Wells Fargo Funds Management, LLC, disclaims any obligation to publicly update or revise any views expressed or forward-looking statements.
NOT FDIC INSURED ¡ NO BANK GUARANTEE ¡ MAY LOSE VALUE

WELLS FARGO INVESTMENT HISTORY
| | |
| |
| 1932 | | Keystone creates one of the first mutual fund families. |
| |
| 1971 | | Wells Fargo & Company introduces one of the first institutional index funds. |
| |
| 1978 | | Wells Fargo applies Markowitz and Sharpe’s research on Modern Portfolio Theory to introduce one of the industry’s first Tactical Asset Allocation (TAA) models in institutional separately managed accounts. |
| |
| 1984 | | Wells Fargo Stagecoach Funds launches its first asset allocation fund. |
| |
| 1989 | | The Tactical Asset Allocation (TAA) Model is first applied to Wells Fargo’s asset allocation mutual funds. |
| |
| 1994 | | Wells Fargo introduces the LifePath Funds, one of the first suites of target date funds (now the Wells Fargo Advantage Dow Jones Target Date FundsSM). |
| |
| 1996 | | Evergreen Investments and Keystone Funds merge. |
| |
| 1997 | | Wells Fargo launches Wells Fargo Advantage WealthBuilder PortfoliosSM, a fund-of-funds suite of products that includes the use of quantitative models to shift assets among investment styles. |
| |
| 1999 | | Norwest Advantage Funds and Stagecoach Funds are reorganized into Wells Fargo Funds after the merger of Norwest and Wells Fargo. |
| |
| 2002 | | Evergreen Retail and Evergreen Institutional companies form the umbrella asset management company, Evergreen Investments. |
| |
| 2005 | | The integration of Strong Funds with Wells Fargo Funds creates Wells Fargo Advantage Funds, resulting in one of the top 20 mutual fund companies in the United States. |
| |
| 2006 | | Wells Fargo Advantage Funds relaunches the target date product line as Wells Fargo Advantage Dow Jones Target Date Funds. |
| |
| 2010 | | The mergers and reorganizations of Evergreen and Wells Fargo Advantage mutual funds are completed, unifying the families under the brand of Wells Fargo Advantage Funds. |
Wells Fargo Advantage Funds®
Wells Fargo Advantage Funds skillfully guides institutions, financial advisors, and individuals through the investment terrain to help them reach their financial objectives. Everything we do on behalf of investors is backed by our unique combination of qualifications.
Strength
Our organization is built on the standards of integrity and service established by our parent company—Wells Fargo & Company—more than 150 years ago. And, because we’re part of a highly diversified financial enterprise, we offer the depth of resources to help investors succeed.
Expertise
Our multi-boutique model offers investors access to the independent thinking of premier investment managers that have been chosen for their time-tested strategies. While each team specializes in a specific investment strategy, collectively they provide investors a wide choice of distinct investment styles. Our dedication to investment excellence doesn’t end with our expertise in manager selection—risk management, analysis, and rigorous ongoing review seek to ensure each manager’s investment process remains consistent.
Partnership
Our collaborative approach is built around understanding the needs and goals of our clients. By adhering to core principles of sound judgment and steady guidance, we support you through every stage of the investment decision process.
Carefully consider a fund’s investment objectives, risks, charges, and expenses before investing. For a current prospectus and, if available, a summary prospectus, containing this and other information, visit wellsfargoadvantagefunds.com. Read it carefully before investing.
Wells Fargo Funds Management, LLC, a wholly owned subsidiary of Wells Fargo & Company, provides investment advisory and administrative services for Wells Fargo Advantage Funds®. Other affiliates of Wells Fargo & Company provide subadvisory and other services for the Funds. The Funds are distributed by Wells Fargo Funds Distributor, LLC, Member FINRA/SIPC, an affiliate of Wells Fargo & Company.
“Dow Jones®” and “Dow Jones Target Date IndexesSM” are service marks of Dow Jones Trademark Holdings, LLC (“Dow Jones”), have been licensed to CME Group Index Services LLC (“CME Indexes”) and have been sublicensed for use for certain purposes by Global Index Advisors, Inc, and Wells Fargo Funds Management, LLC. The Wells Fargo Advantage Dow Jones Target Date FundsSM based on the Dow Jones Target Date IndexesSM, are not sponsored, endorsed, sold or promoted by Dow Jones, CME Indexes or their respective affiliates and none of them makes any representation regarding the advisability of investing in such product(s).
NOT FDIC INSURED ¡ NO BANK GUARANTEE ¡ MAY LOSE VALUE
Not part of the semi-annual report.
Wells Fargo Advantage Funds offers more than 110 mutual funds across a wide range of asset classes, representing over $213 billion in assets under management, as of March 31, 2012.
| | | | |
| Equity Funds | | | | |
Asia Pacific Fund | | Equity Value Fund | | Precious Metals Fund |
C&B Large Cap Value Fund | | Global Opportunities Fund | | Premier Large Company Growth Fund |
C&B Mid Cap Value Fund | | Growth Fund | | Small Cap Opportunities Fund |
Capital Growth Fund | | Index Fund | | Small Cap Value Fund |
Common Stock Fund | | International Equity Fund | | Small Company Growth Fund |
Disciplined U.S. Core Fund | | International Value Fund | | Small Company Value Fund |
Discovery Fund† | | Intrinsic Small Cap Value Fund | | Small/Mid Cap Core Fund |
Diversified Equity Fund | | Intrinsic Value Fund | | Small/Mid Cap Value Fund |
Diversified International Fund | | Intrinsic World Equity Fund | | Special Mid Cap Value Fund |
Diversified Small Cap Fund | | Large Cap Core Fund | | Special Small Cap Value Fund |
Emerging Growth Fund | | Large Cap Growth Fund | | Specialized Technology Fund |
Emerging Markets Equity Fund | | Large Company Value Fund | | Strategic Large Cap Growth Fund |
Endeavor Select Fund† | | Omega Growth Fund | | Traditional Small Cap Growth Fund |
Enterprise Fund† | | Opportunity Fund† | | Utility and Telecommunications Fund |
| Bond Funds | | | | |
Adjustable Rate Government Fund | | Inflation-Protected Bond Fund | | Short-Term Bond Fund |
California Limited-Term Tax-Free Fund | | Intermediate Tax/AMT-Free Fund | | Short-Term High Yield Bond Fund |
California Tax-Free Fund | | International Bond Fund | | Short-Term Municipal Bond Fund |
Colorado Tax-Free Fund | | Minnesota Tax-Free Fund | | Strategic Municipal Bond Fund |
Government Securities Fund | | Municipal Bond Fund | | Total Return Bond Fund |
High Income Fund | | North Carolina Tax-Free Fund | | Ultra Short-Term Income Fund |
High Yield Bond Fund | | Pennsylvania Tax-Free Fund | | Ultra Short-Term Municipal Income Fund |
Income Plus Fund | | Short Duration Government Bond Fund | | Wisconsin Tax-Free Fund |
| Asset Allocation Funds | | | | |
Absolute Return Fund | | WealthBuilder Equity Portfolio† | | Target 2020 Fund† |
Asset Allocation Fund | | WealthBuilder Growth Allocation Portfolio† | | Target 2025 Fund† |
Conservative Allocation Fund | | WealthBuilder Growth Balanced Portfolio† | | Target 2030 Fund† |
Diversified Capital Builder Fund | | WealthBuilder Moderate Balanced Portfolio† | | Target 2035 Fund† |
Diversified Income Builder Fund | | WealthBuilder Tactical Equity Portfolio† | | Target 2040 Fund† |
Growth Balanced Fund | | Target Today Fund† | | Target 2045 Fund† |
Index Asset Allocation Fund | | Target 2010 Fund† | | Target 2050 Fund† |
Moderate Balanced Fund | | Target 2015 Fund† | | Target 2055 Fund† |
WealthBuilder Conservative Allocation Portfolio† | | | | |
| Money Market Funds | | | | |
100% Treasury Money Market Fund | | Heritage Money Market Fund† | | National Tax-Free Money Market Fund |
California Municipal Money Market Fund | | Money Market Fund | | Prime Investment Money Market Fund |
Cash Investment Money Market Fund | | Municipal Cash Management Money Market Fund | | Treasury Plus Money Market Fund |
Government Money Market Fund | | Municipal Money Market Fund | | |
| Variable Trust Funds1 | | | | |
VT Discovery Fund† | | VT Intrinsic Value Fund | | VT Small Cap Growth Fund |
VT Index Asset Allocation Fund | | VT Omega Growth Fund | | VT Small Cap Value Fund |
VT International Equity Fund | | VT Opportunity Fund† | | VT Total Return Bond Fund |
An investment in a money market fund is not insured or guaranteed by the Federal Deposit Insurance Corporation or any other government agency. Although the Wells Fargo Advantage Money Market Funds seek to preserve the value of your investment at $1.00 per share, it is possible to lose money by investing in a money market fund.
| 1. | The Variable Trust Funds are generally available only through insurance company variable contracts. |
| † | In this report, the Wells Fargo Advantage Discovery FundSM, Wells Fargo Advantage Endeavor Select FundSM, Wells Fargo Advantage Enterprise FundSM, Wells Fargo Advantage Opportunity FundSM, Wells Fargo Advantage WealthBuilder Conservative Allocation PortfolioSM, Wells Fargo Advantage WealthBuilder Equity PortfolioSM, Wells Fargo Advantage WealthBuilder Growth Allocation PortfolioSM, Wells Fargo Advantage WealthBuilder Growth Balanced PortfolioSM, Wells Fargo Advantage WealthBuilder Moderate Balanced PortfolioSM, Wells Fargo Advantage WealthBuilder Tactical Equity PortfolioSM, Wells Fargo Advantage Dow Jones Target Today FundSM, Wells Fargo Advantage Dow Jones Target 2010 FundSM, Wells Fargo Advantage Dow Jones Target 2015 FundSM, Wells Fargo Advantage Dow Jones Target 2020 FundSM, Wells Fargo Advantage Dow Jones Target 2025 FundSM, Wells Fargo Advantage Dow Jones Target 2030 FundSM, Wells Fargo Advantage Dow Jones Target 2035 FundSM, Wells Fargo Advantage Dow Jones Target 2040 FundSM, Wells Fargo Advantage Dow Jones Target 2045 FundSM, Wells Fargo Advantage Dow Jones Target 2050 FundSM, Wells Fargo Advantage Dow Jones Target 2055 FundSM, Wells Fargo Advantage Heritage Money Market FundSM, Wells Fargo Advantage VT Discovery FundSM, and Wells Fargo Advantage VT Opportunity FundSM are referred to as the Discovery Fund, Endeavor Select Fund, Enterprise Fund, Opportunity Fund, WealthBuilder Conservative Allocation Portfolio, WealthBuilder Equity Portfolio, WealthBuilder Growth Allocation Portfolio, WealthBuilder Growth Balanced Portfolio, WealthBuilder Moderate Balanced Portfolio, WealthBuilder Tactical Equity Portfolio, Target Today Fund, Target 2010 Fund, Target 2015 Fund, Target 2020 Fund, Target 2025 Fund, Target 2030 Fund, Target 2035 Fund, Target 2040 Fund, Target 2045 Fund, Target 2050 Fund, Target 2055 Fund, Heritage Money Market Fund, VT Discovery Fund, and VT Opportunity Fund, respectively. |
Not part of the semi-annual report.
| | | | |
| 2 | | Wells Fargo Advantage C&B Mid Cap Value Fund | | Letter to Shareholders |

Karla M. Rabusch,
President
Wells Fargo Advantage Funds
The period was marked by increased confidence that the U.S. economy was staging a fragile recovery, offset by continued concerns about the possible effect on the global economy of the ongoing European sovereign debt crisis—which began in Greece and later spread to the larger economies of Italy and Spain.
In contrast to worrisome data from the eurozone, U.S. economic data remained moderately positive.
Dear Valued Shareholder:
We’re pleased to offer you this semi-annual report for the Wells Fargo Advantage C&B Mid Cap Value Fund for the six-month period that ended March 31, 2012. The period was marked by increased confidence that the U.S. economy was staging a fragile recovery, offset by continued concerns about the possible effect on the global economy of the ongoing European sovereign debt crisis—which began in Greece and later spread to the larger economies of Italy and Spain. U.S. stock indexes posted solid gains for the period.
Macroeconomic optimism faded as global growth slowed and worries rose.
Prior to the reporting period, investors worried that the global economy was returning to a recession. Although second quarter U.S. gross domestic product (GDP) grew at a 1.3% annual rate, it was below the levels set in 2010 and seemed to confirm that the economy had slowed from its previous pace. Moreover, the drawn-out political debate over the raising of the U.S. debt ceiling reduced confidence that the national government would be able to work together to address the country’s problems. Partly as a result, Standard & Poor’s rating service downgraded U.S. long-term debt from AAA to AA+1 in August 2011.
Throughout the six-month period, concerns about the eurozone sovereign debt situation returned to center stage. Investors became increasingly concerned that Greece would default on its debt, a scenario that only seemed more likely as eurozone leaders began to openly discuss a “voluntary” haircut on Greek debt for private investors. Because many eurozone banks owned Greek debt and many U.S. banks had financial ties to eurozone banks, investors worried about the effect of such an event on the financial systems and the global economy. In October 2011, market participants turned their attention to the debt burdens of Italy—which also had its credit rating downgraded by Standard & Poor’s—because even though it had a relatively modest budget deficit, it had a high amount of outstanding debt and a stagnant economy. French banks were heavily exposed to Italian debt, so Italy’s woes led to fears of a state bailout of French banks and a resulting increase in France’s required expenditures.
After months of rumors and worries, the Greek credit crisis was finally addressed in March 2012 when the country came to an agreement with its creditors allowing it to write down the principal on most of its bonds in exchange for increased financial austerity. By the end of the reporting period, the Greek agreement, combined with unprecedented support for eurozone banks by the European Central Bank (ECB), seemed to calm investor concerns, at least temporarily.
The U.S. economy reported relatively solid news.
In contrast to worrisome data from the eurozone, U.S. economic data remained moderately positive. After disappointing reports for first and second quarter GDP growth, reported GDP came in at a 1.8% annualized rate in the third quarter of 2011, and then accelerated to a 3.0% annualized rate in the fourth quarter. The major banks appeared to have taken steps toward repairing their balance sheets; in March, the Federal Reserve (Fed) announced that 15 of the 19 major banks had passed a “stress test,” in which the Fed attempted to gauge whether the banks could survive a severe recession that included a 50% drop in the stock market and a 21% percent decline in housing prices.
| 1. | The ratings indicated are from Standard & Poor’s. Standard & Poor’s rates the creditworthiness of bonds, ranging from AAA (highest) to D (lowest). Ratings from A to CCC may be modified by the addition of a plus (+) or minus (-) sign to show relative standing within the rating categories. |
| | | | | | |
| Letter to Shareholders | | Wells Fargo Advantage C&B Mid Cap Value Fund | | | 3 | |
Bank stocks rebounded strongly after the Fed released details of the stress test, but all major market sectors rallied as investors became increasingly confident that the U.S. would not return to recession. Small-cap stocks modestly outperformed large-cap stocks, and growth stocks outperformed value stocks by an even smaller margin.
Central banks continued to provide stimulus.
Throughout the reporting period, the Federal Open Market Committee (FOMC) kept its key interest rates effectively at zero in order to support the economy and financial system. In the second quarter of 2011, the Fed completed its second round of monetary stimulus, in which it had planned to purchase $600 billion in long-term U.S. Treasuries as well as reinvest an additional $250 billion to $300 billion in Treasuries with the proceeds from earlier investments. Even though the Fed seemed to rule out further monetary stimulus, it remained accommodative. In early August 2011, in response to extreme market volatility and signs of a weakening economy, the Fed announced its intention to keep interest rates low until at least late 2014.
At the beginning of the period, the ECB had a key rate of 1.50%, which it had raised in early 2011 in an attempt to keep inflation in check. However, in response to weakness in the southern European economies, the ECB lowered its key rate to 1.25% in November and to 1.0% in December. In August, after a sell-off in the sovereign debts of Spain and Italy, the ECB announced plans to purchase the debt of those countries in exchange for increased deficit reduction. The ECB also continued to provide virtually unlimited liquidity for banks, announcing a long-term refinancing operation (LTRO) in December through which it provided low cost, three-year loans to lenders.
We use time-tested investment strategies, even as many variables are at work in the market.
The full effect of the credit crisis remains unknown. Elevated unemployment and debt defaults continue to pressure consumers and businesses alike.
In our experience strict adherence to time-tested investment strategies has its rewards. As a whole, Wells Fargo Advantage Funds represents investments across a range of asset classes and investment styles, giving you an opportunity to create a diversified investment portfolio. While diversification may not prevent losses in a downturn, we believe it helps in managing risk.
Thank you for choosing to invest with Wells Fargo Advantage Funds. We appreciate your confidence in us and remain committed to helping you meet your financial needs. For current information about your fund investments, contact your investment professional, visit our Web site at wellsfargoadvantagefunds.com, or call us directly at 1-800-222-8222. We are available 24 hours a day, 7 days a week.
Sincerely,

Karla M. Rabusch
President
Wells Fargo Advantage Funds
| | | | |
| 4 | | Wells Fargo Advantage C&B Mid Cap Value Fund | | Letter to Shareholders |
Notice to Shareholders
The Board of Trustees for Wells Fargo Advantage Funds has unanimously approved the following modifications to certain net asset value (NAV) waiver privileges and commission schedules:
| | n | | Effective May 1, 2012, automatic investment plan (AIP) purchases and proceeds received from systematic withdrawals will no longer qualify for NAV repurchase privileges. | |
| | n | | Effective May 1, 2012, discretionary rights to waive the upfront commission for Class C and “jumbo” Class A share purchases will no longer be granted to broker/dealers. However, we will continue to waive the Class C shares contingent deferred sales charge for redemptions by employer-sponsored retirement plans where the dealer of record waived its commission at the time of purchase. | |
| | n | | Effective July 31, 2012, NAV purchase privileges for former Evergreen Class IS and Class R shareholders are being modified to remove the ability to purchase Class A shares at NAV unless those shares are held directly with the Fund on or after July 31, 2012. | |
Please contact your investment professional or call us directly at 1-800-222-8222 if you have any questions on this Notice to Shareholders.
| | | | | | |
| Performance Highlights (Unaudited) | | Wells Fargo Advantage C&B Mid Cap Value Fund | | | 5 | |
INVESTMENT OBJECTIVE
The Fund seeks maximum long-term total return (current income and capital appreciation), consistent with minimizing risk to principal.
ADVISER
Wells Fargo Funds Management, LLC
SUB-ADVISER
Cooke & Bieler, L.P.
PORTFOLIO MANAGERS
Daren C. Heitman, CFA
Steve Lyons, CFA
Michael M. Meyer, CFA
Edward W. O’Connor, CFA
James R. O’Neil, CFA
Mehul Trivedi, CFA
William Weber, CFA
FUND INCEPTION
February 18, 1998
| | | | |
TEN LARGEST EQUITY HOLDINGS1 (AS OF MARCH 31, 2012) | |
Lam Research Corporation | | | 3.96% | |
NVR Incorporated | | | 3.22% | |
Republic Services Incorporated | | | 2.99% | |
Axis Capital Holdings Limited | | | 2.87% | |
Reliance Steel & Aluminum Company | | | 2.75% | |
Harsco Corporation | | | 2.72% | |
Hanesbrands Incorporated | | | 2.71% | |
Quanex Building Products Corporation | | | 2.69% | |
City National Corporation | | | 2.65% | |
Coca-Cola Enterprises Incorporated | | | 2.64% | |
|
SECTOR DISTRIBUTION2 (AS OF MARCH 31, 2012) |
|
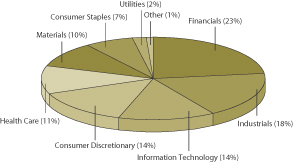 |
| 1. | The ten largest equity holdings are calculated based on the value of the securities divided by total net assets of the Fund. Holdings are subject to change and may have changed since the date specified. |
| 2. | Sector distribution is subject to change and is calculated based on the total long-term investments of the Fund. |
| | | | |
| 6 | | Wells Fargo Advantage C&B Mid Cap Value Fund | | Performance Highlights (Unaudited) |
AVERAGE ANNUAL TOTAL RETURN3 (%) (AS OF MARCH 31, 2012)
| | | | | | | | | | | | | | | | | | | | | | | | | | | | | | | | | | | | | | | | | | | | |
| | | | | | Including Sales Charge | | | Excluding Sales Charge | | | Expense Ratios4 | |
| | | Inception Date | | | 6 Months* | | | 1 Year | | | 5 Year | | | 10 Year | | | 6 Months* | | | 1 Year | | | 5 Year | | | 10 Year | | | Gross | | | Net5 | |
Class A (CBMAX) | | | 07/26/2004 | | | | 20.94 | | | | (1.39 | ) | | | (0.81 | ) | | | 5.53 | | | | 28.34 | | | | 4.61 | | | | 0.37 | | | | 6.16 | | | | 1.36% | | | | 1.21% | |
Class B (CBMBX)** | | | 07/26/2004 | | | | 22.87 | | | | (1.12 | ) | | | (0.79 | ) | | | 5.62 | | | | 27.87 | | | | 3.88 | | | | (0.38 | ) | | | 5.62 | | | | 2.11% | | | | 1.96% | |
Class C (CBMCX) | | | 07/26/2004 | | | | 26.89 | | | | 2.82 | | | | (0.39 | ) | | | 5.37 | | | | 27.89 | | | | 3.82 | | | | (0.39 | ) | | | 5.37 | | | | 2.11% | | | | 1.96% | |
Administrator Class (CBMIX) | | | 07/26/2004 | | | | | | | | | | | | | | | | | | | | 28.32 | | | | 4.69 | | | | 0.46 | | | | 6.27 | | | | 1.20% | | | | 1.16% | |
Institutional Class (CBMSX) | | | 07/26/2004 | | | | | | | | | | | | | | | | | | | | 28.45 | | | | 4.94 | | | | 0.71 | | | | 6.47 | | | | 0.93% | | | | 0.91% | |
Investor Class (CBMDX) | | | 02/18/1998 | | | | | | | | | | | | | | | | | | | | 28.28 | | | | 4.58 | | | | 0.35 | | | | 6.18 | | | | 1.43% | | | | 1.26% | |
Russell Midcap® Value Index6 | | | | | | | | | | | | | | | | | | | | | | | 26.30 | | | | 2.28 | | | | 1.26 | | | | 8.02 | | | | | | | | | |
| * | Returns for periods of less than one year are not annualized. |
| ** | Class B shares are closed to investment, except in connection with the reinvestment of any distributions and permitted exchanges. |
Figures quoted represent past performance, which is no guarantee of future results and do not reflect the deduction of taxes that a shareholder may pay on fund distributions or the redemption of fund shares. Investment return and principal value of an investment will fluctuate so that an investor’s shares, when redeemed, may be worth more or less than their original cost. Performance shown without sales charges would be lower if sales charges were reflected. Current performance may be lower or higher than the performance data quoted and assumes the reinvestment of dividends and capital gains. Current month-end performance is available on the Fund’s Web site – wellsfargoadvantagefunds.com
Index returns do not include transaction costs associated with buying and selling securities, any mutual fund fees or expenses or any taxes. It is not possible to invest directly in an index.
For Class A shares, the maximum front-end sales charge is 5.75%. For Class B shares, the maximum contingent deferred sales charge is 5.00%. For Class C shares, the maximum contingent deferred sales charge is 1.00%. Performance including sales charge assumes the sales charge for the corresponding time period. Administrator Class, Institutional Class and Investor Class shares are sold without a front-end sales charge or contingent deferred sales charge.
Please keep in mind that high double-digit returns were primarily achieved during favorable market conditions. You should not expect that such favorable returns can be consistently achieved. A Fund’s performance, especially for very short time periods, should not be the sole factor in making your investment decision.
Stock fund values fluctuate in response to the activities of individual companies and general market and economic conditions. Smaller-company stocks tend to be more volatile and less liquid than those of larger companies. Consult the Fund’s prospectus for additional information on these and other risks.
| 3. | Historical performance shown for Class A, Class B and Class C shares prior to their inception reflects the performance of the Investor Class shares, adjusted to reflect the higher expenses applicable to Class A, Class B and Class C shares. Historical performance shown for the Administrator and Institutional Class shares prior to their inception reflects the performance of the Investor Class shares, and includes the higher expenses applicable to the Investor Class shares. If these expenses had not been included, returns would be higher. Prior to June 20, 2008, the Investor Class was named Class D. |
| 4. | Reflects the expense ratios as stated in the most recent prospectuses. |
| 5. | The Adviser has committed through January 31, 2013 to waive fees and/or reimburse expenses to the extent necessary to cap the Fund’s Total Annual Fund Operating Expenses After Fee Waiver, excluding certain expenses, at 1.20% for Class A, 1.95% for Class B, 1.95% for Class C, 1.15% for Administrator Class, 0.90% for Institutional Class and 1.25% for Investor Class. Without this cap, the Fund’s returns would have been lower. |
| 6. | The Russell Midcap® Value Index measures the performance of those Russell Midcap® companies with lower price-to-book ratios and lower forecasted growth values. The stocks are also members of the Russell 1000® Value Index. You cannot invest directly in an index. |
| | | | | | |
| Fund Expenses (Unaudited) | | Wells Fargo Advantage C&B Mid Cap Value Fund | | | 7 | |
As a shareholder of the Fund, you incur two types of costs: (1) transaction costs, including sales charges (loads) on purchase payments and contingent deferred sales charges (if any) on redemptions and (2) ongoing costs, including management fees; distribution (12b-1) and/or shareholder service fees; and other Fund expenses. This example is intended to help you understand your ongoing costs (in dollars) of investing in the Fund and to compare these costs with the ongoing costs of investing in other mutual funds.
The example is based on an investment of $1,000 invested at the beginning of the six-month period and held for the entire period from October 1, 2011 to March 31, 2012.
Actual Expenses
The “Actual” line of the table below provides information about actual account values and actual expenses. You may use the information in this line, together with the amount you invested, to estimate the expenses that you paid over the period. Simply divide your account value by $1,000 (for example, an $8,600 account value divided by $1,000 = 8.6), then multiply the result by the number in the “Actual” line under the heading entitled “Expenses Paid During Period” for your applicable class of shares to estimate the expenses you paid on your account during this period.
Hypothetical Example for Comparison Purposes
The “Hypothetical” line of the table below provides information about hypothetical account values and hypothetical expenses based on the Fund’s actual expense ratio and an assumed rate of return of 5% per year before expenses, which is not the Fund’s actual return. The hypothetical account values and expenses may not be used to estimate the actual ending account balance or expenses you paid for the period. You may use this information to compare the ongoing costs of investing in the Fund and other funds. To do so, compare this 5% hypothetical example with the 5% hypothetical examples that appear in the shareholder reports of the other funds.
Please note that the expenses shown in the table are meant to highlight your ongoing costs only and do not reflect any transactional costs, such as sales charges (loads) and contingent deferred sales charges. Therefore, the “Hypothetical” line of the table is useful in comparing ongoing costs only, and will not help you determine the relative total costs of owning different funds. In addition, if these transactional costs were included, your costs would have been higher.
| | | | | | | | | | | | | | | | |
| | | Beginning
Account Value
10-01-2011 | | | Ending
Account Value
03-31-2012 | | | Expenses
Paid During
the Period1 | | | Net Annual
Expense Ratio | |
Class A | | | | | | | | | | | | | | | | |
Actual | | $ | 1,000.00 | | | $ | 1,283.41 | | | $ | 6.85 | | | | 1.20 | % |
Hypothetical (5% return before expenses) | | $ | 1,000.00 | | | $ | 1,019.00 | | | $ | 6.06 | | | | 1.20 | % |
Class B | | | | | | | | | | | | | | | | |
Actual | | $ | 1,000.00 | | | $ | 1,278.68 | | | $ | 11.11 | | | | 1.95 | % |
Hypothetical (5% return before expenses) | | $ | 1,000.00 | | | $ | 1,015.25 | | | $ | 9.82 | | | | 1.95 | % |
Class C | | | | | | | | | | | | | | | | |
Actual | | $ | 1,000.00 | | | $ | 1,278.88 | | | $ | 11.11 | | | | 1.95 | % |
Hypothetical (5% return before expenses) | | $ | 1,000.00 | | | $ | 1,015.25 | | | $ | 9.82 | | | | 1.95 | % |
Administrator Class | | | | | | | | | | | | | | | | |
Actual | | $ | 1,000.00 | | | $ | 1,283.18 | | | $ | 6.56 | | | | 1.15 | % |
Hypothetical (5% return before expenses) | | $ | 1,000.00 | | | $ | 1,019.25 | | | $ | 5.81 | | | | 1.15 | % |
Institutional Class | | | | | | | | | | | | | | | | |
Actual | | $ | 1,000.00 | | | $ | 1,284.55 | | | $ | 5.14 | | | | 0.90 | % |
Hypothetical (5% return before expenses) | | $ | 1,000.00 | | | $ | 1,020.50 | | | $ | 4.55 | | | | 0.90 | % |
Investor Class | | | | | | | | | | | | | | | | |
Actual | | $ | 1,000.00 | | | $ | 1,282.79 | | | $ | 7.13 | | | | 1.25 | % |
Hypothetical (5% return before expenses) | | $ | 1,000.00 | | | $ | 1,018.75 | | | $ | 6.31 | | | | 1.25 | % |
| 1. | Expenses paid is equal to the annualized expense ratio of each class multiplied by the average account value over the period, multiplied by the number of days in the most recent fiscal half-year divided by the number of days in the fiscal year (to reflect the one-half year period). |
| | | | |
| 8 | | Wells Fargo Advantage C&B Mid Cap Value Fund | | Portfolio of Investments—March 31, 2012 (Unaudited) |
| | | | | | | | | | | | |
| Security Name | | | | | | Shares | | | Value | |
| | | | | | | | | | | | |
| | | | |
Common Stocks: 95.95% | | | | | | | | | | | | |
| | | | |
Consumer Discretionary: 13.23% | | | | | | | | | | | | |
| | | | |
| Hotels, Restaurants & Leisure: 3.58% | | | | | | | | | | | | |
Darden Restaurants Incorporated | | | | | | | 68,600 | | | $ | 3,509,575 | |
International Speedway Corporation Class A | | | | | | | 80,300 | | | | 2,228,325 | |
| | | | |
| | | | | | | | | | | 5,737,900 | |
| | | | | | | | | | | | |
| | | | |
| Household Durables: 3.21% | | | | | | | | | | | | |
NVR Incorporated † | | | | | | | 7,100 | | | | 5,156,943 | |
| | | | | | | | | | | | |
| | | | |
| Specialty Retail: 3.73% | | | | | | | | | | | | |
Best Buy Company Incorporated « | | | | | | | 105,900 | | | | 2,507,712 | |
Penske Auto Group Incorporated « | | | | | | | 140,798 | | | | 3,467,855 | |
| | | | |
| | | | | | | | | | | 5,975,567 | |
| | | | | | | | | | | | |
| | | | |
| Textiles, Apparel & Luxury Goods: 2.71% | | | | | | | | | | | | |
Hanesbrands Incorporated † | | | | | | | 147,100 | | | | 4,345,334 | |
| | | | | | | | | | | | |
| | | | |
Consumer Staples: 6.87% | | | | | | | | | | | | |
| | | | |
| Beverages: 2.64% | | | | | | | | | | | | |
Coca-Cola Enterprises Incorporated | | | | | | | 148,100 | | | | 4,235,660 | |
| | | | | | | | | | | | |
| | | | |
| Food & Staples Retailing: 1.96% | | | | | | | | | | | | |
Safeway Incorporated « | | | | | | | 155,000 | | | | 3,132,550 | |
| | | | | | | | | | | | |
| | | | |
| Personal Products: 2.27% | | | | | | | | | | | | |
Avon Products Incorporated | | | | | | | 188,100 | | | | 3,641,616 | |
| | | | | | | | | | | | |
| | | | |
Financials: 20.79% | | | | | | | | | | | | |
| | | | |
| Commercial Banks: 6.62% | | | | | | | | | | | | |
City National Corporation « | | | | | | | 81,000 | | | | 4,250,070 | |
TCF Financial Corporation | | | | | | | 224,000 | | | | 2,663,360 | |
Umpqua Holdings Corporation « | | | | | | | 273,000 | | | | 3,701,880 | |
| | | | |
| | | | | | | | | | | 10,615,310 | |
| | | | | | | | | | | | |
| | | | |
| Insurance: 14.17% | | | | | | | | | | | | |
Axis Capital Holdings Limited | | | | | | | 138,700 | | | | 4,600,679 | |
Fidelity National Title Group Incorporated | | | | | | | 208,000 | | | | 3,750,240 | |
RenaissanceRe Holdings Limited | | | | | | | 33,800 | | | | 2,559,674 | |
Stewart Information Services Corporation | | | | | | | 186,500 | | | | 2,650,165 | |
Torchmark Corporation « | | | | | | | 63,100 | | | | 3,145,535 | |
White Mountain Insurance Group Limited | | | | | | | 6,470 | | | | 3,246,128 | |
Willis Group Holdings plc | | | | | | | 79,000 | | | | 2,763,420 | |
| | | | |
| | | | | | | | | | | 22,715,841 | |
| | | | | | | | | | | | |
| | | | |
Health Care: 10.34% | | | | | | | | | | | | |
| | | | |
| Health Care Equipment & Supplies: 1.94% | | | | | | | | | | | | |
West Pharmaceutical Services Incorporated « | | | | | | | 73,200 | | | | 3,113,196 | |
| | | | | | | | | | | | |
The accompanying notes are an integral part of these financial statements.
| | | | | | |
| Portfolio of Investments—March 31, 2012 (Unaudited) | | Wells Fargo Advantage C&B Mid Cap Value Fund | | | 9 | |
| | | | | | | | | | | | |
| Security Name | | | | | | Shares | | | Value | |
| | | | | | | | | | | | |
| | | | |
| Health Care Providers & Services: 5.80% | | | | | | | | | | | | |
Cardinal Health Incorporated | | | | | | | 34,890 | | | $ | 1,504,108 | |
MEDNAX Incorporated † | | | | | | | 53,000 | | | | 3,941,610 | |
Quest Diagnostics Incorporated | | | | | | | 63,000 | | | | 3,852,450 | |
| | | | |
| | | | | | | | | | | 9,298,168 | |
| | | | | | | | | | | | |
| | | | |
| Pharmaceuticals: 2.60% | | | | | | | | | | | | |
Hospira Incorporated † | | | | | | | 111,500 | | | | 4,168,985 | |
| | | | | | | | | | | | |
| | | | |
Industrials: 18.18% | | | | | | | | | | | | |
| | | | |
| Building Products: 2.69% | | | | | | | | | | | | |
Quanex Building Products Corporation | | | | | | | 245,000 | | | | 4,319,350 | |
| | | | | | | | | | | | |
| | | | |
| Commercial Services & Supplies: 9.27% | | | | | | | | | | | | |
Cintas Corporation « | | | | | | | 90,700 | | | | 3,548,184 | |
G&K Services Incorporated Class A | | | | | | | 67,400 | | | | 2,305,080 | |
Republic Services Incorporated | | | | | | | 157,000 | | | | 4,797,920 | |
Steelcase Incorporated « | | | | | | | 437,600 | | | | 4,200,960 | |
| | | | |
| | | | | | | | | | | 14,852,144 | |
| | | | | | | | | | | | |
| | | | |
| Machinery: 6.22% | | | | | | | | | | | | |
Albany International Corporation Class A « | | | | | | | 146,987 | | | | 3,373,352 | |
Harsco Corporation | | | | | | | 186,000 | | | | 4,363,560 | |
Kennametal Incorporated | | | | | | | 50,300 | | | | 2,239,859 | |
| | | | |
| | | | | | | | | | | 9,976,771 | |
| | | | | | | | | | | | |
| | | | |
Information Technology: 15.48% | | | | | | | | | | | | |
| | | | |
| Computers & Peripherals: 2.14% | | | | | | | | | | | | |
Diebold Incorporated | | | | | | | 89,180 | | | | 3,435,214 | |
| | | | | | | | | | | | |
| | | | |
| Electronic Equipment, Instruments & Components: 4.76% | | | | | | | | | | | | |
Flextronics International Limited † | | | | | | | 564,000 | | | | 4,077,720 | |
Molex Incorporated « | | | | | | | 126,389 | | | | 3,554,059 | |
| | | | |
| | | | | | | | | | | 7,631,779 | |
| | | | | | | | | | | | |
| | | | |
| IT Services: 2.15% | | | | | | | | | | | | |
Western Union Company | | | | | | | 195,500 | | | | 3,440,800 | |
| | | | | | | | | | | | |
| | | | |
| Semiconductors & Semiconductor Equipment: 6.43% | | | | | | | | | | | | |
Lam Research Corporation †« | | | | | | | 142,247 | | | | 6,347,061 | |
Teradyne Incorporated †« | | | | | | | 234,000 | | | | 3,952,260 | |
| | | | |
| | | | | | | | | | | 10,299,321 | |
| | | | | | | | | | | | |
| | | | |
Materials: 9.34% | | | | | | | | | | | | |
| | | | |
| Containers & Packaging: 6.59% | | | | | | | | | | | | |
Ball Corporation | | | | | | | 18,800 | | | | 806,144 | |
Bemis Company Incorporated « | | | | | | | 106,000 | | | | 3,422,740 | |
Packaging Corporation of America | | | | | | | 128,300 | | | | 3,796,397 | |
Rock-Tenn Company Class A | | | | | | | 37,500 | | | | 2,533,500 | |
| | | | |
| | | | | | | | | | | 10,558,781 | |
| | | | | | | | | | | | |
The accompanying notes are an integral part of these financial statements.
| | | | |
| 10 | | Wells Fargo Advantage C&B Mid Cap Value Fund | | Portfolio of Investments—March 31, 2012 (Unaudited) |
| | | | | | | | | | | | | | |
| Security Name | | | | | | | Shares | | | Value | |
| | | | | | | | | | | | | | |
| | | | |
| Metals & Mining: 2.75% | | | | | | | | | | | | | | |
Reliance Steel & Aluminum Company | | | | | | | | | 78,000 | | | $ | 4,405,440 | |
| | | | | | | | | | | | | | |
| | | | |
Utilities: 1.72% | | | | | | | | | | | | | | |
| | | | |
| Electric Utilities: 1.72% | | | | | | | | | | | | | | |
Entergy Corporation | | | | | | | | | 41,000 | | | | 2,755,200 | |
| | | | | | | | | | | | | | |
| | | | |
Total Common Stocks (Cost $130,029,031) | | | | | | | | | | | | | 153,811,870 | |
| | | | | | | | | | | | | | |
| | | | |
| | | | | | | | Principal | | | | |
| Other: 0.49% | | | | | | | | | | | | | | |
Gryphon Funding Limited Pass-Through Entity (a)(i)(v) | | | | | | | | $ | 1,048,062 | | | | 293,457 | |
VFNC Corporation Pass-Through Entity, 0.24% (a)(i)(v)±144A | | | | | | | | | 1,159,651 | | | | 487,053 | |
| | | | |
Total Other (Cost $319,593) | | | | | | | | | | | | | 780,510 | |
| | | | | | | | | | | | | | |
| | | | |
| | | Yield | | | | | Shares | | | | |
| Short-Term Investments: 25.03% | | | | | | | | | | | | | | |
| | | | |
| Investment Companies: 25.03% | | | | | | | | | | | | | | |
Wells Fargo Advantage Cash Investment Money Market Fund, Select Class (l)(u) | | | 0.10 | % | | | | | 6,160,275 | | | | 6,160,275 | |
Wells Fargo Securities Lending Cash Investments, LLC (v)(l)(u)(r) | | | 0.18 | | | | | | 33,968,900 | | | | 33,968,900 | |
| | | | |
Total Short-Term Investments (Cost $40,129,175) | | | | | | | | | | | | | 40,129,175 | |
| | | | | | | | | | | | | | |
| | | | | | | | |
| Total Investments in Securities | | | | | | | | |
| (Cost $170,477,799) * | | | 121.47 | % | | | 194,721,555 | |
Other Assets and Liabilities, Net | | | (21.47 | ) | | | (34,418,105 | ) |
| | | | | | | | |
| Total Net Assets | | | 100.00 | % | | $ | 160,303,450 | |
| | | | | | | | |
| † | Non-income earning security |
| « | All or a portion of this security is on loan. |
| (a) | Security is fair valued by the Management Valuation Team, and in certain instances by the Board of Trustees, in accordance with procedures approved by the Board of Trustees. |
| (v) | Security represents investment of cash collateral received from securities on loan. |
| ± | Variable rate investment |
| (l) | Investment in an affiliate |
| (u) | Rate shown is the 7-day annualized yield at period end. |
| (r) | The investment company is exempt from registration under Section 3(c)(7) of the 1940 Act. |
| 144A | Security that may be resold to “qualified institutional buyers” under Rule 144A or securities offered pursuant to Section 4(2) of the Securities Act of 1933, as amended. |
| * | Cost for federal income tax purposes is $179,795,560 and net unrealized appreciation (depreciation) consists of |
| | | | |
Gross unrealized appreciation | | $ | 19,965,061 | |
Gross unrealized depreciation | | | (5,039,066 | ) |
| | | | |
Net unrealized appreciation | | $ | 14,925,995 | |
The accompanying notes are an integral part of these financial statements.
| | | | | | |
| Statement of Assets and Liabilities—March 31, 2012 (Unaudited) | | Wells Fargo Advantage C&B Mid Cap Value Fund | | | 11 | |
| | | | |
| | | | |
| |
Assets | | | | |
Investments | | | | |
In unaffiliated securities (including securities on loan), at value (see cost below) | | $ | 154,592,380 | |
In affiliated securities, at value (see cost below) | | | 40,129,175 | |
| | | | |
Total investments, at value (see cost below) | | | 194,721,555 | |
Receivable for Fund shares sold | | | 72,438 | |
Receivable for dividends | | | 275,366 | |
Receivable for securities lending income | | | 3,510 | |
Prepaid expenses and other assets | | | 22,202 | |
| | | | |
Total assets | | | 195,095,071 | |
| | | | |
| |
Liabilities | | | | |
Payable for Fund shares redeemed | | | 330,389 | |
Payable upon receipt of securities loaned | | | 34,288,493 | |
Advisory fee payable | | | 76,038 | |
Distribution fees payable | | | 5,012 | |
Due to other related parties | | | 42,148 | |
Accrued expenses and other liabilities | | | 49,541 | |
| | | | |
Total liabilities | | | 34,791,621 | |
| | | | |
Total net assets | | $ | 160,303,450 | |
| | | | |
| |
NET ASSETS CONSIST OF | | | | |
Paid-in capital | | $ | 288,958,420 | |
Undistributed net investment income | | | 259,137 | |
Accumulated net realized losses on investments | | | (153,157,863 | ) |
Net unrealized gains on investments | | | 24,243,756 | |
| | | | |
Total net assets | | $ | 160,303,450 | |
| | | | |
| |
COMPUTATION OF NET ASSET VALUE AND OFFERING PRICE PER SHARE1 | | | | |
Net assets – Class A | | $ | 14,197,099 | |
Shares outstanding – Class A | | | 791,873 | |
Net asset value per share – Class A | | | $17.93 | |
Maximum offering price per share – Class A2 | | | $19.02 | |
Net assets – Class B | | $ | 2,133,318 | |
Shares outstanding – Class B | | | 122,694 | |
Net asset value per share – Class B | | | $17.39 | |
Net assets – Class C | | $ | 5,536,455 | |
Shares outstanding – Class C | | | 318,583 | |
Net asset value per share – Class C | | | $17.38 | |
Net assets – Administrator Class | | $ | 12,344,329 | |
Shares outstanding – Administrator Class | | | 681,270 | |
Net asset value per share – Administrator Class | | | $18.12 | |
Net assets – Institutional Class | | $ | 31,237,140 | |
Shares outstanding – Institutional Class | | | 1,730,137 | |
Net asset value per share – Institutional Class | | | $18.05 | |
Net assets – Investor Class | | $ | 94,855,109 | |
Shares outstanding – Investor Class | | | 5,265,986 | |
Net asset value per share – Investor Class | | | $18.01 | |
| |
Investments in unaffiliated securities, at cost | | $ | 130,348,624 | |
| | | | |
Investments in affiliated securities, at cost | | $ | 40,129,175 | |
| | | | |
Total investments, at cost | | $ | 170,477,799 | |
| | | | |
Securities on loan, at value | | $ | 33,475,881 | |
| | | | |
| 1. | The Fund has an unlimited number of authorized shares. |
| 2. | Maximum offering price is computed as 100/94.25 of net asset value. On investments of $50,000 or more, the offering price is reduced. |
The accompanying notes are an integral part of these financial statements.
| | | | |
| 12 | | Wells Fargo Advantage C&B Mid Cap Value Fund | | Statement of Operations—Six Months Ended March 31, 2012 (Unaudited) |
| | | | |
| | | | |
| |
Investment income | | | | |
Dividends | | $ | 1,386,038 | |
Securities lending income, net | | | 30,631 | |
Income from affiliated securities | | | 2,158 | |
| | | | |
Total investment income | | | 1,418,827 | |
| | | | |
| |
Expenses | | | | |
Advisory fee | | | 516,887 | |
Administration fees | | | | |
Fund level | | | 36,920 | |
Class A | | | 16,703 | |
Class B | | | 3,199 | |
Class C | | | 6,698 | |
Administrator Class | | | 5,874 | |
Institutional Class | | | 10,298 | |
Investor Class | | | 148,051 | |
Shareholder servicing fees | | | | |
Class A | | | 16,061 | |
Class B | | | 3,076 | |
Class C | | | 6,440 | |
Administrator Class | | | 14,193 | |
Investor Class | | | 112,160 | |
Distribution fees | | | | |
Class B | | | 9,228 | |
Class C | | | 19,320 | |
Custody and accounting fees | | | 6,635 | |
Professional fees | | | 16,091 | |
Registration fees | | | 42,220 | |
Shareholder report expenses | | | 6,603 | |
Trustees’ fees and expenses | | | 8,341 | |
Other fees and expenses | | | 6,342 | |
| | | | |
Total expenses | | | 1,011,340 | |
Less: Fee waivers and/or expense reimbursements | | | (115,823 | ) |
| | | | |
Net expenses | | | 895,517 | |
| | | | |
Net investment income | | | 523,310 | |
| | | | |
| |
REALIZED AND UNREALIZED GAINS (LOSSES) ON INVESTMENTS | | | | |
Net realized gains on investments | | | 6,379,449 | |
Net change in unrealized gains (losses) on investments | | | 29,300,130 | |
| | | | |
Net realized and unrealized gains (losses) on investments | | | 35,679,579 | |
| | | | |
Net increase in net assets resulting from operations | | $ | 36,202,889 | |
| | | | |
The accompanying notes are an integral part of these financial statements.
| | | | | | |
| Statements of Changes in Net Assets | | Wells Fargo Advantage C&B Mid Cap Value Fund | | | 13 | |
| | | | | | | | | | | | | | | | |
| | | Six Months Ended
March 31, 2012
(Unaudited) | | | Year Ended
September 30, 2011 | |
| | | | |
Operations | | | | | | | | | | | | | | | | |
Net investment income | | | | | | $ | 523,310 | | | | | | | $ | 775,389 | |
Net realized gains on investments | | | | | | | 6,379,449 | | | | | | | | 26,041,112 | |
Net change in unrealized gains (losses) on investments | | | | | | | 29,300,130 | | | | | | | | (19,558,013 | ) |
| | | | | | | | | | | | | | | | |
Net increase in net assets resulting from operations | | | | | | | 36,202,889 | | | | | | | | 7,258,488 | |
| | | | | | | | | | | | | | | | |
| | | | |
Distributions to shareholders from | | | | | | | | | | | | | | | | |
Net investment income | | | | | | | | | | | | | | | | |
Class A | | | | | | | (76,365 | ) | | | | | | | (94,794 | ) |
Administrator Class | | | | | | | (77,026 | ) | | | | | | | (92,905 | ) |
Institutional Class | | | | | | | (239,976 | ) | | | | | | | (281,238 | ) |
Investor Class | | | | | | | (484,599 | ) | | | | | | | (644,328 | ) |
| | | | | | | | | | | | | | | | |
Total distributions to shareholders | | | | | | | (877,966 | ) | | | | | | | (1,113,265 | ) |
| | | | | | | | | | | | | | | | |
| | | | |
Capital share transactions | | | Shares | | | | | | | | Shares | | | | | |
Proceeds from shares sold | | | | | | | | | | | | | | | | |
Class A | | | 82,293 | | | | 1,360,626 | | | | 89,121 | | | | 1,426,303 | |
Class B | | | 3,116 | | | | 50,464 | | | | 4,227 | | | | 67,484 | |
Class C | | | 8,939 | | | | 149,425 | | | | 14,660 | | | | 229,441 | |
Administrator Class | | | 43,102 | | | | 690,163 | | | | 381,761 | | | | 5,924,357 | |
Institutional Class | | | 435,170 | | | | 7,455,732 | | | | 622,072 | | | | 10,206,600 | |
Investor Class | | | 208,567 | | | | 3,467,292 | | | | 741,117 | | | | 12,230,951 | |
| | | | | | | | | | | | | | | | |
| | | | | | | 13,173,702 | | | | | | | | 30,085,136 | |
| | | | | | | | | | | | | | | | |
Reinvestment of distributions | | | | | | | | | | | | | | | | |
Class A | | | 4,737 | | | | 71,994 | | | | 5,454 | | | | 87,537 | |
Administrator Class | | | 4,012 | | | | 61,627 | | | | 4,259 | | | | 69,080 | |
Institutional Class | | | 14,741 | | | | 225,392 | | | | 16,748 | | | | 270,649 | |
Investor Class | | | 30,686 | | | | 468,578 | | | | 39,099 | | | | 630,672 | |
| | | | | | | | | | | | | | | | |
| | | | | | | 827,591 | | | | | | | | 1,057,938 | |
| | | | | | | | | | | | | | | | |
Payment for shares redeemed | | | | | | | | | | | | | | | | |
Class A | | | (89,709 | ) | | | (1,455,906 | ) | | | (298,188 | ) | | | (4,825,854 | ) |
Class B | | | (73,166 | ) | | | (1,156,722 | ) | | | (90,405 | ) | | | (1,419,993 | ) |
Class C | | | (29,537 | ) | | | (468,493 | ) | | | (123,117 | ) | | | (1,922,935 | ) |
Administrator Class | | | (90,281 | ) | | | (1,495,382 | ) | | | (330,553 | ) | | | (5,427,645 | ) |
Institutional Class | | | (319,924 | ) | | | (5,185,874 | ) | | | (1,482,302 | ) | | | (23,494,903 | ) |
Investor Class | | | (682,028 | ) | | | (11,292,113 | ) | | | (3,538,223 | ) | | | (57,120,914 | ) |
| | | | | | | | | | | | | | | | |
| | | | | | | (21,054,490 | ) | | | | | | | (94,212,244 | ) |
| | | | | | | | | | | | | | | | |
Net decrease in net assets resulting from capital share transactions | | | | | | | (7,053,197 | ) | | | | | | | (63,069,170 | ) |
| | | | | | | | | | | | | | | | |
Total increase (decrease) in net assets | | | | | | | 28,271,726 | | | | | | | | (56,923,947 | ) |
| | | | | | | | | | | | | | | | |
| | | | |
Net assets | | | | | | | | | | | | | | | | |
Beginning of period | | | | | | | 132,031,724 | | | | | | | | 188,955,671 | |
| | | | | | | | | | | | | | | | |
End of period | | | | | | $ | 160,303,450 | | | | | | | $ | 132,031,724 | |
| | | | | | | | | | | | | | | | |
Undistributed net investment income | | | | | | $ | 259,137 | | | | | | | $ | 613,793 | |
| | | | | | | | | | | | | | | | |
The accompanying notes are an integral part of these financial statements.
| | | | |
| 14 | | Wells Fargo Advantage C&B Mid Cap Value Fund | | Financial Highlights |
(For a share outstanding throughout each period)
| | | | | | | | | | | | | | | | | | | | | | | | | | | | |
| | | Six Months Ended
March 31, 2012 (Unaudited) | | | Year Ended September 30, | | | Year Ended October 31, | |
| Class A | | | 2011 | | | 20101 | | | 2009 | | | 2008 | | | 2007 | | | 2006 | |
Net asset value, beginning of period | | $ | 14.06 | | | $ | 14.16 | | | $ | 12.33 | | | $ | 11.29 | | | $ | 21.80 | | | $ | 23.79 | | | $ | 20.76 | |
Net investment income | | | 0.06 | | | | 0.06 | | | | 0.09 | 2 | | | 0.11 | 2 | | | 0.18 | 2 | | | 0.03 | 2 | | | 0.05 | 2 |
Net realized and unrealized gains (losses) on investments | | | 3.91 | | | | (0.06 | ) | | | 1.81 | | | | 1.10 | | | | (6.52 | ) | | | 0.70 | | | | 4.72 | |
| | | | | | | | | | | | | | | | | | | | | | | | | | | | |
Total from investment operations | | | 3.97 | | | | 0.00 | | | | 1.90 | | | | 1.21 | | | | (6.34 | ) | | | 0.73 | | | | 4.77 | |
Distributions to shareholders from | | | | | | | | | | | | | | | | | | | | | | | | | | | | |
Net investment income | | | (0.10 | ) | | | (0.10 | ) | | | (0.07 | ) | | | (0.17 | ) | | | (0.06 | ) | | | (0.06 | ) | | | 0.00 | |
Net realized gains | | | 0.00 | | | | 0.00 | | | | 0.00 | | | | 0.00 | | | | (4.11 | ) | | | (2.66 | ) | | | (1.74 | ) |
| | | | | | | | | | | | | | | | | | | | | | | | | | | | |
Total distributions to shareholders | | | (0.10 | ) | | | (0.10 | ) | | | (0.07 | ) | | | (0.17 | ) | | | (4.17 | ) | | | (2.72 | ) | | | (1.74 | ) |
Net asset value, end of period | | $ | 17.93 | | | $ | 14.06 | | | $ | 14.16 | | | $ | 12.33 | | | $ | 11.29 | | | $ | 21.80 | | | $ | 23.79 | |
Total return3 | | | 28.34 | % | | | (0.10 | )% | | | 15.44 | % | | | 11.05 | % | | | (34.84 | )% | | | 2.95 | % | | | 24.44 | % |
Ratios to average net assets (annualized) | | | | | | | | | | | | | | | | | | | | | | | | | | | | |
Gross expenses | | | 1.38 | % | | | 1.35 | % | | | 1.40 | % | | | 1.45 | % | | | 1.43 | % | | | 1.36 | % | | | 1.40 | % |
Net expenses | | | 1.20 | % | | | 1.20 | % | | | 1.20 | % | | | 1.20 | % | | | 1.35 | % | | | 1.36 | % | | | 1.38 | % |
Net investment income | | | 0.72 | % | | | 0.48 | % | | | 0.70 | % | | | 1.06 | % | | | 1.19 | % | | | 0.15 | % | | | 0.21 | % |
Supplemental data | | | | | | | | | | | | | | | | | | | | | | | | | | | | |
Portfolio turnover rate | | | 11 | % | | | 44 | % | | | 23 | % | | | 47 | % | | | 31 | % | | | 56 | % | | | 39 | % |
Net assets, end of period (000’s omitted) | | | $14,197 | | | | $11,174 | | | | $14,136 | | | | $16,830 | | | | $18,246 | | | | $50,622 | | | | $41,729 | |
| 1. | For the eleven months ended September 30, 2010. The Fund changed its fiscal year end from October 31 to September 30, effective September 30, 2010. |
| 2. | Calculated based upon average shares outstanding |
| 3. | Total return calculations do not include any sales charges. Returns for periods of less than one year are not annualized. |
The accompanying notes are an integral part of these financial statements.
| | | | | | |
| Financial Highlights | | Wells Fargo Advantage C&B Mid Cap Value Fund | | | 15 | |
(For a share outstanding throughout each period)
| | | | | | | | | | | | | | | | | | | | | | | | | | | | |
| | | Six Months Ended
March 31, 2012 (Unaudited) | | | Year Ended September 30, | | | Year Ended October 31, | |
| Class B | | | 2011 | | | 20101 | | | 2009 | | | 2008 | | | 2007 | | | 2006 | |
Net asset value, beginning of period | | $ | 13.60 | | | $ | 13.72 | | | $ | 11.96 | | | $ | 10.90 | | | $ | 21.29 | | | $ | 23.38 | | | $ | 20.57 | |
Net investment income (loss) | | | (0.01 | )2 | | | (0.04 | )2 | | | (0.01 | )2 | | | 0.04 | 2 | | | 0.07 | 2 | | | (0.14 | )2 | | | (0.11 | )2 |
Net realized and unrealized gains (losses) on investments | | | 3.80 | | | | (0.08 | ) | | | 1.77 | | | | 1.07 | | | | (6.35 | ) | | | 0.71 | | | | 4.66 | |
| | | | | | | | | | | | | | | | | | | | | | | | | | | | |
Total from investment operations | | | 3.79 | | | | (0.12 | ) | | | 1.76 | | | | 1.11 | | | | (6.28 | ) | | | 0.57 | | | | 4.55 | |
Distributions to shareholders from | | | | | | | | | | | | | | | | | | | | | | | | | | | | |
Net investment income | | | 0.00 | | | | 0.00 | | | | 0.00 | | | | (0.05 | ) | | | 0.00 | | | | 0.00 | | | | 0.00 | |
Net realized gains | | | 0.00 | | | | 0.00 | | | | 0.00 | | | | 0.00 | | | | (4.11 | ) | | | (2.66 | ) | | | (1.74 | ) |
| | | | | | | | | | | | | | | | | | | | | | | | | | | | |
Total distributions to shareholders | | | 0.00 | | | | 0.00 | | | | 0.00 | | | | (0.05 | ) | | | (4.11 | ) | | | (2.66 | ) | | | (1.74 | ) |
Net asset value, end of period | | $ | 17.39 | | | $ | 13.60 | | | $ | 13.72 | | | $ | 11.96 | | | $ | 10.90 | | | $ | 21.29 | | | $ | 23.38 | |
Total return3 | | | 27.87 | % | | | (0.87 | )% | | | 14.72 | % | | | 10.27 | % | | | (35.41 | )% | | | 2.23 | % | | | 23.53 | % |
Ratios to average net assets (annualized) | | | | | | | | | | | | | | | | | | | | | | | | | | | | |
Gross expenses | | | 2.12 | % | | | 2.10 | % | | | 2.15 | % | | | 2.21 | % | | | 2.18 | % | | | 2.11 | % | | | 2.15 | % |
Net expenses | | | 1.95 | % | | | 1.95 | % | | | 1.95 | % | | | 1.95 | % | | | 2.10 | % | | | 2.11 | % | | | 2.13 | % |
Net investment income (loss) | | | (0.08 | )% | | | (0.28 | )% | | | (0.05 | )% | | | 0.34 | % | | | 0.46 | % | | | (0.60 | )% | | | (0.54 | )% |
Supplemental data | | | | | | | | | | | | | | | | | | | | | | | | | | | | |
Portfolio turnover rate | | | 11 | % | | | 44 | % | | | 23 | % | | | 47 | % | | | 31 | % | | | 56 | % | | | 39 | % |
Net assets, end of period (000’s omitted) | | | $2,133 | | | | $2,622 | | | | $3,826 | | | | $4,177 | | | | $5,123 | | | | $14,293 | | | | $15,491 | |
| 1. | For the eleven months ended September 30, 2010. The Fund changed its fiscal year end from October 31 to September 30, effective September 30, 2010. |
| 2. | Calculated based upon average shares outstanding |
| 3. | Total return calculations do not include any sales charges. Returns for periods of less than one year are not annualized. |
The accompanying notes are an integral part of these financial statements.
| | | | |
| 16 | | Wells Fargo Advantage C&B Mid Cap Value Fund | | Financial Highlights |
(For a share outstanding throughout each period)
| | | | | | | | | | | | | | | | | | | | | | | | | | | | |
| | | Six Months Ended
March 31, 2012 (Unaudited) | | | Year Ended September 30, | | | Year Ended October 31, | |
| Class C | | | 2011 | | | 20101 | | | 2009 | | | 2008 | | | 2007 | | | 2006 | |
Net asset value, beginning of period | | $ | 13.59 | | | $ | 13.71 | | | $ | 11.96 | | | $ | 10.91 | | | $ | 21.29 | | | $ | 23.39 | | | $ | 20.57 | |
Net investment income (loss) | | | (0.00 | )2,3 | | | (0.04 | )2 | | | (0.00 | )2,3 | | | 0.03 | 2 | | | 0.07 | 2 | | | (0.14 | )2 | | | (0.12 | )2 |
Net realized and unrealized gains (losses) on investments | | | 3.79 | | | | (0.08 | ) | | | 1.75 | | | | 1.08 | | | | (6.34 | ) | | | 0.70 | | | | 4.68 | |
| | | | | | | | | | | | | | | | | | | | | | | | | | | | |
Total from investment operations | | | 3.79 | | | | (0.12 | ) | | | 1.75 | | | | 1.11 | | | | (6.27 | ) | | | 0.56 | | | | 4.56 | |
Distributions to shareholders from | | | | | | | | | | | | | | | | | | | | | | | | | | | | |
Net investment income | | | 0.00 | | | | 0.00 | | | | 0.00 | | | | (0.06 | ) | | | 0.00 | | | | 0.00 | | | | 0.00 | |
Net realized gains | | | 0.00 | | | | 0.00 | | | | 0.00 | | | | 0.00 | | | | (4.11 | ) | | | (2.66 | ) | | | (1.74 | ) |
| | | | | | | | | | | | | | | | | | | | | | | | | | | | |
Total distributions to shareholders | | | 0.00 | | | | 0.00 | | | | 0.00 | | | | (0.06 | ) | | | (4.11 | ) | | | (2.66 | ) | | | (1.74 | ) |
Net asset value, end of period | | $ | 17.38 | | | $ | 13.59 | | | $ | 13.71 | | | $ | 11.96 | | | $ | 10.91 | | | $ | 21.29 | | | $ | 23.39 | |
Total return4 | | | 27.89 | % | | | (0.88 | )% | | | 14.63 | % | | | 10.24 | % | | | (35.26 | )% | | | 2.18 | % | | | 23.58 | % |
Ratios to average net assets (annualized) | | | | | | | | | | | | | | | | | | | | | | | | | | | | |
Gross expenses | | | 2.13 | % | | | 2.10 | % | | | 2.15 | % | | | 2.20 | % | | | 2.16 | % | | | 2.11 | % | | | 2.15 | % |
Net expenses | | | 1.95 | % | | | 1.95 | % | | | 1.95 | % | | | 1.95 | % | | | 2.09 | % | | | 2.11 | % | | | 2.13 | % |
Net investment income (loss) | | | (0.03 | )% | | | (0.27 | )% | | | (0.04 | )% | | | 0.31 | % | | | 0.46 | % | | | (0.60 | )% | | | (0.55 | )% |
Supplemental data | | | | | | | | | | | | | | | | | | | | | | | | | | | | |
Portfolio turnover rate | | | 11 | % | | | 44 | % | | | 23 | % | | | 47 | % | | | 31 | % | | | 56 | % | | | 39 | % |
Net assets, end of period (000’s omitted) | | | $5,536 | | | | $4,611 | | | | $6,137 | | | | $6,105 | | | | $6,147 | | | | $16,171 | | | | $11,523 | |
| 1. | For the eleven months ended September 30, 2010. The Fund changed its fiscal year end from October 31 to September 30, effective September 30, 2010. |
| 2. | Calculated is based upon average shares outstanding |
| 3. | Amount is less than $0.005. |
| 4. | Total return calculations do not include any sales charges. Returns for periods of less than one year are not annualized. |
The accompanying notes are an integral part of these financial statements.
| | | | | | |
| Financial Highlights | | Wells Fargo Advantage C&B Mid Cap Value Fund | | | 17 | |
(For a share outstanding throughout each period)
| | | | | | | | | | | | | | | | | | | | | | | | | | | | |
| | | Six Months Ended
March 31, 2012 (Unaudited) | | | Year Ended September 30, | | | Year Ended October 31, | |
| Administrator Class | | | 2011 | | | 20101 | | | 2009 | | | 2008 | | | 2007 | | | 2006 | |
Net asset value, beginning of period | | $ | 14.22 | | | $ | 14.32 | | | $ | 12.47 | | | $ | 11.39 | | | $ | 21.98 | | | $ | 23.93 | | | $ | 20.82 | |
Net investment income | | | 0.06 | 2 | | | 0.09 | 2 | | | 0.10 | 2 | | | 0.12 | 2 | | | 0.24 | 2 | | | 0.08 | 2 | | | 0.10 | 2 |
Net realized and unrealized gains (losses) on investments | | | 3.95 | | | | (0.07 | ) | | | 1.82 | | | | 1.11 | | | | (6.62 | ) | | | 0.71 | | | | 4.75 | |
| | | | | | | | | | | | | | | | | | | | | | | | | | | | |
Total from investment operations | | | 4.01 | | | | 0.02 | | | | 1.92 | | | | 1.23 | | | | (6.38 | ) | | | 0.79 | | | | 4.85 | |
Distributions to shareholders from | | | | | | | | | | | | | | | | | | | | | | | | | | | | |
Net investment income | | | (0.11 | ) | | | (0.12 | ) | | | (0.07 | ) | | | (0.15 | ) | | | (0.10 | ) | | | (0.08 | ) | | | 0.00 | |
Net realized gains | | | 0.00 | | | | 0.00 | | | | 0.00 | | | | 0.00 | | | | (4.11 | ) | | | (2.66 | ) | | | (1.74 | ) |
| | | | | | | | | | | | | | | | | | | | | | | | | | | | |
Total distributions to shareholders | | | (0.11 | ) | | | (0.12 | ) | | | (0.07 | ) | | | (0.15 | ) | | | (4.21 | ) | | | (2.74 | ) | | | (1.74 | ) |
Net asset value, end of period | | $ | 18.12 | | | $ | 14.22 | | | $ | 14.32 | | | $ | 12.47 | | | $ | 11.39 | | | $ | 21.98 | | | $ | 23.93 | |
Total return3 | | | 28.32 | % | | | 0.01 | % | | | 15.47 | % | | | 11.13 | % | | | (34.77 | )% | | | 3.18 | % | | | 24.79 | % |
Ratios to average net assets (annualized) | | | | | | | | | | | | | | | | | | | | | | | | | | | | |
Gross expenses | | | 1.21 | % | | | 1.18 | % | | | 1.22 | % | | | 1.28 | % | | | 1.24 | % | | | 1.18 | % | | | 1.22 | % |
Net expenses | | | 1.15 | % | | | 1.15 | % | | | 1.15 | % | | | 1.15 | % | | | 1.15 | % | | | 1.15 | % | | | 1.15 | % |
Net investment income | | | 0.76 | % | | | 0.55 | % | | | 0.78 | % | | | 1.11 | % | | | 1.52 | % | | | 0.35 | % | | | 0.46 | % |
Supplemental data | | | | | | | | | | | | | | | | | | | | | | | | | | | | |
Portfolio turnover rate | | | 11 | % | | | 44 | % | | | 23 | % | | | 47 | % | | | 31 | % | | | 56 | % | | | 39 | % |
Net assets, end of period (000’s omitted) | | | $12,344 | | | | $10,299 | | | | $9,582 | | | | $13,237 | | | | $13,383 | | | | $102,201 | | | | $82,402 | |
| 1. | For the eleven months ended September 30, 2010. The Fund changed its fiscal year end from October 31 to September 30, effective September 30, 2010. |
| 2. | Calculated based upon average shares outstanding |
| 3. | Returns for periods of less than one year are not annualized. |
The accompanying notes are an integral part of these financial statements.
| | | | |
| 18 | | Wells Fargo Advantage C&B Mid Cap Value Fund | | Financial Highlights |
(For a share outstanding throughout each period)
| | | | | | | | | | | | | | | | | | | | | | | | | | | | |
| | | Six Months Ended
March 31, 2012 (Unaudited) | | | Year Ended September 30, | | | Year Ended October 31, | |
| Institutional Class | | | 2011 | | | 20101 | | | 2009 | | | 2008 | | | 2007 | | | 2006 | |
Net asset value, beginning of period | | $ | 14.19 | | | $ | 14.29 | | | $ | 12.44 | | | $ | 11.43 | | | $ | 22.06 | | | $ | 24.02 | | | $ | 20.88 | |
Net investment income | | | 0.09 | | | | 0.13 | | | | 0.13 | 2 | | | 0.15 | 2 | | | 0.24 | 2 | | | 0.14 | 2 | | | 0.16 | 2 |
Net realized and unrealized gains (losses) on investments | | | 3.92 | | | | (0.08 | ) | | | 1.82 | | | | 1.10 | | | | (6.60 | ) | | | 0.71 | | | | 4.76 | |
| | | | | | | | | | | | | | | | | | | | | | | | | | | | |
Total from investment operations | | | 4.01 | | | | 0.05 | | | | 1.95 | | | | 1.25 | | | | (6.36 | ) | | | 0.85 | | | | 4.92 | |
Distributions to shareholders from | | | | | | | | | | | | | | | | | | | | | | | | | | | | |
Net investment income | | | (0.15 | ) | | | (0.15 | ) | | | (0.10 | ) | | | (0.24 | ) | | | (0.16 | ) | | | (0.15 | ) | | | (0.04 | ) |
Net realized gains | | | 0.00 | | | | 0.00 | | | | 0.00 | | | | 0.00 | | | | (4.11 | ) | | | (2.66 | ) | | | (1.74 | ) |
| | | | | | | | | | | | | | | | | | | | | | | | | | | | |
Total distributions to shareholders | | | (0.15 | ) | | | (0.15 | ) | | | (0.10 | ) | | | (0.24 | ) | | | (4.27 | ) | | | (2.81 | ) | | | (1.78 | ) |
Net asset value, end of period | | $ | 18.05 | | | $ | 14.19 | | | $ | 14.29 | | | $ | 12.44 | | | $ | 11.43 | | | $ | 22.06 | | | $ | 24.02 | |
Total return3 | | | 28.45 | % | | | 0.21 | % | | | 15.78 | % | | | 11.45 | % | | | (34.63 | )% | | | 3.44 | % | | | 25.12 | % |
Ratios to average net assets (annualized) | | | | | | | | | | | | | | | | | | | | | | | | | | | | |
Gross expenses | | | 0.95 | % | | | 0.92 | % | | | 0.96 | % | | | 1.02 | % | | | 0.98 | % | | | 0.91 | % | | | 0.95 | % |
Net expenses | | | 0.90 | % | | | 0.90 | % | | | 0.90 | % | | | 0.90 | % | | | 0.90 | % | | | 0.90 | % | | | 0.90 | % |
Net investment income | | | 1.06 | % | | | 0.76 | % | | | 1.02 | % | | | 1.41 | % | | | 1.58 | % | | | 0.60 | % | | | 0.74 | % |
Supplemental data | | | | | | | | | | | | | | | | | | | | | | | | | | | | |
Portfolio turnover rate | | | 11 | % | | | 44 | % | | | 23 | % | | | 47 | % | | | 31 | % | | | 56 | % | | | 39 | % |
Net assets, end of period (000’s omitted) | | | $31,237 | | | | $22,704 | | | | $34,910 | | | | $31,421 | | | | $33,017 | | | | $79,559 | | | | $55,799 | |
| 1. | For the eleven months ended September 30, 2010. The Fund changed its fiscal year end from October 31 to September 30, effective September 30, 2010. |
| 2. | Calculated based upon average shares outstanding |
| 3. | Returns for periods of less than one year are not annualized. |
The accompanying notes are an integral part of these financial statements.
| | | | | | |
| Financial Highlights | | Wells Fargo Advantage C&B Mid Cap Value Fund | | | 19 | |
(For a share outstanding throughout each period)
| | | | | | | | | | | | | | | | | | | | | | | | | | | | |
| | | Six Months Ended
March 31, 2012 (Unaudited) | | | Year Ended September 30, | | | Year Ended October 31, | |
| Investor Class | | | 2011 | | | 20101 | | | 2009 | | | 20082 | | | 20072 | | | 20062 | |
Net asset value, beginning of period | | $ | 14.12 | | | $ | 14.22 | | | $ | 12.37 | | | $ | 11.34 | | | $ | 21.89 | | | $ | 23.86 | | | $ | 20.79 | |
Net investment income | | | 0.06 | | | | 0.07 | | | | 0.08 | 3 | | | 0.11 | 3 | | | 0.20 | 3 | | | 0.06 | 3 | | | 0.08 | 3 |
Net realized and unrealized gains (losses) on investments | | | 3.92 | | | | (0.09 | ) | | | 1.83 | | | | 1.10 | | | | (6.58 | ) | | | 0.71 | | | | 4.73 | |
| | | | | | | | | | | | | | | | | | | | | | | | | | | | |
Total from investment operations | | | 3.98 | | | | (0.02 | ) | | | 1.91 | | | | 1.21 | | | | (6.38 | ) | | | 0.77 | | | | 4.81 | |
Distributions to shareholders from | | | | | | | | | | | | | | | | | | | | | | | | | | | | |
Net investment income | | | (0.09 | ) | | | (0.08 | ) | | | (0.06 | ) | | | (0.18 | ) | | | (0.06 | ) | | | (0.08 | ) | | | 0.00 | |
Net realized gains | | | 0.00 | | | | 0.00 | | | | 0.00 | | | | 0.00 | | | | (4.11 | ) | | | (2.66 | ) | | | (1.74 | ) |
| | | | | | | | | | | | | | | | | | | | | | | | | | | | |
Total distributions to shareholders | | | (0.09 | ) | | | (0.08 | ) | | | (0.06 | ) | | | (0.18 | ) | | | (4.17 | ) | | | (2.74 | ) | | | (1.74 | ) |
Net asset value, end of period | | $ | 18.01 | | | $ | 14.12 | | | $ | 14.22 | | | $ | 12.37 | | | $ | 11.34 | | | $ | 21.89 | | | $ | 23.86 | |
Total return4 | | | 28.28 | % | | | (0.19 | )% | | | 15.39 | % | | | 11.09 | % | | | (34.87 | )% | | | 3.12 | % | | | 24.60 | % |
Ratios to average net assets (annualized) | | | | | | | | | | | | | | | | | | | | | | | | | | | | |
Gross expenses | | | 1.45 | % | | | 1.42 | % | | | 1.49 | % | | | 1.56 | % | | | 1.47 | % | | | 1.36 | % | | | 1.40 | % |
Net expenses | | | 1.25 | % | | | 1.25 | % | | | 1.25 | % | | | 1.25 | % | | | 1.25 | % | | | 1.25 | % | | | 1.25 | % |
Net investment income | | | 0.66 | % | | | 0.42 | % | | | 0.64 | % | | | 1.01 | % | | | 1.30 | % | | | 0.26 | % | | | 0.35 | % |
Supplemental data | | | | | | | | | | | | | | | | | | | | | | | | | | | | |
Portfolio turnover rate | | | 11 | % | | | 44 | % | | | 23 | % | | | 47 | % | | | 31 | % | | | 56 | % | | | 39 | % |
Net assets, end of period (000’s omitted) | | | $94,855 | | | | $80,622 | | | | $120,364 | | | | $163,708 | | | | $185,541 | | | | $634,872 | | | | $611,237 | |
| 1. | For the eleven months ended September 30, 2010. The Fund changed its fiscal year end from October 31 to September 30, effective September 30, 2010. |
| 2. | Effective June 20, 2008, Class D was renamed Investor Class. |
| 3. | Calculated based upon average shares outstanding |
| 4. | Returns for periods of less than one year are not annualized. |
The accompanying notes are an integral part of these financial statements.
| | | | |
| 20 | | Wells Fargo Advantage C&B Mid Cap Value Fund | | Notes to Financial Statements (Unaudited) |
1. ORGANIZATION
Wells Fargo Funds Trust (the “Trust”), a Delaware statutory trust organized on March 10, 1999, is an open-end management investment company registered under the Investment Company Act of 1940, as amended (the “1940 Act”). These financial statements report on Wells Fargo Advantage C&B Mid Cap Value Fund (the “Fund”) which is a diversified series of the Trust.
2. SIGNIFICANT ACCOUNTING POLICIES
The following significant accounting policies, which are consistently followed in the preparation of the financial statements of the Fund, are in conformity with U.S. generally accepted accounting principles which require management to make estimates and assumptions that affect the reported amounts of assets and liabilities, disclosure of contingent assets and liabilities at the date of the financial statements, and the reported amounts of revenues and expenses during the reporting period. Actual results could differ from those estimates.
Securities valuation
Investments in equity securities are valued each business day as of the close of regular trading on the New York Stock Exchange, which is usually 4:00 p.m. (Eastern Time). Securities which are traded on a national or foreign securities exchange are valued at the last reported sales price, except that securities listed on The Nasdaq Stock Market, Inc. (“Nasdaq”) are valued at the Nasdaq Official Closing Price (“NOCP”), and if no NOCP is available, then at the last reported sales price. If no sales price is shown on the Nasdaq, the bid price will be used. In the absence of any sale of securities listed on the Nasdaq, and in the case of other securities (including U.S. Government obligations, but excluding debt securities maturing in 60 days or less), the price will be deemed “stale” and the valuations will be determined in accordance with the Fund’s Fair Value Procedures.
Investments in open-end mutual funds and non-registered investment companies are generally valued at net asset value.
Investments which are not valued using any of the methods discussed above, are valued at their fair value, as determined by procedures established in good faith and approved by the Board of Trustees. The Board of Trustees has established a Valuation Committee comprised of the Trustees and has delegated to it the authority to take any actions regarding the valuation of portfolio securities that the Valuation Committee deems necessary in determining the fair value of portfolio securities, unless the responsibility has been delegated to the Management Valuation Team of Wells Fargo Funds Management, LLC (“Funds Management”). The Board of Trustees retains the authority to make or ratify any valuation decisions or approve any changes to the Fair Value Procedures as it deems appropriate. On a quarterly basis, the Board of Trustees considers for ratification any valuation actions taken by the Valuation Committee or the Management Valuation Team.
Valuations of fair valued prices are compared to the next actual sales price when available, or other appropriate market information to assess the continued appropriateness of the fair valuation methodology used. The securities are fair valued on a day-to-day basis, taking into consideration changes to appropriate market information and any significant changes to the input factors considered in the valuation process until there is a readily available price provided on the exchange or by an independent pricing service. Valuations received from an independent pricing service or broker quotes are periodically validated by comparisons to most recent trades and valuations provided by other independent pricing services in addition to the review of prices by the adviser and/or sub-adviser. Unobservable inputs used in determining fair valuations are identified based on the type of security, taking into consideration factors utilized by market participants in valuing the investment, knowledge about the issuer and the current market environment.
Security loans
The Fund may lend its securities from time to time in order to earn additional income in the form of fees or interest on securities received as collateral or the investment of any cash received as collateral. The Fund continues to receive interest or dividends on the securities loaned. The Fund receives collateral in the form of cash or securities with a value at least equal to the value of the securities on loan. The value of the loaned securities is determined at the close of each business day and any additional required collateral is delivered to the Fund on the next business day. In a securities lending transaction, the net asset value of the Fund will be affected by an increase or decrease in the value of the securities loaned and by an increase or decrease in the value of the instrument in which collateral is invested. The amount of securities lending activity undertaken by the Fund fluctuates from time to time. In the event of default or bankruptcy
| | | | | | |
| Notes to Financial Statements (Unaudited) | | Wells Fargo Advantage C&B Mid Cap Value Fund | | | 21 | |
by the borrower, the Fund may be prevented from recovering the loaned securities or gaining access to the collateral or may experience delays or costs in doing so. In addition, the investment of any cash collateral received may lose all or part of its value. The Fund has the right under the lending agreement to recover the securities from the borrower on demand.
The Fund lends its securities through an unaffiliated securities lending agent. Cash collateral received in connection with its securities lending transactions is invested in Wells Fargo Securities Lending Cash Investments, LLC (the “Cash Collateral Fund”). The Cash Collateral Fund is exempt from registration under Section 3(c)(7) of the 1940 Act and is managed by Funds Management and is sub-advised by Wells Capital Management Incorporated (“Wells Capital Management”). Funds Management receives an advisory fee starting at 0.05% and declining to 0.01% as the average daily net assets of the Cash Collateral Fund increase. All of the fees received by Funds Management are paid to Wells Capital Management for its services as sub-adviser. The Cash Collateral Fund seeks to provide a positive return compared to the daily Fed Funds Open rate by investing in high-quality, U.S. dollar-denominated short-term money market instruments. Cash Collateral Fund investments are fair valued based upon the amortized cost valuation technique. Income earned from investment in the Cash Collateral Fund is included in securities lending income on the Statement of Operations.
For Wells Fargo Advantage Funds that participated in securities lending activity prior to February 13, 2009, certain structured investment vehicles purchased in a joint account by the former securities lending agent defaulted or were impaired. Certain of the Wells Fargo Advantage Funds still hold ownership interest in these structured investment vehicles, which have since been restructured as pass-through securities. If the Fund holds an ownership interest in such pass-through securities, information regarding this ownership interest can be found in the Portfolio of Investments under the category “Other”.
Security transactions and income recognition
Securities transactions are recorded on a trade date basis. Realized gains or losses are reported on the basis of identified cost of securities delivered.
Dividend income is recognized on the ex-dividend date.
Distributions to shareholders
Distributions to shareholders from net investment income and net realized gains, if any, are recorded on the ex-dividend date. Such distributions are determined in conformity with income tax regulations, which may differ from generally accepted accounting principles.
Federal and other taxes
The Fund intends to continue to qualify as a regulated investment company by distributing substantially all of its investment company taxable income and any net realized capital gains (after reduction for capital loss carryforwards) sufficient to relieve it from all, or substantially all, federal income taxes. Accordingly, no provision for federal income taxes was required.
The Fund’s income and federal excise tax returns and all financial records supporting those returns for the prior three fiscal years are subject to examination by the federal and Delaware revenue authorities. Management has analyzed the Fund’s tax positions taken on federal, state, and foreign tax returns for all open tax years and does not believe that there are any uncertain tax positions that require recognition of a tax liability.
Under the recently enacted Regulated Investment Company Modernization Act of 2010, the Fund is permitted to carry forward capital losses incurred in taxable years which began after December 22, 2010 for an unlimited period. However, any losses incurred are required to be utilized prior to the losses incurred in pre-enactment taxable years. As a result of this ordering rule, pre-enactment capital loss carryforwards may be more likely to expire unused. Additionally, post-enactment capital losses that are carried forward will retain their character as either short-term or long-term capital losses rather than being considered all short-term as under previous law.
As of September 30, 2011, the Fund had net capital loss carryforwards, which are available to offset future net realized capital gains, in the amount of $149,733,231 with $66,442,910 expiring in 2016, $64,071,649 expiring in 2017 and $19,218,672 expiring in 2018.
Class allocations
The separate classes of shares offered by the Fund differ principally in applicable sales charges, distribution, shareholder servicing and administration fees. Shareholders of each class bear certain expenses that pertain to that particular class. All
| | | | |
| 22 | | Wells Fargo Advantage C&B Mid Cap Value Fund | | Notes to Financial Statements (Unaudited) |
shareholders bear the common expenses of the Fund, earn income from the portfolio, and are allocated unrealized gains and losses pro rata based on the average daily net assets of each class, without distinction between share classes. Dividends are determined separately for each class based on income and expenses allocable to each class. Realized gains and losses are allocated to each class pro rata based upon the net assets of each class on the date realized. Differences in per share dividend rates generally result from the relative weightings of pro rata income and realized gain allocations and from differences in separate class expenses, including distribution, shareholder servicing and administration fees.
3. FAIR VALUATION MEASUREMENTS
Fair value measurements of investments are determined within a framework that has established a fair value hierarchy based upon the various data inputs utilized in determining the value of the Fund’s investments. The three-level hierarchy gives the highest priority to unadjusted quoted prices in active markets for identical assets or liabilities (Level 1) and the lowest priority to significant unobservable inputs (Level 3). The Fund’s investments are classified within the fair value hierarchy based on the lowest level of input that is significant to the fair value measurement. The inputs are summarized into three broad levels as follows:
| n | | Level 1 – quoted prices in active markets for identical securities |
| n | | Level 2 – other significant observable inputs (including quoted prices for similar securities, interest rates, prepayment speeds, credit risk, etc.) |
| n | | Level 3 – significant unobservable inputs (including the Fund’s own assumptions in determining the fair value of investments) |
The inputs or methodologies used for valuing securities are not necessarily an indication of the risk associated with investing in those securities.
As of March 31, 2012, the inputs used in valuing the Fund’s assets, which are carried at fair value, were as follows:
| | | | | | | | | | | | | | | | |
| Investments in Securities | | Quoted Prices (Level 1) | | | Significant Other
Observable Inputs (Level 2) | | | Significant Unobservable Inputs (Level 3) | | | Total | |
| | | | |
Equity securities | | | | | | | | | | | | | | | | |
Common stocks | | $ | 153,811,870 | | | $ | 0 | | | $ | 0 | | | $ | 153,811,870 | |
| | | | |
Other | | | 0 | | | | 0 | | | | 780,510 | | | | 780,510 | |
| | | | |
Short-term investments | | | | | | | | | | | | | | | | |
Investment companies | | | 6,160,275 | | | | 33,968,900 | | | | 0 | | | | 40,129,175 | |
| | | $ | 159,972,145 | | | $ | 33,968,900 | | | $ | 780,510 | | | $ | 194,721,555 | |
Further details on the major security types listed above can be found in the Portfolio of Investments.
Transfers in and transfers out are recognized at the end of the reporting period. For the six months ended March 31, 2012, the Fund did not have any significant transfers into/out of Level 1 and Level 2.
4. TRANSACTIONS WITH AFFILIATES AND OTHER EXPENSES
Advisory fee
The Trust has entered into an advisory contract with Funds Management, an indirect wholly owned subsidiary of Wells Fargo & Company (“Wells Fargo”). The adviser is responsible for implementing investment policies and guidelines and for supervising the sub-adviser, who is responsible for day-to-day portfolio management of the Fund.
Pursuant to the contract, Funds Management is entitled to receive an annual advisory fee starting at 0.70% and declining to 0.60% as the average daily net assets of the Fund increase. For the six months ended March 31, 2012, the advisory fee was equivalent to an annual rate of 0.70% of the Fund’s average daily net assets.
Funds Management has retained the services of certain sub-advisers to provide daily portfolio management to the Fund. The fees related to sub-advisory services are borne directly by Funds Management and do not increase the overall fees paid by the Fund. Cooke & Bieler, L.P., is the sub-adviser to the Fund and is entitled to receive a fee from Funds Management at an annual rate starting at 0.55% and declining to 0.40% as the average daily net assets of the Fund increase.
| | | | | | |
| Notes to Financial Statements (Unaudited) | | Wells Fargo Advantage C&B Mid Cap Value Fund | | | 23 | |
Administration and transfer agent fees
The Trust has entered into an administration agreement with Funds Management. Under this agreement, for providing administrative services, which includes paying fees and expenses for services provided by the transfer agent, sub-transfer agents, omnibus account servicers and record-keepers, Funds Management is entitled to receive from the Fund an annual fund level administration fee starting at 0.05% and declining to 0.03% as the average daily net assets of the Fund increase and a class level administration fee which is calculated based on the average daily net assets of each class as follows:
| | | | |
| | | Class Level Administration Fee | |
Class A, Class B, Class C | | | 0.26 | % |
Administrator Class | | | 0.10 | |
Institutional Class | | | 0.08 | |
Investor Class | | | 0.33 | |
Funds Management has contractually waived and/or reimbursed advisory and administration fees to the extent necessary to maintain certain net operating expense ratios for the Fund. Waiver of fees and/or reimbursement of expenses by Funds Management were made first from fund level expenses on a proportionate basis and then from class specific expenses. Funds Management has committed through January 31, 2013 to waive fees and/or reimburse expenses to the extent necessary to cap the Fund’s expenses at 1.20% for Class A, 1.95% for Class B, 1.95% for Class C, 1.15% for Administrator Class, 0.90% for Institutional Class and 1.25% for Investor Class.
Distribution fees
The Trust has adopted a Distribution Plan for Class B and Class C shares of the Fund pursuant to Rule 12b-1 under the 1940 Act. Distribution fees are charged to Class B and Class C shares and paid to Wells Fargo Funds Distributor, LLC, the principal underwriter, at an annual rate of 0.75% of the average daily net assets of Class B and Class C shares.
For the six months ended March 31, 2012, Wells Fargo Funds Distributor, LLC received $345 from the sale of Class A shares and $381 and $41 in contingent deferred sales charges from redemptions of Class B and Class C shares, respectively.
Shareholder servicing fees
The Trust has entered into contracts with one or more shareholder servicing agents, whereby Class A, Class B, Class C, Administrator Class and Investor Class of the Fund is charged a fee at an annual rate of 0.25% of the average daily net assets of each respective class.
A portion of these total shareholder servicing fees were paid to affiliates of Wells Fargo.
5. INVESTMENT PORTFOLIO TRANSACTIONS
Purchases and sales of investments, excluding U.S. Government obligations (if any) and short-term securities, for the six months ended March 31, 2012 were $15,171,028 and $28,020,472, respectively.
6. BANK BORROWINGS
The Trust (excluding the money market funds) and Wells Fargo Variable Trust are parties to a $150,000,000 revolving credit agreement with State Street Bank and Trust Company, whereby the Fund is permitted to use bank borrowings for temporary or emergency purposes, such as to fund shareholder redemption requests. Interest under the credit agreement is charged to the Fund based on a borrowing rate equal to the higher of the Federal Funds rate in effect on that day plus 1.25% or the overnight LIBOR rate in effect on that day plus 1.25%. In addition, an annual commitment fee equal to 0.10% of the unused balance is allocated to each participating fund. For the six months ended March 31, 2012, the Fund paid $151 in commitment fees.
For the six months ended March 31, 2012, there were no borrowings by the Fund under the agreement.
| | | | |
| 24 | | Wells Fargo Advantage C&B Mid Cap Value Fund | | Notes to Financial Statements (Unaudited) |
7. INDEMNIFICATION
Under the Trust’s organizational documents, the officers and directors are indemnified against certain liabilities that may arise out of performance of their duties to the Trust. Additionally, in the normal course of business, the Trust may enter into contracts with service providers that contain a variety of indemnification clauses. The Trust’s maximum exposure under these arrangements is dependent on future claims that may be made against the Fund and, therefore, cannot be estimated.
8. NEW ACCOUNTING PRONOUNCEMENTS
In December 2011, the Financial Accounting Standards Board (“FASB”) issued Accounting Standard Update (“ASU”) No. 2011-11, Disclosures about Offsetting Assets and Liabilities. ASU 2011-11, which amends FASB ASC Topic 210 Balance Sheet, creates new disclosure requirements which require entities to disclose both gross and net information for derivatives and other financial instruments that are either offset in the Statement of Assets and Liabilities or subject to an enforceable master netting arrangement or similar agreement. The disclosure requirements are effective for interim and annual reporting periods beginning on or after January 1, 2013. Management is currently evaluating the impact of the update’s adoption on the Fund’s financial statement disclosures.
In May 2011, FASB issued ASU No. 2011-04 “Amendments to Achieve Common Fair Value Measurement and Disclosure Requirements in U.S. GAAP and IFRSs”. ASU No. 2011-04 amends FASB ASC Topic 820, Fair Value Measurements and Disclosures, to establish common requirements for measuring fair value and for disclosing information about fair value measurements in accordance with GAAP. The ASU is effective prospectively for interim and annual periods beginning after December 15, 2011. Management expects that adoption of the ASU will result in additional disclosures in the financial statements, as applicable.
In April 2011, FASB issued ASU No. 2011-03 “Reconsideration of Effective Control for Repurchase Agreements”. ASU No. 2011-03 amends FASB ASC Topic 860, Transfers and Servicing, specifically the criteria required to determine whether a repurchase agreement (repo) and similar agreements should be accounted for as sales of financial assets or secured borrowings with commitments. ASU No. 2011-03 changes the assessment of effective control by focusing on the transferor’s contractual rights and obligations and removing the criterion to assess its ability to exercise those rights or honor those obligations. This could result in changes to the way entities account for certain transactions including repurchase agreements, mortgage dollar rolls and reverse repurchase agreements. The ASU will become effective on a prospective basis for new transfers and modifications to existing transactions as of the beginning of the first interim or annual period beginning on or after December 15, 2011. Management has evaluated the impact of adopting the ASU and expects no significant changes.
| | | | | | |
| Other Information (Unaudited) | | Wells Fargo Advantage C&B Mid Cap Value Fund | | | 25 | |
PROXY VOTING INFORMATION
A description of the policies and procedures that the Fund uses to determine how to vote proxies relating to portfolio securities is available without charge, upon request, by calling 1-800-222-8222, visiting our Web site at wellsfargoadvantagefunds.com, or visiting the SEC Web site at sec.gov. Information regarding how the Fund voted proxies relating to portfolio securities during the most recent 12-month period ended June 30 is available without charge on the Fund’s Web site at wellsfargoadvantagefunds.com or by visiting the SEC Web site at sec.gov.
PORTFOLIO HOLDINGS INFORMATION
The complete portfolio holdings for the Fund are publicly available on the Fund’s Web site (wellsfargoadvantagefunds.com) on a monthly, 30-day or more delayed basis. In addition, top ten holdings information for the Fund is publicly available on the Fund’s Web site on a monthly, seven-day or more delayed basis. The Fund files its complete schedule of portfolio holdings with the SEC for the first and third quarters of each fiscal year on Form N-Q, which is available without charge by visiting the SEC Web site at sec.gov. In addition, the Fund’s Form N-Q may be reviewed and copied at the SEC’s Public Reference Room in Washington, DC, and at regional offices in New York City, at 233 Broadway, and in Chicago, at 175 West Jackson Boulevard, Suite 900. Information about the Public Reference Room may be obtained by calling 1-800-SEC-0330.
| | | | |
| 26 | | Wells Fargo Advantage C&B Mid Cap Value Fund | | Other Information (Unaudited) |
BOARD OF TRUSTEES
The following table provides basic information about the Board of Trustees (the “Trustees”) of the Trust and Officers of the Trust. This table should be read in conjunction with the Prospectus and the Statement of Additional Information1 of the Fund. Each of the Trustees and Officers listed below acts in identical capacities for the Wells Fargo Advantage family of funds, which consists of 137 funds comprising the Wells Fargo Funds Trust, Wells Fargo Variable Trust, Wells Fargo Master Trust and four closed-end funds (collectively the “Fund Complex”). All of the Trustees are also Members of the Audit and Governance Committees of each Trust in the Fund Complex. The mailing address of each Trustee and Officer is 525 Market Street, 12th Floor, San Francisco, CA 94105. Each Trustee and Officer serves an indefinite term, however, each Trustee serves such term until reaching the mandatory retirement age established by the Trustees.
Independent Trustees
| | | | | | |
Name and Year of Birth | | Position Held and Length of Service | | Principal Occupations During Past Five Years | | Other Directorships During
Past Five Years |
Peter G. Gordon
(Born 1942) | | Trustee, since 1998; Chairman, since 2005 (Lead Trustee since 2001) | | Co-Founder, Retired Chairman, President and CEO of Crystal Geyser Water Company. Trustee Emeritus, Colby College | | Asset Allocation Trust |
Isaiah Harris, Jr.
(Born 1952) | | Trustee, since 2009 | | Retired. Prior thereto, President and CEO of BellSouth Advertising and Publishing Corp. from 2005 to 2007, President and CEO of BellSouth Enterprises from 2004 to 2005 and President of BellSouth Consumer Services from 2000 to 2003. Emeritus member of the Iowa State University Foundation Board of Governors. Emeritus Member of the Advisory Board of Iowa State University School of Business. Mr. Harris is a certified public accountant. | | CIGNA Corporation; Deluxe Corporation; Asset Allocation Trust |
Judith M. Johnson
(Born 1949) | | Trustee, since 2008 | | Retired. Prior thereto, Chief Executive Officer and Chief Investment Officer of Minneapolis Employees Retirement Fund from 1996 to 2008. Ms. Johnson is an attorney, certified public accountant and a certified managerial accountant. | | Asset Allocation Trust |
Leroy Keith, Jr.
(Born 1939) | | Trustee, since 2010 | | Chairman, Bloc Global Services (development and construction). Trustee of the Evergreen Funds from 1983 to 2010. Former Managing Director, Almanac Capital Management (commodities firm), former Partner, Stonington Partners, Inc. (private equity fund), former Director, Obagi Medical Products Co. and former Director, Lincoln Educational Services. | | Trustee, Virtus Fund Complex (consisting of 40 portfolios as of 12/31/11); Asset Allocation Trust |
David F. Larcker
(Born 1950) | | Trustee, since 2009 | | James Irvin Miller Professor of Accounting at the Graduate School of Business, Stanford University, Director of Corporate Governance Research Program and Senior Faculty of The Rock Center for Corporate Governance since 2006. From 2005 to 2008, Professor of Accounting at the Graduate School of Business, Stanford University. Prior thereto, Ernst & Young Professor of Accounting at The Wharton School, University of Pennsylvania from 1985 to 2005. | | Asset Allocation Trust |
Olivia S. Mitchell
(Born 1953) | | Trustee, since 2006 | | International Foundation of Employee Benefit Plans Professor, Wharton School of the University of Pennsylvania since 1993. Director of Wharton’s Pension Research Council and Boettner Center on Pensions & Retirement Research, and Research Associate at the National Bureau of Economic Research. Previously, Cornell University Professor from 1978 to 1993. | | Asset Allocation Trust |
| | | | | | |
| Other Information (Unaudited) | | Wells Fargo Advantage C&B Mid Cap Value Fund | | | 27 | |
| | | | | | |
Name and Year of Birth | | Position Held and Length of Service | | Principal Occupations During Past Five Years | | Other Directorships During
Past Five Years |
Timothy J. Penny
(Born 1951) | | Trustee, since 1996 | | President and CEO of Southern Minnesota Initiative Foundation, a non-profit organization, since 2007 and Senior Fellow at the Humphrey Institute Policy Forum at the University of Minnesota since 1995. Member of the Board of Trustees of NorthStar Education Finance, Inc., a non-profit organization, since 2007. | | Asset Allocation Trust |
Michael S. Scofield
(Born 1943) | | Trustee, since 2010 | | Served on the Investment Company Institute’s Board of Governors and Executive Committee from 2008-2011 as well the Governing Council of the Independent Directors Council from 2006-2011 and the Independent Directors Council Executive Committee from 2008-2011. Chairman of the IDC from 2008-2010. Institutional Investor (Fund Directions) Trustee of Year in 2007. Trustee of the Evergreen Funds (and its predecessors) from 1984 to 2010. Chairman of the Evergreen Funds from 2000-2010. Former Trustee of the Mentor Funds. Retired Attorney, Law Offices of Michael S. Scofield and former Director and Chairman, Branded Media Corporation (multi-media branding company). | | Asset Allocation Trust |
Donald C. Willeke
(Born 1940) | | Trustee, since 1996 | | Principal of the law firm of Willeke & Daniels. General Counsel of the Minneapolis Employees Retirement Fund from 1984 until its consolidation into the Minnesota Public Employees Retirement Association on June 30, 2010. Director and Vice Chair of The Free Trust (non-profit corporation). Director of the American Chestnut Foundation (non-profit corporation). | | Asset Allocation Trust |
Officers
| | | | | | |
Name and Year of Birth | | Position Held and
Length of Service | | Principal Occupations During Past Five Years | | |
Karla M. Rabusch
(Born 1959) | | President, since 2003 | | Executive Vice President of Wells Fargo Bank, N.A. and President of Wells Fargo Funds Management, LLC since 2003. Senior Vice President and Chief Administrative Officer of Wells Fargo Funds Management, LLC from 2001 to 2003. | | |
C. David Messman
(Born 1960) | | Secretary, since 2000; Chief Legal Counsel, since 2003 | | Senior Vice President and Secretary of Wells Fargo Funds Management, LLC since 2001. Vice President and Managing Senior Counsel of Wells Fargo Bank, N.A. since 1996. | | |
Kasey Phillips
(Born 1970) | | Treasurer, since 2009 | | Senior Vice President of Wells Fargo Funds Management, LLC since 2009. Senior Vice President of Evergreen Investment Management Company, LLC from 2006 to 2010. Treasurer of the Evergreen Funds from 2005 to 2010. | | |
David Berardi
(Born 1975) | | Assistant Treasurer, since 2009 | | Vice President of Wells Fargo Funds Management, LLC since 2009. Vice President of Evergreen Investment Management Company, LLC from 2008 to 2010. Assistant Vice President of Evergreen Investment Services, Inc. from 2004 to 2008. Manager of Fund Reporting and Control for Evergreen Investment Management Company, LLC from 2004 to 2010. | | |
Jeremy DePalma
(Born 1974) | | Assistant Treasurer, since 2009 | | Senior Vice President of Wells Fargo Funds Management, LLC since 2009. Senior Vice President of Evergreen Investment Management Company, LLC from 2008 to 2010. Vice President, Evergreen Investment Services, Inc. from 2004 to 2007. Head of the Fund Reporting and Control Team within Fund Administration from 2005 to 2010. | | |
Debra Ann Early
(Born 1964) | | Chief Compliance Officer, since 2007 | | Chief Compliance Officer of Wells Fargo Funds Management, LLC since 2007. Chief Compliance Officer of Parnassus Investments from 2005 to 2007. Chief Financial Officer of Parnassus Investments from 2004 to 2007 and Senior Audit Manager of PricewaterhouseCoopers LLP from 1998 to 2004. | | |
| 1. | The Statement of Additional Information includes additional information about the Trustees and is available, without charge, upon request, by calling 1-800-222-8222 or by visiting the Web site at wellsfargoadvantagefunds.com. |
| | | | |
| 28 | | Wells Fargo Advantage C&B Mid Cap Value Fund | | Other Information (Unaudited) |
BOARD CONSIDERATION OF INVESTMENT ADVISORY AND SUB-ADVISORY AGREEMENTS:
Under Section 15 of the Investment Company Act of 1940 (the “1940 Act”), the Board of Trustees (the “Board”) of Wells Fargo Funds Trust (the “Trust”), all the members of which have no direct or indirect interest in the investment advisory and sub-advisory agreements and are not “interested persons” of the Trust, as defined in the 1940 Act (the “Independent Trustees”), must determine whether to approve the continuation of the Trust’s investment advisory and sub-advisory agreements. In this regard, at an in person meeting held on March 29-30, 2012 (the “Meeting”), the Board reviewed and re-approved: (i) an investment advisory agreement with Wells Fargo Funds Management, LLC (“Funds Management”) for Wells Fargo Advantage C&B Mid Cap Value Fund (the “Fund”) and (ii) an investment sub-advisory agreement with Cooke & Bieler, L.P. (“Cooke & Bieler”) for the Fund. The investment advisory agreement with Funds Management and the investment sub-advisory agreement with Cooke & Bieler are collectively referred to as the “Advisory Agreements.”
At the Meeting, the Board considered the factors and reached the conclusions described below relating to the selection of Funds Management and Cooke & Bieler and the continuation of the Advisory Agreements. Prior to the Meeting, the Trustees conferred extensively among themselves and with representatives of Funds Management about these matters. The Board also met throughout the year and received information that was useful to them in considering the continuation of the Advisory Agreements. The Independent Trustees were assisted in their evaluation of the Advisory Agreements by independent legal counsel, from whom they received separate legal advice and with whom they met separately from Funds Management.
In providing information to the Board, Funds Management was guided by a detailed set of requests submitted by the Independent Trustees’ independent legal counsel on their behalf at the start of the Board’s annual contract renewal process earlier in 2012. In approving the Advisory Agreements, the Board did not identify any particular information or consideration that was all-important or controlling, and each Trustee likely attributed different weights to various factors.
Nature, extent and quality of services
The Board received and considered various information regarding the nature, extent and quality of services provided to the Fund by Funds Management and Cooke & Bieler under the Advisory Agreements. The Board also received and considered, among other things, information about the background and experience of senior management of Funds Management, and the qualifications, backgrounds, tenures and responsibilities of the portfolio managers primarily responsible for the day-to-day portfolio management of the Fund.
The Board evaluated the ability of Funds Management and Cooke & Bieler, based on their respective financial condition, resources, reputation and other attributes, to attract and retain qualified investment professionals, including research, advisory, and supervisory personnel. The Board further considered the compliance programs and compliance records of Funds Management and Cooke & Bieler. In addition, the Board took into account the administrative services provided to the Fund by Funds Management and its affiliates.
The Board’s decision to approve the continuation of the Advisory Agreements was based on a comprehensive evaluation of all of the information provided to it. In considering these matters, the Board considered not only the specific information presented in connection with the Meeting, but also the knowledge gained over time through interaction with Funds Management and Cooke & Bieler about various topics, including Funds Management’s oversight of service providers. The above factors, together with those referenced below, are some of the most important, but not necessarily all, factors considered by the Board in concluding that the nature, extent and quality of the investment advisory services provided to the Fund by Funds Management and Cooke & Bieler supported the re-approval of the Advisory Agreements. Although the Board considered the continuation of the Advisory Agreements for the Fund as part of the larger process of considering the continuation of the advisory agreements for all of the funds in the complex, its decision to continue the Advisory Agreements for the Fund was ultimately made on a fund-by-fund basis.
Fund performance and expenses
The Board considered the performance results for the Fund over various time periods ended December 31, 2011. The Board also considered these results in comparison to the median performance of a universe of relevant funds (the “Universe”) that was determined by Lipper Inc. (“Lipper”) to be similar to the Fund, and in comparison to the Fund’s benchmark index and to other comparative data. Lipper is an independent provider of investment company data. The Board received a description of the methodology used by Lipper to select the mutual funds in the Universe. The Board
| | | | | | |
| Other Information (Unaudited) | | Wells Fargo Advantage C&B Mid Cap Value Fund | | | 29 | |
noted that, except for the three- and five-year period, the performance of the Fund was higher than or in range of the median performance of the Universe for the other periods under review. The Board also noted that the Fund’s performance results warranted further discussion. As part of its further review, the Board received an analysis of, and discussed factors contributing to, the underperformance of the Fund relative to the Universe. The Board received a report that noted a portfolio manager change occurred in December 2011. The Board was satisfied that Funds Management was taking appropriate actions with respect to the Fund’s investment performance.
The Board received and considered information regarding the Fund’s contractual advisory fee and net operating expense ratios and their various components, including actual management fees (which reflect fee waivers, if any), transfer agent, custodian and other non-management fees, Rule 12b-1 and non-Rule 12b-1 fees, service fees and fee waiver and expense reimbursement arrangements. The Board also considered these ratios in comparison to the median ratios of an expense Universe and a narrower expense group of mutual funds (each, an “Expense Group”) that was determined by Lipper to be similar to the Fund. The Board received a description of the methodology used by Lipper to select the mutual funds in the Fund’s Expense Group. The Board noted that the net operating expense ratios of the Fund were lower than or in range of the Fund’s Expense Group’s median net operating expense ratios.
Based on the above-referenced considerations and other factors, the Board concluded that the overall performance and expense structure of the Fund supported the re-approval of the Advisory Agreements for the Fund.
Investment advisory and sub-advisory fee rates
The Board reviewed and considered the contractual investment advisory fee rate that is payable by the Fund to Funds Management for investment advisory services (the “Advisory Agreement Rate”), both on a stand-alone basis and on a combined basis with the Fund’s administration fee rate. The Board took into account the separate administrative and other services covered by the administration fee rate. The Board also reviewed and considered the contractual investment sub-advisory fee rate that is payable by Funds Management to Cooke & Bieler for investment sub-advisory services (the “Sub-Advisory Agreement Rate”). In addition, the Board reviewed and considered the existing fee waiver/cap arrangements applicable to the Advisory Agreement Rate and considered the Advisory Agreement Rate after taking the waivers/caps into account (the “Net Advisory Rate”).
The Board received and considered information comparing the Advisory Agreement Rate and Net Advisory Rate with those of other funds in the Fund’s Expense Group median. The Board noted that the Advisory Agreement Rate and Net Advisory Rate for the Fund were in range of the median rates for the Fund’s Expense Group, except for the Investor and A share classes. The Board further noted that Funds Management had agreed to continue and, with respect to the Investor class, reduce contractual fee cap arrangements for the Fund designed to lower the Fund’s expenses.
The Board also received and considered information about the portion of the total management fee that was retained by Funds Management after payment of the fees to Cooke & Bieler for sub-advisory services. The Board also considered this amount in comparison to the median amount paid by a sub-advised expense Universe that was determined by Lipper to be similar to the Fund.
The Board also received and considered information about the nature and extent of services offered and fee rates charged by Funds Management and Cooke & Bieler to other types of clients. In this regard, the Board received information about differences between the services, and the compliance, reporting, and other legal burdens and risks of providing investment advice to mutual funds and those associated with providing advice to non-mutual fund clients such as collective funds or institutional separate accounts.
The Board determined that the Advisory Agreement Rate for the Fund, both with and without an administration fee rate and before and after waivers, was reasonable in light of the Fund’s Expense Group information, the net expense ratio commitments, the services covered by the Advisory Agreements and other information provided. The Board also reviewed and considered the Sub-Advisory Agreement Rate and concluded that the Sub-Advisory Agreement Rate was reasonable in light of the services covered by the sub-advisory agreement, the sub-advised expense information provided by Lipper, and other information provided.
Profitability
The Board received and considered a profitability analysis of Funds Management, as well as an analysis of the profitability to the collective Wells Fargo businesses that provide services to the Fund. It considered that the information provided to
| | | | |
| 30 | | Wells Fargo Advantage C&B Mid Cap Value Fund | | Other Information (Unaudited) |
it was necessarily estimated, and that the profitability information provided to it, especially on a fund-by-fund basis, did not necessarily provide a precise tool for evaluating the appropriateness of the Fund’s Advisory Agreement Rate in isolation. It noted that the levels of profitability reported on a fund-by-fund basis varied widely, depending on, among other things, the size and type of fund. The Board concluded that the profitability reported by Funds Management was not unreasonable.
The Board did not consider separate profitability information with respect to Cooke & Bieler, which is not affiliated with Funds Management. The Board considered that the sub-advisory fees paid to Cooke & Bieler had been negotiated by Funds Management on an arm’s-length basis and that Cooke & Bieler’s profitability from its relationship with the Fund was not a material factor in determining whether to renew the sub-advisory agreement.
Economies of scale
With respect to possible economies of scale, the Board reviewed the breakpoints in the Fund’s advisory fee structure, which operate generally to reduce the effective Advisory Agreement Rate of the Fund (as a percentage of Fund assets) as the Fund grows in size. It considered that, as a fund shrinks in size, breakpoints conversely result in increasing fee levels. The Board noted that it would have on-going opportunities to review the appropriate levels of breakpoints in the future, and concluded that the breakpoints as implemented appeared to be a reasonable step toward sharing economies of scale, if any, with the Fund. However, the Board acknowledged the inherent limitations of any analysis of an investment adviser’s economies of scale and of any attempt to correlate breakpoints with such economies, stemming largely from the Board’s understanding that economies of scale are realized, if at all, by an investment adviser across a variety of products and services, not just with respect to a single fund.
Other benefits to Funds Management and Cooke & Bieler
The Board received and considered information regarding potential “fall-out” or ancillary benefits received by Funds Management and its affiliates and Cooke & Bieler as a result of their relationship with the Fund. Ancillary benefits could include, among others, benefits directly attributable to the relationship of Funds Management and Cooke & Bieler with the Fund and benefits potentially derived from an increase in Funds Management’s and Cooke & Bieler’s business as a result of their relationship with the Fund (such as the ability to market to shareholders other financial products offered by Funds Management and its affiliates or Cooke & Bieler).
The Board considered that Wells Fargo Funds Distributor, LLC, an affiliate of Funds Management, serves as distributor to the Fund and receives certain compensation for those services. The Board noted that various financial institutions, including affiliates of Funds Management, may receive distribution-related fees, shareholder servicing payments (including amounts derived from payments under Rule 12b-1 plans) and sub-transfer agency fees in respect of shares sold or held through them and services provided.
The Board also reviewed information about whether and to what extent soft dollar credits are sought and how any such credits are utilized and any benefits that may be realized by using an affiliated broker.
Other factors and broader review
The Board also considered the markets for distribution of the Fund’s shares, including the channels through which the Fund’s shares are offered and sold. The Board noted that the Fund is part of one of the few fund families that have both direct-to-fund and intermediary distribution channels. As discussed above, the Board reviews detailed materials received from Funds Management and Cooke & Bieler annually as part of the re-approval process under Section 15 of the 1940 Act and also reviews and assesses information about the quality of the services that the Fund receives throughout the year. In this regard, the Board has reviewed reports of Funds Management at each of its quarterly meetings, which include, among other things, portfolio reviews and performance reports. In addition, the Board confers with portfolio managers at various times throughout the year.
Conclusion
After considering the above-described factors and based on its deliberations and its evaluation of the information described above, the Board unanimously approved the continuation of the Advisory Agreements for an additional one-year period.
| | | | | | |
| List of Abbreviations | | Wells Fargo Advantage C&B Mid Cap Value Fund | | | 31 | |
The following is a list of common abbreviations for terms and entities which may have appeared in this report.
| ACB | — Agricultural Credit Bank |
| ADR | — American Depository Receipt |
| ADS | — American Depository Shares |
| AGC-ICC | — Assured Guaranty Corporation - Insured Custody Certificates |
| AGM | — Assured Guaranty Municipal |
| AMBAC | — American Municipal Bond Assurance Corporation |
| AMT | — Alternative Minimum Tax |
| BAN | — Bond Anticipation Notes |
| BHAC | — Berkshire Hathaway Assurance Corporation |
| CAB | — Capital Appreciation Bond |
| CCAB | — Convertible Capital Appreciation Bond |
| CDA | — Community Development Authority |
| CDO | — Collateralized Debt Obligation |
| COP | — Certificate of Participation |
| DRIVER | — Derivative Inverse Tax-Exempt Receipts |
| DW&P | — Department of Water & Power |
| DWR | — Department of Water Resources |
| ECFA | — Educational & Cultural Facilities Authority |
| EDA | — Economic Development Authority |
| EDFA | — Economic Development Finance Authority |
| ETF | — Exchange-Traded Fund |
| FFCB | — Federal Farm Credit Bank |
| FGIC | — Financial Guaranty Insurance Corporation |
| FHA | — Federal Housing Authority |
| FHLB | — Federal Home Loan Bank |
| FHLMC | — Federal Home Loan Mortgage Corporation |
| FICO | — The Financing Corporation |
| FNMA | — Federal National Mortgage Association |
| GDR | — Global Depository Receipt |
| GNMA | — Government National Mortgage Association |
| HCFR | — Healthcare Facilities Revenue |
| HEFA | — Health & Educational Facilities Authority |
| HEFAR | — Higher Education Facilities Authority Revenue |
| HFA | — Housing Finance Authority |
| HFFA | — Health Facilities Financing Authority |
| IBC | — Insured Bond Certificate |
| IDA | — Industrial Development Authority |
| IDAG | — Industrial Development Agency |
| IDR | — Industrial Development Revenue |
| KRW | — Republic of Korea Won |
| LIBOR | — London Interbank Offered Rate |
| LLC | — Limited Liability Company |
| LLP | — Limited Liability Partnership |
| MBIA | — Municipal Bond Insurance Association |
| MFHR | — Multi-Family Housing Revenue |
| MSTR | — Municipal Securities Trust Receipts |
| MUD | — Municipal Utility District |
| NATL-RE | — National Public Finance Guarantee Corporation |
| PCFA | — Pollution Control Finance Authority |
| PCR | — Pollution Control Revenue |
| PFA | — Public Finance Authority |
| PFFA | — Public Facilities Financing Authority |
| PFOTER | — Puttable Floating Option Tax-Exempt Receipts |
| plc | — Public Limited Company |
| PUTTER | — Puttable Tax-Exempt Receipts |
| R&D | — Research & Development |
| RDA | — Redevelopment Authority |
| RDFA | — Redevelopment Finance Authority |
| REIT | — Real Estate Investment Trust |
| ROC | — Reset Option Certificates |
| SAVRS | — Select Auction Variable Rate Securities |
| SBA | — Small Business Authority |
| SFHR | — Single Family Housing Revenue |
| SFMR | — Single Family Mortgage Revenue |
| SPDR | — Standard & Poor’s Depositary Receipts |
| STRIPS | — Separate Trading of Registered Interest and Principal Securities |
| TAN | — Tax Anticipation Notes |
| TIPS | — Treasury Inflation-Protected Securities |
| TRAN | — Tax Revenue Anticipation Notes |
| TCR | — Transferable Custody Receipts |
| TTFA | — Transportation Trust Fund Authority |
| TVA | — Tennessee Valley Authority |
| XLCA | — XL Capital Assurance |
This page is intentionally left blank.
This page is intentionally left blank.
This page is intentionally left blank.


FOR MORE INFORMATION
More information about Wells Fargo Advantage Funds is available free upon request. To obtain literature, please write, e-mail, visit the Fund’s Web site, or call:
Wells Fargo Advantage Funds
P.O. Box 8266
Boston, MA 02266-8266
E-mail: wfaf@wellsfargo.com
Web site: wellsfargoadvantagefunds.com
Individual investors: 1-800-222-8222
Retail investment professionals: 1-888-877-9275
Institutional investment professionals: 1-866-765-0778
This report and the financial statements contained herein are submitted for the general information of the shareholders of Wells Fargo Advantage Funds. If this report is used for promotional purposes, distribution of the report must be accompanied or preceded by a current prospectus. For a prospectus containing more complete information, including charges and expenses, call 1-800-222-8222 or visit the Fund’s Web site at wellsfargoadvantagefunds.com. Please consider the investment objectives, risks, charges, and expenses of the investment carefully before investing. This and other information about Wells Fargo Advantage Funds can be found in the current prospectus. Read the prospectus carefully before you invest or send money.
Wells Fargo Funds Management, LLC, a wholly owned subsidiary of Wells Fargo & Company, provides investment advisory and administrative services for Wells Fargo Advantage Funds. Other affiliates of Wells Fargo & Company provide subadvisory and other services for the Funds. The Funds are distributed by Wells Fargo Funds Distributor, LLC, Member FINRA/SIPC, an affiliate of Wells Fargo & Company.
NOT FDIC INSURED ¡ NO BANK GUARANTEE ¡ MAY LOSE VALUE
© 2012 Wells Fargo Funds Management, LLC. All rights reserved.
| | |
 | | 208987 05-12 SA228/SAR228 3-12 |

Wells Fargo Advantage Common Stock Fund

Semi-Annual Report
March 31, 2012

Reduce clutter. Save trees.
Sign up for electronic delivery of prospectuses and shareholder reports at wellsfargo.com/advantagedelivery
Contents
The views expressed and any forward-looking statements are as of March 31, 2012, unless otherwise noted, and are those of the Fund managers and/or Wells Fargo Funds Management, LLC. Discussions of individual securities, or the markets generally, or any Wells Fargo Advantage Fund are not intended as individual recommendations. Future events or results may vary significantly from those expressed in any forward-looking statements; the views expressed are subject to change at any time in response to changing circumstances in the market. Wells Fargo Funds Management, LLC, disclaims any obligation to publicly update or revise any views expressed or forward-looking statements.
NOT FDIC INSURED ¡ NO BANK GUARANTEE ¡ MAY LOSE VALUE

WELLS FARGO INVESTMENT HISTORY
| | |
| |
| 1932 | | Keystone creates one of the first mutual fund families. |
| |
| 1971 | | Wells Fargo & Company introduces one of the first institutional index funds. |
| |
| 1978 | | Wells Fargo applies Markowitz and Sharpe’s research on Modern Portfolio Theory to introduce one of the industry’s first Tactical Asset Allocation (TAA) models in institutional separately managed accounts. |
| |
| 1984 | | Wells Fargo Stagecoach Funds launches its first asset allocation fund. |
| |
| 1989 | | The Tactical Asset Allocation (TAA) Model is first applied to Wells Fargo’s asset allocation mutual funds. |
| |
| 1994 | | Wells Fargo introduces the LifePath Funds, one of the first suites of target date funds (now the Wells Fargo Advantage Dow Jones Target Date FundsSM). |
| |
| 1996 | | Evergreen Investments and Keystone Funds merge. |
| |
| 1997 | | Wells Fargo launches Wells Fargo Advantage WealthBuilder PortfoliosSM, a fund-of-funds suite of products that includes the use of quantitative models to shift assets among investment styles. |
| |
| 1999 | | Norwest Advantage Funds and Stagecoach Funds are reorganized into Wells Fargo Funds after the merger of Norwest and Wells Fargo. |
| |
| 2002 | | Evergreen Retail and Evergreen Institutional companies form the umbrella asset management company, Evergreen Investments. |
| |
| 2005 | | The integration of Strong Funds with Wells Fargo Funds creates Wells Fargo Advantage Funds, resulting in one of the top 20 mutual fund companies in the United States. |
| |
| 2006 | | Wells Fargo Advantage Funds relaunches the target date product line as Wells Fargo Advantage Dow Jones Target Date Funds. |
| |
| 2010 | | The mergers and reorganizations of Evergreen and Wells Fargo Advantage mutual funds are completed, unifying the families under the brand of Wells Fargo Advantage Funds. |
Wells Fargo Advantage Funds®
Wells Fargo Advantage Funds skillfully guides institutions, financial advisors, and individuals through the investment terrain to help them reach their financial objectives. Everything we do on behalf of investors is backed by our unique combination of qualifications.
Strength
Our organization is built on the standards of integrity and service established by our parent company—Wells Fargo & Company—more than 150 years ago. And, because we’re part of a highly diversified financial enterprise, we offer the depth of resources to help investors succeed.
Expertise
Our multi-boutique model offers investors access to the independent thinking of premier investment managers that have been chosen for their time-tested strategies. While each team specializes in a specific investment strategy, collectively they provide investors a wide choice of distinct investment styles. Our dedication to investment excellence doesn’t end with our expertise in manager selection—risk management, analysis, and rigorous ongoing review seek to ensure each manager’s investment process remains consistent.
Partnership
Our collaborative approach is built around understanding the needs and goals of our clients. By adhering to core principles of sound judgment and steady guidance, we support you through every stage of the investment decision process.
Carefully consider a fund’s investment objectives, risks, charges, and expenses before investing. For a current prospectus and, if available, a summary prospectus, containing this and other information, visit wellsfargoadvantagefunds.com. Read it carefully before investing.
Wells Fargo Funds Management, LLC, a wholly owned subsidiary of Wells Fargo & Company, provides investment advisory and administrative services for Wells Fargo Advantage Funds®. Other affiliates of Wells Fargo & Company provide subadvisory and other services for the Funds. The Funds are distributed by Wells Fargo Funds Distributor, LLC, Member FINRA/SIPC, an affiliate of Wells Fargo & Company.
“Dow Jones®” and “Dow Jones Target Date IndexesSM” are service marks of Dow Jones Trademark Holdings, LLC (“Dow Jones”), have been licensed to CME Group Index Services LLC (“CME Indexes”) and have been sublicensed for use for certain purposes by Global Index Advisors, Inc, and Wells Fargo Funds Management, LLC. The Wells Fargo Advantage Dow Jones Target Date FundsSM based on the Dow Jones Target Date IndexesSM, are not sponsored, endorsed, sold or promoted by Dow Jones, CME Indexes or their respective affiliates and none of them makes any representation regarding the advisability of investing in such product(s).
NOT FDIC INSURED ¡ NO BANK GUARANTEE ¡ MAY LOSE VALUE
Not part of the semi-annual report.
Wells Fargo Advantage Funds offers more than 110 mutual funds across a wide range of asset classes, representing over $213 billion in assets under management, as of March 31, 2012.
| | | | |
| Equity Funds | | | | |
Asia Pacific Fund | | Equity Value Fund | | Precious Metals Fund |
C&B Large Cap Value Fund | | Global Opportunities Fund | | Premier Large Company Growth Fund |
C&B Mid Cap Value Fund | | Growth Fund | | Small Cap Opportunities Fund |
Capital Growth Fund | | Index Fund | | Small Cap Value Fund |
Common Stock Fund | | International Equity Fund | | Small Company Growth Fund |
Disciplined U.S. Core Fund | | International Value Fund | | Small Company Value Fund |
Discovery Fund† | | Intrinsic Small Cap Value Fund | | Small/Mid Cap Core Fund |
Diversified Equity Fund | | Intrinsic Value Fund | | Small/Mid Cap Value Fund |
Diversified International Fund | | Intrinsic World Equity Fund | | Special Mid Cap Value Fund |
Diversified Small Cap Fund | | Large Cap Core Fund | | Special Small Cap Value Fund |
Emerging Growth Fund | | Large Cap Growth Fund | | Specialized Technology Fund |
Emerging Markets Equity Fund | | Large Company Value Fund | | Strategic Large Cap Growth Fund |
Endeavor Select Fund† | | Omega Growth Fund | | Traditional Small Cap Growth Fund |
Enterprise Fund† | | Opportunity Fund† | | Utility and Telecommunications Fund |
| Bond Funds | | | | |
Adjustable Rate Government Fund | | Inflation-Protected Bond Fund | | Short-Term Bond Fund |
California Limited-Term Tax-Free Fund | | Intermediate Tax/AMT-Free Fund | | Short-Term High Yield Bond Fund |
California Tax-Free Fund | | International Bond Fund | | Short-Term Municipal Bond Fund |
Colorado Tax-Free Fund | | Minnesota Tax-Free Fund | | Strategic Municipal Bond Fund |
Government Securities Fund | | Municipal Bond Fund | | Total Return Bond Fund |
High Income Fund | | North Carolina Tax-Free Fund | | Ultra Short-Term Income Fund |
High Yield Bond Fund | | Pennsylvania Tax-Free Fund | | Ultra Short-Term Municipal Income Fund |
Income Plus Fund | | Short Duration Government Bond Fund | | Wisconsin Tax-Free Fund |
| Asset Allocation Funds | | | | |
Absolute Return Fund | | WealthBuilder Equity Portfolio† | | Target 2020 Fund† |
Asset Allocation Fund | | WealthBuilder Growth Allocation Portfolio† | | Target 2025 Fund† |
Conservative Allocation Fund | | WealthBuilder Growth Balanced Portfolio† | | Target 2030 Fund† |
Diversified Capital Builder Fund | | WealthBuilder Moderate Balanced Portfolio† | | Target 2035 Fund† |
Diversified Income Builder Fund | | WealthBuilder Tactical Equity Portfolio† | | Target 2040 Fund† |
Growth Balanced Fund | | Target Today Fund† | | Target 2045 Fund† |
Index Asset Allocation Fund | | Target 2010 Fund† | | Target 2050 Fund† |
Moderate Balanced Fund | | Target 2015 Fund† | | Target 2055 Fund† |
WealthBuilder Conservative Allocation Portfolio† | | | | |
| Money Market Funds | | | | |
100% Treasury Money Market Fund | | Heritage Money Market Fund† | | National Tax-Free Money Market Fund |
California Municipal Money Market Fund | | Money Market Fund | | Prime Investment Money Market Fund |
Cash Investment Money Market Fund | | Municipal Cash Management Money Market Fund | | Treasury Plus Money Market Fund |
Government Money Market Fund | | Municipal Money Market Fund | | |
| Variable Trust Funds1 | | | | |
VT Discovery Fund† | | VT Intrinsic Value Fund | | VT Small Cap Growth Fund |
VT Index Asset Allocation Fund | | VT Omega Growth Fund | | VT Small Cap Value Fund |
VT International Equity Fund | | VT Opportunity Fund† | | VT Total Return Bond Fund |
An investment in a money market fund is not insured or guaranteed by the Federal Deposit Insurance Corporation or any other government agency. Although the Wells Fargo Advantage Money Market Funds seek to preserve the value of your investment at $1.00 per share, it is possible to lose money by investing in a money market fund.
| 1. | The Variable Trust Funds are generally available only through insurance company variable contracts. |
| † | In this report, the Wells Fargo Advantage Discovery FundSM, Wells Fargo Advantage Endeavor Select FundSM, Wells Fargo Advantage Enterprise FundSM, Wells Fargo Advantage Opportunity FundSM, Wells Fargo Advantage WealthBuilder Conservative Allocation PortfolioSM, Wells Fargo Advantage WealthBuilder Equity PortfolioSM, Wells Fargo Advantage WealthBuilder Growth Allocation PortfolioSM, Wells Fargo Advantage WealthBuilder Growth Balanced PortfolioSM, Wells Fargo Advantage WealthBuilder Moderate Balanced PortfolioSM, Wells Fargo Advantage WealthBuilder Tactical Equity PortfolioSM, Wells Fargo Advantage Dow Jones Target Today FundSM, Wells Fargo Advantage Dow Jones Target 2010 FundSM, Wells Fargo Advantage Dow Jones Target 2015 FundSM, Wells Fargo Advantage Dow Jones Target 2020 FundSM, Wells Fargo Advantage Dow Jones Target 2025 FundSM, Wells Fargo Advantage Dow Jones Target 2030 FundSM, Wells Fargo Advantage Dow Jones Target 2035 FundSM, Wells Fargo Advantage Dow Jones Target 2040 FundSM, Wells Fargo Advantage Dow Jones Target 2045 FundSM, Wells Fargo Advantage Dow Jones Target 2050 FundSM, Wells Fargo Advantage Dow Jones Target 2055 FundSM, Wells Fargo Advantage Heritage Money Market FundSM, Wells Fargo Advantage VT Discovery FundSM, and Wells Fargo Advantage VT Opportunity FundSM are referred to as the Discovery Fund, Endeavor Select Fund, Enterprise Fund, Opportunity Fund, WealthBuilder Conservative Allocation Portfolio, WealthBuilder Equity Portfolio, WealthBuilder Growth Allocation Portfolio, WealthBuilder Growth Balanced Portfolio, WealthBuilder Moderate Balanced Portfolio, WealthBuilder Tactical Equity Portfolio, Target Today Fund, Target 2010 Fund, Target 2015 Fund, Target 2020 Fund, Target 2025 Fund, Target 2030 Fund, Target 2035 Fund, Target 2040 Fund, Target 2045 Fund, Target 2050 Fund, Target 2055 Fund, Heritage Money Market Fund, VT Discovery Fund, and VT Opportunity Fund, respectively. |
Not part of the semi-annual report.
| | | | |
| 2 | | Wells Fargo Advantage Common Stock Fund | | Letter to Shareholders |

Karla M. Rabusch,
President
Wells Fargo Advantage Funds
The period was marked by increased confidence that the U.S. economy was staging a fragile recovery, offset by continued concerns about the possible effect on the global economy of the ongoing European sovereign debt crisis—which began in Greece and later spread to the larger economies of Italy and Spain.
In contrast to worrisome data from the eurozone, U.S. economic data remained moderately positive.
Dear Valued Shareholder:
We’re pleased to offer you this semi-annual report for the Wells Fargo Advantage Common Stock Fund for the six-month period that ended March 31, 2012. The period was marked by increased confidence that the U.S. economy was staging a fragile recovery, offset by continued concerns about the possible effect on the global economy of the ongoing European sovereign debt crisis—which began in Greece and later spread to the larger economies of Italy and Spain. U.S. stock indexes posted solid gains for the period.
Macroeconomic optimism faded as global growth slowed and worries rose.
Prior to the reporting period, investors worried that the global economy was returning to a recession. Although second quarter U.S. gross domestic product (GDP) grew at a 1.3% annual rate, it was below the levels set in 2010 and seemed to confirm that the economy had slowed from its previous pace. Moreover, the drawn-out political debate over the raising of the U.S. debt ceiling reduced confidence that the national government would be able to work together to address the country’s problems. Partly as a result, Standard & Poor’s rating service downgraded U.S. long-term debt from AAA to AA+1 in August 2011.
Throughout the six-month period, concerns about the eurozone sovereign debt situation returned to center stage. Investors became increasingly concerned that Greece would default on its debt, a scenario that only seemed more likely as eurozone leaders began to openly discuss a “voluntary” haircut on Greek debt for private investors. Because many eurozone banks owned Greek debt and many U.S. banks had financial ties to eurozone banks, investors worried about the effect of such an event on the financial systems and the global economy. In October 2011, market participants turned their attention to the debt burdens of Italy—which also had its credit rating downgraded by Standard & Poor’s—because even though it had a relatively modest budget deficit, it had a high amount of outstanding debt and a stagnant economy. French banks were heavily exposed to Italian debt, so Italy’s woes led to fears of a state bailout of French banks and a resulting increase in France’s required expenditures.
After months of rumors and worries, the Greek credit crisis was finally addressed in March 2012 when the country came to an agreement with its creditors allowing it to write down the principal on most of its bonds in exchange for increased financial austerity. By the end of the reporting period, the Greek agreement, combined with unprecedented support for eurozone banks by the European Central Bank (ECB), seemed to calm investor concerns, at least temporarily.
The U.S. economy reported relatively solid news.
In contrast to worrisome data from the eurozone, U.S. economic data remained moderately positive. After disappointing reports for first and second quarter GDP growth, reported GDP came in at a 1.8% annualized rate in the third quarter of 2011, and then accelerated to a 3.0% annualized rate in the fourth quarter. The major banks appeared to have taken steps toward repairing their balance sheets; in March, the Federal Reserve (Fed) announced that 15 of the 19 major banks had passed a “stress test,” in which the Fed attempted to gauge whether the banks could survive a severe recession that included a 50% drop in the stock market and a 21% percent decline in housing prices.
| 1. | The ratings indicated are from Standard & Poor’s. Standard & Poor’s rates the creditworthiness of bonds, ranging from AAA (highest) to D (lowest). Ratings from A to CCC may be modified by the addition of a plus (+) or minus (-) sign to show relative standing within the rating categories. |
| | | | | | |
| Letter to Shareholders | | Wells Fargo Advantage Common Stock Fund | | | 3 | |
Bank stocks rebounded strongly after the Fed released details of the stress test, but all major market sectors rallied as investors became increasingly confident that the U.S. would not return to recession. Small-cap stocks modestly outperformed large-cap stocks, and growth stocks outperformed value stocks by an even smaller margin.
Central banks continued to provide stimulus.
Throughout the reporting period, the Federal Open Market Committee (FOMC) kept its key interest rates effectively at zero in order to support the economy and financial system. In the second quarter of 2011, the Fed completed its second round of monetary stimulus, in which it had planned to purchase $600 billion in long-term U.S. Treasuries as well as reinvest an additional $250 billion to $300 billion in Treasuries with the proceeds from earlier investments. Even though the Fed seemed to rule out further monetary stimulus, it remained accommodative. In early August 2011, in response to extreme market volatility and signs of a weakening economy, the Fed announced its intention to keep interest rates low until at least late 2014.
At the beginning of the period, the ECB had a key rate of 1.50%, which it had raised in early 2011 in an attempt to keep inflation in check. However, in response to weakness in the southern European economies, the ECB lowered its key rate to 1.25% in November and to 1.0% in December. In August, after a sell-off in the sovereign debts of Spain and Italy, the ECB announced plans to purchase the debt of those countries in exchange for increased deficit reduction. The ECB also continued to provide virtually unlimited liquidity for banks, announcing a long-term refinancing operation (LTRO) in December through which it provided low cost, three-year loans to lenders.
We use time-tested investment strategies, even as many variables are at work in the market.
The full effect of the credit crisis remains unknown. Elevated unemployment and debt defaults continue to pressure consumers and businesses alike.
In our experience strict adherence to time-tested investment strategies has its rewards. As a whole, Wells Fargo Advantage Funds represents investments across a range of asset classes and investment styles, giving you an opportunity to create a diversified investment portfolio. While diversification may not prevent losses in a downturn, we believe it helps in managing risk.
Thank you for choosing to invest with Wells Fargo Advantage Funds. We appreciate your confidence in us and remain committed to helping you meet your financial needs. For current information about your fund investments, contact your investment professional, visit our Web site at wellsfargoadvantagefunds.com, or call us directly at 1-800-222-8222. We are available 24 hours a day, 7 days a week.
Sincerely,

Karla M. Rabusch
President
Wells Fargo Advantage Funds
| | | | |
| 4 | | Wells Fargo Advantage Common Stock Fund | | Letter to Shareholders |
Notice to Shareholders
The Board of Trustees for Wells Fargo Advantage Funds has unanimously approved the following modifications to certain net asset value (NAV) waiver privileges and commission schedules:
| | n | | Effective May 1, 2012, automatic investment plan (AIP) purchases and proceeds received from systematic withdrawals will no longer qualify for NAV repurchase privileges. | |
| | n | | Effective May 1, 2012, discretionary rights to waive the upfront commission for Class C and “jumbo” Class A share purchases will no longer be granted to broker/dealers. However, we will continue to waive the Class C shares contingent deferred sales charge for redemptions by employer-sponsored retirement plans where the dealer of record waived its commission at the time of purchase. | |
| | n | | Effective July 31, 2012, NAV purchase privileges for former Evergreen Class IS and Class R shareholders are being modified to remove the ability to purchase Class A shares at NAV unless those shares are held directly with the Fund on or after July 31, 2012. | |
Please contact your investment professional or call us directly at 1-800-222-8222 if you have any questions on this Notice to Shareholders.
| | | | | | |
| Performance Highlights (Unaudited) | | Wells Fargo Advantage Common Stock Fund | | | 5 | |
INVESTMENT OBJECTIVE
The Fund seeks long-term capital appreciation.
ADVISER
Wells Fargo Funds Management, LLC
SUB-ADVISER
Wells Capital Management Incorporated
PORTFOLIO MANAGER
Ann M. Miletti
FUND INCEPTION
December 29, 1989
| | | | |
TEN LARGEST EQUITY HOLDINGS1 (AS OF MARCH 31, 2012) | |
Grand Canyon Education Incorporated | | | 2.22% | |
CapitalSource Incorporated | | | 1.92% | |
Wabash National Corporation | | | 1.78% | |
Parexel International Corporation | | | 1.66% | |
SPX Corporation | | | 1.60% | |
Express Incorporated | | | 1.53% | |
Hologic Incorporated | | | 1.46% | |
Mohawk Industries Incorporated | | | 1.42% | |
Steelcase Incorporated | | | 1.40% | |
Red Hat Incorporated | | | 1.38% | |
| | |
SECTOR DISTRIBUTION2 (AS OF MARCH 31, 2012) |
|
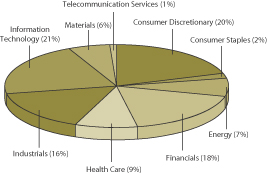 |
| 1. | The ten largest equity holdings are calculated based on the value of the securities divided by total net assets of the Fund. Holdings are subject to change and may have changed since the date specified. |
| 2. | Sector distribution is subject to change and is calculated based on the total long-term investments of the Fund. |
| | | | |
| 6 | | Wells Fargo Advantage Common Stock Fund | | Performance Highlights (Unaudited) |
AVERAGE ANNUAL TOTAL RETURN3 (%) (AS OF MARCH 31, 2012)
| | | | | | | | | | | | | | | | | | | | | | | | | | | | | | | | | | | | | | | | | | | | |
| | | | | | Including Sales Charge | | | Excluding Sales Charge | | | Expense Ratios4 | |
| | | Inception Date | | | 6 Months* | | | 1 Year | | | 5 Year | | | 10 Year | | | 6 Months* | | | 1 Year | | | 5 Year | | | 10 Year | | | Gross | | | Net5 | |
Class A (SCSAX) | | | 11/30/2000 | | | | 22.35 | | | | (2.72 | ) | | | 4.52 | | | | 7.27 | | | | 29.84 | | | | 3.24 | | | | 5.76 | | | | 7.90 | | | | 1.31% | | | | 1.27% | |
Class B (SCSKX)** | | | 11/30/2000 | | | | 24.33 | | | | (2.50 | ) | | | 4.62 | | | | 7.32 | | | | 29.33 | | | | 2.50 | | | | 4.95 | | | | 7.32 | | | | 2.06% | | | | 2.02% | |
Class C (STSAX) | | | 11/30/2000 | | | | 28.41 | | | | 1.50 | | | | 4.96 | | | | 7.07 | | | | 29.41 | | | | 2.50 | | | | 4.96 | | | | 7.07 | | | | 2.06% | | | | 2.02% | |
Administrator Class (SCSDX) | | | 07/30/2010 | | | | | | | | | | | | | | | | | | | | 29.97 | | | | 3.47 | | | | 5.82 | | | | 7.93 | | | | 1.15% | | | | 1.11% | |
Institutional Class (SCNSX) | | | 07/30/2010 | | | | | | | | | | | | | | | | | | | | 30.12 | | | | 3.70 | | | | 5.91 | | | | 7.97 | | | | 0.88% | | | | 0.88% | |
Investor Class (STCSX) | | | 12/29/1989 | | | | | | | | | | | | | | | | | | | | 29.88 | | | | 3.26 | | | | 5.73 | | | | 7.96 | | | | 1.38% | | | | 1.30% | |
Russell 2500TM Index6 | | | | | | | | | | | | | | | | | | | | | | | 29.39 | | | | 1.33 | | | | 3.03 | | | | 7.49 | | | | | | | | | |
| * | Returns for periods of less than one year are not annualized. |
| ** | Class B shares are closed to investment, except in connection with the reinvestment of any distributions and permitted exchanges. |
Figures quoted represent past performance, which is no guarantee of future results and do not reflect the deduction of taxes that a shareholder may pay on fund distributions or the redemption of fund shares. Investment return and principal value of an investment will fluctuate so that an investor’s shares, when redeemed, may be worth more or less than their original cost. Performance shown without sales charges would be lower if sales charges were reflected. Current performance may be lower or higher than the performance data quoted and assumes the reinvestment of dividends and capital gains. Current month-end performance is available on the Fund’s Web site – wellsfargoadvantagefunds.com.
Index returns do not include transaction costs associated with buying and selling securities, any mutual fund fees or expenses or any taxes. It is not possible to invest directly in an index.
For Class A shares, the maximum front-end sales charge is 5.75%. For Class B shares, the maximum contingent deferred sales charge is 5.00%. For Class C shares, the maximum contingent deferred sales charge is 1.00%. Performance including sales charge assumes the sales charge for the corresponding time period. Administrator Class, Institutional Class and Investor Class shares are sold without a front-end sales charge or contingent deferred sales charge.
Please keep in mind that high double-digit returns were primarily achieved during favorable market conditions. You should not expect that such favorable returns can be consistently achieved. A Fund’s performance, especially for very short time periods, should not be the sole factor in making your investment decision.
Stock fund values fluctuate in response to the activities of individual companies and general market and economic conditions. Smaller-company stocks tend to be more volatile and less liquid than those of larger companies. Certain investment strategies tend to increase the total risk of an investment (relative to the broader market). This Fund is exposed to foreign investment risk. Consult the Fund’s prospectus for additional information on these and other risks.
| 3. | Historical performance shown for the Administrator Class and Institutional Class shares prior to their inception reflects the performance of the Class A shares, and includes the higher expenses applicable to the Class A shares. If these expenses had not been included, the returns would be higher. |
| 4. | Reflects the expense ratios as stated in the most recent prospectuses. |
| 5. | The Adviser has committed through January 31, 2013 to waive fees and/or reimburse expenses to the extent necessary to cap the Fund’s Total Annual Fund Operating Expenses After Fee Waiver, excluding certain expenses, at 1.26% for Class A, 2.01% for Class B, 2.01% for Class C, 1.10% for Administrator Class, 0.90% for Institutional Class and 1.29% for Investor Class. Without this cap, the Fund’s returns would have been lower. |
| 6. | The Russell 2500TM Index measures the performance of the 2,500 smallest companies in the Russell 3000® Index, which represents approximately 16% of the total market capitalization of the Russell 3000 Index. You cannot invest directly in an index. |
| | | | | | |
| Fund Expenses (Unaudited) | | Wells Fargo Advantage Common Stock Fund | | | 7 | |
As a shareholder of the Fund, you incur two types of costs: (1) transaction costs, including sales charges (loads) on purchase payments and contingent deferred sales charges (if any) on redemptions and (2) ongoing costs, including management fees; distribution (12b-1) and/or shareholder service fees; and other Fund expenses. This example is intended to help you understand your ongoing costs (in dollars) of investing in the Fund and to compare these costs with the ongoing costs of investing in other mutual funds.
The example is based on an investment of $1,000 invested at the beginning of the six-month period and held for the entire period from October 1, 2011 to March 31, 2012.
Actual Expenses
The “Actual” line of the table below provides information about actual account values and actual expenses. You may use the information in this line, together with the amount you invested, to estimate the expenses that you paid over the period. Simply divide your account value by $1,000 (for example, an $8,600 account value divided by $1,000 = 8.6), then multiply the result by the number in the “Actual” line under the heading entitled “Expenses Paid During Period” for your applicable class of shares to estimate the expenses you paid on your account during this period.
Hypothetical Example for Comparison Purposes
The “Hypothetical” line of the table below provides information about hypothetical account values and hypothetical expenses based on the Fund’s actual expense ratio and an assumed rate of return of 5% per year before expenses, which is not the Fund’s actual return. The hypothetical account values and expenses may not be used to estimate the actual ending account balance or expenses you paid for the period. You may use this information to compare the ongoing costs of investing in the Fund and other funds. To do so, compare this 5% hypothetical example with the 5% hypothetical examples that appear in the shareholder reports of the other funds.
Please note that the expenses shown in the table are meant to highlight your ongoing costs only and do not reflect any transactional costs, such as sales charges (loads) and contingent deferred sales charges. Therefore, the “Hypothetical” line of the table is useful in comparing ongoing costs only, and will not help you determine the relative total costs of owning different funds. In addition, if these transactional costs were included, your costs would have been higher.
| | | | | | | | | | | | | | | | |
| | | Beginning
Account Value
10-01-2011 | | | Ending
Account Value
03-31-2012 | | | Expenses
Paid During
the Period1 | | | Net Annual
Expense Ratio | |
Class A | | | | | | | | | | | | | | | | |
Actual | | $ | 1,000.00 | | | $ | 1,298.41 | | | $ | 7.24 | | | | 1.26 | % |
Hypothetical (5% return before expenses) | | $ | 1,000.00 | | | $ | 1,018.70 | | | $ | 6.36 | | | | 1.26 | % |
Class B | | | | | | | | | | | | | | | | |
Actual | | $ | 1,000.00 | | | $ | 1,293.27 | | | $ | 11.52 | | | | 2.01 | % |
Hypothetical (5% return before expenses) | | $ | 1,000.00 | | | $ | 1,014.95 | | | $ | 10.13 | | | | 2.01 | % |
Class C | | | | | | | | | | | | | | | | |
Actual | | $ | 1,000.00 | | | $ | 1,294.12 | | | $ | 11.53 | | | | 2.01 | % |
Hypothetical (5% return before expenses) | | $ | 1,000.00 | | | $ | 1,014.95 | | | $ | 10.13 | | | | 2.01 | % |
Administrator Class | | | | | | | | | | | | | | | | |
Actual | | $ | 1,000.00 | | | $ | 1,299.70 | | | $ | 6.09 | | | | 1.06 | % |
Hypothetical (5% return before expenses) | | $ | 1,000.00 | | | $ | 1,019.70 | | | $ | 5.35 | | | | 1.06 | % |
Institutional Class | | | | | | | | | | | | | | | | |
Actual | | $ | 1,000.00 | | | $ | 1,301.24 | | | $ | 5.01 | | | | 0.87 | % |
Hypothetical (5% return before expenses) | | $ | 1,000.00 | | | $ | 1,020.65 | | | $ | 4.39 | | | | 0.87 | % |
Investor Class | | | | | | | | | | | | | | | | |
Actual | | $ | 1,000.00 | | | $ | 1,298.76 | | | $ | 7.41 | | | | 1.29 | % |
Hypothetical (5% return before expenses) | | $ | 1,000.00 | | | $ | 1,018.55 | | | $ | 6.51 | | | | 1.29 | % |
| 1. | Expenses paid is equal to the annualized expense ratio of each class multiplied by the average account value over the period, multiplied by the number of days in the most recent fiscal half-year divided by the number of days in the fiscal year (to reflect the one-half year period). |
| | | | |
| 8 | | Wells Fargo Advantage Common Stock Fund | | Portfolio of Investments—March 31, 2012 (Unaudited) |
| | | | | | | | | | | | |
| Security Name | | | | | | Shares | | | Value | |
| | | | | | | | | | | | |
| | | | |
Common Stocks: 95.38% | | | | | | | | | | | | |
| | | | |
Consumer Discretionary: 19.12% | | | | | | | | | | | | |
| | | | |
| Auto Components: 0.59% | | | | | | | | | | | | |
BorgWarner Incorporated Ǡ | | | | | | | 82,036 | | | $ | 6,918,916 | |
| | | | | | | | | | | | |
| | | | |
| Diversified Consumer Services: 3.36% | | | | | | | | | | | | |
Capella Education Company † | | | | | | | 373,982 | | | | 13,444,653 | |
Grand Canyon Education Incorporated † | | | | | | | 1,475,570 | | | | 26,206,123 | |
| | | | |
| | | | | | | | | | | 39,650,776 | |
| | | | | | | | | | | | |
| | | | |
| Hotels, Restaurants & Leisure: 1.11% | | | | | | | | | | | | |
Royal Caribbean Cruises Limited | | | | | | | 444,180 | | | | 13,072,217 | |
| | | | | | | | | | | | |
| | | | |
| Household Durables: 1.42% | | | | | | | | | | | | |
Mohawk Industries Incorporated † | | | | | | | 250,951 | | | | 16,690,751 | |
| | | | | | | | | | | | |
| | | | |
| Internet & Catalog Retail: 1.14% | | | | | | | | | | | | |
Liberty Media Corporation Interactive Series A † | | | | | | | 706,017 | | | | 13,477,865 | |
| | | | | | | | | | | | |
| | | | |
| Media: 4.91% | | | | | | | | | | | | |
Cablevision Systems Corporation New York Group Class A | | | | | | | 746,000 | | | | 10,951,280 | |
Interpublic Group of Companies Incorporated | | | | | | | 1,350,646 | | | | 15,410,871 | |
Scripps Networks Interactive Incorporated | | | | | | | 331,000 | | | | 16,116,390 | |
Time Warner Cable Incorporated | | | | | | | 189,808 | | | | 15,469,352 | |
| | | | |
| | | | | | | | | | | 57,947,893 | |
| | | | | | | | | | | | |
| | | | |
| Specialty Retail: 6.59% | | | | | | | | | | | | |
Ann Incorporated † | | | | | | | 561,074 | | | | 16,069,159 | |
Children’s Place Retail Stores Incorporated «† | | | | | | | 174,823 | | | | 9,033,104 | |
Express Incorporated † | | | | | | | 721,300 | | | | 18,018,074 | |
PetSmart Incorporated | | | | | | | 269,540 | | | | 15,423,079 | |
Tractor Supply Company | | | | | | | 98,124 | | | | 8,886,109 | |
Urban Outfitters Incorporated Ǡ | | | | | | | 351,213 | | | | 10,223,810 | |
| | | | |
| | | | | | | | | | | 77,653,335 | |
| | | | | | | | | | | | |
| | | | |
Consumer Staples: 1.34% | | | | | | | | | | | | |
| | | | |
| Household Products: 1.34% | | | | | | | | | | | | |
Church & Dwight Company Incorporated | | | | | | | 321,016 | | | | 15,790,777 | |
| | | | | | | | | | | | |
| | | | |
Energy: 7.00% | | | | | | | | | | | | |
| | | | |
| Energy Equipment & Services: 3.58% | | | | | | | | | | | | |
Cameron International Corporation † | | | | | | | 305,000 | | | | 16,113,150 | |
Helmerich & Payne Incorporated « | | | | | | �� | 217,000 | | | | 11,707,150 | |
Noble Corporation « | | | | | | | 386,449 | | | | 14,480,244 | |
| | | | |
| | | | | | | | | | | 42,300,544 | |
| | | | | | | | | | | | |
| | | | |
| Oil, Gas & Consumable Fuels: 3.42% | | | | | | | | | | | | |
Forest Oil Corporation † | | | | | | | 1,111,238 | | | | 13,468,205 | |
Newfield Exploration Company † | | | | | | | 397,637 | | | | 13,790,051 | |
The accompanying notes are an integral part of these financial statements.
| | | | | | |
| Portfolio of Investments—March 31, 2012 (Unaudited) | | Wells Fargo Advantage Common Stock Fund | | | 9 | |
| | | | | | | | | | | | |
| Security Name | | | | | | Shares | | | Value | |
| | | | | | | | | | | | |
| | | | |
| Oil, Gas & Consumable Fuels (continued) | | | | | | | | | | | | |
Plains Exploration & Product Company † | | | | | | | 305,827 | | | $ | 13,043,522 | |
| | | | |
| | | | | | | | | | | 40,301,778 | |
| | | | | | | | | | | | |
| | | | |
Financials: 17.30% | | | | | | | | | | | | |
| | | | |
| Capital Markets: 2.33% | | | | | | | | | | | | |
Greenhill & Company Incorporated « | | | | | | | 264,829 | | | | 11,557,138 | |
Waddell & Reed Financial Incorporated « | | | | | | | 490,141 | | | | 15,885,470 | |
| | | | |
| | | | | | | | | | | 27,442,608 | |
| | | | | | | | | | | | |
| | | | |
| Commercial Banks: 3.96% | | | | | | | | | | | | |
CapitalSource Incorporated | | | | | | | 3,432,000 | | | | 22,651,200 | |
City National Corporation | | | | | | | 277,299 | | | | 14,549,879 | |
MB Financial Incorporated | | | | | | | 453,000 | | | | 9,508,470 | |
| | | | |
| | | | | | | | | | | 46,709,549 | |
| | | | | | | | | | | | |
| | | | |
| Diversified Financial Services: 1.18% | | | | | | | | | | | | |
NBH Holdings Corporation Class A †144A(a) | | | | | | | 572,000 | | | | 9,295,000 | |
NBH Holdings Corporation †(a) | | | | | | | 283,000 | | | | 4,598,750 | |
| | | | |
| | | | | | | | | | | 13,893,750 | |
| | | | | | | | | | | | |
| | | | |
| Insurance: 4.77% | | | | | | | | | | | | |
Arch Capital Group Limited † | | | | | | | 356,608 | | | | 13,280,082 | |
CNO Financial Group Incorporated † | | | | | | | 1,969,606 | | | | 15,323,535 | |
Reinsurance Group of America Incorporated | | | | | | | 208,873 | | | | 12,421,677 | |
RenaissanceRe Holdings Limited | | | | | | | 201,190 | | | | 15,236,119 | |
| | | | |
| | | | | | | | | | | 56,261,413 | |
| | | | | | | | | | | | |
| | | | |
| REITs: 5.06% | | | | | | | | | | | | |
BioMed Realty Trust Incorporated | | | | | | | 702,614 | | | | 13,335,614 | |
Campus Crest Communities Incorporated | | | | | | | 916,000 | | | | 10,680,560 | |
DuPont Fabros Technology Incorporated « | | | | | | | 601,896 | | | | 14,716,357 | |
Hersha Hospitality Trust | | | | | | | 2,737,361 | | | | 14,945,991 | |
Mid-America Apartment Communities Incorporated | | | | | | | 89,387 | | | | 5,991,611 | |
| | | | |
| | | | | | | | | | | 59,670,133 | |
| | | | | | | | | | | | |
| | | | |
Health Care: 8.17% | | | | | | | | | | | | |
| | | | |
| Health Care Equipment & Supplies: 5.21% | | | | | | | | | | | | |
CareFusion Corporation † | | | | | | | 598,000 | | | | 15,506,140 | |
DENTSPLY International Incorporated « | | | | | | | 356,997 | | | | 14,326,290 | |
Hologic Incorporated † | | | | | | | 799,000 | | | | 17,218,450 | |
Varian Medical Systems Incorporated Ǡ | | | | | | | 207,866 | | | | 14,334,439 | |
| | | | |
| | | | | | | | | | | 61,385,319 | |
| | | | | | | | | | | | |
| | | | |
| Health Care Providers & Services: 1.30% | | | | | | | | | | | | |
Universal Health Services Class B | | | | | | | 365,480 | | | | 15,317,267 | |
| | | | | | | | | | | | |
| | | | |
| Life Sciences Tools & Services: 1.66% | | | | | | | | | | | | |
Parexel International Corporation † | | | | | | | 726,684 | | | | 19,598,667 | |
| | | | | | | | | | | | |
The accompanying notes are an integral part of these financial statements.
| | | | |
| 10 | | Wells Fargo Advantage Common Stock Fund | | Portfolio of Investments—March 31, 2012 (Unaudited) |
| | | | | | | | | | | | |
| Security Name | | | | | | Shares | | | Value | |
| | | | | | | | | | | | |
| | | | |
Industrials: 15.22% | | | | | | | | | | | | |
| | | | |
| Aerospace & Defense: 0.31% | | | | | | | | | | | | |
Spirit AeroSystems Holdings Incorporated † | | | | | | | 148,551 | | | $ | 3,633,557 | |
| | | | | | | | | | | | |
| | | | |
| Airlines: 1.76% | | | | | | | | | | | | |
Alaska Air Group Incorporated † | | | | | | | 368,000 | | | | 13,181,760 | |
United Continental Holdings Incorporated Ǡ | | | | | | | 352,000 | | | | 7,568,000 | |
| | | | |
| | | | | | | | | | | 20,749,760 | |
| | | | | | | | | | | | |
| | | | |
| Commercial Services & Supplies: 3.79% | | | | | | | | | | | | |
Herman Miller Incorporated « | | | | | | | 530,000 | | | | 12,168,800 | |
Republic Services Incorporated | | | | | | | 522,000 | | | | 15,952,320 | |
Steelcase Incorporated « | | | | | | | 1,723,600 | | | | 16,546,560 | |
| | | | |
| | | | | | | | | | | 44,667,680 | |
| | | | | | | | | | | | |
| | | | |
| Electrical Equipment: 1.18% | | | | | | | | | | | | |
AMETEK Incorporated | | | | | | | 287,357 | | | | 13,939,688 | |
| | | | | | | | | | | | |
| | | | |
| Machinery: 4.59% | | | | | | | | | | | | |
Pentair Incorporated « | | | | | | | 299,064 | | | | 14,238,437 | |
SPX Corporation | | | | | | | 244,000 | | | | 18,917,320 | |
Wabash National Corporation † | | | | | | | 2,023,047 | | | | 20,938,536 | |
| | | | |
| | | | | | | | | | | 54,094,293 | |
| | | | | | | | | | | | |
| | | | |
| Road & Rail: 2.56% | | | | | | | | | | | | |
Avis Budget Group Incorporated † | | | | | | | 1,100,451 | | | | 15,571,382 | |
Ryder System Incorporated | | | | | | | 277,710 | | | | 14,663,088 | |
| | | | |
| | | | | | | | | | | 30,234,470 | |
| | | | | | | | | | | | |
| | | | |
| Trading Companies & Distributors: 1.03% | | | | | | | | | | | | |
GATX Corporation « | | | | | | | 303,000 | | | | 12,210,900 | |
| | | | | | | | | | | | |
| | | | |
Information Technology: 20.13% | | | | | | | | | | | | |
| | | | |
| Communications Equipment: 1.22% | | | | | | | | | | | | |
Riverbed Technology Incorporated † | | | | | | | 513,115 | | | | 14,408,269 | |
| | | | | | | | | | | | |
| | | | |
| Computers & Peripherals: 0.87% | | | | | | | | | | | | |
Diebold Incorporated | | | | | | | 266,197 | | | | 10,253,908 | |
| | | | | | | | | | | | |
| | | | |
| Electronic Equipment, Instruments & Components: 3.81% | | | | | | | | | | | | |
Ingram Micro Incorporated Class A † | | | | | | | 778,480 | | | | 14,448,589 | |
Molex Incorporated Class A | | | | | | | 646,057 | | | | 15,150,037 | |
Trimble Navigation Limited † | | | | | | | 282,697 | | | | 15,384,371 | |
| | | | |
| | | | | | | | | | | 44,982,997 | |
| | | | | | | | | | | | |
| | | | |
| IT Services: 5.58% | | | | | | | | | | | | |
Alliance Data Systems Corporation Ǡ | | | | | | | 94,131 | | | | 11,856,741 | |
Amdocs Limited † | | | | | | | 429,000 | | | | 13,547,820 | |
Cognizant Technology Solutions Corporation Class A † | | | | | | | 173,000 | | | | 13,312,350 | |
The accompanying notes are an integral part of these financial statements.
| | | | | | |
| Portfolio of Investments—March 31, 2012 (Unaudited) | | Wells Fargo Advantage Common Stock Fund | | | 11 | |
| | | | | | | | | | | | |
| Security Name | | | | | | Shares | | | Value | |
| | | | | | | | | | | | |
| | | | |
| IT Services (continued) | | | | | | | | | | | | |
Gartner Incorporated † | | | | | | | 326,000 | | | $ | 13,900,640 | |
Global Payments Incorporated | | | | | | | 276,532 | | | | 13,126,974 | |
| | | | |
| | | | | | | | | | | 65,744,525 | |
| | | | | | | | | | | | |
| | | | |
| Semiconductors & Semiconductor Equipment: 3.90% | | | | | | | | | | | | |
Integrated Device Technology Incorporated † | | | | | | | 2,172,000 | | | | 15,529,800 | |
ON Semiconductor Corporation † | | | | | | | 1,785,000 | | | | 16,082,850 | |
Xilinx Incorporated | | | | | | | 395,000 | | | | 14,389,850 | |
| | | | |
| | | | | | | | | | | 46,002,500 | |
| | | | | | | | | | | | |
| | | | |
| Software: 4.75% | | | | | | | | | | | | |
Activision Blizzard Incorporated « | | | | | | | 946,000 | | | | 12,127,720 | |
Ansys Incorporated Ǡ | | | | | | | 200,250 | | | | 13,020,255 | |
Nuance Communications Incorporated Ǡ | | | | | | | 571,700 | | | | 14,624,086 | |
Red Hat Incorporated † | | | | | | | 271,500 | | | | 16,260,135 | |
| | | | |
| | | | | | | | | | | 56,032,196 | |
| | | | | | | | | | | | |
| | | | |
Materials: 5.84% | | | | | | | | | | | | |
| | | | |
| Chemicals: 1.19% | | | | | | | | | | | | |
International Flavors & Fragrances Incorporated | | | | | | | 240,000 | | | | 14,064,000 | |
| | | | | | | | | | | | |
| | | | |
| Containers & Packaging: 2.46% | | | | | | | | | | | | |
Crown Holdings Incorporated † | | | | | | | 397,000 | | | | 14,621,510 | |
Packaging Corporation of America | | | | | | | 485,956 | | | | 14,379,438 | |
| | | | |
| | | | | | | | | | | 29,000,948 | |
| | | | | | | | | | | | |
| | | | |
| Metals & Mining: 2.19% | | | | | | | | | | | | |
Agnico-Eagle Mines Limited | | | | | | | 213,500 | | | | 7,126,630 | |
Royal Gold Incorporated | | | | | | | 106,127 | | | | 6,921,603 | |
Steel Dynamics Incorporated | | | | | | | 804,326 | | | | 11,694,900 | |
| | | | |
| | | | | | | | | | | 25,743,133 | |
| | | | | | | | | | | | |
| | | | |
Telecommunication Services: 1.26% | | | | | | | | | | | | |
| | | | |
| Diversified Telecommunication Services: 1.26% | | | | | | | | | | | | |
Time Warner Telecom Incorporated Ǡ | | | | | | | 670,632 | | | | 14,861,205 | |
| | | | | | | | | | | | |
| | | | |
Total Common Stocks (Cost $824,765,338) | | | | | | | | | | | 1,124,707,587 | |
| | | | | | | | | | | | |
| | | | |
| | | | | | | Principal | | | | |
| | | | |
Other: 0.27% | | | | | | | | | | | | |
Gryphon Funding Limited, Pass-Through Entity (a)(v)(i) | | | | | | $ | 4,204,277 | | | | 1,177,197 | |
VFNC Corporation, Pass-Through Entity, 0.24% 144A(a)(v)(i)± | | | | | | | 4,651,913 | | | | 1,953,803 | |
| | | | |
Total Other (Cost $1,282,040) | | | | | | | | | | | 3,131,000 | |
| | | | | | | | | | | | |
The accompanying notes are an integral part of these financial statements.
| | | | |
| 12 | | Wells Fargo Advantage Common Stock Fund | | Portfolio of Investments—March 31, 2012 (Unaudited) |
| | | | | | | | | | | | | | |
| Security Name | | | | Yield | | | Shares | | | Value | |
| | | | | | | | | | | | | | |
| Short-Term Investments: 15.39% | | | | | | | | | | | | | | |
| | | | |
| Investment Companies: 15.39% | | | | | | | | | | | | | | |
Wells Fargo Advantage Cash Investment Money Market Fund, Select Class (l)(u) | | | | | 0.10 | % | | | 51,016,220 | | | $ | 51,016,220 | |
Wells Fargo Securities Lending Cash Investments, LLC (v)(l)(u)(r) | | | | | 0.18 | | | | 130,523,038 | | | | 130,523,038 | |
| | | | |
Total Short-Term Investments (Cost $181,539,258) | | | | | | | | | | | | | 181,539,258 | |
| | | | | | | | | | | | | | |
| | | | | | | | |
| Total Investments in Securities | | | | | | | | |
| (Cost $1,007,586,636) * | | | 111.04 | % | | | 1,309,377,845 | |
Other Assets and Liabilities, Net | | | (11.04 | ) | | | (130,131,991 | ) |
| | | | | | | | |
| Total Net Assets | | | 100.00 | % | | $ | 1,179,245,854 | |
| | | | | | | | |
| « | All or a portion of this security is on loan. |
| † | Non-income earning security |
| 144A | Security that may be resold to “qualified institutional buyers” under Rule 144A or security offered pursuant to Section 4(2) of the Securities Act of 1933, as amended. |
| (a) | Security is fair valued by the Management Valuation Team, and in certain instances by the Board of Trustees, in accordance with procedures approved by the Board of Trustees. |
| (v) | Security represents investment of cash collateral received from securities on loan. |
| ± | Variable rate investment |
| (l) | Investment in an affiliate |
| (u) | Rate shown is the 7-day annualized yield at period end. |
| (r) | The investment company is exempt from registration under Section 3(c)(7) of the 1940 Act. |
| * | Cost for federal income tax purposes is $1,022,007,378 and net unrealized appreciation (depreciation) consists of: |
| | | | |
Gross unrealized appreciation | | $ | 296,810,709 | |
Gross unrealized depreciation | | | (9,440,242 | ) |
| | | | |
Net unrealized appreciation | | $ | 287,370,467 | |
The accompanying notes are an integral part of these financial statements.
| | | | | | |
| Statement of Assets and Liabilities—March 31, 2012 (Unaudited) | | Wells Fargo Advantage Common Stock Fund | | | 13 | |
| | | | |
| | | | |
| |
Assets | | | | |
Investments | | | | |
In unaffiliated securities (including securities on loan), at value (see cost below) | | $ | 1,127,838,587 | |
In affiliated securities, at value (see cost below) | | | 181,539,258 | |
| | | | |
Total investments, at value (see cost below) | | | 1,309,377,845 | |
Receivable for investments sold | | | 2,447,779 | |
Receivable for Fund shares sold | | | 1,009,134 | |
Receivable for dividends | | | 1,495,062 | |
Receivable for securities lending income | | | 13,132 | |
Prepaid expenses and other assets | | | 26,148 | |
| | | | |
Total assets | | | 1,314,369,100 | |
| | | | |
| |
Liabilities | | | | |
Payable for investments purchased | | | 722,460 | |
Payable for Fund shares redeemed | | | 1,309,916 | |
Payable upon receipt of securities loaned | | | 131,805,078 | |
Advisory fee payable | | | 667,966 | |
Distribution fees payable | | | 14,734 | |
Due to other related parties | | | 354,349 | |
Accrued expenses and other liabilities | | | 248,743 | |
| | | | |
Total liabilities | | | 135,123,246 | |
| | | | |
Total net assets | | $ | 1,179,245,854 | |
| | | | |
| |
NET ASSETS CONSIST OF | | | | |
Paid-in capital | | $ | 858,805,692 | |
Undistributed net investment loss | | | (1,058,382 | ) |
Accumulated net realized gains on investments | | | 19,707,335 | |
Net unrealized gains on investments | | | 301,791,209 | |
| | | | |
Total net assets | | $ | 1,179,245,854 | |
| | | | |
| |
COMPUTATION OF NET ASSET VALUE AND OFFERING PRICE PER SHARE1 | | | | |
Net assets – Class A | | $ | 215,102,713 | |
Shares outstanding – Class A | | | 10,314,495 | |
Net asset value per share – Class A | | | $20.85 | |
Maximum offering price per share – Class A2 | | | $22.12 | |
Net assets – Class B | | $ | 1,256,821 | |
Shares outstanding – Class B | | | 68,124 | |
Net asset value per share – Class B | | | $18.45 | |
Net assets – Class C | | $ | 21,345,326 | |
Shares outstanding – Class C | | | 1,157,135 | |
Net asset value per share – Class C | | | $18.45 | |
Net assets – Administrator Class | | $ | 20,218,761 | |
Shares outstanding – Administrator Class | | | 966,831 | |
Net asset value per share – Administrator Class | | | $20.91 | |
Net assets – Institutional Class | | $ | 73,646,199 | |
Shares outstanding – Institutional Class | | | 3,507,671 | |
Net asset value per share – Institutional Class | | | $21.00 | |
Net assets – Investor Class | | $ | 847,676,034 | |
Shares outstanding – Investor Class | | | 39,787,607 | |
Net asset value per share – Investor Class | | | $21.31 | |
| |
Investments in unaffiliated securities, at cost | | $ | 826,047,378 | |
| | | | |
Investments in affiliated securities, at cost | | $ | 181,539,258 | |
| | | | |
Total investments, at cost | | $ | 1,007,586,636 | |
| | | | |
Securities on loan, at value | | $ | 128,797,367 | |
| | | | |
| 1. | The Fund has an unlimited number of authorized shares. |
| 2. | Maximum offering price is computed as 100/94.25 of net asset value. On investments of $50,000 or more, the offering price is reduced. |
The accompanying notes are an integral part of these financial statements.
| | | | |
| 14 | | Wells Fargo Advantage Common Stock Fund | | Statement of Operations—March 31, 2012 (Unaudited) |
| | | | |
| | | | |
| |
Investment income | | | | |
Dividends | | $ | 5,701,429 | |
Securities lending income, net | | | 120,747 | |
Income from affiliated securities | | | 25,059 | |
| | | | |
Total investment income | | | 5,847,235 | |
| | | | |
| |
Expenses | | | | |
Advisory fee | | | 3,875,665 | |
Administration fees | | | | |
Fund level | | | 269,498 | |
Class A | | | 240,894 | |
Class B | | | 1,756 | |
Class C | | | 26,134 | |
Administrator Class | | | 10,163 | |
Institutional Class | | | 14,234 | |
Investor Class | | | 1,345,286 | |
Shareholder servicing fees | | | | |
Class A | | | 231,629 | |
Class B | | | 1,688 | |
Class C | | | 25,129 | |
Administrator Class | | | 19,826 | |
Investor Class | | | 1,016,670 | |
Distribution fees | | | | |
Class B | | | 5,065 | |
Class C | | | 75,387 | |
Custody and accounting fees | | | 31,727 | |
Professional fees | | | 18,786 | |
Registration fees | | | 37,448 | |
Shareholder report expenses | | | 53,233 | |
Trustees’ fees and expenses | | | 7,913 | |
Other fees and expenses | | | 2,918 | |
| | | | |
Total expenses | | | 7,311,049 | |
Less: Fee waivers and/or expense reimbursements | | | (405,432 | ) |
| | | | |
Net expenses | | | 6,905,617 | |
| | | | |
Net investment loss | | | (1,058,382 | ) |
| | | | |
| |
REALIZED AND UNREALIZED GAINS (LOSSES) ON INVESTMENTS | | | | |
Net realized gains on investments | | | 33,991,287 | |
Net change in unrealized gains (losses) on investments | | | 242,074,783 | |
| | | | |
Net realized and unrealized gains (losses) on investments | | | 276,066,070 | |
| | | | |
Net increase in net assets resulting from operations | | $ | 275,007,688 | |
| | | | |
The accompanying notes are an integral part of these financial statements.
| | | | | | |
| Statements of Changes in Net Assets | | Wells Fargo Advantage Common Stock Fund | | | 15 | |
| | | | | | | | | | | | | | | | |
| | | Six Months Ended
March 31, 2012
(Unaudited) | | | Year Ended
September 30, 2011 | |
| | | | |
Operations | | | | | | | | | | | | | | | | |
Net investment loss | | | | | | $ | (1,058,382 | ) | | | | | | $ | (3,148,426 | ) |
Net realized gains on investments | | | | | | | 33,991,287 | | | | | | | | 75,995,759 | |
Net change in unrealized gains (losses) on investments | | | | | | | 242,074,783 | | | | | | | | (128,495,541 | ) |
| | | | | | | | | | | | | | | | |
Net increase (decrease) in net assets resulting from operations | | | | | | | 275,007,688 | | | | | | | | (55,648,208 | ) |
| | | | | | | | | | | | | | | | |
| | | | |
Distributions to shareholders from | | | | | | | | | | | | | | | | |
Net realized gains | | | | | | | | | | | | | | | | |
Class A | | | | | | | (11,099,363 | ) | | | | | | | (1,404,311 | ) |
Class B | | | | | | | (93,074 | ) | | | | | | | (69,802 | ) |
Class C | | | | | | | (1,417,106 | ) | | | | | | | (275,410 | ) |
Administrator Class | | | | | | | (1,290,310 | ) | | | | | | | (367,463 | ) |
Institutional Class | | | | | | | (1,221,970 | ) | | | | | | | (27,553 | ) |
Investor Class | | | | | | | (50,921,053 | ) | | | | | | | (10,251,225 | ) |
| | | | | | | | | | | | | | | | |
Total distributions to shareholders | | | | | | | (66,042,876 | ) | | | | | | | (12,395,764 | ) |
| | | | | | | | | | | | | | | | |
| | | | |
Capital share transactions | | | Shares | | | | | | | | Shares | | | | | |
Proceeds from shares sold | | | | | | | | | | | | | | | | |
Class A | | | 2,246,157 | | | | 43,598,687 | | | | 6,090,833 | | | | 124,471,269 | |
Class B | | | 4,636 | | | | 82,346 | | | | 18,209 | | | | 332,389 | |
Class C | | | 53,339 | | | | 918,360 | | | | 284,610 | | | | 5,194,168 | |
Administrator Class | | | 71,121 | | | | 1,365,376 | | | | 1,855,833 | | | | 35,929,881 | |
Institutional Class | | | 2,797,799 | | | | 55,502,997 | | | | 1,069,310 | | | | 21,868,363 | |
Investor Class | | | 842,866 | | | | 16,576,207 | | | | 4,638,350 | | | | 95,106,351 | |
| | | | | | | | | | | | | | | | |
| | | | | | | 118,043,973 | | | | | | | | 282,902,421 | |
| | | | | | | | | | | | | | | | |
Reinvestment of distributions | | | | | | | | | | | | | | | | |
Class A | | | 593,442 | | | | 10,960,870 | | | | 68,402 | | | | 1,359,826 | |
Class B | | | 5,433 | | | | 88,990 | | | | 3,729 | | | | 66,793 | |
Class C | | | 73,222 | | | | 1,199,381 | | | | 12,959 | | | | 232,092 | |
Administrator Class | | | 55,926 | | | | 1,035,183 | | | | 14,807 | | | | 294,511 | |
Institutional Class | | | 49,167 | | | | 913,022 | | | | 1,384 | | | | 27,553 | |
Investor Class | | | 2,603,273 | | | | 49,123,785 | | | | 486,118 | | | | 9,863,325 | |
| | | | | | | | | | | | | | | | |
| | | | | | | 63,321,231 | | | | | | | | 11,844,100 | |
| | | | | | | | | | | | | | | | |
Payment for shares redeemed | | | | | | | | | | | | | | | | |
Class A | | | (1,498,504 | ) | | | (29,232,326 | ) | | | (3,971,644 | ) | | | (77,483,331 | ) |
Class B | | | (49,723 | ) | | | (842,769 | ) | | | (601,505 | ) | | | (10,853,568 | ) |
Class C | | | (134,441 | ) | | | (2,334,315 | ) | | | (226,229 | ) | | | (4,113,863 | ) |
Administrator Class | | | (268,594 | ) | | | (5,244,318 | ) | | | (762,834 | ) | | | (15,765,307 | ) |
Institutional Class | | | (295,507 | ) | | | (5,906,689 | ) | | | (132,421 | ) | | | (2,703,097 | ) |
Investor Class | | | (5,006,516 | ) | | | (100,216,341 | ) | | | (4,774,766 | ) | | | (97,697,974 | ) |
| | | | | | | | | | | | | | | | |
| | | | | | | (143,776,758 | ) | | | | | | | (208,617,140 | ) |
| | | | | | | | | | | | | | | | |
Net increase in net assets resulting
from capital share transactions | | | | | | | 37,588,446 | | | | | | | | 86,129,381 | |
| | | | | | | | | | | | | | | | |
Total increase in net assets | | | | | | | 246,553,258 | | | | | | | | 18,085,409 | |
| | | | | | | | | | | | | | | | |
| | | | |
Net assets | | | | | | | | | | | | | | | | |
Beginning of period | | | | | | | 932,692,596 | | | | | | | | 914,607,187 | |
| | | | | | | | | | | | | | | | |
End of period | | | | | | $ | 1,179,245,854 | | | | | | | $ | 932,692,596 | |
| | | | | | | | | | | | | | | | |
Undistributed net investment loss | | | | | | $ | (1,058,382 | ) | | | | | | $ | 0 | |
| | | | | | | | | | | | | | | | |
The accompanying notes are an integral part of these financial statements.
| | | | |
| 16 | | Wells Fargo Advantage Common Stock Fund | | Financial Highlights |
(For a share outstanding throughout each period)
| | | | | | | | | | | | | | | | | | | | | | | | | | | | |
| | | Six Months Ended
March 31, 2012 (Unaudited) | | | Year Ended September 30, | | | Year Ended October 31, | |
| Class A | | | 2011 | | | 20101 | | | 2009 | | | 2008 | | | 2007 | | | 2006 | |
Net asset value, beginning of period | | $ | 17.15 | | | $ | 18.20 | | | $ | 15.10 | | | $ | 12.26 | | | $ | 22.66 | | | $ | 23.84 | | | $ | 22.97 | |
Net investment income (loss) | | | (0.02 | ) | | | (0.06 | ) | | | (0.04 | ) | | | 0.02 | 2 | | | 0.00 | 2,3 | | | (0.05 | )2 | | | (0.03 | )2 |
Net realized and unrealized gains (losses) on investments | | | 4.98 | | | | (0.74 | ) | | | 3.16 | | | | 2.82 | | | | (6.68 | ) | | | 3.98 | | | | 4.08 | |
| | | | | | | | | | | | | | | | | | | | | | | | | | | | |
Total from investment operations | | | 4.96 | | | | (0.80 | ) | | | 3.12 | | | | 2.84 | | | | (6.68 | ) | | | 3.93 | | | | 4.05 | |
Distributions to shareholders from | | | | | | | | | | | | | | | | | | | | | | | | | | | | |
Net investment income | | | 0.00 | | | | 0.00 | | | | (0.02 | ) | | | 0.00 | | | | (0.10 | ) | | | 0.00 | | | | 0.00 | |
Net realized gains | | | (1.26 | ) | | | (0.25 | ) | | | 0.00 | | | | 0.00 | | | | (3.61 | ) | | | (5.11 | ) | | | (3.18 | ) |
Tax basis return of capital | | | 0.00 | | | | 0.00 | | | | 0.00 | | | | 0.00 | | | | (0.01 | ) | | | 0.00 | | | | 0.00 | |
| | | | | | | | | | | | | | | | | | | | | | | | | | | | |
Total distributions to shareholders | | | (1.26 | ) | | | (0.25 | ) | | | (0.02 | ) | | | 0.00 | | | | (3.72 | ) | | | (5.11 | ) | | | (3.18 | ) |
Net asset value, end of period | | $ | 20.85 | | | $ | 17.15 | | | $ | 18.20 | | | $ | 15.10 | | | $ | 12.26 | | | $ | 22.66 | | | $ | 23.84 | |
Total return4 | | | 29.84 | % | | | (4.61 | )% | | | 20.80 | % | | | 23.08 | % | | | (34.55 | )% | | | 19.74 | % | | | 19.11 | % |
Ratios to average net assets (annualized) | | | | | | | | | | | | | | | | | | | | | | | | | | | | |
Gross expenses | | | 1.31 | % | | | 1.30 | % | | | 1.33 | % | | | 1.37 | % | | | 1.34 | % | | | 1.37 | % | | | 1.34 | % |
Net expenses | | | 1.26 | % | | | 1.26 | % | | | 1.26 | % | | | 1.26 | % | | | 1.29 | % | | | 1.31 | % | | | 1.31 | % |
Net investment income (loss) | | | (0.17 | )% | | | (0.24 | )% | | | (0.25 | )% | | | 0.19 | % | | | 0.03 | % | | | (0.25 | )% | | | (0.15 | )% |
Supplemental data | | | | | | | | | | | | | | | | | | | | | | | | | | | | |
Portfolio turnover rate | | | 17 | % | | | 41 | % | | | 47 | % | | | 58 | % | | | 81 | % | | | 58 | % | | | 56 | % |
Net assets, end of period (000’s omitted) | | | $215,103 | | | | $153,921 | | | | $123,495 | | | | $112,900 | | | | $88,049 | | | | $62,456 | | | | $64,915 | |
| 1. | For the eleven months ended September 30, 2010. The Fund changed its fiscal year end from October 31 to September 30, effective September 30, 2010. |
| 2. | Calculated based upon average shares outstanding |
| 3. | Amount is less than $0.005. |
| 4. | Total return calculations do not include any sales charges. Returns for periods of less than one year are not annualized. |
The accompanying notes are an integral part of these financial statements.
| | | | | | |
| Financial Highlights | | Wells Fargo Advantage Common Stock Fund | | | 17 | |
(For a share outstanding throughout each period)
| | | | | | | | | | | | | | | | | | | | | | | | | | | | |
| | | Six Months Ended
March 31, 2012 (Unaudited) | | | Year Ended September 30, | | | Year Ended October 31, | |
| Class B | | | 2011 | | | 20101 | | | 2009 | | | 2008 | | | 2007 | | | 2006 | |
Net asset value, beginning of period | | $ | 15.35 | | | $ | 16.44 | | | $ | 13.71 | | | $ | 11.23 | | | $ | 21.10 | | | $ | 22.67 | | | $ | 22.13 | |
Net investment loss | | | (0.08 | )2 | | | (0.20 | )2 | | | (0.14 | )2 | | | (0.06 | )2 | | | (0.12 | )2 | | | (0.20 | )2 | | | (0.20 | )2 |
Net realized and unrealized gains (losses) on investments | | | 4.44 | | | | (0.64 | ) | | | 2.87 | | | | 2.54 | | | | (6.14 | ) | | | 3.74 | | | | 3.92 | |
| | | | | | | | | | | | | | | | | | | | | | | | | | | | |
Total from investment operations | | | 4.36 | | | | (0.84 | ) | | | 2.73 | | | | 2.48 | | | | (6.26 | ) | | | 3.54 | | | | 3.72 | |
Distributions to shareholders from | | | | | | | | | | | | | | | | | | | | | | | | | | | | |
Net realized gains | | | (1.26 | ) | | | (0.25 | ) | | | 0.00 | | | | 0.00 | | | | (3.61 | ) | | | (5.11 | ) | | | (3.18 | ) |
Tax basis return of capital | | | 0.00 | | | | 0.00 | | | | 0.00 | | | | 0.00 | | | | (0.00 | )3 | | | 0.00 | | | | 0.00 | |
| | | | | | | | | | | | | | | | | | | | | | | | | | | | |
Total distributions to shareholders | | | (1.26 | ) | | | (0.25 | ) | | | 0.00 | | | | 0.00 | | | | (3.61 | ) | | | (5.11 | ) | | | (3.18 | ) |
Net asset value, end of period | | $ | 18.45 | | | $ | 15.35 | | | $ | 16.44 | | | $ | 13.71 | | | $ | 11.23 | | | $ | 21.10 | | | $ | 22.67 | |
Total return4 | | | 29.33 | % | | | (5.29 | )% | | | 19.91 | % | | | 22.08 | % | | | (35.04 | )% | | | 18.86 | % | | | 18.23 | % |
Ratios to average net assets (annualized) | | | | | | | | | | | | | | | | | | | | | | | | | | | | |
Gross expenses | | | 2.05 | % | | | 2.05 | % | | | 2.08 | % | | | 2.12 | % | | | 2.11 | % | | | 2.12 | % | | | 2.09 | % |
Net expenses | | | 2.01 | % | | | 2.01 | % | | | 2.01 | % | | | 2.01 | % | | | 2.06 | % | | | 2.06 | % | | | 2.06 | % |
Net investment loss | | | (0.97 | )% | | | (1.13 | )% | | | (1.02 | )% | | | (0.51 | )% | | | (0.76 | )% | | | (1.00 | )% | | | (0.90 | )% |
Supplemental data | | | | | | | | | | | | | | | | | | | | | | | | | | | | |
Portfolio turnover rate | | | 17 | % | | | 41 | % | | | 47 | % | | | 58 | % | | | 81 | % | | | 58 | % | | | 56 | % |
Net assets, end of period (000’s omitted) | | | $1,257 | | | | $1,655 | | | | $11,302 | | | | $12,487 | | | | $14,449 | | | | $31,415 | | | | $34,205 | |
| 1. | For the eleven months ended September 30, 2010. The Fund changed its fiscal year end from October 31 to September 30, effective September 30, 2010. |
| 2. | Calculated based upon average shares outstanding |
| 3. | Amount is less than $0.005. |
| 4. | Total return calculations do not include any sales charges. Returns for periods of less than one year are not annualized. |
The accompanying notes are an integral part of these financial statements.
| | | | |
| 18 | | Wells Fargo Advantage Common Stock Fund | | Financial Highlights |
(For a share outstanding throughout each period)
| | | | | | | | | | | | | | | | | | | | | | | | | | | | |
| | | Six Months Ended
March 31, 2012 (Unaudited) | | | Year Ended September 30, | | | Year Ended October 31, | |
| Class C | | | 2011 | | | 20101 | | | 2009 | | | 2008 | | | 2007 | | | 2006 | |
Net asset value, beginning of period | | $ | 15.35 | | | $ | 16.44 | | | $ | 13.71 | | | $ | 11.23 | | | $ | 21.09 | | | $ | 22.67 | | | $ | 22.13 | |
Net investment loss | | | (0.09 | ) | | | (0.18 | )2 | | | (0.14 | )2 | | | (0.06 | )2 | | | (0.12 | )2 | | | (0.20 | )2 | | | (0.20 | )2 |
Net realized and unrealized gains (losses) on investments | | | 4.45 | | | | (0.66 | ) | | | 2.87 | | | | 2.54 | | | | (6.13 | ) | | | 3.73 | | | | 3.92 | |
| | | | | | | | | | | | | | | | | | | | | | | | | | | | |
Total from investment operations | | | 4.36 | | | | (0.84 | ) | | | 2.73 | | | | 2.48 | | | | (6.25 | ) | | | 3.53 | | | | 3.72 | |
Distributions to shareholders from | | | | | | | | | | | | | | | | | | | | | | | | | | | | |
Net realized gains | | | (1.26 | ) | | | (0.25 | ) | | | 0.00 | | | | 0.00 | | | | (3.61 | ) | | | (5.11 | ) | | | (3.18 | ) |
Tax basis return of capital | | | 0.00 | | | | 0.00 | | | | 0.00 | | | | 0.00 | | | | (0.00 | )3 | | | 0.00 | | | | 0.00 | |
| | | | | | | | | | | | | | | | | | | | | | | | | | | | |
Total distributions to shareholders | | | (1.26 | ) | | | (0.25 | ) | | | 0.00 | | | | 0.00 | | | | (3.61 | ) | | | (5.11 | ) | | | (3.18 | ) |
Net asset value, end of period | | $ | 18.45 | | | $ | 15.35 | | | $ | 16.44 | | | $ | 13.71 | | | $ | 11.23 | | | $ | 21.09 | | | $ | 22.67 | |
Total return4 | | | 29.41 | % | | | (5.35 | )% | | | 20.00 | % | | | 21.99 | % | | | (35.00 | )% | | | 18.82 | % | | | 18.24 | % |
Ratios to average net assets (annualized) | | | | | | | | | | | | | | | | | | | | | | | | | | | | |
Gross expenses | | | 2.06 | % | | | 2.05 | % | | | 2.08 | % | | | 2.12 | % | | | 2.10 | % | | | 2.12 | % | | | 2.09 | % |
Net expenses | | | 2.01 | % | | | 2.01 | % | | | 2.01 | % | | | 2.01 | % | | | 2.06 | % | | | 2.06 | % | | | 2.06 | % |
Net investment loss | | | (0.93 | )% | | | (1.01 | )% | | | (1.01 | )% | | | (0.56 | )% | | | (0.76 | )% | | | (1.00 | )% | | | (0.90 | )% |
Supplemental data | | | | | | | | | | | | | | | | | | | | | | | | | | | | |
Portfolio turnover rate | | | 17 | % | | | 41 | % | | | 47 | % | | | 58 | % | | | 81 | % | | | 58 | % | | | 56 | % |
Net assets, end of period (000’s omitted) | | | $21,345 | | | | $17,887 | | | | $17,976 | | | | $11,750 | | | | $9,692 | | | | $18,501 | | | | $18,885 | |
| 1. | For the eleven months ended September 30, 2010. The Fund changed its fiscal year end from October 31 to September 30, effective September 30, 2010. |
| 2. | Calculated based upon average shares outstanding |
| 3. | Amount is less than $0.005. |
| 4. | Total return calculations do not include any sales charges. Returns for periods of less than one year are not annualized. |
The accompanying notes are an integral part of these financial statements.
| | | | | | |
| Financial Highlights | | Wells Fargo Advantage Common Stock Fund | | | 19 | |
(For a share outstanding throughout each period)
| | | | | | | | | | | | |
| | | Six Months Ended
March 31, 2012 (Unaudited) | | | Year Ended September 30, | |
| Administrator Class | | | 2011 | | | 20101 | |
Net asset value, beginning of period | | $ | 17.18 | | | $ | 18.20 | | | $ | 17.49 | |
Net investment income (loss) | | | 0.01 | | | | (0.01 | )2 | | | 0.01 | 2 |
Net realized and unrealized gains (losses) on investments | | | 4.98 | | | | (0.76 | ) | | | 0.70 | |
| | | | | | | | | | | | |
Total from investment operations | | | 4.99 | | | | (0.77 | ) | | | 0.71 | |
Distributions to shareholders from | | | | | | | | | | | | |
Net realized gains | | | (1.26 | ) | | | (0.25 | ) | | | 0.00 | |
Net asset value, end of period | | $ | 20.91 | | | $ | 17.18 | | | $ | 18.20 | |
Total return3 | | | 29.97 | % | | | (4.44 | )% | | | 4.06 | % |
Ratios to average net assets (annualized) | | | | | | | | | | | | |
Gross expenses | | | 1.09 | % | | | 1.10 | % | | | 1.18 | % |
Net expenses | | | 1.06 | % | | | 1.09 | % | | | 1.07 | % |
Net investment income (loss) | | | 0.00 | %4 | | | (0.05 | )% | | | 0.19 | % |
Supplemental data | | | | | | | | | | | | |
Portfolio turnover rate | | | 17 | % | | | 41 | % | | | 47 | % |
Net assets, end of period (000’s omitted) | | | $20,219 | | | | $19,044 | | | | $10 | |
| 1. | For the period from July 30, 2010 (commencement of class operations) to September 30, 2010 |
| 2. | Calculated based upon average shares outstanding |
| 3. | Returns for periods of less than one year are not annualized. |
| 4. | Amount is less than 0.005%. |
The accompanying notes are an integral part of these financial statements.
| | | | |
| 20 | | Wells Fargo Advantage Common Stock Fund | | Financial Highlights |
(For a share outstanding throughout each period)
| | | | | | | | | | | | |
| | | Six Months Ended
March 31, 2012 (Unaudited) | | | Year Ended September 30, | |
| Institutional Class | | | 2011 | | | 20101 | |
Net asset value, beginning of period | | $ | 17.23 | | | $ | 18.21 | | | $ | 17.49 | |
Net investment income | | | 0.03 | 2 | | | 0.01 | | | | 0.02 | 2 |
Net realized and unrealized gains (losses) on investments | | | 5.00 | | | | (0.74 | ) | | | 0.70 | |
| | | | | | | | | | | | |
Total from investment operations | | | 5.03 | | | | (0.73 | ) | | | 0.72 | |
Distributions to shareholders from | | | | | | | | | | | | |
Net realized gains | | | (1.26 | ) | | | (0.25 | ) | | | 0.00 | |
Net asset value, end of period | | $ | 21.00 | | | $ | 17.23 | | | $ | 18.21 | |
Total return3 | | | 30.12 | % | | | (4.22 | )% | | | 4.12 | % |
Ratios to average net assets (annualized) | | | | | | | | | | | | |
Gross expenses | | | 0.87 | % | | | 0.87 | % | | | 0.94 | % |
Net expenses | | | 0.87 | % | | | 0.87 | % | | | 0.89 | % |
Net investment income | | | 0.31 | % | | | 0.29 | % | | | 0.60 | % |
Supplemental data | | | | | | | | | | | | |
Portfolio turnover rate | | | 17 | % | | | 41 | % | | | 47 | % |
Net assets, end of period (000’s omitted) | | | $73,646 | | | | $16,475 | | | | $327 | |
| 1. | For the period from July 30, 2010 (commencement of class operations) to September 30, 2010 |
| 2. | Calculated based upon average shares outstanding |
| 3. | Returns for periods of less than one year are not annualized. |
The accompanying notes are an integral part of these financial statements.
| | | | | | |
| Financial Highlights | | Wells Fargo Advantage Common Stock Fund | | | 21 | |
(For a share outstanding throughout each period)
| | | | | | | | | | | | | | | | | | | | | | | | | | | | |
| | | Six Months Ended
March 31, 2012 (Unaudited) | | | Year Ended September 30, | | | Year Ended October 31, | |
| Investor Class | | | 2011 | | | 20101 | | | 2009 | | | 2008 | | | 2007 | | | 2006 | |
Net asset value, beginning of period | | $ | 17.50 | | | $ | 18.57 | | | $ | 15.41 | | | $ | 12.53 | | | $ | 23.07 | | | $ | 24.18 | | | $ | 23.25 | |
Net investment income (loss) | | | (0.02 | ) | | | (0.06 | ) | | | (0.05 | )2 | | | 0.02 | 2 | | | 0.00 | 2,3 | | | (0.05 | )2 | | | (0.03 | )2 |
Net realized and unrealized gains (losses) on investments | | | 5.09 | | | | (0.76 | ) | | | 3.23 | | | | 2.86 | | | | (6.81 | ) | | | 4.05 | | | | 4.14 | |
| | | | | | | | | | | | | | | | | | | | | | | | | | | | |
Total from investment operations | | | 5.07 | | | | (0.82 | ) | | | 3.18 | | | | 2.88 | | | | (6.81 | ) | | | 4.00 | | | | 4.11 | |
Distributions to shareholders from | | | | | | | | | | | | | | | | | | | | | | | | | | | | |
Net investment income | | | 0.00 | | | | 0.00 | | | | (0.02 | ) | | | 0.00 | | | | (0.11 | ) | | | 0.00 | | | | 0.00 | |
Net realized gains | | | (1.26 | ) | | | (0.25 | ) | | | 0.00 | | | | 0.00 | | | | (3.61 | ) | | | (5.11 | ) | | | (3.18 | ) |
Tax basis return of capital | | | 0.00 | | | | 0.00 | | | | 0.00 | | | | 0.00 | | | | (0.01 | ) | | | 0.00 | | | | 0.00 | |
| | | | | | | | | | | | | | | | | | | | | | | | | | | | |
Total distributions to shareholders | | | (1.26 | ) | | | (0.25 | ) | | | (0.02 | ) | | | 0.00 | | | | (3.73 | ) | | | (5.11 | ) | | | (3.18 | ) |
Net asset value, end of period | | $ | 21.31 | | | $ | 17.50 | | | $ | 18.57 | | | $ | 15.41 | | | $ | 12.53 | | | $ | 23.07 | | | $ | 24.18 | |
Total return4 | | | 29.88 | % | | | (4.62 | )% | | | 20.73 | % | | | 22.91 | % | | | (34.52 | )% | | | 19.75 | % | | | 19.14 | % |
Ratios to average net assets (annualized) | | | | | | | | | | | | | | | | | | | | | | | | | | | | |
Gross expenses | | | 1.38 | % | | | 1.36 | % | | | 1.43 | % | | | 1.47 | % | | | 1.50 | % | | | 1.54 | % | | | 1.51 | % |
Net expenses | | | 1.29 | % | | | 1.29 | % | | | 1.29 | % | | | 1.29 | % | | | 1.29 | % | | | 1.29 | % | | | 1.29 | % |
Net investment income (loss) | | | (0.21 | )% | | | (0.29 | )% | | | (0.30 | )% | | | 0.17 | % | | | 0.00 | % | | | (0.23 | )% | | | (0.13 | )% |
Supplemental data | | | | | | | | | | | | | | | | | | | | | | | | | | | | |
Portfolio turnover rate | | | 17 | % | | | 41 | % | | | 47 | % | | | 58 | % | | | 81 | % | | | 58 | % | | | 56 | % |
Net assets, end of period (000’s omitted) | | | $847,676 | | | | $723,711 | | | | $761,497 | | | | $657,333 | | | | $564,998 | | | | $1,057,463 | | | | $991,457 | |
| 1. | For the eleven months ended September 30, 2010. The Fund changed its fiscal year end from October 31 to September 30, effective September 30, 2010. |
| 2. | Calculated based upon average shares outstanding |
| 3. | Amount is less than $0.005. |
| 4. | Returns for periods of less than one year are not annualized. |
The accompanying notes are an integral part of these financial statements.
| | | | |
| 22 | | Wells Fargo Advantage Common Stock Fund | | Notes to Financial Statements (Unaudited) |
1. ORGANIZATION
Wells Fargo Funds Trust (the “Trust”), a Delaware statutory trust organized on March 10, 1999, is an open-end management investment company registered under the Investment Company Act of 1940, as amended (the “1940 Act”). These financial statements report on Wells Fargo Advantage Common Stock Fund (the “Fund”) which is a diversified series of the Trust.
2. SIGNIFICANT ACCOUNTING POLICIES
The following significant accounting policies, which are consistently followed in the preparation of the financial statements of the Fund, are in conformity with U.S. generally accepted accounting principles which require management to make estimates and assumptions that affect the reported amounts of assets and liabilities, disclosure of contingent assets and liabilities at the date of the financial statements, and the reported amounts of revenues and expenses during the reporting period. Actual results could differ from those estimates.
Securities valuation
Investments in equity securities are valued each business day as of the close of regular trading on the New York Stock Exchange, which is usually 4:00 p.m. (Eastern Time). Securities which are traded on a national or foreign securities exchange are valued at the last reported sales price, except that securities listed on The Nasdaq Stock Market, Inc. (“Nasdaq”) are valued at the Nasdaq Official Closing Price (“NOCP”), and if no NOCP is available, then at the last reported sales price. If no sales price is shown on the Nasdaq, the bid price will be used. In the absence of any sale of securities listed on the Nasdaq, and in the case of other securities (including U.S. Government obligations, but excluding debt securities maturing in 60 days or less), the price will be deemed “stale” and the valuations will be determined in accordance with the Fund’s Fair Value Procedures.
Investments in open-end mutual funds and non-registered investment companies are generally valued at net asset value.
Investments which are not valued using any of the methods discussed above, are valued at their fair value, as determined by procedures established in good faith and approved by the Board of Trustees. The Board of Trustees has established a Valuation Committee comprised of the Trustees and has delegated to it the authority to take any actions regarding the valuation of portfolio securities that the Valuation Committee deems necessary in determining the fair value of portfolio securities, unless the responsibility has been delegated to the Management Valuation Team of Wells Fargo Funds Management, LLC (“Funds Management”). The Board of Trustees retains the authority to make or ratify any valuation decisions or approve any changes to the Fair Value Procedures as it deems appropriate. On a quarterly basis, the Board of Trustees considers for ratification any valuation actions taken by the Valuation Committee or the Management Valuation Team.
Valuations of fair valued prices are compared to the next actual sales price when available, or other appropriate market information to assess the continued appropriateness of the fair valuation methodology used. The securities are fair valued on a day-to-day basis, taking into consideration changes to appropriate market information and any significant changes to the input factors considered in the valuation process until there is a readily available price provided on the exchange or by an independent pricing service. Valuations received from an independent pricing service or broker quotes are periodically validated by comparisons to most recent trades and valuations provided by other independent pricing services in addition to the review of prices by the adviser and/or sub-adviser. Unobservable inputs used in determining fair valuations are identified based on the type of security, taking into consideration factors utilized by market participants in valuing the investment, knowledge about the issuer and the current market environment.
Security loans
The Fund may lend its securities from time to time in order to earn additional income in the form of fees or interest on securities received as collateral or the investment of any cash received as collateral. The Fund continues to receive interest or dividends on the securities loaned. The Fund receives collateral in the form of cash or securities with a value at least equal to the value of the securities on loan. The value of the loaned securities is determined at the close of each business day and any additional required collateral is delivered to the Fund on the next business day. In a securities lending transaction, the net asset value of the Fund will be affected by an increase or decrease in the value of the securities loaned and by an increase or decrease in the value of the instrument in which collateral is invested. The amount of securities lending activity undertaken by the Fund fluctuates from time to time. In the event of default or bankruptcy
| | | | | | |
| Notes to Financial Statements (Unaudited) | | Wells Fargo Advantage Common Stock Fund | | | 23 | |
by the borrower, the Fund may be prevented from recovering the loaned securities or gaining access to the collateral or may experience delays or costs in doing so. In addition, the investment of any cash collateral received may lose all or part of its value. The Fund has the right under the lending agreement to recover the securities from the borrower on demand.
The Fund lends its securities through an unaffiliated securities lending agent. Cash collateral received in connection with its securities lending transactions is invested in Wells Fargo Securities Lending Cash Investments, LLC (the “Cash Collateral Fund”). The Cash Collateral Fund is exempt from registration under Section 3(c)(7) of the 1940 Act and is managed by Funds Management and is sub-advised by Wells Capital Management Incorporated (“Wells Capital Management”). Funds Management receives an advisory fee starting at 0.05% and declining to 0.01% as the average daily net assets of the Cash Collateral Fund increase. All of the fees received by Funds Management are paid to Wells Capital Management for its services as sub-adviser. The Cash Collateral Fund seeks to provide a positive return compared to the daily Fed Funds Open rate by investing in high-quality, U.S. dollar-denominated short-term money market instruments. Cash Collateral Fund investments are fair valued based upon the amortized cost valuation technique. Income earned from investment in the Cash Collateral Fund is included in securities lending income on the Statement of Operations.
For Wells Fargo Advantage Funds that participated in securities lending activity prior to February 13, 2009, certain structured investment vehicles purchased in a joint account by the former securities lending agent defaulted or were impaired. Certain of the Wells Fargo Advantage Funds still hold ownership interest in these structured investment vehicles, which have since been restructured as pass-through securities. If the Fund holds an ownership interest in such pass-through securities, information regarding this ownership interest can be found in the Portfolio of Investments under the category “Other”.
Security transactions and income recognition
Securities transactions are recorded on a trade date basis. Realized gains or losses are reported on the basis of identified cost of securities delivered.
Dividend income is recognized on the ex-dividend date.
Distributions to shareholders
Distributions to shareholders from net investment income and net realized gains, if any, are recorded on the ex-dividend date. Such distributions are determined in conformity with income tax regulations, which may differ from generally accepted accounting principles.
Federal and other taxes
The Fund intends to continue to qualify as a regulated investment company by distributing substantially all of its investment company taxable income and any net realized capital gains (after reduction for capital loss carryforwards) sufficient to relieve it from all, or substantially all, federal income taxes. Accordingly, no provision for federal income taxes was required.
The Fund’s income and federal excise tax returns and all financial records supporting those returns for the prior three fiscal years are subject to examination by the federal and Delaware revenue authorities. Management has analyzed the Fund’s tax positions taken on federal, state, and foreign tax returns for all open tax years and does not believe that there are any uncertain tax positions that require recognition of a tax liability.
Under the recently enacted Regulated Investment Company Modernization Act of 2010, the Fund is permitted to carry forward capital losses incurred in taxable years which began after December 22, 2010 for an unlimited period. However, any losses incurred are required to be utilized prior to the losses incurred in pre-enactment taxable years. As a result of this ordering rule, pre-enactment capital loss carryforwards may be more likely to expire unused. Additionally, post-enactment capital losses that are carried forward will retain their character as either short-term or long-term capital losses rather than being considered all short-term as under previous law.
Class allocations
The separate classes of shares offered by the Fund differ principally in applicable sales charges, distribution, shareholder servicing and administration fees. Shareholders of each class bear certain expenses that pertain to that particular class. All shareholders bear the common expenses of the Fund, earn income from the portfolio, and are allocated unrealized gains and losses pro rata based on the average daily net assets of each class, without distinction between share classes. Dividends are determined separately for each class based on income and expenses allocable to each class. Realized gains and losses are allocated to each class pro rata based upon the net assets of each class on the date realized. Differences in
| | | | |
| 24 | | Wells Fargo Advantage Common Stock Fund | | Notes to Financial Statements (Unaudited) |
per share dividend rates generally result from the relative weightings of pro rata income and realized gain allocations and from differences in separate class expenses, including distribution, shareholder servicing and administration fees.
3. FAIR VALUATION MEASUREMENTS
Fair value measurements of investments are determined within a framework that has established a fair value hierarchy based upon the various data inputs utilized in determining the value of the Fund’s investments. The three-level hierarchy gives the highest priority to unadjusted quoted prices in active markets for identical assets or liabilities (Level 1) and the lowest priority to significant unobservable inputs (Level 3). The Fund’s investments are classified within the fair value hierarchy based on the lowest level of input that is significant to the fair value measurement. The inputs are summarized into three broad levels as follows:
| n | | Level 1 – quoted prices in active markets for identical securities |
| n | | Level 2 – other significant observable inputs (including quoted prices for similar securities, interest rates, prepayment speeds, credit risk, etc.) |
| n | | Level 3 – significant unobservable inputs (including the Fund’s own assumptions in determining the fair value of investments) |
The inputs or methodologies used for valuing securities are not necessarily an indication of the risk associated with investing in those securities.
As of March 31, 2012, the inputs used in valuing the Fund’s assets, which are carried at fair value, were as follows:
| | | | | | | | | | | | | | | | |
| Investments in Securities | | Quoted Prices (Level 1) | | | Significant Other
Observable Inputs (Level 2) | | | Significant Unobservable Inputs (Level 3) | | | Total | |
| | | | |
Equity securities | | | | | | | | | | | | | | | | |
Common stocks | | $ | 1,110,813,837 | | | $ | 0 | | | $ | 13,893,750 | | | $ | 1,124,707,587 | |
| | | | |
Other | | | 0 | | | | 0 | | | | 3,131,000 | | | | 3,131,000 | |
| | | | |
Short-term investments | | | | | | | | | | | | | | | | |
Investment companies | | | 51,016,220 | | | | 130,523,038 | | | | 0 | | | | 181,539,258 | |
| | | $ | 1,161,830,057 | | | $ | 130,523,038 | | | $ | 17,024,750 | | | $ | 1,309,377,845 | |
Further details on the major security types listed above can be found in the Portfolio of Investments.
Transfers in and transfers out are recognized at the end of the reporting period. For the six months ended March 31, 2012, the Fund did not have any significant transfers into/out of Level 1 and Level 2.
The following is a reconciliation of assets in which significant unobservable inputs (Level 3) were used in determining fair value:
| | | | | | | | | | | | |
| | | Common
stocks | | | Other | | | Total | |
Balance as of September 30, 2011 | | $ | 13,435,100 | | | $ | 4,227,523 | | | $ | 17,662,623 | |
Accrued discounts (premiums) | | | 0 | | | | 0 | | | | 0 | |
Realized gains (losses) | | | 0 | | | | 0 | | | | 0 | |
Change in unrealized gains (losses) | | | (579,138 | ) | | | (508,996 | ) | | | (1,088,134 | ) |
Purchases | | | 1,037,788 | | | | 0 | | | | 1,037,788 | |
Sales | | | 0 | | | | (587,527 | ) | | | (587,527 | ) |
Transfers into Level 3 | | | 0 | | | | 0 | | | | 0 | |
Transfers out of Level 3 | | | 0 | | | | 0 | | | | 0 | |
Balance as of March 31, 2012 | | $ | 13,893,750 | | | $ | 3,131,000 | | | $ | 17,024,750 | |
Change in unrealized gains (losses)
relating to securities still held at March 31, 2012 | | $ | (579,138 | ) | | $ | (819,340 | ) | | $ | (1,398,478 | ) |
| | | | | | |
| Notes to Financial Statements (Unaudited) | | Wells Fargo Advantage Common Stock Fund | | | 25 | |
4. TRANSACTIONS WITH AFFILIATES AND OTHER EXPENSES
Advisory fee
The Trust has entered into an advisory contract with Funds Management, an indirect wholly owned subsidiary of Wells Fargo & Company (“Wells Fargo”). The adviser is responsible for implementing investment policies and guidelines and for supervising the sub-adviser, who is responsible for day-to-day portfolio management of the Fund.
Pursuant to the contract, Funds Management is entitled to receive an annual advisory fee starting at 0.75% and declining to 0.60% as the average daily net assets of the Fund increase. For the six months ended March 31, 2012, the advisory fee was equivalent to an annual rate of 0.72% of the Fund’s average daily net assets.
Funds Management has retained the services of certain sub-advisers to provide daily portfolio management to the Fund. The fees related to sub-advisory services are borne directly by Funds Management and do not increase the overall fees paid by the Fund. Wells Capital Management, an affiliate of Funds Management, is the sub-adviser to the Fund and is entitled to receive a fee from Funds Management at an annual rate starting at 0.45% and declining to 0.30% as the average daily net assets of the Fund increase.
Administration and transfer agent fees
The Trust has entered into an administration agreement with Funds Management. Under this agreement, for providing administrative services, which includes paying fees and expenses for services provided by the transfer agent, sub-transfer agents, omnibus account servicers and record-keepers, Funds Management is entitled to receive from the Fund an annual fund level administration fee starting at 0.05% and declining to 0.03% as the average daily net assets of the Fund increase and a class level administration fee which is calculated based on the average daily net assets of each class as follows:
| | | | |
| | | Class Level Administration Fee | |
Class A, Class B, Class C | | | 0.26 | % |
Administrator Class | | | 0.10 | |
Institutional Class | | | 0.08 | |
Investor Class | | | 0.33 | |
Funds Management has contractually waived and/or reimbursed advisory and administration fees to the extent necessary to maintain certain net operating expense ratios for the Fund. Waiver of fees and/or reimbursement of expenses by Funds Management were made first from fund level expenses on a proportionate basis and then from class specific expenses. Funds Management has committed through January 31, 2013 to waive fees and/or reimburse expenses to the extent necessary to cap the Fund’s expenses at 1.26% for Class A, 2.01% for Class B, 2.01% for Class C, 1.10% for Administrator Class, 0.90% for Institutional Class and 1.29% for Investor Class.
Distribution fees
The Trust has adopted a Distribution Plan for Class B and Class C shares of the Fund pursuant to Rule 12b-1 under the 1940 Act. Distribution fees are charged to Class B and Class C shares and paid to Wells Fargo Funds Distributor, LLC, the principal underwriter, at an annual rate of 0.75% of the average daily net assets of Class B and Class C shares.
For the six months ended March 31, 2012, Wells Fargo Funds Distributor, LLC received $11,620 from the sale of Class A shares and $457, $163 and $390 in contingent deferred sales charges from redemptions of Class A, Class B and Class C shares, respectively.
Shareholder servicing fees
The Trust has entered into contracts with one or more shareholder servicing agents, whereby Class A, Class B, Class C, Administrator Class and Investor Class of the Fund is charged a fee at an annual rate of 0.25% of the average daily net assets of each respective class.
A portion of these total shareholder servicing fees were paid to affiliates of Wells Fargo.
5. INVESTMENT PORTFOLIO TRANSACTIONS
Purchases and sales of investments, excluding U.S. Government obligations (if any) and short-term securities, for the six months ended March 31, 2012 were $172,603,850 and $200,134,045, respectively.
| | | | |
| 26 | | Wells Fargo Advantage Common Stock Fund | | Notes to Financial Statements (Unaudited) |
6. BANK BORROWINGS
The Trust (excluding the money market funds) and Wells Fargo Variable Trust are parties to a $150,000,000 revolving credit agreement with State Street Bank and Trust Company, whereby the Fund is permitted to use bank borrowings for temporary or emergency purposes, such as to fund shareholder redemption requests. Interest under the credit agreement is charged to the Fund based on a borrowing rate equal to the higher of the Federal Funds rate in effect on that day plus 1.25% or the overnight LIBOR rate in effect on that day plus 1.25%. In addition, an annual commitment fee equal to 0.10% of the unused balance is allocated to each participating fund. For the six months ended March 31, 2012, the Fund paid $1,079 in commitment fees.
For the six months ended March 31, 2012, there were no borrowings by the Fund under the agreement.
7. INDEMNIFICATION
Under the Trust’s organizational documents, the officers and directors are indemnified against certain liabilities that may arise out of performance of their duties to the Trust. Additionally, in the normal course of business, the Trust may enter into contracts with service providers that contain a variety of indemnification clauses. The Trust’s maximum exposure under these arrangements is dependent on future claims that may be made against the Fund and, therefore, cannot be estimated.
8. NEW ACCOUNTING PRONOUNCEMENTS
In December 2011, the Financial Accounting Standards Board (“FASB”) issued Accounting Standard Update (“ASU”) No. 2011-11, Disclosures about Offsetting Assets and Liabilities. ASU 2011-11, which amends FASB ASC Topic 210 Balance Sheet, creates new disclosure requirements which require entities to disclose both gross and net information for derivatives and other financial instruments that are either offset in the Statement of Assets and Liabilities or subject to an enforceable master netting arrangement or similar agreement. The disclosure requirements are effective for interim and annual reporting periods beginning on or after January 1, 2013. Management is currently evaluating the impact of the update’s adoption on the Fund’s financial statement disclosures.
In May 2011, FASB issued ASU No. 2011-04 “Amendments to Achieve Common Fair Value Measurement and Disclosure Requirements in U.S. GAAP and IFRSs”. ASU No. 2011-04 amends FASB ASC Topic 820, Fair Value Measurements and Disclosures, to establish common requirements for measuring fair value and for disclosing information about fair value measurements in accordance with GAAP. The ASU is effective prospectively for interim and annual periods beginning after December 15, 2011. Management expects that adoption of the ASU will result in additional disclosures in the financial statements, as applicable.
In April 2011, FASB issued ASU No. 2011-03 “Reconsideration of Effective Control for Repurchase Agreements”. ASU No. 2011-03 amends FASB ASC Topic 860, Transfers and Servicing, specifically the criteria required to determine whether a repurchase agreement (repo) and similar agreements should be accounted for as sales of financial assets or secured borrowings with commitments. ASU No. 2011-03 changes the assessment of effective control by focusing on the transferor’s contractual rights and obligations and removing the criterion to assess its ability to exercise those rights or honor those obligations. This could result in changes to the way entities account for certain transactions including repurchase agreements, mortgage dollar rolls and reverse repurchase agreements. The ASU will become effective on a prospective basis for new transfers and modifications to existing transactions as of the beginning of the first interim or annual period beginning on or after December 15, 2011. Management has evaluated the impact of adopting the ASU and expects no significant changes.
| | | | | | |
| Other Information (Unaudited) | | Wells Fargo Advantage Common Stock Fund | | | 27 | |
PROXY VOTING INFORMATION
A description of the policies and procedures that the Fund uses to determine how to vote proxies relating to portfolio securities is available without charge, upon request, by calling 1-800-222-8222, visiting our Web site at wellsfargoadvantagefunds.com, or visiting the SEC Web site at sec.gov. Information regarding how the Fund voted proxies relating to portfolio securities during the most recent 12-month period ended June 30 is available without charge on the Fund’s Web site at wellsfargoadvantagefunds.com or by visiting the SEC Web site at sec.gov.
PORTFOLIO HOLDINGS INFORMATION
The complete portfolio holdings for the Fund are publicly available on the Fund’s Web site (wellsfargoadvantagefunds.com) on a monthly, 30-day or more delayed basis. In addition, top ten holdings information for the Fund is publicly available on the Fund’s Web site on a monthly, seven-day or more delayed basis. The Fund files its complete schedule of portfolio holdings with the SEC for the first and third quarters of each fiscal year on Form N-Q, which is available without charge by visiting the SEC Web site at sec.gov. In addition, the Fund’s Form N-Q may be reviewed and copied at the SEC’s Public Reference Room in Washington, DC, and at regional offices in New York City, at 233 Broadway, and in Chicago, at 175 West Jackson Boulevard, Suite 900. Information about the Public Reference Room may be obtained by calling 1-800-SEC-0330.
| | | | |
| 28 | | Wells Fargo Advantage Common Stock Fund | | Other Information (Unaudited) |
BOARD OF TRUSTEES
The following table provides basic information about the Board of Trustees (the “Trustees”) of the Trust and Officers of the Trust. This table should be read in conjunction with the Prospectus and the Statement of Additional Information1 of the Fund. Each of the Trustees and Officers listed below acts in identical capacities for the Wells Fargo Advantage family of funds, which consists of 137 funds comprising the Wells Fargo Funds Trust, Wells Fargo Variable Trust, Wells Fargo Master Trust and four closed-end funds (collectively the “Fund Complex”). All of the Trustees are also Members of the Audit and Governance Committees of each Trust in the Fund Complex. The mailing address of each Trustee and Officer is 525 Market Street, 12th Floor, San Francisco, CA 94105. Each Trustee and Officer serves an indefinite term, however, each Trustee serves such term until reaching the mandatory retirement age established by the Trustees.
Independent Trustees
| | | | | | |
Name and Year of Birth | | Position Held and Length of Service | | Principal Occupations During Past Five Years | | Other Directorships During
Past Five Years |
Peter G. Gordon
(Born 1942) | | Trustee, since 1998; Chairman, since 2005 (Lead Trustee since 2001) | | Co-Founder, Retired Chairman, President and CEO of Crystal Geyser Water Company. Trustee Emeritus, Colby College | | Asset Allocation Trust |
Isaiah Harris, Jr.
(Born 1952) | | Trustee, since 2009 | | Retired. Prior thereto, President and CEO of BellSouth Advertising and Publishing Corp. from 2005 to 2007, President and CEO of BellSouth Enterprises from 2004 to 2005 and President of BellSouth Consumer Services from 2000 to 2003. Emeritus member of the Iowa State University Foundation Board of Governors. Emeritus Member of the Advisory Board of Iowa State University School of Business. Mr. Harris is a certified public accountant. | | CIGNA Corporation; Deluxe Corporation; Asset Allocation Trust |
Judith M. Johnson
(Born 1949) | | Trustee, since 2008 | | Retired. Prior thereto, Chief Executive Officer and Chief Investment Officer of Minneapolis Employees Retirement Fund from 1996 to 2008. Ms. Johnson is an attorney, certified public accountant and a certified managerial accountant. | | Asset Allocation Trust |
Leroy Keith, Jr.
(Born 1939) | | Trustee, since 2010 | | Chairman, Bloc Global Services (development and construction). Trustee of the Evergreen Funds from 1983 to 2010. Former Managing Director, Almanac Capital Management (commodities firm), former Partner, Stonington Partners, Inc. (private equity fund), former Director, Obagi Medical Products Co. and former Director, Lincoln Educational Services. | | Trustee, Virtus Fund Complex (consisting of 40 portfolios as of 12/31/11); Asset Allocation Trust |
David F. Larcker
(Born 1950) | | Trustee, since 2009 | | James Irvin Miller Professor of Accounting at the Graduate School of Business, Stanford University, Director of Corporate Governance Research Program and Senior Faculty of The Rock Center for Corporate Governance since 2006. From 2005 to 2008, Professor of Accounting at the Graduate School of Business, Stanford University. Prior thereto, Ernst & Young Professor of Accounting at The Wharton School, University of Pennsylvania from 1985 to 2005. | | Asset Allocation Trust |
Olivia S. Mitchell
(Born 1953) | | Trustee, since 2006 | | International Foundation of Employee Benefit Plans Professor, Wharton School of the University of Pennsylvania since 1993. Director of Wharton’s Pension Research Council and Boettner Center on Pensions & Retirement Research, and Research Associate at the National Bureau of Economic Research. Previously, Cornell University Professor from 1978 to 1993. | | Asset Allocation Trust |
| | | | | | |
| Other Information (Unaudited) | | Wells Fargo Advantage Common Stock Fund | | | 29 | |
| | | | | | |
Name and Year of Birth | | Position Held and Length of Service | | Principal Occupations During Past Five Years | | Other Directorships During
Past Five Years |
Timothy J. Penny
(Born 1951) | | Trustee, since 1996 | | President and CEO of Southern Minnesota Initiative Foundation, a non-profit organization, since 2007 and Senior Fellow at the Humphrey Institute Policy Forum at the University of Minnesota since 1995. Member of the Board of Trustees of NorthStar Education Finance, Inc., a non-profit organization, since 2007. | | Asset Allocation Trust |
Michael S. Scofield
(Born 1943) | | Trustee, since 2010 | | Served on the Investment Company Institute’s Board of Governors and Executive Committee from 2008-2011 as well the Governing Council of the Independent Directors Council from 2006-2011 and the Independent Directors Council Executive Committee from 2008-2011. Chairman of the IDC from 2008-2010. Institutional Investor (Fund Directions) Trustee of Year in 2007. Trustee of the Evergreen Funds (and its predecessors) from 1984 to 2010. Chairman of the Evergreen Funds from 2000-2010. Former Trustee of the Mentor Funds. Retired Attorney, Law Offices of Michael S. Scofield and former Director and Chairman, Branded Media Corporation (multi-media branding company). | | Asset Allocation Trust |
Donald C. Willeke
(Born 1940) | | Trustee, since 1996 | | Principal of the law firm of Willeke & Daniels. General Counsel of the Minneapolis Employees Retirement Fund from 1984 until its consolidation into the Minnesota Public Employees Retirement Association on June 30, 2010. Director and Vice Chair of The Free Trust (non-profit corporation). Director of the American Chestnut Foundation (non-profit corporation). | | Asset Allocation Trust |
Officers
| | | | | | |
Name and Year of Birth | | Position Held and
Length of Service | | Principal Occupations During Past Five Years | | |
Karla M. Rabusch
(Born 1959) | | President, since 2003 | | Executive Vice President of Wells Fargo Bank, N.A. and President of Wells Fargo Funds Management, LLC since 2003. Senior Vice President and Chief Administrative Officer of Wells Fargo Funds Management, LLC from 2001 to 2003. | | |
C. David Messman
(Born 1960) | | Secretary, since 2000; Chief Legal Counsel, since 2003 | | Senior Vice President and Secretary of Wells Fargo Funds Management, LLC since 2001. Vice President and Managing Senior Counsel of Wells Fargo Bank, N.A. since 1996. | | |
Kasey Phillips
(Born 1970) | | Treasurer, since 2009 | | Senior Vice President of Wells Fargo Funds Management, LLC since 2009. Senior Vice President of Evergreen Investment Management Company, LLC from 2006 to 2010. Treasurer of the Evergreen Funds from 2005 to 2010. | | |
David Berardi
(Born 1975) | | Assistant Treasurer, since 2009 | | Vice President of Wells Fargo Funds Management, LLC since 2009. Vice President of Evergreen Investment Management Company, LLC from 2008 to 2010. Assistant Vice President of Evergreen Investment Services, Inc. from 2004 to 2008. Manager of Fund Reporting and Control for Evergreen Investment Management Company, LLC from 2004 to 2010. | | |
Jeremy DePalma
(Born 1974) | | Assistant Treasurer, since 2009 | | Senior Vice President of Wells Fargo Funds Management, LLC since 2009. Senior Vice President of Evergreen Investment Management Company, LLC from 2008 to 2010. Vice President, Evergreen Investment Services, Inc. from 2004 to 2007. Head of the Fund Reporting and Control Team within Fund Administration from 2005 to 2010. | | |
Debra Ann Early
(Born 1964) | | Chief Compliance Officer, since 2007 | | Chief Compliance Officer of Wells Fargo Funds Management, LLC since 2007. Chief Compliance Officer of Parnassus Investments from 2005 to 2007. Chief Financial Officer of Parnassus Investments from 2004 to 2007 and Senior Audit Manager of PricewaterhouseCoopers LLP from 1998 to 2004. | | |
| 1. | The Statement of Additional Information includes additional information about the Trustees and is available, without charge, upon request, by calling 1-800-222-8222 or by visiting the Web site at wellsfargoadvantagefunds.com. |
| | | | |
| 30 | | Wells Fargo Advantage Common Stock Fund | | Other Information (Unaudited) |
BOARD CONSIDERATION OF INVESTMENT ADVISORY AND SUB-ADVISORY AGREEMENTS:
Under Section 15 of the Investment Company Act of 1940 (the “1940 Act”), the Board of Trustees (the “Board”) of Wells Fargo Funds Trust (the “Trust”), all the members of which have no direct or indirect interest in the investment advisory and sub-advisory agreements and are not “interested persons” of the Trust, as defined in the 1940 Act (the “Independent Trustees”), must determine whether to approve the continuation of the Trust’s investment advisory and sub-advisory agreements. In this regard, at an in person meeting held on March 29-30, 2012 (the “Meeting”), the Board reviewed and re-approved: (i) an investment advisory agreement with Wells Fargo Funds Management, LLC (“Funds Management”) for Wells Fargo Advantage Common Stock Fund (the “Fund”) and (ii) an investment sub-advisory agreement with Wells Capital Management Incorporated (“Wells Capital Management”) for the Fund. The investment advisory agreement with Funds Management and the investment sub-advisory agreement with Wells Capital Management are collectively referred to as the “Advisory Agreements.”
At the Meeting, the Board considered the factors and reached the conclusions described below relating to the selection of Funds Management and Wells Capital Management and the continuation of the Advisory Agreements. Prior to the Meeting, the Trustees conferred extensively among themselves and with representatives of Funds Management about these matters. The Board also met throughout the year and received information that was useful to them in considering the continuation of the Advisory Agreements. The Independent Trustees were assisted in their evaluation of the Advisory Agreements by independent legal counsel, from whom they received separate legal advice and with whom they met separately from Funds Management.
In providing information to the Board, Funds Management and Wells Capital Management were guided by a detailed set of requests submitted by the Independent Trustees’ independent legal counsel on their behalf at the start of the Board’s annual contract renewal process earlier in 2012. In approving the Advisory Agreements, the Board did not identify any particular information or consideration that was all-important or controlling, and each Trustee likely attributed different weights to various factors.
Nature, extent and quality of services
The Board received and considered various information regarding the nature, extent and quality of services provided to the Fund by Funds Management and Wells Capital Management under the Advisory Agreements. The Board also received and considered, among other things, information about the background and experience of senior management of Funds Management, and the qualifications, backgrounds, tenures and responsibilities of the portfolio managers primarily responsible for the day-to-day portfolio management of the Fund.
The Board evaluated the ability of Funds Management and Wells Capital Management, based on their respective financial condition, resources, reputation and other attributes, to attract and retain qualified investment professionals, including research, advisory, and supervisory personnel. The Board further considered the compliance programs and compliance records of Funds Management and Wells Capital Management. In addition, the Board took into account the administrative services provided to the Fund by Funds Management and its affiliates.
The Board’s decision to approve the continuation of the Advisory Agreements was based on a comprehensive evaluation of all of the information provided to it. In considering these matters, the Board considered not only the specific information presented in connection with the Meeting, but also the knowledge gained over time through interaction with Funds Management and Wells Capital Management about various topics, including Funds Management’s oversight of service providers. The above factors, together with those referenced below, are some of the most important, but not necessarily all, factors considered by the Board in concluding that the nature, extent and quality of the investment advisory services provided to the Fund by Funds Management and Wells Capital Management supported the re-approval of the Advisory Agreements. Although the Board considered the continuation of the Advisory Agreements for the Fund as part of the larger process of considering the continuation of the advisory agreements for all of the funds in the complex, its decision to continue the Advisory Agreements for the Fund was ultimately made on a fund-by-fund basis.
Fund performance and expenses
The Board considered the performance results for the Fund over various time periods ended December 31, 2011. The Board also considered these results in comparison to the median performance of a universe of relevant funds (the “Universe”) that was determined by Lipper Inc. (“Lipper”) to be similar to the Fund, and in comparison to the Fund’s
| | | | | | |
| Other Information (Unaudited) | | Wells Fargo Advantage Common Stock Fund | | | 31 | |
benchmark index and to other comparative data. Lipper is an independent provider of investment company data. The Board received a description of the methodology used by Lipper to select the mutual funds in the Universe. The Board noted that, except for the one-year period, the performance of the Fund was higher than the median performance of the Universe for all other periods under review. The Board also noted that the performance of the Fund was higher than its benchmark, the Lipper Mid-Cap Core Funds Index, for the periods under review.
The Board received and considered information regarding the Fund’s contractual advisory fee and net operating expense ratios and their various components, including actual management fees (which reflect fee waivers, if any), transfer agent, custodian and other non-management fees, Rule 12b-1 and non-Rule 12b-1 fees, service fees and fee waiver and expense reimbursement arrangements. The Board also considered these ratios in comparison to the median ratios of an expense Universe and a narrower expense group of mutual funds (each, an “Expense Group”) that was determined by Lipper to be similar to the Fund. The Board received a description of the methodology used by Lipper to select the mutual funds in the Fund’s Expense Group. The Board noted that, except for the Investor class, the net operating expense ratios of the Fund were in range of or equal to the Fund’s Expense Group’s median net operating expense ratios. The Board received a report that provided further analysis of the expense results for the Fund’s Investor class, which showed that the Investor class had a higher small cap exposure compared to its Universe.
Based on the above-referenced considerations and other factors, the Board concluded that the overall performance and expense structure of the Fund supported the re-approval of the Advisory Agreements for the Fund.
Investment advisory and sub-advisory fee rates
The Board reviewed and considered the contractual investment advisory fee rate that is payable by the Fund to Funds Management for investment advisory services (the “Advisory Agreement Rate”), both on a stand-alone basis and on a combined basis with the Fund’s administration fee rate. The Board took into account the separate administrative and other services covered by the administration fee rate. The Board also reviewed and considered the contractual investment sub-advisory fee rate that is payable by Funds Management to Wells Capital Management for investment sub-advisory services (the “Sub-Advisory Agreement Rate”). In addition, the Board reviewed and considered the existing fee waiver/cap arrangements applicable to the Advisory Agreement Rate and considered the Advisory Agreement Rate after taking the waivers/caps into account (the “Net Advisory Rate”).
The Board received and considered information comparing the Advisory Agreement Rate and Net Advisory Rate with those of other funds in the Fund’s Expense Group median. The Board noted that, except for Investor and A share classes, the Advisory Agreement Rate and Net Advisory Rate for the Fund were in range of the median rates for the Fund’s Expense Group. The Board received a report from Funds Management that noted, unlike the Fund, the Expense Group data did not include transfer agency expenses.
The Board also received and considered information about the nature and extent of services offered and fee rates charged by Funds Management and Wells Capital Management to other types of clients. In this regard, the Board received information about differences between the services, and the compliance, reporting, and other legal burdens and risks of providing investment advice to mutual funds and those associated with providing advice to non-mutual fund clients such as collective funds or institutional separate accounts.
The Board determined that the Advisory Agreement Rate for the Fund, both with and without an administration fee rate and before and after waivers, was reasonable in light of the Fund’s Expense Group information, the net expense ratio commitments, the services covered by the Advisory Agreements and other information provided. The Board also reviewed and considered the Sub-Advisory Agreement Rate and concluded that the Sub-Advisory Agreement Rate was reasonable in light of the services covered by the sub-advisory agreement, the sub-advised expense information provided by Lipper, and other information provided.
Profitability
The Board received and considered a profitability analysis of Funds Management, as well as an analysis of the profitability to the collective Wells Fargo businesses that provide services to the Fund. It considered that the information provided to it was necessarily estimated, and that the profitability information provided to it, especially on a fund-by-fund basis, did not necessarily provide a precise tool for evaluating the appropriateness of the Fund’s Advisory Agreement Rate in isolation. It noted that the levels of profitability reported on a fund-by-fund basis varied widely, depending on, among other things, the size and type of fund. The Board concluded that the profitability reported by Funds Management was not unreasonable.
| | | | |
| 32 | | Wells Fargo Advantage Common Stock Fund | | Other Information (Unaudited) |
The Board did not consider separate profitability information with respect to Wells Capital Management, because, as an affiliate of Funds Management, its profitability information was subsumed in the collective Wells Fargo profitability analysis provided by Funds Management.
Economies of scale
With respect to possible economies of scale, the Board reviewed the breakpoints in the Fund’s advisory fee structure, which operate generally to reduce the effective Advisory Agreement Rate of the Fund (as a percentage of Fund assets) as the Fund grows in size. It considered that, as a fund shrinks in size, breakpoints conversely result in increasing fee levels. The Board noted that it would have on-going opportunities to review the appropriate levels of breakpoints in the future, and concluded that the breakpoints as implemented appeared to be a reasonable step toward sharing economies of scale, if any, with the Fund. However, the Board acknowledged the inherent limitations of any analysis of an investment adviser’s economies of scale and of any attempt to correlate breakpoints with such economies, stemming largely from the Board’s understanding that economies of scale are realized, if at all, by an investment adviser across a variety of products and services, not just with respect to a single fund.
Other benefits to Funds Management and Wells Capital Management
The Board received and considered information regarding potential “fall-out” or ancillary benefits received by Funds Management and its affiliates, including Wells Capital Management, as a result of their relationship with the Fund. Ancillary benefits could include, among others, benefits directly attributable to the relationship of Funds Management and Wells Capital Management with the Fund and benefits potentially derived from an increase in Funds Management’s and Wells Capital Management’s business as a result of their relationship with the Fund (such as the ability to market to shareholders other financial products offered by Funds Management and its affiliates, including Wells Capital Management).
The Board considered that Wells Fargo Funds Distributor, LLC, an affiliate of Funds Management, serves as distributor to the Fund and receives certain compensation for those services. The Board noted that various financial institutions, including affiliates of Funds Management, may receive distribution-related fees, shareholder servicing payments (including amounts derived from payments under Rule 12b-1 plans) and sub-transfer agency fees in respect of shares sold or held through them and services provided.
The Board also reviewed information about whether and to what extent soft dollar credits are sought and how any such credits are utilized and any benefits that may be realized by using an affiliated broker.
Other factors and broader review
The Board also considered the markets for distribution of the Fund’s shares, including the channels through which the Fund’s shares are offered and sold. The Board noted that the Fund is part of one of the few fund families that have both direct-to-fund and intermediary distribution channels. As discussed above, the Board reviews detailed materials received from Funds Management and Wells Capital Management annually as part of the re-approval process under Section 15 of the 1940 Act and also reviews and assesses information about the quality of the services that the Fund receives throughout the year. In this regard, the Board has reviewed reports of Funds Management at each of its quarterly meetings, which include, among other things, portfolio reviews and performance reports. In addition, the Board confers with portfolio managers at various times throughout the year.
Conclusion
After considering the above-described factors and based on its deliberations and its evaluation of the information described above, the Board unanimously approved the continuation of the Advisory Agreements for an additional one-year period.
| | | | | | |
| List of Abbreviations | | Wells Fargo Advantage Common Stock Fund | | | 33 | |
The following is a list of common abbreviations for terms and entities which may have appeared in this report.
| ACB | — Agricultural Credit Bank |
| ADR | — American Depository Receipt |
| ADS | — American Depository Shares |
| AGC-ICC | — Assured Guaranty Corporation - Insured Custody Certificates |
| AGM | — Assured Guaranty Municipal |
| AMBAC | — American Municipal Bond Assurance Corporation |
| AMT | — Alternative Minimum Tax |
| BAN | — Bond Anticipation Notes |
| BHAC | — Berkshire Hathaway Assurance Corporation |
| CAB | — Capital Appreciation Bond |
| CCAB | — Convertible Capital Appreciation Bond |
| CDA | — Community Development Authority |
| CDO | — Collateralized Debt Obligation |
| COP | — Certificate of Participation |
| DRIVER | — Derivative Inverse Tax-Exempt Receipts |
| DW&P | — Department of Water & Power |
| DWR | — Department of Water Resources |
| ECFA | — Educational & Cultural Facilities Authority |
| EDA | — Economic Development Authority |
| EDFA | — Economic Development Finance Authority |
| ETF | — Exchange-Traded Fund |
| FFCB | — Federal Farm Credit Bank |
| FGIC | — Financial Guaranty Insurance Corporation |
| FHA | — Federal Housing Authority |
| FHLB | — Federal Home Loan Bank |
| FHLMC | — Federal Home Loan Mortgage Corporation |
| FICO | — The Financing Corporation |
| FNMA | — Federal National Mortgage Association |
| GDR | — Global Depository Receipt |
| GNMA | — Government National Mortgage Association |
| HCFR | — Healthcare Facilities Revenue |
| HEFA | — Health & Educational Facilities Authority |
| HEFAR | — Higher Education Facilities Authority Revenue |
| HFA | — Housing Finance Authority |
| HFFA | — Health Facilities Financing Authority |
| IBC | — Insured Bond Certificate |
| IDA | — Industrial Development Authority |
| IDAG | — Industrial Development Agency |
| IDR | — Industrial Development Revenue |
| KRW | — Republic of Korea Won |
| LIBOR | — London Interbank Offered Rate |
| LLC | — Limited Liability Company |
| LLP | — Limited Liability Partnership |
| MBIA | — Municipal Bond Insurance Association |
| MFHR | — Multi-Family Housing Revenue |
| MSTR | — Municipal Securities Trust Receipts |
| MUD | — Municipal Utility District |
| NATL-RE | — National Public Finance Guarantee Corporation |
| PCFA | — Pollution Control Finance Authority |
| PCR | — Pollution Control Revenue |
| PFA | — Public Finance Authority |
| PFFA | — Public Facilities Financing Authority |
| PFOTER | — Puttable Floating Option Tax-Exempt Receipts |
| plc | — Public Limited Company |
| PUTTER | — Puttable Tax-Exempt Receipts |
| R&D | — Research & Development |
| RDA | — Redevelopment Authority |
| RDFA | — Redevelopment Finance Authority |
| REIT | — Real Estate Investment Trust |
| ROC | — Reset Option Certificates |
| SAVRS | — Select Auction Variable Rate Securities |
| SBA | — Small Business Authority |
| SFHR | — Single Family Housing Revenue |
| SFMR | — Single Family Mortgage Revenue |
| SPDR | — Standard & Poor’s Depositary Receipts |
| STRIPS | — Separate Trading of Registered Interest and Principal Securities |
| TAN | — Tax Anticipation Notes |
| TIPS | — Treasury Inflation-Protected Securities |
| TRAN | — Tax Revenue Anticipation Notes |
| TCR | — Transferable Custody Receipts |
| TTFA | — Transportation Trust Fund Authority |
| TVA | — Tennessee Valley Authority |
| XLCA | — XL Capital Assurance |
This page is intentionally left blank.


FOR MORE INFORMATION
More information about Wells Fargo Advantage Funds is available free upon request. To obtain literature, please write, e-mail, visit the Fund’s Web site, or call:
Wells Fargo Advantage Funds
P.O. Box 8266
Boston, MA 02266-8266
E-mail: wfaf@wellsfargo.com
Web site: wellsfargoadvantagefunds.com
Individual investors: 1-800-222-8222
Retail investment professionals: 1-888-877-9275
Institutional investment professionals: 1-866-765-0778
This report and the financial statements contained herein are submitted for the general information of the shareholders of Wells Fargo Advantage Funds. If this report is used for promotional purposes, distribution of the report must be accompanied or preceded by a current prospectus. For a prospectus containing more complete information, including charges and expenses, call 1-800-222-8222 or visit the Fund’s Web site at wellsfargoadvantagefunds.com. Please consider the investment objectives, risks, charges, and expenses of the investment carefully before investing. This and other information about Wells Fargo Advantage Funds can be found in the current prospectus. Read the prospectus carefully before you invest or send money.
Wells Fargo Funds Management, LLC, a wholly owned subsidiary of Wells Fargo & Company, provides investment advisory and administrative services for Wells Fargo Advantage Funds. Other affiliates of Wells Fargo & Company provide subadvisory and other services for the Funds. The Funds are distributed by Wells Fargo Funds Distributor, LLC, Member FINRA/SIPC, an affiliate of Wells Fargo & Company.
NOT FDIC INSURED ¡ NO BANK GUARANTEE ¡ MAY LOSE VALUE
© 2012 Wells Fargo Funds Management, LLC. All rights reserved.
| | |
 | | 208988 05-12 SA229/SAR229 3-12 |

Wells Fargo Advantage Discovery FundSM

Semi-Annual Report
March 31, 2012

Reduce clutter. Save trees.
Sign up for electronic delivery of prospectuses and shareholder reports at wellsfargo.com/advantagedelivery
Contents
The views expressed and any forward-looking statements are as of March 31, 2012, unless otherwise noted, and are those of the Fund managers and/or Wells Fargo Funds Management, LLC. Discussions of individual securities, or the markets generally, or any Wells Fargo Advantage Fund are not intended as individual recommendations. Future events or results may vary significantly from those expressed in any forward-looking statements; the views expressed are subject to change at any time in response to changing circumstances in the market. Wells Fargo Funds Management, LLC, disclaims any obligation to publicly update or revise any views expressed or forward-looking statements.
NOT FDIC INSURED ¡ NO BANK GUARANTEE ¡ MAY LOSE VALUE

WELLS FARGO INVESTMENT HISTORY
| | |
| |
| 1932 | | Keystone creates one of the first mutual fund families. |
| |
| 1971 | | Wells Fargo & Company introduces one of the first institutional index funds. |
| |
| 1978 | | Wells Fargo applies Markowitz and Sharpe’s research on Modern Portfolio Theory to introduce one of the industry’s first Tactical Asset Allocation (TAA) models in institutional separately managed accounts. |
| |
| 1984 | | Wells Fargo Stagecoach Funds launches its first asset allocation fund. |
| |
| 1989 | | The Tactical Asset Allocation (TAA) Model is first applied to Wells Fargo’s asset allocation mutual funds. |
| |
| 1994 | | Wells Fargo introduces the LifePath Funds, one of the first suites of target date funds (now the Wells Fargo Advantage Dow Jones Target Date FundsSM). |
| |
| 1996 | | Evergreen Investments and Keystone Funds merge. |
| |
| 1997 | | Wells Fargo launches Wells Fargo Advantage WealthBuilder PortfoliosSM, a fund-of-funds suite of products that includes the use of quantitative models to shift assets among investment styles. |
| |
| 1999 | | Norwest Advantage Funds and Stagecoach Funds are reorganized into Wells Fargo Funds after the merger of Norwest and Wells Fargo. |
| |
| 2002 | | Evergreen Retail and Evergreen Institutional companies form the umbrella asset management company, Evergreen Investments. |
| |
| 2005 | | The integration of Strong Funds with Wells Fargo Funds creates Wells Fargo Advantage Funds, resulting in one of the top 20 mutual fund companies in the United States. |
| |
| 2006 | | Wells Fargo Advantage Funds relaunches the target date product line as Wells Fargo Advantage Dow Jones Target Date Funds. |
| |
| 2010 | | The mergers and reorganizations of Evergreen and Wells Fargo Advantage mutual funds are completed, unifying the families under the brand of Wells Fargo Advantage Funds. |
Wells Fargo Advantage Funds®
Wells Fargo Advantage Funds skillfully guides institutions, financial advisors, and individuals through the investment terrain to help them reach their financial objectives. Everything we do on behalf of investors is backed by our unique combination of qualifications.
Strength
Our organization is built on the standards of integrity and service established by our parent company—Wells Fargo & Company—more than 150 years ago. And, because we’re part of a highly diversified financial enterprise, we offer the depth of resources to help investors succeed.
Expertise
Our multi-boutique model offers investors access to the independent thinking of premier investment managers that have been chosen for their time-tested strategies. While each team specializes in a specific investment strategy, collectively they provide investors a wide choice of distinct investment styles. Our dedication to investment excellence doesn’t end with our expertise in manager selection—risk management, analysis, and rigorous ongoing review seek to ensure each manager’s investment process remains consistent.
Partnership
Our collaborative approach is built around understanding the needs and goals of our clients. By adhering to core principles of sound judgment and steady guidance, we support you through every stage of the investment decision process.
Carefully consider a fund’s investment objectives, risks, charges, and expenses before investing. For a current prospectus and, if available, a summary prospectus, containing this and other information, visit wellsfargoadvantagefunds.com. Read it carefully before investing.
Wells Fargo Funds Management, LLC, a wholly owned subsidiary of Wells Fargo & Company, provides investment advisory and administrative services for Wells Fargo Advantage Funds®. Other affiliates of Wells Fargo & Company provide subadvisory and other services for the Funds. The Funds are distributed by Wells Fargo Funds Distributor, LLC, Member FINRA/SIPC, an affiliate of Wells Fargo & Company.
“Dow Jones®” and “Dow Jones Target Date IndexesSM” are service marks of Dow Jones Trademark Holdings, LLC (“Dow Jones”), have been licensed to CME Group Index Services LLC (“CME Indexes”) and have been sublicensed for use for certain purposes by Global Index Advisors, Inc, and Wells Fargo Funds Management, LLC. The Wells Fargo Advantage Dow Jones Target Date FundsSM based on the Dow Jones Target Date IndexesSM, are not sponsored, endorsed, sold or promoted by Dow Jones, CME Indexes or their respective affiliates and none of them makes any representation regarding the advisability of investing in such product(s).
NOT FDIC INSURED ¡ NO BANK GUARANTEE ¡ MAY LOSE VALUE
Not part of the semi-annual report.
Wells Fargo Advantage Funds offers more than 110 mutual funds across a wide range of asset classes, representing over $213 billion in assets under management, as of March 31, 2012.
| | | | |
| Equity Funds | | | | |
Asia Pacific Fund | | Equity Value Fund | | Precious Metals Fund |
C&B Large Cap Value Fund | | Global Opportunities Fund | | Premier Large Company Growth Fund |
C&B Mid Cap Value Fund | | Growth Fund | | Small Cap Opportunities Fund |
Capital Growth Fund | | Index Fund | | Small Cap Value Fund |
Common Stock Fund | | International Equity Fund | | Small Company Growth Fund |
Disciplined U.S. Core Fund | | International Value Fund | | Small Company Value Fund |
Discovery Fund† | | Intrinsic Small Cap Value Fund | | Small/Mid Cap Core Fund |
Diversified Equity Fund | | Intrinsic Value Fund | | Small/Mid Cap Value Fund |
Diversified International Fund | | Intrinsic World Equity Fund | | Special Mid Cap Value Fund |
Diversified Small Cap Fund | | Large Cap Core Fund | | Special Small Cap Value Fund |
Emerging Growth Fund | | Large Cap Growth Fund | | Specialized Technology Fund |
Emerging Markets Equity Fund | | Large Company Value Fund | | Strategic Large Cap Growth Fund |
Endeavor Select Fund† | | Omega Growth Fund | | Traditional Small Cap Growth Fund |
Enterprise Fund† | | Opportunity Fund† | | Utility and Telecommunications Fund |
| Bond Funds | | | | |
Adjustable Rate Government Fund | | Inflation-Protected Bond Fund | | Short-Term Bond Fund |
California Limited-Term Tax-Free Fund | | Intermediate Tax/AMT-Free Fund | | Short-Term High Yield Bond Fund |
California Tax-Free Fund | | International Bond Fund | | Short-Term Municipal Bond Fund |
Colorado Tax-Free Fund | | Minnesota Tax-Free Fund | | Strategic Municipal Bond Fund |
Government Securities Fund | | Municipal Bond Fund | | Total Return Bond Fund |
High Income Fund | | North Carolina Tax-Free Fund | | Ultra Short-Term Income Fund |
High Yield Bond Fund | | Pennsylvania Tax-Free Fund | | Ultra Short-Term Municipal Income Fund |
Income Plus Fund | | Short Duration Government Bond Fund | | Wisconsin Tax-Free Fund |
| Asset Allocation Funds | | | | |
Absolute Return Fund | | WealthBuilder Equity Portfolio† | | Target 2020 Fund† |
Asset Allocation Fund | | WealthBuilder Growth Allocation Portfolio† | | Target 2025 Fund† |
Conservative Allocation Fund | | WealthBuilder Growth Balanced Portfolio† | | Target 2030 Fund† |
Diversified Capital Builder Fund | | WealthBuilder Moderate Balanced Portfolio† | | Target 2035 Fund† |
Diversified Income Builder Fund | | WealthBuilder Tactical Equity Portfolio† | | Target 2040 Fund† |
Growth Balanced Fund | | Target Today Fund† | | Target 2045 Fund† |
Index Asset Allocation Fund | | Target 2010 Fund† | | Target 2050 Fund† |
Moderate Balanced Fund | | Target 2015 Fund† | | Target 2055 Fund† |
WealthBuilder Conservative Allocation Portfolio† | | | | |
| Money Market Funds | | | | |
100% Treasury Money Market Fund | | Heritage Money Market Fund† | | National Tax-Free Money Market Fund |
California Municipal Money Market Fund | | Money Market Fund | | Prime Investment Money Market Fund |
Cash Investment Money Market Fund | | Municipal Cash Management Money Market Fund | | Treasury Plus Money Market Fund |
Government Money Market Fund | | Municipal Money Market Fund | | |
| Variable Trust Funds1 | | | | |
VT Discovery Fund† | | VT Intrinsic Value Fund | | VT Small Cap Growth Fund |
VT Index Asset Allocation Fund | | VT Omega Growth Fund | | VT Small Cap Value Fund |
VT International Equity Fund | | VT Opportunity Fund† | | VT Total Return Bond Fund |
An investment in a money market fund is not insured or guaranteed by the Federal Deposit Insurance Corporation or any other government agency. Although the Wells Fargo Advantage Money Market Funds seek to preserve the value of your investment at $1.00 per share, it is possible to lose money by investing in a money market fund.
| 1. | The Variable Trust Funds are generally available only through insurance company variable contracts. |
| † | In this report, the Wells Fargo Advantage Discovery FundSM, Wells Fargo Advantage Endeavor Select FundSM, Wells Fargo Advantage Enterprise FundSM, Wells Fargo Advantage Opportunity FundSM, Wells Fargo Advantage WealthBuilder Conservative Allocation PortfolioSM, Wells Fargo Advantage WealthBuilder Equity PortfolioSM, Wells Fargo Advantage WealthBuilder Growth Allocation PortfolioSM, Wells Fargo Advantage WealthBuilder Growth Balanced PortfolioSM, Wells Fargo Advantage WealthBuilder Moderate Balanced PortfolioSM, Wells Fargo Advantage WealthBuilder Tactical Equity PortfolioSM, Wells Fargo Advantage Dow Jones Target Today FundSM, Wells Fargo Advantage Dow Jones Target 2010 FundSM, Wells Fargo Advantage Dow Jones Target 2015 FundSM, Wells Fargo Advantage Dow Jones Target 2020 FundSM, Wells Fargo Advantage Dow Jones Target 2025 FundSM, Wells Fargo Advantage Dow Jones Target 2030 FundSM, Wells Fargo Advantage Dow Jones Target 2035 FundSM, Wells Fargo Advantage Dow Jones Target 2040 FundSM, Wells Fargo Advantage Dow Jones Target 2045 FundSM, Wells Fargo Advantage Dow Jones Target 2050 FundSM, Wells Fargo Advantage Dow Jones Target 2055 FundSM, Wells Fargo Advantage Heritage Money Market FundSM, Wells Fargo Advantage VT Discovery FundSM, and Wells Fargo Advantage VT Opportunity FundSM are referred to as the Discovery Fund, Endeavor Select Fund, Enterprise Fund, Opportunity Fund, WealthBuilder Conservative Allocation Portfolio, WealthBuilder Equity Portfolio, WealthBuilder Growth Allocation Portfolio, WealthBuilder Growth Balanced Portfolio, WealthBuilder Moderate Balanced Portfolio, WealthBuilder Tactical Equity Portfolio, Target Today Fund, Target 2010 Fund, Target 2015 Fund, Target 2020 Fund, Target 2025 Fund, Target 2030 Fund, Target 2035 Fund, Target 2040 Fund, Target 2045 Fund, Target 2050 Fund, Target 2055 Fund, Heritage Money Market Fund, VT Discovery Fund, and VT Opportunity Fund, respectively. |
Not part of the semi-annual report.
| | | | |
| 2 | | Wells Fargo Advantage Discovery Fund | | Letter to Shareholders |

Karla M. Rabusch,
President
Wells Fargo Advantage Funds
The period was marked by increased confidence that the U.S. economy was staging a fragile recovery, offset by continued concerns about the possible effect on the global economy of the ongoing European sovereign debt crisis—which began in Greece and later spread to the larger economies of Italy and Spain.
In contrast to worrisome data from the eurozone, U.S. economic data remained moderately positive.
Dear Valued Shareholder:
We’re pleased to offer you this semi-annual report for the Wells Fargo Advantage Discovery Fund for the six-month period that ended March 31, 2012. The period was marked by increased confidence that the U.S. economy was staging a fragile recovery, offset by continued concerns about the possible effect on the global economy of the ongoing European sovereign debt crisis—which began in Greece and later spread to the larger economies of Italy and Spain. U.S. stock indexes posted solid gains for the period.
Macroeconomic optimism faded as global growth slowed and worries rose.
Prior to the reporting period, investors worried that the global economy was returning to a recession. Although second quarter U.S. gross domestic product (GDP) grew at a 1.3% annual rate, it was below the levels set in 2010 and seemed to confirm that the economy had slowed from its previous pace. Moreover, the drawn-out political debate over the raising of the U.S. debt ceiling reduced confidence that the national government would be able to work together to address the country’s problems. Partly as a result, Standard & Poor’s rating service downgraded U.S. long-term debt from AAA to AA+1 in August 2011.
Throughout the six-month period, concerns about the eurozone sovereign debt situation returned to center stage. Investors became increasingly concerned that Greece would default on its debt, a scenario that only seemed more likely as eurozone leaders began to openly discuss a “voluntary” haircut on Greek debt for private investors. Because many eurozone banks owned Greek debt and many U.S. banks had financial ties to eurozone banks, investors worried about the effect of such an event on the financial systems and the global economy. In October 2011, market participants turned their attention to the debt burdens of Italy—which also had its credit rating downgraded by Standard & Poor’s—because even though it had a relatively modest budget deficit, it had a high amount of outstanding debt and a stagnant economy. French banks were heavily exposed to Italian debt, so Italy’s woes led to fears of a state bailout of French banks and a resulting increase in France’s required expenditures.
After months of rumors and worries, the Greek credit crisis was finally addressed in March 2012 when the country came to an agreement with its creditors allowing it to write down the principal on most of its bonds in exchange for increased financial austerity. By the end of the reporting period, the Greek agreement, combined with unprecedented support for eurozone banks by the European Central Bank (ECB), seemed to calm investor concerns, at least temporarily.
The U.S. economy reported relatively solid news.
In contrast to worrisome data from the eurozone, U.S. economic data remained moderately positive. After disappointing reports for first and second quarter GDP growth, reported GDP came in at a 1.8% annualized rate in the third quarter of 2011, and then accelerated to a 3.0% annualized rate in the fourth quarter. The major banks appeared to have taken steps toward repairing their balance sheets; in March, the Federal Reserve (Fed) announced that 15 of the 19 major banks had passed a “stress test,” in which the Fed attempted to gauge whether the banks could survive a severe recession that included a 50% drop in the stock market and a 21% percent decline in housing prices.
| 1. | The ratings indicated are from Standard & Poor’s. Standard & Poor’s rates the creditworthiness of bonds, ranging from AAA (highest) to D (lowest). Ratings from A to CCC may be modified by the addition of a plus (+) or minus (-) sign to show relative standing within the rating categories. |
| | | | | | |
| Letter to Shareholders | | Wells Fargo Advantage Discovery Fund | | | 3 | |
Bank stocks rebounded strongly after the Fed released details of the stress test, but all major market sectors rallied as investors became increasingly confident that the U.S. would not return to recession. Small-cap stocks modestly outperformed large-cap stocks, and growth stocks outperformed value stocks by an even smaller margin.
Central banks continued to provide stimulus.
Throughout the reporting period, the Federal Open Market Committee (FOMC) kept its key interest rates effectively at zero in order to support the economy and financial system. In the second quarter of 2011, the Fed completed its second round of monetary stimulus, in which it had planned to purchase $600 billion in long-term U.S. Treasuries as well as reinvest an additional $250 billion to $300 billion in Treasuries with the proceeds from earlier investments. Even though the Fed seemed to rule out further monetary stimulus, it remained accommodative. In early August 2011, in response to extreme market volatility and signs of a weakening economy, the Fed announced its intention to keep interest rates low until at least late 2014.
At the beginning of the period, the ECB had a key rate of 1.50%, which it had raised in early 2011 in an attempt to keep inflation in check. However, in response to weakness in the southern European economies, the ECB lowered its key rate to 1.25% in November and to 1.0% in December. In August, after a sell-off in the sovereign debts of Spain and Italy, the ECB announced plans to purchase the debt of those countries in exchange for increased deficit reduction. The ECB also continued to provide virtually unlimited liquidity for banks, announcing a long-term refinancing operation (LTRO) in December through which it provided low cost, three-year loans to lenders.
We use time-tested investment strategies, even as many variables are at work in the market.
The full effect of the credit crisis remains unknown. Elevated unemployment and debt defaults continue to pressure consumers and businesses alike.
In our experience strict adherence to time-tested investment strategies has its rewards. As a whole, Wells Fargo Advantage Funds represents investments across a range of asset classes and investment styles, giving you an opportunity to create a diversified investment portfolio. While diversification may not prevent losses in a downturn, we believe it helps in managing risk.
Thank you for choosing to invest with Wells Fargo Advantage Funds. We appreciate your confidence in us and remain committed to helping you meet your financial needs. For current information about your fund investments, contact your investment professional, visit our Web site at wellsfargoadvantagefunds.com, or call us directly at 1-800-222-8222. We are available 24 hours a day, 7 days a week.
Sincerely,

Karla M. Rabusch
President
Wells Fargo Advantage Funds
| | | | |
| 4 | | Wells Fargo Advantage Discovery Fund | | Letter to Shareholders |
Notice to Shareholders
The Board of Trustees for Wells Fargo Advantage Funds has unanimously approved the following modifications to certain net asset value (NAV) waiver privileges and commission schedules:
| | n | | Effective May 1, 2012, automatic investment plan (AIP) purchases and proceeds received from systematic withdrawals will no longer qualify for NAV repurchase privileges. | |
| | n | | Effective May 1, 2012, discretionary rights to waive the upfront commission for Class C and “jumbo” Class A share purchases will no longer be granted to broker/dealers. However, we will continue to waive the Class C shares contingent deferred sales charge for redemptions by employer-sponsored retirement plans where the dealer of record waived its commission at the time of purchase. | |
| | n | | Effective July 31, 2012, NAV purchase privileges for former Evergreen Class IS and Class R shareholders are being modified to remove the ability to purchase Class A shares at NAV unless those shares are held directly with the Fund on or after July 31, 2012. | |
Please contact your investment professional or call us directly at 1-800-222-8222 if you have any questions on this Notice to Shareholders.
| | | | | | |
| Performance Highlights (Unaudited) | | Wells Fargo Advantage Discovery Fund | | | 5 | |
INVESTMENT OBJECTIVE
The Fund seeks long-term capital appreciation.
ADVISER
Wells Fargo Funds Management, LLC
SUB-ADVISER
Wells Capital Management Incorporated
PORTFOLIO MANAGERS
Thomas J. Pence, CFA
Michael T. Smith, CFA
Chris Warner, CFA
FUND INCEPTION
December 31, 1987
| | | | |
TEN LARGEST EQUITY HOLDINGS1 (AS OF MARCH 31, 2012) | |
Kansas City Southern | | | 2.76% | |
Airgas Incorporated | | | 2.65% | |
TransDigm Group Incorporated | | | 2.42% | |
Gartner Incorporated | | | 2.24% | |
SBA Communications Corporation Class A | | | 1.95% | |
Broadsoft Incorporated | | | 1.92% | |
Monster Beverage Corporation | | | 1.71% | |
Chart Industries Incorporated | | | 1.66% | |
Fortinet Incorporated | | | 1.66% | |
Alexion Pharmaceuticals Incorporated | | | 1.66% | |
| | |
SECTOR DISTRIBUTION2 (AS OF MARCH 31, 2012) | | |
|
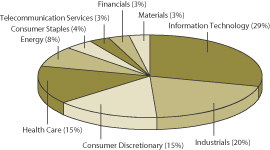 |
| 1. | The ten largest equity holdings are calculated based on the value of the securities divided by total net assets of the Fund. Holdings are subject to change and may have changed since the date specified |
| 2. | Sector distribution is subject to change and is calculated based on the total long-term investments of the Fund. |
| | | | |
| 6 | | Wells Fargo Advantage Discovery Fund | | Performance Highlights (Unaudited) |
AVERAGE ANNUAL TOTAL RETURN3 (%) (AS OF MARCH 31, 2012)
| | | | | | | | | | | | | | | | | | | | | | | | | | | | | | | | | | | | | | | | | | | | |
| | | | | | Including Sales Charge | | | Excluding Sales Charge | | | Expense Ratios4 | |
| | | Inception Date | | | 6 Months* | | | 1 Year | | | 5 Year | | | 10 Year | | | 6 Months* | | | 1 Year | | | 5 Year | | | 10 Year | | | Gross | | | Net5 | |
Class A (WFDAX) | | | 07/31/2007 | | | | 26.01 | | | | 0.81 | | | | 6.22 | | | | 8.89 | | | | 33.67 | | | | 6.98 | | | | 7.48 | | | | 9.54 | | | | 1.34% | | | | 1.23% | |
Class C (WDSCX) | | | 07/31/2007 | | | | 32.19 | | | | 5.17 | | | | 6.66 | | | | 8.76 | | | | 33.19 | | | | 6.17 | | | | 6.66 | | | | 8.76 | | | | 2.09% | | | | 1.98% | |
Administrator Class (WFDDX) | | | 04/08/2005 | | | | | | | | | | | | | | | | | | | | 33.67 | | | | 7.08 | | | | 7.63 | | | | 9.68 | | | | 1.18% | | | | 1.16% | |
Institutional Class (WFDSX) | | | 08/31/2006 | | | | | | | | | | | | | | | | | | | | 33.92 | | | | 7.41 | | | | 7.89 | | | | 9.82 | | | | 0.91% | | | | 0.91% | |
Investor Class (STDIX) | | | 12/31/1987 | | | | | | | | | | | | | | | | | | | | 33.61 | | | | 6.89 | | | | 7.39 | | | | 9.50 | | | | 1.41% | | | | 1.30% | |
Russell 2500TM Growth Index6 | | | | | | | | | | | | | | | | | | | | | | | 30.09 | | | | 2.70 | | | | 4.90 | | | | 6.99 | | | | | | | | | |
| * | Returns for periods of less than one year are not annualized. |
Figures quoted represent past performance, which is no guarantee of future results and do not reflect the deduction of taxes that a shareholder may pay on fund distributions or the redemption of fund shares. Investment return and principal value of an investment will fluctuate so that an investor’s shares, when redeemed, may be worth more or less than their original cost. Performance shown without sales charges would be lower if sales charges were reflected. Current performance may be lower or higher than the performance data quoted and assumes the reinvestment of dividends and capital gains. Current month-end performance is available on the Fund’s Web site – wellsfargoadvantagefunds.com
Index returns do not include transaction costs associated with buying and selling securities, any mutual fund fees or expenses or any taxes. It is not possible to invest directly in an index.
For Class A shares, the maximum front-end sales charge is 5.75%. For Class C shares, the maximum contingent deferred sales charge is 1.00%. Performance including sales charge assumes the sales charge for the corresponding time period. Administrator Class, Institutional Class and Investor Class shares are sold without a front-end sales charge or contingent deferred sales charge.
Please keep in mind that high double-digit returns were primarily achieved during favorable market conditions. You should not expect that such favorable returns can be consistently achieved. A Fund’s performance, especially for very short time periods, should not be the sole factor in making your investment decision.
Stock fund values fluctuate in response to the activities of individual companies and general market and economic conditions. Smaller company stocks tend to be more volatile and less liquid than those of larger companies. The use of derivatives may reduce returns and/or increase volatility. Certain investment strategies tend to increase the total risk of an investment (relative to the broader market). This Fund is exposed to foreign investment risk. Consult the Fund’s prospectus for additional information on these and other risks.
| 3. | Historical performance shown for Class C shares prior to their inception reflects the performance of the Investor Class shares, adjusted to reflect the higher expenses applicable to Class C shares. Historical performance shown for the Institutional Class shares prior to their inception reflects the performance of the Administrator Class shares and includes the higher expenses applicable to the Administrator Class shares. If these expenses had not been included, returns would be higher. Historical performance shown for Class A and Administrator Class shares prior to their inception reflects the performance of the Investor Class shares and includes the higher expenses applicable to the Investor Class shares. If these expenses had not been included, returns would be higher. |
| 4. | Reflects the expense ratios as stated in the most recent prospectuses. |
| 5. | The Adviser has committed through July 18, 2013 to waive fees and/or reimburse expenses to the extent necessary to cap the Fund’s Total Annual Fund Operating Expenses After Fee Waiver, excluding certain expenses, at 1.22% for Class A, 1.97% for Class C, 1.15% for Administrator Class, 0.90% for Institutional Class and 1.29% for Investor Class. Without this cap, the Fund’s returns would have been lower. |
| 6. | The Russell 2500™ Growth Index measures the performance of those Russell 2500™ companies with higher price-to-book ratios and higher forecasted growth values. You cannot invest directly in an index. |
| | | | | | |
| Fund Expenses (Unaudited) | | Wells Fargo Advantage Discovery Fund | | | 7 | |
As a shareholder of the Fund, you incur two types of costs: (1) transaction costs, including sales charges (loads) on purchase payments and contingent deferred sales charges (if any) on redemptions and (2) ongoing costs, including management fees; distribution (12b-1) and/or shareholder service fees; and other Fund expenses. This example is intended to help you understand your ongoing costs (in dollars) of investing in the Fund and to compare these costs with the ongoing costs of investing in other mutual funds.
The example is based on an investment of $1,000 invested at the beginning of the six-month period and held for the entire period from October 1, 2011 to March 31, 2012.
Actual Expenses
The “Actual” line of the table below provides information about actual account values and actual expenses. You may use the information in this line, together with the amount you invested, to estimate the expenses that you paid over the period. Simply divide your account value by $1,000 (for example, an $8,600 account value divided by $1,000 = 8.6), then multiply the result by the number in the “Actual” line under the heading entitled “Expenses Paid During Period” for your applicable class of shares to estimate the expenses you paid on your account during this period.
Hypothetical Example for Comparison Purposes
The “Hypothetical” line of the table below provides information about hypothetical account values and hypothetical expenses based on the Fund’s actual expense ratio and an assumed rate of return of 5% per year before expenses, which is not the Fund’s actual return. The hypothetical account values and expenses may not be used to estimate the actual ending account balance or expenses you paid for the period. You may use this information to compare the ongoing costs of investing in the Fund and other funds. To do so, compare this 5% hypothetical example with the 5% hypothetical examples that appear in the shareholder reports of the other funds.
Please note that the expenses shown in the table are meant to highlight your ongoing costs only and do not reflect any transactional costs, such as sales charges (loads) and contingent deferred sales charges. Therefore, the “Hypothetical” line of the table is useful in comparing ongoing costs only, and will not help you determine the relative total costs of owning different funds. In addition, if these transactional costs were included, your costs would have been higher.
| | | | | | | | | | | | | | | | |
| | | Beginning
Account Value
10-01-2011 | | | Ending
Account Value
03-31-2012 | | | Expenses
Paid During
the Period1 | | | Net Annual
Expense Ratio | |
Class A | | | | | | | | | | | | | | | | |
Actual | | $ | 1,000.00 | | | $ | 1,336.74 | | | $ | 7.13 | | | | 1.22 | % |
Hypothetical (5% return before expenses) | | $ | 1,000.00 | | | $ | 1,018.90 | | | $ | 6.16 | | | | 1.22 | % |
Class C | | | | | | | | | | | | | | | | |
Actual | | $ | 1,000.00 | | | $ | 1,331.86 | | | $ | 11.48 | | | | 1.97 | % |
Hypothetical (5% return before expenses) | | $ | 1,000.00 | | | $ | 1,015.15 | | | $ | 9.92 | | | | 1.97 | % |
Administrator Class | | | | | | | | | | | | | | | | |
Actual | | $ | 1,000.00 | | | $ | 1,336.70 | | | $ | 6.66 | | | | 1.14 | % |
Hypothetical (5% return before expenses) | | $ | 1,000.00 | | | $ | 1,019.30 | | | $ | 5.76 | | | | 1.14 | % |
Institutional Class | | | | | | | | | | | | | | | | |
Actual | | $ | 1,000.00 | | | $ | 1,339.16 | | | $ | 5.09 | | | | 0.87 | % |
Hypothetical (5% return before expenses) | | $ | 1,000.00 | | | $ | 1,020.65 | | | $ | 4.39 | | | | 0.87 | % |
Investor Class | | | | | | | | | | | | | | | | |
Actual | | $ | 1,000.00 | | | $ | 1,336.11 | | | $ | 7.53 | | | | 1.29 | % |
Hypothetical (5% return before expenses) | | $ | 1,000.00 | | | $ | 1,018.55 | | | $ | 6.51 | | | | 1.29 | % |
| 1. | Expenses paid is equal to the annualized expense ratio of each class multiplied by the average account value over the period, multiplied by the number of days in the most recent fiscal half-year divided by the number of days in the fiscal year (to reflect the one-half year period). |
| | | | |
| 8 | | Wells Fargo Advantage Discovery Fund | | Portfolio of Investments—March 31, 2012 (Unaudited) |
| | | | | | | | | | | | |
| Security Name | | | | | | Shares | | | Value | |
| | | | | | | | | | | | |
| | | | |
Common Stocks: 95.80% | | | | | | | | | | | | |
| | | | |
Consumer Discretionary: 14.29% | | | | | | | | | | | | |
| | | | |
| Auto Components: 1.53% | | | | | | | | | | | | |
BorgWarner Incorporated Ǡ | | | | | | | 248,600 | | | $ | 20,966,924 | |
| | | | | | | | | | | | |
| | | | |
| Automobiles: 1.30% | | | | | | | | | | | | |
Tesla Motors Incorporated Ǡ | | | | | | | 481,387 | | | | 17,926,852 | |
| | | | | | | | | | | | |
| | | | |
| Household Durables: 1.55% | | | | | | | | | | | | |
SodaStream International Limited Ǡ | | | | | | | 219,000 | | | | 7,375,920 | |
Tempur-Pedic International Incorporated Ǡ | | | | | | | 164,200 | | | | 13,863,406 | |
| | | | |
| | | | | | | | | | | 21,239,326 | |
| | | | | | | | | | | | |
| | | | |
| Internet & Catalog Retail: 1.35% | | | | | | | | | | | | |
HomeAway Incorporated Ǡ | | | | | | | 356,515 | | | | 9,044,786 | |
Shutterfly Incorporated † | | | | | | | 302,700 | | | | 9,483,591 | |
| | | | |
| | | | | | | | | | | 18,528,377 | |
| | | | | | | | | | | | |
| | | | |
| Specialty Retail: 4.55% | | | | | | | | | | | | |
DSW Incorporated Class A | | | | | | | 184,700 | | | | 10,116,019 | |
GNC Holdings Incorporated Class A | | | | | | | 507,216 | | | | 17,696,766 | |
Ulta Salon Cosmetics & Fragrance Incorporated | | | | | | | 223,200 | | | | 20,733,048 | |
Vitamin Shoppe Incorporated † | | | | | | | 314,700 | | | | 13,912,887 | |
| | | | |
| | | | | | | | | | | 62,458,720 | |
| | | | | | | | | | | | |
| | | | |
| Textiles, Apparel & Luxury Goods: 4.01% | | | | | | | | | | | | |
Deckers Outdoor Corporation Ǡ | | | | | | | 192,100 | | | | 12,111,905 | |
PVH Corporation | | | | | | | 191,000 | | | | 17,062,030 | |
Under Armour Incorporated Ǡ | | | | | | | 138,900 | | | | 13,056,600 | |
Vera Bradley Incorporated Ǡ | | | | | | | 427,300 | | | | 12,900,187 | |
| | | | |
| | | | | | | | | | | 55,130,722 | |
| | | | | | | | | | | | |
| | | | |
Consumer Staples: 4.17% | | | | | | | | | | | | |
| | | | |
| Beverages: 2.91% | | | | | | | | | | | | |
Boston Beer Company Incorporated Ǡ | | | | | | | 154,462 | | | | 16,494,997 | |
Monster Beverage Corporation † | | | | | | | 378,700 | | | | 23,513,483 | |
| | | | |
| | | | | | | | | | | 40,008,480 | |
| | | | | | | | | | | | |
| | | | |
| Food Products: 1.26% | | | | | | | | | | | | |
Hain Celestial Group Incorporated Ǡ | | | | | | | 393,800 | | | | 17,252,378 | |
| | | | | | | | | | | | |
| | | | |
Energy: 8.11% | | | | | | | | | | | | |
| | | | |
| Energy Equipment & Services: 2.93% | | | | | | | | | | | | |
Atwood Oceanics Incorporated † | | | | | | | 294,500 | | | | 13,220,105 | |
GulfMark Offshore Incorporated Class A † | | | | | | | 180,300 | | | | 8,286,588 | |
Oil States International Incorporated † | | | | | | | 239,200 | | | | 18,671,952 | |
| | | | |
| | | | | | | | | | | 40,178,645 | |
| | | | | | | | | | | | |
The accompanying notes are an integral part of these financial statements.
| | | | | | |
| Portfolio of Investments—March 31, 2012 (Unaudited) | | Wells Fargo Advantage Discovery Fund | | | 9 | |
| | | | | | | | | | | | |
| Security Name | | | | | | Shares | | | Value | |
| | | | | | | | | | | | |
| | | | |
| Oil, Gas & Consumable Fuels: 5.18% | | | | | | | | | | | | |
Approach Resources Incorporated † | | | | | | | 390,817 | | | $ | 14,440,688 | |
Cabot Oil & Gas Corporation | | | | | | | 293,500 | | | | 9,148,395 | |
Gulfport Energy Corporation † | | | | | | | 276,000 | | | | 8,037,120 | |
Kodiak Oil & Gas Corporation Ǡ | | | | | | | 1,467,600 | | | | 14,617,296 | |
Pioneer Natural Resources Company | | | | | | | 127,100 | | | | 14,183,089 | |
Plains Exploration & Product Company † | | | | | | | 252,200 | | | | 10,756,330 | |
| | | | |
| | | | | | | | | | | 71,182,918 | |
| | | | | | | | | | | | |
| | | | |
Financials: 2.77% | | | | | | | | | | | | |
| | | | |
| Capital Markets: 1.82% | | | | | | | | | | | | |
Affiliated Managers Group Incorporated † | | | | | | | 200,500 | | | | 22,417,905 | |
LPL Investment Holdings Incorporated | | | | | | | 67,140 | | | | 2,547,292 | |
| | | | |
| | | | | | | | | | | 24,965,197 | |
| | | | | | | | | | | | |
| | | | |
| Real Estate Management & Development: 0.95% | | | | | | | | | | | | |
CBRE Group Incorporated † | | | | | | | 654,400 | | | | 13,061,824 | |
| | | | | | | | | | | | |
| | | | |
Health Care: 13.98% | | | | | | | | | | | | |
| | | | |
| Biotechnology: 4.41% | | | | | | | | | | | | |
Alexion Pharmaceuticals Incorporated † | | | | | | | 244,900 | | | | 22,741,414 | |
BioMarin Pharmaceutical Incorporated Ǡ | | | | | | | 478,657 | | | | 16,394,002 | |
Cubist Pharmaceuticals Incorporated † | | | | | | | 410,200 | | | | 17,741,150 | |
Threshold Pharmaceuticals Incorporated † | | | | | | | 426,603 | | | | 3,754,106 | |
| | | | |
| | | | | | | | | | | 60,630,672 | |
| | | | | | | | | | | | |
| | | | |
| Health Care Equipment & Supplies: 2.52% | | | | | | | | | | | | |
Alere Incorporated † | | | | | | | 455,991 | | | | 11,860,326 | |
Edwards Lifesciences Corporation † | | | | | | | 66,599 | | | | 4,843,745 | |
Gen-Probe Incorporated † | | | | | | | 160,100 | | | | 10,632,241 | |
HeartWare International Incorporated Ǡ | | | | | | | 110,000 | | | | 7,225,900 | |
| | | | |
| | | | | | | | | | | 34,562,212 | |
| | | | | | | | | | | | |
| | | | |
| Health Care Providers & Services: 3.11% | | | | | | | | | | | | |
AmerisourceBergen Corporation | | | | | | | 296,000 | | | | 11,745,280 | |
MEDNAX Incorporated † | | | | | | | 234,600 | | | | 17,447,202 | |
Team Health Holdings LLC † | | | | | | | 659,800 | | | | 13,565,488 | |
| | | | |
| | | | | | | | | | | 42,757,970 | |
| | | | | | | | | | | | |
| | | | |
| Health Care Technology: 0.97% | | | | | | | | | | | | |
athenahealth Incorporated Ǡ | | | | | | | 179,200 | | | | 13,282,304 | |
| | | | | | | | | | | | |
| | | | |
| Life Sciences Tools & Services: 0.94% | | | | | | | | | | | | |
Bruker BioSciences Corporation † | | | | | | | 843,300 | | | | 12,910,923 | |
| | | | | | | | | | | | |
| | | | |
| Pharmaceuticals: 2.03% | | | | | | | | | | | | |
Auxilium Pharmaceuticals Incorporated † | | | | | | | 702,200 | | | | 13,039,854 | |
Impax Laboratories Incorporated Ǡ | | | | | | | 602,500 | | | | 14,809,450 | |
| | | | |
| | | | | | | | | | | 27,849,304 | |
| | | | | | | | | | | | |
The accompanying notes are an integral part of these financial statements.
| | | | |
| 10 | | Wells Fargo Advantage Discovery Fund | | Portfolio of Investments—March 31, 2012 (Unaudited) |
| | | | | | | | | | | | |
| Security Name | | | | | | Shares | | | Value | |
| | | | | | | | | | | | |
| | | | |
Industrials: 19.33% | | | | | | | | | | | | |
| | | | |
| Aerospace & Defense: 3.86% | | | | | | | | | | | | |
TransDigm Group Incorporated † | | | | | | | 286,800 | | | $ | 33,199,968 | |
Triumph Group Incorporated « | | | | | | | 317,300 | | | | 19,882,018 | |
| | | | |
| | | | | | | | | | | 53,081,986 | |
| | | | | | | | | | | | |
| | | | |
| Airlines: 0.37% | | | | | | | | | | | | |
Copa Holdings SA | | | | | | | 64,954 | | | | 5,144,357 | |
| | | | | | | | | | | | |
| | | | |
| Machinery: 5.87% | | | | | | | | | | | | |
Chart Industries Incorporated Ǡ | | | | | | | 311,600 | | | | 22,849,628 | |
Colfax Corporation † | | | | | | | 393,545 | | | | 13,868,526 | |
Graco Incorporated | | | | | | | 375,600 | | | | 19,929,336 | |
Rexnord Corporation † | | | | | | | 319,732 | | | | 6,746,345 | |
Wabtec Corporation | | | | | | | 228,400 | | | | 17,214,508 | |
| | | | |
| | | | | | | | | | | 80,608,343 | |
| | | | | | | | | | | | |
| | | | |
| Marine: 1.33% | | | | | | | | | | | | |
Kirby Corporation † | | | | | | | 277,000 | | | | 18,223,830 | |
| | | | | | | | | | | | |
| | | | |
| Professional Services: 1.00% | | | | | | | | | | | | |
Verisk Analytics Incorporated Class A † | | | | | | | 292,400 | | | | 13,734,028 | |
| | | | | | | | | | | | |
| | | | |
| Road & Rail: 4.05% | | | | | | | | | | | | |
Hertz Global Holdings Incorporated † | | | | | | | 1,179,190 | | | | 17,735,018 | |
Kansas City Southern | | | | | | | 529,200 | | | | 37,938,348 | |
| | | | |
| | | | | | | | | | | 55,673,366 | |
| | | | | | | | | | | | |
| | | | |
| Trading Companies & Distributors: 1.61% | | | | | | | | | | | | |
WESCO International Incorporated Ǡ | | | | | | | 337,470 | | | | 22,040,166 | |
| | | | | | | | | | | | |
| | | | |
| Transportation Infrastructure: 1.24% | | | | | | | | | | | | |
Wesco Aircraft Holdings Incorporated † | | | | | | | 1,049,771 | | | | 17,006,290 | |
| | | | | | | | | | | | |
| | | | |
Information Technology: 27.45% | | | | | | | | | | | | |
| | | | |
| Communications Equipment: 1.92% | | | | | | | | | | | | |
F5 Networks Incorporated † | | | | | | | 126,500 | | | | 17,072,440 | |
Ubiquiti Networks Incorporated Ǡ | | | | | | | 293,724 | | | | 9,290,490 | |
| | | | |
| | | | | | | | | | | 26,362,930 | |
| | | | | | | | | | | | |
| | | | |
| Electronic Equipment, Instruments & Components: 2.12% | | | | | | | | | | | | |
M/A-COM Technology Solutions Incorporated † | | | | | | | 357,337 | | | | 7,411,169 | |
Trimble Navigation Limited † | | | | | | | 398,900 | | | | 21,708,138 | |
| | | | |
| | | | | | | | | | | 29,119,307 | |
| | | | | | | | | | | | |
| | | | |
| Internet Software & Services: 6.42% | | | | | | | | | | | | |
Angie’s List Incorporated «† | | | | | | | 456,794 | | | | 8,628,839 | |
DealerTrack Holdings Incorporated Ǡ | | | | | | | 679,972 | | | | 20,575,953 | |
Equinix Incorporated Ǡ | | | | | | | 95,183 | | | | 14,986,563 | |
ExactTarget Incorporated † | | | | | | | 61,988 | | | | 1,611,688 | |
The accompanying notes are an integral part of these financial statements.
| | | | | | |
| Portfolio of Investments—March 31, 2012 (Unaudited) | | Wells Fargo Advantage Discovery Fund | | | 11 | |
| | | | | | | | | | | | |
| Security Name | | | | | | Shares | | | Value | |
| | | | | | | | | | | | |
| | | | |
| Internet Software & Services (continued) | | | | | | | | | | | | |
Liquidity Services Incorporated † | | | | | | | 210,200 | | | $ | 9,416,960 | |
LogMeIn Incorporated Ǡ | | | | | | | 373,348 | | | | 13,153,050 | |
Mercadolibre Incorporated | | | | | | | 202,000 | | | | 19,753,580 | |
| | | | |
| | | | | | | | | | | 88,126,633 | |
| | | | | | | | | | | | |
| | | | |
| IT Services: 4.04% | | | | | | | | | | | | |
Alliance Data Systems Corporation † | | | | | | | 80,600 | | | | 10,217,726 | |
Gartner Incorporated † | | | | | | | 720,396 | | | | 30,717,685 | |
ServiceSource International Incorporated Ǡ | | | | | | | 943,810 | | | | 14,610,179 | |
| | | | |
| | | | | | | | | | | 55,545,590 | |
| | | | | | | | | | | | |
| | | | |
| Semiconductors & Semiconductor Equipment: 3.90% | | | | | | | | | | | | |
Avago Technologies Limited | | | | | | | 426,800 | | | | 16,632,396 | |
Ceva Incorporated Ǡ | | | | | | | 462,900 | | | | 10,512,459 | |
EZchip Semiconductor Limited Ǡ | | | | | | | 277,500 | | | | 12,024,075 | |
LSI Corporation † | | | | | | | 1,655,900 | | | | 14,373,212 | |
| | | | |
| | | | | | | | | | | 53,542,142 | |
| | | | | | | | | | | | |
| | | | |
| Software: 9.05% | | | | | | | | | | | | |
Aspen Technology Incorporated † | | | | | | | 1,019,000 | | | | 20,920,070 | |
Autodesk Incorporated † | | | | | | | 425,800 | | | | 18,019,856 | |
Broadsoft Incorporated Ǡ | | | | | | | 689,900 | | | | 26,388,675 | |
CommVault Systems Incorporated † | | | | | | | 13,634 | | | | 669,001 | |
Fortinet Incorporated † | | | | | | | 824,455 | | | | 22,796,181 | |
Qlik Technologies Incorporated † | | | | | | | 426,491 | | | | 13,647,712 | |
TIBCO Software Incorporated † | | | | | | | 718,271 | | | | 21,907,266 | |
| | | | |
| | | | | | | | | | | 124,348,761 | |
| | | | | | | | | | | | |
| | | | |
Materials: 2.64% | | | | | | | | | | | | |
| | | | |
| Chemicals: 2.64% | | | | | | | | | | | | |
Airgas Incorporated | | | | | | | 408,700 | | | | 36,362,039 | |
| | | | | | | | | | | | |
| | | | |
Telecommunication Services: 3.06% | | | | | | | | | | | | |
| | | | |
| Diversified Telecommunication Services: 1.11% | | | | | | | | | | | | |
Iridium Communications Incorporated Ǡ | | | | | | | 1,735,250 | | | | 15,200,790 | |
| | | | | | | | | | | | |
| | | | |
| Wireless Telecommunication Services: 1.95% | | | | | | | | | | | | |
SBA Communications Corporation Class A Ǡ | | | | | | | 528,351 | | | | 26,845,514 | |
| | | | | | | | | | | | |
| | | | |
Total Common Stocks (Cost $1,107,527,600) | | | | | | | | | | | 1,315,859,820 | |
| | | | | | | | | | | | |
| | | | |
| | | | | | | Principal | | | | |
| Other: 0.09% | | | | | | | | | | | | |
Gryphon Funding Limited, Pass-Through Entity (v)(a)(i) | | | | | | $ | 1,710,560 | | | | 478,956 | |
VFNC Corporation, Pass-Through Entity, 0.24% (v)(a)(i)144A± | | | | | | | 1,892,686 | | | | 794,928 | |
| | | | |
Total Other (Cost $521,613) | | | | | | | | | | | 1,273,884 | |
| | | | | | | | | | | | |
The accompanying notes are an integral part of these financial statements.
| | | | |
| 12 | | Wells Fargo Advantage Discovery Fund | | Portfolio of Investments—March 31, 2012 (Unaudited) |
| | | | | | | | | | | | | | |
| Security Name | | Yield | | | | | Shares | | | Value | |
| | | | | | | | | | | | | | |
| | | | |
Short-Term Investments: 23.81% | | | | | | | | | | | | | | |
| | | | |
| Investment Companies: 23.81% | | | | | | | | | | | | | | |
Wells Fargo Advantage Cash Investment Money Market Fund, Select Class (l)(u) | | | 0.10 | % | | | | | 79,239,689 | | | $ | 79,239,689 | |
Wells Fargo Securities Lending Cash Investments, LLC (v)(l)(u)(r) | | | 0.18 | | | | | | 247,892,314 | | | | 247,892,314 | |
| | | | |
Total Short-Term Investments (Cost $327,132,003) | | | | | | | | | | | | | 327,132,003 | |
| | | | | | | | | | | | | | |
| | | | | | | | |
| Total Investments in Securities | | | | | | | | |
| (Cost $1,435,181,216) * | | | 119.70 | % | | | 1,644,265,707 | |
Other Assets and Liabilities, Net | | | (19.70 | ) | | | (270,667,108 | ) |
| | | �� | | | | | |
| Total Net Assets | | | 100.00 | % | | $ | 1,373,598,599 | |
| | | | | | | | |
| « | All or a portion of this security is on loan. |
| † | Non-income earning security |
| (v) | Security represents investment of cash collateral received from securities on loan. |
| (a) | Security is fair valued by the Management Valuation Team, and in certain instances by the Board of Trustees, in accordance with procedures approved by the Board of Trustees. |
| 144A | Security that may be resold to “qualified institutional buyers” under Rule 144A or security offered pursuant to Section 4(2) of the Securities Act of 1933, as amended. |
| ± | Variable rate investment |
| (l) | Investment in an affiliate |
| (u) | Rate shown is the 7-day annualized yield at period end. |
| (r) | The investment company is exempt from registration under Section 3(c)(7) of the 1940 Act. |
| * | Cost for federal income tax purposes is $1,438,994,093 and net unrealized appreciation (depreciation) consists of: |
| | | | |
Gross unrealized appreciation | | $ | 231,089,557 | |
Gross unrealized depreciation | | | (25,817,943 | ) |
| | | | |
Net unrealized appreciation | | $ | 205,271,614 | |
The accompanying notes are an integral part of these financial statements.
| | | | | | |
| Statement of Assets and Liabilities—March 31, 2012 (Unaudited) | | Wells Fargo Advantage Discovery Fund | | | 13 | |
| | | | |
| | | | |
| |
Assets | | | | |
Investments | | | | |
In unaffiliated securities (including securities on loan), at value (see cost below) | | $ | 1,317,133,704 | |
In affiliated securities, at value (see cost below) | | | 327,132,003 | |
| | | | |
Total investments, at value (see cost below) | | | 1,644,265,707 | |
Receivable for investments sold | | | 22,262,073 | |
Receivable for Fund shares sold | | | 29,236,837 | |
Receivable for dividends | | | 270,894 | |
Receivable for securities lending income | | | 658,334 | |
Prepaid expenses and other assets | | | 32,166 | |
| | | | |
Total assets | | | 1,696,726,011 | |
| | | | |
| |
Liabilities | | | | |
Payable for investments purchased | | | 57,982,028 | |
Payable for Fund shares redeemed | | | 15,462,875 | |
Payable upon receipt of securities loaned | | | 248,413,927 | |
Advisory fee payable | | | 788,861 | |
Distribution fees payable | | | 6,111 | |
Due to other related parties | | | 248,591 | |
Accrued expenses and other liabilities | | | 225,019 | |
| | | | |
Total liabilities | | | 323,127,412 | |
| | | | |
Total net assets | | $ | 1,373,598,599 | |
| | | | |
| |
NET ASSETS CONSIST OF | | | | |
Paid-in capital | | $ | 1,084,826,654 | |
Undistributed net investment loss | | | (2,758,091 | ) |
Accumulated net realized gains on investments | | | 82,445,545 | |
Net unrealized gains on investments | | | 209,084,491 | |
| | | | |
Total net assets | | $ | 1,373,598,599 | |
| | | | |
| |
COMPUTATION OF NET ASSET VALUE AND OFFERING PRICE PER SHARE1 | | | | |
Net assets – Class A | | $ | 76,447,352 | |
Shares outstanding – Class A | | | 2,808,172 | |
Net asset value per share – Class A | | | $27.22 | |
Maximum offering price per share – Class A2 | | | $28.88 | |
Net assets – Class C | | $ | 10,428,357 | |
Shares outstanding – Class C | | | 397,987 | |
Net asset value per share – Class C | | | $26.20 | |
Net assets – Administrator Class | | $ | 431,430,108 | |
Shares outstanding – Administrator Class | | | 15,617,716 | |
Net asset value per share – Administrator Class | | | $27.62 | |
Net assets – Institutional Class | | $ | 428,865,015 | |
Shares outstanding – Institutional Class | | | 15,307,709 | |
Net asset value per share – Institutional Class | | | $28.02 | |
Net assets – Investor Class | | $ | 426,427,767 | |
Shares outstanding – Investor Class | | | 15,734,007 | |
Net asset value per share – Investor Class | | | $27.10 | |
| |
Investments in unaffiliated securities, at cost | | $ | 1,108,049,213 | |
| | | | |
Investments in affiliated securities, at cost | | $ | 327,132,003 | |
| | | | |
Total investments, at cost | | $ | 1,435,181,216 | |
| | | | |
Securities on loan, at value | | $ | 242,492,407 | |
| | | | |
| 1. | The Fund has an unlimited number of authorized shares. |
| 2. | Maximum offering price is computed as 100/94.25 of net asset value. On investments of $50,000 or more, the offering price is reduced. |
The accompanying notes are an integral part of these financial statements.
| | | | |
| 14 | | Wells Fargo Advantage Discovery Fund | | Statement of Operations—Six Months Ended March 31, 2012 (Unaudited) |
| | | | |
| | | | |
| |
Investment income | | | | |
Dividends* | | $ | 1,488,896 | |
Securities lending income, net | | | 1,813,885 | |
Income from affiliated securities | | | 20,511 | |
| | | | |
Total investment income | | | 3,323,292 | |
| | | | |
| |
Expenses | | | | |
Advisory fee | | | 3,915,309 | |
Administration fees | | | | |
Fund level | | | 273,057 | |
Class A | | | 70,519 | |
Class C | | | 8,801 | |
Administrator Class | | | 173,214 | |
Institutional Class | | | 136,207 | |
Investor Class | | | 568,040 | |
Shareholder servicing fees | | | | |
Class A | | | 67,807 | |
Class C | | | 8,462 | |
Administrator Class | | | 431,947 | |
Investor Class | | | 430,333 | |
Distribution fees | | | | |
Class C | | | 25,386 | |
Custody and accounting fees | | | 34,832 | |
Professional fees | | | 7,861 | |
Registration fees | | | 40,726 | |
Shareholder report expenses | | | 37,415 | |
Trustees’ fees and expenses | | | 7,841 | |
Other fees and expenses | | | 15,339 | |
| | | | |
Total expenses | | | 6,253,096 | |
Less: Fee waivers and/or expense reimbursements | | | (172,336 | ) |
| | | | |
Net expenses | | | 6,080,760 | |
| | | | |
Net investment loss | | | (2,757,468 | ) |
| | | | |
| |
REALIZED AND UNREALIZED GAINS (LOSSES) ON INVESTMENTS | | | | |
Net realized gains on investments | | | 93,699,698 | |
Net change in unrealized gains (losses) on investments | | | 215,985,439 | |
| | | | |
Net realized and unrealized gains (losses) on investments | | | 309,685,137 | |
| | | | |
Net increase in net assets resulting from operations | | $ | 306,927,669 | |
| | | | |
| |
* Net of foreign dividend withholding taxes of | | | $12,432 | |
The accompanying notes are an integral part of these financial statements.
| | | | | | |
| Statements of Changes in Net Assets | | Wells Fargo Advantage Discovery Fund | | | 15 | |
| | | | | | | | | | | | | | | | |
| | | Six Months Ended
March 31, 2012
(Unaudited) | | | Year Ended
September 30, 2011 | |
| | | | |
Operations | | | | | | | | | | | | | | | | |
Net investment loss | | | | | | $ | (2,757,468 | ) | | | | | | $ | (5,531,512 | ) |
Net realized gains on investments | | | | | | | 93,699,698 | | | | | | | | 94,566,284 | |
Net change in unrealized gains (losses) on investments | | | | | | | 215,985,439 | | | | | | | | (113,827,336 | ) |
| | | | | | | | | | | | | | | | |
Net increase (decrease) in net assets resulting from operations | | | | | | | 306,927,669 | | | | | | | | (24,792,564 | ) |
| | | | | | | | | | | | | | | | |
| | | | |
Distributions to shareholders from | | | | | | | | | | | | | | | | |
Net realized gains | | | | | | | | | | | | | | | | |
Class A | | | | | | | (1,927,768 | ) | | | | | | | 0 | |
Class C | | | | | | | (248,530 | ) | | | | | | | 0 | |
Administrator Class | | | | | | | (14,784,852 | ) | | | | | | | 0 | |
Institutional Class | | | | | | | (12,862,945 | ) | | | | | | | 0 | |
Investor Class | | | | | | | (13,211,150 | ) | | | | | | | 0 | |
| | | | | | | | | | | | | | | | |
Total distributions to shareholders | | | | | | | (43,035,245 | ) | | | | | | | 0 | |
| | | | | | | | | | | | | | | | |
| | | | |
Capital share transactions | | | Shares | | | | | | | | Shares | | | | | |
Proceeds from shares sold | | | | | | | | | | | | | | | | |
Class A | | | 1,164,398 | | | | 29,225,209 | | | | 1,095,297 | | | | 27,452,345 | |
Class C | | | 174,192 | | | | 4,345,422 | | | | 148,549 | | | | 3,590,156 | |
Administrator Class | | | 7,169,862 | | | | 171,891,838 | | | | 5,191,652 | | | | 126,543,495 | |
Institutional Class | | | 3,792,356 | | | | 99,328,221 | | | | 9,263,173 | | | | 222,854,410 | |
Investor Class | | | 3,895,725 | | | | 98,386,399 | | | | 6,857,139 | | | | 169,186,037 | |
| | | | | | | | | | | | | | | | |
| | | | | | | 403,177,089 | | | | | | | | 549,626,443 | |
| | | | | | | | | | | | | | | | |
Reinvestment of distributions | | | | | | | | | | | | | | | | |
Class A | | | 77,157 | | | | 1,858,725 | | | | 0 | | | | 0 | |
Class C | | | 9,308 | | | | 216,331 | | | | 0 | | | | 0 | |
Administrator Class | | | 571,489 | | | | 13,967,192 | | | | 0 | | | | 0 | |
Institutional Class | | | 458,139 | | | | 11,348,097 | | | | 0 | | | | 0 | |
Investor Class | | | 535,087 | | | | 12,836,737 | | | | 0 | | | | 0 | |
| | | | | | | | | | | | | | | | |
| | | | | | | 40,227,082 | | | | | | | | 0 | |
| | | | | | | | | | | | | | | | |
Payment for shares redeemed | | | | | | | | | | | | | | | | |
Class A | | | (390,887 | ) | | | (9,178,340 | ) | | | (386,635 | ) | | | (9,369,870 | ) |
Class C | | | (39,243 | ) | | | (918,084 | ) | | | (47,396 | ) | | | (1,103,405 | ) |
Administrator Class | | | (1,604,380 | ) | | | (41,460,542 | ) | | | (1,559,935 | ) | | | (38,591,381 | ) |
Institutional Class | | | (1,535,560 | ) | | | (38,986,054 | ) | | | (2,131,822 | ) | | | (49,902,368 | ) |
Investor Class | | | (1,939,897 | ) | | | (47,441,225 | ) | | | (6,571,868 | ) | | | (157,069,883 | ) |
| | | | | | | | | | | | | | | | |
| | | | | | | (137,984,245 | ) | | | | | | | (256,036,907 | ) |
| | | | | | | | | | | | | | | | |
Net asset value of shares issued in acquisition | | | | | | | | | | | | | | | | |
Class A | | | 0 | | | | 0 | | | | 889,490 | | | | 19,144,806 | |
Class C | | | 0 | | | | 0 | | | | 1,860 | | | | 38,754 | |
Administrator Class | | | 0 | | | | 0 | | | | 7,885 | | | | 172,065 | |
Institutional Class | | | 0 | | | | 0 | | | | 129,416 | | | | 2,857,998 | |
| | | | | | | | | | | | | | | | |
| | | | | | | 0 | | | | | | | | 22,213,623 | |
| | | | | | | | | | | | | | | | |
Net increase in net assets resulting
from capital share transactions | | | | | | | 305,419,926 | | | | | | | | 315,803,159 | |
| | | | | | | | | | | | | | | | |
Total increase in net assets | | | | | | | 569,312,350 | | | | | | | | 291,010,595 | |
| | | | | | | | | | | | | | | | |
| | | | |
Net assets | | | | | | | | | | | | | | | | |
Beginning of period | | | | | | | 804,286,249 | | | | | | | | 513,275,654 | |
| | | | | | | | | | | | | | | | |
End of period | | | | | | $ | 1,373,598,599 | | | | | | | $ | 804,286,249 | |
| | | | | | | | | | | | | | | | |
Undistributed net investment loss | | | | | | $ | (2,758,091 | ) | | | | | | $ | (623 | ) |
| | | | | | | | | | | | | | | | |
The accompanying notes are an integral part of these financial statements.
| | | | |
| 16 | | Wells Fargo Advantage Discovery Fund | | Financial Highlights |
(For a share outstanding throughout each period)
| | | | | | | | | | | | | | | | | | | | | | | | |
| | | Six Months Ended
March 31, 2012 (Unaudited) | | | Year Ended September 30, | | | Year Ended October 31, | |
| Class A | | | 2011 | | | 20101 | | | 2009 | | | 2008 | | | 20072 | |
Net asset value, beginning of period | | $ | 21.20 | | | $ | 20.71 | | | $ | 15.69 | | | $ | 14.52 | | | $ | 28.07 | | | $ | 25.25 | |
Net investment loss | | | (0.07 | )3 | | | (0.21 | )3 | | | (0.18 | ) | | | (0.09 | )3 | | | (0.17 | )3 | | | (0.06 | )3 |
Net realized and unrealized gains (losses) on investments | | | 7.08 | | | | 0.70 | | | | 5.20 | | | | 1.26 | | | | (9.40 | ) | | | 2.88 | |
| | | | | | | | | | | | | | | | | | | | | | | | |
Total from investment operations | | | 7.01 | | | | 0.49 | | | | 5.02 | | | | 1.17 | | | | (9.57 | ) | | | 2.82 | |
Distributions to shareholders from | | | | | | | | | | | | | | | | | | | | | | | | |
Net realized gains | | | (0.99 | ) | | | 0.00 | | | | 0.00 | | | | 0.00 | | | | (3.98 | ) | | | 0.00 | |
Net asset value, end of period | | $ | 27.22 | | | $ | 21.20 | | | $ | 20.71 | | | $ | 15.69 | | | $ | 14.52 | | | $ | 28.07 | |
Total return4 | | | 33.67 | % | | | 2.37 | % | | | 31.99 | % | | | 8.06 | % | | | (39.00 | )% | | | 11.17 | % |
Ratios to average net assets (annualized) | | | | | | | | | | | | | | | | | | | | | | | | |
Gross expenses | | | 1.30 | % | | | 1.34 | % | | | 1.37 | % | | | 1.43 | % | | | 1.41 | % | | | 1.38 | % |
Net expenses | | | 1.22 | % | | | 1.30 | % | | | 1.33 | % | | | 1.33 | % | | | 1.33 | % | | | 1.30 | % |
Net investment loss | | | (0.60 | )% | | | (0.86 | )% | | | (0.97 | )% | | | (0.68 | )% | | | (0.85 | )% | | | (0.87 | )% |
Supplemental data | | | | | | | | | | | | | | | | | | | | | | | | |
Portfolio turnover rate | | | 58 | % | | | 111 | % | | | 93 | % | | | 221 | % | | | 153 | % | | | 137 | % |
Net assets, end of period (000’s omitted) | | | $76,447 | | | | $41,507 | | | | $7,442 | | | | $3,750 | | | | $3,150 | | | | $220 | |
| 1. | For the eleven months ended September 30, 2010. The Fund changed its fiscal year end from October 31 to September 30, effective September 30, 2010. |
| 2. | For the period from July 31, 2007 (commencement of class operations) to October 31, 2007 |
| 3. | Calculated based upon average shares outstanding |
| 4. | Total return calculations do not include any sales charges. Returns for periods of less than one year are not annualized. |
The accompanying notes are an integral part of these financial statements.
| | | | | | |
| Financial Highlights | | Wells Fargo Advantage Discovery Fund | | | 17 | |
(For a share outstanding throughout each period)
| | | | | | | | | | | | | | | | | | | | | | | | |
| | | Six Months Ended
March 31, 2012 (Unaudited) | | | Year Ended September 30, | | | Year Ended October 31, | |
| Class C | | | 2011 | | | 20101 | | | 2009 | | | 2008 | | | 20072 | |
Net asset value, beginning of period | | $ | 20.51 | | | $ | 20.19 | | | $ | 15.41 | | | $ | 14.36 | | | $ | 28.04 | | | $ | 25.25 | |
Net investment loss | | | (0.16 | )3 | | | (0.38 | )3 | | | (0.29 | ) | | | (0.20 | )3 | | | (0.32 | )3 | | | (0.19 | )3 |
Net realized and unrealized gains (losses) on investments | | | 6.84 | | | | 0.70 | | | | 5.07 | | | | 1.25 | | | | (9.38 | ) | | | 2.98 | |
| | | | | | | | | | | | | | | | | | | | | | | | |
Total from investment operations | | | 6.68 | | | | 0.32 | | | | 4.78 | | | | 1.05 | | | | (9.70 | ) | | | 2.79 | |
Distributions to shareholders from | | | | | | | | | | | | | | | | | | | | | | | | |
Net realized gains | | | (0.99 | ) | | | 0.00 | | | | 0.00 | | | | 0.00 | | | | (3.98 | ) | | | 0.00 | |
Net asset value, end of period | | $ | 26.20 | | | $ | 20.51 | | | $ | 20.19 | | | $ | 15.41 | | | $ | 14.36 | | | $ | 28.04 | |
Total return4 | | | 33.19 | % | | | 1.59 | % | | | 31.10 | % | | | 7.24 | % | | | (39.57 | )% | | | 11.05 | % |
Ratios to average net assets (annualized) | | | | | | | | | | | | | | | | | | | | | | | | |
Gross expenses | | | 2.06 | % | | | 2.09 | % | | | 2.13 | % | | | 2.18 | % | | | 2.18 | % | | | 2.02 | % |
Net expenses | | | 1.97 | % | | | 2.07 | % | | | 2.08 | % | | | 2.08 | % | | | 2.08 | % | | | 1.88 | % |
Net investment loss | | | (1.35 | )% | | | (1.62 | )% | | | (1.73 | )% | | | (1.47 | )% | | | (1.59 | )% | | | (2.85 | )% |
Supplemental data | | | | | | | | | | | | | | | | | | | | | | | | |
Portfolio turnover rate | | | 58 | % | | | 111 | % | | | 93 | % | | | 221 | % | | | 153 | % | | | 137 | % |
Net assets, end of period (000’s omitted) | | | $10,428 | | | | $5,205 | | | | $3,043 | | | | $2,334 | | | | $1,471 | | | | $362 | |
| 1. | For the eleven months ended September 30, 2010. The Fund changed its fiscal year end from October 31 to September 30, effective September 30, 2010. |
| 2. | For the period from July 31, 2007 (commencement of class operations) to October 31, 2007 |
| 3. | Calculated based upon average shares outstanding |
| 4. | Total return calculations do not include any sales charges. Returns for periods of less than one year are not annualized. |
The accompanying notes are an integral part of these financial statements.
| | | | |
| 18 | | Wells Fargo Advantage Discovery Fund | | Financial Highlights |
(For a share outstanding throughout each period)
| | | | | | | | | | | | | | | | | | | | | | | | | | | | |
| | | Six Months Ended
March 31, 2012 (Unaudited) | | | Year Ended September 30, | | | Year Ended October 31, | |
| Administrator Class | | | 2011 | | | 20101 | | | 2009 | | | 2008 | | | 2007 | | | 2006 | |
Net asset value, beginning of period | | $ | 21.50 | | | $ | 20.96 | | | $ | 15.86 | | | $ | 14.65 | | | $ | 28.23 | | | $ | 22.42 | | | $ | 20.89 | |
Net investment loss | | | (0.07 | )2 | | | (0.20 | ) | | | (0.13 | ) | | | (0.07 | )2 | | | (0.13 | )2 | | | (0.16 | )2 | | | (0.56 | ) |
Net realized and unrealized gains (losses) on investments | | | 7.18 | | | | 0.74 | | | | 5.23 | | | | 1.28 | | | | (9.47 | ) | | | 7.13 | | | | 3.62 | |
| | | | | | | | | | | | | | | | | | | | | | | | | | | | |
Total from investment operations | | | 7.11 | | | | 0.54 | | | | 5.10 | | | | 1.21 | | | | (9.60 | ) | | | 6.97 | | | | 3.06 | |
Distributions to shareholders from | | | | | | | | | | | | | | | | | | | | | | | | | | | | |
Net realized gains | | | (0.99 | ) | | | 0.00 | | | | 0.00 | | | | 0.00 | | | | (3.98 | ) | | | (1.16 | ) | | | (1.53 | ) |
Net asset value, end of period | | $ | 27.62 | | | $ | 21.50 | | | $ | 20.96 | | | $ | 15.86 | | | $ | 14.65 | | | $ | 28.23 | | | $ | 22.42 | |
Total return3 | | | 33.67 | % | | | 2.58 | % | | | 32.16 | % | | | 8.26 | % | | | (38.87 | )% | | | 32.49 | % | | | 15.22 | % |
Ratios to average net assets (annualized) | | | | | | | | | | | | | | | | | | | | | | | | | | | | |
Gross expenses | | | 1.14 | % | | | 1.17 | % | | | 1.20 | % | | | 1.25 | % | | | 1.24 | % | | | 1.22 | % | | | 1.25 | % |
Net expenses | | | 1.14 | % | | | 1.15 | % | | | 1.15 | % | | | 1.15 | % | | | 1.15 | % | | | 1.15 | % | | | 1.15 | % |
Net investment loss | | | (0.52 | )% | | | (0.70 | )% | | | (0.81 | )% | | | (0.52 | )% | | | (0.62 | )% | | | (0.65 | )% | | | (0.69 | )% |
Supplemental data | | | | | | | | | | | | | | | | | | | | | | | | | | | | |
Portfolio turnover rate | | | 58 | % | | | 111 | % | | | 93 | % | | | 221 | % | | | 153 | % | | | 137 | % | | | 120 | % |
Net assets, end of period (000’s omitted) | | | $431,430 | | | | $203,820 | | | | $122,451 | | | | $103,576 | | | | $82,359 | | | | $122,576 | | | | $68,374 | |
| 1. | For the eleven months ended September 30, 2010. The Fund changed its fiscal year end from October 31 to September 30, effective September 30, 2010. |
| 2. | Calculated based upon average shares outstanding |
| 3. | Returns for periods of less than one year are not annualized. |
The accompanying notes are an integral part of these financial statements.
| | | | | | |
| Financial Highlights | | Wells Fargo Advantage Discovery Fund | | | 19 | |
(For a share outstanding throughout each period)
| | | | | | | | | | | | | | | | | | | | | | | | | | | | |
| | | Six Months Ended
March 31, 2012 (Unaudited) | | | Year Ended September 30, | | | Year Ended October 31, | |
| Institutional Class | | | 2011 | | | 20101 | | | 2009 | | | 2008 | | | 2007 | | | 20062 | |
Net asset value, beginning of period | | $ | 21.76 | | | $ | 21.17 | | | $ | 15.99 | | | $ | 14.73 | | | $ | 28.31 | | | $ | 22.43 | | | $ | 21.42 | |
Net investment loss | | | (0.05 | ) | | | (0.14 | ) | | | (0.11 | ) | | | (0.05 | )3 | | | (0.09 | )3 | | | (0.08 | )3 | | | (0.01 | ) |
Net realized and unrealized gains (losses) on investments | | | 7.30 | | | | 0.73 | | | | 5.29 | | | | 1.31 | | | | (9.51 | ) | | | 7.12 | | | | 1.02 | |
| | | | | | | | | | | | | | | | | | | | | | | | | | | | |
Total from investment operations | | | 7.25 | | | | 0.59 | | | | 5.18 | | | | 1.26 | | | | (9.60 | ) | | | 7.04 | | | | 1.01 | |
Distributions to shareholders from | | | | | | | | | | | | | | | | | | | | | | | | | | | | |
Net realized gains | | | (0.99 | ) | | | 0.00 | | | | 0.00 | | | | 0.00 | | | | (3.98 | ) | | | (1.16 | ) | | | 0.00 | |
Net asset value, end of period | | $ | 28.02 | | | $ | 21.76 | | | $ | 21.17 | | | $ | 15.99 | | | $ | 14.73 | | | $ | 28.31 | | | $ | 22.43 | |
Total return4 | | | 33.92 | % | | | 2.79 | % | | | 32.48 | % | | | 8.49 | % | | | (38.74 | )% | | | 32.80 | % | | | 4.72 | % |
Ratios to average net assets (annualized) | | | | | | | | | | | | | | | | | | | | | | | | | | | | |
Gross expenses | | | 0.87 | % | | | 0.91 | % | | | 0.93 | % | | | 0.96 | % | | | 1.00 | % | | | 0.96 | % | | | 0.87 | % |
Net expenses | | | 0.87 | % | | | 0.90 | % | | | 0.93 | % | | | 0.95 | % | | | 0.95 | % | | | 0.95 | % | | | 0.87 | % |
Net investment loss | | | (0.27 | )% | | | (0.45 | )% | | | (0.58 | )% | | | (0.37 | )% | | | (0.45 | )% | | | (0.32 | )% | | | (0.37 | )% |
Supplemental data | | | | | | | | | | | | | | | | | | | | | | | | | | | | |
Portfolio turnover rate | | | 58 | % | | | 111 | % | | | 93 | % | | | 221 | % | | | 153 | % | | | 137 | % | | | 120 | % |
Net assets, end of period (000’s omitted) | | | $428,865 | | | | $274,039 | | | | $112,874 | | | | $68,395 | | | | $23,455 | | | | $6,359 | | | | $10 | |
| 1. | For the eleven months ended September 30, 2010. The Fund changed its fiscal year end from October 31 to September 30, effective September 30, 2010. |
| 2. | For the period from August 31, 2006 (commencement of class operations) to October 31, 2007 |
| 3. | Calculated based upon average shares outstanding |
| 4. | Returns for periods of less than one year are not annualized. |
The accompanying notes are an integral part of these financial statements.
| | | | |
| 20 | | Wells Fargo Advantage Discovery Fund | | Financial Highlights |
(For a share outstanding throughout each period)
| | | | | | | | | | | | | | | | | | | | | | | | | | | | |
| | | Six Months Ended
March 31, 2012 (Unaudited) | | | Year Ended September 30, | | | Year Ended October 31, | |
| Investor Class | | | 2011 | | | 20101 | | | 2009 | | | 2008 | | | 2007 | | | 2006 | |
Net asset value, beginning of period | | $ | 21.12 | | | $ | 20.64 | | | $ | 15.65 | | | $ | 14.49 | | | $ | 28.02 | | | $ | 22.31 | | | $ | 20.84 | |
Net investment loss | | | (0.08 | )2 | | | (0.24 | ) | | | (0.14 | ) | | | (0.10 | )2 | | | (0.18 | )2 | | | (0.22 | )2 | | | (0.20 | ) |
Net realized and unrealized gains (losses) on investments | | | 7.05 | | | | 0.72 | | | | 5.13 | | | | 1.26 | | | | (9.37 | ) | | | 7.09 | | | | 3.20 | |
| | | | | | | | | | | | | | | | | | | | | | | | | | | | |
Total from investment operations | | | 6.97 | | | | 0.48 | | | | 4.99 | | | | 1.16 | | | | (9.55 | ) | | | 6.87 | | | | 3.00 | |
Distributions to shareholders from | | | | | | | | | | | | | | | | | | | | | | | | | | | | |
Net realized gains | | | (0.99 | ) | | | 0.00 | | | | 0.00 | | | | 0.00 | | | | (3.98 | ) | | | (1.16 | ) | | | (1.53 | ) |
Net asset value, end of period | | $ | 27.10 | | | $ | 21.12 | | | $ | 20.64 | | | $ | 15.65 | | | $ | 14.49 | | | $ | 28.02 | | | $ | 22.31 | |
Total return3 | | | 33.61 | % | | | 2.33 | % | | | 31.89 | % | | | 8.01 | % | | | (39.00 | )% | | | 32.19 | % | | | 14.96 | % |
Ratios to average net assets (annualized) | | | | | | | | | | | | | | | | | | | | | | | | | | | | |
Gross expenses | | | 1.37 | % | | | 1.40 | % | | | 1.47 | % | | | 1.53 | % | | | 1.56 | % | | | 1.57 | % | | | 1.58 | % |
Net expenses | | | 1.29 | % | | | 1.37 | % | | | 1.38 | % | | | 1.38 | % | | | 1.38 | % | | | 1.38 | % | | | 1.38 | % |
Net investment loss | | | (0.68 | )% | | | (0.93 | )% | | | (1.03 | )% | | | (0.74 | )% | | | (0.84 | )% | | | (0.89 | )% | | | (0.91 | )% |
Supplemental data | | | | | | | | | | | | | | | | | | | | | | | | | | | | |
Portfolio turnover rate | | | 58 | % | | | 111 | % | | | 93 | % | | | 221 | % | | | 153 | % | | | 137 | % | | | 120 | % |
Net assets, end of period (000’s omitted) | | | $426,428 | | | | $279,715 | | | | $267,466 | | | | $180,898 | | | | $179,913 | | | | $309,759 | | | | $218,187 | |
| 1. | For the eleven months ended September 30, 2010. The Fund changed its fiscal year end from October 31 to September 30, effective September 30, 2010. |
| 2. | Calculated based upon average shares outstanding |
| 3. | Returns for periods of less than one year are not annualized. |
The accompanying notes are an integral part of these financial statements.
| | | | | | |
| Notes to Financial Statements (Unaudited) | | Wells Fargo Advantage Discovery Fund | | | 21 | |
1. ORGANIZATION
Wells Fargo Funds Trust (the “Trust”), a Delaware statutory trust organized on March 10, 1999, is an open-end management investment company registered under the Investment Company Act of 1940, as amended (the “1940 Act”). These financial statements report on Wells Fargo Advantage Discovery Fund (the “Fund”) which is a diversified series of the Trust.
2. SIGNIFICANT ACCOUNTING POLICIES
The following significant accounting policies, which are consistently followed in the preparation of the financial statements of the Fund, are in conformity with U.S. generally accepted accounting principles which require management to make estimates and assumptions that affect the reported amounts of assets and liabilities, disclosure of contingent assets and liabilities at the date of the financial statements, and the reported amounts of revenues and expenses during the reporting period. Actual results could differ from those estimates.
Securities valuation
Investments in equity securities are valued each business day as of the close of regular trading on the New York Stock Exchange, which is usually 4:00 p.m. (Eastern Time). Securities which are traded on a national or foreign securities exchange are valued at the last reported sales price, except that securities listed on The Nasdaq Stock Market, Inc. (“Nasdaq”) are valued at the Nasdaq Official Closing Price (“NOCP”), and if no NOCP is available, then at the last reported sales price. If no sales price is shown on the Nasdaq, the bid price will be used. In the absence of any sale of securities listed on the Nasdaq, and in the case of other securities (including U.S. Government obligations, but excluding debt securities maturing in 60 days or less), the price will be deemed “stale” and the valuations will be determined in accordance with the Fund’s Fair Value Procedures.
Investments in open-end mutual funds and non-registered investment companies are generally valued at net asset value.
Investments which are not valued using any of the methods discussed above, are valued at their fair value, as determined by procedures established in good faith and approved by the Board of Trustees. The Board of Trustees has established a Valuation Committee comprised of the Trustees and has delegated to it the authority to take any actions regarding the valuation of portfolio securities that the Valuation Committee deems necessary in determining the fair value of portfolio securities, unless the responsibility has been delegated to the Management Valuation Team of Wells Fargo Funds Management, LLC (“Funds Management”). The Board of Trustees retains the authority to make or ratify any valuation decisions or approve any changes to the Fair Value Procedures as it deems appropriate. On a quarterly basis, the Board of Trustees considers for ratification any valuation actions taken by the Valuation Committee or the Management Valuation Team.
Valuations of fair valued prices are compared to the next actual sales price when available, or other appropriate market information to assess the continued appropriateness of the fair valuation methodology used. The securities are fair valued on a day-to-day basis, taking into consideration changes to appropriate market information and any significant changes to the input factors considered in the valuation process until there is a readily available price provided on the exchange or by an independent pricing service. Valuations received from an independent pricing service or broker quotes are periodically validated by comparisons to most recent trades and valuations provided by other independent pricing services in addition to the review of prices by the adviser and/or sub-adviser. Unobservable inputs used in determining fair valuations are identified based on the type of security, taking into consideration factors utilized by market participants in valuing the investment, knowledge about the issuer and the current market environment.
Security loans
The Fund may lend its securities from time to time in order to earn additional income in the form of fees or interest on securities received as collateral or the investment of any cash received as collateral. The Fund continues to receive interest or dividends on the securities loaned. The Fund receives collateral in the form of cash or securities with a value at least equal to the value of the securities on loan. The value of the loaned securities is determined at the close of each business day and any additional required collateral is delivered to the Fund on the next business day. In a securities lending transaction, the net asset value of the Fund will be affected by an increase or decrease in the value of the securities loaned and by an increase or decrease in the value of the instrument in which collateral is invested. The amount of securities lending activity undertaken by the Fund fluctuates from time to time. In the event of default or bankruptcy
| | | | |
| 22 | | Wells Fargo Advantage Discovery Fund | | Notes to Financial Statements (Unaudited) |
by the borrower, the Fund may be prevented from recovering the loaned securities or gaining access to the collateral or may experience delays or costs in doing so. In addition, the investment of any cash collateral received may lose all or part of its value. The Fund has the right under the lending agreement to recover the securities from the borrower on demand.
The Fund lends its securities through an unaffiliated securities lending agent. Cash collateral received in connection with its securities lending transactions is invested in Wells Fargo Securities Lending Cash Investments, LLC (the “Cash Collateral Fund”). The Cash Collateral Fund is exempt from registration under Section 3(c)(7) of the 1940 Act and is managed by Funds Management and is sub-advised by Wells Capital Management Incorporated (“Wells Capital Management”). Funds Management receives an advisory fee starting at 0.05% and declining to 0.01% as the average daily net assets of the Cash Collateral Fund increase. All of the fees received by Funds Management are paid to Wells Capital Management for its services as sub-adviser. The Cash Collateral Fund seeks to provide a positive return compared to the daily Fed Funds Open rate by investing in high-quality, U.S. dollar-denominated short-term money market instruments. Cash Collateral Fund investments are fair valued based upon the amortized cost valuation technique. Income earned from investment in the Cash Collateral Fund is included in securities lending income on the Statement of Operations.
For Wells Fargo Advantage Funds that participated in securities lending activity prior to February 13, 2009, certain structured investment vehicles purchased in a joint account by the former securities lending agent defaulted or were impaired. Certain of the Wells Fargo Advantage Funds still hold ownership interest in these structured investment vehicles, which have since been restructured as pass-through securities. If the Fund holds an ownership interest in such pass-through securities, information regarding this ownership interest can be found in the Portfolio of Investments under the category “Other”.
Security transactions and income recognition
Securities transactions are recorded on a trade date basis. Realized gains or losses are reported on the basis of identified cost of securities delivered.
Dividend income is recognized on the ex-dividend date. Dividend income is recorded net of foreign taxes withheld where recovery of such taxes is not assured.
Distributions to shareholders
Distributions to shareholders from net investment income and net realized gains, if any, are recorded on the ex-dividend date. Such distributions are determined in conformity with income tax regulations, which may differ from generally accepted accounting principles.
Federal and other taxes
The Fund intends to continue to qualify as a regulated investment company by distributing substantially all of its investment company taxable income and any net realized capital gains (after reduction for capital loss carryforwards) sufficient to relieve it from all, or substantially all, federal income taxes. Accordingly, no provision for federal income taxes was required.
The Fund’s income and federal excise tax returns and all financial records supporting those returns for the prior three fiscal years are subject to examination by the federal and Delaware revenue authorities. Management has analyzed the Fund’s tax positions taken on federal, state, and foreign tax returns for all open tax years and does not believe that there are any uncertain tax positions that require recognition of a tax liability.
Under the recently enacted Regulated Investment Company Modernization Act of 2010, the Fund is permitted to carry forward capital losses incurred in taxable years which began after December 22, 2010 for an unlimited period. However, any losses incurred are required to be utilized prior to the losses incurred in pre-enactment taxable years. As a result of this ordering rule, pre-enactment capital loss carryforwards may be more likely to expire unused. Additionally, post-enactment capital losses that are carried forward will retain their character as either short-term or long-term capital losses rather than be considered all short-term as under previous law.
Class allocations
The separate classes of shares offered by the Fund differ principally in applicable sales charges, distribution, shareholder servicing and administration fees. Shareholders of each class bear certain expenses that pertain to that particular class. All shareholders bear the common expenses of the Fund, earn income from the portfolio, and are allocated unrealized gains
| | | | | | |
| Notes to Financial Statements (Unaudited) | | Wells Fargo Advantage Discovery Fund | | | 23 | |
and losses pro rata based on the average daily net assets of each class, without distinction between share classes. Dividends are determined separately for each class based on income and expenses allocable to each class. Realized gains and losses are allocated to each class pro rata based upon the net assets of each class on the date realized. Differences in per share dividend rates generally result from the relative weightings of pro rata income and realized gain allocations and from differences in separate class expenses, including distribution, shareholder servicing and administration fees.
3. FAIR VALUATION MEASUREMENTS
Fair value measurements of investments are determined within a framework that has established a fair value hierarchy based upon the various data inputs utilized in determining the value of the Fund’s investments. The three-level hierarchy gives the highest priority to unadjusted quoted prices in active markets for identical assets or liabilities (Level 1) and the lowest priority to significant unobservable inputs (Level 3). The Fund’s investments are classified within the fair value hierarchy based on the lowest level of input that is significant to the fair value measurement. The inputs are summarized into three broad levels as follows:
| n | | Level 1 – quoted prices in active markets for identical securities |
| n | | Level 2 – other significant observable inputs (including quoted prices for similar securities, interest rates, prepayment speeds, credit risk, etc.) |
| n | | Level 3 – significant unobservable inputs (including the Fund’s own assumptions in determining the fair value of investments) |
The inputs or methodologies used for valuing securities are not necessarily an indication of the risk associated with investing in those securities.
As of March 31, 2012, the inputs used in valuing the Fund’s assets, which are carried at fair value, were as follows:
| | | | | | | | | | | | | | | | |
| Investments in Securities | | Quoted Prices (Level 1) | | | Significant Other
Observable Inputs (Level 2) | | | Significant Unobservable Inputs (Level 3) | | | Total | |
Equity securities | | | | | | | | | | | | | | | | |
Common stocks | | $ | 1,315,859,820 | | | $ | 0 | | | $ | 0 | | | $ | 1,315,859,820 | |
Other | | | 0 | | | | 0 | | | | 1,273,884 | | | | 1,273,884 | |
Short-term investments | | | | | | | | | | | | | | | | |
Investment companies | | | 79,239,689 | | | | 247,892,314 | | | | 0 | | | | 327,132,003 | |
| | | $ | 1,395,099,509 | | | $ | 247,892,314 | | | $ | 1,273,884 | | | $ | 1,644,265,707 | |
Further details on the major security types listed above can be found in the Portfolio of Investments.
Transfers in and transfers out are recognized at the end of the reporting period. For the six months ended March 31, 2012, the Fund did not have any significant transfers into/out of Level 1 and Level 2.
4. TRANSACTIONS WITH AFFILIATES AND OTHER EXPENSES
Advisory fee
The Trust has entered into an advisory contract with Funds Management, an indirect wholly owned subsidiary of Wells Fargo & Company (“Wells Fargo”). The adviser is responsible for implementing investment policies and guidelines and for supervising the sub-adviser, who is responsible for day-to-day portfolio management of the Fund.
Pursuant to the contract, Funds Management is entitled to receive an annual advisory fee starting at 0.75% and declining to 0.60% as the average daily net assets of the Fund increase. For the six months ended March 31, 2012, the advisory fee was equivalent to an annual rate of 0.72% of the Fund’s average daily net assets.
Funds Management has retained the services of certain sub-advisers to provide daily portfolio management to the Fund. The fees related to sub-advisory services are borne directly by Funds Management and do not increase the overall fees paid by the Fund. Wells Capital Management, an affiliate of Funds Management, is the sub-adviser to the Fund and is entitled to receive a fee from Funds Management at an annual rate starting at 0.45% and declining to 0.35% as the average daily net assets of the Fund increase.
| | | | |
| 24 | | Wells Fargo Advantage Discovery Fund | | Notes to Financial Statements (Unaudited) |
Administration and transfer agent fees
The Trust has entered into an administration agreement with Funds Management. Under this agreement, for providing administrative services, which includes paying fees and expenses for services provided by the transfer agent, sub-transfer agents, omnibus account servicers and record-keepers, Funds Management is entitled to receive from the Fund an annual fund level administration fee starting at 0.05% and declining to 0.03% as the average daily net assets of the Fund increase and a class level administration fee which is calculated based on the average daily net assets of each class as follows:
| | | | |
| | | Class Level Administration Fee | |
Class A, Class C | | | 0.26 | % |
Administrator Class | | | 0.10 | |
Institutional Class | | | 0.08 | |
Investor Class | | | 0.33 | |
Funds Management has contractually waived and/or reimbursed advisory and administration fees to the extent necessary to maintain certain net operating expense ratios for the Fund. Waiver of fees and/or reimbursement of expenses by Funds Management were made first from fund level expenses on a proportionate basis and then from class specific expenses. Funds Management has committed through July 18, 2013 to waive fees and/or reimburse expenses to the extent necessary to cap the Fund’s expenses at 1.22% for Class A, 1.97% for Class C, 1.15% for Administrator Class, 0.90% for Institutional Class and 1.29% for Investor Class.
Distribution fees
The Trust has adopted a Distribution Plan for Class C shares of the Fund pursuant to Rule 12b-1 under the 1940 Act. Distribution fees are charged to Class C shares and paid to Wells Fargo Funds Distributor, LLC, the principal underwriter, at an annual rate of 0.75% of the average daily net assets of Class C shares.
For the six months ended March 31, 2012, Wells Fargo Funds Distributor, LLC received $11,256 from the sale of Class A shares and $645 in contingent deferred sales charges from redemptions of Class C shares.
Shareholder servicing fees
The Trust has entered into contracts with one or more shareholder servicing agents, whereby Class A, Class C, Administrator Class and Investor Class of the Fund is charged a fee at an annual rate of 0.25% of the average daily net assets of each respective class.
A portion of these total shareholder servicing fees were paid to affiliates of Wells Fargo.
5. INVESTMENT PORTFOLIO TRANSACTIONS
Purchases and sales of investments, excluding U.S. Government obligations (if any) and short-term securities, for the six months ended March 31, 2012 were $855,103,798 and $616,384,810, respectively.
6. ACQUISITION
After the close of business on August 26, 2011, the Fund acquired the net assets of Wells Fargo Advantage Growth Opportunities Fund. The purpose of the transaction was to combine two funds with similar investment objectives and strategies. Shareholders holding Class A, Class C, Administrator Class and Institutional Class shares of Wells Fargo Advantage Growth Opportunities Fund received Class A, Class C, Administrator Class and Institutional Class shares, respectively, of the Fund in the reorganization. The acquisition was accomplished by a tax-free exchange of all of the shares of Wells Fargo Advantage Growth Opportunities Fund for 1,028,651 shares of the Fund valued at $22,213,623 at an exchange ratio of 0.39, 0.41, 0.39 and 0.39 for Class A, Class C, Administrator Class and Institutional Class shares, respectively. The investment portfolio of Wells Fargo Advantage Growth Opportunities Fund with a fair value of $22,345,279, identified cost of $24,880,014 and unrealized losses of $2,534,735 at August 26, 2011 were the principal assets acquired by the Fund. The aggregate net assets of Wells Fargo Advantage Growth Opportunities Fund and the Fund immediately prior to the acquisition were $22,213,623 and $688,866,341, respectively. The aggregate net assets of the Fund immediately after the acquisition were $711,079,964. For financial reporting purposes, assets received and
| | | | | | |
| Notes to Financial Statements (Unaudited) | | Wells Fargo Advantage Discovery Fund | | | 25 | |
shares issued by the Fund were recorded at fair value; however, the cost basis of the investments received from Wells Fargo Advantage Growth Opportunities Fund was carried forward to align ongoing reporting of the Fund’s realized and unrealized gains and losses with amounts distributable to shareholders for tax purposes.
Assuming the acquisition had been completed October 1, 2010, the beginning of the annual reporting period for the Fund, the pro forma results of operations for the year ended September 30, 2011 would have been:
| | | | |
Net investment loss | | $ | (5,384,715 | ) |
Net realized and unrealized gains (losses) on investments | | $ | (15,881,575 | ) |
Net decrease in net assets resulting from operations | | $ | (21,266,290 | ) |
7. BANK BORROWINGS
The Trust (excluding the money market funds) and Wells Fargo Variable Trust are parties to a $150,000,000 revolving credit agreement with State Street Bank and Trust Company, whereby the Fund is permitted to use bank borrowings for temporary or emergency purposes, such as to fund shareholder redemption requests. Interest under the credit agreement is charged to the Fund based on a borrowing rate equal to the higher of the Federal Funds rate in effect on that day plus 1.25% or the overnight LIBOR rate in effect on that day plus 1.25%. In addition, an annual commitment fee equal to 0.10% of the unused balance is allocated to each participating fund. For the six months ended March 31, 2012, the Fund paid $925 in commitment fees.
For the six months ended March 31, 2012, there were no borrowings by the Fund under the agreement.
8. INDEMNIFICATION
Under the Trust’s organizational documents, the officers and directors are indemnified against certain liabilities that may arise out of performance of their duties to the Trust. Additionally, in the normal course of business, the Trust may enter into contracts with service providers that contain a variety of indemnification clauses. The Trust’s maximum exposure under these arrangements is dependent on future claims that may be made against the Fund and, therefore, cannot be estimated.
9. NEW ACCOUNTING PRONOUNCEMENTS
In December 2011, the Financial Accounting Standards Board (“FASB”) issued Accounting Standard Update (“ASU”) No. 2011-11, Disclosures about Offsetting Assets and Liabilities. ASU 2011-11, which amends FASB ASC Topic 210 Balance Sheet, creates new disclosure requirements which require entities to disclose both gross and net information for derivatives and other financial instruments that are either offset in the Statement of Assets and Liabilities or subject to an enforceable master netting arrangement or similar agreement. The disclosure requirements are effective for interim and annual reporting periods beginning on or after January 1, 2013. Management is currently evaluating the impact of the update’s adoption on the Fund’s financial statement disclosures.
In May 2011, FASB issued ASU No. 2011-04 “Amendments to Achieve Common Fair Value Measurement and Disclosure Requirements in U.S. GAAP and IFRSs”. ASU No. 2011-04 amends FASB ASC Topic 820, Fair Value Measurements and Disclosures, to establish common requirements for measuring fair value and for disclosing information about fair value measurements in accordance with GAAP. The ASU is effective prospectively for interim and annual periods beginning after December 15, 2011. Management expects that adoption of the ASU will result in additional disclosures in the financial statements, as applicable.
In April 2011, FASB issued ASU No. 2011-03 “Reconsideration of Effective Control for Repurchase Agreements”. ASU No. 2011-03 amends FASB ASC Topic 860, Transfers and Servicing, specifically the criteria required to determine whether a repurchase agreement (repo) and similar agreements should be accounted for as sales of financial assets or secured borrowings with commitments. ASU No. 2011-03 changes the assessment of effective control by focusing on the transferor’s contractual rights and obligations and removing the criterion to assess its ability to exercise those rights or honor those obligations. This could result in changes to the way entities account for certain transactions including repurchase agreements, mortgage dollar rolls and reverse repurchase agreements. The ASU will become effective on a prospective basis for new transfers and modifications to existing transactions as of the beginning of the first interim or annual period beginning on or after December 15, 2011. Management has evaluated the impact of adopting the ASU and expects no significant changes.
| | | | |
| 26 | | Wells Fargo Advantage Discovery Fund | | Other Information (Unaudited) |
PROXY VOTING INFORMATION
A description of the policies and procedures that the Fund uses to determine how to vote proxies relating to portfolio securities is available without charge, upon request, by calling 1-800-222-8222, visiting our Web site at wellsfargoadvantagefunds.com, or visiting the SEC Web site at sec.gov. Information regarding how the Fund voted proxies relating to portfolio securities during the most recent 12-month period ended June 30 is available without charge on the Fund’s Web site at wellsfargoadvantagefunds.com or by visiting the SEC Web site at sec.gov.
PORTFOLIO HOLDINGS INFORMATION
The complete portfolio holdings for the Fund are publicly available on the Fund’s Web site (wellsfargoadvantagefunds.com) on a monthly, 30-day or more delayed basis. In addition, top ten holdings information for the Fund is publicly available on the Fund’s Web site on a monthly, seven-day or more delayed basis. The Fund files its complete schedule of portfolio holdings with the SEC for the first and third quarters of each fiscal year on Form N-Q, which is available without charge by visiting the SEC Web site at sec.gov. In addition, the Fund’s Form N-Q may be reviewed and copied at the SEC’s Public Reference Room in Washington, DC, and at regional offices in New York City, at 233 Broadway, and in Chicago, at 175 West Jackson Boulevard, Suite 900. Information about the Public Reference Room may be obtained by calling 1-800-SEC-0330.
| | | | | | |
| Other Information (Unaudited) | | Wells Fargo Advantage Discovery Fund | | | 27 | |
BOARD OF TRUSTEES
The following table provides basic information about the Board of Trustees (the “Trustees”) of the Trust and Officers of the Trust. This table should be read in conjunction with the Prospectus and the Statement of Additional Information1 of the Fund. Each of the Trustees and Officers listed below acts in identical capacities for the Wells Fargo Advantage family of funds, which consists of 137 funds comprising the Wells Fargo Funds Trust, Wells Fargo Variable Trust, Wells Fargo Master Trust and four closed-end funds (collectively the “Fund Complex”). All of the Trustees are also Members of the Audit and Governance Committees of each Trust in the Fund Complex. The mailing address of each Trustee and Officer is 525 Market Street, 12th Floor, San Francisco, CA 94105. Each Trustee and Officer serves an indefinite term, however, each Trustee serves such term until reaching the mandatory retirement age established by the Trustees.
Independent Trustees
| | | | | | |
Name and Year of Birth | | Position Held and Length of Service | | Principal Occupations During Past Five Years | | Other Directorships During
Past Five Years |
Peter G. Gordon
(Born 1942) | | Trustee, since 1998; Chairman, since 2005 (Lead Trustee since 2001) | | Co-Founder, Retired Chairman, President and CEO of Crystal Geyser Water Company. Trustee Emeritus, Colby College | | Asset Allocation Trust |
Isaiah Harris, Jr.
(Born 1952) | | Trustee, since 2009 | | Retired. Prior thereto, President and CEO of BellSouth Advertising and Publishing Corp. from 2005 to 2007, President and CEO of BellSouth Enterprises from 2004 to 2005 and President of BellSouth Consumer Services from 2000 to 2003. Emeritus member of the Iowa State University Foundation Board of Governors. Emeritus Member of the Advisory Board of Iowa State University School of Business. Mr. Harris is a certified public accountant. | | CIGNA Corporation; Deluxe Corporation; Asset Allocation Trust |
Judith M. Johnson
(Born 1949) | | Trustee, since 2008 | | Retired. Prior thereto, Chief Executive Officer and Chief Investment Officer of Minneapolis Employees Retirement Fund from 1996 to 2008. Ms. Johnson is an attorney, certified public accountant and a certified managerial accountant. | | Asset Allocation Trust |
Leroy Keith, Jr.
(Born 1939) | | Trustee, since 2010 | | Chairman, Bloc Global Services (development and construction). Trustee of the Evergreen Funds from 1983 to 2010. Former Managing Director, Almanac Capital Management (commodities firm), former Partner, Stonington Partners, Inc. (private equity fund), former Director, Obagi Medical Products Co. and former Director, Lincoln Educational Services. | | Trustee, Virtus Fund Complex (consisting of 40 portfolios as of 12/31/11); Asset Allocation Trust |
David F. Larcker
(Born 1950) | | Trustee, since 2009 | | James Irvin Miller Professor of Accounting at the Graduate School of Business, Stanford University, Director of Corporate Governance Research Program and Senior Faculty of The Rock Center for Corporate Governance since 2006. From 2005 to 2008, Professor of Accounting at the Graduate School of Business, Stanford University. Prior thereto, Ernst & Young Professor of Accounting at The Wharton School, University of Pennsylvania from 1985 to 2005. | | Asset Allocation Trust |
Olivia S. Mitchell
(Born 1953) | | Trustee, since 2006 | | International Foundation of Employee Benefit Plans Professor, Wharton School of the University of Pennsylvania since 1993. Director of Wharton’s Pension Research Council and Boettner Center on Pensions & Retirement Research, and Research Associate at the National Bureau of Economic Research. Previously, Cornell University Professor from 1978 to 1993. | | Asset Allocation Trust |
| | | | |
| 28 | | Wells Fargo Advantage Discovery Fund | | Other Information (Unaudited) |
| | | | | | |
Name and Year of Birth | | Position Held and Length of Service | | Principal Occupations During Past Five Years | | Other Directorships During
Past Five Years |
Timothy J. Penny
(Born 1951) | | Trustee, since 1996 | | President and CEO of Southern Minnesota Initiative Foundation, a non-profit organization, since 2007 and Senior Fellow at the Humphrey Institute Policy Forum at the University of Minnesota since 1995. Member of the Board of Trustees of NorthStar Education Finance, Inc., a non-profit organization, since 2007. | | Asset Allocation Trust |
Michael S. Scofield
(Born 1943) | | Trustee, since 2010 | | Served on the Investment Company Institute’s Board of Governors and Executive Committee from 2008-2011 as well the Governing Council of the Independent Directors Council from 2006-2011 and the Independent Directors Council Executive Committee from 2008-2011. Chairman of the IDC from 2008-2010. Institutional Investor (Fund Directions) Trustee of Year in 2007. Trustee of the Evergreen Funds (and its predecessors) from 1984 to 2010. Chairman of the Evergreen Funds from 2000-2010. Former Trustee of the Mentor Funds. Retired Attorney, Law Offices of Michael S. Scofield and former Director and Chairman, Branded Media Corporation (multi-media branding company). | | Asset Allocation Trust |
Donald C. Willeke
(Born 1940) | | Trustee, since 1996 | | Principal of the law firm of Willeke & Daniels. General Counsel of the Minneapolis Employees Retirement Fund from 1984 until its consolidation into the Minnesota Public Employees Retirement Association on June 30, 2010. Director and Vice Chair of The Free Trust (non-profit corporation). Director of the American Chestnut Foundation (non-profit corporation). | | Asset Allocation Trust |
Officers
| | | | | | |
Name and Year of Birth | | Position Held and
Length of Service | | Principal Occupations During Past Five Years | | |
Karla M. Rabusch
(Born 1959) | | President, since 2003 | | Executive Vice President of Wells Fargo Bank, N.A. and President of Wells Fargo Funds Management, LLC since 2003. Senior Vice President and Chief Administrative Officer of Wells Fargo Funds Management, LLC from 2001 to 2003. | | |
C. David Messman
(Born 1960) | | Secretary, since 2000; Chief Legal Counsel, since 2003 | | Senior Vice President and Secretary of Wells Fargo Funds Management, LLC since 2001. Vice President and Managing Senior Counsel of Wells Fargo Bank, N.A. since 1996. | | |
Kasey Phillips
(Born 1970) | | Treasurer, since 2009 | | Senior Vice President of Wells Fargo Funds Management, LLC since 2009. Senior Vice President of Evergreen Investment Management Company, LLC from 2006 to 2010. Treasurer of the Evergreen Funds from 2005 to 2010. | | |
David Berardi
(Born 1975) | | Assistant Treasurer, since 2009 | | Vice President of Wells Fargo Funds Management, LLC since 2009. Vice President of Evergreen Investment Management Company, LLC from 2008 to 2010. Assistant Vice President of Evergreen Investment Services, Inc. from 2004 to 2008. Manager of Fund Reporting and Control for Evergreen Investment Management Company, LLC from 2004 to 2010. | | |
Jeremy DePalma
(Born 1974) | | Assistant Treasurer, since 2009 | | Senior Vice President of Wells Fargo Funds Management, LLC since 2009. Senior Vice President of Evergreen Investment Management Company, LLC from 2008 to 2010. Vice President, Evergreen Investment Services, Inc. from 2004 to 2007. Head of the Fund Reporting and Control Team within Fund Administration from 2005 to 2010. | | |
Debra Ann Early
(Born 1964) | | Chief Compliance Officer, since 2007 | | Chief Compliance Officer of Wells Fargo Funds Management, LLC since 2007. Chief Compliance Officer of Parnassus Investments from 2005 to 2007. Chief Financial Officer of Parnassus Investments from 2004 to 2007 and Senior Audit Manager of PricewaterhouseCoopers LLP from 1998 to 2004. | | |
| 1. | The Statement of Additional Information includes additional information about the Trustees and is available, without charge, upon request, by calling 1-800-222-8222 or by visiting the Web site at wellsfargoadvantagefunds.com. |
| | | | | | |
| Other Information (Unaudited) | | Wells Fargo Advantage Discovery Fund | | | 29 | |
BOARD CONSIDERATION OF INVESTMENT ADVISORY AND SUB-ADVISORY AGREEMENTS:
Under Section 15 of the Investment Company Act of 1940 (the “1940 Act”), the Board of Trustees (the “Board”) of Wells Fargo Funds Trust (the “Trust”), all the members of which have no direct or indirect interest in the investment advisory and sub-advisory agreements and are not “interested persons” of the Trust, as defined in the 1940 Act (the “Independent Trustees”), must determine whether to approve the continuation of the Trust’s investment advisory and sub-advisory agreements. In this regard, at an in person meeting held on March 29-30, 2012 (the “Meeting”), the Board reviewed and re-approved: (i) an investment advisory agreement with Wells Fargo Funds Management, LLC (“Funds Management”) for Wells Fargo Advantage Discovery Fund (the “Fund”) and (ii) an investment sub-advisory agreement with Wells Capital Management Incorporated (“Wells Capital Management”) for the Fund. The investment advisory agreement with Funds Management and the investment sub-advisory agreement with Wells Capital Management are collectively referred to as the “Advisory Agreements.”
At the Meeting, the Board considered the factors and reached the conclusions described below relating to the selection of Funds Management and Wells Capital Management and the continuation of the Advisory Agreements. Prior to the Meeting, the Trustees conferred extensively among themselves and with representatives of Funds Management about these matters. The Board also met throughout the year and received information that was useful to them in considering the continuation of the Advisory Agreements. The Independent Trustees were assisted in their evaluation of the Advisory Agreements by independent legal counsel, from whom they received separate legal advice and with whom they met separately from Funds Management.
In providing information to the Board, Funds Management and Wells Capital Management were guided by a detailed set of requests submitted by the Independent Trustees’ independent legal counsel on their behalf at the start of the Board’s annual contract renewal process earlier in 2012. In approving the Advisory Agreements, the Board did not identify any particular information or consideration that was all-important or controlling, and each Trustee likely attributed different weights to various factors.
Nature, extent and quality of services
The Board received and considered various information regarding the nature, extent and quality of services provided to the Fund by Funds Management and Wells Capital Management under the Advisory Agreements. The Board also received and considered, among other things, information about the background and experience of senior management of Funds Management, and the qualifications, backgrounds, tenures and responsibilities of the portfolio managers primarily responsible for the day-to-day portfolio management of the Fund.
The Board evaluated the ability of Funds Management and Wells Capital Management, based on their respective financial condition, resources, reputation and other attributes, to attract and retain qualified investment professionals, including research, advisory, and supervisory personnel. The Board further considered the compliance programs and compliance records of Funds Management and Wells Capital Management. In addition, the Board took into account the administrative services provided to the Fund by Funds Management and its affiliates.
The Board’s decision to approve the continuation of the Advisory Agreements was based on a comprehensive evaluation of all of the information provided to it. In considering these matters, the Board considered not only the specific information presented in connection with the Meeting, but also the knowledge gained over time through interaction with Funds Management and Wells Capital Management about various topics, including Funds Management’s oversight of service providers. The above factors, together with those referenced below, are some of the most important, but not necessarily all, factors considered by the Board in concluding that the nature, extent and quality of the investment advisory services provided to the Fund by Funds Management and Wells Capital Management supported the re-approval of the Advisory Agreements. Although the Board considered the continuation of the Advisory Agreements for the Fund as part of the larger process of considering the continuation of the advisory agreements for all of the funds in the complex, its decision to continue the Advisory Agreements for the Fund was ultimately made on a fund-by-fund basis.
Fund performance and expenses
The Board considered the performance results for the Fund over various time periods ended December 31, 2011. The Board also considered these results in comparison to the median performance of a universe of relevant funds (the “Universe”) that was determined by Lipper Inc. (“Lipper”) to be similar to the Fund, and in comparison to the Fund’s
| | | | |
| 30 | | Wells Fargo Advantage Discovery Fund | | Other Information (Unaudited) |
benchmark index and to other comparative data. Lipper is an independent provider of investment company data. The Board received a description of the methodology used by Lipper to select the mutual funds in the Universe. The Board noted that the performance of the Fund was higher than the median performance of the Universe and its benchmark index, the Lipper Mid-Cap Growth Funds Index, for all periods under review.
The Board received and considered information regarding the Fund’s contractual advisory fee and net operating expense ratios and their various components, including actual management fees (which reflect fee waivers, if any), transfer agent, custodian and other non-management fees, Rule 12b-1 and non-Rule 12b-1 fees, service fees and fee waiver and expense reimbursement arrangements. The Board also considered these ratios in comparison to the median ratios of an expense Universe and a narrower expense group of mutual funds (each, an “Expense Group”) that was determined by Lipper to be similar to the Fund. The Board received a description of the methodology used by Lipper to select the mutual funds in the Fund’s Expense Group. The Board noted that the net operating expense ratios of the Fund were in range of the Fund’s Expense Group’s median net operating expense ratios.
Based on the above-referenced considerations and other factors, the Board concluded that the overall performance and expense structure of the Fund supported the re-approval of the Advisory Agreements for the Fund.
Investment advisory and sub-advisory fee rates
The Board reviewed and considered the contractual investment advisory fee rate that is payable by the Fund to Funds Management for investment advisory services (the “Advisory Agreement Rate”), both on a stand-alone basis and on a combined basis with the Fund’s administration fee rate. The Board took into account the separate administrative and other services covered by the administration fee rate. The Board also reviewed and considered the contractual investment sub-advisory fee rate that is payable by Funds Management to Wells Capital Management for investment sub-advisory services (the “Sub-Advisory Agreement Rate”). In addition, the Board reviewed and considered the existing fee waiver/cap arrangements applicable to the Advisory Agreement Rate and considered the Advisory Agreement Rate after taking the waivers/caps into account (the “Net Advisory Rate”).
The Board received and considered information comparing the Advisory Agreement Rate and Net Advisory Rate with those of other funds in the Fund’s Expense Group median. The Board noted that, except for the Administrator class, the Advisory Agreement Rate and Net Advisory Rate for the Fund were higher than the median rates for the Fund’s Expense Group. The Board received a report from Funds Management that noted that the Fund was benefiting from Advisory Agreement Rate breakpoints, the Fund’s expense caps had been lowered the previous year and the expense caps would be extended until January 31, 2014.
The Board also received and considered information about the nature and extent of services offered and fee rates charged by Funds Management and Wells Capital Management to other types of clients. In this regard, the Board received information about differences between the services, and the compliance, reporting, and other legal burdens and risks of providing investment advice to mutual funds and those associated with providing advice to non-mutual fund clients such as collective funds or institutional separate accounts.
The Board determined that the Advisory Agreement Rate for the Fund, both with and without an administration fee rate and before and after waivers, was reasonable in light of the Fund’s Expense Group information, the net expense ratio commitments, the services covered by the Advisory Agreements and other information provided. The Board also reviewed and considered the Sub-Advisory Agreement Rate and concluded that the Sub-Advisory Agreement Rate was reasonable in light of the services covered by the sub-advisory agreement, the sub-advised expense information provided by Lipper, and other information provided.
Profitability
The Board received and considered a profitability analysis of Funds Management, as well as an analysis of the profitability to the collective Wells Fargo businesses that provide services to the Fund. It considered that the information provided to it was necessarily estimated, and that the profitability information provided to it, especially on a fund-by-fund basis, did not necessarily provide a precise tool for evaluating the appropriateness of the Fund’s Advisory Agreement Rate in isolation. It noted that the levels of profitability reported on a fund-by-fund basis varied widely, depending on, among other things, the size and type of fund. The Board concluded that the profitability reported by Funds Management was not unreasonable.
| | | | | | |
| Other Information (Unaudited) | | Wells Fargo Advantage Discovery Fund | | | 31 | |
The Board did not consider separate profitability information with respect to Wells Capital Management, because, as an affiliate of Funds Management, its profitability information was subsumed in the collective Wells Fargo profitability analysis provided by Funds Management.
Economies of scale
With respect to possible economies of scale, the Board reviewed the breakpoints in the Fund’s advisory fee structure, which operate generally to reduce the effective Advisory Agreement Rate of the Fund (as a percentage of Fund assets) as the Fund grows in size. It considered that, as a fund shrinks in size, breakpoints conversely result in increasing fee levels. The Board noted that it would have on-going opportunities to review the appropriate levels of breakpoints in the future, and concluded that the breakpoints as implemented appeared to be a reasonable step toward sharing economies of scale, if any, with the Fund. However, the Board acknowledged the inherent limitations of any analysis of an investment adviser’s economies of scale and of any attempt to correlate breakpoints with such economies, stemming largely from the Board’s understanding that economies of scale are realized, if at all, by an investment adviser across a variety of products and services, not just with respect to a single fund.
Other benefits to Funds Management and Wells Capital Management
The Board received and considered information regarding potential “fall-out” or ancillary benefits received by Funds Management and its affiliates, including Wells Capital Management, as a result of their relationship with the Fund. Ancillary benefits could include, among others, benefits directly attributable to the relationship of Funds Management and Wells Capital Management with the Fund and benefits potentially derived from an increase in Funds Management’s and Wells Capital Management’s business as a result of their relationship with the Fund (such as the ability to market to shareholders other financial products offered by Funds Management and its affiliates, including Wells Capital Management).
The Board considered that Wells Fargo Funds Distributor, LLC, an affiliate of Funds Management, serves as distributor to the Fund and receives certain compensation for those services. The Board noted that various financial institutions, including affiliates of Funds Management, may receive distribution-related fees, shareholder servicing payments (including amounts derived from payments under Rule 12b-1 plans) and sub-transfer agency fees in respect of shares sold or held through them and services provided.
The Board also reviewed information about whether and to what extent soft dollar credits are sought and how any such credits are utilized and any benefits that may be realized by using an affiliated broker.
Other factors and broader review
The Board also considered the markets for distribution of the Fund’s shares, including the channels through which the Fund’s shares are offered and sold. The Board noted that the Fund is part of one of the few fund families that have both direct-to-fund and intermediary distribution channels. As discussed above, the Board reviews detailed materials received from Funds Management and Wells Capital Management annually as part of the re-approval process under Section 15 of the 1940 Act and also reviews and assesses information about the quality of the services that the Fund receives throughout the year. In this regard, the Board has reviewed reports of Funds Management at each of its quarterly meetings, which include, among other things, portfolio reviews and performance reports. In addition, the Board confers with portfolio managers at various times throughout the year.
Conclusion
After considering the above-described factors and based on its deliberations and its evaluation of the information described above, the Board unanimously approved the continuation of the Advisory Agreements for an additional one-year period.
| | | | |
| 32 | | Wells Fargo Advantage Discovery Fund | | List of Abbreviations |
The following is a list of common abbreviations for terms and entities which may have appeared in this report.
| ACB | — Agricultural Credit Bank |
| ADR | — American Depository Receipt |
| ADS | — American Depository Shares |
| AGC-ICC | — Assured Guaranty Corporation - Insured Custody Certificates |
| AGM | — Assured Guaranty Municipal |
| AMBAC | — American Municipal Bond Assurance Corporation |
| AMT | — Alternative Minimum Tax |
| BAN | — Bond Anticipation Notes |
| BHAC | — Berkshire Hathaway Assurance Corporation |
| CAB | — Capital Appreciation Bond |
| CCAB | — Convertible Capital Appreciation Bond |
| CDA | — Community Development Authority |
| CDO | — Collateralized Debt Obligation |
| COP | — Certificate of Participation |
| DRIVER | — Derivative Inverse Tax-Exempt Receipts |
| DW&P | — Department of Water & Power |
| DWR | — Department of Water Resources |
| ECFA | — Educational & Cultural Facilities Authority |
| EDA | — Economic Development Authority |
| EDFA | — Economic Development Finance Authority |
| ETF | — Exchange-Traded Fund |
| FFCB | — Federal Farm Credit Bank |
| FGIC | — Financial Guaranty Insurance Corporation |
| FHA | — Federal Housing Authority |
| FHLB | — Federal Home Loan Bank |
| FHLMC | — Federal Home Loan Mortgage Corporation |
| FICO | — The Financing Corporation |
| FNMA | — Federal National Mortgage Association |
| GDR | — Global Depository Receipt |
| GNMA | — Government National Mortgage Association |
| HCFR | — Healthcare Facilities Revenue |
| HEFA | — Health & Educational Facilities Authority |
| HEFAR | — Higher Education Facilities Authority Revenue |
| HFA | — Housing Finance Authority |
| HFFA | — Health Facilities Financing Authority |
| IBC | — Insured Bond Certificate |
| IDA | — Industrial Development Authority |
| IDAG | — Industrial Development Agency |
| IDR | — Industrial Development Revenue |
| KRW | — Republic of Korea Won |
| LIBOR | — London Interbank Offered Rate |
| LLC | — Limited Liability Company |
| LLP | — Limited Liability Partnership |
| MBIA | — Municipal Bond Insurance Association |
| MFHR | — Multi-Family Housing Revenue |
| MSTR | — Municipal Securities Trust Receipts |
| MUD | — Municipal Utility District |
| NATL-RE | — National Public Finance Guarantee Corporation |
| PCFA | — Pollution Control Finance Authority |
| PCR | — Pollution Control Revenue |
| PFA | — Public Finance Authority |
| PFFA | — Public Facilities Financing Authority |
| PFOTER | — Puttable Floating Option Tax-Exempt Receipts |
| plc | — Public Limited Company |
| PUTTER | — Puttable Tax-Exempt Receipts |
| R&D | — Research & Development |
| RDA | — Redevelopment Authority |
| RDFA | — Redevelopment Finance Authority |
| REIT | — Real Estate Investment Trust |
| ROC | — Reset Option Certificates |
| SAVRS | — Select Auction Variable Rate Securities |
| SBA | — Small Business Authority |
| SFHR | — Single Family Housing Revenue |
| SFMR | — Single Family Mortgage Revenue |
| SPDR | — Standard & Poor’s Depositary Receipts |
| STRIPS | — Separate Trading of Registered Interest and Principal Securities |
| TAN | — Tax Anticipation Notes |
| TIPS | — Treasury Inflation-Protected Securities |
| TRAN | — Tax Revenue Anticipation Notes |
| TCR | — Transferable Custody Receipts |
| TTFA | — Transportation Trust Fund Authority |
| TVA | — Tennessee Valley Authority |
| XLCA | — XL Capital Assurance |
This page is intentionally left blank.
This page is intentionally left blank.


FOR MORE INFORMATION
More information about Wells Fargo Advantage Funds is available free upon request. To obtain literature, please write, e-mail, visit the Fund’s Web site, or call:
Wells Fargo Advantage Funds
P.O. Box 8266
Boston, MA 02266-8266
E-mail: wfaf@wellsfargo.com
Web site: wellsfargoadvantagefunds.com
Individual investors: 1-800-222-8222
Retail investment professionals: 1-888-877-9275
Institutional investment professionals: 1-866-765-0778
This report and the financial statements contained herein are submitted for the general information of the shareholders of Wells Fargo Advantage Funds. If this report is used for promotional purposes, distribution of the report must be accompanied or preceded by a current prospectus. For a prospectus containing more complete information, including charges and expenses, call 1-800-222-8222 or visit the Fund’s Web site at wellsfargoadvantagefunds.com. Please consider the investment objectives, risks, charges, and expenses of the investment carefully before investing. This and other information about Wells Fargo Advantage Funds can be found in the current prospectus. Read the prospectus carefully before you invest or send money.
Wells Fargo Funds Management, LLC, a wholly owned subsidiary of Wells Fargo & Company, provides investment advisory and administrative services for Wells Fargo Advantage Funds. Other affiliates of Wells Fargo & Company provide subadvisory and other services for the Funds. The Funds are distributed by Wells Fargo Funds Distributor, LLC, Member FINRA/SIPC, an affiliate of Wells Fargo & Company.
NOT FDIC INSURED ¡ NO BANK GUARANTEE ¡ MAY LOSE VALUE
© 2012 Wells Fargo Funds Management, LLC. All rights reserved.
| | |
 | | 208989 05-12 SA230/SAR230 3-12 |

Wells Fargo Advantage Enterprise FundSM

Semi-Annual Report
March 31, 2012

Reduce clutter. Save trees.
Sign up for electronic delivery of prospectuses and shareholder reports at wellsfargo.com/advantagedelivery
Contents
The views expressed and any forward-looking statements are as of March 31, 2012, unless otherwise noted, and are those of the Fund managers and/or Wells Fargo Funds Management, LLC. Discussions of individual securities, or the markets generally, or any Wells Fargo Advantage Fund are not intended as individual recommendations. Future events or results may vary significantly from those expressed in any forward-looking statements; the views expressed are subject to change at any time in response to changing circumstances in the market. Wells Fargo Funds Management, LLC, disclaims any obligation to publicly update or revise any views expressed or forward-looking statements.
NOT FDIC INSURED ¡ NO BANK GUARANTEE ¡ MAY LOSE VALUE

WELLS FARGO INVESTMENT HISTORY
| | |
| |
| 1932 | | Keystone creates one of the first mutual fund families. |
| |
| 1971 | | Wells Fargo & Company introduces one of the first institutional index funds. |
| |
| 1978 | | Wells Fargo applies Markowitz and Sharpe’s research on Modern Portfolio Theory to introduce one of the industry’s first Tactical Asset Allocation (TAA) models in institutional separately managed accounts. |
| |
| 1984 | | Wells Fargo Stagecoach Funds launches its first asset allocation fund. |
| |
| 1989 | | The Tactical Asset Allocation (TAA) Model is first applied to Wells Fargo’s asset allocation mutual funds. |
| |
| 1994 | | Wells Fargo introduces the LifePath Funds, one of the first suites of target date funds (now the Wells Fargo Advantage Dow Jones Target Date FundsSM). |
| |
| 1996 | | Evergreen Investments and Keystone Funds merge. |
| |
| 1997 | | Wells Fargo launches Wells Fargo Advantage WealthBuilder PortfoliosSM, a fund-of-funds suite of products that includes the use of quantitative models to shift assets among investment styles. |
| |
| 1999 | | Norwest Advantage Funds and Stagecoach Funds are reorganized into Wells Fargo Funds after the merger of Norwest and Wells Fargo. |
| |
| 2002 | | Evergreen Retail and Evergreen Institutional companies form the umbrella asset management company, Evergreen Investments. |
| |
| 2005 | | The integration of Strong Funds with Wells Fargo Funds creates Wells Fargo Advantage Funds, resulting in one of the top 20 mutual fund companies in the United States. |
| |
| 2006 | | Wells Fargo Advantage Funds relaunches the target date product line as Wells Fargo Advantage Dow Jones Target Date Funds. |
| |
| 2010 | | The mergers and reorganizations of Evergreen and Wells Fargo Advantage mutual funds are completed, unifying the families under the brand of Wells Fargo Advantage Funds. |
Wells Fargo Advantage Funds®
Wells Fargo Advantage Funds skillfully guides institutions, financial advisors, and individuals through the investment terrain to help them reach their financial objectives. Everything we do on behalf of investors is backed by our unique combination of qualifications.
Strength
Our organization is built on the standards of integrity and service established by our parent company—Wells Fargo & Company—more than 150 years ago. And, because we’re part of a highly diversified financial enterprise, we offer the depth of resources to help investors succeed.
Expertise
Our multi-boutique model offers investors access to the independent thinking of premier investment managers that have been chosen for their time-tested strategies. While each team specializes in a specific investment strategy, collectively they provide investors a wide choice of distinct investment styles. Our dedication to investment excellence doesn’t end with our expertise in manager selection—risk management, analysis, and rigorous ongoing review seek to ensure each manager’s investment process remains consistent.
Partnership
Our collaborative approach is built around understanding the needs and goals of our clients. By adhering to core principles of sound judgment and steady guidance, we support you through every stage of the investment decision process.
Carefully consider a fund’s investment objectives, risks, charges, and expenses before investing. For a current prospectus and, if available, a summary prospectus, containing this and other information, visit wellsfargoadvantagefunds.com. Read it carefully before investing.
Wells Fargo Funds Management, LLC, a wholly owned subsidiary of Wells Fargo & Company, provides investment advisory and administrative services for Wells Fargo Advantage Funds®. Other affiliates of Wells Fargo & Company provide subadvisory and other services for the Funds. The Funds are distributed by Wells Fargo Funds Distributor, LLC, Member FINRA/SIPC, an affiliate of Wells Fargo & Company.
“Dow Jones®” and “Dow Jones Target Date IndexesSM” are service marks of Dow Jones Trademark Holdings, LLC (“Dow Jones”), have been licensed to CME Group Index Services LLC (“CME Indexes”) and have been sublicensed for use for certain purposes by Global Index Advisors, Inc, and Wells Fargo Funds Management, LLC. The Wells Fargo Advantage Dow Jones Target Date FundsSM based on the Dow Jones Target Date IndexesSM, are not sponsored, endorsed, sold or promoted by Dow Jones, CME Indexes or their respective affiliates and none of them makes any representation regarding the advisability of investing in such product(s).
NOT FDIC INSURED ¡ NO BANK GUARANTEE ¡ MAY LOSE VALUE
Not part of the semi-annual report.
Wells Fargo Advantage Funds offers more than 110 mutual funds across a wide range of asset classes, representing over $213 billion in assets under management, as of March 31, 2012.
| | | | |
| Equity Funds | | | | |
Asia Pacific Fund | | Equity Value Fund | | Precious Metals Fund |
C&B Large Cap Value Fund | | Global Opportunities Fund | | Premier Large Company Growth Fund |
C&B Mid Cap Value Fund | | Growth Fund | | Small Cap Opportunities Fund |
Capital Growth Fund | | Index Fund | | Small Cap Value Fund |
Common Stock Fund | | International Equity Fund | | Small Company Growth Fund |
Disciplined U.S. Core Fund | | International Value Fund | | Small Company Value Fund |
Discovery Fund† | | Intrinsic Small Cap Value Fund | | Small/Mid Cap Core Fund |
Diversified Equity Fund | | Intrinsic Value Fund | | Small/Mid Cap Value Fund |
Diversified International Fund | | Intrinsic World Equity Fund | | Special Mid Cap Value Fund |
Diversified Small Cap Fund | | Large Cap Core Fund | | Special Small Cap Value Fund |
Emerging Growth Fund | | Large Cap Growth Fund | | Specialized Technology Fund |
Emerging Markets Equity Fund | | Large Company Value Fund | | Strategic Large Cap Growth Fund |
Endeavor Select Fund† | | Omega Growth Fund | | Traditional Small Cap Growth Fund |
Enterprise Fund† | | Opportunity Fund† | | Utility and Telecommunications Fund |
| Bond Funds | | | | |
Adjustable Rate Government Fund | | Inflation-Protected Bond Fund | | Short-Term Bond Fund |
California Limited-Term Tax-Free Fund | | Intermediate Tax/AMT-Free Fund | | Short-Term High Yield Bond Fund |
California Tax-Free Fund | | International Bond Fund | | Short-Term Municipal Bond Fund |
Colorado Tax-Free Fund | | Minnesota Tax-Free Fund | | Strategic Municipal Bond Fund |
Government Securities Fund | | Municipal Bond Fund | | Total Return Bond Fund |
High Income Fund | | North Carolina Tax-Free Fund | | Ultra Short-Term Income Fund |
High Yield Bond Fund | | Pennsylvania Tax-Free Fund | | Ultra Short-Term Municipal Income Fund |
Income Plus Fund | | Short Duration Government Bond Fund | | Wisconsin Tax-Free Fund |
| Asset Allocation Funds | | | | |
Absolute Return Fund | | WealthBuilder Equity Portfolio† | | Target 2020 Fund† |
Asset Allocation Fund | | WealthBuilder Growth Allocation Portfolio† | | Target 2025 Fund† |
Conservative Allocation Fund | | WealthBuilder Growth Balanced Portfolio† | | Target 2030 Fund† |
Diversified Capital Builder Fund | | WealthBuilder Moderate Balanced Portfolio† | | Target 2035 Fund† |
Diversified Income Builder Fund | | WealthBuilder Tactical Equity Portfolio† | | Target 2040 Fund† |
Growth Balanced Fund | | Target Today Fund† | | Target 2045 Fund† |
Index Asset Allocation Fund | | Target 2010 Fund† | | Target 2050 Fund† |
Moderate Balanced Fund | | Target 2015 Fund† | | Target 2055 Fund† |
WealthBuilder Conservative Allocation Portfolio† | | | | |
| Money Market Funds | | | | |
100% Treasury Money Market Fund | | Heritage Money Market Fund† | | National Tax-Free Money Market Fund |
California Municipal Money Market Fund | | Money Market Fund | | Prime Investment Money Market Fund |
Cash Investment Money Market Fund | | Municipal Cash Management Money Market Fund | | Treasury Plus Money Market Fund |
Government Money Market Fund | | Municipal Money Market Fund | | |
| Variable Trust Funds1 | | | | |
VT Discovery Fund† | | VT Intrinsic Value Fund | | VT Small Cap Growth Fund |
VT Index Asset Allocation Fund | | VT Omega Growth Fund | | VT Small Cap Value Fund |
VT International Equity Fund | | VT Opportunity Fund† | | VT Total Return Bond Fund |
An investment in a money market fund is not insured or guaranteed by the Federal Deposit Insurance Corporation or any other government agency. Although the Wells Fargo Advantage Money Market Funds seek to preserve the value of your investment at $1.00 per share, it is possible to lose money by investing in a money market fund.
| 1. | The Variable Trust Funds are generally available only through insurance company variable contracts. |
| † | In this report, the Wells Fargo Advantage Discovery FundSM, Wells Fargo Advantage Endeavor Select FundSM, Wells Fargo Advantage Enterprise FundSM, Wells Fargo Advantage Opportunity FundSM, Wells Fargo Advantage WealthBuilder Conservative Allocation PortfolioSM, Wells Fargo Advantage WealthBuilder Equity PortfolioSM, Wells Fargo Advantage WealthBuilder Growth Allocation PortfolioSM, Wells Fargo Advantage WealthBuilder Growth Balanced PortfolioSM, Wells Fargo Advantage WealthBuilder Moderate Balanced PortfolioSM, Wells Fargo Advantage WealthBuilder Tactical Equity PortfolioSM, Wells Fargo Advantage Dow Jones Target Today FundSM, Wells Fargo Advantage Dow Jones Target 2010 FundSM, Wells Fargo Advantage Dow Jones Target 2015 FundSM, Wells Fargo Advantage Dow Jones Target 2020 FundSM, Wells Fargo Advantage Dow Jones Target 2025 FundSM, Wells Fargo Advantage Dow Jones Target 2030 FundSM, Wells Fargo Advantage Dow Jones Target 2035 FundSM, Wells Fargo Advantage Dow Jones Target 2040 FundSM, Wells Fargo Advantage Dow Jones Target 2045 FundSM, Wells Fargo Advantage Dow Jones Target 2050 FundSM, Wells Fargo Advantage Dow Jones Target 2055 FundSM, Wells Fargo Advantage Heritage Money Market FundSM, Wells Fargo Advantage VT Discovery FundSM, and Wells Fargo Advantage VT Opportunity FundSM are referred to as the Discovery Fund, Endeavor Select Fund, Enterprise Fund, Opportunity Fund, WealthBuilder Conservative Allocation Portfolio, WealthBuilder Equity Portfolio, WealthBuilder Growth Allocation Portfolio, WealthBuilder Growth Balanced Portfolio, WealthBuilder Moderate Balanced Portfolio, WealthBuilder Tactical Equity Portfolio, Target Today Fund, Target 2010 Fund, Target 2015 Fund, Target 2020 Fund, Target 2025 Fund, Target 2030 Fund, Target 2035 Fund, Target 2040 Fund, Target 2045 Fund, Target 2050 Fund, Target 2055 Fund, Heritage Money Market Fund, VT Discovery Fund, and VT Opportunity Fund, respectively. |
Not part of the semi-annual report.
| | | | |
| 2 | | Wells Fargo Advantage Enterprise Fund | | Letter to Shareholders |

Karla M. Rabusch,
President
Wells Fargo Advantage Funds
The period was marked by increased confidence that the U.S. economy was staging a fragile recovery, offset by continued concerns about the possible effect on the global economy of the ongoing European sovereign debt crisis—which began in Greece and later spread to the larger economies of Italy and Spain.
In contrast to worrisome data from the eurozone, U.S. economic data remained moderately positive.
Dear Valued Shareholder:
We’re pleased to offer you this semi-annual report for the Wells Fargo Advantage Enterprise Fund for the six-month period that ended March 31, 2012. The period was marked by increased confidence that the U.S. economy was staging a fragile recovery, offset by continued concerns about the possible effect on the global economy of the ongoing European sovereign debt crisis—which began in Greece and later spread to the larger economies of Italy and Spain. U.S. stock indexes posted solid gains for the period.
Macroeconomic optimism faded as global growth slowed and worries rose.
Prior to the reporting period, investors worried that the global economy was returning to a recession. Although second quarter U.S. gross domestic product (GDP) grew at a 1.3% annual rate, it was below the levels set in 2010 and seemed to confirm that the economy had slowed from its previous pace. Moreover, the drawn-out political debate over the raising of the U.S. debt ceiling reduced confidence that the national government would be able to work together to address the country’s problems. Partly as a result, Standard & Poor’s rating service downgraded U.S. long-term debt from AAA to AA+1 in August 2011.
Throughout the six-month period, concerns about the eurozone sovereign debt situation returned to center stage. Investors became increasingly concerned that Greece would default on its debt, a scenario that only seemed more likely as eurozone leaders began to openly discuss a “voluntary” haircut on Greek debt for private investors. Because many eurozone banks owned Greek debt and many U.S. banks had financial ties to eurozone banks, investors worried about the effect of such an event on the financial systems and the global economy. In October 2011, market participants turned their attention to the debt burdens of Italy—which also had its credit rating downgraded by Standard & Poor’s—because even though it had a relatively modest budget deficit, it had a high amount of outstanding debt and a stagnant economy. French banks were heavily exposed to Italian debt, so Italy’s woes led to fears of a state bailout of French banks and a resulting increase in France’s required expenditures.
After months of rumors and worries, the Greek credit crisis was finally addressed in March 2012 when the country came to an agreement with its creditors allowing it to write down the principal on most of its bonds in exchange for increased financial austerity. By the end of the reporting period, the Greek agreement, combined with unprecedented support for eurozone banks by the European Central Bank (ECB), seemed to calm investor concerns, at least temporarily.
The U.S. economy reported relatively solid news.
In contrast to worrisome data from the eurozone, U.S. economic data remained moderately positive. After disappointing reports for first and second quarter GDP growth, reported GDP came in at a 1.8% annualized rate in the third quarter of 2011, and then accelerated to a 3.0% annualized rate in the fourth quarter. The major banks appeared to have taken steps toward repairing their balance sheets; in March, the Federal Reserve (Fed) announced that 15 of the 19 major banks had passed a “stress test,” in which the Fed attempted to gauge whether the banks could survive a severe recession that included a 50% drop in the stock market and a 21% percent decline in housing prices.
| 1. | The ratings indicated are from Standard & Poor’s. Standard & Poor’s rates the creditworthiness of bonds, ranging from AAA (highest) to D (lowest). Ratings from A to CCC may be modified by the addition of a plus (+) or minus (-) sign to show relative standing within the rating categories. |
| | | | | | |
| Letter to Shareholders | | Wells Fargo Advantage Enterprise Fund | | | 3 | |
Bank stocks rebounded strongly after the Fed released details of the stress test, but all major market sectors rallied as investors became increasingly confident that the U.S. would not return to recession. Small-cap stocks modestly outperformed large-cap stocks, and growth stocks outperformed value stocks by an even smaller margin.
Central banks continued to provide stimulus.
Throughout the reporting period, the Federal Open Market Committee (FOMC) kept its key interest rates effectively at zero in order to support the economy and financial system. In the second quarter of 2011, the Fed completed its second round of monetary stimulus, in which it had planned to purchase $600 billion in long-term U.S. Treasuries as well as reinvest an additional $250 billion to $300 billion in Treasuries with the proceeds from earlier investments. Even though the Fed seemed to rule out further monetary stimulus, it remained accommodative. In early August 2011, in response to extreme market volatility and signs of a weakening economy, the Fed announced its intention to keep interest rates low until at least late 2014.
At the beginning of the period, the ECB had a key rate of 1.50%, which it had raised in early 2011 in an attempt to keep inflation in check. However, in response to weakness in the southern European economies, the ECB lowered its key rate to 1.25% in November and to 1.0% in December. In August, after a sell-off in the sovereign debts of Spain and Italy, the ECB announced plans to purchase the debt of those countries in exchange for increased deficit reduction. The ECB also continued to provide virtually unlimited liquidity for banks, announcing a long-term refinancing operation (LTRO) in December through which it provided low cost, three-year loans to lenders.
We use time-tested investment strategies, even as many variables are at work in the market.
The full effect of the credit crisis remains unknown. Elevated unemployment and debt defaults continue to pressure consumers and businesses alike.
In our experience strict adherence to time-tested investment strategies has its rewards. As a whole, Wells Fargo Advantage Funds represents investments across a range of asset classes and investment styles, giving you an opportunity to create a diversified investment portfolio. While diversification may not prevent losses in a downturn, we believe it helps in managing risk.
Thank you for choosing to invest with Wells Fargo Advantage Funds. We appreciate your confidence in us and remain committed to helping you meet your financial needs. For current information about your fund investments, contact your investment professional, visit our Web site at wellsfargoadvantagefunds.com, or call us directly at 1-800-222-8222. We are available 24 hours a day, 7 days a week.
Sincerely,

Karla M. Rabusch
President
Wells Fargo Advantage Funds
| | | | |
| 4 | | Wells Fargo Advantage Enterprise Fund | | Letter to Shareholders |
Notice to Shareholders
The Board of Trustees for Wells Fargo Advantage Funds has unanimously approved the following modifications to certain net asset value (NAV) waiver privileges and commission schedules:
| | n | | Effective May 1, 2012, automatic investment plan (AIP) purchases and proceeds received from systematic withdrawals will no longer qualify for NAV repurchase privileges. | |
| | n | | Effective May 1, 2012, discretionary rights to waive the upfront commission for Class C and “jumbo” Class A share purchases will no longer be granted to broker/dealers. However, we will continue to waive the Class C shares contingent deferred sales charge for redemptions by employer-sponsored retirement plans where the dealer of record waived its commission at the time of purchase. | |
| | n | | Effective July 31, 2012, NAV purchase privileges for former Evergreen Class IS and Class R shareholders are being modified to remove the ability to purchase Class A shares at NAV unless those shares are held directly with the Fund on or after July 31, 2012. | |
Please contact your investment professional or call us directly at 1-800-222-8222 if you have any questions on this Notice to Shareholders.
| | | | | | |
| Performance Highlights (Unaudited) | | Wells Fargo Advantage Enterprise Fund | | | 5 | |
INVESTMENT OBJECTIVE
The Fund seeks long-term capital appreciation.
ADVISER
Wells Fargo Funds Management, LLC
SUB-ADVISER
Wells Capital Management Incorporated
PORTFOLIO MANAGERS
Thomas J. Pence, CFA
Michael T. Smith, CFA
Chris Warner, CFA
FUND INCEPTION
September 30, 1998
| | | | |
TEN LARGEST EQUITY HOLDINGS1 (AS OF MARCH 31, 2012) | | | |
Discovery Communications Incorporated | | | 2.59% | |
Airgas Incorporated | | | 2.49% | |
Alexion Pharmaceuticals Incorporated | | | 2.43% | |
Kansas City Southern | | | 2.22% | |
TransDigm Group Incorporated | | | 2.12% | |
Gartner Incorporated | | | 2.10% | |
F5 Networks Incorporated | | | 2.07% | |
Dollar General Corporation | | | 2.03% | |
BorgWarner Incorporated | | | 1.99% | |
Citrix Systems Incorporated | | | 1.98% | |
| | |
SECTOR DISTRIBUTION2 (AS OF MARCH 31, 2012) |
|
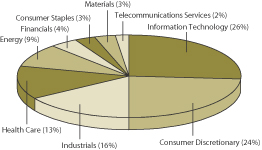 |
| 1. | The ten largest equity holdings are calculated based on the value of the securities divided by total net assets of the Fund. Holdings are subject to change and may have changed since the date specified |
| 2. | Sector distribution is subject to change and is calculated based on the total long-term investments of the Fund. |
| | | | |
| 6 | | Wells Fargo Advantage Enterprise Fund | | Performance Highlights (Unaudited) |
AVERAGE ANNUAL TOTAL RETURN3 (%) (AS OF MARCH 31, 2012)
| | | | | | | | | | | | | | | | | | | | | | | | | | | | | | | | | | | | | | | | | | | | |
| | | | | | Including Sales Charge | | | Excluding Sales Charge | | | Expense Ratios4 | |
| | | Inception Date | | | 6 Months* | | | 1 Year | | | 5 Year | | | 10 Year | | | 6 Months* | | | 1 Year | | | 5 Year | | | 10 Year | | | Gross | | | Net5 | |
Class A (SENAX) | | | 02/24/2000 | | | | 25.34 | | | | (2.30 | ) | | | 2.69 | | | | 5.39 | | | | 32.97 | | | | 3.67 | | | | 3.91 | | | | 6.02 | | | | 1.33% | | | | 1.18% | |
Class B (WENBX)** | | | 08/26/2011 | | | | 27.46 | | | | (2.07 | ) | | | 2.95 | | | | 5.94 | | | | 32.46 | | | | 2.93 | | | | 3.30 | | | | 5.94 | | | | 2.08% | | | | 1.93% | |
Class C (WENCX) | | | 03/31/2008 | | | | 31.46 | | | | 1.93 | | | | 3.15 | | | | 5.34 | | | | 32.46 | | | | 2.93 | | | | 3.15 | | | | 5.34 | | | | 2.08% | | | | 1.93% | |
Administrator Class (SEPKX) | | | 08/30/2002 | | | | | | | | | | | | | | | | | | | | 33.01 | | | | 3.78 | | | | 4.13 | | | | 6.26 | | | | 1.17% | | | | 1.15% | |
Institutional Class (WFEIX) | | | 06/30/2003 | | | | | | | | | | | | | | | | | | | | 33.18 | | | | 4.06 | | | | 4.39 | | | | 6.43 | | | | 0.90% | | | | 0.85% | |
Investor Class (SENTX) | | | 09/30/1998 | | | | | | | | | | | | | | | | | | | | 32.90 | | | | 3.61 | | | | 3.81 | | | | 5.82 | | | | 1.40% | | | | 1.25% | |
Russell Midcap® Growth Index6 | | | | | | | | | | | | | | | | | | | | | | | 27.39 | | | | 4.43 | | | | 4.44 | | | | 6.92 | | | | | | | | | |
| * | Returns for periods of less than one year are not annualized. |
| ** | Class B shares are closed to investment, except in connection with the reinvestment of any distributions and permitted exchanges. |
Figures quoted represent past performance, which is no guarantee of future results and do not reflect the deduction of taxes that a shareholder may pay on fund distributions or the redemption of fund shares. Investment return and principal value of an investment will fluctuate so that an investor’s shares, when redeemed, may be worth more or less than their original cost. Performance shown without sales charges would be lower if sales charges were reflected. Current performance may be lower or higher than the performance data quoted and assumes the reinvestment of dividends and capital gains. Current month-end performance is available on the Fund’s Web site – wellsfargoadvantagefunds.com
Index returns do not include transaction costs associated with buying and selling securities, any mutual fund fees or expenses or any taxes. It is not possible to invest directly in an index.
For Class A shares, the maximum front-end sales charge is 5.75%. For Class B shares, the maximum contingent deferred sales charge is 5.00%. For Class C shares, the maximum contingent deferred sales charge is 1.00%. Performance including sales charge assumes the sales charge for the corresponding time period. Administrator Class, Institutional Class and Investor Class shares are sold without a front-end sales charge or contingent deferred sales charge.
Please keep in mind that high double-digit returns were primarily achieved during favorable market conditions. You should not expect that such favorable returns can be consistently achieved. A Fund’s performance, especially for very short time periods, should not be the sole factor in making your investment decision.
Stock fund values fluctuate in response to the activities of individual companies and general market and economic conditions. Smaller-company stocks tend to be more volatile and less liquid than those of larger companies. Certain investment strategies tend to increase the total risk of an investment (relative to the broader market). This Fund is exposed to foreign investment risk. Consult the Fund’s prospectus for additional information on these and other risks.
| 3. | Effective June 20, 2008, the Advisor Class was renamed Class A and modified to assume the features and attributes of Class A. Historical performance shown for the Class A shares through June 20, 2008, includes Advisor Class expenses. Historical performance shown for Class B shares prior to their inception reflects the performance of Class C shares. Historical performance shown for Class C shares prior to their inception reflects the performance of the Investor Class shares, adjusted to reflect the higher expenses applicable to Class C shares. Historical performance shown for the Administrator Class and Institutional Class shares prior to their inception reflects the performance of the Investor Class shares and includes the higher expenses applicable to the Investor Class shares. If these expenses had not been included, returns would be higher. |
| 4. | Reflects the expense ratios as stated in the most recent prospectuses. |
| 5. | The Adviser has committed through July 18, 2013 to waive fees and/or reimburse expenses to the extent necessary to cap the Fund’s Total Annual Fund Operating Expenses After Fee Waiver, excluding certain expenses, at the amounts shown above. Without this cap, the Fund’s returns would have been lower. |
| 6. | The Russell Midcap® Growth Index measures the performance of those Russell Midcap® companies with higher price-to-book ratios and higher forecasted growth values. The stocks are also members of the Russell 1000® Growth index. You cannot invest directly in an index. |
| | | | | | |
| Fund Expenses (Unaudited) | | Wells Fargo Advantage Enterprise Fund | | | 7 | |
As a shareholder of the Fund, you incur two types of costs: (1) transaction costs, including sales charges (loads) on purchase payments and contingent deferred sales charges (if any) on redemptions and (2) ongoing costs, including management fees; distribution (12b-1) and/or shareholder service fees; and other Fund expenses. This example is intended to help you understand your ongoing costs (in dollars) of investing in the Fund and to compare these costs with the ongoing costs of investing in other mutual funds.
The example is based on an investment of $1,000 invested at the beginning of the six-month period and held for the entire period from October 1, 2011 to March 31, 2012.
Actual Expenses
The “Actual” line of the table below provides information about actual account values and actual expenses. You may use the information in this line, together with the amount you invested, to estimate the expenses that you paid over the period. Simply divide your account value by $1,000 (for example, an $8,600 account value divided by $1,000 = 8.6), then multiply the result by the number in the “Actual” line under the heading entitled “Expenses Paid During Period” for your applicable class of shares to estimate the expenses you paid on your account during this period.
Hypothetical Example for Comparison Purposes
The “Hypothetical” line of the table below provides information about hypothetical account values and hypothetical expenses based on the Fund’s actual expense ratio and an assumed rate of return of 5% per year before expenses, which is not the Fund’s actual return. The hypothetical account values and expenses may not be used to estimate the actual ending account balance or expenses you paid for the period. You may use this information to compare the ongoing costs of investing in the Fund and other funds. To do so, compare this 5% hypothetical example with the 5% hypothetical examples that appear in the shareholder reports of the other funds.
Please note that the expenses shown in the table are meant to highlight your ongoing costs only and do not reflect any transactional costs, such as sales charges (loads) and contingent deferred sales charges. Therefore, the “Hypothetical” line of the table is useful in comparing ongoing costs only, and will not help you determine the relative total costs of owning different funds. In addition, if these transactional costs were included, your costs would have been higher.
| | | | | | | | | | | | | | | | |
| | | Beginning
Account Value
10-01-2011 | | | Ending
Account Value
03-31-2012 | | | Expenses
Paid During
the Period1 | | | Net Annual
Expense Ratio | |
Class A | | | | | | | | | | | | | | | | |
Actual | | $ | 1,000.00 | | | $ | 1,329.67 | | | $ | 6.87 | | | | 1.18 | % |
Hypothetical (5% return before expenses) | | $ | 1,000.00 | | | $ | 1,019.10 | | | $ | 5.96 | | | | 1.18 | % |
Class B | | | | | | | | | | | | | | | | |
Actual | | $ | 1,000.00 | | | $ | 1,324.56 | | | $ | 11.22 | | | | 1.93 | % |
Hypothetical (5% return before expenses) | | $ | 1,000.00 | | | $ | 1,015.35 | | | $ | 9.72 | | | | 1.93 | % |
Class C | | | | | | | | | | | | | | | | |
Actual | | $ | 1,000.00 | | | $ | 1,324.56 | | | $ | 11.22 | | | | 1.93 | % |
Hypothetical (5% return before expenses) | | $ | 1,000.00 | | | $ | 1,015.35 | | | $ | 9.72 | | | | 1.93 | % |
Administrator Class | | | | | | | | | | | | | | | | |
Actual | | $ | 1,000.00 | | | $ | 1,330.10 | | | $ | 6.52 | | | | 1.12 | % |
Hypothetical (5% return before expenses) | | $ | 1,000.00 | | | $ | 1,019.40 | | | $ | 5.65 | | | | 1.12 | % |
Institutional Class | | | | | | | | | | | | | | | | |
Actual | | $ | 1,000.00 | | | $ | 1,331.80 | | | $ | 4.96 | | | | 0.85 | % |
Hypothetical (5% return before expenses) | | $ | 1,000.00 | | | $ | 1,020.75 | | | $ | 4.29 | | | | 0.85 | % |
Investor Class | | | | | | | | | | | | | | | | |
Actual | | $ | 1,000.00 | | | $ | 1,329.04 | | | $ | 7.28 | | | | 1.25 | % |
Hypothetical (5% return before expenses) | | $ | 1,000.00 | | | $ | 1,018.75 | | | $ | 6.31 | | | | 1.25 | % |
| 1. | Expenses paid is equal to the annualized expense ratio of each class multiplied by the average account value over the period, multiplied by the number of days in the most recent fiscal half-year divided by the number of days in the fiscal year (to reflect the one-half year period). |
| | | | |
| 8 | | Wells Fargo Advantage Enterprise Fund | | Portfolio of Investments—March 31, 2012 (Unaudited) |
| | | | | | | | | | | | |
| Security Name | | | | | | Shares | | | Value | |
| | | | | | | | | | | | |
| | | | |
Common Stocks: 98.52% | | | | | | | | | | | | |
| | | | |
Consumer Discretionary: 23.28% | | | | | | | | | | | | |
| | | | |
| Auto Components: 2.96% | | | | | | | | | | | | |
BorgWarner Incorporated Ǡ | | | | | | | 167,400 | | | $ | 14,118,516 | |
Delphi Automotive plc † | | | | | | | 217,300 | | | | 6,866,680 | |
| | | | |
| | | | | | | | | | | 20,985,196 | |
| | | | | | | | | | | | |
| | | | |
| Hotels, Restaurants & Leisure: 0.65% | | | | | | | | | | | | |
Chipotle Mexican Grill Incorporated † | | | | | | | 11,100 | | | | 4,639,800 | |
| | | | | | | | | | | | |
| | | | |
| Household Durables: 0.98% | | | | | | | | | | | | |
Tempur-Pedic International Incorporated Ǡ | | | | | | | 82,000 | | | | 6,923,260 | |
| | | | | | | | | | | | |
| | | | |
| Internet & Catalog Retail: 1.35% | | | | | | | | | | | | |
priceline.com Incorporated † | | | | | | | 13,300 | | | | 9,542,750 | |
| | | | | | | | | | | | |
| | | | |
| Media: 3.88% | | | | | | | | | | | | |
CBS Corporation Class B | | | | | | | 269,395 | | | | 9,135,184 | |
Discovery Communications Incorporated † | | | | | | | 391,400 | | | | 18,348,832 | |
| | | | |
| | | | | | | | | | | 27,484,016 | |
| | | | | | | | | | | | |
| | | | |
| Multiline Retail: 4.00% | | | | | | | | | | | | |
Dollar General Corporation † | | | | | | | 311,847 | | | | 14,407,331 | |
JCPenney Company Incorporated « | | | | | | | 125,300 | | | | 4,439,379 | |
Nordstrom Incorporated | | | | | | | 170,000 | | | | 9,472,400 | |
| | | | |
| | | | | | | | | | | 28,319,110 | |
| | | | | | | | | | | | |
| | | | |
| Specialty Retail: 5.13% | | | | | | | | | | | | |
GNC Holdings Incorporated Class A | | | | | | | 262,392 | | | | 9,154,857 | |
Limited Brands Incorporated | | | | | | | 270,500 | | | | 12,984,000 | |
Ross Stores Incorporated | | | | | | | 74,300 | | | | 4,316,830 | |
Ulta Salon Cosmetics & Fragrance Incorporated | | | | | | | 106,400 | | | | 9,883,496 | |
| | | | |
| | | | | | | | | | | 36,339,183 | |
| | | | | | | | | | | | |
| | | | |
| Textiles, Apparel & Luxury Goods: 4.33% | | | | | | | | | | | | |
Deckers Outdoor Corporation Ǡ | | | | | | | 94,600 | | | | 5,964,530 | |
lululemon athletica incorporated † | | | | | | | 96,500 | | | | 7,206,620 | |
Ralph Lauren Corporation | | | | | | | 61,000 | | | | 10,634,130 | |
Under Armour Incorporated † | | | | | | | 73,200 | | | | 6,880,800 | |
| | | | |
| | | | | | | | | | | 30,686,080 | |
| | | | | | | | | | | | |
| | | | |
Consumer Staples: 3.14% | | | | | | | | | | | | |
| | | | |
| Beverages: 1.50% | | | | | | | | | | | | |
Monster Beverage Corporation † | | | | | | | 170,700 | | | | 10,598,763 | |
| | | | | | | | | | | | |
| | | | |
| Food & Staples Retailing: 1.64% | | | | | | | | | | | | |
Whole Foods Market Incorporated | | | | | | | 139,700 | | | | 11,623,040 | |
| | | | | | | | | | | | |
The accompanying notes are an integral part of these financial statements.
| | | | | | |
| Portfolio of Investments—March 31, 2012 (Unaudited) | | Wells Fargo Advantage Enterprise Fund | | | 9 | |
| | | | | | | | | | | | |
| Security Name | | | | | | Shares | | | Value | |
| | | | | | | | | | | | |
| | | | |
Energy: 9.28% | | | | | | | | | | | | |
| | | | |
| Energy Equipment & Services: 3.55% | | | | | | | | | | | | |
Cameron International Corporation Ǡ | | | | | | | 240,625 | | | $ | 12,712,219 | |
Ensco International plc ADR | | | | | | | 66,400 | | | | 3,514,552 | |
Oil States International Incorporated † | | | | | | | 114,220 | | | | 8,916,013 | |
| | | | |
| | | | | | | | | | | 25,142,784 | |
| | | | | | | | | | | | |
| | | | |
| Oil, Gas & Consumable Fuels: 5.73% | | | | | | | | | | | | |
Cabot Oil & Gas Corporation « | | | | | | | 155,200 | | | | 4,837,584 | |
Concho Resources Incorporated † | | | | | | | 107,500 | | | | 10,973,600 | |
Kodiak Oil & Gas Corporation Ǡ | | | | | | | 549,900 | | | | 5,477,004 | |
Pioneer Natural Resources Company | | | | | | | 123,015 | | | | 13,727,244 | |
Plains Exploration & Product Company † | | | | | | | 131,900 | | | | 5,625,535 | |
| | | | |
| | | | | | | | | | | 40,640,967 | |
| | | | | | | | | | | | |
| | | | |
Financials: 4.15% | | | | | | | | | | | | |
| | | | |
| Capital Markets: 1.75% | | | | | | | | | | | | |
Ameriprise Financial Incorporated | | | | | | | 134,105 | | | | 7,661,419 | |
TD Ameritrade Holding Corporation | | | | | | | 238,400 | | | | 4,706,016 | |
| | | | |
| | | | | | | | | | | 12,367,435 | |
| | | | | | | | | | | | |
| | | | |
| Consumer Finance: 1.15% | | | | | | | | | | | | |
Discover Financial Services | | | | | | | 245,000 | | | | 8,168,300 | |
| | | | | | | | | | | | |
| | | | |
| Real Estate Management & Development: 1.25% | | | | | | | | | | | | |
CBRE Group Incorporated † | | | | | | | 443,500 | | | | 8,852,260 | |
| | | | | | | | | | | | |
| | | | |
Health Care: 12.58% | | | | | | | | | | | | |
| | | | |
| Biotechnology: 3.54% | | | | | | | | | | | | |
Alexion Pharmaceuticals Incorporated † | | | | | | | 185,110 | | | | 17,189,315 | |
BioMarin Pharmaceutical Incorporated Ǡ | | | | | | | 229,724 | | | | 7,868,047 | |
| | | | |
| | | | | | | | | | | 25,057,362 | |
| | | | | | | | | | | | |
| | | | |
| Health Care Equipment & Supplies: 3.34% | | | | | | | | | | | | |
Alere Incorporated † | | | | | | | 248,521 | | | | 6,464,031 | |
Edwards Lifesciences Corporation Ǡ | | | | | | | 71,166 | | | | 5,175,903 | |
Intuitive Surgical Incorporated † | | | | | | | 22,200 | | | | 12,026,850 | |
| | | | |
| | | | | | | | | | | 23,666,784 | |
| | | | | | | | | | | | |
| | | | |
| Health Care Providers & Services: 2.30% | | | | | | | | | | | | |
Cardinal Health Incorporated | | | | | | | 149,703 | | | | 6,453,696 | |
Humana Incorporated | | | | | | | 106,400 | | | | 9,839,872 | |
| | | | |
| | | | | | | | | | | 16,293,568 | |
| | | | | | | | | | | | |
| | | | |
| Health Care Technology: 1.75% | | | | | | | | | | | | |
Cerner Corporation Ǡ | | | | | | | 163,000 | | | | 12,414,080 | |
| | | | | | | | | | | | |
| | | | |
| Life Sciences Tools & Services: 0.31% | | | | | | | | | | | | |
Illumina Incorporated Ǡ | | | | | | | 42,175 | | | | 2,218,827 | |
| | | | | | | | | | | | |
The accompanying notes are an integral part of these financial statements.
| | | | |
| 10 | | Wells Fargo Advantage Enterprise Fund | | Portfolio of Investments—March 31, 2012 (Unaudited) |
| | | | | | | | | | | | |
| Security Name | | | | | | Shares | | | Value | |
| | | | | | | | | | | | |
| | | | |
| Pharmaceuticals: 1.34% | | | | | | | | | | | | |
Shire plc ADR | | | | | | | 99,801 | | | $ | 9,456,145 | |
| | | | | | | | | | | | |
| | | | |
Industrials: 16.08% | | | | | | | | | | | | |
| | | | |
| Aerospace & Defense: 3.09% | | | | | | | | | | | | |
TransDigm Group Incorporated † | | | | | | | 129,752 | | | | 15,020,092 | |
Triumph Group Incorporated « | | | | | | | 109,800 | | | | 6,880,068 | |
| | | | |
| | | | | | | | | | | 21,900,160 | |
| | | | | | | | | | | | |
| | | | |
| Electrical Equipment: 1.52% | | | | | | | | | | | | |
Rockwell Automation Incorporated | | | | | | | 135,215 | | | | 10,776,636 | |
| | | | | | | | | | | | |
| | | | |
| Machinery: 2.89% | | | | | | | | | | | | |
Colfax Corporation † | | | | | | | 203,781 | | | | 7,181,242 | |
Cummins Incorporated « | | | | | | | 79,821 | | | | 9,581,713 | |
Gardner Denver Incorporated « | | | | | | | 58,500 | | | | 3,686,670 | |
| | | | |
| | | | | | | | | | | 20,449,625 | |
| | | | | | | | | | | | |
| | | | |
| Marine: 1.26% | | | | | | | | | | | | |
Kirby Corporation † | | | | | | | 135,300 | | | | 8,901,387 | |
| | | | | | | | | | | | |
| | | | |
| Professional Services: 1.00% | | | | | | | | | | | | |
Verisk Analytics Incorporated Class A † | | | | | | | 150,800 | | | | 7,083,076 | |
| | | | | | | | | | | | |
| | | | |
| Road & Rail: 3.39% | | | | | | | | | | | | |
Hertz Global Holdings Incorporated Ǡ | | | | | | | 552,100 | | | | 8,303,584 | |
Kansas City Southern † | | | | | | | 219,475 | | | | 15,734,163 | |
| | | | |
| | | | | | | | | | | 24,037,747 | |
| | | | | | | | | | | | |
| | | | |
| Trading Companies & Distributors: 2.93% | | | | | | | | | | | | |
W.W. Grainger Incorporated « | | | | | | | 45,519 | | | | 9,777,936 | |
WESCO International Incorporated Ǡ | | | | | | | 168,500 | | | | 11,004,735 | |
| | | | |
| | | | | | | | | | | 20,782,671 | |
| | | | | | | | | | | | |
| | | | |
Information Technology: 25.72% | | | | | | | | | | | | |
| | | | |
| Communications Equipment: 2.07% | | | | | | | | | | | | |
Comverse Technology Incorporated † | | | | | | | 538 | | | | 3,696 | |
F5 Networks Incorporated † | | | | | | | 108,600 | | | | 14,656,656 | |
| | | | |
| | | | | | | | | | | 14,660,352 | |
| | | | | | | | | | | | |
| | | | |
| Electronic Equipment, Instruments & Components: 3.01% | | | | | | | | | | | | |
Agilent Technologies Incorporated † | | | | | | | 195,095 | | | | 8,683,678 | |
M/A-COM Technology Solutions Holdings Incorporated † | | | | | | | 72,981 | | | | 1,513,626 | |
Trimble Navigation Limited † | | | | | | | 205,100 | | | | 11,161,542 | |
| | | | |
| | | | | | | | | | | 21,358,846 | |
| | | | | | | | | | | | |
| | | | |
| Internet Software & Services: 2.38% | | | | | | | | | | | | |
Equinix Incorporated Ǡ | | | | | | | 48,764 | | | | 7,677,892 | |
Mercadolibre Incorporated | | | | | | | 94,265 | | | | 9,218,174 | |
| | | | |
| | | | | | | | | | | 16,896,066 | |
| | | | | | | | | | | | |
The accompanying notes are an integral part of these financial statements.
| | | | | | |
| Portfolio of Investments—March 31, 2012 (Unaudited) | | Wells Fargo Advantage Enterprise Fund | | | 11 | |
| | | | | | | | | | | | | | |
| Security Name | | | | | | | Shares | | | Value | |
| | | | | | | | | | | | | | |
| | | | |
| IT Services: 3.99% | | | | | | | | | | | | | | |
Cognizant Technology Solutions Corporation Class A † | | | | | | | | | 125,795 | | | $ | 9,679,925 | |
Gartner Incorporated † | | | | | | | | | 348,828 | | | | 14,874,026 | |
Teradata Corporation † | | | | | | | | | 54,300 | | | | 3,700,545 | |
| | | | |
| | | | | | | | | | | | | 28,254,496 | |
| | | | | | | | | | | | | | |
| | | | |
| Semiconductors & Semiconductor Equipment: 5.06% | | | | | | | | | | | | | | |
Altera Corporation | | | | | | | | | 214,000 | | | | 8,521,480 | |
ARM Holdings plc ADR « | | | | | | | | | 281,600 | | | | 7,966,464 | |
Avago Technologies Limited | | | | | | | | | 303,805 | | | | 11,839,281 | |
LSI Corporation † | | | | | | | | | 863,400 | | | | 7,494,312 | |
| | | | |
| | | | | | | | | | | | | 35,821,537 | |
| | | | | | | | | | | | | | |
| | | | |
| Software: 9.21% | | | | | | | | | | | | | | |
Autodesk Incorporated † | | | | | | | | | 289,400 | | | | 12,247,408 | |
Check Point Software Technologies Limited Ǡ | | | | | | | | | 120,333 | | | | 7,682,059 | |
Citrix Systems Incorporated † | | | | | | | | | 177,370 | | | | 13,996,267 | |
CommVault Systems Incorporated † | | | | | | | | | 7,118 | | | | 349,270 | |
Fortinet Incorporated † | | | | | | | | | 414,600 | | | | 11,463,690 | |
Intuit Incorporated | | | | | | | | | 155,200 | | | | 9,332,176 | |
TIBCO Software Incorporated † | | | | | | | | | 333,518 | | | | 10,172,299 | |
| | | | |
| | | | | | | | | | | | | 65,243,169 | |
| | | | | | | | | | | | | | |
| | | | |
Materials: 2.49% | | | | | | | | | | | | | | |
| | | | |
| Chemicals: 2.49% | | | | | | | | | | | | | | |
Airgas Incorporated | | | | | | | | | 198,405 | | | | 17,652,092 | |
| | | | | | | | | | | | | | |
| | | | |
Telecommunication Services: 1.80% | | | | | | | | | | | | | | |
| | | | |
| Wireless Telecommunication Services: 1.80% | | | | | | | | | | | | | | |
SBA Communications Corporation Class A † | | | | | | | | | 251,385 | | | | 12,772,871 | |
| | | | | | | | | | | | | | |
| | | | |
Total Common Stocks (Cost $608,973,884) | | | | | | | | | | | | | 698,010,441 | |
| | | | | | | | | | | | | | |
| | | | |
| | | | | | | | Principal | | | | |
| Other: 0.25% | | | | | | | | | | | | | | |
Gryphon Funding Limited, Pass-Through Entity (a)(i)(v) | | | | | | | | $ | 2,396,523 | | | | 671,027 | |
VFNC Corporation, Pass-Through Entity, 0.24% (a)(i)(v)144A± | | | | | | | | | 2,651,685 | | | | 1,113,708 | |
| | | | |
Total Other (Cost $730,789) | | | | | | | | | | | | | 1,784,735 | |
| | | | | | | | | | | | | | |
| | | | |
| | | Yield | | | | | Shares | | | | |
| Short-Term Investments: 17.06% | | | | | | | | | | | | | | |
| | | | |
| Investment Companies: 17.06% | | | | | | | | | | | | | | |
Wells Fargo Advantage Cash Investment Money Market Fund, Select Class (u)(l) | | | 0.10 | % | | | | | 10,934,136 | | | | 10,934,136 | |
Wells Fargo Securities Lending Cash Investments, LLC (v)(u)(l)(r) | | | 0.18 | | | | | | 109,915,011 | | | | 109,915,011 | |
| | | | |
Total Short-Term Investments (Cost $120,849,147) | | | | | | | | | | | | | 120,849,147 | |
| | | | | | | | | | | | | | |
| | | | | | | | |
| | |
| Total Investments in Securities | | | | | | | | |
| (Cost $730,553,820) * | | | 115.83 | % | | | 820,644,323 | |
Other Assets and Liabilities, Net | | | (15.83 | ) | | | (112,140,901 | ) |
| | | | | | | | |
| Total Net Assets | | | 100.00 | % | | $ | 708,503,422 | |
| | | | | | | | |
The accompanying notes are an integral part of these financial statements.
| | | | |
| 12 | | Wells Fargo Advantage Enterprise Fund | | Portfolio of Investments—March 31, 2012 (Unaudited) |
| « | All or a portion of this security is on loan. |
| † | Non-income earning security |
| (a) | Security is fair valued by the Management Valuation Team, and in certain instances by the Board of Trustees, in accordance with procedures approved by the Board of Trustees. |
| (v) | Security represents investment of cash collateral received from securities on loan. |
| 144A | Security that may be resold to “qualified institutional buyers” under Rule 144A or security offered pursuant to Section 4(2) of the Securities Act of 1933, as amended. |
| ± | Variable rate investment |
| (u) | Rate shown is the 7-day annualized yield at period end. |
| (l) | Investment in an affiliate |
| (r) | The investment company is exempt from registration under Section 3(c)(7) of the 1940 Act. |
| * | Cost for federal income tax purposes is $728,973,609 and net unrealized appreciation (depreciation) consists of: |
| | | | |
Gross unrealized appreciation | | $ | 104,147,108 | |
Gross unrealized depreciation | | | (12,476,394 | ) |
| | | | |
Net unrealized appreciation | | $ | 91,670,714 | |
The accompanying notes are an integral part of these financial statements.
| | | | | | |
| Statement of Assets and Liabilities—March 31, 2012 (Unaudited) | | Wells Fargo Advantage Enterprise Fund | | | 13 | |
| | | | |
| | | | |
| |
Assets | | | | |
Investments | | | | |
In unaffiliated securities (including securities on loan), at value (see cost below) | | $ | 699,795,176 | |
In affiliated securities, at value (see cost below) | | | 120,849,147 | |
| | | | |
Total investments, at value (see cost below) | | | 820,644,323 | |
Receivable for investments sold | | | 4,459,553 | |
Receivable for Fund shares sold | | | 146,776 | |
Receivable for dividends | | | 284,049 | |
Receivable for securities lending income | | | 13,828 | |
Prepaid expenses and other assets | | | 86,699 | |
| | | | |
Total assets | | | 825,635,228 | |
| | | | |
| |
Liabilities | | | | |
Payable for investments purchased | | | 4,625,395 | |
Payable for Fund shares redeemed | | | 1,161,227 | |
Payable upon receipt of securities loaned | | | 110,645,800 | |
Advisory fee payable | | | 385,540 | |
Distribution fees payable | | | 8,150 | |
Due to other related parties | | | 132,638 | |
Accrued expenses and other liabilities | | | 173,056 | |
| | | | |
Total liabilities | | | 117,131,806 | |
| | | | |
Total net assets | | $ | 708,503,422 | |
| | | | |
| |
NET ASSETS CONSIST OF | | | | |
Paid-in capital | | $ | 659,909,571 | |
Undistributed net investment loss | | | (1,764,401 | ) |
Accumulated net realized losses on investments | | | (39,732,251 | ) |
Net unrealized gains on investments | | | 90,090,503 | |
| | | | |
Total net assets | | $ | 708,503,422 | |
| | | | |
| |
COMPUTATION OF NET ASSET VALUE AND OFFERING PRICE PER SHARE1 | | | | |
Net assets – Class A | | $ | 385,058,575 | |
Shares outstanding – Class A | | | 9,953,606 | |
Net asset value per share – Class A | | | $38.69 | |
Maximum offering price per share – Class A2 | | | $41.05 | |
Net assets – Class B | | $ | 4,621,857 | |
Shares outstanding – Class B | | | 124,167 | |
Net asset value per share – Class B | | | $37.22 | |
Net assets – Class C | | $ | 7,989,486 | |
Shares outstanding – Class C | | | 214,626 | |
Net asset value per share – Class C | | | $37.23 | |
Net assets – Administrator Class | | $ | 18,128,727 | |
Shares outstanding – Administrator Class | | | 455,374 | |
Net asset value per share – Administrator Class | | | $39.81 | |
Net assets – Institutional Class | | $ | 110,909,693 | |
Shares outstanding – Institutional Class | | | 2,741,049 | |
Net asset value per share – Institutional Class | | | $40.46 | |
Net assets – Investor Class | | $ | 181,795,084 | |
Shares outstanding – Investor Class | | | 4,757,625 | |
Net asset value per share – Investor Class | | | $38.21 | |
| |
Investments in unaffiliated securities, at cost | | $ | 609,704,673 | |
| | | | |
Investments in affiliated securities, at cost | | $ | 120,849,147 | |
| | | | |
Total investments, at cost | | $ | 730,553,820 | |
| | | | |
Securities on loan, at value | | $ | 108,255,201 | |
| | | | |
| 1. | The Fund has an unlimited number of authorized shares. |
| 2. | Maximum offering price is computed as 100/94.25 of net asset value. On investments of $50,000 or more, the offering price is reduced. |
The accompanying notes are an integral part of these financial statements.
| | | | |
| 14 | | Wells Fargo Advantage Enterprise Fund | | Statement of Operations—Six Months Ended March 31, 2012 (Unaudited) |
| | | | |
| | | | |
| |
Investment income | | | | |
Dividends* | | $ | 2,109,598 | |
Securities lending income, net | | | 85,171 | |
Income from affiliated securities | | | 2,819 | |
| | | | |
Total investment income | | | 2,197,588 | |
| | | | |
| |
Expenses | | | | |
Advisory fee | | | 2,379,522 | |
Administration fees | | | | |
Fund level | | | 171,656 | |
Class A | | | 457,278 | |
Class B | | | 6,218 | |
Class C | | | 9,395 | |
Administrator Class | | | 12,029 | |
Institutional Class | | | 53,319 | |
Investor Class | | | 273,089 | |
Shareholder servicing fees | | | | |
Class A | | | 439,690 | |
Class B | | | 5,751 | |
Class C | | | 9,034 | |
Administrator Class | | | 28,841 | |
Investor Class | | | 206,886 | |
Distribution fees | | | | |
Class B | | | 17,936 | |
Class C | | | 27,102 | |
Custody and accounting fees | | | 40,262 | |
Professional fees | | | 14,307 | |
Registration fees | | | 31,634 | |
Shareholder report expenses | | | 27,246 | |
Trustees’ fees and expenses | | | 7,696 | |
Other fees and expenses | | | 5,729 | |
| | | | |
Total expenses | | | 4,224,620 | |
Less: Fee waivers and/or expense reimbursements | | | (297,747 | ) |
| | | | |
Net expenses | | | 3,926,873 | |
| | | | |
Net investment loss | | | (1,729,285 | ) |
| | | | |
| |
REALIZED AND UNREALIZED GAINS (LOSSES) ON INVESTMENTS | | | | |
Net realized gains on investments | | | 9,654,540 | |
Net change in unrealized gains (losses) on investments | | | 185,773,418 | |
| | | | |
Net realized and unrealized gains (losses) on investments | | | 195,427,958 | |
| | | | |
Net increase in net assets resulting from operations | | $ | 193,698,673 | |
| | | | |
| |
* Net of foreign dividend withholding taxes of | | | $9,645 | |
The accompanying notes are an integral part of these financial statements.
| | | | | | |
| Statements of Changes in Net Assets | | Wells Fargo Advantage Enterprise Fund | | | 15 | |
| | | | | | | | | | | | | | | | |
| | | Six Months Ended
March 31, 2012
(Unaudited) | | | Year Ended
September 30, 2011 | |
| | | | |
Operations | | | | | | | | | | | | | | | | |
Net investment loss | | | | | | $ | (1,729,285 | ) | | | | | | $ | (2,039,089 | ) |
Net realized gains on investments | | | | | | | 9,654,540 | | | | | | | | 62,555,728 | |
Net change in unrealized gains (losses) on investments | | | | | | | 185,773,418 | | | | | | | | (77,494,357 | ) |
| | | | | | | | | | | | | | | | |
Net increase (decrease) in net assets resulting from operations | | | | | | | 193,698,673 | | | | | | | | (16,977,718 | ) |
| | | | | | | | | | | | | | | | |
| | | | |
Capital share transactions | | | Shares | | | | | | | | Shares | | | | | |
Proceeds from shares sold | | | | | | | | | | | | | | | | |
Class A | | | 58,191 | | | | 2,020,600 | | | | 15,541 | | | | 534,697 | |
Class B | | | 1,334 | | | | 49,586 | | | | 181 | 1 | | | 5,270 | 1 |
Class C | | | 10,700 | | | | 362,629 | | | | 12,782 | | | | 444,034 | |
Administrator Class | | | 77,230 | | | | 2,855,262 | | | | 121,351 | | | | 4,324,090 | |
Institutional Class | | | 375,216 | | | | 14,392,154 | | | | 391,905 | | | | 14,582,728 | |
Investor Class | | | 100,959 | | | | 3,492,472 | | | | 724,545 | | | | 24,904,707 | |
| | | | | | | | | | | | | | | | |
| | | | | | | 23,172,703 | | | | | | | | 44,795,526 | |
| | | | | | | | | | | | | | | | |
Payment for shares redeemed | | | | | | | | | | | | | | | | |
Class A | | | (681,451 | ) | | | (23,682,813 | ) | | | (136,638 | ) | | | (4,253,646 | ) |
Class B | | | (44,263 | ) | | | (1,483,603 | ) | | | (8,088 | )1 | | | (241,508 | )1 |
Class C | | | (24,825 | ) | | | (808,785 | ) | | | (10,239 | ) | | | (333,954 | ) |
Administrator Class | | | (383,945 | ) | | | (14,414,148 | ) | | | (217,786 | ) | | | (7,725,772 | ) |
Institutional Class | | | (1,637,023 | ) | | | (63,071,462 | ) | | | (1,132,371 | ) | | | (40,632,468 | ) |
Investor Class | | | (382,987 | ) | | | (13,076,767 | ) | | | (1,168,954 | ) | | | (40,505,514 | ) |
| | | | | | | | | | | | | | | | |
| | | | | | | (116,537,578 | ) | | | | | | | (93,692,862 | ) |
| | | | | | | | | | | | | | | | |
Net asset value of shares issued in acquisition | | | | | | | | | | | | | | | | |
Class A | | | 0 | | | | 0 | | | | 10,668,880 | | | | 321,938,695 | |
Class B | | | 0 | | | | 0 | | | | 175,003 | 1 | | | 5,104,055 | 1 |
Class C | | | 0 | | | | 0 | | | | 220,298 | | | | 6,425,031 | |
Administrator Class | | | 0 | | | | 0 | | | | 318,417 | | | | 9,884,076 | |
Institutional Class | | | 0 | | | | 0 | | | | 1,339,792 | | | | 42,203,714 | |
Investor Class | | | 0 | | | | 0 | | | | 979,896 | | | | 29,217,885 | |
| | | | | | | | | | | | | | | | |
| | | | | | | 0 | | | | | | | | 414,773,456 | |
| | | | | | | | | | | | | | | | |
Net increase (decrease) in net assets resulting from capital share transactions | | | | | | | (93,364,875 | ) | | | | | | | 365,876,120 | |
| | | | | | | | | | | | | | | | |
Total increase in net assets | | | | | | | 100,333,798 | | | | | | | | 348,898,402 | |
| | | | | | | | | | | | | | | | |
| | | | |
Net assets | | | | | | | | | | | | | | | | |
Beginning of period | | | | | | | 608,169,624 | | | | | | | | 259,271,222 | |
| | | | | | | | | | | | | | | | |
End of period | | | | | | $ | 708,503,422 | | | | | | | $ | 608,169,624 | |
| | | | | | | | | | | | | | | | |
Undistributed net investment loss | | | | | | $ | (1,764,401 | ) | | | | | | $ | (35,116 | ) |
| | | | | | | | | | | | | | | | |
| 1. | Class commenced operations on August 26, 2011. |
The accompanying notes are an integral part of these financial statements.
| | | | |
| 16 | | Wells Fargo Advantage Enterprise Fund | | Financial Highlights |
(For a share outstanding throughout each period)
| | | | | | | | | | | | | | | | | | | | | | | | | | | | |
| | | Six Months Ended
March 31, 2012 (Unaudited) | | | Year Ended September 30, | | | Year Ended October 31, | |
| Class A | | | 2011 | | | 20101 | | | 2009 | | | 20082 | | | 20072 | | | 20062 | |
Net asset value, beginning of period | | $ | 29.10 | | | $ | 30.21 | | | $ | 24.24 | | | $ | 21.77 | | | $ | 37.95 | | | $ | 29.31 | | | $ | 25.57 | |
Net investment loss | | | (0.10 | ) | | | (0.17 | )3 | | | (0.22 | )3 | | | (0.14 | )3 | | | (0.25 | )3 | | | (0.26 | )3 | | | (0.31 | )3 |
Net realized and unrealized gains (losses) on investments | | | 9.69 | | | | (0.94 | ) | | | 6.19 | | | | 2.61 | | | | (15.93 | ) | | | 8.90 | | | | 4.05 | |
| | | | | | | | | | | | | | | | | | | | | | | | | | | | |
Total from investment operations | | | 9.59 | | | | (1.11 | ) | | | 5.97 | | | | 2.47 | | | | (16.18 | ) | | | 8.64 | | | | 3.74 | |
Net asset value, end of period | | $ | 38.69 | | | $ | 29.10 | | | $ | 30.21 | | | $ | 24.24 | | | $ | 21.77 | | | $ | 37.95 | | | $ | 29.31 | |
Total return4 | | | 32.97 | % | | | (3.71 | )% | | | 24.63 | % | | | 11.35 | % | | | (42.63 | )% | | | 29.48 | % | | | 14.63 | % |
Ratios to average net assets (annualized) | | | | | | | | | | | | | | | | | | | | | | | | | | | | |
Gross expenses | | | 1.29 | % | | | 1.34 | % | | | 1.38 | % | | | 1.44 | % | | | 1.45 | % | | | 1.42 | % | | | 1.42 | % |
Net expenses | | | 1.18 | % | | | 1.18 | % | | | 1.34 | % | | | 1.36 | % | | | 1.40 | % | | | 1.40 | % | | | 1.39 | % |
Net investment loss | | | (0.54 | )% | | | (0.51 | )% | | | (0.85 | )% | | | (0.64 | )% | | | (0.79 | )% | | | (0.79 | )% | | | (0.89 | )% |
Supplemental data | | | | | | | | | | | | | | | | | | | | | | | | | | | | |
Portfolio turnover rate | | | 51 | % | | | 104 | % | | | 108 | % | | | 203 | % | | | 179 | % | | | 117 | % | | | 118 | % |
Net assets, end of period (000’s omitted) | | | $385,059 | | | | $307,735 | | | | $878 | | | | $824 | | | | $851 | | | | $1,769 | | | | $1,761 | |
| 1. | For the eleven months ended September 30, 2010. The Fund changed its fiscal year end from October 31 to September 30, effective September 30, 2010. |
| 2. | On June 20, 2008, Advisor Class was renamed Class A. |
| 3. | Calculated based upon average shares outstanding |
| 4. | Total return calculations do not include any sales charges. Returns for periods of less than one year are not annualized. |
The accompanying notes are an integral part of these financial statements.
| | | | | | |
| Financial Highlights | | Wells Fargo Advantage Enterprise Fund | | | 17 | |
(For a share outstanding throughout each period)
| | | | | | | | |
| | | Six Months Ended
March 31, 2012 (Unaudited) | | | Year Ended September 30, 20111 | |
| Class B | | |
Net asset value, beginning of period | | $ | 28.10 | | | $ | 29.17 | |
Net investment loss | | | (0.20 | ) | | | (0.04 | )2 |
Net realized and unrealized gains (losses) on investments | | | 9.32 | | | | (1.03 | ) |
| | | | | | | | |
Total from investment operations | | | 9.12 | | | | (1.07 | ) |
Net asset value, end of period | | $ | 37.22 | | | $ | 28.10 | |
Total return3 | | | 32.46 | % | | | (3.67 | )% |
Ratios to average net assets (annualized) | | | | | | | | |
Gross expenses | | | 2.03 | % | | | 2.09 | % |
Net expenses | | | 1.93 | % | | | 1.93 | % |
Net investment loss | | | (1.30 | )% | | | (1.26 | )% |
Supplemental data | | | | | | | | |
Portfolio turnover rate | | | 51 | % | | | 104 | % |
Net assets, end of period (000’s omitted) | | | $4,622 | | | | $4,695 | |
| 1. | For the period from August 26, 2011 (commencement of class operations) to September 30, 2011 |
| 2. | Calculated based upon average shares outstanding |
| 3. | Total return calculations do not include any sales charges. Returns for periods of less than one year are not annualized. |
The accompanying notes are an integral part of these financial statements.
| | | | |
| 18 | | Wells Fargo Advantage Enterprise Fund | | Financial Highlights |
(For a share outstanding throughout each period)
| | | | | | | | | | | | | | | | | | | | |
| | | Six Months Ended
March 31, 2012 (Unaudited) | | | Year Ended September 30, | | | Year Ended October 31, | |
| Class C | | | 2011 | | | 20101 | | | 2009 | | | 20082 | |
Net asset value, beginning of period | | $ | 28.10 | | | $ | 29.39 | | | $ | 23.75 | | | $ | 21.49 | | | $ | 30.67 | |
Net investment loss | | | (0.22 | ) | | | (0.44 | )3 | | | (0.39 | )3 | | | (0.31 | )3 | | | (0.27 | )3 |
Net realized and unrealized gains (losses) on investments | | | 9.35 | | | | (0.85 | ) | | | 6.03 | | | | 2.57 | | | | (8.91 | ) |
| | | | | | | | | | | | | | | | | | | | |
Total from investment operations | | | 9.13 | | | | (1.29 | ) | | | 5.64 | | | | 2.26 | | | | (9.18 | ) |
Net asset value, end of period | | $ | 37.23 | | | $ | 28.10 | | | $ | 29.39 | | | $ | 23.75 | | | $ | 21.49 | |
Total return4 | | | 32.46 | % | | | (4.39 | )% | | | 23.80 | % | | | 10.52 | % | | | (29.96 | )% |
Ratios to average net assets (annualized) | | | | | | | | | | | | | | | | | | | | |
Gross expenses | | | 2.04 | % | | | 2.09 | % | | | 2.13 | % | | | 2.19 | % | | | 2.18 | % |
Net expenses | | | 1.93 | % | | | 1.97 | % | | | 2.09 | % | | | 2.11 | % | | | 2.15 | % |
Net investment loss | | | (1.29 | )% | | | (1.35 | )% | | | (1.60 | )% | | | (1.43 | )% | | | (1.58 | )% |
Supplemental data | | | | | | | | | | | | | | | | | | | | |
Portfolio turnover rate | | | 51 | % | | | 104 | % | | | 108 | % | | | 203 | % | | | 179 | % |
Net assets, end of period (000’s omitted) | | | $7,989 | | | | $6,428 | | | | $174 | | | | $268 | | | | $21 | |
| 1. | For the eleven months ended September 30, 2010. The Fund changed its fiscal year end from October 31 to September 30, effective September 30, 2010. |
| 2. | For the period from March 31, 2008 (commencement of class operations) to October 31, 2008 |
| 3. | Calculated based upon average shares outstanding |
| 4. | Returns for periods of less than one year are not annualized. |
The accompanying notes are an integral part of these financial statements.
| | | | | | |
| Financial Highlights | | Wells Fargo Advantage Enterprise Fund | | | 19 | |
(For a share outstanding throughout each period)
| | | | | | | | | | | | | | | | | | | | | | | | | | | | |
| | | Six Months Ended
March 31, 2012 (Unaudited) | | | Year Ended September 30, | | | Year ended October 31, | |
| Administrator Class | | | 2011 | | | 20101 | | | 2009 | | | 2008 | | | 2007 | | | 2006 | |
Net asset value, beginning of period | | $ | 29.93 | | | $ | 31.03 | | | $ | 24.86 | | | $ | 22.27 | | | $ | 38.71 | | | $ | 29.83 | | | $ | 25.95 | |
Net investment income (loss) | | | (0.08 | )2 | | | (0.24 | ) | | | (0.17 | )2 | | | (0.09 | )2 | | | (0.18 | )2 | | | (0.18 | )2 | | | 0.07 | |
Net realized and unrealized gains (losses) on investments | | | 9.96 | | | | (0.86 | ) | | | 6.34 | | | | 2.68 | | | | (16.26 | ) | | | 9.06 | | | | 3.81 | |
| | | | | | | | | | | | | | | | | | | | | | | | | | | | |
Total from investment operations | | | 9.88 | | | | (1.10 | ) | | | 6.17 | | | | 2.59 | | | | (16.44 | ) | | | 8.88 | | | | 3.88 | |
Net asset value, end of period | | $ | 39.81 | | | $ | 29.93 | | | $ | 31.03 | | | $ | 24.86 | | | $ | 22.27 | | | $ | 38.71 | | | $ | 29.83 | |
Total return3 | | | 33.01 | % | | | (3.54 | )% | | | 24.87 | % | | | 11.59 | % | | | (42.47 | )% | | | 29.77 | % | | | 14.95 | % |
Ratios to average net assets (annualized) | | | | | | | | | | | | | | | | | | | | | | | | | | | | |
Gross expenses | | | 1.12 | % | | | 1.17 | % | | | 1.21 | % | | | 1.26 | % | | | 1.26 | % | | | 1.24 | % | | | 1.23 | % |
Net expenses | | | 1.12 | % | | | 1.15 | % | | | 1.15 | % | | | 1.15 | % | | | 1.15 | % | | | 1.15 | % | | | 1.15 | % |
Net investment loss | | | (0.48 | )% | | | (0.62 | )% | | | (0.66 | )% | | | (0.44 | )% | | | (0.55 | )% | | | (0.54 | )% | | | (0.63 | )% |
Supplemental data | | | | | | | | | | | | | | | | | | | | | | | | | | | | |
Portfolio turnover rate | | | 51 | % | | | 104 | % | | | 108 | % | | | 203 | % | | | 179 | % | | | 117 | % | | | 118 | % |
Net assets, end of period (000’s omitted) | | | $18,129 | | | | $22,811 | | | | $16,760 | | | | $16,000 | | | | $14,677 | | | | $3,358 | | | | $2,553 | |
| 1. | For the eleven months ended September 30, 2010. The Fund changed its fiscal year end from October 31 to September 30, effective September 30, 2010. |
| 2. | Calculated based upon average shares outstanding |
| 3. | Returns for periods of less than one year are not annualized |
The accompanying notes are an integral part of these financial statements.
| | | | |
| 20 | | Wells Fargo Advantage Enterprise Fund | | Financial Highlights |
(For a share outstanding throughout each period)
| | | | | | | | | | | | | | | | | | | | | | | | | | | | |
| | | Six Months Ended
March 31, 2012 (Unaudited) | | | Year Ended September 30, | | | Year Ended October 31, | |
| Institutional Class | | | 2011 | | | 20101 | | | 2009 | | | 2008 | | | 2007 | | | 2006 | |
Net asset value, beginning of period | | $ | 30.38 | | | $ | 31.42 | | | $ | 25.11 | | | $ | 22.44 | | | $ | 38.90 | | | $ | 29.90 | | | $ | 25.95 | |
Net investment loss | | | (0.04 | )2 | | | (0.13 | )2 | | | (0.11 | )2 | | | (0.04 | )2 | | | (0.10 | )2 | | | (0.10 | )2 | | | (0.34 | )2 |
Net realized and unrealized gains (losses) on investments | | | 10.12 | | | | (0.91 | ) | | | 6.42 | | | | 2.71 | | | | (16.36 | ) | | | 9.10 | | | | 4.29 | |
| | | | | | | | | | | | | | | | | | | | | | | | | | | | |
Total from investment operations | | | 10.08 | | | | (1.04 | ) | | | 6.31 | | | | 2.67 | | | | (16.46 | ) | | | 9.00 | | | | 3.95 | |
Net asset value, end of period | | $ | 40.46 | | | $ | 30.38 | | | $ | 31.42 | | | $ | 25.11 | | | $ | 22.44 | | | $ | 38.90 | | | $ | 29.90 | |
Total return3 | | | 33.18 | % | | | (3.31 | )% | | | 25.13 | % | | | 11.90 | % | | | (42.31 | )% | | | 30.10 | % | | | 15.22 | % |
Ratios to average net assets (annualized) | | | | | | | | | | | | | | | | | | | | | | | | | | | | |
Gross expenses | | | 0.86 | % | | | 0.90 | % | | | 0.94 | % | | | 0.99 | % | | | 0.98 | % | | | 0.97 | % | | | 0.98 | % |
Net expenses | | | 0.85 | % | | | 0.89 | % | | | 0.90 | % | | | 0.90 | % | | | 0.90 | % | | | 0.90 | % | | | 0.90 | % |
Net investment loss | | | (0.21 | )% | | | (0.37 | )% | | | (0.41 | )% | | | (0.18 | )% | | | (0.29 | )% | | | (0.30 | )% | | | (0.39 | )% |
Supplemental data | | | | | | | | | | | | | | | | | | | | | | | | | | | | |
Portfolio turnover rate | | | 51 | % | | | 104 | % | | | 108 | % | | | 203 | % | | | 179 | % | | | 117 | % | | | 118 | % |
Net assets, end of period (000’s omitted) | | | $110,910 | | | | $121,618 | | | | $106,931 | | | | $113,467 | | | | $104,121 | | | | $126,347 | | | | $36,587 | |
| 1. | For the eleven months ended September 30, 2010. The Fund changed its fiscal year end from October 31 to September 30, effective September 30, 2010. |
| 2. | Calculated based upon average shares outstanding |
| 3. | Returns for periods of less than one year are not annualized. |
The accompanying notes are an integral part of these financial statements.
| | | | | | |
| Financial Highlights | | Wells Fargo Advantage Enterprise Fund | | | 21 | |
(For a share outstanding throughout each period)
| | | | | | | | | | | | | | | | | | | | | | | | | | | | |
| | | Six Months Ended
March 31, 2012 (Unaudited) | | | Year Ended September 30, | | | Year Ended October 31, | |
| Investor Class | | | 2011 | | | 20101 | | | 2009 | | | 2008 | | | 2007 | | | 2006 | |
Net asset value, beginning of period | | $ | 28.75 | | | $ | 29.87 | | | $ | 23.99 | | | $ | 21.56 | | | $ | 37.62 | | | $ | 29.11 | | | $ | 25.43 | |
Net investment loss | | | (0.10 | )2 | | | (0.29 | )2 | | | (0.24 | )2 | | | (0.16 | )2 | | | (0.29 | )2 | | | (0.32 | )2 | | | (0.33 | )2 |
Net realized and unrealized gains (losses) on investments | | | 9.56 | | | | (0.83 | ) | | | 6.12 | | | | 2.59 | | | | (15.77 | ) | | | 8.83 | | | | 4.01 | |
| | | | | | | | | | | | | | | | | | | | | | | | | | | | |
Total from investment operations | | | 9.46 | | | | (1.12 | ) | | | 5.88 | | | | 2.43 | | | | (16.06 | ) | | | 8.51 | | | | 3.68 | |
Net asset value, end of period | | $ | 38.21 | | | $ | 28.75 | | | $ | 29.87 | | | $ | 23.99 | | | $ | 21.56 | | | $ | 37.62 | | | $ | 29.11 | |
Total return3 | | | 32.90 | % | | | (3.75 | )% | | | 24.56 | % | | | 11.22 | % | | | (42.69 | )% | | | 29.23 | % | | | 14.47 | % |
Ratios to average net assets (annualized) | | | | | | | | | | | | | | | | | | | | | | | | | | | | |
Gross expenses | | | 1.36 | % | | | 1.40 | % | | | 1.48 | % | | | 1.54 | % | | | 1.57 | % | | | 1.59 | % | | | 1.59 | % |
Net expenses | | | 1.25 | % | | | 1.36 | % | | | 1.43 | % | | | 1.46 | % | | | 1.53 | % | | | 1.57 | % | | | 1.56 | % |
Net investment loss | | | (0.61 | )% | | | (0.84 | )% | | | (0.94 | )% | | | (0.74 | )% | | | (0.91 | )% | | | (0.96 | )% | | | (1.05 | )% |
Supplemental data | | | | | | | | | | | | | | | | | | | | | | | | | | | | |
Portfolio turnover rate | | | 51 | % | | | 104 | % | | | 108 | % | | | 203 | % | | | 179 | % | | | 117 | % | | | 118 | % |
Net assets, end of period (000’s omitted) | | | $181,795 | | | | $144,883 | | | | $134,528 | | | | $117,725 | | | | $112,689 | | | | $209,651 | | | | $192,533 | |
| 1. | For the eleven months ended September 30, 2010. The Fund changed its fiscal year end from October 31 to September 30, effective September 30, 2010. |
| 2. | Calculated based upon average shares outstanding |
| 3. | Total return calculations do not include any sales charges. Returns for periods of less than one year are not annualized. |
The accompanying notes are an integral part of these financial statements.
| | | | |
| 22 | | Wells Fargo Advantage Enterprise Fund | | Notes to Financial Statements (Unaudited) |
1. ORGANIZATION
Wells Fargo Funds Trust (the “Trust”), a Delaware statutory trust organized on March 10, 1999, is an open-end management investment company registered under the Investment Company Act of 1940, as amended (the “1940 Act”). These financial statements report on Wells Fargo Advantage Enterprise Fund (the “Fund”) which is a diversified series of the Trust.
2. SIGNIFICANT ACCOUNTING POLICIES
The following significant accounting policies, which are consistently followed in the preparation of the financial statements of the Fund, are in conformity with U.S. generally accepted accounting principles which require management to make estimates and assumptions that affect the reported amounts of assets and liabilities, disclosure of contingent assets and liabilities at the date of the financial statements, and the reported amounts of revenues and expenses during the reporting period. Actual results could differ from those estimates.
Securities valuation
Investments in equity securities are valued each business day as of the close of regular trading on the New York Stock Exchange, which is usually 4:00 p.m. (Eastern Time). Securities which are traded on a national or foreign securities exchange are valued at the last reported sales price, except that securities listed on The Nasdaq Stock Market, Inc. (“Nasdaq”) are valued at the Nasdaq Official Closing Price (“NOCP”), and if no NOCP is available, then at the last reported sales price. If no sales price is shown on the Nasdaq, the bid price will be used. In the absence of any sale of securities listed on the Nasdaq, and in the case of other securities (including U.S. Government obligations, but excluding debt securities maturing in 60 days or less), the price will be deemed “stale” and the valuations will be determined in accordance with the Fund’s Fair Value Procedures.
Investments in open-end mutual funds and non-registered investment companies are generally valued at net asset value.
Investments which are not valued using any of the methods discussed above, are valued at their fair value, as determined by procedures established in good faith and approved by the Board of Trustees. The Board of Trustees has established a Valuation Committee comprised of the Trustees and has delegated to it the authority to take any actions regarding the valuation of portfolio securities that the Valuation Committee deems necessary in determining the fair value of portfolio securities, unless the responsibility has been delegated to the Management Valuation Team of Wells Fargo Funds Management, LLC (“Funds Management”). The Board of Trustees retains the authority to make or ratify any valuation decisions or approve any changes to the Fair Value Procedures as it deems appropriate. On a quarterly basis, the Board of Trustees considers for ratification any valuation actions taken by the Valuation Committee or the Management Valuation Team.
Valuations of fair valued prices are compared to the next actual sales price when available, or other appropriate market information to assess the continued appropriateness of the fair valuation methodology used. The securities are fair valued on a day-to-day basis, taking into consideration changes to appropriate market information and any significant changes to the input factors considered in the valuation process until there is a readily available price provided on the exchange or by an independent pricing service. Valuations received from an independent pricing service or broker quotes are periodically validated by comparisons to most recent trades and valuations provided by other independent pricing services in addition to the review of prices by the adviser and/or sub-adviser. Unobservable inputs used in determining fair valuations are identified based on the type of security, taking into consideration factors utilized by market participants in valuing the investment, knowledge about the issuer and the current market environment.
Foreign currency translation
The accounting records of the Fund are maintained in U.S. dollars. Assets, including investment securities, and liabilities denominated in foreign currency are translated into U.S. dollars at the prevailing rates of exchange at the date of valuation. Purchases and sales of securities, and income and expenses are translated at the prevailing rate of exchange on the respective dates of such transactions. Reported net realized foreign exchange gains or losses arise from sales of foreign currencies, currency gains or losses realized between the trade and settlement dates on securities transactions, and the difference between the amounts of dividends, interest and foreign withholding taxes recorded and the U.S. dollar equivalent of the amounts actually paid or received. Net unrealized foreign exchange gains and losses arise from changes in the fair value of assets and liabilities other than investments in securities resulting in changes in exchange rates.
| | | | | | |
| Notes to Financial Statements (Unaudited) | | Wells Fargo Advantage Enterprise Fund | | | 23 | |
The changes in net assets arising from changes in exchange rates and the changes in net assets resulting from changes in market prices of securities are not separately presented. Such changes are recorded with net realized and unrealized gains or losses from investments. Gains and losses from certain foreign currency transactions are treated as ordinary income for U.S. federal income tax purposes.
Security loans
The Fund may lend its securities from time to time in order to earn additional income in the form of fees or interest on securities received as collateral or the investment of any cash received as collateral. The Fund continues to receive interest or dividends on the securities loaned. The Fund receives collateral in the form of cash or securities with a value at least equal to the value of the securities on loan. The value of the loaned securities is determined at the close of each business day and any additional required collateral is delivered to the Fund on the next business day. In a securities lending transaction, the net asset value of the Fund will be affected by an increase or decrease in the value of the securities loaned and by an increase or decrease in the value of the instrument in which collateral is invested. The amount of securities lending activity undertaken by the Fund fluctuates from time to time. In the event of default or bankruptcy by the borrower, the Fund may be prevented from recovering the loaned securities or gaining access to the collateral or may experience delays or costs in doing so. In addition, the investment of any cash collateral received may lose all or part of its value. The Fund has the right under the lending agreement to recover the securities from the borrower on demand.
The Fund lends its securities through an unaffiliated securities lending agent. Cash collateral received in connection with its securities lending transactions is invested in Wells Fargo Securities Lending Cash Investments, LLC (the “Cash Collateral Fund”). The Cash Collateral Fund is exempt from registration under Section 3(c)(7) of the 1940 Act and is managed by Funds Management and is sub-advised by Wells Capital Management Incorporated (“Wells Capital Management”). Funds Management receives an advisory fee starting at 0.05% and declining to 0.01% as the average daily net assets of the Cash Collateral Fund increase. All of the fees received by Funds Management are paid to Wells Capital Management for its services as sub-adviser. The Cash Collateral Fund seeks to provide a positive return compared to the daily Fed Funds Open rate by investing in high-quality, U.S. dollar-denominated short-term money market instruments. Cash Collateral Fund investments are fair valued based upon the amortized cost valuation technique. Income earned from investment in the Cash Collateral Fund is included in securities lending income on the Statement of Operations.
For Wells Fargo Advantage Funds that participated in securities lending activity prior to February 13, 2009, certain structured investment vehicles purchased in a joint account by the former securities lending agent defaulted or were impaired. Certain of the Wells Fargo Advantage Funds still hold ownership interest in these structured investment vehicles, which have since been restructured as pass-through securities. If the Fund holds an ownership interest in such pass-through securities, information regarding this ownership interest can be found in the Portfolio of Investments under the category “Other”.
Security transactions and income recognition
Securities transactions are recorded on a trade date basis. Realized gains or losses are reported on the basis of identified cost of securities delivered.
Dividend income is recognized on the ex-dividend date. Dividend income is recorded net of foreign taxes withheld where recovery of such taxes is not assured.
Distributions to shareholders
Distributions to shareholders from net investment income and net realized gains, if any, are recorded on the ex-dividend date. Such distributions are determined in conformity with income tax regulations, which may differ from generally accepted accounting principles.
Federal and other taxes
The Fund intends to continue to qualify as a regulated investment company by distributing substantially all of its investment company taxable income and any net realized capital gains (after reduction for capital loss carryforwards) sufficient to relieve it from all, or substantially all, federal income taxes. Accordingly, no provision for federal income taxes was required.
| | | | |
| 24 | | Wells Fargo Advantage Enterprise Fund | | Notes to Financial Statements (Unaudited) |
The Fund’s income and federal excise tax returns and all financial records supporting those returns for the prior three fiscal years are subject to examination by the federal and Delaware revenue authorities. Management has analyzed the Fund’s tax positions taken on federal, state, and foreign tax returns for all open tax years and does not believe that there are any uncertain tax positions that require recognition of a tax liability.
Under the recently enacted Regulated Investment Company Modernization Act of 2010, the Fund is permitted to carry forward capital losses incurred in taxable years which began after December 22, 2010 for an unlimited period. However, any losses incurred are required to be utilized prior to the losses incurred in pre-enactment taxable years. As a result of this ordering rule, pre-enactment capital loss carryforwards may be more likely to expire unused. Additionally, post-enactment capital losses that are carried forward will retain their character as either short-term or long-term capital losses rather than being considered all short-term as under previous law.
As of September 30, 2011, the Fund had net capital loss carryforwards, which were available to offset future net realized capital gains, in the amount of $46,381,136 with $20,942,524 expiring in 2015, $22,887,718 expiring in 2017 and $2,550,894 expiring in 2019.
Class allocations
The separate classes of shares offered by the Fund differ principally in applicable sales charges, distribution, shareholder servicing and administration fees. Shareholders of each class bear certain expenses that pertain to that particular class. All shareholders bear the common expenses of the Fund, earn income from the portfolio, and are allocated unrealized gains and losses pro rata based on the average daily net assets of each class, without distinction between share classes. Dividends are determined separately for each class based on income and expenses allocable to each class. Realized gains and losses are allocated to each class pro rata based upon the net assets of each class on the date realized. Differences in per share dividend rates generally result from the relative weightings of pro rata income and realized gain allocations and from differences in separate class expenses, including distribution, shareholder servicing and administration fees.
3. FAIR VALUATION MEASUREMENTS
Fair value measurements of investments are determined within a framework that has established a fair value hierarchy based upon the various data inputs utilized in determining the value of the Fund’s investments. The three-level hierarchy gives the highest priority to unadjusted quoted prices in active markets for identical assets or liabilities (Level 1) and the lowest priority to significant unobservable inputs (Level 3). The Fund’s investments are classified within the fair value hierarchy based on the lowest level of input that is significant to the fair value measurement. The inputs are summarized into three broad levels as follows:
| n | | Level 1 – quoted prices in active markets for identical securities |
| n | | Level 2 – other significant observable inputs (including quoted prices for similar securities, interest rates, prepayment speeds, credit risk, etc.) |
| n | | Level 3 – significant unobservable inputs (including the Fund’s own assumptions in determining the fair value of investments) |
The inputs or methodologies used for valuing securities are not necessarily an indication of the risk associated with investing in those securities.
As of March 31, 2012, the inputs used in valuing the Fund’s assets, which are carried at fair value, were as follows:
| | | | | | | | | | | | | | | | |
| Investments in Securities | | Quoted Prices (Level 1) | | | Significant Other
Observable Inputs (Level 2) | | | Significant Unobservable Inputs (Level 3) | | | Total | |
Equity securities | | | | | | | | | | | | | | | | |
Common stocks | | $ | 698,010,441 | | | $ | 0 | | | $ | 0 | | | $ | 698,010,441 | |
Other | | | 0 | | | | 0 | | | | 1,784,735 | | | | 1,784,735 | |
Short-term investments | | | | | | | | | | | | | | | | |
Investment companies | | | 10,934,136 | | | | 109,915,011 | | | | 0 | | | | 120,849,147 | |
| | | $ | 708,944,577 | | | $ | 109,915,011 | | | $ | 1,784,735 | | | $ | 820,644,323 | |
Further details on the major security types listed above can be found in the Portfolio of Investments.
| | | | | | |
| Notes to Financial Statements (Unaudited) | | Wells Fargo Advantage Enterprise Fund | | | 25 | |
Transfers in and transfers out are recognized at the end of the reporting period. For the six months ended March 31, 2012, the Fund did not have any significant transfers into/out of Level 1 and Level 2.
4. TRANSACTIONS WITH AFFILIATES AND OTHER EXPENSES
Advisory fee
The Trust has entered into an advisory contract with Funds Management, an indirect wholly owned subsidiary of Wells Fargo & Company (“Wells Fargo”). The adviser is responsible for implementing investment policies and guidelines and for supervising the sub-adviser, who is responsible for day-to-day portfolio management of the Fund.
Pursuant to the contract, Funds Management is entitled to receive an annual advisory fee starting at 0.70% and declining to 0.60% as the average daily net assets of the Fund increase. For the six months ended March 31, 2012, the advisory fee was equivalent to an annual rate of 0.69% of the Fund’s average daily net assets.
Funds Management has retained the services of certain sub-advisers to provide daily portfolio management to the Fund. The fees related to sub-advisory services are borne directly by Funds Management and do not increase the overall fees paid by the Fund. Wells Capital Management, an affiliate of Funds Management, is the sub-adviser to the Fund and is entitled to receive a fee from Funds Management at an annual rate starting at 0.45% and declining to 0.30% as the average daily net assets of the Fund increase.
Administration and transfer agent fees
The Trust has entered into an administration agreement with Funds Management. Under this agreement, for providing administrative services, which includes paying fees and expenses for services provided by the transfer agent, sub-transfer agents, omnibus account servicers and record-keepers, Funds Management is entitled to receive from the Fund an annual fund level administration fee starting at 0.05% and declining to 0.03% as the average daily net assets of the Fund increase and a class level administration fee which is calculated based on the average daily net assets of each class as follows:
| | | | |
| | | Class Level Administration Fee | |
Class A, Class B, Class C | | | 0.26 | % |
Administrator Class | | | 0.10 | |
Institutional Class | | | 0.08 | |
Investor Class | | | 0.33 | |
Funds Management has contractually waived and/or reimbursed advisory and administration fees to the extent necessary to maintain certain net operating expense ratios for the Fund. Waiver of fees and/or reimbursement of expenses by Funds Management were made first from fund level expenses on a proportionate basis and then from class specific expenses. Funds Management has committed through July 18, 2013 to waive fees and/or reimburse expenses to the extent necessary to cap the Fund’s expenses at 1.18% for Class A, 1.93% for Class B, 1.93% for Class C, 1.15% for Administrator Class, 0.85% for Institutional Class and 1.25% for Investor Class.
Distribution fees
The Trust has adopted a Distribution Plan for Class B and Class C shares of the Fund pursuant to Rule 12b-1 under the 1940 Act. Distribution fees are charged to Class B and Class C shares and paid to Wells Fargo Funds Distributor, LLC, the principal underwriter, at an annual rate of 0.75% of the average daily net assets of Class B and Class C shares.
For the six months ended March 31, 2012, Wells Fargo Funds Distributor, LLC received $1,704 from the sale of Class A shares and $61, $1,508 and $365 in contingent deferred sales charges from redemptions of Class A, Class B and Class C shares, respectively.
Shareholder servicing fees
The Trust has entered into contracts with one or more shareholder servicing agents, whereby Class A, Class B, Class C, Administrator Class and Investor Class of the Fund is charged a fee at an annual rate of 0.25% of the average daily net assets of each respective class.
| | | | |
| 26 | | Wells Fargo Advantage Enterprise Fund | | Notes to Financial Statements (Unaudited) |
A portion of these total shareholder servicing fees were paid to affiliates of Wells Fargo.
5. INVESTMENT PORTFOLIO TRANSACTIONS
Purchases and sales of investments, excluding U.S. Government obligations (if any) and short-term securities, for the six months ended March 31, 2012 were $344,884,138 and $447,891,275, respectively.
6. ACQUISITION
After the close of business on August 26, 2011, the Fund acquired the net assets of Wells Fargo Advantage Mid Cap Growth Fund. The purpose of the transaction was to combine two funds with similar investment objectives and strategies. Shareholders holding Class A, Class B, Class C, Administrator Class, Institutional Class and Investor shares of Wells Fargo Advantage Mid Cap Growth Fund received Class A, Class A, Class C, Administrator Class, Institutional Class and Investor Class shares, respectively, of the Fund in the reorganization. The acquisition was accomplished by a tax-free exchange of all of the shares of Wells Fargo Advantage Mid Cap Growth Fund for 13,702,286 shares of Wells Fargo Advantage Enterprise Fund valued at $414,773,456 at an exchange ratio of 0.16, 0.15, 0.15, 0.16, 0.16, and 0.16 for Class A, Class B, Class C, Administrator Class, Institutional Class and Investor Class shares, respectively. The investment portfolio of Wells Fargo Advantage Mid Cap Growth Fund with a fair value of $412,740,595, identified cost of $473,427,369 and unrealized losses of $60,686,774 at August 26, 2011 were the principal assets acquired by the Fund. The aggregate net assets of Wells Fargo Advantage Mid Cap Growth Fund and the Fund immediately prior to the acquisition were $414,773,456 and $224,429,514, respectively. The aggregate net assets of the Fund immediately after the acquisition were $639,202,970. For financial reporting purposes, assets received and shares issued by the Fund were recorded at fair value; however, the cost basis of the investments received from Wells Fargo Advantage Mid Cap Growth Fund was carried forward to align ongoing reporting of the Fund’s realized and unrealized gains and losses with amounts distributable to shareholders for tax purposes.
Assuming the acquisition had been completed October 1, 2010, the beginning of the annual reporting period for the Fund, the pro forma results of operations for the year ended September 30, 2011 would have been:
| | | | |
Net investment loss | | $ | (4,691,686 | ) |
Net realized and unrealized gains on investments | | $ | 38,867,844 | |
Net increase in net assets resulting from operations | | $ | 34,176,158 | |
7. BANK BORROWINGS
The Trust (excluding the money market funds) and Wells Fargo Variable Trust are parties to a $150,000,000 revolving credit agreement with State Street Bank and Trust Company, whereby the Fund is permitted to use bank borrowings for temporary or emergency purposes, such as to fund shareholder redemption requests. Interest under the credit agreement is charged to the Fund based on a borrowing rate equal to the higher of the Federal Funds rate in effect on that day plus 1.25% or the overnight LIBOR rate in effect on that day plus 1.25%. In addition, an annual commitment fee equal to 0.10% of the unused balance is allocated to each participating fund. For the six months ended March 31, 2012, the Fund paid $536 in commitment fees.
For the six months ended March 31, 2012, there were no borrowings by the Fund under the agreement.
8. INDEMNIFICATION
Under the Trust’s organizational documents, the officers and directors are indemnified against certain liabilities that may arise out of performance of their duties to the Trust. Additionally, in the normal course of business, the Trust may enter into contracts with service providers that contain a variety of indemnification clauses. The Trust’s maximum exposure under these arrangements is dependent on future claims that may be made against the Fund and, therefore, cannot be estimated.
9. NEW ACCOUNTING PRONOUNCEMENTS
In December 2011, the Financial Accounting Standards Board (“FASB”) issued Accounting Standard Update (“ASU”) No. 2011-11, Disclosures about Offsetting Assets and Liabilities. ASU 2011-11, which amends FASB ASC Topic 210 Balance Sheet, creates new disclosure requirements requiring entities to disclose both gross and net information for derivatives and other financial instruments that are either offset in the Statement of Assets and Liabilities or subject to an enforceable
| | | | | | |
| Notes to Financial Statements (Unaudited) | | Wells Fargo Advantage Enterprise Fund | | | 27 | |
master netting arrangement or similar agreement. The disclosure requirements are effective for interim and annual reporting periods beginning on or after January 1, 2013. Management is currently evaluating the impact of the update’s adoption on the Fund’s financial statement disclosures.
In May 2011, FASB issued ASU No. 2011-04 “Amendments to Achieve Common Fair Value Measurement and Disclosure Requirements in U.S. GAAP and IFRSs”. ASU No. 2011-04 amends FASB ASC Topic 820, Fair Value Measurements and Disclosures, to establish common requirements for measuring fair value and for disclosing information about fair value measurements in accordance with GAAP. The ASU is effective prospectively for interim and annual periods beginning after December 15, 2011. Management expects that adoption of the ASU will result in additional disclosures in the financial statements, as applicable.
In April 2011, FASB issued ASU No. 2011-03 “Reconsideration of Effective Control for Repurchase Agreements”. ASU No. 2011-03 amends FASB ASC Topic 860, Transfers and Servicing, specifically the criteria required to determine whether a repurchase agreement (repo) and similar agreements should be accounted for as sales of financial assets or secured borrowings with commitments. ASU No. 2011-03 changes the assessment of effective control by focusing on the transferor’s contractual rights and obligations and removing the criterion to assess its ability to exercise those rights or honor those obligations. This could result in changes to the way entities account for certain transactions including repurchase agreements, mortgage dollar rolls and reverse repurchase agreements. The ASU will become effective on a prospective basis for new transfers and modifications to existing transactions as of the beginning of the first interim or annual period beginning on or after December 15, 2011. Management has evaluated the impact of adopting the ASU and expects no significant changes.
| | | | |
| 28 | | Wells Fargo Advantage Enterprise Fund | | Other Information (Unaudited) |
PROXY VOTING INFORMATION
A description of the policies and procedures that the Fund uses to determine how to vote proxies relating to portfolio securities is available without charge, upon request, by calling 1-800-222-8222, visiting our Web site at wellsfargoadvantagefunds.com, or visiting the SEC Web site at sec.gov. Information regarding how the Fund voted proxies relating to portfolio securities during the most recent 12-month period ended June 30 is available without charge on the Fund’s Web site at wellsfargoadvantagefunds.com or by visiting the SEC Web site at sec.gov.
PORTFOLIO HOLDINGS INFORMATION
The complete portfolio holdings for the Fund are publicly available on the Fund’s Web site (wellsfargoadvantagefunds.com) on a monthly, 30-day or more delayed basis. In addition, top ten holdings information for the Fund is publicly available on the Fund’s Web site on a monthly, seven-day or more delayed basis. The Fund files its complete schedule of portfolio holdings with the SEC for the first and third quarters of each fiscal year on Form N-Q, which is available without charge by visiting the SEC Web site at sec.gov. In addition, the Fund’s Form N-Q may be reviewed and copied at the SEC’s Public Reference Room in Washington, DC, and at regional offices in New York City, at 233 Broadway, and in Chicago, at 175 West Jackson Boulevard, Suite 900. Information about the Public Reference Room may be obtained by calling 1-800-SEC-0330.
| | | | | | |
| Other Information (Unaudited) | | Wells Fargo Advantage Enterprise Fund | | | 29 | |
BOARD OF TRUSTEES
The following table provides basic information about the Board of Trustees (the “Trustees”) of the Trust and Officers of the Trust. This table should be read in conjunction with the Prospectus and the Statement of Additional Information1 of the Fund. Each of the Trustees and Officers listed below acts in identical capacities for the Wells Fargo Advantage family of funds, which consists of 137 funds comprising the Wells Fargo Funds Trust, Wells Fargo Variable Trust, Wells Fargo Master Trust and four closed-end funds (collectively the “Fund Complex”). All of the Trustees are also Members of the Audit and Governance Committees of each Trust in the Fund Complex. The mailing address of each Trustee and Officer is 525 Market Street, 12th Floor, San Francisco, CA 94105. Each Trustee and Officer serves an indefinite term, however, each Trustee serves such term until reaching the mandatory retirement age established by the Trustees.
Independent Trustees
| | | | | | |
Name and Year of Birth | | Position Held and Length of Service | | Principal Occupations During Past Five Years | | Other Directorships During
Past Five Years |
Peter G. Gordon
(Born 1942) | | Trustee, since 1998; Chairman, since 2005 (Lead Trustee since 2001) | | Co-Founder, Retired Chairman, President and CEO of Crystal Geyser Water Company. Trustee Emeritus, Colby College | | Asset Allocation Trust |
Isaiah Harris, Jr.
(Born 1952) | | Trustee, since 2009 | | Retired. Prior thereto, President and CEO of BellSouth Advertising and Publishing Corp. from 2005 to 2007, President and CEO of BellSouth Enterprises from 2004 to 2005 and President of BellSouth Consumer Services from 2000 to 2003. Emeritus member of the Iowa State University Foundation Board of Governors. Emeritus Member of the Advisory Board of Iowa State University School of Business. Mr. Harris is a certified public accountant. | | CIGNA Corporation; Deluxe Corporation; Asset Allocation Trust |
Judith M. Johnson
(Born 1949) | | Trustee, since 2008 | | Retired. Prior thereto, Chief Executive Officer and Chief Investment Officer of Minneapolis Employees Retirement Fund from 1996 to 2008. Ms. Johnson is an attorney, certified public accountant and a certified managerial accountant. | | Asset Allocation Trust |
Leroy Keith, Jr.
(Born 1939) | | Trustee, since 2010 | | Chairman, Bloc Global Services (development and construction). Trustee of the Evergreen Funds from 1983 to 2010. Former Managing Director, Almanac Capital Management (commodities firm), former Partner, Stonington Partners, Inc. (private equity fund), former Director, Obagi Medical Products Co. and former Director, Lincoln Educational Services. | | Trustee, Virtus Fund Complex (consisting of 40 portfolios as of 12/31/11); Asset Allocation Trust |
David F. Larcker
(Born 1950) | | Trustee, since 2009 | | James Irvin Miller Professor of Accounting at the Graduate School of Business, Stanford University, Director of Corporate Governance Research Program and Senior Faculty of The Rock Center for Corporate Governance since 2006. From 2005 to 2008, Professor of Accounting at the Graduate School of Business, Stanford University. Prior thereto, Ernst & Young Professor of Accounting at The Wharton School, University of Pennsylvania from 1985 to 2005. | | Asset Allocation Trust |
Olivia S. Mitchell
(Born 1953) | | Trustee, since 2006 | | International Foundation of Employee Benefit Plans Professor, Wharton School of the University of Pennsylvania since 1993. Director of Wharton’s Pension Research Council and Boettner Center on Pensions & Retirement Research, and Research Associate at the National Bureau of Economic Research. Previously, Cornell University Professor from 1978 to 1993. | | Asset Allocation Trust |
| | | | |
| 30 | | Wells Fargo Advantage Enterprise Fund | | Other Information (Unaudited) |
| | | | | | |
Name and Year of Birth | | Position Held and Length of Service | | Principal Occupations During Past Five Years | | Other Directorships During
Past Five Years |
Timothy J. Penny
(Born 1951) | | Trustee, since 1996 | | President and CEO of Southern Minnesota Initiative Foundation, a non-profit organization, since 2007 and Senior Fellow at the Humphrey Institute Policy Forum at the University of Minnesota since 1995. Member of the Board of Trustees of NorthStar Education Finance, Inc., a non-profit organization, since 2007. | | Asset Allocation Trust |
Michael S. Scofield
(Born 1943) | | Trustee, since 2010 | | Served on the Investment Company Institute’s Board of Governors and Executive Committee from 2008-2011 as well the Governing Council of the Independent Directors Council from 2006-2011 and the Independent Directors Council Executive Committee from 2008-2011. Chairman of the IDC from 2008-2010. Institutional Investor (Fund Directions) Trustee of Year in 2007. Trustee of the Evergreen Funds (and its predecessors) from 1984 to 2010. Chairman of the Evergreen Funds from 2000-2010. Former Trustee of the Mentor Funds. Retired Attorney, Law Offices of Michael S. Scofield and former Director and Chairman, Branded Media Corporation (multi-media branding company). | | Asset Allocation Trust |
Donald C. Willeke
(Born 1940) | | Trustee, since 1996 | | Principal of the law firm of Willeke & Daniels. General Counsel of the Minneapolis Employees Retirement Fund from 1984 until its consolidation into the Minnesota Public Employees Retirement Association on June 30, 2010. Director and Vice Chair of The Free Trust (non-profit corporation). Director of the American Chestnut Foundation (non-profit corporation). | | Asset Allocation Trust |
Officers
| | | | | | |
Name and Year of Birth | | Position Held and
Length of Service | | Principal Occupations During Past Five Years | | |
Karla M. Rabusch
(Born 1959) | | President, since 2003 | | Executive Vice President of Wells Fargo Bank, N.A. and President of Wells Fargo Funds Management, LLC since 2003. Senior Vice President and Chief Administrative Officer of Wells Fargo Funds Management, LLC from 2001 to 2003. | | |
C. David Messman
(Born 1960) | | Secretary, since 2000; Chief Legal Counsel, since 2003 | | Senior Vice President and Secretary of Wells Fargo Funds Management, LLC since 2001. Vice President and Managing Senior Counsel of Wells Fargo Bank, N.A. since 1996. | | |
Kasey Phillips
(Born 1970) | | Treasurer, since 2009 | | Senior Vice President of Wells Fargo Funds Management, LLC since 2009. Senior Vice President of Evergreen Investment Management Company, LLC from 2006 to 2010. Treasurer of the Evergreen Funds from 2005 to 2010. | | |
David Berardi
(Born 1975) | | Assistant Treasurer, since 2009 | | Vice President of Wells Fargo Funds Management, LLC since 2009. Vice President of Evergreen Investment Management Company, LLC from 2008 to 2010. Assistant Vice President of Evergreen Investment Services, Inc. from 2004 to 2008. Manager of Fund Reporting and Control for Evergreen Investment Management Company, LLC from 2004 to 2010. | | |
Jeremy DePalma
(Born 1974) | | Assistant Treasurer, since 2009 | | Senior Vice President of Wells Fargo Funds Management, LLC since 2009. Senior Vice President of Evergreen Investment Management Company, LLC from 2008 to 2010. Vice President, Evergreen Investment Services, Inc. from 2004 to 2007. Head of the Fund Reporting and Control Team within Fund Administration from 2005 to 2010. | | |
Debra Ann Early
(Born 1964) | | Chief Compliance Officer, since 2007 | | Chief Compliance Officer of Wells Fargo Funds Management, LLC since 2007. Chief Compliance Officer of Parnassus Investments from 2005 to 2007. Chief Financial Officer of Parnassus Investments from 2004 to 2007 and Senior Audit Manager of PricewaterhouseCoopers LLP from 1998 to 2004. | | |
| 1. | The Statement of Additional Information includes additional information about the Trustees and is available, without charge, upon request, by calling 1-800-222-8222 or by visiting the Web site at wellsfargoadvantagefunds.com. |
| | | | | | |
| Other Information (Unaudited) | | Wells Fargo Advantage Enterprise Fund | | | 31 | |
BOARD CONSIDERATION OF INVESTMENT ADVISORY AND SUB-ADVISORY AGREEMENTS:
Under Section 15 of the Investment Company Act of 1940 (the “1940 Act”), the Board of Trustees (the “Board”) of Wells Fargo Funds Trust (the “Trust”), all the members of which have no direct or indirect interest in the investment advisory and sub-advisory agreements and are not “interested persons” of the Trust, as defined in the 1940 Act (the “Independent Trustees”), must determine whether to approve the continuation of the Trust’s investment advisory and sub-advisory agreements. In this regard, at an in person meeting held on March 29-30, 2012 (the “Meeting”), the Board reviewed and re-approved: (i) an investment advisory agreement with Wells Fargo Funds Management, LLC (“Funds Management”) for Wells Fargo Advantage Enterprise Fund (the “Fund”) and (ii) an investment sub-advisory agreement with Wells Capital Management Incorporated (“Wells Capital Management”) for the Fund. The investment advisory agreement with Funds Management and the investment sub-advisory agreement with Wells Capital Management are collectively referred to as the “Advisory Agreements.”
At the Meeting, the Board considered the factors and reached the conclusions described below relating to the selection of Funds Management and Wells Capital Management and the continuation of the Advisory Agreements. Prior to the Meeting, the Trustees conferred extensively among themselves and with representatives of Funds Management about these matters. The Board also met throughout the year and received information that was useful to them in considering the continuation of the Advisory Agreements. The Independent Trustees were assisted in their evaluation of the Advisory Agreements by independent legal counsel, from whom they received separate legal advice and with whom they met separately from Funds Management.
In providing information to the Board, Funds Management and Wells Capital Management were guided by a detailed set of requests submitted by the Independent Trustees’ independent legal counsel on their behalf at the start of the Board’s annual contract renewal process earlier in 2012. In approving the Advisory Agreements, the Board did not identify any particular information or consideration that was all-important or controlling, and each Trustee likely attributed different weights to various factors.
Nature, extent and quality of services
The Board received and considered various information regarding the nature, extent and quality of services provided to the Fund by Funds Management and Wells Capital Management under the Advisory Agreements. The Board also received and considered, among other things, information about the background and experience of senior management of Funds Management, and the qualifications, backgrounds, tenures and responsibilities of the portfolio managers primarily responsible for the day-to-day portfolio management of the Fund.
The Board evaluated the ability of Funds Management and Wells Capital Management, based on their respective financial condition, resources, reputation and other attributes, to attract and retain qualified investment professionals, including research, advisory, and supervisory personnel. The Board further considered the compliance programs and compliance records of Funds Management and Wells Capital Management. In addition, the Board took into account the administrative services provided to the Fund by Funds Management and its affiliates.
The Board’s decision to approve the continuation of the Advisory Agreements was based on a comprehensive evaluation of all of the information provided to it. In considering these matters, the Board considered not only the specific information presented in connection with the Meeting, but also the knowledge gained over time through interaction with Funds Management and Wells Capital Management about various topics, including Funds Management’s oversight of service providers. The above factors, together with those referenced below, are some of the most important, but not necessarily all, factors considered by the Board in concluding that the nature, extent and quality of the investment advisory services provided to the Fund by Funds Management and Wells Capital Management supported the re-approval of the Advisory Agreements. Although the Board considered the continuation of the Advisory Agreements for the Fund as part of the larger process of considering the continuation of the advisory agreements for all of the funds in the complex, its decision to continue the Advisory Agreements for the Fund was ultimately made on a fund-by-fund basis.
Fund performance and expenses
The Board considered the performance results for the Fund over various time periods ended December 31, 2011. The Board also considered these results in comparison to the median performance of a universe of relevant funds (the “Universe”) that was determined by Lipper Inc. (“Lipper”) to be similar to the Fund, and in comparison to the Fund’s
| | | | |
| 32 | | Wells Fargo Advantage Enterprise Fund | | Other Information (Unaudited) |
benchmark index and to other comparative data. Lipper is an independent provider of investment company data. The Board received a description of the methodology used by Lipper to select the mutual funds in the Universe. The Board noted that, except for the one-year period, the performance of the Fund was higher than or in range of the median performance of the Universe and its benchmark index, the Lipper Multi-Cap Growth Funds Index, for all other periods under review.
The Board received and considered information regarding the Fund’s contractual advisory fee and net operating expense ratios and their various components, including actual management fees (which reflect fee waivers, if any), transfer agent, custodian and other non-management fees, Rule 12b-1 and non-Rule 12b-1 fees, service fees and fee waiver and expense reimbursement arrangements. The Board also considered these ratios in comparison to the median ratios of an expense Universe and a narrower expense group of mutual funds (each, an “Expense Group”) that was determined by Lipper to be similar to the Fund. The Board received a description of the methodology used by Lipper to select the mutual funds in the Fund’s Expense Group. The Board noted that the net operating expense ratios of the Fund were equal to or lower than the Fund’s Expense Group’s median net operating expense ratios.
Based on the above-referenced considerations and other factors, the Board concluded that the overall performance and expense structure of the Fund supported the re-approval of the Advisory Agreements for the Fund.
Investment advisory and sub-advisory fee rates
The Board reviewed and considered the contractual investment advisory fee rate that is payable by the Fund to Funds Management for investment advisory services (the “Advisory Agreement Rate”), both on a stand-alone basis and on a combined basis with the Fund’s administration fee rate. The Board took into account the separate administrative and other services covered by the administration fee rate. The Board also reviewed and considered the contractual investment sub-advisory fee rate that is payable by Funds Management to Wells Capital Management for investment sub-advisory services (the “Sub-Advisory Agreement Rate”). In addition, the Board reviewed and considered the existing fee waiver/cap arrangements applicable to the Advisory Agreement Rate and considered the Advisory Agreement Rate after taking the waivers/caps into account (the “Net Advisory Rate”).
The Board received and considered information comparing the Advisory Agreement Rate and Net Advisory Rate with those of other funds in the Fund’s Expense Group median. The Board noted that, except for the Institutional class, the Advisory Agreement Rate and Net Advisory Rate for the Fund were higher than the median rates for the Fund’s Expense Group. The Board received a report from Funds Management that noted that the Fund was benefiting from Advisory Agreement Rate breakpoints, the Fund’s net operating expense caps had been lowered the previous year and the expense caps would be extended until January 31, 2014.
The Board also received and considered information about the nature and extent of services offered and fee rates charged by Funds Management and Wells Capital Management to other types of clients. In this regard, the Board received information about differences between the services, and the compliance, reporting, and other legal burdens and risks of providing investment advice to mutual funds and those associated with providing advice to non-mutual fund clients such as collective funds or institutional separate accounts.
The Board determined that the Advisory Agreement Rate for the Fund, both with and without an administration fee rate and before and after waivers, was reasonable in light of the Fund’s Expense Group information, the net expense ratio commitments, the services covered by the Advisory Agreements and other information provided. The Board also reviewed and considered the Sub-Advisory Agreement Rate and concluded that the Sub-Advisory Agreement Rate was reasonable in light of the services covered by the Sub-Advisory Agreement, the sub-advised expense information provided by Lipper, and other information provided.
Profitability
The Board received and considered a profitability analysis of Funds Management, as well as an analysis of the profitability to the collective Wells Fargo businesses that provide services to the Fund. It considered that the information provided to it was necessarily estimated, and that the profitability information provided to it, especially on a fund-by-fund basis, did not necessarily provide a precise tool for evaluating the appropriateness of the Fund’s Advisory Agreement Rate in isolation. It noted that the levels of profitability reported on a fund-by-fund basis varied widely, depending on, among other things, the size and type of fund. The Board concluded that the profitability reported by Funds Management was not unreasonable.
| | | | | | |
| Other Information (Unaudited) | | Wells Fargo Advantage Enterprise Fund | | | 33 | |
The Board did not consider separate profitability information with respect to Wells Capital Management, because, as an affiliate of Funds Management, its profitability information was subsumed in the collective Wells Fargo profitability analysis provided by Funds Management.
Economies of scale
With respect to possible economies of scale, the Board reviewed the breakpoints in the Fund’s advisory fee structure, which operate generally to reduce the effective Advisory Agreement Rate of the Fund (as a percentage of Fund assets) as the Fund grows in size. It considered that, as a fund shrinks in size, breakpoints conversely result in increasing fee levels. The Board noted that it would have on-going opportunities to review the appropriate levels of breakpoints in the future, and concluded that the breakpoints as implemented appeared to be a reasonable step toward sharing economies of scale, if any, with the Fund. However, the Board acknowledged the inherent limitations of any analysis of an investment adviser’s economies of scale and of any attempt to correlate breakpoints with such economies, stemming largely from the Board’s understanding that economies of scale are realized, if at all, by an investment adviser across a variety of products and services, not just with respect to a single fund.
Other benefits to Funds Management and Wells Capital Management
The Board received and considered information regarding potential “fall-out” or ancillary benefits received by Funds Management and its affiliates, including Wells Capital Management, as a result of their relationship with the Fund. Ancillary benefits could include, among others, benefits directly attributable to the relationship of Funds Management and Wells Capital Management with the Fund and benefits potentially derived from an increase in Funds Management’s and Wells Capital Management’s business as a result of their relationship with the Fund (such as the ability to market to shareholders other financial products offered by Funds Management and its affiliates, including Wells Capital Management).
The Board considered that Wells Fargo Funds Distributor, LLC, an affiliate of Funds Management, serves as distributor to the Fund and receives certain compensation for those services. The Board noted that various financial institutions, including affiliates of Funds Management, may receive distribution-related fees, shareholder servicing payments (including amounts derived from payments under Rule 12b-1 plans) and sub-transfer agency fees in respect of shares sold or held through them and services provided.
The Board also reviewed information about whether and to what extent soft dollar credits are sought and how any such credits are utilized and any benefits that may be realized by using an affiliated broker.
Other factors and broader review
The Board also considered the markets for distribution of the Fund’s shares, including the channels through which the Fund’s shares are offered and sold. The Board noted that the Fund is part of one of the few fund families that have both direct-to-fund and intermediary distribution channels. As discussed above, the Board reviews detailed materials received from Funds Management and Wells Capital Management annually as part of the re-approval process under Section 15 of the 1940 Act and also reviews and assesses information about the quality of the services that the Fund receives throughout the year. In this regard, the Board has reviewed reports of Funds Management at each of its quarterly meetings, which include, among other things, portfolio reviews and performance reports. In addition, the Board confers with portfolio managers at various times throughout the year.
Conclusion
After considering the above-described factors and based on its deliberations and its evaluation of the information described above, the Board unanimously approved the continuation of the Advisory Agreements for an additional one-year period.
| | | | |
| 34 | | Wells Fargo Advantage Enterprise Fund | | List of Abbreviations |
The following is a list of common abbreviations for terms and entities which may have appeared in this report.
| ACB | — Agricultural Credit Bank |
| ADR | — American Depository Receipt |
| ADS | — American Depository Shares |
| AGC-ICC | — Assured Guaranty Corporation - Insured Custody Certificates |
| AGM | — Assured Guaranty Municipal |
| AMBAC | — American Municipal Bond Assurance Corporation |
| AMT | — Alternative Minimum Tax |
| BAN | — Bond Anticipation Notes |
| BHAC | — Berkshire Hathaway Assurance Corporation |
| CAB | — Capital Appreciation Bond |
| CCAB | — Convertible Capital Appreciation Bond |
| CDA | — Community Development Authority |
| CDO | — Collateralized Debt Obligation |
| COP | — Certificate of Participation |
| DRIVER | — Derivative Inverse Tax-Exempt Receipts |
| DW&P | — Department of Water & Power |
| DWR | — Department of Water Resources |
| ECFA | — Educational & Cultural Facilities Authority |
| EDA | — Economic Development Authority |
| EDFA | — Economic Development Finance Authority |
| ETF | — Exchange-Traded Fund |
| FFCB | — Federal Farm Credit Bank |
| FGIC | — Financial Guaranty Insurance Corporation |
| FHA | — Federal Housing Authority |
| FHLB | — Federal Home Loan Bank |
| FHLMC | — Federal Home Loan Mortgage Corporation |
| FICO | — The Financing Corporation |
| FNMA | — Federal National Mortgage Association |
| GDR | — Global Depository Receipt |
| GNMA | — Government National Mortgage Association |
| HCFR | — Healthcare Facilities Revenue |
| HEFA | — Health & Educational Facilities Authority |
| HEFAR | — Higher Education Facilities Authority Revenue |
| HFA | — Housing Finance Authority |
| HFFA | — Health Facilities Financing Authority |
| IBC | — Insured Bond Certificate |
| IDA | — Industrial Development Authority |
| IDAG | — Industrial Development Agency |
| IDR | — Industrial Development Revenue |
| KRW | — Republic of Korea Won |
| LIBOR | — London Interbank Offered Rate |
| LLC | — Limited Liability Company |
| LLP | — Limited Liability Partnership |
| MBIA | — Municipal Bond Insurance Association |
| MFHR | — Multi-Family Housing Revenue |
| MSTR | — Municipal Securities Trust Receipts |
| MUD | — Municipal Utility District |
| NATL-RE | — National Public Finance Guarantee Corporation |
| PCFA | — Pollution Control Finance Authority |
| PCR | — Pollution Control Revenue |
| PFA | — Public Finance Authority |
| PFFA | — Public Facilities Financing Authority |
| PFOTER | — Puttable Floating Option Tax-Exempt Receipts |
| plc | — Public Limited Company |
| PUTTER | — Puttable Tax-Exempt Receipts |
| R&D | — Research & Development |
| RDA | — Redevelopment Authority |
| RDFA | — Redevelopment Finance Authority |
| REIT | — Real Estate Investment Trust |
| ROC | — Reset Option Certificates |
| SAVRS | — Select Auction Variable Rate Securities |
| SBA | — Small Business Authority |
| SFHR | — Single Family Housing Revenue |
| SFMR | — Single Family Mortgage Revenue |
| SPDR | — Standard & Poor’s Depositary Receipts |
| STRIPS | — Separate Trading of Registered Interest and Principal Securities |
| TAN | — Tax Anticipation Notes |
| TIPS | — Treasury Inflation-Protected Securities |
| TRAN | — Tax Revenue Anticipation Notes |
| TCR | — Transferable Custody Receipts |
| TTFA | — Transportation Trust Fund Authority |
| TVA | — Tennessee Valley Authority |
| XLCA | — XL Capital Assurance |


FOR MORE INFORMATION
More information about Wells Fargo Advantage Funds is available free upon request. To obtain literature, please write, e-mail, visit the Fund’s Web site, or call:
Wells Fargo Advantage Funds
P.O. Box 8266
Boston, MA 02266-8266
E-mail: wfaf@wellsfargo.com
Web site: wellsfargoadvantagefunds.com
Individual investors: 1-800-222-8222
Retail investment professionals: 1-888-877-9275
Institutional investment professionals: 1-866-765-0778
This report and the financial statements contained herein are submitted for the general information of the shareholders of Wells Fargo Advantage Funds. If this report is used for promotional purposes, distribution of the report must be accompanied or preceded by a current prospectus. For a prospectus containing more complete information, including charges and expenses, call 1-800-222-8222 or visit the Fund’s Web site at wellsfargoadvantagefunds.com. Please consider the investment objectives, risks, charges, and expenses of the investment carefully before investing. This and other information about Wells Fargo Advantage Funds can be found in the current prospectus. Read the prospectus carefully before you invest or send money.
Wells Fargo Funds Management, LLC, a wholly owned subsidiary of Wells Fargo & Company, provides investment advisory and administrative services for Wells Fargo Advantage Funds. Other affiliates of Wells Fargo & Company provide subadvisory and other services for the Funds. The Funds are distributed by Wells Fargo Funds Distributor, LLC, Member FINRA/SIPC, an affiliate of Wells Fargo & Company.
NOT FDIC INSURED ¡ NO BANK GUARANTEE ¡ MAY LOSE VALUE
© 2012 Wells Fargo Funds Management, LLC. All rights reserved.
| | |
 | | 208990 05-12 SA231/SAR231 3-12 |

Wells Fargo Advantage Opportunity FundSM

Semi-Annual Report
March 31, 2012

Reduce clutter. Save trees.
Sign up for electronic delivery of prospectuses and shareholder reports at wellsfargo.com/advantagedelivery
Contents
The views expressed and any forward-looking statements are as of March 31, 2012, unless otherwise noted, and are those of the Fund managers and/or Wells Fargo Funds Management, LLC. Discussions of individual securities, or the markets generally, or any Wells Fargo Advantage Fund are not intended as individual recommendations. Future events or results may vary significantly from those expressed in any forward-looking statements; the views expressed are subject to change at any time in response to changing circumstances in the market. Wells Fargo Funds Management, LLC, disclaims any obligation to publicly update or revise any views expressed or forward-looking statements.
NOT FDIC INSURED ¡ NO BANK GUARANTEE ¡ MAY LOSE VALUE

WELLS FARGO INVESTMENT HISTORY
| | |
| |
| 1932 | | Keystone creates one of the first mutual fund families. |
| |
| 1971 | | Wells Fargo & Company introduces one of the first institutional index funds. |
| |
| 1978 | | Wells Fargo applies Markowitz and Sharpe’s research on Modern Portfolio Theory to introduce one of the industry’s first Tactical Asset Allocation (TAA) models in institutional separately managed accounts. |
| |
| 1984 | | Wells Fargo Stagecoach Funds launches its first asset allocation fund. |
| |
| 1989 | | The Tactical Asset Allocation (TAA) Model is first applied to Wells Fargo’s asset allocation mutual funds. |
| |
| 1994 | | Wells Fargo introduces the LifePath Funds, one of the first suites of target date funds (now the Wells Fargo Advantage Dow Jones Target Date FundsSM). |
| |
| 1996 | | Evergreen Investments and Keystone Funds merge. |
| |
| 1997 | | Wells Fargo launches Wells Fargo Advantage WealthBuilder PortfoliosSM, a fund-of-funds suite of products that includes the use of quantitative models to shift assets among investment styles. |
| |
| 1999 | | Norwest Advantage Funds and Stagecoach Funds are reorganized into Wells Fargo Funds after the merger of Norwest and Wells Fargo. |
| |
| 2002 | | Evergreen Retail and Evergreen Institutional companies form the umbrella asset management company, Evergreen Investments. |
| |
| 2005 | | The integration of Strong Funds with Wells Fargo Funds creates Wells Fargo Advantage Funds, resulting in one of the top 20 mutual fund companies in the United States. |
| |
| 2006 | | Wells Fargo Advantage Funds relaunches the target date product line as Wells Fargo Advantage Dow Jones Target Date Funds. |
| |
| 2010 | | The mergers and reorganizations of Evergreen and Wells Fargo Advantage mutual funds are completed, unifying the families under the brand of Wells Fargo Advantage Funds. |
Wells Fargo Advantage Funds®
Wells Fargo Advantage Funds skillfully guides institutions, financial advisors, and individuals through the investment terrain to help them reach their financial objectives. Everything we do on behalf of investors is backed by our unique combination of qualifications.
Strength
Our organization is built on the standards of integrity and service established by our parent company—Wells Fargo & Company—more than 150 years ago. And, because we’re part of a highly diversified financial enterprise, we offer the depth of resources to help investors succeed.
Expertise
Our multi-boutique model offers investors access to the independent thinking of premier investment managers that have been chosen for their time-tested strategies. While each team specializes in a specific investment strategy, collectively they provide investors a wide choice of distinct investment styles. Our dedication to investment excellence doesn’t end with our expertise in manager selection—risk management, analysis, and rigorous ongoing review seek to ensure each manager’s investment process remains consistent.
Partnership
Our collaborative approach is built around understanding the needs and goals of our clients. By adhering to core principles of sound judgment and steady guidance, we support you through every stage of the investment decision process.
Carefully consider a fund’s investment objectives, risks, charges, and expenses before investing. For a current prospectus and, if available, a summary prospectus, containing this and other information, visit wellsfargoadvantagefunds.com. Read it carefully before investing.
Wells Fargo Funds Management, LLC, a wholly owned subsidiary of Wells Fargo & Company, provides investment advisory and administrative services for Wells Fargo Advantage Funds®. Other affiliates of Wells Fargo & Company provide subadvisory and other services for the Funds. The Funds are distributed by Wells Fargo Funds Distributor, LLC, Member FINRA/SIPC, an affiliate of Wells Fargo & Company.
“Dow Jones®” and “Dow Jones Target Date IndexesSM” are service marks of Dow Jones Trademark Holdings, LLC (“Dow Jones”), have been licensed to CME Group Index Services LLC (“CME Indexes”) and have been sublicensed for use for certain purposes by Global Index Advisors, Inc, and Wells Fargo Funds Management, LLC. The Wells Fargo Advantage Dow Jones Target Date FundsSM based on the Dow Jones Target Date IndexesSM, are not sponsored, endorsed, sold or promoted by Dow Jones, CME Indexes or their respective affiliates and none of them makes any representation regarding the advisability of investing in such product(s).
NOT FDIC INSURED ¡ NO BANK GUARANTEE ¡ MAY LOSE VALUE
Not part of the semi-annual report.
Wells Fargo Advantage Funds offers more than 110 mutual funds across a wide range of asset classes, representing over $213 billion in assets under management, as of March 31, 2012.
| | | | |
| Equity Funds | | | | |
Asia Pacific Fund | | Equity Value Fund | | Precious Metals Fund |
C&B Large Cap Value Fund | | Global Opportunities Fund | | Premier Large Company Growth Fund |
C&B Mid Cap Value Fund | | Growth Fund | | Small Cap Opportunities Fund |
Capital Growth Fund | | Index Fund | | Small Cap Value Fund |
Common Stock Fund | | International Equity Fund | | Small Company Growth Fund |
Disciplined U.S. Core Fund | | International Value Fund | | Small Company Value Fund |
Discovery Fund† | | Intrinsic Small Cap Value Fund | | Small/Mid Cap Core Fund |
Diversified Equity Fund | | Intrinsic Value Fund | | Small/Mid Cap Value Fund |
Diversified International Fund | | Intrinsic World Equity Fund | | Special Mid Cap Value Fund |
Diversified Small Cap Fund | | Large Cap Core Fund | | Special Small Cap Value Fund |
Emerging Growth Fund | | Large Cap Growth Fund | | Specialized Technology Fund |
Emerging Markets Equity Fund | | Large Company Value Fund | | Strategic Large Cap Growth Fund |
Endeavor Select Fund† | | Omega Growth Fund | | Traditional Small Cap Growth Fund |
Enterprise Fund† | | Opportunity Fund† | | Utility and Telecommunications Fund |
| Bond Funds | | | | |
Adjustable Rate Government Fund | | Inflation-Protected Bond Fund | | Short-Term Bond Fund |
California Limited-Term Tax-Free Fund | | Intermediate Tax/AMT-Free Fund | | Short-Term High Yield Bond Fund |
California Tax-Free Fund | | International Bond Fund | | Short-Term Municipal Bond Fund |
Colorado Tax-Free Fund | | Minnesota Tax-Free Fund | | Strategic Municipal Bond Fund |
Government Securities Fund | | Municipal Bond Fund | | Total Return Bond Fund |
High Income Fund | | North Carolina Tax-Free Fund | | Ultra Short-Term Income Fund |
High Yield Bond Fund | | Pennsylvania Tax-Free Fund | | Ultra Short-Term Municipal Income Fund |
Income Plus Fund | | Short Duration Government Bond Fund | | Wisconsin Tax-Free Fund |
| Asset Allocation Funds | | | | |
Absolute Return Fund | | WealthBuilder Equity Portfolio† | | Target 2020 Fund† |
Asset Allocation Fund | | WealthBuilder Growth Allocation Portfolio† | | Target 2025 Fund† |
Conservative Allocation Fund | | WealthBuilder Growth Balanced Portfolio† | | Target 2030 Fund† |
Diversified Capital Builder Fund | | WealthBuilder Moderate Balanced Portfolio† | | Target 2035 Fund† |
Diversified Income Builder Fund | | WealthBuilder Tactical Equity Portfolio† | | Target 2040 Fund† |
Growth Balanced Fund | | Target Today Fund† | | Target 2045 Fund† |
Index Asset Allocation Fund | | Target 2010 Fund† | | Target 2050 Fund† |
Moderate Balanced Fund | | Target 2015 Fund† | | Target 2055 Fund† |
WealthBuilder Conservative Allocation Portfolio† | | | | |
| Money Market Funds | | | | |
100% Treasury Money Market Fund | | Heritage Money Market Fund† | | National Tax-Free Money Market Fund |
California Municipal Money Market Fund | | Money Market Fund | | Prime Investment Money Market Fund |
Cash Investment Money Market Fund | | Municipal Cash Management Money Market Fund | | Treasury Plus Money Market Fund |
Government Money Market Fund | | Municipal Money Market Fund | | |
| Variable Trust Funds1 | | | | |
VT Discovery Fund† | | VT Intrinsic Value Fund | | VT Small Cap Growth Fund |
VT Index Asset Allocation Fund | | VT Omega Growth Fund | | VT Small Cap Value Fund |
VT International Equity Fund | | VT Opportunity Fund† | | VT Total Return Bond Fund |
An investment in a money market fund is not insured or guaranteed by the Federal Deposit Insurance Corporation or any other government agency. Although the Wells Fargo Advantage Money Market Funds seek to preserve the value of your investment at $1.00 per share, it is possible to lose money by investing in a money market fund.
| 1. | The Variable Trust Funds are generally available only through insurance company variable contracts. |
| † | In this report, the Wells Fargo Advantage Discovery FundSM, Wells Fargo Advantage Endeavor Select FundSM, Wells Fargo Advantage Enterprise FundSM, Wells Fargo Advantage Opportunity FundSM, Wells Fargo Advantage WealthBuilder Conservative Allocation PortfolioSM, Wells Fargo Advantage WealthBuilder Equity PortfolioSM, Wells Fargo Advantage WealthBuilder Growth Allocation PortfolioSM, Wells Fargo Advantage WealthBuilder Growth Balanced PortfolioSM, Wells Fargo Advantage WealthBuilder Moderate Balanced PortfolioSM, Wells Fargo Advantage WealthBuilder Tactical Equity PortfolioSM, Wells Fargo Advantage Dow Jones Target Today FundSM, Wells Fargo Advantage Dow Jones Target 2010 FundSM, Wells Fargo Advantage Dow Jones Target 2015 FundSM, Wells Fargo Advantage Dow Jones Target 2020 FundSM, Wells Fargo Advantage Dow Jones Target 2025 FundSM, Wells Fargo Advantage Dow Jones Target 2030 FundSM, Wells Fargo Advantage Dow Jones Target 2035 FundSM, Wells Fargo Advantage Dow Jones Target 2040 FundSM, Wells Fargo Advantage Dow Jones Target 2045 FundSM, Wells Fargo Advantage Dow Jones Target 2050 FundSM, Wells Fargo Advantage Dow Jones Target 2055 FundSM, Wells Fargo Advantage Heritage Money Market FundSM, Wells Fargo Advantage VT Discovery FundSM, and Wells Fargo Advantage VT Opportunity FundSM are referred to as the Discovery Fund, Endeavor Select Fund, Enterprise Fund, Opportunity Fund, WealthBuilder Conservative Allocation Portfolio, WealthBuilder Equity Portfolio, WealthBuilder Growth Allocation Portfolio, WealthBuilder Growth Balanced Portfolio, WealthBuilder Moderate Balanced Portfolio, WealthBuilder Tactical Equity Portfolio, Target Today Fund, Target 2010 Fund, Target 2015 Fund, Target 2020 Fund, Target 2025 Fund, Target 2030 Fund, Target 2035 Fund, Target 2040 Fund, Target 2045 Fund, Target 2050 Fund, Target 2055 Fund, Heritage Money Market Fund, VT Discovery Fund, and VT Opportunity Fund, respectively. |
Not part of the semi-annual report.
| | | | |
| 2 | | Wells Fargo Advantage Opportunity Fund | | Letter to Shareholders |

Karla M. Rabusch,
President
Wells Fargo Advantage Funds
The period was marked by increased confidence that the U.S. economy was staging a fragile recovery, offset by continued concerns about the possible effect on the global economy of the ongoing European sovereign debt crisis—which began in Greece and later spread to the larger economies of Italy and Spain. U.S. stock indexes posted solid gains for the period.
In contrast to worrisome data from the eurozone, U.S. economic data remained moderately positive.
Dear Valued Shareholder:
We’re pleased to offer you this semi-annual report for the Wells Fargo Advantage Opportunity Fund for the six-month period that ended March 31, 2012. The period was marked by increased confidence that the U.S. economy was staging a fragile recovery, offset by continued concerns about the possible effect on the global economy of the ongoing European sovereign debt crisis—which began in Greece and later spread to the larger economies of Italy and Spain. U.S. stock indexes posted solid gains for the period.
Macroeconomic optimism faded as global growth slowed and worries rose.
Prior to the reporting period, investors worried that the global economy was returning to a recession. Although second quarter U.S. gross domestic product (GDP) grew at a 1.3% annual rate, it was below the levels set in 2010 and seemed to confirm that the economy had slowed from its previous pace. Moreover, the drawn-out political debate over the raising of the U.S. debt ceiling reduced confidence that the national government would be able to work together to address the country’s problems. Partly as a result, Standard & Poor’s rating service downgraded U.S. long-term debt from AAA to AA+1 in August 2011.
Throughout the six-month period, concerns about the eurozone sovereign debt situation returned to center stage. Investors became increasingly concerned that Greece would default on its debt, a scenario that only seemed more likely as eurozone leaders began to openly discuss a “voluntary” haircut on Greek debt for private investors. Because many eurozone banks owned Greek debt and many U.S. banks had financial ties to eurozone banks, investors worried about the effect of such an event on the financial systems and the global economy. In October 2011, market participants turned their attention to the debt burdens of Italy—which also had its credit rating downgraded by Standard & Poor’s—because even though it had a relatively modest budget deficit, it had a high amount of outstanding debt and a stagnant economy. French banks were heavily exposed to Italian debt, so Italy’s woes led to fears of a state bailout of French banks and a resulting increase in France’s required expenditures.
After months of rumors and worries, the Greek credit crisis was finally addressed in March 2012 when the country came to an agreement with its creditors allowing it to write down the principal on most of its bonds in exchange for increased financial austerity. By the end of the reporting period, the Greek agreement, combined with unprecedented support for eurozone banks by the European Central Bank (ECB), seemed to calm investor concerns, at least temporarily.
The U.S. economy reported relatively solid news.
In contrast to worrisome data from the eurozone, U.S. economic data remained moderately positive. After disappointing reports for first and second quarter GDP growth, reported GDP came in at a 1.8% annualized rate in the third quarter of 2011, and then accelerated to a 3.0% annualized rate in the fourth quarter. The major banks appeared to have taken steps toward repairing their balance sheets; in March, the Federal Reserve (Fed) announced that 15 of the 19 major banks had passed a “stress test,” in which the Fed attempted to gauge whether the banks could survive a severe recession that included a 50% drop in the stock market and a 21% percent decline in housing prices.
| 1. | The ratings indicated are from Standard & Poor’s. Standard & Poor’s rates the creditworthiness of bonds, ranging from AAA (highest) to D (lowest). Ratings from A to CCC may be modified by the addition of a plus (+) or minus (-) sign to show relative standing within the rating categories. |
| | | | | | |
| Letter to Shareholders | | Wells Fargo Advantage Opportunity Fund | | | 3 | |
Bank stocks rebounded strongly after the Fed released details of the stress test, but all major market sectors rallied as investors became increasingly confident that the U.S. would not return to recession. Small-cap stocks modestly outperformed large-cap stocks, and growth stocks outperformed value stocks by an even smaller margin.
Central banks continued to provide stimulus.
Throughout the reporting period, the Federal Open Market Committee (FOMC) kept its key interest rates effectively at zero in order to support the economy and financial system. In the second quarter of 2011, the Fed completed its second round of monetary stimulus, in which it had planned to purchase $600 billion in long-term U.S. Treasuries as well as reinvest an additional $250 billion to $300 billion in Treasuries with the proceeds from earlier investments. Even though the Fed seemed to rule out further monetary stimulus, it remained accommodative. In early August 2011, in response to extreme market volatility and signs of a weakening economy, the Fed announced its intention to keep interest rates low until at least late 2014.
At the beginning of the period, the ECB had a key rate of 1.50%, which it had raised in early 2011 in an attempt to keep inflation in check. However, in response to weakness in the southern European economies, the ECB lowered its key rate to 1.25% in November and to 1.0% in December. In August, after a sell-off in the sovereign debts of Spain and Italy, the ECB announced plans to purchase the debt of those countries in exchange for increased deficit reduction. The ECB also continued to provide virtually unlimited liquidity for banks, announcing a long-term refinancing operation (LTRO) in December through which it provided low cost, three-year loans to lenders.
We use time-tested investment strategies, even as many variables are at work in the market.
The full effect of the credit crisis remains unknown. Elevated unemployment and debt defaults continue to pressure consumers and businesses alike.
In our experience strict adherence to time-tested investment strategies has its rewards. As a whole, Wells Fargo Advantage Funds represents investments across a range of asset classes and investment styles, giving you an opportunity to create a diversified investment portfolio. While diversification may not prevent losses in a downturn, we believe it helps in managing risk.
Thank you for choosing to invest with Wells Fargo Advantage Funds. We appreciate your confidence in us and remain committed to helping you meet your financial needs. For current information about your fund investments, contact your investment professional, visit our Web site at wellsfargoadvantagefunds.com, or call us directly at 1-800-222-8222. We are available 24 hours a day, 7 days a week.
Sincerely,

Karla M. Rabusch
President
Wells Fargo Advantage Funds
| | | | |
| 4 | | Wells Fargo Advantage Opportunity Fund | | Letter to Shareholders |
Notice to Shareholders
The Board of Trustees for Wells Fargo Advantage Funds has unanimously approved the following modifications to certain net asset value (NAV) waiver privileges and commission schedules:
| | n | | Effective May 1, 2012, automatic investment plan (AIP) purchases and proceeds received from systematic withdrawals will no longer qualify for NAV repurchase privileges. | |
| | n | | Effective May 1, 2012, discretionary rights to waive the upfront commission for Class C and “jumbo” Class A share purchases will no longer be granted to broker/dealers. However, we will continue to waive the Class C shares contingent deferred sales charge for redemptions by employer-sponsored retirement plans where the dealer of record waived its commission at the time of purchase. | |
| | n | | Effective July 31, 2012, NAV purchase privileges for former Evergreen Class IS and Class R shareholders are being modified to remove the ability to purchase Class A shares at NAV unless those shares are held directly with the Fund on or after July 31, 2012. | |
Please contact your investment professional or call us directly at 1-800-222-8222 if you have any questions on this Notice to Shareholders.
| | | | | | |
| Performance Highlights (Unaudited) | | Wells Fargo Advantage Opportunity Fund | | | 5 | |
INVESTMENT OBJECTIVE
The Fund seeks long-term capital appreciation.
ADVISER
Wells Fargo Funds Management, LLC
SUB-ADVISER
Wells Capital Management, LLC
PORTFOLIO MANAGERS
Ann M. Miletti
Thomas D. Wooden, CFA
FUND INCEPTION
December 31, 1985
| | | | |
TEN LARGEST EQUITY HOLDINGS1
(AS OF MARCH 31, 2012) | |
Praxair Incorporated | | | 1.86% | |
Fifth Third Bancorp | | | 1.80% | |
Covidien plc | | | 1.63% | |
National Oilwell Varco Incorporated | | | 1.61% | |
NetApp Incorporated | | | 1.56% | |
Whirlpool Corporation | | | 1.56% | |
Kohl’s Corporation | | | 1.55% | |
Republic Services Incorporated | | | 1.50% | |
Bemis Company Incorporated | | | 1.47% | |
Autodesk Incorporated | | | 1.46% | |
| | |
SECTOR DISTRIBUTION2 (AS OF MARCH 31, 2012) |
|
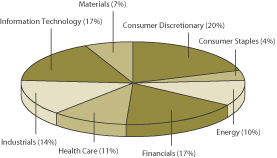 |
| 1. | The ten largest equity holdings are calculated based on the value of the securities divided by total net assets of the Fund. Holdings are subject to change and may have changed since the date specified. |
| 2. | Sector distribution is subject to change and is calculated based on the total long-term investments of the Fund. |
| | | | |
| 6 | | Wells Fargo Advantage Opportunity Fund | | Performance Highlights (Unaudited) |
AVERAGE ANNUAL TOTAL RETURN3 (%) (AS OF MARCH 31, 2012)
| | | | | | | | | | | | | | | | | | | | | | | | | | | | | | | | | | | | | | | | | | | | |
| | | | | | Including Sales Charge | | | Excluding Sales Charge | | | Expense Ratios4 | |
| | | Inception Date | | | 6 Months* | | | 1 Year | | | 5 Year | | | 10 Year | | | 6 Months* | | | 1 Year | | | 5 Year | | | 10 Year | | | Gross | | | Net5 | |
Class A (SOPVX) | | | 02/24/2000 | | | | 17.95 | | | | (6.52 | ) | | | 1.47 | | | | 4.54 | | | | 25.16 | | | | (0.82 | ) | | | 2.67 | | | | 5.16 | | | | 1.26% | | | | 1.26% | |
Class B (SOPBX)** | | | 08/26/2011 | | | | 19.69 | | | | (6.56 | ) | | | 1.70 | | | | 4.85 | | | | 24.69 | | | | (1.56 | ) | | | 2.07 | | | | 4.85 | | | | 2.01% | | | | 2.01% | |
Class C (WFOPX) | | | 03/31/2008 | | | | 23.69 | | | | (2.56 | ) | | | 1.91 | | | | 4.48 | | | | 24.69 | | | | (1.56 | ) | | | 1.91 | | | | 4.48 | | | | 2.01% | | | | 2.01% | |
Administrator Class (WOFDX) | | | 08/30/2002 | | | | | | | | | | | | | | | | | | | | 25.30 | | | | (0.59 | ) | | | 2.92 | | | | 5.43 | | | | 1.10% | | | | 1.01% | |
Institutional Class (WOFNX) | | | 07/30/2010 | | | | | | | | | | | | | | | | | | | | 25.45 | | | | (0.38 | ) | | | 3.00 | | | | 5.47 | | | | 0.83% | | | | 0.76% | |
Investor Class (SOPFX) | | | 12/31/1985 | | | | | | | | | | | | | | | | | | | | 25.12 | | | | (0.87 | ) | | | 2.61 | | | | 5.16 | | | | 1.33% | | | | 1.33% | |
Russell Midcap® Index6 | | | | | | | | | | | | | | | | | | | | | | | 26.84 | | | | 3.31 | | | | 3.03 | | | | 7.85 | | | | | | | | | |
| * | Returns for periods of less than one year are not annualized. |
| ** | Class B shares are closed to investment, except in connection with the reinvestment of any distributions and permitted exchanges. |
Figures quoted represent past performance, which is no guarantee of future results and do not reflect the deduction of taxes that a shareholder may pay on fund distributions or the redemption of fund shares. Investment return and principal value of an investment will fluctuate so that an investor’s shares, when redeemed, may be worth more or less than their original cost. Performance shown without sales charges would be lower if sales charges were reflected. Current performance may be lower or higher than the performance data quoted and assumes the reinvestment of dividends and capital gains. Current month-end performance is available on the Fund’s Web site – wellsfargoadvantagefunds.com
Index returns do not include transaction costs associated with buying and selling securities, any mutual fund fees or expenses or any taxes. It is not possible to invest directly in an index.
For Class A shares, the maximum front-end sales charge is 5.75%. For Class B shares, the maximum contingent deferred sales charge is 5.00%. For Class C shares, the maximum contingent deferred sales charge is 1.00%. Performance including sales charge assumes the sales charge for the corresponding time period. Administrator Class, Institutional Class and Investor Class shares are sold without a front-end sales charge or contingent deferred sales charge.
Stock fund values fluctuate in response to the activities of individual companies and general market and economic conditions. Smaller-company stocks tend to be more volatile and less liquid than those of larger companies. Certain investment strategies tend to increase the total risk of an investment (relative to the broader market). This Fund is exposed to foreign investment risk. Consult the Fund’s prospectus for additional information on these and other risks.
| 3. | Effective June 20, 2008, the Advisor Classwas renamed Class A and modified to assume the features and attributes of Class A. Historical performance shown for the Class A shares through June 20, 2008, includes Advisor Class expenses. Historical performance shown for Class B shares prior to their inception reflects the performance of Class C shares. Historical performance shown for Class C shares prior to their inception reflects the performance of Class A shares, adjusted to reflect the higher expenses applicable to Class C shares. Historical performance shown for the Institutional Class prior to their inception reflects the performance of the Administrator Class shares, and includes the higher expenses applicable to the Administrator Class shares. If these expenses had not been included, returns would be higher. Historical performance shown for the Administrator Class shares prior to their inception reflects the performance of the Investor Class shares, and includes the higher expenses applicable to the Investor Class shares. If these expenses had not been included, returns would be higher. |
| 4. | Reflects the expense ratios as stated in the most recent prospectuses. |
| 5. | The Adviser has committed through July 18, 2013 to waive fees and/or reimburse expenses to the extent necessary to cap the Fund’s Total Annual Fund Operating Expenses After Fee Waiver, excluding certain expenses, at 1.25% for Class A, 2.00% for Class B, 2.00% for Class C, 1.00% for Administrator Class, 0.75% for Institutional Class and 1.32% for Investor Class. Without this cap, the Fund’s returns would have been lower. |
| 6. | The Russell Midcap® Index measures the performance of the 800 smallest companies in the Russell 1000® Index, which represent approximately 25% of the total market capitalization of the Russell 1000® Index. You cannot invest directly in an index. |
| | | | | | |
| Fund Expenses (Unaudited) | | Wells Fargo Advantage Opportunity Fund | | | 7 | |
As a shareholder of the Fund, you incur two types of costs: (1) transaction costs, including sales charges (loads) on purchase payments and contingent deferred sales charges (if any) on redemptions and (2) ongoing costs, including management fees; distribution (12b-1) and/or shareholder service fees; and other Fund expenses. This example is intended to help you understand your ongoing costs (in dollars) of investing in the Fund and to compare these costs with the ongoing costs of investing in other mutual funds.
The example is based on an investment of $1,000 invested at the beginning of the six-month period and held for the entire period from October 1, 2011 to March 31, 2012.
Actual Expenses
The “Actual” line of the table below provides information about actual account values and actual expenses. You may use the information in this line, together with the amount you invested, to estimate the expenses that you paid over the period. Simply divide your account value by $1,000 (for example, an $8,600 account value divided by $1,000 = 8.6), then multiply the result by the number in the “Actual” line under the heading entitled “Expenses Paid During Period” for your applicable class of shares to estimate the expenses you paid on your account during this period.
Hypothetical Example for Comparison Purposes
The “Hypothetical” line of the table below provides information about hypothetical account values and hypothetical expenses based on the Fund’s actual expense ratio and an assumed rate of return of 5% per year before expenses, which is not the Fund’s actual return. The hypothetical account values and expenses may not be used to estimate the actual ending account balance or expenses you paid for the period. You may use this information to compare the ongoing costs of investing in the Fund and other funds. To do so, compare this 5% hypothetical example with the 5% hypothetical examples that appear in the shareholder reports of the other funds.
Please note that the expenses shown in the table are meant to highlight your ongoing costs only and do not reflect any transactional costs, such as sales charges (loads) and contingent deferred sales charges. Therefore, the “Hypothetical” line of the table is useful in comparing ongoing costs only, and will not help you determine the relative total costs of owning different funds. In addition, if these transactional costs were included, your costs would have been higher.
| | | | | | | | | | | | | | | | |
| | | Beginning
Account Value
10-01-2011 | | | Ending
Account Value
03-31-2012 | | | Expenses
Paid During
the Period1 | | | Net Annual
Expense Ratio | |
Class A | | | | | | | | | | | | | | | | |
Actual | | $ | 1,000.00 | | | $ | 1,251.56 | | | $ | 7.04 | | | | 1.25 | % |
Hypothetical (5% return before expenses) | | $ | 1,000.00 | | | $ | 1,018.75 | | | $ | 6.31 | | | | 1.25 | % |
Class B | | | | | | | | | | | | | | | | |
Actual | | $ | 1,000.00 | | | $ | 1,246.94 | | | $ | 11.18 | | | | 1.99 | % |
Hypothetical (5% return before expenses) | | $ | 1,000.00 | | | $ | 1,015.05 | | | $ | 10.02 | | | | 1.99 | % |
Class C | | | | | | | | | | | | | | | | |
Actual | | $ | 1,000.00 | | | $ | 1,246.94 | | | $ | 11.23 | | | | 2.00 | % |
Hypothetical (5% return before expenses) | | $ | 1,000.00 | | | $ | 1,015.00 | | | $ | 10.08 | | | | 2.00 | % |
Administrator Class | | | | | | | | | | | | | | | | |
Actual | | $ | 1,000.00 | | | $ | 1,252.99 | | | $ | 5.63 | | | | 1.00 | % |
Hypothetical (5% return before expenses) | | $ | 1,000.00 | | | $ | 1,020.00 | | | $ | 5.05 | | | | 1.00 | % |
Institutional Class | | | | | | | | | | | | | | | | |
Actual | | $ | 1,000.00 | | | $ | 1,254.47 | | | $ | 4.23 | | | | 0.75 | % |
Hypothetical (5% return before expenses) | | $ | 1,000.00 | | | $ | 1,021.25 | | | $ | 3.79 | | | | 0.75 | % |
Investor Class | | | | | | | | | | | | | | | | |
Actual | | $ | 1,000.00 | | | $ | 1,251.22 | | | $ | 7.43 | | | | 1.32 | % |
Hypothetical (5% return before expenses) | | $ | 1,000.00 | | | $ | 1,018.40 | | | $ | 6.66 | | | | 1.32 | % |
| 1. | Expenses paid is equal to the annualized expense ratio of each class multiplied by the average account value over the period, multiplied by the number of days in the most recent fiscal half-year divided by the number of days in the fiscal year (to reflect the one-half year period). |
| | | | |
| 8 | | Wells Fargo Advantage Opportunity Fund | | Portfolio of Investments—March 31, 2012 (Unaudited) |
| | | | | | | | | | | | |
| Security Name | | | | | | Shares | | | Value | |
| | | | | | | | | | | | |
| | | | |
Common Stocks: 97.61% | | | | | | | | | | | | |
| | | | |
Consumer Discretionary: 19.19% | | | | | | | | | | | | |
| | | | |
| Auto Components: 1.15% | | | | | | | | | | | | |
Johnson Controls Incorporated | | | | | | | 727,018 | | | $ | 23,613,545 | |
| | | | | | | | | | | | |
| | | | |
| Diversified Consumer Services: 1.12% | | | | | | | | | | | | |
K12 Incorporated †« | | | | | | | 970,018 | | | | 22,921,525 | |
| | | | | | | | | | | | |
| | | | |
| Hotels, Restaurants & Leisure: 1.15% | | | | | | | | | | | | |
Carnival Corporation « | | | | | | | 738,647 | | | | 23,695,796 | |
| | | | | | | | | | | | |
| | | |
| Household Durables: 2.09% | | | | | | | | | | |
Tempur-Pedic International Incorporated †« | | | | | | | 128,583 | | | | 10,856,263 | |
Whirlpool Corporation « | | | | | | | 417,000 | | | | 32,050,620 | |
| | | | |
| | | | | | | | | | | 42,906,883 | |
| | | | | | | | | | | | |
| | | | |
| Internet & Catalog Retail: 1.15% | | | | | | | | | | | | |
Liberty Interactive Corporation Series A † | | | | | | | 1,235,892 | | | | 23,593,178 | |
| | | | | | | | | | | | |
| | | | |
| Media: 6.05% | | | | | | | | | | | | |
Cablevision Systems Corporation New York Group Class A « | | | | | | | 1,370,611 | | | | 20,120,569 | |
Comcast Corporation Class A | | | | | | | 876,960 | | | | 25,879,090 | |
Discovery Communications Incorporated † | | | | | | | 569,515 | | | | 26,698,863 | |
Liberty Global Incorporated Class A † | | | | | | | 494,368 | | | | 24,757,949 | |
Omnicom Group Incorporated « | | | | | | | 529,298 | | | | 26,808,944 | |
| | | | |
| | | | | | | | | | | 124,265,415 | |
| | | | | | | | | | | | |
| | | | |
| Multiline Retail: 4.64% | | | | | | | | | | | | |
Best Buy Company Incorporated « | | | | | | | 893,209 | | | | 21,151,189 | |
Family Dollar Stores Incorporated | | | | | | | 212,963 | | | | 13,476,299 | |
Kohl’s Corporation | | | | | | | 637,882 | | | | 31,913,236 | |
Nordstrom Incorporated « | | | | | | | 516,503 | | | | 28,779,547 | |
| | | | |
| | | | | | | | | | | 95,320,271 | |
| | | | | | | | | | | | |
| | | |
| Specialty Retail: 1.84% | | | | | | | | | | |
Abercrombie & Fitch Company Class A « | | | | | | | 458,877 | | | | 22,764,888 | |
Express Incorporated †« | | | | | | | 597,539 | | | | 14,926,524 | |
| | | | |
| | | | | | | | | | | 37,691,412 | |
| | | | | | | | | | | | |
| | | | |
Consumer Staples: 4.04% | | | | | | | | | | | | |
| | | | |
| Food & Staples Retailing: 1.45% | | | | | | | | | | | | |
Kroger Company « | | | | | | | 1,232,793 | | | | 29,870,574 | |
| | | | | | | | | | | | |
| | | | |
| Food Products: 1.24% | | | | | | | | | | | | |
General Mills Incorporated | | | | | | | 643,602 | | | | 25,390,099 | |
| | | | | | | | | | | | |
| | | | |
| Household Products: 1.35% | | | | | | | | | | | | |
Church & Dwight Company Incorporated | | | | | | | 563,222 | | | | 27,704,890 | |
| | | | | | | | | | | | |
The accompanying notes are an integral part of these financial statements.
| | | | | | |
| Portfolio of Investments—March 31, 2012 (Unaudited) | | Wells Fargo Advantage Opportunity Fund | | | 9 | |
| | | | | | | | | | | | |
| Security Name | | | | | | Shares | | | Value | |
| | | | | | | | | | | | |
| | | | |
Energy: 9.69% | | | | | | | | | | | | |
| | | | |
| Energy Equipment & Services: 4.57% | | | | | | | | | | | | |
McDermott International Incorporated † | | | | | | | 1,043,765 | | | $ | 13,370,630 | |
National Oilwell Varco Incorporated | | | | | | | 416,606 | | | | 33,107,679 | |
Superior Energy Services Incorporated † | | | | | | | 927,074 | | | | 24,437,671 | |
Weatherford International Limited † | | | | | | | 1,513,517 | | | | 22,838,972 | |
| | | | |
| | | | | | | | | | | 93,754,952 | |
| | | | | | | | | | | | |
| | | | |
| Oil, Gas & Consumable Fuels: 5.12% | | | | | | | | | | | | |
Apache Corporation | | | | | | | 142,008 | | | | 14,263,284 | |
Cabot Oil & Gas Corporation | | | | | | | 694,765 | | | | 21,655,825 | |
Newfield Exploration Company † | | | | | | | 698,120 | | | | 24,210,802 | |
Peabody Energy Corporation | | | | | | | 726,242 | | | | 21,031,968 | |
Southwestern Energy Company † | | | | | | | 785,248 | | | | 24,028,589 | |
| | | | |
| | | | | | | | | | | 105,190,468 | |
| | | | | | | | | | | | |
| | | | |
Financials: 16.27% | | | | | | | | | | | | |
| | | | |
| Capital Markets: 2.83% | | | | | | | | | | | | |
Invesco Limited | | | | | | | 1,093,611 | | | | 29,166,605 | |
TD Ameritrade Holding Corporation | | | | | | | 1,469,586 | | | | 29,009,628 | |
| | | | |
| | | | | | | | | | | 58,176,233 | |
| | | | | | | | | | | | |
| | | | |
| Commercial Banks: 4.15% | | | | | | | | | | | | |
Branch Banking & Trust Corporation « | | | | | | | 714,185 | | | | 22,418,267 | |
City National Corporation « | | | | | | | 489,691 | | | | 25,694,087 | |
Fifth Third Bancorp | | | | | | | 2,634,598 | | | | 37,016,102 | |
| | | | |
| | | | | | | | | | | 85,128,456 | |
| | | | | | | | | | | | |
| | | |
| Consumer Finance: 1.23% | | | | | | | | | | |
MasterCard Incorporated | | | | | | | 60,176 | | | | 25,306,415 | |
| | | | | | | | | | | | |
| | | |
| Diversified Financial Services: 0.80% | | | | | | | | | | |
InterContinental Exchange Incorporated † | | | | | | | 119,000 | | | | 16,352,980 | |
| | | | | | | | | | | | |
| | | | |
| Insurance: 5.00% | | | | | | | | | | | | |
ACE Limited | | | | | | | 376,179 | | | | 27,536,303 | |
Reinsurance Group of America Incorporated | | | | | | | 366,708 | | | | 21,808,125 | |
RenaissanceRe Holdings Limited | | | | | | | 380,248 | | | | 28,796,181 | |
Willis Group Holdings plc | | | | | | | 702,631 | | | | 24,578,032 | |
| | | | |
| | | | | | | | | | | 102,718,641 | |
| | | | | | | | | | | | |
| | | |
| REITs: 2.26% | | | | | | | | | | |
American Tower Corporation | | | | | | | 336,940 | | | | 21,233,959 | |
BioMed Realty Trust Incorporated « | | | | | | | 1,330,681 | | | | 25,256,325 | |
| | | | |
| | | | | | | | | | | 46,490,284 | |
| | | | | | | | | | | | |
| | | |
Health Care: 10.69% | | | | | | | | | | |
| | | | |
| Health Care Equipment & Supplies: 4.16% | | | | | | | | | | | | |
C.R. Bard Incorporated | | | | | | | 262,927 | | | | 25,956,153 | |
The accompanying notes are an integral part of these financial statements.
| | | | |
| 10 | | Wells Fargo Advantage Opportunity Fund | | Portfolio of Investments—March 31, 2012 (Unaudited) |
| | | | | | | | | | | | |
| Security Name | | | | | | Shares | | | Value | |
| | | | | | | | | | | | |
| | | | |
| Health Care Equipment & Supplies (continued) | | | | | | | | | | | | |
Covidien plc | | | | | | | 612,219 | | | $ | 33,476,135 | |
Zimmer Holdings Incorporated | | | | | | | 403,858 | | | | 25,959,992 | |
| | | | |
| | | | | | | | | | | 85,392,280 | |
| | | | | | | | | | | | |
| | | |
| Health Care Providers & Services: 2.46% | | | | | | | | | | |
Health Management Associates Incorporated Class A † | | | | | | | 4,038,702 | | | | 27,140,077 | |
McKesson Corporation | | | | | | | 265,592 | | | | 23,311,010 | |
| | | | |
| | | | | | | | | | | 50,451,087 | |
| | | | | | | | | | | | |
| | | | |
| Life Sciences Tools & Services: 4.07% | | | | | | | | | | | | |
Covance Incorporated †« | | | | | | | 600,827 | | | | 28,617,390 | |
Thermo Fisher Scientific Incorporated | | | | | | | 506,569 | | | | 28,560,360 | |
Waters Corporation † | | | | | | | 286,442 | | | | 26,541,716 | |
| | | | |
| | | | | | | | | | | 83,719,466 | |
| | | | | | | | | | | | |
| | | |
Industrials: 13.86% | | | | | | | | | | |
| | | | |
| Airlines: 2.04% | | | | | | | | | | | | |
Delta Air Lines Incorporated † | | | | | | | 2,827,762 | | | | 28,023,121 | |
United Continental Holdings Incorporated †« | | | | | | | 649,746 | | | | 13,969,539 | |
| | | | |
| | | | | | | | | | | 41,992,660 | |
| | | | | | | | | | | | |
| | | |
| Commercial Services & Supplies: 2.80% | | | | | | | | | | |
Manpower Incorporated | | | | | | | 563,440 | | | | 26,690,153 | |
Republic Services Incorporated | | | | | | | 1,009,167 | | | | 30,840,144 | |
| | | | |
| | | | | | | | | | | 57,530,297 | |
| | | | | | | | | | | | |
| | | |
| Construction & Engineering: 0.83% | | | | | | | | | | |
Quanta Services Incorporated † | | | | | | | 820,104 | | | | 17,140,174 | |
| | | | | | | | | | | | |
| | | |
| Electrical Equipment: 4.32% | | | | | | | | | | |
AMETEK Incorporated | | | | | | | 508,626 | | | | 24,673,447 | |
Babcock & Wilcox Company † | | | | | | | 942,588 | | | | 24,271,641 | |
Regal-Beloit Corporation | | | | | | | 343,622 | | | | 22,524,422 | |
Rockwell Automation Incorporated | | | | | | | 216,361 | | | | 17,243,972 | |
| | | | |
| | | | | | | | | | | 88,713,482 | |
| | | | | | | | | | | | |
| | | |
| Machinery: 1.16% | | | | | | | | | | |
Dover Corporation « | | | | | | | 377,689 | | | | 23,771,746 | |
| | | | | | | | | | | | |
| | | |
| Road & Rail: 2.71% | | | | | | | | | | |
Hertz Global Holdings Incorporated †« | | | | | 1,939,328 | | | | 29,167,493 | |
J.B. Hunt Transport Services Incorporated « | | | | | | | 485,781 | | | | 26,411,913 | |
| | | | |
| | | | | | | | | | | 55,579,406 | |
| | | | | | | | | | | | |
| | | |
Information Technology: 16.63% | | | | | | | | | | |
| | | | |
| Communications Equipment: 1.17% | | | | | | | | | | | | |
Polycom Incorporated † | | | | | | | 1,264,416 | | | | 24,112,413 | |
| | | | | | | | | | | | |
The accompanying notes are an integral part of these financial statements.
| | | | | | |
| Portfolio of Investments—March 31, 2012 (Unaudited) | | Wells Fargo Advantage Opportunity Fund | | | 11 | |
| | | | | | | | | | | | |
| Security Name | | | | | | Shares | | | Value | |
| | | | | | | | | | | | |
| | | |
| Computers & Peripherals: 1.56% | | | | | | | | | | |
NetApp Incorporated † | | | | | | | 713,727 | | | $ | 31,953,558 | |
| | | | | | | | | | | | |
| | | |
| Electronic Equipment, Instruments & Components: 1.57% | | | | | | | | | | |
Agilent Technologies Incorporated | | | | | | | 80,814 | | | | 3,597,031 | |
Amphenol Corporation Class A « | | | | | | | 479,312 | | | | 28,648,478 | |
| | | | |
| | | | | | | | | | | 32,245,509 | |
| | | | | | | | | | | | |
| | | |
| Internet Software & Services: 1.12% | | | | | | | | | | |
Equinix Incorporated †« | | | | | | | 145,384 | | | | 22,890,711 | |
| | | | | | | | | | | | |
| | | |
| IT Services: 3.32% | | | | | | | | | | |
Alliance Data Systems Corporation †« | | | | | | | 167,086 | | | | 21,046,153 | |
Cognizant Technology Solutions Corporation Class A † | | | | | | | 312,981 | | | | 24,083,888 | |
Global Payments Incorporated | | | | | | | 485,260 | | | | 23,035,292 | |
| | | | |
| | | | | | | | | | | 68,165,333 | |
| | | | | | | | | | | | |
| | | |
| Semiconductors & Semiconductor Equipment: 5.05% | | | | | | | | | | |
Altera Corporation | | | | | | | 586,727 | | | | 23,363,469 | |
ARM Holdings plc | | | | | | | 2,375,680 | | | | 22,495,422 | |
Avago Technologies Limited | | | | | | | 734,138 | | | | 28,609,358 | |
ON Semiconductor Corporation † | | | | | | | 3,243,266 | | | | 29,221,827 | |
| | | | |
| | | | | | | | | | | 103,690,076 | |
| | | | | | | | | | | | |
| | | |
| Software: 2.84% | | | | | | | | | | |
Autodesk Incorporated † | | | | | | | 706,539 | | | | 29,900,730 | |
Red Hat Incorporated † | | | | | | | 475,373 | | | | 28,470,089 | |
| | | | |
| | | | | | | | | | | 58,370,819 | |
| | | | | | | | | | | | |
| | | |
Materials: 7.24% | | | | | | | | | | |
| | | |
| Chemicals: 1.86% | | | | | | | | | | |
Praxair Incorporated | | | | | | | 333,427 | | | | 38,224,072 | |
| | | | | | | | | | | | |
| | | |
| Containers & Packaging: 4.18% | | | | | | | | | | |
Bemis Company Incorporated « | | | | | | | 933,453 | | | | 30,141,197 | |
Crown Holdings Incorporated †« | | | | | | | 706,326 | | | | 26,013,987 | |
Owens-Illinois Incorporated † | | | | | | | 1,276,637 | | | | 29,796,708 | |
| | | | |
| | | | | | | | | | | 85,951,892 | |
| | | | | | | | | | | | |
| | | |
| Metals & Mining: 1.20% | | | | | | | | | | |
Agnico-Eagle Mines Limited | | | | | | | 373,507 | | | | 12,467,664 | |
Royal Gold Incorporated | | | | | | | 185,653 | | | | 12,108,286 | |
| | | | |
| | | | | | | | | | | 24,575,950 | |
| | | | | | | | | | | | |
| | | | |
Total Common Stocks (Cost $1,589,591,946) | | | | | | | | | | | 2,004,562,948 | |
| | | | | | | | | | | | |
| | | | |
| | | | | | | Principal | | | | |
| Other: 0.24% | | | | | | | | | | | | |
Gryphon Funding Limited, Pass-Through Entity (a)(i)(v) | | | | | | $ | 10,290,702 | | | | 2,881,397 | |
VFNC Corporation, Pass-Through Entity, 0.24% (a)(i)(v)144A± | | | | | | | 4,971,686 | | | | 2,088,108 | |
| | | | |
Total Other (Cost $6,453,075) | | | | | | | | | | | 4,969,505 | |
| | | | | | | | | | | | |
The accompanying notes are an integral part of these financial statements.
| | | | |
| 12 | | Wells Fargo Advantage Opportunity Fund | | Portfolio of Investments—March 31, 2012 (Unaudited) |
| | | | | | | | | | | | | | |
| Security Name | | Yield | | | | | Shares | | | Value | |
| | | | | | | | | | | | | | |
| | | | |
Short-Term Investments: 10.92% | | | | | | | | | | | | | | |
| | | | |
| Investment Companies: 10.92% | | | | | | | | | | | | | | |
Wells Fargo Advantage Cash Investment Money Market Fund, Select Class (l)(u) | | | 0.10 | % | | | | | 68,779,712 | | | $ | 68,779,712 | |
Wells Fargo Securities Lending Cash Investments (v)(l)(u)(r) | | | 0.18 | | | | | | 155,584,049 | | | | 155,584,049 | |
| | | | |
Total Short-Term Investments (Cost $224,363,761) | | | | | | | | | | | | | 224,363,761 | |
| | | | | | | | | | | | | | |
| | | | | | | | |
| Total Investments in Securities | | | | | | | | |
| (Cost $1,820,408,782) * | | | 108.77 | % | | | 2,233,896,214 | |
Other Assets and Liabilities, Net | | | (8.77 | ) | | | (180,181,021 | ) |
| | | | | | | | |
| Total Net Assets | | | 100.00 | % | | $ | 2,053,715,193 | |
| | | | | | | | |
| † | Non-income earning security |
| « | All or a portion of this security is on loan. |
| (a) | Security is fair valued by the Management Valuation Team, and in certain instances by the Board of Trustees, in accordance with procedures approved by the Board of Trustees. |
| (v) | All or a portion of the security represents investment of cash collateral received from securities on loan. |
| 144A | Security that may be resold to “qualified institutional buyers” under Rule 144A or security offered pursuant to Section 4(2) of the Securities Act of 1933, as amended. |
| ± | Variable rate investment |
| (l) | Investment in an affiliate |
| (u) | Rate shown is the 7-day annualized yield at period end. |
| (r) | The investment company is exempt from registration under Section 3(c)(7) of the 1940 Act. |
| * | Cost for federal income tax purposes is $1,842,731,447 and net unrealized appreciation (depreciation) consists of: |
| | | | |
Gross unrealized appreciation | | $ | 434,231,078 | |
Gross unrealized depreciation | | | (43,066,311 | ) |
| | | | |
Net unrealized appreciation | | $ | 391,164,767 | |
The accompanying notes are an integral part of these financial statements.
| | | | | | |
| Statement of Assets and Liabilities—March 31, 2012 (Unaudited) | | Wells Fargo Advantage Opportunity Fund | | | 13 | |
| | | | |
| | | | |
| |
Assets | | | | |
Investments | | | | |
In unaffiliated securities (including securities on loan), at value (see cost below) | | $ | 2,009,532,453 | |
In affiliated securities, at value (see cost below) | | | 224,363,761 | |
| | | | |
Total investments, at value (see cost below) | | | 2,233,896,214 | |
Foreign currency, at value (see cost below) | | | 93 | |
Receivable for investments sold | | | 2,881,607 | |
Receivable for Fund shares sold | | | 395,134 | |
Receivable for dividends and interest | | | 1,803,056 | |
Receivable for securities lending income | | | 16,044 | |
Prepaid expenses and other assets | | | 123,004 | |
| | | | |
Total assets | | | 2,239,115,152 | |
| | | | |
| |
Liabilities | | | | |
Payable for investments purchased | | | 23,662,136 | |
Payable for Fund shares redeemed | | | 2,240,974 | |
Payable upon receipt of securities loaned | | | 156,954,217 | |
Advisory fee payable | | | 1,184,368 | |
Distribution fees payable | | | 43,984 | |
Due to other related parties | | | 566,127 | |
Accrued expenses and other liabilities | | | 748,153 | |
| | | | |
Total liabilities | | | 185,399,959 | |
| | | | |
Total net assets | | $ | 2,053,715,193 | |
| | | | |
| |
NET ASSETS CONSIST OF | | | | |
Paid-in capital | | $ | 1,657,269,967 | |
Undistributed net investment loss | | | (947,208 | ) |
Accumulated net realized losses on investments | | | (16,098,323 | ) |
Net unrealized gains on investments | | | 413,490,757 | |
| | | | |
Total net assets | | $ | 2,053,715,193 | |
| | | | |
| |
COMPUTATION OF NET ASSET VALUE AND OFFERING PRICE PER SHARE1 | | | | |
Net assets – Class A | | $ | 445,293,100 | |
Shares outstanding – Class A | | | 11,090,323 | |
Net asset value per share – Class A | | | $40.15 | |
Maximum offering price per share – Class A2 | | | $42.60 | |
Net assets – Class B | | $ | 15,444,912 | |
Shares outstanding – Class B | | | 388,187 | |
Net asset value per share – Class B | | | $39.79 | |
Net assets – Class C | | $ | 48,872,091 | |
Shares outstanding – Class C | | | 1,228,316 | |
Net asset value per share – Class C | | | $39.79 | |
Net assets – Administrator Class | | $ | 432,413,304 | |
Shares outstanding – Administrator Class | | | 10,319,864 | |
Net asset value per share – Administrator Class | | | $41.90 | |
Net assets – Institutional Class | | $ | 10,879,719 | |
Shares outstanding – Institutional Class | | | 258,737 | |
Net asset value per share – Institutional Class | | | $42.05 | |
Net assets – Investor Class | | $ | 1,100,812,067 | |
Shares outstanding – Investor Class | | | 26,857,523 | |
Net asset value per share – Investor Class | | | $40.99 | |
Investments in unaffiliated securities, at cost | | $ | 1,596,045,021 | |
| | | | |
Investments in affiliated securities, at cost | | $ | 224,363,761 | |
| | | | |
Total investments, at cost | | $ | 1,820,408,782 | |
| | | | |
Securities on loan, at value | | $ | 153,219,063 | |
| | | | |
Foreign currency, at cost | | $ | 92 | |
| | | | |
| 1. | The Fund has an unlimited number of authorized shares. |
| 2. | Maximum offering price is computed as 100/94.25 of net asset value. On investments of $50,000 or more, the offering price is reduced. |
The accompanying notes are an integral part of these financial statements.
| | | | |
| 14 | | Wells Fargo Advantage Opportunity Fund | | Statement of Operations—Six Months Ended March 31, 2012 (Unaudited) |
| | | | |
| | | | |
| |
Investment income | | | | |
Dividends* | | $ | 11,270,387 | |
Securities lending income, net | | | 104,635 | |
Income from affiliated securities | | | 42,166 | |
Interest | | | 17,312 | |
| | | | |
Total investment income | | | 11,434,500 | |
| | | | |
| |
Expenses | | | | |
Advisory fee | | | 6,517,516 | |
Administration fees | | | | |
Fund level | | | 487,171 | |
Class A | | | 557,417 | |
Class B | | | 20,799 | |
Class C | | | 62,196 | |
Administrator Class | | | 202,265 | |
Institutional Class | | | 5,623 | |
Investor Class | | | 1,711,826 | |
Shareholder servicing fees | | | | |
Class A | | | 535,978 | |
Class B | | | 19,699 | |
Class C | | | 59,804 | |
Administrator Class | | | 505,384 | |
Investor Class | | | 1,296,838 | |
Distribution fees | | | | |
Class B | | | 59,997 | |
Class C | | | 179,413 | |
Custody and accounting fees | | | 38,862 | |
Professional fees | | | 6,948 | |
Registration fees | | | 29,804 | |
Shareholder report expenses | | | 40,671 | |
Trustees’ fees and expenses | | | 69,115 | |
Other fees and expenses | | | 5,025 | |
| | | | |
Total expenses | | | 12,412,351 | |
Less: Fee waivers and/or expense reimbursements | | | (192,029 | ) |
| | | | |
Net expenses | | | 12,220,322 | |
| | | | |
Net investment loss | | | (785,822 | ) |
| | | | |
| |
REALIZED AND UNREALIZED GAINS (LOSSES) ON INVESTMENTS | | | | |
Net realized gains on investments | | | 16,562,203 | |
Net change in unrealized gains (losses) on investments | | | 417,385,537 | |
| | | | |
Net realized and unrealized gains (losses) on investments | | | 433,947,740 | |
| | | | |
Net increase in net assets resulting from operations | | $ | 433,161,918 | |
| | | | |
| |
* Net of foreign dividend withholding taxes of | | | $33,709 | |
The accompanying notes are an integral part of these financial statements.
| | | | | | |
| Statements of Changes in Net Assets | | Wells Fargo Advantage Opportunity Fund | | | 15 | |
| | | | | | | | | | | | | | | | |
| | | Six Months Ended March 31, 2012 (Unaudited) | | | Year Ended September 30, 2011 | |
| | | | |
Operations | | | | | | | | | | | | | | | | |
Net investment loss | | | | | | $ | (785,822 | ) | | | | | | $ | (1,318,061 | ) |
Net realized gains on investments | | | | | | | 16,562,203 | | | | | | | | 85,442,197 | |
Net change in unrealized gains (losses) on investments | | | | | | | 417,385,537 | | | | | | | | (175,968,841 | ) |
| | | | | | | | | | | | | | | | |
Net increase (decrease) in net assets resulting from operations | | | | | | | 433,161,918 | | | | | | | | (91,844,705 | ) |
| | | | | | | | | | | | | | | | |
| | | | |
Capital share transactions | | | Shares | | | | | | | | Shares | | | | | |
Proceeds from shares sold | | | | | | | | | | | | | | | | |
Class A | | | 175,730 | | | | 6,451,217 | | | | 132,465 | | | | 4,924,569 | |
Class B | | | 503 | | | | 19,062 | | | | 43 | 1 | | | 1,522 | 1 |
Class C | | | 10,978 | | | | 399,974 | | | | 23,548 | | | | 905,341 | |
Administrator Class | | | 465,865 | | | | 17,739,822 | | | | 1,368,552 | | | | 54,348,199 | |
Institutional Class | | | 206,879 | | | | 8,000,315 | | | | 178,908 | | | | 6,917,374 | |
Investor Class | | | 355,457 | | | | 13,279,589 | | | | 1,754,217 | | | | 67,656,154 | |
| | | | | | | | | | | | | | | | |
| | | | | | | 45,889,979 | | | | | | | | 134,753,159 | |
| | | | | | | | | | | | | | | | |
Payment for shares redeemed | | | | | | | | | | | | | | | | |
Class A | | | (1,372,803 | ) | | | (50,840,527 | ) | | | (457,402 | ) | | | (15,987,248 | ) |
Class B | | | (118,591 | ) | | | (4,305,308 | ) | | | (24,944 | )1 | | | (832,546 | )1 |
Class C | | | (195,894 | ) | | | (7,156,225 | ) | | | (39,103 | ) | | | (1,342,163 | ) |
Administrator Class | | | (941,084 | ) | | | (36,472,762 | ) | | | (1,380,151 | ) | | | (52,714,107 | ) |
Institutional Class | | | (366,643 | ) | | | (14,596,384 | ) | | | (31,927 | ) | | | (1,320,637 | ) |
Investor Class | | | (2,226,882 | ) | | | (83,576,395 | ) | | | (5,052,303 | ) | | | (197,448,386 | ) |
| | | | | | | | | | | | | | | | |
| | | | | | | (196,947,601 | ) | | | | | | | (269,645,087 | ) |
| | | | | | | | | | | | | | | | |
Net asset value of shares issued in acquisition | | | | | | | | | | | | | | | | |
Class A | | | 0 | | | | 0 | | | | 11,953,930 | | | | 403,612,992 | |
Class B | | | 0 | | | | 0 | | | | 531,176 | 1 | | | 17,851,453 | 1 |
Class C | | | 0 | | | | 0 | | | | 1,420,682 | | | | 47,745,717 | |
Administrator Class | | | 0 | | | | 0 | | | | 5,444,176 | | | | 191,545,214 | |
Institutional Class | | | 0 | | | | 0 | | | | 271,220 | | | | 9,562,903 | |
| | | | | | | | | | | | | | | | |
| | | | | | | 0 | | | | | | | | 670,318,279 | |
| | | | | | | | | | | | | | | | |
Net increase (decrease) in net assets resulting from capital share transactions | | | | | | | (151,057,622 | ) | | | | | | | 535,426,351 | |
| | | | | | | | | | | | | | | | |
Total increase in net assets | | | | | | | 282,104,296 | | | | | | | | 443,581,646 | |
| | | | | | | | | | | | | | | | |
| | | | |
Net assets | | | | | | | | | | | | | | | | |
Beginning of period | | | | | | | 1,771,610,897 | | | | | | | | 1,328,029,251 | |
| | | | | | | | | | | | | | | | |
End of period | | | | | | $ | 2,053,715,193 | | | | | | | $ | 1,771,610,897 | |
| | | | | | | | | | | | | | | | |
Undistributed net investment loss | | | | | | $ | (947,208 | ) | | | | | | $ | (161,386 | ) |
| | | | | | | | | | | | | | | | |
| 1. | Class commenced operations on August 26, 2011. |
The accompanying notes are an integral part of these financial statements.
| | | | |
| 16 | | Wells Fargo Advantage Opportunity Fund | | Financial Highlights |
(For a share outstanding throughout each period)
| | | | | | | | | | | | | | | | | | | | | | | | | | | | |
| | | Six Months Ended
March 31, 2012 (Unaudited) | | | Year Ended September 30, | | | Year Ended October 31, | |
| Class A | | | 2011 | | | 20101 | | | 2009 | | | 20082 | | | 20072 | | | 20062 | |
Net asset value, beginning of period | | $ | 32.08 | | | $ | 34.08 | | | $ | 28.81 | | | $ | 23.24 | | | $ | 45.42 | | | $ | 47.74 | | | $ | 46.57 | |
Net investment income (loss) | | | (0.01 | ) | | | 0.06 | 3 | | | (0.03 | )3 | | | 0.07 | 3 | | | 0.08 | 3 | | | 0.24 | 3 | | | 0.23 | |
Net realized and unrealized gains (losses) on investments | | | 8.08 | | | | (2.06 | ) | | | 5.37 | | | | 5.50 | | | | (15.15 | ) | | | 5.94 | | | | 5.87 | |
| | | | | | | | | | | | | | | | | | | | | | | | | | | | |
Total from investment operations | | | 8.07 | | | | (2.00 | ) | | | 5.34 | | | | 5.57 | | | | (15.07 | ) | | | 6.18 | | | | 6.10 | |
Distributions to shareholders from | | | | | | | | | | | | | | | | | | | | | | | | | | | | |
Net investment income | | | 0.00 | | | | 0.00 | | | | (0.07 | ) | | | 0.00 | | | | (0.47 | ) | | | (0.06 | ) | | | 0.00 | |
Net realized gains | | | 0.00 | | | | 0.00 | | | | 0.00 | | | | 0.00 | | | | (6.47 | ) | | | (8.44 | ) | | | (4.93 | ) |
Tax basis return of capital | | | 0.00 | | | | 0.00 | | | | 0.00 | | | | 0.00 | | | | (0.17 | ) | | | 0.00 | | | | 0.00 | |
| | | | | | | | | | | | | | | | | | | | | | | | | | | | |
Total distributions to shareholders | | | 0.00 | | | | 0.00 | | | | (0.07 | ) | | | 0.00 | | | | (7.11 | ) | | | (8.50 | ) | | | (4.93 | ) |
Net asset value, end of period | | $ | 40.15 | | | $ | 32.08 | | | $ | 34.08 | | | $ | 28.81 | | | $ | 23.24 | | | $ | 45.42 | | | $ | 47.74 | |
Total return4 | | | 25.16 | % | | | (5.87 | )% | | | 18.55 | % | | | 23.97 | % | | | (38.55 | )% | | | 14.89 | % | | | 13.86 | % |
Ratios to average net assets (annualized) | | | | | | | | | | | | | | | | | | | | | | | | | | | | |
Gross expenses | | | 1.25 | % | | | 1.27 | % | | | 1.31 | % | | | 1.35 | % | | | 1.34 | % | | | 1.36 | % | | | 1.30 | % |
Net expenses | | | 1.25 | % | | | 1.25 | % | | | 1.29 | % | | | 1.29 | % | | | 1.29 | % | | | 1.29 | % | | | 1.29 | % |
Net investment income (loss) | | | (0.07 | )% | | | 0.15 | % | | | (0.11 | )% | | | 0.28 | % | | | 0.22 | % | | | 0.55 | % | | | 0.39 | % |
Supplemental data | | | | | | | | | | | | | | | | | | | | | | | | | | | | |
Portfolio turnover rate | | | 19 | % | | | 31 | % | | | 42 | % | | | 55 | % | | | 73 | % | | | 56 | % | | | 39 | % |
Net assets, end of period (000’s omitted) | | | $445,293 | | | | $394,194 | | | | $22,437 | | | | $21,108 | | | | $20,695 | | | | $44,558 | | | | $51,489 | |
| 1. | For the eleven months ended September 30, 2010. The Fund changed its fiscal year end from October 31 to September 30, effective September 30, 2010. |
| 2. | On June 20, 2008, Advisor Class was renamed Class A. |
| 3. | Calculated based upon average shares outstanding |
| 4. | Total return calculations do not include any sales charges. Returns for periods of less than one year are not annualized. |
The accompanying notes are an integral part of these financial statements.
| | | | | | |
| Financial Highlights | | Wells Fargo Advantage Opportunity Fund | | | 17 | |
(For a share outstanding throughout each period)
| | | | | | | | |
| Class B | | Six Months Ended
March 31, 2012 (Unaudited) | | | Year Ended
September 30,
20111 | |
Net asset value, beginning of period | | $ | 31.91 | | | $ | 33.61 | |
Net investment loss | | | (0.16 | ) | | | (0.01 | ) |
Net realized and unrealized gains (losses) on investments | | | 8.04 | | | | (1.69 | ) |
| | | | | | | | |
Total from investment operations | | | 7.88 | | | | (1.70 | ) |
Net asset value, end of period | | $ | 39.79 | | | $ | 31.91 | |
Total return2 | | | 24.69 | % | | | (5.06 | )% |
Ratios to average net assets (annualized) | | | | | | | | |
Gross expenses | | | 1.99 | % | | | 2.02 | % |
Net expenses | | | 1.99 | % | | | 2.00 | % |
Net investment loss | | | (0.82 | )% | | | (0.45 | )% |
Supplemental data | | | | | | | | |
Portfolio turnover rate | | | 19 | % | | | 31 | % |
Net assets, end of period (000’s omitted) | | | $15,445 | | | | $16,154 | |
| 1. | For the period from August 26, 2011 (commencement of class operations) to September 30, 2011 |
| 2. | Total return calculations do not include any sales charges. Returns for periods of less than one year are not annualized. |
The accompanying notes are an integral part of these financial statements.
| | | | |
| 18 | | Wells Fargo Advantage Opportunity Fund | | Financial Highlights |
(For a share outstanding throughout each period)
| | | | | | | | | | | | | | | | | | | | |
| | | Six Months Ended
March 31, 2012 (Unaudited) | | | Year Ended September 30, | | | Year Ended October 31, | |
| Class C | | | 2011 | | | 20101 | | | 2009 | | | 20082 | |
Net asset value, beginning of period | | $ | 31.91 | | | $ | 34.15 | | | $ | 29.12 | | | $ | 23.66 | | | $ | 33.56 | |
Net investment loss | | | (0.16 | ) | | | (0.18 | )3 | | | (0.25 | )3 | | | (0.17 | )3 | | | (0.06 | )3 |
Net realized and unrealized gains (losses) on investments | | | 8.04 | | | | (2.06 | ) | | | 5.41 | | | | 5.63 | | | | (9.84 | ) |
| | | | | | | | | | | | | | | | | | | | |
Total from investment operations | | | 7.88 | | | | (2.24 | ) | | | 5.16 | | | | 5.46 | | | | (9.90 | ) |
Distributions to shareholders from | | | | | | | | | | | | | | | | | | | | |
Net investment income | | | 0.00 | | | | 0.00 | | | | (0.13 | ) | | | 0.00 | | | | 0.00 | |
Net asset value, end of period | | $ | 39.79 | | | $ | 31.91 | | | $ | 34.15 | | | $ | 29.12 | | | $ | 23.66 | |
Total return4 | | | 24.69 | % | | | (6.56 | )% | | | 17.76 | % | | | 23.08 | % | | | (29.50 | )% |
Ratios to average net assets (annualized) | | | | | | | | | | | | | | | | | | | | |
Gross expenses | | | 2.00 | % | | | 2.02 | % | | | 2.07 | % | | | 2.08 | % | | | 2.10 | % |
Net expenses | | | 2.00 | % | | | 2.00 | % | | | 2.04 | % | | | 2.04 | % | | | 2.04 | % |
Net investment loss | | | (0.83 | )% | | | (0.50 | )% | | | (0.87 | )% | | | (0.63 | )% | | | (0.33 | )% |
Supplemental data | | | | | | | | | | | | | | | | | | | | |
Portfolio turnover rate | | | 19 | % | | | 31 | % | | | 42 | % | | | 55 | % | | | 73 | % |
Net assets, end of period (000’s omitted) | | | $48,872 | | | | $45,096 | | | | $277 | | | | $150 | | | | $7 | |
| 1 | For the eleven months ended September 30, 2010. The Fund changed its fiscal year end from October 31 to September 30, effective September 30, 2010. |
| 2. | For the period from March 31, 2008 (commencement of class operations) to October 31, 2008 |
| 3. | Calculated based upon average shares outstanding |
| 4. | Total return calculations do not include any sales charges. Returns for periods of less than one year are not annualized. |
The accompanying notes are an integral part of these financial statements.
| | | | | | |
| Financial Highlights | | Wells Fargo Advantage Opportunity Fund | | | 19 | |
(For a share outstanding throughout each period)
| | | | | | | | | | | | | | | | | | | | | | | | | | | | |
| | | Six Months Ended
March 31, 2012 (Unaudited) | | | Year Ended September 30, | | | Year Ended October 31, | |
| Administrator Class | | | 2011 | | | 20101 | | | 2009 | | | 2008 | | | 2007 | | | 2006 | |
Net asset value, beginning of period | | $ | 33.44 | | | $ | 35.44 | | | $ | 29.95 | | | $ | 24.10 | | | $ | 46.86 | | | $ | 49.05 | | | $ | 47.61 | |
Net investment income | | | 0.04 | | | | 0.07 | 2 | | | 0.04 | 2 | | | 0.13 | 2 | | | 0.17 | 2 | | | 0.33 | 2 | | | 0.19 | |
Net realized and unrealized gains (losses) on investments | | | 8.42 | | | | (2.07 | ) | | | 5.59 | | | | 5.72 | | | | (15.69 | ) | | | 6.14 | | | | 6.18 | |
| | | | | | | | | | | | | | | | | | | | | | | | | | | | |
Total from investment operations | | | 8.46 | | | | (2.00 | ) | | | 5.63 | | | | 5.85 | | | | (15.52 | ) | | | 6.47 | | | | 6.37 | |
Distributions to shareholders from | | | | | | | | | | | | | | | | | | | | | | | | | | | | |
Net investment income | | | 0.00 | | | | 0.00 | | | | (0.14 | ) | | | 0.00 | | | | (0.60 | ) | | | (0.22 | ) | | | 0.00 | |
Net realized gains | | | 0.00 | | | | 0.00 | | | | 0.00 | | | | 0.00 | | | | (6.47 | ) | | | (8.44 | ) | | | (4.93 | ) |
Tax basis return of capital | | | 0.00 | | | | 0.00 | | | | 0.00 | | | | 0.00 | | | | (0.17 | ) | | | 0.00 | | | | 0.00 | |
| | | | | | | | | | | | | | | | | | | | | | | | | | | | |
Total distributions to shareholders | | | 0.00 | | | | 0.00 | | | | (0.14 | ) | | | 0.00 | | | | (7.24 | ) | | | (8.66 | ) | | | (4.93 | ) |
Net asset value, end of period | | $ | 41.90 | | | $ | 33.44 | | | $ | 35.44 | | | $ | 29.95 | | | $ | 24.10 | | | $ | 46.86 | | | $ | 49.05 | |
Total return3 | | | 25.30 | % | | | (5.64 | )% | | | 18.84 | % | | | 24.27 | % | | | (38.41 | )% | | | 15.17 | % | | | 14.15 | % |
Ratios to average net assets (annualized) | | | | | | | | | | | | | | | | | | | | | | | | | | | | |
Gross expenses | | | 1.09 | % | | | 1.09 | % | | | 1.14 | % | | | 1.17 | % | | | 1.17 | % | | | 1.18 | % | | | 1.13 | % |
Net expenses | | | 1.00 | % | | | 1.03 | % | | | 1.04 | % | | | 1.04 | % | | | 1.04 | % | | | 1.04 | % | | | 1.04 | % |
Net investment income | | | 0.17 | % | | | 0.17 | % | | | 0.13 | % | | | 0.51 | % | | | 0.49 | % | | | 0.73 | % | | | 0.48 | % |
Supplemental data | | | | | | | | | | | | | | | | | | | | | | | | | | | | |
Portfolio turnover rate | | | 19 | % | | | 31 | % | | | 42 | % | | | 55 | % | | | 73 | % | | | 56 | % | | | 39 | % |
Net assets, end of period (000’s omitted) | | | $432,413 | | | | $360,968 | | | | $190,054 | | | | $124,175 | | | | $97,243 | | | | $151,776 | | | | $167,560 | |
| 1. | For the eleven months ended September 30, 2010. The Fund changed its fiscal year end from October 31 to September 30, effective September 30, 2010. |
| 2. | Calculated based upon average shares outstanding |
| 3. | Returns for periods of less than one year are not annualized. |
The accompanying notes are an integral part of these financial statements.
| | | | |
| 20 | | Wells Fargo Advantage Opportunity Fund | | Financial Highlights |
(For a share outstanding throughout each period)
| | | | | | | | | | | | |
| | | Six Months Ended
March 31, 2012 (Unaudited) | | | Year Ended September 30, | |
| Institutional Class | | | 2011 | | | 20101 | |
Net asset value, beginning of period | | $ | 33.52 | | | $ | 35.45 | | | $ | 33.36 | |
Net investment income | | | 0.07 | 2 | | | 0.24 | 2 | | | 0.02 | 2 |
Net realized and unrealized gains (losses) on investments | | | 8.46 | | | | (2.17 | ) | | | 2.07 | |
| | | | | | | | | | | | |
Total from investment operations | | | 8.53 | | | | (1.93 | ) | | | 2.09 | |
Net asset value, end of period | | $ | 42.05 | | | $ | 33.52 | | | $ | 35.45 | |
Total return3 | | | 25.45 | % | | | (5.44 | )% | | | 6.26 | % |
Ratios to average net assets (annualized) | | | | | | | | | | | | |
Gross expenses | | | 0.82 | % | | | 0.83 | % | | | 0.81 | % |
Net expenses | | | 0.75 | % | | | 0.78 | % | | | 0.81 | % |
Net investment income | | | 0.38 | % | | | 0.61 | % | | | 0.36 | % |
Supplemental data | | | | | | | | | | | | |
Portfolio turnover rate | | | 19 | % | | | 31 | % | | | 42 | % |
Net assets, end of period (000’s omitted) | | | $10,880 | | | | $14,027 | | | | $11 | |
| 1 | For the period from July 30, 2010 (commencement of class operations) to September 30, 2010 |
| 2. | Calculated based upon average shares outstanding |
| 3. | Returns for periods of less than one year are not annualized. |
The accompanying notes are an integral part of these financial statements.
| | | | | | |
| Financial Highlights | | Wells Fargo Advantage Opportunity Fund | | | 21 | |
(For a share outstanding throughout each period)
| | | | | | | | | | | | | | | | | | | | | | | | | | | | |
| | | Six Months Ended
March 31, 2012 (Unaudited) | | | Year Ended September 30, | | | Year Ended October 31, | |
| Investor Class | | | 2011 | | | 20101 | | | 2009 | | | 2008 | | | 2007 | | | 2006 | |
Net asset value, beginning of period | | $ | 32.76 | | | $ | 34.82 | | | $ | 29.44 | | | $ | 23.76 | | | $ | 46.28 | | | $ | 48.54 | | | $ | 47.29 | |
Net investment income (loss) | | | (0.03 | ) | | | (0.07 | ) | | | (0.05 | )2 | | | 0.05 | 2 | | | 0.06 | 2 | | | 0.23 | 2 | | | 0.09 | |
Net realized and unrealized gains (losses) on investments | | | 8.26 | | | | (1.99 | ) | | | 5.49 | | | | 5.63 | | | | (15.48 | ) | | | 6.04 | | | | 6.09 | |
| | | | | | | | | | | | | | | | | | | | | | | | | | | | |
Total from investment operations | | | 8.23 | | | | (2.06 | ) | | | 5.44 | | | | 5.68 | | | | (15.42 | ) | | | 6.27 | | | | 6.18 | |
Distributions to shareholders from | | | | | | | | | | | | | | | | | | | | | | | | | | | | |
Net investment income | | | 0.00 | | | | 0.00 | | | | (0.06 | ) | | | 0.00 | | | | (0.46 | ) | | | (0.09 | ) | | | 0.00 | |
Net realized gains | | | 0.00 | | | | 0.00 | | | | 0.00 | | | | 0.00 | | | | (6.47 | ) | | | (8.44 | ) | | | (4.93 | ) |
Tax basis return of capital | | | 0.00 | | | | 0.00 | | | | 0.00 | | | | 0.00 | | | | (0.17 | ) | | | 0.00 | | | | 0.00 | |
| | | | | | | | | | | | | | | | | | | | | | | | | | | | |
Total distributions to shareholders | | | 0.00 | | | | 0.00 | | | | (0.06 | ) | | | 0.00 | | | | (7.10 | ) | | | (8.53 | ) | | | (4.93 | ) |
Net asset value, end of period | | $ | 40.99 | | | $ | 32.76 | | | $ | 34.82 | | | $ | 29.44 | | | $ | 23.76 | | | $ | 46.28 | | | $ | 48.54 | |
Total return3 | | | 25.12 | % | | | (5.92 | )% | | | 18.48 | % | | | 23.91 | % | | | (38.60 | )% | | | 14.81 | % | | | 13.81 | % |
Ratios to average net assets (annualized) | | | | | | | | | | | | | | | | | | | | | | | | | | | | |
Gross expenses | | | 1.32 | % | | | 1.32 | % | | | 1.41 | % | | | 1.46 | % | | | 1.49 | % | | | 1.53 | % | | | 1.47 | % |
Net expenses | | | 1.32 | % | | | 1.32 | % | | | 1.35 | % | | | 1.35 | % | | | 1.35 | % | | | 1.35 | % | | | 1.35 | % |
Net investment income (loss) | | | (0.14 | )% | | | (0.15 | )% | | | (0.17 | )% | | | 0.21 | % | | | 0.17 | % | | | 0.50 | % | | | 0.18 | % |
Supplemental data | | | | | | | | | | | | | | | | | | | | | | | | | | | | |
Portfolio turnover rate | | | 19 | % | | | 31 | % | | | 42 | % | | | 55 | % | | | 73 | % | | | 56 | % | | | 39 | % |
Net assets, end of period (000’s omitted) | | | $1,100,812 | | | | $941,172 | | | | $1,115,250 | | | | $1,030,766 | | | | $895,916 | | | | $1,721,922 | | | | $1,834,134 | |
| 1 | For the eleven months ended September 30, 2010. The Fund changed its fiscal year end from October 31 to September 30, effective September 30, 2010. |
| 2. | Calculated based upon average shares outstanding |
| 3. | Returns for periods of less than one year are not annualized. |
The accompanying notes are an integral part of these financial statements.
| | | | |
| 22 | | Wells Fargo Advantage Opportunity Fund | | Notes to Financial Statements (Unaudited) |
1. ORGANIZATION
Wells Fargo Funds Trust (the “Trust”), a Delaware statutory trust organized on March 10, 1999, is an open-end management investment company registered under the Investment Company Act of 1940, as amended (the “1940 Act”). These financial statements report on Wells Fargo Advantage Opportunity Fund (the “Fund”) which is a diversified series of the Trust.
2. SIGNIFICANT ACCOUNTING POLICIES
The following significant accounting policies, which are consistently followed in the preparation of the financial statements of the Fund, are in conformity with U.S. generally accepted accounting principles which require management to make estimates and assumptions that affect the reported amounts of assets and liabilities, disclosure of contingent assets and liabilities at the date of the financial statements, and the reported amounts of revenues and expenses during the reporting period. Actual results could differ from those estimates.
Securities valuation
Investments in equity securities are valued each business day as of the close of regular trading on the New York Stock Exchange, which is usually 4:00 p.m. (Eastern Time). Securities which are traded on a national or foreign securities exchange are valued at the last reported sales price, except that securities listed on The Nasdaq Stock Market, Inc. (“Nasdaq”) are valued at the Nasdaq Official Closing Price (“NOCP”), and if no NOCP is available, then at the last reported sales price. If no sales price is shown on the Nasdaq, the bid price will be used. In the absence of any sale of securities listed on the Nasdaq, and in the case of other securities (including U.S. Government obligations, but excluding debt securities maturing in 60 days or less), the price will be deemed “stale” and the valuations will be determined in accordance with the Fund’s Fair Value Procedures.
Securities denominated in foreign currencies are translated into U.S. dollars using the closing rates of exchange in effect on the day of valuation.
Many securities markets and exchanges outside the U.S. close prior to the close of the New York Stock Exchange and therefore may not fully reflect trading or events that occur after the close of the principal exchange in which the foreign investments are traded but before the close of the New York Stock Exchange. If such trading or events are expected to materially affect the value of the investments, then those investments are fair valued following procedures approved by the Board of Trustees. These procedures take into account multiple factors including movements in U.S. securities markets after foreign exchanges close. Depending on market activity, such fair valuations may be frequent. Such fair value pricing may result in NAVs that are higher or lower than NAVs based on the closing price or latest quoted bid price.
Investments in open-end mutual funds and non-registered investment companies are generally valued at net asset value.
Investments which are not valued using any of the methods discussed above, are valued at their fair value, as determined by procedures established in good faith and approved by the Board of Trustees. The Board of Trustees has established a Valuation Committee comprised of the Trustees and has delegated to it the authority to take any actions regarding the valuation of portfolio securities that the Valuation Committee deems necessary in determining the fair value of portfolio securities, unless the responsibility has been delegated to the Management Valuation Team of Wells Fargo Funds Management, LLC (“Funds Management”). The Board of Trustees retains the authority to make or ratify any valuation decisions or approve any changes to the Fair Value Procedures as it deems appropriate. On a quarterly basis, the Board of Trustees considers for ratification any valuation actions taken by the Valuation Committee or the Management Valuation Team.
Valuations of fair valued prices are compared to the next actual sales price when available, or other appropriate market information to assess the continued appropriateness of the fair valuation methodology used. The securities are fair valued on a day-to-day basis, taking into consideration changes to appropriate market information and any significant changes to the input factors considered in the valuation process until there is a readily available price provided on the exchange or by an independent pricing service. Valuations received from an independent pricing service or broker quotes are periodically validated by comparisons to most recent trades and valuations provided by other independent pricing services in addition to the review of prices by the adviser and/or sub-adviser. Unobservable inputs used in determining fair valuations are identified based on the type of security, taking into consideration factors utilized by market participants in valuing the investment, knowledge about the issuer and the current market environment.
| | | | | | |
| Notes to Financial Statements (Unaudited) | | Wells Fargo Advantage Opportunity Fund | | | 23 | |
Foreign currency translation
The accounting records of the Fund are maintained in U.S. dollars. Assets, including investment securities, and liabilities denominated in foreign currency are translated into U.S. dollars at the prevailing rates of exchange at the date of valuation. Purchases and sales of securities, and income and expenses are translated at the prevailing rate of exchange on the respective dates of such transactions. Reported net realized foreign exchange gains or losses arise from sales of foreign currencies, currency gains or losses realized between the trade and settlement dates on securities transactions, and the difference between the amounts of dividends, interest and foreign withholding taxes recorded and the U.S. dollar equivalent of the amounts actually paid or received. Net unrealized foreign exchange gains and losses arise from changes in the fair value of assets and liabilities other than investments in securities resulting in changes in exchange rates.
The changes in net assets arising from changes in exchange rates and the changes in net assets resulting from changes in market prices of securities are not separately presented. Such changes are recorded with net realized and unrealized gains or losses from investments. Gains and losses from certain foreign currency transactions are treated as ordinary income for U.S. federal income tax purposes.
Security loans
The Fund may lend its securities from time to time in order to earn additional income in the form of fees or interest on securities received as collateral or the investment of any cash received as collateral. The Fund continues to receive interest or dividends on the securities loaned. The Fund receives collateral in the form of cash or securities with a value at least equal to the value of the securities on loan. The value of the loaned securities is determined at the close of each business day and any additional required collateral is delivered to the Fund on the next business day. In a securities lending transaction, the net asset value of the Fund will be affected by an increase or decrease in the value of the securities loaned and by an increase or decrease in the value of the instrument in which collateral is invested. The amount of securities lending activity undertaken by the Fund fluctuates from time to time. In the event of default or bankruptcy by the borrower, the Fund may be prevented from recovering the loaned securities or gaining access to the collateral or may experience delays or costs in doing so. In addition, the investment of any cash collateral received may lose all or part of its value. The Fund has the right under the lending agreement to recover the securities from the borrower on demand.
The Fund lends its securities through an unaffiliated securities lending agent. Cash collateral received in connection with its securities lending transactions is invested in Wells Fargo Securities Lending Cash Investments, LLC (the “Cash Collateral Fund”). The Cash Collateral Fund is exempt from registration under Section 3(c)(7) of the 1940 Act and is managed by Funds Management and is sub-advised by Wells Capital Management Incorporated (“Wells Capital Management”). Funds Management receives an advisory fee starting at 0.05% and declining to 0.01% as the average daily net assets of the Cash Collateral Fund increase. All of the fees received by Funds Management are paid to Wells Capital Management for its services as sub-adviser. The Cash Collateral Fund seeks to provide a positive return compared to the daily Fed Funds Open rate by investing in high-quality, U.S. dollar-denominated short-term money market instruments. Cash Collateral Fund investments are fair valued based upon the amortized cost valuation technique. Income earned from investment in the Cash Collateral Fund is included in securities lending income on the Statement of Operations.
For Wells Fargo Advantage Funds that participated in securities lending activity prior to February 13, 2009, certain structured investment vehicles purchased in a joint account by the former securities lending agent defaulted or were impaired. Certain of the Wells Fargo Advantage Funds still hold ownership interest in these structured investment vehicles, which have since been restructured as pass-through securities. If the Fund holds an ownership interest in such pass-through securities, information regarding this ownership interest can be found in the Portfolio of Investments under the category “Other”.
Security transactions and income recognition
Securities transactions are recorded on a trade date basis. Realized gains or losses are reported on the basis of identified cost of securities delivered.
Interest income is accrued daily and bond discounts are accreted and premiums are amortized daily based on the effective interest method. To the extent debt obligations are placed on non-accrual status, any related interest income may be reduced by writing off interest receivables when the collection of all or a portion of interest has become doubtful based on consistently applied procedures. If the issuer subsequently resumes interest payments or when the collectability of interest is reasonably assured, the debt obligation is removed from non-accrual status.
| | | | |
| 24 | | Wells Fargo Advantage Opportunity Fund | | Notes to Financial Statements (Unaudited) |
Dividend income is recognized on the ex-dividend date, except for certain dividends from foreign securities, which are recorded as soon as the Fund is informed of the ex-dividend date. Dividend income from foreign securities is recorded net of foreign taxes withheld where recovery of such taxes is not assured.
Distributions to shareholders
Distributions to shareholders from net investment income and net realized gains, if any, are recorded on the ex-dividend date. Such distributions are determined in conformity with income tax regulations, which may differ from generally accepted accounting principles.
Federal and other taxes
The Fund intends to continue to qualify as a regulated investment company by distributing substantially all of its investment company taxable income and any net realized capital gains (after reduction for capital loss carryforwards) sufficient to relieve it from all, or substantially all, federal income taxes. Accordingly, no provision for federal income taxes was required.
The Fund’s income and federal excise tax returns and all financial records supporting those returns for the prior three fiscal years are subject to examination by the federal and Delaware revenue authorities. Management has analyzed the Fund’s tax positions taken on federal, state, and foreign tax returns for all open tax years and does not believe that there are any uncertain tax positions that require recognition of a tax liability.
Under the recently enacted Regulated Investment Company Modernization Act of 2010, the Fund is permitted to carry forward capital losses incurred in taxable years which began after December 22, 2010 for an unlimited period. However, any losses incurred are required to be utilized prior to the losses incurred in pre-enactment taxable years. As a result of this ordering rule, pre-enactment capital loss carryforwards may be more likely to expire unused. Additionally, post-enactment capital losses that are carried forward will retain their character as either short-term or long-term capital losses rather than being considered all short-term as under previous law.
As of September 30, 2011, the Fund had net capital loss carryforwards, which were available to offset future net realized capital gains, in the amount of $8,304,841 expiring in 2019.
Class allocations
The separate classes of shares offered by the Fund differ principally in applicable sales charges, distribution, shareholder servicing and administration fees. Shareholders of each class bear certain expenses that pertain to that particular class. All shareholders bear the common expenses of the Fund, earn income from the portfolio, and are allocated unrealized gains and losses pro rata based on the average daily net assets of each class, without distinction between share classes. Dividends are determined separately for each class based on income and expenses allocable to each class. Realized gains and losses are allocated to each class pro rata based upon the net assets of each class on the date realized. Differences in per share dividend rates generally result from the relative weightings of pro rata income and realized gain allocations and from differences in separate class expenses, including distribution, shareholder servicing and administration fees.
3. FAIR VALUATION MEASUREMENTS
Fair value measurements of investments are determined within a framework that has established a fair value hierarchy based upon the various data inputs utilized in determining the value of the Fund’s investments. The three-level hierarchy gives the highest priority to unadjusted quoted prices in active markets for identical assets or liabilities (Level 1) and the lowest priority to significant unobservable inputs (Level 3). The Fund’s investments are classified within the fair value hierarchy based on the lowest level of input that is significant to the fair value measurement. The inputs are summarized into three broad levels as follows:
| n | | Level 1 – quoted prices in active markets for identical securities |
| n | | Level 2 – other significant observable inputs (including quoted prices for similar securities, interest rates, prepayment speeds, credit risk, etc.) |
| n | | Level 3 – significant unobservable inputs (including the Fund’s own assumptions in determining the fair value of investments) |
The inputs or methodologies used for valuing securities are not necessarily an indication of the risk associated with investing in those securities.
| | | | | | |
| Notes to Financial Statements (Unaudited) | | Wells Fargo Advantage Opportunity Fund | | | 25 | |
As of March 31, 2012, the inputs used in valuing the Fund’s assets, which are carried at fair value, were as follows:
| | | | | | | | | | | | | | | | |
| Investments in Securities | | Quoted Prices (Level 1) | | | Significant Other
Observable Inputs (Level 2) | | | Significant Unobservable Inputs (Level 3) | | | Total | |
Equity securities | | | | | | | | | | | | | | | | |
Common stocks | | $ | 2,004,562,948 | | | $ | 0 | | | $ | 0 | | | $ | 2,004,562,948 | |
Other | | | 0 | | | | 0 | | | | 4,969,505 | | | | 4,969,505 | |
Short-term investments | | | | | | | | | | | | | | | | |
Investment companies | | | 68,779,712 | | | | 155,584,049 | | | | 0 | | | | 224,363,761 | |
| | | $ | 2,073,342,660 | | | $ | 155,584,049 | | | $ | 4,969,505 | | | $ | 2,233,896,214 | |
Further details on the major security types listed above can be found in the Portfolio of Investments.
Transfers in and transfers out are recognized at the end of the reporting period. For the six months ended March 31, 2012, the Fund did not have any significant transfers into/out of Level 1 and Level 2.
4. TRANSACTIONS WITH AFFILIATES AND OTHER EXPENSES
Advisory fee
The Trust has entered into an advisory contract with Funds Management, an indirect wholly owned subsidiary of Wells Fargo & Company (“Wells Fargo”). The adviser is responsible for implementing investment policies and guidelines and for supervising the sub-adviser, who is responsible for day-to-day portfolio management of the Fund.
Pursuant to the contract, Funds Management is entitled to receive an annual advisory fee starting at 0.70% and declining to 0.60% as the average daily net assets of the Fund increase. For the six months ended March 31, 2012, the advisory fee was equivalent to an annual rate of 0.67% of the Fund’s average daily net assets.
Funds Management has retained the services of certain sub-advisers to provide daily portfolio management to the Fund. The fees related to sub-advisory services are borne directly by Funds Management and do not increase the overall fees paid by the Fund. Wells Capital Management, an affiliate of Funds Management, is the sub-adviser to the Fund and is entitled to receive a fee from Funds Management at an annual rate starting at 0.45% and declining to 0.30% as the average daily net assets of the Fund increase.
Administration and transfer agent fees
The Trust has entered into an administration agreement with Funds Management. Under this agreement, for providing administrative services, which includes paying fees and expenses for services provided by the transfer agent, sub-transfer agents, omnibus account servicers and record-keepers, Funds Management is entitled to receive from the Fund an annual fund level administration fee starting at 0.05% and declining to 0.03% as the average daily net assets of the Fund increase and a class level administration fee which is calculated based on the average daily net assets of each class as follows:
| | | | |
| | | Class Level Administration Fee | |
Class A, Class B, Class C | | | 0.26 | % |
Administrator Class | | | 0.10 | |
Institutional Class | | | 0.08 | |
Investor Class | | | 0.33 | |
Funds Management has contractually waived and/or reimbursed advisory and administration fees to the extent necessary to maintain certain net operating expense ratios for the Fund. Waiver of fees and/or reimbursement of expenses by Funds Management were made first from fund level expenses on a proportionate basis and then from class specific expenses. Funds Management has committed through July 18, 2013 to waive fees and/or reimburse expenses to the extent necessary to cap the Fund’s expenses at 1.25% for Class A, 2.00% for Class B, 2.00% for Class C, 1.00% for Administrator Class, 0.75% for Institutional Class and 1.32% for Investor Class.
| | | | |
| 26 | | Wells Fargo Advantage Opportunity Fund | | Notes to Financial Statements (Unaudited) |
Distribution fees
The Trust has adopted a Distribution Plan for Class B and Class C shares of the Fund pursuant to Rule 12b-1 under the 1940 Act. Distribution fees are charged to Class B and Class C shares and paid to Wells Fargo Funds Distributor, LLC, the principal underwriter, at an annual rate of 0.75% of the average daily net assets of Class B and Class C shares.
For the six months ended March 31, 2012, Wells Fargo Funds Distributor, LLC received $4,219 from the sale of Class A shares and $6,251 and $2,108 in contingent deferred sales charges from redemptions of Class B and Class C shares, respectively.
Shareholder servicing fees
The Trust has entered into contracts with one or more shareholder servicing agents, whereby Class A, Class B, Class C, Administrator Class and Investor Class of the Fund is charged a fee at an annual rate of 0.25% of the average daily net assets of each respective class.
A portion of these total shareholder servicing fees were paid to affiliates of Wells Fargo.
5. INVESTMENT PORTFOLIO TRANSACTIONS
Purchases and sales of investments, excluding U.S. Government obligations (if any) and short-term securities, for the six months ended March 31, 2012 were $363,157,865 and $519,645,647, respectively.
6. ACQUISITION
After the close of business on August 26, 2011, the Fund acquired the net assets of Wells Fargo Advantage Core Equity Fund. The purpose of the transaction was to combine two funds with similar investment objectives and strategies. Shareholders holding Class A, Class B, Class C, Administrator Class and Institutional Class shares of Wells Fargo Advantage Core Equity Fund received Class A, Class B, Class C, Administrator Class and Institutional Class shares, respectively, of the Fund in the reorganization. The acquisition was accomplished by a tax-free exchange of all of the shares of Wells Fargo Advantage Core Equity Fund for 19,621,184 shares of the Fund valued at $670,318,279 at an exchange ratio of 0.53, 0.47, 0.47, 0.52, and 0.52 for Class A, Class B, Class C, Administrator Class and Institutional Class shares, respectively. The investment portfolio of Wells Fargo Advantage Core Equity Fund with a fair value of $666,385,431, identified cost of $756,097,944 and unrealized losses of $89,712,513 at August 26, 2011 were the principal assets acquired by the Fund. The aggregate net assets of Wells Fargo Advantage Core Equity Fund and the Fund immediately prior to the acquisition were $670,318,279 and $1,218,175, 749, respectively. The aggregate net assets of the Fund immediately after the acquisition were $1,888,494,028. For financial reporting purposes, assets received and shares issued by the Fund were recorded at fair value; however, the cost basis of the investments received from Wells Fargo Advantage Core Equity Fund was carried forward to align ongoing reporting of the Fund’s realized and unrealized gains and losses with amounts distributable to shareholders for tax purposes.
Assuming the acquisition had been completed October 1, 2010, the beginning of the annual reporting period for the Fund, the pro forma results of operations for the year ended September 30, 2011 would have been:
| | | | |
Net investment income | | $ | 1,341,554 | |
Net realized and unrealized losses on investments | | $ | (2,878,219 | ) |
Net decrease in net assets resulting from operations | | $ | (1,536,665 | ) |
7. BANK BORROWINGS
The Trust (excluding the money market funds) and Wells Fargo Variable Trust are parties to a $150,000,000 revolving credit agreement with State Street Bank and Trust Company, whereby the Fund is permitted to use bank borrowings for temporary or emergency purposes, such as to fund shareholder redemption requests. Interest under the credit agreement is charged to the Fund based on a borrowing rate equal to the higher of the Federal Funds rate in effect on that day plus 1.25% or the overnight LIBOR rate in effect on that day plus 1.25%. In addition, an annual commitment fee equal to 0.10% of the unused balance is allocated to each participating fund. For the six months ended March 31, 2012, the Fund paid $1,762 in commitment fees.
For the six months ended March 31, 2012, there were no borrowings by the Fund under the agreement.
| | | | | | |
| Notes to Financial Statements (Unaudited) | | Wells Fargo Advantage Opportunity Fund | | | 27 | |
8. INDEMNIFICATION
Under the Trust’s organizational documents, the officers and directors are indemnified against certain liabilities that may arise out of performance of their duties to the Trust. Additionally, in the normal course of business, the Trust may enter into contracts with service providers that contain a variety of indemnification clauses. The Trust’s maximum exposure under these arrangements is dependent on future claims that may be made against the Fund and, therefore, cannot be estimated.
9. NEW ACCOUNTING PRONOUNCEMENTS
In December 2011, the Financial Accounting Standards Board (“FASB”) issued Accounting Standard Update (“ASU”) No. 2011-11, Disclosures about Offsetting Assets and Liabilities. ASU 2011-11, which amends FASB ASC Topic 210 Balance Sheet, creates new disclosure requirements which require entities to disclose both gross and net information for derivatives and other financial instruments that are either offset in the Statement of Assets and Liabilities or subject to an enforceable master netting arrangement or similar agreement. The disclosure requirements are effective for interim and annual reporting periods beginning on or after January 1, 2013. Management is currently evaluating the impact of the update’s adoption on the Fund’s financial statement disclosures.
In May 2011, FASB issued ASU No. 2011-04 “Amendments to Achieve Common Fair Value Measurement and Disclosure Requirements in U.S. GAAP and IFRSs”. ASU No. 2011-04 amends FASB ASC Topic 820, Fair Value Measurements and Disclosures, to establish common requirements for measuring fair value and for disclosing information about fair value measurements in accordance with GAAP. The ASU is effective prospectively for interim and annual periods beginning after December 15, 2011. Management expects that adoption of the ASU will result in additional disclosures in the financial statements, as applicable.
In April 2011, FASB issued ASU No. 2011-03 “Reconsideration of Effective Control for Repurchase Agreements”. ASU No. 2011-03 amends FASB ASC Topic 860, Transfers and Servicing, specifically the criteria required to determine whether a repurchase agreement (repo) and similar agreements should be accounted for as sales of financial assets or secured borrowings with commitments. ASU No. 2011-03 changes the assessment of effective control by focusing on the transferor’s contractual rights and obligations and removing the criterion to assess its ability to exercise those rights or honor those obligations. This could result in changes to the way entities account for certain transactions including repurchase agreements, mortgage dollar rolls and reverse repurchase agreements. The ASU will become effective on a prospective basis for new transfers and modifications to existing transactions as of the beginning of the first interim or annual period beginning on or after December 15, 2011. Management has evaluated the impact of adopting the ASU and expects no significant changes.
| | | | |
| 28 | | Wells Fargo Advantage Opportunity Fund | | Other Information (Unaudited) |
PROXY VOTING INFORMATION
A description of the policies and procedures that the Fund uses to determine how to vote proxies relating to portfolio securities is available without charge, upon request, by calling 1-800-222-8222, visiting our Web site at wellsfargoadvantagefunds.com, or visiting the SEC Web site at sec.gov. Information regarding how the Fund voted proxies relating to portfolio securities during the most recent 12-month period ended June 30 is available without charge on the Fund’s Web site at wellsfargoadvantagefunds.com or by visiting the SEC Web site at sec.gov.
PORTFOLIO HOLDINGS INFORMATION
The complete portfolio holdings for the Fund are publicly available on the Fund’s Web site (wellsfargoadvantagefunds.com) on a monthly, 30-day or more delayed basis. In addition, top ten holdings information for the Fund is publicly available on the Fund’s Web site on a monthly, seven-day or more delayed basis. The Fund files its complete schedule of portfolio holdings with the SEC for the first and third quarters of each fiscal year on Form N-Q, which is available without charge by visiting the SEC Web site at sec.gov. In addition, the Fund’s Form N-Q may be reviewed and copied at the SEC’s Public Reference Room in Washington, DC, and at regional offices in New York City, at 233 Broadway, and in Chicago, at 175 West Jackson Boulevard, Suite 900. Information about the Public Reference Room may be obtained by calling 1-800-SEC-0330.
| | | | | | |
| Other Information (Unaudited) | | Wells Fargo Advantage Opportunity Fund | | | 29 | |
BOARD OF TRUSTEES
The following table provides basic information about the Board of Trustees (the “Trustees”) of the Trust and Officers of the Trust. This table should be read in conjunction with the Prospectus and the Statement of Additional Information1 of the Fund. Each of the Trustees and Officers listed below acts in identical capacities for the Wells Fargo Advantage family of funds, which consists of 137 funds comprising the Wells Fargo Funds Trust, Wells Fargo Variable Trust, Wells Fargo Master Trust and four closed-end funds (collectively the “Fund Complex”). All of the Trustees are also Members of the Audit and Governance Committees of each Trust in the Fund Complex. The mailing address of each Trustee and Officer is 525 Market Street, 12th Floor, San Francisco, CA 94105. Each Trustee and Officer serves an indefinite term, however, each Trustee serves such term until reaching the mandatory retirement age established by the Trustees.
Independent Trustees
| | | | | | |
Name and Year of Birth | | Position Held and Length of Service | | Principal Occupations During Past Five Years | | Other Directorships During
Past Five Years |
Peter G. Gordon
(Born 1942) | | Trustee, since 1998; Chairman, since 2005 (Lead Trustee since 2001) | | Co-Founder, Retired Chairman, President and CEO of Crystal Geyser Water Company. Trustee Emeritus, Colby College | | Asset Allocation Trust |
Isaiah Harris, Jr.
(Born 1952) | | Trustee, since 2009 | | Retired. Prior thereto, President and CEO of BellSouth Advertising and Publishing Corp. from 2005 to 2007, President and CEO of BellSouth Enterprises from 2004 to 2005 and President of BellSouth Consumer Services from 2000 to 2003. Emeritus member of the Iowa State University Foundation Board of Governors. Emeritus Member of the Advisory Board of Iowa State University School of Business. Mr. Harris is a certified public accountant. | | CIGNA Corporation; Deluxe Corporation; Asset Allocation Trust |
Judith M. Johnson
(Born 1949) | | Trustee, since 2008 | | Retired. Prior thereto, Chief Executive Officer and Chief Investment Officer of Minneapolis Employees Retirement Fund from 1996 to 2008. Ms. Johnson is an attorney, certified public accountant and a certified managerial accountant. | | Asset Allocation Trust |
Leroy Keith, Jr.
(Born 1939) | | Trustee, since 2010 | | Chairman, Bloc Global Services (development and construction). Trustee of the Evergreen Funds from 1983 to 2010. Former Managing Director, Almanac Capital Management (commodities firm), former Partner, Stonington Partners, Inc. (private equity fund), former Director, Obagi Medical Products Co. and former Director, Lincoln Educational Services. | | Trustee, Virtus Fund Complex (consisting of 40 portfolios as of 12/31/11); Asset Allocation Trust |
David F. Larcker
(Born 1950) | | Trustee, since 2009 | | James Irvin Miller Professor of Accounting at the Graduate School of Business, Stanford University, Director of Corporate Governance Research Program and Senior Faculty of The Rock Center for Corporate Governance since 2006. From 2005 to 2008, Professor of Accounting at the Graduate School of Business, Stanford University. Prior thereto, Ernst & Young Professor of Accounting at The Wharton School, University of Pennsylvania from 1985 to 2005. | | Asset Allocation Trust |
Olivia S. Mitchell
(Born 1953) | | Trustee, since 2006 | | International Foundation of Employee Benefit Plans Professor, Wharton School of the University of Pennsylvania since 1993. Director of Wharton’s Pension Research Council and Boettner Center on Pensions & Retirement Research, and Research Associate at the National Bureau of Economic Research. Previously, Cornell University Professor from 1978 to 1993. | | Asset Allocation Trust |
| | | | |
| 30 | | Wells Fargo Advantage Opportunity Fund | | Other Information (Unaudited) |
| | | | | | |
Name and Year of Birth | | Position Held and Length of Service | | Principal Occupations During Past Five Years | | Other Directorships During
Past Five Years |
Timothy J. Penny
(Born 1951) | | Trustee, since 1996 | | President and CEO of Southern Minnesota Initiative Foundation, a non-profit organization, since 2007 and Senior Fellow at the Humphrey Institute Policy Forum at the University of Minnesota since 1995. Member of the Board of Trustees of NorthStar Education Finance, Inc., a non-profit organization, since 2007. | | Asset Allocation Trust |
Michael S. Scofield
(Born 1943) | | Trustee, since 2010 | | Served on the Investment Company Institute’s Board of Governors and Executive Committee from 2008-2011 as well the Governing Council of the Independent Directors Council from 2006-2011 and the Independent Directors Council Executive Committee from 2008-2011. Chairman of the IDC from 2008-2010. Institutional Investor (Fund Directions) Trustee of Year in 2007. Trustee of the Evergreen Funds (and its predecessors) from 1984 to 2010. Chairman of the Evergreen Funds from 2000-2010. Former Trustee of the Mentor Funds. Retired Attorney, Law Offices of Michael S. Scofield and former Director and Chairman, Branded Media Corporation (multi-media branding company). | | Asset Allocation Trust |
Donald C. Willeke
(Born 1940) | | Trustee, since 1996 | | Principal of the law firm of Willeke & Daniels. General Counsel of the Minneapolis Employees Retirement Fund from 1984 until its consolidation into the Minnesota Public Employees Retirement Association on June 30, 2010. Director and Vice Chair of The Free Trust (non-profit corporation). Director of the American Chestnut Foundation (non-profit corporation). | | Asset Allocation Trust |
Officers
| | | | | | |
Name and Year of Birth | | Position Held and
Length of Service | | Principal Occupations During Past Five Years | | |
Karla M. Rabusch
(Born 1959) | | President, since 2003 | | Executive Vice President of Wells Fargo Bank, N.A. and President of Wells Fargo Funds Management, LLC since 2003. Senior Vice President and Chief Administrative Officer of Wells Fargo Funds Management, LLC from 2001 to 2003. | | |
C. David Messman
(Born 1960) | | Secretary, since 2000; Chief Legal Counsel, since 2003 | | Senior Vice President and Secretary of Wells Fargo Funds Management, LLC since 2001. Vice President and Managing Senior Counsel of Wells Fargo Bank, N.A. since 1996. | | |
Kasey Phillips
(Born 1970) | | Treasurer, since 2009 | | Senior Vice President of Wells Fargo Funds Management, LLC since 2009. Senior Vice President of Evergreen Investment Management Company, LLC from 2006 to 2010. Treasurer of the Evergreen Funds from 2005 to 2010. | | |
David Berardi
(Born 1975) | | Assistant Treasurer, since 2009 | | Vice President of Wells Fargo Funds Management, LLC since 2009. Vice President of Evergreen Investment Management Company, LLC from 2008 to 2010. Assistant Vice President of Evergreen Investment Services, Inc. from 2004 to 2008. Manager of Fund Reporting and Control for Evergreen Investment Management Company, LLC from 2004 to 2010. | | |
Jeremy DePalma
(Born 1974) | | Assistant Treasurer, since 2009 | | Senior Vice President of Wells Fargo Funds Management, LLC since 2009. Senior Vice President of Evergreen Investment Management Company, LLC from 2008 to 2010. Vice President, Evergreen Investment Services, Inc. from 2004 to 2007. Head of the Fund Reporting and Control Team within Fund Administration from 2005 to 2010. | | |
Debra Ann Early
(Born 1964) | | Chief Compliance Officer, since 2007 | | Chief Compliance Officer of Wells Fargo Funds Management, LLC since 2007. Chief Compliance Officer of Parnassus Investments from 2005 to 2007. Chief Financial Officer of Parnassus Investments from 2004 to 2007 and Senior Audit Manager of PricewaterhouseCoopers LLP from 1998 to 2004. | | |
| 1. | The Statement of Additional Information includes additional information about the Trustees and is available, without charge, upon request, by calling 1-800-222-8222 or by visiting the Web site at wellsfargoadvantagefunds.com. |
| | | | | | |
| Other Information (Unaudited) | | Wells Fargo Advantage Opportunity Fund | | | 31 | |
BOARD CONSIDERATION OF INVESTMENT ADVISORY AND SUB-ADVISORY AGREEMENTS:
Under Section 15 of the Investment Company Act of 1940 (the “1940 Act”), the Board of Trustees (the “Board”) of Wells Fargo Funds Trust (the “Trust”), all the members of which have no direct or indirect interest in the investment advisory and sub-advisory agreements and are not “interested persons” of the Trust, as defined in the 1940 Act (the “Independent Trustees”), must determine whether to approve the continuation of the Trust’s investment advisory and sub-advisory agreements. In this regard, at an in person meeting held on March 29-30, 2012 (the “Meeting”), the Board reviewed and re-approved: (i) an investment advisory agreement with Wells Fargo Funds Management, LLC (“Funds Management”) for Wells Fargo Advantage Opportunity Fund (the “Fund”) and (ii) an investment sub-advisory agreement with Wells Capital Management Incorporated (“Wells Capital Management”) for the Fund. The investment advisory agreement with Funds Management and the investment sub-advisory agreement with Wells Capital Management are collectively referred to as the “Advisory Agreements.”
At the Meeting, the Board considered the factors and reached the conclusions described below relating to the selection of Funds Management and Wells Capital Management and the continuation of the Advisory Agreements. Prior to the Meeting, the Trustees conferred extensively among themselves and with representatives of Funds Management about these matters. The Board also met throughout the year and received information that was useful to them in considering the continuation of the Advisory Agreements. The Independent Trustees were assisted in their evaluation of the Advisory Agreements by independent legal counsel, from whom they received separate legal advice and with whom they met separately from Funds Management.
In providing information to the Board, Funds Management and Wells Capital Management were guided by a detailed set of requests submitted by the Independent Trustees’ independent legal counsel on their behalf at the start of the Board’s annual contract renewal process earlier in 2012. In approving the Advisory Agreements, the Board did not identify any particular information or consideration that was all-important or controlling, and each Trustee likely attributed different weights to various factors.
Nature, extent and quality of services
The Board received and considered various information regarding the nature, extent and quality of services provided to the Fund by Funds Management and Wells Capital Management under the Advisory Agreements. The Board also received and considered, among other things, information about the background and experience of senior management of Funds Management, and the qualifications, backgrounds, tenures and responsibilities of the portfolio managers primarily responsible for the day-to-day portfolio management of the Fund.
The Board evaluated the ability of Funds Management and Wells Capital Management, based on their respective financial condition, resources, reputation and other attributes, to attract and retain qualified investment professionals, including research, advisory, and supervisory personnel. The Board further considered the compliance programs and compliance records of Funds Management and Wells Capital Management. In addition, the Board took into account the administrative services provided to the Fund by Funds Management and its affiliates.
The Board’s decision to approve the continuation of the Advisory Agreements was based on a comprehensive evaluation of all of the information provided to it. In considering these matters, the Board considered not only the specific information presented in connection with the Meeting, but also the knowledge gained over time through interaction with Funds Management and Wells Capital Management about various topics, including Funds Management’s oversight of service providers. The above factors, together with those referenced below, are some of the most important, but not necessarily all, factors considered by the Board in concluding that the nature, extent and quality of the investment advisory services provided to the Fund by Funds Management and Wells Capital Management supported the re-approval of the Advisory Agreements. Although the Board considered the continuation of the Advisory Agreements for the Fund as part of the larger process of considering the continuation of the advisory agreements for all of the funds in the complex, its decision to continue the Advisory Agreements for the Fund was ultimately made on a fund-by-fund basis.
Fund performance and expenses
The Board considered the performance results for the Fund over various time periods ended December 31, 2011. The Board also considered these results in comparison to the median performance of a universe of relevant funds (the “Universe”) that was determined by Lipper Inc. (“Lipper”) to be similar to the Fund, and in comparison to the Fund’s
| | | | |
| 32 | | Wells Fargo Advantage Opportunity Fund | | Other Information (Unaudited) |
benchmark index and to other comparative data. Lipper is an independent provider of investment company data. The Board received a description of the methodology used by Lipper to select the mutual funds in the Universe. The Board noted that, except for the one-year period, the performance of the Fund was higher than or in range of the median performance of the Universe for all other periods under review. The Board also noted that the performance of the Fund was higher than its benchmark index, the Lipper Multi-Cap Funds Index, for the longer-term periods under review. The Board noted that the Fund’s one-year performance results warranted further discussion. As part of its further review, the Board received an analysis of, and discussed factors contributing to, the recent underperformance of the Fund relative to the Universe. The Board was satisfied that the Fund’s investment performance was being appropriately monitored and that Funds Management and Wells Capital Management were taking appropriate actions with respect to the Fund’s investment performance.
The Board received and considered information regarding the Fund’s contractual advisory fee and net operating expense ratios and their various components, including actual management fees (which reflect fee waivers, if any), transfer agent, custodian and other non-management fees, Rule 12b-1 and non-Rule 12b-1 fees, service fees and fee waiver and expense reimbursement arrangements. The Board also considered these ratios in comparison to the median ratios of an expense Universe and a narrower expense group of mutual funds (each, an “Expense Group”) that was determined by Lipper to be similar to the Fund. The Board received a description of the methodology used by Lipper to select the mutual funds in the Fund’s Expense Group. The Board noted that, except for the Investor class, the net operating expense ratios of the Fund were in range of or lower than the Fund’s Expense Group’s median net operating expense ratios. The Board received a report that provided further analysis of the expense results for the Fund’s Investor class. The Board noted that Funds Management had agreed to lower contractual fee cap arrangements for the Fund with respect to the Investor class and certain other classes to lower the Fund’s net operating expense ratios.
Based on the above-referenced considerations and other factors, the Board concluded that the overall performance and expense structure of the Fund supported the re-approval of the Advisory Agreements for the Fund.
Investment advisory and sub-advisory fee rates
The Board reviewed and considered the contractual investment advisory fee rate that is payable by the Fund to Funds Management for investment advisory services (the “Advisory Agreement Rate”), both on a stand-alone basis and on a combined basis with the Fund’s administration fee rate. The Board took into account the separate administrative and other services covered by the administration fee rate. The Board also reviewed and considered the contractual investment sub-advisory fee rate that is payable by Funds Management to Wells Capital Management for investment sub-advisory services (the “Sub-Advisory Agreement Rate”). In addition, the Board reviewed and considered the existing fee waiver/cap arrangements applicable to the Advisory Agreement Rate and considered the Advisory Agreement Rate after taking the waivers/caps into account (the “Net Advisory Rate”).
The Board received and considered information comparing the Advisory Agreement Rate and Net Advisory Rate with those of other funds in the Fund’s Expense Group median. The Board noted that the Advisory Agreement Rate was higher than the median rates for the Fund’s Expense Group. The Board also noted that, except for Investor and A share classes, the Fund’s Net Advisory Rate was in range of the median rates for the Fund’s Expense Group. The Board received a report from Funds Management that noted that the Fund was benefiting from Advisory Agreement Rate breakpoints, the Fund’s net operating expense caps had been lowered the previous year, net operating expense caps for certain share classes would be further lowered and the expense caps would be extended until January 31, 2014.
The Board also received and considered information about the nature and extent of services offered and fee rates charged by Funds Management and Wells Capital Management to other types of clients. In this regard, the Board received information about differences between the services, and the compliance, reporting, and other legal burdens and risks of providing investment advice to mutual funds and those associated with providing advice to non-mutual fund clients such as collective funds or institutional separate accounts.
The Board determined that the Advisory Agreement Rate for the Fund, both with and without an administration fee rate and before and after waivers, was reasonable in light of the Fund’s Expense Group information, the net expense ratio commitments, the services covered by the Advisory Agreements and other information provided. The Board also reviewed and considered the Sub-Advisory Agreement Rate and concluded that the Sub-Advisory Agreement Rate was reasonable in light of the services covered by the sub-advisory agreement, the sub-advised expense information provided by Lipper, and other information provided.
| | | | | | |
| Other Information (Unaudited) | | Wells Fargo Advantage Opportunity Fund | | | 33 | |
Profitability
The Board received and considered a profitability analysis of Funds Management, as well as an analysis of the profitability to the collective Wells Fargo businesses that provide services to the Fund. It considered that the information provided to it was necessarily estimated, and that the profitability information provided to it, especially on a fund-by-fund basis, did not necessarily provide a precise tool for evaluating the appropriateness of the Fund’s Advisory Agreement Rate in isolation. It noted that the levels of profitability reported on a fund-by-fund basis varied widely, depending on, among other things, the size and type of fund. The Board concluded that the profitability reported by Funds Management was not unreasonable.
The Board did not consider separate profitability information with respect to Wells Capital Management, because, as an affiliate of Funds Management, its profitability information was subsumed in the collective Wells Fargo profitability analysis provided by Funds Management.
Economies of scale
With respect to possible economies of scale, the Board reviewed the breakpoints in the Fund’s advisory fee structure, which operate generally to reduce the effective Advisory Agreement Rate of the Fund (as a percentage of Fund assets) as the Fund grows in size. It considered that, as a fund shrinks in size, breakpoints conversely result in increasing fee levels. The Board noted that it would have on-going opportunities to review the appropriate levels of breakpoints in the future, and concluded that the breakpoints as implemented appeared to be a reasonable step toward sharing economies of scale, if any, with the Fund. However, the Board acknowledged the inherent limitations of any analysis of an investment adviser’s economies of scale and of any attempt to correlate breakpoints with such economies, stemming largely from the Board’s understanding that economies of scale are realized, if at all, by an investment adviser across a variety of products and services, not just with respect to a single fund.
Other benefits to Funds Management and Wells Capital Management
The Board received and considered information regarding potential “fall-out” or ancillary benefits received by Funds Management and its affiliates, including Wells Capital Management, as a result of their relationship with the Fund. Ancillary benefits could include, among others, benefits directly attributable to the relationship of Funds Management and Wells Capital Management with the Fund and benefits potentially derived from an increase in Funds Management’s and Wells Capital Management’s business as a result of their relationship with the Fund (such as the ability to market to shareholders other financial products offered by Funds Management and its affiliates, including Wells Capital Management).
The Board considered that Wells Fargo Funds Distributor, LLC, an affiliate of Funds Management, serves as distributor to the Fund and receives certain compensation for those services. The Board noted that various financial institutions, including affiliates of Funds Management, may receive distribution-related fees, shareholder servicing payments (including amounts derived from payments under Rule 12b-1 plans) and sub-transfer agency fees in respect of shares sold or held through them and services provided.
The Board also reviewed information about whether and to what extent soft dollar credits are sought and how any such credits are utilized and any benefits that may be realized by using an affiliated broker.
Other factors and broader review
The Board also considered the markets for distribution of the Fund’s shares, including the channels through which the Fund’s shares are offered and sold. The Board noted that the Fund is part of one of the few fund families that have both direct-to-fund and intermediary distribution channels. As discussed above, the Board reviews detailed materials received from Funds Management and Wells Capital Management annually as part of the re-approval process under Section 15 of the 1940 Act and also reviews and assesses information about the quality of the services that the Fund receives throughout the year. In this regard, the Board has reviewed reports of Funds Management at each of its quarterly meetings, which include, among other things, portfolio reviews and performance reports. In addition, the Board confers with portfolio managers at various times throughout the year.
Conclusion
After considering the above-described factors and based on its deliberations and its evaluation of the information described above, the Board unanimously approved the continuation of the Advisory Agreements for an additional one-year period.
| | | | |
| 34 | | Wells Fargo Advantage Opportunity Fund | | List of Abbreviations |
The following is a list of common abbreviations for terms and entities which may have appeared in this report.
| ACB | — Agricultural Credit Bank |
| ADR | — American Depository Receipt |
| ADS | — American Depository Shares |
| AGC-ICC | — Assured Guaranty Corporation - Insured Custody Certificates |
| AGM | — Assured Guaranty Municipal |
| AMBAC | — American Municipal Bond Assurance Corporation |
| AMT | — Alternative Minimum Tax |
| BAN | — Bond Anticipation Notes |
| BHAC | — Berkshire Hathaway Assurance Corporation |
| CAB | — Capital Appreciation Bond |
| CCAB | — Convertible Capital Appreciation Bond |
| CDA | — Community Development Authority |
| CDO | — Collateralized Debt Obligation |
| COP | — Certificate of Participation |
| DRIVER | — Derivative Inverse Tax-Exempt Receipts |
| DW&P | — Department of Water & Power |
| DWR | — Department of Water Resources |
| ECFA | — Educational & Cultural Facilities Authority |
| EDA | — Economic Development Authority |
| EDFA | — Economic Development Finance Authority |
| ETF | — Exchange-Traded Fund |
| FFCB | — Federal Farm Credit Bank |
| FGIC | — Financial Guaranty Insurance Corporation |
| FHA | — Federal Housing Authority |
| FHLB | — Federal Home Loan Bank |
| FHLMC | — Federal Home Loan Mortgage Corporation |
| FICO | — The Financing Corporation |
| FNMA | — Federal National Mortgage Association |
| GDR | — Global Depository Receipt |
| GNMA | — Government National Mortgage Association |
| HCFR | — Healthcare Facilities Revenue |
| HEFA | — Health & Educational Facilities Authority |
| HEFAR | — Higher Education Facilities Authority Revenue |
| HFA | — Housing Finance Authority |
| HFFA | — Health Facilities Financing Authority |
| IBC | — Insured Bond Certificate |
| IDA | — Industrial Development Authority |
| IDAG | — Industrial Development Agency |
| IDR | — Industrial Development Revenue |
| KRW | — Republic of Korea Won |
| LIBOR | — London Interbank Offered Rate |
| LLC | — Limited Liability Company |
| LLP | — Limited Liability Partnership |
| MBIA | — Municipal Bond Insurance Association |
| MFHR | — Multi-Family Housing Revenue |
| MSTR | — Municipal Securities Trust Receipts |
| MUD | — Municipal Utility District |
| NATL-RE | — National Public Finance Guarantee Corporation |
| PCFA | — Pollution Control Finance Authority |
| PCR | — Pollution Control Revenue |
| PFA | — Public Finance Authority |
| PFFA | — Public Facilities Financing Authority |
| PFOTER | — Puttable Floating Option Tax-Exempt Receipts |
| plc | — Public Limited Company |
| PUTTER | — Puttable Tax-Exempt Receipts |
| R&D | — Research & Development |
| RDA | — Redevelopment Authority |
| RDFA | — Redevelopment Finance Authority |
| REIT | — Real Estate Investment Trust |
| ROC | — Reset Option Certificates |
| SAVRS | — Select Auction Variable Rate Securities |
| SBA | — Small Business Authority |
| SFHR | — Single Family Housing Revenue |
| SFMR | — Single Family Mortgage Revenue |
| SPDR | — Standard & Poor’s Depositary Receipts |
| STRIPS | — Separate Trading of Registered Interest and Principal Securities |
| TAN | — Tax Anticipation Notes |
| TIPS | — Treasury Inflation-Protected Securities |
| TRAN | — Tax Revenue Anticipation Notes |
| TCR | — Transferable Custody Receipts |
| TTFA | — Transportation Trust Fund Authority |
| TVA | — Tennessee Valley Authority |
| XLCA | — XL Capital Assurance |


FOR MORE INFORMATION
More information about Wells Fargo Advantage Funds is available free upon request. To obtain literature, please write, e-mail, visit the Fund’s Web site, or call:
Wells Fargo Advantage Funds
P.O. Box 8266
Boston, MA 02266-8266
E-mail: wfaf@wellsfargo.com
Web site: wellsfargoadvantagefunds.com
Individual investors: 1-800-222-8222
Retail investment professionals: 1-888-877-9275
Institutional investment professionals: 1-866-765-0778
This report and the financial statements contained herein are submitted for the general information of the shareholders of Wells Fargo Advantage Funds. If this report is used for promotional purposes, distribution of the report must be accompanied or preceded by a current prospectus. For a prospectus containing more complete information, including charges and expenses, call 1-800-222-8222 or visit the Fund’s Web site at wellsfargoadvantagefunds.com. Please consider the investment objectives, risks, charges, and expenses of the investment carefully before investing. This and other information about Wells Fargo Advantage Funds can be found in the current prospectus. Read the prospectus carefully before you invest or send money.
Wells Fargo Funds Management, LLC, a wholly owned subsidiary of Wells Fargo & Company, provides investment advisory and administrative services for Wells Fargo Advantage Funds. Other affiliates of Wells Fargo & Company provide subadvisory and other services for the Funds. The Funds are distributed by Wells Fargo Funds Distributor, LLC, Member FINRA/SIPC, an affiliate of Wells Fargo & Company.
NOT FDIC INSURED ¡ NO BANK GUARANTEE ¡ MAY LOSE VALUE
© 2012 Wells Fargo Funds Management, LLC. All rights reserved.
| | |
 | | 208991 05-12 SA232/SAR232 3-12 |

Wells Fargo Advantage
Small/Mid Cap Core Fund

Semi-Annual Report
March 31, 2012

Reduce clutter. Save trees.
Sign up for electronic delivery of prospectuses and shareholder reports at wellsfargo.com/advantagedelivery
Contents
The views expressed and any forward-looking statements are as of March 31, 2012, unless otherwise noted, and are those of the Fund managers and/or Wells Fargo Funds Management, LLC. Discussions of individual securities, or the markets generally, or any Wells Fargo Advantage Fund are not intended as individual recommendations. Future events or results may vary significantly from those expressed in any forward-looking statements; the views expressed are subject to change at any time in response to changing circumstances in the market. Wells Fargo Funds Management, LLC, disclaims any obligation to publicly update or revise any views expressed or forward-looking statements.
NOT FDIC INSURED ¡ NO BANK GUARANTEE ¡ MAY LOSE VALUE

WELLS FARGO INVESTMENT HISTORY
| | |
| |
| 1932 | | Keystone creates one of the first mutual fund families. |
| |
| 1971 | | Wells Fargo & Company introduces one of the first institutional index funds. |
| |
| 1978 | | Wells Fargo applies Markowitz and Sharpe’s research on Modern Portfolio Theory to introduce one of the industry’s first Tactical Asset Allocation (TAA) models in institutional separately managed accounts. |
| |
| 1984 | | Wells Fargo Stagecoach Funds launches its first asset allocation fund. |
| |
| 1989 | | The Tactical Asset Allocation (TAA) Model is first applied to Wells Fargo’s asset allocation mutual funds. |
| |
| 1994 | | Wells Fargo introduces the LifePath Funds, one of the first suites of target date funds (now the Wells Fargo Advantage Dow Jones Target Date FundsSM). |
| |
| 1996 | | Evergreen Investments and Keystone Funds merge. |
| |
| 1997 | | Wells Fargo launches Wells Fargo Advantage WealthBuilder PortfoliosSM, a fund-of-funds suite of products that includes the use of quantitative models to shift assets among investment styles. |
| |
| 1999 | | Norwest Advantage Funds and Stagecoach Funds are reorganized into Wells Fargo Funds after the merger of Norwest and Wells Fargo. |
| |
| 2002 | | Evergreen Retail and Evergreen Institutional companies form the umbrella asset management company, Evergreen Investments. |
| |
| 2005 | | The integration of Strong Funds with Wells Fargo Funds creates Wells Fargo Advantage Funds, resulting in one of the top 20 mutual fund companies in the United States. |
| |
| 2006 | | Wells Fargo Advantage Funds relaunches the target date product line as Wells Fargo Advantage Dow Jones Target Date Funds. |
| |
| 2010 | | The mergers and reorganizations of Evergreen and Wells Fargo Advantage mutual funds are completed, unifying the families under the brand of Wells Fargo Advantage Funds. |
Wells Fargo Advantage Funds®
Wells Fargo Advantage Funds skillfully guides institutions, financial advisors, and individuals through the investment terrain to help them reach their financial objectives. Everything we do on behalf of investors is backed by our unique combination of qualifications.
Strength
Our organization is built on the standards of integrity and service established by our parent company—Wells Fargo & Company—more than 150 years ago. And, because we’re part of a highly diversified financial enterprise, we offer the depth of resources to help investors succeed.
Expertise
Our multi-boutique model offers investors access to the independent thinking of premier investment managers that have been chosen for their time-tested strategies. While each team specializes in a specific investment strategy, collectively they provide investors a wide choice of distinct investment styles. Our dedication to investment excellence doesn’t end with our expertise in manager selection—risk management, analysis, and rigorous ongoing review seek to ensure each manager’s investment process remains consistent.
Partnership
Our collaborative approach is built around understanding the needs and goals of our clients. By adhering to core principles of sound judgment and steady guidance, we support you through every stage of the investment decision process.
Carefully consider a fund’s investment objectives, risks, charges, and expenses before investing. For a current prospectus and, if available, a summary prospectus, containing this and other information, visit wellsfargoadvantagefunds.com. Read it carefully before investing.
Wells Fargo Funds Management, LLC, a wholly owned subsidiary of Wells Fargo & Company, provides investment advisory and administrative services for Wells Fargo Advantage Funds®. Other affiliates of Wells Fargo & Company provide subadvisory and other services for the Funds. The Funds are distributed by Wells Fargo Funds Distributor, LLC, Member FINRA/SIPC, an affiliate of Wells Fargo & Company.
“Dow Jones®” and “Dow Jones Target Date IndexesSM” are service marks of Dow Jones Trademark Holdings, LLC (“Dow Jones”), have been licensed to CME Group Index Services LLC (“CME Indexes”) and have been sublicensed for use for certain purposes by Global Index Advisors, Inc, and Wells Fargo Funds Management, LLC. The Wells Fargo Advantage Dow Jones Target Date FundsSM based on the Dow Jones Target Date IndexesSM, are not sponsored, endorsed, sold or promoted by Dow Jones, CME Indexes or their respective affiliates and none of them makes any representation regarding the advisability of investing in such product(s).
NOT FDIC INSURED ¡ NO BANK GUARANTEE ¡ MAY LOSE VALUE
Not part of the semi-annual report.
Wells Fargo Advantage Funds offers more than 110 mutual funds across a wide range of asset classes, representing over $213 billion in assets under management, as of March 31, 2012.
| | | | |
| Equity Funds | | | | |
Asia Pacific Fund | | Equity Value Fund | | Precious Metals Fund |
C&B Large Cap Value Fund | | Global Opportunities Fund | | Premier Large Company Growth Fund |
C&B Mid Cap Value Fund | | Growth Fund | | Small Cap Opportunities Fund |
Capital Growth Fund | | Index Fund | | Small Cap Value Fund |
Common Stock Fund | | International Equity Fund | | Small Company Growth Fund |
Disciplined U.S. Core Fund | | International Value Fund | | Small Company Value Fund |
Discovery Fund† | | Intrinsic Small Cap Value Fund | | Small/Mid Cap Core Fund |
Diversified Equity Fund | | Intrinsic Value Fund | | Small/Mid Cap Value Fund |
Diversified International Fund | | Intrinsic World Equity Fund | | Special Mid Cap Value Fund |
Diversified Small Cap Fund | | Large Cap Core Fund | | Special Small Cap Value Fund |
Emerging Growth Fund | | Large Cap Growth Fund | | Specialized Technology Fund |
Emerging Markets Equity Fund | | Large Company Value Fund | | Strategic Large Cap Growth Fund |
Endeavor Select Fund† | | Omega Growth Fund | | Traditional Small Cap Growth Fund |
Enterprise Fund† | | Opportunity Fund† | | Utility and Telecommunications Fund |
| Bond Funds | | | | |
Adjustable Rate Government Fund | | Inflation-Protected Bond Fund | | Short-Term Bond Fund |
California Limited-Term Tax-Free Fund | | Intermediate Tax/AMT-Free Fund | | Short-Term High Yield Bond Fund |
California Tax-Free Fund | | International Bond Fund | | Short-Term Municipal Bond Fund |
Colorado Tax-Free Fund | | Minnesota Tax-Free Fund | | Strategic Municipal Bond Fund |
Government Securities Fund | | Municipal Bond Fund | | Total Return Bond Fund |
High Income Fund | | North Carolina Tax-Free Fund | | Ultra Short-Term Income Fund |
High Yield Bond Fund | | Pennsylvania Tax-Free Fund | | Ultra Short-Term Municipal Income Fund |
Income Plus Fund | | Short Duration Government Bond Fund | | Wisconsin Tax-Free Fund |
| Asset Allocation Funds | | | | |
Absolute Return Fund | | WealthBuilder Equity Portfolio† | | Target 2020 Fund† |
Asset Allocation Fund | | WealthBuilder Growth Allocation Portfolio† | | Target 2025 Fund† |
Conservative Allocation Fund | | WealthBuilder Growth Balanced Portfolio† | | Target 2030 Fund† |
Diversified Capital Builder Fund | | WealthBuilder Moderate Balanced Portfolio† | | Target 2035 Fund† |
Diversified Income Builder Fund | | WealthBuilder Tactical Equity Portfolio† | | Target 2040 Fund† |
Growth Balanced Fund | | Target Today Fund† | | Target 2045 Fund† |
Index Asset Allocation Fund | | Target 2010 Fund† | | Target 2050 Fund† |
Moderate Balanced Fund | | Target 2015 Fund† | | Target 2055 Fund† |
WealthBuilder Conservative Allocation Portfolio† | | | | |
| Money Market Funds | | | | |
100% Treasury Money Market Fund | | Heritage Money Market Fund† | | National Tax-Free Money Market Fund |
California Municipal Money Market Fund | | Money Market Fund | | Prime Investment Money Market Fund |
Cash Investment Money Market Fund | | Municipal Cash Management Money Market Fund | | Treasury Plus Money Market Fund |
Government Money Market Fund | | Municipal Money Market Fund | | |
| Variable Trust Funds1 | | | | |
VT Discovery Fund† | | VT Intrinsic Value Fund | | VT Small Cap Growth Fund |
VT Index Asset Allocation Fund | | VT Omega Growth Fund | | VT Small Cap Value Fund |
VT International Equity Fund | | VT Opportunity Fund† | | VT Total Return Bond Fund |
An investment in a money market fund is not insured or guaranteed by the Federal Deposit Insurance Corporation or any other government agency. Although the Wells Fargo Advantage Money Market Funds seek to preserve the value of your investment at $1.00 per share, it is possible to lose money by investing in a money market fund.
| 1. | The Variable Trust Funds are generally available only through insurance company variable contracts. |
| † | In this report, the Wells Fargo Advantage Discovery FundSM, Wells Fargo Advantage Endeavor Select FundSM, Wells Fargo Advantage Enterprise FundSM, Wells Fargo Advantage Opportunity FundSM, Wells Fargo Advantage WealthBuilder Conservative Allocation PortfolioSM, Wells Fargo Advantage WealthBuilder Equity PortfolioSM, Wells Fargo Advantage WealthBuilder Growth Allocation PortfolioSM, Wells Fargo Advantage WealthBuilder Growth Balanced PortfolioSM, Wells Fargo Advantage WealthBuilder Moderate Balanced PortfolioSM, Wells Fargo Advantage WealthBuilder Tactical Equity PortfolioSM, Wells Fargo Advantage Dow Jones Target Today FundSM, Wells Fargo Advantage Dow Jones Target 2010 FundSM, Wells Fargo Advantage Dow Jones Target 2015 FundSM, Wells Fargo Advantage Dow Jones Target 2020 FundSM, Wells Fargo Advantage Dow Jones Target 2025 FundSM, Wells Fargo Advantage Dow Jones Target 2030 FundSM, Wells Fargo Advantage Dow Jones Target 2035 FundSM, Wells Fargo Advantage Dow Jones Target 2040 FundSM, Wells Fargo Advantage Dow Jones Target 2045 FundSM, Wells Fargo Advantage Dow Jones Target 2050 FundSM, Wells Fargo Advantage Dow Jones Target 2055 FundSM, Wells Fargo Advantage Heritage Money Market FundSM, Wells Fargo Advantage VT Discovery FundSM, and Wells Fargo Advantage VT Opportunity FundSM are referred to as the Discovery Fund, Endeavor Select Fund, Enterprise Fund, Opportunity Fund, WealthBuilder Conservative Allocation Portfolio, WealthBuilder Equity Portfolio, WealthBuilder Growth Allocation Portfolio, WealthBuilder Growth Balanced Portfolio, WealthBuilder Moderate Balanced Portfolio, WealthBuilder Tactical Equity Portfolio, Target Today Fund, Target 2010 Fund, Target 2015 Fund, Target 2020 Fund, Target 2025 Fund, Target 2030 Fund, Target 2035 Fund, Target 2040 Fund, Target 2045 Fund, Target 2050 Fund, Target 2055 Fund, Heritage Money Market Fund, VT Discovery Fund, and VT Opportunity Fund, respectively. |
Not part of the semi-annual report.
| | | | |
| 2 | | Wells Fargo Advantage Small/Mid Cap Core Fund | | Letter to Shareholders |

Karla M. Rabusch,
President
Wells Fargo Advantage Funds
The period was marked by increased confidence that the U.S. economy was staging a fragile recovery, offset by continued concerns about the possible effect on the global economy of the ongoing European sovereign debt crisis—which began in Greece and later spread to the larger economies of Italy and Spain.
In contrast to worrisome data from the eurozone, U.S. economic data remained moderately positive.
Dear Valued Shareholder:
We’re pleased to offer you this semi-annual report for the Wells Fargo Advantage Small/Mid Cap Core Fund for the six-month period that ended March 31, 2012. The period was marked by increased confidence that the U.S. economy was staging a fragile recovery, offset by continued concerns about the possible effect on the global economy of the ongoing European sovereign debt crisis—which began in Greece and later spread to the larger economies of Italy and Spain. U.S. stock indexes posted solid gains for the period.
Macroeconomic optimism faded as global growth slowed and worries rose.
Prior to the reporting period, investors worried that the global economy was returning to a recession. Although second quarter U.S. gross domestic product (GDP) grew at a 1.3% annual rate, it was below the levels set in 2010 and seemed to confirm that the economy had slowed from its previous pace. Moreover, the drawn-out political debate over the raising of the U.S. debt ceiling reduced confidence that the national government would be able to work together to address the country’s problems. Partly as a result, Standard & Poor’s rating service downgraded U.S. long-term debt from AAA to AA+1 in August 2011.
Throughout the six-month period, concerns about the eurozone sovereign debt situation returned to center stage. Investors became increasingly concerned that Greece would default on its debt, a scenario that only seemed more likely as eurozone leaders began to openly discuss a “voluntary” haircut on Greek debt for private investors. Because many eurozone banks owned Greek debt and many U.S. banks had financial ties to eurozone banks, investors worried about the effect of such an event on the financial systems and the global economy. In October 2011, market participants turned their attention to the debt burdens of Italy—which also had its credit rating downgraded by Standard & Poor’s—because even though it had a relatively modest budget deficit, it had a high amount of outstanding debt and a stagnant economy. French banks were heavily exposed to Italian debt, so Italy’s woes led to fears of a state bailout of French banks and a resulting increase in France’s required expenditures.
After months of rumors and worries, the Greek credit crisis was finally addressed in March 2012 when the country came to an agreement with its creditors allowing it to write down the principal on most of its bonds in exchange for increased financial austerity. By the end of the reporting period, the Greek agreement, combined with unprecedented support for eurozone banks by the European Central Bank (ECB), seemed to calm investor concerns, at least temporarily.
The U.S. economy reported relatively solid news.
In contrast to worrisome data from the eurozone, U.S. economic data remained moderately positive. After disappointing reports for first and second quarter GDP growth, reported GDP came in at a 1.8% annualized rate in the third quarter of 2011, and then accelerated to a 3.0% annualized rate in the fourth quarter. The major banks appeared to have taken steps toward repairing their balance sheets; in March, the Federal Reserve (Fed) announced that 15 of the 19 major banks had passed a “stress test,” in which the Fed attempted to gauge whether the banks could survive a severe recession that included a 50% drop in the stock market and a 21% percent decline in housing prices.
| 1. | The ratings indicated are from Standard & Poor’s. Standard & Poor’s rates the creditworthiness of bonds, ranging from AAA (highest) to D (lowest). Ratings from A to CCC may be modified by the addition of a plus (+) or minus (-) sign to show relative standing within the rating categories. |
| | | | | | |
| Letter to Shareholders | | Wells Fargo Advantage Small/Mid Cap Core Fund | | | 3 | |
Bank stocks rebounded strongly after the Fed released details of the stress test, but all major market sectors rallied as investors became increasingly confident that the U.S. would not return to recession. Small-cap stocks modestly outperformed large-cap stocks, and growth stocks outperformed value stocks by an even smaller margin.
Central banks continued to provide stimulus.
Throughout the reporting period, the Federal Open Market Committee (FOMC) kept its key interest rates effectively at zero in order to support the economy and financial system. In the second quarter of 2011, the Fed completed its second round of monetary stimulus, in which it had planned to purchase $600 billion in long-term U.S. Treasuries as well as reinvest an additional $250 billion to $300 billion in Treasuries with the proceeds from earlier investments. Even though the Fed seemed to rule out further monetary stimulus, it remained accommodative. In early August 2011, in response to extreme market volatility and signs of a weakening economy, the Fed announced its intention to keep interest rates low until at least late 2014.
At the beginning of the period, the ECB had a key rate of 1.50%, which it had raised in early 2011 in an attempt to keep inflation in check. However, in response to weakness in the southern European economies, the ECB lowered its key rate to 1.25% in November and to 1.0% in December. In August, after a sell-off in the sovereign debts of Spain and Italy, the ECB announced plans to purchase the debt of those countries in exchange for increased deficit reduction. The ECB also continued to provide virtually unlimited liquidity for banks, announcing a long-term refinancing operation (LTRO) in December through which it provided low cost, three-year loans to lenders.
We use time-tested investment strategies, even as many variables are at work in the market.
The full effect of the credit crisis remains unknown. Elevated unemployment and debt defaults continue to pressure consumers and businesses alike.
In our experience strict adherence to time-tested investment strategies has its rewards. As a whole, Wells Fargo Advantage Funds represents investments across a range of asset classes and investment styles, giving you an opportunity to create a diversified investment portfolio. While diversification may not prevent losses in a downturn, we believe it helps in managing risk.
Thank you for choosing to invest with Wells Fargo Advantage Funds. We appreciate your confidence in us and remain committed to helping you meet your financial needs. For current information about your fund investments, contact your investment professional, visit our Web site at wellsfargoadvantagefunds.com, or call us directly at 1-800-222-8222. We are available 24 hours a day, 7 days a week.
Sincerely,

Karla M. Rabusch
President
Wells Fargo Advantage Funds
| | | | |
| 4 | | Wells Fargo Advantage Small/Mid Cap Core Fund | | Letter to Shareholders |
Notice to Shareholders
The Board of Trustees for Wells Fargo Advantage Funds has unanimously approved the following modifications to certain net asset value (NAV) waiver privileges and commission schedules:
| | n | | Effective May 1, 2012, automatic investment plan (AIP) purchases and proceeds received from systematic withdrawals will no longer qualify for NAV repurchase privileges. | |
| | n | | Effective May 1, 2012, discretionary rights to waive the upfront commission for Class C and “jumbo” Class A share purchases will no longer be granted to broker/dealers. However, we will continue to waive the Class C shares contingent deferred sales charge for redemptions by employer-sponsored retirement plans where the dealer of record waived its commission at the time of purchase. | |
| | n | | Effective July 31, 2012, NAV purchase privileges for former Evergreen Class IS and Class R shareholders are being modified to remove the ability to purchase Class A shares at NAV unless those shares are held directly with the Fund on or after July 31, 2012. | |
Please contact your investment professional or call us directly at 1-800-222-8222 if you have any questions on this Notice to Shareholders.
| | | | | | |
| Performance Highlights (Unaudited) | | Wells Fargo Advantage Small/Mid Cap Core Fund | | | 5 | |
INVESTMENT OBJECTIVE
The Fund seeks long-term capital appreciation.
ADVISER
Wells Fargo Funds Management, LLC
SUB-ADVISER
Golden Capital Management, LLC
PORTFOLIO MANAGER
John R. Campbell, CFA
FUND INCEPTION
December 17, 2007
| | | | |
TEN LARGEST EQUITY HOLDINGS1
(AS OF MARCH 31, 2012) | | | |
FMC Corporation | | | 2.73% | |
TIBCO Software Incorporated | | | 2.53% | |
Family Dollar Stores Incorporated | | | 2.52% | |
Domino’s Pizza Incorporated | | | 2.51% | |
IAC InterActive Corporation | | | 2.50% | |
Financial Engines Incorporated | | | 2.42% | |
Skullcandy Incorporated | | | 2.38% | |
Constant Contact Incorporated | | | 2.34% | |
American Financial Group Incorporated | | | 2.34% | |
Helmerich & Payne Incorporated | | | 2.30% | |
| | |
SECTOR DISTRIBUTION2
(AS OF MARCH 31, 2012) |
|
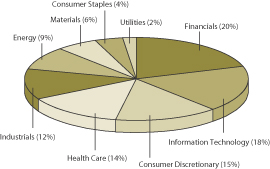 |
| 1. | The ten largest equity holdings are calculated based on the value of the securities divided by total net assets of the Fund. Holdings are subject to change and may have changed since the date specified. |
| 2. | Sector distribution is subject to change and is calculated based on the total long-term investments of the Fund. |
| | | | |
| 6 | | Wells Fargo Advantage Small/Mid Cap Core Fund | | Performance Highlights (Unaudited) |
AVERAGE ANNUAL TOTAL RETURN3 (%) (AS OF MARCH 31, 2012)
| | | | | | | | | | | | | | | | | | | | | | | | | | | | | | | | | | | | |
| | | | | | Including Sales Charge | | | Excluding Sales Charge | | | Expense Ratios4 | |
| | | Inception Date | | | 6 Months* | | | 1 Year | | | Life of Fund | | | 6 Months* | | | 1 Year | | | Life of Fund | | | Gross | | | Net5 | |
Class A (ECOAX) | | | 12/17/2007 | | | | 15.26 | | | | (11.29 | ) | | | (2.32 | ) | | | 22.32 | | | | (5.89 | ) | | | (0.96 | ) | | | 1.71% | | | | 1.40% | |
Class C (ECOCX) | | | 12/17/2007 | | | | 20.73 | | | | (7.81 | ) | | | (1.68 | ) | | | 21.73 | | | | (6.81 | ) | | | (1.68 | ) | | | 2.46% | | | | 2.15% | |
Administrator Class (ECOIX) | | | 12/17/2007 | | | | | | | | | | | | | | | | 22.50 | | | | (5.74 | ) | | | (0.72 | ) | | | 1.55% | | | | 1.15% | |
Institutional Class (ECONX) | | | 07/30/2010 | | | | | | | | | | | | | | | | 22.45 | | | | (5.64 | ) | | | (0.66 | ) | | | 1.28% | | | | 0.95% | |
Russell 2500TM Index6 | | | | | | | | | | | | | | | | | | | 29.39 | | | | 1.33 | | | | 4.72 | | | | | | | | | |
| * | Returns for periods of less than one year are not annualized. |
Figures quoted represent past performance, which is no guarantee of future results and do not reflect the deduction of taxes that a shareholder may pay on fund distributions or the redemption of fund shares. Investment return and principal value of an investment will fluctuate so that an investor’s shares, when redeemed, may be worth more or less than their original cost. Performance shown without sales charges would be lower if sales charges were reflected. Current performance may be lower or higher than the performance data quoted and assumes the reinvestment of dividends and capital gains. Current month-end performance is available on the Fund’s Web site – wellsfargoadvantagefunds.com
Index returns do not include transaction costs associated with buying and selling securities, any mutual fund fees or expenses or any taxes. It is not possible to invest directly in an index.
For Class A shares, the maximum front-end sales charge is 5.75%. For Class C shares, the maximum contingent deferred sales charge is 1.00%. Performance including sales charge assumes the sales charge for the corresponding time period. Administrator Class and Institutional Class shares are sold without a front-end sales charge or contingent deferred sales charge.
Stock fund values fluctuate in response to the activities of individual companies and general market and economic conditions. Smaller-company stocks tend to be more volatile and less liquid than those of larger companies. Certain investment strategies tend to increase the total risk of an investment (relative to the broader market). Consult the Fund’s prospectus for additional information on these and other risks.
| 3. | Historical performance shown for the Institutional Class shares prior to their inception reflects the performance of the Administrator Class shares, and includes the higher expenses applicable to the Administrator Class shares. If these expenses had not been included, returns would be higher. Historical performance shown for all classes of the Fund prior to July 19, 2010 is based on the performance of the Fund’s predecessor, Evergreen Golden Core Opportunities Fund. |
| 4. | Reflects the expense ratios as stated in the most recent prospectuses. |
| 5. | The Adviser has committed through July 18, 2013 to waive fees and/or reimburse expenses to the extent necessary to cap the Fund’s Total Annual Fund Operating Expenses After Fee Waiver, excluding certain expenses, at the amounts shown above. Without this cap, the Fund’s returns would have been lower. |
| 6. | The Russell 2500TM Index measures the performance of the 2,500 smallest companies in the Russell 3000® Index, which represents approximately 16% of the total market capitalization of the Russell 3000 Index. You cannot invest directly in an index. |
| | | | | | |
| Fund Expenses (Unaudited) | | Wells Fargo Advantage Small/Mid Cap Core Fund | | | 7 | |
As a shareholder of the Fund, you incur two types of costs: (1) transaction costs, including sales charges (loads) on purchase payments and contingent deferred sales charges (if any) on redemptions and (2) ongoing costs, including management fees; distribution (12b-1) and/or shareholder service fees; and other Fund expenses. This example is intended to help you understand your ongoing costs (in dollars) of investing in the Fund and to compare these costs with the ongoing costs of investing in other mutual funds.
The example is based on an investment of $1,000 invested at the beginning of the six-month period and held for the entire period from October 1, 2011 to March 31, 2012.
Actual Expenses
The “Actual” line of the table below provides information about actual account values and actual expenses. You may use the information in this line, together with the amount you invested, to estimate the expenses that you paid over the period. Simply divide your account value by $1,000 (for example, an $8,600 account value divided by $1,000 = 8.6), then multiply the result by the number in the “Actual” line under the heading entitled “Expenses Paid During Period” for your applicable class of shares to estimate the expenses you paid on your account during this period.
Hypothetical Example for Comparison Purposes
The “Hypothetical” line of the table below provides information about hypothetical account values and hypothetical expenses based on the Fund’s actual expense ratio and an assumed rate of return of 5% per year before expenses, which is not the Fund’s actual return. The hypothetical account values and expenses may not be used to estimate the actual ending account balance or expenses you paid for the period. You may use this information to compare the ongoing costs of investing in the Fund and other funds. To do so, compare this 5% hypothetical example with the 5% hypothetical examples that appear in the shareholder reports of the other funds.
Please note that the expenses shown in the table are meant to highlight your ongoing costs only and do not reflect any transactional costs, such as sales charges (loads) and contingent deferred sales charges. Therefore, the “Hypothetical” line of the table is useful in comparing ongoing costs only, and will not help you determine the relative total costs of owning different funds. In addition, if these transactional costs were included, your costs would have been higher.
| | | | | | | | | | | | | | | | |
| | | Beginning
Account Value
10-01-2011 | | | Ending
Account Value
03-31-2012 | | | Expenses
Paid During
the Period1 | | | Net Annual
Expense Ratio | |
Class A | | | | | | | | | | | | | | | | |
Actual | | $ | 1,000.00 | | | $ | 1,223.21 | | | $ | 7.78 | | | | 1.40 | % |
Hypothetical (5% return before expenses) | | $ | 1,000.00 | | | $ | 1,018.00 | | | $ | 7.06 | | | | 1.40 | % |
Class C | | | | | | | | | | | | | | | | |
Actual | | $ | 1,000.00 | | | $ | 1,217.28 | | | $ | 11.92 | | | | 2.15 | % |
Hypothetical (5% return before expenses) | | $ | 1,000.00 | | | $ | 1,014.25 | | | $ | 10.83 | | | | 2.15 | % |
Administrator Class | | | | | | | | | | | | | | | | |
Actual | | $ | 1,000.00 | | | $ | 1,225.03 | | | $ | 6.40 | | | | 1.15 | % |
Hypothetical (5% return before expenses) | | $ | 1,000.00 | | | $ | 1,019.25 | | | $ | 5.81 | | | | 1.15 | % |
Institutional Class | | | | | | | | | | | | | | | | |
Actual | | $ | 1,000.00 | | | $ | 1,224.46 | | | $ | 5.28 | | | | 0.95 | % |
Hypothetical (5% return before expenses) | | $ | 1,000.00 | | | $ | 1,020.25 | | | $ | 4.80 | | | | 0.95 | % |
| 1. | Expenses paid is equal to the annualized expense ratio of each class multiplied by the average account value over the period, multiplied by the number of days in the most recent fiscal half-year divided by the number of days in the fiscal year (to reflect the one-half year period). |
| | | | |
| 8 | | Wells Fargo Advantage Small/Mid Cap Core Fund | | Portfolio of Investments—March 31, 2012 (Unaudited) |
| | | | | | | | | | | | |
| Security Name | | | | | | Shares | | | Value | |
| | | | | | | | | | | | |
| | | | |
Common Stocks: 101.97% | | | | | | | | | | | | |
| | | | |
Consumer Discretionary: 15.33% | | | | | | | | | | | | |
| | | | |
| Hotels, Restaurants & Leisure: 2.51% | | | | | | | | | | | | |
Domino’s Pizza Incorporated « | | | | | | | 18,241 | | | $ | 662,148 | |
| | | | | | | | | | | | |
| | | | |
| Household Durables: 2.38% | | | | | | | | | | | | |
Skullcandy Incorporated †« | | | | | | | 39,620 | | | | 627,185 | |
| | | | | | | | | | | | |
| | | | |
| Media: 2.04% | | | | | | | | | | | | |
Gannett Company Incorporated | | | | | | | 35,060 | | | | 537,470 | |
| | | | | | | | | | | | |
| | | | |
| Multiline Retail: 4.42% | | | | | | | | | | | | |
Big Lots Incorporated † | | | | | | | 11,668 | | | | 501,956 | |
Family Dollar Stores Incorporated | | | | | | | 10,526 | | | | 666,085 | |
| | | | |
| | | | | | | | | | | 1,168,041 | |
| | | | | | | | | | | | |
| | | | |
| Specialty Retail: 2.06% | | | | | | | | | | | | |
Sotheby’s Holdings Incorporated « | | | | | | | 13,813 | | | | 543,403 | |
| | | | | | | | | | | | |
| | | | |
| Textiles, Apparel & Luxury Goods: 1.92% | | | | | | | | | | | | |
Wolverine World Wide Incorporated « | | | | | | | 13,654 | | | | 507,656 | |
| | | | | | | | | | | | |
| | | | |
Consumer Staples: 3.90% | | | | | | | | | | | | |
| | | | |
| Food & Staples Retailing: 2.09% | | | | | | | | | | | | |
The Andersons Incorporated « | | | | | | | 11,290 | | | | 549,710 | |
| | | | | | | | | | | | |
| | | | |
| Food Products: 1.81% | | | | | | | | | | | | |
Fresh del Monte Produce Incorporated | | | | | | | 20,942 | | | | 478,315 | |
| | | | | | | | | | | | |
| | | | |
Energy: 9.20% | | | | | | | | | | | | |
| | | | |
| Energy Equipment & Services: 5.70% | | | | | | | | | | | | |
Core Laboratories NV | | | | | | | 4,188 | | | | 551,015 | |
Helmerich & Payne Incorporated « | | | | | | | 11,256 | | | | 607,261 | |
Patterson-UTI Energy Incorporated | | | | | | | 20,120 | | | | 347,875 | |
| | | | |
| | | | | | | | | | | 1,506,151 | |
| | | | | | | | | | | | |
| | | | |
| Oil, Gas & Consumable Fuels: 3.50% | | | | | | | | | | | | |
Cimarex Energy Company | | | | | | | 5,633 | | | | 425,123 | |
Whiting Petroleum Corporation † | | | | | | | 9,177 | | | | 498,311 | |
| | | | |
| | | | | | | | | | | 923,434 | |
| | | | | | | | | | | | |
| | | | |
Financials: 20.71% | | | | | | | | | | | | |
| | | | |
| Capital Markets: 4.44% | | | | | | | | | | | | |
Financial Engines Incorporated †« | | | | | | | 28,524 | | | | 637,797 | |
Raymond James Financial Incorporated | | | | | | | 14,610 | | | | 533,703 | |
| | | | |
| | | | | | | | | | | 1,171,500 | |
| | | | | | | | | | | | |
| | | | |
| Commercial Banks: 1.73% | | | | | | | | | | | | |
Commerce Bancshares Incorporated « | | | | | | | 11,271 | | | | 456,701 | |
| | | | | | | | | | | | |
The accompanying notes are an integral part of these financial statements.
| | | | | | |
| Portfolio of Investments—March 31, 2012 (Unaudited) | | Wells Fargo Advantage Small/Mid Cap Core Fund | | | 9 | |
| | | | | | | | | | | | |
| Security Name | | | | | | Shares | | | Value | |
| | | | | | | | | | | | |
| | | | |
| Diversified Financial Services: 2.02% | | | | | | | | | | | | |
NASDAQ OMX Group Incorporated † | | | | | | | 20,567 | | | $ | 532,685 | |
| | | | | | | | | | | | |
| | | | |
| Insurance: 2.34% | | | | | | | | | | | | |
American Financial Group Incorporated | | | | | | | 16,004 | | | | 617,434 | |
| | | | | | | | | | | | |
| | | | |
| Real Estate Management & Development: 1.82% | | | | | | | | | | | | |
CBRE Group Incorporated Class A † | | | | | | | 24,027 | | | | 479,579 | |
| | | | | | | | | | | | |
| | | | |
| REITs: 6.21% | | | | | | | | | | | | |
Digital Reality Trust Incorporated « | | | | | | | 7,369 | | | | 545,085 | |
Post Properties Incorporated | | | | | | | 11,795 | | | | 552,714 | |
Sabra Health Care REIT Incorporated | | | | | | | 32,925 | | | | 541,287 | |
| | | | |
| | | | | | | | | | | 1,639,086 | |
| | | | | | | | | | | | |
| | | | |
| Thrifts & Mortgage Finance: 2.15% | | | | | | | | | | | | |
Ocwen Financial Corporation † | | | | | | | 36,418 | | | | 569,213 | |
| | | | | | | | | | | | |
| | | | |
Health Care: 13.84% | | | | | | | | | | | | |
| | | | |
| Biotechnology: 1.66% | | | | | | | | | | | | |
Momenta Pharmaceuticals Incorporated †« | | | | | | | 28,674 | | | | 439,286 | |
| | | | | | | | | | | | |
| | | | |
| Health Care Providers & Services: 8.05% | | | | | | | | | | | | |
AmerisourceBergen Corporation | | | | | | | 13,222 | | | | 524,649 | |
AmSurg Corporation † | | | | | | | 21,153 | | | | 591,861 | |
Laboratory Corporation of America Holdings †« | | | | | | | 5,950 | | | | 544,663 | |
Magellan Health Services Incorporated † | | | | | | | 9,482 | | | | 462,816 | |
| | | | |
| | | | | | | | | | | 2,123,989 | |
| | | | | | | | | | | | |
| | | | |
| Pharmaceuticals: 4.13% | | | | | | | | | | | | |
Endo Pharmaceuticals Holdings Incorporated † | | | | | | | 14,239 | | | | 551,476 | |
Medicines Company † | | | | | | | 26,832 | | | | 538,518 | |
| | | | |
| | | | | | | | | | | 1,089,994 | |
| | | | | | | | | | | | |
| | | | |
Industrials: 11.67% | | | | | | | | | | | | |
| | | | |
| Commercial Services & Supplies: 3.48% | | | | | | | | | | | | |
Brink’s Company « | | | | | | | 15,669 | | | | 374,019 | |
Copart Incorporated † | | | | | | | 20,870 | | | | 544,081 | |
| | | | |
| | | | | | | | | | | 918,100 | |
| | | | | | | | | | | | |
| | | | |
| Construction & Engineering: 2.07% | | | | | | | | | | | | |
Shaw Group Incorporated † | | | | | | | 17,250 | | | | 546,998 | |
| | | | | | | | | | | | |
| | | | |
| Electrical Equipment: 1.95% | | | | | | | | | | | | |
Polypore International Incorporated †« | | | | | | | 14,624 | | | | 514,180 | |
| | | | | | | | | | | | |
| | | | |
| Machinery: 4.17% | | | | | | | | | | | | |
AGCO Corporation † | | | | | | | 11,959 | | | | 564,584 | |
Pall Corporation | | | | | | | 9,014 | | | | 537,505 | |
| | | | |
| | | | | | | | | | | 1,102,089 | |
| | | | | | | | | | | | |
The accompanying notes are an integral part of these financial statements.
| | | | |
| 10 | | Wells Fargo Advantage Small/Mid Cap Core Fund | | Portfolio of Investments—March 31, 2012 (Unaudited) |
| | | | | | | | | | | | | | |
| Security Name | | | | | | | Shares | | | Value | |
| | | | | | | | | | | | | | |
| | | | |
Information Technology: 18.60% | | | | | | | | | | | | | | |
| | | | |
| Communications Equipment: 4.12% | | | | | | | | | | | | | | |
Brocade Communications Systems Incorporated † | | | | | | | | | 93,545 | | | $ | 537,884 | |
InterDigital Incorporated « | | | | | | | | | 15,730 | | | | 548,348 | |
| | | | |
| | | | | | | | | | | | | 1,086,232 | |
| | | | | | | | | | | | | | |
| | | | |
| Electronic Equipment, Instruments & Components: 2.16% | | | | | | | | | | | | | | |
Vishay Intertechnology Incorporated †« | | | | | | | | | 46,879 | | | | 570,049 | |
| | | | | | | | | | | | | | |
| | | | |
| Internet Software & Services: 4.84% | | | | | | | | | | | | | | |
Constant Contact Incorporrated †« | | | | | | | | | 20,745 | | | | 617,994 | |
IAC InterActive Corporation | | | | | | | | | 13,461 | | | | 660,800 | |
| | | | |
| | | | | | | | | | | | | 1,278,794 | |
| | | | | | | | | | | | | | |
| | | | |
| Semiconductors & Semiconductor Equipment: 2.05% | | | | | | | | | | | | | | |
Novellus Systems Incorporated † | | | | | | | | | 10,832 | | | | 540,625 | |
| | | | | | | | | | | | | | |
| | | | |
| Software: 5.43% | | | | | | | | | | | | | | |
BMC Software Incorporated † | | | | | | | | | 13,087 | | | | 525,574 | |
TeleNav Incorporated † | | | | | | | | | 34,159 | | | | 239,796 | |
TIBCO Software Incorporated † | | | | | | | | | 21,919 | | | | 668,530 | |
| | | | |
| | | | | | | | | | | | | 1,433,900 | |
| | | | | | | | | | | | | | |
| | | | |
Materials: 6.48% | | | | | | | | | | | | | | |
| | | | |
| Chemicals: 4.68% | | | | | | | | | | | | | | |
Albemarle Corporation | | | | | | | | | 8,067 | | | | 515,643 | |
FMC Corporation | | | | | | | | | 6,809 | | | | 720,801 | |
| | | | |
| | | | | | | | | | | | | 1,236,444 | |
| | | | | | | | | | | | | | |
| | | | |
| Metals & Mining: 1.80% | | | | | | | | | | | | | | |
Coeur D’alene Mines Corporation † | | | | | | | | | 19,994 | | | | 474,658 | |
| | | | | | | | | | | | | | |
| | | | |
Utilities: 2.24% | | | | | | | | | | | | | | |
| | | | |
| Electric Utilities: 2.24% | | | | | | | | | | | | | | |
Alliant Energy Corporation | | | | | | | | | 13,655 | | | | 591,535 | |
| | | | | | | | | | | | | | |
| | | | |
Total Common Stocks (Cost $21,705,504) | | | | | | | | | | | | | 26,916,584 | |
| | | | | | | | | | | | | | |
| | | | |
| | | Yield | | | | | | | | | |
| Short-Term Investments: 28.87% | | | | | | | | | | | | | | |
| | | | |
| Investment Companies: 28.87% | | | | | | | | | | | | | | |
Wells Fargo Advantage Cash Investment Money Market Fund, Select Class (l)(u) | | | 0.10 | % | | | | | 284,578 | | | | 284,578 | |
Wells Fargo Securities Lending Cash Investments, LLC (r)(v)(l)(u) | | | 0.18 | | | | | | 7,335,625 | | | | 7,335,625 | |
| | | | |
Total Short-Term Investments (Cost $7,620,203) | | | | | | | | | | | | | 7,620,203 | |
| | | | | | | | | | | | | | |
| | | | | | | | |
| Total Investments in Securities | | | | | | | | |
| (Cost $29,325,707) * | | | 130.84 | % | | | 34,536,787 | |
Other Assets and Liabilities, Net | | | (30.84 | ) | | | (8,139,756 | ) |
| | | | | | | | |
| Total Net Assets | | | 100.00 | % | | $ | 26,397,031 | |
| | | | | | | | |
The accompanying notes are an integral part of these financial statements.
| | | | | | |
| Portfolio of Investments—March 31, 2012 (Unaudited) | | Wells Fargo Advantage Small/Mid Cap Core Fund | | | 11 | |
| † | Non-income earning security |
| « | All or a portion of this security is on loan. |
| (l) | Investment in an affiliate |
| (u) | Rate shown is the 7-day annualized yield at period end. |
| (r) | The investment company is exempt from registration under Section 3(c)(7) of the 1940 Act. |
| (v) | Security represents investment of cash collateral received from securities on loan. |
| * | Cost for federal income tax purposes is $29,341,898 and net unrealized appreciation (depreciation) consists of: |
| | | | |
Gross unrealized appreciation | | $ | 5,936,604 | |
Gross unrealized depreciation | | | (741,715 | ) |
| | | | |
Net unrealized appreciation | | $ | 5,194,889 | |
The accompanying notes are an integral part of these financial statements.
| | | | |
| 12 | | Wells Fargo Advantage Small/Mid Cap Core Fund | | Statement of Assets and Liabilities—March 31, 2012 (Unaudited) |
| | | | |
| | | | |
| |
Assets | | | | |
Investments | | | | |
In unaffiliated securities (including securities on loan), at value (see cost below) | | $ | 26,916,584 | |
In affiliated securities, at value (see cost below) | | | 7,620,203 | |
| | | | |
Total investments, at value (see cost below) | | | 34,536,787 | |
Receivable for investments sold | | | 2,207,778 | |
Receivable for Fund shares sold | | | 24,141 | |
Receivable for dividends | | | 70,743 | |
Receivable for securities lending income | | | 3,575 | |
Prepaid expenses and other assets | | | 50,697 | |
| | | | |
Total assets | | | 36,893,721 | |
| | | | |
| |
Liabilities | | | | |
Payable for investments purchased | | | 2,156,136 | |
Payable for Fund shares redeemed | | | 958,629 | |
Payable upon receipt of securities loaned | | | 7,335,625 | |
Advisory fee payable | | | 2,605 | |
Distribution fees payable | | | 2,550 | |
Due to other related parties | | | 6,916 | |
Accrued expenses and other liabilities | | | 34,229 | |
| | | | |
Total liabilities | | | 10,496,690 | |
| | | | |
Total net assets | | $ | 26,397,031 | |
| | | | |
| |
NET ASSETS CONSIST OF | | | | |
Paid-in capital | | $ | 44,247,631 | |
Accumulated net investment loss | | | (4,918 | ) |
Accumulated net realized losses on investments | | | (23,056,762 | ) |
Net unrealized gains on investments | | | 5,211,080 | |
| | | | |
Total net assets | | $ | 26,397,031 | |
| | | | |
| |
COMPUTATION OF NET ASSET VALUE AND OFFERING PRICE PER SHARE1 | | | | |
Net assets – Class A | | $ | 16,664,791 | |
Shares outstanding – Class A | | | 1,738,293 | |
Net asset value per share – Class A | | | $9.59 | |
Maximum offering price per share – Class A2 | | | $10.18 | |
Net assets – Class C | | $ | 3,751,584 | |
Shares outstanding – Class C | | | 403,221 | |
Net asset value per share – Class C | | | $9.30 | |
Net assets – Administrator Class | | $ | 5,377,324 | |
Shares outstanding – Administrator Class | | | 555,056 | |
Net asset value per share – Administrator Class | | | $9.69 | |
Net assets – Institutional Class | | $ | 603,332 | |
Shares outstanding – Institutional Class | | | 62,105 | |
Net asset value per share – Institutional Class | | | $9.71 | |
| |
Investments in unaffiliated securities, at cost | | $ | 21,705,504 | |
| | | | |
Investments in affiliated securities, at cost | | $ | 7,620,203 | |
| | | | |
Total investments, at cost | | $ | 29,325,707 | |
| | | | |
Securities on loan, at value | | $ | 7,167,125 | |
| | | | |
| 1. | The Fund has an unlimited number of authorized shares. |
| 2. | Maximum offering price is computed as 100/94.25 of net asset value. On investments of $50,000 or more, the offering price is reduced. |
The accompanying notes are an integral part of these financial statements.
| | | | | | |
| Statement of Operations—Six Months Ended March 31, 2012 (Unaudited) | | Wells Fargo Advantage Small/Mid Cap Core Fund | | | 13 | |
| | | | |
| | | | |
| |
Investment income | | | | |
Dividends* | | $ | 183,896 | |
Securities lending income, net | | | 12,422 | |
Income from affiliated securities | | | 137 | |
| | | | |
Total investment income | | | 196,455 | |
| | | | |
| |
Expenses | | | | |
Advisory fee | | | 102,385 | |
Administration fees | | | | |
Fund level | | | 6,826 | |
Class A | | | 21,050 | |
Class C | | | 4,864 | |
Administrator Class | | | 3,366 | |
Institutional Class | | | 255 | |
Shareholder servicing fees | | | | |
Class A | | | 20,241 | |
Class C | | | 4,677 | |
Administrator Class | | | 7,296 | |
Distribution fees | | | | |
Class C | | | 14,030 | |
Custody and accounting fees | | | 10,048 | |
Professional fees | | | 22,068 | |
Registration fees | | | 4,323 | |
Shareholder report expenses | | | 13,626 | |
Trustees’ fees and expenses | | | 7,933 | |
Other fees and expenses | | | 3,464 | |
| | | | |
Total expenses | | | 246,452 | |
Less: Fee waivers and/or expense reimbursements | | | (51,150 | ) |
| | | | |
Net expenses | | | 195,302 | |
| | | | |
Net investment income | | | 1,153 | |
| | | | |
| |
REALIZED AND UNREALIZED GAINS (LOSSES) ON INVESTMENTS | | | | |
Net realized gains on investments | | | 333,884 | |
Net change in unrealized gains (losses) on investments | | | 5,101,879 | |
| | | | |
Net realized and unrealized gains (losses) on investments | | | 5,435,763 | |
| | | | |
Net increase in net assets resulting from operations | | $ | 5,436,916 | |
| | | | |
| |
* Net of foreign dividend withholding taxes of | | | $434 | |
The accompanying notes are an integral part of these financial statements.
| | | | |
| 14 | | Wells Fargo Advantage Small/Mid Cap Core Fund | | Statements of Changes in Net Assets |
| | | | | | | | | | | | | | | | |
| | | Six Months Ended
March 31, 2012 (Unaudited) | | | Year Ended
September 30, 2011 | |
| | | | |
Operations | | | | | | | | | | | | | | | | |
Net investment income (loss) | | | | | | $ | 1,153 | | | | | | | $ | (149,651 | ) |
Net realized gains on investments | | | | | | | 333,884 | | | | | | | | 2,272,674 | |
Net change in unrealized gains (losses) on investments | | | | | | | 5,101,879 | | | | | | | | (2,829,350 | ) |
| | | | | | | | | | | | | | | | |
Net increase (decrease) in net assets resulting from operations | | | | | | | 5,436,916 | | | | | | | | (706,327 | ) |
| | | | | | | | | | | | | | | | |
| | | | |
Distributions to shareholders from | | | | | | | | | | | | | | | | |
Net investment income | | | | | | | | | | | | | | | | |
Class A | | | | | | | 0 | | | | | | | | (7,704 | ) |
Administrator Class | | | | | | | 0 | | | | | | | | (5,516 | ) |
Institutional Class | | | | | | | 0 | | | | | | | | (12 | ) |
| | | | | | | | | | | | | | | | |
Total distributions to shareholders | | | | | | | 0 | | | | | | | | (13,232 | ) |
| | | | | | | | | | | | | | | | |
| | | | |
Capital share transactions | | | Shares | | | | | | | | Shares | | | | | |
Proceeds from shares sold | | | | | | | | | | | | | | | | |
Class A | | | 45,595 | | | | 419,761 | | | | 224,431 | | | | 2,106,290 | |
Class C | | | 6,160 | | | | 53,545 | | | | 216,480 | | | | 2,027,495 | |
Administrator Class | | | 45,998 | | | | 429,286 | | | | 390,700 | | | | 3,589,824 | |
Institutional Class | | | 0 | | | | 0 | | | | 69,106 | | | | 680,000 | |
| | | | | | | | | | | | | | | | |
| | | | | | | 902,592 | | | | | | | | 8,403,609 | |
| | | | | | | | | | | | | | | | |
Reinvestment of distributions | | | | | | | | | | | | | | | | |
Class A | | | 0 | | | | 0 | | | | 803 | | | | 7,289 | |
Administrator Class | | | 0 | | | | 0 | | | | 532 | | | | 4,865 | |
Institutional Class | | | 0 | | | | 0 | | | | 1 | | | | 12 | |
| | | | | | | | | | | | | | | | |
| | | | | | | 0 | | | | | | | | 12,166 | |
| | | | | | | | | | | | | | | | |
Payment for shares redeemed | | | | | | | | | | | | | | | | |
Class A | | | (215,986 | ) | | | (1,932,338 | ) | | | (481,738 | ) | | | (4,463,681 | ) |
Class C | | | (68,531 | ) | | | (581,401 | ) | | | (140,564 | ) | | | (1,224,060 | ) |
Administrator Class | | | (331,036 | ) | | | (3,066,469 | ) | | | (346,516 | ) | | | (3,202,738 | ) |
Institutional Class | | | (8,325 | ) | | | (80,000 | ) | | | 0 | | | | 0 | |
| | | | | | | | | | | | | | | | |
| | | | | | | (5,660,208 | ) | | | | | | | (8,890,479 | ) |
| | | | | | | | | | | | | | | | |
Net decrease in net assets resulting from capital share transactions | | | | | | | (4,757,616 | ) | | | | | | | (474,704 | ) |
| | | | | | | | | | | | | | | | |
Total increase (decrease) in net assets | | | | | | | 679,300 | | | | | | | | (1,194,263 | ) |
| | | | | | | | | | | | | | | | |
| | | | |
Net assets | | | | | | | | | | | | | | | | |
Beginning of period | | | | | | | 25,717,731 | | | | | | | | 26,911,994 | |
| | | | | | | | | | | | | | | | |
End of period | | | | | | $ | 26,397,031 | | | | | | | $ | 25,717,731 | |
| | | | | | | | | | | | | | | | |
Accumulated (overdistributed) net investment income (loss) | | | | | | $ | (4,918 | ) | | | | | | $ | (6,071 | ) |
| | | | | | | | | | | | | | | | |
The accompanying notes are an integral part of these financial statements.
| | | | | | |
| Financial Highlights | | Wells Fargo Advantage Small/Mid Cap Core Fund | | | 15 | |
(For a share outstanding throughout each period)
| | | | | | | | | | | | | | | | | | | | | | | | |
| | | Six Months Ended
March 31, 2012 (Unaudited) | | | Year Ended September 30, | | | Year Ended July 31, | |
| Class A | | | 2011 | | | 2010¹ | | | 2010² | | | 2009² | | | 2008²,³ | |
Net asset value, beginning of period | | $ | 7.84 | | | $ | 8.03 | | | $ | 7.51 | | | $ | 6.30 | | | $ | 9.06 | | | $ | 10.00 | |
Net investment income (loss) | | | 0.00 | 4 | | | (0.04 | ) | | | 0.00 | 4 | | | 0.00 | 4 | | | 0.00 | 4 | | | (0.02 | ) |
Net realized and unrealized gains (losses) on investments | | | 1.75 | | | | (0.15 | ) | | | 0.52 | | | | 1.21 | | | | (2.76 | ) | | | (0.92 | ) |
| | | | | | | | | | | | | | | | | | | | | | | | |
Total from investment operations | | | 1.75 | | | | (0.19 | ) | | | 0.52 | | | | 1.21 | | | | (2.76 | ) | | | (0.94 | ) |
Distribution to shareholders from | | | | | | | | | | | | | | | | | | | | | | | | |
Net investment income | | | 0.00 | | | | (0.00 | )4 | | | 0.00 | | | | 0.00 | | | | 0.00 | | | | 0.00 | |
Net asset value, end of period | | $ | 9.59 | | | $ | 7.84 | | | $ | 8.03 | | | $ | 7.51 | | | $ | 6.30 | | | $ | 9.06 | |
Total return5 | | | 22.32 | % | | | (2.33 | )% | | | 6.92 | % | | | 19.21 | % | | | (30.46 | )% | | | (9.40 | )% |
Ratios to average net assets (annualized) | | | | | | | | | | | | | | | | | | | | | | | | |
Gross expenses | | | 1.76 | % | | | 1.72 | % | | | 2.48 | % | | | 2.31 | % | | | 2.35 | % | | | 5.15 | % |
Net expenses | | | 1.40 | % | | | 1.40 | % | | | 1.40 | % | | | 1.50 | % | | | 1.50 | % | | | 1.50 | % |
Net investment income (loss) | | | 0.05 | % | | | (0.43 | )% | | | 0.33 | % | | | (0.01 | )% | | | (0.07 | )% | | | (0.44 | )% |
Supplemental data | | | | | | | | | | | | | | | | | | | | | | | | |
Portfolio turnover rate | | | 16 | % | | | 48 | % | | | 17 | % | | | 23 | % | | | 230 | % | | | 23 | % |
Net assets, end of period (000’s omitted) | | | $16,665 | | | | $14,957 | | | | $17,392 | | | | $16,583 | | | | $14,915 | | | | $563 | |
| 1. | For the two months ended September 30, 2010. The Fund changed its fiscal year end from July 31 to September 30, effective September 30, 2010. |
| 2. | After the close of business on July 16, 2010, the Fund acquired the net assets of Evergreen Golden Core Opportunities Fund which became the accounting and performance survivor in the transaction. The information for the periods prior to July 19, 2010 is that of Class A of Evergreen Golden Core Opportunities Fund. |
| 3. | For the period from December 17, 2007 (commenced of class operations) to July 31, 2008 |
| 4. | Amount is less than $0.005. |
| 5. | Total return calculations do not include any sales charges. Returns for periods of less than one year are not annualized. |
The accompanying notes are an integral part of these financial statements.
| | | | |
| 16 | | Wells Fargo Advantage Small/Mid Cap Core Fund | | Financial Highlights |
(For a share outstanding throughout each period)
| | | | | | | | | | | | | | | | | | | | | | | | |
| | | Six Months Ended
March 31, 2012 (Unaudited) | | | Year Ended September 30, | | | Year Ended July 31, | |
| Class C | | | 2011 | | | 2010¹ | | | 2010² | | | 2009² | | | 2008²,³ | |
Net asset value, beginning of period | | $ | 7.64 | | | $ | 7.89 | | | $ | 7.38 | | | $ | 6.24 | | | $ | 9.04 | | | $ | 10.00 | |
Net investment loss | | | (0.03 | )4 | | | (0.09 | ) | | | (0.01 | ) | | | (0.08 | ) | | | (0.05 | )4 | | | (0.07 | ) |
Net realized and unrealized gains (losses) on investments | | | 1.69 | | | | (0.16 | ) | | | 0.52 | | | | 1.22 | | | | (2.75 | ) | | | (0.89 | ) |
| | | | | | | | | | | | | | | | | | | | | | | | |
Total from investment operations | | | 1.66 | | | | (0.25 | ) | | | 0.51 | | | | 1.14 | | | | (2.80 | ) | | | (0.96 | ) |
Net asset value, end of period | | $ | 9.30 | | | $ | 7.64 | | | $ | 7.89 | | | $ | 7.38 | | | $ | 6.24 | | | $ | 9.04 | |
Total return5 | | | 21.73 | % | | | (3.17 | )% | | | 6.91 | % | | | 18.27 | % | | | (30.97 | )% | | | (9.60 | )% |
Ratios to average net assets (annualized) | | | | | | | | | | | | | | | | | | | | | | | | |
Gross expenses | | | 2.51 | % | | | 2.43 | % | | | 3.23 | % | | | 3.06 | % | | | 3.10 | % | | | 5.90 | % |
Net expenses | | | 2.15 | % | | | 2.15 | % | | | 2.15 | % | | | 2.25 | % | | | 2.25 | % | | | 2.25 | % |
Net investment loss | | | (0.71 | )% | | | (1.18 | )% | | | (0.42 | )% | | | (0.76 | )% | | | (0.80 | )% | | | (1.18 | )% |
Supplemental data | | | | | | | | | | | | | | | | | | | | | | | | |
Portfolio turnover rate | | | 16 | % | | | 48 | % | | | 17 | % | | | 23 | % | | | 230 | % | | | 23 | % |
Net assets, end of period (000’s omitted) | | | $3,752 | | | | $3,557 | | | | $3,074 | | | | $2,976 | | | | $3,553 | | | | $477 | |
| 1. | For the two months ended September 30, 2010. The Fund changed its fiscal year end from July 31 to September 30, effective September 30, 2010. |
| 2. | After the close of business on July 16, 2010, the Fund acquired the net assets of Evergreen Golden Core Opportunities Fund which became the accounting and performance survivor in the transaction. The information for the periods prior to July 19, 2010 is that of Class C of Evergreen Golden Core Opportunities Fund. |
| 3. | For the period from December 17, 2007 (commencement of class operations) to July 31, 2008 |
| 4. | Calculated based upon average shares outstanding |
| 5. | Total return calculations do not include any sales charges. Returns for periods of less than one year are not annualized. |
The accompanying notes are an integral part of these financial statements.
| | | | | | |
| Financial Highlights | | Wells Fargo Advantage Small/Mid Cap Core Fund | | | 17 | |
(For a share outstanding throughout each period)
| | | | | | | | | | | | | | | | | | | | | | | | |
| | | Six Months Ended
March 31, 2012 (Unaudited) | | | Year Ended September 30, | | | Year Ended July 31, | |
| Administrator Class | | | 2011 | | | 2010¹ | | | 2010² | | | 2009² | | | 2008²,³ | |
Net asset value, beginning of period | | $ | 7.91 | | | $ | 8.09 | | | $ | 7.56 | | | $ | 6.33 | | | $ | 9.07 | | | $ | 10.00 | |
Net investment income (loss) | | | 0.01 | 4 | | | (0.02 | ) | | | 0.01 | | | | 0.04 | | | | 0.00 | 5 | | | (0.01 | ) |
Net realized and unrealized gains (losses) on investments | | | 1.77 | | | | (0.15 | ) | | | 0.52 | | | | 1.19 | | | | (2.74 | ) | | | (0.92 | ) |
| | | | | | | | | | | | | | | | | | | | | | | | |
Total from investment operations | | | 1.78 | | | | (0.17 | ) | | | 0.53 | | | | 1.23 | | | | (2.74 | ) | | | (0.93 | ) |
Distributions to shareholders from | | | | | | | | | | | | | | | | | | | | | | | | |
Net investment income | | | 0.00 | | | | (0.01 | ) | | | 0.00 | | | | 0.00 | | | | 0.00 | | | | 0.00 | |
Net asset value, end of period | | $ | 9.69 | | | $ | 7.91 | | | $ | 8.09 | | | $ | 7.56 | | | $ | 6.33 | | | $ | 9.07 | |
Total return6 | | | 22.50 | % | | | (2.16 | )% | | | 7.01 | % | | | 19.43 | % | | | (30.21 | )% | | | (9.30 | )% |
Ratios to average net assets (annualized) | | | | | | | | | | | | | | | | | | | | | | | | |
Gross expenses | | | 1.56 | % | | | 1.52 | % | | | 2.32 | % | | | 2.06 | % | | | 2.10 | % | | | 4.90 | % |
Net expenses | | | 1.15 | % | | | 1.15 | % | | | 1.15 | % | | | 1.24 | % | | | 1.25 | % | | | 1.25 | % |
Net investment income (loss) | | | 0.25 | % | | | (0.18 | )% | | | 0.57 | % | | | 0.26 | % | | | 0.22 | % | | | (0.18 | )% |
Supplemental data | | | | | | | | | | | | | | | | | | | | | | | | |
Portfolio turnover rate | | | 16 | % | | | 48 | % | | | 17 | % | | | 23 | % | | | 230 | % | | | 23 | % |
Net assets, end of period (000’s omitted) | | | $5,377 | | | | $6,646 | | | | $6,435 | | | | $6,708 | | | | $9,521 | | | | $3,221 | |
| 1. | For the two months ended September 30, 2010. The Fund changed its fiscal year end from July 31 to September 30, effective September 30, 2010. |
| 2. | After the close of business on July 16, 2010, the Fund acquired the net assets of Evergreen Golden Core Opportunities Fund which became the accounting and performance survivor in the transaction. The information for the periods prior to July 19, 2010 is that of Class I of Evergreen Golden Core Opportunities Fund. |
| 3. | For the period from December 17, 2007 (commencement of class operations) to July 31, 2008 |
| 4. | Calculated based upon average shares outstanding |
| 5. | Amount is less than $0.005. |
| 6. | Returns for periods of less than one year are not annualized. |
The accompanying notes are an integral part of these financial statements.
| | | | |
| 18 | | Wells Fargo Advantage Small/Mid Cap Core Fund | | Financial Highlights |
(For a share outstanding throughout each period)
| | | | | | | | | | | | | | | | |
| | | Six Months Ended
March 31, 2012
(Unaudited) | | | Year Ended September 30, | | | Year Ended
July 31, 2010² | |
| Institutional Class | | | 2011 | | | 2010¹ | | |
Net asset value, beginning of period | | $ | 7.93 | | | $ | 8.10 | | | $ | 7.56 | | | $ | 7.56 | |
Net investment income | | | 0.03 | | | | 0.00 | 3 | | | 0.01 | | | | 0.00 | 4 |
Net realized and unrealized gains (losses) on investments | | | 1.75 | | | | (0.16 | ) | | | 0.53 | | | | 0.00 | |
| | | | | | | | | | | | | | | | |
Total from investment operations | | | 1.78 | | | | (0.16 | ) | | | 0.54 | | | | 0.00 | 4 |
Distribution to shareholders from | | | | | | | | | | | | | | | | |
Net investment income | | | 0.00 | | | | (0.01 | ) | | | 0.00 | | | | 0.00 | |
Net asset value, end of period | | $ | 9.71 | | | $ | 7.93 | | | $ | 8.10 | | | $ | 7.56 | |
Total return5 | | | 22.45 | % | | | (2.00 | )% | | | 7.14 | % | | | 0.00 | % |
Ratios to average net assets (annualized) | | | | | | | | | | | | | | | | |
Gross expenses | | | 1.33 | % | | | 1.13 | % | | | 2.05 | % | | | 0.00 | % |
Net expenses | | | 0.95 | % | | | 0.95 | % | | | 0.95 | % | | | 0.00 | % |
Net investment income | | | 0.52 | % | | | 0.32 | % | | | 0.78 | % | | | 0.00 | % |
Supplemental data | | | | | | | | | | | | | | | | |
Portfolio turnover rate | | | 16 | % | | | 48 | % | | | 17 | % | | | 23 | % |
Net assets, end of period (000’s omitted) | | | $603 | | | | $558 | | | | $11 | | | | $10 | |
| 1. | For the two months ended September 30, 2010. The Fund changed its fiscal year end from July 31 to September 30, effective September 30, 2010. |
| 2. | For the period July 30, 2010 (commencement of class operations) to July 31, 2010 |
| 3. | Amount is less than $0.005. |
| 4. | Calculated based upon average shares outstanding |
| 5. | Returns for periods of less than one year are not annualized. |
The accompanying notes are an integral part of these financial statements.
| | | | | | |
| Notes to Financial Statements (Unaudited) | | Wells Fargo Advantage Small/Mid Cap Core Fund | | | 19 | |
1. ORGANIZATION
Wells Fargo Funds Trust (the “Trust”), a Delaware statutory trust organized on March 10, 1999, is an open-end management investment company registered under the Investment Company Act of 1940, as amended (the “1940 Act”). These financial statements report on Wells Fargo Advantage Small/Mid Cap Core Fund (the “Fund”) which is a diversified series of the Trust.
2. SIGNIFICANT ACCOUNTING POLICIES
The following significant accounting policies, which are consistently followed in the preparation of the financial statements of the Fund, are in conformity with U.S. generally accepted accounting principles which require management to make estimates and assumptions that affect the reported amounts of assets and liabilities, disclosure of contingent assets and liabilities at the date of the financial statements, and the reported amounts of revenues and expenses during the reporting period. Actual results could differ from those estimates.
Securities valuation
Investments in equity securities are valued each business day as of the close of regular trading on the New York Stock Exchange, which is usually 4:00 p.m. (Eastern Time). Securities which are traded on a national or foreign securities exchange are valued at the last reported sales price, except that securities listed on The Nasdaq Stock Market, Inc. (“Nasdaq”) are valued at the Nasdaq Official Closing Price (“NOCP”), and if no NOCP is available, then at the last reported sales price. If no sales price is shown on the Nasdaq, the bid price will be used. In the absence of any sale of securities listed on the Nasdaq, and in the case of other securities (including U.S. Government obligations, but excluding debt securities maturing in 60 days or less), the price will be deemed “stale” and the valuations will be determined in accordance with the Fund’s Fair Value Procedures.
Investments in open-end mutual funds and non-registered investment companies are generally valued at net asset value.
Investments which are not valued using any of the methods discussed above, are valued at their fair value, as determined by procedures established in good faith and approved by the Board of Trustees. The Board of Trustees has established a Valuation Committee comprised of the Trustees and has delegated to it the authority to take any actions regarding the valuation of portfolio securities that the Valuation Committee deems necessary in determining the fair value of portfolio securities, unless the responsibility has been delegated to the Management Valuation Team of Wells Fargo Funds Management, LLC (“Funds Management”). The Board of Trustees retains the authority to make or ratify any valuation decisions or approve any changes to the Fair Value Procedures as it deems appropriate. On a quarterly basis, the Board of Trustees considers for ratification any valuation actions taken by the Valuation Committee or the Management Valuation Team.
Valuations of fair valued prices are compared to the next actual sales price when available, or other appropriate market information to assess the continued appropriateness of the fair valuation methodology used. The securities are fair valued on a day-to-day basis, taking into consideration changes to appropriate market information and any significant changes to the input factors considered in the valuation process until there is a readily available price provided on the exchange or by an independent pricing service. Valuations received from an independent pricing service or broker quotes are periodically validated by comparisons to most recent trades and valuations provided by other independent pricing services in addition to the review of prices by the adviser and/or sub-adviser. Unobservable inputs used in determining fair valuations are identified based on the type of security, taking into consideration factors utilized by market participants in valuing the investment, knowledge about the issuer and the current market environment.
Security loans
The Fund may lend its securities from time to time in order to earn additional income in the form of fees or interest on securities received as collateral or the investment of any cash received as collateral. The Fund continues to receive interest or dividends on the securities loaned. The Fund receives collateral in the form of cash or securities with a value at least equal to the value of the securities on loan. The value of the loaned securities is determined at the close of each business day and any additional required collateral is delivered to the Fund on the next business day. In a securities lending transaction, the net asset value of the Fund will be affected by an increase or decrease in the value of the securities loaned and by an increase or decrease in the value of the instrument in which collateral is invested. The amount of securities lending activity undertaken by the Fund fluctuates from time to time. In the event of default or bankruptcy by the borrower, the Fund may be prevented from recovering the loaned securities or gaining access to the collateral or
| | | | |
| 20 | | Wells Fargo Advantage Small/Mid Cap Core Fund | | Notes to Financial Statements (Unaudited) |
may experience delays or costs in doing so. In addition, the investment of any cash collateral received may lose all or part of its value. The Fund has the right under the lending agreement to recover the securities from the borrower on demand.
The Fund lends its securities through an unaffiliated securities lending agent. Cash collateral received in connection with its securities lending transactions is invested in Wells Fargo Securities Lending Cash Investments, LLC (the “Cash Collateral Fund”). The Cash Collateral Fund is exempt from registration under Section 3(c)(7) of the 1940 Act and is managed by Funds Management and is sub-advised by Wells Capital Management Incorporated (“Wells Capital Management”). Funds Management receives an advisory fee starting at 0.05% and declining to 0.01% as the average daily net assets of the Cash Collateral Fund increase. All of the fees received by Funds Management are paid to Wells Capital Management for its services as sub-adviser. The Cash Collateral Fund seeks to provide a positive return compared to the daily Fed Funds Open rate by investing in high-quality, U.S. dollar-denominated short-term money market instruments. Cash Collateral Fund investments are fair valued based upon the amortized cost valuation technique. Income earned from investment in the Cash Collateral Fund is included in securities lending income on the Statement of Operations.
Security transactions and income recognition
Securities transactions are recorded on a trade date basis. Realized gains or losses are reported on the basis of identified cost of securities delivered.
Dividend income is recognized on the ex-dividend date. Dividend income is recorded net of foreign taxes withheld where recovery of such taxes is not assured.
Distributions to shareholders
Distributions to shareholders from net investment income and net realized gains, if any, are recorded on the ex-dividend date. Such distributions are determined in conformity with income tax regulations, which may differ from generally accepted accounting principles.
Federal and other taxes
The Fund intends to continue to qualify as a regulated investment company by distributing substantially all of its investment company taxable income and any net realized capital gains (after reduction for capital loss carryforwards) sufficient to relieve it from all, or substantially all, federal income taxes. Accordingly, no provision for federal income taxes was required.
The Fund’s income and federal excise tax returns and all financial records supporting those returns for the prior three fiscal years are subject to examination by the federal and Delaware revenue authorities. Management has analyzed the Fund’s tax positions taken on federal, state, and foreign tax returns for all open tax years and does not believe that there are any uncertain tax positions that require recognition of a tax liability.
Under the recently enacted Regulated Investment Company Modernization Act of 2010, the Fund is permitted to carry forward capital losses incurred in taxable years which began after December 22, 2010 for an unlimited period. However, any losses incurred are required to be utilized prior to the losses incurred in pre-enactment taxable years. As a result of this ordering rule, pre-enactment capital loss carryforwards may be more likely to expire unused. Additionally, post-enactment capital losses that are carried forward will retain their character as either short-term or long-term capital losses rather than being considered all short-term as under previous law.
As of September 30, 2011, the Fund had net capital loss carryforwards, which were available to offset future net realized capital gains, in the amount of $23,364,948 with $10,783,608 expiring in 2016 and $12,581,340 expiring in 2017.
Class allocations
The separate classes of shares offered by the Fund differ principally in applicable sales charges, distribution, shareholder servicing and administration fees. Shareholders of each class bear certain expenses that pertain to that particular class. All shareholders bear the common expenses of the Fund, earn income from the portfolio, and are allocated unrealized gains and losses pro rata based on the average daily net assets of each class, without distinction between share classes. Dividends are determined separately for each class based on income and expenses allocable to each class. Realized gains and losses are allocated to each class pro rata based upon the net assets of each class on the date realized. Differences in per share dividend rates generally result from the relative weightings of pro rata income and realized gain allocations and from differences in separate class expenses, including distribution, shareholder servicing and administration fees.
| | | | | | |
| Notes to Financial Statements (Unaudited) | | Wells Fargo Advantage Small/Mid Cap Core Fund | | | 21 | |
3. FAIR VALUATION MEASUREMENTS
Fair value measurements of investments are determined within a framework that has established a fair value hierarchy based upon the various data inputs utilized in determining the value of the Fund’s investments. The three-level hierarchy gives the highest priority to unadjusted quoted prices in active markets for identical assets or liabilities (Level 1) and the lowest priority to significant unobservable inputs (Level 3). The Fund’s investments are classified within the fair value hierarchy based on the lowest level of input that is significant to the fair value measurement. The inputs are summarized into three broad levels as follows:
| n | | Level 1 – quoted prices in active markets for identical securities |
| n | | Level 2 – other significant observable inputs (including quoted prices for similar securities, interest rates, prepayment speeds, credit risk, etc.) |
| n | | Level 3 – significant unobservable inputs (including the Fund’s own assumptions in determining the fair value of investments) |
The inputs or methodologies used for valuing securities are not necessarily an indication of the risk associated with investing in those securities.
As of March 31, 2012, the inputs used in valuing the Fund’s assets, which are carried at fair value, were as follows:
| | | | | | | | | | | | | | | | |
| Investments in Securities | | Quoted Prices (Level 1) | | | Significant Other
Observable Inputs (Level 2) | | | Significant Unobservable Inputs (Level 3) | | | Total | |
Equity securities | | | | | | | | | | | | | | | | |
Common stocks | | $ | 26,916,584 | | | $ | 0 | | | $ | 0 | | | $ | 26,916,584 | |
Short-term investments | | | | | | | | | | | | | | | | |
Investment companies | | | 284,578 | | | | 7,335,625 | | | | 0 | | | | 7,620,203 | |
| | | $ | 27,201,162 | | | $ | 7,335,625 | | | $ | 0 | | | $ | 34,536,787 | |
Further details on the major security types listed above can be found in the Portfolio of Investments.
Transfers in and transfers out are recognized at the end of the reporting period. For the six months ended March 31, 2012, the Fund did not have any significant transfers into/out of Level 1 and Level 2.
4. TRANSACTIONS WITH AFFILIATES AND OTHER EXPENSES
Advisory fee
The Trust has entered into an advisory contract with Funds Management, an indirect wholly owned subsidiary of Wells Fargo & Company (“Wells Fargo”). The adviser is responsible for implementing investment policies and guidelines and for supervising the sub-adviser, who is responsible for day-to-day portfolio management of the Fund.
Pursuant to the contract, Funds Management is entitled to receive an annual advisory fee starting at 0.75% and declining to 0.60% as the average daily net assets of the Fund increase. For the six months ended March 31, 2012, the advisory fee was equivalent to an annual rate of 0.75% of the Fund’s average daily net assets.
Funds Management has retained the services of certain sub-advisers to provide daily portfolio management to the Fund. The fees related to sub-advisory services are borne directly by Funds Management and do not increase the overall fees paid by the Fund. Golden Capital Management, LLC, an affiliate of Funds Management, is the sub-adviser to the Fund and is entitled to receive a fee from Funds Management at an annual rate starting at 0.45% and declining to 0.35% as the average daily net assets of the Fund increase.
| | | | |
| 22 | | Wells Fargo Advantage Small/Mid Cap Core Fund | | Notes to Financial Statements (Unaudited) |
Administration and transfer agent fees
The Trust has entered into an administration agreement with Funds Management. Under this agreement, for providing administrative services, which includes paying fees and expenses for services provided by the transfer agent, sub-transfer agents, omnibus account servicers and record-keepers, Funds Management is entitled to receive from the Fund an annual fund level administration fee starting at 0.05% and declining to 0.03% as the average daily net assets of the Fund increase and a class level administration fee which is calculated based on the average daily net assets of each class as follows:
| | | | |
| | | Class Level Administration Fee | |
Class A, Class C | | | 0.26 | % |
Administrator Class | | | 0.10 | |
Institutional Class | | | 0.08 | |
Funds Management has contractually waived and/or reimbursed advisory and administration fees to the extent necessary to maintain certain net operating expense ratios for the Fund. Waiver of fees and/or reimbursement of expenses by Funds Management were made first from fund level expenses on a proportionate basis and then from class specific expenses. Funds Management has committed through July 18, 2013 to waive fees and/or reimburse expenses to the extent necessary to cap the Fund’s expenses at 1.40% for Class A, 2.15% for Class C, 1.15% for Administrator and 0.95% for Institutional Class.
Distribution fees
The Trust has adopted a Distribution Plan for Class C shares of the Fund pursuant to Rule 12b-1 under the 1940 Act. Distribution fees are charged to Class C shares and paid to Wells Fargo Funds Distributor, LLC, the principal underwriter, at an annual rate of 0.75% of the average daily net assets of Class C shares.
For the six months ended March 31, 2012, Wells Fargo Funds Distributor, LLC received $544 from the sale of Class A shares.
Shareholder servicing fees
The Trust has entered into contracts with one or more shareholder servicing agents, whereby Class A, Class C and Administrator Class of the Fund is charged a fee at an annual rate of 0.25% of the average daily net assets of each respective class.
A portion of these total shareholder servicing fees were paid to affiliates of Wells Fargo.
5. INVESTMENT PORTFOLIO TRANSACTIONS
Purchases and sales of investments, excluding U.S. Government obligations (if any) and short-term securities, for the six months ended March 31, 2012 were $4,272,326 and $8,241,943, respectively.
6. BANK BORROWINGS
The Trust (excluding the money market funds) and Wells Fargo Variable Trust are parties to a $150,000,000 revolving credit agreement with State Street Bank and Trust Company, whereby the Fund is permitted to use bank borrowings for temporary or emergency purposes, such as to fund shareholder redemption requests. Interest under the credit agreement is charged to the Fund based on a borrowing rate equal to the higher of the Federal Funds rate in effect on that day plus 1.25% or the overnight LIBOR rate in effect on that day plus 1.25%. In addition, an annual commitment fee equal to 0.10% of the unused balance is allocated to each participating fund. For the six months ended March 31, 2012, the Fund paid $30 in commitment fees.
For the six months ended March 31, 2012, there were no borrowings by the Fund under the agreement.
7. INDEMNIFICATION
Under the Trust’s organizational documents, the officers and directors are indemnified against certain liabilities that may arise out of performance of their duties to the Trust. Additionally, in the normal course of business, the Trust may enter into contracts with service providers that contain a variety of indemnification clauses. The Trust’s maximum exposure under these arrangements is dependent on future claims that may be made against the Fund and, therefore, cannot be estimated.
| | | | | | |
| Notes to Financial Statements (Unaudited) | | Wells Fargo Advantage Small/Mid Cap Core Fund | | | 23 | |
8. NEW ACCOUNTING PRONOUNCEMENTS
In December 2011, the Financial Accounting Standards Board (“FASB”) issued Accounting Standard Update (“ASU”) No. 2011-11, Disclosures about Offsetting Assets and Liabilities. ASU 2011-11, which amends FASB ASC Topic 210 Balance Sheet, creates new disclosure requirements requiring entities to disclose both gross and net information for derivatives and other financial instruments that are either offset in the Statement of Assets and Liabilities or subject to an enforceable master netting arrangement or similar agreement. The disclosure requirements are effective for interim and annual reporting periods beginning on or after January 1, 2013. Management is currently evaluating the impact of the update’s adoption on the Fund’s financial statement disclosures.
In May 2011, FASB issued ASU No. 2011-04 “Amendments to Achieve Common Fair Value Measurement and Disclosure Requirements in U.S. GAAP and IFRSs”. ASU No. 2011-04 amends FASB ASC Topic 820, Fair Value Measurements and Disclosures, to establish common requirements for measuring fair value and for disclosing information about fair value measurements in accordance with GAAP. The ASU is effective prospectively for interim and annual periods beginning after December 15, 2011. Management expects that adoption of the ASU will result in additional disclosures in the financial statements, as applicable.
In April 2011, FASB issued ASU No. 2011-03 “Reconsideration of Effective Control for Repurchase Agreements”. ASU No. 2011-03 amends FASB ASC Topic 860, Transfers and Servicing, specifically the criteria required to determine whether a repurchase agreement (repo) and similar agreements should be accounted for as sales of financial assets or secured borrowings with commitments. ASU No. 2011-03 changes the assessment of effective control by focusing on the transferor’s contractual rights and obligations and removing the criterion to assess its ability to exercise those rights or honor those obligations. This could result in changes to the way entities account for certain transactions including repurchase agreements, mortgage dollar rolls and reverse repurchase agreements. The ASU will become effective on a prospective basis for new transfers and modifications to existing transactions as of the beginning of the first interim or annual period beginning on or after December 15, 2011. Management has evaluated the impact of adopting the ASU and expects no significant changes.
| | | | |
| 24 | | Wells Fargo Advantage Small/Mid Cap Core Fund | | Other Information (Unaudited) |
PROXY VOTING INFORMATION
A description of the policies and procedures that the Fund uses to determine how to vote proxies relating to portfolio securities is available without charge, upon request, by calling 1-800-222-8222, visiting our Web site at wellsfargoadvantagefunds.com, or visiting the SEC Web site at sec.gov. Information regarding how the Fund voted proxies relating to portfolio securities during the most recent 12-month period ended June 30 is available without charge on the Fund’s Web site at wellsfargoadvantagefunds.com or by visiting the SEC Web site at sec.gov.
PORTFOLIO HOLDINGS INFORMATION
The complete portfolio holdings for the Fund are publicly available on the Fund’s Web site (wellsfargoadvantagefunds.com) on a monthly, 30-day or more delayed basis. In addition, top ten holdings information for the Fund is publicly available on the Fund’s Web site on a monthly, seven-day or more delayed basis. The Fund files its complete schedule of portfolio holdings with the SEC for the first and third quarters of each fiscal year on Form N-Q, which is available without charge by visiting the SEC Web site at sec.gov. In addition, the Fund’s Form N-Q may be reviewed and copied at the SEC’s Public Reference Room in Washington, DC, and at regional offices in New York City, at 233 Broadway, and in Chicago, at 175 West Jackson Boulevard, Suite 900. Information about the Public Reference Room may be obtained by calling 1-800-SEC-0330.
| | | | | | |
| Other Information (Unaudited) | | Wells Fargo Advantage Small/Mid Cap Core Fund | | | 25 | |
BOARD OF TRUSTEES
The following table provides basic information about the Board of Trustees (the “Trustees”) of the Trust and Officers of the Trust. This table should be read in conjunction with the Prospectus and the Statement of Additional Information1 of the Fund. Each of the Trustees and Officers listed below acts in identical capacities for the Wells Fargo Advantage family of funds, which consists of 137 funds comprising the Wells Fargo Funds Trust, Wells Fargo Variable Trust, Wells Fargo Master Trust and four closed-end funds (collectively the “Fund Complex”). All of the Trustees are also Members of the Audit and Governance Committees of each Trust in the Fund Complex. The mailing address of each Trustee and Officer is 525 Market Street, 12th Floor, San Francisco, CA 94105. Each Trustee and Officer serves an indefinite term, however, each Trustee serves such term until reaching the mandatory retirement age established by the Trustees.
Independent Trustees
| | | | | | |
Name and Year of Birth | | Position Held and Length of Service | | Principal Occupations During Past Five Years | | Other Directorships During
Past Five Years |
Peter G. Gordon
(Born 1942) | | Trustee, since 1998; Chairman, since 2005 (Lead Trustee since 2001) | | Co-Founder, Retired Chairman, President and CEO of Crystal Geyser Water Company. Trustee Emeritus, Colby College | | Asset Allocation Trust |
Isaiah Harris, Jr.
(Born 1952) | | Trustee, since 2009 | | Retired. Prior thereto, President and CEO of BellSouth Advertising and Publishing Corp. from 2005 to 2007, President and CEO of BellSouth Enterprises from 2004 to 2005 and President of BellSouth Consumer Services from 2000 to 2003. Emeritus member of the Iowa State University Foundation Board of Governors. Emeritus Member of the Advisory Board of Iowa State University School of Business. Mr. Harris is a certified public accountant. | | CIGNA Corporation; Deluxe Corporation; Asset Allocation Trust |
Judith M. Johnson
(Born 1949) | | Trustee, since 2008 | | Retired. Prior thereto, Chief Executive Officer and Chief Investment Officer of Minneapolis Employees Retirement Fund from 1996 to 2008. Ms. Johnson is an attorney, certified public accountant and a certified managerial accountant. | | Asset Allocation Trust |
Leroy Keith, Jr.
(Born 1939) | | Trustee, since 2010 | | Chairman, Bloc Global Services (development and construction). Trustee of the Evergreen Funds from 1983 to 2010. Former Managing Director, Almanac Capital Management (commodities firm), former Partner, Stonington Partners, Inc. (private equity fund), former Director, Obagi Medical Products Co. and former Director, Lincoln Educational Services. | | Trustee, Virtus Fund Complex (consisting of 40 portfolios as of 12/31/11); Asset Allocation Trust |
David F. Larcker
(Born 1950) | | Trustee, since 2009 | | James Irvin Miller Professor of Accounting at the Graduate School of Business, Stanford University, Director of Corporate Governance Research Program and Senior Faculty of The Rock Center for Corporate Governance since 2006. From 2005 to 2008, Professor of Accounting at the Graduate School of Business, Stanford University. Prior thereto, Ernst & Young Professor of Accounting at The Wharton School, University of Pennsylvania from 1985 to 2005. | | Asset Allocation Trust |
Olivia S. Mitchell
(Born 1953) | | Trustee, since 2006 | | International Foundation of Employee Benefit Plans Professor, Wharton School of the University of Pennsylvania since 1993. Director of Wharton’s Pension Research Council and Boettner Center on Pensions & Retirement Research, and Research Associate at the National Bureau of Economic Research. Previously, Cornell University Professor from 1978 to 1993. | | Asset Allocation Trust |
| | | | |
| 26 | | Wells Fargo Advantage Small/Mid Cap Core Fund | | Other Information (Unaudited) |
| | | | | | |
Name and Year of Birth | | Position Held and Length of Service | | Principal Occupations During Past Five Years | | Other Directorships During
Past Five Years |
Timothy J. Penny
(Born 1951) | | Trustee, since 1996 | | President and CEO of Southern Minnesota Initiative Foundation, a non-profit organization, since 2007 and Senior Fellow at the Humphrey Institute Policy Forum at the University of Minnesota since 1995. Member of the Board of Trustees of NorthStar Education Finance, Inc., a non-profit organization, since 2007. | | Asset Allocation Trust |
Michael S. Scofield
(Born 1943) | | Trustee, since 2010 | | Served on the Investment Company Institute’s Board of Governors and Executive Committee from 2008-2011 as well the Governing Council of the Independent Directors Council from 2006-2011 and the Independent Directors Council Executive Committee from 2008-2011. Chairman of the IDC from 2008-2010. Institutional Investor (Fund Directions) Trustee of Year in 2007. Trustee of the Evergreen Funds (and its predecessors) from 1984 to 2010. Chairman of the Evergreen Funds from 2000-2010. Former Trustee of the Mentor Funds. Retired Attorney, Law Offices of Michael S. Scofield and former Director and Chairman, Branded Media Corporation (multi-media branding company). | | Asset Allocation Trust |
Donald C. Willeke
(Born 1940) | | Trustee, since 1996 | | Principal of the law firm of Willeke & Daniels. General Counsel of the Minneapolis Employees Retirement Fund from 1984 until its consolidation into the Minnesota Public Employees Retirement Association on June 30, 2010. Director and Vice Chair of The Free Trust (non-profit corporation). Director of the American Chestnut Foundation (non-profit corporation). | | Asset Allocation Trust |
Officers
| | | | | | |
Name and Year of Birth | | Position Held and
Length of Service | | Principal Occupations During Past Five Years | | |
Karla M. Rabusch
(Born 1959) | | President, since 2003 | | Executive Vice President of Wells Fargo Bank, N.A. and President of Wells Fargo Funds Management, LLC since 2003. Senior Vice President and Chief Administrative Officer of Wells Fargo Funds Management, LLC from 2001 to 2003. | | |
C. David Messman
(Born 1960) | | Secretary, since 2000; Chief Legal Counsel, since 2003 | | Senior Vice President and Secretary of Wells Fargo Funds Management, LLC since 2001. Vice President and Managing Senior Counsel of Wells Fargo Bank, N.A. since 1996. | | |
Kasey Phillips
(Born 1970) | | Treasurer, since 2009 | | Senior Vice President of Wells Fargo Funds Management, LLC since 2009. Senior Vice President of Evergreen Investment Management Company, LLC from 2006 to 2010. Treasurer of the Evergreen Funds from 2005 to 2010. | | |
David Berardi
(Born 1975) | | Assistant Treasurer, since 2009 | | Vice President of Wells Fargo Funds Management, LLC since 2009. Vice President of Evergreen Investment Management Company, LLC from 2008 to 2010. Assistant Vice President of Evergreen Investment Services, Inc. from 2004 to 2008. Manager of Fund Reporting and Control for Evergreen Investment Management Company, LLC from 2004 to 2010. | | |
Jeremy DePalma
(Born 1974) | | Assistant Treasurer, since 2009 | | Senior Vice President of Wells Fargo Funds Management, LLC since 2009. Senior Vice President of Evergreen Investment Management Company, LLC from 2008 to 2010. Vice President, Evergreen Investment Services, Inc. from 2004 to 2007. Head of the Fund Reporting and Control Team within Fund Administration from 2005 to 2010. | | |
Debra Ann Early
(Born 1964) | | Chief Compliance Officer, since 2007 | | Chief Compliance Officer of Wells Fargo Funds Management, LLC since 2007. Chief Compliance Officer of Parnassus Investments from 2005 to 2007. Chief Financial Officer of Parnassus Investments from 2004 to 2007 and Senior Audit Manager of PricewaterhouseCoopers LLP from 1998 to 2004. | | |
| 1. | The Statement of Additional Information includes additional information about the Trustees and is available, without charge, upon request, by calling 1-800-222-8222 or by visiting the Web site at wellsfargoadvantagefunds.com. |
| | | | | | |
| Other Information (Unaudited) | | Wells Fargo Advantage Small/Mid Cap Core Fund | | | 27 | |
BOARD CONSIDERATION OF INVESTMENT ADVISORY AND SUB-ADVISORY AGREEMENTS:
Under Section 15 of the Investment Company Act of 1940 (the “1940 Act”), the Board of Trustees (the “Board”) of Wells Fargo Funds Trust (the “Trust”), all the members of which have no direct or indirect interest in the investment advisory and sub-advisory agreements and are not “interested persons” of the Trust, as defined in the 1940 Act (the “Independent Trustees”), must determine whether to approve the continuation of the Trust’s investment advisory and sub-advisory agreements. In this regard, at an in person meeting held on March 29-30, 2012 (the “Meeting”), the Board reviewed and re-approved: (i) an investment advisory agreement with Wells Fargo Funds Management, LLC (“Funds Management”) for Wells Fargo Advantage Small/Mid Cap Core Fund (the “Fund”) and (ii) an investment sub-advisory agreement with Golden Capital Management, LLC (“Golden”) for the Fund. The investment advisory agreement with Funds Management and the investment sub-advisory agreement with Golden are collectively referred to as the “Advisory Agreements.”
At the Meeting, the Board considered the factors and reached the conclusions described below relating to the selection of Funds Management and Golden and the continuation of the Advisory Agreements. Prior to the Meeting, the Trustees conferred extensively among themselves and with representatives of Funds Management about these matters. The Board also met throughout the year and received information that was useful to them in considering the continuation of the Advisory Agreements. The Independent Trustees were assisted in their evaluation of the Advisory Agreements by independent legal counsel, from whom they received separate legal advice and with whom they met separately from Funds Management.
In providing information to the Board, Funds Management and Golden were guided by a detailed set of requests submitted by the Independent Trustees’ independent legal counsel on their behalf at the start of the Board’s annual contract renewal process earlier in 2012. In approving the Advisory Agreements, the Board did not identify any particular information or consideration that was all-important or controlling, and each Trustee likely attributed different weights to various factors.
Nature, extent and quality of services
The Board received and considered various information regarding the nature, extent and quality of services provided to the Fund by Funds Management and Golden under the Advisory Agreements. The Board also received and considered, among other things, information about the background and experience of senior management of Funds Management, and the qualifications, backgrounds, tenures and responsibilities of the portfolio managers primarily responsible for the day-to-day portfolio management of the Fund.
The Board evaluated the ability of Funds Management and Golden, based on their respective financial condition, resources, reputation and other attributes, to attract and retain qualified investment professionals, including research, advisory, and supervisory personnel. The Board further considered the compliance programs and compliance records of Funds Management and Golden. In addition, the Board took into account the administrative services provided to the Fund by Funds Management and its affiliates.
The Board’s decision to approve the continuation of the Advisory Agreements was based on a comprehensive evaluation of all of the information provided to it. In considering these matters, the Board considered not only the specific information presented in connection with the Meeting, but also the knowledge gained over time through interaction with Funds Management and Golden about various topics, including Funds Management’s oversight of service providers. The above factors, together with those referenced below, are some of the most important, but not necessarily all, factors considered by the Board in concluding that the nature, extent and quality of the investment advisory services provided to the Fund by Funds Management and Golden supported the re-approval of the Advisory Agreements. Although the Board considered the continuation of the Advisory Agreements for the Fund as part of the larger process of considering the continuation of the advisory agreements for all of the funds in the complex, its decision to continue the Advisory Agreements for the Fund was ultimately made on a fund-by-fund basis.
Fund performance and expenses
The Board considered the performance results for the Fund over various time periods ended December 31, 2011. The Board also considered these results in comparison to the median performance of a universe of relevant funds (the “Universe”) that was determined by Lipper Inc. (“Lipper”) to be similar to the Fund, and in comparison to the Fund’s benchmark index and to other comparative data. Lipper is an independent provider of investment company data. The
| | | | |
| 28 | | Wells Fargo Advantage Small/Mid Cap Core Fund | | Other Information (Unaudited) |
Board received a description of the methodology used by Lipper to select the mutual funds in the Universe. The Board noted that the performance of the Fund was in range of the median performance of the Universe for all periods under review. The Board also noted that the performance of the Fund was in range of or higher than its benchmark index, the Lipper Mid Cap Core Funds Index, for the periods under review.
The Board received and considered information regarding the Fund’s contractual advisory fee and net operating expense ratios and their various components, including actual management fees (which reflect fee waivers, if any), transfer agent, custodian and other non-management fees, Rule 12b-1 and non-Rule 12b-1 fees, service fees and fee waiver and expense reimbursement arrangements. The Board also considered these ratios in comparison to the median ratios of an expense Universe and a narrower expense group of mutual funds (each, an “Expense Group”) that was determined by Lipper to be similar to the Fund. The Board received a description of the methodology used by Lipper to select the mutual funds in the Fund’s Expense Group. The Board noted that the net operating expense ratios of the Fund were lower than, equal to or in range of the Fund’s Expense Group’s median net operating expense ratios.
Based on the above-referenced considerations and other factors, the Board concluded that the overall performance and expense structure of the Fund supported the re-approval of the Advisory Agreements for the Fund.
Investment advisory and sub-advisory fee rates
The Board reviewed and considered the contractual investment advisory fee rate that is payable by the Fund to Funds Management for investment advisory services (the “Advisory Agreement Rate”), both on a stand-alone basis and on a combined basis with the Fund’s administration fee rate. The Board took into account the separate administrative and other services covered by the administration fee rate. The Board also reviewed and considered the contractual investment sub-advisory fee rate that is payable by Funds Management to Golden for investment sub-advisory services (the “Sub-Advisory Agreement Rate”). In addition, the Board reviewed and considered the existing fee waiver/cap arrangements applicable to the Advisory Agreement Rate and considered the Advisory Agreement Rate after taking the waivers/caps into account (the “Net Advisory Rate”).
The Board received and considered information comparing the Advisory Agreement Rate and Net Advisory Rate with those of other funds in the Fund’s Expense Group median. The Board noted that, except for class A, the Advisory Agreement Rate for the Fund was in range of the median rates for the Fund’s Expense Group. The Board also noted that the Net Advisory Rate for the Fund was in range of or lower than the median rates for the Fund’s Expense Group.
The Board also received and considered information about the nature and extent of services offered and fee rates charged by Funds Management and Golden to other types of clients. In this regard, the Board received information about differences between the services, and the compliance, reporting, and other legal burdens and risks of providing investment advice to mutual funds and those associated with providing advice to non-mutual fund clients such as collective funds or institutional separate accounts.
The Board determined that the Advisory Agreement Rate for the Fund, both with and without an administration fee rate and before and after waivers, was reasonable in light of the Fund’s Expense Group information, the net expense ratio commitments, the services covered by the Advisory Agreements and other information provided. The Board also reviewed and considered the Sub-Advisory Agreement Rate and concluded that the Sub-Advisory Agreement Rate was reasonable in light of the services covered by the sub-advisory agreement, the sub-advised expense information provided by Lipper, and other information provided.
Profitability
The Board received and considered a profitability analysis of Funds Management, as well as an analysis of the profitability to the collective Wells Fargo businesses that provide services to the Fund. It considered that the information provided to it was necessarily estimated, and that the profitability information provided to it, especially on a fund-by-fund basis, did not necessarily provide a precise tool for evaluating the appropriateness of the Fund’s Advisory Agreement Rate in isolation. It noted that the levels of profitability reported on a fund-by-fund basis varied widely, depending on, among other things, the size and type of fund. The Board concluded that the profitability reported by Funds Management was not unreasonable.
The Board did not consider separate profitability information with respect to Golden, because, as an affiliate of Funds Management, its profitability information was subsumed in the collective Wells Fargo profitability analysis provided by Funds Management.
| | | | | | |
| Other Information (Unaudited) | | Wells Fargo Advantage Small/Mid Cap Core Fund | | | 29 | |
Economies of scale
With respect to possible economies of scale, the Board reviewed the breakpoints in the Fund’s advisory fee structure, which operate generally to reduce the effective Advisory Agreement Rate of the Fund (as a percentage of Fund assets) as the Fund grows in size. It considered that, as a fund shrinks in size, breakpoints conversely result in increasing fee levels. The Board noted that it would have on-going opportunities to review the appropriate levels of breakpoints in the future, and concluded that the breakpoints as implemented appeared to be a reasonable step toward sharing economies of scale, if any, with the Fund. However, the Board acknowledged the inherent limitations of any analysis of an investment adviser’s economies of scale and of any attempt to correlate breakpoints with such economies, stemming largely from the Board’s understanding that economies of scale are realized, if at all, by an investment adviser across a variety of products and services, not just with respect to a single fund.
Other benefits to Funds Management and Golden
The Board received and considered information regarding potential “fall-out” or ancillary benefits received by Funds Management and its affiliates, including Golden, as a result of their relationship with the Fund. Ancillary benefits could include, among others, benefits directly attributable to the relationship of Funds Management and Golden with the Fund and benefits potentially derived from an increase in Funds Management’s and Golden’s business as a result of their relationship with the Fund (such as the ability to market to shareholders other financial products offered by Funds Management and its affiliates, including Golden).
The Board considered that Wells Fargo Funds Distributor, LLC, an affiliate of Funds Management, serves as distributor to the Fund and receives certain compensation for those services. The Board noted that various financial institutions, including affiliates of Funds Management, may receive distribution-related fees, shareholder servicing payments (including amounts derived from payments under Rule 12b-1 plans) and sub-transfer agency fees in respect of shares sold or held through them and services provided.
The Board also reviewed information about whether and to what extent soft dollar credits are sought and how any such credits are utilized and any benefits that may be realized by using an affiliated broker.
Other factors and broader review
The Board also considered the markets for distribution of the Fund’s shares, including the channels through which the Fund’s shares are offered and sold. The Board noted that the Fund is part of one of the few fund families that have both direct-to-fund and intermediary distribution channels. As discussed above, the Board reviews detailed materials received from Funds Management and Golden annually as part of the re-approval process under Section 15 of the 1940 Act and also reviews and assesses information about the quality of the services that the Fund receives throughout the year. In this regard, the Board has reviewed reports of Funds Management at each of its quarterly meetings, which include, among other things, portfolio reviews and performance reports. In addition, the Board confers with portfolio managers at various times throughout the year.
Conclusion
After considering the above-described factors and based on its deliberations and its evaluation of the information described above, the Board unanimously approved the continuation of the Advisory Agreements for an additional one-year period.
| | | | |
| 30 | | Wells Fargo Advantage Small/Mid Cap Core Fund | | List of Abbreviations |
The following is a list of common abbreviations for terms and entities which may have appeared in this report.
| ACB | — Agricultural Credit Bank |
| ADR | — American Depository Receipt |
| ADS | — American Depository Shares |
| AGC-ICC | — Assured Guaranty Corporation - Insured Custody Certificates |
| AGM | — Assured Guaranty Municipal |
| AMBAC | — American Municipal Bond Assurance Corporation |
| AMT | — Alternative Minimum Tax |
| BAN | — Bond Anticipation Notes |
| BHAC | — Berkshire Hathaway Assurance Corporation |
| CAB | — Capital Appreciation Bond |
| CCAB | — Convertible Capital Appreciation Bond |
| CDA | — Community Development Authority |
| CDO | — Collateralized Debt Obligation |
| COP | — Certificate of Participation |
| DRIVER | — Derivative Inverse Tax-Exempt Receipts |
| DW&P | — Department of Water & Power |
| DWR | — Department of Water Resources |
| ECFA | — Educational & Cultural Facilities Authority |
| EDA | — Economic Development Authority |
| EDFA | — Economic Development Finance Authority |
| ETF | — Exchange-Traded Fund |
| FFCB | — Federal Farm Credit Bank |
| FGIC | — Financial Guaranty Insurance Corporation |
| FHA | — Federal Housing Authority |
| FHLB | — Federal Home Loan Bank |
| FHLMC | — Federal Home Loan Mortgage Corporation |
| FICO | — The Financing Corporation |
| FNMA | — Federal National Mortgage Association |
| GDR | — Global Depository Receipt |
| GNMA | — Government National Mortgage Association |
| HCFR | — Healthcare Facilities Revenue |
| HEFA | — Health & Educational Facilities Authority |
| HEFAR | — Higher Education Facilities Authority Revenue |
| HFA | — Housing Finance Authority |
| HFFA | — Health Facilities Financing Authority |
| IBC | — Insured Bond Certificate |
| IDA | — Industrial Development Authority |
| IDAG | — Industrial Development Agency |
| IDR | — Industrial Development Revenue |
| KRW | — Republic of Korea Won |
| LIBOR | — London Interbank Offered Rate |
| LLC | — Limited Liability Company |
| LLP | — Limited Liability Partnership |
| MBIA | — Municipal Bond Insurance Association |
| MFHR | — Multi-Family Housing Revenue |
| MSTR | — Municipal Securities Trust Receipts |
| MUD | — Municipal Utility District |
| NATL-RE | — National Public Finance Guarantee Corporation |
| PCFA | — Pollution Control Finance Authority |
| PCR | — Pollution Control Revenue |
| PFA | — Public Finance Authority |
| PFFA | — Public Facilities Financing Authority |
| PFOTER | — Puttable Floating Option Tax-Exempt Receipts |
| plc | — Public Limited Company |
| PUTTER | — Puttable Tax-Exempt Receipts |
| R&D | — Research & Development |
| RDA | — Redevelopment Authority |
| RDFA | — Redevelopment Finance Authority |
| REIT | — Real Estate Investment Trust |
| ROC | — Reset Option Certificates |
| SAVRS | — Select Auction Variable Rate Securities |
| SBA | — Small Business Authority |
| SFHR | — Single Family Housing Revenue |
| SFMR | — Single Family Mortgage Revenue |
| SPDR | — Standard & Poor’s Depositary Receipts |
| STRIPS | — Separate Trading of Registered Interest and Principal Securities |
| TAN | — Tax Anticipation Notes |
| TIPS | — Treasury Inflation-Protected Securities |
| TRAN | — Tax Revenue Anticipation Notes |
| TCR | — Transferable Custody Receipts |
| TTFA | — Transportation Trust Fund Authority |
| TVA | — Tennessee Valley Authority |
| XLCA | — XL Capital Assurance |


FOR MORE INFORMATION
More information about Wells Fargo Advantage Funds is available free upon request. To obtain literature, please write, e-mail, visit the Fund’s Web site, or call:
Wells Fargo Advantage Funds
P.O. Box 8266
Boston, MA 02266-8266
E-mail: wfaf@wellsfargo.com
Web site: wellsfargoadvantagefunds.com
Individual investors: 1-800-222-8222
Retail investment professionals: 1-888-877-9275
Institutional investment professionals: 1-866-765-0778
This report and the financial statements contained herein are submitted for the general information of the shareholders of Wells Fargo Advantage Funds. If this report is used for promotional purposes, distribution of the report must be accompanied or preceded by a current prospectus. For a prospectus containing more complete information, including charges and expenses, call 1-800-222-8222 or visit the Fund’s Web site at wellsfargoadvantagefunds.com. Please consider the investment objectives, risks, charges, and expenses of the investment carefully before investing. This and other information about Wells Fargo Advantage Funds can be found in the current prospectus. Read the prospectus carefully before you invest or send money.
Wells Fargo Funds Management, LLC, a wholly owned subsidiary of Wells Fargo & Company, provides investment advisory and administrative services for Wells Fargo Advantage Funds. Other affiliates of Wells Fargo & Company provide subadvisory and other services for the Funds. The Funds are distributed by Wells Fargo Funds Distributor, LLC, Member FINRA/SIPC, an affiliate of Wells Fargo & Company.
NOT FDIC INSURED ¡ NO BANK GUARANTEE ¡ MAY LOSE VALUE
© 2012 Wells Fargo Funds Management, LLC. All rights reserved.
| | |
 | | 208992 05-12 SA233/SAR233 3-12 |

Wells Fargo Advantage
Special Mid Cap Value Fund

Semi-Annual Report
March 31, 2012

Reduce clutter. Save trees.
Sign up for electronic delivery of prospectuses and shareholder reports at wellsfargo.com/advantagedelivery
Contents
The views expressed and any forward-looking statements are as of March 31, 2012, unless otherwise noted, and are those of the Fund managers and/or Wells Fargo Funds Management, LLC. Discussions of individual securities, or the markets generally, or any Wells Fargo Advantage Fund are not intended as individual recommendations. Future events or results may vary significantly from those expressed in any forward-looking statements; the views expressed are subject to change at any time in response to changing circumstances in the market. Wells Fargo Funds Management, LLC, disclaims any obligation to publicly update or revise any views expressed or forward-looking statements.
NOT FDIC INSURED ¡ NO BANK GUARANTEE ¡ MAY LOSE VALUE

WELLS FARGO INVESTMENT HISTORY
| | |
| |
| 1932 | | Keystone creates one of the first mutual fund families. |
| |
| 1971 | | Wells Fargo & Company introduces one of the first institutional index funds. |
| |
| 1978 | | Wells Fargo applies Markowitz and Sharpe’s research on Modern Portfolio Theory to introduce one of the industry’s first Tactical Asset Allocation (TAA) models in institutional separately managed accounts. |
| |
| 1984 | | Wells Fargo Stagecoach Funds launches its first asset allocation fund. |
| |
| 1989 | | The Tactical Asset Allocation (TAA) Model is first applied to Wells Fargo’s asset allocation mutual funds. |
| |
| 1994 | | Wells Fargo introduces the LifePath Funds, one of the first suites of target date funds (now the Wells Fargo Advantage Dow Jones Target Date FundsSM). |
| |
| 1996 | | Evergreen Investments and Keystone Funds merge. |
| |
| 1997 | | Wells Fargo launches Wells Fargo Advantage WealthBuilder PortfoliosSM, a fund-of-funds suite of products that includes the use of quantitative models to shift assets among investment styles. |
| |
| 1999 | | Norwest Advantage Funds and Stagecoach Funds are reorganized into Wells Fargo Funds after the merger of Norwest and Wells Fargo. |
| |
| 2002 | | Evergreen Retail and Evergreen Institutional companies form the umbrella asset management company, Evergreen Investments. |
| |
| 2005 | | The integration of Strong Funds with Wells Fargo Funds creates Wells Fargo Advantage Funds, resulting in one of the top 20 mutual fund companies in the United States. |
| |
| 2006 | | Wells Fargo Advantage Funds relaunches the target date product line as Wells Fargo Advantage Dow Jones Target Date Funds. |
| |
| 2010 | | The mergers and reorganizations of Evergreen and Wells Fargo Advantage mutual funds are completed, unifying the families under the brand of Wells Fargo Advantage Funds. |
Wells Fargo Advantage Funds®
Wells Fargo Advantage Funds skillfully guides institutions, financial advisors, and individuals through the investment terrain to help them reach their financial objectives. Everything we do on behalf of investors is backed by our unique combination of qualifications.
Strength
Our organization is built on the standards of integrity and service established by our parent company—Wells Fargo & Company—more than 150 years ago. And, because we’re part of a highly diversified financial enterprise, we offer the depth of resources to help investors succeed.
Expertise
Our multi-boutique model offers investors access to the independent thinking of premier investment managers that have been chosen for their time-tested strategies. While each team specializes in a specific investment strategy, collectively they provide investors a wide choice of distinct investment styles. Our dedication to investment excellence doesn’t end with our expertise in manager selection—risk management, analysis, and rigorous ongoing review seek to ensure each manager’s investment process remains consistent.
Partnership
Our collaborative approach is built around understanding the needs and goals of our clients. By adhering to core principles of sound judgment and steady guidance, we support you through every stage of the investment decision process.
Carefully consider a fund’s investment objectives, risks, charges, and expenses before investing. For a current prospectus and, if available, a summary prospectus, containing this and other information, visit wellsfargoadvantagefunds.com. Read it carefully before investing.
Wells Fargo Funds Management, LLC, a wholly owned subsidiary of Wells Fargo & Company, provides investment advisory and administrative services for Wells Fargo Advantage Funds®. Other affiliates of Wells Fargo & Company provide subadvisory and other services for the Funds. The Funds are distributed by Wells Fargo Funds Distributor, LLC, Member FINRA/SIPC, an affiliate of Wells Fargo & Company.
“Dow Jones®” and “Dow Jones Target Date IndexesSM” are service marks of Dow Jones Trademark Holdings, LLC (“Dow Jones”), have been licensed to CME Group Index Services LLC (“CME Indexes”) and have been sublicensed for use for certain purposes by Global Index Advisors, Inc, and Wells Fargo Funds Management, LLC. The Wells Fargo Advantage Dow Jones Target Date FundsSM based on the Dow Jones Target Date IndexesSM, are not sponsored, endorsed, sold or promoted by Dow Jones, CME Indexes or their respective affiliates and none of them makes any representation regarding the advisability of investing in such product(s).
NOT FDIC INSURED ¡ NO BANK GUARANTEE ¡ MAY LOSE VALUE
Not part of the semi-annual report.
Wells Fargo Advantage Funds offers more than 110 mutual funds across a wide range of asset classes, representing over $213 billion in assets under management, as of March 31, 2012.
| | | | |
| Equity Funds | | | | |
Asia Pacific Fund | | Equity Value Fund | | Precious Metals Fund |
C&B Large Cap Value Fund | | Global Opportunities Fund | | Premier Large Company Growth Fund |
C&B Mid Cap Value Fund | | Growth Fund | | Small Cap Opportunities Fund |
Capital Growth Fund | | Index Fund | | Small Cap Value Fund |
Common Stock Fund | | International Equity Fund | | Small Company Growth Fund |
Disciplined U.S. Core Fund | | International Value Fund | | Small Company Value Fund |
Discovery Fund† | | Intrinsic Small Cap Value Fund | | Small/Mid Cap Core Fund |
Diversified Equity Fund | | Intrinsic Value Fund | | Small/Mid Cap Value Fund |
Diversified International Fund | | Intrinsic World Equity Fund | | Special Mid Cap Value Fund |
Diversified Small Cap Fund | | Large Cap Core Fund | | Special Small Cap Value Fund |
Emerging Growth Fund | | Large Cap Growth Fund | | Specialized Technology Fund |
Emerging Markets Equity Fund | | Large Company Value Fund | | Strategic Large Cap Growth Fund |
Endeavor Select Fund† | | Omega Growth Fund | | Traditional Small Cap Growth Fund |
Enterprise Fund† | | Opportunity Fund† | | Utility and Telecommunications Fund |
| Bond Funds | | | | |
Adjustable Rate Government Fund | | Inflation-Protected Bond Fund | | Short-Term Bond Fund |
California Limited-Term Tax-Free Fund | | Intermediate Tax/AMT-Free Fund | | Short-Term High Yield Bond Fund |
California Tax-Free Fund | | International Bond Fund | | Short-Term Municipal Bond Fund |
Colorado Tax-Free Fund | | Minnesota Tax-Free Fund | | Strategic Municipal Bond Fund |
Government Securities Fund | | Municipal Bond Fund | | Total Return Bond Fund |
High Income Fund | | North Carolina Tax-Free Fund | | Ultra Short-Term Income Fund |
High Yield Bond Fund | | Pennsylvania Tax-Free Fund | | Ultra Short-Term Municipal Income Fund |
Income Plus Fund | | Short Duration Government Bond Fund | | Wisconsin Tax-Free Fund |
| Asset Allocation Funds | | | | |
Absolute Return Fund | | WealthBuilder Equity Portfolio† | | Target 2020 Fund† |
Asset Allocation Fund | | WealthBuilder Growth Allocation Portfolio† | | Target 2025 Fund† |
Conservative Allocation Fund | | WealthBuilder Growth Balanced Portfolio† | | Target 2030 Fund† |
Diversified Capital Builder Fund | | WealthBuilder Moderate Balanced Portfolio† | | Target 2035 Fund† |
Diversified Income Builder Fund | | WealthBuilder Tactical Equity Portfolio† | | Target 2040 Fund† |
Growth Balanced Fund | | Target Today Fund† | | Target 2045 Fund† |
Index Asset Allocation Fund | | Target 2010 Fund† | | Target 2050 Fund† |
Moderate Balanced Fund | | Target 2015 Fund† | | Target 2055 Fund† |
WealthBuilder Conservative Allocation Portfolio† | | | | |
| Money Market Funds | | | | |
100% Treasury Money Market Fund | | Heritage Money Market Fund† | | National Tax-Free Money Market Fund |
California Municipal Money Market Fund | | Money Market Fund | | Prime Investment Money Market Fund |
Cash Investment Money Market Fund | | Municipal Cash Management Money Market Fund | | Treasury Plus Money Market Fund |
Government Money Market Fund | | Municipal Money Market Fund | | |
| Variable Trust Funds1 | | | | |
VT Discovery Fund† | | VT Intrinsic Value Fund | | VT Small Cap Growth Fund |
VT Index Asset Allocation Fund | | VT Omega Growth Fund | | VT Small Cap Value Fund |
VT International Equity Fund | | VT Opportunity Fund† | | VT Total Return Bond Fund |
An investment in a money market fund is not insured or guaranteed by the Federal Deposit Insurance Corporation or any other government agency. Although the Wells Fargo Advantage Money Market Funds seek to preserve the value of your investment at $1.00 per share, it is possible to lose money by investing in a money market fund.
| 1. | The Variable Trust Funds are generally available only through insurance company variable contracts. |
| † | In this report, the Wells Fargo Advantage Discovery FundSM, Wells Fargo Advantage Endeavor Select FundSM, Wells Fargo Advantage Enterprise FundSM, Wells Fargo Advantage Opportunity FundSM, Wells Fargo Advantage WealthBuilder Conservative Allocation PortfolioSM, Wells Fargo Advantage WealthBuilder Equity PortfolioSM, Wells Fargo Advantage WealthBuilder Growth Allocation PortfolioSM, Wells Fargo Advantage WealthBuilder Growth Balanced PortfolioSM, Wells Fargo Advantage WealthBuilder Moderate Balanced PortfolioSM, Wells Fargo Advantage WealthBuilder Tactical Equity PortfolioSM, Wells Fargo Advantage Dow Jones Target Today FundSM, Wells Fargo Advantage Dow Jones Target 2010 FundSM, Wells Fargo Advantage Dow Jones Target 2015 FundSM, Wells Fargo Advantage Dow Jones Target 2020 FundSM, Wells Fargo Advantage Dow Jones Target 2025 FundSM, Wells Fargo Advantage Dow Jones Target 2030 FundSM, Wells Fargo Advantage Dow Jones Target 2035 FundSM, Wells Fargo Advantage Dow Jones Target 2040 FundSM, Wells Fargo Advantage Dow Jones Target 2045 FundSM, Wells Fargo Advantage Dow Jones Target 2050 FundSM, Wells Fargo Advantage Dow Jones Target 2055 FundSM, Wells Fargo Advantage Heritage Money Market FundSM, Wells Fargo Advantage VT Discovery FundSM, and Wells Fargo Advantage VT Opportunity FundSM are referred to as the Discovery Fund, Endeavor Select Fund, Enterprise Fund, Opportunity Fund, WealthBuilder Conservative Allocation Portfolio, WealthBuilder Equity Portfolio, WealthBuilder Growth Allocation Portfolio, WealthBuilder Growth Balanced Portfolio, WealthBuilder Moderate Balanced Portfolio, WealthBuilder Tactical Equity Portfolio, Target Today Fund, Target 2010 Fund, Target 2015 Fund, Target 2020 Fund, Target 2025 Fund, Target 2030 Fund, Target 2035 Fund, Target 2040 Fund, Target 2045 Fund, Target 2050 Fund, Target 2055 Fund, Heritage Money Market Fund, VT Discovery Fund, and VT Opportunity Fund, respectively. |
Not part of the semi-annual report.
| | | | |
| 2 | | Wells Fargo Advantage Special Mid Cap Value Fund | | Letter to Shareholders |

Karla M. Rabusch,
President
Wells Fargo Advantage Funds
The period was marked by increased confidence that the U.S. economy was staging a fragile recovery, offset by continued concerns about the possible effect on the global economy of the ongoing European sovereign debt crisis—which began in Greece and later spread to the larger economies of Italy and Spain.
In contrast to worrisome data from the eurozone, U.S. economic data remained moderately positive.
Dear Valued Shareholder:
We’re pleased to offer you this semi-annual report for the Wells Fargo Advantage Special Mid Cap Value Fund for the six-month period that ended March 31, 2012. The period was marked by increased confidence that the U.S. economy was staging a fragile recovery, offset by continued concerns about the possible effect on the global economy of the ongoing European sovereign debt crisis—which began in Greece and later spread to the larger economies of Italy and Spain. U.S. stock indexes posted solid gains for the period.
Macroeconomic optimism faded as global growth slowed and worries rose.
Prior to the reporting period, investors worried that the global economy was returning to a recession. Although second quarter U.S. gross domestic product (GDP) grew at a 1.3% annual rate, it was below the levels set in 2010 and seemed to confirm that the economy had slowed from its previous pace. Moreover, the drawn-out political debate over the raising of the U.S. debt ceiling reduced confidence that the national government would be able to work together to address the country’s problems. Partly as a result, Standard & Poor’s rating service downgraded U.S. long-term debt from AAA to AA+1 in August 2011.
Throughout the six-month period, concerns about the eurozone sovereign debt situation returned to center stage. Investors became increasingly concerned that Greece would default on its debt, a scenario that only seemed more likely as eurozone leaders began to openly discuss a “voluntary” haircut on Greek debt for private investors. Because many eurozone banks owned Greek debt and many U.S. banks had financial ties to eurozone banks, investors worried about the effect of such an event on the financial systems and the global economy. In October 2011, market participants turned their attention to the debt burdens of Italy—which also had its credit rating downgraded by Standard & Poor’s—because even though it had a relatively modest budget deficit, it had a high amount of outstanding debt and a stagnant economy. French banks were heavily exposed to Italian debt, so Italy’s woes led to fears of a state bailout of French banks and a resulting increase in France’s required expenditures.
After months of rumors and worries, the Greek credit crisis was finally addressed in March 2012 when the country came to an agreement with its creditors allowing it to write down the principal on most of its bonds in exchange for increased financial austerity. By the end of the reporting period, the Greek agreement, combined with unprecedented support for eurozone banks by the European Central Bank (ECB), seemed to calm investor concerns, at least temporarily.
The U.S. economy reported relatively solid news.
In contrast to worrisome data from the eurozone, U.S. economic data remained moderately positive. After disappointing reports for first and second quarter GDP growth, reported GDP came in at a 1.8% annualized rate in the third quarter of 2011, and then accelerated to a 3.0% annualized rate in the fourth quarter. The major banks appeared to have taken steps toward repairing their balance sheets; in March, the Federal Reserve (Fed) announced that 15 of the 19 major banks had passed a “stress test,” in which the Fed attempted to gauge whether the banks
| 1. | The ratings indicated are from Standard & Poor’s. Standard & Poor’s rates the creditworthiness of bonds, ranging from AAA (highest) to D (lowest). Ratings from A to CCC may be modified by the addition of a plus (+) or minus (-) sign to show relative standing within the rating categories. |
| | | | | | |
| Letter to Shareholders | | Wells Fargo Advantage Special Mid Cap Value Fund | | | 3 | |
could survive a severe recession that included a 50% drop in the stock market and a 21% percent decline in housing prices.
Bank stocks rebounded strongly after the Fed released details of the stress test, but all major market sectors rallied as investors became increasingly confident that the U.S. would not return to recession. Small-cap stocks modestly outperformed large-cap stocks, and growth stocks outperformed value stocks by an even smaller margin.
Central banks continued to provide stimulus.
Throughout the reporting period, the Federal Open Market Committee (FOMC) kept its key interest rates effectively at zero in order to support the economy and financial system. In the second quarter of 2011, the Fed completed its second round of monetary stimulus, in which it had planned to purchase $600 billion in long-term U.S. Treasuries as well as reinvest an additional $250 billion to $300 billion in Treasuries with the proceeds from earlier investments. Even though the Fed seemed to rule out further monetary stimulus, it remained accommodative. In early August 2011, in response to extreme market volatility and signs of a weakening economy, the Fed announced its intention to keep interest rates low until at least late 2014.
At the beginning of the period, the ECB had a key rate of 1.50%, which it had raised in early 2011 in an attempt to keep inflation in check. However, in response to weakness in the southern European economies, the ECB lowered its key rate to 1.25% in November and to 1.0% in December. In August, after a sell-off in the sovereign debts of Spain and Italy, the ECB announced plans to purchase the debt of those countries in exchange for increased deficit reduction. The ECB also continued to provide virtually unlimited liquidity for banks, announcing a long-term refinancing operation (LTRO) in December through which it provided low cost, three-year loans to lenders.
We use time-tested investment strategies, even as many variables are at work in the market.
The full effect of the credit crisis remains unknown. Elevated unemployment and debt defaults continue to pressure consumers and businesses alike.
In our experience strict adherence to time-tested investment strategies has its rewards. As a whole, Wells Fargo Advantage Funds represents investments across a range of asset classes and investment styles, giving you an opportunity to create a diversified investment portfolio. While diversification may not prevent losses in a downturn, we believe it helps in managing risk.
| | | | |
| 4 | | Wells Fargo Advantage Special Mid Cap Value Fund | | Letter to Shareholders |
Thank you for choosing to invest with Wells Fargo Advantage Funds. We appreciate your confidence in us and remain committed to helping you meet your financial needs. For current information about your fund investments, contact your investment professional, visit our Web site at wellsfargoadvantagefunds.com, or call us directly at 1-800-222-8222. We are available 24 hours a day, 7 days a week.
Sincerely,

Karla M. Rabusch
President
Wells Fargo Advantage Funds
Notice to Shareholders
The Board of Trustees for Wells Fargo Advantage Funds has unanimously approved the following modifications to certain net asset value (NAV) waiver privileges and commission schedules:
| | n | | Effective May 1, 2012, automatic investment plan (AIP) purchases and proceeds received from systematic withdrawals will no longer qualify for NAV repurchase privileges. | |
| | n | | Effective May 1, 2012, discretionary rights to waive the upfront commission for Class C and “jumbo” Class A share purchases will no longer be granted to broker/dealers. However, we will continue to waive the Class C shares contingent deferred sales charge for redemptions by employer-sponsored retirement plans where the dealer of record waived its commission at the time of purchase. | |
| | n | | Effective July 31, 2012, NAV purchase privileges for former Evergreen Class IS and Class R shareholders are being modified to remove the ability to purchase Class A shares at NAV unless those shares are held directly with the Fund on or after July 31, 2012. | |
Please contact your investment professional or call us directly at 1-800-222-8222 if you have any questions on this Notice to Shareholders.
| | | | | | |
| Performance Highlights (Unaudited) | | Wells Fargo Advantage Special Mid Cap Value Fund | | | 5 | |
INVESTMENT OBJECTIVE
The Fund seeks long-term capital appreciation.
ADVISER
Wells Fargo Funds Management, LLC
SUB-ADVISER
Wells Capital Management, Incorporated
PORTFOLIO MANAGERS
James M. Tringas, CFA, CPA
Bryant VanCronkhite, CFA, CPA
FUND INCEPTION
December 31, 1998
| | | | |
TEN LARGEST EQUITY HOLDINGS1 (AS OF MARCH 31, 2012) | | | |
Allstate Corporation | | | 3.14% | |
CIGNA Corporation | | | 2.85% | |
Tyco International Limited | | | 2.57% | |
Paccar Incorporated | | | 2.54% | |
Emcor Group Incorporated | | | 2.43% | |
Arch Capital Group Limited | | | 2.34% | |
DaVita Incorporated | | | 2.31% | |
Northern Trust Corporation | | | 2.29% | |
Sysco Corporation | | | 2.24% | |
IAC InterActive Corporation | | | 2.23% | |
| | |
SECTOR DISTRIBUTION2 (AS OF MARCH 31, 2012) |
|
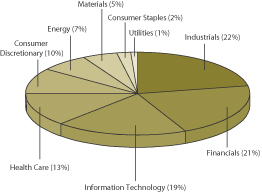 |
| 1. | The ten largest equity holdings are calculated based on the value of the securities divided by total net assets of the Fund. Holdings are subject to change and may have changed since the date specified. |
| 2. | Sector distribution is subject to change and is calculated based on the total long-term investments of the Fund. |
| | | | |
| 6 | | Wells Fargo Advantage Special Mid Cap Value Fund | | Performance Highlights (Unaudited) |
AVERAGE ANNUAL TOTAL RETURN3 (%) (AS OF MARCH 31, 2012)
| | | | | | | | | | | | | | | | | | | | | | | | | | | | | | | | | | | | | | | | | | | | |
| | | | | | Including Sales Charge | | | Excluding Sales Charge | | | Expense Ratios4 | |
| | | Inception Date | | | 6 Months* | | | 1 Year | | | 5 Year | | | 10 Year | | | 6 Months* | | | 1 Year | | | 5 Year | | | 10 Year | | | Gross | | | Net5 | |
Class A (WFPAX) | | | 07/31/2007 | | | | 19.79 | | | | (4.32 | ) | | | 1.20 | | | | 6.82 | | | | 27.11 | | | | 1.51 | | | | 2.41 | | | | 7.46 | | | | 1.30% | | | | 1.26% | |
Class C (WFPCX) | | | 07/31/2007 | | | | 25.59 | | | | (0.28 | ) | | | 1.66 | | | | 6.73 | | | | 26.59 | | | | 0.72 | | | | 1.66 | | | | 6.73 | | | | 2.05% | | | | 2.01% | |
Administrator Class (WFMDX) | | | 04/08/2005 | | | | | | | | | | | | | | | | | | | | 27.19 | | | | 1.61 | | | | 2.54 | | | | 7.56 | | | | 1.14% | | | | 1.14% | |
Institutional Class (WFMIX) | | | 04/08/2005 | | | | | | | | | | | | | | | | | | | | 27.32 | | | | 1.88 | | | | 2.79 | | | | 7.74 | | | | 0.87% | | | | 0.87% | |
Investor Class (SMCDX) | | | 12/31/1998 | | | | | | | | | | | | | | | | | | | | 27.05 | | | | 1.46 | | | | 2.35 | | | | 7.42 | | | | 1.37% | | | | 1.32% | |
Russell Midcap® Value Index6 | | | | | | | | | | | | | | | | | | | | | | | 26.30 | | | | 2.28 | | | | 1.26 | | | | 8.02 | | | | | | | | | |
| * | Returns for periods of less than one year are not annualized. |
Figures quoted represent past performance, which is no guarantee of future results and do not reflect the deduction of taxes that a shareholder may pay on fund distributions or the redemption of fund shares. Investment return and principal value of an investment will fluctuate so that an investor’s shares, when redeemed, may be worth more or less than their original cost. Performance shown without sales charges would be lower if sales charges were reflected. Current performance may be lower or higher than the performance data quoted and assumes the reinvestment of dividends and capital gains. Current month-end performance is available on the Fund’s Web site – wellsfargoadvantagefunds.com
Index returns do not include transaction costs associated with buying and selling securities, any mutual fund fees or expenses or any taxes. It is not possible to invest directly in an index.
For Class A shares, the maximum front-end sales charge is 5.75%. For Class C shares, the maximum contingent deferred sales charge is 1.00%. Performance including sales charge assumes the sales charge for the corresponding time period. Administrator Class, Institutional Class and Investor Class shares are sold without a front-end sales charge or contingent deferred sales charge.
Please keep in mind that high double-digit returns were primarily achieved during favorable market conditions. You should not expect that such favorable returns can be consistently achieved. A Fund’s performance, especially for very short time periods, should not be the sole factor in making your investment decision.
Stock fund values fluctuate in response to the activities of individual companies and general market and economic conditions. Smaller-company stocks tend to be more volatile and less liquid than those of larger companies. Consult the Fund’s prospectus for additional information on these and other risks.
| 3. | Historical performance shown for Class C shares prior to their inception reflects the performance of the Investor Class shares, adjusted to reflect the higher expenses applicable to Class C shares. Historical performance shown for Class A, Administrator Class and Institutional Class shares prior to their inception reflects the performance of the Investor Class shares, and includes the higher expenses applicable to the Investor Class shares. If these expenses had not been included, returns would be higher. |
| 4. | Reflects the expense ratios as stated in the most recent prospectuses. |
| 5. | The Adviser has committed through July 18, 2013 to waive fees and/or reimburse expenses to the extent necessary to cap the Fund’s Total Annual Fund Operating Expenses After Fee Waiver, excluding certain expenses, at 1.25% for Class A, 2.00% for Class C, 1.14% for Administrator Class, 0.87% for Institutional Class and 1.31% for Investor Class. Without this cap, the Fund’s returns would have been lower. |
| 6. | The Russell Midcap® Value Index measures the performance of those Russell Midcap companies with lower price-to-book ratios and lower forecasted growth values. The stocks are also members of the Russell 1000® Value Index. You cannot invest directly in an index. |
| | | | | | |
| Fund Expenses (Unaudited) | | Wells Fargo Advantage Special Mid Cap Value Fund | | | 7 | |
As a shareholder of the Fund, you incur two types of costs: (1) transaction costs, including sales charges (loads) on purchase payments and contingent deferred sales charges (if any) on redemptions and (2) ongoing costs, including management fees; distribution (12b-1) and/or shareholder service fees; and other Fund expenses. This example is intended to help you understand your ongoing costs (in dollars) of investing in the Fund and to compare these costs with the ongoing costs of investing in other mutual funds.
The example is based on an investment of $1,000 invested at the beginning of the six-month period and held for the entire period from October 1, 2011 to March 31, 2012.
Actual Expenses
The “Actual” line of the table below provides information about actual account values and actual expenses. You may use the information in this line, together with the amount you invested, to estimate the expenses that you paid over the period. Simply divide your account value by $1,000 (for example, an $8,600 account value divided by $1,000 = 8.6), then multiply the result by the number in the “Actual” line under the heading entitled “Expenses Paid During Period” for your applicable class of shares to estimate the expenses you paid on your account during this period.
Hypothetical Example for Comparison Purposes
The “Hypothetical” line of the table below provides information about hypothetical account values and hypothetical expenses based on the Fund’s actual expense ratio and an assumed rate of return of 5% per year before expenses, which is not the Fund’s actual return. The hypothetical account values and expenses may not be used to estimate the actual ending account balance or expenses you paid for the period. You may use this information to compare the ongoing costs of investing in the Fund and other funds. To do so, compare this 5% hypothetical example with the 5% hypothetical examples that appear in the shareholder reports of the other funds.
Please note that the expenses shown in the table are meant to highlight your ongoing costs only and do not reflect any transactional costs, such as sales charges (loads) and contingent deferred sales charges. Therefore, the “Hypothetical” line of the table is useful in comparing ongoing costs only, and will not help you determine the relative total costs of owning different funds. In addition, if these transactional costs were included, your costs would have been higher.
| | | | | | | | | | | | | | | | |
| | | Beginning
Account Value
10-01-2011 | | | Ending
Account Value
03-31-2012 | | | Expenses
Paid During
the Period1 | | | Net Annual
Expense Ratio | |
Class A | | | | | | | | | | | | | | | | |
Actual | | $ | 1,000.00 | | | $ | 1,271.10 | | | $ | 7.10 | | | | 1.25 | % |
Hypothetical (5% return before expenses) | | $ | 1,000.00 | | | $ | 1,018.75 | | | $ | 6.31 | | | | 1.25 | % |
Class C | | | | | | | | | | | | | | | | |
Actual | | $ | 1,000.00 | | | $ | 1,265.91 | | | $ | 11.33 | | | | 2.00 | % |
Hypothetical (5% return before expenses) | | $ | 1,000.00 | | | $ | 1,015.00 | | | $ | 10.08 | | | | 2.00 | % |
Administrator Class | | | | | | | | | | | | | | | | |
Actual | | $ | 1,000.00 | | | $ | 1,271.87 | | | $ | 6.42 | | | | 1.13 | % |
Hypothetical (5% return before expenses) | | $ | 1,000.00 | | | $ | 1,019.35 | | | $ | 5.70 | | | | 1.13 | % |
Institutional Class | | | | | | | | | | | | | | | | |
Actual | | $ | 1,000.00 | | | $ | 1,273.20 | | | $ | 4.94 | | | | 0.87 | % |
Hypothetical (5% return before expenses) | | $ | 1,000.00 | | | $ | 1,020.65 | | | $ | 4.39 | | | | 0.87 | % |
Investor Class | | | | | | | | | | | | | | | | |
Actual | | $ | 1,000.00 | | | $ | 1,270.46 | | | $ | 7.44 | | | | 1.31 | % |
Hypothetical (5% return before expenses) | | $ | 1,000.00 | | | $ | 1,018.45 | | | $ | 6.61 | | | | 1.31 | % |
| 1. | Expenses paid is equal to the annualized expense ratio of each class multiplied by the average account value over the period, multiplied by the number of days in the most recent fiscal half-year divided by the number of days in the fiscal year (to reflect the one-half year period). |
| | | | |
| 8 | | Wells Fargo Advantage Special Mid Cap Value Fund | | Portfolio of Investments—March 31, 2012 (Unaudited) |
| | | | | | | | | | | | |
| Security Name | | | | | | Shares | | | Value | |
| | | | | | | | | | | | |
| | | | |
Common Stocks: 97.05% | | | | | | | | | | | | |
| | | | |
Consumer Discretionary: 9.76% | | | | | | | | | | | | |
| | | | |
| Auto Components: 1.97% | | | | | | | | | | | | |
Lear Corporation | | | | | | | 234,000 | | | $ | 10,878,660 | |
| | | | | | | | | | | | |
| | | | |
| Hotels, Restaurants & Leisure: 1.66% | | | | | | | | | | | | |
WMS Industries Incorporated † | | | | | | | 385,900 | | | | 9,157,407 | |
| | | | | | | | | | | | |
| | | | |
| Household Durables: 1.45% | | | | | | | | | | | | |
Mohawk Industries Incorporated † | | | | | | | 120,271 | | | | 7,999,224 | |
| | | | | | | | | | | | |
| | | | |
| Media: 1.26% | | | | | | | | | | | | |
Interpublic Group of Companies Incorporated « | | | | | | | 607,100 | | | | 6,927,011 | |
| | | | | | | | | | | | |
| | | | |
| Multiline Retail: 1.69% | | | | | | | | | | | | |
Kohl’s Corporation | | | | | | | 186,800 | | | | 9,345,604 | |
| | | | | | | | | | | | |
| | | | |
| Specialty Retail: 1.73% | | | | | | | | | | | | |
Best Buy Company Incorporated « | | | | | | | 225,200 | | | | 5,332,736 | |
Guess Incorporated | | | | | | | 135,000 | | | | 4,218,750 | |
| | | | |
| | | | | | | | | | | 9,551,486 | |
| | | | | | | | | | | | |
| | | | |
Consumer Staples: 2.24% | | | | | | | | | | | | |
| | | | |
| Food & Staples Retailing: 2.24% | | | | | | | | | | | | |
Sysco Corporation « | | | | | | | 413,000 | | | | 12,332,180 | |
| | | | | | | | | | | | |
| | | | |
Energy: 6.47% | | | | | | | | | | | | |
| | | | |
| Energy Equipment & Services: 2.02% | | | | | | | | | | | | |
Ensco International plc ADR | | | | | | | 75,366 | | | | 3,989,122 | |
Nabors Industries Limited † | | | | | | | 407,604 | | | | 7,128,994 | |
| | | | |
| | | | | | | | | | | 11,118,116 | |
| | | | | | | | | | | | |
| | | | |
| Oil, Gas & Consumable Fuels: 4.45% | | | | | | | | | | | | |
Cimarex Energy Company « | | | | | | | 123,910 | | | | 9,351,488 | |
Comstock Resources Incorporated †« | | | | | | | 303,719 | | | | 4,807,872 | |
Patterson-UTI Energy Incorporated | | | | | | | 178,300 | | | | 3,082,807 | |
Southwestern Energy Company † | | | | | | | 239,400 | | | | 7,325,640 | |
| | | | |
| | | | | | | | | | | 24,567,807 | |
| | | | | | | | | | | | |
| | | | |
Financials: 20.60% | | | | | | | | | | | | |
| | | | |
| Capital Markets: 2.29% | | | | | | | | | | | | |
Northern Trust Corporation | | | | | | | 265,800 | | | | 12,612,210 | |
| | | | | | | | | | | | |
| | | | |
| Commercial Banks: 4.01% | | | | | | | | | | | | |
CapitalSource Incorporated | | | | | | | 1,351,891 | | | | 8,922,481 | |
KeyCorp Incorporated | | | | | | | 540,600 | | | | 4,595,100 | |
UMB Financial Corporation « | | | | | | | 192,780 | | | | 8,624,013 | |
| | | | |
| | | | | | | | | | | 22,141,594 | |
| | | | | | | | | | | | |
The accompanying notes are an integral part of these financial statements.
| | | | | | |
| Portfolio of Investments—March 31, 2012 (Unaudited) | | Wells Fargo Advantage Special Mid Cap Value Fund | | | 9 | |
| | | | | | | | | | | | |
| Security Name | | | | | | Shares | | | Value | |
| | | | | | | | | | | | |
| | | | |
| Insurance: 14.30% | | | | | | | | | | | | |
Allstate Corporation | | | | | | | 526,000 | | | $ | 17,315,920 | |
Arch Capital Group Limited † | | | | | | | 347,100 | | | | 12,926,004 | |
Brown & Brown Incorporated « | | | | | | | 258,903 | | | | 6,156,713 | |
Everest Reinsurance Group Limited | | | | | | | 19,700 | | | | 1,822,644 | |
Fidelity National Title Group Incorporated | | | | | | | 391,147 | | | | 7,052,380 | |
Stewart Information Services Corporation | | | | | | | 517,800 | | | | 7,357,938 | |
Validus Holdings Limited | | | | | | | 297,969 | | | | 9,222,141 | |
W.R. Berkley Corporation « | | | | | | | 291,900 | | | | 10,543,428 | |
Willis Group Holdings plc | | | | | | | 185,300 | | | | 6,481,794 | |
| | | | |
| | | | | | | | | | | 78,878,962 | |
| | | | | | | | | | | | |
| | | | |
Health Care: 12.60% | | | | | | | | | | | | |
| | | | |
| Health Care Equipment & Supplies: 3.60% | | | | | | | | | | | | |
Becton Dickinson & Company | | | | | | | 131,100 | | | | 10,179,915 | |
CareFusion Corporation † | | | | | | | 373,800 | | | | 9,692,634 | |
| | | | |
| | | | | | | | | | | 19,872,549 | |
| | | | | | | | | | | | |
| | | | |
| Health Care Providers & Services: 9.00% | | | | | | | | | | | | |
CIGNA Corporation | | | | | | | 319,675 | | | | 15,743,994 | |
DaVita Incorporated †« | | | | | | | 141,100 | | | | 12,722,987 | |
Omnicare Incorporated « | | | | | | | 313,955 | | | | 11,167,379 | |
Patterson Companies Incorporated | | | | | | | 299,400 | | | | 9,999,960 | |
| | | | |
| | | | | | | | | | | 49,634,320 | |
| | | | | | | | | | | | |
| | | | |
Industrials: 21.27% | | | | | | | | | | | | |
| | | | |
| Building Products: 1.88% | | | | | | | | | | | | |
Quanex Building Products Corporation | | | | | | | 486,230 | | | | 8,572,235 | |
Simpson Manufacturing Company Incorporated | | | | | | | 56,100 | | | | 1,809,225 | |
| | | | |
| | | | | | | | | | | 10,381,460 | |
| | | | | | | | | | | | |
| | | | |
| Commercial Services & Supplies: 4.23% | | | | | | | | | | | | |
Avery Dennison Corporation | | | | | | | 348,700 | | | | 10,506,331 | |
GEO Group Incorporated †« | | | | | | | 598,707 | | | | 11,381,420 | |
Sykes Enterprises Incorporated † | | | | | | | 91,800 | | | | 1,450,440 | |
| | | | |
| | | | | | | | | | | 23,338,191 | |
| | | | | | | | | | | | |
| | | | |
| Construction & Engineering: 2.43% | | | | | | | | | | | | |
Emcor Group Incorporated | | | | | | | 483,528 | | | | 13,403,396 | |
| | | | | | | | | | | | |
| | | | |
| Electrical Equipment: 2.55% | | | | | | | | | | | | |
GrafTech International Limited † | | | | | | | 724,700 | | | | 8,652,918 | |
Regal-Beloit Corporation « | | | | | | | 82,300 | | | | 5,394,765 | |
| | | | |
| | | | | | | | | | | 14,047,683 | |
| | | | | | | | | | | | |
| | | | |
| Industrial Conglomerates: 2.57% | | | | | | | | | | | | |
Tyco International Limited | | | | | | | 252,700 | | | | 14,196,686 | |
| | | | | | | | | | | | |
The accompanying notes are an integral part of these financial statements.
| | | | |
| 10 | | Wells Fargo Advantage Special Mid Cap Value Fund | | Portfolio of Investments—March 31, 2012 (Unaudited) |
| | | | | | | | | | | | |
| Security Name | | | | | | Shares | | | Value | |
| | | | | | | | | | | | |
| | | | |
| Machinery: 4.27% | | | | | | | | | | | | |
Gardner Denver Incorporated | | | | | | | 4,300 | | | $ | 270,986 | |
Ingersoll-Rand plc « | | | | | | | 224,200 | | | | 9,270,670 | |
Paccar Incorporated « | | | | | | | 299,500 | | | | 14,025,585 | |
| | | | |
| | | | | | | | | | | 23,567,241 | |
| | | | | | | | | | | | |
| | | | |
| Professional Services: 1.52% | | | | | | | | | | | | |
Manpower Incorporated | | | | | | | 176,800 | | | | 8,375,016 | |
| | | | | | | | | | | | |
| | | | |
| Transportation Infrastructure: 1.82% | | | | | | | | | | | | |
Macquarie Infrastucture Company LLC | | | | | | | 304,414 | | | | 10,042,618 | |
| | | | | | | | | | | | |
| | | | |
Information Technology: 17.99% | | | | | | | | | | | | |
| | | | |
| Communications Equipment: 3.27% | | | | | | | | | | | | |
Juniper Networks Incorporated † | | | | | | | 413,600 | | | | 9,463,168 | |
Riverbed Technology Incorporated † | | | | | | | 306,000 | | | | 8,592,480 | |
| | | | |
| | | | | | | | | | | 18,055,648 | |
| | | | | | | | | | | | |
| | | | |
| Computers & Peripherals: 1.17% | | | | | | | | | | | | |
SanDisk Corporation † | | | | | | | 129,900 | | | | 6,441,741 | |
| | | | | | | | | | | | |
| | | | |
| Electronic Equipment, Instruments & Components: 4.06% | | | | | | | | | | | | |
Agilent Technologies Incorporated | | | | | | | 131,000 | | | | 5,830,810 | |
Ingram Micro Incorporated Class A † | | | | | | | 503,393 | | | | 9,342,974 | |
Vishay Intertechnology Incorporated † | | | | | | | 591,000 | | | | 7,186,560 | |
| | | | |
| | | | | | | | | | | 22,360,344 | |
| | | | | | | | | | | | |
| | | | |
| Internet Software & Services: 2.23% | | | | | | | | | | | | |
IAC InterActive Corporation | | | | | | | 250,572 | | | | 12,300,579 | |
| | | | | | | | | | | | |
| | | | |
| IT Services: 1.79% | | | | | | | | | | | | |
Broadridge Financial Solutions Incorporated | | | | | | | 336,115 | | | | 8,036,510 | |
Global Payments Incorporated | | | | | | | 38,700 | | | | 1,830,811 | |
| | | | |
| | | | | | | | | | | 9,867,321 | |
| | | | | | | | | | | | |
| | | | |
| Semiconductors & Semiconductor Equipment: 5.47% | | | | | | | | | | | | |
Applied Materials Incorporated | | | | | | | 821,800 | | | | 10,223,192 | |
ATMI Incorporated † | | | | | | | 408,380 | | | | 9,515,254 | |
ON Semiconductor Corporation † | | | | | | | 1,160,100 | | | | 10,452,501 | |
| | | | |
| | | | | | | | | | | 30,190,947 | |
| | | | | | | | | | | | |
| | | | |
Materials: 4.77% | | | | | | | | | | | | |
| | | | |
| Containers & Packaging: 1.71% | | | | | | | | | | | | |
Silgan Holdings Incorporated | | | | | | | 213,083 | | | | 9,418,269 | |
| | | | | | | | | | | | |
| | | | |
| Metals & Mining: 3.06% | | | | | | | | | | | | |
Allegheny Technologies Incorporated | | | | | | | 181,022 | | | | 7,452,676 | |
IAMGOLD Corporation | | | | | | | 21,100 | | | | 280,248 | |
Royal Gold Incorporated | | | | | | | 21,600 | | | | 1,408,752 | |
The accompanying notes are an integral part of these financial statements.
| | | | | | |
| Portfolio of Investments—March 31, 2012 (Unaudited) | | Wells Fargo Advantage Special Mid Cap Value Fund | | | 11 | |
| | | | | | | | | | | | | | |
| Security Name | | | | | | | Shares | | | Value | |
| | | | | | | | | | | | | | |
| | | | |
| Metals & Mining (continued) | | | | | | | | | | | | | | |
Steel Dynamics Incorporated | | | | | | | | | 410,200 | | | $ | 5,964,308 | |
Walter Industries Incorporated | | | | | | | | | 29,800 | | | | 1,764,458 | |
| | | | |
| | | | | | | | | | | | | 16,870,442 | |
| | | | | | | | | | | | | | |
| | | | |
Utilities: 1.35% | | | | | | | | | | | | | | |
| | | | |
| Electric Utilities: 1.35% | | | | | | | | | | | | | | |
Westar Energy Incorporated | | | | | | | | | 266,665 | | | | 7,447,953 | |
| | | | | | | | | | | | | | |
| | | | |
Total Common Stocks (Cost $457,408,600) | | | | | | | | | | | | | 535,322,665 | |
| | | | | | | | | | | | | | |
| | | | |
| | | | | | | | Principal | | | | |
| | | | |
Other: 0.21% | | | | | | | | | | | | | | |
Gryphon Funding Limited, Pass-Through Entity (a)(i)(v) | | | | | | | | $ | 1,535,893 | | | | 430,050 | |
VFNC Corporation, Pass-Through Entity, 0.24% (a)(i)(v)±144A | | | | | | | | | 1,699,422 | | | | 713,757 | |
| | | | |
Total Other (Cost $468,351) | | | | | | | | | | | | | 1,143,807 | |
| | | | | | | | | | | | | | |
| | | | |
| | | Yield | | | | | Shares | | | | |
| | | | |
Short-Term Investments: 14.43% | | | | | | | | | | | | | | |
| | | | |
| Investment Companies: 14.43% | | | | | | | | | | | | | | |
Wells Fargo Advantage Cash Investment Money Market Fund, Select Class (l)(u) | | | 0.10 | % | | | | | 19,005,681 | | | | 19,005,681 | |
Wells Fargo Securities Lending Cash Investment, LLC (v)(l)(u)(r) | | | 0.18 | | | | | | 60,607,484 | | | | 60,607,484 | |
| | | | |
Total Short-Term Investments (Cost $79,613,165) | | | | | | | | | | | | | 79,613,165 | |
| | | | | | | | | | | | | | |
| | | | | | | | |
| Total Investments in Securities | | | | | | | | |
| (Cost $537,490,116) * | | | 111.69 | % | | | 616,079,637 | |
Other Assets and Liabilities, Net | | | (11.69 | ) | | | (64,502,789 | ) |
| | | | | | | | |
| Total Net Assets | | | 100.00 | % | | $ | 551,576,848 | |
| | | | | | | | |
| † | Non-income earning security |
| « | All or a portion of this security is on loan. |
| (a) | Security is fair valued by the Management Valuation Team, and in certain instances by the Board of Trustees, in accordance with procedures approved by the Board of Trustees. |
| (v) | Security represents investment of cash collateral received from securities on loan. |
| ± | Variable rate investment |
| 144A | Security that may be resold to “qualified institutional buyers” under Rule 144A or security offered pursuant to Section 4(2) of the Securities Act of 1933, as amended. |
| (l) | Investment in an affiliate |
| (u) | Rate shown is the 7-day annualized yield at period end. |
| (r) | The investment company is exempt from registration under Section 3(c)(7) of the 1940 Act. |
| * | Cost for federal income tax purposes is $540,372,430 and net unrealized appreciation (depreciation) consists of: |
| | | | |
Gross unrealized appreciation | | $ | 85,059,843 | |
Gross unrealized depreciation | | | (9,352,636 | ) |
| | | | |
Net unrealized appreciation | | $ | 75,707,207 | |
The accompanying notes are an integral part of these financial statements.
| | | | |
| 12 | | Wells Fargo Advantage Special Mid Cap Value Fund | | Statement of Assets and Liabilities—March 31, 2012 (Unaudited) |
| | | | |
| | | | |
| |
Assets | | | | |
Investments | | | | |
In unaffiliated securities (including securities on loan), at value (see cost below) | | $ | 536,466,472 | |
In affiliated securities, at value (see cost below) | | | 79,613,165 | |
| | | | |
Total investments, at value (see cost below) | | | 616,079,637 | |
Receivable for investments sold | | | 1,152,056 | |
Receivable for Fund shares sold | | | 285,830 | |
Receivable for dividends | | | 578,342 | |
Receivable for securities lending income | | | 6,249 | |
Prepaid expenses and other assets | | | 26,102 | |
| | | | |
Total assets | | | 618,128,216 | |
| | | | |
| |
Liabilities | | | | |
Payable for investments purchased | | | 2,671,893 | |
Payable for Fund shares redeemed | | | 2,156,812 | |
Payable upon receipt of securities loaned | | | 61,075,835 | |
Advisory fee payable | | | 329,109 | |
Distribution fees payable | | | 1,903 | |
Due to other related parties | | | 130,180 | |
Accrued expenses and other liabilities | | | 185,636 | |
| | | | |
Total liabilities | | | 66,551,368 | |
| | | | |
Total net assets | | $ | 551,576,848 | |
| | | | |
| |
NET ASSETS CONSIST OF | | | | |
Paid-in capital | | $ | 517,748,339 | |
Undistributed net investment income | | | 163,817 | |
Accumulated net realized losses on investments | | | (44,924,829 | ) |
Net unrealized gains on investments | | | 78,589,521 | |
| | | | |
Total net assets | | $ | 551,576,848 | |
| | | | |
| |
COMPUTATION OF NET ASSET VALUE AND OFFERING PRICE PER SHARE1 | | | | |
Net assets – Class A | | $ | 11,340,772 | |
Shares outstanding – Class A | | | 500,943 | |
Net asset value per share – Class A | | | $22.64 | |
Maximum offering price per share – Class A2 | | | $24.02 | |
Net assets – Class C | | $ | 2,962,064 | |
Shares outstanding – Class C | | | 132,950 | |
Net asset value per share – Class C | | | $22.28 | |
Net assets – Administrator Class | | $ | 63,626,858 | |
Shares outstanding – Administrator Class | | | 2,780,045 | |
Net asset value per share – Administrator Class | | | $22.89 | |
Net assets – Institutional Class | | $ | 133,870,744 | |
Shares outstanding – Institutional Class | | | 5,842,272 | |
Net asset value per share – Institutional Class | | | $22.91 | |
Net assets – Investor Class | | $ | 339,776,410 | |
Shares outstanding – Investor Class | | | 14,838,854 | |
Net asset value per share – Investor Class | | | $22.90 | |
| |
Investments in unaffiliated securities, at cost | | $ | 457,876,951 | |
| | | | |
Investments in affiliated securities, at cost | | $ | 79,613,165 | |
| | | | |
Total investments, at cost | | $ | 537,490,116 | |
| | | | |
Securities on loan, at value | | $ | 59,620,920 | |
| | | | |
| 1. | The Fund has an unlimited number of authorized shares. |
| 2. | Maximum offering price is computed as 100/94.25 of net asset value. On investments of $50,000 or more, the offering price is reduced. |
The accompanying notes are an integral part of these financial statements.
| | | | | | |
| Statement of Operations—Six Months Ended March 31, 2012 (Unaudited) | | Wells Fargo Advantage Special Mid Cap Value Fund | | | 13 | |
| | | | |
| | | | |
| |
Investment income | | | | |
Dividends | | $ | 4,504,666 | |
Securities lending income, net | | | 58,714 | |
Income from affiliated securities | | | 13,787 | |
| | | | |
Total investment income | | | 4,577,167 | |
| | | | |
| |
Expenses | | | | |
Advisory fee | | | 1,998,110 | |
Administration fees | | | | |
Fund level | | | 143,404 | |
Class A | | | 14,214 | |
Class C | | | 2,835 | |
Administrator Class | | | 32,044 | |
Institutional Class | | | 49,382 | |
Investor Class | | | 615,380 | |
Shareholder servicing fees | | | | |
Class A | | | 13,667 | |
Class C | | | 2,726 | |
Administrator Class | | | 77,314 | |
Investor Class | | | 466,198 | |
Distribution fees | | | | |
Class C | | | 8,178 | |
Custody and accounting fees | | | 19,846 | |
Professional fees | | | 24,079 | |
Registration fees | | | 36,938 | |
Shareholder report expenses | | | 45,024 | |
Trustees’ fees and expenses | | | 5,589 | |
Other fees and expenses | | | 10,074 | |
| | | | |
Total expenses | | | 3,565,002 | |
Less: Fee waivers and/or expense reimbursements | | | (131,999 | ) |
| | | | |
Net expenses | | | 3,433,003 | |
| | | | |
Net investment income | | | 1,144,164 | |
| | | | |
| |
REALIZED AND UNREALIZED GAINS (LOSSES) ON INVESTMENTS | | | | |
Net realized gains on investments | | | 11,685,582 | |
Net change in unrealized gains (losses) on investments | | | 123,205,847 | |
| | | | |
Net realized and unrealized gains (losses) on investments | | | 134,891,429 | |
| | | | |
Net increase in net assets resulting from operations | | $ | 136,035,593 | |
| | | | |
The accompanying notes are an integral part of these financial statements.
| | | | |
| 14 | | Wells Fargo Advantage Special Mid Cap Value Fund | | Statements of Changes in Net Assets |
| | | | | | | | | | | | | | | | |
| | | Six Months Ended
March 31, 2012
(Unaudited) | | | Year Ended
September 30, 2011 | |
| | | | |
Operations | | | | | | | | | | | | | | | | |
Net investment income | | | | | | $ | 1,144,164 | | | | | | | $ | 1,303,413 | |
Net realized gains on investments | | | | | | | 11,685,582 | | | | | | | | 65,371,085 | |
Net change in unrealized gains (losses) on investments | | | | | | | 123,205,847 | | | | | | | | (71,257,180 | ) |
| | | | | | | | | | | | | | | | |
Net increase (decrease) in net assets resulting from operations | | | | | | | 136,035,593 | | | | | | | | (4,582,682 | ) |
| | | | | | | | | | | | | | | | |
| | | | |
Distributions to shareholders from | | | | | | | | | | | | | | | | |
Net investment income | | | | | | | | | | | | | | | | |
Class A | | | | | | | (16,595 | ) | | | | | | | (152,090 | ) |
Class C | | | | | | | 0 | | | | | | | | (15,966 | ) |
Administrator Class | | | | | | | (146,995 | ) | | | | | | | (1,170,880 | ) |
Institutional Class | | | | | | | (682,086 | ) | | | | | | | (2,346,840 | ) |
Investor Class | | | | | | | (299,809 | ) | | | | | | | (4,991,023 | ) |
| | | | | | | | | | | | | | | | |
Total distributions to shareholders | | | | | | | (1,145,485 | ) | | | | | | | (8,676,799 | ) |
| | | | | | | | | | | | | | | | |
| | | | |
Capital share transactions | | | Shares | | | | | | | | Shares | | | | | |
Proceeds from shares sold | | | | | | | | | | | | | | | | |
Class A | | | 54,208 | | | | 1,127,309 | | | | 178,082 | | | | 3,727,338 | |
Class C | | | 59,563 | | | | 1,293,476 | | | | 43,943 | | | | 939,785 | |
Administrator Class | | | 215,904 | | | | 4,613,671 | | | | 1,459,040 | | | | 30,967,227 | |
Institutional Class | | | 376,886 | | | | 8,053,695 | | | | 838,865 | | | | 17,848,227 | |
Investor Class | | | 777,695 | | | | 16,683,210 | | | | 2,996,888 | | | | 64,191,914 | |
| | | | | | | | | | | | | | | | |
| | | | | | | 31,771,361 | | | | | | | | 117,674,491 | |
| | | | | | | | | | | | | | | | |
Reinvestment of distributions | | | | | | | | | | | | | | | | |
Class A | | | 798 | | | | 15,794 | | | | 7,335 | | | | 149,934 | |
Class C | | | 0 | | | | 0 | | | | 624 | | | | 12,659 | |
Administrator Class | | | 7,136 | | | | 142,719 | | | | 54,840 | | | | 1,132,446 | |
Institutional Class | | | 33,315 | | | | 666,632 | | | | 112,591 | | | | 2,327,271 | |
Investor Class | | | 14,511 | | | | 290,518 | | | | 232,935 | | | | 4,814,783 | |
| | | | | | | | | | | | | | | | |
| | | | | | | 1,115,663 | | | | | | | | 8,437,093 | |
| | | | | | | | | | | | | | | | |
Payment for shares redeemed | | | | | | | | | | | | | | | | |
Class A | | | (106,175 | ) | | | (2,198,747 | ) | | | (197,628 | ) | | | (4,122,393 | ) |
Class C | | | (24,041 | ) | | | (512,706 | ) | | | (34,322 | ) | | | (681,203 | ) |
Administrator Class | | | (886,635 | ) | | | (18,659,222 | ) | | | (2,101,566 | ) | | | (44,740,100 | ) |
Institutional Class | | | (333,579 | ) | | | (7,244,589 | ) | | | (2,077,046 | ) | | | (44,904,369 | ) |
Investor Class | | | (4,596,561 | ) | | | (101,871,000 | ) | | | (5,043,796 | ) | | | (106,447,949 | ) |
| | | | | | | | | | | | | | | | |
| | | | | | | (130,486,264 | ) | | | | | | | (200,896,014 | ) |
| | | | | | | | | | | | | | | | |
Net decrease in net assets resulting from capital share transactions | | | | | | | (97,599,240 | ) | | | | | | | (74,784,430 | ) |
| | | | | | | | | | | | | | | | |
Total increase (decrease) in net assets | | | | | | | 37,290,868 | | | | | | | | (88,043,911 | ) |
| | | | | | | | | | | | | | | | |
| | | | |
Net assets | | | | | | | | | | | | | | | | |
Beginning of period | | | | | | | 514,285,980 | | | | | | | | 602,329,891 | |
| | | | | | | | | | | | | | | | |
End of period | | | | | | $ | 551,576,848 | | | | | | | $ | 514,285,980 | |
| | | | | | | | | | | | | | | | |
Undistributed net investment income | | | | | | $ | 163,817 | | | | | | | $ | 165,138 | |
| | | | | | | | | | | | | | | | |
The accompanying notes are an integral part of these financial statements.
| | | | | | |
| Financial Highlights | | Wells Fargo Advantage Special Mid Cap Value Fund | | | 15 | |
(For a share outstanding throughout each period)
| | | | | | | | | | | | | | | | | | | | | | | | |
| | | Six Months Ended
March 31, 2012 (Unaudited) | | | Year Ended September 30, | | | Year Ended October 31, | |
| Class A | | | 2011 | | | 20101 | | | 2009 | | | 2008 | | | 20072 | |
Net asset value, beginning of period | | $ | 17.84 | | | $ | 18.60 | | | $ | 15.98 | | | $ | 13.90 | | | $ | 23.12 | | | $ | 22.85 | |
Net investment income | | | 0.03 | 3 | | | 0.03 | | | | 0.30 | | | | 0.13 | 3 | | | 0.28 | | | | 0.07 | 3 |
Net realized and unrealized gains (losses) on investments | | | 4.80 | | | | (0.52 | ) | | | 2.49 | | | | 2.14 | | | | (7.34 | ) | | | 0.20 | |
| | | | | | | | | | | | | | | | | | | | | | | | |
Total from investment operations | | | 4.83 | | | | (0.49 | ) | | | 2.79 | | | | 2.27 | | | | (7.06 | ) | | | 0.27 | |
Distributions to shareholders from | | | | | | | | | | | | | | | | | | | | | | | | |
Net investment income | | | (0.03 | ) | | | (0.27 | ) | | | (0.17 | ) | | | (0.19 | ) | | | (0.28 | ) | | | 0.00 | |
Net realized gains | | | 0.00 | | | | 0.00 | | | | 0.00 | | | | 0.00 | | | | (1.88 | ) | | | 0.00 | |
| | | | | | | | | | | | | | | | | | | | | | | | |
Total distributions to shareholders | | | (0.03 | ) | | | (0.27 | ) | | | (0.17 | ) | | | (0.19 | ) | | | (2.16 | ) | | | 0.00 | |
Net asset value, end of period | | $ | 22.64 | | | $ | 17.84 | | | $ | 18.60 | | | $ | 15.98 | | | $ | 13.90 | | | $ | 23.12 | |
Total return4 | | | 27.11 | % | | | (2.82 | )% | | | 17.55 | % | | | 16.67 | % | | | (33.17 | )% | | | 1.18 | % |
Ratios to average net assets (annualized) | | | | | | | | | | | | | | | | | | | | | | | | |
Gross expenses | | | 1.31 | % | | | 1.29 | % | | | 1.35 | % | | | 1.35 | % | | | 1.38 | % | | | 1.39 | % |
Net expenses | | | 1.25 | % | | | 1.25 | % | | | 1.25 | % | | | 1.23 | % | | | 1.25 | % | | | 1.20 | % |
Net investment income | | | 0.33 | % | | | 0.14 | % | | | 1.80 | % | | | 0.94 | % | | | 0.65 | % | | | 1.17 | % |
Supplemental data | | | | | | | | | | | | | | | | | | | | | | | | |
Portfolio turnover rate | | | 40 | % | | | 78 | % | | | 84 | % | | | 106 | % | | | 158 | % | | | 113 | % |
Net assets, end of period (000’s omitted) | | | $11,341 | | | | $9,850 | | | | $10,497 | | | | $7,738 | | | | $1,273 | | | | $104 | |
| 1. | For the eleven months ended September 30, 2010. The Fund changed its fiscal year end from October 31 to September 30, effective September 30, 2010. |
| 2. | For the period from July 31, 2007 (commencement of class operations) to October 31, 2007 |
| 3. | Calculated based upon average shares outstanding |
| 4. | Total return calculations do not include any sales charges. Returns for periods of less than one year are not annualized. |
The accompanying notes are an integral part of these financial statements.
| | | | |
| 16 | | Wells Fargo Advantage Special Mid Cap Value Fund | | Financial Highlights |
(For a share outstanding throughout each period)
| | | | | | | | | | | | | | | | | | | | | | | | |
| | | Six Months Ended
March 31, 2012 (Unaudited) | | | Year Ended September 30, | | | Year Ended October 31, | |
| Class C | | | 2011 | | | 20101 | | | 2009 | | | 2008 | | | 20072 | |
Net asset value, beginning of period | | $ | 17.60 | | | $ | 18.40 | | | $ | 15.85 | | | $ | 13.83 | | | $ | 23.08 | | | $ | 22.85 | |
Net investment income (loss) | | | (0.04 | )3 | | | (0.13 | ) | | | 0.24 | | | | 0.02 | 3 | | | 0.14 | | | | 0.05 | 3 |
Net realized and unrealized gains (losses) on investments | | | 4.72 | | | | (0.49 | ) | | | 2.41 | | | | 2.14 | | | | (7.31 | ) | | | 0.18 | |
| | | | | | | | | | | | | | | | | | | | | | | | |
Total from investment operations | | | 4.68 | | | | (0.62 | ) | | | 2.65 | | | | 2.16 | | | | (7.17 | ) | | | 0.23 | |
Distributions to shareholders from | | | | | | | | | | | | | | | | | | | | | | | | |
Net investment income | | | 0.00 | | | | (0.18 | ) | | | (0.10 | ) | | | (0.14 | ) | | | (0.20 | ) | | | 0.00 | |
Net realized gains | | | 0.00 | | | | 0.00 | | | | 0.00 | | | | 0.00 | | | | (1.88 | ) | | | 0.00 | |
| | | | | | | | | | | | | | | | | | | | | | | | |
Total distributions to shareholders | | | 0.00 | | | | (0.18 | ) | | | (0.10 | ) | | | (0.14 | ) | | | (2.08 | ) | | | 0.00 | |
Net asset value, end of period | | $ | 22.28 | | | $ | 17.60 | | | $ | 18.40 | | | $ | 15.85 | | | $ | 13.83 | | | $ | 23.08 | |
Total return4 | | | 26.59 | % | | | (3.52 | )% | | | 16.76 | % | | | 15.81 | % | | | (33.66 | )% | | | 1.01 | % |
Ratios to average net assets (annualized) | | | | | | | | | | | | | | | | | | | | | | | | |
Gross expenses | | | 2.06 | % | | | 2.04 | % | | | 2.09 | % | | | 2.11 | % | | | 2.01 | % | | | 2.12 | % |
Net expenses | | | 2.00 | % | | | 2.00 | % | | | 2.00 | % | | | 1.98 | % | | | 2.00 | % | | | 1.98 | % |
Net investment income (loss) | | | (0.39 | )% | | | (0.60 | )% | | | 1.64 | % | | | 0.11 | % | | | (0.08 | )% | | | 0.79 | % |
Supplemental data | | | | | | | | | | | | | | | | | | | | | | | | |
Portfolio turnover rate | | | 40 | % | | | 78 | % | | | 84 | % | | | 106 | % | | | 158 | % | | | 113 | % |
Net assets, end of period (000’s omitted) | | | $2,962 | | | | $1,714 | | | | $1,604 | | | | $707 | | | | $78 | | | | $10 | |
| 1. | For the eleven months ended September 30, 2010. The Fund changed its fiscal year end from October 31 to September 30, effective September 30, 2010. |
| 2. | For the period from July 31, 2007 (commencement of class operations) to October 31, 2007 |
| 3. | Calculated based upon average shares outstanding |
| 4. | Total return calculations do not include any sales charges. Returns for periods of less than one year are not annualized. |
The accompanying notes are an integral part of these financial statements.
| | | | | | |
| Financial Highlights | | Wells Fargo Advantage Special Mid Cap Value Fund | | | 17 | |
(For a share outstanding throughout each period)
| | | | | | | | | | | | | | | | | | | | | | | | | | | | |
| | | Six Months Ended
March 31, 2012 (Unaudited) | | | Year Ended September 30, | | | Year Ended October 31, | |
| Administrator Class | | | 2011 | | | 20101 | | | 2009 | | | 2008 | | | 2007 | | | 2006 | |
Net asset value, beginning of period | | $ | 18.04 | | | $ | 18.80 | | | $ | 16.14 | | | $ | 13.99 | | | $ | 23.16 | | | $ | 23.40 | | | $ | 23.25 | |
Net investment income | | | 0.05 | 2 | | | 0.06 | 2 | | | 0.31 | | | | 0.17 | 2 | | | 0.13 | | | | 0.21 | 2 | | | 0.12 | |
Net realized and unrealized gains (losses) on investments | | | 4.85 | | | | (0.54 | ) | | | 2.53 | | | | 2.15 | | | | (7.20 | ) | | | 1.11 | | | | 3.47 | |
| | | | | | | | | | | | | | | | | | | | | | | | | | | | |
Total from investment operations | | | 4.90 | | | | (0.48 | ) | | | 2.84 | | | | 2.32 | | | | (7.07 | ) | | | 1.32 | | | | 3.59 | |
Distributions to shareholders from | | | | | | | | | | | | | | | | | | | | | | | | | | | | |
Net investment income | | | (0.05 | ) | | | (0.28 | ) | | | (0.18 | ) | | | (0.17 | ) | | | (0.22 | ) | | | (0.15 | ) | | | (0.02 | ) |
Net realized gains | | | 0.00 | | | | 0.00 | | | | 0.00 | | | | 0.00 | | | | (1.88 | ) | | | (1.41 | ) | | | (3.42 | ) |
| | | | | | | | | | | | | | | | | | | | | | | | | | | | |
Total distributions to shareholders | | | (0.05 | ) | | | (0.28 | ) | | | (0.18 | ) | | | (0.17 | ) | | | (2.10 | ) | | | (1.56 | ) | | | (3.44 | ) |
Net asset value, end of period | | $ | 22.89 | | | $ | 18.04 | | | $ | 18.80 | | | $ | 16.14 | | | $ | 13.99 | | | $ | 23.16 | | | $ | 23.40 | |
Total return3 | | | 27.19 | % | | | (2.72 | )% | | | 17.66 | % | | | 16.83 | % | | | (33.08 | )% | | | 5.75 | % | | | 17.47 | % |
Ratios to average net assets (annualized) | | | | | | | | | | | | | | | | | | | | | | | | | | | | |
Gross expenses | | | 1.14 | % | | | 1.13 | % | | | 1.17 | % | | | 1.19 | % | | | 1.21 | % | | | 1.17 | % | | | 1.20 | % |
Net expenses | | | 1.13 | % | | | 1.13 | % | | | 1.14 | % | | | 1.11 | % | | | 1.15 | % | | | 1.15 | % | | | 1.15 | % |
Net investment income | | | 0.45 | % | | | 0.26 | % | | | 1.65 | % | | | 1.21 | % | | | 0.81 | % | | | 0.91 | % | | | 0.70 | % |
Supplemental data | | | | | | | | | | | | | | | | | | | | | | | | | | | | |
Portfolio turnover rate | | | 40 | % | | | 78 | % | | | 84 | % | | | 106 | % | | | 158 | % | | | 113 | % | | | 125 | % |
Net assets, end of period (000’s omitted) | | | $63,627 | | | | $62,122 | | | | $75,775 | | | | $95,005 | | | | $85,786 | | | | $119,079 | | | | $97,014 | |
| 1. | For the eleven months ended September 30, 2010. The Fund changed its fiscal year end from October 31 to September 30, effective September 30, 2010. |
| 2. | Calculated based upon average shares outstanding |
| 3. | Returns for periods of less than one year are not annualized. |
The accompanying notes are an integral part of these financial statements.
| | | | |
| 18 | | Wells Fargo Advantage Special Mid Cap Value Fund | | Financial Highlights |
(For a share outstanding throughout each period)
| | | | | | | | | | | | | | | | | | | | | | | | | | | | |
| | | Six Months Ended
March 31, 2012 (Unaudited) | | | Year Ended September 30, | | | Year Ended October 31, | |
| Institutional Class | | | 2011 | | | 20101 | | | 2009 | | | 2008 | | | 2007 | | | 2006 | |
Net asset value, beginning of period | | $ | 18.10 | | | $ | 18.86 | | | $ | 16.19 | | | $ | 14.05 | | | $ | 23.26 | | | $ | 23.47 | | | $ | 23.28 | |
Net investment income | | | 0.08 | | | | 0.10 | | | | 0.33 | | | | 0.21 | 2 | | | 0.18 | | | | 0.29 | 2 | | | 0.20 | |
Net realized and unrealized gains (losses) on investments | | | 4.85 | | | | (0.52 | ) | | | 2.56 | | | | 2.14 | | | | (7.22 | ) | | | 1.10 | | | | 3.46 | |
| | | | | | | | | | | | | | | | | | | | | | | | | | | | |
Total from investment operations | | | 4.93 | | | | (0.42 | ) | | | 2.89 | | | | 2.35 | | | | (7.04 | ) | | | 1.39 | | | | 3.66 | |
Distributions to shareholders from | | | | | | | | | | | | | | | | | | | | | | | | | | | | |
Net investment income | | | (0.12 | ) | | | (0.34 | ) | | | (0.22 | ) | | | (0.21 | ) | | | (0.29 | ) | | | (0.19 | ) | | | (0.05 | ) |
Net realized gains | | | 0.00 | | | | 0.00 | | | | 0.00 | | | | 0.00 | | | | (1.88 | ) | | | (1.41 | ) | | | (3.42 | ) |
| | | | | | | | | | | | | | | | | | | | | | | | | | | | |
Total distributions to shareholders | | | (0.12 | ) | | | (0.34 | ) | | | (0.22 | ) | | | (0.21 | ) | | | (2.17 | ) | | | (1.60 | ) | | | (3.47 | ) |
Net asset value, end of period | | $ | 22.91 | | | $ | 18.10 | | | $ | 18.86 | | | $ | 16.19 | | | $ | 14.05 | | | $ | 23.26 | | | $ | 23.47 | |
Total return3 | | | 27.32 | % | | | (2.46 | )% | | | 17.97 | % | | | 17.04 | % | | | (32.89 | )% | | | 6.04 | % | | | 17.77 | % |
Ratios to average net assets (annualized) | | | | | | | | | | | | | | | | | | | | | | | | | | | | |
Gross expenses | | | 0.88 | % | | | 0.86 | % | | | 0.91 | % | | | 0.92 | % | | | 0.96 | % | | | 0.90 | % | | | 0.92 | % |
Net expenses | | | 0.87 | % | | | 0.86 | % | | | 0.89 | % | | | 0.85 | % | | | 0.90 | % | | | 0.90 | % | | | 0.90 | % |
Net investment income | | | 0.72 | % | | | 0.52 | % | | | 2.02 | % | | | 1.46 | % | | | 1.06 | % | | | 1.23 | % | | | 0.93 | % |
Supplemental data | | | | | | | | | | | | | | | | | | | | | | | | | | | | |
Portfolio turnover rate | | | 40 | % | | | 78 | % | | | 84 | % | | | 106 | % | | | 158 | % | | | 113 | % | | | 125 | % |
Net assets, end of period (000’s omitted) | | | $133,871 | | | | $104,360 | | | | $129,945 | | | | $131,036 | | | | $112,753 | | | | $157,342 | | | | $137,471 | |
| 1. | For the eleven months ended September 30, 2010. The Fund changed its fiscal year end from October 31 to September 30, effective September 30, 2010. |
| 2. | Calculated based upon average shares outstanding |
| 3. | Returns for periods of less than one year are not annualized. |
The accompanying notes are an integral part of these financial statements.
| | | | | | |
| Financial Highlights | | Wells Fargo Advantage Special Mid Cap Value Fund | | | 19 | |
(For a share outstanding throughout each period)
| | | | | | | | | | | | | | | | | | | | | | | | | | | | |
| | | Six Months Ended
March 31, 2012 (Unaudited) | | | Year Ended September 30, | | | Year Ended October 31, | |
| Investor Class | | | 2011 | | | 20101 | | | 2009 | | | 2008 | | | 2007 | | | 2006 | |
Net asset value, beginning of period | | $ | 18.04 | | | $ | 18.80 | | | $ | 16.13 | | | $ | 13.97 | | | $ | 23.11 | | | $ | 23.36 | | | $ | 23.23 | |
Net investment income | | | 0.03 | 2 | | | 0.02 | | | | 0.28 | | | | 0.14 | | | | 0.14 | 2 | | | 0.18 | 2 | | | 0.10 | |
Net realized and unrealized gains (losses) on investments | | | 4.85 | | | | (0.53 | ) | | | 2.54 | | | | 2.14 | | | | (7.23 | ) | | | 1.10 | | | | 3.45 | |
| | | | | | | | | | | | | | | | | | | | | | | | | | | | |
Total from investment operations | | | 4.88 | | | | (0.51 | ) | | | 2.82 | | | | 2.28 | | | | (7.09 | ) | | | 1.28 | | | | 3.55 | |
Distributions to shareholders from | | | | | | | | | | | | | | | | | | | | | | | | | | | | |
Net investment income | | | (0.02 | ) | | | (0.25 | ) | | | (0.15 | ) | | | (0.12 | ) | | | (0.17 | ) | | | (0.12 | ) | | | 0.00 | |
Net realized gains | | | 0.00 | | | | 0.00 | | | | 0.00 | | | | 0.00 | | | | (1.88 | ) | | | (1.41 | ) | | | (3.42 | ) |
| | | | | | | | | | | | | | | | | | | | | | | | | | | | |
Total distributions to shareholders | | | (0.02 | ) | | | (0.25 | ) | | | (0.15 | ) | | | (0.12 | ) | | | (2.05 | ) | | | (1.53 | ) | | | (3.42 | ) |
Net asset value, end of period | | $ | 22.90 | | | $ | 18.04 | | | $ | 18.80 | | | $ | 16.13 | | | $ | 13.97 | | | $ | 23.11 | | | $ | 23.36 | |
Total return3 | | | 27.05 | % | | | (2.88 | )% | | | 17.53 | % | | | 16.55 | % | | | (33.19 | )% | | | 5.58 | % | | | 17.26 | % |
Ratios to average net assets (annualized) | | | | | | | | | | | | | | | | | | | | | | | | | | | | |
Gross expenses | | | 1.38 | % | | | 1.36 | % | | | 1.44 | % | | | 1.48 | % | | | 1.54 | % | | | 1.52 | % | | | 1.54 | % |
Net expenses | | | 1.31 | % | | | 1.31 | % | | | 1.31 | % | | | 1.31 | % | | | 1.31 | % | | | 1.31 | % | | | 1.31 | % |
Net investment income | | | 0.29 | % | | | 0.08 | % | | | 1.57 | % | | | 1.02 | % | | | 0.67 | % | | | 0.76 | % | | | 0.53 | % |
Supplemental data | | | | | | | | | | | | | | | | | | | | | | | | | | | | |
Portfolio turnover rate | | | 40 | % | | | 78 | % | | | 84 | % | | | 106 | % | | | 158 | % | | | 113 | % | | | 125 | % |
Net assets, end of period (000’s omitted) | | | $339,776 | | | | $336,239 | | | | $384,509 | | | | $362,184 | | | | $374,417 | | | | $839,228 | | | | $756,815 | |
| 1. | For the eleven months ended September 30, 2010. The Fund changed its fiscal year end from October 31 to September��30, effective September 30, 2010. |
| 2. | Calculated based upon average shares outstanding |
| 3. | Returns for periods of less than one year are not annualized. |
The accompanying notes are an integral part of these financial statements.
| | | | |
| 20 | | Wells Fargo Advantage Special Mid Cap Value Fund | | Notes to Financial Statements (Unaudited) |
1. ORGANIZATION
Wells Fargo Funds Trust (the “Trust”), a Delaware statutory trust organized on March 10, 1999, is an open-end management investment company registered under the Investment Company Act of 1940, as amended (the “1940 Act”). These financial statements report on Wells Fargo Advantage Special Mid Cap Value Fund Fund (the “Fund”) which is a diversified series of the Trust.
2. SIGNIFICANT ACCOUNTING POLICIES
The following significant accounting policies, which are consistently followed in the preparation of the financial statements of the Fund, are in conformity with U.S. generally accepted accounting principles which require management to make estimates and assumptions that affect the reported amounts of assets and liabilities, disclosure of contingent assets and liabilities at the date of the financial statements, and the reported amounts of revenues and expenses during the reporting period. Actual results could differ from those estimates.
Securities valuation
Investments in equity securities are valued each business day as of the close of regular trading on the New York Stock Exchange, which is usually 4:00 p.m. (Eastern Time). Securities which are traded on a national or foreign securities exchange are valued at the last reported sales price, except that securities listed on The Nasdaq Stock Market, Inc. (“Nasdaq”) are valued at the Nasdaq Official Closing Price (“NOCP”), and if no NOCP is available, then at the last reported sales price. If no sales price is shown on the Nasdaq, the bid price will be used. In the absence of any sale of securities listed on the Nasdaq, and in the case of other securities (including U.S. Government obligations, but excluding debt securities maturing in 60 days or less), the price will be deemed “stale” and the valuations will be determined in accordance with the Fund’s Fair Value Procedures.
Investments in open-end mutual funds and non-registered investment companies are generally valued at net asset value.
Investments which are not valued using any of the methods discussed above, are valued at their fair value, as determined by procedures established in good faith and approved by the Board of Trustees. The Board of Trustees has established a Valuation Committee comprised of the Trustees and has delegated to it the authority to take any actions regarding the valuation of portfolio securities that the Valuation Committee deems necessary in determining the fair value of portfolio securities, unless the responsibility has been delegated to the Management Valuation Team of Wells Fargo Funds Management, LLC (“Funds Management”). The Board of Trustees retains the authority to make or ratify any valuation decisions or approve any changes to the Fair Value Procedures as it deems appropriate. On a quarterly basis, the Board of Trustees considers for ratification any valuation actions taken by the Valuation Committee or the Management Valuation Team.
Valuations of fair valued prices are compared to the next actual sales price when available, or other appropriate market information to assess the continued appropriateness of the fair valuation methodology used. The securities are fair valued on a day-to-day basis, taking into consideration changes to appropriate market information and any significant changes to the input factors considered in the valuation process until there is a readily available price provided on the exchange or by an independent pricing service. Valuations received from an independent pricing service or broker quotes are periodically validated by comparisons to most recent trades and valuations provided by other independent pricing services in addition to the review of prices by the adviser and/or sub-adviser. Unobservable inputs used in determining fair valuations are identified based on the type of security, taking into consideration factors utilized by market participants in valuing the investment, knowledge about the issuer and the current market environment.
Security loans
The Fund may lend its securities from time to time in order to earn additional income in the form of fees or interest on securities received as collateral or the investment of any cash received as collateral. The Fund continues to receive interest or dividends on the securities loaned. The Fund receives collateral in the form of cash or securities with a value at least equal to the value of the securities on loan. The value of the loaned securities is determined at the close of each business day and any additional required collateral is delivered to the Fund on the next business day. In a securities lending transaction, the net asset value of the Fund will be affected by an increase or decrease in the value of the securities loaned and by an increase or decrease in the value of the instrument in which collateral is invested. The amount of securities lending activity undertaken by the Fund fluctuates from time to time. In the event of default or bankruptcy
| | | | | | |
| Notes to Financial Statements (Unaudited) | | Wells Fargo Advantage Special Mid Cap Value Fund | | | 21 | |
by the borrower, the Fund may be prevented from recovering the loaned securities or gaining access to the collateral or may experience delays or costs in doing so. In addition, the investment of any cash collateral received may lose all or part of its value. The Fund has the right under the lending agreement to recover the securities from the borrower on demand.
The Fund lends its securities through an unaffiliated securities lending agent. Cash collateral received in connection with its securities lending transactions is invested in Wells Fargo Securities Lending Cash Investments, LLC (the “Cash Collateral Fund”). The Cash Collateral Fund is exempt from registration under Section 3(c)(7) of the 1940 Act and is managed by Funds Management and is sub-advised by Wells Capital Management Incorporated (“Wells Capital Management”). Funds Management receives an advisory fee starting at 0.05% and declining to 0.01% as the average daily net assets of the Cash Collateral Fund increase. All of the fees received by Funds Management are paid to Wells Capital Management for its services as sub-adviser. The Cash Collateral Fund seeks to provide a positive return compared to the daily Fed Funds Open rate by investing in high-quality, U.S. dollar-denominated short-term money market instruments. Cash Collateral Fund investments are fair valued based upon the amortized cost valuation technique. Income earned from investment in the Cash Collateral Fund is included in securities lending income on the Statement of Operations.
For Wells Fargo Advantage Funds that participated in securities lending activity prior to February 13, 2009, certain structured investment vehicles purchased in a joint account by the former securities lending agent defaulted or were impaired. Certain of the Wells Fargo Advantage Funds still hold ownership interest in these structured investment vehicles, which have since been restructured as pass-through securities. If the Fund holds an ownership interest in such pass-through securities, information regarding this ownership interest can be found in the Portfolio of Investments under the category “Other”.
Security transactions and income recognition
Securities transactions are recorded on a trade date basis. Realized gains or losses are reported on the basis of identified cost of securities delivered.
Dividend income is recognized on the ex-dividend date.
Distributions to shareholders
Distributions to shareholders from net investment income and net realized gains, if any, are recorded on the ex-dividend date. Such distributions are determined in conformity with income tax regulations, which may differ from generally accepted accounting principles.
Federal and other taxes
The Fund intends to continue to qualify as a regulated investment company by distributing substantially all of its investment company taxable income and any net realized capital gains (after reduction for capital loss carryforwards) sufficient to relieve it from all, or substantially all, federal income taxes. Accordingly, no provision for federal income taxes was required.
The Fund’s income and federal excise tax returns and all financial records supporting those returns for the prior three fiscal years are subject to examination by the federal and Delaware revenue authorities. Management has analyzed the Fund’s tax positions taken on federal, state, and foreign tax returns for all open tax years and does not believe that there are any uncertain tax positions that require recognition of a tax liability.
Under the recently enacted Regulated Investment Company Modernization Act of 2010, the Fund is permitted to carry forward capital losses incurred in taxable years which began after December 22, 2010 for an unlimited period. However, any losses incurred are required to be utilized prior to the losses incurred in pre-enactment taxable years. As a result of this ordering rule, pre-enactment capital loss carryforwards may be more likely to expire unused. Additionally, post-enactment capital losses that are carried forward will retain their character as either short-term or long-term capital losses rather than being considered all short-term as under previous law.
As of September 30, 2011, the Fund had net capital loss carryforwards, which were available to offset future net realized capital gains, in the amount of $53,960,596 expiring in 2017.
Class allocations
The separate classes of shares offered by the Fund differ principally in applicable sales charges, distribution, shareholder servicing and administration fees. Shareholders of each class bear certain expenses that pertain to that particular class. All shareholders bear the common expenses of the Fund, earn income from the portfolio, and are allocated unrealized gains and losses pro rata based on the average daily net assets of each class, without distinction between share classes.
| | | | |
| 22 | | Wells Fargo Advantage Special Mid Cap Value Fund | | Notes to Financial Statements (Unaudited) |
Dividends are determined separately for each class based on income and expenses allocable to each class. Realized gains and losses are allocated to each class pro rata based upon the net assets of each class on the date realized. Differences in per share dividend rates generally result from the relative weightings of pro rata income and realized gain allocations and from differences in separate class expenses, including distribution, shareholder servicing and administration fees.
3. FAIR VALUATION MEASUREMENTS
Fair value measurements of investments are determined within a framework that has established a fair value hierarchy based upon the various data inputs utilized in determining the value of the Fund’s investments. The three-level hierarchy gives the highest priority to unadjusted quoted prices in active markets for identical assets or liabilities (Level 1) and the lowest priority to significant unobservable inputs (Level 3). The Fund’s investments are classified within the fair value hierarchy based on the lowest level of input that is significant to the fair value measurement. The inputs are summarized into three broad levels as follow:
| n | | Level 1 – quoted prices in active markets for identical securities |
| n | | Level 2 – other significant observable inputs (including quoted prices for similar securities, interest rates, prepayment speeds, credit risk, etc.) |
| n | | Level 3 – significant unobservable inputs (including the Fund’s own assumptions in determining the fair value of investments) |
The inputs or methodologies used for valuing securities are not necessarily an indication of the risk associated with investing in those securities.
As of March 31, 2012, the inputs used in valuing the Fund’s assets, which are carried at fair value, were as follows:
| | | | | | | | | | | | | | | | |
| Investments in Securities | | Quoted Prices (Level 1) | | | Significant Other
Observable Inputs (Level 2) | | | Significant Unobservable Inputs (Level 3) | | | Total | |
| | | | |
Equity securities | | | | | | | | | | | | | | | | |
Common stocks | | $ | 535,322,665 | | | $ | 0 | | | $ | 0 | | | $ | 535,322,665 | |
| | | | |
Other | | | 0 | | | | 0 | | | | 1,143,807 | | | | 1,143,807 | |
| | | | |
Short-term investments | | | | | | | | | | | | | | | | |
Investment companies | | | 19,005,681 | | | | 60,607,484 | | | | 0 | | | | 79,613,165 | |
| | | $ | 554,328,346 | | | $ | 60,607,484 | | | $ | 1,143,807 | | | $ | 616,079,637 | |
Further details on the major security types listed above can be found in the Portfolio of Investments.
Transfers in and transfers out are recognized at the end of the reporting period. For the six months ended March 31, 2012, the Fund did not have any significant transfers into/out of Level 1 and Level 2.
4. TRANSACTIONS WITH AFFILIATES AND OTHER EXPENSES
Advisory fee
The Trust has entered into an advisory contract with Funds Management, an indirect wholly owned subsidiary of Wells Fargo & Company (“Wells Fargo”). The adviser is responsible for implementing investment policies and guidelines and for supervising the sub-adviser, who is responsible for day-to-day portfolio management of the Fund.
Pursuant to the contract, Funds Management is entitled to receive an annual advisory fee starting at 0.70% and declining to 0.60% as the average daily net assets of the Fund increase. For the six months ended March 31, 2012, the advisory fee was equivalent to an annual rate of 0.70% of the Fund’s average daily net assets.
Funds Management has retained the services of certain sub-advisers to provide daily portfolio management to the Fund. The fees related to sub-advisory services are borne directly by Funds Management and do not increase the overall fees paid by the Fund. Wells Capital Management, an affiliate of Funds Management, is the sub-adviser to the Fund and is entitled to receive a fee from Funds Management at an annual rate starting at 0.45% and declining to 0.30% as the average daily net assets of the Fund increase.
| | | | | | |
| Notes to Financial Statements (Unaudited) | | Wells Fargo Advantage Special Mid Cap Value Fund | | | 23 | |
Administration and transfer agent fees
The Trust has entered into an administration agreement with Funds Management. Under this agreement, for providing administrative services, which includes paying fees and expenses for services provided by the transfer agent, sub-transfer agents, omnibus account servicers and record-keepers, Funds Management is entitled to receive from the Fund an annual fund level administration fee starting at 0.05% and declining to 0.03% as the average daily net assets of the Fund increase and a class level administration fee which is calculated based on the average daily net assets of each class as follows:
| | | | |
| | | Class Level Administration Fee | |
Class A, Class C | | | 0.26 | % |
Administrator Class | | | 0.10 | |
Institutional Class | | | 0.08 | |
Investor Class | | | 0.33 | |
Funds Management has contractually waived and/or reimbursed advisory and administration fees to the extent necessary to maintain certain net operating expense ratios for the Fund. Waiver of fees and/or reimbursement of expenses by Funds Management were made first from fund level expenses on a proportionate basis and then from class specific expenses. Funds Management has committed through July 18, 2013 to waive fees and/or reimburse expenses to the extent necessary to cap the Fund’s expenses at 1.25% for Class A, 2.00% for Class C, 1.14% for Administrator Class, 0.87% for Institutional Class and 1.31% for Investor Class.
Distribution fees
The Trust has adopted a Distribution Plan for Class C shares of the Fund pursuant to Rule 12b-1 under the 1940 Act. Distribution fees are charged to Class C shares and paid to Wells Fargo Funds Distributor, LLC, the principal underwriter, at an annual rate of 0.75% of its average daily net assets.
For the six months ended March 31, 2012, Wells Fargo Funds Distributor, LLC received $1,520 from the sale of Class A shares.
Shareholder servicing fees
The Trust has entered into contracts with one or more shareholder servicing agents, whereby Class A, Class C, Administrator Class and Investor Class of the Fund is charged a fee at an annual rate of 0.25% of the average daily net assets of each respective class.
A portion of these total shareholder servicing fees were paid to affiliates of Wells Fargo.
5. INVESTMENT PORTFOLIO TRANSACTIONS
Purchases and sales of investments, excluding U.S. Government obligations (if any) and short-term securities, for the six months ended March 31, 2012 were $217,245,741 and $306,963,237, respectively.
6. BANK BORROWINGS
The Trust (excluding the money market funds) and Wells Fargo Variable Trust are parties to a $150,000,000 revolving credit agreement with State Street Bank and Trust Company, whereby the Fund is permitted to use bank borrowings for temporary or emergency purposes, such as to fund shareholder redemption requests. Interest under the credit agreement is charged to the Fund based on a borrowing rate equal to the higher of the Federal Funds rate in effect on that day plus 1.25% or the overnight LIBOR rate in effect on that day plus 1.25%. In addition, an annual commitment fee equal to 0.10% of the unused balance is allocated to each participating fund. For the six months ended March 31, 2012, the Fund paid $602 in commitment fees.
For the six months ended March 31, 2012, there were no borrowings by the Fund under the agreement.
7. INDEMNIFICATION
Under the Trust’s organizational documents, the officers and directors are indemnified against certain liabilities that may arise out of performance of their duties to the Trust. Additionally, in the normal course of business, the Trust may enter
| | | | |
| 24 | | Wells Fargo Advantage Special Mid Cap Value Fund | | Notes to Financial Statements (Unaudited) |
into contracts with service providers that contain a variety of indemnification clauses. The Trust’s maximum exposure under these arrangements is dependent on future claims that may be made against the Fund and, therefore, cannot be estimated.
8. NEW ACCOUNTING PRONOUNCEMENTS
In December 2011, the Financial Accounting Standards Board (“FASB”) issued Accounting Standard Update (“ASU”) No. 2011-11, Disclosures about Offsetting Assets and Liabilities. ASU 2011-11, which amends FASB ASC Topic 210 Balance Sheet, creates new disclosure requirements requiring entities to disclose both gross and net information for derivatives and other financial instruments that are either offset in the Statement of Assets and Liabilities or subject to an enforceable master netting arrangement or similar agreement. The disclosure requirements are effective for interim and annual reporting periods beginning on or after January 1, 2013. Management is currently evaluating the impact of the update’s adoption on the Fund’s financial statement disclosures.
In May 2011, FASB issued ASU No. 2011-04 “Amendments to Achieve Common Fair Value Measurement and Disclosure Requirements in U.S. GAAP and IFRSs”. ASU No. 2011-04 amends FASB ASC Topic 820, Fair Value Measurements and Disclosures, to establish common requirements for measuring fair value and for disclosing information about fair value measurements in accordance with GAAP. The ASU is effective prospectively for interim and annual periods beginning after December 15, 2011. Management expects that adoption of the ASU will result in additional disclosures in the financial statements, as applicable.
In April 2011, FASB issued ASU No. 2011-03 “Reconsideration of Effective Control for Repurchase Agreements”. ASU No. 2011-03 amends FASB ASC Topic 860, Transfers and Servicing, specifically the criteria required to determine whether a repurchase agreement (repo) and similar agreements should be accounted for as sales of financial assets or secured borrowings with commitments. ASU No. 2011-03 changes the assessment of effective control by focusing on the transferor’s contractual rights and obligations and removing the criterion to assess its ability to exercise those rights or honor those obligations. This could result in changes to the way entities account for certain transactions including repurchase agreements, mortgage dollar rolls and reverse repurchase agreements. The ASU will become effective on a prospective basis for new transfers and modifications to existing transactions as of the beginning of the first interim or annual period beginning on or after December 15, 2011. Management has evaluated the impact of adopting the ASU and expects no significant changes.
| | | | | | |
| Other Information (Unaudited) | | Wells Fargo Advantage Special Mid Cap Value Fund | | | 25 | |
PROXY VOTING INFORMATION
A description of the policies and procedures that the Fund uses to determine how to vote proxies relating to portfolio securities is available without charge, upon request, by calling 1-800-222-8222, visiting our Web site at wellsfargoadvantagefunds.com, or visiting the SEC Web site at sec.gov. Information regarding how the Fund voted proxies relating to portfolio securities during the most recent 12-month period ended June 30 is available without charge on the Fund’s Web site at wellsfargoadvantagefunds.com or by visiting the SEC Web site at sec.gov.
PORTFOLIO HOLDINGS INFORMATION
The complete portfolio holdings for the Fund are publicly available on the Fund’s Web site (wellsfargoadvantagefunds.com) on a monthly, 30-day or more delayed basis. In addition, top ten holdings information for the Fund is publicly available on the Fund’s Web site on a monthly, seven-day or more delayed basis. The Fund files its complete schedule of portfolio holdings with the SEC for the first and third quarters of each fiscal year on Form N-Q, which is available without charge by visiting the SEC Web site at sec.gov. In addition, the Fund’s Form N-Q may be reviewed and copied at the SEC’s Public Reference Room in Washington, DC, and at regional offices in New York City, at 233 Broadway, and in Chicago, at 175 West Jackson Boulevard, Suite 900. Information about the Public Reference Room may be obtained by calling 1-800-SEC-0330.
| | | | |
| 26 | | Wells Fargo Advantage Special Mid Cap Value Fund | | Other Information (Unaudited) |
BOARD OF TRUSTEES
The following table provides basic information about the Board of Trustees (the “Trustees”) of the Trust and Officers of the Trust. This table should be read in conjunction with the Prospectus and the Statement of Additional Information1 of the Fund. Each of the Trustees and Officers listed below acts in identical capacities for the Wells Fargo Advantage family of funds, which consists of 137 funds comprising the Wells Fargo Funds Trust, Wells Fargo Variable Trust, Wells Fargo Master Trust and four closed-end funds (collectively the “Fund Complex”). All of the Trustees are also Members of the Audit and Governance Committees of each Trust in the Fund Complex. The mailing address of each Trustee and Officer is 525 Market Street, 12th Floor, San Francisco, CA 94105. Each Trustee and Officer serves an indefinite term, however, each Trustee serves such term until reaching the mandatory retirement age established by the Trustees.
Independent Trustees
| | | | | | |
Name and Year of Birth | | Position Held and Length of Service | | Principal Occupations During Past Five Years | | Other Directorships During
Past Five Years |
Peter G. Gordon
(Born 1942) | | Trustee, since 1998; Chairman, since 2005 (Lead Trustee since 2001) | | Co-Founder, Retired Chairman, President and CEO of Crystal Geyser Water Company. Trustee Emeritus, Colby College | | Asset Allocation Trust |
Isaiah Harris, Jr.
(Born 1952) | | Trustee, since 2009 | | Retired. Prior thereto, President and CEO of BellSouth Advertising and Publishing Corp. from 2005 to 2007, President and CEO of BellSouth Enterprises from 2004 to 2005 and President of BellSouth Consumer Services from 2000 to 2003. Emeritus member of the Iowa State University Foundation Board of Governors. Emeritus Member of the Advisory Board of Iowa State University School of Business. Mr. Harris is a certified public accountant. | | CIGNA Corporation; Deluxe Corporation; Asset Allocation Trust |
Judith M. Johnson
(Born 1949) | | Trustee, since 2008 | | Retired. Prior thereto, Chief Executive Officer and Chief Investment Officer of Minneapolis Employees Retirement Fund from 1996 to 2008. Ms. Johnson is an attorney, certified public accountant and a certified managerial accountant. | | Asset Allocation Trust |
Leroy Keith, Jr.
(Born 1939) | | Trustee, since 2010 | | Chairman, Bloc Global Services (development and construction). Trustee of the Evergreen Funds from 1983 to 2010. Former Managing Director, Almanac Capital Management (commodities firm), former Partner, Stonington Partners, Inc. (private equity fund), former Director, Obagi Medical Products Co. and former Director, Lincoln Educational Services. | | Trustee, Virtus Fund Complex (consisting of 40 portfolios as of 12/31/11); Asset Allocation Trust |
David F. Larcker
(Born 1950) | | Trustee, since 2009 | | James Irvin Miller Professor of Accounting at the Graduate School of Business, Stanford University, Director of Corporate Governance Research Program and Senior Faculty of The Rock Center for Corporate Governance since 2006. From 2005 to 2008, Professor of Accounting at the Graduate School of Business, Stanford University. Prior thereto, Ernst & Young Professor of Accounting at The Wharton School, University of Pennsylvania from 1985 to 2005. | | Asset Allocation Trust |
Olivia S. Mitchell
(Born 1953) | | Trustee, since 2006 | | International Foundation of Employee Benefit Plans Professor, Wharton School of the University of Pennsylvania since 1993. Director of Wharton’s Pension Research Council and Boettner Center on Pensions & Retirement Research, and Research Associate at the National Bureau of Economic Research. Previously, Cornell University Professor from 1978 to 1993. | | Asset Allocation Trust |
| | | | | | |
| Other Information (Unaudited) | | Wells Fargo Advantage Special Mid Cap Value Fund | | | 27 | |
| | | | | | |
Name and Year of Birth | | Position Held and Length of Service | | Principal Occupations During Past Five Years | | Other Directorships During
Past Five Years |
Timothy J. Penny
(Born 1951) | | Trustee, since 1996 | | President and CEO of Southern Minnesota Initiative Foundation, a non-profit organization, since 2007 and Senior Fellow at the Humphrey Institute Policy Forum at the University of Minnesota since 1995. Member of the Board of Trustees of NorthStar Education Finance, Inc., a non-profit organization, since 2007. | | Asset Allocation Trust |
Michael S. Scofield
(Born 1943) | | Trustee, since 2010 | | Served on the Investment Company Institute’s Board of Governors and Executive Committee from 2008-2011 as well the Governing Council of the Independent Directors Council from 2006-2011 and the Independent Directors Council Executive Committee from 2008-2011. Chairman of the IDC from 2008-2010. Institutional Investor (Fund Directions) Trustee of Year in 2007. Trustee of the Evergreen Funds (and its predecessors) from 1984 to 2010. Chairman of the Evergreen Funds from 2000-2010. Former Trustee of the Mentor Funds. Retired Attorney, Law Offices of Michael S. Scofield and former Director and Chairman, Branded Media Corporation (multi-media branding company). | | Asset Allocation Trust |
Donald C. Willeke
(Born 1940) | | Trustee, since 1996 | | Principal of the law firm of Willeke & Daniels. General Counsel of the Minneapolis Employees Retirement Fund from 1984 until its consolidation into the Minnesota Public Employees Retirement Association on June 30, 2010. Director and Vice Chair of The Free Trust (non-profit corporation). Director of the American Chestnut Foundation (non-profit corporation). | | Asset Allocation Trust |
Officers
| | | | | | |
Name and Year of Birth | | Position Held and
Length of Service | | Principal Occupations During Past Five Years | | |
Karla M. Rabusch
(Born 1959) | | President, since 2003 | | Executive Vice President of Wells Fargo Bank, N.A. and President of Wells Fargo Funds Management, LLC since 2003. Senior Vice President and Chief Administrative Officer of Wells Fargo Funds Management, LLC from 2001 to 2003. | | |
C. David Messman
(Born 1960) | | Secretary, since 2000; Chief Legal Counsel, since 2003 | | Senior Vice President and Secretary of Wells Fargo Funds Management, LLC since 2001. Vice President and Managing Senior Counsel of Wells Fargo Bank, N.A. since 1996. | | |
Kasey Phillips
(Born 1970) | | Treasurer, since 2009 | | Senior Vice President of Wells Fargo Funds Management, LLC since 2009. Senior Vice President of Evergreen Investment Management Company, LLC from 2006 to 2010. Treasurer of the Evergreen Funds from 2005 to 2010. | | |
David Berardi
(Born 1975) | | Assistant Treasurer, since 2009 | | Vice President of Wells Fargo Funds Management, LLC since 2009. Vice President of Evergreen Investment Management Company, LLC from 2008 to 2010. Assistant Vice President of Evergreen Investment Services, Inc. from 2004 to 2008. Manager of Fund Reporting and Control for Evergreen Investment Management Company, LLC from 2004 to 2010. | | |
Jeremy DePalma
(Born 1974) | | Assistant Treasurer, since 2009 | | Senior Vice President of Wells Fargo Funds Management, LLC since 2009. Senior Vice President of Evergreen Investment Management Company, LLC from 2008 to 2010. Vice President, Evergreen Investment Services, Inc. from 2004 to 2007. Head of the Fund Reporting and Control Team within Fund Administration from 2005 to 2010. | | |
Debra Ann Early
(Born 1964) | | Chief Compliance Officer, since 2007 | | Chief Compliance Officer of Wells Fargo Funds Management, LLC since 2007. Chief Compliance Officer of Parnassus Investments from 2005 to 2007. Chief Financial Officer of Parnassus Investments from 2004 to 2007 and Senior Audit Manager of PricewaterhouseCoopers LLP from 1998 to 2004. | | |
| 1. | The Statement of Additional Information includes additional information about the Trustees and is available, without charge, upon request, by calling 1-800-222-8222 or by visiting the Web site at wellsfargoadvantagefunds.com. |
| | | | |
| 28 | | Wells Fargo Advantage Special Mid Cap Value Fund | | Other Information (Unaudited) |
BOARD CONSIDERATION OF INVESTMENT ADVISORY AND SUB-ADVISORY AGREEMENTS:
Under Section 15 of the Investment Company Act of 1940 (the “1940 Act”), the Board of Trustees (the “Board”) of Wells Fargo Funds Trust (the “Trust”), all the members of which have no direct or indirect interest in the investment advisory and sub-advisory agreements and are not “interested persons” of the Trust, as defined in the 1940 Act (the “Independent Trustees”), must determine whether to approve the continuation of the Trust’s investment advisory and sub-advisory agreements. In this regard, at an in person meeting held on March 29-30, 2012 (the “Meeting”), the Board reviewed and re-approved: (i) an investment advisory agreement with Wells Fargo Funds Management, LLC (“Funds Management”) for Wells Fargo Advantage Special Mid Cap Value Fund (the “Fund”) and (ii) an investment sub-advisory agreement with Wells Capital Management Incorporated (“Wells Capital Management”) for the Fund. The investment advisory agreement with Funds Management and the investment sub-advisory agreement with Wells Capital Management are collectively referred to as the “Advisory Agreements.”
At the Meeting, the Board considered the factors and reached the conclusions described below relating to the selection of Funds Management and Wells Capital Management and the continuation of the Advisory Agreements. Prior to the Meeting, the Trustees conferred extensively among themselves and with representatives of Funds Management about these matters. The Board also met throughout the year and received information that was useful to them in considering the continuation of the Advisory Agreements. The Independent Trustees were assisted in their evaluation of the Advisory Agreements by independent legal counsel, from whom they received separate legal advice and with whom they met separately from Funds Management.
In providing information to the Board, Funds Management and Wells Capital Management were guided by a detailed set of requests submitted by the Independent Trustees’ independent legal counsel on their behalf at the start of the Board’s annual contract renewal process earlier in 2012. In approving the Advisory Agreements, the Board did not identify any particular information or consideration that was all-important or controlling, and each Trustee likely attributed different weights to various factors.
Nature, extent and quality of services
The Board received and considered various information regarding the nature, extent and quality of services provided to the Fund by Funds Management and Wells Capital Management under the Advisory Agreements. The Board also received and considered, among other things, information about the background and experience of senior management of Funds Management, and the qualifications, backgrounds, tenures and responsibilities of the portfolio managers primarily responsible for the day-to-day portfolio management of the Fund.
The Board evaluated the ability of Funds Management and Wells Capital Management, based on their respective financial condition, resources, reputation and other attributes, to attract and retain qualified investment professionals, including research, advisory, and supervisory personnel. The Board further considered the compliance programs and compliance records of Funds Management and Wells Capital Management. In addition, the Board took into account the administrative services provided to the Fund by Funds Management and its affiliates.
The Board’s decision to approve the continuation of the Advisory Agreements was based on a comprehensive evaluation of all of the information provided to it. In considering these matters, the Board considered not only the specific information presented in connection with the Meeting, but also the knowledge gained over time through interaction with Funds Management and Wells Capital Management about various topics, including Funds Management’s oversight of service providers. The above factors, together with those referenced below, are some of the most important, but not necessarily all, factors considered by the Board in concluding that the nature, extent and quality of the investment advisory services provided to the Fund by Funds Management and Wells Capital Management supported the re-approval of the Advisory Agreements. Although the Board considered the continuation of the Advisory Agreements for the Fund as part of the larger process of considering the continuation of the advisory agreements for all of the funds in the complex, its decision to continue the Advisory Agreements for the Fund was ultimately made on a fund-by-fund basis.
Fund performance and expenses
The Board considered the performance results for the Fund over various time periods ended December 31, 2011. The Board also considered these results in comparison to the median performance of a universe of relevant funds (the “Universe”) that was determined by Lipper Inc. (“Lipper”) to be similar to the Fund, and in comparison to the Fund’s
| | | | | | |
| Other Information (Unaudited) | | Wells Fargo Advantage Special Mid Cap Value Fund | | | 29 | |
benchmark index and to other comparative data. Lipper is an independent provider of investment company data. The Board received a description of the methodology used by Lipper to select the mutual funds in the Universe. The Board noted that the performance of the Fund was higher than the median performance of the Universe and its benchmark index, the Lipper Multi-Cap Value Funds Index, for all periods under review.
The Board received and considered information regarding the Fund’s contractual advisory fee and net operating expense ratios and their various components, including actual management fees (which reflect fee waivers, if any), transfer agent, custodian and other non-management fees, Rule 12b-1 and non-Rule 12b-1 fees, service fees and fee waiver and expense reimbursement arrangements. The Board also considered these ratios in comparison to the median ratios of an expense Universe and a narrower expense group of mutual funds (each, an “Expense Group”) that was determined by Lipper to be similar to the Fund. The Board received a description of the methodology used by Lipper to select the mutual funds in the Fund’s Expense Group. The Board noted that the net operating expense ratios of the Fund were in range of or equal to the Fund’s Expense Group’s median net operating expense ratios.
Based on the above-referenced considerations and other factors, the Board concluded that the overall performance and expense structure of the Fund supported the re-approval of the Advisory Agreements for the Fund.
Investment advisory and sub-advisory fee rates
The Board reviewed and considered the contractual investment advisory fee rate that is payable by the Fund to Funds Management for investment advisory services (the “Advisory Agreement Rate”), both on a stand-alone basis and on a combined basis with the Fund’s administration fee rate. The Board took into account the separate administrative and other services covered by the administration fee rate. The Board also reviewed and considered the contractual investment sub-advisory fee rate that is payable by Funds Management to Wells Capital Management for investment sub-advisory services (the “Sub-Advisory Agreement Rate”). In addition, the Board reviewed and considered the existing fee waiver/cap arrangements applicable to the Advisory Agreement Rate and considered the Advisory Agreement Rate after taking the waivers/caps into account (the “Net Advisory Rate”).
The Board received and considered information comparing the Advisory Agreement Rate and Net Advisory Rate with those of other funds in the Fund’s Expense Group median. The Board noted that, except for the Advisory Agreement Rate and Net Advisory Rate of the Institutional class, the Advisory Agreement Rate and Net Advisory Rate for the Fund were higher than the median rates for the Fund’s Expense Group. The Board received a report from Funds Management that noted, unlike the Fund, the Expense Group data did not include transfer agency expenses, the Fund was benefiting from Advisory Agreement Rate breakpoints and the net operating expense caps would be extended until January 31, 2014.
The Board also received and considered information about the nature and extent of services offered and fee rates charged by Funds Management and Wells Capital Management to other types of clients. In this regard, the Board received information about differences between the services, and the compliance, reporting, and other legal burdens and risks of providing investment advice to mutual funds and those associated with providing advice to non-mutual fund clients such as collective funds or institutional separate accounts.
The Board determined that the Advisory Agreement Rate for the Fund, both with and without an administration fee rate and before and after waivers, was reasonable in light of the Fund’s Expense Group information, the net expense ratio commitments, the services covered by the Advisory Agreements and other information provided. The Board also reviewed and considered the Sub-Advisory Agreement Rate and concluded that the Sub-Advisory Agreement Rate was reasonable in light of the services covered by the sub-advisory agreement, the sub-advised expense information provided by Lipper, and other information provided.
Profitability
The Board received and considered a profitability analysis of Funds Management, as well as an analysis of the profitability to the collective Wells Fargo businesses that provide services to the Fund. It considered that the information provided to it was necessarily estimated, and that the profitability information provided to it, especially on a fund-by-fund basis, did not necessarily provide a precise tool for evaluating the appropriateness of the Fund’s Advisory Agreement Rate in isolation. It noted that the levels of profitability reported on a fund-by-fund basis varied widely, depending on, among other things, the size and type of fund. The Board concluded that the profitability reported by Funds Management was not unreasonable.
| | | | |
| 30 | | Wells Fargo Advantage Special Mid Cap Value Fund | | Other Information (Unaudited) |
The Board did not consider separate profitability information with respect to Wells Capital Management, because, as an affiliate of Funds Management, its profitability information was subsumed in the collective Wells Fargo profitability analysis provided by Funds Management.
Economies of scale
With respect to possible economies of scale, the Board reviewed the breakpoints in the Fund’s advisory fee structure, which operate generally to reduce the effective Advisory Agreement Rate of the Fund (as a percentage of Fund assets) as the Fund grows in size. It considered that, as a fund shrinks in size, breakpoints conversely result in increasing fee levels. The Board noted that it would have on-going opportunities to review the appropriate levels of breakpoints in the future, and concluded that the breakpoints as implemented appeared to be a reasonable step toward sharing economies of scale, if any, with the Fund. However, the Board acknowledged the inherent limitations of any analysis of an investment adviser’s economies of scale and of any attempt to correlate breakpoints with such economies, stemming largely from the Board’s understanding that economies of scale are realized, if at all, by an investment adviser across a variety of products and services, not just with respect to a single fund.
Other benefits to Funds Management and Wells Capital Management
The Board received and considered information regarding potential “fall-out” or ancillary benefits received by Funds Management and its affiliates, including Wells Capital Management, as a result of their relationship with the Fund. Ancillary benefits could include, among others, benefits directly attributable to the relationship of Funds Management and Wells Capital Management with the Fund and benefits potentially derived from an increase in Funds Management’s and Wells Capital Management’s business as a result of their relationship with the Fund (such as the ability to market to shareholders other financial products offered by Funds Management and its affiliates, including Wells Capital Management).
The Board considered that Wells Fargo Funds Distributor, LLC, an affiliate of Funds Management, serves as distributor to the Fund and receives certain compensation for those services. The Board noted that various financial institutions, including affiliates of Funds Management, may receive distribution-related fees, shareholder servicing payments (including amounts derived from payments under Rule 12b-1 plans) and sub-transfer agency fees in respect of shares sold or held through them and services provided.
The Board also reviewed information about whether and to what extent soft dollar credits are sought and how any such credits are utilized and any benefits that may be realized by using an affiliated broker.
Other factors and broader review
The Board also considered the markets for distribution of the Fund’s shares, including the channels through which the Fund’s shares are offered and sold. The Board noted that the Fund is part of one of the few fund families that have both direct-to-fund and intermediary distribution channels. As discussed above, the Board reviews detailed materials received from Funds Management and Wells Capital Management annually as part of the re-approval process under Section 15 of the 1940 Act and also reviews and assesses information about the quality of the services that the Fund receives throughout the year. In this regard, the Board has reviewed reports of Funds Management at each of its quarterly meetings, which include, among other things, portfolio reviews and performance reports. In addition, the Board confers with portfolio managers at various times throughout the year.
Conclusion
After considering the above-described factors and based on its deliberations and its evaluation of the information described above, the Board unanimously approved the continuation of the Advisory Agreements for an additional one-year period.
| | | | | | |
| List of Abbreviations | | Wells Fargo Advantage Special Mid Cap Value Fund | | | 31 | |
The following is a list of common abbreviations for terms and entities which may have appeared in this report.
| ACB | — Agricultural Credit Bank |
| ADR | — American Depository Receipt |
| ADS | — American Depository Shares |
| AGC-ICC | — Assured Guaranty Corporation - Insured Custody Certificates |
| AGM | — Assured Guaranty Municipal |
| AMBAC | — American Municipal Bond Assurance Corporation |
| AMT | — Alternative Minimum Tax |
| BAN | — Bond Anticipation Notes |
| BHAC | — Berkshire Hathaway Assurance Corporation |
| CAB | — Capital Appreciation Bond |
| CCAB | — Convertible Capital Appreciation Bond |
| CDA | — Community Development Authority |
| CDO | — Collateralized Debt Obligation |
| COP | — Certificate of Participation |
| DRIVER | — Derivative Inverse Tax-Exempt Receipts |
| DW&P | — Department of Water & Power |
| DWR | — Department of Water Resources |
| ECFA | — Educational & Cultural Facilities Authority |
| EDA | — Economic Development Authority |
| EDFA | — Economic Development Finance Authority |
| ETF | — Exchange-Traded Fund |
| FFCB | — Federal Farm Credit Bank |
| FGIC | — Financial Guaranty Insurance Corporation |
| FHA | — Federal Housing Authority |
| FHLB | — Federal Home Loan Bank |
| FHLMC | — Federal Home Loan Mortgage Corporation |
| FICO | — The Financing Corporation |
| FNMA | — Federal National Mortgage Association |
| GDR | — Global Depository Receipt |
| GNMA | — Government National Mortgage Association |
| HCFR | — Healthcare Facilities Revenue |
| HEFA | — Health & Educational Facilities Authority |
| HEFAR | — Higher Education Facilities Authority Revenue |
| HFA | — Housing Finance Authority |
| HFFA | — Health Facilities Financing Authority |
| IBC | — Insured Bond Certificate |
| IDA | — Industrial Development Authority |
| IDAG | — Industrial Development Agency |
| IDR | — Industrial Development Revenue |
| KRW | — Republic of Korea Won |
| LIBOR | — London Interbank Offered Rate |
| LLC | — Limited Liability Company |
| LLP | — Limited Liability Partnership |
| MBIA | — Municipal Bond Insurance Association |
| MFHR | — Multi-Family Housing Revenue |
| MSTR | — Municipal Securities Trust Receipts |
| MUD | — Municipal Utility District |
| NATL-RE | — National Public Finance Guarantee Corporation |
| PCFA | — Pollution Control Finance Authority |
| PCR | — Pollution Control Revenue |
| PFA | — Public Finance Authority |
| PFFA | — Public Facilities Financing Authority |
| PFOTER | — Puttable Floating Option Tax-Exempt Receipts |
| plc | — Public Limited Company |
| PUTTER | — Puttable Tax-Exempt Receipts |
| R&D | — Research & Development |
| RDA | — Redevelopment Authority |
| RDFA | — Redevelopment Finance Authority |
| REIT | — Real Estate Investment Trust |
| ROC | — Reset Option Certificates |
| SAVRS | — Select Auction Variable Rate Securities |
| SBA | — Small Business Authority |
| SFHR | — Single Family Housing Revenue |
| SFMR | — Single Family Mortgage Revenue |
| SPDR | — Standard & Poor’s Depositary Receipts |
| STRIPS | — Separate Trading of Registered Interest and Principal Securities |
| TAN | — Tax Anticipation Notes |
| TIPS | — Treasury Inflation-Protected Securities |
| TRAN | — Tax Revenue Anticipation Notes |
| TCR | — Transferable Custody Receipts |
| TTFA | — Transportation Trust Fund Authority |
| TVA | — Tennessee Valley Authority |
| XLCA | — XL Capital Assurance |
This page is intentionally left blank.
This page is intentionally left blank.
This page is intentionally left blank.


FOR MORE INFORMATION
More information about Wells Fargo Advantage Funds is available free upon request. To obtain literature, please write, e-mail, visit the Fund’s Web site, or call:
Wells Fargo Advantage Funds
P.O. Box 8266
Boston, MA 02266-8266
E-mail: wfaf@wellsfargo.com
Web site: wellsfargoadvantagefunds.com
Individual investors: 1-800-222-8222
Retail investment professionals: 1-888-877-9275
Institutional investment professionals: 1-866-765-0778
This report and the financial statements contained herein are submitted for the general information of the shareholders of Wells Fargo Advantage Funds. If this report is used for promotional purposes, distribution of the report must be accompanied or preceded by a current prospectus. For a prospectus containing more complete information, including charges and expenses, call 1-800-222-8222 or visit the Fund’s Web site at wellsfargoadvantagefunds.com. Please consider the investment objectives, risks, charges, and expenses of the investment carefully before investing. This and other information about Wells Fargo Advantage Funds can be found in the current prospectus. Read the prospectus carefully before you invest or send money.
Wells Fargo Funds Management, LLC, a wholly owned subsidiary of Wells Fargo & Company, provides investment advisory and administrative services for Wells Fargo Advantage Funds. Other affiliates of Wells Fargo & Company provide subadvisory and other services for the Funds. The Funds are distributed by Wells Fargo Funds Distributor, LLC, Member FINRA/SIPC, an affiliate of Wells Fargo & Company.
NOT FDIC INSURED ¡ NO BANK GUARANTEE ¡ MAY LOSE VALUE
© 2012 Wells Fargo Funds Management, LLC. All rights reserved.
| | |
 | | 208998 05-12 SA234/SAR234 3-12 |
Not required in this filing
| ITEM 3. | AUDIT COMMITTEE FINANCIAL EXPERT |
Not required in this filing.
| ITEM 4. | PRINCIPAL ACCOUNTANT FEES AND SERVICES |
Not required in this filing.
| ITEM 5. | AUDIT COMMITTEE OF LISTED REGISTRANTS |
Not required in this filing.
| ITEM 6. | SCHEDULE OF INVESTMENTS |
The Schedule of Investments is included as part of the report to shareholders filed under Item 1 of this Form.
| ITEM 7. | DISCLOSURE OF PROXY VOTING POLICIES AND PROCEDURES FOR CLOSED-END MANAGEMENT INVESTMENT COMPANIES |
Not applicable.
| ITEM 8. | PORTFOLIO MANAGERS OF CLOSED-END MANAGEMENT INVESTMENT COMPANIES |
Not applicable.
| ITEM 9. | PURCHASES OF EQUITY SECURITIES BY CLOSED-END MANAGEMEENT INVESTMENT COMPANY AND AFFILIATED PURCHASES |
Not applicable.
| ITEM 10. | SUBMISSION OF MATTERS TO A VOTE OF SECURITY HOLDERS |
The Governance Committee (the “Committee”) of the Board of Trustees of the registrant (the “Trust”) has adopted procedures by which a shareholder of any series of the Trust may submit properly a nominee recommendation for the Committee’s consideration.
The shareholder must submit any such recommendation (a “Shareholder Recommendation”) in writing to the Trust, to the attention of the Trust’s Secretary, at the address of the principal executive offices of the Trust.
The Shareholder Recommendation must be delivered to, or mailed and received at, the principal executive offices of the Trust not less than forty-five (45) calendar days nor more than seventy-five (75) calendar days prior to the date of the Committee meeting at which the nominee would be considered.
The Shareholder Recommendation must include: (i) a statement in writing setting forth (A) the name, age, date of birth, business address, residence address and nationality of the person recommended by the shareholder (the “candidate”); (B) the series (and, if applicable, class) and number of all shares of the Trust owned of record or beneficially by the candidate, as reported to such shareholder by the candidate; (C) any other information regarding the candidate called for with respect to director nominees by paragraphs (a), (d), (e) and (f) of Item 401 of Regulation S-K or paragraph (b) of Item 22 of Rule 14a-101 (Schedule 14A) under the Securities Exchange Act of 1934, as amended (the “Exchange Act”), adopted by the Securities and Exchange Commission (or the corresponding provisions of any regulation or rule subsequently adopted by the Securities and Exchange Commission or any successor agency applicable to the Trust); (D) any other information regarding the candidate that would be required to be disclosed if the candidate were a nominee in a proxy statement or other filing required to be made in connection with solicitation of proxies for election of directors pursuant to Section 14 of the Exchange Act and the rules and regulations promulgated thereunder; and (E) whether the recommending shareholder believes that the candidate is or will be an “interested person” of the Trust (as defined in the Investment Company Act of 1940, as amended) and, if not an “interested person,” information regarding the candidate that will be sufficient for the Trust to make such determination; (ii) the written and signed consent of the candidate to be named as a nominee and to serve as a Trustee if elected; (iii) the recommending shareholder’s name as it appears on the Trust’s books; (iv) the series (and, if applicable, class) and number of all shares of the Trust owned beneficially and of record by the recommending shareholder; and (v) a description of all arrangements or understandings between the recommending shareholder and the candidate and any other person or persons (including their names) pursuant to which the recommendation is being made by the recommending shareholder. In addition, the Committee may require the candidate to interview in person and furnish such other information as it may reasonably require or deem necessary to determine the eligibility of such candidate to serve as a Trustee of the Trust.
| ITEM 11. | CONTROLS AND PROCEDURES |
(a) The President and Treasurer have concluded that the Wells Fargo Funds Trust (the “Trust”) disclosure controls and procedures (as defined in Rule 30a-3(c) under the Investment Company Act of 1940) provide reasonable assurances that material information relating to the Trust is made known to them by the appropriate persons, based on their evaluation of these controls and procedures as of a date within 90 days of the filing of this report.
(b) There were no significant changes in the Trust’s internal controls over financial reporting (as defined in Rule 30a-3(d) under the Investment Company Act of 1940) that occurred during the second quarter of the period covered by this report that materially affected, or is reasonably likely to materially affect, the registrant’s internal control over financial reporting.
(a)(1) Not required in this filing.
(a)(2) Certification pursuant to Rule 30a-2(a) under the Investment Company Act of 1940 (17 CFR 270.30a-2(a)) is filed and attached hereto as Exhibit 99.CERT.
(a)(3) Not applicable.
(b) Certification pursuant to Rule 30a-2(b) under the Investment Company Act of 1940 (17 CFR 270.30a-2(b)) is filed and attached hereto as Exhibit 99.906CERT.
SIGNATURES
Pursuant to the requirements of the Securities Exchange Act of 1934 and the Investment Company Act of 1940, the registrant has duly caused this report to be signed on its behalf by the undersigned, thereunto duly authorized.
| | |
| Wells Fargo Funds Trust |
| |
| By: | | /s/ Karla M. Rabusch |
| | Karla M. Rabusch President |
|
Date: May 23, 2012 |
Pursuant to the requirements of the Securities Exchange Act of 1934 and the Investment Company Act of 1940, this report has been signed below by the following persons on behalf of the registrant and in the capacities and on the date indicated.
| | |
| By: | | /s/ Karla M. Rabusch |
| | Karla M. Rabusch President |
|
Date: May 23, 2012 |
| | |
| By: | | /s/ Kasey L. Phillips |
| | Kasey L. Phillips Treasurer |
|
Date: May 23, 2012 |