
UNITED STATES
SECURITIES AND EXCHANGE COMMISSION
Washington, D.C. 20549
FORM N-CSRS
CERTIFIED SHAREHOLDER REPORT OF REGISTERED
MANAGEMENT INVESTMENT COMPANIES
Investment Company Act file number: 811-09253
Wells Fargo Funds Trust
(Exact name of registrant as specified in charter)
525 Market St., San Francisco, CA 94105
(Address of principal executive offices) (Zip code)
C. David Messman
Wells Fargo Funds Management, LLC
525 Market St., San Francisco, CA 94105
(Name and address of agent for service)
Registrant’s telephone number, including area code: 800-222-8222
Date of fiscal year end: May 31
Registrant is making a filing for 27 of its series:
Wells Fargo Growth Balanced Fund, Wells Fargo Moderate Balanced Fund, Wells Fargo C&B Large Cap Value Fund, Wells Fargo Diversified Equity Fund, Wells Fargo Emerging Growth Fund, Wells Fargo Index Fund, Wells Fargo International Value Fund, Wells Fargo Small Company Growth Fund, Wells Fargo Small Company Value Fund, Wells Fargo Dynamic Target Today Fund, Wells Fargo Dynamic Target 2015 Fund, Wells Fargo Dynamic Target 2020 Fund, Wells Fargo Dynamic Target 2025 Fund, Wells Fargo Dynamic Target 2030 Fund, Wells Fargo Dynamic Target 2035 Fund, Wells Fargo Dynamic Target 2040 Fund, Wells Fargo Dynamic Target 2045 Fund, Wells Fargo Dynamic Target 2050 Fund, Wells Fargo Dynamic Target 2055 Fund, Wells Fargo Dynamic Target 2060 Fund, Wells Fargo Core Bond Fund, Wells Fargo Real Return Fund, Wells Fargo WealthBuilder Conservative Allocation Portfolio, Wells Fargo WealthBuilder Moderate Balanced Portfolio, Wells Fargo WealthBuilder Growth Balanced Portfolio, Wells Fargo WealthBuilder Growth Allocation Portfolio, and Wells Fargo WealthBuilder Equity Portfolio (formerly, Wells Fargo WealthBuilder Tactical Equity Portfolio).
Date of reporting period: November 30, 2016
ITEM 1. REPORT TO STOCKHOLDERS
Semi-Annual Report
November 30, 2016

Allocation Funds

| ∎ | | Wells Fargo Growth Balanced Fund |
| ∎ | | Wells Fargo Moderate Balanced Fund |

Reduce clutter. Save trees.
Sign up for electronic delivery of prospectuses and shareholder reports at wellsfargo.com/advantagedelivery
Contents
| * | A complete schedule of portfolio holdings as of the report date may be obtained, free of charge, by accessing the following website: https:/www.wellsfargofunds.com/assets/edocs/regulatory/holdings/index-semi.pdf or by calling Wells Fargo Funds at 1-800-222-8222. This complete schedule, filed on Form N-CSRS, is also available on the SEC’s website at sec.gov. |
| ** | A complete schedule of portfolio holdings as of the report date may be obtained, free of charge, by accessing the following website: https://www.wellsfargofunds.com/assets/edocs/regulatory/holdings/core-bond-semi.pdf or by calling Wells Fargo Funds at 1-800-222-8222. This complete schedule, filed on Form N-CSRS, is also available on the SEC’s website at sec.gov. |
The views expressed and any forward-looking statements are as of November 30, 2016, unless otherwise noted, and are those of the Fund managers and/or Wells Fargo Funds Management, LLC. Discussions of individual securities, or the markets generally, or any Wells Fargo Fund are not intended as individual recommendations. Future events or results may vary significantly from those expressed in any forward-looking statements. The views expressed are subject to change at any time in response to changing circumstances in the market. Wells Fargo Funds Management, LLC and the Fund disclaim any obligation to publicly update or revise any views expressed or forward-looking statements.
NOT FDIC INSURED ◾ NO BANK GUARANTEE ◾ MAY LOSE VALUE
| | | | |
| 2 | | Wells Fargo Allocation Funds | | Letter to shareholders (unaudited) |

Andrew Owen
President
Wells Fargo Funds
During much of the period, modestly positive economic data influenced global stock, bond, and commodity markets.
Throughout the period, economic and business data, while often uneven, appeared to be strengthening overall.
Dear Shareholder:
As the new president of Wells Fargo Funds now that Karla Rabusch is retiring from that position after nearly 14 years, I am pleased to offer you this semi-annual report for the Wells Fargo Allocation Funds for the six-month period that ended November 30, 2016. During much of the period, modestly positive economic data influenced global stock, bond, and commodity markets. Late in the period, stocks moved higher and bond markets fell in reaction to global political events including the U.S. presidential election, efforts by the Organization of Petroleum Exporting Countries (OPEC) to increase oil prices, and interest-rate expectations.
The surprise Brexit vote rattled markets briefly before stocks rebounded.
Global investment markets trended lower at the end of June following the Brexit vote in the U.K. to leave the European Union (E.U.). The equity sell-off proved temporary. During July, better-than-expected corporate earnings, economic data, consumer confidence, and industrial output sent U.S. stocks higher.
Stocks drifted somewhat lower in the fall as the presidential campaign wore on toward the election. Following the November election, the S&P 500 Index1 reached several record all-time highs on its path to a 6.01% return for the six-month period that ended November 30, 2016. The Russell 2000® Index2 and S&P MidCap 400® Index3 delivered even more robust returns for the period at 15.37% and 9.93%, respectively.
International equity markets confronted challenging circumstances during the period.
During the period, political circumstances in countries outside of the U.S. challenged investor sentiment. In the U.K., a new prime minister took office following the Brexit vote and began setting the ground rules for the country’s exit from the E.U. In Brazil, the Senate removed the president from office, and the possibility of presidential impeachment due to a corruption scandal emerged in South Korea. The king of Thailand died. The French president lost a primary election and endorsed his rival. An attempted coup in Turkey, continued escalation of conflicts in Syria and Iraq, and North Korea’s testing of its nuclear weapons capabilities also caused uncertainty.
Throughout the period, economic and business data, while often uneven, appeared to be strengthening overall. After generating concern early in 2016, China’s economic growth demonstrated strength. The prime minister’s re-election in Japan offered the potential for new economic stimulus. India appointed a new central bank governor who many expected would continue the outgoing governor’s policies, which were considered effective. OPEC members agreed to production cuts intended to support increased prices for oil, which could benefit commodities markets that are economically important to many international developed and emerging markets. Developed international markets as measured by the Morgan Stanley Capital International (MSCI) Europe, Australasia, Far East (EAFE) Index (Net)4 ended the period
| 1 | The S&P 500 Index consists of 500 stocks chosen for market size, liquidity, and industry group representation. It is a market-value-weighted index with each stock’s weight in the index proportionate to its market value. You cannot invest directly in an index. |
| 2 | The Russell 2000® Index measures the performance of the 2,000 smallest companies in the Russell 3000® Index, which represents approximately 8% of the total market capitalization of the Russell 3000® Index. You cannot invest directly in an index. |
| 3 | The S&P MidCap 400® Index measures the performance of the mid-size company segment of the U.S. market; this index is used by more than 95% of U.S. managers and pension plan sponsors. More than $25 billion is indexed to the S&P MidCap 400® Index. You cannot invest directly in an index. |
| 4 | The Morgan Stanley Capital International (MSCI) Europe, Australasia, Far East (EAFE) Index (Net) is a free-float-adjusted market-capitalization-weighted index that is designed to measure the equity market performance of developed markets, excluding the United States and Canada. The MSCI EAFE Index (Net) consists of the following 21 developed markets country indexes: Australia, Austria, Belgium, Denmark, Finland, France, Germany, Hong Kong, Ireland, Israel, Italy, Japan, the Netherlands, New Zealand, Norway, Portugal, Singapore, Spain, Sweden, Switzerland, and the United Kingdom. Source: MSCI. MSCI makes no representations and shall have no liability whatsoever with respect to any MSCI data contained herein. The MSCI data may not be further redistributed or used as a basis for other indexes or any securities or financial products. This report is not approved, reviewed, or produced by MSCI.You cannot invest directly in an index. |
| | | | | | |
| Letter to shareholders (unaudited) | | Wells Fargo Allocation Funds | | | 3 | |
1.25% lower. Stocks in emerging markets delivered an 8.42% gain for the period as measured by the MSCI Emerging Markets Index (Net).5
Fixed-income markets were volatile before the U.S. election and declined post-election.
Global fixed-income markets were volatile during the period, particularly following the U.S. election. Investors appeared to be anticipating U.S. interest-rate increases and waiting for clarity from central bank policymakers outside of the U.S. When investors expect interest rates to rise, they often seek higher yields on their investments to compensate for inflation’s eroding effect on real returns, tending to favor equities and high-yield bonds, for example, over investment-grade bonds.
Also, currency values in several European and Asian countries fell relative to the U.S. dollar during the period, restraining investor interest in foreign bond markets. While the Bloomberg Barclays U.S. Aggregate Bond Index6 suffered a 0.92% loss during the period, the 4.97% loss for the Bloomberg Barclays Global Aggregate ex-U.S. Dollar Bond Index7 reflects the relatively more difficult conditions for bonds outside of the U.S.
Don’t let short-term uncertainty derail long-term investment goals.
Periods of investment uncertainty can present challenges, but experience has taught us that maintaining long-term investment goals can be an effective way to plan for the future. To help you create a sound strategy based on your personal goals and risk tolerance, Wells Fargo Funds offers more than 100 mutual funds spanning a wide range of asset classes and investment styles. Although diversification cannot guarantee an investment profit or prevent losses, we believe it can be an effective way to manage investment risk and potentially smooth out overall portfolio performance. We encourage investors to know their investments and to understand that appropriate levels of risk-taking may unlock opportunities.
Thank you for choosing to invest with Wells Fargo Funds. We appreciate your confidence in us and remain committed to helping you meet your financial needs.
Sincerely,

Andrew Owen
President
Wells Fargo Funds
For further information about your Fund, contact your investment professional, visit our website at wellsfargofunds.com, or call us directly at 1-800-222-8222. We are available 24 hours a day, 7 days a week.
| 5 | The Morgan Stanley Capital International (MSCI) Emerging Markets (EM) Index (Net) is a free-float-adjusted market-capitalization-weighted index that is designed to measure the equity market performance of emerging markets. The MSCI EM Index (Net) consists of the following 23 emerging markets country indexes: Brazil, Chile, China, Colombia, Czech Republic, Egypt, Greece, Hungary, India, Indonesia, Korea, Malaysia, Mexico, Peru, the Philippines, Poland, Qatar, Russia, South Africa, Taiwan, Thailand, Turkey, and United Arab Emirates. Source: MSCI. MSCI makes no express or implied warranties or representations and shall have no liability whatsoever with respect to any MSCI data contained herein. The MSCI data may not be further redistributed or used as a basis for other indexes or any securities or financial products. This report is not approved, reviewed, or produced by MSCI. You cannot invest directly in an index. |
| 6 | The Bloomberg Barclays U.S. Aggregate Bond Index (formerly known as Barclays U.S. Aggregate Bond Index) is a broad-based benchmark that measures the investment-grade, U.S. dollar-denominated, fixed-rate taxable bond market, including Treasuries, government-related and corporate securities, mortgage-backed securities (agency fixed-rate and hybrid adjustable-rate mortgage pass-throughs), asset-backed securities, and commercial mortgage-backed securities. You cannot invest directly in an index. |
| 7 | The Bloomberg Barclays Global Aggregate ex-U.S. Dollar Bond Index (formerly known as Barclays Global Aggregate ex-U.S. Dollar Bond Index) tracks an international basket of government, corporate, agency, and mortgage-related bonds. You cannot invest directly in an index. |
| | | | |
| 4 | | Wells Fargo Allocation Funds | | Performance highlights (unaudited) |
Wells Fargo Growth Balanced Fund1
Investment objective
The Fund seeks total return, consisting of capital appreciation and current income.
Manager
Wells Fargo Funds Management, LLC
Subadviser
Wells Capital Management Incorporated
Subadvisers for the affiliated master portfolios
Analytic Investors, LLC‡
Artisan Partners Limited Partnership
Cooke & Bieler, L.P.
Galliard Capital Management, Inc.
Golden Capital Management, LLC
LSV Asset Management
Peregrine Capital Management, LLC
Phocas Financial Corporation‡
Wells Capital Management Incorporated
Portfolio managers
Kandarp Acharya, CFA®, FRM
Thomas C. Biwer, CFA®
Petros Bocray, CFA®, FRM
Aldo Ceccarelli, CFA®
Christian Chan, CFA®
Erik Sens, CFA®
Average annual total returns (%) as of November 30, 2016
| | | | | | | | | | | | | | | | | | | | | | | | | | | | | | | | | | |
| | | | | Including sales charge | | | Excluding sales charge | | | Expense ratios2 (%) | |
| | | Inception date | | 1 year | | | 5 year | | | 10 year | | | 1 year | | | 5 year | | | 10 year | | | Gross | | | Net3 | |
| Class A (WFGBX) | | 10-14-1998 | | | (2.74 | ) | | | 8.49 | | | | 4.16 | | | | 3.20 | | | | 9.78 | | | | 4.78 | | | | 1.35 | | | | 1.20 | |
| Class B (NVGRX)* | | 10-1-1998 | | | (2.56 | ) | | | 8.67 | | | | 4.23 | | | | 2.44 | | | | 8.95 | | | | 4.23 | | | | 2.10 | | | | 1.95 | |
| Class C (WFGWX) | | 10-1-1998 | | | 1.41 | | | | 8.96 | | | | 4.00 | | | | 2.41 | | | | 8.96 | | | | 4.00 | | | | 2.10 | | | | 1.95 | |
| Administrator Class (NVGBX) | | 11-11-1994 | | | – | | | | – | | | | – | | | | 3.47 | | | | 10.05 | | | | 5.04 | | | | 1.27 | | | | 0.95 | |
| Growth Balanced Blended Index4 | | – | | | – | | | | – | | | | – | | | | 5.28 | | | | 9.42 | | | | 5.76 | | | | – | | | | – | |
| Bloomberg Barclays U.S. Aggregate Bond Index5 | | – | | | – | | | | – | | | | – | | | | 2.17 | | | | 2.43 | | | | 4.27 | | | | – | | | | – | |
| MSCI EAFE Index (Net)6 | | – | | | – | | | | – | | | | – | | | | (3.66 | ) | | | 5.62 | | | | 0.72 | | | | – | | | | – | |
| Russell 1000® Growth Index7 | | – | | | – | | | | – | | | | – | | | | 4.22 | | | | 14.14 | | | | 8.24 | | | | – | | | | – | |
| Russell 1000® Value Index8 | | – | | | – | | | | – | | | | – | | | | 12.02 | | | | 14.69 | | | | 5.70 | | | | – | | | | – | |
| Russell 2000® Index9 | | – | | | – | | | | – | | | | – | | | | 12.08 | | | | 13.98 | | | | 6.81 | | | | – | | | | – | |
| S&P 500 Index10 | | – | | | – | | | | – | | | | – | | | | 8.06 | | | | 14.45 | | | | 6.89 | | | | – | | | | – | |
| * | | At the close of business on December 5, 2016, existing Class B shareholders were converted to Class A shareholders. Effective December 6, 2016, Class B shares are no longer offered by the Fund. |
Figures quoted represent past performance, which is no guarantee of future results, and do not reflect taxes that a shareholder may pay on fund distributions or the redemption of fund shares. Investment return and principal value of an investment will fluctuate so that an investor’s shares, when redeemed, may be worth more or less than their original cost. Performance shown without sales charges would be lower if sales charges were reflected. Current performance may be lower or higher than the performance data quoted, which assumes the reinvestment of dividends and capital gains. Current month-end performance is available on the Fund’s website, wellsfargofunds.com.
Index returns do not include transaction costs associated with buying and selling securities, any mutual fund fees or expenses, or any taxes. It is not possible to invest directly in an index.
For Class A shares, the maximum front-end sales charge is 5.75%. For Class B shares, the maximum contingent deferred sales charge is 5.00%. For Class C shares, the maximum contingent deferred sales charge is 1.00%. Performance including a contingent deferred sales charge assumes the sales charge for the corresponding time period. Administrator Class shares are sold without a front-end sales charge or contingent deferred sales charge.
Please see footnotes on page 6.
| | | | | | |
| Performance highlights (unaudited) | | Wells Fargo Allocation Funds | | | 5 | |
Wells Fargo Growth Balanced Fund (continued)
| | | | |
| Ten largest holdings (%) as of November 30, 201611 | |
Amazon.com Incorporated | | | 1.20 | |
Facebook Incorporated Class A | | | 1.03 | |
Microsoft Corporation | | | 1.01 | |
Alphabet Incorporated Class A | | | 0.95 | |
Apple Incorporated | | | 0.85 | |
Exxon Mobil Corporation | | | 0.76 | |
JPMorgan Chase & Company | | | 0.75 | |
Visa Incorporated Class A | | | 0.66 | |
Alphabet Incoporated Class C | | | 0.65 | |
Bank of America Corporation | | | 0.57 | |
|
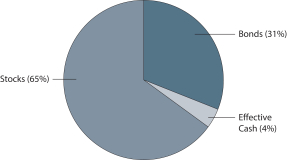
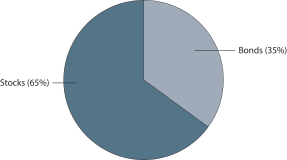
| Current target allocation as of November 30, 201612 |
|
 |
|
| Neutral target allocation |
|
 |
Balanced funds may invest in stocks and bonds. Stock values fluctuate in response to the activities of individual companies and general market and economic conditions. Bond values fluctuate in response to the financial condition of individual issuers, general market and economic conditions, and changes in interest rates. Changes in market conditions and government policies may lead to periods of heightened volatility in the bond market and reduced liquidity for certain bonds held by the Fund. In general, when interest rates rise, bond values fall and investors may lose principal value. Interest-rate changes and their impact on the Fund and its share price can be sudden and unpredictable. The use of derivatives may reduce returns and/or increase volatility. Certain investment strategies tend to increase the total risk of an investment (relative to the broader market). The Fund is exposed to foreign investment risk, mortgage- and asset-backed securities risk, and smaller-company securities risk. Consult the Fund’s prospectus for additional information on these and other risks.
Please see footnotes on page 6.
| | | | |
| 6 | | Wells Fargo Allocation Funds | | Performance highlights (unaudited) |
Wells Fargo Growth Balanced Fund (continued)
| ‡ | Effective February 1, 2017, Analytic Investors, LLC replaced Phocas Financial Corporation as a subadviser. |
| 1 | The Fund is a gateway blended fund that invests all of its assets in two or more affiliated master portfolios of Wells Fargo Master Trust in varying proportions. References to the investment activities of the Fund are intended to refer to the investment activities of the affiliated master portfolios in which it invests. |
| 2 | Reflects the expense ratios as stated in the most recent prospectuses, which include the impact of 0.51% in net expenses from affiliated master portfolios. The expense ratios shown are subject to change and may differ from the annualized expense ratios shown in the financial highlights of this report. |
| 3 | The manager has contractually committed through September 30, 2017, to waive fees and/or reimburse expenses to the extent necessary to cap the Fund’s Total Annual Fund Operating Expenses After Fee Waiver at the amounts shown. After this time, the cap may be increased or the commitment to maintain the cap may be terminated only with the approval of the Board of Trustees. Brokerage commissions, stamp duty fees, interest, taxes, acquired money market fund fees and expenses (if any), and extraordinary expenses are excluded from the expense cap. All other acquired fund fees from the underlying affiliated master portfolios are included in the expense cap. Without this cap, the Fund’s returns would have been lower. |
| 4 | Source: Wells Fargo Funds Management, LLC. The Growth Balanced Blended Index is weighted 35% in the Bloomberg Barclays U.S. Aggregate Bond Index, 9.75% in the MSCI EAFE Index (Net), 16.25% in the Russell 1000® Growth Index, 16.25% in the Russell 1000® Value Index, 6.50% in the Russell 2000® Index and 16.25% in the S&P 500 Index. You cannot invest directly in an index. |
| 5 | The Bloomberg Barclays U.S. Aggregate Bond Index (formerly known as Barclays U.S. Aggregate Bond Index) is a broad-based benchmark that measures the investment-grade, U.S. dollar–denominated, fixed-rate taxable bond market, including Treasuries, government-related and corporate securities, mortgage-backed securities (agency fixed-rate and hybrid adjustable-rate mortgage pass-throughs), asset-backed securities, and commercial mortgage-backed securities. You cannot invest directly in an index. |
| 6 | The Morgan Stanley Capital International (MSCI) Europe, Australasia, Far East (EAFE) Index (Net) is a free-float-adjusted market-capitalization-weighted index that is designed to measure the equity market performance of developed markets, excluding the United States and Canada. The MSCI EAFE Index (Net) consists of the following 21 developed markets country indexes: Australia, Austria, Belgium, Denmark, Finland, France, Germany, Hong Kong, Ireland, Israel, Italy, Japan, the Netherlands, New Zealand, Norway, Portugal, Singapore, Spain, Sweden, Switzerland, and the United Kingdom. Source: MSCI. MSCI makes no representations and shall have no liability whatsoever with respect to any MSCI data contained herein. The MSCI data may not be further redistributed or used as a basis for other indexes or any securities or financial products. This report is not approved, reviewed, or produced by MSCI. You cannot invest directly in an index. |
| 7 | The Russell 1000® Growth Index measures the performance of those Russell 1000 companies with higher price-to-book ratios and higher forecasted growth values. You cannot invest directly in an index. |
| 8 | The Russell 1000® Value Index measures the performance of those Russell 1000 companies with lower price-to-book ratios and lower forecasted growth values. You cannot invest directly in an index. |
| 9 | The Russell 2000® Index measures the performance of the 2,000 smallest companies in the Russell 3000® Index, which represents approximately 8% of the total market capitalization of the Russell 3000® Index. You cannot invest directly in an index. |
| 10 | The S&P 500 Index consists of 500 stocks chosen for market size, liquidity, and industry group representation. It is a market-value-weighted index with each stock’s weight in the index proportionate to its market value. You cannot invest directly in an index. |
| 11 | The ten largest holdings, excluding cash and cash equivalents, are calculated based on the value of the securities of the affiliated master portfolios allocable to the Fund divided by the total net assets of the Fund. Holdings are subject to change and may have changed since the date specified. |
| 12 | Current target allocation includes the effect of any tactical futures overlay that may be in place. These amounts are subject to change and may have changed since the date specified. |
This page is intentionally left blank.
| | | | |
| 8 | | Wells Fargo Allocation Funds | | Performance highlights (unaudited) |
Wells Fargo Moderate Balanced Fund1
Investment objective
The Fund seeks total return, consisting of current income and capital appreciation.
Manager
Wells Fargo Funds Management, LLC
Subadviser
Wells Capital Management Incorporated
Subadvisers for the affiliated master portfolios
Analytic Investors, LLC‡
Artisan Partners Limited Partnership
Cooke & Bieler, L.P.
Galliard Capital Management, Inc.
Golden Capital Management, LLC
LSV Asset Management
Peregrine Capital Management, LLC
Phocas Financial Corporation‡
Wells Capital Management Incorporated
Portfolio managers
Kandarp Acharya, CFA®, FRM
Thomas C. Biwer, CFA®
Petros Bocray, CFA®, FRM
Aldo Ceccarelli, CFA®
Christian Chan, CFA®
Erik Sens, CFA®
Average annual total returns (%) as of November 30, 2016
| | | | | | | | | | | | | | | | | | | | | | | | | | | | | | | | | | |
| | | | | Including sales charge | | | Excluding sales charge | | | Expense ratios2 (%) | |
| | | Inception date | | 1 year | | | 5 year | | | 10 year | | | 1 year | | | 5 year | | | 10 year | | | Gross | | | Net3 | |
| Class A (WFMAX) | | 1-30-2004 | | | (2.97 | ) | | | 5.87 | | | | 3.78 | | | | 2.95 | | | | 7.13 | | | | 4.39 | | | | 1.32 | | | | 1.15 | |
| Class B (WMOBX)* | | 1-30-2004 | | | (2.84 | ) | | | 6.01 | | | | 3.84 | | | | 2.16 | | | | 6.32 | | | | 3.84 | | | | 2.07 | | | | 1.90 | |
| Class C (WFBCX) | | 1-30-2004 | | | 1.15 | | | | 6.33 | | | | 3.60 | | | | 2.15 | | | | 6.33 | | | | 3.60 | | | | 2.07 | | | | 1.90 | |
| Administrator Class (NVMBX) | | 11-11-1994 | | | – | | | | – | | | | – | | | | 3.19 | | | | 7.38 | | | | 4.64 | | | | 1.24 | | | | 0.90 | |
| Moderate Balanced Blended Index4 | | – | | | – | | | | – | | | | – | | | | 3.93 | | | | 6.42 | | | | 4.89 | | | | – | | | | – | |
| Bloomberg Barclays U.S. Aggregate Bond Index5 | | – | | | – | | | | – | | | | – | | | | 2.17 | | | | 2.43 | | | | 4.27 | | | | – | | | | – | |
| Bloomberg Barclays U.S. Short Treasury 9-12 Months Index6 | | – | | | – | | | | – | | | | – | | | | 0.74 | | | | 0.32 | | | | 1.42 | | | | – | | | | – | |
| MSCI EAFE Index (Net)7 | | – | | | – | | | | – | | | | – | | | | (3.66 | ) | | | 5.62 | | | | 0.72 | | | | – | | | | – | |
| Russell 1000® Growth Index8 | | – | | | – | | | | – | | | | – | | | | 4.22 | | | | 14.14 | | | | 8.24 | | | | – | | | | – | |
| Russell 1000® Value Index9 | | – | | | – | | | | – | | | | – | | | | 12.02 | | | | 14.69 | | | | 5.70 | | | | – | | | | – | |
| Russell 2000® Index10 | | – | | | – | | | | – | | | | – | | | | 12.08 | | | | 13.98 | | | | 6.81 | | | | – | | | | – | |
| S&P 500 Index11 | | – | | | – | | | | – | | | | – | | | | 8.06 | | | | 14.45 | | | | 6.89 | | | | – | | | | – | |
| * | | At the close of business on December 5, 2016, existing Class B shareholders were converted to Class A shareholders. Effective December 6, 2016, Class B shares are no longer offered by the Fund. |
Figures quoted represent past performance, which is no guarantee of future results, and do not reflect taxes that a shareholder may pay on fund distributions or the redemption of fund shares. Investment return and principal value of an investment will fluctuate so that an investor’s shares, when redeemed, may be worth more or less than their original cost. Performance shown without sales charges would be lower if sales charges were reflected. Current performance may be lower or higher than the performance data quoted, which assumes the reinvestment of dividends and capital gains. Current month-end performance is available on the Fund’s website, wellsfargofunds.com.
Index returns do not include transaction costs associated with buying and selling securities, any mutual fund fees or expenses, or any taxes. It is not possible to invest directly in an index.
For Class A shares, the maximum front-end sales charge is 5.75%. For Class B shares, the maximum contingent deferred sales charge is 5.00%. For Class C shares, the maximum contingent deferred sales charge is 1.00%. Performance including a contingent deferred sales charge assumes the sales charge for the corresponding time period. Administrator Class shares are sold without a front-end sales charge or contingent deferred sales charge.
Please see footnotes on page 10.
| | | | | | |
| Performance highlights (unaudited) | | Wells Fargo Allocation Funds | | | 9 | |
Wells Fargo Moderate Balanced Fund (continued)
| | | | |
| Ten largest holdings (%) as of November 30, 201612 | |
U.S. Treasury Bond, 0.75%, 9-30-2018 | | | 0.75 | |
Amazon.com Incorporated | | | 0.74 | |
FHLMC Series T-58 Class 4A, 7.5%, 9-25-2043 | | | 0.68 | |
Facebook Incorporated Class A | | | 0.64 | |
Microsoft Corporation | | | 0.62 | |
Alphabet Incorporated Class A | | | 0.59 | |
FNMA Series 2002-W4 Class A4, 6.25%, 5-25-2042 | | | 0.54 | |
Apple Incorporated | | | 0.53 | |
FNMA, 3.50%, 9-1-2032 | | | 0.47 | |
Exxon Mobil Corporation | | | 0.47 | |
|
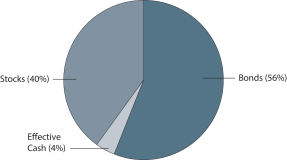
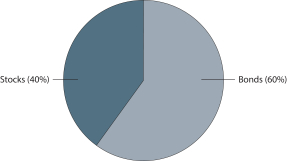
| Current target allocation as of November 30, 201613 |
|
 |
|
| Neutral target allocation |
|
 |
Balanced funds may invest in stocks and bonds. Stock values fluctuate in response to the activities of individual companies and general market and economic conditions. Bond values fluctuate in response to the financial condition of individual issuers, general market and economic conditions, and changes in interest rates. Changes in market conditions and government policies may lead to periods of heightened volatility in the bond market and reduced liquidity for certain bonds held by the Fund. In general, when interest rates rise, bond values fall and investors may lose principal value. Interest-rate changes and their impact on the Fund and its share price can be sudden and unpredictable. The use of derivatives may reduce returns and/or increase volatility. Certain investment strategies tend to increase the total risk of an investment (relative to the broader market). The Fund is exposed to mortgage- and asset-backed securities risk. Consult the Fund’s prospectus for additional information on these and other risks.
Please see footnotes on page 10.
| | | | |
| 10 | | Wells Fargo Allocation Funds | | Performance highlights (unaudited) |
Wells Fargo Moderate Balanced Fund (continued)
| ‡ | Effective February 1, 2017, Analytic Investors, LLC replaced Phocas Financial Corporation as a subadviser. |
| 1 | The Fund is a gateway blended fund that invests all of its assets in two or more affiliated master portfolios of Wells Fargo Master Trust in varying proportions. References to the investment activities of the Fund are intended to refer to the investment activities of the affiliated master portfolios in which it invests. |
| 2 | Reflects the expense ratios as stated in the most recent prospectuses, which include the impact of 0.47% in net expenses from affiliated master portfolios. The expense ratios shown are subject to change and may differ from the annualized expense ratios shown in the financial highlights of this report. |
| 3 | The manager has contractually committed through September 30, 2017, to waive fees and/or reimburse expenses to the extent necessary to cap the Fund’s Total Annual Fund Operating Expenses After Fee Waiver at the amounts shown. After this time, the cap may be increased or the commitment to maintain the cap may be terminated only with the approval of the Board of Trustees. Brokerage commissions, stamp duty fees, interest, taxes, acquired money market fund fees and expenses (if any), and extraordinary expenses are excluded from the expense cap. All other acquired fund fees from the underlying affiliated master portfolios are included in the expense cap. Without this cap, the Fund’s returns would have been lower. |
| 4 | Source: Wells Fargo Funds Management, LLC. The Moderate Balanced Blended Index is weighted 45% in the Bloomberg Barclays U.S. Aggregate Bond Index, 15% in the Bloomberg Barclays U.S. Short Treasury 9-12 Months Index, 6% in the MSCI EAFE Index (Net), 10% in the Russell 1000® Growth Index, 10% in the Russell 1000® Value Index, 4% in the Russell 2000® Index and 10% in the S&P 500 Index. You cannot invest directly in an index. |
| 5 | The Bloomberg Barclays U.S. Aggregate Bond Index (formerly known as Barclays U.S. Aggregate Bond Index) is a broad-based benchmark that measures the investment-grade, U.S. dollar–denominated, fixed-rate taxable bond market, including Treasuries, government-related and corporate securities, mortgage-backed securities (agency fixed-rate and hybrid adjustable-rate mortgage pass-throughs), asset-backed securities, and commercial mortgage-backed securities. You cannot invest directly in an index. |
| 6 | The Bloomberg Barclays U.S. Short Treasury 9–12 Months Index (formerly known as Barclays U.S. Short Treasury 9–12 Months Index) is an unmanaged index that includes aged U.S. Treasury bills, notes, and bonds with a remaining maturity from 9 up to (but not including) 12 months. It excludes zero-coupon STRIPS. You cannot invest directly in an index. |
| 7 | The Morgan Stanley Capital International (MSCI) Europe, Australasia, Far East (EAFE) Index (Net) is a free-float-adjusted market-capitalization-weighted index that is designed to measure the equity market performance of developed markets, excluding the United States and Canada. The MSCI EAFE Index (Net) consists of the following 21 developed markets country indexes: Australia, Austria, Belgium, Denmark, Finland, France, Germany, Hong Kong, Ireland, Israel, Italy, Japan, the Netherlands, New Zealand, Norway, Portugal, Singapore, Spain, Sweden, Switzerland, and the United Kingdom. Source: MSCI. MSCI makes no representations and shall have no liability whatsoever with respect to any MSCI data contained herein. The MSCI data may not be further redistributed or used as a basis for other indexes or any securities or financial products. This report is not approved, reviewed, or produced by MSCI. You cannot invest directly in an index. |
| 8 | The Russell 1000® Growth Index measures the performance of those Russell 1000 companies with higher price-to-book ratios and higher forecasted growth values. You cannot invest directly in an index. |
| 9 | The Russell 1000® Value Index measures the performance of those Russell 1000 companies with lower price-to-book ratios and lower forecasted growth values. You cannot invest directly in an index. |
| 10 | The Russell 2000® Index measures the performance of the 2,000 smallest companies in the Russell 3000® Index, which represents approximately 8% of the total market capitalization of the Russell 3000® Index. You cannot invest directly in an index. |
| 11 | The S&P 500 Index consists of 500 stocks chosen for market size, liquidity, and industry group representation. It is a market-value-weighted index with each stock’s weight in the index proportionate to its market value. You cannot invest directly in an index. |
| 12 | The ten largest holdings, excluding cash and cash equivalents, are calculated based on the value of the securities of the affiliated master portfolios allocable to the Fund divided by the total net assets of the Fund. Holdings are subject to change and may have changed since the date specified. |
| 13 | Current target allocation includes the effect of any tactical futures overlay that may be in place. These amounts are subject to change and may have changed since the date specified. |
| | | | | | |
| Fund expenses (unaudited) | | Wells Fargo Allocation Funds | | | 11 | |
As a shareholder of the Fund, you incur two types of costs: (1) transaction costs, including sales charges (loads) on purchase payments and contingent deferred sales charges (if any) on redemptions and (2) ongoing costs, including management fees, distribution (12b-1) and/or shareholder servicing fees, and other Fund expenses. This example is intended to help you understand your ongoing costs (in dollars) of investing in the Fund and to compare these costs with the ongoing costs of investing in other mutual funds.
The example is based on an investment of $1,000 invested at the beginning of the six-month period and held for the entire period from June 1, 2016 to November 30, 2016.
Actual expenses
The “Actual” line of the table below provides information about actual account values and actual expenses. You may use the information in this line, together with the amount you invested, to estimate the expenses that you paid over the period. Simply divide your account value by $1,000 (for example, an $8,600 account value divided by $1,000 = 8.6), then multiply the result by the number in the “Actual” line under the heading entitled “Expenses paid during period” for your applicable class of shares to estimate the expenses you paid on your account during this period.
Hypothetical example for comparison purposes
The “Hypothetical” line of the table below provides information about hypothetical account values and hypothetical expenses based on the Fund’s actual expense ratio and an assumed rate of return of 5% per year before expenses, which is not the Fund’s actual return. The hypothetical account values and expenses may not be used to estimate the actual ending account balance or expenses you paid for the period. You may use this information to compare the ongoing costs of investing in the Fund and other funds. To do so, compare this 5% hypothetical example with the 5% hypothetical examples that appear in the shareholder reports of the other funds.
Please note that the expenses shown in the table are meant to highlight your ongoing costs only and do not reflect any transactional costs, such as sales charges (loads) and contingent deferred sales charges. Therefore, the “Hypothetical” line of the table is useful in comparing ongoing costs only and will not help you determine the relative total costs of owning different funds. In addition, if these transactional costs were included, your costs would have been higher.
| | | | | | | | | | | | | | | | |
| Wells Fargo Growth Balanced Fund | | Beginning
account value
6-1-2016 | | | Ending
account value
11-30-2016 | | | Expenses
paid during
the period¹ | | | Annualized net
expense ratio | |
Class A | | | | | | | | | | | | | | | | |
Actual | | $ | 1,000.00 | | | $ | 1,027.76 | | | $ | 6.08 | | | | 1.20 | % |
Hypothetical (5% return before expenses) | | $ | 1,000.00 | | | $ | 1,019.00 | | | $ | 6.06 | | | | 1.20 | % |
Class B | | | | | | | | | | | | | | | | |
Actual | | $ | 1,000.00 | | | $ | 1,023.80 | | | $ | 9.87 | | | | 1.95 | % |
Hypothetical (5% return before expenses) | | $ | 1,000.00 | | | $ | 1,015.25 | | | $ | 9.82 | | | | 1.95 | % |
Class C | | | | | | | | | | | | | | | | |
Actual | | $ | 1,000.00 | | | $ | 1,023.84 | | | $ | 9.87 | | | | 1.95 | % |
Hypothetical (5% return before expenses) | | $ | 1,000.00 | | | $ | 1,015.25 | | | $ | 9.82 | | | | 1.95 | % |
Administrator Class | | | | | | | | | | | | | | | | |
Actual | | $ | 1,000.00 | | | $ | 1,028.79 | | | $ | 4.82 | | | | 0.95 | % |
Hypothetical (5% return before expenses) | | $ | 1,000.00 | | | $ | 1,020.25 | | | $ | 4.80 | | | | 0.95 | % |
| Wells Fargo Moderate Balanced Fund | |
Class A | | | | | | | | | | | | | | | | |
Actual | | $ | 1,000.00 | | | $ | 1,016.88 | | | $ | 5.80 | | | | 1.15 | % |
Hypothetical (5% return before expenses) | | $ | 1,000.00 | | | $ | 1,019.25 | | | $ | 5.81 | | | | 1.15 | % |
Class B | | | | | | | | | | | | | | | | |
Actual | | $ | 1,000.00 | | | $ | 1,013.20 | | | $ | 9.56 | | | | 1.90 | % |
Hypothetical (5% return before expenses) | | $ | 1,000.00 | | | $ | 1,015.50 | | | $ | 9.57 | | | | 1.90 | % |
Class C | | | | | | | | | | | | | | | | |
Actual | | $ | 1,000.00 | | | $ | 1,013.15 | | | $ | 9.56 | | | | 1.90 | % |
Hypothetical (5% return before expenses) | | $ | 1,000.00 | | | $ | 1,015.50 | | | $ | 9.57 | | | | 1.90 | % |
Administrator Class | | | | | | | | | | | | | | | | |
Actual | | $ | 1,000.00 | | | $ | 1,018.06 | | | $ | 4.54 | | | | 0.90 | % |
Hypothetical (5% return before expenses) | | $ | 1,000.00 | | | $ | 1,020.50 | | | $ | 4.55 | | | | 0.90 | % |
| 1 | Expenses paid is equal to the annualized net expense ratio of each class multiplied by the average account value over the period, multiplied by the number of days in the most recent fiscal half-year divided by the number of days in the fiscal year (to reflect the one-half-year period). |
| | | | |
| 12 | | Wells Fargo Allocation Funds | | Portfolio of investments—November 30, 2016 (unaudited) |
GROWTH BALANCED FUND
| | | | | | | | | | | | | | | | |
| Security name | | | | | | | | | | | Value | |
| | | | |
Investment Companies: 99.90% | | | | | | | | | | | | | | | | |
| | | | |
| Affiliated Master Portfolios: 99.90% | | | | | | | | | | | | | | | | |
Wells Fargo C&B Large Cap Value Portfolio | | | | | | | | | | | | | | $ | 13,108,968 | |
Wells Fargo Core Bond Portfolio | | | | | | | | | | | | | | | 15,976,020 | |
Wells Fargo Diversified Large Cap Growth Portfolio | | | | | | | | | | | | | | | 38,057,281 | |
Wells Fargo Emerging Growth Portfolio | | | | | | | | | | | | | | | 3,879,679 | |
Wells Fargo Index Portfolio | | | | | | | | | | | | | | | 38,974,062 | |
Wells Fargo International Growth Portfolio | | | | | | | | | | | | | | | 10,789,023 | |
Wells Fargo International Value Portfolio | | | | | | | | | | | | | | | 11,323,065 | |
Wells Fargo Large Company Value Portfolio | | | | | | | | | | | | | | | 26,340,516 | |
Wells Fargo Managed Fixed Income Portfolio | | | | | | | | | | | | | | | 56,002,123 | |
Wells Fargo Real Return Portfolio | | | | | | | | | | | | | | | 8,057,134 | |
Wells Fargo Small Company Growth Portfolio | | | | | | | | | | | | | | | 3,906,658 | |
Wells Fargo Small Company Value Portfolio | | | | | | | | | | | | | | | 8,037,362 | |
| | | | |
Total Investment Companies (Cost $209,305,894) | | | | | | | | | | | | | | | 234,451,891 | |
| | | | | | | | | | | | | | | | |
| | | | |
| | | Yield | | | Maturity date | | | Principal | | | | |
| | | | |
Short-Term Investments: 0.09% | | | | | | | | | | | | | | | | |
| | | | |
| U.S. Treasury Securities: 0.09% | | | | | | | | | | | | | | | | |
U.S. Treasury Bill #(z) | | | 0.00 | % | | | 12-1-2016 | | | $ | 104,000 | | | | 104,000 | |
U.S. Treasury Bill #(z) | | | 0.34 | | | | 12-29-2016 | | | | 104,000 | | | | 103,971 | |
| | | | |
Total Short-Term Investments (Cost $207,971) | | | | | | | | | | | | | | | 207,971 | |
| | | | | | | | | | | | | | | | |
| | | | | | | | |
| Total investments in securities (Cost $209,513,865) * | | | 99.99 | % | | | 234,659,862 | |
Other assets and liabilities, net | | | 0.01 | | | | 14,328 | |
| | | | | | | | |
| Total net assets | | | 100.00 | % | | $ | 234,674,190 | |
| | | | | | | | |
| # | All or a portion of this security is segregated as collateral for investments in derivative instruments. |
| (z) | Zero coupon security. The rate represents the current yield to maturity. |
| * | Cost for federal income tax purposes is $210,486,901and unrealized gains (losses) consists of: |
| | | | |
Gross unrealized gains | | $ | 24,172,961 | |
Gross unrealized losses | | | 0 | |
| | | | |
Net unrealized gains | | $ | 24,172,961 | |
The accompanying notes are an integral part of these financial statements.
| | | | | | |
| Portfolio of investments—November 30, 2016 (unaudited) | | Wells Fargo Allocation Funds | | | 13 | |
MODERATE BALANCED FUND
| | | | | | | | | | | | | | | | |
| Security name | | | | | | | | | | | Value | |
| | | | |
Investment Companies: 99.88% | | | | | | | | | | | | | | | | |
| | | | |
| Affiliated Master Portfolios: 99.88% | | | | | | | | | | | | | | | | |
Wells Fargo C&B Large Cap Value Portfolio | | | | | | | | | | | | | | $ | 6,469,695 | |
Wells Fargo Core Bond Portfolio | | | | | | | | | | | | | | | 16,493,252 | |
Wells Fargo Diversified Large Cap Growth Portfolio | | | | | | | | | | | | | | | 18,645,994 | |
Wells Fargo Emerging Growth Portfolio | | | | | | | | | | | | | | | 1,941,068 | |
Wells Fargo Index Portfolio | | | | | | | | | | | | | | | 19,174,378 | |
Wells Fargo International Growth Portfolio | | | | | | | | | | | | | | | 5,369,360 | |
Wells Fargo International Value Portfolio | | | | | | | | | | | | | | | 5,588,877 | |
Wells Fargo Large Company Value Portfolio | | | | | | | | | | | | | | | 12,950,036 | |
Wells Fargo Managed Fixed Income Portfolio | | | | | | | | | | | | | | | 57,779,470 | |
Wells Fargo Real Return Portfolio | | | | | | | | | | | | | | | 8,294,425 | |
Wells Fargo Small Company Growth Portfolio | | | | | | | | | | | | | | | 1,942,066 | |
Wells Fargo Small Company Value Portfolio | | | | | | | | | | | | | | | 3,973,332 | |
Wells Fargo Stable Income Portfolio | | | | | | | | | | | | | | | 27,799,995 | |
| | | | |
Total Investment Companies (Cost $176,307,213) | | | | | | | | | | | | | | | 186,421,948 | |
| | | | | | | | | | | | | | | | |
| | | | |
| | | Yield | | | Maturity date | | | Principal | | | | |
| | | | |
Short-Term Investments: 0.09% | | | | | | | | | | | | | | | | |
| | | | |
| U.S. Treasury Securities: 0.09% | | | | | | | | | | | | | | | | |
U.S. Treasury Bill #(z) | | | 0.00 | % | | | 12-1-2016 | | | $ | 83,000 | | | | 83,000 | |
U.S. Treasury Bill #(z) | | | 0.34 | | | | 12-29-2016 | | | | 83,000 | | | | 82,977 | |
| | | | |
Total Short-Term Investments (Cost $165,977) | | | | | | | | | | | | | | | 165,977 | |
| | | | | | | | | | | | | | | | |
| | | | | | | | |
| Total investments in securities (Cost $176,473,190) * | | | 99.97 | % | | | 186,587,925 | |
Other assets and liabilities, net | | | 0.03 | | | | 52,222 | |
| | | | | | | | |
| Total net assets | | | 100.00 | % | | $ | 186,640,147 | |
| | | | | | | | |
| # | All or a portion of this security is segregated as collateral for investments in derivative instruments. |
| (z) | Zero coupon security. The rate represents the current yield to maturity. |
| * | Cost for federal income tax purposes is $175,642,936 and unrealized gains (losses) consists of: |
| | | | |
Gross unrealized gains | | $ | 10,944,989 | |
Gross unrealized losses | | | 0 | |
| | | | |
Net unrealized gains | | $ | 10,944,989 | |
The accompanying notes are an integral part of these financial statements.
| | | | |
| 14 | | Wells Fargo Allocation Funds | | Statements of assets and liabilities—November 30, 2016 (unaudited) |
| | | | | | | | |
| | | Growth
Balanced Fund | | | Moderate
Balanced Fund | |
| | |
Assets | | | | | | | | |
Investments | | | | | | | | |
In affiliated Master Portfolios, at value (see cost below) | | $ | 234,451,891 | | | $ | 186,421,948 | |
In unaffiliated securities, at value (see cost below) | | | 207,971 | | | | 165,977 | |
| | | | |
Total investments, at value (see cost below) | | | 234,659,862 | | | | 186,587,925 | |
Receivable for Fund shares sold | | | 235,993 | | | | 294,906 | |
Receivable for daily variation margin on open futures contracts | | | 40,375 | | | | 32,063 | |
Receivable from manager | | | 0 | | | | 553 | |
Prepaid expenses and other assets | | | 50,268 | | | | 30,598 | |
| | | | |
Total assets | | | 234,986,498 | | | | 186,946,045 | |
| | | | |
| | |
Liabilities | | | | | | | | |
Payable for investments purchased | | | 103,971 | | | | 82,977 | |
Payable for Fund shares redeemed | | | 76,940 | | | | 123,824 | |
Management fee payable | | | 6,098 | | | | 0 | |
Distribution fees payable | | | 9,799 | | | | 8,266 | |
Administration fees payable | | | 30,218 | | | | 23,167 | |
Shareholder report expenses payable | | | 22,088 | | | | 15,519 | |
Shareholder servicing fees payable | | | 48,189 | | | | 38,026 | |
Accrued expenses and other liabilities | | | 15,005 | | | | 14,119 | |
| | | | |
Total liabilities | | | 312,308 | | | | 305,898 | |
| | | | |
Total net assets | | $ | 234,674,190 | | | $ | 186,640,147 | |
| | | | |
| | |
NET ASSETS CONSIST OF | | | | | | | | |
Paid-in capital | | $ | 338,304,836 | | | $ | 169,454,530 | |
Undistributed net investment income | | | 4,165,190 | | | | 2,350,731 | |
Accumulated net realized gains (losses) on investments | | | (132,956,104 | ) | | | 4,708,818 | |
Net unrealized gains on investments | | | 25,160,268 | | | | 10,126,068 | |
| | | | |
Total net assets | | $ | 234,674,190 | | | $ | 186,640,147 | |
| | | | |
| | |
COMPUTATION OF NET ASSET VALUE AND OFFERING PRICE PER SHARE | | | | | | | | |
Net assets – Class A | | $ | 62,866,456 | | | $ | 36,348,880 | |
Shares outstanding – Class A1 | | | 1,529,681 | | | | 1,588,027 | |
Net asset value per share – Class A | | | $41.10 | | | | $22.89 | |
Maximum offering price per share – Class A2 | | | $43.61 | | | | $24.29 | |
Net assets – Class B | | $ | 145,853 | | | $ | 88,295 | |
Shares outstanding – Class B1 | | | 3,989 | | | | 3,821 | |
Net asset value per share – Class B | | | $36.56 | | | | $23.11 | |
Net assets – Class C | | $ | 15,738,926 | | | $ | 13,436,513 | |
Shares outstanding – Class C1 | | | 441,447 | | | | 601,409 | |
Net asset value per share – Class C | | | $35.65 | | | | $22.34 | |
Net assets – Administrator Class | | $ | 155,922,955 | | | $ | 136,766,459 | |
Shares outstanding – Administrator Class1 | | | 4,235,567 | | | | 5,917,491 | |
Net asset value per share – Administrator Class | | | $36.81 | | | | $23.11 | |
| | |
Investments in affiliated Master Portfolios, at cost | | $ | 209,305,894 | | | $ | 176,307,213 | |
| | | | |
Investments in unaffiliated securities, at cost | | $ | 207,971 | | | $ | 165,977 | |
| | | | |
Total investments, at cost | | $ | 209,513,865 | | | $ | 176,473,190 | |
| | | | |
| 1 | Each Fund has an unlimited number of authorized shares. |
| 2 | Maximum offering price is computed as 100/94.25 of net asset value. On investments of $50,000 or more, the offering price is reduced. |
The accompanying notes are an integral part of these financial statements.
| | | | | | |
| Statements of operations—six months ended November 30, 2016 (unaudited) | | Wells Fargo Allocation Funds | | | 15 | |
| | | | | | | | |
| | | Growth
Balanced Fund | | | Moderate
Balanced Fund | |
| | |
Investment income | | | | | | | | |
Dividends allocated from affiliated Master Portfolios* | | $ | 1,451,115 | | | $ | 711,639 | |
Interest allocated from affiliated Master Portfolios** | | | 1,330,075 | | | | 1,594,977 | |
Securities lending income allocated from affiliated Master Portfolios | | | 35,741 | | | | 19,562 | |
Interest | | | 220 | | | | 176 | |
Expenses allocated from affiliated Master Portfolios | | | (724,766 | ) | | | (552,252 | ) |
Waivers allocated from affiliated Master Portfolios | | | 69,403 | | | | 85,184 | |
| | | | |
Total investment income | | | 2,161,788 | | | | 1,859,286 | |
| | | | |
| | |
Expenses | | | | | | | | |
Management fee | | | 383,283 | | | | 299,822 | |
Administration fees | | | | | | | | |
Class A | | | 68,324 | | | | 38,460 | |
Class B | | | 173 | | | | 120 | |
Class C | | | 16,964 | | | | 13,966 | |
Administrator Class | | | 113,185 | | | | 97,394 | |
Shareholder servicing fees | | | | | | | | |
Class A | | | 81,338 | | | | 45,786 | |
Class B | | | 206 | | | | 143 | |
Class C | | | 20,195 | | | | 16,626 | |
Administrator Class | | | 217,664 | | | | 187,051 | |
Distribution fees | | | | | | | | |
Class B | | | 619 | | | | 430 | |
Class C | | | 60,585 | | | | 49,878 | |
Custody and accounting fees | | | 5,530 | | | | 4,663 | |
Professional fees | | | 13,566 | | | | 15,681 | |
Registration fees | | | 33,597 | | | | 30,753 | |
Shareholder report expenses | | | 34,377 | | | | 30,442 | |
Trustees’ fees and expenses | | | 8,727 | | | | 11,194 | |
Other fees and expenses | | | 5,047 | | | | 4,901 | |
| | | | |
Total expenses | | | 1,063,380 | | | | 847,310 | |
Less: Fee waivers and/or expense reimbursements | | | (342,070 | ) | | | (302,049 | ) |
| | | | |
Net expenses | | | 721,310 | | | | 545,261 | |
| | | | |
Net investment income | | | 1,440,478 | | | | 1,314,025 | |
| | | | |
| | |
REALIZED AND UNREALIZED GAINS (LOSSES) ON INVESTMENTS | | | | | | | | |
| | |
Net realized gains on: | | | | | | | | |
Securities transactions allocated from affiliated Master Portfolios | | | 5,967,198 | | | | 3,060,537 | |
Futures transactions | | | 443,163 | | | | 339,882 | |
| | | | |
Net realized gains on investments | | | 6,410,361 | | | | 3,400,419 | |
| | | | |
| | |
Net change in unrealized gains (losses) on: | | | | | | | | |
Securities transactions allocated from affiliated Master Portfolios | | | (922,550 | ) | | | (1,110,589 | ) |
Futures transactions | | | 44,546 | | | | 34,670 | |
| | | | |
Net change in unrealized gains (losses) on investments | | | (878,004 | ) | | | (1,075,919 | ) |
| | | | |
Net realized and unrealized gains (losses) on investments | | | 5,532,357 | | | | 2,324,500 | |
| | | | |
Net increase in net assets resulting from operations | | $ | 6,972,835 | | | $ | 3,638,525 | |
| | | | |
| | |
* Net of foreign dividend withholding taxes allocated from affiliated Master Portfolios in the amount of | | | $40,291 | | | | $19,798 | |
** Net of foreign interest withholding taxes allocated from affiliated Master Portfolios in the amount of | | | $124 | | | | $121 | |
The accompanying notes are an integral part of these financial statements.
| | | | |
| 16 | | Wells Fargo Allocation Funds | | Statements of changes in net assets |
| | | | | | | | | | | | | | | | |
| | | Growth Balanced Fund | |
| | | Six months ended
November 30, 2016
(unaudited) | | | Year ended May 31, 2016 | |
| | | | |
Operations | | | | | | | | | | | | | | | | |
Net investment income | | | | | | $ | 1,440,478 | | | | | | | $ | 3,105,608 | |
Net realized gains on investments | | | | | | | 6,410,361 | | | | | | | | 5,629,076 | |
Net change in unrealized gains (losses) on investments | | | | | | | (878,004 | ) | | | | | | | (11,392,210 | ) |
| | | | |
Net increase (decrease) in net assets resulting from operations | | | | | | | 6,972,835 | | | | | | | | (2,657,526 | ) |
| | | | |
| | | | |
Distributions to shareholders from | | | | | | | | | | | | | | | | |
Net investment income | | | | | | | | | | | | | | | | |
Class A | | | | | | | 0 | | | | | | | | (542,593 | ) |
Class C | | | | | | | 0 | | | | | | | | (61,467 | ) |
Administrator Class | | | | | | | 0 | | | | | | | | (2,115,400 | ) |
| | | | |
Total distributions to shareholders | | | | | | | 0 | | | | | | | | (2,719,460 | ) |
| | | | |
| | | | |
Capital share transactions | | | Shares | | | | | | | | Shares | | | | | |
Proceeds from shares sold | | | | | | | | | | | | | | | | |
Class A | | | 70,252 | | | | 2,856,259 | | | | 302,429 | | | | 11,925,156 | |
Class B | | | 238 | | | | 8,516 | | | | 6,666 | | | | 229,343 | |
Class C | | | 9,879 | | | | 349,079 | | | | 129,397 | | | | 4,455,113 | |
Administrator Class | | | 271,750 | | | | 9,869,214 | | | | 668,947 | | | | 23,470,005 | |
| | | | |
| | | | | | | 13,083,068 | | | | | | | | 40,079,617 | |
| | | | |
Reinvestment of distributions | | | | | | | | | | | | | | | | |
Class A | | | 0 | | | | 0 | | | | 13,763 | | | | 533,044 | |
Class C | | | 0 | | | | 0 | | | | 1,662 | | | | 56,244 | |
Administrator Class | | | 0 | | | | 0 | | | | 60,923 | | | | 2,108,567 | |
| | | | |
| | | | | | | 0 | | | | | | | | 2,697,855 | |
| | | | |
Payment for shares redeemed | | | | | | | | | | | | | | | | |
Class A | | | (187,541 | ) | | | (7,620,723 | ) | | | (243,456 | ) | | | (9,569,788 | ) |
Class B | | | (935 | ) | | | (34,184 | ) | | | (6,490 | ) | | | (227,822 | ) |
Class C | | | (34,326 | ) | | | (1,218,072 | ) | | | (67,904 | ) | | | (2,314,573 | ) |
Administrator Class | | | (947,545 | ) | | | (34,482,046 | ) | | | (809,000 | ) | | | (28,424,055 | ) |
| | | | |
| | | | | | | (43,355,025 | ) | | | | | | | (40,536,238 | ) |
| | | | |
Net increase (decrease) in net assets resulting from capital share transactions | | | | | | | (30,271,957 | ) | | | | | | | 2,241,234 | |
| | | | |
Total decrease in net assets | | | | | | | (23,299,122 | ) | | | | | | | (3,135,752 | ) |
| | | | |
| | | | |
Net assets | | | | | | | | | | | | | | | | |
Beginning of period | | | | | | | 257,973,312 | | | | | | | | 261,109,064 | |
| | | | |
End of period | | | | | | $ | 234,674,190 | | | | | | | $ | 257,973,312 | |
| | | | |
Undistributed net investment income | | | | | | $ | 4,165,190 | | | | | | | $ | 2,724,712 | |
| | | | |
The accompanying notes are an integral part of these financial statements.
| | | | | | |
| Statements of changes in net assets | | Wells Fargo Allocation Funds | | | 17 | |
| | | | | | | | | | | | | | | | |
| | | Moderate Balanced Fund | |
| | | Six months ended
November 30, 2016 (unaudited) | | | Year ended May 31, 2016 | |
| | | | |
Operations | | | | | | | | | | | | | | | | |
Net investment income | | | | | | $ | 1,314,025 | | | | | | | $ | 2,606,971 | |
Net realized gains on investments | | | | | | | 3,400,419 | | | | | | | | 3,030,846 | |
Net change in unrealized gains (losses) on investments | | | | | | | (1,075,919 | ) | | | | | | | (4,259,791 | ) |
| | | | |
Net increase in net assets resulting from operations | | | | | | | 3,638,525 | | | | | | | | 1,378,026 | |
| | | | |
| | | | |
Distributions to shareholders from | | | | | | | | | | | | | | | | |
Net investment income | | | | | | | | | | | | | | | | |
Class A | | | | | | | 0 | | | | | | | | (297,818 | ) |
Class B | | | | | | | 0 | | | | | | | | (182 | ) |
Class C | | | | | | | 0 | | | | | | | | (67,037 | ) |
Administrator Class | | | | | | | 0 | | | | | | | | (2,056,183 | ) |
Net realized gains | | | | | | | | | | | | | | | | |
Class A | | | | | | | 0 | | | | | | | | (935,192 | ) |
Class B | | | | | | | 0 | | | | | | | | (5,343 | ) |
Class C | | | | | | | 0 | | | | | | | | (325,466 | ) |
Administrator Class | | | | | | | 0 | | | | | | | | (5,453,616 | ) |
| | | | |
Total distributions to shareholders | | | | | | | 0 | | | | | | | | (9,140,837 | ) |
| | | | |
| | | | |
Capital share transactions | | | Shares | | | | | | | | Shares | | | | | |
Proceeds from shares sold | | | | | | | | | | | | | | | | |
Class A | | | 262,991 | | | | 6,006,745 | | | | 1,014,195 | | | | 22,691,852 | |
Class B | | | 0 | | | | 0 | | | | 5,573 | | | | 125,768 | |
Class C | | | 98,724 | | | | 2,209,474 | | | | 408,018 | | | | 8,992,522 | |
Administrator Class | | | 533,850 | | | | 12,307,924 | | | | 1,214,117 | | | | 27,655,326 | |
| | | | |
| | | | | | | 20,524,143 | | | | | | | | 59,465,468 | |
| | | | |
Reinvestment of distributions | | | | | | | | | | | | | | | | |
Class A | | | 0 | | | | 0 | | | | 53,460 | | | | 1,186,272 | |
Class B | | | 0 | | | | 0 | | | | 203 | | | | 4,571 | |
Class C | | | 0 | | | | 0 | | | | 15,738 | | | | 342,627 | |
Administrator Class | | | 0 | | | | 0 | | | | 327,107 | | | | 7,317,656 | |
| | | | |
| | | | | | | 0 | | | | | | | | 8,851,126 | |
| | | | |
Payment for shares redeemed | | | | | | | | | | | | | | | | |
Class A | | | (274,085 | ) | | | (6,277,612 | ) | | | (350,307 | ) | | | (7,888,089 | ) |
Class B | | | (2,873 | ) | | | (66,881 | ) | | | (7,820 | ) | | | (179,801 | ) |
Class C | | | (64,197 | ) | | | (1,434,845 | ) | | | (117,584 | ) | | | (2,583,589 | ) |
Administrator Class | | | (1,529,240 | ) | | | (35,305,251 | ) | | | (1,089,111 | ) | | | (24,830,085 | ) |
| | | | |
| | | | | | | (43,084,589 | ) | | | | | | | (35,481,564 | ) |
| | | | |
Net increase (decrease) in net assets resulting from capital share transactions | | | | | | | (22,560,446 | ) | | | | | | | 32,835,030 | |
| | | | |
Total increase (decrease) in net assets | | | | | | | (18,921,921 | ) | | | | | | | 25,072,219 | |
| | | | |
| | | | |
Net assets | | | | | | | | | | | | | | | | |
Beginning of period | | | | | | | 205,562,068 | | | | | | | | 180,489,849 | |
| | | | |
End of period | | | | | | $ | 186,640,147 | | | | | | | $ | 205,562,068 | |
| | | | |
Undistributed net investment income | | | | | | $ | 2,350,731 | | | | | | | $ | 1,036,706 | |
| | | | |
The accompanying notes are an integral part of these financial statements.
| | | | |
| 18 | | Wells Fargo Allocation Funds | | Financial highlights |
| | | | | | | | | | | | | | | | | | | | |
| Growth Balanced Fund | | Beginning
net asset
value per
share | | | Net
investment
income | | | Net realized
and unrealized
gains (losses)
on investments | | | Distributions
from net
investment
income | | | Ending
net asset
value per
share | |
Class A | | | | | | | | | | | | | | | | | | | | |
Six months ended November 30, 2016 (unaudited) | | $ | 39.99 | | | | 0.18 | 4 | | | 0.93 | | | | 0.00 | | | $ | 41.10 | |
Year ended May 31, 2016 | | $ | 40.80 | | | | 0.46 | | | | (0.94 | ) | | | (0.33 | ) | | $ | 39.99 | |
Year ended May 31, 2015 | | $ | 37.96 | | | | 0.36 | | | | 2.65 | | | | (0.17 | ) | | $ | 40.80 | |
Year ended May 31, 2014 | | $ | 33.35 | | | | 0.35 | | | | 4.60 | | | | (0.34 | ) | | $ | 37.96 | |
Year ended May 31, 2013 | | $ | 27.77 | | | | 0.32 | | | | 5.70 | | | | (0.44 | ) | | $ | 33.35 | |
Year ended May 31, 2012 | | $ | 29.34 | | | | 0.39 | 4 | | | (1.73 | ) | | | (0.23 | ) | | $ | 27.77 | |
Class B | | | | | | | | | | | | | | | | | | | | |
Six months ended November 30, 2016 (unaudited) | | $ | 35.71 | | | | 0.05 | 4 | | | 0.80 | | | | 0.00 | | | $ | 36.56 | |
Year ended May 31, 2016 | | $ | 36.39 | | | | 0.13 | 4 | | | (0.81 | ) | | | 0.00 | | | $ | 35.71 | |
Year ended May 31, 2015 | | $ | 33.97 | | | | 0.06 | 4 | | | 2.36 | | | | 0.00 | | | $ | 36.39 | |
Year ended May 31, 2014 | | $ | 29.84 | | | | 0.08 | 4 | | | 4.10 | | | | (0.05 | ) | | $ | 33.97 | |
Year ended May 31, 2013 | | $ | 24.80 | | | | 0.12 | 4 | | | 5.05 | | | | (0.13 | ) | | $ | 29.84 | |
Year ended May 31, 2012 | | $ | 26.17 | | | | 0.15 | 4 | | | (1.52 | ) | | | 0.00 | | | $ | 24.80 | |
Class C | | | | | | | | | | | | | | | | | | | | |
Six months ended November 30, 2016 (unaudited) | | $ | 34.82 | | | | 0.05 | 4 | | | 0.78 | | | | 0.00 | | | $ | 35.65 | |
Year ended May 31, 2016 | | $ | 35.63 | | | | 0.12 | 4 | | | (0.79 | ) | | | (0.14 | ) | | $ | 34.82 | |
Year ended May 31, 2015 | | $ | 33.33 | | | | 0.08 | 4 | | | 2.30 | | | | (0.08 | ) | | $ | 35.63 | |
Year ended May 31, 2014 | | $ | 29.38 | | | | 0.10 | 4 | | | 4.00 | | | | (0.15 | ) | | $ | 33.33 | |
Year ended May 31, 2013 | | $ | 24.52 | | | | 0.13 | 4 | | | 4.98 | | | | (0.25 | ) | | $ | 29.38 | |
Year ended May 31, 2012 | | $ | 25.94 | | | | 0.16 | 4 | | | (1.53 | ) | | | (0.05 | ) | | $ | 24.52 | |
Administrator Class | | | | | | | | | | | | | | | | | | | | |
Six months ended November 30, 2016 (unaudited) | | $ | 35.78 | | | | 0.41 | | | | 0.62 | | | | 0.00 | | | $ | 36.81 | |
Year ended May 31, 2016 | | $ | 36.54 | | | | 0.49 | | | | (0.82 | ) | | | (0.43 | ) | | $ | 35.78 | |
Year ended May 31, 2015 | | $ | 33.98 | | | | 0.45 | | | | 2.32 | | | | (0.21 | ) | | $ | 36.54 | |
Year ended May 31, 2014 | | $ | 29.89 | | | | 0.41 | 4 | | | 4.10 | | | | (0.42 | ) | | $ | 33.98 | |
Year ended May 31, 2013 | | $ | 24.93 | | | | 0.65 | 4 | | | 4.82 | | | | (0.51 | ) | | $ | 29.89 | |
Year ended May 31, 2012 | | $ | 26.39 | | | | 0.41 | 4 | | | (1.57 | ) | | | (0.30 | ) | | $ | 24.93 | |
| 1 | Ratios include net expenses allocated from the affiliated Master Portfolios which were as follows: |
| | | | | | | | | | | | | | | | | | | | | | | | |
| | | Six month ended November 30, 2016 (unaudited) | | | Year ended May 31 | |
| | | | 2016 | | | 2015 | | | 2014 | | | 2013 | | | 2012 | |
Class A | | | 0.51 | % | | | 0.51 | % | | | 0.51 | % | | | 0.51 | % | | | 0.50 | % | | | 0.49 | % |
Class B | | | 0.50 | | | | 0.50 | | | | 0.51 | | | | 0.51 | | | | 0.50 | | | | 0.49 | |
Class C | | | 0.51 | | | | 0.50 | | | | 0.51 | | | | 0.51 | | | | 0.50 | | | | 0.49 | |
Administrator Class | | | 0.51 | | | | 0.50 | | | | 0.51 | | | | 0.51 | | | | 0.50 | | | | 0.49 | |
| 2 | Total return calculations do not include any sales charges. Returns for periods of less than one year are not annualized. |
| 3 | Portfolio turnover rate is calculated by aggregating the results of multiplying the Fund’s investment percentage in the respective affiliated Master Portfolio by the corresponding affiliated Master Portfolio’s portfolio turnover rate. |
| 4 | Calculated based upon average shares outstanding |
The accompanying notes are an integral part of these financial statements.
| | | | | | |
| Financial highlights | | Wells Fargo Allocation Funds | | | 19 | |
| | | | | | | | | | | | | | | | | | | | | | |
| Ratio to average net assets (annualized) | | | Total return2 | | | Portfolio
turnover rate3 | | | Net assets at end of period (000s omitted) | |
Net investment income | | | Gross expenses1 | | | Net expenses1 | | | | |
| | | | | | | | | | | | | | | | | | | | | | |
| | 1.01 | % | | | 1.35 | % | | | 1.20 | % | | | 2.78 | % | | | 40 | % | | $ | 62,866 | |
| | 1.10 | % | | | 1.35 | % | | | 1.20 | % | | | (1.14 | )% | | | 79 | % | | $ | 65,866 | |
| | 0.97 | % | | | 1.40 | % | | | 1.20 | % | | | 7.94 | % | | | 75 | % | | $ | 64,223 | |
| | 1.05 | % | | | 1.39 | % | | | 1.20 | % | | | 14.87 | % | | | 77 | % | | $ | 61,117 | |
| | 1.23 | % | | | 1.39 | % | | | 1.20 | % | | | 21.85 | % | | | 80 | % | | $ | 55,777 | |
| | 1.40 | % | | | 1.36 | % | | | 1.20 | % | | | (4.53 | )% | | | 107 | % | | $ | 49,403 | |
| | | | | | | | | | | | | | | | | | | | | | |
| | 0.26 | % | | | 2.09 | % | | | 1.95 | % | | | 2.38 | % | | | 40 | % | | $ | 146 | |
| | 0.36 | % | | | 2.09 | % | | | 1.95 | % | | | (1.87 | )% | | | 79 | % | | $ | 167 | |
| | 0.18 | % | | | 2.14 | % | | | 1.95 | % | | | 7.12 | % | | | 75 | % | | $ | 164 | |
| | 0.25 | % | | | 2.14 | % | | | 1.95 | % | | | 14.00 | % | | | 77 | % | | $ | 476 | |
| | 0.45 | % | | | 2.12 | % | | | 1.95 | % | | | 20.91 | % | | | 80 | % | | $ | 970 | |
| | 0.61 | % | | | 2.10 | % | | | 1.95 | % | | | (5.23 | )% | | | 107 | % | | $ | 1,704 | |
| | | | | | | | | | | | | | | | | | | | | | |
| | 0.26 | % | | | 2.10 | % | | | 1.95 | % | | | 2.38 | % | | | 40 | % | | $ | 15,739 | |
| | 0.36 | % | | | 2.10 | % | | | 1.95 | % | | | (1.88 | )% | | | 79 | % | | $ | 16,225 | |
| | 0.22 | % | | | 2.15 | % | | | 1.95 | % | | | 7.13 | % | | | 75 | % | | $ | 14,349 | |
| | 0.31 | % | | | 2.14 | % | | | 1.95 | % | | | 13.99 | % | | | 77 | % | | $ | 12,637 | |
| | 0.48 | % | | | 2.14 | % | | | 1.95 | % | | | 20.97 | % | | | 80 | % | | $ | 9,326 | |
| | 0.65 | % | | | 2.11 | % | | | 1.95 | % | | | (5.26 | )% | | | 107 | % | | $ | 7,656 | |
| | | | | | | | | | | | | | | | | | | | | | |
| | 1.25 | % | | | 1.27 | % | | | 0.95 | % | | | 2.88 | % | | | 40 | % | | $ | 155,923 | |
| | 1.35 | % | | | 1.27 | % | | | 0.95 | % | | | (0.86 | )% | | | 79 | % | | $ | 175,715 | |
| | 1.22 | % | | | 1.24 | % | | | 0.95 | % | | | 8.16 | % | | | 75 | % | | $ | 182,373 | |
| | 1.29 | % | | | 1.23 | % | | | 0.95 | % | | | 15.16 | % | | | 77 | % | | $ | 175,094 | |
| | 1.47 | % | | | 1.22 | % | | | 0.95 | % | | | 22.18 | % | | | 80 | % | | $ | 175,142 | |
| | 1.64 | % | | | 1.20 | % | | | 0.95 | % | | | (4.30 | )% | | | 107 | % | | $ | 220,021 | |
The accompanying notes are an integral part of these financial statements.
| | | | |
| 20 | | Wells Fargo Allocation Funds | | Financial highlights |
| | | | | | | | | | | | | | | | | | | | | | | | |
| Moderate Balanced Fund | | Beginning
net asset
value per
share | | | Net
investment
income | | | Net realized
and unrealized
gains (losses)
on investments | | | Distributions
from net
investment
income | | | Distributions
from net
realized gains | | | Ending
net asset
value per
share | |
Class A | | | | | | | | | | | | | | | | | | | | | | | | |
Six months ended November 30, 2016 (unaudited) | | $ | 22.51 | | | | 0.13 | | | | 0.25 | | | | 0.00 | | | | 0.00 | | | $ | 22.89 | |
Year ended May 31, 2016 | | $ | 23.57 | | | | 0.28 | 4 | | | (0.23 | ) | | | (0.26 | ) | | | (0.85 | ) | | $ | 22.51 | |
Year ended May 31, 2015 | | $ | 23.19 | | | | 0.32 | | | | 1.01 | | | | (0.44 | ) | | | (0.51 | ) | | $ | 23.57 | |
Year ended May 31, 2014 | | $ | 21.21 | | | | 0.29 | 4 | | | 1.82 | | | | (0.13 | ) | | | 0.00 | | | $ | 23.19 | |
Year ended May 31, 2013 | | $ | 18.84 | | | | 0.21 | | | | 2.50 | | | | (0.34 | ) | | | 0.00 | | | $ | 21.21 | |
Year ended May 31, 2012 | | $ | 19.64 | | | | 0.32 | | | | (0.54 | ) | | | (0.58 | ) | | | 0.00 | | | $ | 18.84 | |
Class B | | | | | | | | | | | | | | | | | | | | | | | | |
Six months ended November 30, 2016 (unaudited) | | $ | 22.81 | | | | 0.05 | 4 | | | 0.25 | | | | 0.00 | | | | 0.00 | | | $ | 23.11 | |
Year ended May 31, 2016 | | $ | 23.81 | | | | 0.11 | 4 | | | (0.23 | ) | | | (0.03 | ) | | | (0.85 | ) | | $ | 22.81 | |
Year ended May 31, 2015 | | $ | 23.16 | | | | 0.09 | 4 | | | 1.07 | | | | 0.00 | | | | (0.51 | ) | | $ | 23.81 | |
Year ended May 31, 2014 | | $ | 21.25 | | | | 0.11 | 4 | | | 1.83 | | | | (0.03 | ) | | | 0.00 | | | $ | 23.16 | |
Year ended May 31, 2013 | | $ | 18.86 | | | | 0.13 | 4 | | | 2.43 | | | | (0.17 | ) | | | 0.00 | | | $ | 21.25 | |
Year ended May 31, 2012 | | $ | 19.58 | | | | 0.18 | 4 | | | (0.53 | ) | | | (0.37 | ) | | | 0.00 | | | $ | 18.86 | |
Class C | | | | | | | | | | | | | | | | | | | | | | | | |
Six months ended November 30, 2016 (unaudited) | | $ | 22.05 | | | | 0.05 | 4 | | | 0.24 | | | | 0.00 | | | | 0.00 | | | $ | 22.34 | |
Year ended May 31, 2016 | | $ | 23.18 | | | | 0.11 | 4 | | | (0.23 | ) | | | (0.16 | ) | | | (0.85 | ) | | $ | 22.05 | |
Year ended May 31, 2015 | | $ | 22.79 | | | | 0.09 | 4 | | | 1.04 | | | | (0.23 | ) | | | (0.51 | ) | | $ | 23.18 | |
Year ended May 31, 2014 | | $ | 20.96 | | | | 0.12 | 4 | | | 1.80 | | | | (0.09 | ) | | | 0.00 | | | $ | 22.79 | |
Year ended May 31, 2013 | | $ | 18.63 | | | | 0.11 | | | | 2.42 | | | | (0.20 | ) | | | 0.00 | | | $ | 20.96 | |
Year ended May 31, 2012 | | $ | 19.45 | | | | 0.18 | 4 | | | (0.53 | ) | | | (0.47 | ) | | | 0.00 | | | $ | 18.63 | |
Administrator Class | | | | | | | | | | | | | | | | | | | | | | | | |
Six months ended November 30, 2016 (unaudited) | | $ | 22.70 | | | | 0.22 | | | | 0.19 | | | | 0.00 | | | | 0.00 | | | $ | 23.11 | |
Year ended May 31, 2016 | | $ | 23.75 | | | | 0.32 | | | | (0.21 | ) | | | (0.31 | ) | | | (0.85 | ) | | $ | 22.70 | |
Year ended May 31, 2015 | | $ | 23.38 | | | | 0.33 | 4 | | | 1.07 | | | | (0.52 | ) | | | (0.51 | ) | | $ | 23.75 | |
Year ended May 31, 2014 | | $ | 21.36 | | | | 0.38 | | | | 1.79 | | | | (0.15 | ) | | | 0.00 | | | $ | 23.38 | |
Year ended May 31, 2013 | | $ | 18.96 | | | | 0.41 | | | | 2.38 | | | | (0.39 | ) | | | 0.00 | | | $ | 21.36 | |
Year ended May 31, 2012 | | $ | 19.77 | | | | 0.40 | | | | (0.58 | ) | | | (0.63 | ) | | | 0.00 | | | $ | 18.96 | |
| 1 | Ratios include net expenses allocated from the affiliated Master Portfolios which were as follows: |
| | | | | | | | | | | | | | | | | | | | | | | | |
| | | Six month ended
November 30, 2016
(unaudited) | | | Year ended May 31 | |
| | | | 2016 | | | 2015 | | | 2014 | | | 2013 | | | 2012 | |
Class A | | | 0.47 | % | | | 0.47 | % | | | 0.47 | % | | | 0.46 | % | | | 0.46 | % | | | 0.45 | % |
Class B | | | 0.46 | | | | 0.46 | | | | 0.47 | | | | 0.46 | | | | 0.46 | | | | 0.45 | |
Class C | | | 0.47 | | | | 0.47 | | | | 0.47 | | | | 0.46 | | | | 0.46 | | | | 0.45 | |
Administrator Class | | | 0.47 | | | | 0.47 | | | | 0.47 | | | | 0.46 | | | | 0.46 | | | | 0.45 | |
| 2 | Total return calculations do not include any sales charges. Returns for periods of less than one year are not annualized. |
| 3 | Portfolio turnover rate is calculated by aggregating the results of multiplying the Fund’s investment percentage in the respective affiliated Master Portfolio by the corresponding affiliated Master Portfolio’s portfolio turnover rate. |
| 4 | Calculated based upon average shares outstanding |
The accompanying notes are an integral part of these financial statements.
| | | | | | |
| Financial highlights | | Wells Fargo Allocation Funds | | | 21 | |
| | | | | | | | | | | | | | | | | | | | | | |
| Ratio to average net assets (annualized) | | | Total
return2 | | | Portfolio
turnover
rate3 | | | Net assets at
end of period
(000s omitted) | |
Net investment
income | | | Gross
expenses1 | | | Net
expenses1 | | | | |
| | | | | | | | | | | | | | | | | | | | | | |
| | 1.18 | % | | | 1.33 | % | | | 1.15 | % | | | 1.69 | % | | | 43 | % | | $ | 36,349 | |
| | 1.26 | % | | | 1.32 | % | | | 1.15 | % | | | 0.34 | % | | | 87 | % | | $ | 35,993 | |
| | 1.14 | % | | | 1.36 | % | | | 1.15 | % | | | 5.87 | % | | | 84 | % | | $ | 20,782 | |
| | 1.29 | % | | | 1.36 | % | | | 1.15 | % | | | 9.94 | % | | | 89 | % | | $ | 18,169 | |
| | 1.41 | % | | | 1.36 | % | | | 1.15 | % | | | 14.57 | % | | | 86 | % | | $ | 10,344 | |
| | 1.68 | % | | | 1.33 | % | | | 1.15 | % | | | (0.93 | )% | | | 115 | % | | $ | 9,935 | |
| | | | | | | | | | | | | | | | | | | | | | |
| | 0.42 | % | | | 2.06 | % | | | 1.90 | % | | | 1.32 | % | | | 43 | % | | $ | 88 | |
| | 0.48 | % | | | 2.06 | % | | | 1.90 | % | | | (0.43 | )% | | | 87 | % | | $ | 153 | |
| | 0.38 | % | | | 2.10 | % | | | 1.90 | % | | | 5.07 | % | | | 84 | % | | $ | 208 | |
| | 0.50 | % | | | 2.11 | % | | | 1.90 | % | | | 9.15 | % | | | 89 | % | | $ | 380 | |
| | 0.65 | % | | | 2.11 | % | | | 1.90 | % | | | 13.65 | % | | | 86 | % | | $ | 613 | |
| | 0.94 | % | | | 2.08 | % | | | 1.90 | % | | | (1.66 | )% | | | 115 | % | | $ | 807 | |
| | | | | | | | | | | | | | | | | | | | | | |
| | 0.43 | % | | | 2.08 | % | | | 1.90 | % | | | 1.32 | % | | | 43 | % | | $ | 13,437 | |
| | 0.51 | % | | | 2.07 | % | | | 1.90 | % | | | (0.44 | )% | | | 87 | % | | $ | 12,501 | |
| | 0.40 | % | | | 2.11 | % | | | 1.90 | % | | | 5.06 | % | | | 84 | % | | $ | 6,042 | |
| | 0.54 | % | | | 2.11 | % | | | 1.90 | % | | | 9.15 | % | | | 89 | % | | $ | 4,469 | |
| | 0.66 | % | | | 2.11 | % | | | 1.90 | % | | | 13.65 | % | | | 86 | % | | $ | 2,576 | |
| | 0.92 | % | | | 2.08 | % | | | 1.90 | % | | | (1.67 | )% | | | 115 | % | | $ | 2,319 | |
| | | | | | | | | | | | | | | | | | | | | | |
| | 1.43 | % | | | 1.24 | % | | | 0.90 | % | | | 1.81 | % | | | 43 | % | | $ | 136,766 | |
| | 1.48 | % | | | 1.23 | % | | | 0.90 | % | | | 0.59 | % | | | 87 | % | | $ | 156,915 | |
| | 1.39 | % | | | 1.20 | % | | | 0.90 | % | | | 6.13 | % | | | 84 | % | | $ | 153,457 | |
| | 1.52 | % | | | 1.20 | % | | | 0.90 | % | | | 10.18 | % | | | 89 | % | | $ | 144,248 | |
| | 1.66 | % | | | 1.20 | % | | | 0.90 | % | | | 14.81 | % | | | 86 | % | | $ | 146,729 | |
| | 1.92 | % | | | 1.17 | % | | | 0.90 | % | | | (0.66 | )% | | | 115 | % | | $ | 172,587 | |
The accompanying notes are an integral part of these financial statements.
| | | | |
| 22 | | Wells Fargo Allocation Funds | | Notes to financial statements (unaudited) |
1. ORGANIZATION
Wells Fargo Funds Trust (the “Trust”), a Delaware statutory trust organized on March 10, 1999, is an open-end management investment company registered under the Investment Company Act of 1940, as amended (the “1940 Act”). As an investment company, the Trust follows the accounting and reporting guidance in Financial Accounting Standards Board (“FASB”) Accounting Standards Codification Topic 946, Financial Services – Investment Companies. These financial statements report on the following funds: Wells Fargo Growth Balanced Fund (“Growth Balanced Fund”) and Wells Fargo Moderate Balanced Fund (“Moderate Balanced Fund”) (each, a “Fund”, collectively, the “Funds”). Each Fund is a diversified series of the Trust.
Each Fund seeks to achieve its investment objective by investing all investable assets in separate diversified portfolios (each, an “affiliated Master Portfolio”, collectively, the “affiliated Master Portfolios”) of Wells Fargo Master Trust, a registered open-end management investment company. Each affiliated Master Portfolio directly acquires portfolio securities, and a Fund investing in an affiliated Master Portfolio acquires an indirect interest in those securities. Each Fund accounts for its investment in the affiliated Master Portfolios as partnership investments and records on a daily basis its share of the affiliated Master Portfolio’s income, expense and realized and unrealized gains and losses. The financial statements of the affiliated Master Portfolios for the six months ended November 30, 2016 are included in this report and should be read in conjunction with each Fund’s financial statements. As of November 30, 2016, the Funds own the following percentages of the affiliated Master Portfolios:
| | | | | | | | |
| | | Growth
Balanced
Fund | | | Moderate
Balanced
Fund | |
Wells Fargo C&B Large Cap Value Portfolio | | | 4 | % | �� | | 2 | % |
Wells Fargo Core Bond Portfolio | | | 0 | * | | | 0 | * |
Wells Fargo Diversified Large Cap Growth Portfolio | | | 36 | | | | 18 | |
Wells Fargo Emerging Growth Portfolio | | | 0 | * | | | 0 | * |
Wells Fargo Index Portfolio | | | 2 | | | | 1 | |
Wells Fargo International Growth Portfolio | | | 8 | | | | 4 | |
Wells Fargo International Value Portfolio | | | 2 | | | | 1 | |
Wells Fargo Large Company Value Portfolio | | | 35 | | | | 17 | |
Wells Fargo Managed Fixed Income Portfolio | | | 49 | | | | 51 | |
Wells Fargo Real Return Portfolio | | | 11 | | | | 11 | |
Wells Fargo Small Company Growth Portfolio | | | 0 | * | | | 0 | * |
Wells Fargo Small Company Value Portfolio | | | 4 | | | | 2 | |
Wells Fargo Stable Income Portfolio | | | N/A | | | | 100 | |
| * | The amount owned is less than 1%. |
2. SIGNIFICANT ACCOUNTING POLICIES
The following significant accounting policies, which are consistently followed in the preparation of the financial statements of each Fund, are in conformity with U.S. generally accepted accounting principles which require management to make estimates and assumptions that affect the reported amounts of assets and liabilities, disclosure of contingent assets and liabilities at the date of the financial statements, and the reported amounts of revenues and expenses during the reporting period. Actual results could differ from those estimates.
Securities valuation
All investments are valued each business day as of the close of regular trading on the New York Stock Exchange (generally 4 p.m. Eastern Time), although the Fund may deviate from this calculation time under unusual or unexpected circumstances.
Investments in the affiliated Master Portfolios are valued daily based on each Fund’s proportionate share of each affiliated Master Portfolio’s net assets, which are also valued daily. Securities held in the affiliated Master Portfolios are valued as discussed in the Notes to Financial Statements of the affiliated Master Portfolios, which are included elsewhere in this report.
Futures that are listed on a foreign or domestic exchange or market are valued at the official closing price or, if none, the last sales price.
| | | | | | |
| Notes to financial statements (unaudited) | | Wells Fargo Allocation Funds | | | 23 | |
Debt securities are valued at the evaluated bid price provided by an independent pricing service or, if a reliable price is not available, the quoted bid price from an independent broker-dealer.
Investments which are not valued using any of the methods discussed above are valued at their fair value, as determined in good faith by the Board of Trustees of the Funds. The Board of Trustees has established a Valuation Committee comprised of the Trustees and has delegated to it the authority to take any actions regarding the valuation of portfolio securities that the Valuation Committee deems necessary or appropriate, including determining the fair value of portfolio securities, unless the determination has been delegated to the Management Valuation Team of Wells Fargo Funds Management, LLC (“Funds Management”). The Board of Trustees retains the authority to make or ratify any valuation decisions or approve any changes to the Valuation Procedures as it deems appropriate. On a quarterly basis, the Board of Trustees receives reports on any valuation actions taken by the Valuation Committee or the Management Valuation Team which may include items for ratification.
Valuations of fair valued securities are compared to the next actual sales price when available, or other appropriate market values, to assess the continued appropriateness of the fair valuation methodologies used. These securities are fair valued on a day-to-day basis, taking into consideration changes to appropriate market information and any significant changes to the inputs considered in the valuation process until there is a readily available price provided on an exchange or by an independent pricing service. Valuations received from an independent pricing service or independent broker-dealer quotes are periodically validated by comparisons to most recent trades and valuations provided by other independent pricing services in addition to the review of prices by the manager and/or subadviser. Unobservable inputs used in determining fair valuations are identified based on the type of security, taking into consideration factors utilized by market participants in valuing the investment, knowledge about the issuer and the current market environment.
Futures contracts
Each Fund is subject to interest rate risk and equity price risk in the normal course of pursuing its investment objectives. The Fund may buy and sell futures contracts in order to gain exposure to, or protect against, changes in security values and interest rates. The primary risks associated with the use of futures contracts are the imperfect correlation between changes in market values of securities held by the Fund and the prices of futures contracts, and the possibility of an illiquid market.
The aggregate principal amounts of the contracts are not recorded in the financial statements. Fluctuations in the value of the contracts are recorded in the Statements of Assets and Liabilities as an asset or liability and in the Statements of Operations as unrealized gains or losses until the contracts are closed, at which point they are recorded as net realized gains or losses on futures contracts. With futures contracts, there is minimal counterparty risk to the Fund since futures are exchange traded and the exchange’s clearinghouse, as counterparty to all exchange traded futures, guarantees the futures against default.
Security transactions and income recognition
Securities transactions are recorded on a trade date basis in each Fund and each affiliated Master Portfolio. Realized gains or losses in each Fund and each affiliated Master Portfolio are recorded on the basis of identified cost.
Interest income is accrued daily and bond discounts are accreted and premiums are amortized daily based on the effective interest method by each Fund and each affiliated Master Portfolio. To the extent debt obligations are placed on non-accrual status, any related interest income may be reduced by writing off interest receivables when the collection of all or a portion of interest has become doubtful based on consistently applied procedures. If the issuer subsequently resumes interest payments or when the collectability of interest is reasonably assured, the debt obligation is removed from non-accrual status.
Dividend income in each affiliated Master Portfolio is recognized on the ex-dividend date, except for certain dividends from foreign securities which are recorded as soon as the custodian verifies the ex-dividend date.
Income from foreign securities in each affiliated Master Portfolio is recorded net of foreign taxes withheld where recovery of such taxes is not assured.
Each Fund records daily its proportionate share of each affiliated Master Portfolio’s interest and dividend income and realized and unrealized gains or losses.
Distributions to shareholders
Distributions to shareholders from net investment income and net realized gains, if any, are recorded on the ex-dividend date. Such distributions are determined in conformity with federal income tax regulations, which may differ in amount or character from net investment income and realized gains recognized for purposes of U.S. generally accepted accounting principles.
| | | | |
| 24 | | Wells Fargo Allocation Funds | | Notes to financial statements (unaudited) |
Federal and other taxes
Each Fund is treated as a separate entity for federal income tax purposes. Each Fund intends to continue to qualify as a regulated investment company by distributing substantially all of its investment company taxable income and any net realized capital gains (after reduction for capital loss carryforwards) sufficient to relieve it from all, or substantially all, federal income taxes. Accordingly, no provision for federal income taxes was required.
Each Fund’s income and federal excise tax returns and all financial records supporting those returns for the prior three fiscal years are subject to examination by the federal and Delaware revenue authorities. Management has analyzed each Fund’s tax positions taken on federal, state, and foreign tax returns for all open tax years and does not believe that there are any uncertain tax positions that require recognition of a tax liability.
As of May 31, 2016, Growth Balanced Fund had capital loss carryforwards that are available to offset future net realized capital gains in the amount of $137,481,627 with $54,903,400 expiring in 2017 and $82,578,227 expiring in 2018.
As of May 31, 2016, Growth Balanced Fund had current year deferred post-October capital losses of $1,137,602, which was recognized on the first day of the current fiscal year.
Class allocations
The separate classes of shares offered by each Fund differ principally in applicable sales charges, distribution, shareholder servicing, and administration fees. Class specific expenses are charged directly to that share class. Investment income, common expenses, and realized and unrealized gains (losses) on investments are allocated daily to each class of shares based on the relative proportion of net assets of each class.
3. FAIR VALUATION MEASUREMENTS
Fair value measurements of investments are determined within a framework that has established a fair value hierarchy based upon the various data inputs utilized in determining the value of each Fund’s investments. The three-level hierarchy gives the highest priority to unadjusted quoted prices in active markets for identical assets or liabilities (Level 1) and the lowest priority to significant unobservable inputs (Level 3). Each Fund’s investments are classified within the fair value hierarchy based on the lowest level of input that is significant to the fair value measurement. The inputs are summarized into three broad levels as follows:
| ∎ | | Level 1 – quoted prices in active markets for identical securities |
| ∎ | | Level 2 – other significant observable inputs (including quoted prices for similar securities, interest rates, prepayment speeds, credit risk, use of amortized cost, etc.) |
| ∎ | | Level 3 – significant unobservable inputs (including the Fund’s own assumptions in determining the fair value of investments) |
The inputs or methodologies used for valuing investments in securities are not necessarily an indication of the risk associated with investing in those securities.
The following is a summary of the inputs used in valuing each Fund’s assets and liabilities as of November 30, 2016:
| | | | | | | | | | | | | | | | |
| Growth Balanced Fund | | Quoted prices
(Level 1) | | | Other significant
observable inputs
(Level 2) | | | Significant
unobservable inputs (Level 3) | | | Total | |
Assets | | | | | | | | | | | | | | | | |
Investments in: | | | | | | | | | | | | | | | | |
| | | | |
Short-term investments | | | | | | | | | | | | | | | | |
U.S. Treasury securities | | $ | 207,971 | | | $ | 0 | | | $ | 0 | | | $ | 207,971 | |
Investments measured at net asset value* | | | | | | | | | | | | | | | 234,451,891 | |
| | | 207,971 | | | | 0 | | | | 0 | | | | 234,659,862 | |
Futures contracts | | | 40,375 | | | | 0 | | | | 0 | | | | 40,375 | |
Total assets | | $ | 248,346 | | | $ | 0 | | | $ | 0 | | | $ | 234,700,237 | |
| * | Investments that are measured at fair value using the net asset value per share (or its equivalent) as a practical expedient have not been categorized in the fair value hierarchy. The fair value amount presented in the table is intended to permit reconciliation of the fair value hierarchy to the amounts presented in the Statements of Assets and Liabilities. At November 30, 2016, the aggregated affiliated Master Portfolios measured at fair value using the net asset value per share (or its equivalent) were valued at $234,451,891. Each affiliated Master Portfolio does not have a redemption period notice, can be redeemed daily and does not have any unfunded commitments. |
| | | | | | |
| Notes to financial statements (unaudited) | | Wells Fargo Allocation Funds | | | 25 | |
| | | | | | | | | | | | | | | | |
| Moderate Balanced Fund | | Quoted prices
(Level 1) | | | Other significant
observable inputs
(Level 2) | | | Significant
unobservable inputs (Level 3) | | | Total | |
Assets | | | | | | | | | | | | | | | | |
Investments in: | | | | | | | | | | | | | | | | |
| | | | |
Short-term investments | | | | | | | | | | | | | | | | |
U.S. Treasury securities | | $ | 165,977 | | | $ | 0 | | | $ | 0 | | | $ | 165,977 | |
Investments measured at net asset value* | | | | | | | | | | | | | | | 186,421,948 | |
| | | 165,977 | | | | 0 | | | | 0 | | | | 186,587,925 | |
Futures contracts | | | 32,063 | | | | 0 | | | | 0 | | | | 32,063 | |
Total assets | | $ | 198,040 | | | $ | 0 | | | $ | 0 | | | $ | 186,619,988 | |
| * | Investments that are measured at fair value using the net asset value per share (or its equivalent) as a practical expedient have not been categorized in the fair value hierarchy. The fair value amount presented in the table is intended to permit reconciliation of the fair value hierarchy to the amounts presented in the Statements of Assets and Liabilities. At November 30, 2016, the aggregated affiliated Master Portfolios measured at fair value using the net asset value per share (or its equivalent) were valued at $186,421,948. Each affiliated Master Portfolio does not have a redemption period notice, can be redeemed daily and does not have any unfunded commitments. |
Futures contracts are reported at their variation margin at measurement date, which represents the amount due to the Fund at that date. All other assets and liabilities are reported at their market value at measurement date.
The Funds recognize transfers between levels within the fair value hierarchy at the end of the reporting period. At November 30, 2016, the Funds did not have any transfers into/out of Level 1, Level 2, or Level 3.
The investment objective of each affiliated Master Portfolio is as follows:
| | |
| Affiliated Master Portfolio | | Investment objective |
Wells Fargo C&B Large Cap Value Portfolio | | Seeks maximum long-term total return (current income and capital appreciation), consistent with minimizing risk to principal |
Wells Fargo Core Bond Portfolio | | Seeks total return, consisting of income and capital appreciation |
Wells Fargo Diversified Large Cap Growth Portfolio | | Seeks long-term capital appreciation |
Wells Fargo Emerging Growth Portfolio | | Seeks long-term capital appreciation |
Wells Fargo Index Portfolio | | Seeks to replicate the total return of the S&P 500 Index, before expenses |
Wells Fargo International Growth Portfolio | | Seeks long-term capital appreciation |
Wells Fargo International Value Portfolio | | Seeks long-term capital appreciation |
Wells Fargo Large Company Value Portfolio | | Seeks long-term capital appreciation |
Wells Fargo Managed Fixed Income Portfolio | | Seeks consistent fixed-income returns |
Wells Fargo Real Return Portfolio | | Seeks returns that exceed the rate of inflation over the long-term |
Wells Fargo Small Company Growth Portfolio | | Seeks long-term capital appreciation |
Wells Fargo Small Company Value Portfolio | | Seeks long-term capital appreciation |
Wells Fargo Stable Income Portfolio | | Seeks current income consistent with capital preservation |
4. TRANSACTIONS WITH AFFILIATES
Management fee
Funds Management, an indirect wholly owned subsidiary of Wells Fargo & Company (“Wells Fargo”), is the manager of each Fund and provides advisory and fund-level administrative services under an investment management agreement. Under the investment management agreement, Funds Management is responsible for, among other services, implementing the investment objectives and strategies of each Fund, supervising the subadviser, providing fund-level administrative services in connection with each Fund’s operations, and providing any other fund-level administrative services reasonably necessary for the operation of each Fund. As compensation for its services under the investment management agreement, Funds Management is entitled to receive an annual management fee starting at 0.30% and declining to 0.22% as the average daily net assets of each Fund increase. For the six months ended November 30, 2016, the management fee was equivalent to an annual rate of 0.30% of each Fund’s average daily net assets.
| | | | |
| 26 | | Wells Fargo Allocation Funds | | Notes to financial statements (unaudited) |
Funds Management has retained the services of a subadviser to provide daily portfolio management to the Funds. The fee for subadvisory services is borne by Funds Management. Wells Capital Management Incorporated, an affiliate of Funds Management and an indirect, wholly owned subsidiary of Wells Fargo, is the subadviser to each Fund and is entitled to receive a fee from Funds Management at an annual rate starting at 0.10% and declining to 0.05% as the average daily net assets of each Fund increase.
Funds Management also serves as the adviser to each affiliated Master Portfolio and is entitled to receive a fee from each affiliated Master Portfolio for those services.
Administration fees
Under a class-level administration agreement, Funds Management provides class-level administrative services to the Fund, which includes paying fees and expenses for services provided by the transfer agent, sub-transfer agents, omnibus account servicers and record-keepers. As compensation for its services under the class-level administration agreement, Funds Management receives an annual fee which is calculated based on the average daily net assets of each class as follows:
| | | | |
| | | Class-level
administration fee | |
Class A, Class B, Class C | | | 0.21 | % |
Administrator Class | | | 0.13 | |
Funds Management has contractually waived and/or reimbursed management and administration fees to the extent necessary to maintain certain net operating expense ratios for the Funds. Waiver of fees and/or reimbursement of expenses by Funds Management were made first from fund level expenses on a proportionate basis and then from class specific expenses. Funds Management has committed through September 30, 2017 to waive fees and/or reimburse expenses to the extent necessary to cap each Fund’s expenses as follows:
| | | | | | | | | | | | | | | | |
| | | Class A | | | Class B | | | Class C | | | Administrator
Class | |
Growth Balanced Fund | | | 1.20 | % | | | 1.95 | % | | | 1.95 | % | | | 0.95 | % |
Moderate Balanced Fund | | | 1.15 | | | | 1.90 | | | | 1.90 | | | | 0.90 | |
Net expenses from affiliated Master Portfolios are included in the expense caps. After the expiration date, each expense cap may be increased or the commitment to maintain the cap may be terminated only with the approval of the Board of Trustees.
Distribution fees
The Trust has adopted a Distribution Plan for Class B and Class C shares of the applicable Funds pursuant to Rule 12b-1 under the 1940 Act. Distribution fees are charged to the Class B and Class C shares and paid to Wells Fargo Funds Distributor, LLC (“Funds Distributor”), the principal underwriter of each Fund, at an annual rate of 0.75% of the average daily net assets of Class B and Class C shares.
In addition, Funds Distributor is entitled to receive the front-end sales charge from the purchase of Class A shares and a contingent deferred sales charge on the redemption of certain Class A shares. Funds Distributor is also entitled to receive the contingent deferred sales charges from redemptions of Class B and Class C shares. For the six months ended November 30, 2016, Funds Distributor received the following amounts in front-end sales charges.
| | | | |
| | | Class A | |
Growth Balanced Fund | | $ | 5,693 | |
Moderate Balanced Fund | | | 3,747 | |
Shareholder servicing fees
The Trust has entered into contracts with one or more shareholder servicing agents, whereby Class A, Class B, Class C, and Administrator Class of each applicable Fund are charged a fee at an annual rate of 0.25% of the average daily net assets of each respective class.
A portion of these total shareholder servicing fees were paid to affiliates of Wells Fargo.
| | | | | | |
| Notes to financial statements (unaudited) | | Wells Fargo Allocation Funds | | | 27 | |
5. INVESTMENT PORTFOLIO TRANSACTIONS
Purchases and sales of investments, excluding short-term securities, for the six months ended November 30, 2016 were as follows:
| | | | | | | | | | | | | | | | |
| | | Purchases at cost* | | | Sales proceeds* | |
| | | U.S.
government | | | Non-U.S.
government | | | U.S.
government | | | Non-U.S.
government | |
Growth Balanced Fund | | $ | 43,170,349 | | | $ | 61,338,206 | | | $ | 39,867,246 | | | $ | 67,135,999 | |
Moderate Balanced Fund | | | 47,211,185 | | | | 42,001,414 | | | | 45,858,380 | | | | 42,691,597 | |
| * | The Funds seek to achieve their investment objective by investing all of their investable assets in affiliated Master Portfolios. Purchases and sales related to these investments have been calculated by aggregating the results of multiplying each Fund’s ownership percentage of the respective affiliated Master Portfolio by the corresponding affiliated Master Portfolio’s purchases and sales. Purchases and sales of unaffiliated securities in which the Funds invest are actual purchases and sale of those securities. |
6. DERIVATIVE TRANSACTIONS
During the six months ended November 30, 2016, the Funds entered into futures contracts to gain market exposure to certain asset classes consistent with an active asset allocation strategy.
At November 30, 2016, the Funds had short futures contracts outstanding as follows:
| | | | | | | | | | | | | | | | | | | | | | | | |
| | | Expiration date | | | Counterparty | | | Contracts | | | Type | | | Contract
value at
November 30, 2016 | | | Unrealized
gains | |
Growth Balanced Fund | | | 3-22-2017 | | | | Goldman Sachs | | | | 68 Short | | | | 10-Year U.S. Treasury Notes | | | $ | 8,467,063 | | | $ | 14,271 | |
Moderate Balanced Fund | | | 3-22-2017 | | | | Goldman Sachs | | | | 54 Short | | | | 10-Year U.S. Treasury Notes | | | | 6,723,844 | | | | 11,333 | |
The Funds had an average notional amounts in futures contracts during the six months ended November 30, 2016 as follows:
| | | | |
| | | Short contracts | |
Growth Balanced Fund | | $ | 2,393,813 | |
Moderate Balanced Fund | | | 2,930,912 | |
A summary of derivative instruments by primary risk exposure is outlined in the following tables.
The fair value of derivative instruments as of November 30, 2016 was as follows for Growth Balanced Fund:
| | | | | | | | | | | | |
| | | Asset derivatives | | | Liability derivatives | |
| | | Statements of Assets and
Liabilities location | | Fair value | | | Statements of Assets and
Liabilities location | | Fair value | |
Interest rate risk | | Receivable for daily variation margin on open futures contracts | | $ | 40,375 | * | | Payable for daily variation margin on open futures contracts | | $ | 0 | * |
| * | Only the current day’s variation margin as of November 30, 2016 is reported separately on the Statements of Assets and Liabilities. |
The effect of derivative instruments on the Statements of Operations for the year ended November 30, 2016 was as follows for Growth Balanced Fund:
| | | | | | | | |
| | | Amount of realized
gains on
derivatives | | | Change in unrealized
gains (losses) on
derivatives | |
Interest rate risk | | $ | 281,950 | | | $ | 44,546 | |
Equity risk | | | 161,213 | | | | 0 | |
| | | $ | 443,163 | | | $ | 44,546 | |
| | | | |
| 28 | | Wells Fargo Allocation Funds | | Notes to financial statements (unaudited) |
The fair value of derivative instruments as of November 30, 2016 was as follows for Moderate Balanced Fund:
| | | | | | | | | | | | |
| | | Asset derivatives | | | Liability derivatives | |
| | | Statements of Assets and
Liabilities location | | Fair value | | | Statements of Assets and
Liabilities location | | Fair value | |
Interest rate risk | | Receivable for daily variation margin on open futures contracts | | $ | 32,063 | * | | Payable for daily variation margin on open futures contracts | | $ | 0 | * |
| * | Only the current day’s variation margin as of November 30, 2016 is reported separately on the Statements of Assets and Liabilities. |
The effect of derivative instruments on the Statements of Operations for the year ended November 30, 2016 was as follows for Moderate Balanced Fund:
| | | | | | | | |
| | | Amount of realized
gains on
derivatives | | | Change in unrealized
gains (losses) on
derivatives | |
Interest rate risk | | $ | 212,609 | | | $ | 34,670 | |
Equity risk | | | 127,273 | | | | 0 | |
| | | $ | 339,882 | | | $ | 34,670 | |
For certain types of derivative transactions, the Funds have entered into International Swaps and Derivatives Association, Inc. master agreements (“ISDA Master Agreements”) or similar agreements with approved counterparties. The ISDA Master Agreements or similar agreements may have requirements to deliver/deposit securities or cash to/with an exchange or broker-dealer as collateral and allow the Funds to offset, with each counterparty, certain derivative financial instrument’s assets and/or liabilities with collateral held or pledged. Collateral requirements differ by type of derivative. Collateral or margin requirements are set by the broker or exchange clearing house for exchange traded derivatives while collateral terms are contract specific for over-the-counter traded derivatives. Cash collateral that has been pledged to cover obligations of the Funds under ISDA Master Agreements or similar agreements, if any, are reported separately in the Statements of Assets and Liabilities. Securities pledged as collateral, if any, are noted in the Portfolio of Investments. With respect to balance sheet offsetting, absent an event of default by the counterparty or a termination of the agreement, the reported amounts of financial assets and financial liabilities in the Statements of Assets and Liabilities are not offset across transactions between each Fund and the applicable counterparty. A reconciliation of the gross amounts on the Statements of Assets and Liabilities to the net amounts by derivative type, including any collateral exposure, is as follows:
| | | | | | | | | | | | | | | | | | | | |
| | | Derivative type | | Counterparty | | Gross amounts
of assets in the
Statements of
Assets and
Liabilities | | | Amounts
subject to
netting
agreements | | | Collateral
received | | | Net amount of
assets | |
| Growth Balanced Fund | | Futures – variation margin | | Goldman Sachs | | $ | 40,375 | | | $ | 0 | | | $ | 0 | | | $ | 40,375 | |
| Moderate Balanced Fund | | Futures – variation margin | | Goldman Sachs | | | 32,063 | | | | 0 | | | | 0 | | | | 32,063 | |
7. BANK BORROWINGS
The Trust (excluding the money market funds and certain other funds) and Wells Fargo Variable Trust are parties to a $250,000,000 revolving credit agreement whereby the Fund is permitted to use bank borrowings for temporary or emergency purposes, such as to fund shareholder redemption requests. Interest under the credit agreement is charged to the Fund based on a borrowing rate equal to the higher of the Federal Funds rate in effect on that day plus 1.25% or the overnight LIBOR rate in effect on that day plus 1.25%. In addition, an annual commitment fee equal to 0.25% of the unused balance is allocated to each participating fund. Prior to August 30, 2016, the revolving credit agreement amount was $200,000,000 and the annual commitment fee was equal to 0.20% of the unused balance which was allocated to each participating fund.
For the sixth months ended November 30, 2016, there were no borrowings by Funds under the agreement.
| | | | | | |
| Notes to financial statements (unaudited) | | Wells Fargo Allocation Funds | | | 29 | |
8. INDEMNIFICATION
Under the Trust’s organizational documents, the officers and Trustees have been granted certain indemnification rights against certain liabilities that may arise out of performance of their duties to the Trust. Additionally, in the normal course of business, the Trust may enter into contracts with service providers that contain a variety of indemnification clauses. The Trust’s maximum exposure under these arrangements is dependent on future claims that may be made against the Funds and, therefore, cannot be estimated.
9. REGULATORY CHANGES
In October 2016, the Securities and Exchange Commission (“SEC”) adopted new rules and forms and amended existing rules and forms (together, “final rules”) intended to modernize and enhance the reporting and disclosure of information by registered investment companies and to enhance liquidity risk management by open-end mutual funds and exchange-traded funds. The final rules will enhance the quality of information available to investors and will allow the SEC to more effectively collect and use data reported by funds. In part, the final rules amend Regulation S-X and require standardized, enhanced disclosure about derivatives in the Fund’s financial statements, as well as other amendments. The compliance date for the amendments to Regulation S-X is August 1, 2017 while the compliance date for the new form types is June 1, 2018 and the compliance date for the liquidity risk management program requirements is December 1, 2018. Management is currently assessing the potential impact of these enhancements and their impact on the financial statement disclosures and reporting requirements.
10. SUBSEQUENT DISTRIBUTIONS
On December 16, 2016, Funds declared distributions from net investment income gains to shareholders of record on December 15, 2016. The per share amounts payable on December 19, 2016 were as follows:
| | | | | | | | |
| | | Growth
Balanced Fund | | | Moderate
Balanced Fund | |
Net investment income | | | | | | | | |
Class A | | $ | 0.42382 | | | $ | 0.29254 | |
Class C | | | 0.18603 | | | | 0.13777 | |
Administrator Class | | | 0.52814 | | | | 0.34776 | |
On December 7, 2016, Moderate Balanced Funds declared distributions from capital gains to shareholders of record on December 6, 2016. The per share amounts payable on December 8, 2016 were as follows:
| | | | | | | | |
| | | Short term capital gains | | | Long term
capital gains | |
Class A | | $ | 0.07504 | | | $ | 0.29175 | |
Class C | | | 0.07504 | | | | 0.29175 | |
Administrator Class | | | 0.07504 | | | | 0.29175 | |
| | | | |
| 30 | | Wells Fargo Allocation Funds | | Portfolio of investments—November 30, 2016 (unaudited) |
C&B LARGE CAP VALUE PORTFOLIO
| | | | | | | | | | | | | | | | |
| Security name | | | | | | | | Shares | | | Value | |
| | | | |
Common Stocks: 97.20% | | | | | | | | | | | | | | | | |
| | | | |
Consumer Discretionary: 13.25% | | | | | | | | | | | | | | | | |
| | | | |
| Hotels, Restaurants & Leisure: 3.14% | | | | | | | | | | | | | | | | |
Brinker International Incorporated « | | | | | | | | | | | 86,707 | | | $ | 4,605,009 | |
Carnival Corporation | | | | | | | | | | | 119,800 | | | | 6,158,918 | |
| |
| | | | 10,763,927 | |
| | | | | | | | | | | | | | | | |
| | | | |
| Household Durables: 1.56% | | | | | | | | | | | | | | | | |
Whirlpool Corporation | | | | | | | | | | | 32,900 | | | | 5,344,276 | |
| | | | | | | | | | | | | | | | |
| | | | |
| Media: 5.50% | | | | | | | | | | | | | | | | |
Omnicom Group Incorporated | | | | | | | | | | | 113,146 | | | | 9,836,913 | |
Twenty-First Century Fox Incorporated Class A | | | | | | | | | | | 321,351 | | | | 9,033,177 | |
| |
| | | | 18,870,090 | |
| | | | | | | | | | | | | | | | |
| | | | |
| Specialty Retail: 0.39% | | | | | | | | | | | | | | | | |
Tiffany & Company | | | | | | | | | | | 16,480 | | | | 1,359,270 | |
| | | | | | | | | | | | | | | | |
| | | | |
| Textiles, Apparel & Luxury Goods: 2.66% | | | | | | | | | | | | | | | | |
Gildan Activewear Incorporated | | | | | | | | | | | 335,432 | | | | 9,120,396 | |
| | | | | | | | | | | | | | | | |
| | | | |
Consumer Staples: 5.55% | | | | | | | | | | | | | | | | |
| | | | |
| Beverages: 1.81% | | | | | | | | | | | | | | | | |
Diageo plc ADR « | | | | | | | | | | | 61,320 | | | | 6,208,037 | |
| | | | | | | | | | | | | | | | |
| | | | |
| Personal Products: 2.32% | | | | | | | | | | | | | | | | |
Unilever NV ADR | | | | | | | | | | | 199,349 | | | | 7,940,071 | |
| | | | | | | | | | | | | | | | |
| | | | |
| Tobacco: 1.42% | | | | | | | | | | | | | | | | |
Philip Morris International | | | | | | | | | | | 55,300 | | | | 4,881,884 | |
| | | | | | | | | | | | | | | | |
| | | | |
Energy: 5.60% | | | | | | | | | | | | | | | | |
| | | | |
| Oil, Gas & Consumable Fuels: 5.60% | | | | | | | | | | | | | | | | |
Chevron Corporation | | | | | | | | | | | 34,400 | | | | 3,837,664 | |
Exxon Mobil Corporation | | | | | | | | | | | 90,400 | | | | 7,891,920 | |
World Fuel Services Corporation | | | | | | | | | | | 168,323 | | | | 7,483,641 | |
| |
| | | | 19,213,225 | |
| | | | | | | | | | | | | | | | |
| | | | |
Financials: 25.42% | | | | | | | | | | | | | | | | |
| | | | |
| Banks: 7.92% | | | | | | | | | | | | | | | | |
Bank of America Corporation | | | | | | | | | | | 359,850 | | | | 7,600,032 | |
JPMorgan Chase & Company | | | | | | | | | | | 136,700 | | | | 10,959,239 | |
PNC Financial Services Group Incorporated | | | | | | | | | | | 78,000 | | | | 8,622,120 | |
| |
| | | | 27,181,391 | |
| | | | | | | | | | | | | | | | |
| | | | |
| Capital Markets: 2.85% | | | | | | | | | | | | | | | | |
State Street Corporation | | | | | | | | | | | 124,200 | | | | 9,786,960 | |
| | | | | | | | | | | | | | | | |
The accompanying notes are an integral part of these financial statements.
| | | | | | |
| Portfolio of investments—November 30, 2016 (unaudited) | | Wells Fargo Allocation Funds | | | 31 | |
C&B LARGE CAP VALUE PORTFOLIO
| | | | | | | | | | | | | | | | |
| Security name | | | | | | | | Shares | | | Value | |
| | | | |
| Consumer Finance: 2.13% | | | | | | | | | | | | | | | | |
American Express Company | | | | | | | | | | | 101,200 | | | $ | 7,290,448 | |
| | | | | | | | | | | | | | | | |
| | | | |
| Diversified Financial Services: 2.41% | | | | | | | | | | | | | | | | |
Berkshire Hathaway Incorporated Class B † | | | | | | | | | | | 52,440 | | | | 8,256,154 | |
| | | | | | | | | | | | | | | | |
| | | | |
| Insurance: 10.11% | | | | | | | | | | | | | | | | |
Chubb Limited | | | | | | | | | | | 54,900 | | | | 7,027,200 | |
FNF Group | | | | | | | | | | | 263,600 | | | | 8,419,384 | |
RenaissanceRe Holdings Limited | | | | | | | | | | | 79,290 | | | | 10,352,102 | |
The Progressive Corporation | | | | | | | | | | | 266,100 | | | | 8,861,130 | |
| |
| | | | 34,659,816 | |
| | | | | | | | | | | | | | | | |
| | | | |
Health Care: 14.15% | | | | | | | | | | | | | | | | |
| | | | |
| Health Care Equipment & Supplies: 4.02% | | | | | | | | | | | | | | | | |
Abbott Laboratories | | | | | | | | | | | 234,200 | | | | 8,915,994 | |
Becton Dickinson & Company | | | | | | | | | | | 28,800 | | | | 4,870,080 | |
| |
| | | | 13,786,074 | |
| | | | | | | | | | | | | | | | |
| | | | |
| Health Care Providers & Services: 7.39% | | | | | | | | | | | | | | | | |
Cardinal Health Incorporated | | | | | | | | | | | 94,440 | | | | 6,706,184 | |
Laboratory Corporation of America Holdings † | | | | | | | | | | | 85,650 | | | | 10,779,053 | |
UnitedHealth Group Incorporated | | | | | | | | | | | 49,615 | | | | 7,855,047 | |
| |
| | | | 25,340,284 | |
| | | | | | | | | | | | | | | | |
| | | | |
| Pharmaceuticals: 2.74% | | | | | | | | | | | | | | | | |
Allergan plc | | | | | | | | | | | 18,100 | | | | 3,516,830 | |
Johnson & Johnson | | | | | | | | | | | 53,015 | | | | 5,900,570 | |
| |
| | | | 9,417,400 | |
| | | | | | | | | | | | | | | | |
| | | | |
Industrials: 17.04% | | | | | | | | | | | | | | | | |
| | | | |
| Aerospace & Defense: 2.17% | | | | | | | | | | | | | | | | |
Rockwell Collins Incorporated | | | | | | | | | | | 80,367 | | | | 7,451,628 | |
| | | | | | | | | | | | | | | | |
| | | | |
| Air Freight & Logistics: 2.08% | | | | | | | | | | | | | | | | |
United Parcel Service Incorporated Class B | | | | | | | | | | | 61,500 | | | | 7,129,080 | |
| | | | | | | | | | | | | | | | |
| | | | |
| Electrical Equipment: 4.03% | | | | | | | | | | | | | | | | |
AMETEK Incorporated | | | | | | | | | | | 107,900 | | | | 5,109,065 | |
Eaton Corporation plc | | | | | | | | | | | 131,200 | | | | 8,726,112 | |
| |
| | | | 13,835,177 | |
| | | | | | | | | | | | | | | | |
| | | | |
| Industrial Conglomerates: 1.28% | | | | | | | | | | | | | | | | |
3M Company | | | | | | | | | | | 25,600 | | | | 4,396,544 | |
| | | | | | | | | | | | | | | | |
| | | | |
| Machinery: 4.44% | | | | | | | | | | | | | | | | |
Donaldson Company Incorporated | | | | | | | | | | | 181,000 | | | | 7,341,360 | |
Parker-Hannifin Corporation | | | | | | | | | | | 56,771 | | | | 7,887,195 | |
| |
| | | | 15,228,555 | |
| | | | | | | | | | | | | | | | |
The accompanying notes are an integral part of these financial statements.
| | | | |
| 32 | | Wells Fargo Allocation Funds | | Portfolio of investments—November 30, 2016 (unaudited) |
C&B LARGE CAP VALUE PORTFOLIO
| | | | | | | | | | | | | | | | |
| Security name | | | | | | | | Shares | | | Value | |
| | | | |
| Trading Companies & Distributors: 3.04% | | | | | | | | | | | | | | | | |
AerCap Holdings NV † | | | | | | | | | | | 243,100 | | | $ | 10,416,835 | |
| | | | | | | | | | | | | | | | |
| | | | |
Information Technology: 8.91% | | | | | | | | | | | | | | | | |
| | | | |
| Electronic Equipment, Instruments & Components: 1.00% | | | | | | | | | | | | | | | | |
TE Connectivity Limited | | | | | | | | | | | 50,500 | | | | 3,415,820 | |
| | | | | | | | | | | | | | | | |
| | | | |
| IT Services: 5.73% | | | | | | | | | | | | | | | | |
Alliance Data Systems Corporation | | | | | | | | | | | 34,988 | | | | 8,004,555 | |
Cognizant Technology Solutions Corporation Class A † | | | | | | | | | | | 134,800 | | | | 7,424,784 | |
The Western Union Company | | | | | | | | | | | 199,900 | | | | 4,203,897 | |
| | | | |
| | | | | | | | | | | | | | | 19,633,236 | |
| | | | | | | | | | | | | | | | |
| | | | |
| Semiconductors & Semiconductor Equipment: 2.18% | | | | | | | | | | | | | | | | |
Linear Technology Corporation | | | | | | | | | | | 119,800 | | | | 7,491,094 | |
| | | | | | | | | | | | | | | | |
| | | | |
Materials: 5.67% | | | | | | | | | | | | | | | | |
| | | | |
| Chemicals: 2.14% | | | | | | | | | | | | | | | | |
Axalta Coating Systems Limited † | | | | | | | | | | | 278,550 | | | | 7,359,291 | |
| | | | | | | | | | | | | | | | |
| | | | |
| Containers & Packaging: 3.53% | | | | | | | | | | | | | | | | |
Ball Corporation | | | | | | | | | | | 67,800 | | | | 5,089,069 | |
Crown Holdings Incorporated † | | | | | | | | | | | 128,900 | | | | 7,010,871 | |
| | | | |
| | | | | | | | | | | | | | | 12,099,940 | |
| | | | | | | | | | | | | | | | |
| | | | |
Real Estate: 1.61% | | | | | | | | | | | | | | | | |
| | | | |
| Real Estate Management & Development: 1.61% | | | | | | | | | | | | | | | | |
CBRE Group Incorporated Class A † | | | | | | | | | | | 189,600 | | | | 5,505,981 | |
| | | | | | | | | | | | | | | | |
| | | | |
Total Common Stocks (Cost $252,599,693) | | | | | | | | | | | | | | | 333,382,884 | |
| | | | | | | | | | | | | | | | |
| | | | |
| | | Yield | | | | | | | | | | |
| | | | |
Short-Term Investments: 5.28% | | | | | | | | | | | | | | | | |
| | | | |
| Investment Companies: 5.28% | | | | | | | | | | | | | | | | |
Securities Lending Cash Investment LLC (l)(r)(u) | | | 0.65 | % | | | | | | | 6,884,213 | | | | 6,884,901 | |
Wells Fargo Government Money Market Fund Select Class (l)(u) | | | 0.31 | | | | | | | | 11,232,148 | | | | 11,232,148 | |
| | | | |
Total Short-Term Investments (Cost $18,117,000) | | | | | | | | | | | | | | | 18,117,049 | |
| | | | | | | | | | | | | | | | |
| | | | | | | | |
| Total investments in securities (Cost $270,716,693) * | | | 102.48 | % | | | 351,499,933 | |
Other assets and liabilities, net | | | (2.48 | ) | | | (8,502,706 | ) |
| | | | | | | | |
| Total net assets | | | 100.00 | % | | $ | 342,997,227 | |
| | | | | | | | |
| « | All or a portion of this security is on loan. |
| † | Non-income-earning security |
| (l) | The issuer of the security is an affiliated person of the Portfolio as defined in the Investment Company Act of 1940. |
| (r) | The investment is a non-registered investment vehicle purchased with cash collateral received from securities on loan. |
| (u) | The rate represents the 7-day annualized yield at period end. |
| * | Cost for federal income tax purposes is $271,791,273 and unrealized gains (losses) consists of: |
| | | | |
Gross unrealized gains | | $ | 82,237,521 | |
Gross unrealized losses | | | (2,528,861 | ) |
| | | | |
Net unrealized gains | | $ | 79,708,660 | |
The accompanying notes are an integral part of these financial statements.
| | | | | | |
| Portfolio of investments—November 30, 2016 (unaudited) | | Wells Fargo Allocation Funds | | | 33 | |
DIVERSIFIED LARGE CAP GROWTH PORTFOLIO
| | | | | | | | | | | | | | | | |
| Security name | | | | | | | | Shares | | | Value | |
| | | | |
Common Stocks: 98.53% | | | | | | | | | | | | | | | | |
| | | | |
Consumer Discretionary: 20.20% | | | | | | | | | | | | | | | | |
| | | | |
| Auto Components: 0.03% | | | | | | | | | | | | | | | | |
Delphi Automotive plc | | | | | | | | | | | 570 | | | $ | 36,480 | |
| | | | | | | | | | | | | | | | |
| | | | |
| Distributors: 0.19% | | | | | | | | | | | | | | | | |
LKQ Corporation † | | | | | | | | | | | 6,270 | | | | 205,844 | |
| | | | | | | | | | | | | | | | |
| | | | |
| Hotels, Restaurants & Leisure: 2.88% | | | | | | | | | | | | | | | | |
Marriott International Incorporated Class A | | | | | | | | | | | 2,930 | | | | 230,825 | |
Starbucks Corporation | | | | | | | | | | | 35,748 | | | | 2,072,312 | |
Yum China Holdings Incorporated † | | | | | | | | | | | 220 | | | | 6,186 | |
Yum! Brands Incorporated | | | | | | | | | | | 11,620 | | | | 736,592 | |
| | | | |
| | | | | | | | | | | | | | | 3,045,915 | |
| | | | | | | | | | | | | | | | |
| | | | |
| Internet & Direct Marketing Retail: 6.19% | | | | | | | | | | | | | | | | |
Amazon.com Incorporated † | | | | | | | | | | | 7,980 | | | | 5,989,549 | |
The Priceline Group Incorporated † | | | | | | | | | | | 380 | | | | 571,398 | |
| | | | |
| | | | | | | | | | | | | | | 6,560,947 | |
| | | | | | | | | | | | | | | | |
| | | | |
| Media: 1.00% | | | | | | | | | | | | | | | | |
Charter Communications Incorporated Class A † | | | | | | | | | | | 3,500 | | | | 963,585 | |
The Walt Disney Company | | | | | | | | | | | 940 | | | | 93,173 | |
| | | | |
| | | | | | | | | | | | | | | 1,056,758 | |
| | | | | | | | | | | | | | | | |
| | | | |
| Multiline Retail: 2.30% | | | | | | | | | | | | | | | | |
Dollar Tree Incorporated † | | | | | | | | | | | 27,590 | | | | 2,432,334 | |
| | | | | | | | | | | | | | | | |
| | | | |
| Specialty Retail: 6.09% | | | | | | | | | | | | | | | | |
Burlington Stores Incorporated † | | | | | | | | | | | 2,560 | | | | 225,075 | |
O’Reilly Automotive Incorporated † | | | | | | | | | | | 7,210 | | | | 1,979,145 | |
The Home Depot Incorporated | | | | | | | | | | | 20,440 | | | | 2,644,936 | |
The TJX Companies Incorporated | | | | | | | | | | | 11,140 | | | | 872,708 | |
Tractor Supply Company | | | | | | | | | | | 6,730 | | | | 505,221 | |
ULTA Salon Cosmetics & Fragrance Incorporated † | | | | | | | | | | | 880 | | | | 228,360 | |
| | | | |
| | | | | | | | | | | | | | | 6,455,445 | |
| | | | | | | | | | | | | | | | |
| | | | |
| Textiles, Apparel & Luxury Goods: 1.52% | | | | | | | | | | | | | | | | |
Nike Incorporated Class B | | | | | | | | | | | 12,510 | | | | 626,376 | |
Under Armour Incorporated Class A « | | | | | | | | | | | 10,670 | | | | 328,636 | |
Under Armour Incorporated Class C † | | | | | | | | | | | 3,215 | | | | 82,883 | |
VF Corporation | | | | | | | | | | | 10,480 | | | | 571,265 | |
| | | | |
| | | | | | | | | | | | | | | 1,609,160 | |
| | | | | | | | | | | | | | | | |
| | | | |
Consumer Staples: 5.26% | | | | | | | | | | | | | | | | |
| | | | |
| Beverages: 2.39% | | | | | | | | | | | | | | | | |
Constellation Brands Incorporated Class A | | | | | | | | | | | 7,900 | | | | 1,194,006 | |
Monster Beverage Corporation † | | | | | | | | | | | 18,360 | | | | 821,610 | |
The Coca-Cola Company | | | | | | | | | | | 12,640 | | | | 510,024 | |
| | | | |
| | | | | | | | | | | | | | | 2,525,640 | |
| | | | | | | | | | | | | | | | |
The accompanying notes are an integral part of these financial statements.
| | | | |
| 34 | | Wells Fargo Allocation Funds | | Portfolio of investments—November 30, 2016 (unaudited) |
DIVERSIFIED LARGE CAP GROWTH PORTFOLIO
| | | | | | | | | | | | | | | | |
| Security name | | | | | | | | Shares | | | Value | |
| | | | |
| Food & Staples Retailing: 0.95% | | | | | | | | | | | | | | | | |
Costco Wholesale Corporation | | | | | | | | | | | 6,730 | | | $ | 1,010,240 | |
| | | | | | | | | | | | | | | | |
| | | | |
| Household Products: 0.50% | | | | | | | | | | | | | | | | |
Colgate-Palmolive Company | | | | | | | | | | | 8,150 | | | | 531,625 | |
| | | | | | | | | | | | | | | | |
| | | | |
| Personal Products: 0.95% | | | | | | | | | | | | | | | | |
The Estee Lauder Companies Incorporated Class A | | | | | | | | | | | 12,930 | | | | 1,004,661 | |
| | | | | | | | | | | | | | | | |
| | | | |
| Tobacco: 0.47% | | | | | | | | | | | | | | | | |
Reynolds American Incorporated | | | | | | | | | | | 9,250 | | | | 500,425 | |
| | | | | | | | | | | | | | | | |
| | | | |
Energy: 1.68% | | | | | | | | | | | | | | | | |
| | | | |
| Energy Equipment & Services: 0.38% | | | | | | | | | | | | | | | | |
Schlumberger Limited | | | | | | | | | | | 4,850 | | | | 407,643 | |
| | | | | | | | | | | | | | | | |
| | | | |
| Oil, Gas & Consumable Fuels: 1.30% | | | | | | | | | | | | | | | | |
Concho Resources Incorporated † | | | | | | | | | | | 8,620 | | | | 1,232,832 | |
EOG Resources Incorporated | | | | | | | | | | | 1,210 | | | | 124,049 | |
Extraction Oil & Gas Incorporated † | | | | | | | | | | | 753 | | | | 17,718 | |
| | | | |
| | | | | | | | | | | | | | | 1,374,599 | |
| | | | | | | | | | | | | | | | |
| | | | |
Financials: 2.17% | | | | | | | | | | | | | | | | |
| | | | |
| Capital Markets: 2.17% | | | | | | | | | | | | | | | | |
Goldman Sachs Group Incorporated | | | | | | | | | | | 660 | | | | 144,731 | |
Intercontinental Exchange Incorporated | | | | | | | | | | | 16,200 | | | | 897,480 | |
S&P Global Incorporated | | | | | | | | | | | 4,810 | | | | 572,342 | |
TD Ameritrade Holding Corporation | | | | | | | | | | | 4,220 | | | | 173,062 | |
The Charles Schwab Corporation | | | | | | | | | | | 13,160 | | | | 508,766 | |
| | | | |
| | | | | | | | | | | | | | | 2,296,381 | |
| | | | | | | | | | | | | | | | |
| | | | |
Health Care: 12.84% | | | | | | | | | | | | | | | | |
| | | | |
| Biotechnology: 6.97% | | | | | | | | | | | | | | | | |
Alexion Pharmaceuticals Incorporated † | | | | | | | | | | | 3,740 | | | | 458,487 | |
Amgen Incorporated | | | | | | | | | | | 2,500 | | | | 360,175 | |
Biogen Incorporated † | | | | | | | | | | | 700 | | | | 205,849 | |
BioMarin Pharmaceutical Incorporated † | | | | | | | | | | | 12,020 | | | | 1,029,273 | |
Celgene Corporation † | | | | | | | | | | | 25,510 | | | | 3,023,190 | |
Incyte Corporation | | | | | | | | | | | 5,570 | | | | 569,755 | |
Regeneron Pharmaceuticals Incorporated † | | | | | | | | | | | 2,950 | | | | 1,118,758 | |
Tesaro Incorporated Ǡ | | | | | | | | | | | 1,180 | | | | 160,114 | |
Vertex Pharmaceuticals Incorporated † | | | | | | | | | | | 5,610 | | | | 457,832 | |
| | | | |
| | | | | | | | | | | | | | | 7,383,433 | |
| | | | | | | | | | | | | | | | |
| | | | |
| Health Care Equipment & Supplies: 2.41% | | | | | | | | | | | | | | | | |
Baxter International Incorporated | | | | | | | | | | | 13,380 | | | | 593,671 | |
Boston Scientific Corporation † | | | | | | | | | | | 26,200 | | | | 536,052 | |
Danaher Corporation | | | | | | | | | | | 7,650 | | | | 598,001 | |
Edwards Lifesciences Corporation † | | | | | | | | | | | 1,530 | | | | 126,761 | |
Intuitive Surgical Incorporated † | | | | | | | | | | | 1,090 | | | | 701,677 | |
| | | | |
| | | | | | | | | | | | | | | 2,556,162 | |
| | | | | | | | | | | | | | | | |
The accompanying notes are an integral part of these financial statements.
| | | | | | |
| Portfolio of investments—November 30, 2016 (unaudited) | | Wells Fargo Allocation Funds | | | 35 | |
DIVERSIFIED LARGE CAP GROWTH PORTFOLIO
| | | | | | | | | | | | | | | | |
| Security name | | | | | | | | Shares | | | Value | |
| | | | |
| Health Care Providers & Services: 2.24% | | | | | | | | | | | | | | | | |
Acadia Healthcare Company Incorporated Ǡ | | | | | | | | | | | 23,230 | | | $ | 882,972 | |
UnitedHealth Group Incorporated | | | | | | | | | | | 8,460 | | | | 1,339,387 | |
VCA Incorporated † | | | | | | | | | | | 2,430 | | | | 152,118 | |
| | | | |
| | | | | | | | | | | | | | | 2,374,477 | |
| | | | | | | | | | | | | | | | |
| | | | |
| Pharmaceuticals: 1.22% | | | | | | | | | | | | | | | | |
Eli Lilly & Company | | | | | | | | | | | 3,070 | | | | 206,058 | |
Zoetis Incorporated | | | | | | | | | | | 21,522 | | | | 1,084,278 | |
| | | | |
| | | | | | | | | | | | | | | 1,290,336 | |
| | | | | | | | | | | | | | | | |
| | | | |
Industrials: 9.54% | | | | | | | | | | | | | | | | |
| | | | |
| Aerospace & Defense: 0.66% | | | | | | | | | | | | | | | | |
The Boeing Company | | | | | | | | | | | 4,610 | | | | 694,082 | |
| | | | | | | | | | | | | | | | |
| | | | |
| Air Freight & Logistics: 0.90% | | | | | | | | | | | | | | | | |
FedEx Corporation | | | | | | | | | | | 2,900 | | | | 555,843 | |
United Parcel Service Incorporated Class B | | | | | | | | | | | 3,440 | | | | 398,765 | |
| | | | |
| | | | | | | | | | | | | | | 954,608 | |
| | | | | | | | | | | | | | | | |
| | | | |
| Airlines: 0.11% | | | | | | | | | | | | | | | | |
Southwest Airlines Company | | | | | | | | | | | 2,443 | | | | 113,868 | |
| | | | | | | | | | | | | | | | |
| | | | |
| Building Products: 0.70% | | | | | | | | | | | | | | | | |
Johnson Controls International plc | | | | | | | | | | | 16,538 | | | | 743,879 | |
| | | | | | | | | | | | | | | | |
| | | | |
| Commercial Services & Supplies: 2.11% | | | | | | | | | | | | | | | | |
KAR Auction Services Incorporated | | | | | | | | | | | 18,011 | | | | 759,344 | |
Waste Connections Incorporated | | | | | | | | | | | 19,303 | | | | 1,475,521 | |
| | | | |
| | | | | | | | | | | | | | | 2,234,865 | |
| | | | | | | | | | | | | | | | |
| | | | |
| Electrical Equipment: 0.73% | | | | | | | | | | | | | | | | |
Acuity Brands Incorporated | | | | | | | | | | | 1,760 | | | | 442,482 | |
Rockwell Automation Incorporated | | | | | | | | | | | 2,500 | | | | 334,275 | |
| | | | |
| | | | | | | | | | | | | | | 776,757 | |
| | | | | | | | | | | | | | | | |
| | | | |
| Industrial Conglomerates: 0.81% | | | | | | | | | | | | | | | | |
3M Company | | | | | | | | | | | 3,480 | | | | 597,655 | |
Honeywell International Incorporated | | | | | | | | | | | 2,290 | | | | 260,923 | |
| | | | |
| | | | | | | | | | | | | | | 858,578 | |
| | | | | | | | | | | | | | | | |
| | | | |
| Machinery: 0.35% | | | | | | | | | | | | | | | | |
Fortive Corporation | | | | | | | | | | | 6,805 | | | | 374,207 | |
| | | | | | | | | | | | | | | | |
| | | | |
| Road & Rail: 3.17% | | | | | | | | | | | | | | | | |
Kansas City Southern | | | | | | | | | | | 10,610 | | | | 941,213 | |
Norfolk Southern Corporation | | | | | | | | | | | 5,470 | | | | 582,336 | |
Union Pacific Corporation | | | | | | | | | | | 18,090 | | | | 1,833,060 | |
| | | | |
| | | | | | | | | | | | | | | 3,356,609 | |
| | | | | | | | | | | | | | | | |
The accompanying notes are an integral part of these financial statements.
| | | | |
| 36 | | Wells Fargo Allocation Funds | | Portfolio of investments—November 30, 2016 (unaudited) |
DIVERSIFIED LARGE CAP GROWTH PORTFOLIO
| | | | | | | | | | | | | | | | |
| Security name | | | | | | | | Shares | | | Value | |
| | | | |
Information Technology: 43.41% | | | | | | | | | | | | | | | | |
| | | | |
| Communications Equipment: 1.01% | | | | | | | | | | | | | | | | |
Harris Corporation | | | | | | | | | | | 7,180 | | | $ | 743,561 | |
Palo Alto Networks Incorporated † | | | | | | | | | | | 2,470 | | | | 331,894 | |
| | | | |
| | | | | | | | | | | | | | | 1,075,455 | |
| | | | | | | | | | | | | | | | |
| | | | |
| Internet Software & Services: 13.69% | | | | | | | | | | | | | | | | |
Alphabet Incorporated Class A † | | | | | | | | | | | 6,574 | | | | 5,100,635 | |
Alphabet Incorporated Class C † | | | | | | | | | | | 2,764 | | | | 2,095,223 | |
CoStar Group Incorporated † | | | | | | | | | | | 1,340 | | | | 256,087 | |
eBay Incorporated † | | | | | | | | | | | 31,680 | | | | 881,021 | |
Facebook Incorporated Class A † | | | | | | | | | | | 45,210 | | | | 5,353,768 | |
MercadoLibre Incorporated | | | | | | | | | | | 890 | | | | 140,460 | |
Tencent Holdings Limited ADR | | | | | | | | | | | 27,150 | | | | 677,121 | |
| | | | |
| | | | | | | | | | | | | | | 14,504,315 | |
| | | | | | | | | | | | | | | | |
| | | | |
| IT Services: 9.63% | | | | | | | | | | | | | | | | |
Accenture plc Class A | | | | | | | | | | | 7,300 | | | | 871,839 | |
Fidelity National Information Services Incorporated | | | | | | | | | | | 14,360 | | | | 1,108,448 | |
FleetCor Technologies Incorporated † | | | | | | | | | | | 5,120 | | | | 764,621 | |
Global Payments Incorporated | | | | | | | | | | | 770 | | | | 52,784 | |
MasterCard Incorporated Class A | | | | | | | | | | | 19,490 | | | | 1,991,878 | |
PayPal Holdings Incorporated † | | | | | | | | | | | 46,750 | | | | 1,836,340 | |
Visa Incorporated Class A | | | | | | | | | | | 46,290 | | | | 3,579,143 | |
| | | | |
| | | | | | | | | | | | | | | 10,205,053 | |
| | | | | | | | | | | | | | | | |
| | | | |
| Semiconductors & Semiconductor Equipment: 6.08% | | | | | | | | | | | | | | | | |
Broadcom Limited | | | | | | | | | | | 12,271 | | | | 2,092,083 | |
Microchip Technology Incorporated | | | | | | | | | | | 32,239 | | | | 2,133,577 | |
NXP Semiconductors NV † | | | | | | | | | | | 1,940 | | | | 192,351 | |
QUALCOMM Incorporated | | | | | | | | | | | 6,630 | | | | 451,702 | |
Texas Instruments Incorporated | | | | | | | | | | | 21,260 | | | | 1,571,752 | |
| | | | |
| | | | | | | | | | | | | | | 6,441,465 | |
| | | | | | | | | | | | | | | | |
| | | | |
| Software: 11.39% | | | | | | | | | | | | | | | | |
Activision Blizzard Incorporated | | | | | | | | | | | 3,270 | | | | 119,715 | |
Adobe Systems Incorporated † | | | | | | | | | | | 16,950 | | | | 1,742,630 | |
Electronic Arts Incorporated † | | | | | | | | | | | 10,430 | | | | 826,473 | |
Microsoft Corporation | | | | | | | | | | | 68,840 | | | | 4,148,298 | |
Red Hat Incorporated † | | | | | | | | | | | 3,840 | | | | 303,782 | |
Salesforce.com Incorporated † | | | | | | | | | | | 19,884 | | | | 1,431,648 | |
ServiceNow Incorporated † | | | | | | | | | | | 11,610 | | | | 965,372 | |
Splunk Incorporated † | | | | | | | | | | | 20,758 | | | | 1,196,076 | |
Symantec Corporation | | | | | | | | | | | 26,360 | | | | 642,920 | |
Ultimate Software Group Incorporated † | | | | | | | | | | | 3,376 | | | | 691,844 | |
| | | | |
| | | | | | | | | | | | | | | 12,068,758 | |
| | | | | | | | | | | | | | | | |
| | | | |
| Technology Hardware, Storage & Peripherals: 1.61% | | | | | | | | | | | | | | | | |
Apple Incorporated | | | | | | | | | | | 15,447 | | | | 1,707,202 | |
| | | | | | | | | | | | | | | | |
The accompanying notes are an integral part of these financial statements.
| | | | | | |
| Portfolio of investments—November 30, 2016 (unaudited) | | Wells Fargo Allocation Funds | | | 37 | |
DIVERSIFIED LARGE CAP GROWTH PORTFOLIO
| | | | | | | | | | | | | | | | |
| Security name | | | | | | | | Shares | | | Value | |
| | | | |
Materials: 3.13% | | | | | | | | | | | | | | | | |
| | | | |
| Chemicals: 3.13% | | | | | | | | | | | | | | | | |
Ecolab Incorporated | | | | | | | | | | | 12,300 | | | $ | 1,435,779 | |
Praxair Incorporated | | | | | | | | | | | 11,000 | | | | 1,323,300 | |
The Sherwin-Williams Company | | | | | | | | | | | 2,100 | | | | 564,204 | |
| | | | |
| | | | | | | | | | | | | | | 3,323,283 | |
| | | | | | | | | | | | | | | | |
| | | | |
Real Estate: 0.30% | | | | | | | | | | | | | | | | |
| | | | |
| Equity REITs: 0.30% | | | | | | | | | | | | | | | | |
American Tower Corporation | | | | | | | | | | | 3,080 | | | | 314,992 | |
| | | | | | | | | | | | | | | | |
| | | | |
Total Common Stocks (Cost $71,168,423) | | | | | | | | | | | | | | | 104,406,481 | |
| | | | | | | | | | | | | | | | |
| | | | |
| | | Yield | | | | | | | | | | |
| Short-Term Investments: 2.37% | | | | | | | | | | | | | | | | |
| | | | |
| Investment Companies: 2.37% | | | | | | | | | | | | | | | | |
Securities Lending Cash Investment LLC (l)(r)(u) | | | 0.65 | % | | | | | | | 1,030,133 | | | | 1,030,236 | |
Wells Fargo Government Money Market Fund Select Class (l)(u) | | | 0.31 | | | | | | | | 1,480,422 | | | | 1,480,422 | |
| | | | |
Total Short-Term Investments (Cost $2,510,604) | | | | | | | | | | | | | | | 2,510,658 | |
| | | | | | | | | | | | | | | | |
| | | | | | | | |
| | |
| Total investments in securities (Cost $73,679,027) * | | | 100.90 | % | | | 106,917,139 | |
Other assets and liabilities, net | | | (0.90 | ) | | | (954,171 | ) |
| | | | | | | | |
| Total net assets | | | 100.00 | % | | $ | 105,962,968 | |
| | | | | | | | |
| † | Non-income-earning security |
| « | All or a portion of this security is on loan. |
| (l) | The issuer of the security is an affiliated person of the Portfolio as defined in the Investment Company Act of 1940. |
| (r) | The investment is a non-registered investment vehicle purchased with cash collateral received from securities on loan. |
| (u) | The rate represents the 7-day annualized yield at period end. |
| * | Cost for federal income tax purposes is $73,569,746 and unrealized gains (losses) consists of: |
| | | | |
Gross unrealized gains | | $ | 34,231,628 | |
Gross unrealized losses | | | (884,235 | ) |
| | | | |
Net unrealized gains | | $ | 33,347,393 | |
The accompanying notes are an integral part of these financial statements.
| | | | |
| 38 | | Wells Fargo Allocation Funds | | Portfolio of investments—November 30, 2016 (unaudited) |
EMERGING GROWTH PORTFOLIO
| | | | | | | | | | | | | | | | |
| Security name | | | | | | | | Shares | | | Value | |
| | | | |
Common Stocks: 97.34% | | | | | | | | | | | | | | | | |
| | | | |
Consumer Discretionary: 12.14% | | | | | | | | | | | | | | | | |
| | | | |
| Auto Components: 1.38% | | | | | | | | | | | | | | | | |
Cooper-Standard Holdings Incorporated † | | | | | | | | | | | 34,100 | | | $ | 3,250,412 | |
Drew Industries Incorporated | | | | | | | | | | | 46,300 | | | | 4,866,130 | |
Motorcar Parts of America Incorporated † | | | | | | | | | | | 122,391 | | | | 2,993,684 | |
| |
| | | | 11,110,226 | |
| | | | | | | | | | | | | | | | |
| | | | |
| Diversified Consumer Services: 1.35% | | | | | | | | | | | | | | | | |
Grand Canyon Education Incorporated † | | | | | | | | | | | 190,420 | | | | 10,872,982 | |
| | | | | | | | | | | | | | | | |
| | | | |
| Hotels, Restaurants & Leisure: 2.85% | | | | | | | | | | | | | | | | |
Planet Fitness Incorporated Class A « | | | | | | | | | | | 344,231 | | | | 6,977,562 | |
The Habit Restaurants Incorporated Class A Ǡ | | | | | | | | | | | 483,908 | | | | 8,129,654 | |
Wingstop Incorporated « | | | | | | | | | | | 255,778 | | | | 7,849,827 | |
| |
| | | | 22,957,043 | |
| | | | | | | | | | | | | | | | |
| | | | |
| Household Durables: 0.30% | | | | | | | | | | | | | | | | |
Universal Electronics Incorporated † | | | | | | | | | | | 36,000 | | | | 2,424,600 | |
| | | | | | | | | | | | | | | | |
| | | | |
| Leisure Products: 1.16% | | | | | | | | | | | | | | | | |
MCBC Holdings Incorporated | | | | | | | | | | | 289,912 | | | | 3,896,417 | |
Nautilus Group Incorporated † | | | | | | | | | | | 315,800 | | | | 5,431,760 | |
| |
| | | | 9,328,177 | |
| | | | | | | | | | | | | | | | |
| | | | |
| Media: 1.36% | | | | | | | | | | | | | | | | |
IMAX Corporation † | | | | | | | | | | | 343,040 | | | | 10,960,128 | |
| | | | | | | | | | | | | | | | |
| | | | |
| Multiline Retail: 0.86% | | | | | | | | | | | | | | | | |
Ollie’s Bargain Outlet Holdings Incorporated «† | | | | | | | | | | | 231,900 | | | | 6,968,595 | |
| | | | | | | | | | | | | | | | |
| | | | |
| Specialty Retail: 2.88% | | | | | | | | | | | | | | | | |
Camping World Holdings Incorporated | | | | | | | | | | | 113,700 | | | | 3,172,230 | |
Five Below Incorporated † | | | | | | | | | | | 98,207 | | | | 3,865,428 | |
Lithia Motors Incorporated Class A | | | | | | | | | | | 121,720 | | | | 11,186,068 | |
Sportsman’s Warehouse Holdings Incorporated † | | | | | | | | | | | 555,463 | | | | 4,999,167 | |
| |
| | | | 23,222,893 | |
| | | | | | | | | | | | | | | | |
| | | | |
Energy: 3.62% | | | | | | | | | | | | | | | | |
| | | | |
| Oil, Gas & Consumable Fuels: 3.62% | | | | | | | | | | | | | | | | |
Extraction Oil & Gas Incorporated | | | | | | | | | | | 58,588 | | | | 1,378,576 | |
Matador Resources Company † | | | | | | | | | | | 157,236 | | | | 4,188,767 | |
PDC Energy Incorporated † | | | | | | | | | | | 135,190 | | | | 10,064,896 | |
RSP Permian Incorporated † | | | | | | | | | | | 302,358 | | | | 13,500,285 | |
| |
| | | | 29,132,524 | |
| | | | | | | | | | | | | | | | |
| | | | |
Financials: 6.25% | | | | | | | | | | | | | | | | |
| | | | |
| Capital Markets: 4.20% | | | | | | | | | | | | | | | | |
Financial Engines Incorporated « | | | | | | | | | | | 280,920 | | | | 9,790,062 | |
MarketAxess Holdings Incorporated | | | | | | | | | | | 145,041 | | | | 24,043,447 | |
| |
| | | | 33,833,509 | |
| | | | | | | | | | | | | | | | |
The accompanying notes are an integral part of these financial statements.
| | | | | | |
| Portfolio of investments—November 30, 2016 (unaudited) | | Wells Fargo Allocation Funds | | | 39 | |
EMERGING GROWTH PORTFOLIO
| | | | | | | | | | | | | | | | |
| Security name | | | | | | | | Shares | | | Value | |
| | | | |
| Insurance: 0.29% | | | | | | | | | | | | | | | | |
Kinsale Capital Group Incorporated | | | | | | | | | | | 80,948 | | | $ | 2,307,827 | |
| | | | | | | | | | | | | | | | |
| | | | |
| Thrifts & Mortgage Finance: 1.76% | | | | | | | | | | | | | | | | |
LendingTree Incorporated † | | | | | | | | | | | 135,512 | | | | 14,201,658 | |
| | | | | | | | | | | | | | | | |
| | | | |
Health Care: 28.71% | | | | | | | | | | | | | | | | |
| | | | |
| Biotechnology: 6.13% | | | | | | | | | | | | | | | | |
Alder Biopharmaceuticals Incorporated Ǡ | | | | | | | | | | | 147,900 | | | | 3,483,045 | |
Ligand Pharmaceuticals Incorporated Ǡ | | | | | | | | | | | 178,380 | | | | 18,622,872 | |
Radius Health Incorporated Ǡ | | | | | | | | | | | 126,105 | | | | 6,711,308 | |
Repligen Corporation † | | | | | | | | | | | 306,850 | | | | 9,880,570 | |
Spark Therapeutics Incorporated Ǡ | | | | | | | | | | | 85,300 | | | | 4,692,353 | |
Ultragenyx Pharmaceutical Incorporated † | | | | | | | | | | | 76,734 | | | | 6,007,505 | |
| |
| | | | 49,397,653 | |
| | | | | | | | | | | | | | | | |
| | | | |
| Health Care Equipment & Supplies: 15.48% | | | | | | | | | | | | | | | | |
Abiomed Incorporated † | | | | | | | | | | | 34,330 | | | | 3,853,199 | |
Cerus Corporation Ǡ | | | | | | | | | | | 926,118 | | | | 4,834,336 | |
Cynosure Incorporated Class A † | | | | | | | | | | | 277,698 | | | | 12,593,604 | |
Entellus Medical Incorporated Ǡ | | | | | | | | | | | 188,772 | | | | 3,479,068 | |
Glaukos Corporation † | | | | | | | | | | | 366,672 | | | | 11,443,833 | |
Inogen Incorporated † | | | | | | | | | | | 136,170 | | | | 8,773,433 | |
Integra LifeSciences Holdings Corporation † | | | | | | | | | | | 138,000 | | | | 11,150,400 | |
iRhythm Technologies Incorporated † | | | | | | | | | | | 102,332 | | | | 3,121,126 | |
Natus Medical Incorporated † | | | | | | | | | | | 241,090 | | | | 9,607,437 | |
Nevro Corporation Ǡ | | | | | | | | | | | 166,165 | | | | 12,633,525 | |
NxStage Medical Incorporated † | | | | | | | | | | | 567,050 | | | | 14,017,476 | |
The Spectranetics Corporation † | | | | | | | | | | | 704,469 | | | | 15,392,640 | |
Zeltiq Aesthetics Incorporated Ǡ | | | | | | | | | | | 314,060 | | | | 13,821,781 | |
| |
| | | | 124,721,858 | |
| | | | | | | | | | | | | | | | |
| | | | |
| Health Care Providers & Services: 4.22% | | | | | | | | | | | | | | | | |
Acadia Healthcare Company Incorporated † | | | | | | | | | | | 349,530 | | | | 13,285,635 | |
HealthEquity Incorporated † | | | | | | | | | | | 367,842 | | | | 16,380,004 | |
Surgery Partners Incorporated † | | | | | | | | | | | 154,100 | | | | 2,272,975 | |
Teladoc Incorporated Ǡ | | | | | | | | | | | 112,059 | | | | 2,056,283 | |
| |
| | | | 33,994,897 | |
| | | | | | | | | | | | | | | | |
| | | | |
| Life Sciences Tools & Services: 2.26% | | | | | | | | | | | | | | | | |
ICON plc ADR † | | | | | | | | | | | 88,140 | | | | 6,666,910 | |
INC Research Holdings Incorporated Class A † | | | | | | | | | | | 232,945 | | | | 11,530,778 | |
| |
| | | | 18,197,688 | |
| | | | | | | | | | | | | | | | |
| | | | |
| Pharmaceuticals: 0.62% | | | | | | | | | | | | | | | | |
Heska Corporation † | | | | | | | | | | | 76,420 | | | | 5,052,126 | |
| | | | | | | | | | | | | | | | |
| | | | |
Industrials: 16.06% | | | | | | | | | | | | | | | | |
| | | | |
| Aerospace & Defense: 0.73% | | | | | | | | | | | | | | | | |
HEICO Corporation | | | | | | | | | | | 74,600 | | | | 5,856,100 | |
| | | | | | | | | | | | | | | | |
The accompanying notes are an integral part of these financial statements.
| | | | |
| 40 | | Wells Fargo Allocation Funds | | Portfolio of investments—November 30, 2016 (unaudited) |
EMERGING GROWTH PORTFOLIO
| | | | | | | | | | | | | | | | |
| Security name | | | | | | | | Shares | | | Value | |
| | | | |
| Airlines: 0.96% | | | | | | | | | | | | | | | | |
SkyWest Incorporated | | | | | | | | | | | 209,960 | | | $ | 7,737,026 | |
| | | | | | | | | | | | | | | | |
| | | | |
| Building Products: 1.19% | | | | | | | | | | | | | | | | |
Apogee Enterprises Incorporated | | | | | | | | | | | 200,950 | | | | 9,585,315 | |
| | | | | | | | | | | | | | | | |
| | | |
| Commercial Services & Supplies: 0.58% | | | | | | | | | | | | | |
Advanced Disposal Services † | | | | | | | | | | | 134,432 | | | | 2,696,706 | |
Multi-Color Corporation | | | | | | | | | | | 27,130 | | | | 1,950,647 | |
| | | | |
| | | | | | | | | | | | | | | 4,647,353 | |
| | | | | | | | | | | | | | | | |
| | | |
| Construction & Engineering: 1.54% | | | | | | | | | | | | | |
Dycom Industries Incorporated Ǡ | | | | | | | | | | | 73,400 | | | | 5,375,082 | |
Granite Construction Incorporated | | | | | | | | | | | 119,590 | | | | 7,054,614 | |
| | | | |
| | | | | | | | | | | | | | | 12,429,696 | |
| | | | | | | | | | | | | | | | |
| | | |
| Machinery: 4.31% | | | | | | | | | | | | | |
John Bean Technologies Corporation | | | | | | | | | | | 156,410 | | | | 14,108,182 | |
Milacron Holdings Corporation † | | | | | | | | | | | 438,868 | | | | 7,412,481 | |
Mueller Water Products Incorporated Class A | | | | | | | | | | | 384,190 | | | | 5,082,834 | |
Rexnord Corporation † | | | | | | | | | | | 368,710 | | | | 8,111,620 | |
| | | | |
| | | | | | | | | | | | | | | 34,715,117 | |
| | | | | | | | | | | | | | | | |
| | | |
| Professional Services: 5.09% | | | | | | | | | | | | | |
On Assignment Incorporated † | | | | | | | | | | | 536,313 | | | | 22,144,364 | |
WageWorks Incorporated † | | | | | | | | | | | 255,824 | | | | 18,892,602 | |
| | | | |
| | | | | | | | | | | | | | | 41,036,966 | |
| | | | | | | | | | | | | | | | |
| | | |
| Trading Companies & Distributors: 1.66% | | | | | | | | | | | | | |
Beacon Roofing Supply Incorporated | | | | | | | | | | | 199,670 | | | | 9,262,691 | |
BMC Stock Holdings Incorporated † | | | | | | | | | | | 218,200 | | | | 4,113,070 | |
| | | | |
| | | | | | | | | | | | | | | 13,375,761 | |
| | | | | | | | | | | | | | | | |
| | | |
Information Technology: 30.56% | | | | | | | | | | | | | |
| | | |
| Communications Equipment: 0.36% | | | | | | | | | | | | | |
Quantenna Communications Incorporated Ǡ | | | | | | | | | | | 150,804 | | | | 2,863,768 | |
| | | | | | | | | | | | | | | | |
| | | |
| Electronic Equipment, Instruments & Components: 0.10% | | | | | | | | | | | | | |
Mercury Computer Systems Incorporated † | | | | | | | | | | | 27,500 | | | | 817,025 | |
| | | | | | | | | | | | | | | | |
| | | |
| Internet Software & Services: 10.74% | | | | | | | | | | | | | |
2U Incorporated † | | | | | | | | | | | 216,920 | | | | 7,171,375 | |
Benefitfocus Incorporated † | | | | | | | | | | | 2,039 | | | | 55,665 | |
Coupa Software Incorporated † | | | | | | | | | | | 30,805 | | | | 977,751 | |
Envestnet Incorporated † | | | | | | | | | | | 420,242 | | | | 15,170,736 | |
Five9 Incorporated † | | | | | | | | | | | 235,300 | | | | 3,724,799 | |
LogMeIn Incorporated | | | | | | | | | | | 147,500 | | | | 14,875,375 | |
Q2 Holdings Incorporated † | | | | | | | | | | | 665,143 | | | | 19,621,719 | |
SPS Commerce Incorporated † | | | | | | | | | | | 288,608 | | | | 19,991,876 | |
Xactly Corporation † | | | | | | | | | | | 350,967 | | | | 4,948,635 | |
| | | | |
| | | | | | | | | | | | | | | 86,537,931 | |
| | | | | | | | | | | | | | | | |
The accompanying notes are an integral part of these financial statements.
| | | | | | |
| Portfolio of investments—November 30, 2016 (unaudited) | | Wells Fargo Allocation Funds | | | 41 | |
EMERGING GROWTH PORTFOLIO
| | | | | | | | | | | | | | | | |
| Security name | | | | | | | | Shares | | | Value | |
| | | |
| IT Services: 1.67% | | | | | | | | | | | | | |
InterXion Holding NV † | | | | | | | | | | | 393,470 | | | $ | 13,440,935 | |
| | | | | | | | | | | | | | | | |
| | | |
| Semiconductors & Semiconductor Equipment: 4.72% | | | | | | | | | | | | | |
Cavium Incorporated † | | | | | | | | | | | 151,880 | | | | 8,661,716 | |
MaxLinear Incorporated Class A † | | | | | | | | | | | 234,948 | | | | 4,799,988 | |
Microsemi Corporation † | | | | | | | | | | | 229,150 | | | | 12,545,963 | |
Monolithic Power Systems Incorporated | | | | | | | | | | | 146,910 | | | | 12,052,496 | |
| | | | |
| | | | | | | | | | | | | | | 38,060,163 | |
| | | | | | | | | | | | | | | | |
| | | | |
| Software: 12.97% | | | | | | | | | | | | | | | | |
BlackLine Incorporated † | | | | | | | | | | | 21,374 | | | | 575,816 | |
Callidus Software Incorporated † | | | | | | | | | | | 412,022 | | | | 6,468,745 | |
CommVault Systems Incorporated † | | | | | | | | | | | 113,070 | | | | 6,105,780 | |
CyberArk Software Limited † | | | | | | | | | | | 221,480 | | | | 11,297,695 | |
Guidewire Software Incorporated † | | | | | | | | | | | 64,781 | | | | 3,608,950 | |
HubSpot Incorporated † | | | | | | | | | | | 212,936 | | | | 11,945,710 | |
Paycom Software Incorporated † | | | | | | | | | | | 265,850 | | | | 11,928,690 | |
Paylocity Holding Corporation † | | | | | | | | | | | 127,353 | | | | 4,216,658 | |
Proofpoint Incorporated † | | | | | | | | | | | 270,460 | | | | 20,828,125 | |
Rapid7 Incorporated Ǡ | | | | | | | | | | | 83,928 | | | | 973,565 | |
Ringcentral Incorporated Class A † | | | | | | | | | | | 360,930 | | | | 7,778,042 | |
Synchronoss Technologies Incorporated † | | | | | | | | | | | 221,351 | | | | 10,731,096 | |
Talend SA Ǡ | | | | | | | | | | | 160,096 | | | | 3,696,617 | |
Tyler Technologies Incorporated † | | | | | | | | | | | 28,995 | | | | 4,317,356 | |
| | | | |
| | | | | | | | | | | | | | | 104,472,845 | |
| | | | | | | | | | | | | | | | |
| | | | |
Total Common Stocks (Cost $560,292,720) | | | | | | | | | | | | | | | 784,260,385 | |
| | | | | | | | | | | | | | | | |
| | | | |
| | | Yield | | | | | | | | | | |
| Short-Term Investments: 13.06% | | | | | | | | | | | | | | | | |
| | | | |
| Investment Companies: 13.06% | | | | | | | | | | | | | | | | |
Securities Lending Cash Investment LLC (l)(r)(u) | | | 0.65 | % | | | | | | | 85,987,308 | | | | 85,995,907 | |
Wells Fargo Government Money Market Fund Select Class (l)(u) | | | 0.31 | | | | | | | | 19,236,622 | | | | 19,236,622 | |
| | | | |
Total Short-Term Investments (Cost $105,224,647) | | | | | | | | | | | | | | | 105,232,529 | |
| | | | | | | | | | | | | | | | |
| | | | | | | | |
| Total investments in securities (Cost $665,517,367) * | | | 110.40 | % | | | 889,492,914 | |
Other assets and liabilities, net | | | (10.40 | ) | | | (83,761,636 | ) |
| | | | | | | | |
| Total net assets | | | 100.00 | % | | $ | 805,731,278 | |
| | | | | | | | |
| † | Non-income-earning security |
| « | All or a portion of this security is on loan. |
| (l) | The issuer of the security is an affiliated person of the Portfolio as defined in the Investment Company Act of 1940. |
| (r) | The investment is a non-registered investment vehicle purchased with cash collateral received from securities on loan. |
| (u) | The rate represents the 7-day annualized yield at period end. |
| * | Cost for federal income tax purposes is $669,076,405 and unrealized gains (losses) consists of: |
| | | | |
Gross unrealized gains | | $ | 236,058,540 | |
Gross unrealized losses | | | (15,642,031 | ) |
| | | | |
Net unrealized gains | | $ | 220,416,509 | |
The accompanying notes are an integral part of these financial statements.
| | | | |
| 42 | | Wells Fargo Allocation Funds | | Summary portfolio of investments—November 30, 2016 (unaudited) |
INDEX PORTFOLIO
The Summary portfolio of investments shows the 50 largest portfolio holdings in unaffiliated issuers and any holdings exceeding 1% of the total net assets as of the report date. The remaining securities held are grouped as “Other securities” in each category.
| | | | | | | | | | | | | | | | | | | | |
| Security name | | | | | | | | Shares | | | Value | | | Percent of
net assets | |
| | | | | |
Common Stocks: 96.55% | | | | | | | | | | | | | | | | | | | | |
| | | | | |
Consumer Discretionary: 11.90% | | | | | | | | | | | | | | | | | | | | |
| | | | | |
| Auto Components: 0.17% | | | | | | | | | | | | | | | | | | | | |
Other securities | | | | | | | | | | | | | | $ | 3,711,162 | | | | 0.17 | % |
| | | | | | | | | | | | | | | | | | | | |
| | | | | |
| Automobiles: 0.54% | | | | | | | | | | | | | | | | | | | | |
Other securities | | | | | | | | | | | | | | | 12,109,380 | | | | 0.54 | |
| | | | | | | | | | | | | | | | | | | | |
| | | | | |
| Distributors: 0.12% | | | | | | | | | | | | | | | | | | | | |
Other securities | | | | | | | | | | | | | | | 2,772,162 | | | | 0.12 | |
| | | | | | | | | | | | | | | | | | | | |
| | | | | |
| Diversified Consumer Services: 0.03% | | | | | | | | | | | | | | | | | | | | |
Other securities | | | | | | | | | | | | | | | 551,319 | | | | 0.03 | |
| | | | | | | | | | | | | | | | | | | | |
| | | | | |
| Hotels, Restaurants & Leisure: 1.56% | | | | | | | | | | | | | | | | | | | | |
McDonald’s Corporation | | | | | | | | | | | 96,904 | | | | 11,557,740 | | | | 0.52 | |
Starbucks Corporation | | | | | | | | | | | 166,540 | | | | 9,654,324 | | | | 0.43 | |
Other securities | | | | | | | | | | | | | | | 13,620,653 | | | | 0.61 | |
| | | | | |
| | | | | | | | | | | | | | | 34,832,717 | | | | 1.56 | |
| | | | | | | | | | | | | | | | | | | | |
| | | | | |
| Household Durables: 0.46% | | | | | | | | | | | | | | | | | | | | |
Other securities | | | | | | | | | | | | | | | 10,293,517 | | | | 0.46 | |
| | | | | | | | | | | | | | | | | | | | |
| | | | | |
| Internet & Direct Marketing Retail: 2.24% | | | | | | | | | | | | | | | | | | | | |
Amazon.com Incorporated † | | | | | | | | | | | 44,682 | | | | 33,536,969 | | | | 1.50 | |
Other securities | | | | | | | | | | | | | | | 16,496,074 | | | | 0.74 | |
| | | | | |
| | | | | | | | | | | | | | | 50,033,043 | | | | 2.24 | |
| | | | | | | | | | | | | | | | | | | | |
| | | | | |
| Leisure Products: 0.10% | | | | | | | | | | | | | | | | | | | | |
Other securities | | | | | | | | | | | | | | | 2,315,540 | | | | 0.10 | |
| | | | | | | | | | | | | | | | | | | | |
| | | | | |
| Media: 2.97% | | | | | | | | | | | | | | | | | | | | |
Comcast Corporation Class A | | | | | | | | | | | 272,803 | | | | 18,962,537 | | | | 0.85 | |
The Walt Disney Company | | | | | | | | | | | 167,895 | | | | 16,641,752 | | | | 0.75 | |
Other securities | | | | | | | | | | | | | | | 30,642,403 | | | | 1.37 | |
| | | | | |
| | | | | | | | | | | | | | | 66,246,692 | | | | 2.97 | |
| | | | | | | | | | | | | | | | | | | | |
| | | | | |
| Multiline Retail: 0.58% | | | | | | | | | | | | | | | | | | | | |
Other securities | | | | | | | | | | | | | | | 12,992,294 | | | | 0.58 | |
| | | | | | | | | | | | | | | | | | | | |
| | | | | |
| Specialty Retail: 2.43% | | | | | | | | | | | | | | | | | | | | |
The Home Depot Incorporated | | | | | | | | | | | 140,306 | | | | 18,155,596 | | | | 0.81 | |
Other securities | | | | | | | | | | | | | | | 36,009,790 | | | | 1.62 | |
| | | | | |
| | | | | | | | | | | | | | | 54,165,386 | | | | 2.43 | |
| | | | | | | | | | | | | | | | | | | | |
| | | | | |
| Textiles, Apparel & Luxury Goods: 0.70% | | | | | | | | | | | | | | | | | | | | |
Other securities | | | | | | | | | | | | | | | 15,577,559 | | | | 0.70 | |
| | | | | | | | | | | | | | | | | | | | |
The accompanying notes are an integral part of these financial statements.
| | | | | | |
| Summary portfolio of investments—November 30, 2016 (unaudited) | | Wells Fargo Allocation Funds | | | 43 | |
INDEX PORTFOLIO
| | | | | | | | | | | | | | | | | | | | |
| Security name | | | | | | | | Shares | | | Value | | | Percent of
net assets | |
| | | | | |
Consumer Staples: 8.94% | | | | | | | | | | | | | | | | | | | | |
| | | | | |
| Beverages: 1.97% | | | | | | | | | | | | | | | | | | | | |
PepsiCo Incorporated | | | | | | | | | | | 163,424 | | | $ | 16,358,742 | | | | 0.73 | % |
The Coca-Cola Company | | | | | | | | | | | 441,098 | | | | 17,798,304 | | | | 0.80 | |
Other securities | | | | | | | | | | | | | | | 9,916,817 | | | | 0.44 | |
| | | | | |
| | | | | | | | | | | | | | | 44,073,863 | | | | 1.97 | |
| | | | | | | | | | | | | | | | | | | | |
| | | | | |
| Food & Staples Retailing: 2.01% | | | | | | | | | | | | | | | | | | | | |
Wal-Mart Stores Incorporated | | | | | | | | | | | 172,116 | | | | 12,122,130 | | | | 0.54 | |
Other securities | | | | | | | | | | | | | | | 32,672,450 | | | | 1.47 | |
| | | | | |
| | | | | | | | | | | | | | | 44,794,580 | | | | 2.01 | |
| | | | | | | | | | | | | | | | | | | | |
| | | | | |
| Food Products: 1.51% | | | | | | | | | | | | | | | | | | | | |
Other securities | | | | | | | | | | | | | | | 33,728,636 | | | | 1.51 | |
| | | | | | | | | | | | | | | | | | | | |
| | | | | |
| Household Products: 1.76% | | | | | | | | | | | | | | | | | | | | |
The Procter & Gamble Company | | | | | | | | | | | 303,051 | | | | 24,989,585 | | | | 1.12 | |
Other securities | | | | | | | | | | | | | | | 14,304,799 | | | | 0.64 | |
| | | | | |
| | | | | | | | | | | | | | | 39,294,384 | | | | 1.76 | |
| | | | | | | | | | | | | | | | | | | | |
| | | | | |
| Personal Products: 0.13% | | | | | | | | | | | | | | | | | | | | |
Other securities | | | | | | | | | | | | | | | 2,951,710 | | | | 0.13 | |
| | | | | | | | | | | | | | | | | | | | |
| | | | | |
| Tobacco: 1.56% | | | | | | | | | | | | | | | | | | | | |
Altria Group Incorporated | | | | | | | | | | | 221,871 | | | | 14,184,213 | | | | 0.63 | |
Philip Morris International | | | | | | | | | | | 176,162 | | | | 15,551,581 | | | | 0.70 | |
Other securities | | | | | | | | | | | | | | | 5,085,833 | | | | 0.23 | |
| | | | | |
| | | | | | | | | | | | | | | 34,821,627 | | | | 1.56 | |
| | | | | | | | | | | | | | | | | | | | |
| | | | | |
Energy: 7.26% | | | | | | | | | | | | | | | | | | | | |
| | | | | |
| Energy Equipment & Services: 1.15% | | | | | | | | | | | | | | | | | | | | |
Schlumberger Limited | | | | | | | | | | | 157,921 | | | | 13,273,260 | | | | 0.60 | |
Other securities | | | | | | | | | | | | | | | 12,293,577 | | | | 0.55 | |
| | | | | |
| | | | | | | | | | | | | | | 25,566,837 | | | | 1.15 | |
| | | | | | | | | | | | | | | | | | | | |
| | | | | |
| Oil, Gas & Consumable Fuels: 6.11% | | | | | | | | | | | | | | | | | | | | |
Chevron Corporation | | | | | | | | | | | 214,225 | | | | 23,898,941 | | | | 1.07 | |
Exxon Mobil Corporation | | | | | | | | | | | 470,874 | | | | 41,107,300 | | | | 1.84 | |
Other securities | | | | | | | | | | | | | | | 71,507,310 | | | | 3.20 | |
| | | | | |
| | | | | | | | | | | | | | | 136,513,551 | | | | 6.11 | |
| | | | | | | | | | | | | | | | | | | | |
| | | | | |
Financials: 14.14% | | | | | | | | | | | | | | | | | | | | |
| | | | | |
| Banks: 6.31% | | | | | | | | | | | | | | | | | | | | |
Bank of America Corporation | | | | | | | | | | | 1,158,810 | | | | 24,474,067 | | | | 1.10 | |
Citigroup Incorporated | | | | | | | | | | | 329,921 | | | | 18,604,245 | | | | 0.83 | |
JPMorgan Chase & Company | | | | | | | | | | | 410,160 | | | | 32,882,527 | | | | 1.47 | |
Wells Fargo & Company (l) | | | | | | | | | | | 515,654 | | | | 27,288,410 | | | | 1.22 | |
Other securities | | | | | | | | | | | | | | | 37,619,996 | | | | 1.69 | |
| | | | | |
| | | | | | | | | | | | | | | 140,869,245 | | | | 6.31 | |
| | | | | | | | | | | | | | | | | | | | |
The accompanying notes are an integral part of these financial statements.
| | | | |
| 44 | | Wells Fargo Allocation Funds | | Summary portfolio of investments—November 30, 2016 (unaudited) |
INDEX PORTFOLIO
| | | | | | | | | | | | | | | | | | | | |
| Security name | | | | | | | | Shares | | | Value | | | Percent of
net assets | |
| | | | | |
| Capital Markets: 2.76% | | | | | | | | | | | | | | | | | | | | |
Other securities | | | | | | | | | | | | | | $ | 61,662,693 | | | | 2.76 | % |
| | | | | | | | | | | | | | | | | | | | |
| | | | | |
| Consumer Finance: 0.81% | | | | | | | | | | | | | | | | | | | | |
Other securities | | | | | | | | | | | | | | | 18,013,042 | | | | 0.81 | |
| | | | | | | | | | | | | | | | | | | | |
| | | | | |
| Diversified Financial Services: 1.56% | | | | | | | | | | | | | | | | | | | | |
Berkshire Hathaway Incorporated Class B † | | | | | | | | | | | 215,602 | | | | 33,944,379 | | | | 1.52 | |
Other securities | | | | | | | | | | | | | | | 811,041 | | | | 0.04 | |
| | | | | |
| | | | | | | | | | | | | | | 34,755,420 | | | | 1.56 | |
| | | | | | | | | | | | | | | | | | | | |
| | | | | |
| Insurance: 2.70% | | | | | | | | | | | | | | | | | | | | |
Other securities | | | | | | | | | | | | | | | 60,394,672 | | | | 2.70 | |
| | | | | | | | | | | | | | | | | | | | |
| | | | | |
Health Care: 13.26% | | | | | | | | | | | | | | | | | | | | |
| | | | | |
| Biotechnology: 2.73% | | | | | | | | | | | | | | | | | | | | |
AbbVie Incorporated | | | | | | | | | | | 184,930 | | | | 11,243,744 | | | | 0.50 | |
Amgen Incorporated | | | | | | | | | | | 84,980 | | | | 12,243,069 | | | | 0.55 | |
Celgene Corporation † | | | | | | | | | | | 88,018 | | | | 10,431,013 | | | | 0.47 | |
Gilead Sciences Incorporated | | | | | | | | | | | 149,854 | | | | 11,044,240 | | | | 0.49 | |
Other securities | | | | | | | | | | | | | | | 15,985,152 | | | | 0.72 | |
| | | | | |
| | | | | | | | | | | | | | | 60,947,218 | | | | 2.73 | |
| | | | | | | | | | | | | | | | | | | | |
| | | | | |
| Health Care Equipment & Supplies: 2.37% | | | | | | | | | | | | | | | | | | | | |
Medtronic plc | | | | | | | | | | | 156,926 | | | | 11,457,167 | | | | 0.51 | |
Other securities | | | | | | | | | | | | | | | 41,532,294 | | | | 1.86 | |
| | | | | |
| | | | | | | | | | | | | | | 52,989,461 | | | | 2.37 | |
| | | | | | | | | | | | | | | | | | | | |
| | | | | |
| Health Care Providers & Services: 2.59% | | | | | | | | | | | | | | | | | | | | |
UnitedHealth Group Incorporated | | | | | | | | | | | 108,149 | | | | 17,122,150 | | | | 0.77 | |
Other securities | | | | | | | | | | | | | | | 40,699,861 | | | | 1.82 | |
| | | | | |
| | | | | | | | | | | | | | | 57,822,011 | | | | 2.59 | |
| | | | | | | | | | | | | | | | | | | | |
| | | | | |
| Health Care Technology: 0.08% | | | | | | | | | | | | | | | | | | | | |
Other securities | | | | | | | | | | | | | | | 1,698,991 | | | | 0.08 | |
| | | | | | | | | | | | | | | | | | | | |
| | | | | |
| Life Sciences Tools & Services: 0.59% | | | | | | | | | | | | | | | | | | | | |
Other securities | | | | | | | | | | | | | | | 13,215,735 | | | | 0.59 | |
| | | | | | | | | | | | | | | | | | | | |
| | | | | |
| Pharmaceuticals: 4.90% | | | | | | | | | | | | | | | | | | | | |
Bristol-Myers Squibb Company | | | | | | | | | | | 189,735 | | | | 10,708,643 | | | | 0.48 | |
Johnson & Johnson | | | | | | | | | | | 310,674 | | | | 34,578,016 | | | | 1.55 | |
Merck & Company Incorporated | | | | | | | | | | | 314,004 | | | | 19,213,905 | | | | 0.86 | |
Pfizer Incorporated | | | | | | | | | | | 688,788 | | | | 22,137,646 | | | | 0.99 | |
Other securities | | | | | | | | | | | | | | | 22,833,685 | | | | 1.02 | |
| | | | | |
| | | | | | | | | | | | | | | 109,471,895 | | | | 4.90 | |
| | | | | | | | | | | | | | | | | | | | |
The accompanying notes are an integral part of these financial statements.
| | | | | | |
| Summary portfolio of investments—November 30, 2016 (unaudited) | | Wells Fargo Allocation Funds | | | 45 | |
INDEX PORTFOLIO
| | | | | | | | | | | | | | | | | | | | |
| Security name | | | | | | | | Shares | | | Value | | | Percent of
net assets | |
| | | | | |
Industrials: 10.10% | | | | | | | | | | | | | | | | | | | | |
| | | | | |
| Aerospace & Defense: 2.21% | | | | | | | | | | | | | | | | | | | | |
The Boeing Company | | | | | | | | | | | 65,880 | | | $ | 9,918,893 | | | | 0.44 | % |
United Technologies Corporation | | | | | | | | | | | 88,385 | | | | 9,520,832 | | | | 0.43 | |
Other securities | | | | | | | | | | | | | | | 29,940,927 | | | | 1.34 | |
| | | | | |
| | | | | | | | | | | | | | | 49,380,652 | | | | 2.21 | |
| | | | | | | | | | | | | | | | | | | | |
| | | | | |
| Air Freight & Logistics: 0.75% | | | | | | | | | | | | | | | | | | | | |
Other securities | | | | | | | | | | | | | | | 16,713,640 | | | | 0.75 | |
| | | | | | | | | | | | | | | | | | | | |
| | | | | |
| Airlines: 0.61% | | | | | | | | | | | | | | | | | | | | |
Other securities | | | | | | | | | | | | | | | 13,621,750 | | | | 0.61 | |
| | | | | | | | | | | | | | | | | | | | |
| | | | | |
| Building Products: 0.35% | | | | | | | | | | | | | | | | | | | | |
Other securities | | | | | | | | | | | | | | | 7,700,669 | | | | 0.35 | |
| | | | | | | | | | | | | | | | | | | | |
| | | | | |
| Commercial Services & Supplies: 0.31% | | | | | | | | | | | | | | | | | | | | |
Other securities | | | | | | | | | | | | | | | 6,800,344 | | | | 0.31 | |
| | | | | | | | | | | | | | | | | | | | |
| | | | | |
| Construction & Engineering: 0.10% | | | | | | | | | | | | | | | | | | | | |
Other securities | | | | | | | | | | | | | | | 2,279,623 | | | | 0.10 | |
| | | | | | | | | | | | | | | | | | | | |
| | | | | |
| Electrical Equipment: 0.54% | | | | | | | | | | | | | | | | | | | | |
Other securities | | | | | | | | | | | | | | | 12,026,066 | | | | 0.54 | |
| | | | | | | | | | | | | | | | | | | | |
| | | | | |
| Industrial Conglomerates: 2.46% | | | | | | | | | | | | | | | | | | | | |
3M Company | | | | | | | | | | | 68,633 | | | | 11,787,031 | | | | 0.53 | |
General Electric Company | | | | | | | | | | | 1,017,596 | | | | 31,301,253 | | | | 1.40 | |
Honeywell International Incorporated | | | | | | | | | | | 86,401 | | | | 9,844,530 | | | | 0.44 | |
Other securities | | | | | | | | | | | | | | | 2,084,214 | | | | 0.09 | |
| | | | | |
| | | | | | | | | | | | | | | 55,017,028 | | | | 2.46 | |
| | | | | | | | | | | | | | | | | | | | |
| | | | | |
| Machinery: 1.46% | | | | | | | | | | | | | | | | | | | | |
Other securities | | | | | | | | | | | | | | | 32,565,855 | | | | 1.46 | |
| | | | | | | | | | | | | | | | | | | | |
| | | | | |
| Professional Services: 0.26% | | | | | | | | | | | | | | | | | | | | |
Other securities | | | | | | | | | | | | | | | 5,842,339 | | | | 0.26 | |
| | | | | | | | | | | | | | | | | | | | |
| | | | | |
| Road & Rail: 0.87% | | | | | | | | | | | | | | | | | | | | |
Union Pacific Corporation | | | | | | | | | | | 94,582 | | | | 9,583,994 | | | | 0.43 | |
Other securities | | | | | | | | | | | | | | | 9,910,591 | | | | 0.44 | |
| | | | | |
| | | | | | | | | | | | | | | 19,494,585 | | | | 0.87 | |
| | | | | | | | | | | | | | | | | | | | |
| | | | | |
| Trading Companies & Distributors: 0.18% | | | | | | | | | | | | | | | | | | | | |
Other securities | | | | | | | | | | | | | | | 4,000,002 | | | | 0.18 | |
| | | | | | | | | | | | | | | | | | | | |
| | | | | |
Information Technology: 20.09% | | | | | | | | | | | | | | | | | | | | |
| | | | | |
| Communications Equipment: 1.00% | | | | | | | | | | | | | | | | | | | | |
Cisco Systems Incorporated | | | | | | | | | | | 571,151 | | | | 17,031,723 | | | | 0.76 | |
Other securities | | | | | | | | | | | | | | | 5,236,009 | | | | 0.24 | |
| | | | | |
| | | | | | | | | | | | | | | 22,267,732 | | | | 1.00 | |
| | | | | | | | | | | | | | | | | | | | |
The accompanying notes are an integral part of these financial statements.
| | | | |
| 46 | | Wells Fargo Allocation Funds | | Summary portfolio of investments—November 30, 2016 (unaudited) |
INDEX PORTFOLIO
| | | | | | | | | | | | | | | | | | | | |
| Security name | | | | | | | | Shares | | | Value | | | Percent of
net assets | |
| | | | | |
| Electronic Equipment, Instruments & Components: 0.37% | | | | | | | | | | | | | | | | | | | | |
Other securities | | | | | | | | | | | | | | $ | 8,279,406 | | | | 0.37 | % |
| | | | | | | | | | | | | | | | | | | | |
| | | | | |
| Internet Software & Services: 4.13% | | | | | | | | | | | | | | | | | | | | |
Alphabet Incorporated Class A † | | | | | | | | | | | 33,481 | | | | 25,977,238 | | | | 1.16 | |
Alphabet Incorporated Class C † | | | | | | | | | | | 33,556 | | | | 25,436,790 | | | | 1.14 | |
Facebook Incorporated Class A † | | | | | | | | | | | 263,785 | | | | 31,237,420 | | | | 1.40 | |
Other securities | | | | | | | | | | | | | | | 9,549,730 | | | | 0.43 | |
| | | | | |
| | | | | | | | | | | | | | | 92,201,178 | | | | 4.13 | |
| | | | | | | | | | | | | | | | | | | | |
| | | | | |
| IT Services: 3.59% | | | | | | | | | | | | | | | | | | | | |
International Business Machines Corporation | | | | | | | | | | | 98,773 | | | | 16,022,956 | | | | 0.72 | |
MasterCard Incorporated Class A | | | | | | | | | | | 108,892 | | | | 11,128,762 | | | | 0.50 | |
Visa Incorporated Class A | | | | | | | | | | | 214,215 | | | | 16,563,104 | | | | 0.74 | |
Other securities | | | | | | | | | | | | | | | 36,488,992 | | | | 1.63 | |
| | | | | |
| | | | | | | | | | | | | | | 80,203,814 | | | | 3.59 | |
| | | | | | | | | | | | | | | | | | | | |
| | | | | |
| Semiconductors & Semiconductor Equipment: 3.20% | | | | | | | | | | | | | | | | | | | | |
Intel Corporation | | | | | | | | | | | 537,231 | | | | 18,641,916 | | | | 0.84 | |
QUALCOMM Incorporated | | | | | | | | | | | 167,341 | | | | 11,400,942 | | | | 0.51 | |
Other securities | | | | | | | | | | | | | | | 41,421,595 | | | | 1.85 | |
| | | | | |
| | | | | | | | | | | | | | | 71,464,453 | | | | 3.20 | |
| | | | | | | | | | | | | | | | | | | | |
| | | | | |
| Software: 4.23% | | | | | | | | | | | | | | | | | | | | |
Microsoft Corporation | | | | | | | | | | | 884,882 | | | | 53,322,989 | | | | 2.39 | |
Oracle Corporation | | | | | | | | | | | 341,756 | | | | 13,735,174 | | | | 0.61 | |
Other securities | | | | | | | | | | | | | | | 27,403,125 | | | | 1.23 | |
| | | | | |
| | | | | | | | | | | | | | | 94,461,288 | | | | 4.23 | |
| | | | | | | | | | | | | | | | | | | | |
| | | | | |
| Technology Hardware, Storage & Peripherals: 3.57% | | | | | | | | | | | | | | | | | | | | |
Apple Incorporated | | | | | | | | | | | 611,887 | | | | 67,625,751 | | | | 3.03 | |
Other securities | | | | | | | | | | | | | | | 12,054,487 | | | | 0.54 | |
| | | | | |
| | | | | | | | | | | | | | | 79,680,238 | | | | 3.57 | |
| | | | | | | | | | | | | | | | | | | | |
| | | | | |
Materials: 2.81% | | | | | | | | | | | | | | | | | | | | |
| | | | | |
| Chemicals: 2.04% | | | | | | | | | | | | | | | | | | | | |
Other securities | | | | | | | | | | | | | | | 45,536,718 | | | | 2.04 | |
| | | | | | | | | | | | | | | | | | | | |
| | | | | |
| Construction Materials: 0.16% | | | | | | | | | | | | | | | | | | | | |
Other securities | | | | | | | | | | | | | | | 3,479,615 | | | | 0.16 | |
| | | | | | | | | | | | | | | | | | | | |
| | | | | |
| Containers & Packaging: 0.33% | | | | | | | | | | | | | | | | | | | | |
Other securities | | | | | | | | | | | | | | | 7,305,967 | | | | 0.33 | |
| | | | | | | | | | | | | | | | | | | | |
| | | | | |
| Metals & Mining: 0.28% | | | | | | | | | | | | | | | | | | | | |
Other securities | | | | | | | | | | | | | | | 6,332,800 | | | | 0.28 | |
| | | | | | | | | | | | | | | | | | | | |
The accompanying notes are an integral part of these financial statements.
| | | | | | |
| Summary portfolio of investments—November 30, 2016 (unaudited) | | Wells Fargo Allocation Funds | | | 47 | |
INDEX PORTFOLIO
| | | | | | | | | | | | | | | | | | | | |
| Security name | | | | | | | | Shares | | | Value | | | Percent of
net assets | |
| | | | | |
Real Estate: 2.67% | | | | | | | | | | | | | | | | | | | | |
| | | | | |
| Equity REITs: 2.63% | | | | | | | | | | | | | | | | | | | | |
Other securities | | | | | | | | | | | | | | $ | 58,634,333 | | | | 2.63 | % |
| | | | | | | | | | | | | | | | | | | | |
| | | | | |
| Real Estate Management & Development: 0.04% | | | | | | | | | | | | | | | | | | | | |
Other securities | | | | | | | | | | | | | | | 985,008 | | | | 0.04 | |
| | | | | | | | | | | | | | | | | | | | |
| | | | | |
Telecommunication Services: 2.41% | | | | | | | | | | | | | | | | | | | | |
| | | | | |
| Diversified Telecommunication Services: 2.41% | | | | | | | | | | | | | | | | | | | | |
AT&T Incorporated | | | | | | | | | | | 698,593 | | | | 26,986,648 | | | | 1.21 | |
Verizon Communications Incorporated | | | | | | | | | | | 462,886 | | | | 23,098,011 | | | | 1.03 | |
Other securities | | | | | | | | | | | | | | | 3,765,516 | | | | 0.17 | |
| | | | | |
| | | | | | | | | | | | | | | 53,850,175 | | | | 2.41 | |
| | | | | | | | | | | | | | | | | | | | |
| | | | | |
Utilities: 2.97% | | | | | | | | | | | | | | | | | | | | |
| | | | | |
| Electric Utilities: 1.84% | | | | | | | | | | | | | | | | | | | | |
Other securities | | | | | | | | | | | | | | | 41,064,531 | | | | 1.84 | |
| | | | | | | | | | | | | | | | | | | | |
| | | | | |
| Independent Power & Renewable Electricity Producers: 0.06% | | | | | | | | | | | | | | | | | | | | |
Other securities | | | | | | | | | | | | | | | 1,262,947 | | | | 0.06 | |
| | | | | | | | | | | | | | | | | | | | |
| | | | | |
| Multi-Utilities: 1.01% | | | | | | | | | | | | | | | | | | | | |
Other securities | | | | | | | | | | | | | | | 22,470,109 | | | | 1.01 | |
| | | | | | | | | | | | | | | | | | | | |
| | | | | |
| Water Utilities: 0.06% | | | | | | | | | | | | | | | | | | | | |
Other securities | | | | | | | | | | | | | | | 1,464,039 | | | | 0.06 | |
| | | | | | | | | | | | | | | | | | | | |
| | | | |
Total Common Stocks (Cost $964,325,647) | | | | | | | | | | | | 2,155,573,246 | | | | 96.55 | |
| | | | | | | | | | | | | | | | | | | | |
| | | | | |
| | | Yield | | | | | | | | | | | | | |
| Short-Term Investments: 0.62% | | | | | | | | | | | | | | | | | | | | |
| | | | | |
| Investment Companies: 0.54% | | | | | | | | | | | | | | | | | | | | |
Securities Lending Cash Investment LLC (l)(r)(u) | | | 0.65 | % | | | | | | | 12,148,091 | | | | 12,149,306 | | | | 0.54 | |
| | | | | | | | | | | | | | | | | | | | |
| | | | | |
| | | | | | Maturity date | | | Principal | | | | | | | |
| U.S. Treasury Securities: 0.08% | | | | | | | | | | | | | | | | | | | | |
U.S. Treasury Bill #(z) | | | 0.21 | | | | 12-15-2016 | | | $ | 535,000 | | | | 534,970 | | | | 0.02 | |
U.S. Treasury Bill #(z) | | | 0.31 | | | | 1-19-2017 | | | | 282,000 | | | | 281,867 | | | | 0.01 | |
U.S. Treasury Bill #(z) | | | 0.36 | | | | 1-5-2017 | | | | 331,000 | | | | 330,901 | | | | 0.02 | |
U.S. Treasury Bill #(z) | | | 0.41 | | | | 2-16-2017 | | | | 605,000 | | | | 604,419 | | | | 0.03 | |
U.S. Treasury Bill #(z) | | | 0.46 | | | | 2-23-2017 | | | | 50,000 | | | | 49,946 | | | | 0.00 | |
| | | | | |
| | | | | | | | | | | | | | | 1,802,103 | | | | 0.08 | |
| | | | | | | | | | | | | | | | | | | | |
| | | | |
Total Short-Term Investments (Cost $13,950,780) | | | | | | | | | | | | 13,951,409 | | | | 0.62 | |
| | | | | | | | | | | | | | | | | | | | |
| | | | | |
| Total investments in securities (Cost $978,276,427) * | | | | | | | | | | | | | | | 2,169,524,655 | | | | 97.17 | |
Other assets and liabilities, net | | | | | | | | | | | | | | | 63,087,873 | | | | 2.83 | |
| | | | | | | | | | | | | | | | | | | | |
| Total net assets | | | | | | | | | | | | | | $ | 2,232,612,528 | | | | 100.00 | % |
| | | | | | | | | | | | | | | | | | | | |
The accompanying notes are an integral part of these financial statements.
| | | | |
| 48 | | Wells Fargo Allocation Funds | | Summary portfolio of investments—November 30, 2016 (unaudited) |
INDEX PORTFOLIO
| † | Non-income-earning security |
| (l) | The issuer of the security is an affiliated person of the Portfolio as defined in the Investment Company Act of 1940. |
| (r) | The investment is a non-registered investment vehicle purchased with cash collateral received from securities on loan. |
| (u) | The rate represents the 7-day annualized yield at period end. |
| # | All or a portion of this security is segregated as collateral for investments in derivative instruments. |
| (z) | Zero coupon security. The rate represents the current yield to maturity. |
| * | Cost for federal income tax purposes is $980,547,734 and unrealized gains (losses) consists of: |
| | | | |
Gross unrealized gains | | $ | 1,214,008,252 | |
Gross unrealized losses | | | (25,031,331 | ) |
| | | | |
Net unrealized gains | | $ | 1,188,976,921 | |
The accompanying notes are an integral part of these financial statements.
| | | | | | |
| Portfolio of investments—November 30, 2016 (unaudited) | | Wells Fargo Allocation Funds | | | 49 | |
INTERNATIONAL GROWTH PORTFOLIO
| | | | | | | | | | | | | | | | |
| Security name | | | | | | | | Shares | | | Value | |
| | | | |
Common Stocks: 93.99% | | | | | | | | | | | | | | | | |
| | | | |
| Australia: 1.47% | | | | | | | | | | | | | | | | |
BHP Billiton Limited (Materials, Metals & Mining) | | | | | | | | | | | 35,733 | | | $ | 644,106 | |
Westpac Banking Corporation (Financials, Banks) | | | | | | | | | | | 57,349 | | | | 1,324,265 | |
| | | | |
| | | | | | | | | | | | | | | 1,968,371 | |
| | | | | | | | | | | | | | | | |
| | | | |
| Belgium: 0.97% | | | | | | | | | | | | | | | | |
Telenet Group Holding NV (Consumer Discretionary, Media) † | | | | | | | | | | | 24,727 | | | | 1,305,628 | |
| | | | | | | | | | | | | | | | |
| | | | |
| Canada: 4.23% | | | | | | | | | | | | | | | | |
Canadian Pacific Railway Limited (Industrials, Road & Rail) | | | | | | | | | | | 31,520 | | | | 4,830,440 | |
Rogers Communications Incorporated Class B (Telecommunication Services, Wireless Telecommunication Services) | | | | | | | | | | | 21,864 | | | | 844,742 | |
| | | | |
| | | | | | | | | | | | | | | 5,675,182 | |
| | | | | | | | | | | | | | | | |
| | | | |
| China: 5.72% | | | | | | | | | | | | | | | | |
Alibaba Group Holding Limited ADR (Information Technology, Internet Software & Services) † | | | | | | | | | | | 48,260 | | | | 4,537,405 | |
China Construction Bank H Shares (Financials, Banks) | | | | | | | | | | | 540,512 | | | | 402,780 | |
China Mobile Limited (Telecommunication Services, Wireless Telecommunication Services) | | | | | | | | | | | 158,500 | | | | 1,729,778 | |
Ctrip.com International Limited ADR (Consumer Discretionary, Internet & Direct Marketing Retail) † | | | | | | | | | | | 22,433 | | | | 1,014,645 | |
| | | | |
| | | | | | | | | | | | | | | 7,684,608 | |
| | | | | | | | | | | | | | | | |
| | | | |
| Denmark: 0.45% | | | | | | | | | | | | | | | | |
ISS AS (Industrials, Commercial Services & Supplies) | | | | | | | | | | | 17,616 | | | | 602,226 | |
| | | | | | | | | | | | | | | | |
| | | | |
| France: 4.12% | | | | | | | | | | | | | | | | |
AXA SA (Financials, Insurance) | | | | | | | | | | | 31,087 | | | | 732,424 | |
LVMH Moet Hennessy Louis Vuitton SA (Consumer Discretionary, Textiles, Apparel & Luxury Goods) « | | | | | | | | | | | 4,347 | | | | 791,051 | |
Pernod-Ricard SA (Consumer Staples, Beverages) | | | | | | | | | | | 8,852 | | | | 928,797 | |
Schneider Electric SE (Industrials, Electrical Equipment) | | | | | | | | | | | 3,347 | | | | 222,806 | |
Zodiac Aerospace SA (Industrials, Aerospace & Defense) | | | | | | | | | | | 128,822 | | | | 2,856,249 | |
| | | | |
| | | | | | | | | | | | | | | 5,531,327 | |
| | | | | | | | | | | | | | | | |
| | | | |
| Germany: 18.46% | | | | | | | | | | | | | | | | |
Allianz AG (Financials, Insurance) | | | | | | | | | | | 31,427 | | | | 4,989,523 | |
Beiersdorf AG (Consumer Staples, Personal Products) | | | | | | | | | | | 28,722 | | | | 2,346,393 | |
Deutsche Boerse AG (Financials, Diversified Financial Services) | | | | | | | | | | | 67,176 | | | | 5,428,730 | |
Deutsche Post AG (Industrials, Air Freight & Logistics) | | | | | | | | | | | 52,553 | | | | 1,642,542 | |
Linde AG (Materials, Chemicals) | | | | | | | | | | | 35,043 | | | | 5,838,457 | |
Vonovia SE (Real Estate, Real Estate Management & Development) | | | | | | | | | | | 60,926 | | | | 1,964,938 | |
Wirecard AG (Information Technology, IT Services) | | | | | | | | | | | 57,756 | | | | 2,576,748 | |
| | | | |
| | | | | | | | | | | | | | | 24,787,331 | |
| | | | | | | | | | | | | | | | |
| | | | |
| Hong Kong: 3.42% | | | | | | | | | | | | | | | | |
AIA Group Limited (Financials, Insurance) | | | | | | | | | | | 753,000 | | | | 4,591,878 | |
| | | | | | | | | | | | | | | | |
| | | | |
| Indonesia: 0.23% | | | | | | | | | | | | | | | | |
PT Bank Rakyat Indonesia Tbk (Financials, Banks) | | | | | | | | | | | 387,000 | | | | 311,256 | |
| | | | | | | | | | | | | | | | |
The accompanying notes are an integral part of these financial statements.
| | | | |
| 50 | | Wells Fargo Allocation Funds | | Portfolio of investments—November 30, 2016 (unaudited) |
INTERNATIONAL GROWTH PORTFOLIO
| | | | | | | | | | | | | | | | |
| Security name | | | | | | | | Shares | | | Value | |
| | | | |
| Ireland: 5.29% | | | | | | | | | | | | | | | | |
Allegion plc (Industrials, Building Products) | | | | | | | | | | | 2,032 | | | $ | 135,961 | |
Medtronic plc (Health Care, Health Care Equipment & Supplies) | | | | | | | | | | | 72,196 | | | | 5,271,030 | |
Willis Towers Watson plc (Financials, Insurance) | | | | | | | | | | | 13,620 | | | | 1,693,919 | |
| | | | |
| | | | | | | | | | | | | | | 7,100,910 | |
| | | | | | | | | | | | | | | | |
| | | | |
| Italy: 1.96% | | | | | | | | | | | | | | | | |
Atlantia SpA (Industrials, Transportation Infrastructure) « | | | | | | | | | | | 56,331 | | | | 1,251,362 | |
Intesa Sanpaolo SpA (Financials, Banks) | | | | | | | | | | | 618,767 | | | | 1,374,557 | |
| | | | |
| | | | | | | | | | | | | | | 2,625,919 | |
| | | | | | | | | | | | | | | | |
| | | | |
| Japan: 12.47% | | | | | | | | | | | | | | | | |
Bridgestone Corporation (Consumer Discretionary, Auto Components) | | | | | | | | | | | 25,700 | | | | 981,005 | |
CALBEE Incorporated (Consumer Staples, Food Products) | | | | | | | | | | | 30,300 | | | | 944,185 | |
Japan Tobacco Incorporated (Consumer Staples, Tobacco) | | | | | | | | | | | 166,754 | | | | 5,751,596 | |
KDDI Corporation (Telecommunication Services, Wireless Telecommunication Services) | | | | | | | | | | | 92,800 | | | | 2,432,649 | |
Nippon Telegraph & Telephone Corporation (Telecommunication Services, Diversified Telecommunication Services) | | | | | | | | | | | 60,400 | | | | 2,441,764 | |
Nomura Holdings Incorporated (Financials, Capital Markets) | | | | | | | | | | | 14,500 | | | | 77,714 | |
NTT DOCOMO Incorporated (Telecommunication Services, Wireless Telecommunication Services) | | | | | | | | | | | 161,593 | | | | 3,706,307 | |
Seven & I Holdings Company Limited (Consumer Staples, Food & Staples Retailing) | | | | | | | | | | | 10,600 | | | | 410,917 | |
| | | | |
| | | | | | | | | | | | | | | 16,746,137 | |
| | | | | | | | | | | | | | | | |
| | | | |
| Luxembourg: 0.31% | | | | | | | | | | | | | | | | |
RTL Group SA (Consumer Discretionary, Media) | | | | | | | | | | | 6,064 | | | | 412,030 | |
| | | | | | | | | | | | | | | | |
| | | | |
| Netherlands: 4.79% | | | | | | | | | | | | | | | | |
Akzo Nobel NV (Materials, Chemicals) | | | | | | | | | | | 23,491 | | | | 1,462,944 | |
ASML Holding NV (Information Technology, Semiconductors & Semiconductor Equipment) | | | | | | | | | | | 11,856 | | | | 1,226,652 | |
Heineken NV (Consumer Staples, Beverages) | | | | | | | | | | | 4,147 | | | | 310,828 | |
ING Group NV (Financials, Banks) | | | | | | | | | | | 252,482 | | | | 3,438,570 | |
| | | | |
| | | | | | | | | | | | | | | 6,438,994 | |
| | | | | | | | | | | | | | | | |
| | | | |
| Russia: 0.27% | | | | | | | | | | | | | | | | |
MMC Norilsk Nickel PJSC (Materials, Metals & Mining) | | | | | | | | | | | 21,629 | | | | 362,935 | |
| | | | | | | | | | | | | | | | |
| | | | |
| South Korea: 0.01% | | | | | | | | | | | | | | | | |
Orion Corporation (Consumer Staples, Food Products) | | | | | | | | | | | 18 | | | | 10,470 | |
| | | | | | | | | | | | | | | | |
| | | | |
| Spain: 1.82% | | | | | | | | | | | | | | | | |
Grifols SA (Health Care, Biotechnology) | | | | | | | | | | | 44,705 | | | | 876,541 | |
Grifols SA ADR (Health Care, Biotechnology) | | | | | | | | | | | 100,677 | | | | 1,573,582 | |
| | | | |
| | | | | | | | | | | | | | | 2,450,123 | |
| | | | | | | | | | | | | | | | |
| | | | |
| Sweden: 1.16% | | | | | | | | | | | | | | | | |
Swedbank AB Class A (Financials, Banks) | | | | | | | | | | | 67,414 | | | | 1,556,191 | |
| | | | | | | | | | | | | | | | |
| | | | |
| Switzerland: 7.39% | | | | | | | | | | | | | | | | |
Actelion Limited (Health Care, Biotechnology) | | | | | | | | | | | 6,140 | | | | 1,183,673 | |
LafargeHolcim Limited (Materials, Construction Materials) | | | | | | | | | | | 24,233 | | | | 1,283,512 | |
Nestle SA (Consumer Staples, Food Products) | | | | | | | | | | | 73,051 | | | | 4,914,614 | |
The accompanying notes are an integral part of these financial statements.
| | | | | | |
| Portfolio of investments—November 30, 2016 (unaudited) | | Wells Fargo Allocation Funds | | | 51 | |
INTERNATIONAL GROWTH PORTFOLIO
| | | | | | | | | | | | | | | | |
| Security name | | | | | | | | Shares | | | Value | |
| | | | |
| Switzerland (continued) | | | | | | | | | | | | | | | | |
Roche Holding AG (Health Care, Pharmaceuticals) | | | | | | | | | | | 3,060 | | | $ | 682,307 | |
UBS Group AG (Financials, Capital Markets) | | | | | | | | | | | 116,663 | | | | 1,855,455 | |
| | | | |
| | | | | | | | | | | | | | | 9,919,561 | |
| | | | | | | | | | | | | | | | |
| | | | |
| Taiwan: 2.11% | | | | | | | | | | | | | | | | |
Taiwan Semiconductor Manufacturing Company Limited (Information Technology, Semiconductors & Semiconductor Equipment) | | | | | | | | | | | 493,000 | | | | 2,830,578 | |
| | | | | | | | | | | | | | | | |
| | | | |
| Thailand: 0.14% | | | | | | | | | | | | | | | | |
Thai Beverage PCL (Consumer Staples, Beverages) | | | | | | | | | | | 311,500 | | | | 190,158 | |
| | | | | | | | | | | | | | | | |
| | | | |
| United Kingdom: 15.06% | | | | | | | | | | | | | | | | |
Aon plc (Financials, Insurance) | | | | | | | | | | | 37,872 | | | | 4,321,195 | |
BHP Billiton plc (Materials, Metals & Mining) | | | | | | | | | | | 51,436 | | | | 845,325 | |
British American Tobacco plc (Consumer Staples, Tobacco) | | | | | | | | | | | 25,681 | | | | 1,411,722 | |
Coca-Cola European Partners plc (Consumer Staples, Beverages) | | | | | | | | | | | 73,650 | | | | 2,390,679 | |
Conva Tec Limited (Health Care, Health Care Equipment & Supplies) †144A | | | | | | | | | | | 430,131 | | | | 1,280,868 | |
Imperial Tobacco Group plc (Consumer Staples, Tobacco) | | | | | | | | | | | 24,893 | | | | 1,069,246 | |
Liberty Global plc Class A (Consumer Discretionary, Media) | | | | | | | | | | | 61,931 | | | | 1,939,679 | |
Liberty Global plc Class C (Consumer Discretionary, Media) | | | | | | | | | | | 101,136 | | | | 3,079,591 | |
Liberty Global plc LiLAC Class A (Consumer Discretionary, Media) †« | | | | | | | | | | | 9,208 | | | | 198,709 | |
Liberty Global plc LiLAC Class C (Consumer Discretionary, Media) † | | | | | | | | | | | 14,073 | | | | 297,925 | |
St. James’s Place plc (Financials, Insurance) | | | | | | | | | | | 11,697 | | | | 137,572 | |
Unilever plc (Consumer Staples, Personal Products) | | | | | | | | | | | 34,191 | | | | 1,367,241 | |
Wolseley plc (Industrials, Trading Companies & Distributors) | | | | | | | | | | | 32,418 | | | | 1,884,076 | |
| | | | |
| | | | | | | | | | | | | | | 20,223,828 | |
| | | | | | | | | | | | | | | | |
| | | | |
| United States: 2.14% | | | | | | | | | | | | | | | | |
Amazon.com Incorporated (Consumer Discretionary, Internet & Direct Marketing Retail) † | | | | | | | | | | | 2,183 | | | | 1,638,494 | |
WABCO Holdings Incorporated (Industrials, Machinery) † | | | | | | | | | | | 12,575 | | | | 1,238,763 | |
| | | | |
| | | | | | | | | | | | | | | 2,877,257 | |
| | | | | | | | | | | | | | | | |
| | | | |
Total Common Stocks (Cost $123,698,895) | | | | | | | | | | | | | | | 126,202,898 | |
| | | | | | | | | | | | | | | | |
| | | | |
| | | | | | Expiration date | | | | | | | |
| Participation Notes: 2.22% | | | | | | | | | | | | | | | | |
| | | | |
| Ireland: 2.22% | | | | | | | | | | | | | | | | |
HSBC Bank plc (Ryanair Holdings plc) (Industrials, Airlines) | | | | | | | 10-29-2018 | | | | 203,815 | | | | 2,979,015 | |
| | | | | | | | | | | | | | | | |
| | | | |
Total Participation Notes (Cost $2,299,114) | | | | | | | | | | | | | | | 2,979,015 | |
| | | | | | | | | | | | | | | | |
| | | | |
| | | Dividend yield | | | | | | | | | | |
| Preferred Stocks: 1.49% | | | | | | | | | | | | | | | | |
| | | | |
| Germany: 1.49% | | | | | | | | | | | | | | | | |
Henkel AG & Company KGaA (Consumer Staples, Household Products) ± | | | 1.44 | % | | | | | | | 17,290 | | | | 2,002,901 | |
| | | | | | | | | | | | | | | | |
| | | | |
Total Preferred Stocks (Cost $1,464,874) | | | | | | | | | | | | | | | 2,002,901 | |
| | | | | | | | | | | | | | | | |
The accompanying notes are an integral part of these financial statements.
| | | | |
| 52 | | Wells Fargo Allocation Funds | | Portfolio of investments—November 30, 2016 (unaudited) |
INTERNATIONAL GROWTH PORTFOLIO
| | | | | | | | | | | | | | | | |
| Security name | | Yield | | | | | | Shares | | | Value | |
| Short-Term Investments: 2.95% | | | | | | | | | | | | | | | | |
| | | | |
| Investment Companies: 2.95% | | | | | | | | | | | | | | | | |
Securities Lending Cash Investment LLC (l)(r)(u) | | | 0.65 | % | | | | | | | 2,197,894 | | | $ | 2,198,114 | |
Wells Fargo Government Money Market Fund Select Class (l)(u) | | | 0.31 | | | | | | | | 1,759,819 | | | | 1,759,819 | |
| | | | |
Total Short-Term Investments (Cost $3,957,933) | | | | | | | | | | | | | | | 3,957,933 | |
| | | | | | | | | | | | | | | | |
| | | | | | | | |
| Total investments in securities (Cost $131,420,816) * | | | 100.65 | % | | | 135,142,747 | |
Other assets and liabilities, net | | | (0.65 | ) | | | (867,980 | ) |
| | | | | | | | |
| Total net assets | | | 100.00 | % | | $ | 134,274,767 | |
| | | | | | | | |
| † | Non-income-earning security |
| « | All or a portion of this security is on loan. |
| 144A | The security may be resold in transactions exempt from registration, normally to qualified institutional buyers, pursuant to Rule 144A under the Securities Act of 1933. |
| ± | Variable rate investment. The rate shown is the rate in effect at period end. |
| (l) | The issuer of the security is an affiliated person of the Portfolio as defined in the Investment Company Act of 1940. |
| (r) | The investment is a non-registered investment vehicle purchased with cash collateral received from securities on loan. |
| (u) | The rate represents the 7-day annualized yield at period end. |
| * | Cost for federal income tax purposes is $131,355,071 and unrealized gains (losses) consists of: |
| | | | |
Gross unrealized gains | | $ | 9,514,811 | |
Gross unrealized losses | | | (5,727,135 | ) |
| | | | |
Net unrealized gains | | $ | 3,787,676 | |
The following table shows the percent of total long-term investments by sector as of November 30, 2016:
| | | | |
Financials | | | 24.57 | % |
Consumer Staples | | | 18.33 | |
Industrials | | | 13.45 | |
Consumer Discretionary | | | 8.89 | |
Information Technology | | | 8.52 | |
Telecommunication Services | | | 8.50 | |
Health Care | | | 8.28 | |
Materials | | | 7.96 | |
Real Estate | | | 1.50 | |
| | | | |
| | | 100.00 | % |
| | | | |
The accompanying notes are an integral part of these financial statements.
| | | | | | |
| Portfolio of investments—November 30, 2016 (unaudited) | | Wells Fargo Allocation Funds | | | 53 | |
INTERNATIONAL VALUE PORTFOLIO
| | | | | | | | | | | | | | | | |
| Security name | | | | | | | | Shares | | | Value | |
| | | | |
Common Stocks: 97.38% | | | | | | | | | | | | | | | | |
| | | | |
| Australia: 5.64% | | | | | | | | | | | | | | | | |
Arrium Limited (Materials, Metals & Mining) †(a) | | | | | | | | | | | 3,063,400 | | | $ | 49,771 | |
Asaleo Care Limited (Consumer Staples, Personal Products) | | | | | | | | | | | 1,262,800 | | | | 1,436,072 | |
Automotive Holdings Group Limited (Consumer Discretionary, Specialty Retail) | | | | | | | | | | | 410,016 | | | | 1,111,189 | |
Bendigo Bank Limited (Financials, Banks) | | | | | | | | | | | 272,500 | | | | 2,424,793 | |
BlueScope Steel Limited (Materials, Metals & Mining) | | | | | | | | | | | 234,700 | | | | 1,563,294 | |
Boart Longyear Limited (Industrials, Construction & Engineering) † | | | | | | | | | | | 199,991 | | | | 18,460 | |
Cabcharge Australia Limited (Industrials, Commercial Services & Supplies) | | | | | | | | | | | 207,386 | | | | 565,102 | |
Challenger Financial Services Group Limited (Financials, Diversified Financial Services) | | | | | | | | | | | 200,200 | | | | 1,574,471 | |
CSR Limited (Materials, Construction Materials) | | | | | | | | | | | 754,900 | | | | 2,268,845 | |
Downer EDI Limited (Industrials, Commercial Services & Supplies) | | | | | | | | | | | 518,900 | | | | 2,172,640 | |
Fortescue Metals Group Limited (Materials, Metals & Mining) | | | | | | | | | | | 380,300 | | | | 1,648,487 | |
Harvey Norman Holdings Limited (Consumer Discretionary, Multiline Retail) | | | | | | | | | | | 455,500 | | | | 1,597,729 | |
Lendlease Corporation Limited (Real Estate, Real Estate Management & Development) | | | | | | | | | | | 350,500 | | | | 3,522,631 | |
McMillan Shakespeare Limited (Industrials, Professional Services) | | | | | | | | | | | 158,800 | | | | 1,158,587 | |
Metcash Limited (Consumer Staples, Food & Staples Retailing) †« | | | | | | | | | | | 1,164,200 | | | | 1,770,989 | |
Mincor Resources NL (Materials, Metals & Mining) †(i) | | | | | | | | | | | 550,994 | | | | 115,961 | |
Mineral Resources Limited (Industrials, Metals & Mining) | | | | | | | | | | | 144,300 | | | | 1,339,438 | |
Myer Holdings Limited (Consumer Discretionary, Multiline Retail) | | | | | | | | | | | 1,059,500 | | | | 997,544 | |
Panoramic Resources Limited (Materials, Metals & Mining) † | | | | | | | | | | | 180,600 | | | | 44,010 | |
Primary Health Care Limited (Health Care, Health Care Providers & Services) | | | | | | | | | | | 339,000 | | | | 918,728 | |
Qantas Airways Limited (Industrials, Airlines) | | | | | | | | | | | 821,700 | | | | 2,002,388 | |
Retail Food Group Limited (Consumer Discretionary, Food Products) | | | | | | | | | | | 269,500 | | | | 1,231,886 | |
Seven Group Holdings Limited (Industrials, Trading Companies & Distributors) | | | | | | | | | | | 157,700 | | | | 992,184 | |
| | | | |
| | | | | | | | | | | | | | | 30,525,199 | |
| | | | | | | | | | | | | | | | |
| | | | |
| Austria: 1.27% | | | | | | | | | | | | | | | | |
OMV AG (Energy, Oil, Gas & Consumable Fuels) | | | | | | | | | | | 62,900 | | | | 2,032,935 | |
Raiffeisen Bank International AG (Financials, Banks) † | | | | | | | | | | | 81,200 | | | | 1,478,938 | |
RHI AG (Materials, Construction Materials) | | | | | | | | | | | 64,721 | | | | 1,562,926 | |
Voestalpine AG (Materials, Metals & Mining) | | | | | | | | | | | 47,700 | | | | 1,807,588 | |
| | | | |
| | | | | | | | | | | | | | | 6,882,387 | |
| | | | | | | | | | | | | | | | |
| | | | |
| Brazil: 1.05% | | | | | | | | | | | | | | | | |
Banco do Brasil SA (Financials, Banks) | | | | | | | | | | | 309,500 | | | | 2,608,108 | |
Companhia de Saneamento de Minas Gerais SA (Utilities, Water Utilities) | | | | | | | | | | | 72,400 | | | | 729,769 | |
JBS SA (Consumer Staples, Food Products) | | | | | | | | | | | 805,600 | | | | 2,324,820 | |
| | | | |
| | | | | | | | | | | | | | | 5,662,697 | |
| | | | | | | | | | | | | | | | |
| | | | |
| Canada: 2.03% | | | | | | | | | | | | | | | | |
Magna International Incorporated (Consumer Discretionary, Auto Components) « | | | | | | | | | | | 131,600 | | | | 5,317,686 | |
Open Text Corporation (Information Technology, Software) | | | | | | | | | | | 59,700 | | | | 3,803,858 | |
WestJet Airlines Limited (Industrials, Airlines) | | | | | | | | | | | 120,000 | | | | 1,881,337 | |
| | | | |
| | | | | | | | | | | | | | | 11,002,881 | |
| | | | | | | | | | | | | | | | |
| | | | |
| China: 2.70% | | | | | | | | | | | | | | | | |
China BlueChemical Limited H Shares (Materials, Chemicals) | | | | | | | | | | | 1,984,000 | | | | 455,298 | |
China Communications Services Corporation Limited H Shares (Telecommunication Services, Diversified Telecommunication Services) | | | | | | | | | | | 2,836,000 | | | | 1,670,924 | |
The accompanying notes are an integral part of these financial statements.
| | | | |
| 54 | | Wells Fargo Allocation Funds | | Portfolio of investments—November 30, 2016 (unaudited) |
INTERNATIONAL VALUE PORTFOLIO
| | | | | | | | | | | | | | | | |
| Security name | | | | | | | | Shares | | | Value | |
| | | | |
| China (continued) | | | | | | | | | | | | | | | | |
China Petroleum & Chemical Corporation H Shares (Energy, Oil, Gas & Consumable Fuels) | | | | | | | | | | | 2,970,000 | | | $ | 2,075,343 | |
China Railway Construction Corporation Limited H Shares (Industrials, Construction & Engineering) | | | | | | | | | | | 1,747,500 | | | | 2,482,750 | |
Dongfeng Motor Group Company Limited H Shares (Consumer Discretionary, Automobiles) | | | | | | | | | | | 1,730,000 | | | | 1,759,776 | |
PICC Property & Casualty Company Limited H Shares (Financials, Insurance) | | | | | | | | | | | 910,000 | | | | 1,525,172 | |
Shanghai Pharmaceuticals Holding Company Limited H Shares (Health Care, Health Care Providers & Services) | | | | | | | | | | | 676,200 | | | | 1,691,263 | |
Shenzhen International Holdings Limited H Shares (Industrials, Transportation Infrastructure) | | | | | | | | | | | 731,500 | | | | 1,076,997 | |
Xinyi Glass Holdings Limited (Consumer Discretionary, Auto Components) | | | | | | | | | | | 2,502,000 | | | | 1,864,444 | |
| | | | |
| | | | | | | | | | | | | | | 14,601,967 | |
| | | | | | | | | | | | | | | | |
| | | | |
| Czech Republic: 0.17% | | | | | | | | | | | | | | | | |
CEZ AS (Utilities, Electric Utilities) | | | | | | | | | | | 57,500 | | | | 933,331 | |
| | | | | | | | | | | | | | | | |
| | | | |
| Denmark: 0.95% | | | | | | | | | | | | | | | | |
Danske Bank AS (Financials, Banks) | | | | | | | | | | | 132,300 | | | | 3,865,153 | |
Sydbank AS (Financials, Banks) | | | | | | | | | | | 43,000 | | | | 1,264,823 | |
| | | | |
| | | | | | | | | | | | | | | 5,129,976 | |
| | | | | | | | | | | | | | | | |
| | | | |
| Finland: 0.23% | | | | | | | | | | | | | | | | |
Tieto Oyj (Information Technology, IT Services) | | | | | | | | | | | 48,200 | | | | 1,222,969 | |
| | | | | | | | | | | | | | | | |
| | | | |
| France: 9.40% | | | | | | | | | | | | | | | | |
Atos Origin SA (Information Technology, IT Services) | | | | | | | | | | | 42,800 | | | | 4,424,114 | |
AXA SA (Financials, Insurance) | | | | | | | | | | | 132,200 | | | | 3,114,693 | |
BNP Paribas SA (Financials, Banks) | | | | | | | | | | | 49,100 | | | | 2,850,676 | |
Carrefour SA (Consumer Staples, Food & Staples Retailing) | | | | | | | | | | | 133,200 | | | | 3,122,724 | |
Cie Generale des Establissements Michelin (Consumer Discretionary, Auto Components) | | | | | | | | | | | 32,700 | | | | 3,500,366 | |
Credit Agricole SA (Financials, Banks) | | | | | | | | | | | 219,328 | | | | 2,475,643 | |
Electricite de France SA (Utilities, Electric Utilities) « | | | | | | | | | | | 148,600 | | | | 1,574,149 | |
Engie SA (Utilities, Multi-Utilities) | | | | | | | | | | | 171,900 | | | | 2,122,492 | |
Orange SA (Telecommunication Services, Diversified Telecommunication Services) | | | | | | | | | | | 243,000 | | | | 3,542,511 | |
Renault SA (Consumer Discretionary, Automobiles) | | | | | | | | | | | 40,500 | | | | 3,190,964 | |
Sanofi SA (Health Care, Pharmaceuticals) | | | | | | | | | | | 123,800 | | | | 9,986,347 | |
SCOR SE (Financials, Insurance) | | | | | | | | | | | 109,700 | | | | 3,483,896 | |
Societe Generale SA (Financials, Banks) | | | | | | | | | | | 39,000 | | | | 1,677,546 | |
Thales SA (Industrials, Aerospace & Defense) | | | | | | | | | | | 13,500 | | | | 1,318,193 | |
Total SA (Energy, Oil, Gas & Consumable Fuels) | | | | | | | | | | | 93,700 | | | | 4,464,387 | |
| | | | |
| | | | | | | | | | | | | | | 50,848,701 | |
| | | | | | | | | | | | | | | | |
| | | | |
| Germany: 8.27% | | | | | | | | | | | | | | | | |
Allianz AG (Financials, Insurance) | | | | | | | | | | | 35,700 | | | | 5,667,928 | |
Aurubis AG (Materials, Metals & Mining) | | | | | | | | | | | 25,900 | | | | 1,371,545 | |
BASF SE (Materials, Chemicals) | | | | | | | | | | | 46,500 | | | | 3,991,431 | |
Bayer AG (Health Care, Pharmaceuticals) | | | | | | | | | | | 44,600 | | | | 4,187,587 | |
Bayerische Motoren Werke AG (Consumer Discretionary, Automobiles) | | | | | | | | | | | 31,200 | | | | 2,658,942 | |
Daimler AG (Consumer Discretionary, Automobiles) | | | | | | | | | | | 75,700 | | | | 5,035,274 | |
Deutsche Bank AG (Financials, Capital Markets) † | | | | | | | | | | | 130,100 | | | | 2,048,993 | |
Deutsche Post AG (Industrials, Air Freight & Logistics) | | | | | | | | | | | 74,100 | | | | 2,315,993 | |
E.ON SE (Utilities, Multi-Utilities) | | | | | | | | | | | 87,200 | | | | 575,492 | |
Hannover Rueck SE (Financials, Insurance) | | | | | | | | | | | 16,300 | | | | 1,730,146 | |
Metro AG (Consumer Staples, Food & Staples Retailing) | | | | | | | | | | | 108,100 | | | | 3,230,294 | |
The accompanying notes are an integral part of these financial statements.
| | | | | | |
| Portfolio of investments—November 30, 2016 (unaudited) | | Wells Fargo Allocation Funds | | | 55 | |
INTERNATIONAL VALUE PORTFOLIO
| | | | | | | | | | | | | | | | |
| Security name | | | | | | | | Shares | | | Value | |
| | | | |
| Germany (continued) | | | | | | | | | | | | | | | | |
Muenchener Rueckversicherungs Gesellschaft AG (Financials, Insurance) | | | | | | | | | | | 23,200 | | | $ | 4,225,536 | |
Siemens AG (Industrials, Industrial Conglomerates) | | | | | | | | | | | 26,600 | | | | 3,005,267 | |
Stada Arzneimittel AG (Health Care, Pharmaceuticals) | | | | | | | | | | | 30,500 | | | | 1,489,878 | |
Uniper SE (Utilities, Independent Power & Renewable Electricity Producers) | | | | | | | | | | | 8,720 | | | | 108,638 | |
Volkswagen AG (Consumer Discretionary, Automobiles) | | | | | | | | | | | 22,600 | | | | 3,094,676 | |
| | | | |
| | | | | | | | | | | | | | | 44,737,620 | |
| | | | | | | | | | | | | | | | |
| | | | |
| Hong Kong: 2.13% | | | | | | | | | | | | | | | | |
China Resources Cement Holdings Limited (Materials, Construction Materials) | | | | | | | | | | | 2,350,000 | | | | 1,008,896 | |
Kingboard Laminates Holdings Limited (Information Technology, Electronic Equipment, Instruments & Components) (i) | | | | | | | | | | | 2,204,000 | | | | 1,952,102 | |
Lee & Man Paper Manufacturing Limited (Materials, Paper & Forest Products) | | | | | | | | | | | 2,338,000 | | | | 1,796,491 | |
Skyworth Digital Holdings Limited (Consumer Discretionary, Household Durables) | | | | | | | | | | | 3,680,000 | | | | 2,310,527 | |
Wheelock & Company Limited (Real Estate, Real Estate Management & Development) | | | | | | | | | | | 379,000 | | | | 2,252,549 | |
Yue Yuen Industrial Holdings Limited (Consumer Discretionary, Textiles, Apparel & Luxury Goods) | | | | | | | | | | | 611,500 | | | | 2,203,497 | |
| | | | |
| | | | | | | | | | | | | | | 11,524,062 | |
| | | | | | | | | | | | | | | | |
| | | | |
| Hungary: 0.22% | | | | | | | | | | | | | | | | |
Richter Gedeon (Health Care, Pharmaceuticals) | | | | | | | | | | | 58,400 | | | | 1,166,323 | |
| | | | | | | | | | | | | | | | |
| | | | |
| India: 0.31% | | | | | | | | | | | | | | | | |
Tata Motors Limited ADR (Consumer Discretionary, Automobiles) | | | | | | | | | | | 50,800 | | | | 1,679,956 | |
| | | | | | | | | | | | | | | | |
| | | | |
| Ireland: 0.71% | | | | | | | | | | | | | | | | |
C&C Group plc (Consumer Staples, Beverages) | | | | | | | | | | | 240,000 | | | | 884,932 | |
Smurfit Kappa Group plc (Materials, Containers & Packaging) | | | | | | | | | | | 130,200 | | | | 2,966,837 | |
| | | | |
| | | | | | | | | | | | | | | 3,851,769 | |
| | | | | | | | | | | | | | | | |
| | | | |
| Israel: 0.96% | | | | | | | | | | | | | | | | |
Bank Hapoalim Limited (Financials, Banks) | | | | | | | | | | | 542,900 | | | | 3,267,631 | |
Teva Pharmaceutical Industries Limited (Health Care, Pharmaceuticals) | | | | | | | | | | | 51,404 | | | | 1,905,194 | |
| | | | |
| | | | | | | | | | | | | | | 5,172,825 | |
| | | | | | | | | | | | | | | | |
| | | | |
| Italy: 1.61% | | | | | | | | | | | | | | | | |
A2A SpA (Utilities, Multi-Utilities) | | | | | | | | | | | 1,078,900 | | | | 1,286,406 | |
Enel SpA (Utilities, Electric Utilities) | | | | | | | | | | | 688,400 | | | | 2,782,696 | |
Leonardo-Finmeccanica SpA (Industrials, Aerospace & Defense) † | | | | | | | | | | | 184,000 | | | | 2,388,901 | |
Mediobanca SpA (Financials, Banks) | | | | | | | | | | | 324,800 | | | | 2,240,997 | |
| | | | |
| | | | | | | | | | | | | | | 8,699,000 | |
| | | | | | | | | | | | | | | | |
| | | | |
| Japan: 23.36% | | | | | | | | | | | | | | | | |
Adeka Corporation (Materials, Chemicals) | | | | | | | | | | | 155,300 | | | | 2,089,128 | |
Aisin Seiki Company Limited (Consumer Discretionary, Auto Components) | | | | | | | | | | | 46,400 | | | | 1,983,270 | |
Anritsu Corporation (Information Technology, Electronic Equipment, Instruments & Components) | | | | | | | | | | | 206,300 | | | | 1,044,078 | |
Aoyama Trading Company Limited (Consumer Discretionary, Specialty Retail) | | | | | | | | | | | 24,800 | | | | 842,166 | |
Aozora Bank Limited (Financials, Banks) | | | | | | | | | | | 427,000 | | | | 1,466,815 | |
Astellas Pharma Incorporated (Health Care, Pharmaceuticals) | | | | | | | | | | | 136,700 | | | | 1,887,310 | |
Calsonic Kansei Corporation (Consumer Discretionary, Auto Components) | | | | | | | | | | | 326,000 | | | | 4,998,068 | |
Central Glass Company Limited (Industrials, Building Products) | | | | | | | | | | | 444,000 | | | | 1,754,189 | |
CKD Corporation (Industrials, Machinery) | | | | | | | | | | | 171,200 | | | | 2,059,099 | |
The accompanying notes are an integral part of these financial statements.
| | | | |
| 56 | | Wells Fargo Allocation Funds | | Portfolio of investments—November 30, 2016 (unaudited) |
INTERNATIONAL VALUE PORTFOLIO
| | | | | | | | | | | | | | | | |
| Security name | | | | | | | | Shares | | | Value | |
| | | | |
| Japan (continued) | | | | | | | | | | | | | | | | |
Cocokara Fine Incorporated (Consumer Staples, Food & Staples Retailing) | | | | | | | | | | | 15,100 | | | $ | 553,027 | |
DCM Holdings Company Limited (Consumer Discretionary, Specialty Retail) « | | | | | | | | | | | 143,100 | | | | 1,292,097 | |
Denka Company Limited (Materials, Chemicals) | | | | | | | | | | | 682,000 | | | | 3,010,445 | |
DIC Incorporated (Materials, Chemicals) | | | | | | | | | | | 100,700 | | | | 3,111,529 | |
Eizo Corporation (Information Technology, Technology Hardware, Storage & Peripherals) | | | | | | | | | | | 63,300 | | | | 1,864,613 | |
Fujikura Limited (Industrials, Electrical Equipment) | | | | | | | | | | | 348,000 | | | | 1,876,806 | |
Geo Holdings Corporation (Consumer Discretionary, Specialty Retail) | | | | | | | | | | | 91,700 | | | | 992,305 | |
Hitachi Limited (Information Technology, Electronic Equipment, Instruments & Components) | | | | | | | | | | | 327,800 | | | | 1,745,803 | |
Isuzu Motors Limited (Consumer Discretionary, Automobiles) | | | | | | | | | | | 221,400 | | | | 2,610,625 | |
Itochu Corporation (Industrials, Trading Companies & Distributors) | | | | | | | | | | | 200,700 | | | | 2,740,207 | |
Japan Airlines Company Limited (Industrials, Airlines) | | | | | | | | | | | 80,700 | | | | 2,387,741 | |
KDDI Corporation (Telecommunication Services, Wireless Telecommunication Services) | | | | | | | | | | | 245,400 | | | | 6,432,888 | |
Kureha Corporation (Materials, Chemicals) | | | | | | | | | | | 27,100 | | | | 1,106,219 | |
Kyorin Company Limited (Health Care, Pharmaceuticals) | | | | | | | | | | | 99,000 | | | | 2,078,563 | |
Maeda Road Construction Company Limited (Industrials, Construction & Engineering) | | | | | | | | | | | 148,000 | | | | 2,545,903 | |
Makino Milling Machine Company Limited (Industrials, Machinery) | | | | | | | | | | | 232,000 | | | | 1,638,530 | |
Marubeni Corporation (Industrials, Trading Companies & Distributors) | | | | | | | | | | | 516,000 | | | | 2,824,796 | |
Matsumotokiyoshi Holdings Company Limited (Consumer Staples, Food & Staples Retailing) | | | | | | | | | | | 60,500 | | | | 2,887,374 | |
Miraca Holdings Incorporated (Health Care, Health Care Providers & Services) | | | | | | | | | | | 25,100 | | | | 1,123,308 | |
Mitsubishi Gas Chemical Company Incorporated (Materials, Chemicals) | | | | | | | | | | | 278,200 | | | | 4,216,588 | |
Mitsubishi UFJ Financial Group Incorporated (Financials, Banks) | | | | | | | | | | | 657,100 | | | | 3,847,083 | |
Mizuho Financial Group Incorporated (Financials, Banks) | | | | | | | | | | | 2,244,400 | | | | 3,974,612 | |
Nippon Telegraph & Telephone Corporation (Telecommunication Services, Diversified Telecommunication Services) | | | | | | | | | | | 201,600 | | | | 8,149,993 | |
Nissan Motor Company Limited (Consumer Discretionary, Automobiles) | | | | | | | | | | | 505,000 | | | | 4,663,542 | |
Nisshinbo Holdings Incorporated (Industrials, Industrial Conglomerates) | | | | | | | | | | | 147,200 | | | | 1,425,616 | |
NTT DOCOMO Incorporated (Telecommunication Services, Wireless Telecommunication Services) | | | | | | | | | | | 98,600 | | | | 2,261,496 | |
ORIX Corporation (Financials, Diversified Financial Services) | | | | | | | | | | | 201,300 | | | | 3,134,618 | |
Resona Holdings Incorporated (Financials, Banks) | | | | | | | | | | | 1,013,300 | | | | 4,872,307 | |
Sankyu Incorporated (Industrials, Road & Rail) | | | | | | | | | | | 370,000 | | | | 2,150,693 | |
Sawai Pharmaceutical Company Limited (Health Care, Pharmaceuticals) | | | | | | | | | | | 36,200 | | | | 1,939,653 | |
Sojitz Corporation (Industrials, Trading Companies & Distributors) | | | | | | | | | | | 1,160,700 | | | | 2,942,205 | |
Sumitomo Corporation (Industrials, Trading Companies & Distributors) | | | | | | | | | | | 205,000 | | | | 2,445,916 | |
Sumitomo Heavy Industries Limited (Industrials, Machinery) | | | | | | | | | | | 256,000 | | | | 1,541,751 | |
Sumitomo Mitsui Financial Group Incorporated (Financials, Banks) | | | | | | | | | | | 100,400 | | | | 3,691,118 | |
Sumitomo Osaka Cement Company (Materials, Construction Materials) | | | | | | | | | | | 444,000 | | | | 1,567,904 | |
Suzuken Company Limited (Health Care, Health Care Providers & Services) | | | | | | | | | | | 67,000 | | | | 2,002,884 | |
T-Gaia Corporation (Consumer Discretionary, Specialty Retail) | | | | | | | | | | | 10,300 | | | | 153,683 | |
The Keiyo Bank Limited (Financials, Banks) | | | | | | | | | | | 62,000 | | | | 264,464 | |
Toho Holdings Company Limited (Health Care, Health Care Providers & Services) | | | | | | | | | | | 63,000 | | | | 1,220,296 | |
Toyo Ink SC Holding Company Limited (Materials, Chemicals) | | | | | | | | | | | 375,000 | | | | 1,704,471 | |
Toyo Tire & Rubber Company Limited (Consumer Discretionary, Auto Components) | | | | | | | | | | | 95,400 | | | | 1,164,930 | |
Tsumura & Company (Health Care, Pharmaceuticals) | | | | | | | | | | | 53,700 | | | | 1,452,747 | |
UBE Industries Limited (Materials, Chemicals) | | | | | | | | | | | 954,300 | | | | 1,985,258 | |
Yokohama Rubber Company Limited (Consumer Discretionary, Auto Components) | | | | | | | | | | | 148,500 | | | | 2,683,008 | |
| |
| | | | 126,403,738 | |
| | | | | | | | | | | | | | | | |
| | | | |
| Liechtenstein: 0.12% | | | | | | | | | | | | | | | | |
VP Bank AG (Financials, Capital Markets) | | | | | | | | | | | 6,558 | | | | 664,379 | |
| | | | | | | | | | | | | | | | |
The accompanying notes are an integral part of these financial statements.
| | | | | | |
| Portfolio of investments—November 30, 2016 (unaudited) | | Wells Fargo Allocation Funds | | | 57 | |
INTERNATIONAL VALUE PORTFOLIO
| | | | | | | | | | | | | | | | |
| Security name | | | | | | | | Shares | | | Value | |
| | | | |
| Netherlands: 2.01% | | | | | | | | | | | | | | | | |
Aegon NV (Financials, Insurance) | | | | | | | | | | | 334,000 | | | $ | 1,698,443 | |
ING Group NV (Financials, Banks) | | | | | | | | | | | 237,100 | | | | 3,229,081 | |
Koninklijke Ahold NV (Consumer Staples, Food & Staples Retailing) | | | | | | | | | | | 267,032 | | | | 5,266,887 | |
X 5 Retail Group NV GDR (Consumer Staples, Food & Staples Retailing) † | | | | | | | | | | | 23,700 | | | | 711,000 | |
| |
| | | | 10,905,411 | |
| | | | | | | | | | | | | | | | |
| | | | |
| Norway: 1.24% | | | | | | | | | | | | | | | | |
Atea ASA (Information Technology, IT Services) (i) | | | | | | | | | | | 84,900 | | | | 777,829 | |
DNB Nor ASA (Financials, Banks) | | | | | | | | | | | 148,800 | | | | 2,191,705 | |
Marine Harvest ASA (Consumer Staples, Food Products) | | | | | | | | | | | 97,500 | | | | 1,753,321 | |
Yara International ASA (Materials, Chemicals) | | | | | | | | | | | 53,600 | | | | 1,983,157 | |
| |
| | | | 6,706,012 | |
| | | | | | | | | | | | | | | | |
| | | | |
| Poland: 0.38% | | | | | | | | | | | | | | | | |
Asseco Poland SA (Information Technology, Software) | | | | | | | | | | | 101,800 | | | | 1,273,802 | |
KGHM Polska Miedz SA (Materials, Metals & Mining) | | | | | | | | | | | 36,500 | | | | 758,676 | |
| |
| | | | 2,032,478 | |
| | | | | | | | | | | | | | | | |
| | | | |
| Portugal: 0.21% | | | | | | | | | | | | | | | | |
Sonae SGPS SA (Consumer Staples, Food & Staples Retailing) | | | | | | | | | | | 1,362,100 | | | | 1,147,679 | |
| | | | | | | | | | | | | | | | |
| | | | |
| Russia: 0.98% | | | | | | | | | | | | | | | | |
Gazprom Neft Sponsored ADR (Energy, Oil, Gas & Consumable Fuels) | | | | | | | | | | | 886 | | | | 13,600 | |
Gazprom Neft Sponsored ADR - London Exchange (Energy, Oil, Gas & Consumable Fuels) (i) | | | | | | | | | | | 150,014 | | | | 2,340,218 | |
LUKOIL OAO ADR (Energy, Oil, Gas & Consumable Fuels) | | | | | | | | | | | 60,400 | | | | 2,972,284 | |
| |
| | | | 5,326,102 | |
| | | | | | | | | | | | | | | | |
| | | | |
| Singapore: 0.81% | | | | | | | | | | | | | | | | |
DBS Group Holdings Limited (Financials, Banks) | | | | | | | | | | | 227,000 | | | | 2,779,398 | |
United Overseas Bank Limited (Financials, Banks) | | | | | | | | | | | 113,000 | | | | 1,609,049 | |
| |
| | | | 4,388,447 | |
| | | | | | | | | | | | | | | | |
| | | | |
| South Africa: 0.47% | | | | | | | | | | | | | | | | |
Barclays Africa Group Limited (Financials, Banks) | | | | | | | | | | | 161,100 | | | | 1,800,223 | |
Petra Diamonds Limited (Materials, Metals & Mining) † | | | | | | | | | | | 367,347 | | | | 757,461 | |
| |
| | | | 2,557,684 | |
| | | | | | | | | | | | | | | | |
| | | | |
| South Korea: 2.23% | | | | | | | | | | | | | | | | |
BNK Financial Group Incorporated (Financials, Banks) | | | | | | | | | | | 13,188 | | | | 101,077 | |
E-MART Limited (Consumer Staples, Food & Staples Retailing) | | | | | | | | | | | 8,500 | | | | 1,366,922 | |
Industrial Bank of Korea (Financials, Banks) | | | | | | | | | | | 192,500 | | | | 2,148,860 | |
KT&G Corporation (Consumer Staples, Tobacco) | | | | | | | | | | | 31,300 | | | | 2,811,257 | |
Kwangju Bank (Financials, Banks) | | | | | | | | | | | 13,510 | | | | 119,031 | |
SK Telecom Company Limited (Telecommunication Services, Wireless Telecommunication Services) | | | | | | | | | | | 19,000 | | | | 3,673,068 | |
Woori Bank (Financials, Banks) | | | | | | | | | | | 178,044 | | | | 1,827,576 | |
| |
| | | | 12,047,791 | |
| | | | | | | | | | | | | | | | |
The accompanying notes are an integral part of these financial statements.
| | | | |
| 58 | | Wells Fargo Allocation Funds | | Portfolio of investments—November 30, 2016 (unaudited) |
INTERNATIONAL VALUE PORTFOLIO
| | | | | | | | | | | | | | | | |
| Security name | | | | | | | | Shares | | | Value | |
| | | | |
| Spain: 1.91% | | | | | | | | | | | | | | | | |
Banco Santander Central Hispano SA (Financials, Banks) | | | | | | | | | | | 429,681 | | | $ | 1,964,128 | |
Distribuidora Internacional SA (Consumer Staples, Food & Staples Retailing) | | | | | | | | | | | 483,500 | | | | 2,206,555 | |
Gas Natural SDG SA (Utilities, Gas Utilities) | | | | | | | | | | | 209,300 | | | | 3,582,499 | |
Iberdrola SA (Utilities, Electric Utilities) | | | | | | | | | | | 433,600 | | | | 2,609,789 | |
| |
| | | | 10,362,971 | |
| | | | | | | | | | | | | | | | |
| | | | |
| Sweden: 1.68% | | | | | | | | | | | | | | | | |
Boliden AB (Materials, Metals & Mining) | | | | | | | | | | | 122,600 | | | | 3,166,427 | |
Nordea Bank AB (Financials, Banks) | | | | | | | | | | | 177,300 | | | | 1,862,815 | |
Skandinaviska Enskilda Banken AB Class A (Financials, Banks) | | | | | | | | | | | 144,900 | | | | 1,443,847 | |
Telefonaktiebolaget LM Ericsson Class B (Information Technology, Communications Equipment) | | | | | | | | | | | 207,200 | | | | 1,066,913 | |
Telia Company AB (Telecommunication Services, Diversified Telecommunication Services) | | | | | | | | | | | 417,000 | | | | 1,567,118 | |
| |
| | | | 9,107,120 | |
| | | | | | | | | | | | | | | | |
| | | | |
| Switzerland: 6.98% | | | | | | | | | | | | | | | | |
Aryzta AG (Consumer Staples, Food Products) | | | | | | | | | | | 42,100 | | | | 1,793,815 | |
Baloise Holding AG (Financials, Insurance) | | | | | | | | | | | 28,800 | | | | 3,470,050 | |
Credit Suisse Group AG (Financials, Capital Markets) | | | | | | | | | | | 273,395 | | | | 3,635,586 | |
Georg Fischer AG (Industrials, Machinery) | | | | | | | | | | | 3,000 | | | | 2,567,129 | |
Helvetia Holding AG (Financials, Insurance) | | | | | | | | | | | 4,600 | | | | 2,391,168 | |
Roche Holding AG (Health Care, Pharmaceuticals) | | | | | | | | | | | 12,900 | | | | 2,876,394 | |
Swiss Life Holding AG (Financials, Insurance) | | | | | | | | | | | 17,800 | | | | 4,895,131 | |
Swiss Reinsurance AG (Financials, Insurance) | | | | | | | | | | | 75,700 | | | | 6,969,135 | |
UBS Group AG (Financials, Capital Markets) | | | | | | | | | | | 158,900 | | | | 2,527,209 | |
Valiant Holding AG (Financials, Banks) | | | | | | | | | | | 22,700 | | | | 2,173,547 | |
Zurich Insurance Group AG (Financials, Insurance) | | | | | | | | | | | 17,100 | | | | 4,482,296 | |
| |
| | | | 37,781,460 | |
| | | | | | | | | | | | | | | | |
| | | | |
| Taiwan: 1.10% | | | | | | | | | | | | | | | | |
Hon Hai Precision Industry Company Limited GDR (Information Technology, Electronic Equipment, Instruments & Components) | | | | | | | | | | | 49,100 | | | | 245,991 | |
Hon Hai Precision Industry Company Limited (Information Technology, Electronic Equipment, Instruments & Components) | | | | | | | | | | | 1,255,000 | | | | 3,228,752 | |
Pegatron Corporation (Information Technology, Technology Hardware, Storage & Peripherals) | | | | | | | | | | | 1,035,000 | | | | 2,464,672 | |
| |
| | | | 5,939,415 | |
| | | | | | | | | | | | | | | | |
| | | | |
| Thailand: 1.50% | | | | | | | | | | | | | | | | |
Bangchak Petroleum PCL (Energy, Oil, Gas & Consumable Fuels) | | | | | | | | | | | 2,188,900 | | | | 2,009,178 | |
Krung Thai Bank PCL (Financials, Banks) | | | | | | | | | | | 4,470,600 | | | | 2,205,260 | |
Thai Oil PCL (Energy, Oil, Gas & Consumable Fuels) | | | | | | | | | | | 1,003,900 | | | | 2,068,040 | |
Thanachart Capital PCL (Financials, Banks) | | | | | | | | | | | 1,481,500 | | | | 1,826,987 | |
| | | | |
| | | | | | | | | | | | | | | 8,109,465 | |
| | | | | | | | | | | | | | | | |
| | | | |
| United Kingdom: 14.75% | | | | | | | | | | | | | | | | |
3i Group plc (Financials, Capital Markets) | | | | | | | | | | | 409,100 | | | | 3,526,755 | |
AMEC Foster Wheeler plc (Energy, Energy Equipment & Services) | | | | | | | | | | | 83,300 | | | | 454,421 | |
AstraZeneca plc (Health Care, Pharmaceuticals) | | | | | | | | | | | 30,100 | | | | 1,562,748 | |
Aviva plc (Financials, Insurance) | | | | | | | | | | | 314,900 | | | | 1,761,192 | |
BAE Systems plc (Industrials, Aerospace & Defense) | | | | | | | | | | | 939,800 | | | | 7,061,144 | |
The accompanying notes are an integral part of these financial statements.
| | | | | | |
| Portfolio of investments—November 30, 2016 (unaudited) | | Wells Fargo Allocation Funds | | | 59 | |
INTERNATIONAL VALUE PORTFOLIO
| | | | | | | | | | | | | | | | |
| Security name | | | | | | | | Shares | | | Value | |
| | | | |
| United Kingdom (continued) | | | | | | | | | | | | | | | | |
Barclays plc (Financials, Banks) | | | | | | | | | | | 715,000 | | | $ | 1,931,905 | |
Barratt Developments plc (Consumer Discretionary, Household Durables) | | | | | | | | | | | 345,800 | | | | 2,030,063 | |
Bellway plc (Consumer Discretionary, Household Durables) | | | | | | | | | | | 80,100 | | | | 2,447,399 | |
Berkeley Group Holdings plc (Consumer Discretionary, Household Durables) | | | | | | | | | | | 75,800 | | | | 2,349,210 | |
Bovis Homes Group plc (Consumer Discretionary, Household Durables) | | | | | | | | | | | 108,600 | | | | 1,104,707 | |
BP plc (Energy, Oil, Gas & Consumable Fuels) | | | | | | | | | | | 1,138,200 | | | | 6,543,098 | |
BT Group plc (Telecommunication Services, Diversified Telecommunication Services) | | | | | | | | | | | 252,200 | | | | 1,126,838 | |
Carillion plc (Industrials, Construction & Engineering) | | | | | | | | | | | 764,400 | | | | 2,360,437 | |
Centrica plc (Utilities, Multi-Utilities) | | | | | | | | | | | 898,500 | | | | 2,364,199 | |
Chemring Group plc (Industrials, Aerospace & Defense) † | | | | | | | | | | | 324,766 | | | | 674,536 | |
Crest Nicholson Holdings plc (Consumer Discretionary, Household Durables) | | | | | | | | | | | 264,876 | | | | 1,449,931 | |
Debenhams plc (Consumer Discretionary, Multiline Retail) | | | | | | | | | | | 1,238,200 | | | | 858,276 | |
easyJet plc (Industrials, Airlines) | | | | | | | | | | | 103,400 | | | | 1,280,803 | |
Firstgroup plc (Industrials, Road & Rail) † | | | | | | | | | | | 952,400 | | | | 1,213,092 | |
GlaxoSmithKline plc (Health Care, Pharmaceuticals) | | | | | | | | | | | 251,200 | | | | 4,700,376 | |
Inchcape plc (Consumer Discretionary, Distributors) | | | | | | | | | | | 25,400 | | | | 193,384 | |
Indivior plc (Health Care, Pharmaceuticals) | | | | | | | | | | | 371,600 | | | | 1,499,915 | |
International Consolidated Airlines Group SA (Industrials, Airlines) | | | | | | | | | | | 182,900 | | | | 992,040 | |
J Sainsbury plc (Consumer Staples, Food & Staples Retailing) | | | | | | | | | | | 1,211,800 | | | | 3,502,430 | |
Kingfisher plc (Consumer Discretionary, Specialty Retail) | | | | | | | | | | | 507,900 | | | | 2,243,895 | |
Lloyds Banking Group plc (Financials, Banks) | | | | | | | | | | | 2,460,500 | | | | 1,781,572 | |
Marks & Spencer Group plc (Consumer Discretionary, Multiline Retail) | | | | | | | | | | | 379,900 | | | | 1,562,412 | |
Marston’s plc (Consumer Discretionary, Hotels, Restaurants & Leisure) | | | | | | | | | | | 558,800 | | | | 940,384 | |
Meggitt plc (Industrials, Aerospace & Defense) | | | | | | | | | | | 316,900 | | | | 1,873,090 | |
Mitchells & Butlers plc (Consumer Discretionary, Hotels, Restaurants & Leisure) | | | | | | | | | | | 236,800 | | | | 673,157 | |
Mitie Group plc (Industrials, Commercial Services & Supplies) « | | | | | | | | | | | 539,300 | | | | 1,387,331 | |
Mondi plc (Materials, Paper & Forest Products) | | | | | | | | | | | 117,200 | | | | 2,394,641 | |
Old Mutual plc (Financials, Insurance) | | | | | | | | | | | 698,000 | | | | 1,658,468 | |
Paragon Group of Companies plc (Financials, Thrifts & Mortgage Finance) | | | | | | | | | | | 355,291 | | | | 1,624,349 | |
Premier Foods plc (Consumer Staples, Food Products) † | | | | | | | | | | | 73,926 | | | | 40,698 | |
Redrow plc (Consumer Discretionary, Household Durables) | | | | | | | | | | | 388,600 | | | | 1,986,679 | |
Restaurant Group plc (Consumer Discretionary, Hotels, Restaurants & Leisure) | | | | | | | | | | | 44,316 | | | | 179,985 | |
Royal Dutch Shell plc Class B (Energy, Oil, Gas & Consumable Fuels) | | | | | | | | | | | 104,800 | | | | 2,777,898 | |
Royal Mail plc (Industrials, Air Freight & Logistics) | | | | | | | | | | | 382,800 | | | | 2,244,403 | |
Tullett Prebon plc (Financials, Capital Markets) | | | | | | | | | | | 279,500 | | | | 1,555,162 | |
Vesuvius plc (Industrials, Machinery) | | | | | | | | | | | 145,400 | | | | 715,691 | |
William Morrison Supermarkets plc (Consumer Staples, Food & Staples Retailing) | | | | | | | | | | | 443,800 | | | | 1,207,739 | |
| | | | |
| | | | | | | | | | | | | | | 79,836,453 | |
| | | | | | | | | | | | | | | | |
| | | | |
Total Common Stocks (Cost $570,491,874) | | | | | | | | | | | | | | | 526,958,268 | |
| | | | | | | | | | | | | | | | |
| | | | |
| | | Dividend yield | | | | | | | | | | |
| | | | |
Preferred Stocks: 0.26% | | | | | | | | | | | | | | | | |
| | | | |
| Brazil: 0.26% | | | | | | | | | | | | | | | | |
Banco do Estado do Rio Grande do Sul SA (Financials, Banks) ± | | | 5.91 | % | | | | | | | 349,800 | | | | 1,164,604 | |
Companhia Energetica de Minas Gerais SA (Utilities, Electric Utilities) ± | | | 5.66 | % | | | | | | | 109,056 | | | | 254,740 | |
| | | | |
Total Preferred Stocks (Cost $3,545,600) | | | | | | | | | | | | | | | 1,419,344 | |
| | | | | | | | | | | | | | | | |
The accompanying notes are an integral part of these financial statements.
| | | | |
| 60 | | Wells Fargo Allocation Funds | | Portfolio of investments—November 30, 2016 (unaudited) |
INTERNATIONAL VALUE PORTFOLIO
| | | | | | | | | | | | | | | | |
| Security name | | Yield | | | | | | Shares | | | Value | |
| | | | |
Short-Term Investments: 2.96% | | | | | | | | | | | | | | | | |
| | | | |
| Investment Companies: 2.96% | | | | | | | | | | | | | | | | |
Securities Lending Cash Investment LLC (l)(r)(u) | | | 0.65 | % | | | | | | | 9,471,381 | | | $ | 9,472,329 | |
Wells Fargo Government Money Market Fund Select Class (l)(u) | | | 0.31 | | | | | | | | 6,504,594 | | | | 6,504,594 | |
| | | | |
Total Short-Term Investments (Cost $15,976,523) | | | | | | | | | | | | | | | 15,976,923 | |
| | | | | | | | | | | | | | | | |
| | | | | | | | |
| Total investments in securities (Cost $590,013,997) * | | | 100.60 | % | | | 544,354,535 | |
Other assets and liabilities, net | | | (0.60 | ) | | | (3,225,536 | ) |
| | | | | | | | |
| Total net assets | | | 100.00 | % | | $ | 541,128,999 | |
| | | | | | | | |
| † | Non-income-earning security |
| (a) | The security is fair valued in accordance with procedures approved by the Board of Trustees. |
| « | All or a portion of this security is on loan. |
| ± | Variable rate investment. The rate shown is the rate in effect at period end. |
| (l) | The issuer of the security is an affiliated person of the Portfolio as defined in the Investment Company Act of 1940. |
| (r) | The investment is a non-registered investment vehicle purchased with cash collateral received from securities on loan. |
| (u) | The rate represents the 7-day annualized yield at period end. |
| * | Cost for federal income tax purposes is $590,510,958 and unrealized gains (losses) consists of: |
| | | | |
Gross unrealized gains | | $ | 54,934,308 | |
Gross unrealized losses | | | (101,090,731 | ) |
| | | | |
Net unrealized losses | | $ | (46,156,423 | ) |
The following table shows the percent of total long-term investments by sector as of November 30, 2016:
| | | | |
Financials | | | 26.84 | % |
Consumer Discretionary | | | 14.56 | |
Industrials | | | 13.90 | |
Materials | | | 9.18 | |
Health Care | | | 8.27 | |
Consumer Staples | | | 7.20 | |
Telecommunication Services | | | 5.38 | |
Energy | | | 5.25 | |
Information Technology | | | 4.75 | |
Utilities | | | 3.58 | |
Real Estate | | | 1.09 | |
| | | | |
| | | 100.00 | % |
| | | | |
The accompanying notes are an integral part of these financial statements.
| | | | | | |
| Portfolio of investments—November 30, 2016 (unaudited) | | Wells Fargo Allocation Funds | | | 61 | |
LARGE COMPANY VALUE PORTFOLIO
| | | | | | | | | | | | | | | | |
| Security name | | | | | | | | Shares | | | Value | |
| | | | |
Common Stocks: 100.26% | | | | | | | | | | | | | | | | |
| | | | |
Consumer Discretionary: 6.22% | | | | | | | | | | | | | | | | |
| | | | |
| Hotels, Restaurants & Leisure: 1.20% | | | | | | | | | | | | | | | | |
Norwegian Cruise Line Holdings Limited † | | | | | | | | | | | 22,588 | | | $ | 899,228 | |
| | | | | | | | | | | | | | | | |
| | | | |
| Leisure Products: 1.19% | | | | | | | | | | | | | | | | |
Mattel Incorporated | | | | | | | | | | | 28,289 | | | | 893,084 | |
| | | | | | | | | | | | | | | | |
| | | | |
| Media: 1.24% | | | | | | | | | | | | | | | | |
Scripps Networks Interactive Incorporated Class A | | | | | | | | | | | 13,361 | | | | 925,383 | |
| | | | | | | | | | | | | | | | |
| | | | |
| Specialty Retail: 1.63% | | | | | | | | | | | | | | | | |
Signet Jewelers Limited « | | | | | | | | | | | 7,442 | | | | 679,380 | |
Williams-Sonoma Incorporated | | | | | | | | | | | 9,848 | | | | 539,473 | |
| | | | |
| | | | | | | | | | | | | | | 1,218,853 | |
| | | | | | | | | | | | | | | | |
| | | | |
| Textiles, Apparel & Luxury Goods: 0.96% | | | | | | | | | | | | | | | | |
HanesBrands Incorporated | | | | | | | | | | | 30,807 | | | | 715,647 | |
| | | | | | | | | | | | | | | | |
| | | | |
Consumer Staples: 6.50% | | | | | | | | | | | | | | | | |
| | | | |
| Beverages: 0.78% | | | | | | | | | | | | | | | | |
Coca-Cola European Partners plc | | | | | | | | | | | 18,027 | | | | 585,156 | |
| | | | | | | | | | | | | | | | |
| | | | |
| Food & Staples Retailing: 0.91% | | | | | | | | | | | | | | | | |
CVS Health Corporation | | | | | | | | | | | 8,817 | | | | 677,939 | |
| | | | | | | | | | | | | | | | |
| | | | |
| Food Products: 3.02% | | | | | | | | | | | | | | | | |
ConAgra Foods Incorporated | | | | | | | | | | | 22,948 | | | | 841,962 | |
Lamb Weston Holdings Incorporated † | | | | | | | | | | | 24,397 | | | | 816,812 | |
TreeHouse Foods Incorporated † | | | | | | | | | | | 8,597 | | | | 595,944 | |
| | | | |
| | | | | | | | | | | | | | | 2,254,718 | |
| | | | | | | | | | | | | | | | |
| | | | |
| Household Products: 1.07% | | | | | | | | | | | | | | | | |
The Procter & Gamble Company | | | | | | | | | | | 9,735 | | | | 802,748 | |
| | | | | | | | | | | | | | | | |
| | | | |
| Personal Products: 0.72% | | | | | | | | | | | | | | | | |
Herbalife Limited †« | | | | | | | | | | | 11,002 | | | | 539,428 | |
| | | | | | | | | | | | | | | | |
| | | | |
Energy: 13.70% | | | | | | | | | | | | | | | | |
| | | | |
| Energy Equipment & Services: 1.71% | | | | | | | | | | | | | | | | |
Baker Hughes Incorporated | | | | | | | | | | | 19,922 | | | | 1,281,582 | |
| | | | | | | | | | | | | | | | |
| | | | |
| Oil, Gas & Consumable Fuels: 11.99% | | | | | | | | | | | | | | | | |
Apache Corporation | | | | | | | | | | | 14,744 | | | | 972,367 | |
Chevron Corporation | | | | | | | | | | | 10,225 | | | | 1,140,701 | |
ConocoPhillips | | | | | | | | | | | 33,992 | | | | 1,649,292 | |
Exxon Mobil Corporation | | | | | | | | | | | 25,922 | | | | 2,262,991 | |
Kinder Morgan Incorporated | | | | | | | | | | | 60,857 | | | | 1,351,025 | |
Noble Energy Incorporated | | | | | | | | | | | 41,675 | | | | 1,590,318 | |
| | | | |
| | | | | | | | | | | | | | | 8,966,694 | |
| | | | | | | | | | | | | | | | |
The accompanying notes are an integral part of these financial statements.
| | | | |
| 62 | | Wells Fargo Allocation Funds | | Portfolio of investments—November 30, 2016 (unaudited) |
LARGE COMPANY VALUE PORTFOLIO
| | | | | | | | | | | | | | | | |
| Security name | | | | | | | | Shares | | | Value | |
| | | | |
Financials: 24.10% | | | | | | | | | | | | | | | | |
| | | | |
| Banks: 14.51% | | | | | | | | | | | | | | | | |
Bank of America Corporation | | | | | | | | | | | 88,457 | | | $ | 1,868,212 | |
BOK Financial Corporation « | | | | | | | | | | | 17,834 | | | | 1,432,427 | |
CIT Group Incorporated | | | | | | | | | | | 29,921 | | | | 1,222,273 | |
Citigroup Incorporated | | | | | | | | | | | 28,047 | | | | 1,581,570 | |
First Republic Bank | | | | | | | | | | | 10,675 | | | | 874,283 | |
FNB Corporation PA | | | | | | | | | | | 102,222 | | | | 1,561,952 | |
JPMorgan Chase & Company | | | | | | | | | | | 28,913 | | | | 2,317,955 | |
| | | | |
| | | | | | | | | | | | | | | 10,858,672 | |
| | | | | | | | | | | | | | | | |
| | | | |
| Capital Markets: 3.26% | | | | | | | | | | | | | | | | |
Affiliated Managers Group Incorporated † | | | | | | | | | | | 4,699 | | | | 695,922 | |
Ameriprise Financial Incorporated | | | | | | | | | | | 3,994 | | | | 456,155 | |
Goldman Sachs Group Incorporated | | | | | | | | | | | 5,871 | | | | 1,287,452 | |
| | | | |
| | | | | | | | | | | | | | | 2,439,529 | |
| | | | | | | | | | | | | | | | |
| | | | |
| Insurance: 6.33% | | | | | | | | | | | | | | | | |
American International Group Incorporated | | | | | | | | | | | 26,004 | | | | 1,646,833 | |
Arthur J. Gallagher & Company | | | | | | | | | | | 19,125 | | | | 962,944 | |
Chubb Limited | | | | | | | | | | | 8,758 | | | | 1,121,024 | |
MetLife Incorporated | | | | | | | | | | | 18,213 | | | | 1,001,897 | |
| | | | |
| | | | | | | | | | | | | | | 4,732,698 | |
| | | | | | | | | | | | | | | | |
| | | | |
Health Care: 10.28% | | | | | | | | | | | | | | | | |
| | | | |
| Biotechnology: 1.81% | | | | | | | | | | | | | | | | |
AbbVie Incorporated | | | | | | | | | | | 9,462 | | | | 575,290 | |
Shire plc ADR | | | | | | | | | | | 4,489 | | | | 783,779 | |
| | | | |
| | | | | | | | | | | | | | | 1,359,069 | |
| | | | | | | | | | | | | | | | |
| | | | |
| Health Care Providers & Services: 2.50% | | | | | | | | | | | | | | | | |
AmSurg Corporation †« | | | | | | | | | | | 8,848 | | | | 602,726 | |
Cigna Corporation | | | | | | | | | | | 5,034 | | | | 678,281 | |
HCA Holdings Incorporated † | | | | | | | | | | | 8,291 | | | | 587,749 | |
| | | | |
| | | | | | | | | | | | | | | 1,868,756 | |
| | | | | | | | | | | | | | | | |
| | | | |
| Pharmaceuticals: 5.97% | | | | | | | | | | | | | | | | |
Allergan plc | | | | | | | | | | | 3,972 | | | | 771,760 | |
Johnson & Johnson | | | | | | | | | | | 6,914 | | | | 769,528 | |
Mallinckrodt plc † | | | | | | | | | | | 14,270 | | | | 752,029 | |
Merck & Company Incorporated | | | | | | | | | | | 14,988 | | | | 917,116 | |
Pfizer Incorporated | | | | | | | | | | | 39,049 | | | | 1,255,035 | |
| | | | |
| | | | | | | | | | | | | | | 4,465,468 | |
| | | | | | | | | | | | | | | | |
| | | | |
Industrials: 10.60% | | | | | | | | | | | | | | | | |
| | | | |
| Aerospace & Defense: 2.55% | | | | | | | | | | | | | | | | |
Curtiss-Wright Corporation | | | | | | | | | | | 10,547 | | | | 1,060,184 | |
Orbital ATK Incorporated | | | | | | | | | | | 9,957 | | | | 849,631 | |
| | | | |
| | | | | | | | | | | | | | | 1,909,815 | |
| | | | | | | | | | | | | | | | |
The accompanying notes are an integral part of these financial statements.
| | | | | | |
| Portfolio of investments—November 30, 2016 (unaudited) | | Wells Fargo Allocation Funds | | | 63 | |
LARGE COMPANY VALUE PORTFOLIO
| | | | | | | | | | | | | | | | |
| Security name | | | | | | | | Shares | | | Value | |
| | | | |
| Airlines: 1.09% | | | | | | | | | | | | | | | | |
United Continental Holdings Incorporated † | | | | | | | | | | | 11,852 | | | $ | 817,195 | |
| | | | | | | | | | | | | | | | |
| | | | |
| Electrical Equipment: 0.96% | | | | | | | | | | | | | | | | |
Eaton Corporation plc | | | | | | | | | | | 10,743 | | | | 714,517 | |
| | | | | | | | | | | | | | | | |
| | | | |
| Industrial Conglomerates: 1.61% | | | | | | | | | | | | | | | | |
General Electric Company | | | | | | | | | | | 39,096 | | | | 1,202,593 | |
| | | | | | | | | | | | | | | | |
| | | | |
| Machinery: 1.67% | | | | | | | | | | | | | | | | |
Stanley Black & Decker Incorporated | | | | | | | | | | | 10,506 | | | | 1,246,327 | |
| | | | | | | | | | | | | | | | |
| | | | |
| Road & Rail: 1.23% | | | | | | | | | | | | | | | | |
Norfolk Southern Corporation | | | | | | | | | | | 8,656 | | | | 921,518 | |
| | | | | | | | | | | | | | | | |
| | | | |
| Trading Companies & Distributors: 1.49% | | | | | | | | | | | | | | | | |
HD Supply Holdings Incorporated † | | | | | | | | | | | 28,463 | | | | 1,116,888 | |
| | | | | | | | | | | | | | | | |
| | | | |
Information Technology: 10.57% | | | | | | | | | | | | | | | | |
| | | | |
| Electronic Equipment, Instruments & Components: 2.12% | | | | | | | | | | | | | | | | |
Synnex Corporation | | | | | | | | | | | 7,320 | | | | 855,781 | |
TE Connectivity Limited | | | | | | | | | | | 10,754 | | | | 727,401 | |
| | | | |
| | | | | | | | | | | | | | | 1,583,182 | |
| | | | | | | | | | | | | | | | |
| | | | |
| Internet Software & Services: 1.38% | | | | | | | | | | | | | | | | |
Alphabet Incorporated Class C † | | | | | | | | | | | 1,362 | | | | 1,032,450 | |
| | | | | | | | | | | | | | | | |
| | | | |
| IT Services: 1.01% | | | | | | | | | | | | | | | | |
Alliance Data Systems Corporation | | | | | | | | | | | 3,290 | | | | 752,686 | |
| | | | | | | | | | | | | | | | |
| | | | |
| Semiconductors & Semiconductor Equipment: 2.71% | | | | | | | | | | | | | | | | |
NXP Semiconductors NV † | | | | | | | | | | | 8,734 | | | | 865,976 | |
Skyworks Solutions Incorporated | | | | | | | | | | | 15,126 | | | | 1,162,433 | |
| | | | |
| | | | | | | | | | | | | | | 2,028,409 | |
| | | | | | | | | | | | | | | | |
| | | | |
| Software: 0.79% | | | | | | | | | | | | | | | | |
Citrix Systems Incorporated † | | | | | | | | | | | 6,840 | | | | 593,233 | |
| | | | | | | | | | | | | | | | |
| | | | |
| Technology Hardware, Storage & Peripherals: 2.56% | | | | | | | | | | | | | | | | |
Apple Incorporated | | | | | | | | | | | 6,384 | | | | 705,560 | |
NCR Corporation † | | | | | | | | | | | 31,246 | | | | 1,210,783 | |
| | | | |
| | | | | | | | | | | | | | | 1,916,343 | |
| | | | | | | | | | | | | | | | |
| | | | |
Materials: 4.35% | | | | | | | | | | | | | | | | |
| | | | |
| Chemicals: 2.07% | | | | | | | | | | | | | | | | |
Cabot Corporation | | | | | | | | | | | 10,801 | | | | 550,095 | |
FMC Corporation | | | | | | | | | | | 17,826 | | | | 1,000,395 | |
| | | | |
| | | | | | | | | | | | | | | 1,550,490 | |
| | | | | | | | | | | | | | | | |
| | | | |
| Containers & Packaging: 2.28% | | | | | | | | | | | | | | | | |
Crown Holdings Incorporated † | | | | | | | | | | | 15,497 | | | | 842,882 | |
WestRock Company | | | | | | | | | | | 16,768 | | | | 858,522 | |
| | | | |
| | | | | | | | | | | | | | | 1,701,404 | |
| | | | | | | | | | | | | | | | |
The accompanying notes are an integral part of these financial statements.
| | | | |
| 64 | | Wells Fargo Allocation Funds | | Portfolio of investments—November 30, 2016 (unaudited) |
LARGE COMPANY VALUE PORTFOLIO
| | | | | | | | | | | | | | | | |
| Security name | | | | | | | | Shares | | | Value | |
| | | | |
Real Estate: 6.39% | | | | | | | | | | | | | | | | |
| | | | |
| Equity REITs: 6.39% | | | | | | | | | | | | | | | | |
Alexandria Real Estate Equities Incorporated | | | | | | | | | | | 16,994 | | | $ | 1,862,372 | |
Prologis Incorporated | | | | | | | | | | | 16,426 | | | | 836,083 | |
SL Green Realty Corporation | | | | | | | | | | | 7,470 | | | | 787,039 | |
VEREIT Incorporated | | | | | | | | | | | 88,980 | | | | 737,644 | |
Vornado Realty Trust | | | | | | | | | | | 5,698 | | | | 556,980 | |
| | | | |
| | | | | | | | | | | | | | | 4,780,118 | |
| | | | | | | | | | | | | | | | |
| | | | |
Telecommunication Services: 2.12% | | | | | | | | | | | | | | | | |
| | | | |
| Diversified Telecommunication Services: 2.12% | | | | | | | | | | | | | | | | |
AT&T Incorporated | | | | | | | | | | | 20,511 | | | | 792,340 | |
Verizon Communications Incorporated | | | | | | | | | | | 15,997 | | | | 798,250 | |
| | | | |
| | | | | | | | | | | | | | | 1,590,590 | |
| | | | | | | | | | | | | | | | |
| | | | |
Utilities: 5.43% | | | | | | | | | | | | | | | | |
| | | | |
| Electric Utilities: 4.43% | | | | | | | | | | | | | | | | |
Duke Energy Corporation | | | | | | | | | | | 13,747 | | | | 1,014,116 | |
Great Plains Energy Incorporated | | | | | | | | | | | 45,713 | | | | 1,206,366 | |
The Southern Company | | | | | | | | | | | 23,409 | | | | 1,096,009 | |
| | | | |
| | | | | | | | | | | | | | | 3,316,491 | |
| | | | | | | | | | | | | | | | |
| | | | |
| Multi-Utilities: 1.00% | | | | | | | | | | | | | | | | |
Black Hills Corporation « | | | | | | | | | | | 12,675 | | | | 744,656 | |
| | | | | | | | | | | | | | | | |
| | | | |
Total Common Stocks (Cost $60,740,114) | | | | | | | | | | | | | | | 75,003,557 | |
| | | | | | | | | | | | | | | | |
| | | | |
| | | Yield | | | | | | | | | | |
| Short-Term Investments: 4.42% | | | | | | | | | | | | | | | | |
| | | | |
| Investment Companies: 4.42% | | | | | | | | | | | | | | | | |
Securities Lending Cash Investment LLC (l)(r)(u) | | | 0.65 | % | | | | | | | 3,310,979 | | | | 3,311,310 | |
| | | | | | | | | | | | | | | | |
| | | | |
Total Short-Term Investments (Cost $3,311,198) | | | | | | | | | | | | | | | 3,311,310 | |
| | | | | | | | | | | | | | | | |
| | | | | | | | |
| Total investments in securities (Cost $64,051,312) * | | | 104.68 | % | | | 78,314,867 | |
Other assets and liabilities, net | | | (4.68 | ) | | | (3,504,364 | ) |
| | | | | | | | |
| Total net assets | | | 100.00 | % | | $ | 74,810,503 | |
| | | | | | | | |
| † | Non-income-earning security |
| « | All or a portion of this security is on loan. |
| (l) | The issuer of the security is an affiliated person of the Portfolio as defined in the Investment Company Act of 1940. |
| (r) | The investment is a non-registered investment vehicle purchased with cash collateral received from securities on loan. |
| (u) | The rate represents the 7-day annualized yield at period end. |
| * | Cost for federal income tax purposes is $64,189,829 and unrealized gains (losses) consists of: |
| | | | |
Gross unrealized gains | | $ | 15,729,328 | |
Gross unrealized losses | | | (1,604,290 | ) |
| | | | |
Net unrealized gains | | $ | 14,125,038 | |
The accompanying notes are an integral part of these financial statements.
| | | | | | |
| Portfolio of investments—November 30, 2016 (unaudited) | | Wells Fargo Allocation Funds | | | 65 | |
SMALL COMPANY GROWTH PORTFOLIO
| | | | | | | | | | | | | | | | |
| Security name | | | | | | | | Shares | | | Value | |
| | | | |
Common Stocks: 95.13% | | | | | | | | | | | | | | | | |
| | | | |
Consumer Discretionary: 13.25% | | | | | | | | | | | | | | | | |
| | | | |
| Auto Components: 1.39% | | | | | | | | | | | | | | | | |
Gentherm Incorporated † | | | | | | | | | | | 428,583 | | | $ | 13,650,369 | |
Tower International Incorporated | | | | | | | | | | | 280,761 | | | | 7,355,938 | |
| | | | |
| | | | | | | | | | | | | | | 21,006,307 | |
| | | | | | | | | | | | | | | | |
| | | | |
| Diversified Consumer Services: 0.49% | | | | | | | | | | | | | | | | |
Houghton Mifflin Harcourt Company † | | | | | | | | | | | 673,835 | | | | 7,445,877 | |
| | | | | | | | | | | | | | | | |
| | | | |
| Hotels, Restaurants & Leisure: 2.18% | | | | | | | | | | | | | | | | |
Del Taco Restaurants Incorporated † | | | | | | | | | | | 675,213 | | | | 9,804,093 | |
Extended Stay America Incorporated | | | | | | | | | | | 867,711 | | | | 13,501,583 | |
Zoe’s Kitchen Incorporated «† | | | | | | | | | | | 393,745 | | | | 9,709,752 | |
| | | | |
| | | | | | | | | | | | | | | 33,015,428 | |
| | | | | | | | | | | | | | | | |
| | | | |
| Household Durables: 1.18% | | | | | | | | | | | | | | | | |
Tempur-Pedic International Incorporated Ǡ | | | | | | | | | | | 137,287 | | | | 8,690,267 | |
William Lyon Homes Class A Ǡ | | | | | | | | | | | 465,911 | | | | 9,225,038 | |
| | | | |
| | | | | | | | | | | | | | | 17,915,305 | |
| | | | | | | | | | | | | | | | |
| | | | |
| Media: 2.45% | | | | | | | | | | | | | | | | |
IMAX Corporation Ǡ | | | | | | | | | | | 633,716 | | | | 20,247,226 | |
Lions Gate Entertainment Corporation « | | | | | | | | | | | 450,595 | | | | 10,543,923 | |
Media General Incorporated † | | | | | | | | | | | 346,667 | | | | 6,368,273 | |
| | | | |
| | | | | | | | | | | | | | | 37,159,422 | |
| | | | | | | | | | | | | | | | |
| | | | |
| Specialty Retail: 4.95% | | | | | | | | | | | | | | | | |
At Home Group Incorporated Ǡ | | | | | | | | | | | 334,908 | | | | 4,313,615 | |
Burlington Stores Incorporated † | | | | | | | | | | | 182,737 | | | | 16,066,237 | |
Chico’s FAS Incorporated | | | | | | | | | | | 607,888 | | | | 9,306,765 | |
Dick’s Sporting Goods Incorporated | | | | | | | | | | | 260,543 | | | | 15,390,275 | |
Monro Muffler Brake Incorporated | | | | | | | | | | | 180,411 | | | | 10,788,578 | |
Party City Holdco Incorporated Ǡ | | | | | | | | | | | 787,328 | | | | 12,636,614 | |
Sportsman’s Warehouse Holdings Incorporated † | | | | | | | | | | | 722,719 | | | | 6,504,471 | |
| | | | |
| | | | | | | | | | | | | | | 75,006,555 | |
| | | | | | | | | | | | | | | | |
| | | | |
| Textiles, Apparel & Luxury Goods: 0.61% | | | | | | | | | | | | | | | | |
Kate Spade & Company † | | | | | | | | | | | 620,807 | | | | 9,218,984 | |
| | | | | | | | | | | | | | | | |
| | | | |
Consumer Staples: 1.81% | | | | | | | | | | | | | | | | |
| | | | |
| Food Products: 0.91% | | | | | | | | | | | | | | | | |
Snyders Lance Incorporated | | | | | | | | | | | 371,994 | | | | 13,860,496 | |
| | | | | | | | | | | | | | | | |
| | | | |
| Household Products: 0.90% | | | | | | | | | | | | | | | | |
Central Garden & Pet Company Class A † | | | | | | | | | | | 496,937 | | | | 13,601,166 | |
| | | | | | | | | | | | | | | | |
The accompanying notes are an integral part of these financial statements.
| | | | |
| 66 | | Wells Fargo Allocation Funds | | Portfolio of investments—November 30, 2016 (unaudited) |
SMALL COMPANY GROWTH PORTFOLIO
| | | | | | | | | | | | | | | | |
| Security name | | | | | | | | Shares | | | Value | |
| | | | |
Energy: 3.57% | | | | | | | | | | | | | | | | |
| | | | |
| Energy Equipment & Services: 0.54% | | | | | | | | | | | | | | | | |
Mammoth Energy Services Incorporated † | | | | | | | | | | | 246,374 | | | $ | 3,949,375 | |
Smart Sand Incorporated † | | | | | | | | | | | 308,988 | | | | 4,223,866 | |
| | | | |
| | | | | | | | | | | | | | | 8,173,241 | |
| | | | | | | | | | | | | | | | |
| | | | |
| Oil, Gas & Consumable Fuels: 3.03% | | | | | | | | | | | | | | | | |
Diamondback Energy Incorporated † | | | | | | | | | | | 86,343 | | | | 9,312,093 | |
GasLog Limited « | | | | | | | | | | | 520,749 | | | | 8,175,759 | |
Oasis Petroleum Incorporated † | | | | | | | | | | | 629,047 | | | | 9,416,834 | |
PDC Energy Incorporated † | | | | | | | | | | | 127,547 | | | | 9,495,874 | |
QEP Resources Incorporated | | | | | | | | | | | 486,916 | | | | 9,572,769 | |
| | | | |
| | | | | | | | | | | | | | | 45,973,329 | |
| | | | | | | | | | | | | | | | |
| | | | |
Financials: 9.27% | | | | | | | | | | | | | | | | |
| | | | |
| Banks: 2.85% | | | | | | | | | | | | | | | | |
ServisFirst Bancshares Incorporated | | | | | | | | | | | 157,518 | | | | 11,596,475 | |
Signature Bank † | | | | | | | | | | | 82,084 | | | | 12,305,212 | |
SVB Financial Group † | | | | | | | | | | | 122,193 | | | | 19,310,160 | |
| | | | |
| | | | | | | | | | | | | | | 43,211,847 | |
| | | | | | | | | | | | | | | | |
| | | | |
| Capital Markets: 3.81% | | | | | | | | | | | | | | | | |
Evercore Partners Incorporated Class A | | | | | | | | | | | 289,599 | | | | 19,518,973 | |
Stifel Financial Corporation † | | | | | | | | | | | 309,969 | | | | 15,451,955 | |
Virtu Financial Incorporated Class A | | | | | | | | | | | 799,166 | | | | 11,068,449 | |
Virtus Investment Partners Incorporated « | | | | | | | | | | | 100,356 | | | | 11,621,225 | |
| | | | |
| | | | | | | | | | | | | | | 57,660,602 | |
| | | | | | | | | | | | | | | | |
| | | | |
| Insurance: 1.33% | | | | | | | | | | | | | | | | |
Argo Group International Holdings Limited | | | | | | | | | | | 318,160 | | | | 20,187,252 | |
| | | | | | | | | | | | | | | | |
| | | | |
| Thrifts & Mortgage Finance: 1.28% | | | | | | | | | | | | | | | | |
Essent Group Limited † | | | | | | | | | | | 635,448 | | | | 19,393,873 | |
| | | | | | | | | | | | | | | | |
| | | | |
Health Care: 20.62% | | | | | | | | | | | | | | | | |
| | | | |
| Biotechnology: 3.71% | | | | | | | | | | | | | | | | |
Alder Biopharmaceuticals Incorporated Ǡ | | | | | | | | | | | 216,403 | | | | 5,096,291 | |
Alnylam Pharmaceuticals Incorporated † | | | | | | | | | | | 128,703 | | | | 5,646,201 | |
Emergent BioSolutions Incorporated | | | | | | | | | | | 184,706 | | | | 4,942,733 | |
Flexion Therapeutics Incorporated † | | | | | | | | | | | 453,599 | | | | 7,484,384 | |
Galapagos NV | | | | | | | | | | | 55,987 | | | | 3,309,951 | |
Intrexon Corporation Ǡ | | | | | | | | | | | 156,456 | | | | 4,565,386 | |
Ophthotech Corporation † | | | | | | | | | | | 148,610 | | | | 4,554,897 | |
Portola Pharmaceuticals Incorporated † | | | | | | | | | | | 282,149 | | | | 5,075,861 | |
Radius Health Incorporated Ǡ | | | | | | | | | | | 115,044 | | | | 6,122,642 | |
Tesaro Incorporated Ǡ | | | | | | | | | | | 68,924 | | | | 9,352,298 | |
| | | | |
| | | | | | | | | | | | | | | 56,150,644 | |
| | | | | | | | | | | | | | | | |
The accompanying notes are an integral part of these financial statements.
| | | | | | |
| Portfolio of investments—November 30, 2016 (unaudited) | | Wells Fargo Allocation Funds | | | 67 | |
SMALL COMPANY GROWTH PORTFOLIO
| | | | | | | | | | | | | | | | |
| Security name | | | | | | | | Shares | | | Value | |
| | | | |
| Health Care Equipment & Supplies: 8.19% | | | | | | | | | | | | | | | | |
Accuray Incorporated Ǡ | | | | | | | | | | | 1,502,649 | | | $ | 7,588,377 | |
Analogic Corporation | | | | | | | | | | | 140,682 | | | | 12,963,846 | |
Atricure Incorporated Ǡ | | | | | | | | | | | 493,150 | | | | 8,871,769 | |
Cerus Corporation Ǡ | | | | | | | | | | | 2,023,805 | | | | 10,564,262 | |
DexCom Incorporated † | | | | | | | | | | | 156,767 | | | | 10,235,317 | |
Inogen Incorporated † | | | | | | | | | | | 231,853 | | | | 14,938,289 | |
K2M Group Holdings Incorporated Ǡ | | | | | | | | | | | 599,308 | | | | 11,266,990 | |
Nevro Corporation Ǡ | | | | | | | | | | | 197,741 | | | | 15,034,248 | |
Novocure Limited Ǡ | | | | | | | | | | | 693,104 | | | | 5,371,556 | |
Obalon Therapeutics Incorporated Ǡ | | | | | | | | | | | 175,558 | | | | 2,141,808 | |
The Spectranetics Corporation † | | | | | | | | | | | 576,206 | | | | 12,590,101 | |
Wright Medical Group NV Ǡ | | | | | | | | | | | 541,891 | | | | 12,485,169 | |
| | | | |
| | | | | | | | | | | | | | | 124,051,732 | |
| | | | | | | | | | | | | | | | |
| | | | |
| Health Care Providers & Services: 4.83% | | | | | | | | | | | | | | | | |
AMN Healthcare Services Incorporated † | | | | | | | | | | | 516,420 | | | | 17,196,786 | |
HealthEquity Incorporated † | | | | | | | | | | | 423,315 | | | | 18,850,217 | |
LifePoint Hospitals Incorporated † | | | | | | | | | | | 127,242 | | | | 6,991,948 | |
Surgery Partners Incorporated Ǡ | | | | | | | | | | | 665,808 | | | | 9,820,668 | |
Teladoc Incorporated Ǡ | | | | | | | | | | | 451,456 | | | | 8,284,218 | |
The Ensign Group Incorporated | | | | | | | | | | | 556,138 | | | | 12,023,704 | |
| | | | |
| | | | | | | | | | | | | | | 73,167,541 | |
| | | | | | | | | | | | | | | | |
| | | | |
| Health Care Technology: 1.74% | | | | | | | | | | | | | | | | |
Evolent Health Incorporated Class A Ǡ | | | | | | | | | | | 639,290 | | | | 12,018,652 | |
Medidata Solutions Incorporated † | | | | | | | | | | | 176,517 | | | | 9,749,034 | |
Vocera Communications Incorporated † | | | | | | | | | | | 253,550 | | | | 4,614,610 | |
| | | | |
| | | | | | | | | | | | | | | 26,382,296 | |
| | | | | | | | | | | | | | | | |
| | | | |
| Life Sciences Tools & Services: 1.68% | | | | | | | | | | | | | | | | |
ICON plc ADR † | | | | | | | | | | | 276,389 | | | | 20,906,064 | |
Pacific BioSciences of California Ǡ | | | | | | | | | | | 606,224 | | | | 4,613,365 | |
| | | | |
| | | | | | | | | | | | | | | 25,519,429 | |
| | | | | | | | | | | | | | | | |
| | | | |
| Pharmaceuticals: 0.47% | | | | | | | | | | | | | | | | |
Pacira Pharmaceuticals Incorporated † | | | | | | | | | | | 225,421 | | | | 7,179,659 | |
| | | | | | | | | | | | | | | | |
| | | | |
Industrials: 15.55% | | | | | | | | | | | | | | | | |
| | | | |
| Air Freight & Logistics: 0.70% | | | | | | | | | | | | | | | | |
Hub Group Incorporated Class A † | | | | | | | | | | | 248,722 | | | | 10,657,738 | |
| | | | | | | | | | | | | | | | |
| | | | |
| Building Products: 4.65% | | | | | | | | | | | | | | | | |
A.O. Smith Corporation | | | | | | | | | | | 343,834 | | | | 16,720,647 | |
Apogee Enterprises Incorporated « | | | | | | | | | | | 376,873 | | | | 17,976,842 | |
Masonite International Corporation † | | | | | | | | | | | 156,523 | | | | 10,142,690 | |
NCI Building Systems Incorporated † | | | | | | | | | | | 840,469 | | | | 14,035,832 | |
PGT Incorporated † | | | | | | | | | | | 1,043,239 | | | | 11,579,953 | |
| | | | |
| | | | | | | | | | | | | | | 70,455,964 | |
| | | | | | | | | | | | | | | | |
The accompanying notes are an integral part of these financial statements.
| | | | |
| 68 | | Wells Fargo Allocation Funds | | Portfolio of investments—November 30, 2016 (unaudited) |
SMALL COMPANY GROWTH PORTFOLIO
| | | | | | | | | | | | | | | | |
| Security name | | | | | | | | Shares | | | Value | |
| | | | |
| Commercial Services & Supplies: 3.11% | | | | | | | | | | | | | | | | |
Copart Incorporated † | | | | | | | | | | | 399,834 | | | $ | 21,878,916 | |
KAR Auction Services Incorporated | | | | | | | | | | | 311,248 | | | | 13,122,216 | |
West Corporation | | | | | | | | | | | 507,728 | | | | 12,114,390 | |
| | | | |
| | | | | | | | | | | | | | | 47,115,522 | |
| | | | | | | | | | | | | | | | |
| | | | |
| Construction & Engineering: 1.73% | | | | | | | | | | | | | | | | |
Chicago Bridge & Iron Company NV | | | | | | | | | | | 267,979 | | | | 8,979,976 | |
Granite Construction Incorporated | | | | | | | | | | | 291,422 | | | | 17,190,984 | |
| | | | |
| | | | | | | | | | | | | | | 26,170,960 | |
| | | | | | | | | | | | | | | | |
| | | | |
| Machinery: 2.20% | | | | | | | | | | | | | | | | |
EnPro Industries Incorporated | | | | | | | | | | | 242,570 | | | | 14,748,256 | |
SPX Corporation † | | | | | | | | | | | 266,974 | | | | 6,522,175 | |
Wabash National Corporation † | | | | | | | | | | | 871,045 | | | | 12,011,711 | |
| | | | |
| | | | | | | | | | | | | | | 33,282,142 | |
| | | | | | | | | | | | | | | | |
| | | | |
| Professional Services: 1.48% | | | | | | | | | | | | | | | | |
On Assignment Incorporated † | | | | | | | | | | | 408,796 | | | | 16,879,187 | |
RPX Corporation † | | | | | | | | | | | 524,539 | | | | 5,481,433 | |
| | | | |
| | | | | | | | | | | | | | | 22,360,620 | |
| | | | | | | | | | | | | | | | |
| | | | |
| Road & Rail: 1.68% | | | | | | | | | | | | | | | | |
Genesee & Wyoming Incorporated Class A † | | | | | | | | | | | 177,927 | | | | 13,593,623 | |
Swift Transportation Company Ǡ | | | | | | | | | | | 478,378 | | | | 11,945,099 | |
| | | | |
| | | | | | | | | | | | | | | 25,538,722 | |
| | | | | | | | | | | | | | | | |
| | | | |
Information Technology: 27.24% | | | | | | | | | | | | | | | | |
| | | | |
| Communications Equipment: 0.93% | | | | | | | | | | | | | | | | |
Ciena Corporation † | | | | | | | | | | | 659,825 | | | | 14,153,246 | |
| | | | | | | | | | | | | | | | |
| | | | |
| Electronic Equipment, Instruments & Components: 0.89% | | | | | | | | | | | | | | | | |
OSI Systems Incorporated † | | | | | | | | | | | 178,599 | | | | 13,519,944 | |
| | | | | | | | | | | | | | | | |
| | | | |
| Internet Software & Services: 4.93% | | | | | | | | | | | | | | | | |
2U Incorporated Ǡ | | | | | | | | | | | 481,364 | | | | 15,913,894 | |
Benefitfocus Incorporated Ǡ | | | | | | | | | | | 395,772 | | | | 10,804,576 | |
Cornerstone OnDemand Incorporated † | | | | | | | | | | | 395,230 | | | | 14,192,709 | |
Hortonworks Incorporated Ǡ | | | | | | | | | | | 709,136 | | | | 6,446,046 | |
Mimecast Limited Ǡ | | | | | | | | | | | 308,131 | | | | 6,304,360 | |
Pandora Media Incorporated Ǡ | | | | | | | | | | | 632,881 | | | | 7,354,077 | |
Shopify Incorporated Class A † | | | | | | | | | | | 330,468 | | | | 13,770,602 | |
| | | | |
| | | | | | | | | | | | | | | 74,786,264 | |
| | | | | | | | | | | | | | | | |
| | | | |
| IT Services: 2.96% | | | | | | | | | | | | | | | | |
Acxiom Corporation † | | | | | | | | | | | 725,369 | | | | 19,244,040 | |
Maximus Incorporated | | | | | | | | | | | 183,650 | | | | 10,154,009 | |
Vantiv Incorporated Class A † | | | | | | | | | | | 272,902 | | | | 15,399,860 | |
| | | | |
| | | | | | | | | | | | | | | 44,797,909 | |
| | | | | | | | | | | | | | | | |
The accompanying notes are an integral part of these financial statements.
| | | | | | |
| Portfolio of investments—November 30, 2016 (unaudited) | | Wells Fargo Allocation Funds | | | 69 | |
SMALL COMPANY GROWTH PORTFOLIO
| | | | | | | | | | | | | | | | |
| Security name | | | | | | | | Shares | | | Value | |
| | | | |
| Semiconductors & Semiconductor Equipment: 6.90% | | | | | | | | | | | | | | | | |
Applied Micro Circuits Corporation † | | | | | | | | | | | 1,446,062 | | | $ | 12,653,043 | |
Cypress Semiconductor Corporation | | | | | | | | | | | 1,370,032 | | | | 15,412,860 | |
FormFactor Incorporated † | | | | | | | | | | | 1,168,758 | | | | 13,090,090 | |
Microsemi Corporation † | | | | | | | | | | | 424,962 | | | | 23,266,670 | |
Nanometrics Incorporated † | | | | | | | | | | | 376,654 | | | | 9,005,797 | |
Silicon Motion Technology Corporation | | | | | | | | | | | 229,552 | | | | 10,557,096 | |
Teradyne Incorporated | | | | | | | | | | | 841,804 | | | | 20,523,182 | |
| | | | |
| | | | | | | | | | | | | | | 104,508,738 | |
| | | | | | | | | | | | | | | | |
| | | | |
| Software: 10.63% | | | | | | | | | | | | | | | | |
Cadence Design Systems Incorporated † | | | | | | | | | | | 735,628 | | | | 19,332,304 | |
CyberArk Software Limited Ǡ | | | | | | | | | | | 287,418 | | | | 14,661,192 | |
Nuance Communications Incorporated † | | | | | | | | | | | 814,495 | | | | 13,202,964 | |
PTC Incorporated † | | | | | | | | | | | 496,550 | | | | 24,186,951 | |
Realpage Incorporated † | | | | | | | | | | | 647,839 | | | | 18,528,195 | |
Secureworks Corporation Class A Ǡ | | | | | | | | | | | 285,547 | | | | 3,526,505 | |
SS&C Technologies Holdings Incorporated | | | | | | | | | | | 838,360 | | | | 25,159,184 | |
Synchronoss Technologies Incorporated † | | | | | | | | | | | 214,327 | | | | 10,390,573 | |
Talend SA † | | | | | | | | | | | 200,949 | | | | 4,639,912 | |
The Rubicon Project Incorporated † | | | | | | | | | | | 681,139 | | | | 5,142,599 | |
Ultimate Software Group Incorporated † | | | | | | | | | | | 54,951 | | | | 11,261,108 | |
Zendesk Incorporated † | | | | | | | | | | | 520,474 | | | | 11,080,891 | |
| | | | |
| | | | | | | | | | | | | | | 161,112,378 | |
| | | | | | | | | | | | | | | | |
| | | |
Materials: 2.71% | | | | | | | | | | | | | |
| | | |
| Construction Materials: 0.81% | | | | | | | | | | | | | |
Forterra Incorporated † | | | | | | | | | | | 616,847 | | | | 12,219,739 | |
| | | | | | | | | | | | | | | | |
| | | |
| Metals & Mining: 0.99% | | | | | | | | | | | | | |
Steel Dynamics Incorporated | | | | | | | | | | | 421,999 | | | | 14,972,525 | |
| | | | | | | | | | | | | | | | |
| | | |
| Paper & Forest Products: 0.91% | | | | | | | | | | | | | |
Boise Cascade Company † | | | | | | | | | | | 607,382 | | | | 13,848,310 | |
| | | | | | | | | | | | | | | | |
| | | |
Real Estate: 1.11% | | | | | | | | | | | | | |
| | | |
| Equity REITs: 1.11% | | | | | | | | | | | | | |
QTS Realty Trust Incorporated Class A | | | | | | | | | | | 359,619 | | | | 16,830,162 | |
| | | | | | | | | | | | | | | | |
| | | | |
Total Common Stocks (Cost $1,226,035,864) | | | | | | | | | | | | | | | 1,441,611,868 | |
| | | | | | | | | | | | | | | | |
| | | | |
| | | Yield | | | | | | | | | | |
| Short-Term Investments: 15.86% | | | | | | | | | | | | | | | | |
| | | | |
| Investment Companies: 15.86% | | | | | | | | | | | | | | | | |
Securities Lending Cash Investment LLC (l)(r)(u) | | | 0.65 | % | | | | | | | 165,095,831 | | | | 165,112,340 | |
Wells Fargo Government Money Market Fund Select Class (l)(u) | | | 0.31 | | | | | | | | 75,190,164 | | | | 75,190,164 | |
| | | | |
Total Short-Term Investments (Cost $240,287,228) | | | | | | | | | | | | | | | 240,302,504 | |
| | | | | | | | | | | | | | | | |
The accompanying notes are an integral part of these financial statements.
| | | | |
| 70 | | Wells Fargo Allocation Funds | | Portfolio of investments—November 30, 2016 (unaudited) |
SMALL COMPANY GROWTH PORTFOLIO
| | | | | | | | |
| | | | | | Value | |
| Total investments in securities (Cost $1,466,323,092) * | | | 110.99 | % | | $ | 1,681,914,372 | |
Other assets and liabilities, net | | | (10.99 | ) | | | (166,551,894 | ) |
| | | | | | | | |
| Total net assets | | | 100.00 | % | | $ | 1,515,362,478 | |
| | | | | | | | |
| † | Non-income-earning security |
| « | All or a portion of this security is on loan. |
| (l) | The issuer of the security is an affiliated person of the Portfolio as defined in the Investment Company Act of 1940. |
| (r) | The investment is a non-registered investment vehicle purchased with cash collateral received from securities on loan. |
| (u) | The rate represents the 7-day annualized yield at period end. |
| * | Cost for federal income tax purposes is $1,510,671,686 and unrealized gains (losses) consists of: |
| | | | |
Gross unrealized gains | | $ | 279,923,404 | |
Gross unrealized losses | | | (108,680,718 | ) |
| | | | |
Net unrealized gains | | $ | 171,242,686 | |
The accompanying notes are an integral part of these financial statements.
| | | | | | |
| Portfolio of investments—November 30, 2016 (unaudited) | | Wells Fargo Allocation Funds | | | 71 | |
SMALL COMPANY VALUE PORTFOLIO
| | | | | | | | | | | | | | | | |
| Security name | | | | | | | | Shares | | | Value | |
| | | | |
Common Stocks: 97.67% | | | | | | | | | | | | | | | | |
| | | | |
Consumer Discretionary: 17.61% | | | | | | | | | | | | | | | | |
| | | | |
| Auto Components: 1.81% | | | | | | | | | | | | | | | | |
Metaldyne Performance Group Incorporated | | | | | | | | | | | 93,100 | | | $ | 1,880,620 | |
Visteon Corporation | | | | | | | | | | | 27,790 | | | | 2,186,239 | |
| |
| | | | 4,066,859 | |
| | | | | | | | | | | | | | | | |
| | | | |
| Automobiles: 0.99% | | | | | | | | | | | | | | | | |
Thor Industries Incorporated | | | | | | | | | | | 22,110 | | | | 2,223,603 | |
| | | | | | | | | | | | | | | | |
| | | | |
| Diversified Consumer Services: 1.18% | | | | | | | | | | | | | | | | |
DeVry Incorporated « | | | | | | | | | | | 89,060 | | | | 2,658,441 | |
| | | | | | | | | | | | | | | | |
| | | | |
| Hotels, Restaurants & Leisure: 3.99% | | | | | | | | | | | | | | | | |
ClubCorp Holdings Incorporated | | | | | | | | | | | 155,424 | | | | 2,020,512 | |
Eldorado Resorts Incorporated Ǡ | | | | | | | | | | | 165,790 | | | | 2,279,613 | |
Penn National Gaming Incorporated † | | | | | | | | | | | 190,030 | | | | 2,523,598 | |
Red Robin Gourmet Burgers Incorporated † | | | | | | | | | | | 41,970 | | | | 2,159,357 | |
| |
| | | | 8,983,080 | |
| | | | | | | | | | | | | | | | |
| | | | |
| Household Durables: 2.60% | | | | | | | | | | | | | | | | |
Century Communities Incorporated † | | | | | | | | | | | 90,546 | | | | 1,878,830 | |
Taylor Morrison Home Corporation Class A † | | | | | | | | | | | 115,990 | | | | 2,297,762 | |
TRI Pointe Homes Incorporated † | | | | | | | | | | | 144,881 | | | | 1,683,517 | |
| |
| | | | 5,860,109 | |
| | | | | | | | | | | | | | | | |
| | | | |
| Internet & Direct Marketing Retail: 0.80% | | | | | | | | | | | | | | | | |
1-800-Flowers.com Incorporated Class A † | | | | | | | | | | | 170,400 | | | | 1,797,720 | |
| | | | | | | | | | | | | | | | |
| | | | |
| Media: 2.38% | | | | | | | | | | | | | | | | |
Lions Gate Entertainment Corporation « | | | | | | | | | | | 141,820 | | | | 3,318,588 | |
Scholastic Corporation | | | | | | | | | | | 45,933 | | | | 2,025,186 | |
| |
| | | | 5,343,774 | |
| | | | | | | | | | | | | | | | |
| | | | |
| Specialty Retail: 2.10% | | | | | | | | | | | | | | | | |
Asbury Automotive Group Incorporated † | | | | | | | | | | | 29,609 | | | | 1,739,529 | |
GNC Holdings Incorporated Class A | | | | | | | | | | | 56,970 | | | | 823,217 | |
Urban Outfitters Incorporated † | | | | | | | | | | | 68,450 | | | | 2,163,020 | |
| |
| | | | 4,725,766 | |
| | | | | | | | | | | | | | | | |
| | | | |
| Textiles, Apparel & Luxury Goods: 1.76% | | | | | | | | | | | | | | | | |
G-III Apparel Group Limited † | | | | | | | | | | | 60,000 | | | | 1,629,600 | |
Oxford Industries Incorporated | | | | | | | | | | | 32,000 | | | | 2,325,120 | |
| |
| | | | 3,954,720 | |
| | | | | | | | | | | | | | | | |
| | | | |
Consumer Staples: 2.14% | | | | | | | | | | | | | | | | |
| | | | |
| Food & Staples Retailing: 1.16% | | | | | | | | | | | | | | | | |
The Andersons Incorporated | | | | | | | | | | | 24,425 | | | | 961,124 | |
United Natural Foods Incorporated † | | | | | | | | | | | 35,120 | | | | 1,648,884 | |
| |
| | | | 2,610,008 | |
| | | | | | | | | | | | | | | | |
The accompanying notes are an integral part of these financial statements.
| | | | |
| 72 | | Wells Fargo Allocation Funds | | Portfolio of investments—November 30, 2016 (unaudited) |
SMALL COMPANY VALUE PORTFOLIO
| | | | | | | | | | | | | | | | |
| Security name | | | | | | | | Shares | | | Value | |
| | | | |
| Food Products: 0.98% | | | | | | | | | | | | | | | | |
Darling Ingredients Incorporated † | | | | | | | | | | | 163,010 | | | $ | 2,202,265 | |
| | | | | | | | | | | | | | | | |
| | | | |
Energy: 5.04% | | | | | | | | | | | | | | | | |
| | | | |
| Energy Equipment & Services: 1.80% | | | | | | | | | | | | | | | | |
RPC Incorporated « | | | | | | | | | | | 98,300 | | | | 1,973,864 | |
Unit Corporation † | | | | | | | | | | | 85,160 | | | | 2,069,388 | |
| |
| | | | 4,043,252 | |
| | | | | | | | | | | | | | | | |
| | | | |
| Oil, Gas & Consumable Fuels: 3.24% | | | | | | | | | | | | | | | | |
Callon Petroleum Company † | | | | | | | | | | | 114,600 | | | | 2,021,544 | |
Carrizo Oil & Gas Incorporated † | | | | | | | | | | | 41,000 | | | | 1,735,940 | |
Delek US Holdings Incorporated | | | | | | | | | | | 112,900 | | | | 2,270,419 | |
Scorpio Tankers Incorporated | | | | | | | | | | | 301,400 | | | | 1,274,922 | |
| |
| | | | 7,302,825 | |
| | | | | | | | | | | | | | | | |
| | | | |
Financials: 27.50% | | | | | | | | | | | | | | | | |
| | | | |
| Banks: 19.50% | | | | | | | | | | | | | | | | |
BancorpSouth Incorporated | | | | | | | | | | | 78,592 | | | | 2,243,802 | |
Cathay General Bancorp | | | | | | | | | | | 67,300 | | | | 2,362,230 | |
Chemical Financial Corporation | | | | | | | | | | | 50,895 | | | | 2,640,433 | |
ConnectOne Bancorp Incorporated | | | | | | | | | | | 74,920 | | | | 1,760,620 | |
Customers Bancorp Incorporated † | | | | | | | | | | | 61,700 | | | | 1,881,850 | |
FCB Financial Holdings Class A † | | | | | | | | | | | 58,700 | | | | 2,597,475 | |
Great Western Bancorp Incorporated | | | | | | | | | | | 63,140 | | | | 2,525,600 | |
Independent Bank Group Incorporated | | | | | | | | | | | 48,700 | | | | 2,926,870 | |
MB Financial Incorporated | | | | | | | | | | | 56,400 | | | | 2,440,428 | |
Pinnacle Financial Partners Incorporated | | | | | | | | | | | 36,560 | | | | 2,358,120 | |
Renasant Corporation | | | | | | | | | | | 69,700 | | | | 2,889,762 | |
Sterling BanCorp | | | | | | | | | | | 100,673 | | | | 2,290,311 | |
Umpqua Holdings Corporation | | | | | | | | | | | 120,400 | | | | 2,139,508 | |
United Community Bank | | | | | | | | | | | 92,800 | | | | 2,522,304 | |
Webster Financial Corporation | | | | | | | | | | | 51,537 | | | | 2,556,751 | |
Western Alliance Bancorp † | | | | | | | | | | | 58,678 | | | | 2,741,436 | |
Wintrust Financial Corporation | | | | | | | | | | | 36,977 | | | | 2,434,566 | |
Yadkin Financial Corporation | | | | | | | | | | | 77,800 | | | | 2,548,728 | |
| |
| | | | 43,860,794 | |
| | | | | | | | | | | | | | | | |
| | | | |
| Capital Markets: 1.37% | | | | | | | | | | | | | | | | |
Stifel Financial Corporation † | | | | | | | | | | | 61,893 | | | | 3,085,366 | |
| | | | | | | | | | | | | | | | |
| | | | |
| Consumer Finance: 1.00% | | | | | | | | | | | | | | | | |
PRA Group Incorporated † | | | | | | | | | | | 62,470 | | | | 2,245,797 | |
| | | | | | | | | | | | | | | | |
| | | | |
| Insurance: 4.66% | | | | | | | | | | | | | | | | |
American Equity Investment Life Holding Company | | | | | | | | | | | 93,208 | | | | 1,932,202 | |
Horace Mann Educators Corporation | | | | | | | | | | | 66,210 | | | | 2,658,332 | |
Kemper Corporation | | | | | | | | | | | 54,310 | | | | 2,223,995 | |
OneBeacon Insurance Group Limited Class A | | | | | | | | | | | 95,256 | | | | 1,462,180 | |
Primerica Incorporated | | | | | | | | | | | 31,363 | | | | 2,217,364 | |
| |
| | | | 10,494,073 | |
| | | | | | | | | | | | | | | | |
The accompanying notes are an integral part of these financial statements.
| | | | | | |
| Portfolio of investments—November 30, 2016 (unaudited) | | Wells Fargo Allocation Funds | | | 73 | |
SMALL COMPANY VALUE PORTFOLIO
| | | | | | | | | | | | | | | | |
| Security name | | | | | | | | Shares | | | Value | |
| | | | |
| Thrifts & Mortgage Finance: 0.97% | | | | | | | | | | | | | | | | |
Bofi Holding Incorporated Ǡ | | | | | | | | | | | 92,300 | | | $ | 2,181,049 | |
| | | | | | | | | | | | | | | | |
| | | | |
Health Care: 5.69% | | | | | | | | | | | | | | | | |
| | | | |
| Health Care Equipment & Supplies: 0.80% | | | | | | | | | | | | | | | | |
Merit Medical Systems Incorporated † | | | | | | | | | | | 76,410 | | | | 1,799,456 | |
| | | | | | | | | | | | | | | | |
| | | | |
| Health Care Providers & Services: 4.89% | | | | | | | | | | | | | | | | |
Magellan Health Services Incorporated † | | | | | | | | | | | 37,120 | | | | 2,702,336 | |
Molina Healthcare Incorporated † | | | | | | | | | | | 44,540 | | | | 2,354,384 | |
Owens & Minor Incorporated | | | | | | | | | | | 45,850 | | | | 1,554,774 | |
PharMerica Corporation † | | | | | | | | | | | 103,710 | | | | 2,494,226 | |
Select Medical Holdings Corporation † | | | | | | | | | | | 155,120 | | | | 1,884,708 | |
| |
| | | | 10,990,428 | |
| | | | | | | | | | | | | | | | |
| | | | |
Industrials: 10.21% | | | | | | | | | | | | | | | | |
| | | | |
| Aerospace & Defense: 0.97% | | | | | | | | | | | | | | | | |
Triumph Group Incorporated | | | | | | | | | | | 78,360 | | | | 2,178,408 | |
| | | | | | | | | | | | | | | | |
| | | | |
| Commercial Services & Supplies: 3.05% | | | | | | | | | | | | | | | | |
Interface Incorporated | | | | | | | | | | | 131,220 | | | | 2,283,228 | |
LSC Communications Incorporated | | | | | | | | | | | 96,461 | | | | 1,990,955 | |
West Corporation | | | | | | | | | | | 108,110 | | | | 2,579,505 | |
| |
| | | | 6,853,688 | |
| | | | | | | | | | | | | | | | |
| | | | |
| Construction & Engineering: 2.87% | | | | | | | | | | | | | | | | |
Argan Incorporated | | | | | | | | | | | 36,932 | | | | 2,232,539 | |
KBR Incorporated | | | | | | | | | | | 107,290 | | | | 1,792,816 | |
Tutor Perini Corporation † | | | | | | | | | | | 92,895 | | | | 2,424,560 | |
| |
| | | | 6,449,915 | |
| | | | | | | | | | | | | | | | |
| | | | |
| Electrical Equipment: 0.89% | | | | | | | | | | | | | | | | |
Generac Holdings Incorporated † | | | | | | | | | | | 49,090 | | | | 2,011,708 | |
| | | | | | | | | | | | | | | | |
| | | | |
| Professional Services: 1.23% | | | | | | | | | | | | | | | | |
Korn/Ferry International | | | | | | | | | | | 108,560 | | | | 2,755,253 | |
| | | | | | | | | | | | | | | | |
| | | | |
| Trading Companies & Distributors: 1.20% | | | | | | | | | | | | | | | | |
Air Lease Corporation | | | | | | | | | | | 75,500 | | | | 2,707,430 | |
| | | | | | | | | | | | | | | | |
| | | | |
Information Technology: 13.59% | | | | | | | | | | | | | | | | |
| | | | |
| Communications Equipment: 1.95% | | | | | | | | | | | | | | | | |
Comtech Telecommunications Corporation | | | | | | | | | | | 151,970 | | | | 1,747,655 | |
NetScout Systems Incorporated † | | | | | | | | | | | 84,350 | | | | 2,631,720 | |
| |
| | | | 4,379,375 | |
| | | | | | | | | | | | | | | | |
| | | | |
| Electronic Equipment, Instruments & Components: 3.30% | | | | | | | | | | | | | | | | |
Anixter International Incorporated † | | | | | | | | | | | 26,120 | | | | 2,041,278 | |
Jabil Circuit Incorporated | | | | | | | | | | | 123,910 | | | | 2,620,697 | |
VeriFone Systems Incorporated † | | | | | | | | | | | 98,000 | | | | 1,655,220 | |
Vishay Intertechnology Incorporated | | | | | | | | | | | 72,381 | | | | 1,098,418 | |
| |
| | | | 7,415,613 | |
| | | | | | | | | | | | | | | | |
The accompanying notes are an integral part of these financial statements.
| | | | |
| 74 | | Wells Fargo Allocation Funds | | Portfolio of investments—November 30, 2016 (unaudited) |
SMALL COMPANY VALUE PORTFOLIO
| | | | | | | | | | | | | | | | |
| Security name | | | | | | | | Shares | | | Value | |
| | | | |
| IT Services: 1.13% | | | | | | | | | | | | | | | | |
Cardtronics Incorporated † | | | | | | | | | | | 51,610 | | | $ | 2,553,147 | |
| | | | | | | | | | | | | | | | |
| | | |
| Semiconductors & Semiconductor Equipment: 4.47% | | | | | | | | | | | | | |
Cirrus Logic Incorporated † | | | | | | | | | | | 60,070 | | | | 3,303,850 | |
Integrated Device Technology Incorporated † | | | | | | | | | | | 72,814 | | | | 1,703,848 | |
MKS Instruments Incorporated | | | | | | | | | | | 36,870 | | | | 2,121,869 | |
Veeco Instruments Incorporated † | | | | | | | | | | | 110,140 | | | | 2,935,231 | |
| | | | |
| | | | | | | | | | | | | | | 10,064,798 | |
| | | | | | | | | | | | | | | | |
| | | |
| Software: 2.27% | | | | | | | | | | | | | |
Nuance Communications Incorporated † | | | | | | | | | | | 147,450 | | | | 2,390,165 | |
Tivo Corporation † | | | | | | | | | | | 134,460 | | | | 2,722,815 | |
| | | | |
| | | | | | | | | | | | | | | 5,112,980 | |
| | | | | | | | | | | | | | | | |
| | | |
| Technology Hardware, Storage & Peripherals: 0.47% | | | | | | | | | | | | | |
Avid Technology Incorporated † | | | | | | | | | | | 250,880 | | | | 1,056,205 | |
| | | | | | | | | | | | | | | | |
| | | |
Materials: 3.18% | | | | | | | | | | | | | |
| | | |
| Chemicals: 2.04% | | | | | | | | | | | | | |
A. Schulman Incorporated | | | | | | | | | | | 78,000 | | | | 2,597,400 | |
Cabot Corporation | | | | | | | | | | | 39,200 | | | | 1,996,456 | |
| | | | |
| | | | | | | | | | | | | | | 4,593,856 | |
| | | | | | | | | | | | | | | | |
| | | |
| Metals & Mining: 1.14% | | | | | | | | | | | | | |
Ferroglobe plc (a) | | | | | | | | | | | 224,340 | | | | 0 | |
Ferroglobe plc | | | | | | | | | | | 224,340 | | | | 2,559,719 | |
| | | | |
| | | | | | | | | | | | | | | 2,559,719 | |
| | | | | | | | | | | | | | | | |
| | | |
Real Estate: 9.20% | | | | | | | | | | | | | |
| | | |
| Equity REITs: 8.41% | | | | | | | | | | | | | |
Brandywine Realty Trust | | | | | | | | | | | 139,500 | | | | 2,141,325 | |
Corporate Office Properties Trust | | | | | | | | | | | 75,600 | | | | 2,163,672 | |
Cousins Properties Incorporated | | | | | | | | | | | 281,500 | | | | 2,226,665 | |
Equity Commonwealth † | | | | | | | | | | | 76,200 | | | | 2,215,896 | |
Four Corners Property Trust Incorporated | | | | | | | | | | | 123,100 | | | | 2,361,058 | |
Kite Realty Group Trust | | | | | | | | | | | 83,100 | | | | 1,998,555 | |
Pennsylvania Real Estate Investment Trust | | | | | | | | | | | 94,500 | | | | 1,811,565 | |
Ramco-Gershenson Properties Trust | | | | | | | | | | | 101,721 | | | | 1,726,205 | |
Sunstone Hotel Investors Incorporated | | | | | | | | | | | 156,680 | | | | 2,278,127 | |
| | | | |
| | | | | | | | | | | | | | | 18,923,068 | |
| | | | | | | | | | | | | | | | |
| | | |
| Real Estate Management & Development: 0.79% | | | | | | | | | | | | | |
Alexander & Baldwin Incorporated | | | | | | | | | | | 40,281 | | | | 1,775,184 | |
| | | | | | | | | | | | | | | | |
| | | |
Utilities: 3.51% | | | | | | | | | | | | | |
| | | |
| Electric Utilities: 2.70% | | | | | | | | | | | | | |
El Paso Electric Company | | | | | | | | | | | 45,031 | | | | 2,028,647 | |
PNM Resources Incorporated | | | | | | | | | | | 61,127 | | | | 1,931,613 | |
Portland General Electric Company | | | | | | | | | | | 50,924 | | | | 2,118,438 | |
| | | | |
| | | | | | | | | | | | | | | 6,078,698 | |
| | | | | | | | | | | | | | | | |
The accompanying notes are an integral part of these financial statements.
| | | | | | |
| Portfolio of investments—November 30, 2016 (unaudited) | | Wells Fargo Allocation Funds | | | 75 | |
SMALL COMPANY VALUE PORTFOLIO
| | | | | | | | | | | | | | | | |
| Security name | | | | | | | | Shares | | | Value | |
| | | |
| Gas Utilities: 0.81% | | | | | | | | | | | | | |
Southwest Gas Corporation | | | | | | | | | | | 24,490 | | | $ | 1,815,436 | |
| | | | | | | | | | | | | | | | |
| | | | |
Total Common Stocks (Cost $181,313,891) | | | | | | | | | | | | | | | 219,713,866 | |
| | | | | | | | | | | | | | | | |
| | | | |
| | | | | | Expiration date | | | | | | | |
| | | |
Warrants: 0.00% | | | | | | | | | | | | | |
| | | |
Health Care: 0.00% | | | | | | | | | | | | | |
| | | |
| Health Care Equipment & Supplies: 0.00% | | | | | | | | | | | | | |
EnteroMedics Incorporated †(a) | | | | | | | 2-15-2017 | | | | 9,104 | | | | 0 | |
| | | | | | | | | | | | | | | | |
| | | | |
Total Warrants (Cost $0) | | | | | | | | | | | | | | | 0 | |
| | | | | | | | | | | | | | | | |
| | | | |
| | | Yield | | | | | | | | | | |
| Short-Term Investments: 6.71% | | | | | | | | | | | | | | | | |
| | | | |
| Investment Companies: 6.71% | | | | | | | | | | | | | | | | |
Securities Lending Cash Investment LLC (l)(r)(u) | | | 0.65 | % | | | | | | | 11,761,436 | | | | 11,762,612 | |
Wells Fargo Government Money Market Fund Select Class (u) | | | 0.31 | | | | | | | | 3,332,087 | | | | 3,332,087 | |
| | | | |
Total Short-Term Investments (Cost $15,094,012) | | | | | | | | | | | | | | | 15,094,699 | |
| | | | | | | | | | | | | | | | |
| | | | | | | | |
| Total investments in securities (Cost $196,407,903) * | | | 104.38 | % | | | 234,808,565 | |
Other assets and liabilities, net | | | (4.38 | ) | | | (9,860,757 | ) |
| | | | | | | | |
| Total net assets | | | 100.00 | % | | $ | 224,947,808 | |
| | | | | | | | |
| « | All or a portion of this security is on loan. |
| † | Non-income-earning security |
| (a) | The security is fair valued in accordance with procedures approved by the Board of Trustees. |
| (l) | The issuer of the security is an affiliated person of the Portfolio as defined in the Investment Company Act of 1940. |
| (r) | The investment is a non-registered investment vehicle purchased with cash collateral received from securities on loan. |
| (u) | The rate represents the 7-day annualized yield at period end. |
| * | Cost for federal income tax purposes is $198,335,771 and unrealized gains (losses) consists of: |
| | | | |
Gross unrealized gains | | $ | 45,949,979 | |
Gross unrealized losses | | | (9,477,185 | ) |
| | | | |
Net unrealized gains | | $ | 36,472,794 | |
The accompanying notes are an integral part of these financial statements.
| | | | |
| 76 | | Wells Fargo Allocation Funds | | Summary portfolio of investments—November 30, 2016 (unaudited) |
CORE BOND PORTFOLIO
The Summary portfolio of investments shows the 50 largest portfolio holdings in unaffiliated issuers and any holdings exceeding 1% of the total net assets as of the report date. The remaining securities held are grouped as “Other securities” in each category.
| | | | | | | | | | | | | | | | | | | | |
| Security name | | Interest rate | | | Maturity date | | | Principal | | | Value | | | Percent of
net assets | |
| | | | | |
Agency Securities: 27.20% | | | | | | | | | | | | | | | | | | | | |
FHLMC | | | 1.24-7.00 | % | | | 8-1-2017 to 12-13-2046 | | | $ | 160,588,888 | | | $ | 169,079,765 | | | | 3.22 | % |
FHLMC %% | | | 3.00 | | | | 12-13-2046 | | | | 44,100,000 | | | | 43,838,156 | | | | 0.84 | |
FHLMC | | | 3.50 | | | | 7-1-2032 | | | | 14,165,419 | | | | 14,699,881 | | | | 0.28 | |
FHLMC | | | 4.00 | | | | 8-1-2044 | | | | 18,453,037 | | | | 19,619,382 | | | | 0.38 | |
FHLMC Series 300 Class 300 | | | 3.00 | | | | 1-15-2043 | | | | 14,386,497 | | | | 14,443,906 | | | | 0.28 | |
FNMA | | | 0.00-8.12 | | | | 4-1-2017 to 11-1-2046 | | | | 479,910,237 | | | | 504,096,462 | | | | 9.68 | |
FNMA | | | 3.00 | | | | 6-1-2031 | | | | 14,469,882 | | | | 14,930,795 | | | | 0.29 | |
FNMA %% | | | 3.00 | | | | 12-13-2046 | | | | 34,100,000 | | | | 33,918,844 | | | | 0.65 | |
FNMA %% | | | 3.00 | | | | 1-18-2047 | | | | 110,500,000 | | | | 109,684,200 | | | | 2.10 | |
FNMA | | | 3.50 | | | | 6-1-2045 | | | | 17,691,683 | | | | 18,218,372 | | | | 0.35 | |
FNMA %% | | | 3.50 | | | | 12-13-2046 | | | | 86,500,000 | | | | 88,743,594 | | | | 1.70 | |
FNMA %% | | | 3.50 | | | | 1-18-2047 | | | | 23,600,000 | | | | 24,202,343 | | | | 0.46 | |
FNMA %% | | | 4.00 | | | | 12-13-2046 | | | | 23,500,000 | | | | 24,722,207 | | | | 0.47 | |
FNMA | | | 4.50 | | | | 2-1-2044 | | | | 13,480,624 | | | | 14,806,106 | | | | 0.28 | |
FNMA | | | 4.50 | | | | 3-1-2046 | | | | 14,991,505 | | | | 16,378,521 | | | | 0.31 | |
FNMA Series 2015-18 Class HE | | | 4.00 | | | | 9-25-2041 | | | | 14,738,307 | | | | 15,668,393 | | | | 0.30 | |
GNMA %% | | | 3.00 | | | | 12-20-2046 | | | | 35,200,000 | | | | 35,699,125 | | | | 0.68 | |
GNMA %% | | | 3.50 | | | | 12-20-2046 | | | | 105,500,000 | | | | 109,715,875 | | | | 2.10 | |
GNMA | | | 3.50-5.00 | | | | 3-15-2041 to 12-20-2046 | | | | 66,644,891 | | | | 71,970,810 | | | | 1.37 | |
Other securities | | | | | | | | | | | | | | | 75,256,391 | | | | 1.46 | |
| | | | |
Total Agency Securities (Cost $1,436,765,054) | | | | | | | | | | | | 1,419,693,128 | | | | 27.20 | |
| | | | | | | | | | | | | | | | | | | | |
| | | | | |
Asset-Backed Securities: 12.48% | | | | | | | | | | | | | | | | | | | | |
Capital Auto Receivables Asset Trust | | | 1.39-2.01 | | | | 2-20-2018 to 10-20-2020 | | | | 60,002,588 | | | | 60,131,465 | | | | 1.14 | |
SLM Student Loan Trust | | | 0.92-3.74 | | | | 4-25-2019 to 1-25-2072 | | | | 138,293,380 | | | | 134,680,958 | | | | 2.60 | |
SMB Private Education Loan Trust Series 2016-B Class A2A 144A | | | 2.43 | | | | 2-17-2032 | | | | 16,726,000 | | | | 16,451,744 | | | | 0.31 | |
Other securities | | | | | | | | | | | | | | | 440,050,191 | | | | 8.43 | |
| | | | |
Total Asset-Backed Securities (Cost $652,378,051) | | | | | | | | | | | | 651,314,358 | | | | 12.48 | |
| | | | | | | | | | | | | | | | | | | | |
| | | | | |
Corporate Bonds and Notes: 18.61% | | | | | | | | | | | | | | | | | | | | |
| | | | | |
Consumer Discretionary: 1.07% | | | | | | | | | | | | | | | | | | | | |
| | | | | |
| Automobiles: 0.09% | | | | | | | | | | | | | | | | | | | | |
Other securities | | | | | | | | | | | | | | | 4,584,220 | | | | 0.09 | |
| | | | | | | | | | | | | | | | | | | | |
| | | | | |
| Hotels, Restaurants & Leisure: 0.17% | | | | | | | | | | | | | | | | | | | | |
Other securities | | | | | | | | | | | | | | | 8,773,757 | | | | 0.17 | |
| | | | | | | | | | | | | | | | | | | | |
| | | | | |
| Household Durables: 0.14% | | | | | | | | | | | | | | | | | | | | |
Other securities | | | | | | | | | | | | | | | 7,599,477 | | | | 0.14 | |
| | | | | | | | | | | | | | | | | | | | |
| | | | | |
| Media: 0.67% | | | | | | | | | | | | | | | | | | | | |
Other securities | | | | | | | | | | | | | | | 34,860,933 | | | | 0.67 | |
| | | | | | | | | | | | | | | | | | | | |
The accompanying notes are an integral part of these financial statements.
| | | | | | |
| Summary portfolio of investments—November 30, 2016 (unaudited) | | Wells Fargo Allocation Funds | | | 77 | |
CORE BOND PORTFOLIO
| | | | | | | | | | | | | | | | | | | | |
| Security name | | Interest rate | | | Maturity date | | | Principal | | | Value | | | Percent of
net assets | |
| | | | | |
Consumer Staples: 1.18% | | | | | | | | | | | | | | | | | | | | |
| | | | | |
| Beverages: 0.26% | | | | | | | | | | | | | | | | | | | | |
Other securities | | | | | | | | | | | | | | $ | 13,789,725 | | | | 0.26 | % |
| | | | | | | | | | | | | | | | | | | | |
| | | | | |
| Food & Staples Retailing: 0.15% | | | | | | | | | | | | | | | | | | | | |
Other securities | | | | | | | | | | | | | | | 7,948,054 | | | | 0.15 | |
| | | | | | | | | | | | | | | | | | | | |
| | | | | |
| Food Products: 0.63% | | | | | | | | | | | | | | | | | | | | |
Other securities | | | | | | | | | | | | | | | 32,710,454 | | | | 0.63 | |
| | | | | | | | | | | | | | | | | | | | |
| | | | | |
| Tobacco: 0.14% | | | | | | | | | | | | | | | | | | | | |
Other securities | | | | | | | | | | | | | | | 7,009,791 | | | | 0.14 | |
| | | | | | | | | | | | | | | | | | | | |
| | | | | |
Energy: 1.98% | | | | | | | | | | | | | | | | | | | | |
| | | | | |
| Energy Equipment & Services: 0.06% | | | | | | | | | | | | | | | | | | | | |
Other securities | | | | | | | | | | | | | | | 3,186,815 | | | | 0.06 | |
| | | | | | | | | | | | | | | | | | | | |
| | | | | |
| Oil, Gas & Consumable Fuels: 1.92% | | | | | | | | | | | | | | | | | | | | |
Other securities | | | | | | | | | | | | | | | 100,232,644 | | | | 1.92 | |
| | | | | | | | | | | | | | | | | | | | |
| | | | | |
Financials: 5.42% | | | | | | | | | | | | | | | | | | | | |
| | | | | |
| Banks: 1.85% | | | | | | | | | | | | | | | | | | | | |
Bank of America Corporation | | | 3.25 | % | | | 10-21-2027 | | | $ | 17,750,000 | | | | 16,951,747 | | | | 0.32 | |
Other securities | | | | | | | | | | | | | | | 79,753,520 | | | | 1.53 | |
| | | | | |
| | | | | | | | | | | | | | | 96,705,267 | | | | 1.85 | |
| | | | | | | | | | | | | | | | | | | | |
| | | | | |
| Capital Markets: 1.49% | | | | | | | | | | | | | | | | | | | | |
Morgan Stanley | | | 2.63 | | | | 11-17-2021 | | | | 15,250,000 | | | | 15,073,405 | | | | 0.29 | |
Other securities | | | | | | | | | | | | | | | 62,346,176 | | | | 1.20 | |
| | | | | |
| | | | | | | | | | | | | | | 77,419,581 | | | | 1.49 | |
| | | | | | | | | | | | | | | | | | | | |
| | | | | |
| Consumer Finance: 0.98% | | | | | | | | | | | | | | | | | | | | |
Other securities | | | | | | | | | | | | | | | 51,170,711 | | | | 0.98 | |
| | | | | | | | | | | | | | | | | | | | |
| | | | | |
| Diversified Financial Services: 0.18% | | | | | | | | | | | | | | | | | | | | |
Other securities | | | | | | | | | | | | | | | 9,340,849 | | | | 0.18 | |
| | | | | | | | | | | | | | | | | | | | |
| | | | | |
| Insurance: 0.92% | | | | | | | | | | | | | | | | | | | | |
Other securities | | | | | | | | | | | | | | | 48,059,262 | | | | 0.92 | |
| | | | | | | | | | | | | | | | | | | | |
| | | | | |
Health Care: 1.37% | | | | | | | | | | | | | | | | | | | | |
| | | | | |
| Biotechnology: 0.67% | | | | | | | | | | | | | | | | | | | | |
Other securities | | | | | | | | | | | | | | | 34,688,992 | | | | 0.67 | |
| | | | | | | | | | | | | | | | | | | | |
| | | | | |
| Health Care Providers & Services: 0.15% | | | | | | | | | | | | | | | | | | | | |
Other securities | | | | | | | | | | | | | | | 7,647,661 | | | | 0.15 | |
| | | | | | | | | | | | | | | | | | | | |
| | | | | |
| Life Sciences Tools & Services: 0.10% | | | | | | | | | | | | | | | | | | | | |
Other securities | | | | | | | | | | | | | | | 5,433,610 | | | | 0.10 | |
| | | | | | | | | | | | | | | | | | | | |
The accompanying notes are an integral part of these financial statements.
| | | | |
| 78 | | Wells Fargo Allocation Funds | | Summary portfolio of investments—November 30, 2016 (unaudited) |
CORE BOND PORTFOLIO
| | | | | | | | | | | | | | | | | | | | |
| Security name | | | | | | | | | | | Value | | | Percent of
net assets | |
| | | | | |
| Pharmaceuticals: 0.45% | | | | | | | | | | | | | | | | | | | | |
Other securities | | | | | | | | | | | | | | $ | 23,649,922 | | | | 0.45 | % |
| | | | | | | | | | | | | | | | | | | | |
| | | | | |
Industrials: 1.11% | | | | | | | | | | | | | | | | | | | | |
| | | | | |
| Aerospace & Defense: 0.51% | | | | | | | | | | | | | | | | | | | | |
Other securities | | | | | | | | | | | | | | | 26,595,110 | | | | 0.51 | |
| | | | | | | | | | | | | | | | | | | | |
| | | | | |
| Air Freight & Logistics: 0.10% | | | | | | | | | | | | | | | | | | | | |
Other securities | | | | | | | | | | | | | | | 5,034,524 | | | | 0.10 | |
| | | | | | | | | | | | | | | | | | | | |
| | | | | |
| Construction & Engineering: 0.05% | | | | | | | | | | | | | | | | | | | | |
Other securities | | | | | | | | | | | | | | | 2,424,627 | | | | 0.05 | |
| | | | | | | | | | | | | | | | | | | | |
| | | | | |
| Machinery: 0.08% | | | | | | | | | | | | | | | | | | | | |
Other securities | | | | | | | | | | | | | | | 4,410,650 | | | | 0.08 | |
| | | | | | | | | | | | | | | | | | | | |
| | | | | |
| Road & Rail: 0.37% | | | | | | | | | | | | | | | | | | | | |
Other securities | | | | | | | | | | | | | | | 19,583,744 | | | | 0.37 | |
| | | | | | | | | | | | | | | | | | | | |
| | | | | |
Information Technology: 2.28% | | | | | | | | | | | | | | | | | | | | |
| | | | | |
| Communications Equipment: 0.64% | | | | | | | | | | | | | | | | | | | | |
Other securities | | | | | | | | | | | | | | | 33,600,473 | | | | 0.64 | |
| | | | | | | | | | | | | | | | | | | | |
| | | | | |
| IT Services: 0.31% | | | | | | | | | | | | | | | | | | | | |
Other securities | | | | | | | | | | | | | | | 16,013,261 | | | | 0.31 | |
| | | | | | | | | | | | | | | | | | | | |
| | | | | |
| Semiconductors & Semiconductor Equipment: 0.36% | | | | | | | | | | | | | | | | | | | | |
Other securities | | | | | | | | | | | | | | | 18,933,701 | | | | 0.36 | |
| | | | | | | | | | | | | | | | | | | | |
| | | | | |
| Software: 0.69% | | | | | | | | | | | | | | | | | | | | |
Other securities | | | | | | | | | | | | | | | 35,714,356 | | | | 0.69 | |
| | | | | | | | | | | | | | | | | | | | |
| | | | | |
| Technology Hardware, Storage & Peripherals: 0.28% | | | | | | | | | | | | | | | | | | | | |
Other securities | | | | | | | | | | | | | | | 14,574,189 | | | | 0.28 | |
| | | | | | | | | | | | | | | | | | | | |
| | | | | |
Materials: 0.38% | | | | | | | | | | | | | | | | | | | | |
| | | | | |
| Chemicals: 0.26% | | | | | | | | | | | | | | | | | | | | |
Other securities | | | | | | | | | | | | | | | 13,555,869 | | | | 0.26 | |
| | | | | | | | | | | | | | | | | | | | |
| | | | | |
| Containers & Packaging: 0.08% | | | | | | | | | | | | | | | | | | | | |
Other securities | | | | | | | | | | | | | | | 4,416,591 | | | | 0.08 | |
| | | | | | | | | | | | | | | | | | | | |
| | | | | |
| Metals & Mining: 0.04% | | | | | | | | | | | | | | | | | | | | |
Other securities | | | | | | | | | | | | | | | 1,958,873 | | | | 0.04 | |
| | | | | | | | | | | | | | | | | | | | |
| | | | | |
Real Estate: 0.58% | | | | | | | | | | | | | | | | | | | | |
| | | | | |
| Equity REITs: 0.45% | | | | | | | | | | | | | | | | | | | | |
Other securities | | | | | | | | | | | | | | | 23,783,659 | | | | 0.45 | |
| | | | | | | | | | | | | | | | | | | | |
The accompanying notes are an integral part of these financial statements.
| | | | | | |
| Summary portfolio of investments—November 30, 2016 (unaudited) | | Wells Fargo Allocation Funds | | | 79 | |
CORE BOND PORTFOLIO
| | | | | | | | | | | | | | | | | | | | |
| Security name | | | | | | | | | | | Value | | | Percent of
net assets | |
| | | | | |
| Real Estate Management & Development: 0.13% | | | | | | | | | | | | | | | | | | | | |
Other securities | | | | | | | | | | | | | | $ | 6,606,640 | | | | 0.13 | % |
| | | | | | | | | | | | | | | | | | | | |
| | | | | |
Telecommunication Services: 1.38% | | | | | | | | | | | | | | | | | | | | |
| | | | | |
| Diversified Telecommunication Services: 1.26% | | | | | | | | | | | | | | | | | | | | |
Other securities | | | | | | | | | | | | | | | 65,888,791 | | | | 1.26 | |
| | | | | | | | | | | | | | | | | | | | |
| | | | | |
| Wireless Telecommunication Services: 0.12% | | | | | | | | | | | | | | | | | | | | |
Other securities | | | | | | | | | | | | | | | 6,305,725 | | | | 0.12 | |
| | | | | | | | | | | | | | | | | | | | |
| | | | | |
Utilities: 1.86% | | | | | | | | | | | | | | | | | | | | |
| | | | | |
| Electric Utilities: 1.25% | | | | | | | | | | | | | | | | | | | | |
Other securities | | | | | | | | | | | | | | | 65,133,988 | | | | 1.25 | |
| | | | | | | | | | | | | | | | | | | | |
| | | | | |
| Gas Utilities: 0.09% | | | | | | | | | | | | | | | | | | | | |
Other securities | | | | | | | | | | | | | | | 4,755,915 | | | | 0.09 | |
| | | | | | | | | | | | | | | | | | | | |
| | | | | |
Independent Power & Renewable Electricity
Producers: 0.07% | | | | | | | | | | | | | | | | | | | | |
Other securities | | | | | | | | | | | | | | | 3,744,067 | | | | 0.07 | |
| | | | | | | | | | | | | | | | | | | | |
| | | | | |
| Multi-Utilities: 0.45% | | | | | | | | | | | | | | | | | | | | |
Other securities | | | | | | | | | | | | | | | 23,452,864 | | | | 0.45 | |
| | | | | | | | | | | | | | | | | | | | |
| | | | | |
Total Corporate Bonds and Notes (Cost $990,186,671) | | | | | | | | | | | | | | | 971,299,342 | | | | 18.61 | |
| | | | | | | | | | | | | | | | | | | | |
| | | | | |
Government Agency Debt: 0.39% | | | | | | | | | | | | | | | | | | | | |
Other securities | | | | | | | | | | | | | | | 20,555,046 | | | | 0.39 | |
| | | | | | | | | |
| | | | | |
Total Government Agency Debt (Cost $21,113,777) | | | | | | | | | | | | | | | 20,555,046 | | | | 0.39 | |
| | | | | | | | | | | | | | | | | | | | |
| | | | | |
Municipal Obligations: 0.76% | | | | | | | | | | | | | | | | | | | | |
| | | | | |
| California: 0.23% | | | | | | | | | | | | | | | | | | | | |
Other securities | | | | | | | | | | | | | | | 12,140,785 | | | | 0.23 | |
| | | | | | | | | | | | | | | | | | | | |
| | | | | |
| Nevada: 0.12% | | | | | | | | | | | | | | | | | | | | |
Other securities | | | | | | | | | | | | | | | 6,354,442 | | | | 0.12 | |
| | | | | | | | | | | | | | | | | | | | |
| | | | | |
| New Jersey: 0.11% | | | | | | | | | | | | | | | | | | | | |
Other securities | | | | | | | | | | | | | | | 5,526,055 | | | | 0.11 | |
| | | | | | | | | | | | | | | | | | | | |
| | | | | |
| New York: 0.13% | | | | | | | | | | | | | | | | | | | | |
Other securities | | | | | | | | | | | | | | | 6,614,413 | | | | 0.13 | |
| | | | | | | | | | | | | | | | | | | | |
| | | | | |
| Ohio: 0.04% | | | | | | | | | | | | | | | | | | | | |
Other securities | | | | | | | | | | | | | | | 1,933,085 | | | | 0.04 | |
| | | | | | | | | | | | | | | | | | | | |
| | | | | |
| Texas: 0.13% | | | | | | | | | | | | | | | | | | | | |
Other securities | | | | | | | | | | | | | | | 6,929,864 | | | | 0.13 | |
| | | | | | | | | | | | | | | | | | | | |
| | | | | |
Total Municipal Obligations (Cost $34,858,655) | | | | | | | | | | | | | | | 39,498,644 | | | | 0.76 | |
| | | | | | | | | | | | | | | | | | | | |
The accompanying notes are an integral part of these financial statements.
| | | | |
| 80 | | Wells Fargo Allocation Funds | | Summary portfolio of investments—November 30, 2016 (unaudited) |
CORE BOND PORTFOLIO
| | | | | | | | | | | | | | | | | | | | |
| Security name | | Interest rate | | | Maturity date | | | Principal | | | Value | | | Percent of
net assets | |
| | |
Non-Agency Mortgage-Backed Securities: 5.49% | | | | | | | | | |
SMB Private Education Loan Trust Series 2016-C Class A2A 144A | | | 2.34 | % | | | 9-15-2034 | | | $ | 14,672,000 | | | $ | 14,497,770 | | | | 0.28 | % |
Verizon Owner Trust Series 2016-2A Class A 144A | | | 1.68 | | | | 5-20-2021 | | | | 13,972,000 | | | | 13,948,459 | | | | 0.27 | |
Other securities | | | | | | | | | | | | | | | 258,081,189 | | | | 4.94 | |
| | | |
Total Non-Agency Mortgage-Backed Securities (Cost $289,024,528) | | | | | | | | 286,527,418 | | | | 5.49 | |
| | | | | | | | | | | | | | | | | | | | |
| | | | | |
U.S. Treasury Securities: 34.66% | | | | | | | | | | | | | | | | | | | | |
U.S. Treasury Bond « | | | 2.25 | | | | 8-15-2046 | | | | 73,660,000 | | | | 62,038,441 | | | | 1.19 | |
U.S. Treasury Bond | | | 2.50 | | | | 2-15-2046 | | | | 49,355,000 | | | | 43,983,794 | | | | 0.84 | |
U.S. Treasury Bond | | | 2.50 | | | | 5-15-2046 | | | | 38,269,000 | | | | 34,089,298 | | | | 0.65 | |
U.S. Treasury Bond | | | 2.88 | | | | 11-15-2046 | | | | 26,020,000 | | | | 25,174,350 | | | | 0.48 | |
U.S. Treasury Bond | | | 3.00 | | | | 11-15-2045 | | | | 27,871,000 | | | | 27,579,219 | | | | 0.53 | |
U.S. Treasury Note | | | 0.75 | | | | 7-31-2018 | | | | 87,096,000 | | | | 86,629,862 | | | | 1.66 | |
U.S. Treasury Note ## | | | 0.75 | | | | 9-30-2018 | | | | 279,439,000 | | | | 277,616,219 | | | | 5.32 | |
U.S. Treasury Note | | | 0.75-2.00 | | | | 10-31-2018 to 11-30-2023 | | | | 29,024,000 | | | | 28,771,763 | | | | 0.55 | |
U.S. Treasury Note | | | 0.88 | | | | 7-15-2018 | | | | 27,343,000 | | | | 27,266,111 | | | | 0.52 | |
U.S. Treasury Note | | | 1.00 | | | | 11-30-2018 | | | | 42,967,000 | | | | 42,862,934 | | | | 0.82 | |
U.S. Treasury Note | | | 1.00 | | | | 10-15-2019 | | | | 168,848,000 | | | | 167,001,141 | | | | 3.20 | |
U.S. Treasury Note | | | 1.00 | | | | 11-15-2019 | | | | 150,115,000 | | | | 148,379,370 | | | | 2.84 | |
U.S. Treasury Note | | | 1.13 | | | | 6-15-2018 | | | | 17,877,000 | | | | 17,897,952 | | | | 0.34 | |
U.S. Treasury Note | | | 1.13 | | | | 6-30-2021 | | | | 51,083,000 | | | | 49,488,648 | | | | 0.95 | |
U.S. Treasury Note | | | 1.13 | | | | 7-31-2021 | | | | 16,549,000 | | | | 16,013,739 | | | | 0.31 | |
U.S. Treasury Note | | | 1.13 | | | | 9-30-2021 | | | | 61,169,000 | | | | 59,071,087 | | | | 1.13 | |
U.S. Treasury Note | | | 1.25 | | | | 12-15-2018 | | | | 23,639,000 | | | | 23,687,933 | | | | 0.45 | |
U.S. Treasury Note | | | 1.25 | | | | 10-31-2021 | | | | 43,614,000 | | | | 42,336,241 | | | | 0.81 | |
U.S. Treasury Note | | | 1.38 | | | | 2-29-2020 | | | | 16,496,000 | | | | 16,426,403 | | | | 0.31 | |
U.S. Treasury Note | | | 1.38 | | | | 1-31-2021 | | | | 74,478,000 | | | | 73,325,900 | | | | 1.41 | |
U.S. Treasury Note | | | 1.38 | | | | 4-30-2021 | | | | 55,396,000 | | | | 54,383,306 | | | | 1.04 | |
U.S. Treasury Note « | | | 1.50 | | | | 8-15-2026 | | | | 172,381,000 | | | | 158,933,903 | | | | 3.05 | |
U.S. Treasury Note | | | 1.63 | | | | 5-15-2026 | | | | 6,515,000 | | | | 6,089,492 | | | | 0.12 | |
U.S. Treasury Note | | | 1.75 | | | | 11-30-2021 | | | | 44,442,000 | | | | 44,235,434 | | | | 0.85 | |
U.S. Treasury Note | | | 2.00 | | | | 8-31-2021 | | | | 33,853,000 | | | | 34,032,827 | | | | 0.65 | |
U.S. Treasury Note | | | 2.00 | | | | 10-31-2021 | | | | 47,323,000 | | | | 47,530,038 | | | | 0.91 | |
U.S. Treasury Note | | | 2.00 | | | | 11-15-2026 | | | | 28,004,000 | | | | 27,046,823 | | | | 0.52 | |
U.S. Treasury Note ## | | | 2.13 | | | | 8-15-2021 | | | | 149,754,000 | | | | 151,427,052 | | | | 2.90 | |
U.S. Treasury Note | | | 2.13 | | | | 9-30-2021 | | | | 15,782,000 | | | | 15,948,453 | | | | 0.31 | |
| | | | |
Total U.S. Treasury Securities (Cost $1,852,142,157) | | | | | | | | | | | | 1,809,267,733 | | | | 34.66 | |
| | | | | | | | | | | | | | | | | | | | |
| | | | |
Yankee Corporate Bonds and Notes: 6.05% | | | | | | | | | | | | | | | | | |
| | | | | |
Consumer Discretionary: 0.08% | | | | | | | | | | | | | | | | | | | | |
| | | | | |
| Media: 0.08% | | | | | | | | | | | | | | | | | | | | |
Other securities | | | | | | | | | | | | | | | 4,062,162 | | | | 0.08 | |
| | | | | | | | | | | | | | | | | | | | |
| | | | | |
Energy: 0.85% | | | | | | | | | | | | | | | | | | | | |
| | | | | |
| Oil, Gas & Consumable Fuels: 0.85% | | | | | | | | | | | | | | | | | | | | |
Other securities | | | | | | | | | | | | | | | 44,580,982 | | | | 0.85 | |
| | | | | | | | | | | | | | | | | | | | |
The accompanying notes are an integral part of these financial statements.
| | | | | | |
| Summary portfolio of investments—November 30, 2016 (unaudited) | | Wells Fargo Allocation Funds | | | 81 | |
CORE BOND PORTFOLIO
| | | | | | | | | | | | | | | | | | | | |
| Security name | | Interest rate | | | Maturity date | | | Principal | | | Value | | | Percent of
net assets | |
| | | | | |
Financials: 3.92% | | | | | | | | | | | | | | | | | | | | |
| | | | | |
| Banks: 2.56% | | | | | | | | | | | | | | | | | | | | |
HSBC Holdings plc | | | 2.65 | % | | | 1-5-2022 | | | $ | 13,920,000 | | | $ | 13,542,587 | | | | 0.26 | % |
KFW | | | 1.00 | | | | 7-15-2019 | | | | 28,907,000 | | | | 28,466,226 | | | | 0.54 | |
Other securities | | | | | | | | | | | | | | | 91,792,637 | | | | 1.76 | |
| | | | | |
| | | | | | | | | | | | | | | 133,801,450 | | | | 2.56 | |
| | | | | | | | | | | | | | | | | | | | |
| | | | | |
| Capital Markets: 0.25% | | | | | | | | | | | | | | | | | | | | |
Other securities | | | | | | | | | | | | | | | 12,994,394 | | | | 0.25 | |
| | | | | | | | | | | | | | | | | | | | |
| | | | | |
| Diversified Financial Services: 0.98% | | | | | | | | | | | | | | | | | | | | |
Other securities | | | | | | | | | | | | | | | 51,217,702 | | | | 0.98 | |
| | | | | | | | | | | | | | | | | | | | |
| | | | | |
| Insurance: 0.02% | | | | | | | | | | | | | | | | | | | | |
Other securities | | | | | | | | | | | | | | | 924,177 | | | | 0.02 | |
| | | | | | | | | | | | | | | | | | | | |
| | | | | |
| Thrifts & Mortgage Finance: 0.11% | | | | | | | | | | | | | | | | | | | | |
Other securities | | | | | | | | | | | | | | | 5,698,968 | | | | 0.11 | |
| | | | | | | | | | | | | | | | | | | | |
| | | | | |
Health Care: 0.65% | | | | | | | | | | | | | | | | | | | | |
| | | | | |
| Pharmaceuticals: 0.65% | | | | | | | | | | | | | | | | | | | | |
Other securities | | | | | | | | | | | | | | | 33,764,288 | | | | 0.65 | |
| | | | | | | | | | | | | | | | | | | | |
| | | | | |
Industrials: 0.18% | | | | | | | | | | | | | | | | | | | | |
| | | | | |
| Chemicals: 0.18% | | | | | | | | | | | | | | | | | | | | |
Other securities | | | | | | | | | | | | | | | 9,187,406 | | | | 0.18 | |
| | | | | | | | | | | | | | | | | | | | |
| | | | | |
Materials: 0.13% | | | | | | | | | | | | | | | | | | | | |
| | | | | |
| Metals & Mining: 0.13% | | | | | | | | | | | | | | | | | | | | |
Other securities | | | | | | | | | | | | | | | 6,541,034 | | | | 0.13 | |
| | | | | | | | | | | | | | | | | | | | |
| | | | | |
Utilities: 0.24% | | | | | | | | | | | | | | | | | | | | |
| | | | | |
| Electric Utilities: 0.24% | | | | | | | | | | | | | | | | | | | | |
Other securities | | | | | | | | | | | | | | | 12,785,354 | | | | 0.24 | |
| | | | | | | | | | | | | | | | | | | | |
| | | | |
Total Yankee Corporate Bonds and Notes (Cost $324,477,592) | | | | | | | | | | | | 315,557,917 | | | | 6.05 | |
| | | | | | | | | | | | | | | | | | | | |
| | | | | |
Yankee Government Bonds: 1.49% | | | | | | | | | | | | | | | | | | | | |
Other securities | | | | | | | | | | | | | | | 77,693,478 | | | | 1.49 | |
| | | | | | | | | | | | | | | | | | | | |
| | | | |
Total Yankee Government Bonds (Cost $80,078,070) | | | | | | | | | | | | 77,693,478 | | | | 1.49 | |
| | | | | | | | | | | | | | | | | | | | |
| | | | | |
| | | Yield | | | | | | Shares | | | | | | | |
| Short-Term Investments: 7.06% | | | | | | | | | | | | | | | | | | | | |
| | | | | |
| Investment Companies: 7.06% | | | | | | | | | | | | | | | | | | | | |
Securities Lending Cash Investment LLC (l)(r)(u) | | | 0.65 | | | | | | | | 230,736,112 | | | | 230,759,186 | | | | 4.42 | |
Wells Fargo Government Money Market Fund Select Class (l)(u)## | | | 0.31 | | | | | | | | 137,895,059 | | | | 137,895,059 | | | | 2.64 | |
| | | |
Total Short-Term Investments (Cost $368,654,047) | | | | | | | | 368,654,245 | | | | 7.06 | |
| | | | | | | | | | | | | | | | | | | | |
| | | | |
| Total investments in securities (Cost $6,049,678,602) * | | | | | | | | | | | | 5,960,061,309 | | | | 114.19 | % |
Other assets and liabilities, net | | | | (740,715,159 | ) | | | (14.19 | ) |
| | | | | | | | | | | | | | | | | | | | |
| Total net assets | | | $ | 5,219,346,150 | | | | 100.00 | % |
| | | | | | | | | | | | | | | | | | | | |
The accompanying notes are an integral part of these financial statements.
| | | | |
| 82 | | Wells Fargo Allocation Funds | | Summary portfolio of investments—November 30, 2016 (unaudited) |
CORE BOND PORTFOLIO
| %% | Security issued on a when-issued basis |
| 144A | The security may be resold in transactions exempt from registration, normally to qualified institutional buyers, pursuant to Rule 144A under the Securities Act of 1933. |
| « | All or a portion of this security is on loan. |
| ## | All or a portion of this security has been segregated for when-issued securities. |
| (l) | The issuer of the security is an affiliated person of the Portfolio as defined in the Investment Company Act of 1940. |
| (r) | The investment is a non-registered investment vehicle purchased with cash collateral received from securities on loan. |
| (u) | The rate represents the 7-day annualized yield at period end. |
| * | Cost for federal income tax purposes is $6,074,405,459 and unrealized gains (losses) consists of: |
| | | | |
Gross unrealized gains | | $ | 15,025,520 | |
Gross unrealized losses | | | (129,369,670 | ) |
| | | | |
Net unrealized losses | | $ | (114,344,150 | ) |
The accompanying notes are an integral part of these financial statements.
| | | | | | |
| Portfolio of investments—November 30, 2016 (unaudited) | | Wells Fargo Allocation Funds | | | 83 | |
MANAGED FIXED INCOME PORTFOLIO
| | | | | | | | | | | | | | | | |
| Security name | | Interest rate | | | Maturity date | | | Principal | | | Value | |
| | | | | | | | | | | | | | | | |
| | | | |
Agency Securities: 33.01% | | | | | | | | | | | | | | | | |
FHLMC | | | 3.00 | % | | | 7-1-2046 | | | $ | 738,895 | | | $ | 736,534 | |
FHLMC | | | 3.00 | | | | 7-1-2046 | | | | 1,025,977 | | | | 1,022,383 | |
FHLMC | | | 3.50 | | | | 9-1-2032 | | | | 912,614 | | | | 949,097 | |
FHLMC | | | 3.50 | | | | 4-1-2043 | | | | 1,508,145 | | | | 1,552,553 | |
FHLMC | | | 3.50 | | | | 5-1-2044 | | | | 681,557 | | | | 702,738 | |
FHLMC | | | 3.50 | | | | 6-1-2046 | | | | 582,994 | | | | 599,497 | |
FHLMC | | | 4.00 | | | | 4-1-2044 | | | | 844,413 | | | | 898,452 | |
FHLMC | | | 4.00 | | | | 8-1-2044 | | | | 616,781 | | | | 653,923 | |
FHLMC Structured Pass-Through Securities Series T-20 Class A6 | | | 7.08 | | | | 9-25-2029 | | | | 48,993 | | | | 51,306 | |
FHLMC Structured Pass-Through Securities Series T-58 Class 4A | | | 7.50 | | | | 9-25-2043 | | | | 1,021,525 | | | | 1,183,022 | |
FNMA | | | 2.50 | | | | 8-1-2031 | | | | 510,875 | | | | 513,419 | |
FNMA | | | 2.51 | | | | 9-1-2024 | | | | 964,843 | | | | 967,661 | |
FNMA | | | 2.57 | | | | 9-1-2019 | | | | 523,121 | | | | 532,656 | |
FNMA | | | 2.57 | | | | 9-1-2019 | | | | 523,868 | | | | 533,416 | |
FNMA | | | 2.69 | | | | 5-1-2023 | | | | 593,276 | | | | 601,155 | |
FNMA | | | 2.73 | | | | 1-1-2023 | | | | 571,508 | | | | 580,621 | |
FNMA | | | 2.73 | | | | 9-1-2023 | | | | 588,050 | | | | 594,906 | |
FNMA | | | 2.76 | | | | 4-1-2021 | | | | 1,084,948 | | | | 1,098,484 | |
FNMA | | | 2.78 | | | | 10-1-2020 | | | | 550,000 | | | | 564,410 | |
FNMA | | | 2.85 | | | | 12-1-2023 | | | | 590,000 | | | | 598,319 | |
FNMA | | | 2.96 | | | | 6-1-2022 | | | | 516,389 | | | | 520,249 | |
FNMA | | | 3.00 | | | | 12-1-2032 | | | | 63,479 | | | | 64,841 | |
FNMA | | | 3.00 | | | | 7-1-2046 | | | | 593,146 | | | | 591,614 | |
FNMA | | | 3.05 | | | | 11-1-2022 | | | | 537,148 | | | | 553,354 | |
FNMA | | | 3.07 | | | | 2-1-2026 | | | | 360,000 | | | | 367,148 | |
FNMA | | | 3.08 | | | | 1-1-2026 | | | | 480,000 | | | | 489,963 | |
FNMA | | | 3.31 | | | | 6-1-2021 | | | | 550,000 | | | | 570,804 | |
FNMA | | | 3.35 | | | | 1-1-2028 | | | | 280,000 | | | | 288,079 | |
FNMA | | | 3.50 | | | | 9-1-2032 | | | | 1,699,988 | | | | 1,766,962 | |
FNMA | | | 3.50 | | | | 10-1-2032 | | | | 896,883 | | | | 932,384 | |
FNMA | | | 3.50 | | | | 11-1-2042 | | | | 350,267 | | | | 361,199 | |
FNMA | | | 3.50 | | | | 11-1-2042 | | | | 451,041 | | | | 463,025 | |
FNMA | | | 3.50 | | | | 2-1-2043 | | | | 250,129 | | | | 256,773 | |
FNMA | | | 3.50 | | | | 4-1-2046 | | | | 287,117 | | | | 295,632 | |
FNMA | | | 5.00 | | | | 9-1-2033 | | | | 223,304 | | | | 246,806 | |
FNMA | | | 5.50 | | | | 2-1-2036 | | | | 258,710 | | | | 274,877 | |
FNMA Series 2002-90 Class A2 | | | 6.50 | | | | 11-25-2042 | | | | 401,304 | | | | 447,961 | |
FNMA Series 2002-T4 Class A2 | | | 7.00 | | | | 12-25-2041 | | | | 199,417 | | | | 226,988 | |
FNMA Series 2002-W4 Class A4 | | | 6.25 | | | | 5-25-2042 | | | | 1,790,229 | | | | 2,016,434 | |
FNMA Series 2003-86 Class PT | | | 4.50 | | | | 9-25-2018 | | | | 143,845 | | | | 146,592 | |
FNMA Series 2003-W4 Class 3A ± | | | 6.25 | | | | 10-25-2042 | | | | 274,341 | | | | 308,019 | |
FNMA Series 2004-T2 Class 1A1 | | | 6.00 | | | | 11-25-2043 | | | | 765,394 | | | | 845,360 | |
FNMA Series 2004-T3 Class A1 | | | 6.00 | | | | 2-25-2044 | | | | 1,092,834 | | | | 1,234,486 | |
FNMA Series 2004-W1 Class 2A2 | | | 7.00 | | | | 12-25-2033 | | | | 178,577 | | | | 206,034 | |
FNMA Series 2004-W11 Class 1A3 | | | 7.00 | | | | 5-25-2044 | | | | 1,056,469 | | | | 1,230,480 | |
FNMA Series 2004-W8 Class 3A | | | 7.50 | | | | 6-25-2044 | | | | 350,477 | | | | 402,884 | |
FNMA Series 2006-M2 Class A2F ± | | | 5.26 | | | | 5-25-2020 | | | | 266,057 | | | | 269,493 | |
GNMA | | | 6.50 | | | | 10-15-2023 | | | | 26,521 | | | | 30,281 | |
GNMA | | | 6.50 | | | | 11-15-2023 | | | | 12,625 | | | | 14,415 | |
GNMA | | | 6.50 | | | | 11-15-2023 | | | | 3,322 | | | | 3,793 | |
The accompanying notes are an integral part of these financial statements.
| | | | |
| 84 | | Wells Fargo Allocation Funds | | Portfolio of investments—November 30, 2016 (unaudited) |
MANAGED FIXED INCOME PORTFOLIO
| | | | | | | | | | | | | | | | |
| Security name | | Interest rate | | | Maturity date | | | Principal | | | Value | |
| | | | |
Agency Securities (continued) | | | | | | | | | | | | | | | | |
GNMA | | | 6.50 | % | | | 12-15-2023 | | | $ | 15,269 | | | $ | 17,434 | |
GNMA | | | 6.50 | | | | 1-15-2024 | | | | 32,351 | | | | 36,938 | |
GNMA | | | 7.00 | | | | 8-15-2027 | | | | 86,056 | | | | 99,764 | |
SBA Series 2006-20B Class 1 | | | 5.35 | | | | 2-1-2026 | | | | 415,954 | | | | 448,403 | |
SBA Series 2006-20H Class 1 | | | 5.70 | | | | 8-1-2026 | | | | 235,823 | | | | 259,150 | |
SBA Series 2007-20J Class 1 | | | 5.57 | | | | 10-1-2027 | | | | 547,713 | | | | 602,865 | |
SBA Series 2013-20A Class 1 | | | 2.13 | | | | 1-1-2033 | | | | 465,719 | | | | 456,989 | |
SBA Series 2013-20J Class 1 | | | 3.37 | | | | 10-1-2033 | | | | 490,473 | | | | 511,327 | |
SBA Series 2014-10A Class 1 | | | 3.19 | | | | 3-10-2024 | | | | 681,330 | | | | 706,471 | |
SBA Series 2014-10B Class 1 | | | 3.02 | | | | 9-10-2024 | | | | 1,060,564 | | | | 1,100,494 | |
SBA Series 2014-20A Class 1 | | | 3.46 | | | | 1-1-2034 | | | | 404,046 | | | | 422,466 | |
SBA Series 2015-10B Class 1 | | | 2.83 | | | | 9-10-2025 | | | | 574,441 | | | | 586,193 | |
SBA Series 2015-20C Class 1 | | | 2.72 | | | | 3-1-2035 | | | | 526,942 | | | | 529,559 | |
SBA Series 2015-20E Class 1 | | | 2.77 | | | | 5-1-2035 | | | | 823,775 | | | | 828,955 | |
SBA Series 2015-20F Class 1 | | | 2.98 | | | | 6-1-2035 | | | | 574,195 | | | | 585,695 | |
| | | | |
Total Agency Securities (Cost $36,902,080) | | | | | | | | | | | | | | | 37,554,185 | |
| | | | | | | | | | | | | | | | |
| | | | |
Asset-Backed Securities: 4.13% | | | | | | | | | | | | | | | | |
American Express Credit Accounts Series 2014-2 Class A | | | 1.26 | | | | 1-15-2020 | | | | 570,000 | | | | 570,559 | |
Barclays Dryrock Issuance Trust Series 2014-3 Class A | | | 2.41 | | | | 7-15-2022 | | | | 570,000 | | | | 580,210 | |
Capital Auto Receivables Asset Trust Series 2014-2 Class A3 | | | 1.26 | | | | 5-21-2018 | | | | 104,022 | | | | 104,038 | |
Capital Auto Receivables Asset Trust Series 2014-3 Class A3 | | | 1.48 | | | | 11-20-2018 | | | | 484,932 | | | | 485,313 | |
CNH Equipment Trust Series 2014-Class A3 | | | 0.84 | | | | 5-15-2019 | | | | 193,252 | | | | 193,149 | |
CNH Equipment Trust Series 2015-A Class A4 | | | 1.85 | | | | 4-15-2021 | | | | 580,000 | | | | 583,247 | |
Ford Credit Auto Owner Trust Series 2015-2 Class A 144A | | | 2.44 | | | | 1-15-2027 | | | | 600,000 | | | | 607,540 | |
Ford Credit Auto Owner Trust Series 2016-1 Class A 144A | | | 2.31 | | | | 8-15-2027 | | | | 600,000 | | | | 601,540 | |
Mississippi Higher Education Assistance Corporation Series 2014-1 Class A1 ± | | | 1.26 | | | | 10-25-2035 | | | | 551,777 | | | | 537,107 | |
South Carolina Student Loan Corporation Series 2014-1 Class B ± | | | 2.03 | | | | 8-1-2035 | | | | 500,000 | | | | 437,027 | |
| | | | |
Total Asset-Backed Securities (Cost $4,735,382) | | | | | | | | | | | | | | | 4,699,730 | |
| | | | | | | | | | | | | | | | |
| | | | |
Corporate Bonds and Notes: 31.33% | | | | | | | | | | | | | | | | |
| | | | |
Consumer Discretionary: 4.19% | | | | | | | | | | | | | | | | |
| | | | |
| Auto Components: 0.35% | | | | | | | | | | | | | | | | |
Allison Transmission Incorporated 144A | | | 5.00 | | | | 10-1-2024 | | | | 400,000 | | | | 403,000 | |
| | | | | | | | | | | | | | | | |
| | | | |
| Automobiles: 0.37% | | | | | | | | | | | | | | | | |
General Motors Company | | | 4.88 | | | | 10-2-2023 | | | | 400,000 | | | | 417,457 | |
| | | | | | | | | | | | | | | | |
| | | | |
| Diversified Consumer Services: 2.14% | | | | | | | | | | | | | | | | |
Massachusetts Institute of Technology | | | 3.96 | | | | 7-1-2038 | | | | 200,000 | | | | 209,969 | |
Massachusetts Institute of Technology | | | 7.25 | | | | 11-2-2096 | | | | 500,000 | | | | 760,034 | |
Northwestern University | | | 3.69 | | | | 12-1-2038 | | | | 530,000 | | | | 529,308 | |
President and Fellows of Harvard College | | | 3.53 | | | | 10-1-2031 | | | | 250,000 | | | | 247,718 | |
Service Corporation International | | | 5.38 | | | | 1-15-2022 | | | | 360,000 | | | | 372,600 | |
University of Southern California | | | 3.03 | | | | 10-1-2039 | | | | 350,000 | | | | 309,192 | |
| | | | |
| | | | | | | | | | | | | | | 2,428,821 | |
| | | | | | | | | | | | | | | | |
The accompanying notes are an integral part of these financial statements.
| | | | | | |
| Portfolio of investments—November 30, 2016 (unaudited) | | Wells Fargo Allocation Funds | | | 85 | |
MANAGED FIXED INCOME PORTFOLIO
| | | | | | | | | | | | | | | | |
| Security name | | Interest rate | | | Maturity date | | | Principal | | | Value | |
| | | | |
| Media: 0.93% | | | | | | | | | | | | | | | | |
Charter Communications 144A | | | 4.91 | % | | | 7-23-2025 | | | $ | 325,000 | | | $ | 338,789 | |
Lamar Media Corporation | | | 5.88 | | | | 2-1-2022 | | | | 315,000 | | | | 324,450 | |
Time Warner Incorporated | | | 3.40 | | | | 6-15-2022 | | | | 140,000 | | | | 140,795 | |
Time Warner Incorporated | | | 3.60 | | | | 7-15-2025 | | | | 260,000 | | | | 256,810 | |
| | | | |
| | | | | | | | | | | | | | | 1,060,844 | |
| | | | | | | | | | | | | | | | |
| | | | |
| Textiles, Apparel & Luxury Goods: 0.40% | | | | | | | | | | | | | | | | |
Hanesbrands Incorporated 144A | | | 4.63 | | | | 5-15-2024 | | | | 200,000 | | | | 200,000 | |
The William Carter Company | | | 5.25 | | | | 8-15-2021 | | | | 250,000 | | | | 259,000 | |
| | | | |
| | | | | | | | | | | | | | | 459,000 | |
| | | | | | | | | | | | | | | | |
| | | | |
Consumer Staples: 0.86% | | | | | | | | | | | | | | | | |
| | | | |
| Beverages: 0.12% | | | | | | | | | | | | | | | | |
Anheuser-Busch InBev Finance Incorporated | | | 3.65 | | | | 2-1-2026 | | | | 140,000 | | | | 140,675 | |
| | | | | | | | | | | | | | | | |
| | | | |
| Food & Staples Retailing: 0.34% | | | | | | | | | | | | | | | | |
CVS Health Corporation | | | 3.50 | | | | 7-20-2022 | | | | 120,000 | | | | 123,128 | |
SABMiller Holdings Incorporated 144A | | | 3.75 | | | | 1-15-2022 | | | | 250,000 | | | | 261,021 | |
| | | | |
| | | | | | | | | | | | | | | 384,149 | |
| | | | | | | | | | | | | | | | |
| | | | |
| Food Products: 0.40% | | | | | | | | | | | | | | | | |
Ingredion Incorporated | | | 3.20 | | | | 10-1-2026 | | | | 150,000 | | | | 145,800 | |
Kraft Foods Group Incorporated | | | 3.50 | | | | 6-6-2022 | | | | 300,000 | | | | 306,650 | |
| | | | |
| | | | | | | | | | | | | | | 452,450 | |
| | | | | | | | | | | | | | | | |
| | | | |
Energy: 4.08% | | | | | | | | | | | | | | | | |
| | | | |
| Energy Equipment & Services: 0.14% | | | | | | | | | | | | | | | | |
Halliburton Company | | | 3.80 | | | | 11-15-2025 | | | | 160,000 | | | | 160,468 | |
| | | | | | | | | | | | | | | | |
| | | | |
| Oil, Gas & Consumable Fuels: 3.94% | | | | | | | | | | | | | | | | |
Anadarko Petroleum Corporation « | | | 5.55 | | | | 3-15-2026 | | | | 150,000 | | | | 163,657 | |
Chevron Corporation | | | 2.95 | | | | 5-16-2026 | | | | 250,000 | | | | 245,027 | |
Chevron Corporation | | | 3.19 | | | | 6-24-2023 | | | | 250,000 | | | | 254,635 | |
Cimarex Energy Company | | | 5.88 | | | | 5-1-2022 | | | | 350,000 | | | | 365,027 | |
Columbia Pipeline Group Company | | | 2.45 | | | | 6-1-2018 | | | | 210,000 | | | | 211,117 | |
Concho Resources Incorporated | | | 6.50 | | | | 1-15-2022 | | | | 375,000 | | | | 389,063 | |
ConocoPhillips Company | | | 3.35 | | | | 11-15-2024 | | | | 370,000 | | | | 363,208 | |
Devon Energy Corporation | | | 5.85 | | | | 12-15-2025 | | | | 130,000 | | | | 143,730 | |
EQT Corporation | | | 8.13 | | | | 6-1-2019 | | | | 400,000 | | | | 450,599 | |
Florida Gas Transmission Company 144A | | | 4.35 | | | | 7-15-2025 | | | | 230,000 | | | | 228,885 | |
Magellan Midstream Partners LP | | | 5.00 | | | | 3-1-2026 | | | | 170,000 | | | | 185,842 | |
Marathon Oil Corporation « | | | 3.85 | | | | 6-1-2025 | | | | 410,000 | | | | 380,860 | |
Newfield Exploration Company | | | 5.38 | | | | 1-1-2026 | | | | 75,000 | | | | 76,155 | |
Newfield Exploration Company | | | 5.63 | | | | 7-1-2024 | | | | 249,000 | | | | 256,781 | |
Pioneer Natural Resource Company | | | 4.45 | | | | 1-15-2026 | | | | 190,000 | | | | 198,738 | |
Plains All American Pipeline LP | | | 4.65 | | | | 10-15-2025 | | | | 400,000 | | | | 402,120 | |
Southwestern Energy Company | | | 6.70 | | | | 1-23-2025 | | | | 175,000 | | | | 173,250 | |
| | | | |
| | | | | | | | | | | | | | | 4,488,694 | |
| | | | | | | | | | | | | | | | |
The accompanying notes are an integral part of these financial statements.
| | | | |
| 86 | | Wells Fargo Allocation Funds | | Portfolio of investments—November 30, 2016 (unaudited) |
MANAGED FIXED INCOME PORTFOLIO
| | | | | | | | | | | | | | | | |
| Security name | | Interest rate | | | Maturity date | | | Principal | | | Value | |
| | | | |
Financials: 6.92% | | | | | | | | | | | | | | | | |
| | | | |
| Banks: 2.78% | | | | | | | | | | | | | | | | |
Bank of America Corporation | | | 3.95 | % | | | 4-21-2025 | | | $ | 120,000 | | | $ | 118,820 | |
Bank of America Corporation | | | 4.00 | | | | 4-1-2024 | | | | 700,000 | | | | 722,827 | |
Citigroup Incorporated | | | 3.30 | | | | 4-27-2025 | | | | 130,000 | | | | 127,228 | |
Citigroup Incorporated | | | 3.40 | | | | 5-1-2026 | | | | 250,000 | | | | 242,697 | |
Citigroup Incorporated | | | 4.40 | | | | 6-10-2025 | | | | 100,000 | | | | 102,013 | |
CoreStates Capital Trust II 144A± | | | 1.53 | | | | 1-15-2027 | | | | 750,000 | | | | 664,688 | |
National Capital Commerce Incorporated ±(i) | | | 1.83 | | | | 4-1-2027 | | | | 400,000 | | | | 332,000 | |
NTC Capital Trust Series A ± | | | 1.40 | | | | 1-15-2027 | | | | 450,000 | | | | 405,563 | |
PNC Bank | | | 3.25 | | | | 6-1-2025 | | | | 250,000 | | | | 250,059 | |
US Bancorp | | | 2.95 | | | | 7-15-2022 | | | | 200,000 | | | | 201,563 | |
| | | | |
| | | | | | | | | | | | | | | 3,167,458 | |
| | | | | | | | | | | | | | | | |
| | | | |
| Capital Markets: 1.35% | | | | | | | | | | | | | | | | |
Goldman Sachs Capital II ± | | | 4.00 | | | | 12-29-2049 | | | | 6,000 | | | | 4,781 | |
Goldman Sachs Group Incorporated | | | 3.50 | | | | 1-23-2025 | | | | 265,000 | | | | 263,497 | |
Goldman Sachs Group Incorporated | | | 4.25 | | | | 10-21-2025 | | | | 120,000 | | | | 121,284 | |
Goldman Sachs Group Incorporated | | | 5.75 | | | | 1-24-2022 | | | | 200,000 | | | | 225,721 | |
Morgan Stanley | | | 3.70 | | | | 10-23-2024 | | | | 100,000 | | | | 101,223 | |
Morgan Stanley | | | 3.95 | | | | 4-23-2027 | | | | 180,000 | | | | 177,900 | |
Morgan Stanley | | | 5.50 | | | | 7-24-2020 | | | | 350,000 | | | | 383,422 | |
The Bank of New York Mellon Corporation | | | 3.25 | | | | 9-11-2024 | | | | 250,000 | | | | 251,899 | |
| | | | |
| | | | | | | | | | | | | | | 1,529,727 | |
| | | | | | | | | | | | | | | | |
| | | | |
| Consumer Finance: 0.37% | | | | | | | | | | | | | | | | |
Caterpillar Financial Services Corporation | | | 3.75 | | | | 11-24-2023 | | | | 150,000 | | | | 157,473 | |
Daimler Finance North America LLC 144A | | | 2.38 | | | | 8-1-2018 | | | | 260,000 | | | | 261,987 | |
| | | | |
| | | | | | | | | | | | | | | 419,460 | |
| | | | | | | | | | | | | | | | |
| | | | |
| Diversified Financial Services: 0.77% | | | | | | | | | | | | | | | | |
Abay Leasing 2014 LLC | | | 2.65 | | | | 11-9-2026 | | | | 479,167 | | | | 486,737 | |
CNH Industrial Capital LLC | | | 3.38 | | | | 7-15-2019 | | | | 390,000 | | | | 389,025 | |
| | | | |
| | | | | | | | | | | | | | | 875,762 | |
| | | | | | | | | | | | | | | | |
| | | | |
| Insurance: 1.65% | | | | | | | | | | | | | | | | |
Berkshire Hathaway Incorporated | | | 2.75 | | | | 3-15-2023 | | | | 210,000 | | | | 209,067 | |
Minnesota Life Insurance Company 144A | | | 8.25 | | | | 9-15-2025 | | | | 650,000 | | | | 814,437 | |
NLV Financial Corporation 144A | | | 7.50 | | | | 8-15-2033 | | | | 565,000 | | | | 637,949 | |
Pacific LifeCorp 144A | | | 6.00 | | | | 2-10-2020 | | | | 200,000 | | | | 216,807 | |
| | | | |
| | | | | | | | | | | | | | | 1,878,260 | |
| | | | | | | | | | | | | | | | |
| | | | |
Health Care: 3.19% | | | | | | | | | | | | | | | | |
| | | | |
| Health Care Equipment & Supplies: 0.56% | | | | | | | | | | | | | | | | |
Becton Dickinson & Company | | | 3.73 | | | | 12-15-2024 | | | | 134,000 | | | | 137,074 | |
C.R. Bard Incorporated | | | 3.00 | | | | 5-15-2026 | | | | 170,000 | | | | 162,793 | |
Medtronic Incorporated | | | 3.15 | | | | 3-15-2022 | | | | 130,000 | | | | 133,181 | |
Teleflex Incorporated | | | 4.88 | | | | 6-1-2026 | | | | 200,000 | | | | 198,000 | |
| | | | |
| | | | | | | | | | | | | | | 631,048 | |
| | | | | | | | | | | | | | | | |
The accompanying notes are an integral part of these financial statements.
| | | | | | |
| Portfolio of investments—November 30, 2016 (unaudited) | | Wells Fargo Allocation Funds | | | 87 | |
MANAGED FIXED INCOME PORTFOLIO
| | | | | | | | | | | | | | | | |
| Security name | | Interest rate | | | Maturity date | | | Principal | | | Value | |
| | | | |
| Health Care Providers & Services: 2.07% | | | | | | | | | | | | | | | | |
Allina Health System Incorporated | | | 4.81 | % | | | 11-15-2045 | | | $ | 235,000 | | | $ | 251,968 | |
Ascension Health | | | 3.95 | | | | 11-15-2046 | | | | 225,000 | | | | 215,757 | |
Howard Hughes Medical Institute | | | 3.50 | | | | 9-1-2023 | | | | 120,000 | | | | 125,098 | |
Mayo Clinic | | | 3.77 | | | | 11-15-2043 | | | | 120,000 | | | | 112,355 | |
Mednax Incorporated 144A | | | 5.25 | | | | 12-1-2023 | | | | 475,000 | | | | 482,125 | |
Memorial Sloan Kettering Cancer Center | | | 4.20 | | | | 7-1-2055 | | | | 375,000 | | | | 367,499 | |
Texas Health Resources | | | 4.33 | | | | 11-15-2055 | | | | 375,000 | | | | 371,782 | |
The New York and Presbyterian Hospital | | | 3.56 | | | | 8-1-2036 | | | | 275,000 | | | | 263,223 | |
The New York and Presbyterian Hospital | | | 4.02 | | | | 8-1-2045 | | | | 175,000 | | | | 169,905 | |
| | | | |
| | | | | | | | | | | | | | | 2,359,712 | |
| | | | | | | | | | | | | | | | |
| | | | |
| Life Sciences Tools & Services: 0.13% | | | | | | | | | | | | | | | | |
Thermo Fisher Scientific Incorporated | | | 3.30 | | | | 2-15-2022 | | | | 150,000 | | | | 152,392 | |
| | | | | | | | | | | | | | | | |
| | | | |
| Pharmaceuticals: 0.43% | | | | | | | | | | | | | | | | |
Bayer US Finance LLC 144A | | | 3.38 | | | | 10-8-2024 | | | | 240,000 | | | | 237,523 | |
EMD Finance LLC 144A | | | 2.95 | | | | 3-19-2022 | | | | 250,000 | | | | 249,550 | |
| | | | |
| | | | | | | | | | | | | | | 487,073 | |
| | | | | | | | | | | | | | | | |
| | | | |
Industrials: 2.77% | | | | | | | | | | | | | | | | |
| | | | |
| Aerospace & Defense: 0.09% | | | | | | | | | | | | | | | | |
BAE Systems Holdings Incorporated 144A | | | 3.80 | | | | 10-7-2024 | | | | 100,000 | | | | 102,475 | |
| | | | | | | | | | | | | | | | |
| | | | |
| Commercial Services & Supplies: 0.32% | | | | | | | | | | | | | | | | |
Clean Harbors Incorporated | | | 5.25 | | | | 8-1-2020 | | | | 350,000 | | | | 357,875 | |
| | | | | | | | | | | | | | | | |
| | | | |
| Construction & Engineering: 0.20% | | | | | | | | | | | | | | | | |
Valmont Industries Incorporated | | | 5.00 | | | | 10-1-2044 | | | | 260,000 | | | | 226,951 | |
| | | | | | | | | | | | | | | | |
| | | | |
| Machinery: 1.86% | | | | | | | | | | | | | | | | |
Actuant Corporation | | | 5.63 | | | | 6-15-2022 | | | | 425,000 | | | | 437,219 | |
Briggs & Stratton Corporation | | | 6.88 | | | | 12-15-2020 | | | | 350,000 | | | | 384,125 | |
Deere & Company | | | 2.60 | | | | 6-8-2022 | | | | 340,000 | | | | 340,038 | |
Fortive Corporation 144A | | | 3.15 | | | | 6-15-2026 | | | | 240,000 | | | | 235,532 | |
Oshkosh Corporation | | | 5.38 | | | | 3-1-2022 | | | | 375,000 | | | | 390,938 | |
Vessel Management Services Incorporated | | | 3.43 | | | | 8-15-2036 | | | | 340,000 | | | | 330,454 | |
| | | | |
| | | | | | | | | | | | | | | 2,118,306 | |
| | | | | | | | | | | | | | | | |
| | | | |
| Road & Rail: 0.30% | | | | | | | | | | | | | | | | |
Burlington Northern Santa Fe LLC | | | 3.40 | | | | 9-1-2024 | | | | 150,000 | | | | 154,244 | |
Union Pacific Corporation | | | 7.88 | | | | 1-15-2019 | | | | 171,000 | | | | 191,623 | |
| | | | |
| | | | | | | | | | | | | | | 345,867 | |
| | | | | | | | | | | | | | | | |
| | | | |
Information Technology: 1.06% | | | | | | | | | | | | | | | | |
| | | | |
| IT Services: 0.09% | | | | | | | | | | | | | | | | |
Fiserv Incorporated | | | 4.75 | | | | 6-15-2021 | | | | 100,000 | | | | 107,943 | |
| | | | | | | | | | | | | | | | |
| | | | |
| Semiconductors & Semiconductor Equipment: 0.24% | | | | | | | | | | | | | | | | |
Micron Technology Incorporated 144A | | | 7.50 | | | | 9-15-2023 | | | | 245,000 | | | | 269,500 | |
| | | | | | | | | | | | | | | | |
The accompanying notes are an integral part of these financial statements.
| | | | |
| 88 | | Wells Fargo Allocation Funds | | Portfolio of investments—November 30, 2016 (unaudited) |
MANAGED FIXED INCOME PORTFOLIO
| | | | | | | | | | | | | | | | |
| Security name | | Interest rate | | | Maturity date | | | Principal | | | Value | |
| | | | |
| Software: 0.39% | | | | | | | | | | | | | | | | |
Oracle Corporation | | | 2.50 | % | | | 5-15-2022 | | | $ | 220,000 | | | $ | 217,701 | |
Oracle Corporation | | | 3.40 | | | | 7-8-2024 | | | | 220,000 | | | | 223,986 | |
| | | | |
| | | | | | | | | | | | | | | 441,687 | |
| | | | | | | | | | | | | | | | |
| | | | |
| Technology Hardware, Storage & Peripherals: 0.34% | | | | | | | | | | | | | | | | |
Hewlett Packard Enterprise Company 144A | | | 5.15 | | | | 10-15-2025 | | | | 375,000 | | | | 383,070 | |
| | | | | | | | | | | | | | | | |
| | | | |
Materials: 1.70% | | | | | | | | | | | | | | | | |
| | | | |
| Chemicals: 0.61% | | | | | | | | | | | | | | | | |
Scotts Miracle-Gro Company 144A | | | 6.00 | | | | 10-15-2023 | | | | 390,000 | | | | 412,425 | |
Valspar Corporation | | | 3.30 | | | | 2-1-2025 | | | | 100,000 | | | | 95,862 | |
Valvoline Incorporated 144A | | | 5.50 | | | | 7-15-2024 | | | | 185,000 | | | | 191,013 | |
| | | | |
| | | | | | | | | | | | | | | 699,300 | |
| | | | | | | | | | | | | | | | |
| | | | |
| Containers & Packaging: 0.50% | | | | | | | | | | | | | | | | |
Ball Corporation | | | 5.00 | | | | 3-15-2022 | | | | 350,000 | | | | 368,375 | |
International Paper Company | | | 3.00 | | | | 2-15-2027 | | | | 210,000 | | | | 196,120 | |
| | | | |
| | | | | | | | | | | | | | | 564,495 | |
| | | | | | | | | | | | | | | | |
| | | | |
| Metals & Mining: 0.28% | | | | | | | | | | | | | | | | |
Alcoa Incorporated « | | | 5.40 | | | | 4-15-2021 | | | | 300,000 | | | | 316,875 | |
| | | | | | | | | | | | | | | | |
| | | | |
| Paper & Forest Products: 0.31% | | | | | | | | | | | | | | | | |
Georgia Pacific LLC 144A | | | 3.73 | | | | 7-15-2023 | | | | 340,000 | | | | 349,960 | |
| | | | | | | | | | | | | | | | |
| | | | |
Real Estate: 3.19% | | | | | | | | | | | | | | | | |
| | | | |
| Equity REITs: 3.19% | | | | | | | | | | | | | | | | |
Alexandria Real Estate Equities Incorporated | | | 3.95 | | | | 1-15-2027 | | | | 240,000 | | | | 238,759 | |
AvalonBay Communities Incorporated | | | 2.95 | | | | 9-15-2022 | | | | 190,000 | | | | 189,616 | |
AvalonBay Communities Incorporated | | | 3.63 | | | | 10-1-2020 | | | | 40,000 | | | | 41,571 | |
Boston Properties LP | | | 3.70 | | | | 11-15-2018 | | | | 180,000 | | | | 185,845 | |
Boston Properties LP | | | 5.88 | | | | 10-15-2019 | | | | 200,000 | | | | 218,864 | |
Duke Realty LP | | | 3.25 | | | | 6-30-2026 | | | | 130,000 | | | | 125,637 | |
Duke Realty LP | | | 3.88 | | | | 10-15-2022 | | | | 150,000 | | | | 156,258 | |
ERP Operating LP | | | 4.63 | | | | 12-15-2021 | | | | 281,000 | | | | 305,169 | |
Liberty Property LP | | | 3.75 | | | | 4-1-2025 | | | | 100,000 | | | | 100,431 | |
Potlatch Corporation | | | 7.50 | | | | 11-1-2019 | | | | 310,000 | | | | 339,450 | |
ProLogis LP | | | 3.75 | | | | 11-1-2025 | | | | 170,000 | | | | 174,710 | |
Realty Income Corporation | | | 4.65 | | | | 8-1-2023 | | | | 370,000 | | | | 396,471 | |
Simon Property Group LP | | | 3.38 | | | | 10-1-2024 | | | | 300,000 | | | | 303,349 | |
UDR Incorporated | | | 4.63 | | | | 1-10-2022 | | | | 260,000 | | | | 279,318 | |
Ventas Realty LP | | | 3.50 | | | | 2-1-2025 | | | | 150,000 | | | | 147,758 | |
Vornado Realty LP | | | 2.50 | | | | 6-30-2019 | | | | 200,000 | | | | 200,709 | |
Weingarten Realty Investors | | | 3.25 | | | | 8-15-2026 | | | | 240,000 | | | | 226,796 | |
| | | | |
| | | | | | | | | | | | | | | 3,630,711 | |
| | | | | | | | | | | | | | | | |
The accompanying notes are an integral part of these financial statements.
| | | | | | |
| Portfolio of investments—November 30, 2016 (unaudited) | | Wells Fargo Allocation Funds | | | 89 | |
MANAGED FIXED INCOME PORTFOLIO
| | | | | | | | | | | | | | | | |
| Security name | | Interest rate | | | Maturity date | | | Principal | | | Value | |
| | | |
Telecommunication Services: 0.77% | | | | | | | | | | | | | |
| | | | |
| Diversified Telecommunication Services: 0.77% | | | | | | | | | | | | | | | | |
AT&T Incorporated | | | 4.75 | % | | | 5-15-2046 | | | $ | 280,000 | | | $ | 260,833 | |
Verizon Communications Incorporated | | | 2.63 | | | | 8-15-2026 | | | | 130,000 | | | | 119,723 | |
Verizon Communications Incorporated | | | 3.50 | | | | 11-1-2024 | | | | 110,000 | | | | 110,414 | |
Verizon Communications Incorporated | | | 5.15 | | | | 9-15-2023 | | | | 350,000 | | | | 387,136 | |
| | | | |
| | | | | | | | | | | | | | | 878,106 | |
| | | | | | | | | | | | | | | | |
| | | |
Utilities: 2.60% | | | | | | | | | | | | | |
| | | |
| Electric Utilities: 1.95% | | | | | | | | | | | | | |
Great River Energy 144A | | | 5.83 | | | | 7-1-2017 | | | | 129,702 | | | | 131,767 | |
IPALCO Enterprises Incorporated | | | 3.45 | | | | 7-15-2020 | | | | 350,000 | | | | 354,375 | |
ITC Holdings Corporation | | | 3.65 | | | | 6-15-2024 | | | | 120,000 | | | | 120,192 | |
Monongahela Power Company 144A | | | 4.10 | | | | 4-15-2024 | | | | 380,000 | | | | 397,222 | |
Northern States Power Company of Wisconsin | | | 3.30 | | | | 6-15-2024 | | | | 370,000 | | | | 374,345 | |
Otter Tail Corporation (i) | | | 9.00 | | | | 12-15-2016 | | | | 350,000 | | | | 350,625 | |
PacifiCorp | | | 3.35 | | | | 7-1-2025 | | | | 130,000 | | | | 132,807 | |
Tenaska Alabama II Partners LP 144A | | | 7.00 | | | | 6-30-2021 | | | | 151,817 | | | | 153,715 | |
Trans-Allegheny Interstate Line Company 144A | | | 3.85 | | | | 6-1-2025 | | | | 200,000 | | | | 203,741 | |
| | | | |
| | | | | | | | | | | | | | | 2,218,789 | |
| | | | | | | | | | | | | | | | |
| | | |
| Gas Utilities: 0.65% | | | | | | | | | | | | | |
AmeriGas Finance LLC | | | 7.00 | | | | 5-20-2022 | | | | 375,000 | | | | 393,750 | |
Boardwalk Pipelines Company | | | 5.95 | | | | 6-1-2026 | | | | 325,000 | | | | 346,272 | |
| | | | |
| | | | | | | | | | | | | | | 740,022 | |
| | | | | | | | | | | | | | | | |
| | | | |
Total Corporate Bonds and Notes (Cost $35,076,594) | | | | | | | | | | | | | | | 35,648,382 | |
| | | | | | | | | | | | | | | | |
| | | | |
Municipal Obligations: 7.98% | | | | | | | | | | | | | | | | |
| | | |
| Alaska: 0.27% | | | | | | | | | | | | | |
Alaska Taxable Build America Bonds Series 2010A (GO Revenue) | | | 5.74 | | | | 8-1-2033 | | | | 250,000 | | | | 306,980 | |
| | | | | | | | | | | | | | | | |
| | | |
| Arizona: 0.09% | | | | | | | | | | | | | |
Arizona School Facilities Board Refunding Certificates of Participation Series A-3 (Miscellaneous Revenue) | | | 2.38 | | | | 9-1-2019 | | | | 100,000 | | | | 101,562 | |
| | | | | | | | | | | | | | | | |
| | | |
| Georgia: 0.52% | | | | | | | | | | | | | |
Cherokee County GA School System Build America Bonds (GO Revenue) | | | 5.87 | | | | 8-1-2028 | | | | 500,000 | | | | 589,275 | |
| | | | | | | | | | | | | | | | |
| | | | |
| Indiana: 0.19% | | | | | | | | | | | | | | | | |
Indiana Finance Authority Taxable Facilities Series A (Miscellaneous Revenue) | | | 2.37 | | | | 7-1-2024 | | | | 225,000 | | | | 217,244 | |
| | | | | | | | | | | | | | | | |
| | | | |
| Maryland: 0.26% | | | | | | | | | | | | | | | | |
Baltimore County MD (GO Revenue) | | | 3.57 | | | | 8-1-2032 | | | | 300,000 | | | | 300,279 | |
| | | | | | | | | | | | | | | | |
| | | | |
| Massachusetts: 0.72% | | | | | | | | | | | | | | | | |
Boston MA Series C Qualified School Construction Bonds (GO Revenue) | | | 4.40 | | | | 4-1-2026 | | | | 400,000 | | | | 429,804 | |
Massachusetts Build America Bonds Series D (GO Revenue) | | | 4.50 | | | | 8-1-2031 | | | | 350,000 | | | | 390,919 | |
| | | | |
| | | | | | | | | | | | | | | 820,723 | |
| | | | | | | | | | | | | | | | |
The accompanying notes are an integral part of these financial statements.
| | | | |
| 90 | | Wells Fargo Allocation Funds | | Portfolio of investments—November 30, 2016 (unaudited) |
MANAGED FIXED INCOME PORTFOLIO
| | | | | | | | | | | | | | | | |
| Security name | | Interest rate | | | Maturity date | | | Principal | | | Value | |
| | | | |
| Missouri: 0.26% | | | | | | | | | | | | | | | | |
Missouri Higher Education Loan Authority Notes Class A-1 (Education Revenue) ± | | | 1.51 | % | | | 8-27-2029 | | | $ | 298,636 | | | $ | 295,243 | |
| | | | | | | | | | | | | | | | |
| | | | |
| New Jersey: 1.07% | | | | | | | | | | | | | | | | |
Hudson County NJ Improvement Authority Hudson County Lease Project (Miscellaneous Revenue, AGM Insured) | | | 7.40 | | | | 12-1-2025 | | | | 1,030,000 | | | | 1,210,611 | |
| | | | | | | | | | | | | | | | |
| | | | |
| North Carolina: 1.03% | | | | | | | | | | | | | | | | |
Duke University Series A (Education Revenue) | | | 5.85 | | | | 4-1-2037 | | | | 300,000 | | | | 384,144 | |
North Carolina Education Assistance Authority Student Loan 2011-1 Series A3 (Education Revenue) | | | 1.78 | | | | 10-25-2041 | | | | 650,000 | | | | 641,797 | |
University of North Carolina Chapel Hill Refunding Bonds Series 2016C (Education Revenue) | | | 3.33 | | | | 12-1-2036 | | | | 150,000 | | | | 146,888 | |
| | | | |
| | | | | | | | | | | | | | | 1,172,829 | |
| | | | | | | | | | | | | | | | |
| | | | |
| Ohio: 0.57% | | | | | | | | | | | | | | | | |
Cuyahoga County OH Build America Bonds Series B (GO Revenue) | | | 6.03 | | | | 12-1-2034 | | | | 325,000 | | | | 391,817 | |
Ohio Veterans Compensation (GO Revenue) | | | 3.38 | | | | 10-1-2021 | | | | 250,000 | | | | 261,330 | |
| | | | |
| | | | | | | | | | | | | | | 653,147 | |
| | | | | | | | | | | | | | | | |
| | | | |
| Oklahoma: 0.34% | | | | | | | | | | | | | | | | |
Oklahoma Water Resource Board Revolving Fund Series A (Water & Sewer Revenue) | | | 3.27 | | | | 4-1-2023 | | | | 375,000 | | | | 391,226 | |
| | | | | | | | | | | | | | | | |
| | | | |
| Texas: 0.97% | | | | | | | | | | | | | | | | |
Clear Creek TX Independent School District Taxable Refunding Series B (GO Revenue) | | | 3.40 | | | | 2-15-2022 | | | | 375,000 | | | | 394,046 | |
Harris County TX Taxable Refunding Permanent Improvement Series B (GO Revenue) | | | 2.12 | | | | 10-1-2021 | | | | 500,000 | | | | 495,625 | |
Texas State A&M University (Education Revenue) | | | 3.11 | | | | 5-15-2028 | | | | 220,000 | | | | 215,054 | |
| | | | |
| | | | | | | | | | | | | | | 1,104,725 | |
| | | | | | | | | | | | | | | | |
| | | | |
| Virginia: 0.20% | | | | | | | | | | | | | | | | |
Virginia State HDA (Housing Revenue) | | | 3.10 | | | | 6-25-2041 | | | | 232,393 | | | | 229,728 | |
| | | | | | | | | | | | | | | | |
| | | | |
| Washington: 0.95% | | | | | | | | | | | | | | | | |
King County WA Economic Development Taxable Bond Series C (GO Revenue) | | | 5.03 | | | | 12-1-2023 | | | | 230,000 | | | | 261,418 | |
King County WA School District #210 (GO Revenue, AGM Insured) | | | 4.90 | | | | 12-1-2022 | | | | 400,000 | | | | 428,264 | |
Washington Build America Bonds (Tax Revenue) | | | 5.09 | | | | 8-1-2033 | | | | 325,000 | | | | 385,011 | |
| | | | |
| | | | | | | | | | | | | | | 1,074,693 | |
| | | | | | | | | | | | | | | | |
| | | | |
| West Virginia: 0.44% | | | | | | | | | | | | | | | | |
Ohio County WV Special District Excise Tax Series A (Tax Revenue) | | | 8.25 | | | | 3-1-2035 | | | | 475,000 | | | | 498,152 | |
| | | | | | | | | | | | | | | | |
| | | | |
| Wisconsin: 0.10% | | | | | | | | | | | | | | | | |
Milwaukee County WI Taxable Pension Promissory Notes Series A (GO Revenue) | | | 6.84 | | | | 12-1-2028 | | | | 90,000 | | | | 112,387 | |
| | | | | | | | | | | | | | | | |
| | | | |
Total Municipal Obligations (Cost $8,666,179) | | | | | | | | | | | | | | | 9,078,804 | |
| | | | | | | | | | | | | | | | |
| | | | |
Non-Agency Mortgage-Backed Securities: 12.85% | | | | | | | | | | | | | | | | |
Commercial Mortgage Pass-Through Certificate Series 2010-C1 Class A3 144A | | | 4.21 | | | | 7-10-2046 | | | | 700,000 | | | | 745,013 | |
Commercial Mortgage Pass-Through Certificate Series 2012-CR2 Class A4 | | | 3.15 | | | | 8-15-2045 | | | | 550,000 | | | | 569,718 | |
Commercial Mortgage Pass-Through Certificate Series 2012-CR3 Class A3 | | | 2.82 | | | | 10-15-2045 | | | | 620,000 | | | | 629,503 | |
Commercial Mortgage Pass-Through Certificate Series 2012-UBS5 Class A3 | | | 3.55 | | | | 9-10-2047 | | | | 630,000 | | | | 659,103 | |
Commercial Mortgage Pass-Through Certificate Series 2013-CR12 Class ASB | | | 3.62 | | | | 10-10-2046 | | | | 550,000 | | | | 579,303 | |
The accompanying notes are an integral part of these financial statements.
| | | | | | |
| Portfolio of investments—November 30, 2016 (unaudited) | | Wells Fargo Allocation Funds | | | 91 | |
MANAGED FIXED INCOME PORTFOLIO
| | | | | | | | | | | | | | | | |
| Security name | | Interest rate | | | Maturity date | | | Principal | | | Value | |
| | | | |
Non-Agency Mortgage-Backed Securities (continued) | | | | | | | | | | | | | | | | |
Commercial Mortgage Pass-Through Certificate Series 2013-CR13 Class A4 ± | | | 4.19 | % | | | 11-10-2023 | | | $ | 600,000 | | | $ | 648,600 | |
Commercial Mortgage Pass-Through Certificate Series 2013-CR7 Class A4 | | | 3.21 | | | | 3-10-2046 | | | | 630,000 | | | | 645,617 | |
Credit Suisse First Boston Commercial Mortgage Trust Series 2004-AR5 Class 10A1 ± | | | 2.98 | | | | 6-25-2034 | | | | 477,094 | | | | 480,236 | |
GS Mortgage Securities Trust Series 2011-GC3 Class A4 144A | | | 4.75 | | | | 3-10-2044 | | | | 492,412 | | | | 533,678 | |
GS Mortgage Securities Trust Series 2011-GC5 Class A4 | | | 3.71 | | | | 8-10-2044 | | | | 545,000 | | | | 577,937 | |
GS Mortgage Securities Trust Series 2012-GCJ7 Class A4 | | | 3.38 | | | | 5-10-2045 | | | | 560,000 | | | | 585,729 | |
GS Mortgage Securities Trust Series 2013-GC10 Class AAB | | | 2.56 | | | | 2-10-2046 | | | | 212,500 | | | | 215,356 | |
GS Mortgage Securities Trust Series 2013-GC12 Class AAB | | | 2.68 | | | | 6-10-2046 | | | | 212,500 | | | | 216,150 | |
GS Mortgage Securities Trust Series 2013-GC14 Class A5 | | | 4.24 | | | | 8-10-2046 | | | | 615,000 | | | | 668,607 | |
GS Mortgage Securities Trust Series 2013-GC16 Class A4 | | | 4.27 | | | | 11-10-2046 | | | | 350,000 | | | | 380,035 | |
JPMorgan Chase Commercial Mortgage Securities Trust Series 2010-C2 Class A3 144A | | | 4.07 | | | | 11-15-2043 | | | | 395,000 | | | | 413,814 | |
JPMorgan Chase Commercial Mortgage Securities Trust Series 2013-C12 Class ASB | | | 3.16 | | | | 7-15-2045 | | | | 550,000 | | | | 569,232 | |
MMAF Equipment Finance LLC Series 2015-AA Class A4 144A | | | 1.93 | | | | 7-16-2021 | | | | 500,000 | | | | 502,071 | |
Morgan Stanley Bank of America Merrill Lynch Trust Series 2014-C15 Class ASB | | | 3.65 | | | | 4-15-2047 | | | | 550,000 | | | | 575,437 | |
Morgan Stanley Capital I Trust Series 2011-C2 Class A4 144A | | | 4.66 | | | | 6-15-2044 | | | | 500,000 | | | | 546,547 | |
Morgan Stanley Capital I Trust Series 2011-C3 Class A4 | | | 4.12 | | | | 7-15-2049 | | | | 530,000 | | | | 572,403 | |
Motel 6 Trust Series 2015-MTL6 Class B 144A | | | 3.30 | | | | 2-5-2030 | | | | 500,000 | | | | 500,171 | |
Nomura Asset Acceptance Corporation Series 2004-R2 Class A1 144A± | | | 6.50 | | | | 10-25-2034 | | | | 927,781 | | | | 926,982 | |
Sequoia Mortgage Trust Series 10 Class 1A ± | | | 1.36 | | | | 10-20-2027 | | | | 241,147 | | | | 234,985 | |
Towd Point Mortgage Trust Series 2016-2 Class A1A 144A± | | | 2.75 | | | | 8-25-2055 | | | | 398,622 | | | | 399,182 | |
Towd Point Mortgage Trust Series 2016-3 Class A1 144A± | | | 2.25 | | | | 8-25-2055 | | | | 578,924 | | | | 575,353 | |
WFRBS Commercial Mortgage Trust Series 2013-C17 Class A4 | | | 4.02 | | | | 12-15-2046 | | | | 630,000 | | | | 672,195 | |
| | | | |
Total Non-Agency Mortgage-Backed Securities (Cost $14,588,079) | | | | | | | | | | | | | | | 14,622,957 | |
| | | | | | | | | | | | | | | | |
| | | | |
U.S. Treasury Securities: 1.82% | | | | | | | | | | | | | | | | |
U.S. Treasury Bond « | | | 2.25 | | | | 8-15-2046 | | | | 1,075,000 | | | | 905,394 | |
U.S. Treasury Bond | | | 2.88 | | | | 11-15-2046 | | | | 1,200,000 | | | | 1,161,000 | |
| | | | |
Total U.S. Treasury Securities (Cost $2,187,971) | | | | | | | | | | | | | | | 2,066,394 | |
| | | | | | | | | | | | | | | | |
| | | | |
Yankee Corporate Bonds and Notes: 5.42% | | | | | | | | | | | | | | | | |
| | | | |
Consumer Discretionary: 0.30% | | | | | | | | | | | | | | | | |
| | | | |
| Media: 0.30% | | | | | | | | | | | | | | | | |
Pearson Dollar Finance Two plc 144A | | | 6.25 | | | | 5-6-2018 | | | | 325,000 | | | | 341,580 | |
| | | | | | | | | | | | | | | | |
| | | | |
Energy: 1.73% | | | | | | | | | | | | | | | | |
| | | | |
| Energy Equipment & Services: 0.36% | | | | | | | | | | | | | | | | |
Schlumberger Norge AS 144A | | | 4.20 | | | | 1-15-2021 | | | | 380,000 | | | | 403,976 | |
| | | | | | | | | | | | | | | | |
| | | | |
| Oil, Gas & Consumable Fuels: 1.37% | | | | | | | | | | | | | | | | |
BP Capital Markets plc | | | 3.81 | | | | 2-10-2024 | | | | 110,000 | | | | 113,626 | |
BP Capital Markets plc | | | 4.50 | | | | 10-1-2020 | | | | 350,000 | | | | 375,578 | |
Petroleos Mexicanos | | | 2.29 | | | | 2-15-2024 | | | | 206,250 | | | | 207,556 | |
Petroleos Mexicanos | | | 2.83 | | | | 2-15-2024 | | | | 431,250 | | | | 442,215 | |
Petroleos Mexicanos | | | 6.38 | | | | 1-23-2045 | | | | 250,000 | | | | 215,000 | |
Total Capital International SA | | | 3.70 | | | | 1-15-2024 | | | | 200,000 | | | | 207,392 | |
| | | | |
| | | | | | | | | | | | | | | 1,561,367 | |
| | | | | | | | | | | | | | | | |
The accompanying notes are an integral part of these financial statements.
| | | | |
| 92 | | Wells Fargo Allocation Funds | | Portfolio of investments—November 30, 2016 (unaudited) |
MANAGED FIXED INCOME PORTFOLIO
| | | | | | | | | | | | | | | | |
| Security name | | Interest rate | | | Maturity date | | | Principal | | | Value | |
| | | | |
Financials: 1.46% | | | | | | | | | | | | | | | | |
| | | | |
| Banks: 0.77% | | | | | | | | | | | | | | | | |
Bank of Nova Scotia | | | 4.50 | % | | | 12-16-2025 | | | $ | 250,000 | | | $ | 253,936 | |
Credit Suisse New York | | | 3.63 | | | | 9-9-2024 | | | | 250,000 | | | | 251,050 | |
HSBC Holdings plc | | | 3.60 | | | | 5-25-2023 | | | | 250,000 | | | | 250,881 | |
Royal Bank of Canada | | | 4.65 | | | | 1-27-2026 | | | | 120,000 | | | | 125,542 | |
| | | | |
| | | | | | | | | | | | | | | 881,409 | |
| | | | | | | | | | | | | | | | |
| | | | |
| Diversified Financial Services: 0.69% | | | | | | | | | | | | | | | | |
Shell International Finance BV | | | 3.25 | | | | 5-11-2025 | | | | 200,000 | | | | 199,185 | |
Shell International Finance BV | | | 3.40 | | | | 8-12-2023 | | | | 370,000 | | | | 376,760 | |
Tyco Electronics Group SA | | | 3.50 | | | | 2-3-2022 | | | | 200,000 | | | | 206,215 | |
| | | | |
| | | | | | | | | | | | | | | 782,160 | |
| | | | | | | | | | | | | | | | |
| | | | |
Health Care: 0.32% | | | | | | | | | | | | | | | | |
| | | | |
| Pharmaceuticals: 0.32% | | | | | | | | | | | | | | | | |
Actavis Funding SCS | | | 4.55 | | | | 3-15-2035 | | | | 230,000 | | | | 225,353 | |
Teva Pharmaceutical Finance BV | | | 2.20 | | | | 7-21-2021 | | | | 150,000 | | | | 143,994 | |
| | | | |
| | | | | | | | | | | | | | | 369,347 | |
| | | | | | | | | | | | | | | | |
| | | | |
Industrials: 0.57% | | | | | | | | | | | | | | | | |
| | | | |
| Aerospace & Defense: 0.44% | | | | | | | | | | | | | | | | |
BAE Systems plc 144A | | | 4.75 | | | | 10-11-2021 | | | | 470,000 | | | | 505,984 | |
| | | | | | | | | | | | | | | | |
| | | | |
| Road & Rail: 0.13% | | | | | | | | | | | | | | | | |
Canadian Pacific Railway Company | | | 2.90 | | | | 2-1-2025 | | | | 150,000 | | | | 146,523 | |
| | | | | | | | | | | | | | | | |
| | | | |
Information Technology: 0.70% | | | | | | | | | | | | | | | | |
| | | | |
| Semiconductors & Semiconductor Equipment: 0.34% | | | | | | | | | | | | | | | | |
TSMC Global Limited 144A | | | 1.63 | | | | 4-3-2018 | | | | 380,000 | | | | 378,732 | |
| | | | | | | | | | | | | | | | |
| | | | |
| Technology Hardware, Storage & Peripherals: 0.36% | | | | | | | | | | | | | | | | |
Seagate HDD | | | 4.75 | | | | 6-1-2023 | | | | 425,000 | | | | 412,781 | |
| | | | | | | | | | | | | | | | |
| | | | |
Telecommunication Services: 0.34% | | | | | | | | | | | | | | | | |
| | | | |
| Wireless Telecommunication Services: 0.34% | | | | | | | | | | | | | | | | |
Rogers Communications Incorporated | | | 4.10 | | | | 10-1-2023 | | | | 370,000 | | | | 388,944 | |
| | | | | | | | | | | | | | | | |
| | | | |
Total Yankee Corporate Bonds and Notes (Cost $6,070,414) | | | | | | | | | | | | | | | 6,172,803 | |
| | | | | | | | | | | | | | | | |
| | | | |
| | | Yield | | | | | | Shares | | | | |
| Short-Term Investments: 4.06% | | | | | | | | | | | | | | | | |
| | | | |
| Investment Companies: 4.06% | | | | | | | | | | | | | | | | |
Securities Lending Cash Investment LLC (l)(r)(u) | | | 0.65 | | | | | | | | 1,699,678 | | | | 1,699,848 | |
Wells Fargo Government Money Market Fund Select Class (l)(u) | | | 0.31 | | | | | | | | 2,919,104 | | | | 2,919,104 | |
| | | | |
Total Short-Term Investments (Cost $4,618,936) | | | | | | | | | | | | | | | 4,618,952 | |
| | | | | | | | | | | | | | | | |
| | | | | | | | |
| Total investments in securities (Cost $112,845,635) * | | | 100.60 | % | | | 114,462,207 | |
Other assets and liabilities, net | | | (0.60 | ) | | | (680,614 | ) |
| | | | | | | | |
| Total net assets | | | 100.00 | % | | $ | 113,781,593 | |
| | | | | | | | |
The accompanying notes are an integral part of these financial statements.
| | | | | | |
| Portfolio of investments—November 30, 2016 (unaudited) | | Wells Fargo Allocation Funds | | | 93 | |
MANAGED FIXED INCOME PORTFOLIO
| ± | Variable rate investment. The rate shown is the rate in effect at period end. |
| 144A | The security may be resold in transactions exempt from registration, normally to qualified institutional buyers, pursuant to Rule 144A under the Securities Act of 1933. |
| « | All or a portion of this security is on loan. |
| (l) | The issuer of the security is an affiliated person of the Portfolio as defined in the Investment Company Act of 1940. |
| (r) | The investment is a non-registered investment vehicle purchased with cash collateral received from securities on loan. |
| (u) | The rate represents the 7-day annualized yield at period end. |
| * | Cost for federal income tax purposes is $112,924,557 and unrealized gains (losses) consists of: |
| | | | |
Gross unrealized gains | | $ | 2,988,290 | |
Gross unrealized losses | | | (1,450,640 | ) |
| | | | |
Net unrealized gains | | $ | 1,537,650 | |
The accompanying notes are an integral part of these financial statements.
| | | | |
| 94 | | Wells Fargo Allocation Funds | | Portfolio of investments—November 30, 2016 (unaudited) |
REAL RETURN PORTFOLIO
| | | | | | | | | | | | | | | | |
| Security name | | | | | | | | Shares | | | Value | |
| | | | | | | | | | | | | | | | |
| | | | |
Common Stocks: 14.12% | | | | | | | | | | | | | | | | |
| | | | |
Consumer Staples: 3.47% | | | | | | | | | | | | | | | | |
| | | | |
| Beverages: 0.28% | | | | | | | | | | | | | | | | |
The Coca-Cola Company | | | | | | | | | | | 5,100 | | | $ | 205,785 | |
| | | | | | | | | | | | | | | | |
| | | | |
| Food & Staples Retailing: 0.67% | | | | | | | | | | | | | | | | |
The Kroger Company | | | | | | | | | | | 5,132 | | | | 165,764 | |
Wal-Mart Stores Incorporated | | | | | | | | | | | 1,718 | | | | 120,999 | |
Walgreens Boots Alliance Incorporated | | | | | | | | | | | 2,326 | | | | 197,082 | |
| | | | |
| | | | | | | | | | | | | | | 483,845 | |
| | | | | | | | | | | | | | | | |
| | | | |
| Food Products: 1.09% | | | | | | | | | | | | | | | | |
Biostime International Holdings Limited Ǡ | | | | | | | | | | | 79,000 | | | | 258,190 | |
JBS SA | | | | | | | | | | | 52,100 | | | | 150,351 | |
Marine Harvest ASA | | | | | | | | | | | 4,555 | | | | 81,912 | |
Mead Johnson Nutrition Company | | | | | | | | | | | 1,122 | | | | 80,885 | |
Mondelez International Incorporated Class A | | | | | | | | | | | 2,537 | | | | 104,626 | |
The Hershey Company | | | | | | | | | | | 476 | | | | 46,001 | |
The Kraft Heinz Company | | | | | | | | | | | 889 | | | | 72,587 | |
| | | | |
| | | | | | | | | | | | | | | 794,552 | |
| | | | | | | | | | | | | | | | |
| | | | |
| Household Products: 1.11% | | | | | | | | | | | | | | | | |
Church & Dwight Company Incorporated | | | | | | | | | | | 2,528 | | | | 110,701 | |
Reckitt Benckiser Group plc | | | | | | | | | | | 4,626 | | | | 391,446 | |
The Clorox Company | | | | | | | | | | | 502 | | | | 58,011 | |
The Procter & Gamble Company | | | | | | | | | | | 3,032 | | | | 250,019 | |
| | | | |
| | | | | | | | | | | | | | | 810,177 | |
| | | | | | | | | | | | | | | | |
| | | | |
| Personal Products: 0.08% | | | | | | | | | | | | | | | | |
The Estee Lauder Companies Incorporated Class A | | | | | | | | | | | 771 | | | | 59,907 | |
| | | | | | | | | | | | | | | | |
| | | | |
| Tobacco: 0.24% | | | | | | | | | | | | | | | | |
Philip Morris International | | | | | | | | | | | 1,965 | | | | 173,470 | |
| | | | | | | | | | | | | | | | |
| | | | |
Energy: 3.70% | | | | | | | | | | | | | | | | |
| | | | |
| Energy Equipment & Services: 0.60% | | | | | | | | | | | | | | | | |
AMEC Foster Wheeler plc | | | | | | | | | | | 27,787 | | | | 151,584 | |
Halliburton Company | | | | | | | | | | | 3,763 | | | | 199,778 | |
Schlumberger Limited | | | | | | | | | | | 1,073 | | | | 90,186 | |
| | | | |
| | | | | | | | | | | | | | | 441,548 | |
| | | | | | | | | | | | | | | | |
| | | | |
| Oil, Gas & Consumable Fuels: 3.10% | | | | | | | | | | | | | | | | |
Anadarko Petroleum Corporation | | | | | | | | | | | 2,011 | | | | 139,061 | |
BP plc | | | | | | | | | | | 106,870 | | | | 614,357 | |
Chevron Corporation | | | | | | | | | | | 3,127 | | | | 348,848 | |
Cimarex Energy Company | | | | | | | | | | | 1,073 | | | | 147,945 | |
Eni SpA | | | | | | | | | | | 32,056 | | | | 446,425 | |
EOG Resources Incorporated | | | | | | | | | | | 1,815 | | | | 186,074 | |
Occidental Petroleum Corporation | | | | | | | | | | | 2,104 | | | | 150,141 | |
Phillips 66 Company | | | | | | | | | | | 1,119 | | | | 92,967 | |
Pioneer Natural Resources Company | | | | | | | | | | | 699 | | | | 133,537 | |
| | | | |
| | | | | | | | | | | | | | | 2,259,355 | |
| | | | | | | | | | | | | | | | |
The accompanying notes are an integral part of these financial statements.
| | | | | | |
| Portfolio of investments—November 30, 2016 (unaudited) | | Wells Fargo Allocation Funds | | | 95 | |
REAL RETURN PORTFOLIO
| | | | | | | | | | | | | | | | |
| Security name | | | | | | | | Shares | | | Value | |
| | | | | | | | | | | | | | | | |
| | | | |
Materials: 3.66% | | | | | | | | | | | | | | | | |
| | | | |
| Chemicals: 0.78% | | | | | | | | | | | | | | | | |
Axalta Coating Systems Limited † | | | | | | | | | | | 1,809 | | | $ | 47,794 | |
Dow Chemical Company | | | | | | | | | | | 2,028 | | | | 113,000 | |
Ecolab Incorporated | | | | | | | | | | | 506 | | | | 59,065 | |
International Flavors & Fragrances Incorporated | | | | | | | | | | | 493 | | | | 59,678 | |
LyondellBasell Industries NV Class A | | | | | | | | | | | 1,018 | | | | 91,946 | |
PolyOne Corporation | | | | | | | | | | | 1,895 | | | | 62,478 | |
PPG Industries Incorporated | | | | | | | | | | | 788 | | | | 75,593 | |
Praxair Incorporated | | | | | | | | | | | 500 | | | | 60,150 | |
| | | | |
| | | | | | | | | | | | | | | 569,704 | |
| | | | | | | | | | | | | | | | |
| | | | |
| Construction Materials: 0.09% | | | | | | | | | | | | | | | | |
Martin Marietta Materials Incorporated | | | | | | | | | | | 309 | | | | 67,810 | |
| | | | | | | | | | | | | | | | |
| | | | |
| Containers & Packaging: 0.10% | | | | | | | | | | | | | | | | |
Crown Holdings Incorporated † | | | | | | | | | | | 1,375 | | | | 74,786 | |
| | | | | | | | | | | | | | | | |
| | | | |
| Metals & Mining: 2.69% | | | | | | | | | | | | | | | | |
Agnico-Eagle Mines Limited-U.S. Exchange Traded Shares | | | | | | | | | | | 3,600 | | | | 147,780 | |
Barrick Gold Corporation | | | | | | | | | | | 5,000 | | | | 75,100 | |
Detour Gold Corporation † | | | | | | | | | | | 9,800 | | | | 124,898 | |
Fresnillo plc | | | | | | | | | | | 6,800 | | | | 102,098 | |
Goldcorp Incorporated-U.S. Exchange Traded Shares | | | | | | | | | | | 5,171 | | | | 68,205 | |
Kinross Gold Corporation † | | | | | | | | | | | 20,000 | | | | 66,106 | |
Lundin Mining Corporation † | | | | | | | | | | | 53,049 | | | | 260,249 | |
Newmont Mining Corporation | | | | | | | | | | | 7,600 | | | | 246,544 | |
Randgold Resources Limited ADR | | | | | | | | | | | 3,050 | | | | 219,234 | |
Royal Gold Incorporated | | | | | | | | | | | 3,759 | | | | 261,777 | |
Silver Wheaton Corporation-U.S. Exchange Traded Shares | | | | | | | | | | | 10,000 | | | | 182,300 | |
Steel Dynamics Incorporated | | | | | | | | | | | 1,981 | | | | 70,286 | |
Tahoe Resources Incorporated | | | | | | | | | | | 14,000 | | | | 134,549 | |
| | | | |
| | | | | | | | | | | | | | | 1,959,126 | |
| | | | | | | | | | | | | | | | |
| | | | |
Real Estate: 3.29% | | | | | | | | | | | | | | | | |
| | | | |
| Equity REITs: 3.29% | | | | | | | | | | | | | | | | |
American Homes 4 Rent Class A | | | | | | | | | | | 3,633 | | | | 76,547 | |
American Tower Corporation | | | | | | | | | | | 2,796 | | | | 285,947 | |
AvalonBay Communities Incorporated | | | | | | | | | | | 1,195 | | | | 196,566 | |
Boston Properties Incorporated | | | | | | | | | | | 1,885 | | | | 233,514 | |
Camden Property Trust | | | | | | | | | | | 1,746 | | | | 137,428 | |
Equinix Incorporated | | | | | | | | | | | 439 | | | | 148,716 | |
Essex Property Trust Incorporated | | | | | | | | | | | 472 | | | | 101,914 | |
General Growth Properties Incorporated | | | | | | | | | | | 6,912 | | | | 175,150 | |
Hersha Hospitality Trust | | | | | | | | | | | 1,971 | | | | 39,755 | |
Host Hotels & Resorts Incorporated | | | | | | | | | | | 6,076 | | | | 108,396 | |
Mid-America Apartment Communities Incorporated | | | | | | | | | | | 679 | | | | 62,217 | |
Physicians Realty Trust | | | | | | | | | | | 12,345 | | | | 223,691 | |
Prologis Incorporated | | | | | | | | | | | 3,416 | | | | 173,874 | |
Public Storage Incorporated | | | | | | | | | | | 568 | | | | 118,882 | |
The accompanying notes are an integral part of these financial statements.
| | | | |
| 96 | | Wells Fargo Allocation Funds | | Portfolio of investments—November 30, 2016 (unaudited) |
REAL RETURN PORTFOLIO
| | | | | | | | | | | | | | | | |
| Security name | | | | | | | | Shares | | | Value | |
| | | | | | | | | | | | | | | | |
| | | | |
| Equity REITs (continued) | | | | | | | | | | | | | | | | |
Simon Property Group Incorporated | | | | | | | | | | | 1,018 | | | $ | 182,884 | |
Ventas Incorporated | | | | | | | | | | | 2,228 | | | | 134,616 | |
| | | | |
| | | | | | | | | | | | | | | 2,400,097 | |
| | | | | | | | | | | | | | | | |
| | | | |
Total Common Stocks (Cost $9,929,361) | | | | | | | | | | | | | | | 10,300,162 | |
| | | | | | | | | | | | | | | | |
| | | Interest rate | | | Maturity date | | | Principal | | | | |
| | | | |
Corporate Bonds and Notes: 10.01% | | | | | | | | | | | | | | | | |
| | | | |
Consumer Discretionary: 3.32% | | | | | | | | | | | | | | | | |
| | | | |
| Auto Components: 0.33% | | | | | | | | | | | | | | | | |
American Axle & Manufacturing Incorporated « | | | 6.25 | % | | | 3-15-2021 | | | $ | 100,000 | | | | 102,000 | |
American Axle & Manufacturing Incorporated | | | 7.75 | | | | 11-15-2019 | | | | 25,000 | | | | 27,688 | |
Cooper Tire & Rubber Company (i) | | | 8.00 | | | | 12-15-2019 | | | | 20,000 | | | | 22,250 | |
Goodyear Tire & Rubber Company | | | 7.00 | | | | 5-15-2022 | | | | 85,000 | | | | 89,144 | |
| | | | |
| | | | | | | | | | | | | | | 241,082 | |
| | | | | | | | | | | | | | | | |
| | | | |
| Diversified Consumer Services: 0.14% | | | | | | | | | | | | | | | | |
Service Corporation International | | | 5.38 | | | | 1-15-2022 | | | | 100,000 | | | | 103,500 | |
| | | | | | | | | | | | | | | | |
| | | | |
| Hotels, Restaurants & Leisure: 0.58% | | | | | | | | | | | | | | | | |
GLP Capital LP/GLP Financing II Incorporated | | | 4.88 | | | | 11-1-2020 | | | | 75,000 | | | | 78,750 | |
Hilton Worldwide Finance LLC | | | 5.63 | | | | 10-15-2021 | | | | 100,000 | | | | 103,248 | |
MGM Resorts International | | | 8.63 | | | | 2-1-2019 | | | | 100,000 | | | | 111,000 | |
NCL Corporation Limited 144A | | | 5.25 | | | | 11-15-2019 | | | | 125,000 | | | | 126,875 | |
| | | | |
| | | | | | | | | | | | | | | 419,873 | |
| | | | | | | | | | | | | | | | |
| | | | |
| Household Durables: 0.35% | | | | | | | | | | | | | | | | |
CalAtlantic Group Incorporated | | | 6.63 | | | | 5-1-2020 | | | | 15,000 | | | | 16,463 | |
DR Horton Incorporated | | | 3.63 | | | | 2-15-2018 | | | | 135,000 | | | | 136,688 | |
Lennar Corporation | | | 4.50 | | | | 6-15-2019 | | | | 100,000 | | | | 103,000 | |
| | | | |
| | | | | | | | | | | | | | | 256,151 | |
| | | | | | | | | | | | | | | | |
| | | | |
| Media: 1.17% | | | | | | | | | | | | | | | | |
CCO Holdings LLC | | | 6.63 | | | | 1-31-2022 | | | | 125,000 | | | | 129,844 | |
CSC Holdings LLC | | | 7.63 | | | | 7-15-2018 | | | | 75,000 | | | | 79,500 | |
DISH DBS Corporation | | | 4.25 | | | | 4-1-2018 | | | | 130,000 | | | | 132,600 | |
DISH DBS Corporation | | | 7.88 | | | | 9-1-2019 | | | | 25,000 | | | | 27,688 | |
LIN Television Corporation | | | 6.38 | | | | 1-15-2021 | | | | 40,000 | | | | 41,400 | |
Mediacom LLC/Mediacom Capital Corporation | | | 7.25 | | | | 2-15-2022 | | | | 70,000 | | | | 72,450 | |
National CineMedia LLC | | | 6.00 | | | | 4-15-2022 | | | | 100,000 | | | | 103,000 | |
Nexstar Broadcasting Group Incorporated | | | 6.88 | | | | 11-15-2020 | | | | 75,000 | | | | 77,250 | |
Sinclair Television Group Incorporated | | | 6.13 | | | | 10-1-2022 | | | | 100,000 | | | | 103,750 | |
TEGNA Incorporated | | | 5.13 | | | | 10-15-2019 | | | | 50,000 | | | | 51,267 | |
TEGNA Incorporated | | | 5.13 | | | | 7-15-2020 | | | | 30,000 | | | | 30,975 | |
| | | | |
| | | | | | | | | | | | | | | 849,724 | |
| | | | | | | | | | | | | | | | |
| | | | |
| Multiline Retail: 0.14% | | | | | | | | | | | | | | | | |
Dollar Tree Incorporated | | | 5.25 | | | | 3-1-2020 | | | | 100,000 | | | | 103,250 | |
| | | | | | | | | | | | | | | | |
The accompanying notes are an integral part of these financial statements.
| | | | | | |
| Portfolio of investments—November 30, 2016 (unaudited) | | Wells Fargo Allocation Funds | | | 97 | |
REAL RETURN PORTFOLIO
| | | | | | | | | | | | | | | | |
| Security name | | Interest rate | | | Maturity date | | | Principal | | | Value | |
| | | | |
| Specialty Retail: 0.36% | | | | | | | | | | | | | | | | |
Best Buy Company Incorporated | | | 5.00 | % | | | 8-1-2018 | | | $ | 100,000 | | | $ | 104,795 | |
International Game Technology | | | 7.50 | | | | 6-15-2019 | | | | 50,000 | | | | 54,625 | |
Sally Beauty Holdings Incorporated | | | 5.75 | | | | 6-1-2022 | | | | 100,000 | | | | 103,625 | |
| | | | |
| | | | | | | | | | | | | | | 263,045 | |
| | | | | | | | | | | | | | | | |
| | | | |
| Textiles, Apparel & Luxury Goods: 0.25% | | | | | | | | | | | | | | | | |
Levi Strauss & Company | | | 6.88 | | | | 5-1-2022 | | | | 75,000 | | | | 78,750 | |
The William Carter Company | | | 5.25 | | | | 8-15-2021 | | | | 100,000 | | | | 103,600 | |
| | | | |
| | | | | | | | | | | | | | | 182,350 | |
| | | | | | | | | | | | | | | | |
| | | | |
Consumer Staples: 0.70% | | | | | | | | | | | | | | | | |
| | | | |
| Beverages: 0.14% | | | | | | | | | | | | | | | | |
Cott Beverages Incorporated | | | 6.75 | | | | 1-1-2020 | | | | 100,000 | | | | 103,500 | |
| | | | | | | | | | | | | | | | |
| | | | |
| Food Products: 0.56% | | | | | | | | | | | | | | | | |
B&G Foods Incorporated | | | 4.63 | | | | 6-1-2021 | | | | 85,000 | | | | 86,700 | |
Pinnacle Foods Incorporated | | | 4.88 | | | | 5-1-2021 | | | | 100,000 | | | | 102,250 | |
Post Holdings Incorporated 144A | | | 6.75 | | | | 12-1-2021 | | | | 90,000 | | | | 95,850 | |
Smithfield Foods Incorporated | | | 7.75 | | | | 7-1-2017 | | | | 120,000 | | | | 123,660 | |
| | | | |
| | | | | | | | | | | | | | | 408,460 | |
| | | | | | | | | | | | | | | | |
| | | | |
Energy: 0.74% | | | | | | | | | | | | | | | | |
| | | | |
| Energy Equipment & Services: 0.17% | | | | | | | | | | | | | | | | |
NGPL PipeCo LLC 144A | | | 7.12 | | | | 12-15-2017 | | | | 120,000 | | | | 124,500 | |
| | | | | | | | | | | | | | | | |
| | | | |
| Oil, Gas & Consumable Fuels: 0.57% | | | | | | | | | | | | | | | | |
Crestwood Midstream Partners LP | | | 6.00 | | | | 12-15-2020 | | | | 30,000 | | | | 30,525 | |
Kinder Morgan Incorporated | | | 7.00 | | | | 6-15-2017 | | | | 60,000 | | | | 61,592 | |
Rockies Express Pipeline LLC 144A | | | 6.00 | | | | 1-15-2019 | | | | 125,000 | | | | 130,000 | |
Sabine Pass Liquefaction LLC | | | 5.63 | | | | 2-1-2021 | | | | 60,000 | | | | 63,750 | |
Tesoro Corporation | | | 4.25 | | | | 10-1-2017 | | | | 65,000 | | | | 66,056 | |
Tesoro Logistics LP | | | 5.88 | | | | 10-1-2020 | | | | 65,000 | | | | 67,106 | |
| | | | |
| | | | | | | | | | | | | | | 419,029 | |
| | | | | | | | | | | | | | | | |
| | | | |
Financials: 1.01% | | | | | | | | | | | | | | | | |
| | | | |
| Banks: 0.22% | | | | | | | | | | | | | | | | |
CIT Group Incorporated | | | 4.25 | | | | 8-15-2017 | | | | 105,000 | | | | 106,604 | |
CIT Group Incorporated | | | 5.25 | | | | 3-15-2018 | | | | 25,000 | | | | 25,856 | |
CIT Group Incorporated 144A | | | 5.50 | | | | 2-15-2019 | | | | 25,000 | | | | 26,391 | |
| | | | |
| | | | | | | | | | | | | | | 158,851 | |
| | | | | | | | | | | | | | | | |
| | | | |
| Consumer Finance: 0.79% | | | | | | | | | | | | | | | | |
Ally Financial Incorporated | | | 3.75 | | | | 11-18-2019 | | | | 65,000 | | | | 65,073 | |
Ally Financial Incorporated | | | 6.25 | | | | 12-1-2017 | | | | 60,000 | | | | 62,100 | |
Diamond 1 Finance Corporation 144A | | | 3.48 | | | | 6-1-2019 | | | | 40,000 | | | | 40,763 | |
General Motors Financial Company Incorporated | | | 3.25 | | | | 5-15-2018 | | | | 135,000 | | | | 136,331 | |
Navient Corporation | | | 4.63 | | | | 9-25-2017 | | | | 130,000 | | | | 131,950 | |
Toll Brothers Finance Corporation | | | 4.00 | | | | 12-31-2018 | | | | 135,000 | | | | 138,796 | |
| | | | |
| | | | | | | | | | | | | | | 575,013 | |
| | | | | | | | | | | | | | | | |
The accompanying notes are an integral part of these financial statements.
| | | | |
| 98 | | Wells Fargo Allocation Funds | | Portfolio of investments—November 30, 2016 (unaudited) |
REAL RETURN PORTFOLIO
| | | | | | | | | | | | | | | | |
| Security name | | Interest rate | | | Maturity date | | | Principal | | | Value | |
| | | | |
Health Care: 0.83% | | | | | | | | | | | | | | | | |
| | | | |
| Health Care Providers & Services: 0.79% | | | | | | | | | | | | | | | | |
Centene Corporation | | | 5.63 | % | | | 2-15-2021 | | | $ | 115,000 | | | $ | 118,450 | |
Fresenius Medical Care Holdings Incorporated | | | 6.88 | | | | 7-15-2017 | | | | 125,000 | | | | 128,125 | |
HCA Incorporated | | | 8.00 | | | | 10-1-2018 | | | | 115,000 | | | | 124,775 | |
MPT Operating Partnership LP | | | 6.38 | | | | 2-15-2022 | | | | 100,000 | | | | 102,625 | |
Tenet Healthcare Corporation | | | 6.25 | | | | 11-1-2018 | | | | 100,000 | | | | 104,250 | |
| | | | |
| | | | | | | | | | | | | | | 578,225 | |
| | | | | | | | | | | | | | | | |
| | | | |
| Life Sciences Tools & Services: 0.04% | | | | | | | | | | | | | | | | |
inVentiv Health Incorporated 144A | | | 9.00 | | | | 1-15-2018 | | | | 30,000 | | | | 30,227 | |
| | | | | | | | | | | | | | | | |
| | | | |
Industrials: 1.13% | | | | | | | | | | | | | | | | |
| | | | |
| Aerospace & Defense: 0.06% | | | | | | | | | | | | | | | | |
Huntington Ingalls Industries Incorporated 144A | | | 5.00 | | | | 12-15-2021 | | | | 40,000 | | | | 41,600 | |
| | | | | | | | | | | | | | | | |
| | | | |
| Airlines: 0.28% | | | | | | | | | | | | | | | | |
American Airlines Group Incorporated | | | 6.13 | | | | 6-1-2018 | | | | 100,000 | | | | 103,375 | |
United Continental Holdings Incorporated | | | 6.38 | | | | 6-1-2018 | | | | 100,000 | | | | 103,500 | |
| | | | |
| | | | | | | | | | | | | | | 206,875 | |
| | | | | | | | | | | | | | | | |
| | | | |
| Building Products: 0.12% | | | | | | | | | | | | | | | | |
USG Corporation | | | 9.75 | | | | 1-15-2018 | | | | 80,000 | | | | 84,400 | |
| | | | | | | | | | | | | | | | |
| | | | |
| Commercial Services & Supplies: 0.29% | | | | | | | | | | | | | | | | |
ACCO Brands Corporation | | | 6.75 | | | | 4-30-2020 | | | | 105,000 | | | | 109,988 | |
Clean Harbors Incorporated | | | 5.13 | | | | 6-1-2021 | | | | 100,000 | | | | 102,250 | |
| | | | |
| | | | | | | | | | | | | | | 212,238 | |
| | | | | | | | | | | | | | | | |
| | | | |
| Machinery: 0.09% | | | | | | | | | | | | | | | | |
Case New Holland Industrial Incorporated | | | 7.88 | | | | 12-1-2017 | | | | 65,000 | | | | 68,501 | |
| | | | | | | | | | | | | | | | |
| | | | |
| Trading Companies & Distributors: 0.29% | | | | | | | | | | | | | | | | |
Aircastle Limited | | | 4.63 | | | | 12-15-2018 | | | | 100,000 | | | | 104,375 | |
Ashtead Capital Incorporated 144A | | | 6.50 | | | | 7-15-2022 | | | | 100,000 | | | | 104,625 | |
| | | | |
| | | | | | | | | | | | | | | 209,000 | |
| | | | | | | | | | | | | | | | |
| | | | |
Information Technology: 0.42% | | | | | | | | | | | | | | | | |
| | | | |
| Communications Equipment: 0.08% | | | | | | | | | | | | | | | | |
ViaSat Incorporated | | | 6.88 | | | | 6-15-2020 | | | | 55,000 | | | | 56,753 | |
| | | | | | | | | | | | | | | | |
| | | | |
| Electronic Equipment, Instruments & Components: 0.11% | | | | | | | | | | | | | | | | |
Jabil Circuit Incorporated | | | 8.25 | | | | 3-15-2018 | | | | 75,000 | | | | 80,614 | |
| | | | | | | | | | | | | | | | |
| | | | |
| Internet Software & Services: 0.15% | | | | | | | | | | | | | | | | |
IAC/InterActiveCorp | | | 4.88 | | | | 11-30-2018 | | | | 109,000 | | | | 110,635 | |
| | | | | | | | | | | | | | | | |
| | | | |
| Technology Hardware, Storage & Peripherals: 0.08% | | | | | | | | | | | | | | | | |
EMC Corporation | | | 1.88 | | | | 6-1-2018 | | | | 60,000 | | | | 59,119 | |
| | | | | | | | | | | | | | | | |
The accompanying notes are an integral part of these financial statements.
| | | | | | |
| Portfolio of investments—November 30, 2016 (unaudited) | | Wells Fargo Allocation Funds | | | 99 | |
REAL RETURN PORTFOLIO
| | | | | | | | | | | | | | | | |
| Security name | | Interest rate | | | Maturity date | | | Principal | | | Value | |
| | | | |
Materials: 0.57% | | | | | | | | | | | | | | | | |
| | | | |
| Chemicals: 0.11% | | | | | | | | | | | | | | | | |
Ashland Incorporated | | | 3.88 | % | | | 4-15-2018 | | | $ | 80,000 | | | $ | 81,600 | |
| | | | | | | | | | | | | | | | |
| | | | |
| Containers & Packaging: 0.30% | | | | | | | | | | | | | | | | |
Owens-Illinois Incorporated | | | 7.80 | | | | 5-15-2018 | | | | 120,000 | | | | 128,400 | |
Reynolds Group Holdings | | | 5.75 | | | | 10-15-2020 | | | | 85,000 | | | | 87,444 | |
| | | | |
| | | | | | | | | | | | | | | 215,844 | |
| | | | | | | | | | | | | | | | |
| | | | |
| Metals & Mining: 0.16% | | | | | | | | | | | | | | | | |
Alcoa Incorporated | | | 6.75 | | | | 7-15-2018 | | | | 60,000 | | | | 63,825 | |
Steel Dynamics Incorporated | | | 6.13 | | | | 8-15-2019 | | | | 50,000 | | | | 51,700 | |
| | | | |
| | | | | | | | | | | | | | | 115,525 | |
| | | | | | | | | | | | | | | | |
| | | | |
Real Estate: 0.60% | | | | | | | | | | | | | | | | |
| | | | |
| Equity REITs: 0.44% | | | | | | | | | | | | | | | | |
ARC Properties Operating Partnership LP | | | 3.00 | | | | 2-6-2019 | | | | 100,000 | | | | 99,780 | |
Equinix Incorporated | | | 5.38 | | | | 1-1-2022 | | | | 100,000 | | | | 104,250 | |
Iron Mountain Incorporated 144A | | | 6.00 | | | | 10-1-2020 | | | | 100,000 | | | | 105,250 | |
VEREIT Operating Partnership LP | | | 4.13 | | | | 6-1-2021 | | | | 10,000 | | | | 10,250 | |
| | | | |
| | | | | | | | | | | | | | | 319,530 | |
| | | | | | | | | | | | | | | | |
| | | | |
| Real Estate Management & Development: 0.16% | | | | | | | | | | | | | | | | |
KB Home | | | 4.75 | | | | 5-15-2019 | | | | 60,000 | | | | 60,750 | |
Taylor Morrison Communities Incorporated 144A | | | 5.25 | | | | 4-15-2021 | | | | 60,000 | | | | 61,350 | |
| | | | |
| | | | | | | | | | | | | | | 122,100 | |
| | | | | | | | | | | | | | | | |
| | | | |
Telecommunication Services: 0.69% | | | | | | | | | | | | | | | | |
| | | | |
| Diversified Telecommunication Services: 0.35% | | | | | | | | | | | | | | | | |
CenturyLink Incorporated | | | 5.63 | | | | 4-1-2020 | | | | 90,000 | | | | 93,713 | |
Frontier Communications Corporation | | | 8.13 | | | | 10-1-2018 | | | | 75,000 | | | | 79,973 | |
Hughes Satellite Systems Corporation | | | 6.50 | | | | 6-15-2019 | | | | 75,000 | | | | 80,625 | |
| | | | |
| | | | | | | | | | | | | | | 254,311 | |
| | | | | | | | | | | | | | | | |
| | | | |
| Wireless Telecommunication Services: 0.34% | | | | | | | | | | | | | | | | |
Sprint Communications Incorporated 144A | | | 9.00 | | | | 11-15-2018 | | | | 130,000 | | | | 142,675 | |
T-Mobile USA Incorporated | | | 6.25 | | | | 4-1-2021 | | | | 5,000 | | | | 5,213 | |
T-Mobile USA Incorporated | | | 6.46 | | | | 4-28-2019 | | | | 100,000 | | | | 101,625 | |
| | | | |
| | | | | | | | | | | | | | | 249,513 | |
| | | | | | | | | | | | | | | | |
| | | | |
Total Corporate Bonds and Notes (Cost $7,319,812) | | | | | | | | | | | | | | | 7,304,938 | |
| | | | | | | | | | | | | | | | |
| | | | |
Loans: 3.24% | | | | | | | | | | | | | | | | |
| | | | |
Consumer Discretionary: 0.46% | | | | | | | | | | | | | | | | |
| | | | |
| Auto Components: 0.08% | | | | | | | | | | | | | | | | |
Allison Transmission Incorporated ± | | | 3.25 | | | | 9-23-2022 | | | | 56,713 | | | | 57,188 | |
| | | | | | | | | | | | | | | | |
The accompanying notes are an integral part of these financial statements.
| | | | |
| 100 | | Wells Fargo Allocation Funds | | Portfolio of investments—November 30, 2016 (unaudited) |
REAL RETURN PORTFOLIO
| | | | | | | | | | | | | | | | |
| Security name | | Interest rate | | | Maturity date | | | Principal | | | Value | |
| | | | |
| Household Products: 0.18% | | | | | | | | | | | | | | | | |
Michaels Stores Incorporated ± | | | 3.75 | % | | | 1-27-2023 | | | $ | 132,238 | | | $ | 133,148 | |
| | | | | | | | | | | | | | | | |
| | | | |
| Internet & Direct Marketing Retail: 0.08% | | | | | | | | | | | | | | | | |
Ancestry.com Incorporated ± | | | 5.25 | | | | 10-19-2023 | �� | | | 55,000 | | | | 55,092 | |
| | | | | | | | | | | | | | | | |
| | | | |
| Media: 0.12% | | | | | | | | | | | | | | | | |
Virgin Media Investment Holdings Limited ± | | | 3.50 | | | | 6-30-2023 | | | | 90,898 | | | | 91,381 | |
| | | | | | | | | | | | | | | | |
| | | | |
Financials: 0.18% | | | | | | | | | | | | | | | | |
| | | | |
| Diversified Financial Services: 0.18% | | | | | | | | | | | | | | | | |
Delos Finance SARL ± | | | 3.59 | | | | 3-6-2021 | | | | 135,000 | | | | 135,748 | |
| | | | | | | | | | | | | | | | |
| | | | |
Health Care: 0.27% | | | | | | | | | | | | | | | | |
| | | | |
| Health Care Equipment & Supplies: 0.11% | | | | | | | | | | | | | | | | |
Prestige Brands Incorporated ± | | | 3.50 | | | | 9-3-2021 | | | | 83,048 | | | | 83,549 | |
| | | | | | | | | | | | | | | | |
| | | | |
| Health Care Providers & Services: 0.16% | | | | | | | | | | | | | | | | |
Community Health Systems Incorporated ± | | | 4.16 | | | | 12-31-2018 | | | | 118,263 | | | | 114,473 | |
| | | | | | | | | | | | | | | | |
| | | | |
Industrials: 0.85% | | | | | | | | | | | | | | | | |
| | | | |
| Aerospace & Defense: 0.16% | | | | | | | | | | | | | | | | |
TransDigm Incorporated ± | | | 3.82 | | | | 2-28-2020 | | | | 117,909 | | | | 118,137 | |
| | | | | | | | | | | | | | | | |
| | | | |
| Airlines: 0.19% | | | | | | | | | | | | | | | | |
Delta Air Lines Incorporated ± | | | 3.25 | | | | 8-24-2022 | | | | 133,650 | | | | 134,628 | |
| | | | | | | | | | | | | | | | |
| | | | |
| Commercial Services & Supplies: 0.50% | | | | | | | | | | | | | | | | |
Huntsman International LLC ±%%< | | | 0.00 | | | | 4-1-2023 | | | | 100,000 | | | | 100,438 | |
KAR Auction Services Incorporated ± | | | 4.06 | | | | 3-9-2021 | | | | 131,865 | | | | 132,579 | |
ServiceMaster Company ± | | | 3.11 | | | | 11-3-2023 | | | | 135,000 | | | | 134,691 | |
| | | | |
| | | | | | | | | | | | | | | 367,708 | |
| | | | | | | | | | | | | | | | |
| | | | |
Information Technology: 0.45% | | | | | | | | | | | | | | | | |
| | | | |
| Internet Software & Services: 0.09% | | | | | | | | | | | | | | | | |
Zayo Group LLC ± | | | 3.75 | | | | 5-6-2021 | | | | 62,460 | | | | 62,633 | |
| | | | | | | | | | | | | | | | |
| | | | |
| IT Services: 0.13% | | | | | | | | | | | | | | | | |
First Data Corporation ± | | | 4.33 | | | | 7-8-2022 | | | | 93,295 | | | | 93,697 | |
| | | | | | | | | | | | | | | | |
| | | | |
| Semiconductors & Semiconductor Equipment: 0.23% | | | | | | | | | | | | | | | | |
Avago Technologies ± | | | 3.54 | | | | 2-1-2023 | | | | 97,397 | | | | 98,290 | |
Micron Technology Incorporated ±%%< | | | 4.36 | | | | 4-26-2022 | | | | 20,000 | | | | 20,211 | |
NXP Semiconductors NV ± | | | 3.41 | | | | 12-7-2020 | | | | 53,320 | | | | 53,462 | |
| | | | |
| | | | | | | | | | | | | | | 171,963 | |
| | | | | | | | | | | | | | | | |
| | | | |
Materials: 0.54% | | | | | | | | | | | | | | | | |
| | | | |
| Chemicals: 0.18% | | | | | | | | | | | | | | | | |
Ineos US Finance LLC ± | | | 3.75 | | | | 12-15-2020 | | | | 132,301 | | | | 132,538 | |
| | | | | | | | | | | | | | | | |
The accompanying notes are an integral part of these financial statements.
| | | | | | |
| Portfolio of investments—November 30, 2016 (unaudited) | | Wells Fargo Allocation Funds | | | 101 | |
REAL RETURN PORTFOLIO
| | | | | | | | | | | | | | | | |
| Security name | | Interest rate | | | Maturity date | | | Principal | | | Value | |
| | | | |
| Containers & Packaging: 0.22% | | | | | | | | | | | | | | | | |
Berry Plastics Group Incorporated ± | | | 3.50 | % | | | 2-8-2020 | | | $ | 132,259 | | | $ | 132,604 | |
Reynolds Group Holdings Incorporated ± | | | 4.25 | | | | 2-5-2023 | | | | 30,000 | | | | 30,146 | |
| | | | |
| | | | | | | | | | | | | | | 162,750 | |
| | | | | | | | | | | | | | | | |
| | | | |
| Metals & Mining: 0.14% | | | | | | | | | | | | | | | | |
Novelis Incorporated ± | | | 4.00 | | | | 6-2-2022 | | | | 99,747 | | | | 99,919 | |
| | | | | | | | | | | | | | | | |
| | | | |
Real Estate: 0.16% | | | | | | | | | | | | | | | | |
| | | | |
| Equity REITs: 0.16% | | | | | | | | | | | | | | | | |
MGM Growth Properties LLC ± | | | 3.50 | | | | 4-25-2023 | | | | 114,712 | | | | 115,190 | |
| | | | | | | | | | | | | | | | |
| | | | |
Telecommunication Services: 0.19% | | | | | | | | | | | | | | | | |
| | | | |
| Diversified Telecommunication Services: 0.19% | | | | | | | | | | | | | | | | |
Level 3 Financing Incorporated ± | | | 3.50 | | | | 5-31-2022 | | | | 135,000 | | | | 135,929 | |
| | | | | | | | | | | | | | | | |
| | | | |
Utilities: 0.14% | | | | | | | | | | | | | | | | |
| | | | |
| Independent Power & Renewable Electricity Producers: 0.14% | | | | | | | | | | | | | | | | |
Calpine Corporation ± | | | 3.59 | | | | 5-27-2022 | | | | 99,747 | | | | 99,922 | |
| | | | | | | | | | | | | | | | |
| | | | |
Total Loans (Cost $2,357,822) | | | | | | | | | | | | | | | 2,365,593 | |
| | | | | | | | | | | | | | | | |
|
U.S. Treasury Securities: 66.55% | |
TIPS | | | 0.13 | | | | 4-15-2018 | | | | 287,194 | | | | 289,086 | |
TIPS | | | 0.13 | | | | 4-15-2019 | | | | 1,586,585 | | | | 1,602,435 | |
TIPS | | | 0.13 | | | | 4-15-2020 | | | | 3,901,843 | | | | 3,934,934 | |
TIPS | | | 0.13 | | | | 4-15-2021 | | | | 2,368,175 | | | | 2,378,536 | |
TIPS | | | 0.13 | | | | 1-15-2022 | | | | 1,557,236 | | | | 1,559,109 | |
TIPS | | | 0.13 | | | | 7-15-2022 | | | | 2,314,743 | | | | 2,320,798 | |
TIPS | | | 0.13 | | | | 1-15-2023 | | | | 1,762,291 | | | | 1,749,389 | |
TIPS | | | 0.13 | | | | 7-15-2024 | | | | 1,911,377 | | | | 1,878,607 | |
TIPS | | | 0.13 | | | | 7-15-2026 | | | | 1,641,606 | | | | 1,593,198 | |
TIPS | | | 0.25 | | | | 1-15-2025 | | | | 1,946,729 | | | | 1,916,458 | |
TIPS | | | 0.38 | | | | 7-15-2023 | | | | 2,251,050 | | | | 2,272,891 | |
TIPS | | | 0.38 | | | | 7-15-2025 | | | | 1,837,472 | | | | 1,830,464 | |
TIPS | | | 0.63 | | | | 7-15-2021 | | | | 1,435,274 | | | | 1,480,930 | |
TIPS | | | 0.63 | | | | 1-15-2024 | | | | 1,774,373 | | | | 1,807,183 | |
TIPS | | | 0.63 | | | | 1-15-2026 | | | | 2,809,185 | | | | 2,844,356 | |
TIPS | | | 0.63 | | | | 2-15-2043 | | | | 577,506 | | | | 535,493 | |
TIPS | | | 0.75 | | | | 2-15-2042 | | | | 860,038 | | | | 823,317 | |
TIPS | | | 0.75 | | | | 2-15-2045 | | | | 1,189,197 | | | | 1,131,609 | |
TIPS | | | 1.00 | | | | 2-15-2046 | | | | 916,956 | | | | 934,203 | |
TIPS | | | 1.13 | | | | 1-15-2021 | | | | 1,710,534 | | | | 1,791,377 | |
TIPS | | | 1.25 | | | | 7-15-2020 | | | | 1,284,062 | | | | 1,354,132 | |
TIPS | | | 1.38 | | | | 7-15-2018 | | | | 576,543 | | | | 597,203 | |
TIPS | | | 1.38 | | | | 1-15-2020 | | | | 1,172,178 | | | | 1,230,701 | |
TIPS | | | 1.38 | | | | 2-15-2044 | | | | 895,993 | | | | 988,252 | |
TIPS | | | 1.63 | | | | 1-15-2018 | | | | 316,891 | | | | 324,836 | |
TIPS | | | 1.75 | | | | 1-15-2028 | | | | 685,636 | | | | 769,370 | |
TIPS | | | 1.88 | | | | 7-15-2019 | | | | 531,391 | | | | 565,060 | |
The accompanying notes are an integral part of these financial statements.
| | | | |
| 102 | | Wells Fargo Allocation Funds | | Portfolio of investments—November 30, 2016 (unaudited) |
REAL RETURN PORTFOLIO
| | | | | | | | | | | | | | | | |
| Security name | | Interest rate | | | Maturity date | | | Principal | | | Value | |
| | | | |
U.S. Treasury Securities (continued) | | | | | | | | | | | | | | | | |
TIPS | | | 2.00 | % | | | 1-15-2026 | | | $ | 729,780 | | | $ | 825,417 | |
TIPS | | | 2.13 | | | | 1-15-2019 | | | | 466,626 | | | | 492,619 | |
TIPS | | | 2.13 | | | | 2-15-2040 | | | | 390,919 | | | | 488,940 | |
TIPS | | | 2.13 | | | | 2-15-2041 | | | | 567,721 | | | | 714,627 | |
TIPS | | | 2.38 | | | | 1-15-2025 | | | | 1,165,446 | | | | 1,342,108 | |
TIPS | | | 2.38 | | | | 1-15-2027 | | | | 658,394 | | | | 775,250 | |
TIPS | | | 2.50 | | | | 1-15-2029 | | | | 669,018 | | | | 811,363 | |
TIPS | | | 2.63 | | | | 7-15-2017 | | | | 58,239 | | | | 59,639 | |
TIPS | | | 3.38 | | | | 4-15-2032 | | | | 204,008 | | | | 283,980 | |
TIPS | | | 3.63 | | | | 4-15-2028 | | | | 1,052,262 | | | | 1,391,475 | |
TIPS | | | 3.88 | | | | 4-15-2029 | | | | 631,446 | | | | 868,806 | |
| | | | |
Total U.S. Treasury Securities (Cost $47,673,223) | | | | | | | | | | | | | | | 48,558,151 | |
| | | | | | | | | | | | | | | | |
|
Yankee Corporate Bonds and Notes: 0.93% | |
|
Consumer Discretionary: 0.14% | |
|
| Automobiles: 0.14% | |
Jaguar Land Rover Automotive plc 144A | | | 4.13 | | | | 12-15-2018 | | | | 100,000 | | | | 102,000 | |
| | | | | | | | | | | | | | | | |
|
Consumer Staples: 0.14% | |
|
| Food & Staples Retailing: 0.14% | |
Tesco plc 144A | | | 5.50 | | | | 11-15-2017 | | | | 100,000 | | | | 102,878 | |
| | | | | | | | | | | | | | | | |
|
Financials: 0.23% | |
|
| Banks: 0.23% | |
Nielsen Holding and Finance BV 144A | | | 5.50 | | | | 10-1-2021 | | | | 80,000 | | | | 83,200 | |
Royal Bank of Scotland Group plc | | | 4.70 | | | | 7-3-2018 | | | | 80,000 | | | | 81,428 | |
| | | | |
| | | | | | | | | | | | | | | 164,628 | |
| | | | | | | | | | | | | | | | |
| | | | |
Health Care: 0.14% | | | | | | | | | | | | | | | | |
| | | | |
| Pharmaceuticals: 0.14% | | | | | | | | | | | | | | | | |
Mallinckrodt International Finance SA | | | 3.50 | | | | 4-15-2018 | | | | 100,000 | | | | 99,500 | |
| | | | | | | | | | | | | | | | |
| | | | |
Information Technology: 0.14% | | | | | | | | | | | | | | | | |
| | | | |
| Communications Equipment: 0.14% | | | | | | | | | | | | | | | | |
Nokia Corporation | | | 5.38 | | | | 5-15-2019 | | | | 100,000 | | | | 104,750 | |
| | | | | | | | | | | | | | | | |
| | | | |
Materials: 0.14% | | | | | | | | | | | | | | | | |
| | | | |
| Containers & Packaging: 0.14% | | | | | | | | | | | | | | | | |
Ardagh Packaging Finance plc 144A± | | | 3.85 | | | | 12-15-2019 | | | | 100,000 | | | | 101,743 | |
| | | | | | | | | | | | | | | | |
| | | | |
Total Yankee Corporate Bonds and Notes (Cost $671,391) | | | | | | | | | | | | | | | 675,499 | |
| | | | | | | | | | | | | | | | |
| | | | |
| | | Yield | | | | | | Shares | | | | |
| Short-Term Investments: 5.78% | | | | | | | | | | | | | | | | |
| | | | |
| Investment Companies: 5.71% | | | | | | | | | | | | | | | | |
Securities Lending Cash Investment LLC (l)(r)(u) | | | 0.65 | | | | | | | | 371,298 | | | | 371,335 | |
Wells Fargo Government Money Market Fund Select Class (l)(u)## | | | 0.31 | | | | | | | | 3,792,921 | | | | 3,792,921 | |
| | | | |
| | | | | | | | | | | | | | | 4,164,256 | |
| | | | | | | | | | | | | | | | |
The accompanying notes are an integral part of these financial statements.
| | | | | | |
| Portfolio of investments—November 30, 2016 (unaudited) | | Wells Fargo Allocation Funds | | | 103 | |
REAL RETURN PORTFOLIO
| | | | | | | | | | | | | | | | |
| Security name | | Yield | | | Maturity date | | | Principal | | | Value | |
| U.S. Treasury Securities: 0.07% | | | | | | | | | | | | | | | | |
U.S. Treasury Bill (z)# | | | 0.32 | % | | | 12-15-2016 | | | $ | 50,000 | | | $ | 49,997 | |
| | | | | | | | | | | | | | | | |
| | | | |
Total Short-Term Investments (Cost $4,214,228) | | | | | | | | | | | | | | | 4,214,253 | |
| | | | | | | | | | | | | | | | |
| | | | | | | | |
| Total investments in securities (Cost $72,165,837) * | | | 100.63 | % | | | 73,418,596 | |
Other assets and liabilities, net | | | (0.63 | ) | | | (458,627 | ) |
| | | | | | | | |
| Total net assets | | | 100.00 | % | | $ | 72,959,969 | |
| | | | | | | | |
| « | All or a portion of this security is on loan. |
| † | Non-income-earning security |
| 144A | The security may be resold in transactions exempt from registration, normally to qualified institutional buyers, pursuant to Rule 144A under the Securities Act of 1933. |
| ± | Variable rate investment. The rate shown is the rate in effect at period end. |
| %% | The security is issued on a when-issued basis. |
| < | All or a portion of the position represents an unfunded loan commitment. |
| (l) | The issuer of the security is an affiliated person of the Portfolio as defined in the Investment Company Act of 1940. |
| (r) | The investment is a non-registered investment vehicle purchased with cash collateral received from securities on loan. |
| (u) | The rate represents the 7-day annualized yield at period end. |
| ## | All or a portion of this security is segregated for unfunded loans. |
| (z) | Zero coupon security. The rate represents the current yield to maturity. |
| # | All or a portion of this security is segregated as collateral for investments in derivative instruments. |
| * | Cost for federal income tax purposes is $72,130,823 and unrealized gains (losses) consists of: |
| | | | |
Gross unrealized gains | | $ | 2,188,040 | |
Gross unrealized losses | | | (900,267 | ) |
| | | | |
Net unrealized gains | | $ | 1,287,773 | |
The accompanying notes are an integral part of these financial statements.
| | | | |
| 104 | | Wells Fargo Allocation Funds | | Portfolio of investments—November 30, 2016 (unaudited) |
STABLE INCOME PORTFOLIO
| | | | | | | | | | | | | | | | |
| Security name | | Interest rate | | | Maturity date | | | Principal | | | Value | |
| | | | |
Agency Securities: 22.66% | | | | | | | | | | | | | | | | |
FHLMC | | | 6.00 | % | | | 7-1-2017 | | | $ | 2,728 | | | $ | 2,742 | |
FHLMC | | | 7.50 | | | | 7-17-2017 | | | | 3,618 | | | | 3,642 | |
FHLMC Series T-54 Class 4A ± | | | 3.27 | | | | 2-25-2043 | | | | 387,680 | | | | 398,255 | |
FHLMC Series T-57 Class 1A2 | | | 7.00 | | | | 7-25-2043 | | | | 493,840 | | | | 578,000 | |
FHLMC Series T-63 Class 1A1 ± | | | 1.71 | | | | 2-25-2045 | | | | 332,937 | | | | 331,019 | |
FHLMC Structured Pass-Through Securities Series T-54 Class 3A | | | 7.00 | | | | 2-25-2043 | | | | 353,234 | | | | 409,371 | |
FHLMC Structured Pass-Through Securities Series T-55 Class 1A2 | | | 7.00 | | | | 3-25-2043 | | | | 533,764 | | | | 587,614 | |
FHLMC Structured Pass-Through Securities Series T-58 Class 4A | | | 7.50 | | | | 9-25-2043 | | | | 600,146 | | | | 695,026 | |
FNMA ± | | | 1.72 | | | | 10-1-2034 | | | | 191,915 | | | | 195,629 | |
FNMA ± | | | 1.72 | | | | 4-1-2044 | | | | 138,508 | | | | 141,179 | |
FNMA ± | | | 1.72 | | | | 10-1-2044 | | | | 176,549 | | | | 180,554 | |
FNMA ± | | | 1.94 | | | | 4-1-2034 | | | | 260,604 | | | | 274,577 | |
FNMA ± | | | 2.22 | | | | 4-1-2037 | | | | 211,265 | | | | 216,027 | |
FNMA ± | | | 2.22 | | | | 9-1-2033 | | | | 113,408 | | | | 117,949 | |
FNMA ± | | | 2.23 | | | | 10-1-2033 | | | | 272,464 | | | | 283,449 | |
FNMA ± | | | 2.38 | | | | 1-1-2036 | | | | 145,481 | | | | 152,649 | |
FNMA ± | | | 2.43 | | | | 6-1-2033 | | | | 252,486 | | | | 265,728 | |
FNMA ± | | | 2.56 | | | | 12-1-2033 | | | | 245,344 | | | | 257,598 | |
FNMA ± | | | 2.71 | | | | 8-1-2035 | | | | 235,744 | | | | 247,699 | |
FNMA ± | | | 2.83 | | | | 6-1-2033 | | | | 195,835 | | | | 201,369 | |
FNMA ± | | | 2.84 | | | | 7-1-2035 | | | | 138,841 | | | | 146,541 | |
FNMA | | | 5.50 | | | | 2-1-2017 | | | | 2,660 | | | | 2,664 | |
FNMA Series 2003-W4 Class 3A ± | | | 6.25 | | | | 10-25-2042 | | | | 229,227 | | | | 257,367 | |
FNMA Series 2004-W2 Class 2A2 | | | 7.00 | | | | 2-25-2044 | | | | 155,935 | | | | 179,665 | |
FNMA Series 2007-88 Class HC ± | | | 2.85 | | | | 9-25-2037 | | | | 169,049 | | | | 178,108 | |
| | | | |
Total Agency Securities (Cost $5,937,227) | | | | | | | | | | | | | | | 6,304,421 | |
| | | | | | | | | | | | | | | | |
| | | | |
Asset-Backed Securities: 29.75% | | | | | | | | | | | | | | | | |
Ally Auto Receivables Trust Series 2015-1 Class A2 | | | 0.92 | | | | 2-15-2018 | | | | 24,177 | | | | 24,171 | |
Ally Auto Receivables Trust Series 2016-1 Class A2A | | | 1.20 | | | | 8-15-2018 | | | | 77,320 | | | | 77,372 | |
Ally Auto Receivables Trust Series 2016-2 Class A2 | | | 1.17 | | | | 10-15-2018 | | | | 106,418 | | | | 106,456 | |
Ally Auto Receivables Trust Series 2016-3 Class A2 | | | 1.19 | | | | 12-17-2018 | | | | 150,000 | | | | 150,061 | |
American Express Credit Account Master Trust Series 2014-4 Class A | | | 1.43 | | | | 6-15-2020 | | | | 130,000 | | | | 130,268 | |
AmeriCredit Automobile Receivables Trust Series 2014-1 Class A3 | | | 0.90 | | | | 2-8-2019 | | | | 16,884 | | | | 16,878 | |
AmeriCredit Automobile Receivables Trust Series 2014-4 Class A3 | | | 1.27 | | | | 7-8-2019 | | | | 95,419 | | | | 95,412 | |
AmeriCredit Automobile Receivables Trust Series 2015-2 Class A3 | | | 1.27 | | | | 1-8-2020 | | | | 135,000 | | | | 134,996 | |
AmeriCredit Automobile Receivables Trust Series 2016-1 Class A2 ± | | | 1.29 | | | | 6-10-2019 | | | | 93,538 | | | | 93,696 | |
AmeriCredit Automobile Receivables Trust Series 2016-2 Class A2A | | | 1.42 | | | | 10-8-2019 | | | | 127,143 | | | | 127,263 | |
AmeriCredit Automobile Receivables Trust Series 2016-3 Class A2A | | | 1.37 | | | | 11-8-2019 | | | | 155,000 | | | | 154,994 | |
Bank of the West Auto Trust Series 2014-1 Class A3 144A | | | 1.09 | | | | 3-15-2019 | | | | 63,056 | | | | 63,053 | |
Bank of the West Auto Trust Series 2015-1 Class A2 144A± | | | 0.89 | | | | 4-16-2018 | | | | 11,739 | | | | 11,740 | |
BMW Vehicle Owner Trust Series 2016 Class A2a | | | 0.99 | | | | 5-25-2019 | | | | 155,000 | | | | 154,809 | |
Capital Auto Receivables Asset Trust Series 2014-2 Class A4 | | | 1.62 | | | | 10-22-2018 | | | | 150,000 | | | | 150,235 | |
Capital Auto Receivables Asset Trust Series 2015-1 Class A2 | | | 1.42 | | | | 6-20-2018 | | | | 82,888 | | | | 82,913 | |
Capital Auto Receivables Asset Trust Series 2015-2 Class A1B ± | | | 0.96 | | | | 10-20-2017 | | | | 24,064 | | | | 24,069 | |
Capital Auto Receivables Asset Trust Series 2016-1 Class A2B ± | | | 1.26 | | | | 11-20-2018 | | | | 58,726 | | | | 58,850 | |
Capital Auto Receivables Asset Trust Series 2016-2 Class A2A | | | 1.32 | | | | 1-22-2019 | | | | 200,000 | | | | 200,073 | |
Capital Auto Receivables Asset Trust Series 2016-3 Class A2A | | | 1.36 | | | | 4-22-2019 | | | | 150,000 | | | | 149,997 | |
Capital One Multi-Asset Execution Trust Series 2014-A2 Class A2 | | | 1.26 | | | | 1-15-2020 | | | | 100,000 | | | | 100,061 | |
The accompanying notes are an integral part of these financial statements.
| | | | | | |
| Portfolio of investments—November 30, 2016 (unaudited) | | Wells Fargo Allocation Funds | | | 105 | |
STABLE INCOME PORTFOLIO
| | | | | | | | | | | | | | | | |
| Security name | | Interest rate | | | Maturity date | | | Principal | | | Value | |
| | | | |
Asset-Backed Securities (continued) | | | | | | | | | | | | | | | | |
CarMax Auto Owner Trust Series 2014-1 Class A3 | | | 0.79 | % | | | 10-15-2018 | | | $ | 30,643 | | | $ | 30,621 | |
CarMax Auto Owner Trust Series 2015-1 Class A3 | | | 1.38 | | | | 11-15-2019 | | | | 127,671 | | | | 127,779 | |
CarMax Auto Owner Trust Series 2015-3 Class A2B ± | | | 0.99 | | | | 11-15-2018 | | | | 57,591 | | | | 57,641 | |
CarMax Auto Owner Trust Series 2016-1 Class A2 | | | 1.30 | | | | 4-15-2019 | | | | 104,913 | | | | 104,952 | |
CarMax Auto Owner Trust Series 2016-2 Class A2A | | | 1.24 | | | | 6-17-2019 | | | | 146,145 | | | | 146,186 | |
Chase Issuance Trust Series 2014 Class A6 | | | 1.26 | | | | 7-15-2019 | | | | 120,000 | | | | 120,128 | |
CNH Equipment Trust Series 2014-Class A3 | | | 0.84 | | | | 5-15-2019 | | | | 35,137 | | | | 35,118 | |
CNH Equipment Trust Series 2014-B Class A3 | | | 0.91 | | | | 5-15-2019 | | | | 57,459 | | | | 57,425 | |
CNH Equipment Trust Series 2015 Class A2B ± | | | 1.01 | | | | 12-17-2018 | | | | 63,567 | | | | 63,638 | |
CNH Equipment Trust Series 2016-B Class A2A | | | 1.31 | | | | 10-15-2019 | | | | 150,000 | | | | 150,025 | |
College Loan Corporation Trust Series 2004-1 Class A4 ± | | | 1.07 | | | | 4-25-2024 | | | | 27,541 | | | | 27,461 | |
Dell Equipment Finance Trust Series 2015-1 Class A2 144A | | | 1.01 | | | | 7-24-2017 | | | | 12,397 | | | | 12,395 | |
Dell Equipment Finance Trust Series 2016-1 Class A2 144A | | | 1.43 | | | | 9-24-2018 | | | | 150,000 | | | | 150,039 | |
Fifth Third Auto Trust Series 2014-1 Class A3 | | | 0.68 | | | | 4-16-2018 | | | | 5,901 | | | | 5,899 | |
Fifth Third Auto Trust Series 2014-2 Class A3 | | | 0.89 | | | | 11-15-2018 | | | | 46,416 | | | | 46,394 | |
Ford Credit Auto Owner Trust Series 2014-A Class A3 | | | 0.79 | | | | 5-15-2018 | | | | 25,639 | | | | 25,631 | |
Ford Credit Auto Owner Trust Series 2014-B Class A3 | | | 0.90 | | | | 10-15-2018 | | | | 42,926 | | | | 42,906 | |
Ford Credit Auto Owner Trust Series 2014-C Class A3 | | | 1.06 | | | | 5-15-2019 | | | | 166,810 | | | | 166,771 | |
Ford Credit Auto Owner Trust Series 2016-A Class A2 ± | | | 0.94 | | | | 12-15-2018 | | | | 97,452 | | | | 97,567 | |
Ford Credit Auto Owner Trust Series 2016-B Class A2A | | | 1.08 | | | | 3-15-2019 | | | | 145,592 | | | | 145,585 | |
GM Financial Automobile Lease Series 2016-1A Class A2 | | | 1.30 | | | | 7-20-2018 | | | | 120,440 | | | | 120,470 | |
GM Financial Automobile Lease Series 2016-2 Class A2A | | | 1.28 | | | | 10-22-2018 | | | | 160,000 | | | | 159,973 | |
GSAMP Trust Series 2005 A2 Class A1 144A± | | | 0.93 | | | | 1-25-2045 | | | | 102,887 | | | | 102,058 | |
Honda Auto Receivables Owner Trust Series 2014-1 Class A3 | | | 0.67 | | | | 11-21-2017 | | | | 12,481 | | | | 12,477 | |
Honda Auto Receivables Owner Trust Series 2014-4 Class A3 | | | 0.99 | | | | 9-17-2018 | | | | 57,205 | | | | 57,172 | |
Honda Auto Receivables Owner Trust Series 2015-3 Class A2 | | | 0.92 | | | | 11-20-2017 | | | | 37,622 | | | | 37,615 | |
Honda Auto Receivables Owner Trust Series 2016-2 Class A2 | | | 1.13 | | | | 9-17-2018 | | | | 150,000 | | | | 150,005 | |
Honda Auto Receivables Owner Trust Series 2016-3 Class A2 | | | 1.01 | | | | 10-18-2018 | | | | 150,000 | | | | 149,905 | |
Huntington Auto Trust 2016 1 A2 | | | 1.38 | | | | 5-15-2019 | | | | 140,000 | | | | 139,994 | |
Hyundai Auto Lease Securitization Trust Series 2015-A Class A3 144A | | | 1.42 | | | | 9-17-2018 | | | | 130,000 | | | | 130,143 | |
Hyundai Auto Lease Securitization Trust Series 2015-B Class A3 144A | | | 1.40 | | | | 11-15-2018 | | | | 140,000 | | | | 140,174 | |
Hyundai Auto Lease Securitization Trust Series 2016-A Class A2 144A | | | 1.33 | | | | 7-16-2018 | | | | 129,391 | | | | 129,484 | |
Hyundai Auto Lease Securitization Trust Series 2016-B
Class A2A 144A | | | 1.24 | | | | 11-15-2018 | | | | 150,000 | | | | 149,993 | |
Hyundai Auto Receivables Trust Series 2014-A Class A3 | | | 0.79 | | | | 7-16-2018 | | | | 20,407 | | | | 20,398 | |
Hyundai Auto Receivables Trust Series 2015-A Class A3 | | | 1.05 | | | | 4-15-2019 | | | | 100,610 | | | | 100,562 | |
Hyundai Auto Receivables Trust Series 2016-A Class A2 | | | 1.21 | | | | 6-17-2019 | | | | 122,276 | | | | 122,340 | |
John Deere Owner Trust Series 2014-A Class A3 | | | 0.92 | | | | 4-16-2018 | | | | 32,342 | | | | 32,327 | |
John Deere Owner Trust Series 2015-A Class A3 | | | 1.32 | | | | 6-17-2019 | | | | 130,000 | | | | 130,088 | |
John Deere Owner Trust Series 2016-B Class A2 | | | 1.09 | | | | 2-15-2019 | | | | 150,000 | | | | 149,840 | |
Kubota Credit Owner Trust Series 2016-1A Class A2 144A | | | 1.25 | | | | 4-15-2019 | | | | 155,000 | | | | 154,836 | |
Mercedes Benz Auto Lease Trust Series 2015-A Class A3 | | | 1.10 | | | | 8-15-2017 | | | | 20,956 | | | | 20,957 | |
Mercedes Benz Auto Lease Trust Series 2016-A Class A2A | | | 1.34 | | | | 7-16-2018 | | | | 66,749 | | | | 66,812 | |
Mercedes Benz Auto Receivables Trust Series 2015-1 Class A2B ± | | | 0.81 | | | | 6-15-2018 | | | | 43,273 | | | | 43,289 | |
Mercedes Benz Auto Receivables Trust Series 2016-1 Class A2a | | | 1.11 | | | | 3-15-2019 | | | | 150,000 | | | | 149,974 | |
MMAF Equipment Finance LLC Series 2016-AA Class A2 144A | | | 1.39 | | | | 12-17-2018 | | | | 150,000 | | | | 150,068 | |
Nissan Auto Lease Trust Series 2016-A Class A2A | | | 1.22 | | | | 8-15-2018 | | | | 150,000 | | | | 150,031 | |
Nissan Auto Receivables Owner Trust Series 2014-A Class A3 | | | 0.72 | | | | 8-15-2018 | | | | 25,947 | | | | 25,927 | |
Nissan Auto Receivables Owner Trust Series 2014-B Class A3 | | | 1.11 | | | | 5-15-2019 | | | | 91,665 | | | | 91,662 | |
Nissan Auto Receivables Owner Trust Series 2015-A Class A3 | | | 1.05 | | | | 10-15-2019 | | | | 122,541 | | | | 122,416 | |
Nissan Auto Receivables Owner Trust Series 2015-B Class A2B ± | | | 0.82 | | | | 7-16-2018 | | | | 53,907 | | | | 53,945 | |
The accompanying notes are an integral part of these financial statements.
| | | | |
| 106 | | Wells Fargo Allocation Funds | | Portfolio of investments—November 30, 2016 (unaudited) |
STABLE INCOME PORTFOLIO
| | | | | | | | | | | | | | | | |
| Security name | | Interest rate | | | Maturity date | | | Principal | | | Value | |
| | | | |
Asset-Backed Securities (continued) | | | | | | | | | | | | | | | | |
Nissan Auto Receivables Owner Trust Series 2016-C Class A2A | | | 1.07 | % | | | 5-15-2019 | | | $ | 160,000 | | | $ | 159,749 | |
Santander Drive Auto Receivables Trust Series 2015-4 Class A2B ± | | | 1.24 | | | | 12-17-2018 | | | | 15,842 | | | | 15,848 | |
Santander Drive Auto Receivables Trust Series 2016-2 Class A2A | | | 1.38 | | | | 7-15-2019 | | | | 125,378 | | | | 125,509 | |
SunTrust Auto Receivables Trust Series 2015-1A Class A2 144A | | | 0.99 | | | | 6-15-2018 | | | | 19,006 | | | | 19,005 | |
Toyota Auto Receivables Owner Trust Series 2014-A Class A3 | | | 0.67 | | | | 12-15-2017 | | | | 16,336 | | | | 16,329 | |
Toyota Auto Receivables Owner Trust Series 2014-B Class A3 | | | 0.76 | | | | 3-15-2018 | | | | 33,861 | | | | 33,842 | |
Toyota Auto Receivables Owner Trust Series 2015-B Class A2B ± | | | 0.75 | | | | 11-15-2017 | | | | 22,443 | | | | 22,445 | |
Toyota Auto Receivables Owner Trust Series 2015-C Class A2B ± | | | 0.87 | | | | 2-15-2018 | | | | 39,595 | | | | 39,610 | |
Toyota Auto Receivables Owner Trust Series 2016-B Class A2A | | | 1.02 | | | | 10-15-2018 | | | | 180,000 | | | | 179,906 | |
Toyota Auto Receivables Owner Trust Series 2016-C Class A2A | | | 1.00 | | | | 1-15-2019 | | | | 155,000 | | | | 154,850 | |
Volkswagen Auto Lease Trust Series 2015-A Class A3 | | | 1.25 | | | | 12-20-2017 | | | | 130,000 | | | | 129,956 | |
Volvo Financial Equipment LLC Series 2014-1A Class A3 144A | | | 0.82 | | | | 4-16-2018 | | | | 28,785 | | | | 28,758 | |
Volvo Financial Equipment LLC Series 2015-1A Class A3 144A | | | 1.51 | | | | 6-17-2019 | | | | 150,000 | | | | 150,269 | |
World Omni Auto Receivables Trust Series 2015-B | | | 0.96 | | | | 7-15-2019 | | | | 71,325 | | | | 71,282 | |
World Omni Auto Receivables Trust Series 2016-B Class A2 | | | 1.10 | | | | 1-15-2020 | | | | 190,000 | | | | 189,659 | |
World Omni Automobile Lease Securitization Trust Series 2016-A Class A2A | | | 1.20 | | | | 2-15-2019 | | | | 155,000 | | | | 154,830 | |
| |
Total Asset-Backed Securities (Cost $8,277.870) | | | | 8,278,310 | |
| | | | | | | | | | | | | | | | |
|
Corporate Bonds and Notes: 29.46% | |
|
Consumer Discretionary: 0.84% | |
| | | | |
| Hotels, Restaurants & Leisure: 0.26% | | | | | | | | | | | | | | | | |
McDonald’s Corporation | | | 5.80 | | | | 10-15-2017 | | | | 70,000 | | | | 72,592 | |
| | | | | | | | | | | | | | | | |
| | | | |
| Specialty Retail: 0.58% | | | | | | | | | | | | | | | | |
Lowe’s Companies Incorporated | | | 1.63 | | | | 4-15-2017 | | | | 160,000 | | | | 160,192 | |
| | | | | | | | | | | | | | | | |
| | | | |
Consumer Staples: 2.23% | | | | | | | | | | | | | | | | |
| | | | |
| Beverages: 1.19% | | | | | | | | | | | | | | | | |
Anheuser-Busch InBev NV Companies Incorporated | | | 1.38 | | | | 7-15-2017 | | | | 140,000 | | | | 140,084 | |
Brown Forman Corporation | | | 1.00 | | | | 1-15-2018 | | | | 100,000 | | | | 99,567 | |
PepsiCo Incorporated ± | | | 1.13 | | | | 7-17-2017 | | | | 90,000 | | | | 90,117 | |
| | | | |
| | | | | | | | | | | | | | | 329,768 | |
| | | | | | | | | | | | | | | | |
| | | | |
| Food Products: 1.04% | | | | | | | | | | | | | | | | |
Cargill Incorporated 144A | | | 1.90 | | | | 3-1-2017 | | | | 114,000 | | | | 114,271 | |
General Mills Incorporated | | | 5.70 | | | | 2-15-2017 | | | | 85,000 | | | | 85,779 | |
Kraft Heinz Foods Company | | | 1.60 | | | | 6-30-2017 | | | | 90,000 | | | | 90,095 | |
| | | | |
| | | | | | | | | | | | | | | 290,145 | |
| | | | | | | | | | | | | | | | |
| | | | |
Energy: 1.52% | | | | | | | | | | | | | | | | |
| | | | |
| Oil, Gas & Consumable Fuels: 1.52% | | | | | | | | | | | | | | | | |
Chevron Corporation ± | | | 1.02 | | | | 2-22-2017 | | | | 110,000 | | | | 110,016 | |
Chevron Corporation | | | 1.34 | | | | 11-9-2017 | | | | 30,000 | | | | 30,028 | |
Chevron Corporation ± | | | 1.41 | | | | 5-16-2018 | | | | 60,000 | | | | 60,252 | |
Exxon Mobil Corporation ± | | | 1.54 | | | | 2-28-2018 | | | | 90,000 | | | | 90,625 | |
Marathon Oil Corporation | | | 6.00 | | | | 10-1-2017 | | | | 70,000 | | | | 72,243 | |
Phillips 66 | | | 2.95 | | | | 5-1-2017 | | | | 60,000 | | | | 60,428 | |
| | | | |
| | | | | | | | | | | | | | | 423,592 | |
| | | | | | | | | | | | | | | | |
The accompanying notes are an integral part of these financial statements.
| | | | | | |
| Portfolio of investments—November 30, 2016 (unaudited) | | Wells Fargo Allocation Funds | | | 107 | |
STABLE INCOME PORTFOLIO
| | | | | | | | | | | | | | | | |
| Security name | | Interest rate | | | Maturity date | | | Principal | | | Value | |
| | | | |
Financials: 9.26% | | | | | | | | | | | | | | | | |
| | | | |
| Banks: 3.27% | | | | | | | | | | | | | | | | |
Bank of America Corporation | | | 1.70 | % | | | 8-25-2017 | | | $ | 60,000 | | | $ | 60,096 | |
Bank of America Corporation | | | 2.00 | | | | 1-11-2018 | | | | 50,000 | | | | 50,106 | |
Bank of America Corporation | | | 3.88 | | | | 3-22-2017 | | | | 70,000 | | | | 70,561 | |
Berkshire Hathaway Finance Corporation ± | | | 1.54 | | | | 3-15-2019 | | | | 100,000 | | | | 101,271 | |
Citigroup Incorporated | | | 1.80 | | | | 2-5-2018 | | | | 150,000 | | | | 149,962 | |
Citigroup Incorporated | | | 1.85 | | | | 11-24-2017 | | | | 40,000 | | | | 40,112 | |
HSBC USA Incorporated ± | | | 1.65 | | | | 8-7-2018 | | | | 110,000 | | | | 109,904 | |
JPMorgan Chase & Company | | | 1.80 | | | | 1-25-2018 | | | | 60,000 | | | | 60,029 | |
JPMorgan Chase & Company | | | 2.00 | | | | 8-15-2017 | | | | 60,000 | | | | 60,270 | |
JPMorgan Chase & Company | | | 6.00 | | | | 1-15-2018 | | | | 60,000 | | | | 62,790 | |
KeyCorp | | | 2.30 | | | | 12-13-2018 | | | | 90,000 | | | | 90,738 | |
US Bancorp ± | | | 1.40 | | | | 11-15-2018 | | | | 55,000 | | | | 55,172 | |
| | | | |
| | | | | | | | | | | | | | | 911,011 | |
| | | | | | | | | | | | | | | | |
| | | | |
| Capital Markets: 2.17% | | | | | | | | | | | | | | | | |
Bank of New York Mellon Corporation ± | | | 1.78 | | | | 8-17-2020 | | | | 90,000 | | | | 91,293 | |
Charles Schwab Corporation | | | 2.20 | | | | 7-25-2018 | | | | 90,000 | | | | 90,869 | |
Goldman Sachs Group Incorporated ± | | | 1.92 | | | | 4-25-2019 | | | | 70,000 | | | | 70,501 | |
Goldman Sachs Group Incorporated | | | 2.38 | | | | 1-22-2018 | | | | 40,000 | | | | 40,245 | |
Goldman Sachs Group Incorporated | | | 5.95 | | | | 1-18-2018 | | | | 50,000 | | | | 52,244 | |
Morgan Stanley | | | 4.75 | | | | 3-22-2017 | | | | 50,000 | | | | 50,532 | |
Morgan Stanley | | | 5.55 | | | | 4-27-2017 | | | | 115,000 | | | | 116,910 | |
State Street Corporation ± | | | 1.81 | | | | 8-18-2020 | | | | 90,000 | | | | 91,187 | |
| | | | |
| | | | | | | | | | | | | | | 603,781 | |
| | | | | | | | | | | | | | | | |
| | | | |
| Consumer Finance: 2.34% | | | | | | | | | | | | | | | | |
American Express Credit Corporation | | | 1.55 | | | | 9-22-2017 | | | | 100,000 | | | | 99,991 | |
American Honda Finance Corporation | | | 0.95 | | | | 5-5-2017 | | | | 60,000 | | | | 59,943 | |
American Honda Finance Corporation | | | 1.55 | | | | 12-11-2017 | | | | 30,000 | | | | 30,086 | |
American Honda Finance Corporation ± | | | 1.74 | | | | 2-22-2019 | | | | 50,000 | | | | 50,607 | |
BMW US Capital LLC 144A± | | | 1.26 | | | | 9-13-2019 | | | | 75,000 | | | | 74,940 | |
Caterpillar Financial Service | | | 1.80 | | | | 11-13-2018 | | | | 90,000 | | | | 90,179 | |
Hyundai Capital America 144A | | | 1.45 | | | | 2-6-2017 | | | | 50,000 | | | | 50,014 | |
John Deere Capital Corporation ± | | | 1.44 | | | | 1-8-2019 | | | | 75,000 | | | | 75,503 | |
Toyota Motor Credit Corporation | | | 2.05 | | | | 1-12-2017 | | | | 120,000 | | | | 120,135 | |
| | | | |
| | | | | | | | | | | | | | | 651,398 | |
| | | | | | | | | | | | | | | | |
| | | | |
| Diversified Financial Services: 0.66% | | | | | | | | | | | | | | | | |
AIG Global Funding 144A | | | 1.65 | | | | 12-15-2017 | | | | 100,000 | | | | 100,349 | |
General Electric Capital Corporation | | | 5.63 | | | | 9-15-2017 | | | | 80,000 | | | | 82,772 | |
| | | | |
| | | | | | | | | | | | | | | 183,121 | |
| | | | | | | | | | | | | | | | |
| | | | |
| Insurance: 0.82% | | | | | | | | | | | | | | | | |
Marsh & McLennan Company Incorporated | | | 2.55 | | | | 10-15-2018 | | | | 54,000 | | | | 54,577 | |
New York Life Global Funding 144A | | | 1.55 | | | | 11-2-2018 | | | | 70,000 | | | | 69,813 | |
Travelers Company Incorporated | | | 5.80 | | | | 5-15-2018 | | | | 97,000 | | | | 102,861 | |
| | | | |
| | | | | | | | | | | | | | | 227,251 | |
| | | | | | | | | | | | | | | | |
The accompanying notes are an integral part of these financial statements.
| | | | |
| 108 | | Wells Fargo Allocation Funds | | Portfolio of investments—November 30, 2016 (unaudited) |
STABLE INCOME PORTFOLIO
| | | | | | | | | | | | | | | | |
| Security name | | Interest rate | | | Maturity date | | | Principal | | | Value | |
| | | | |
Health Care: 2.18% | | | | | | | | | | | | | | | | |
| | | | |
| Biotechnology: 0.23% | | | | | | | | | | | | | | | | |
AbbVie Incorporated | | | 1.80 | % | | | 5-14-2018 | | | $ | 65,000 | | | $ | 64,959 | |
| | | | | | | | | | | | | | | | |
| | | | |
| Health Care Equipment & Supplies: 0.47% | | | | | | | | | | | | | | | | |
Becton Dickinson & Company | | | 1.80 | | | | 12-15-2017 | | | | 39,000 | | | | 39,073 | |
Medtronic plc ± | | | 1.65 | | | | 3-15-2020 | | | | 90,000 | | | | 91,041 | |
| | | | |
| | | | | | | | | | | | | | | 130,114 | |
| | | | | | | | | | | | | | | | |
| | | | |
| Health Care Providers & Services: 0.69% | | | | | | | | | | | | | | | | |
Cardinal Health Incorporated | | | 1.90 | | | | 6-15-2017 | | | | 90,000 | | | | 90,272 | |
UnitedHealth Group Incorporated | | | 1.45 | | | | 7-17-2017 | | | | 70,000 | | | | 70,175 | |
UnitedHealth Group Incorporated | | | 1.70 | | | | 2-15-2019 | | | | 30,000 | | | | 29,924 | |
| | | | |
| | | | | | | | | | | | | | | 190,371 | |
| | | | | | | | | | | | | | | | |
| | | | |
| Pharmaceuticals: 0.79% | | | | | | | | | | | | | | | | |
EMD Finance LLC Company 144A | | | 1.70 | | | | 3-19-2018 | | | | 40,000 | | | | 39,916 | |
Johnson & Johnson ± | | | 1.11 | | | | 3-1-2019 | | | | 90,000 | | | | 90,202 | |
Merck & Company Incorporated ± | | | 1.01 | | | | 2-10-2017 | | | | 90,000 | | | | 90,008 | |
| | | | |
| | | | | | | | | | | | | | | 220,126 | |
| | | | | | | | | | | | | | | | |
| | | | |
Industrials: 1.87% | | | | | | | | | | | | | | | | |
| | | | |
| Aerospace & Defense: 0.43% | | | | | | | | | | | | | | | | |
Lockheed Martin Corporation | | | 1.85 | | | | 11-23-2018 | | | | 30,000 | | | | 30,103 | |
Northrop Grumman Corporation | | | 1.75 | | | | 6-1-2018 | | | | 90,000 | | | | 90,236 | |
| | | | |
| | | | | | | | | | | | | | | 120,339 | |
| | | | | | | | | | | | | | | | |
| | | | |
| Electrical Equipment: 0.29% | | | | | | | | | | | | | | | | |
Eaton Corporation | | | 1.50 | | | | 11-2-2017 | | | | 80,000 | | | | 80,111 | |
| | | | | | | | | | | | | | | | |
| | | | |
| Industrial Conglomerates: 0.18% | | | | | | | | | | | | | | | | |
Roper Industries Incorporated | | | 1.85 | | | | 11-15-2017 | | | | 50,000 | | | | 50,168 | |
| | | | | | | | | | | | | | | | |
| | | | |
| Machinery: 0.34% | | | | | | | | | | | | | | | | |
Parker Hannifin Corporation | | | 5.50 | | | | 5-15-2018 | | | | 90,000 | | | | 95,179 | |
| | | | | | | | | | | | | | | | |
| | | | |
| Road & Rail: 0.63% | | | | | | | | | | | | | | | | |
Burlington Northern Santa Fe LLC | | | 5.65 | | | | 5-1-2017 | | | | 80,000 | | | | 81,488 | |
Union Pacific Corporation | | | 5.75 | | | | 11-15-2017 | | | | 90,000 | | | | 93,690 | |
| |
| | | | 175,178 | |
| | | | | | | | | | | | | | | | |
| | | | |
Information Technology: 2.12% | | | | | | | | | | | | | | | | |
| | | | |
| Communications Equipment: 0.43% | | | | | | | | | | | | | | | | |
Cisco Systems Incorporated ± | | | 1.16 | | | | 6-15-2018 | | | | 90,000 | | | | 90,229 | |
Cisco Systems Incorporated ± | | | 1.51 | | | | 2-21-2018 | | | | 30,000 | | | | 30,177 | |
| |
| | | | 120,406 | |
| | | | | | | | | | | | | | | | |
| | | | |
| Electronic Equipment, Instruments & Components: 0.22% | | | | | | | | | | | | | | | | |
Corning Incorporated | | | 1.50 | | | | 5-8-2018 | | | | 60,000 | | | | 59,778 | |
| | | | | | | | | | | | | | | | |
The accompanying notes are an integral part of these financial statements.
| | | | | | |
| Portfolio of investments—November 30, 2016 (unaudited) | | Wells Fargo Allocation Funds | | | 109 | |
STABLE INCOME PORTFOLIO
| | | | | | | | | | | | | | | | |
| Security name | | Interest rate | | | Maturity date | | | Principal | | | Value | |
| | | | |
| IT Services: 0.18% | | | | | | | | | | | | | | | | |
Visa Incorporated | | | 1.20 | % | | | 12-14-2017 | | | $ | 50,000 | | | $ | 50,053 | |
| | | | | | | | | | | | | | | | |
| | | | |
| Software: 0.50% | | | | | | | | | | | | | | | | |
Microsoft Corporation | | | 1.10 | | | | 8-8-2019 | | | | 50,000 | | | | 49,292 | |
Oracle Corporation ± | | | 1.07 | | | | 7-7-2017 | | | | 90,000 | | | | 90,116 | |
| |
| | | | 139,408 | |
| | | | | | | | | | | | | | | | |
| | | | |
| Technology Hardware, Storage & Peripherals: 0.79% | | | | | | | | | | | | | | | | |
Apple Incorporated | | | 0.90 | | | | 5-12-2017 | | | | 90,000 | | | | 89,998 | |
Apple Incorporated | | | 1.70 | | | | 2-22-2019 | | | | 30,000 | | | | 30,073 | |
HP Enterprise Company 144A | | | 2.70 | | | | 10-5-2017 | | | | 100,000 | | | | 101,075 | |
| |
| | | | 221,146 | |
| | | | | | | | | | | | | | | | |
| | | | |
Materials: 1.45% | | | | | | | | | | | | | | | | |
| | | | |
| Chemicals: 1.45% | | | | | | | | | | | | | | | | |
Chevron Phillips Chemical Company 144A | | | 1.70 | | | | 5-1-2018 | | | | 75,000 | | | | 74,789 | |
Ecolab Incorporated | | | 1.45 | | | | 12-8-2017 | | | | 60,000 | | | | 59,978 | |
Ecolab Incorporated | | | 3.00 | | | | 12-8-2016 | | | | 90,000 | | | | 89,941 | |
Praxair Incorporated | | | 1.05 | | | | 11-7-2017 | | | | 90,000 | | | | 89,870 | |
Sherwin-Williams Company | | | 1.35 | | | | 12-15-2017 | | | | 90,000 | | | | 89,988 | |
| |
| | | | 404,566 | |
| | | | | | | | | | | | | | | | |
| | | | |
Real Estate: 1.37% | | | | | | | | | | | | | | | | |
| | | | |
| Equity REITs: 1.37% | | | | | | | | | | | | | | | | |
Boston Properties LP | | | 3.70 | | | | 11-15-2018 | | | | 90,000 | | | | 92,922 | |
ERP Operating LP | | | 5.75 | | | | 6-15-2017 | | | | 30,000 | | | | 30,703 | |
Realty Income Corporation | | | 2.00 | | | | 1-31-2018 | | | | 73,000 | | | | 73,238 | |
Simon Property Group LP | | | 2.15 | | | | 9-15-2017 | | | | 90,000 | | | | 90,437 | |
UDR Incorporated | | | 4.25 | | | | 6-1-2018 | | | | 90,000 | | | | 93,127 | |
| |
| | | | 380,427 | |
| | | | | | | | | | | | | | | | |
| | | | |
Telecommunication Services: 0.79% | | | | | | | | | | | | | | | | |
| | | | |
| Diversified Telecommunication Services: 0.79% | | | | | | | | | | | | | | | | |
AT&T Incorporated | | | 1.60 | | | | 2-15-2017 | | | | 90,000 | | | | 90,075 | |
Verizon Communications Incorporated | | | 1.35 | | | | 6-9-2017 | | | | 130,000 | | | | 130,223 | |
| |
| | | | 220,298 | |
| | | | | | | | | | | | | | | | |
| | | | |
Utilities: 5.83% | | | | | | | | | | | | | | | | |
| | | | |
| Electric Utilities: 4.68% | | | | | | | | | | | | | | | | |
Alabama Power Company Series Q | | | 5.50 | | | | 10-15-2017 | | | | 90,000 | | | | 93,188 | |
Commonwealth Edison Company | | | 2.15 | | | | 1-15-2019 | | | | 50,000 | | | | 50,453 | |
Connecticut Light & Power | | | 5.38 | | | | 3-1-2017 | | | | 75,000 | | | | 75,736 | |
Duke Energy Carolinas | | | 5.25 | | | | 1-15-2018 | | | | 55,000 | | | | 57,293 | |
Entergy Gulf States Louisiana LLC | | | 6.00 | | | | 5-1-2018 | | | | 90,000 | | | | 95,337 | |
Florida Power & Light Company | | | 5.55 | | | | 11-1-2017 | | | | 115,000 | | | | 119,437 | |
Florida Power & Light Company | | | 5.80 | | | | 9-15-2017 | | | | 80,000 | | | | 82,778 | |
The accompanying notes are an integral part of these financial statements.
| | | | |
| 110 | | Wells Fargo Allocation Funds | | Portfolio of investments—November 30, 2016 (unaudited) |
STABLE INCOME PORTFOLIO
| | | | | | | | | | | | | | | | |
| Security name | | Interest rate | | | Maturity date | | | Principal | | | Value | |
| | | | |
| Electric Utilities (continued) | | | | | | | | | | | | | | | | |
MidAmerican Energy Holdings Company | | | 5.30 | % | | | 3-15-2018 | | | $ | 55,000 | | | $ | 57,597 | |
Northern States Power Company of Minnesota | | | 5.25 | | | | 3-1-2018 | | | | 70,000 | | | | 73,249 | |
PacifiCorp 1st Mortgage | | | 5.50 | | | | 1-15-2019 | | | | 100,000 | | | | 107,304 | |
Public Service Colorado 1st Mortgage | | | 5.80 | | | | 8-1-2018 | | | | 59,000 | | | | 63,063 | |
Public Service Electric & Gas Company | | | 5.30 | | | | 5-1-2018 | | | | 84,000 | | | | 88,397 | |
Southern California Edison Company | | | 1.13 | | | | 5-1-2017 | | | | 90,000 | | | | 90,086 | |
Union Electric Company | | | 6.40 | | | | 6-15-2017 | | | | 120,000 | | | | 123,251 | |
Westar Energy Incorporated | | | 5.15 | | | | 1-1-2017 | | | | 75,000 | | | | 75,204 | |
Xcel Energy Incorporated | | | 1.20 | | | | 6-1-2017 | | | | 50,000 | | | | 49,947 | |
| |
| | | | 1,302,320 | |
| | | | | | | | | | | | | | | | |
| | | | |
| Gas Utilities: 0.32% | | | | | | | | | | | | | | | | |
Southern California Gas Company | | | 5.45 | | | | 4-15-2018 | | | | 85,000 | | | | 89,369 | |
| | | | | | | | | | | | | | | | |
| | | | |
| Multi-Utilities: 0.83% | | | | | | | | | | | | | | | | |
Consumers Energy Company | | | 5.15 | | | | 2-15-2017 | | | | 130,000 | | | | 131,102 | |
Peco Energy Company | | | 5.35 | | | | 3-1-2018 | | | | 96,000 | | | | 100,474 | |
| |
| | | | 231,576 | |
| | | | | | | | | | | | | | | | |
| |
Total Corporate Bonds and Notes (Cost $8,190,601) | | | | 8,198,743 | |
| | | | | | | | | | | | | | | | |
| | | | |
Municipal Obligations: 0.52% | | | | | | | | | | | | | | | | |
| | | | |
| Michigan: 0.21% | | | | | | | | | | | | | | | | |
Chippewa Valley MI School District (GO Revenue, Qualified School Board Loan Fund Insured) | | | 1.18 | | | | 5-1-2017 | | | | 60,000 | | | | 60,055 | |
| | | | | | | | | | | | | | | | |
| | | | |
| North Carolina: 0.31% | | | | | | | | | | | | | | | | |
North Carolina Education Assistance Authority Student Loan Notes Series 2011-1 Tranche A-2 (Education Revenue) | | | 1.78 | | | | 1-26-2026 | | | | 85,699 | | | | 85,684 | |
| | | | | | | | | | | | | | | | |
| |
Total Municipal Obligations (Cost $146,013) | | | | 145,739 | |
| | | | | | | | | | | | | | | | |
| | | | |
Non-Agency Mortgage-Backed Securities: 4.90% | | | | | | | | | | | | | | | | |
Bear Stearns Commercial Mortgage Securities Trust Series 2007 PW16 Class A1A ± | | | 5.90 | | | | 6-11-2040 | | | | 83,622 | | | | 84,688 | |
Bear Stearns Commercial Mortgage Securities Trust Series 2007-PW17 Class A1A ± | | | 5.65 | | | | 6-11-2050 | | | | 105,489 | | | | 107,745 | |
CGGS Commercial Mortgage Trust Series 2016 144A± | | | 2.19 | | | | 2-15-2033 | | | | 115,023 | | | | 115,460 | |
CIT Education Loan Trust Series 2005-1 Class A3 ± | | | 0.97 | | | | 3-15-2026 | | | | 48,878 | | | | 48,431 | |
Commercial Mortgage Trust Pass-Through Certificates Series 2007-C9 Class A4 ± | | | 6.01 | | | | 12-10-2049 | | | | 125,755 | | | | 127,524 | |
GAHR Commercial Mortgage Trust Series 2015 Class AFL1 144A± | | | 1.83 | | | | 12-15-2034 | | | | 138,717 | | | | 139,193 | |
JPMorgan Chase Commercial Mortgage Securities Trust Series 2007-LDPX Class A1A | | | 5.44 | | | | 1-15-2049 | | | | 57,726 | | | | 58,029 | |
Morgan Stanley Capital I Series 2007-T27 Class A4 ± | | | 5.82 | | | | 6-11-2042 | | | | 117,228 | | | | 118,879 | |
SCG Trust Series 2013-SRP1 Class A 144A± | | | 1.94 | | | | 11-15-2026 | | | | 140,000 | | | | 139,534 | |
SLMA Series 2006 1 Class A5 ± | | | 0.99 | | | | 7-26-2021 | | | | 135,000 | | | | 128,442 | |
Structured Asset Securities Corporation Series 2006-RF3
Class 1A1 144A | | | 6.00 | | | | 10-25-2036 | | | | 112,776 | | | | 112,245 | |
Towd Point Mortgage Trust Series 2015-6 Class A1 144A± | | | 3.50 | | | | 4-25-2055 | | | | 83,433 | | | | 85,345 | |
Towd Point Mortgage Trust Series 2016-3 Class A1 144A± | | | 2.25 | | | | 8-25-2055 | | | | 99,503 | | | | 98,889 | |
| |
Total Non-Agency Mortgage-Backed Securities (Cost $1,379,282) | | | | 1,364,404 | |
| | | | | | | | | | | | | | | | |
|
U.S. Treasury Securities: 6.71% | |
U.S. Treasury Note | | | 0.63 | | | | 7-31-2017 | | | | 300,000 | | | | 299,789 | |
U.S. Treasury Note | | | 0.75 | | | | 2-28-2018 | | | | 300,000 | | | | 299,168 | |
The accompanying notes are an integral part of these financial statements.
| | | | | | |
| Portfolio of investments—November 30, 2016 (unaudited) | | Wells Fargo Allocation Funds | | | 111 | |
STABLE INCOME PORTFOLIO
| | | | | | | | | | | | | | | | |
| Security name | | Interest rate | | | Maturity date | | | Principal | | | Value | |
| | | | |
U.S. Treasury Securities (continued) | | | | | | | | | | | | | | | | |
U.S. Treasury Note | | | 0.75 | % | | | 9-30-2018 | | | $ | 550,000 | | | $ | 546,412 | |
U.S. Treasury Note | | | 0.75 | | | | 10-31-2018 | | | | 575,000 | | | | 570,912 | |
U.S. Treasury Note | | | 0.88 | | | | 7-15-2017 | | | | 150,000 | | | | 150,158 | |
| |
Total U.S. Treasury Securities (Cost $1,873,083) | | | | 1,866,439 | |
| | | | | | | | | | | | | | | | |
|
Yankee Corporate Bonds and Notes: 2.38% | |
|
Consumer Staples: 0.33% | |
|
| Food Products: 0.33% | |
Diageo Capital plc | | | 1.50 | | | | 5-11-2017 | | | | 90,000 | | | | 90,169 | |
| | | | | | | | | | | | | | | | |
|
Energy: 0.32% | |
|
| Oil, Gas & Consumable Fuels: 0.32% | |
Shell International Finance Company ± | | | 1.20 | | | | 5-10-2017 | | | | 90,000 | | | | 90,096 | |
| | | | | | | | | | | | | | | | |
|
Financials: 1.30% | |
|
| Banks: 1.30% | |
Bank of Montreal | | | 1.35 | | | | 8-28-2018 | | | | 30,000 | | | | 29,806 | |
Bank of Nova Scotia ± | | | 1.32 | | | | 6-11-2018 | | | | 90,000 | | | | 90,184 | |
Royal Bank of Canada Incorporated | | | 2.00 | | | | 10-1-2018 | | | | 150,000 | | | | 150,879 | |
Toronto Dominion Bank ± | | | 1.42 | | | | 7-23-2018 | | | | 90,000 | | | | 90,215 | |
| |
| | | | 361,084 | |
| | | | | | | | | | | | | | | | |
|
Health Care: 0.11% | |
|
| Pharmaceuticals: 0.11% | |
Teva Pharmaceutical Finance Netherlands III BV | | | 1.40 | | | | 7-20-2018 | | | | 30,000 | | | | 29,706 | |
| | | | | | | | | | | | | | | | |
|
Industrials: 0.32% | |
|
| Road & Rail: 0.32% | |
Canadian National Railway Company | | | 1.45 | | | | 12-15-2016 | | | | 90,000 | | | | 90,018 | |
| | | | | | | | | | | | | | | | |
| |
Total Yankee Corporate Bonds and Notes (Cost $661,856) | | | | 661,073 | |
| | | | | | | | | | | | | | | | |
| | | | |
| | | Yield | | | | | | Shares | | | | |
| Short-Term Investments: 3.35% | |
|
| Investment Companies: 3.35% | |
Wells Fargo Government Money Market Fund Select Class (l)(u) | | | 0.31 | | | | | | | | 931,716 | | | | 931,716 | |
| | | | | | | | | | | | | | | | |
| |
Total Short-Term Investments (Cost $931,716) | | | | 931,716 | |
| | | | | | | | | | | | | | | | |
| | | | | | | | |
| Total investments in securities (Cost $27,397,648) * | | | 99.73 | % | | | 27,750,845 | |
Other assets and liabilities, net | | | 0.27 | | | | 75,006 | |
| | | | | | | | |
| Total net assets | | | 100.00 | % | | $ | 27,825,851 | |
| | | | | | | | |
The accompanying notes are an integral part of these financial statements.
| | | | |
| 112 | | Wells Fargo Allocation Funds | | Portfolio of investments—November 30, 2016 (unaudited) |
STABLE INCOME PORTFOLIO
| ± | Variable rate investment. The rate shown is the rate in effect at period end. |
| 144A | The security may be resold in transactions exempt from registration, normally to qualified institutional buyers, pursuant to Rule 144A under the Securities Act of 1933. |
| (l) | The issuer of the security is an affiliated person of the Portfolio as defined in the Investment Company Act of 1940. |
| (u) | The rate represents the 7-day annualized yield at period end. |
| * | Cost for federal income tax purposes is $26,919,578 and unrealized gains (losses) consists of: |
| | | | |
Gross unrealized gains | | $ | 912,152 | |
Gross unrealized losses | | | (80,885 | ) |
| | | | |
Net unrealized gains | | $ | 831,267 | |
The accompanying notes are an integral part of these financial statements.
This page is intentionally left blank.
| | | | |
| 114 | | Wells Fargo Allocation Funds | | Statements of assets and liabilities—November 30, 2016 (unaudited) |
| | | | | | | | |
| | | C&B Large
Cap Value
Portfolio | | | Diversified Large
Cap Growth
Portfolio | |
| | |
Assets | | | | | | | | |
Investments | | | | | | | | |
In unaffiliated securities (including securities on loan), at value (see cost below) | | $ | 333,382,884 | | | $ | 104,406,481 | |
In affiliated securities, at value (see cost below) | | | 18,117,049 | | | | 2,510,658 | |
| | | | |
Total investments, at value (see cost below) | | | 351,499,933 | | | | 106,917,139 | |
Foreign currency, at value (see cost below) | | | 0 | | | | 0 | |
Receivable for investments sold | | | 4,478,407 | | | | 963,672 | |
Receivable for dividends | | | 617,956 | | | | 154,365 | |
Receivable for daily variation margin on open futures contracts | | | 0 | | | | 0 | |
Receivable for securities lending income | | | 5,946 | | | | 1,412 | |
Prepaid expenses and other assets | | | 2,664 | | | | 0 | |
| | | | |
Total assets | | | 356,604,906 | | | | 108,036,588 | |
| | | | |
| | |
Liabilities | | | | | | | | |
Payable for investments purchased | | | 6,514,762 | | | | 944,357 | |
Payable upon receipt of securities loaned | | | 6,884,850 | | | | 1,030,168 | |
Payable for daily variation margin on open futures contracts | | | 0 | | | | 0 | |
Due to custodian bank | | | 0 | | | | 0 | |
Advisory fee payable | | | 179,778 | | | | 43,360 | |
Accrued expenses and other liabilities | | | 28,289 | | | | 55,735 | |
| | | | |
Total liabilities | | | 13,607,679 | | | | 2,073,620 | |
| | | | |
Total net assets | | $ | 342,997,227 | | | $ | 105,962,968 | |
| | | | |
| | |
Investments in unaffiliated securities (including securities on loan), at cost | | $ | 252,599,693 | | | $ | 71,168,423 | |
| | | | |
Investments in affiliated securities, at cost | | $ | 18,117,000 | | | $ | 2,510,604 | |
| | | | |
Total investments, at cost | | $ | 270,716,693 | | | $ | 73,679,027 | |
| | | | |
Securities on loan, at value | | $ | 6,741,288 | | | $ | 1,004,578 | |
| | | | |
Foreign currency, at cost | | $ | 0 | | | $ | 0 | |
| | | | |
The accompanying notes are an integral part of these financial statements.
| | | | | | |
| Statements of assets and liabilities—November 30, 2016 (unaudited) | | Wells Fargo Allocation Funds | | | 115 | |
| | | | | | | | | | | | | | | | | | | | | | | | | | |
Emerging Growth Portfolio | | | Index Portfolio | | | International Growth
Portfolio | | | International Value
Portfolio | | | Large Company Value
Portfolio | | | Small Company Growth
Portfolio | | | Small Company Value
Portfolio | |
| | | | | | |
| | | | | | | | | | | | | | | | | | | | | | | | | | |
| | | | | | | | | | | | | | | | | | | | | | | | | | |
| $ | 784,260,385 | | | $ | 2,130,086,939 | | | $ | 131,184,814 | | | $ | 528,377,612 | | | $ | 75,003,557 | | | $ | 1,441,611,868 | | | $ | 219,713,866 | |
| | 105,232,529 | | | | 39,437,716 | | | | 3,957,933 | | | | 15,976,923 | | | | 3,311,310 | | | | 240,302,504 | | | | 15,094,699 | |
| | |
| | 889,492,914 | | | | 2,169,524,655 | | | | 135,142,747 | | | | 544,354,535 | | | | 78,314,867 | | | | 1,681,914,372 | | | | 234,808,565 | |
| | 0 | | | | 0 | | | | 129,529 | | | | 6,056,644 | | | | 0 | | | | 0 | | | | 0 | |
| | 6,071,508 | | | | 81,572,756 | | | | 2,484,487 | | | | 2,082,015 | | | | 11 | | | | 4,876,065 | | | | 7,523,952 | |
| | 988,515 | | | | 5,635,238 | | | | 368,292 | | | | 1,744,463 | | | | 188,595 | | | | 563,364 | | | | 189,002 | |
| | 0 | | | | 11,930 | | | | 0 | | | | 0 | | | | 0 | | | | 0 | | | | 0 | |
| | 58,139 | | | | 3,569 | | | | 5,007 | | | | 13,699 | | | | 1,404 | | | | 175,837 | | | | 5,811 | |
| | 0 | | | | 59,534 | | | | 0 | | | | 0 | | | | 0 | | | | 9,093 | | | | 562 | |
| | |
| | 896,611,076 | | | | 2,256,807,682 | | | | 138,130,062 | | | | 554,251,356 | | | | 78,504,877 | | | | 1,687,538,731 | | | | 242,527,892 | |
| | |
| | | | | | |
| | | | | | | | | | | | | | | | | | | | | | | | | | |
| | 4,316,099 | | | | 0 | | | | 1,497,296 | | | | 3,215,938 | | | | 0 | | | | 6,099,373 | | | | 5,647,301 | |
| | 85,985,863 | | | | 12,147,358 | | | | 2,197,722 | | | | 9,469,808 | | | | 3,311,197 | | | | 165,095,222 | | | | 11,761,925 | |
| | 0 | | | | 10,250 | | | | 0 | | | | 0 | | | | 0 | | | | 0 | | | | 0 | |
| | 0 | | | | 0 | | | | 0 | | | | 0 | | | | 316,141 | | | | 0 | | | | 0 | |
| | 511,877 | | | | 158,516 | | | | 89,665 | | | | 332,625 | | | | 37,729 | | | | 941,243 | | | | 143,619 | |
| | 65,959 | | | | 11,879,030 | | | | 70,612 | | | | 103,986 | | | | 29,307 | | | | 40,415 | | | | 27,239 | |
| | |
| | 90,879,798 | | | | 24,195,154 | | | | 3,855,295 | | | | 13,122,357 | | | | 3,694,374 | | | | 172,176,253 | | | | 17,580,084 | |
| | |
| $ | 805,731,278 | | | $ | 2,232,612,528 | | | $ | 134,274,767 | | | $ | 541,128,999 | | | $ | 74,810,503 | | | $ | 1,515,362,478 | | | $ | 224,947,808 | |
| | |
| | | | | | |
| $ | 560,292,720 | | | $ | 952,633,972 | | | $ | 127,462,883 | | | $ | 574,037,474 | | | $ | 60,740,114 | | | $ | 1,226,035,864 | | | $ | 181,313,891 | |
| | |
| $ | 105,224,647 | | | $ | 25,642,455 | | | $ | 3,957,933 | | | $ | 15,976,523 | | | $ | 3,311,198 | | | $ | 240,287,228 | | | $ | 15,094,012 | |
| | |
| $ | 665,517,367 | | | $ | 978,276,427 | | | $ | 131,420,816 | | | $ | 590,013,997 | | | $ | 64,051,312 | | | $ | 1,466,323,092 | | | $ | 196,407,903 | |
| | |
| $ | 83,950,774 | | | $ | 11,407,707 | | | $ | 2,094,957 | | | $ | 8,970,460 | | | $ | 3,241,542 | | | $ | 160,714,454 | | | $ | 11,468,149 | |
| | |
| $ | 0 | | | $ | 0 | | | $ | 131,433 | | | $ | 6,220,868 | | | $ | 0 | | | $ | 0 | | | $ | 0 | |
| | |
The accompanying notes are an integral part of these financial statements.
| | | | |
| 116 | | Wells Fargo Allocation Funds | | Statements of assets and liabilities—November 30, 2016 (unaudited) |
| | | | | | | | |
| | | Core Bond
Portfolio | | | Managed
Fixed Income
Portfolio | |
| | |
Assets | | | | | | | | |
Investments | | | | | | | | |
In unaffiliated securities (including securities on loan), at value (see cost below) | | $ | 5,591,407,064 | | | $ | 109,843,255 | |
In affiliated securities, at value (see cost below) | | | 368,654,245 | | | | 4,618,952 | |
| | | | |
Total investments, at value (see cost below) | | | 5,960,061,309 | | | | 114,462,207 | |
Segregated cash | | | 3,960,000 | | | | 112,000 | |
Foreign currency, at value (see cost below) | | | 0 | | | | 0 | |
Receivable for investments sold | | | 502,646,058 | | | | 159,579 | |
Principal paydown receivable | | | 115,974 | | | | 0 | |
Receivable for interest | | | 22,492,204 | | | | 842,120 | |
Receivable for daily variation margin on open futures contracts | | | 0 | | | | 0 | |
Receivable for securities lending income | | | 69,413 | | | | 555 | |
Prepaid expenses and other assets | | | 66,298 | | | | 5,411 | |
| | | | |
Total assets | | | 6,489,411,256 | | | | 115,581,872 | |
| | | | |
| | |
Liabilities | | | | | | | | |
Payable for investments purchased | | | 1,037,430,406 | | | | 0 | |
Payable upon receipt of securities loaned | | | 230,753,814 | | | | 1,699,779 | |
Payable for daily variation margin on open futures contracts | | | 0 | | | | 37,500 | |
Due to custodian bank | | | 275,520 | | | | 0 | |
Advisory fee payable | | | 1,489,078 | | | | 28,434 | |
Shareholder report expenses payable | | | 511 | | | | 2,909 | |
Professional fees payable | | | 19,837 | | | | 26,635 | |
Accrued expenses and other liabilities | | | 95,940 | | | | 5,022 | |
| | | | |
Total liabilities | | | 1,270,065,106 | | | | 1,800,279 | |
| | | | |
Total net assets | | $ | 5,219,346,150 | | | $ | 113,781,593 | |
| | | | |
| | |
Investments in unaffiliated securities (including securities on loan), at cost | | $ | 5,681,024,555 | | | $ | 108,226,699 | |
| | | | |
Investments in affiliated securities, at cost | | $ | 368,654,047 | | | $ | 4,618,936 | |
| | | | |
Total investments, at cost | | $ | 6,049,678,602 | | | $ | 112,845,635 | |
| | | | |
Securities on loan, at value | | $ | 226,218,264 | | | $ | 1,665,873 | |
| | | | |
Foreign currency, at cost | | $ | 0 | | | $ | 0 | |
| | | | |
The accompanying notes are an integral part of these financial statements.
| | | | | | |
| Statements of assets and liabilities—November 30, 2016 (unaudited) | | Wells Fargo Allocation Funds | | | 117 | |
| | | | | | |
Real Return
Portfolio | | |
Stable Income
Portfolio | |
| |
| | | | | | |
| | | | | | |
| $ | 69,254,340 | | | $ | 26,819,129 | |
| | 4,164,256 | | | | 931,716 | |
| | |
| | 73,418,596 | | | | 27,750,845 | |
| | 0 | | | | 8,500 | |
| | 1,231 | | | | 0 | |
| | 0 | | | | 11,021 | |
| | 0 | | | | 0 | |
| | 273,229 | | | | 85,755 | |
| | 3,656 | | | | 2,813 | |
| | 1,831 | | | | 52 | |
| | 2,050 | | | | 1,164 | |
| | |
| | 73,700,593 | | | | 27,860,150 | |
| | |
| |
| | | | | | |
| | 323,565 | | | | 0 | |
| | 371,300 | | | | 0 | |
| | 1,781 | | | | 0 | |
| | 0 | | | | 0 | |
| | 18,078 | | | | 1,075 | |
| | 2,420 | | | | 1,941 | |
| | 20,909 | | | | 26,780 | |
| | 2,571 | | | | 4,503 | |
| | |
| | 740,624 | | | | 34,299 | |
| | |
| $ | 72,959,969 | | | $ | 27,825,851 | |
| | |
| |
| $ | 68,001,602 | | | $ | 26,465,932 | |
| | |
| $ | 4,164,235 | | | $ | 931,716 | |
| | |
| $ | 72,165,837 | | | $ | 27,397,648 | |
| | |
| $ | 355,661 | | | $ | 0 | |
| | |
| $ | 1,234 | | | $ | 0 | |
| | |
The accompanying notes are an integral part of these financial statements.
| | | | |
| 118 | | Wells Fargo Allocation Funds | | Statements of operations—six months ended November 30, 2016 (unaudited) |
| | | | | | | | |
| | | C&B Large Cap Value Portfolio | | | Diversified Large
Cap Growth Portfolio | |
| | |
Investment income | | | | | | | | |
Dividends* | | $ | 2,806,863 | | | $ | 609,679 | |
Income from affiliated securities | | | 17,185 | | | | 2,589 | |
Securities lending income, net | | | 23,186 | | | | 6,747 | |
Interest | | | 0 | | | | 0 | |
| | | | |
Total investment income | | | 2,847,234 | | | | 619,015 | |
| | | | |
| | |
Expenses | | | | | | | | |
Advisory fee | | | 1,031,131 | | | | 369,429 | |
Custody and accounting fees | | | 11,931 | | | | 11,618 | |
Professional fees | | | 22,130 | | | | 24,088 | |
Shareholder report expenses | | | 531 | | | | 1,025 | |
Trustees’ fees and expenses | | | 6,301 | | | | 26,722 | |
Other fees and expenses | | | 4,552 | | | | 6,702 | |
| | | | |
Total expenses | | | 1,076,576 | | | | 439,584 | |
Less: Fee waivers and/or expense reimbursements | | | 0 | | | | (86,011 | ) |
| | | | |
Net expenses | | | 1,076,576 | | | | 353,573 | |
| | | | |
Net investment income (loss) | | | 1,770,658 | | | | 265,442 | |
| | | | |
| | |
REALIZED AND UNREALIZED GAINS (LOSSES) ON INVESTMENTS | | | | | | | | |
| | |
Net realized gains (losses) on: | | | | | | | | |
Unaffiliated securities | | | 8,791,368 | | | | 3,915,816 | |
Affiliated securities | | | 0 | | | | 0 | |
Futures transactions | | | 0 | | | | 0 | |
| | | | |
Net realized gain (losses) on investments | | | 8,791,368 | | | | 3,915,816 | |
| | | | |
| | |
Net change in unrealized gains (losses) on: | | | | | | | | |
Unaffiliated securities | | | 13,101,251 | | | | (3,207,811 | ) |
Affiliated securities | | | 49 | | | | 54 | |
Futures transactions | | | 0 | | | | 0 | |
| | | | |
Net change in unrealized gains (losses) on investments | | | 13,101,300 | | | | (3,207,757 | ) |
| | | | |
Net realized and unrealized gains (losses) on investments | | | 21,892,668 | | | | 708,059 | |
| | | | |
Net increase (decrease) in net assets resulting from operations | | $ | 23,663,326 | | | $ | 973,501 | |
| | | | |
| | |
* Net of foreign dividend withholding taxes in the amount of | | | $72,523 | | | | $2,418 | |
The accompanying notes are an integral part of these financial statements.
| | | | | | |
| Statements of operations—six months ended November 30, 2016 (unaudited) | | Wells Fargo Allocation Funds | | | 119 | |
| | | | | | | | | | | | | | | | | | | | | | | | | | |
Emerging Growth Portfolio | | | Index Portfolio | | | International Growth
Portfolio | | | International
Value
Portfolio | | | Large Company
Value
Portfolio | | | Small Company
Growth
Portfolio | | | Small Company Value
Portfolio | |
| | | | | | |
| | | | | | | | | | | | | | | | | | | | | | | | | | |
| $ | 3,598,699 | | | $ | 25,227,234 | | | $ | 879,602 | | | $ | 6,732,564 | | | $ | 816,661 | | | $ | 3,366,760 | | | $ | 1,732,589 | |
| | 24,884 | | | | 450,895 | | | | 7,750 | | | | 3,094 | | | | 2,676 | | | | 100,092 | | | | 11,184 | |
| | 679,956 | | | | 74,593 | | | | 86,292 | | | | 265,478 | | | | 7,799 | | | | 1,326,542 | | | | 67,549 | |
| | 0 | | | | 2,259 | | | | 0 | | | | 0 | | | | 0 | | | | 0 | | | | 0 | |
| | |
| | 4,303,539 | | | | 25,754,981 | | | | 973,644 | | | | 7,001,136 | | | | 827,136 | | | | 4,793,394 | | | | 1,811,322 | |
| | |
| | | | | | |
| | | | | | | | | | | | | | | | | | | | | | | | | | |
| | 3,363,418 | | | | 986,981 | | | | 606,777 | | | | 2,077,052 | | | | 253,421 | | | | 5,256,376 | | | | 869,756 | |
| | 27,112 | | | | 70,665 | | | | 38,146 | | | | 94,073 | | | | 5,186 | | | | 40,181 | | | | 11,556 | |
| | 23,494 | | | | 30,361 | | | | 34,775 | | | | 30,416 | | | | 24,502 | | | | 24,297 | | | | 23,329 | |
| | 2,262 | | | | 3,561 | | | | 298 | | | | 1,323 | | | | 317 | | | | 992 | | | | 1,394 | |
| | 6,125 | | | | 4,773 | | | | 12,345 | | | | 5,982 | | | | 10,742 | | | | 5,971 | | | | 6,023 | |
| | 17,018 | | | | 15,565 | | | | 27,186 | | | | 26,969 | | | | 6,734 | | | | 12,515 | | | | 4,721 | |
| | |
| | 3,439,429 | | | | 1,111,906 | | | | 719,527 | | | | 2,235,815 | | | | 300,902 | | | | 5,340,332 | | | | 916,779 | |
| | 0 | | | | 0 | | | | 0 | | | | 0 | | | | (13,016 | ) | | | 0 | | | | 0 | |
| | |
| | 3,439,429 | | | | 1,111,906 | | | | 719,527 | | | | 2,235,815 | | | | 287,886 | | | | 5,340,332 | | | | 916,779 | |
| | |
| | 864,110 | | | | 24,643,075 | | | | 254,117 | | | | 4,765,321 | | | | 539,250 | | | | (546,938 | ) | | | 894,543 | |
| | |
| | | | | | |
| | | | | | | | | | | | | | | | | | | | | | | | | | |
| | | | | | |
| | | | | | | | | | | | | | | | | | | | | | | | | | |
| | 77,141,486 | | | | 114,919,856 | | | | 1,849,535 | | | | (8,467,844 | ) | | | 2,024,711 | | | | 7,468,252 | | | | 14,766,624 | |
| | 0 | | | | 1,344,108 | | | | 391 | | | | 2,122 | | | | 0 | | | | 0 | | | | 0 | |
| | 0 | | | | 2,844,137 | | | | 0 | | | | 0 | | | | 0 | | | | 0 | | | | 0 | |
| | |
| | 77,141,486 | | | | 119,108,101 | | | | 1,849,926 | | | | (8,465,722 | ) | | | 2,024,711 | | | | 7,468,252 | | | | 14,766,624 | |
| | |
| | | | | | |
| | | | | | | | | | | | | | | | | | | | | | | | | | |
| | 37,134,260 | | | | (9,907,265 | ) | | | (11,938,708 | ) | | | 11,362,749 | | | | 2,642,198 | | | | 136,434,698 | | | | 16,402,776 | |
| | 7,882 | | | | (314,536 | ) | | | 0 | | | | 400 | | | | 112 | | | | (1,842 | ) | | | 687 | |
| | 0 | | | | (1,096,995 | ) | | | 0 | | | | 0 | | | | 0 | | | | 0 | | | | 0 | |
| | |
| | 37,142,142 | | | | (11,318,796 | ) | | | (11,938,708 | ) | | | 11,363,149 | | | | 2,642,310 | | | | 136,432,856 | | | | 16,403,463 | |
| | |
| | 114,283,628 | | | | 107,789,305 | | | | (10,088,782 | ) | | | 2,897,427 | | | | 4,667,021 | | | | 143,901,108 | | | | 31,170,087 | |
| | |
| $ | 115,147,738 | | | $ | 132,432,380 | | | $ | (9,834,665 | ) | | $ | 7,662,748 | | | $ | 5,206,271 | | | $ | 143,354,170 | | | $ | 32,064,630 | |
| | |
| | | | | | |
| | 0 | | | | $24,170 | | | | $114,192 | | | | $829,962 | | | | $12,664 | | | | $20,750 | | | | $2,146 | |
The accompanying notes are an integral part of these financial statements.
| | | | |
| 120 | | Wells Fargo Allocation Funds | | Statements of operations—six months ended November 30, 2016 (unaudited) |
| | | | | | | | |
| | | Core Bond
Portfolio | | | Managed
Fixed Income
Portfolio | |
| | |
Investment income | | | | | | | | |
Interest* | | $ | 49,944,640 | | | $ | 2,053,978 | |
Income from affiliated securities | | | 304,382 | | | | 3,650 | |
Securities lending income, net | | | 270,195 | | | | 3,795 | |
Dividends** | | | 0 | | | | 0 | |
| | | | |
Total investment income | | | 50,519,217 | | | | 2,061,423 | |
| | | | |
| | |
Expenses | | | | | | | | |
Advisory fee | | | 8,514,246 | | | | 250,492 | |
Custody and accounting fees | | | 123,471 | | | | 8,774 | |
Professional fees | | | 39,202 | | | | 28,526 | |
Shareholder report expenses | | | 2,033 | | | | 1,297 | |
Trustees’ fees and expenses | | | 5,722 | | | | 7,843 | |
Other fees and expenses | | | 11,526 | | | | 3,684 | |
| | | | |
Total expenses | | | 8,696,200 | | | | 300,616 | |
Less: Fee waivers and/or expense reimbursements | | | (137,093 | ) | | | (57,138 | ) |
| | | | |
Net expenses | | | 8,559,107 | | | | 243,478 | |
| | | | |
Net investment income | | | 41,960,110 | | | | 1,817,945 | |
| | | | |
| | |
REALIZED AND UNREALIZED GAINS (LOSSES) ON INVESTMENTS | | | | | | | | |
| | |
Net realized gains (losses) on: | | | | | | | | |
Unaffiliated securities | | | 27,555,391 | | | | 734,608 | |
Futures transactions | | | 0 | | | | (342,590 | ) |
TBA sale commitments | | | 129,865 | | | | 0 | |
| | | | |
Net realized gains on investments | | | 27,685,256 | | | | 392,018 | |
| | | | |
| | |
Net change in unrealized gains (losses) on: | | | | | | | | |
Unaffiliated securities | | | (126,597,189 | ) | | | (1,917,867 | ) |
Affiliated securities | | | 198 | | | | (33 | ) |
Futures transactions | | | 0 | | | | (24,733 | ) |
| | | | |
Net change in unrealized gains (losses) on investments | | | (126,596,991 | ) | | | (1,942,633 | ) |
| | | | |
Net realized and unrealized gains (losses) on investments | | | (98,911,735 | ) | | | (1,550,615 | ) |
| | | | |
Net increase (decrease) in net assets resulting from operations | | $ | (56,951,625 | ) | | $ | 267,330 | |
| | | | |
| | |
* Net of foreign interest withholding taxes in the amount of | | | $33,358 | | | | $0 | |
** Net of foreign dividend withholding taxes in the amount of | | | $0 | | | | $0 | |
The accompanying notes are an integral part of these financial statements.
| | | | | | |
| Statements of operations—six months ended November 30, 2016 (unaudited) | | Wells Fargo Allocation Funds | | | 121 | |
| | | | | | |
Real Return
Portfolio | | | Stable Income
Portfolio | |
| |
| | | | | | |
| $ | 912,547 | | | $ | 256,604 | |
| | 4,546 | | | | 1,149 | |
| | 11,296 | | | | 52 | |
| | 132,805 | | | | 0 | |
| | |
| | 1,061,194 | | | | 257,805 | |
| | |
| |
| | | | | | |
| | 140,793 | | | | 44,834 | |
| | 6,885 | | | | 5,339 | |
| | 23,413 | | | | 29,875 | |
| | 717 | | | | 163 | |
| | 12,127 | | | | 12,290 | |
| | 4,288 | | | | 2,452 | |
| | |
| | 188,223 | | | | 94,953 | |
| | (33,844 | ) | | | (34,352 | ) |
| | |
| | 154,379 | | | | 60,601 | |
| | |
| | 906,815 | | | | 197,204 | |
| | |
| |
| | | | | | |
| |
| | | | | | |
| | 212,438 | | | | 7,321 | |
| | (6,048 | ) | | | 3,374 | |
| | 0 | | | | 0 | |
| | |
| | 206,390 | | | | 10,695 | |
| | |
| |
| | | | | | |
| | (1,032,338 | ) | | | (124,844 | ) |
| | 21 | | | | 0 | |
| | 7,216 | | | | 5,956 | |
| | |
| | (1,025,101 | ) | | | (118,888 | ) |
| | |
| | (818,711 | ) | | | (108,193 | ) |
| | |
| $ | 88,104 | | | $ | 89,011 | |
| | |
| |
| | $0 | | | | $0 | |
| | $4,566 | | | | $0 | |
The accompanying notes are an integral part of these financial statements.
| | | | |
| 122 | | Wells Fargo Allocation Funds | | Statements of changes in net assets |
| | | | | | | | |
| | | C&B Large Cap Value Portfolio | |
| | | Six months ended
November 30, 2016 (unaudited) | | | Year ended
May 31, 2016 | |
| | |
Operations | | | | | | | | |
Net investment income | | $ | 1,770,658 | | | $ | 4,128,282 | |
Net realized gains on investments | | | 8,791,368 | | | | 14,000,084 | |
Net change in unrealized gains (losses) on investments | | | 13,101,300 | | | | (18,760,215 | ) |
| | | | |
Net increase (decrease) in net assets resulting from operations | | | 23,663,326 | | | | (631,849 | ) |
| | | | |
| | |
Capital share transactions | | | | | | | | |
Transactions in investors’ beneficial interests | | | | | | | | |
Contributions | | | 57,623,968 | | | | 38,393,377 | |
Withdrawals | | | (31,254,356 | ) | | | (80,332,043 | ) |
| | | | |
Net increase (decrease) in net assets resulting from capital share transactions | | | 26,369,612 | | | | (41,938,666 | ) |
| | | | |
Total increase (decrease) in net assets | | | 50,032,938 | | | | (42,570,515 | ) |
| | | | |
| | |
Net assets | | | | | | | | |
Beginning of period | | | 292,964,289 | | | | 335,534,804 | |
| | | | |
End of period | | $ | 342,997,227 | | | $ | 292,964,289 | |
| | | | |
The accompanying notes are an integral part of these financial statements.
| | | | | | |
| Statements of changes in net assets | | Wells Fargo Allocation Funds | | | 123 | |
| | | | | | | | |
| | | Diversified Large Cap Growth Portfolio | |
| | | Six months ended
November 30, 2016 (unaudited) | | | Year ended
May 31, 2016 | |
| | |
Operations | | | | | | | | |
Net investment income | | $ | 265,442 | | | $ | 336,085 | |
Net realized gains on investments | | | 3,915,816 | | | | 5,117,947 | |
Net change in unrealized gains (losses) on investments | | | (3,207,757 | ) | | | (7,846,480 | ) |
| | | | |
Net increase (decrease) in net assets resulting from operations | | | 973,501 | | | | (2,392,448 | ) |
| | | | |
| | |
Capital share transactions | | | | | | | | |
Transactions in investors’ beneficial interests | | | | | | | | |
Contributions | | | 1,585,353 | | | | 7,089,759 | |
Withdrawals | | | (12,354,362 | ) | | | (12,268,696 | ) |
| | | | |
Net decrease in net assets resulting from capital share transactions | | | (10,769,009 | ) | | | (5,178,937 | ) |
| | | | |
Total decrease in net assets | | | (9,795,508 | ) | | | (7,571,385 | ) |
| | | | |
| | |
Net assets | | | | | | | | |
Beginning of period | | | 115,758,476 | | | | 123,329,861 | |
| | | | |
End of period | | $ | 105,962,968 | | | $ | 115,758,476 | |
| | | | |
The accompanying notes are an integral part of these financial statements.
| | | | |
| 124 | | Wells Fargo Allocation Funds | | Statements of changes in net assets |
| | | | | | | | |
| | | Emerging Growth Portfolio | |
| | | Six months ended
November 30, 2016 (unaudited) | | | Year ended
May 31, 2016 | |
| | |
Operations | | | | | | | | |
Net investment income (loss) | | $ | 864,110 | | | $ | (3,962,052 | ) |
Net realized gains on investments | | | 77,141,486 | | | | 18,746,231 | |
Net change in unrealized gains (losses) on investments | | | 37,142,142 | | | | (175,228,106 | ) |
| | | | |
Net increase (decrease) in net assets resulting from operations | | | 115,147,738 | | | | (160,443,927 | ) |
| | | | |
| | |
Capital share transactions | | | | | | | | |
Transactions in investors’ beneficial interests | | | | | | | | |
Contributions | | | 39,242,680 | | | | 105,565,223 | |
Withdrawals | | | (247,146,805 | ) | | | (194,401,064 | ) |
| | | | |
Net decrease in net assets resulting from capital share transactions | | | (207,904,125 | ) | | | (88,835,841 | ) |
| | | | |
Total decrease in net assets | | | (92,756,387 | ) | | | (249,279,768 | ) |
| | | | |
| | |
Net assets | | | | | | | | |
Beginning of period | | | 898,487,665 | | | | 1,147,767,433 | |
| | | | |
End of period | | $ | 805,731,278 | | | $ | 898,487,665 | |
| | | | |
The accompanying notes are an integral part of these financial statements.
| | | | | | |
| Statements of changes in net assets | | Wells Fargo Allocation Funds | | | 125 | |
| | | | | | | | |
| | | Index Portfolio | |
| | | Six months ended
November 30, 2016
(unaudited) | | | Year ended
May 31, 2016 | |
| | |
Operations | | | | | | | | |
Net investment income | | $ | 24,643,075 | | | $ | 51,941,420 | |
Net realized gains on investments | | | 119,108,101 | | | | 154,402,400 | |
Net change in unrealized gains (losses) on investments | | | (11,318,796 | ) | | | (179,622,273 | ) |
| | | | |
Net increase in net assets resulting from operations | | | 132,432,380 | | | | 26,721,547 | |
| | | | |
| | |
Capital share transactions | | | | | | | | |
Transactions in investors’ beneficial interests | | | | | | | | |
Contributions | | | 17,832,463 | | | | 66,728,942 | |
Withdrawals | | | (258,064,773 | ) | | | (523,281,965 | ) |
| | | | |
Net decrease in net assets resulting from capital share transactions | | | (240,232,310 | ) | | | (456,553,023 | ) |
| | | | |
Total decrease in net assets | | | (107,799,930 | ) | | | (429,831,476 | ) |
| | | | |
| | |
Net assets | | | | | | | | |
Beginning of period | | | 2,340,412,458 | | | | 2,770,243,934 | |
| | | | |
End of period | | $ | 2,232,612,528 | | | $ | 2,340,412,458 | |
| | | | |
The accompanying notes are an integral part of these financial statements.
| | | | |
| 126 | | Wells Fargo Allocation Funds | | Statements of changes in net assets |
| | | | | | | | |
| | | International Growth Portfolio | |
| | | Six months ended
November 30, 2016
(unaudited) | | | Year ended
May 31, 2016 | |
| | |
Operations | | | | | | | | |
Net investment income | | $ | 254,117 | | | $ | 1,728,257 | |
Net realized gains (losses) on investments | | | 1,849,926 | | | | (1,635,815 | ) |
Net change in unrealized gains (losses) on investments | | | (11,938,708 | ) | | | (20,243,476 | ) |
| | | | |
Net decrease in net assets resulting from operations | | | (9,834,665 | ) | | | (20,151,034 | ) |
| | | | |
| | |
Capital share transactions | | | | | | | | |
Transactions in investors’ beneficial interests | | | | | | | | |
Contributions | | | 2,143,369 | | | | 15,674,750 | |
Withdrawals | | | (6,410,552 | ) | | | (5,551,430 | ) |
| | | | |
Net increase (decrease) in net assets resulting from capital share transactions | | | (4,267,183 | ) | | | 10,123,320 | |
| | | | |
Total decrease in net assets | | | (14,101,848 | ) | | | (10,027,714 | ) |
| | | | |
| | |
Net assets | | | | | | | | |
Beginning of period | | | 148,376,615 | | | | 158,404,329 | |
| | | | |
End of period | | $ | 134,274,767 | | | $ | 148,376,615 | |
| | | | |
The accompanying notes are an integral part of these financial statements.
| | | | | | |
| Statements of changes in net assets | | Wells Fargo Allocation Funds | | | 127 | |
| | | | | | | | |
| | | International Value Portfolio | |
| | | Six months ended
November 30, 2016
(unaudited) | | | Year ended
May 31, 2016 | |
| | |
Operations | | | | | | | | |
Net investment income | | $ | 4,765,321 | | | $ | 12,349,092 | |
Net realized losses on investments | | | (8,465,722 | ) | | | (1,517,228 | ) |
Net change in unrealized gains (losses) on investments | | | 11,363,149 | | | | (73,474,825 | ) |
| | | | |
Net increase (decrease) in net assets resulting from operations | | | 7,662,748 | | | | (62,642,961 | ) |
| | | | |
| | |
Capital share transactions | | | | | | | | |
Transactions in investors’ beneficial interests | | | | | | | | |
Contributions | | | 62,062,545 | | | | 46,792,442 | |
Withdrawals | | | (36,915,264 | ) | | | (10,044,159 | ) |
| | | | |
Net increase in net assets resulting from capital share transactions | | | 25,147,281 | | | | 36,748,283 | |
| | | | |
Total increase (decrease) in net assets | | | 32,810,029 | | | | (25,894,678 | ) |
| | | | |
| | |
Net assets | | | | | | | | |
Beginning of period | | | 508,318,970 | | | | 534,213,648 | |
| | | | |
End of period | | $ | 541,128,999 | | | $ | 508,318,970 | |
| | | | |
The accompanying notes are an integral part of these financial statements.
| | | | |
| 128 | | Wells Fargo Allocation Funds | | Statements of changes in net assets |
| | | | | | | | |
| | | Large Company Value Portfolio | |
| | | Six months ended
November 30, 2016
(unaudited) | | | Year ended
May 31, 2016 | |
| | |
Operations | | | | | | | | |
Net investment income | | $ | 539,250 | | | $ | 1,196,671 | |
Net realized gains (losses) on investments | | | 2,024,711 | | | | (1,089,821 | ) |
Net change in unrealized gains (losses) on investments | | | 2,642,310 | | | | (3,378,107 | ) |
| | | | |
Net increase (decrease) in net assets resulting from operations | | | 5,206,271 | | | | (3,271,257 | ) |
| | | | |
| | |
Capital share transactions | | | | | | | | |
Transactions in investors’ beneficial interests | | | | | | | | |
Contributions | | | 474,857 | | | | 6,867,155 | |
Withdrawals | | | (9,985,455 | ) | | | (6,977,356 | ) |
| | | | |
Net decrease in net assets resulting from capital share transactions | | | (9,510,598 | ) | | | (110,201 | ) |
| | | | |
Total decrease in net assets | | | (4,304,327 | ) | | | (3,381,458 | ) |
| | | | |
| | |
Net assets | | | | | | | | |
Beginning of period | | | 79,114,830 | | | | 82,496,288 | |
| | | | |
End of period | | $ | 74,810,503 | | | $ | 79,114,830 | |
| | | | |
The accompanying notes are an integral part of these financial statements.
| | | | | | |
| Statements of changes in net assets | | Wells Fargo Allocation Funds | | | 129 | |
| | | | | | | | |
| | | Small Company Growth Portfolio | |
| | | Six months ended
November 30, 2016
(unaudited) | | | Year ended
May 31, 2016 | |
| | |
Operations | | | | | | | | |
Net investment loss | | $ | (546,938 | ) | | $ | (288,808 | ) |
Net realized gains (losses) on investments | | | 7,468,252 | | | | (95,998,247 | ) |
Net change in unrealized gains (losses) on investments | | | 136,432,856 | | | | (55,183,521 | ) |
| | | | |
Net increase (decrease) in net assets resulting from operations | | | 143,354,170 | | | | (151,470,576 | ) |
| | | | |
| | |
Capital share transactions | | | | | | | | |
Transactions in investors’ beneficial interests | | | | | | | | |
Contributions | | | 287,537,092 | | | | 708,902,550 | |
Withdrawals | | | (112,125,224 | ) | | | (112,220,954 | ) |
| | | | |
Net increase in net assets resulting from capital share transactions | | | 175,411,868 | | | | 596,681,596 | |
| | | | |
Total increase in net assets | | | 318,766,038 | | | | 445,211,020 | |
| | | | |
| | |
Net assets | | | | | | | | |
Beginning of period | | | 1,196,596,440 | | | | 751,385,420 | |
| | | | |
End of period | | $ | 1,515,362,478 | | | $ | 1,196,596,440 | |
| | | | |
The accompanying notes are an integral part of these financial statements.
| | | | |
| 130 | | Wells Fargo Allocation Funds | | Statements of changes in net assets |
| | | | | | | | |
| | | Small Company Value Portfolio | |
| | | Six months ended
November 30, 2016 (unaudited) | | | Year ended
May 31, 2016 | |
| | |
Operations | | | | | | | | |
Net investment income | | $ | 894,543 | | | $ | 1,286,924 | |
Net realized gains on investments | | | 14,766,624 | | | | 12,552,384 | |
Net change in unrealized gains (losses) on investments | | | 16,403,463 | | | | (24,625,962 | ) |
| | | | |
Net increase (decrease) in net assets resulting from operations | | | 32,064,630 | | | | (10,786,654 | ) |
| | | | |
| | |
Capital share transactions | | | | | | | | |
Transactions in investors’ beneficial interests | | | | | | | | |
Contributions | | | 14,301,944 | | | | 36,132,062 | |
Withdrawals | | | (38,988,536 | ) | | | (23,471,861 | ) |
| | | | |
Net increase (decrease) in net assets resulting from capital share transactions | | | (24,686,592 | ) | | | 12,660,201 | |
| | | | |
Total increase in net assets | | | 7,378,038 | | | | 1,873,547 | |
| | | | |
| | |
Net assets | | | | | | | | |
Beginning of period | | | 217,569,770 | | | | 215,696,223 | |
| | | | |
End of period | | $ | 224,947,808 | | | $ | 217,569,770 | |
| | | | |
The accompanying notes are an integral part of these financial statements.
| | | | | | |
| Statements of changes in net assets | | Wells Fargo Allocation Funds | | | 131 | |
| | | | | | | | |
| | | Core Bond Portfolio | |
| | | Six months ended
November 30, 2016 (unaudited) | | | Year ended
May 31, 2016 | |
| | |
Operations | | | | | | | | |
Net investment income | | $ | 41,960,110 | | | $ | 71,646,971 | |
Net realized gains on investments | | | 27,685,256 | | | | 33,744,871 | |
Net change in unrealized gains (losses) on investments | | | (126,596,991 | ) | | | 4,164,647 | |
| | | | |
Net increase (decrease) in net assets resulting from operations | | | (56,951,625 | ) | | | 109,556,489 | |
| | | | |
| | |
Capital share transactions | | | | | | | | |
Transactions in investors’ beneficial interests | | | | | | | | |
Contributions | | | 1,064,955,273 | | | | 1,207,036,360 | |
Withdrawals | | | (129,492,556 | ) | | | (728,304,768 | ) |
| | | | |
Net increase in net assets resulting from capital share transactions | | | 935,462,717 | | | | 478,731,592 | |
| | | | |
Total increase in net assets | | | 878,511,092 | | | | 588,288,081 | |
| | | | |
| | |
Net assets | | | | | | | | |
Beginning of period | | | 4,340,835,058 | | | | 3,752,546,977 | |
| | | | |
End of period | | $ | 5,219,346,150 | | | $ | 4,340,835,058 | |
| | | | |
The accompanying notes are an integral part of these financial statements.
| | | | |
| 132 | | Wells Fargo Allocation Funds | | Statements of changes in net assets |
| | | | | | | | |
| | | Managed Fixed Income Portfolio | |
| | | Six months ended
November 30, 2016
(unaudited) | | | Year ended
May 31, 2016 | |
| | |
Operations | | | | | | | | |
Net investment income | | $ | 1,817,945 | | | $ | 3,776,941 | |
Net realized gains on investments | | | 392,018 | | | | 1,250,302 | |
Net change in unrealized gains (losses) on investments | | | (1,942,633 | ) | | | (257,799 | ) |
| | | | |
Net increase in net assets resulting from operations | | | 267,330 | | | | 4,769,444 | |
| | | | |
| | |
Capital share transactions | | | | | | | | |
Transactions in investors’ beneficial interests | | | | | | | | |
Contributions | | | 5,212,499 | | | | 18,117,390 | |
Withdrawals | | | (18,451,966 | ) | | | (17,218,838 | ) |
| | | | |
Net increase (decrease) in net assets resulting from capital share transactions | | | (13,239,467 | ) | | | 898,552 | |
| | | | |
Total increase (decrease) in net assets | | | (12,972,137 | ) | | | 5,667,996 | |
| | | | |
| | |
Net assets | | | | | | | | |
Beginning of period | | | 126,753,730 | | | | 121,085,734 | |
| | | | |
End of period | | $ | 113,781,593 | | | $ | 126,753,730 | |
| | | | |
The accompanying notes are an integral part of these financial statements.
| | | | | | |
| Statements of changes in net assets | | Wells Fargo Allocation Funds | | | 133 | |
| | | | | | | | |
| | | Real Return Portfolio | |
| | | Six months ended
November 30, 2016
(unaudited) | | | Year ended
May 31, 2016 | |
| | |
Operations | | | | | | | | |
Net investment income | | $ | 906,815 | | | $ | 809,383 | |
Net realized gains (losses) on investments | | | 206,390 | | | | (131,670 | ) |
Net change in unrealized gains (losses) on investments | | | (1,025,101 | ) | | | 484,975 | |
| | | | |
Net increase in net assets resulting from operations | | | 88,104 | | | | 1,162,688 | |
| | | | |
| | |
Capital share transactions | | | | | | | | |
Transactions in investors’ beneficial interests | | | | | | | | |
Contributions | | | 15,019,507 | | | | 29,489,684 | |
Withdrawals | | | (6,245,523 | ) | | | (14,951,275 | ) |
| | | | |
Net increase in net assets resulting from capital share transactions | | | 8,773,984 | | | | 14,538,409 | |
| | | | |
Total increase in net assets | | | 8,862,088 | | | | 15,701,097 | |
| | | | |
| | |
Net assets | | | | | | | | |
Beginning of period | | | 64,097,881 | | | | 48,396,784 | |
| | | | |
End of period | | $ | 72,959,969 | | | $ | 64,097,881 | |
| | | | |
The accompanying notes are an integral part of these financial statements.
| | | | |
| 134 | | Wells Fargo Allocation Funds | | Statements of changes in net assets |
| | | | | | | | |
| | | Stable Income Portfolio | |
| | | Six months ended
November 30, 2016
(unaudited) | | | Year ended
May 31, 2016 | |
| | |
Operations | | | | | | | | |
Net investment income | | $ | 197,204 | | | $ | 339,242 | |
Net realized gains (losses) on investments | | | 10,695 | | | | (28,391 | ) |
Net change in unrealized gains (losses) on investments | | | (118,888 | ) | | | (82,401 | ) |
| | | | |
Net increase in net assets resulting from operations | | | 89,011 | | | | 228,450 | |
| | | | |
| | |
Capital share transactions | | | | | | | | |
Transactions in investors’ beneficial interests | | | | | | | | |
Contributions | | | 1,904,166 | | | | 5,915,120 | |
Withdrawals | | | (4,585,527 | ) | | | (2,801,173 | ) |
| | | | |
Net increase (decrease) in net assets resulting from capital share transactions | | | (2,681,361 | ) | | | 3,113,947 | |
| | | | |
Total increase (decrease) in net assets | | | (2,592,350 | ) | | | 3,342,397 | |
| | | | |
| | |
Net assets | | | | | | | | |
Beginning of period | | | 30,418,201 | | | | 27,075,804 | |
| | | | |
End of period | | $ | 27,825,851 | | | $ | 30,418,201 | |
| | | | |
The accompanying notes are an integral part of these financial statements.
| | | | | | |
| Financial highlights | | Wells Fargo Allocation Funds | | | 135 | |
| | | | | | | | | | | | | | | | | | | | |
| | | Ratio to average net assets (annualized) | | | Total
return1 | | | Portfolio turnover
rate | |
| | | Net investment
income (loss) | | | Gross
expenses | | | Net
expenses | | | |
| | | | | |
C&B Large Cap Value Portfolio | | | | | | | | | | | | | | | | | | | | |
Six months ended November 30, 2016 (unaudited) | | | 1.12 | % | | | 0.68 | % | | | 0.68 | % | | | 7.80 | % | | | 32 | % |
Year ended May 31, 2016 | | | 1.33 | % | | | 0.68 | % | | | 0.68 | % | | | 0.35 | % | | | 29 | % |
Year ended May 31, 2015 | | | 1.20 | % | | | 0.68 | % | | | 0.68 | % | | | 10.29 | % | | | 35 | % |
Year ended May 31, 2014 | | | 1.35 | % | | | 0.68 | % | | | 0.68 | % | | | 17.80 | % | | | 22 | % |
Year ended May 31, 2013 | | | 1.73 | % | | | 0.68 | % | | | 0.68 | % | | | 29.30 | % | | | 18 | % |
Year ended May 31, 2012 | | | 1.81 | % | | | 0.68 | % | | | 0.68 | % | | | (4.61 | )% | | | 21 | % |
| | | | | |
Diversified Large Cap Growth Portfolio | | | | | | | | | | | | | | | | | | | | |
Six months ended November 30, 2016 (unaudited) | | | 0.47 | % | | | 0.77 | % | | | 0.62 | % | | | 0.77 | % | | | 36 | % |
Year ended May 31, 2016 | | | 0.29 | % | | | 0.74 | % | | | 0.62 | % | | | (2.28 | )% | | | 59 | % |
Year ended May 31, 2015 | | | 0.28 | % | | | 0.72 | % | | | 0.62 | % | | | 13.11 | % | | | 46 | % |
Year ended May 31, 2014 | | | 0.15 | % | | | 0.72 | % | | | 0.62 | % | | | 21.70 | % | | | 54 | % |
Year ended May 31, 2013 | | | 0.51 | % | | | 0.71 | % | | | 0.62 | % | | | 20.30 | % | | | 56 | % |
Year ended May 31, 2012 | | | 0.24 | % | | | 0.71 | % | | | 0.62 | % | | | 1.26 | % | | | 79 | % |
| | | | | |
Emerging Growth Portfolio | | | | | | | | | | | | | | | | | | | | |
Six months ended November 30, 2016 (unaudited) | | | 0.20 | % | | | 0.81 | % | | | 0.81 | % | | | 14.08 | % | | | 50 | % |
Year ended May 31, 2016 | | | (0.40 | )% | | | 0.80 | % | | | 0.80 | % | | | (14.47 | )% | | | 66 | % |
Year ended May 31, 2015 | | | (0.63 | )% | | | 0.80 | % | | | 0.80 | % | | | 24.02 | % | | | 56 | % |
Year ended May 31, 2014 | | | (0.62 | )% | | | 0.80 | % | | | 0.80 | % | | | 11.92 | % | | | 63 | % |
Year ended May 31, 2013 | | | (0.47 | )% | | | 0.80 | % | | | 0.80 | % | | | 20.53 | % | | | 65 | % |
Year ended May 31, 2012 | | | (0.57 | )% | | | 0.80 | % | | | 0.80 | % | | | (4.83 | )% | | | 75 | % |
| | | | | |
Index Portfolio | | | | | | | | | | | | | | | | | | | | |
Six months ended November 30, 2016 (unaudited) | | | 2.15 | % | | | 0.10 | % | | | 0.10 | % | | | 5.95 | % | | | 5 | % |
Year ended May 31, 2016 | | | 2.12 | % | | | 0.11 | % | | | 0.10 | % | | | 1.62 | % | | | 4 | % |
Year ended May 31, 2015 | | | 1.96 | % | | | 0.11 | % | | | 0.11 | % | | | 11.69 | % | | | 4 | % |
Year ended May 31, 2014 | | | 1.99 | % | | | 0.10 | % | | | 0.10 | % | | | 20.33 | % | | | 5 | % |
Year ended May 31, 2013 | | | 2.20 | % | | | 0.09 | % | | | 0.09 | % | | | 27.22 | % | | | 4 | % |
Year ended May 31, 2012 | | | 2.09 | % | | | 0.10 | % | | | 0.10 | % | | | (0.52 | )% | | | 9 | % |
| | | | | |
International Growth Portfolio | | | | | | | | | | | | | | | | | | | | |
Six months ended November 30, 2016 (unaudited) | | | 0.35 | % | | | 0.99 | % | | | 0.99 | % | | | (6.84 | )% | | | 59 | % |
Year ended May 31, 2016 | | | 1.16 | % | | | 0.99 | % | | | 0.99 | % | | | (12.40 | )% | | | 62 | % |
Year ended May 31, 2015 | | | 0.76 | % | | | 1.00 | % | | | 1.00 | % | | | 5.13 | % | | | 51 | % |
Year ended May 31, 2014 | | | 1.13 | % | | | 1.00 | % | | | 1.00 | % | | | 16.45 | % | | | 46 | % |
Year ended May 31, 2013 | | | 1.63 | % | | | 1.04 | % | | | 1.04 | % | | | 30.34 | % | | | 46 | % |
Year ended May 31, 2012 | | | 2.04 | % | | | 0.97 | % | | | 0.90 | % | | | (9.44 | )% | | | 69 | % |
| | | | | |
International Value Portfolio | | | | | | | | | | | | | | | | | | | | |
Six months ended November 30, 2016 (unaudited) | | | 1.92 | % | | | 0.90 | % | | | 0.90 | % | | | 1.41 | % | | | 15 | % |
Year ended May 31, 2016 | | | 2.50 | % | | | 0.91 | % | | | 0.91 | % | | | (11.85 | )% | | | 14 | % |
Year ended May 31, 2015 | | | 2.45 | % | | | 0.91 | % | | | 0.91 | % | | | (1.04 | )% | | | 18 | % |
Year ended May 31, 2014 | | | 3.09 | % | | | 0.91 | % | | | 0.91 | % | | | 18.22 | % | | | 11 | % |
Year ended May 31, 2013 | | | 3.04 | % | | | 0.91 | % | | | 0.91 | % | | | 29.45 | % | | | 16 | % |
Year ended May 31, 2012 | | | 3.44 | % | | | 0.91 | % | | | 0.85 | % | | | (21.07 | )% | | | 9 | % |
| | | | | |
Large Company Value Portfolio | | | | | | | | | | | | | | | | | | | | |
Six months ended November 30, 2016 (unaudited) | | | 1.38 | % | | | 0.77 | % | | | 0.74 | % | | | 7.09 | % | | | 33 | % |
Year ended May 31, 2016 | | | 1.54 | % | | | 0.76 | % | | | 0.74 | % | | | (3.92 | )% | | | 50 | % |
Year ended May 31, 2015 | | | 1.09 | % | | | 0.74 | % | | | 0.74 | % | | | 7.90 | % | | | 72 | % |
Year ended May 31, 2014 | | | 0.99 | % | | | 0.73 | % | | | 0.73 | % | | | 20.26 | % | | | 62 | % |
Year ended May 31, 2013 | | | 1.49 | % | | | 0.78 | % | | | 0.74 | % | | | 28.91 | % | | | 95 | % |
Year ended May 31, 2012 | | | 1.67 | % | | | 0.77 | % | | | 0.74 | % | | | (6.06 | )% | | | 104 | % |
Please see footnote on page 136.
The accompanying notes are an integral part of these financial statements.
| | | | |
| 136 | | Wells Fargo Allocation Funds | | Financial highlights |
| | | | | | | | | | | | | | | | | | | | |
| | | Ratio to average net assets (annualized) | | | Total
return1 | | | Portfolio turnover
rate | |
| | | Net investment
income (loss) | | | Gross
expenses | | | Net
expenses | | | |
| | | | | |
Small Company Growth Portfolio | | | | | | | | | | | | | | | | | | | | |
Six months ended November 30, 2016 (unaudited) | | | (0.08 | )% | | | 0.79 | % | | | 0.79 | % | | | 11.25 | % | | | 35 | % |
Year ended May 31, 2016 | | | (0.03 | )% | | | 0.80 | % | | | 0.80 | % | | | (13.86 | )% | | | 49 | % |
Year ended May 31, 2015 | | | (0.32 | )% | | | 0.82 | % | | | 0.82 | % | | | 18.07 | % | | | 58 | % |
Year ended May 31, 2014 | | | (0.37 | )% | | | 0.83 | % | | | 0.83 | % | | | 23.47 | % | | | 77 | % |
Year ended May 31, 2013 | | | (0.02 | )% | | | 0.86 | % | | | 0.86 | % | | | 31.39 | % | | | 109 | % |
Year ended May 31, 2012 | | | (0.12 | )% | | | 0.83 | % | | | 0.83 | % | | | (10.75 | )% | | | 107 | % |
| | | | | |
Small Company Value Portfolio | | | | | | | | | | | | | | | | | | | | |
Six months ended November 30, 2016 (unaudited) | | | 0.82 | % | | | 0.84 | % | | | 0.84 | % | | | 15.63 | % | | | 55 | % |
Year ended May 31, 2016 | | | 0.62 | % | | | 0.85 | % | | | 0.85 | % | | | (4.96 | )% | | | 72 | % |
Year ended May 31, 2015 | | | 0.89 | % | | | 0.84 | % | | | 0.84 | % | | | 7.29 | % | | | 54 | % |
Year ended May 31, 2014 | | | 0.89 | % | | | 0.85 | % | | | 0.85 | % | | | 18.09 | % | | | 47 | % |
Year ended May 31, 2013 | | | 0.58 | % | | | 0.85 | % | | | 0.85 | % | | | 30.76 | % | | | 57 | % |
Year ended May 31, 2012 | | | 0.69 | % | | | 0.84 | % | | | 0.84 | % | | | (7.17 | )% | | | 60 | % |
| | | | | |
Core Bond Portfolio | | | | | | | | | | | | | | | | | | | | |
Six months ended November 30, 2016 (unaudited) | | | 1.71 | % | | | 0.35 | % | | | 0.35 | % | | | (0.70 | )% | | | 252 | % |
Year ended May 31, 2016 | | | 1.86 | % | | | 0.36 | % | | | 0.35 | % | | | 2.78 | % | | | 667 | % |
Year ended May 31, 2015 | | | 1.82 | % | | | 0.37 | % | | | 0.35 | % | | | 3.22 | % | | | 586 | % |
Year ended May 31, 2014 | | | 1.94 | % | | | 0.37 | % | | | 0.35 | % | | | 2.90 | % | | | 646 | % |
Year ended May 31, 2013 | | | 1.75 | % | | | 0.37 | % | | | 0.35 | % | | | 2.61 | % | | | 547 | % |
Year ended May 31, 2012 | | | 2.33 | % | | | 0.37 | % | | | 0.35 | % | | | 8.20 | % | | | 803 | % |
| | | | | |
Managed Fixed Income Portfolio | | | | | | | | | | | | | | | | | | | | |
Six months ended November 30, 2016 (unaudited) | | | 2.90 | % | | | 0.48 | % | | | 0.39 | % | | | 0.00 | % | | | 17 | % |
Year ended May 31, 2016 | | | 3.12 | % | | | 0.48 | % | | | 0.39 | % | | | 3.95 | % | | | 25 | % |
Year ended May 31, 2015 | | | 3.20 | % | | | 0.48 | % | | | 0.39 | % | | | 4.23 | % | | | 31 | % |
Year ended May 31, 2014 | | | 3.33 | % | | | 0.48 | % | | | 0.39 | % | | | 3.07 | % | | | 35 | % |
Year ended May 31, 2013 | | | 3.42 | % | | | 0.47 | % | | | 0.39 | % | | | 4.81 | % | | | 49 | % |
Year ended May 31, 2012 | | | 3.83 | % | | | 0.46 | % | | | 0.39 | % | | | 6.97 | % | | | 51 | % |
| | | | | |
Real Return Portfolio | | | | | | | | | | | | | | | | | | | | |
Six months ended November 30, 2016 (unaudited) | | | 2.58 | % | | | 0.53 | % | | | 0.44 | % | | | 0.38 | % | | | 10 | % |
Year ended May 31, 2016 | | | 1.45 | % | | | 0.56 | % | | | 0.44 | % | | | 1.29 | % | | | 29 | % |
Year ended May 31, 2015 | | | 0.89 | % | | | 0.57 | % | | | 0.44 | % | | | 1.50 | % | | | 57 | % |
Year ended May 31, 2014 | | | 1.45 | % | | | 0.53 | % | | | 0.44 | % | | | (0.26 | )% | | | 9 | % |
Year ended May 31, 2013 | | | 1.52 | % | | | 0.50 | % | | | 0.44 | % | | | (1.86 | )% | | | 15 | % |
Year ended May 31, 2012 | | | 3.00 | % | | | 0.48 | % | | | 0.44 | % | | | 12.62 | % | | | 23 | % |
| | | | | |
Stable Income Portfolio | | | | | | | | | | | | | | | | | | | | |
Six months ended November 30, 2016 (unaudited) | | | 1.32 | % | | | 0.64 | % | | | 0.41 | % | | | 0.27 | % | | | 24 | % |
Year ended May 31, 2016 | | | 1.22 | % | | | 0.62 | % | | | 0.41 | % | | | 0.83 | % | | | 20 | % |
Year ended May 31, 2015 | | | 1.20 | % | | | 0.64 | % | | | 0.41 | % | | | 0.89 | % | | | 26 | % |
Year ended May 31, 2014 | | | 1.41 | % | | | 0.66 | % | | | 0.41 | % | | | 1.52 | % | | | 33 | % |
Year ended May 31, 2013 | | | 1.50 | % | | | 0.58 | % | | | 0.41 | % | | | 2.78 | % | | | 20 | % |
Year ended May 31, 2012 | | | 1.76 | % | | | 0.59 | % | | | 0.41 | % | | | 1.71 | % | | | 11 | % |
| 1 | Returns for periods of less than one year are not annualized. |
The accompanying notes are an integral part of these financial statements.
| | | | | | |
| Notes to financial statements (unaudited) | | Wells Fargo Allocation Funds | | | 137 | |
1. ORGANIZATION
Wells Fargo Master Trust (the “Trust”), a Delaware statutory trust organized on March 10, 1999, is an open-end management investment company registered under the Investment Company Act of 1940, as amended (the “1940 Act”). As an investment company, the Trust follows the accounting and reporting guidance in Financial Accounting Standards Board (“FASB”) Accounting Standards Codification Topic 946, Financial Services – Investment Companies. These financial statements report on the following portfolios: Wells Fargo C&B Large Cap Value Portfolio (“C&B Large Cap Value Portfolio”), Wells Fargo Diversified Large Cap Growth Portfolio (“Diversified Large Cap Growth Portfolio”), Wells Fargo Emerging Growth Portfolio (“Emerging Growth Portfolio”), Wells Fargo Index Portfolio (“Index Portfolio”), Wells Fargo International Growth Portfolio (“International Growth Portfolio”), Wells Fargo International Value Portfolio (“International Value Portfolio”), Wells Fargo Large Company Value Portfolio (“Large Company Value Portfolio”), Wells Fargo Small Company Growth Portfolio (“Small Company Growth Portfolio”), Wells Fargo Small Company Value Portfolio (“Small Company Value Portfolio”), Wells Fargo Core Bond Portfolio (“Core Bond Portfolio”), Wells Fargo Managed Fixed Income Portfolio (“Managed Fixed Income Portfolio”), Wells Fargo Real Return Portfolio (“Real Return Portfolio”), and Wells Fargo Stable Income Portfolio (“Stable Income Portfolio”) (each, a “Portfolio”, collectively, the “Portfolios”). Each Portfolio is a diversified series of the Trust.
The Portfolios, which are master portfolios in a master/feeder structure, offer their shares to multiple feeder funds and other affiliated master portfolios rather than directly to the public.
2. SIGNIFICANT ACCOUNTING POLICIES
The following significant accounting policies, which are consistently followed in the preparation of the financial statements of each Portfolio, are in conformity with U.S. generally accepted accounting principles which require management to make estimates and assumptions that affect the reported amounts of assets and liabilities, disclosure of contingent assets and liabilities at the date of the financial statements, and the reported amounts of revenues and expenses during the reporting period. Actual results could differ from those estimates.
Securities valuation
All investments are valued each business day as of the close of regular trading on the New York Stock Exchange (generally 4 p.m. Eastern Time), although the Portfolios may deviate from this calculation time under unusual or unexpected circumstances.
Equity securities and futures that are listed on a foreign or domestic exchange or market are valued at the official closing price or, if none, the last sales price. If no sale occurs on the principal exchange or market that day, the prior day’s price will be deemed “stale” and a fair value price will be determined in accordance with the Portfolio’s Valuation Procedures.
The values of securities denominated in foreign currencies are translated into U.S. dollars at rates provided by an independent foreign currency pricing source at a time each business day specified by the Management Valuation Team of Wells Fargo Funds Management, LLC (“Funds Management”).
Many securities markets and exchanges outside the U.S. close prior to the close of the New York Stock Exchange and therefore may not fully reflect trading or events that occur after the close of the principal exchange in which the foreign securities are traded, but before the close of the New York Stock Exchange. If such trading or events are expected to materially affect the value of such securities, then fair value pricing procedures approved by the Board of Trustees of the Portfolios are applied. These procedures take into account multiple factors including movements in U.S. securities markets after foreign exchanges close. Foreign securities that are fair valued under these procedures are categorized as Level 2 and the application of these procedures may result in transfers between Level 1 and Level 2. Depending on market activity, such fair valuations may be frequent. Such fair value pricing may result in net asset values that are higher or lower than net asset values based on the last reported sales price or latest quoted bid price. On November 30, 2016, such fair value pricing was not used in pricing foreign securities.
Debt securities are valued at the evaluated bid price provided by an independent pricing service or, if a reliable price is not available, the quoted bid price from an independent broker-dealer.
Investments in registered open-end investment companies are valued at net asset value. Interests in non-registered investment vehicles that are redeemable at net asset value are fair valued normally at net asset value.
Investments which are not valued using any of the methods discussed above are valued at their fair value, as determined in good faith by the Board of Trustees. The Board of Trustees has established a Valuation Committee comprised of the Trustees and has delegated to it the authority to take any actions regarding the valuation of portfolio securities that the
| | | | |
| 138 | | Wells Fargo Allocation Funds | | Notes to financial statements (unaudited) |
Valuation Committee deems necessary or appropriate, including determining the fair value of portfolio securities, unless the determination has been delegated to the Management Valuation Team. The Board of Trustees retains the authority to make or ratify any valuation decisions or approve any changes to the Valuation Procedures as it deems appropriate. On a quarterly basis, the Board of Trustees receives reports on any valuation actions taken by the Valuation Committee or the Management Valuation Team which may include items for ratification.
Valuations of fair valued securities are compared to the next actual sales price when available, or other appropriate market values, to assess the continued appropriateness of the fair valuation methodologies used. These securities are fair valued on a day-to-day basis, taking into consideration changes to appropriate market information and any significant changes to the inputs considered in the valuation process until there is a readily available price provided on an exchange or by an independent pricing service. Valuations received from an independent pricing service or independent broker-dealer quotes are periodically validated by comparisons to most recent trades and valuations provided by other independent pricing services in addition to the review of prices by the adviser and/or subadviser. Unobservable inputs used in determining fair valuations are identified based on the type of security, taking into consideration factors utilized by market participants in valuing the investment, knowledge about the issuer and the current market environment.
Foreign currency translation
The accounting records of the Portfolios are maintained in U.S. dollars. The value of other assets and liabilities denominated in foreign currencies are translated into U.S. dollars at rates provided by an independent foreign currency pricing source at a time each business day specified by the Management Valuation Team. Purchases and sales of securities, and income and expenses are converted at the rate of exchange on the respective dates of such transactions. Net realized foreign exchange gains or losses arise from sales of foreign currencies, currency gains or losses realized between the trade and settlement dates on securities transactions, and the difference between the amounts of dividends, interest and foreign withholding taxes recorded and the U.S. dollar equivalent of the amounts actually paid or received. Net unrealized foreign exchange gains and losses arise from changes in the fair value of assets and liabilities other than investments in securities resulting from changes in exchange rates. The changes in net assets arising from changes in exchange rates and the changes in net assets resulting from changes in market prices of securities are not separately presented. Such changes are included in net realized and unrealized gains or losses from investments.
Security loans
The Portfolios may lend its securities from time to time in order to earn additional income in the form of fees or interest on securities received as collateral or the investment of any cash received as collateral. The Portfolios continues to receive interest or dividends on the securities loaned. The Portfolios receives collateral in the form of cash or securities with a value at least equal to the value of the securities on loan. The value of the loaned securities is determined at the close of each business day and any additional required collateral is delivered to the Portfolios on the next business day. In a securities lending transaction, the net asset value of the Portfolio will be affected by an increase or decrease in the value of the securities loaned and by an increase or decrease in the value of the instrument in which collateral is invested. The amount of securities lending activity undertaken by the Portfolios fluctuates from time to time. In the event of default or bankruptcy by the borrower, the Portfolios may be prevented from recovering the loaned securities or gaining access to the collateral or may experience delays or costs in doing so. In addition, the investment of any cash collateral received may lose all or part of its value. The Portfolios has the right under the lending agreement to recover the securities from the borrower on demand.
The Portfolios lend their securities through an unaffiliated securities lending agent. Cash collateral received in connection with its securities lending transactions is invested in Securities Lending Cash Investments, LLC (the “Securities Lending Fund”). The Securities Lending Fund is exempt from registration under Section 3(c)(7) of the 1940 Act and is managed by Funds Management and is subadvised by Wells Capital Management Incorporated (“WellsCap”), an affiliate of Funds Management and an indirect wholly owned subsidiary of Wells Fargo & Company (“Wells Fargo”). Funds Management receives an advisory fee starting at 0.05% and declining to 0.01% as the average daily net assets of the Securities Lending Fund increase. All of the fees received by Funds Management are paid to WellsCap for its services as subadviser. The Securities Lending Fund seeks to provide a positive return compared to the daily Fed Funds Open Rate by investing in high-quality, U.S. dollar-denominated short-term money market instruments. Securities Lending Fund investments are valued at the evaluated bid price provided by an independent pricing service. Income earned from investment in the Securities Lending Fund is included in securities lending income on the Statements of Operations.
When-issued transactions
Each Portfolio may purchase securities on a forward commitment or when-issued basis. A Portfolio records a when-issued transaction on the trade date and will segregate assets in an amount at least equal in value to the Portfolio’s commitment
| | | | | | |
| Notes to financial statements (unaudited) | | Wells Fargo Allocation Funds | | | 139 | |
to purchase when-issued securities. Securities purchased on a when-issued basis are marked-to-market daily and the Portfolio begins earning interest on the settlement date. Losses may arise due to changes in the market value of the underlying securities or if the counterparty does not perform under the contract.
Loans
The Portfolios may invest in direct debt instruments which are interests in amounts owed to lenders by corporate or other borrowers. The loans pay interest at rates which are periodically reset by reference to a base lending rate plus a spread. Investments in loans may be in the form of participations in loans or assignments of all or a portion of loans from third parties. When a Portfolio purchases participations, it generally has no rights to enforce compliance with terms of the loan agreement with the borrower. As a result, the Portfolio assumes the credit risk of both the borrower and the lender that is selling the participation. When a Portfolio purchases assignments from lenders, it acquires direct rights against the borrower on the loan and may enforce compliance by the borrower with the terms of the loan agreement. Loans may include fully funded term loans or unfunded loan commitments, which are contractual obligations for future funding.
Futures contracts
The Portfolios are subject to interest rate risk or equity price risk in the normal course of pursuing its investment objectives. A Portfolio may buy and sell futures contracts in order to gain exposure to, or protect against, changes in security values and interest rates. The primary risks associated with the use of futures contracts are the imperfect correlation between changes in market values of securities held by the Portfolio and the prices of futures contracts, and the possibility of an illiquid market.
The aggregate principal amounts of the contracts are not recorded in the financial statements. Fluctuations in the value of the contracts are recorded in the Statements of Assets and Liabilities as an asset or liability and in the Statements of Operations as unrealized gains or losses until the contracts are closed, at which point they are recorded as net realized gains or losses on futures contracts. With futures contracts, there is minimal counterparty risk to the Portfolio since futures are exchange traded and the exchange’s clearinghouse, as counterparty to all exchange traded futures, guarantees the futures against default.
TBA sale commitments
Each Portfolio may enter into To Be Announced (“TBA”) sale commitments to hedge its portfolio positions or to sell mortgage-backed securities it owns under delayed delivery arrangements. Proceeds of TBA sale commitments are not received until the contractual settlement date. During the time a TBA sale commitment is outstanding, equivalent deliverable securities or offsetting TBA purchase commitments, which are deliverable on or before the sale commitment date, are held as “cover” for the transaction. Unsettled TBA sale commitments are valued at the current market value of the underlying securities, generally according to the procedures described under “Securities valuation”. The contract is marked-to-market daily and the change in market value is recorded by the Portfolio as an unrealized gain or loss. If the TBA sale commitment is closed through the acquisition of an offsetting purchase commitment, the Portfolio realizes a gain or loss. If the Portfolio delivers securities under the commitment, the Portfolio realizes a gain or a loss from the sale of the securities based upon the unit price established at the date the commitment was entered into.
Inflation-indexed bonds and TIPS
Each Portfolio may invest in inflation-indexed bonds, including Treasury inflation-protected securities (TIPS). Inflation-indexed bonds are fixed income securities whose principal value is periodically adjusted according to the rate of inflation. If the index measuring inflation falls, the principal value of inflation-indexed bonds (other than municipal inflation indexed bonds and certain corporate inflation-indexed bonds) will be adjusted downward, and consequently the interest payable on these securities (calculated with respect to a smaller principal amount) will be reduced. Repayment of the original bond principal upon maturity (as adjusted for inflation) is guaranteed in the case of U.S. Treasury inflation-indexed bonds. For bonds that do not provide a similar guarantee, the adjusted principal value of the bond repaid at maturity may be less than the original principal. The value of inflation-indexed bonds is expected to change in response to changes in real interest rates. Real interest rates are tied to the relationship between nominal interest rates and the rate of inflation. If nominal interest rates increase at a faster rate than inflation, real interest rates may rise, leading to a decrease in value of inflation-indexed bonds. Inflation-indexed bonds, including TIPS, decline in value when real interest rates rise. In certain interest rate environments, such as when real interest rates are rising faster than nominal interest rates, inflation-indexed bonds may experience greater losses than other fixed income securities with similar durations.
Security transactions and income recognition
Securities transactions are recorded on a trade date basis. Realized gains or losses are recorded on the basis of identified cost.
| | | | |
| 140 | | Wells Fargo Allocation Funds | | Notes to financial statements (unaudited) |
Dividend income is recognized on the ex-dividend date, except for certain dividends from foreign securities which are recorded as soon as the custodian verifies the ex-dividend date.
Interest income is accrued daily and bond discounts are accreted and premiums are amortized daily based on the effective interest method. To the extent debt obligations are placed on non-accrual status, any related interest income may be reduced by writing off interest receivables when the collection of all or a portion of interest has become doubtful based on consistently applied procedures. If the issuer subsequently resumes interest payments or when the collectability of interest is reasonably assured, the debt obligation is removed from non-accrual status.
Income from foreign securities is recorded net of foreign taxes withheld where recovery of such taxes is not assured.
Federal and other taxes
Each Portfolio is treated as a separate entity for federal income tax purposes. The Portfolios are not required to pay federal income taxes on their net investment income and net capital gain as they are treated as partnerships for federal income tax purposes. All interest, dividends, gains and losses of a Portfolio are deemed to have been “passed through” to the interest holders in proportion to their holdings of the Portfolio regardless of whether such interest, dividends and gains have been distributed by the Portfolio.
Each Portfolio’s income tax returns and all financial records supporting those returns for the prior three fiscal years are subject to examination by the federal revenue authority. Management has analyzed each Portfolio’s tax positions taken on federal, state, and foreign tax returns for all open tax years and does not believe that there are any uncertain tax positions that require recognition of a tax liability.
3. FAIR VALUATION MEASUREMENTS
Fair value measurements of investments are determined within a framework that has established a fair value hierarchy based upon the various data inputs utilized in determining the value of each Portfolio’s investments. The three-level hierarchy gives the highest priority to unadjusted quoted prices in active markets for identical assets or liabilities (Level 1) and the lowest priority to significant unobservable inputs (Level 3). Each Portfolio’s investments are classified within the fair value hierarchy based on the lowest level of input that is significant to the fair value measurement. The inputs are summarized into three broad levels as follows:
| ∎ | | Level 1 – quoted prices in active markets for identical securities |
| ∎ | | Level 2 – other significant observable inputs (including quoted prices for similar securities, interest rates, prepayment speeds, credit risk, use of amortized cost, etc.) |
| ∎ | | Level 3 – significant unobservable inputs (including the Portfolio’s own assumptions in determining the fair value of investments) |
The inputs or methodologies used for valuing investments in securities are not necessarily an indication of the risk associated with investing in those securities.
| | | | | | |
| Notes to financial statements (unaudited) | | Wells Fargo Allocation Funds | | | 141 | |
The following is a summary of the inputs used in valuing each Portfolio’s assets and liabilities as of November 30, 2016:
| | | | | | | | | | | | | | | | |
| C&B Large Cap Value Portfolio | | Quoted prices
(Level 1) | | | Other significant
observable inputs
(Level 2) | | | Significant
unobservable inputs
(Level 3) | | | Total | |
Assets | | | | | | | | | | | | | | | | |
Investments in: | | | | | | | | | | | | | | | | |
| | | | |
Common stocks | | | | | | | | | | | | | | | | |
Consumer discretionary | | $ | 45,457,959 | | | $ | 0 | | | $ | 0 | | | $ | 45,457,959 | |
Consumer staples | | | 19,029,992 | | | | 0 | | | | 0 | | | | 19,029,992 | |
Energy | | | 19,213,225 | | | | 0 | | | | 0 | | | | 19,213,225 | |
Financials | | | 87,174,769 | | | | 0 | | | | 0 | | | | 87,174,769 | |
Health care | | | 48,543,758 | | | | 0 | | | | 0 | | | | 48,543,758 | |
Industrials | | | 58,457,819 | | | | 0 | | | | 0 | | | | 58,457,819 | |
Information technology | | | 30,540,150 | | | | 0 | | | | 0 | | | | 30,540,150 | |
Materials | | | 19,459,231 | | | | 0 | | | | 0 | | | | 19,459,231 | |
Real estate | | | 5,505,981 | | | | 0 | | | | 0 | | | | 5,505,981 | |
| | | | |
Short-term investments | | | | | | | | | | | | | | | | |
Investment companies | | | 11,232,148 | | | | 0 | | | | 0 | | | | 11,232,148 | |
Investments measured at net asset value* | | | | | | | | | | | | | | | 6,884,901 | |
Total assets | | $ | 344,615,032 | | | $ | 0 | | | $ | 0 | | | $ | 351,499,933 | |
| * | Investments that are measured at fair value using the net asset value per share (or its equivalent) as a practical expedient have not been categorized in the fair value hierarchy. The fair value amount presented in the table is intended to permit reconciliation of the fair value hierarchy to the amounts presented in the Statements of Assets and Liabilities. The Portfolio’s investment in Securities Lending Cash Investment, LLC valued at $6,884,901 does not have a redemption period notice, can be redeemed daily and does not have any unfunded commitments. |
| | | | | | | | | | | | | | | | |
| Diversified Large Cap Growth Portfolio | | Quoted prices
(Level 1) | | | Other significant
observable inputs
(Level 2) | | | Significant
unobservable inputs
(Level 3) | | | Total | |
Assets | | | | | | | | | | | | | | | | |
Investments in: | | | | | | | | | | | | | | | | |
| | | | |
Common stocks | | | | | | | | | | | | | | | | |
Consumer discretionary | | $ | 21,402,883 | | | $ | 0 | | | $ | 0 | | | $ | 21,402,883 | |
Consumer staples | | | 5,572,591 | | | | 0 | | | | 0 | | | | 5,572,591 | |
Energy | | | 1,782,242 | | | | 0 | | | | 0 | | | | 1,782,242 | |
Financials | | | 2,296,381 | | | | 0 | | | | 0 | | | | 2,296,381 | |
Health care | | | 13,604,408 | | | | 0 | | | | 0 | | | | 13,604,408 | |
Industrials | | | 10,107,453 | | | | 0 | | | | 0 | | | | 10,107,453 | |
Information technology | | | 46,002,248 | | | | 0 | | | | 0 | | | | 46,002,248 | |
Materials | | | 3,323,283 | | | | 0 | | | | 0 | | | | 3,323,283 | |
Real estate | | | 314,992 | | | | 0 | | | | 0 | | | | 314,992 | |
| | | | |
Short-term investments | | | | | | | | | | | | | | | | |
Investment companies | | | 1,480,422 | | | | 0 | | | | 0 | | | | 1,480,422 | |
Investments measured at net asset value* | | | | | | | | | | | | | | | 1,030,236 | |
Total assets | | $ | 105,886,903 | | | $ | 0 | | | $ | 0 | | | $ | 106,917,139 | |
| * | Investments that are measured at fair value using the net asset value per share (or its equivalent) as a practical expedient have not been categorized in the fair value hierarchy. The fair value amount presented in the table is intended to permit reconciliation of the fair value hierarchy to the amounts presented in the Statements of Assets and Liabilities. The Portfolio’s investment in Securities Lending Cash Investment, LLC valued at $1,030,236 does not have a redemption period notice, can be redeemed daily and does not have any unfunded commitments. |
| | | | |
| 142 | | Wells Fargo Allocation Funds | | Notes to financial statements (unaudited) |
| | | | | | | | | | | | | | | | |
| Emerging Growth Portfolio | | Quoted prices
(Level 1) | | | Other significant
observable inputs
(Level 2) | | | Significant
unobservable inputs
(Level 3) | | | Total | |
Assets | | | | | | | | | | | | | | | | |
Investments in: | | | | | | | | | | | | | | | | |
| | | | |
Common stocks | | | | | | | | | | | | | | | | |
Consumer discretionary | | $ | 97,844,644 | | | $ | 0 | | | $ | 0 | | | $ | 97,844,644 | |
Energy | | | 29,132,524 | | | | 0 | | | | 0 | | | | 29,132,524 | |
Financials | | | 50,342,994 | | | | 0 | | | | 0 | | | | 50,342,994 | |
Health care | | | 231,364,222 | | | | 0 | | | | 0 | | | | 231,364,222 | |
Industrials | | | 129,383,334 | | | | 0 | | | | 0 | | | | 129,383,334 | |
Information technology | | | 246,192,667 | | | | 0 | | | | 0 | | | | 246,192,667 | |
| | | | |
Short-term investments | | | | | | | | | | | | | | | | |
Investment companies | | | 19,236,622 | | | | 0 | | | | 0 | | | | 19,236,622 | |
Investments measured at net asset value* | | | | | | | | | | | | | | | 85,995,907 | |
Total assets | | $ | 803,497,007 | | | $ | 0 | | | $ | 0 | | | $ | 889,492,914 | |
| * | Investments that are measured at fair value using the net asset value per share (or its equivalent) as a practical expedient have not been categorized in the fair value hierarchy. The fair value amount presented in the table is intended to permit reconciliation of the fair value hierarchy to the amounts presented in the Statements of Assets and Liabilities. The Portfolio’s investment in Securities Lending Cash Investment, LLC valued at $85,995,907 does not have a redemption period notice, can be redeemed daily and does not have any unfunded commitments. |
| | | | | | | | | | | | | | | | |
| Index Portfolio | | Quoted prices
(Level 1) | | | Other significant
observable inputs
(Level 2) | | | Significant
unobservable inputs
(Level 3) | | | Total | |
Assets | | | | | | | | | | | | | | | | |
Investments in: | | | | | | | | | | | | | | | | |
| | | | |
Common stocks | | | | | | | | | | | | | | | | |
Consumer discretionary | | $ | 265,600,771 | | | $ | 0 | | | $ | 0 | | | $ | 265,600,771 | |
Consumer staples | | | 199,664,800 | | | | 0 | | | | 0 | | | | 199,664,800 | |
Energy | | | 162,080,388 | | | | 0 | | | | 0 | | | | 162,080,388 | |
Financials | | | 315,695,072 | | | | 0 | | | | 0 | | | | 315,695,072 | |
Health care | | | 296,145,311 | | | | 0 | | | | 0 | | | | 296,145,311 | |
Industrials | | | 225,442,553 | | | | 0 | | | | 0 | | | | 225,442,553 | |
Information technology | | | 448,558,109 | | | | 0 | | | | 0 | | | | 448,558,109 | |
Materials | | | 62,655,100 | | | | 0 | | | | 0 | | | | 62,655,100 | |
Real estate | | | 59,619,341 | | | | 0 | | | | 0 | | | | 59,619,341 | |
Telecommuniciation services | | | 53,850,175 | | | | 0 | | | | 0 | | | | 53,850,175 | |
Utilities | | | 66,261,626 | | | | 0 | | | | 0 | | | | 66,261,626 | |
| | | | |
Short-term investments | | | | | | | | | | | | | | | | |
U.S. Treasury securities | | | 1,802,103 | | | | 0 | | | | 0 | | | | 1,802,103 | |
Investments measured at net asset value* | | | | | | | | | | | | | | | 12,149,306 | |
| | | 2,157,375,349 | | | | 0 | | | | 0 | | | | 2,169,524,655 | |
Futures contracts | | | 11,930 | | | | 0 | | | | 0 | | | | 11,930 | |
Total assets | | $ | 2,157,387,279 | | | $ | 0 | | | $ | 0 | | | $ | 2,169,536,585 | |
Liabilities | | | | | | | | | | | | | | | | |
Futures contracts | | $ | 10,250 | | | $ | 0 | | | $ | 0 | | | $ | 10,250 | |
Total liabilities | | $ | 10,250 | | | $ | 0 | | | $ | 0 | | | $ | 10,250 | |
| * | Investments that are measured at fair value using the net asset value per share (or its equivalent) as a practical expedient have not been categorized in the fair value hierarchy. The fair value amount presented in the table is intended to permit reconciliation of the fair value hierarchy to the amounts presented in the Statements of Assets and Liabilities. The Portfolio’s investment in Securities Lending Cash Investment, LLC valued at $12,149,306 does not have a redemption period notice, can be redeemed daily and does not have any unfunded commitments. |
| | | | | | |
| Notes to financial statements (unaudited) | | Wells Fargo Allocation Funds | | | 143 | |
| | | | | | | | | | | | | | | | |
| International Growth Portfolio | | Quoted prices
(Level 1) | | | Other significant
observable inputs
(Level 2) | | | Significant
unobservable inputs
(Level 3) | | | Total | |
Assets | | | | | | | | | | | | | | | | |
Investments in: | | | | | | | | | | | | | | | | |
| | | | |
Common stocks | | | | | | | | | | | | | | | | |
Australia | | $ | 1,968,371 | | | $ | 0 | | | $ | 0 | | | $ | 1,968,371 | |
Belgium | | | 1,305,628 | | | | 0 | | | | 0 | | | | 1,305,628 | |
Canada | | | 5,675,182 | | | | 0 | | | | 0 | | | | 5,675,182 | |
China | | | 7,684,608 | | | | 0 | | | | 0 | | | | 7,684,608 | |
Denmark | | | 602,226 | | | | 0 | | | | 0 | | | | 602,226 | |
France | | | 5,531,327 | | | | 0 | | | | 0 | | | | 5,531,327 | |
Germany | | | 24,787,331 | | | | 0 | | | | 0 | | | | 24,787,331 | |
Hong Kong | | | 4,591,878 | | | | 0 | | | | 0 | | | | 4,591,878 | |
Indonesia | | | 311,256 | | | | 0 | | | | 0 | | | | 311,256 | |
Ireland | | | 7,100,910 | | | | 0 | | | | 0 | | | | 7,100,910 | |
Italy | | | 2,625,919 | | | | 0 | | | | 0 | | | | 2,625,919 | |
Japan | | | 16,746,137 | | | | 0 | | | | 0 | | | | 16,746,137 | |
Luxembourg | | | 412,030 | | | | 0 | | | | 0 | | | | 412,030 | |
Netherlands | | | 6,438,994 | | | | 0 | | | | 0 | | | | 6,438,994 | |
Russia | | | 362,935 | | | | 0 | | | | 0 | | | | 362,935 | |
South Korea | | | 10,470 | | | | 0 | | | | 0 | | | | 10,470 | |
Spain | | | 2,450,123 | | | | 0 | | | | 0 | | | | 2,450,123 | |
Sweden | | | 1,556,191 | | | | 0 | | | | 0 | | | | 1,556,191 | |
Switzerland | | | 9,919,561 | | | | 0 | | | | 0 | | | | 9,919,561 | |
Taiwan | | | 2,830,578 | | | | 0 | | | | 0 | | | | 2,830,578 | |
Thailand | | | 190,158 | | | | 0 | | | | 0 | | | | 190,158 | |
United Kingdom | | | 20,223,828 | | | | 0 | | | | 0 | | | | 20,223,828 | |
United States | | | 2,877,257 | | | | 0 | | | | 0 | | | | 2,877,257 | |
| | | | |
Participation Notes | | | | | | | | | | | | | | | | |
Ireland | | | 0 | | | | 2,979,015 | | | | 0 | | | | 2,979,015 | |
| | | | |
Preferred stocks | | | | | | | | | | | | | | | | |
Germany | | | 2,002,901 | | | | 0 | | | | 0 | | | | 2,002,901 | |
| | | | |
Short-term investments | | | | | | | | | | | | | | | | |
Investment companies | | | 1,759,819 | | | | 0 | | | | 0 | | | | 1,759,819 | |
Investments measured at net asset value* | | | | | | | | | | | | | | | 2,198,114 | |
Total assets | | $ | 129,965,618 | | | $ | 2,979,015 | | | $ | 0 | | | $ | 135,142,747 | |
| * | Investments that are measured at fair value using the net asset value per share (or its equivalent) as a practical expedient have not been categorized in the fair value hierarchy. The fair value amount presented in the table is intended to permit reconciliation of the fair value hierarchy to the amounts presented in the Statements of Assets and Liabilities. The Portfolio’s investment in Securities Lending Cash Investments, LLC valued at $2,198,114 does not have a redemption period notice, can be redeemed daily and does not have any unfunded commitments. |
| | | | |
| 144 | | Wells Fargo Allocation Funds | | Notes to financial statements (unaudited) |
| | | | | | | | | | | | | | | | |
| International Value Portfolio | | Quoted prices
(Level 1) | | | Other significant
observable inputs
(Level 2) | | | Significant
unobservable inputs
(Level 3) | | | Total | |
Assets | | | | | | | | | | | | | | | | |
Investments in: | | | | | | | | | | | | | | | | |
| | | | |
Common stocks | | | | | | | | | | | | | | | | |
Australia | | $ | 30,475,428 | | | $ | 0 | | | $ | 49,771 | | | $ | 30,525,199 | |
Austria | | | 6,882,387 | | | | 0 | | | | 0 | | | | 6,882,387 | |
Brazil | | | 5,662,697 | | | | 0 | | | | 0 | | | | 5,662,697 | |
Canada | | | 11,002,881 | | | | 0 | | | | 0 | | | | 11,002,881 | |
China | | | 14,601,967 | | | | 0 | | | | 0 | | | | 14,601,967 | |
Czech Republic | | | 933,331 | | | | 0 | | | | 0 | | | | 933,331 | |
Denmark | | | 5,129,976 | | | | 0 | | | | 0 | | | | 5,129,976 | |
Finland | | | 1,222,969 | | | | 0 | | | | 0 | | | | 1,222,969 | |
France | | | 50,848,701 | | | | 0 | | | | 0 | | | | 50,848,701 | |
Germany | | | 44,737,620 | | | | 0 | | | | 0 | | | | 44,737,620 | |
Hong Kong | | | 11,524,062 | | | | 0 | | | | 0 | | | | 11,524,062 | |
Hungary | | | 1,166,323 | | | | 0 | | | | 0 | | | | 1,166,323 | |
India | | | 1,679,956 | | | | 0 | | | | 0 | | | | 1,679,956 | |
Ireland | | | 3,851,769 | | | | 0 | | | | 0 | | | | 3,851,769 | |
Israel | | | 5,172,825 | | | | 0 | | | | 0 | | | | 5,172,825 | |
Italy | | | 8,699,000 | | | | 0 | | | | 0 | | | | 8,699,000 | |
Japan | | | 126,403,738 | | | | 0 | | | | 0 | | | | 126,403,738 | |
Liechtenstein | | | 664,379 | | | | 0 | | | | 0 | | | | 664,379 | |
Netherlands | | | 10,905,411 | | | | 0 | | | | 0 | | | | 10,905,411 | |
Norway | | | 6,706,012 | | | | 0 | | | | 0 | | | | 6,706,012 | |
Poland | | | 2,032,478 | | | | 0 | | | | 0 | | | | 2,032,478 | |
Portugal | | | 1,147,679 | | | | 0 | | | | 0 | | | | 1,147,679 | |
Russia | | | 5,326,102 | | | | 0 | | | | 0 | | | | 5,326,102 | |
Singapore | | | 4,388,447 | | | | 0 | | | | 0 | | | | 4,388,447 | |
South Africa | | | 2,557,684 | | | | 0 | | | | 0 | | | | 2,557,684 | |
South Korea | | | 12,047,791 | | | | 0 | | | | 0 | | | | 12,047,791 | |
Spain | | | 10,362,971 | | | | 0 | | | | 0 | | | | 10,362,971 | |
Sweden | | | 9,107,120 | | | | 0 | | | | 0 | | | | 9,107,120 | |
Switzerland | | | 37,781,460 | | | | 0 | | | | 0 | | | | 37,781,460 | |
Taiwan | | | 5,939,415 | | | | 0 | | | | 0 | | | | 5,939,415 | |
Thailand | | | 8,109,465 | | | | 0 | | | | 0 | | | | 8,109,465 | |
United Kingdom | | | 79,836,453 | | | | 0 | | | | 0 | | | | 79,836,453 | |
| | | | |
Preferred stocks | | | | | | | | | | | | | | | | |
Brazil | | | 1,419,344 | | | | 0 | | | | 0 | | | | 1,419,344 | |
| | | | |
Short-term investments | | | | | | | | | | | | | | | | |
Investment companies | | | 6,504,594 | | | | 0 | | | | 0 | | | | 6,504,594 | |
Investments measured at net asset value* | | | | | | | | | | | | | | | 9,472,329 | |
Total assets | | $ | 534,832,435 | | | $ | 0 | | | $ | 49,771 | | | $ | 544,354,535 | |
| * | Investments that are measured at fair value using the net asset value per share (or its equivalent) as a practical expedient have not been categorized in the fair value hierarchy. The fair value amount presented in the table is intended to permit reconciliation of the fair value hierarchy to the amounts presented in the Statements of Assets and Liabilities. The Portfolio’s investment in Securities Lending Cash Investment, LLC valued at $9,472,329 does not have a redemption period notice, can be redeemed daily and does not have any unfunded commitments. |
| | | | | | |
| Notes to financial statements (unaudited) | | Wells Fargo Allocation Funds | | | 145 | |
| | | | | | | | | | | | | | | | |
| Large Company Value Portfolio | | Quoted prices
(Level 1) | | | Other significant
observable inputs
(Level 2) | | | Significant
unobservable inputs
(Level 3) | | | Total | |
Assets | | | | | | | | | | | | | | | | |
Investments in: | | | | | | | | | | | | | | | | |
| | | | |
Common stocks | | | | | | | | | | | | | | | | |
Consumer discretionary | | $ | 4,652,195 | | | $ | 0 | | | $ | 0 | | | $ | 4,652,195 | |
Consumer staples | | | 4,859,989 | | | | 0 | | | | 0 | | | | 4,859,989 | |
Energy | | | 10,248,276 | | | | 0 | | | | 0 | | | | 10,248,276 | |
Financials | | | 18,030,899 | | | | 0 | | | | 0 | | | | 18,030,899 | |
Health care | | | 7,693,293 | | | | 0 | | | | 0 | | | | 7,693,293 | |
Industrials | | | 7,928,853 | | | | 0 | | | | 0 | | | | 7,928,853 | |
Information technology | | | 7,906,303 | | | | 0 | | | | 0 | | | | 7,906,303 | |
Materials | | | 3,251,894 | | | | 0 | | | | 0 | | | | 3,251,894 | |
Real estate | | | 4,780,118 | | | | 0 | | | | 0 | | | | 4,780,118 | |
Telecommunication services | | | 1,590,590 | | | | 0 | | | | 0 | | | | 1,590,590 | |
Utilities | | | 4,061,147 | | | | 0 | | | | 0 | | | | 4,061,147 | |
Investments measured at net asset value* | | | | | | | | | | | | | | | 3,311,310 | |
Total assets | | $ | 75,003,557 | | | $ | 0 | | | $ | 0 | | | $ | 78,314,867 | |
| * | Investments that are measured at fair value using the net asset value per share (or its equivalent) as a practical expedient have not been categorized in the fair value hierarchy. The fair value amount presented in the table is intended to permit reconciliation of the fair value hierarchy to the amounts presented in the Statements of Assets and Liabilities. The Portfolio’s investment in Securities Lending Cash Investment, LLC valued at $3,311,310 does not have a redemption period notice, can be redeemed daily and does not have any unfunded commitments. |
| | | | | | | | | | | | | | | | |
| Small Company Growth Portfolio | | Quoted prices
(Level 1) | | | Other significant
observable inputs
(Level 2) | | | Significant
unobservable inputs
(Level 3) | | | Total | |
Assets | | | | | | | | | | | | | | | | |
Investments in: | | | | | | | | | | | | | | | | |
| | | | |
Common stocks | | | | | | | | | | | | | | | | |
Consumer discretionary | | $ | 200,767,878 | | | $ | 0 | | | $ | 0 | | | $ | 200,767,878 | |
Consumer staples | | | 27,461,662 | | | | 0 | | | | 0 | | | | 27,461,662 | |
Energy | | | 54,146,570 | | | | 0 | | | | 0 | | | | 54,146,570 | |
Financials | | | 140,453,574 | | | | 0 | | | | 0 | | | | 140,453,574 | |
Health care | | | 312,451,301 | | | | 0 | | | | 0 | | | | 312,451,301 | |
Industrials | | | 235,581,668 | | | | 0 | | | | 0 | | | | 235,581,668 | |
Information technology | | | 412,878,479 | | | | 0 | | | | 0 | | | | 412,878,479 | |
Materials | | | 41,040,574 | | | | 0 | | | | 0 | | | | 41,040,574 | |
Real estate | | | 16,830,162 | | | | 0 | | | | 0 | | | | 16,830,162 | |
| | | | |
Short-term investments | | | | | | | | | | | | | | | | |
Investment companies | | | 75,190,164 | | | | 0 | | | | 0 | | | | 75,190,164 | |
Investments measured at net asset value* | | | | | | | | | | | | | | | 165,112,340 | |
Total assets | | $ | 1,516,802,032 | | | $ | 0 | | | $ | 0 | | | $ | 1,681,914,372 | |
| * | Investments that are measured at fair value using the net asset value per share (or its equivalent) as a practical expedient have not been categorized in the fair value hierarchy. The fair value amount presented in the table is intended to permit reconciliation of the fair value hierarchy to the amounts presented in the Statements of Assets and Liabilities. The Portfolio’s investment in Securities Lending Cash Investment, LLC valued at $165,112,340 does not have a redemption period notice, can be redeemed daily and does not have any unfunded commitments. |
| | | | |
| 146 | | Wells Fargo Allocation Funds | | Notes to financial statements (unaudited) |
| | | | | | | | | | | | | | | | |
| Small Company Value Portfolio | | Quoted prices
(Level 1) | | | Other significant
observable inputs
(Level 2) | | | Significant
unobservable inputs
(Level 3) | | | Total | |
Assets | | | | | | | | | | | | | | | | |
Investments in: | | | | | | | | | | | | | | | | |
| | | | |
Common stocks | | | | | | | | | | | | | | | | |
Consumer discretionary | | $ | 39,614,072 | | | $ | 0 | | | $ | 0 | | | $ | 39,614,072 | |
Consumer staples | | | 4,812,273 | | | | 0 | | | | 0 | | | | 4,812,273 | |
Energy | | | 11,346,077 | | | | 0 | | | | 0 | | | | 11,346,077 | |
Financials | | | 61,867,079 | | | | 0 | | | | 0 | | | | 61,867,079 | |
Health care | | | 12,789,884 | | | | 0 | | | | 0 | | | | 12,789,884 | |
Industrials | | | 22,956,402 | | | | 0 | | | | 0 | | | | 22,956,402 | |
Information technology | | | 30,582,118 | | | | 0 | | | | 0 | | | | 30,582,118 | |
Materials | | | 7,153,575 | | | | 0 | | | | 0 | | | | 7,153,575 | |
Real estate | | | 20,698,252 | | | | 0 | | | | 0 | | | | 20,698,252 | |
Utilities | | | 7,894,134 | | | | 0 | | | | 0 | | | | 7,894,134 | |
| | | | |
Short-term investments | | | | | | | | | | | | | | | | |
Investment companies | | | 3,332,087 | | | | 0 | | | | 0 | | | | 3,332,087 | |
Investments measured at net asset value* | | | | | | | | | | | | | | | 11,762,612 | |
Total assets | | $ | 223,045,953 | | | $ | 0 | | | $ | 0 | | | $ | 234,808,565 | |
| * | Investments that are measured at fair value using the net asset value per share (or its equivalent) as a practical expedient have not been categorized in the fair value hierarchy. The fair value amount presented in the table is intended to permit reconciliation of the fair value hierarchy to the amounts presented in the Statements of Assets and Liabilities. The Portfolio’s investment in Securities Lending Cash Investment, LLC valued at $11,762,612 does not have a redemption period notice, can be redeemed daily and does not have any unfunded commitments. |
| | | | | | | | | | | | | | | | |
| Core Bond Portfolio | | Quoted prices
(Level 1) | | | Other significant
observable inputs
(Level 2) | | | Significant
unobservable inputs
(Level 3) | | | Total | |
Assets | | | | | | | | | | | | | | | | |
Investments in: | | | | | | | | | | | | | | | | |
| | | | |
Agency securities | | $ | 0 | | | $ | 1,419,693,128 | | | $ | 0 | | | $ | 1,419,693,128 | |
| | | | |
Asset-backed securities | | | 0 | | | | 651,314,358 | | | | 0 | | | | 651,314,358 | |
| | | | |
Corporate bonds and notes | | | 0 | | | | 971,299,342 | | | | 0 | | | | 971,299,342 | |
| | | | |
Government agency | | | 0 | | | | 20,555,046 | | | | 0 | | | | 20,555,046 | |
| | | | |
Municipal obligations | | | 0 | | | | 39,498,644 | | | | 0 | | | | 39,498,644 | |
| | | | |
Non-agency mortgage-backed securities | | | 0 | | | | 286,527,418 | | | | 0 | | | | 286,527,418 | |
| | | | |
U.S. Treasury securities | | | 1,809,267,733 | | | | 0 | | | | 0 | | | | 1,809,267,733 | |
| | | | |
Yankee corporate bonds and notes | | | 0 | | | | 315,557,917 | | | | 0 | | | | 315,557,917 | |
| | | | |
Yankee government bonds | | | 0 | | | | 77,693,478 | | | | 0 | | | | 77,693,478 | |
| | | | |
Short-term investments | | | | | | | | | | | | | | | | |
Investment companies | | | 137,895,059 | | | | 0 | | | | 0 | | | | 137,895,059 | |
Investments measured at net asset value* | | | | | | | | | | | | | | | 230,759,186 | |
Total assets | | $ | 1,947,162,792 | | | $ | 3,782,139,331 | | | $ | 0 | | | $ | 5,960,061,309 | |
| * | Investments that are measured at fair value using the net asset value per share (or its equivalent) as a practical expedient have not been categorized in the fair value hierarchy. The fair value amount presented in the table is intended to permit reconciliation of the fair value hierarchy to the amounts presented in the Statements of Assets and Liabilities. The Portfolio’s investment in Securities Lending Cash Investment, LLC valued at $230,759,186 does not have a redemption period notice, can be redeemed daily and does not have any unfunded commitments. |
| | | | | | |
| Notes to financial statements (unaudited) | | Wells Fargo Allocation Funds | | | 147 | |
| | | | | | | | | | | | | | | | |
| Managed Fixed Income Portfolio | | Quoted prices
(Level 1) | | | Other significant
observable inputs
(Level 2) | | | Significant
unobservable inputs
(Level 3) | | | Total | |
Assets | | | | | | | | | | | | | | | | |
Investments in: | | | | | | | | | | | | | | | | |
| | | | |
Agency securities | | $ | 0 | | | $ | 37,554,185 | | | $ | 0 | | | $ | 37,554,185 | |
| | | | |
Asset-backed securities | | | 0 | | | | 4,699,730 | | | | 0 | | | | 4,699,730 | |
| | | | |
Corporate bonds and notes | | | 0 | | | | 35,648,382 | | | | 0 | | | | 35,648,382 | |
| | | | |
Municipal obligations | | | 0 | | | | 9,078,804 | | | | 0 | | | | 9,078,804 | |
| | | | |
Non-agency mortgage-backed securities | | | 0 | | | | 14,622,957 | | | | 0 | | | | 14,622,957 | |
| | | | |
U.S. Treasury securities | | | 2,066,394 | | | | 0 | | | | 0 | | | | 2,066,394 | |
| | | | |
Yankee corporate bonds and notes | | | 0 | | | | 6,172,803 | | | | 0 | | | | 6,172,803 | |
| | | | |
Short-term investments | | | | | | | | | | | | | | | | |
Investment companies | | | 2,919,104 | | | | 0 | | | | 0 | | | | 2,919,104 | |
Investments measured at net asset value* | | | | | | | | | | | | | | | 1,699,848 | |
Total assets | | $ | 4,985,498 | | | $ | 107,776,861 | | | $ | 0 | | | $ | 114,462,207 | |
Liabilities | | | | | | | | | | | | | | | | |
Futures contracts | | $ | 37,500 | | | $ | 0 | | | $ | 0 | | | $ | 37,500 | |
Total liabilities | | $ | 37,500 | | | $ | 0 | | | $ | 0 | | | $ | 37,500 | |
| * | Investments that are measured at fair value using the net asset value per share (or its equivalent) as a practical expedient have not been categorized in the fair value hierarchy. The fair value amount presented in the table is intended to permit reconciliation of the fair value hierarchy to the amounts presented in the Statements of Assets and Liabilities. The Portfolio’s investment in Securities Lending Cash Investment, LLC valued at $1,699,848 does not have a redemption period notice, can be redeemed daily and does not have any unfunded commitments. |
| | | | | | | | | | | | | | | | |
| Real Return Portfolio | | Quoted prices
(Level 1) | | | Other significant
observable inputs
(Level 2) | | | Significant
unobservable inputs
(Level 3) | | | Total | |
Assets | | | | | | | | | | | | | | | | |
Investments in: | | | | | | | | | | | | | | | | |
| | | | |
Common stocks | | | | | | | | | | | | | | | | |
Consumer staples | | $ | 2,527,736 | | | $ | 0 | | | $ | 0 | | | $ | 2,527,736 | |
Energy | | | 2,700,903 | | | | 0 | | | | 0 | | | | 2,700,903 | |
Materials | | | 2,671,426 | | | | 0 | | | | 0 | | | | 2,671,426 | |
Real estate | | | 2,400,097 | | | | 0 | | | | 0 | | | | 2,400,097 | |
| | | | |
Corporate bonds and notes | | | 0 | | | | 7,304,938 | | | | 0 | | | | 7,304,938 | |
| | | | |
Loans | | | 0 | | | | 2,265,155 | | | | 100,438 | | | | 2,365,593 | |
| | | | |
U.S. Treasury securities | | | 48,558,151 | | | | 0 | | | | 0 | | | | 48,558,151 | |
| | | | |
Yankee corporate bonds and notes | | | 0 | | | | 675,499 | | | | 0 | | | | 675,499 | |
| | | | |
Short-term investments | | | | | | | | | | | | | | | | |
Investment companies | | | 3,792,921 | | | | 0 | | | | 0 | | | | 3,792,921 | |
U.S. Treasury securities | | | 49,997 | | | | 0 | | | | 0 | | | | 49,997 | |
Investments measured at net asset value* | | | | | | | | | | | | | | | 371,335 | |
| | | 62,701,231 | | | | 10,245,592 | | | | 100,438 | | | | 73,418,596 | |
Futures contracts | | | 3,656 | | | | 0 | | | | 0 | | | | 3,656 | |
Total assets | | $ | 62,704,887 | | | $ | 10,245,592 | | | $ | 100,438 | | | $ | 73,422,252 | |
Liabilities | | | | | | | | | | | | | | | | |
Futures contracts | | $ | 1,781 | | | $ | 0 | | | $ | 0 | | | $ | 1,781 | |
Total liabilities | | $ | 1,781 | | | $ | 0 | | | $ | 0 | | | $ | 1,781 | |
| * | Investments that are measured at fair value using the net asset value per share (or its equivalent) as a practical expedient have not been categorized in the fair value hierarchy. The fair value amount presented in the table is intended to permit reconciliation of the fair value hierarchy to the amounts presented in the Statements of Assets and Liabilities. The Portfolio’s investment in Securities Lending Cash Investment, LLC valued at $371,335 does not have a redemption period notice, can be redeemed daily and does not have any unfunded commitments. |
| | | | |
| 148 | | Wells Fargo Allocation Funds | | Notes to financial statements (unaudited) |
| | | | | | | | | | | | | | | | |
| Stable Income Portfolio | | Quoted prices
(Level 1) | | | Other significant
observable inputs
(Level 2) | | | Significant
unobservable inputs
(Level 3) | | | Total | |
Assets | | | | | | | | | | | | | | | | |
Investments in: | | | | | | | | | | | | | | | | |
| | | | |
Agency securities | | $ | 0 | | | $ | 6,304,421 | | | $ | 0 | | | $ | 6,304,421 | |
| | | | |
Asset-backed securities | | | 0 | | | | 7,552,507 | | | | 0 | | | | 7,552,507 | |
| | | | |
Corporate bonds and notes | | | 0 | | | | 8,198,743 | | | | 0 | | | | 8,198,743 | |
| | | | |
Municipal obligations | | | 0 | | | | 145,739 | | | | 0 | | | | 145,739 | |
| | | | |
Non-agency mortgage-backed securities | | | 0 | | | | 2,090,207 | | | | 0 | | | | 2,090,207 | |
| | | | |
U.S. Treasury securities | | | 1,866,439 | | | | 0 | | | | 0 | | | | 1,866,439 | |
| | | | |
Yankee corporate bonds and notes | | | 0 | | | | 661,073 | | | | 0 | | | | 661,073 | |
| | | | |
Short-term investments | | | | | | | | | | | | | | | | |
Investment companies | | | 931,716 | | | | 0 | | | | 0 | | | | 931,716 | |
| | | 2,798,155 | | | | 24,952,690 | | | | 0 | | | | 27,750,845 | |
Futures contracts | | | 2,813 | | | | 0 | | | | 0 | | | | 2,813 | |
Total assets | | $ | 2,800,968 | | | $ | 24,952,690 | | | $ | 0 | | | $ | 27,753,658 | |
Futures contracts are reported at their variation margin at measurement date, which represents the amount due to/from the Portfolio at that date. All other assets and liabilities are reported at their market value at measurement date.
The Portfolios recognize transfers between levels within the fair value hierarchy at the end of the reporting period. At November 30, 2016, the Portfolios did not have any transfers into/out of Level 1, Level 2, or Level 3.
4. TRANSACTIONS WITH AFFILIATES AND OTHER EXPENSES
Advisory fee
The Trust has entered into an advisory contract with Funds Management, an indirect wholly owned subsidiary of Wells Fargo. The adviser is responsible for implementing investment policies and guidelines and for supervising the subadvisers, who are responsible for day-to-day portfolio management of the Portfolios. Pursuant to the contract, Funds Management is entitled to receive an annual advisory fee which is calculated based on the average daily net assets of each Portfolio.
Funds Management has retained the services of certain subadvisers to provide daily portfolio management for the Portfolios. Funds Management has engaged WellsCap, Peregrine Capital Management, LLC (“Peregrine”), Artisan Partners Limited Partnership, Cooke & Bieler, L.P., Golden Capital Management, LLC (an affiliate of Funds Management), LSV Asset Management, Phocas Financial Corporation and Galliard Capital Management, Inc. (an affiliate of Funds Management and an indirect wholly owned subsidiary of Wells Fargo) as subadvisers. Peregine, Artisan Partners Limited Partnership, Cooke & Bieler, L.P., LSV Asset Management and Phocas Financial Corporation are not affiliates of Funds Management. As of August 25, 2016, Peregrine is no longer an affiliate of Funds Management as a result of a change in control through a buyout agreement between Wells Fargo and Peregrine. There was no change to the personnel or the operation of Peregrine and the subadvisory fee rates are identical to the prior subadvisory agreement.
The fees for subadvisory services are borne by Funds Management. The subadvisers are each entitled to receive from Funds Management an annual subadvisory fee which is calculated based on the average daily net assets of each Portfolio.
| | | | | | |
| Notes to financial statements (unaudited) | | Wells Fargo Allocation Funds | | | 149 | |
The annual advisory and subadvisory fee rates for each Portfolio are as follows:
| | | | | | | | | | | | | | | | | | | | | | |
| | | Advisory fee | | | Effective rate for the
six months ended November 30, 2016 | | | | | Subadvisory fee | |
| | | starting at | | | declining to | | | | Subadviser | | starting at | | | declining to | |
C&B Large Cap Value Portfolio | | | 0.65 | % | | | 0.475 | % | | | 0.65 | % | | Cooke & Bieler, L.P. | | | 0.38 | % | | | 0.30 | % |
Diversified Large Cap Growth Portfolio | | | 0.65 | | | | 0.475 | | | | 0.65 | | | WellsCap | | | 0.30 | | | | 0.20 | |
Emerging Growth Portfolio | | | 0.80 | | | | 0.68 | | | | 0.79 | | | WellsCap | | | 0.55 | | | | 0.40 | |
Index Portfolio | | | 0.10 | | | | 0.05 | | | | 0.09 | | | Golden Capital Management, LLC | | | 0.05 | | | | 0.02 | |
International Growth Portfolio | | | 0.80 | * | | | 0.65 | * | | | 0.83 | | | Artisan Partners Limited Partnership | | | 0.80 | | | | 0.50 | |
International Value Portfolio | | | 0.80 | * | | | 0.65 | * | | | 0.83 | | | LSV Asset Management | | | 0.35 | | | | 0.30 | |
Large Company Value Portfolio | | | 0.65 | | | | 0.475 | | | | 0.65 | | | Phocas Financial Corporation | | | 0.29 | | | | 0.20 | |
Small Company Growth Portfolio | | | 0.80 | | | | 0.68 | | | | 0.78 | | | Peregrine | | | 0.50 | | | | 0.45 | |
Small Company Value Portfolio | | | 0.80 | | | | 0.68 | | | | 0.80 | | | Peregrine | | | 0.45 | | | | 0.40 | |
Core Bond Portfolio | | | 0.40 | | | | 0.30 | | | | 0.35 | | | WellsCap | | | 0.20 | | | | 0.10 | |
Managed Fixed Income Portfolio | | | 0.40 | | | | 0.30 | | | | 0.40 | | | Galliard Capital Management, Inc. | | | 0.20 | | | | 0.10 | |
Real Return Portfolio | | | 0.40 | | | | 0.30 | | | | 0.40 | | | WellsCap | | | 0.28 | | | | 0.18 | |
Stable Income Portfolio | | | 0.30 | | | | 0.225 | | | | 0.30 | | | Galliard Capital Management, Inc. | | | 0.15 | | | | 0.05 | |
| * | Prior to July 1 2016, the Adviser was entitled to receive a fee which started at 0.85% and declined to 0.70% as average net assets increased. |
Funds Management has voluntarily waived and/or reimbursed advisory fees to the extent necessary to maintain certain net operating expense ratios for the Portfolios.
5. INVESTMENT PORTFOLIO TRANSACTIONS
Purchases and sales of investments, excluding short-term securities, for the six months ended November 30, 2016 were as follows:
| | | | | | | | | | | | | | | | |
| | | Purchases at cost | | | Sales proceeds | |
| | | U.S.
government | | | Non-U.S.
government | | | U.S.
government | | | Non-U.S.
government | |
C&B Large Cap Value Portfolio | | $ | 0 | | | $ | 138,247,965 | | | $ | 0 | | | $ | 98,309,476 | |
Diversified Large Cap Growth Portfolio | | | 0 | | | | 39,874,152 | | | | 0 | | | | 48,378,661 | |
Emerging Growth Portfolio | | | 0 | | | | 423,646,223 | | | | 0 | | | | 445,338,695 | |
Index Portfolio | | | 0 | | | | 105,617,172 | | | | 0 | | | | 342,200,515 | |
International Growth Portfolio | | | 0 | | | | 86,810,483 | | | | 0 | | | | 82,464,777 | |
International Value Portfolio | | | 0 | | | | 118,692,922 | | | | 0 | | | | 74,418,267 | |
Large Company Value Portfolio | | | 0 | | | | 25,686,356 | | | | 0 | | | | 29,271,036 | |
Small Company Growth Portfolio | | | 0 | | | | 789,709,097 | | | | 0 | | | | 467,420,144 | |
Small Company Value Portfolio | | | 0 | | | | 115,642,016 | | | | 0 | | | | 128,449,471 | |
Core Bond Portfolio | | | 11,464,870,789 | | | | 3,054,192,949 | | | | 10,739,535,990 | | | | 2,265,170,181 | |
Managed Fixed Income Portfolio | | | 14,538,157 | | | | 6,194,043 | | | | 13,856,103 | | | | 12,455,363 | |
Real Return Portfolio | | | 8,346,402 | | | | 7,079,293 | | | | 1,580,240 | | | | 4,864,811 | |
Stable Income Portfolio | �� | | 2,650,438.57 | | | | 4,649,625.78 | | | | 4,705,277.22 | | | | 2,275,382.66 | |
The Portfolios may purchase or sell investment securities to other Wells Fargo funds under procedures adopted by the Board of Trustees. The procedures have been designed to ensure that these interfund transactions, which generally do not incur broker commissions, are effected at current market prices. Interfund trades are included within the respective purchases and sales amounts shown.
As of November 30, 2016, Real Return Portfolio had unfunded term loan commitments of $116,006.
| | | | |
| 150 | | Wells Fargo Allocation Funds | | Notes to financial statements (unaudited) |
6. INVESTMENTS IN AFFILIATES
An affiliated investment is a company which is under common ownership or control of the Portfolio or which the Portfolio has ownership of at least 5% of the outstanding voting shares. The following is a summary of transactions for the long-term holdings of issuers that were either affiliates of Index Portfolio at the beginning of the period or the end of the period.
| | | | | | | | | | | | | | | | | | | | | | | | | | | | |
| | | Shares,
beginning
of period | | | Shares
purchases | | | Shares
sold | | | Shares,
end of
period | | | Value, end
of period | | | Income
from
affiliated
securities | | | Realized gains
on affiliated
securities | |
Wells Fargo & Company | | | 583,952 | | | | 15,747 | | | | 84,045 | | | | 515,654 | | | $ | 27,288,410 | | | $ | 420,422 | | | $ | 1,342,812 | |
7. DERIVATIVE TRANSACTIONS
During the six months ended November 30, 2016, Index Portfolio used uninvested cash to enter into futures contracts to gain market exposure. During the six months ended November 30, 2016, Managed Fixed Income Portfolio, Real Return Portfolio and Stable Income Portfolio entered into futures contract to speculate on interest rates and to help manage the duration of each portfolio.
At November 30, 2016, the Portfolios had long and short futures contracts outstanding as follows:
| | | | | | | | | | | | | | | | |
| | | Expiration date | | Counterparty | | Contracts | | Type | | Contract value at
November 30, 2016 | | | Unrealized
gains (losses) | |
Index Portfolio | | 12-15-2016 | | Societe Generale | | 14 Long | | S&P 500 Index | | $ | 7,695,800 | | | $ | 31,255 | |
Index Portfolio | | 3-16-2017 | | Societe Generale | | 50 Long | | S&P 500 Index | | | 27,421,250 | | | | (10,250 | ) |
Managed Fixed Income Portfolio | | 3-22-2017 | | JPMorgan | | 20 Long | | U.S. Treasury Bonds | | | 3,228,125 | | | | (24,733 | ) |
Real Return Portfolio | | 3-22-2017 | | JPMorgan | | 3 Long | | 10-Year U.S. Treasury Notes | | | 373,547 | | | | (1,390 | ) |
Real Return Portfolio | | 3-31-2017 | | JPMorgan | | 13 Short | | 5-Year U.S. Treasury Notes | | | 1,531,969 | | | | 3,152 | |
Stable Income Portfolio | | 3-31-2017 | | JPMorgan | | 10 Short | | 5-Year U.S. Treasury Notes | | | 1,178,438 | | | | 2,089 | |
As of November 30 2016, Managed Fixed Income Portfolio and Stable Income Portfolio had segregated $112,000 and $8,500, respectively, as cash collateral for open futures contracts.
The Portfolios had average notional amounts in futures contracts during the six months ended November 30, 2016 as follows:
| | | | | | | | |
| | | Long contracts | | | Short contracts | |
Index Portfolio | | $ | 24,700,134 | | | $ | 0 | |
Managed Fixed Income Portfolio | | | 1,493,076 | | | | 0 | |
Real Return Portfolio | | | 300,788 | | | | 2,093,099 | |
Stable Income Portfolio | | | 0 | | | | 1,444,466 | |
The receivable and payable for daily variation margin on open futures contracts reflected in the Statements of Assets and Liabilities only represents the current day’s variation margin. The realized gains or losses and change in unrealized gains or losses on derivative instruments are reflected in the Statements of Operations.
For certain types of derivative transactions, the Portfolios have entered into International Swaps and Derivatives Association, Inc. master agreements (“ISDA Master Agreements”) or similar agreements with approved counterparties. The ISDA Master Agreements or similar agreements may have requirements to deliver/deposit securities or cash to/with an exchange or broker-dealer as collateral and allows the Portfolios to offset, with each counterparty, certain derivative financial instrument’s assets and/or liabilities with collateral held or pledged. Collateral requirements differ by type of derivative. Collateral or margin requirements are set by the broker or exchange clearing house for exchange traded derivatives while collateral terms are contract specific for over-the-counter traded derivatives. Cash collateral that has been pledged to cover obligations of the Portfolios under ISDA Master Agreements or similar agreements, if any, will be reported separately in the Statements of Assets and Liabilities. Securities pledged as collateral, if any, for the same purpose are noted in the Portfolio of Investments or Summary Portfolio of Investments. With respect to balance sheet offsetting, absent an event of default by the counterparty or a termination of the agreement, the reported amounts of financial assets and financial liabilities in the Statements of Assets and Liabilities are not offset across transactions
| | | | | | |
| Notes to financial statements (unaudited) | | Wells Fargo Allocation Funds | | | 151 | |
between a Portfolio and the applicable counterparty. A reconciliation of the gross amounts on the Statements of Assets and Liabilities to the net amounts by derivative type, including any collateral exposure, is as follows:
| | | | | | | | | | | | | | | | | | | | |
| | | Derivative type | | Counterparty | | Gross amounts
of assets in the
Statements of
Assets and
Liabilities | | | Amounts
subject to
netting
agreements | | | Collateral
received | | | Net amount
of assets | |
Index Portfolio | | Futures – variation margin | | Societe Generale | | $ | 11,930 | | | $ | (10,250 | ) | | $ | 0 | | | $ | 1,680 | |
Real Return Portfolio | | Futures – variation margin | | JPMorgan | | | 3,656 | | | | (1,781 | ) | | | 0 | | | | 1,875 | |
Stable Income Portfolio | | Futures – variation margin | | JPMorgan | | | 2,813 | | | | 0 | | | | 0 | | | | 2,813 | |
| | | | | | | | | | | | | | | | | | | | |
| | | Derivative type | | Counterparty | | Gross amounts
of liabilities in the
Statements of
Assets and
Liabilities | | | Amounts
subject to
netting
agreements | | | Collateral
pledged1 | | | Net amount
of liabilities | |
Index Portfolio | | Futures – variation margin | | Societe Generale | | $ | 10,250 | | | $ | (10,250 | ) | | $ | 0 | | | $ | 0 | |
Managed Fixed Income Portfolio | | Futures – variation margin | | JPMorgan | | | 37,500 | | | | 0 | | | | (37,500 | ) | | | 0 | |
Real Return Portfolio | | Futures – variation margin | | JPMorgan | | | 1,781 | | | | (1,781 | ) | | | 0 | | | | 0 | |
| | 1 | Collateral pledged within this table is limited to the collateral for the net transaction with the counterparty. | |
8. CONCENTRATION RISKS
Concentration risks result from exposure to a limited number of sectors. Portfolios that invest a substantial portion of their assets in a sector may be more affected by changes in that sector than would be a Portfolio whose investments are not heavily weighted in any sector. The Portfolio of Investments or Summary Portfolio of Investments includes information on each Portfolio’s holdings, including sector composition, country and/or geographical composition as relevant.
9. INDEMNIFICATION
Under the Trust’s organizational documents, the officers and Trustees have been granted certain indemnification rights against certain liabilities that may arise out of performance of their duties to the Trust. Additionally, in the normal course of business, the Trust may enter into contracts with service providers that contain a variety of indemnification clauses. The Trust’s maximum exposure under these arrangements is dependent on future claims that may be made against the Portfolios and, therefore, cannot be estimated.
10. REDEMPTION IN-KIND
After the close of business on July 15, 2016, Wells Fargo Emerging Growth Fund, which invests all of its assets in Emerging Growth Portfolio, redeemed assets through an in-kind redemption. In the redemption transaction, Wells Fargo Emerging Growth Fund issued securities which it received from Emerging Growth Portfolio with a value of $80,953,334 along with cash in the amount of $2,716,932. Emerging Growth Portfolio recognized gains in the amount of $30,973,586, which are reflected on the Statements of Operations. The redemption in-kind represented 9.01% of Emerging Growth Portfolio.
11. REGULATORY CHANGES
In October 2016, the Securities and Exchange Commission (“SEC”) adopted new rules and forms and amended existing rules and forms (together, “final rules”) intended to modernize and enhance the reporting and disclosure of information by registered investment companies and to enhance liquidity risk management by open-end mutual funds and exchange-traded funds. The final rules will enhance the quality of information available to investors and will allow the SEC to more effectively collect and use data reported by funds. In part, the final rules amend Regulation S-X and require standardized, enhanced disclosure about derivatives in the Fund’s financial statements, as well as other amendments. The compliance date for the amendments to Regulation S-X is August 1, 2017 while the compliance date for the new form types is June 1, 2018 and the compliance date for the liquidity risk management program requirements is December 1, 2018. Management is currently assessing the potential impact of these enhancements and their impact on the financial statement disclosures and reporting requirements.
| | | | |
| 152 | | Wells Fargo Allocation Funds | | Other information (unaudited) |
PROXY VOTING INFORMATION
A description of the policies and procedures used to determine how to vote proxies relating to portfolio securities is available without charge, upon request, by calling 1-800-222-8222, visiting our website at wellsfargofunds.com, or visiting the SEC website at sec.gov. Information regarding how the proxies related to portfolio securities were voted during the most recent 12-month period ended June 30 is available on the website at wellsfargofunds.com or by visiting the SEC website at sec.gov.
PORTFOLIO HOLDINGS INFORMATION
The complete portfolio holdings are publicly available on the website (wellsfargofunds.com) on a one-month delayed basis. In addition, top ten holdings information (excluding derivative positions) is publicly available on the website on a monthly, seven-day or more delayed basis. Each Fund and Portfolio files its complete schedule of portfolio holdings with the SEC for the first and third quarters of each fiscal year on Form N-Q, which is available by visiting the SEC website at sec.gov. In addition, each Form N-Q may be reviewed and copied at the SEC’s Public Reference Room in Washington, DC, and at regional offices in New York City, at 233 Broadway, and in Chicago, at 175 West Jackson Boulevard, Suite 900. Information about the Public Reference Room may be obtained by calling 1-800-SEC-0330.
| | | | | | |
| Other information (unaudited) | | Wells Fargo Allocation Funds | | | 153 | |
BOARD OF TRUSTEES AND OFFICERS
Each of the Trustees and Officers1 listed in the table below acts in identical capacities for each fund in the Wells Fargo family of funds, which consists of 139 mutual funds comprising the Wells Fargo Funds Trust, Wells Fargo Variable Trust, Wells Fargo Master Trust and four closed-end funds (collectively the “Fund Complex”). This table should be read in conjunction with the Prospectus and the Statement of Additional Information2. The mailing address of each Trustee and Officer is 525 Market Street, 12th Floor, San Francisco, CA 94105. Each Trustee and Officer serves an indefinite term, however, each Trustee serves such term until reaching the mandatory retirement age established by the Trustees.
Independent Trustees
| | | | | | |
Name and year of birth | | Position held and
length of service* | | Principal occupations during past five years or longer | | Current other public
company or investment
company directorships |
William R. Ebsworth
(Born 1957) | | Trustee, since 2015 | | Retired. From 1984 to 2013, equities analyst, portfolio manager, research director and chief investment officer at Fidelity Management and Research Company in Boston, Tokyo, and Hong Kong and retired in 2013 as Chief Investment Officer of Fidelity Strategic Advisers, Inc. where he lead a team of investment professionals managing client assets. Prior thereto, Board member of Hong Kong Securities Clearing Co., Hong Kong Options Clearing Corp., the Thailand International Fund, Ltd., Fidelity Investments Life Insurance Company, and Empire Fidelity Investments Life Insurance Company. Mr. Ebsworth is a CFA® charterholder and an Adjunct Lecturer, Finance, at Babson College. | | Asset Allocation Trust |
Jane A. Freeman
(Born 1953) | | Trustee, since 2015 | | Retired. From 2012 to 2014 and 1999 to 2008, Chief Financial Officer of Scientific Learning Corporation. From 2008 to 2012, Ms. Freeman provided consulting services related to strategic business projects. Prior to 1999, Portfolio Manager at Rockefeller & Co. and Scudder, Stevens & Clark. Board member of the Harding Loevner Funds from 1996 to 2014, serving as both Lead Independent Director and chair of the Audit Committee. Board member of the Russell Exchange Traded Funds Trust from 2011 to 2012 and the chair of the Audit Committee. Ms. Freeman is Chair of Taproot Foundation (non-profit organization), a Board Member of Ruth Bancroft Garden (non-profit organization) and an inactive chartered financial analyst. | | Asset Allocation Trust |
Peter G. Gordon**
(Born 1942) | | Trustee, since 1998; Chairman, since 2005 | | Co-Founder, Retired Chairman, President and CEO of Crystal Geyser Water Company. Trustee Emeritus, Colby College. | | Asset Allocation Trust |
Isaiah Harris, Jr.
(Born 1952) | | Trustee, since 2009 | | Retired. Chairman of the Board of CIGNA Corporation since 2009, and Director since 2005. From 2003 to 2011, Director of Deluxe Corporation. Prior thereto, President and CEO of BellSouth Advertising and Publishing Corp. from 2005 to 2007, President and CEO of BellSouth Enterprises from 2004 to 2005 and President of BellSouth Consumer Services from 2000 to 2003. Emeritus member of the Iowa State University Foundation Board of Governors. Emeritus Member of the Advisory Board of Iowa State University School of Business. Advisory Board Member, Palm Harbor Academy (charter school). Advisory Board Member, Child Evangelism Fellowship (non-profit). Mr. Harris is a certified public accountant (inactive status). | | CIGNA Corporation; Asset Allocation Trust |
Judith M. Johnson
(Born 1949) | | Trustee, since 2008;
Audit Committee Chairman, since 2008 | | Retired. Prior thereto, Chief Executive Officer and Chief Investment Officer of Minneapolis Employees Retirement Fund from 1996 to 2008. Ms. Johnson is an attorney, certified public accountant and a certified managerial accountant. | | Asset Allocation Trust |
David F. Larcker
(Born 1950) | | Trustee, since 2009 | | James Irvin Miller Professor of Accounting at the Graduate School of Business, Stanford University, Director of the Corporate Governance Research Initiative and Senior Faculty of The Rock Center for Corporate Governance since 2006. From 2005 to 2008, Professor of Accounting at the Graduate School of Business, Stanford University. Prior thereto, Ernst & Young Professor of Accounting at The Wharton School, University of Pennsylvania from 1985 to 2005. | | Asset Allocation Trust |
Olivia S. Mitchell
(Born 1953) | | Trustee, since 2006 | | International Foundation of Employee Benefit Plans Professor, Wharton School of the University of Pennsylvania since 1993. Director of Wharton’s Pension Research Council and Boettner Center on Pensions & Retirement Research, and Research Associate at the National Bureau of Economic Research. Previously, Cornell University Professor from 1978 to 1993. | | Asset Allocation Trust |
| | | | |
| 154 | | Wells Fargo Allocation Funds | | Other information (unaudited) |
| | | | | | |
Name and year of birth | | Position held and
length of service* | | Principal occupations during past five years or longer | | Current other public
company or investment
company directorships |
Timothy J. Penny
(Born 1951) | | Trustee, since 1996 | | President and Chief Executive Officer of Southern Minnesota Initiative Foundation, a non-profit organization, since 2007 and Senior Fellow at the Humphrey Institute Policy Forum at the University of Minnesota since 1995. Member of the Board of Trustees of NorthStar Education Finance, Inc., a non-profit organization, since 2007. | | Asset Allocation Trust |
Michael S. Scofield
(Born 1943) | | Trustee, since 2010 | | Served on the Investment Company Institute’s Board of Governors and Executive Committee from 2008-2011 as well the Governing Council of the Independent Directors Council from 2006-2011 and the Independent Directors Council Executive Committee from 2008-2011. Chairman of the IDC from 2008-2010. Institutional Investor (Fund Directions) Trustee of Year in 2007. Trustee of the Evergreen Funds complex (and its predecessors) from 1984 to 2010. Chairman of the Evergreen Funds from 2000-2010. Former Trustee of the Mentor Funds. Retired Attorney, Law Offices of Michael S. Scofield. | | Asset Allocation Trust |
| * | Length of service dates reflect the Trustee’s commencement of service with the Trust’s predecessor entities, where applicable. |
| ** | Peter Gordon is expected to retire on December 31, 2017. |
Officers
| | | | | | |
Name and
year of birth | | Position held and
length of service | | Principal occupations during past five years or longer | | |
Andrew Owen3 (Born 1960) | | President, since 2017 | | Executive Vice President of Wells Fargo & Company and Head of Affiliated Managers, Wells Fargo Asset Management, since 2014. Executive Vice President responsible for marketing, investments and product development for Wells Fargo Funds Management, LLC, from 2009 to 2014. | | |
Nancy Wiser1
(Born 1967) | | Treasurer, since 2012 | | Executive Vice President of Wells Fargo Funds Management, LLC since 2011. Chief Operating Officer and Chief Compliance Officer at LightBox Capital Management LLC, from 2008 to 2011. | | |
Jeremy DePalma1
(Born 1974) | | Treasurer, since 2012 | | Senior Vice President of Wells Fargo Funds Management, LLC since 2009. Senior Vice President of Evergreen Investment Management Company, LLC from 2008 to 2010 and head of the Fund Reporting and Control Team within Fund Administration from 2005 to 2010. | | |
C. David Messman
(Born 1960) | | Secretary, since 2000; Chief Legal Officer, since 2003 | | Senior Vice President and Secretary of Wells Fargo Funds Management, LLC since 2001. Assistant General Counsel of Wells Fargo Bank, N.A. since 2013 and Vice President and Managing Counsel of Wells Fargo Bank, N.A. from 1996 to 2013. | | |
Michael Whitaker
(Born 1967) | | Chief Compliance Officer, since 2016 | | Executive Vice President of Wells Fargo Funds Management, LLC since 2016. Chief Compliance Officer of Fidelity’s Fixed Income Funds and Asset Allocation Funds from 2008 to 2016, Compliance Officer of FMR Co., Inc. from 2014 to 2016, Fidelity Investments Money Management, Inc. from 2014 to 2016, Fidelity Investments from 2007 to 2016. | | |
David Berardi
(Born 1975) | | Assistant Treasurer, since 2009 | | Vice President of Wells Fargo Funds Management, LLC since 2009. Vice President of Evergreen Investment Management Company, LLC from 2008 to 2010. Manager of Fund Reporting and Control for Evergreen Investment Management Company, LLC from 2004 to 2010. | | |
| 1 | Jeremy DePalma acts as Treasurer of the Growth Balanced Fund, Moderate Balanced Fund, International Growth Portfolio, and International Value Portfolio and Assistant Treasurer of the remaining funds in this shareholder report. In addition, Jeremy DePalma acts as Treasurer of 65 other funds and Assistant Treasurer of 59 other funds in the Fund Complex. Nancy Wiser serves as Treasurer of the remaining funds in this shareholder report as well as 59 other funds in the Fund Complex. |
| 2 | The Statement of Additional Information includes additional information about the Trustees and is available, without charge, upon request, by calling 1-800-222-8222 or by visiting the website at wellsfargofunds.com. |
| 3 | Andrew Owen became President on January 1, 2017. |
| | | | | | |
| List of abbreviations | | Wells Fargo Allocation Funds | | | 155 | |
The following is a list of common abbreviations for terms and entities that may have appeared in this report.
| ACA | — ACA Financial Guaranty Corporation |
| ADR | — American depositary receipt |
| ADS | — American depositary shares |
| AGC | — Assured Guaranty Corporation |
| AGM | — Assured Guaranty Municipal |
| Ambac | — Ambac Financial Group Incorporated |
| AMT | — Alternative minimum tax |
| BAN | — Bond anticipation notes |
| BHAC | — Berkshire Hathaway Assurance Corporation |
| CAB | — Capital appreciation bond |
| CCAB | — Convertible capital appreciation bond |
| CDA | — Community Development Authority |
| CDO | — Collateralized debt obligation |
| DRIVER | — Derivative inverse tax-exempt receipts |
| DW&P | — Department of Water & Power |
| DWR | — Department of Water Resources |
| ECFA | — Educational & Cultural Facilities Authority |
| EDA | — Economic Development Authority |
| EDFA | — Economic Development Finance Authority |
| ETF | — Exchange-traded fund |
| FDIC | — Federal Deposit Insurance Corporation |
| FFCB | — Federal Farm Credit Banks |
| FGIC | — Financial Guaranty Insurance Corporation |
| FHA | — Federal Housing Administration |
| FHLB | — Federal Home Loan Bank |
| FHLMC | — Federal Home Loan Mortgage Corporation |
| FICO | — The Financing Corporation |
| FNMA | — Federal National Mortgage Association |
| GDR | — Global depositary receipt |
| GNMA | — Government National Mortgage Association |
| HCFR | — Healthcare facilities revenue |
| HEFA | — Health & Educational Facilities Authority |
| HEFAR | — Higher education facilities authority revenue |
| HFA | — Housing Finance Authority |
| HFFA | — Health Facilities Financing Authority |
| HUD | — Department of Housing and Urban Development |
| IDA | — Industrial Development Authority |
| IDAG | — Industrial Development Agency |
| KRW | — Republic of Korea won |
| LIBOR | — London Interbank Offered Rate |
| LIFER | — Long Inverse Floating Exempt Receipts |
| LLC | — Limited liability company |
| LLLP | — Limited liability limited partnership |
| LLP | — Limited liability partnership |
| MBIA | — Municipal Bond Insurance Association |
| MFHR | — Multifamily housing revenue |
| MSTR | — Municipal securities trust receipts |
| MUD | — Municipal Utility District |
| National | — National Public Finance Guarantee Corporation |
| PCFA | — Pollution Control Financing Authority |
| PCL | — Public Company Limited |
| PCR | — Pollution control revenue |
| PFA | — Public Finance Authority |
| PFFA | — Public Facilities Financing Authority |
| PFOTER | — Puttable floating option tax-exempt receipts |
| plc | — Public limited company |
| PUTTER | — Puttable tax-exempt receipts |
| R&D | — Research & development |
| Radian | — Radian Asset Assurance |
| RAN | — Revenue anticipation notes |
| RDA | — Redevelopment Authority |
| RDFA | — Redevelopment Finance Authority |
| REIT | — Real estate investment trust |
| ROC | — Reset option certificates |
| SAVRS | — Select auction variable rate securities |
| SBA | — Small Business Authority |
| SDR | — Swedish depositary receipt |
| SFHR | — Single-family housing revenue |
| SFMR | — Single-family mortgage revenue |
| SPA | — Standby purchase agreement |
| SPDR | — Standard & Poor’s Depositary Receipts |
| SPEAR | — Short Puttable Exempt Adjustable Receipts |
| STRIPS | — Separate trading of registered interest and |
| TAN | — Tax anticipation notes |
| TIPS | — Treasury inflation-protected securities |
| TRAN | — Tax revenue anticipation notes |
| TTFA | — Transportation Trust Fund Authority |
| TVA | — Tennessee Valley Authority |
This page is intentionally left blank.

For more information
More information about Wells Fargo Funds is available free upon request. To obtain literature, please write, email, visit the Funds’ website, or call:
Wells Fargo Funds
P.O. Box 8266
Boston, MA 02266-8266
Email: fundservice@wellsfargo.com
Website: wellsfargofunds.com
Individual investors: 1-800-222-8222
Retail investment professionals: 1-888-877-9275
Institutional investment professionals: 1-866-765-0778
This report and the financial statements contained herein are submitted for the general information of the shareholders of Wells Fargo Funds. If this report is used for promotional purposes, distribution of the report must be accompanied or preceded by a current prospectus. Before investing, please consider the investment objectives, risks, charges, and expenses of the investment. For a current prospectus and, if available, a summary prospectus, containing this information, call 1-800-222-8222 or visit the Funds’ website at wellsfargofunds.com. Read the prospectus carefully before you invest or send money.
Wells Fargo Asset Management (WFAM) is a trade name used by the asset management businesses of Wells Fargo & Company. Wells Fargo Funds Management, LLC, a wholly owned subsidiary of Wells Fargo & Company, provides investment advisory and administrative services for Wells Fargo Funds. Other affiliates of Wells Fargo & Company provide subadvisory and other services for the funds. The funds are distributed by Wells Fargo Funds Distributor, LLC, Member FINRA, an affiliate of Wells Fargo & Company. Neither Wells Fargo Funds Management nor Wells Fargo Funds Distributor has Fund customer accounts/assets, and neither provides investment advice/recommendations or acts as an investment advice fiduciary to any investor.
NOT FDIC INSURED ◾ NO BANK GUARANTEE ◾ MAY LOSE VALUE
© 2016 Wells Fargo Funds Management, LLC. All rights reserved.
| | |
 | | 248012 01-17 SAAFNLD/SAR109 11-16 |
Semi-Annual Report
November 30, 2016

Equity Gateway Funds

| ∎ | | Wells Fargo C&B Large Cap Value Fund |
| ∎ | | Wells Fargo Diversified Equity Fund |
| ∎ | | Wells Fargo Emerging Growth Fund |
| ∎ | | Wells Fargo International Value Fund |
| ∎ | | Wells Fargo Small Company Growth Fund |
| ∎ | | Wells Fargo Small Company Value Fund |

Reduce clutter. Save trees.
Sign up for electronic delivery of prospectuses and shareholder reports at wellsfargo.com/advantagedelivery
Contents
| * | A complete schedule of portfolio holdings as of the report date may be obtained, free of charge, by accessing the following website: https://www.wellsfargofunds.com/assets/edocs/regulatory/holdings/index-semi.pdf or by calling Wells Fargo Funds at 1-800-222-8222. This complete schedule, filed on Form N-CSRS, is also available on the SEC’s website at sec.gov. |
The views expressed and any forward-looking statements are as of November 30, 2016, unless otherwise noted, and are those of the Fund managers and/or Wells Fargo Funds Management, LLC. Discussions of individual securities, or the markets generally, or any Wells Fargo Fund are not intended as individual recommendations. Future events or results may vary significantly from those expressed in any forward-looking statements. The views expressed are subject to change at any time in response to changing circumstances in the market. Wells Fargo Funds Management, LLC and the Fund disclaim any obligation to publicly update or revise any views expressed or forward-looking statements.
NOT FDIC INSURED ◾ NO BANK GUARANTEE ◾ MAY LOSE VALUE
| | | | |
| 2 | | Wells Fargo Equity Gateway Funds | | Letter to shareholders (unaudited) |

Andrew Owen
President
Wells Fargo Funds
Despite fluctuating markets, U.S. small-, mid-, and large-cap stocks returned 15.37%, 7.14%, and 6.26% for the six-month period, respectively.
Dear Shareholder:
As the new president of Wells Fargo Funds now that Karla Rabusch is retiring from that position after nearly 14 years, I am pleased to offer you this semi-annual report for the Wells Fargo Equity Gateway Funds for the six-month period that ended November 30, 2016. During this period, which began June 1, 2016, the U.S. economy displayed resilience although growth overall was somewhat sluggish. U.S. stocks experienced heightened volatility, especially around the U.K.’s Brexit vote in late June and the U.S. elections in early November. Despite fluctuating markets, U.S. small-, mid-, and large-cap stocks returned 15.37%, 7.14%, and 6.26% for the six-month period, respectively, as measured by the Russell 2000® Index,1 the Russell Midcap® Index,2 and the Russell 1000® Index3.
The U.K.’s vote drove market volatility in June, as the six-month reporting period began.
Following a market rally that carried into early June, a disappointing jobs report and uncertainty over whether the U.K. would remain in the European Union (E.U.) led to heightened volatility later in June. The U.K.’s Brexit vote on June 23 shocked countries in Europe and much of the rest of the world. Stock markets plummeted as investors worried that the U.K.’s departure from the E.U. would slow global growth and prolong the low-interest-rate environment. Following the initial rout, however, U.S. stocks rallied as investors seemed to decide that any negative effects would be more localized and not create a serious risk for global growth.
U.S. stocks delivered generally positive results in July–September 2016.
The rally in U.S. stocks continued into early July. U.S. stocks then generally continued to move upward at a more moderate pace, reaching a quarterly peak in August before the upward momentum started to lose some steam. Markets worldwide have been supported to varying degrees by accommodative policies from leading central banks; as a result, investors have watched closely for any signs that global central banks might tighten their measures. Although many U.S. investors had doubted the U.S. Federal Reserve (Fed) would increase interest rates in September, comments by several Fed officials in early September raised concerns, sending stock and bond prices downward. However, immediately following the Fed’s September 20 meeting, U.S. stocks surged on news that the Fed had decided to leave short-term interest rates unchanged for the time being and had signaled its intention to make a rate increase by year-end.
U.S. stocks slipped in October, but November brought a rally.
In October, U.S. stocks overall tended to lose some steam, perhaps due partly to increased uncertainty regarding the approaching general election. However, following Donald Trump’s election in early November as president, U.S. stocks began to rally. A string of supportive economic news, including favorable manufacturing and corporate-earnings data, solid jobs gains, and improved consumer confidence, helped the rally continue through the end of the reporting period.
| 1 | The Russell 2000® Index measures the performance of the 2,000 smallest companies in the Russell 3000® Index, which represents approximately 8% of the total market capitalization of the Russell 3000® Index. You cannot invest directly in an index. |
| 2 | The Russell Midcap® Index measures the performance of the 800 smallest companies in the Russell 1000® Index, which represent approximately 25% of the total market capitalization of the Russell 1000® Index. You cannot invest directly in an index. |
| 3 | The Russell 1000® Index measures the performance of the 1,000 largest companies in the Russell 3000® Index, which represents approximately 92% of the total market capitalization of the Russell 3000® Index. You cannot invest directly in an index. |
| | | | | | |
| Letter to shareholders (unaudited) | | Wells Fargo Equity Gateway Funds | | | 3 | |
Don’t let short-term uncertainty derail long-term investment goals.
Periods of uncertainty can present challenges, but experience has taught us that maintaining long-term investment goals can be an effective way to plan for the future. To help you create a sound strategy based on your personal goals and risk tolerance, Wells Fargo Funds offers more than 100 mutual funds spanning a wide range of asset classes and investment styles. Although diversification cannot guarantee an investment profit or prevent losses, we believe it can be an effective way to manage investment risk and potentially smooth out overall portfolio performance. We encourage investors to know their investments and to understand that appropriate levels of risk-taking may unlock opportunities.
Thank you for choosing to invest in Wells Fargo Funds. We appreciate your confidence in us and remain committed to helping you meet your financial needs.
Sincerely,

Andrew Owen
President
Wells Fargo Funds
Although diversification cannot guarantee an investment profit or prevent losses, we believe it can be an effective way to manage investment risk and potentially smooth out overall portfolio performance.
For further information about your Fund, contact your investment professional, visit our website at wellsfargofunds.com, or call us directly at 1-800-222-8222. We are available 24 hours a day, 7 days a week.
| | | | |
| 4 | | Wells Fargo Equity Gateway Funds | | Performance highlights (unaudited) |
Wells Fargo C&B Large Cap Value Fund1
Investment objective
The Fund seeks maximum long-term return (current income and capital appreciation), consistent with minimizing risk to principal.
Manager
Wells Fargo Funds Management, LLC
Subadviser for the affiliated master portfolio
Cooke & Bieler, L.P.
Portfolio managers
| | |
Andrew Armstrong, CFA® Steve Lyons, CFA® Michael M. Meyer, CFA® Edward W. O’Connor, CFA® | | R. James O’Neil, CFA® Mehul Trivedi, CFA® William Weber, CFA® |
Average annual total returns (%) as of November 30, 2016
| | | | | | | | | | | | | | | | | | | | | | | | | | | | | | | | | | |
| | | | | Including sales charge | | | Excluding sales charge | | | Expense ratios2 (%) | |
| | | Inception date | | 1 year | | | 5 year | | | 10 year | | | 1 year | | | 5 year | | | 10 year | | | Gross | | | Net3 | |
| Class A (CBEAX) | | 7-26-2004 | | | 3.68 | | | | 11.65 | | | | 4.62 | | | | 10.01 | | | | 12.99 | | | | 5.25 | | | | 1.25 | | | | 1.15 | |
| Class B (CBEBX)* | | 7-26-2004 | | | 4.19 | | | | 11.88 | | | | 4.71 | | | | 9.19 | | | | 12.13 | | | | 4.71 | | | | 2.00 | | | | 1.90 | |
| Class C (CBECX) | | 7-26-2004 | | | 8.27 | | | | 12.14 | | | | 4.48 | | | | 9.27 | | | | 12.14 | | | | 4.48 | | | | 2.00 | | | | 1.90 | |
| Class R6 (CBEJX)4 | | 10-31-2016 | | | – | | | | – | | | | – | | | | 10.34 | | | | 13.34 | | | | 5.61 | | | | 0.82 | | | | 0.70 | |
| Administrator Class (CBLLX) | | 7-26-2004 | | | – | | | | – | | | | – | | | | 10.22 | | | | 13.20 | | | | 5.46 | | | | 1.17 | | | | 1.00 | |
| Institutional Class (CBLSX) | | 7-26-2004 | | | – | | | | – | | | | – | | | | 10.43 | | | | 13.47 | | | | 5.73 | | | | 0.92 | | | | 0.80 | |
| Russell 1000® Value Index5 | | – | | | – | | | | – | | | | – | | | | 12.02 | | | | 14.69 | | | | 5.70 | | | | – | | | | – | |
| * | | At the close of business on December 5, 2016, existing Class B shareholders were converted to Class A shareholders. Effective December 6, 2016, Class B shares are no longer offered by the Fund. |
Figures quoted represent past performance, which is no guarantee of future results, and do not reflect taxes that a shareholder may pay on fund distributions or the redemption of fund shares. Investment return and principal value of an investment will fluctuate so that an investor’s shares, when redeemed, may be worth more or less than their original cost. Performance shown without sales charges would be lower if sales charges were reflected. Current performance may be lower or higher than the performance data quoted, which assumes the reinvestment of dividends and capital gains. Current month-end performance is available on the Fund’s website, wellsfargofunds.com.
Index returns do not include transaction costs associated with buying and selling securities, any mutual fund fees or expenses, or any taxes. It is not possible to invest directly in an index.
For Class A shares, the maximum front-end sales charge is 5.75%. For Class B shares, the maximum contingent deferred sales charge is 5.00%. For Class C shares, the maximum contingent deferred sales charge is 1.00%. Performance including a contingent deferred sales charge assumes the sales charge for the corresponding time period. Class R6, Administrator Class, and Institutional Class shares are sold without a front-end sales charge or contingent deferred sales charge.
Stock values fluctuate in response to the activities of individual companies and general market and economic conditions. Consult the Fund’s prospectus for additional information on these and other risks.
Please see footnotes on page 5.
| | | | | | |
| Performance highlights (unaudited) | | Wells Fargo Equity Gateway Funds | | | 5 | |
Wells Fargo C&B Large Cap Value Fund (continued)
| | | | |
| Ten largest holdings (%) as of November 30, 20166 | |
JPMorgan Chase & Company | | | 3.27 | |
Laboratory Corporation of America Holdings | | | 3.21 | |
AerCap Holdings NV | | | 3.11 | |
RenaissanceRe Holdings Limited | | | 3.09 | |
Omnicom Group Incorporated | | | 2.93 | |
State Street Corporation | | | 2.92 | |
Gildan Activewear Incorporated | | | 2.72 | |
Twenty-First Century Fox Incorporated Class A | | | 2.69 | |
Abbott Laboratories | | | 2.66 | |
The Progressive Corporation | | | 2.64 | |
|
| Sector distribution as of November 30, 20167 |
|
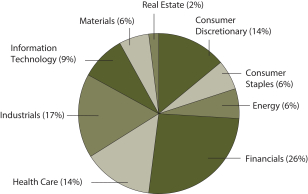
|
| 1 | The Fund is a gateway feeder fund that invests all of its assets in a single affiliated master portfolio of the Wells Fargo Master Trust with a substantially similar investment objective and substantially similar investment strategies. References to the investment activities of the Fund are intended to refer to the investment activities of the affiliated master portfolio in which it invests. |
| 2 | Reflects the expense ratios as stated in the most recent prospectuses. The expense ratios shown are subject to change and may differ from the annualized expense ratios shown in the financial highlights of this report. |
| 3 | The manager has contractually committed through September 30, 2017 (September 30, 2018 for Class R6), to waive fees and/or reimburse expenses to the extent necessary to cap the Fund’s Total Annual Fund Operating Expenses After Fee Waiver at the amounts shown. After this time, the cap may be increased or the commitment to maintain the cap may be terminated only with the approval of the Board of Trustees. Brokerage commissions, stamp duty fees, interest, taxes, acquired fund fees and expenses, and extraordinary expenses are excluded from the expense cap. Net expenses from the affiliated master portfolio are included in the expense cap. Without this cap, the Fund’s returns would have been lower. |
| 4 | Historical performance shown for the Class R6 shares prior to their inception reflects the performance of the Institutional Class shares, and is not adjusted to reflect Class R6 shares expenses. If these expenses had been included, returns would be higher. |
| 5 | The Russell 1000® Value Index measures the performance of those Russell 1000 companies with lower price-to-book ratios and lower forecasted growth values. You cannot invest directly in an index. |
| 6 | The ten largest holdings, excluding cash and cash equivalents, are calculated based on the value of the securities of the affiliated master portfolio allocable to the Fund divided by the total net assets of the Fund. Holdings are subject to change and may have changed since the date specified. |
| 7 | Amounts represent the sector distribution of the affiliated master portfolio which are calculated based on the total long-term investments of the affiliated master portfolio. These amounts are subject to change and may have changed since the date specified. |
| | | | |
| 6 | | Wells Fargo Equity Gateway Funds | | Performance highlights (unaudited) |
Wells Fargo Diversified Equity Fund1
Investment objective
The Fund seeks long-term total capital appreciation.
Manager
Wells Fargo Funds Management, LLC
Subadvisers for the affiliated master portfolios
Analytic Investors, LLC‡
Artisan Partners Limited Partnership
Cooke & Bieler, L.P.
Golden Capital Management, LLC
LSV Asset Management
Peregrine Capital Management, LLC
Phocas Financial Corporation‡
Wells Capital Management Incorporated
Portfolio managers
Thomas C. Biwer, CFA®
Aldo Ceccarelli, CFA®
Erik Sens, CFA®
Average annual total returns (%) as of November 30, 2016
| | | | | | | | | | | | | | | | | | | | | | | | | | | | | | | | | | |
| | | | | Including sales charge | | | Excluding sales charge | | | Expense ratios2 (%) | |
| | | Inception date | | 1 year | | | 5 year | | | 10 year | | | 1 year | | | 5 year | | | 10 year | | | Gross | | | Net3 | |
| Class A (NVDAX) | | 5-2-1996 | | | (3.41 | ) | | | 9.78 | | | | 4.02 | | | | 2.48 | | | | 11.09 | | | | 4.64 | | | | 1.41 | | | | 1.25 | |
| Class C (WFDEX) | | 10-1-1998 | | | 0.69 | | | | 10.27 | | | | 3.86 | | | | 1.69 | | | | 10.27 | | | | 3.86 | | | | 2.16 | | | | 2.00 | |
| Administrator Class (NVDEX) | | 11-11-1994 | | | – | | | | – | | | | – | | | | 2.75 | | | | 11.38 | | | | 4.91 | | | | 1.33 | | | | 1.00 | |
| Diversified Equity Blended Index4 | | – | | | – | | | | – | | | | – | | | | 6.71 | | | | 13.11 | | | | 6.07 | | | | – | | | | – | |
| MSCI EAFE Index (Net)5 | | – | | | – | | | | – | | | | – | | | | (3.66 | ) | | | 5.62 | | | | 0.72 | | | | – | | | | – | |
| Russell 1000® Growth Index6 | | – | | | – | | | | – | | | | – | | | | 4.22 | | | | 14.14 | | | | 8.24 | | | | – | | | | – | |
| Russell 1000® Value Index7 | | – | | | – | | | | – | | | | – | | | | 12.02 | | | | 14.69 | | | | 5.70 | | | | – | | | | – | |
| Russell 2000® Index8 | | – | | | – | | | | – | | | | – | | | | 12.08 | | | | 13.98 | | | | 6.81 | | | | – | | | | – | |
| S&P 500 Index9 | | – | | | – | | | | – | | | | – | | | | 8.06 | | | | 14.45 | | | | 6.89 | | | | – | | | | – | |
Figures quoted represent past performance, which is no guarantee of future results, and do not reflect taxes that a shareholder may pay on fund distributions or the redemption of fund shares. Investment return and principal value of an investment will fluctuate so that an investor’s shares, when redeemed, may be worth more or less than their original cost. Performance shown without sales charges would be lower if sales charges were reflected. Current performance may be lower or higher than the performance data quoted, which assumes the reinvestment of dividends and capital gains. Current month-end performance is available on the Fund’s website, wellsfargofunds.com.
Index returns do not include transaction costs associated with buying and selling securities, any mutual fund fees or expenses, or any taxes. It is not possible to invest directly in an index.
For Class A shares, the maximum front-end sales charge is 5.75%. For Class C shares, the maximum contingent deferred sales charge is 1.00%. Performance including a contingent deferred sales charge assumes the sales charge for the corresponding time period. Administrator Class shares are sold without a front-end sales charge or contingent deferred sales charge.
Stock values fluctuate in response to the activities of individual companies and general market and economic conditions. The use of derivatives may reduce returns and/or increase volatility. Certain investment strategies tend to increase the total risk of an investment (relative to the broader market). The Fund is exposed to foreign investment risk and smaller-company securities risk. Consult the Fund’s prospectus for additional information on these and other risks.
Please see footnotes on page 7.
| | | | | | |
| Performance highlights (unaudited) | | Wells Fargo Equity Gateway Funds | | | 7 | |
Wells Fargo Diversified Equity Fund (continued)
| | | | |
| Ten largest holdings (%) as of November 30, 201610 | |
Amazon.com Incorporated | | | 1.85 | |
Facebook Incorporated Class A | | | 1.59 | |
Microsoft Corporation | | | 1.56 | |
Alphabet Incorporated Class A | | | 1.47 | |
Apple Incorporated | | | 1.31 | |
Exxon Mobil Corporation | | | 1.15 | |
JPMorgan Chase & Company | | | 1.15 | |
Visa Incorporated Class A | | | 1.01 | |
Alphabet Incorporated Class C | | | 1.00 | |
Bank of America Corporation | | | 0.87 | |
|
| Sector distribution as of November 30, 201611 |
|
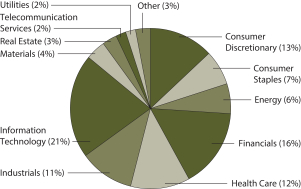
|
| ‡ | Effective February 1, 2017, Analytic Investors, LLC replaced Phocas Financial Corporation as a subadviser. |
| 1 | The Fund is a gateway feeder fund that invests all of its assets in two or more affiliated master portfolios of the Wells Fargo Master Trust in varying proportions. References to the investment activities of the Fund are intended to refer to the investment activities of the affiliated master portfolios in which it invests. |
| 2 | Reflects the expense ratios as stated in the most recent prospectuses, which include the impact of 0.59% in net expenses from affiliated master portfolios. The expense ratios shown are subject to change and may differ from the annualized expense ratios shown in the financial highlights of this report, which do not include net expenses from affiliated master portfolios. |
| 3 | The manager has contractually committed through September 30, 2017, to waive fees and/or reimburse expenses to the extent necessary to cap the Fund’s Total Annual Fund Operating Expenses After Fee Waiver at the amounts shown. After this time, the cap may be increased or the commitment to maintain the cap may be terminated only with the approval of the Board of Trustees. Brokerage commissions, stamp duty fees, interest, taxes, acquired money market fund fees and expenses (if any), and extraordinary expenses are excluded from the expense cap. All other acquired fund fees from the underlying affiliated master portfolios are included in the expense cap. Without this cap, the Fund’s returns would have been lower. |
| 4 | Source: Wells Fargo Funds Management, LLC. The Diversified Equity Blended Index is weighted 15% in the MSCI EAFE Index (Net), 25% in the Russell 1000® Growth Index, 25% in the Russell 1000® Value Index, 10% in the Russell 2000® Index, and 25% in the S&P 500 Index. You cannot invest directly in an index. |
| 5 | The Morgan Stanley Capital International (MSCI) Europe, Australasia, Far East (EAFE) Index (Net) is a free-float-adjusted market-capitalization-weighted index that is designed to measure the equity market performance of developed markets, excluding the United States and Canada. The MSCI EAFE Index (Net) consists of the following 21 developed markets country indexes: Australia, Austria, Belgium, Denmark, Finland, France, Germany, Hong Kong, Ireland, Israel, Italy, Japan, the Netherlands, New Zealand, Norway, Portugal, Singapore, Spain, Sweden, Switzerland, and the United Kingdom. Source: MSCI. MSCI makes no representations and shall have no liability whatsoever with respect to any MSCI data contained herein. The MSCI data may not be further redistributed or used as a basis for other indexes or any securities or financial products. This report is not approved, reviewed, or produced by MSCI. You cannot invest directly in an index. |
| 6 | The Russell 1000® Growth Index measures the performance of those Russell 1000 companies with higher price-to-book ratios and higher forecasted growth values. You cannot invest directly in an index. |
| 7 | The Russell 1000® Value Index measures the performance of those Russell 1000 companies with lower price-to-book ratios and lower forecasted growth values. You cannot invest directly in an index. |
| 8 | The Russell 2000® Index measures the performance of the 2,000 smallest companies in the Russell 3000® Index, which represents approximately 8% of the total market capitalization of the Russell 3000® Index. You cannot invest directly in an index. |
| 9 | The S&P 500 Index consists of 500 stocks chosen for market size, liquidity, and industry group representation. It is a market-value-weighted index with each stock’s weight in the index proportionate to its market value. You cannot invest directly in an index. |
| 10 | The ten largest holdings, excluding cash and cash equivalents, are calculated based on the value of the securities of the affiliated master portfolios allocable to the Fund divided by the total net assets of the Fund. Holdings are subject to change and may have changed since the date specified. |
| 11 | Amounts represent the aggregated sector distributions of the affiliated master portfolios which are calculated based on the Fund’s ownership percentage of each respective affiliated master portfolio’s long-term investments. These amounts are subject to change and may have changed since the date specified. |
| | | | |
| 8 | | Wells Fargo Equity Gateway Funds | | Performance highlights (unaudited) |
Wells Fargo Emerging Growth Fund1
The Fund is closed to most new investors.2
Investment objective
The Fund seeks long-term capital appreciation.
Manager
Wells Fargo Funds Management, LLC
Subadviser for the affiliated master portfolio
Wells Capital Management incorporated
Portfolio managers
Joseph M. Eberhardy, CFA®, CPA
Thomas C. Ognar, CFA®
Bruce C. Olson, CFA®
Average annual total returns (%) as of November 30, 20163
| | | | | | | | | | | | | | | | | | | | | | | | | | | | | | | | |
| | | | | Including sales charge | | | Excluding sales charge | | Expense ratios4 (%) | |
| | | Inception date | | 1 year | | | 5 year | | | Since
inception | | | 1 year | | | 5 year | | | Since
inception | | Gross | | | Net5 | |
| Class A (WEMAX) | | 3-31-2008 | | | (0.82 | ) | | | 9.24 | | | | 6.62 | | | | 5.23 | | | | 10.55 | | | 7.27 | | | 1.34 | | | | 1.34 | |
| Class C (WEMCX) | | 3-31-2008 | | | 3.46 | | | | 9.73 | | | | 6.48 | | | | 4.46 | | | | 9.73 | | | 6.48 | | | 2.09 | | | | 2.09 | |
| Administrator Class (WFGDX) | | 1-31-2007 | | | – | | | | – | | | | – | | | | 5.34 | | | | 10.74 | | | 7.49 | | | 1.26 | | | | 1.20 | |
| Institutional Class (WEMIX) | | 3-31-2008 | | | – | | | | – | | | | – | | | | 5.74 | | | | 11.07 | | | 7.76 | | | 1.01 | | | | 0.90 | |
| Russell 2000® Growth Index6 | | – | | | – | | | | – | | | | – | | | | 4.58 | | | | 13.38 | | | 7.55 | | | – | | | | – | |
Figures quoted represent past performance, which is no guarantee of future results, and do not reflect taxes that a shareholder may pay on fund distributions or the redemption of fund shares. Investment return and principal value of an investment will fluctuate so that an investor’s shares, when redeemed, may be worth more or less than their original cost. Performance shown without sales charges would be lower if sales charges were reflected. Current performance may be lower or higher than the performance data quoted, which assumes the reinvestment of dividends and capital gains. Current month-end performance is available on the Fund’s website, wellsfargofunds.com.
Index returns do not include transaction costs associated with buying and selling securities, any mutual fund fees or expenses, or any taxes. It is not possible to invest directly in an index.
For Class A shares, the maximum front-end sales charge is 5.75%. For Class C shares, the maximum contingent deferred sales charge is 1.00%. Performance including a contingent deferred sales charge assumes the sales charge for the corresponding time period. Administrator Class and Institutional Class shares are sold without a front-end sales charge or contingent deferred sales charge.
Stock values fluctuate in response to the activities of individual companies and general market and economic conditions. Smaller-company stocks tend to be more volatile and less liquid than those of larger companies. Certain investment strategies tend to increase the total risk of an investment (relative to the broader market). The Fund is exposed to foreign investment risk. Consult the Fund’s prospectus for additional information on these and other risks.
Please see footnotes on page 9.
| | | | | | |
| Performance highlights (unaudited) | | Wells Fargo Equity Gateway Funds | | | 9 | |
Wells Fargo Emerging Growth Fund (continued)
| | | | |
| Ten largest holdings (%) as of November 30, 20167 | |
MarketAxess Holdings Incorporated | | | 2.99 | |
On Assignment Incorporated | | | 2.75 | |
Proofpoint Incorporated | | | 2.59 | |
SPS Commerce Incorporated | | | 2.49 | |
Q2 Holdings Incorporated | | | 2.44 | |
WageWorks Incorporated | | | 2.35 | |
Ligand Pharmaceuticals Incorporated | | | 2.32 | |
HealthEquity Incorporated | | | 2.04 | |
The Spectranetics Corporation | | | 1.91 | |
Envestnet Incorporated | | | 1.89 | |
|
| Sector distribution as of November 30, 20168 |
|
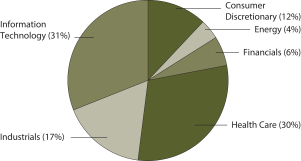
|
| 1 | The Fund is a gateway feeder fund that invests all of its assets in a single affiliated master portfolio of the Wells Fargo Master Trust with a substantially similar investment objective and substantially similar investment strategies. References to the investment activities of the Fund are intended to refer to the investment activities of the affiliated master portfolio in which it invests. |
| 2 | Please see the Fund’s current Statement of Additional Information for further details. |
| 3 | Historical performance shown for Class A shares prior to their inception reflects the performance of the former Investor Class shares, and includes the higher expenses applicable to the former Investor Class shares. If these expenses had not been included, returns would be higher. Historical performance shown for Class C shares prior to their inception reflects the performance of the former Investor Class shares, adjusted to reflect the higher expenses applicable to Class C shares. Historical performance shown for Institutional Class shares prior to their inception reflects the performance of Administrator Class shares, and includes the higher expenses applicable to Administrator Class shares. If these expenses had not been included, returns would be higher. |
| 4 | Reflects the expense ratios as stated in the most recent prospectuses. The expense ratios shown are subject to change and may differ from the annualized expense ratios shown in the financial highlights of this report. |
| 5 | The manager has contractually committed through September 30, 2017, to waive fees and/or reimburse expenses to the extent necessary to cap the Fund’s Total Annual Fund Operating Expenses After Fee Waiver at 1.35% for Class A, 2.10% for Class C, 1.20% for Administrator Class, and 0.90% for Institutional Class. After this time, the cap may be increased or the commitment to maintain the cap may be terminated only with the approval of the Board of Trustees. Brokerage commissions, stamp duty fees, interest, taxes, acquired fund fees and expenses, and extraordinary expenses are excluded from the expense cap. Net expenses from the affiliated master portfolio are included in the expense cap. Without this cap, the Fund’s returns would have been lower. |
| 6 | The Russell 2000® Growth Index measures the performance of those Russell 2000 companies with higher price-to-book ratios and higher forecasted growth values. You cannot invest directly in an index. |
| 7 | The ten largest holdings, excluding cash and cash equivalents, are calculated based on the value of the securities of the affiliated master portfolio allocable to the Fund divided by the total net assets of the Fund. Holdings are subject to change and may have changed since the date specified. |
| 8 | Amounts represent the sector distribution of the affiliated master portfolio which are calculated based on the total long-term investments of the affiliated master portfolio. These amounts are subject to change and may have changed since the date specified. |
| | | | |
| 10 | | Wells Fargo Equity Gateway Funds | | Performance highlights (unaudited) |
Wells Fargo Index Fund1
Investment objective
The Fund seeks to replicate the total return of S&P 500 Index, before fees and expenses.
Manager
Wells Fargo Funds Management, LLC
Subadviser for the affiliated master portfolio
Golden Capital Management, LLC
Portfolio managers
John R. Campbell, CFA®
Justin Carr, CFA®
David Neal, CFA®
Average annual total returns (%) as of November 30, 20162
| | | | | | | | | | | | | | | | | | | | | | | | | | | | | | | | | | |
| | | | | Including sales charge | | | Excluding sales charge | | | Expense ratios3 (%) | |
| | | Inception date | | 1 year | | | 5 year | | | 10 year | | | 1 year | | | 5 year | | | 10 year | | | Gross | | | Net4 | |
| Class A (WFILX) | | 11-4-1998 | | | 1.39 | | | | 12.51 | | | | 5.71 | | | | 7.58 | | | | 13.85 | | | | 6.34 | | | | 0.63 | | | | 0.45 | |
| Class B (WFIMX)* | | 11-3-1998 | | | 1.78 | | | | 12.75 | | | | 5.78 | | | | 6.78 | | | | 13.00 | | | | 5.78 | | | | 1.38 | | | | 1.20 | |
| Class C (WFINX) | | 4-30-1999 | | | 5.78 | | | | 13.00 | | | | 5.54 | | | | 6.78 | | | | 13.00 | | | | 5.54 | | | | 1.38 | | | | 1.20 | |
| Administrator Class (WFIOX) | | 2-14-1985 | | | – | | | | – | | | | – | | | | 7.80 | | | | 14.17 | | | | 6.63 | | | | 0.40 | | | | 0.25 | |
| S&P 500 Index5 | | – | | | – | | | | – | | | | – | | | | 8.06 | | | | 14.45 | | | | 6.89 | | | | – | | | | – | |
| * | | Class B shares are closed to investment, except in connection with the reinvestment of any distribution and permitted exchanges. |
Figures quoted represent past performance, which is no guarantee of future results, and do not reflect taxes that a shareholder may pay on fund distributions or the redemption of fund shares. Investment return and principal value of an investment will fluctuate so that an investor’s shares, when redeemed, may be worth more or less than their original cost. Performance shown without sales charges would be lower if sales charges were reflected. Current performance may be lower or higher than the performance data quoted, which assumes the reinvestment of dividends and capital gains. Current month-end performance is available on the Fund’s website, wellsfargofunds.com.
Index returns do not include transaction costs associated with buying and selling securities, any mutual fund fees or expenses, or any taxes. It is not possible to invest directly in an index.
For Class A shares, the maximum front-end sales charge is 5.75%. For Class B shares, the maximum contingent deferred sales charge is 5.00%. For Class C shares, the maximum contingent deferred sales charge is 1.00%. Performance including a contingent deferred sales charge assumes the sales charge for the corresponding time period. Administrator Class shares are sold without a front-end sales charge or contingent deferred sales charge.
Stock values fluctuate in response to the activities of individual companies and general market and economic conditions. The use of derivatives may reduce returns and/or increase volatility. Consult the Fund’s prospectus for additional information on these and other risks.
Please see footnotes on page 11.
| | | | | | |
| Performance highlights (unaudited) | | Wells Fargo Equity Gateway Funds | | | 11 | |
Wells Fargo Index Fund (continued)
| | | | |
| Ten largest holdings (%) as of November 30, 20166 | |
Apple Incorporated | | | 3.09 | |
Microsoft Corporation | | | 2.44 | |
Exxon Mobil Corporation | | | 1.88 | |
Johnson & Johnson | | | 1.58 | |
Berkshire Hathaway Incorporated Class B | | | 1.55 | |
Amazon.com Incorporated | | | 1.53 | |
JPMorgan Chase & Company | | | 1.50 | |
General Electric Company | | | 1.43 | |
Facebook Incorporated Class A | | | 1.43 | |
Wells Fargo & Company | | | 1.25 | |
|
| Sector distribution as of November 30, 20167 |
|
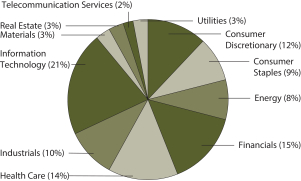
|
| 1 | The Fund is a gateway feeder fund that invests all of its assets in a single affiliated master portfolio of the Wells Fargo Master Trust with a substantially similar investment objective and substantially similar investment strategies. References to the investment activities of the Fund are intended to refer to the investment activities of the affiliated master portfolio in which it invests. |
| 2 | Historical performance shown for all classes of the Fund prior to July 19, 2010, is based on the performance of the Fund’s predecessor, Evergreen Equity Index Fund. |
| 3 | Reflects the expense ratios as stated in the most recent prospectuses. The expense ratios shown are subject to change and may differ from the annualized expense ratios shown in the financial highlights of this report. |
| 4 | The manager has contractually committed through September 30, 2017, to waive fees and/or reimburse expenses to the extent necessary to cap the Fund’s Total Annual Fund Operating Expenses After Fee Waiver at the amounts shown. After this time, the caps may be increased or the commitment to maintain the caps may be terminated only with the approval of the Board of Trustees. Brokerage commissions, stamp duty fees, interest, taxes, acquired fund fees and expenses, and extraordinary expenses are excluded from the expense cap. Net expenses from the affiliated master portfolio are included in the expense cap. Without this cap, the Fund’s returns would have been lower. |
| 5 | The S&P 500 Index consists of 500 stocks chosen for market size, liquidity, and industry group representation. It is a market-value-weighted index with each stock’s weight in the index proportionate to its market value. You cannot invest directly in an index. |
| 6 | The ten largest holdings, excluding cash and cash equivalents, are calculated based on the value of the securities of the affiliated master portfolio allocable to the Fund divided by the total net assets of the Fund. Holdings are subject to change and may have changed since the date specified. |
| 7 | Amounts represent the sector distribution of the affiliated master portfolio which are calculated based on the total long-term investments of the affiliated master portfolio. These amounts are subject to change and may have changed since the date specified. |
| | | | |
| 12 | | Wells Fargo Equity Gateway Funds | | Performance highlights (unaudited) |
Wells Fargo International Value Fund1
Investment objective
The Fund seeks long-term capital appreciation.
Manager
Wells Fargo Funds Management, LLC
Subadviser for the affiliated master portfolio
LSV Asset Management
Portfolio managers
Josef Lakonishok
Puneet Mansharamani, CFA®
Menno Vermeulen, CFA®
Average annual total returns (%) as of November 30, 20162
| | | | | | | | | | | | | | | | | | | | | | | | | | | | | | | | | | |
| | | | | Including sales charge | | | Excluding sales charge | | | Expense ratios3 (%) | |
| | | Inception date | | 1 year | | | 5 year | | | 10 year | | | 1 year | | | 5 year | | | 10 year | | | Gross | | | Net4 | |
| Class A (WFFAX) | | 10-31-2003 | | | (7.47 | ) | | | 3.28 | | | | (1.34 | ) | | | (1.83 | ) | | | 4.51 | | | | (0.75 | ) | | | 1.46 | | | | 1.35 | |
| Class C (WFVCX) | | 4-8-2005 | | | (3.54 | ) | | | 3.72 | | | | (1.51 | ) | | | (2.54 | ) | | | 3.72 | | | | (1.51 | ) | | | 2.21 | | | | 2.10 | |
| Administrator Class (WFVDX) | | 4-8-2005 | | | – | | | | – | | | | – | | | | (1.73 | ) | | | 4.66 | | | | (0.57 | ) | | | 1.38 | | | | 1.25 | |
| Institutional Class (WFVIX) | | 8-31-2006 | | | – | | | | – | | | | – | | | | (1.44 | ) | | | 4.95 | | | | (0.33 | ) | | | 1.13 | | | | 1.00 | |
| MSCI EAFE Value Index (Net)5 | | – | | | – | | | | – | | | | – | | | | (1.51 | ) | | | 5.21 | | | | (0.33 | ) | | | – | | | | – | |
Figures quoted represent past performance, which is no guarantee of future results, and do not reflect taxes that a shareholder may pay on fund distributions or the redemption of fund shares. Investment return and principal value of an investment will fluctuate so that an investor’s shares, when redeemed, may be worth more or less than their original cost. Performance shown without sales charges would be lower if sales charges were reflected. Current performance may be lower or higher than the performance data quoted, which assumes the reinvestment of dividends and capital gains. Current month-end performance is available on the Fund’s website, wellsfargofunds.com.
Index returns do not include transaction costs associated with buying and selling securities, any mutual fund fees or expenses, or any taxes. It is not possible to invest directly in an index.
For Class A shares, the maximum front-end sales charge is 5.75%. For Class C shares, the maximum contingent deferred sales charge is 1.00%. Performance including a contingent deferred sales charge assumes the sales charge for the corresponding time period. Administrator Class and Institutional Class shares are sold without a front-end sales charge or contingent deferred sales charge.
Stock values fluctuate in response to the activities of individual companies and general market and economic conditions. Foreign investments are especially volatile and can rise or fall dramatically due to differences in the political and economic conditions of the host country. These risks are generally intensified in emerging markets. The use of derivatives may reduce returns and/or increase volatility. Certain investment strategies tend to increase the total risk of an investment (relative to the broader market). The Fund is exposed to smaller company securities risk. Consult the Fund’s prospectus for additional information on these and other risks.
Please see footnotes on page 13.
| | | | | | |
| Performance highlights (unaudited) | | Wells Fargo Equity Gateway Funds | | | 13 | |
Wells Fargo International Value Fund (continued)
| | | | |
| Ten largest holdings (%) as of November 30, 20166 | |
Sanofi SA | | | 1.84 | |
Nippon Telegraph & Telephone Corporation | | | 1.50 | |
BAE Systems plc | | | 1.30 | |
Swiss Reinsurance AG | | | 1.29 | |
BP plc | | | 1.21 | |
KDDI Corporation | | | 1.19 | |
Allianz AG | | | 1.05 | |
Magna International Incorporated | | | 0.98 | |
Koninklijke Ahold NV | | | 0.97 | |
Daimler AG | | | 0.93 | |
|
| Sector distribution as of November 30, 20167 |
|
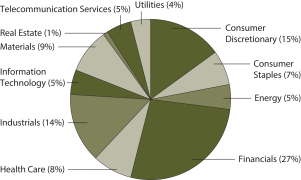
|
|
| Country allocation as of November 30, 20167 |
|
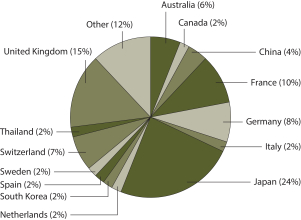
|
| 1 | The Fund is a gateway feeder fund that invests all of its assets in a single affiliated master portfolio of the Wells Fargo Master Trust with a substantially similar investment objective and substantially similar investment strategies. References to the investment activities of the Fund are intended to refer to the investment activities of the affiliated master portfolio in which it invests. |
| 2 | Historical performance shown for Institutional Class shares prior to their inception reflects the performance of Administrator Class shares, and includes the higher expenses applicable to Administrator Class shares. If these expenses had not been included, returns would be higher. |
| 3 | Reflects the expense ratios as stated in the most recent prospectuses. The expense ratios shown are subject to change and may differ from the annualized expense ratios shown in the financial highlights of this report. |
| 4 | The manager has contractually committed through September 30, 2017, to waive fees and/or reimburse expenses to the extent necessary to cap the Fund’s Total Annual Fund Operating Expenses After Fee Waiver at the amounts shown. After this time, the cap may be increased or the commitment to maintain the cap may be terminated only with the approval of the Board of Trustees. Brokerage commissions, stamp duty fees, interest, taxes, acquired fund fees and expenses, and extraordinary expenses are excluded from the expense cap. Net expenses from the affiliated master portfolio are included in the expense cap. Without this cap, the Fund’s returns would have been lower. |
| 5 | The Morgan Stanley Capital International (MSCI) Europe, Australasia, and Far East (EAFE) Value Index (Net) is a free-float-adjusted market capitalization weighted index that is designed to measure the equity market performance of value securities within developed equity markets, excluding the United States and Canada. The MSCI EAFE Value Index (Net) consists of the following 21 developed markets country indexes: Australia, Austria, Belgium, Denmark, Finland, France, Germany, Hong Kong, Ireland, Israel, Italy, Japan, the Netherlands, New Zealand, Norway, Portugal, Singapore, Spain, Sweden, Switzerland, and the United Kingdom. Source: MSCI. MSCI makes no express or implied warranties or representations and shall have no liability whatsoever with respect to any MSCI data contained herein. The MSCI data may not be further redistributed or used as a basis for other indexes or any securities or financial products. This report is not approved, reviewed, or produced by MSCI. You cannot invest directly in an index. |
| 6 | The ten largest holdings, excluding cash and cash equivalents, are calculated based on the value of the securities of the affiliated master portfolio allocable to the Fund divided by the total net assets of the Fund. Holdings are subject to change and may have changed since the date specified. |
| 7 | Amounts represent the composition of the affiliated master portfolio which are calculated based on the total long-term investments of the affiliated master portfolio. These amounts are subject to change and may have changed since the date specified. |
| | | | |
| 14 | | Wells Fargo Equity Gateway Funds | | Performance highlights (unaudited) |
Wells Fargo Small Company Growth Fund1
Investment objective
The Fund seeks long-term capital appreciation.
Manager
Wells Fargo Funds Management, LLC
Subadviser for the affiliated master portfolio
Peregrine Capital Management, LLC
Portfolio managers
William A. Grierson, CFA®
Daniel J. Hagen, CFA®
James P. Ross, CFA®
Paul E. von Kuster, CFA®
Average annual total returns (%) as of November 30, 20162
| | | | | | | | | | | | | | | | | | | | | | | | | | | | | | | | | | |
| | | | | Including sales charge | | | Excluding sales charge | | | Expense ratios3 (%) | |
| | | Inception date | | 1 year | | | 5 year | | | 10 year | | | 1 year | | | 5 year | | | 10 year | | | Gross | | | Net4 | |
| Class A (WFSAX) | | 1-30-2004 | | | (3.49 | ) | | | 11.97 | | | | 6.61 | | | | 2.40 | | | | 13.30 | | | | 7.24 | | | | 1.34 | | | | 1.34 | |
| Class B (WFSBX)* | | 1-30-2004 | | | (3.33 | ) | | | 12.21 | | | | 6.68 | | | | 1.67 | | | | 12.46 | | | | 6.68 | | | | 2.09 | | | | 2.09 | |
| Class C (WSMCX) | | 1-30-2004 | | | 0.65 | | | | 12.46 | | | | 6.46 | | | | 1.65 | | | | 12.46 | | | | 6.46 | | | | 2.09 | | | | 2.09 | |
| Class R6 (WSCRX) | | 10-31-2014 | | | – | | | | – | | | | – | | | | 2.86 | | | | 13.84 | | | | 7.73 | | | | 0.91 | | | | 0.90 | |
| Administrator Class (NVSCX) | | 11-11-1994 | | | – | | | | – | | | | – | | | | 2.55 | | | | 13.54 | | | | 7.50 | | | | 1.26 | | | | 1.20 | |
| Institutional Class (WSCGX) | | 3-31-2008 | | | – | | | | – | | | | – | | | | 2.79 | | | | 13.82 | | | | 7.72 | | | | 1.01 | | | | 0.95 | |
| Russell 2000® Growth Index5 | | – | | | – | | | | – | | | | – | | | | 4.58 | | | | 13.38 | | | | 7.59 | | | | – | | | | – | |
| * | | At the close of business on December 5, 2016, existing Class B shareholders were converted to Class A shareholders. Effective December 6, 2016, Class B shares are no longer ofference by the Fund. |
Figures quoted represent past performance, which is no guarantee of future results, and do not reflect taxes that a shareholder may pay on fund distributions or the redemption of fund shares. Investment return and principal value of an investment will fluctuate so that an investor’s shares, when redeemed, may be worth more or less than their original cost. Performance shown without sales charges would be lower if sales charges were reflected. Current performance may be lower or higher than the performance data quoted, which assumes the reinvestment of dividends and capital gains. Current month-end performance is available on the Fund’s website, wellsfargofunds.com.
Index returns do not include transaction costs associated with buying and selling securities, any mutual fund fees or expenses, or any taxes. It is not possible to invest directly in an index.
For Class A shares, the maximum front-end sales charge is 5.75%. For Class B shares, the maximum contingent deferred sales charge is 5.00%. For Class C shares, the maximum contingent deferred sales charge is 1.00%. Performance including a contingent deferred sales charge assumes the sales charge for the corresponding time period. Class R6, Administrator Class, and Institutional Class shares are sold without a front-end sales charge or contingent deferred sales charge.
Stock values fluctuate in response to the activities of individual companies and general market and economic conditions. Smaller-company stocks tend to be more volatile and less liquid than those of larger companies. Certain investment strategies tend to increase the total risk of an investment (relative to the broader market). The Fund is exposed to foreign investment risk. Consult the Fund’s prospectus for additional information on these and other risks.
Please see footnotes on page 15.
| | | | | | |
| Performance highlights (unaudited) | | Wells Fargo Equity Gateway Funds | | | 15 | |
Wells Fargo Small Company Growth Fund (continued)
| | | | |
| Ten largest holdings (%) as of November 30, 20166 | |
SS&C Technologies Holdings Incorporated | | | 1.66 | |
PTC Incorporated | | | 1.60 | |
Microsemi Corporation | | | 1.53 | |
Copart Incorporated | | | 1.44 | |
ICON plc ADR | | | 1.38 | |
Teradyne Incorporated | | | 1.35 | |
IMAX Corporation | | | 1.34 | |
Argo Group International Holdings Limited | | | 1.33 | |
Evercore Partners Incorporated Class A | | | 1.29 | |
Essent Group Limited | | | 1.28 | |
|
| Sector distribution as of November 30, 20167 |
|
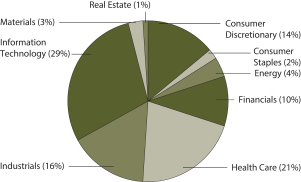
|
| 1 | The Fund is a gateway feeder fund that invests all of its assets in a single affiliated master portfolio of the Wells Fargo Master Trust with a substantially similar investment objective and substantially similar investment strategies. References to the investment activities of the Fund are intended to refer to the investment activities of the affiliated master portfolio in which it invests. |
| 2 | Historical performance shown for Class R6 shares prior to their inception reflects the performance of Institutional Class shares, and includes the higher expenses applicable to Institutional Class shares. If these expenses had not been included, returns would be higher. Historical performance shown for Institutional Class shares prior to their inception reflects the performance of Administrator Class shares, and includes the higher expenses applicable to Administrator Class shares. If these expenses had not been included, returns would be higher. |
| 3 | Reflects the expense ratios as stated in the most recent prospectuses. The expense ratios shown are subject to change and may differ from the annualized expense ratios shown in the financial highlights of this report. |
| 4 | The manager has contractually committed through September 30, 2017, to waive fees and/or reimburse expenses to the extent necessary to cap the Fund’s Total Annual Fund Operating Expenses After Fee Waiver at 1.35% for Class A, 2.10% for Class B, 2.10% for Class C, 0.90% for Class R6, 1.20% for Administrator Class, and 0.95% for Institutional Class. After this time, the cap may be increased or the commitment to maintain the cap may be terminated only with the approval of the Board of Trustees. Brokerage commissions, stamp duty fees, interest, taxes, acquired fund fees and expenses, and extraordinary expenses are excluded from the expense cap. Net expenses from the affiliated master portfolio are included in the expense cap. Without this cap, the Fund’s returns would have been lower. |
| 5 | The Russell 2000® Growth Index measures the performance shown of those Russell 2000 companies with higher price-to-book ratios and higher forecasted growth values. You cannot invest directly in an index. |
| 6 | The ten largest holdings, excluding cash and cash equivalents, are calculated based on the value of the securities of the affiliated master portfolio allocable to the Fund divided by the total net assets of the Fund. Holdings are subject to change and may have changed since the date specified. |
| 7 | Amounts represent the sector distribution of the affiliated master portfolio which are calculated based on the total long-term investments of the affiliated master portfolio. These amounts are subject to change and may have changed since the date specified. |
| | | | |
| 16 | | Wells Fargo Equity Gateway Funds | | Performance highlights (unaudited) |
Wells Fargo Small Company Value Fund1
Investment objective
The Fund seeks long-term capital appreciation.
Manager
Wells Fargo Funds Management, LLC
Subadviser for the affiliated master portfolio
Peregrine Capital Management, LLC
Portfolio managers
Jason R. Ballsrud, CFA®
Tasso H. Coin, Jr., CFA®
Douglas G. Pugh, CFA®
Average annual total returns (%) as of November 30, 20162
| | | | | | | | | | | | | | | | | | | | | | | | | | | | | | | | | | |
| | | | | Including sales charge | | | Excluding sales charge | | | Expense ratios3 (%) | |
| | | Inception date | | 1 year | | | 5 year | | | 10 year | | | 1 year | | | 5 year | | | 10 year | | | Gross | | | Net4 | |
| Class A (SCVAX) | | 1-31-2002 | | | 7.05 | | | | 12.03 | | | | 4.95 | | | | 13.58 | | | | 13.37 | | | | 5.58 | | | | 1.48 | | | | 1.35 | |
| Class C (SCVFX) | | 8-30-2002 | | | 11.76 | | | | 12.51 | | | | 4.82 | | | | 12.76 | | | | 12.51 | | | | 4.82 | | | | 2.23 | | | | 2.10 | |
| Class R6 (SCVJX)5 | | 10-31-2016 | | | – | | | | – | | | | – | | | | 13.98 | | | | 13.63 | | | | 5.87 | | | | 1.05 | | | | 0.90 | |
| Administrator Class (SCVIX) | | 1-31-2002 | | | – | | | | – | | | | – | | | | 13.78 | | | | 13.59 | | | | 5.84 | | | | 1.40 | | | | 1.20 | |
| Institutional Class (SCVNX) | | 7-30-2010 | | | – | | | | – | | | | – | | | | 14.03 | | | | 13.82 | | | | 5.98 | | | | 1.15 | | | | 1.00 | |
| Russell 2000® Value Index6 | | – | | | – | | | | – | | | | – | | | | 19.85 | | | | 14.50 | | | | 5.92 | | | | – | | | | – | |
Figures quoted represent past performance, which is no guarantee of future results, and do not reflect taxes that a shareholder may pay on fund distributions or the redemption of fund shares. Investment return and principal value of an investment will fluctuate so that an investor’s shares, when redeemed, may be worth more or less than their original cost. Performance shown without sales charges would be lower if sales charges were reflected. Current performance may be lower or higher than the performance data quoted, which assumes the reinvestment of dividends and capital gains. Current month-end performance is available on the Fund’s website, wellsfargofunds.com.
Index returns do not include transaction costs associated with buying and selling securities, any mutual fund fees or expenses, or any taxes. It is not possible to invest directly in an index.
For Class A shares, the maximum front-end sales charge is 5.75%. For Class C shares, the maximum contingent deferred sales charge is 1.00%. Performance including a contingent deferred sales charge assumes the sales charge for the corresponding time period. Class R6, Administrator Class, and Institutional Class shares are sold without a front-end sales charge or contingent deferred sales charge.
Stock values fluctuate in response to the activities of individual companies and general market and economic conditions. Smaller-company stocks tend to be more volatile and less liquid than those of larger companies. Certain investment strategies tend to increase the total risk of an investment (relative to the broader market). Consult the Fund’s prospectus for additional information on these and other risks.
Please see footnotes on page 17.
| | | | | | |
| Performance highlights (unaudited) | | Wells Fargo Equity Gateway Funds | | | 17 | |
Wells Fargo Small Company Value Fund (continued)
| | | | |
| Ten largest holdings (%) as of November 30, 20167 | |
Lions Gate Entertainment Corporation | | | 1.47 | |
Cirrus Logic Incorporated | | | 1.47 | |
Stifel Financial Corporation | | | 1.37 | |
Veeco Instruments Incorporated | | | 1.30 | |
Independent Bank Group Incorporated | | | 1.30 | |
Renasant Corporation | | | 1.28 | |
Korn/Ferry International | | | 1.22 | |
Western Alliance Bancorp | | | 1.22 | |
Tivo Corporation | | | 1.21 | |
Air Lease Corporation | | | 1.20 | |
|
| Sector distribution as of November 30, 20168 |
|
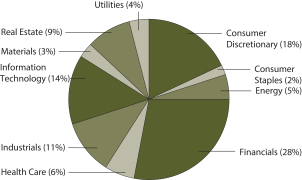
|
| 1 | The Fund is a gateway feeder fund that invests all of its assets in a single affiliated master portfolio of the Wells Fargo Master Trust with a substantially similar investment objective and substantially similar investment strategies. References to the investment activities of the Fund are intended to refer to the investment activities of the affiliated master portfolio in which it invests. |
| 2 | Historical performance shown for Institutional Class shares prior to their inception reflects the performance of Administrator Class shares and includes the higher expenses applicable to Administrator Class shares. If these expenses had not been included, returns would be higher. |
| 3 | Reflects the expense ratios as stated in the most recent prospectuses. The expense ratios shown are subject to change and may differ from the annualized expense ratios shown in the financial highlights of this report. |
| 4 | The manager has contractually committed through September 30, 2017 (September 30, 2018 for Class R6), to waive fees and/or reimburse expenses to the extent necessary to cap the Fund’s Total Annual Fund Operating Expenses After Fee Waiver at the amounts shown. After this time, the cap may be increased or the commitment to maintain the cap may be terminated only with the approval of the Board of Trustees. Brokerage commissions, stamp duty fees, interest, taxes, acquired fund fees and expenses, and extraordinary expenses are excluded from the expense cap. Net expenses from the affiliated master portfolio are included in the expense cap. Without this cap, the Fund’s returns would have been lower. |
| 5 | Historical performance shown for the Class R6 shares prior to their inception reflects the performance of the Institutional Class shares, and is not adjusted to reflect Class R6 shares expenses. If these expenses had been included, returns would be higher. Historical performance shown for the Institutional Class shares prior to their inception reflects the performance of the Administrator Class shares and includes the higher expenses applicable to the Administrator Class shares. If these expenses had not been included, returns would be higher. |
| 6 | The Russell 2000® Value Index measures the performance of those Russell 2000 companies with lower price-to-book ratios and lower forecasted growth values. You cannot invest directly in an index. |
| 7 | The ten largest holdings, excluding cash and cash equivalents, are calculated based on the value of the securities of the affiliated master portfolio allocable to the Fund divided by the total net assets of the Fund. Holdings are subject to change and may have changed since the date specified. |
| 8 | Amounts represent the sector distribution of the affiliated master portfolio which are calculated based on the total long-term investments of the affiliated master portfolio. These amounts are subject to change and may have changed since the date specified. |
| | | | |
| 18 | | Wells Fargo Equity Gateway Funds | | Fund expenses (unaudited) |
As a shareholder of the Fund, you incur two types of costs: (1) transaction costs, including sales charges (loads) on purchase payments and contingent deferred sales charges (if any) on redemptions and (2) ongoing costs, including management fees, distribution (12b-1) and/or shareholder servicing fees, and other Fund expenses. This example is intended to help you understand your ongoing costs (in dollars) of investing in the Fund and to compare these costs with the ongoing costs of investing in other mutual funds.
The example is based on an investment of $1,000 invested at the beginning of the six-month period and held for the entire period from June 1, 2016 to November 30, 2016.
Actual expenses
The “Actual” line of the table below provides information about actual account values and actual expenses. You may use the information in this line, together with the amount you invested, to estimate the expenses that you paid over the period. Simply divide your account value by $1,000 (for example, an $8,600 account value divided by $1,000 = 8.6), then multiply the result by the number in the “Actual” line under the heading entitled “Expenses paid during period” for your applicable class of shares to estimate the expenses you paid on your account during this period.
Hypothetical example for comparison purposes
The “Hypothetical” line of the table below provides information about hypothetical account values and hypothetical expenses based on the Fund’s actual expense ratio and an assumed rate of return of 5% per year before expenses, which is not the Fund’s actual return. The hypothetical account values and expenses may not be used to estimate the actual ending account balance or expenses you paid for the period. You may use this information to compare the ongoing costs of investing in the Fund and other funds. To do so, compare this 5% hypothetical example with the 5% hypothetical examples that appear in the shareholder reports of the other funds.
Please note that the expenses shown in the table are meant to highlight your ongoing costs only and do not reflect any transactional costs, such as sales charges (loads) and contingent deferred sales charges. Therefore, the “Hypothetical” line of the table is useful in comparing ongoing costs only and will not help you determine the relative total costs of owning different funds. In addition, if these transactional costs were included, your costs would have been higher.
| | | | | | | | | | | | | | | | |
| Wells Fargo C&B Large Cap Value Fund | | Beginning
account value
6-1-2016 | | | Ending
account value
11-30-2016 | | | Expenses
paid during
the period¹ | | | Annualized net
expense ratio | |
Class A | | | | | | | | | | | | | | | | |
Actual | | $ | 1,000.00 | | | $ | 1,075.76 | | | $ | 5.97 | | | | 1.15 | % |
Hypothetical (5% return before expenses) | | $ | 1,000.00 | | | $ | 1,019.25 | | | $ | 5.81 | | | | 1.15 | % |
Class B | | | | | | | | | | | | | | | | |
Actual | | $ | 1,000.00 | | | $ | 1,071.70 | | | $ | 9.84 | | | | 1.90 | % |
Hypothetical (5% return before expenses) | | $ | 1,000.00 | | | $ | 1,015.50 | | | $ | 9.57 | | | | 1.90 | % |
Class C | | | | | | | | | | | | | | | | |
Actual | | $ | 1,000.00 | | | $ | 1,072.12 | | | $ | 9.84 | | | | 1.90 | % |
Hypothetical (5% return before expenses) | | $ | 1,000.00 | | | $ | 1,015.50 | | | $ | 9.57 | | | | 1.90 | % |
Class R6 | | | | | | | | | | | | | | | | |
Actual | | $ | 1,000.00 | | | $ | 1,077.74 | | | $ | 3.64 | | | | 0.70 | % |
Hypothetical (5% return before expenses) | | $ | 1,000.00 | | | $ | 1,021.50 | | | $ | 3.54 | | | | 0.70 | % |
Administrator Class | | | | | | | | | | | | | | | | |
Actual | | $ | 1,000.00 | | | $ | 1,076.55 | | | $ | 5.19 | | | | 1.00 | % |
Hypothetical (5% return before expenses) | | $ | 1,000.00 | | | $ | 1,020.00 | | | $ | 5.05 | | | | 1.00 | % |
Institutional Class | | | | | | | | | | | | | | | | |
Actual | | $ | 1,000.00 | | | $ | 1,077.96 | | | $ | 4.16 | | | | 0.80 | % |
Hypothetical (5% return before expenses) | | $ | 1,000.00 | | | $ | 1,021.00 | | | $ | 4.04 | | | | 0.80 | % |
Please see footnote on page 20.
| | | | | | |
| Fund expenses (unaudited) | | Wells Fargo Equity Gateway Funds | | | 19 | |
| | | | | | | | | | | | | | | | |
| Wells Fargo Diversified Equity Fund | | Beginning
account value
6-1-2016 | | | Ending
account value
11-30-2016 | | | Expenses
paid during
the period¹ | | | Annualized net
expense ratio | |
Class A | | | | | | | | | | | | | | | | |
Actual | | $ | 1,000.00 | | | $ | 1,041.39 | | | $ | 6.38 | | | | 1.25 | % |
Hypothetical (5% return before expenses) | | $ | 1,000.00 | | | $ | 1,018.75 | | | $ | 6.31 | | | | 1.25 | % |
Class C | | | | | | | | | | | | | | | | |
Actual | | $ | 1,000.00 | | | $ | 1,037.42 | | | $ | 10.19 | | | | 2.00 | % |
Hypothetical (5% return before expenses) | | $ | 1,000.00 | | | $ | 1,015.00 | | | $ | 10.08 | | | | 2.00 | % |
Administrator Class | | | | | | | | | | | | | | | | |
Actual | | $ | 1,000.00 | | | $ | 1,042.73 | | | $ | 5.11 | | | | 1.00 | % |
Hypothetical (5% return before expenses) | | $ | 1,000.00 | | | $ | 1,020.00 | | | $ | 5.05 | | | | 1.00 | % |
| Wells Fargo Emerging Growth Fund | | | | | | | | | | | | |
Class A | | | | | | | | | | | | | | | | |
Actual | | $ | 1,000.00 | | | $ | 1,138.65 | | | $ | 7.22 | | | | 1.35 | % |
Hypothetical (5% return before expenses) | | $ | 1,000.00 | | | $ | 1,018.25 | | | $ | 6.81 | | | | 1.35 | % |
Class C | | | | | | | | | | | | | | | | |
Actual | | $ | 1,000.00 | | | $ | 1,135.58 | | | $ | 11.21 | | | | 2.10 | % |
Hypothetical (5% return before expenses) | | $ | 1,000.00 | | | $ | 1,014.50 | | | $ | 10.58 | | | | 2.10 | % |
Administrator Class | | | | | | | | | | | | | | | | |
Actual | | $ | 1,000.00 | | | $ | 1,139.63 | | | $ | 6.42 | | | | 1.20 | % |
Hypothetical (5% return before expenses) | | $ | 1,000.00 | | | $ | 1,019.00 | | | $ | 6.06 | | | | 1.20 | % |
Institutional Class | | | | | | | | | | | | | | | | |
Actual | | $ | 1,000.00 | | | $ | 1,142.42 | | | $ | 4.82 | | | | 0.90 | % |
Hypothetical (5% return before expenses) | | $ | 1,000.00 | | | $ | 1,020.50 | | | $ | 4.55 | | | | 0.90 | % |
| Wells Fargo Index Fund | | | | | | | | | | | | |
Class A | | | | | | | | | | | | | | | | |
Actual | | $ | 1,000.00 | | | $ | 1,057.60 | | | $ | 2.31 | | | | 0.45 | % |
Hypothetical (5% return before expenses) | | $ | 1,000.00 | | | $ | 1,022.75 | | | $ | 2.28 | | | | 0.45 | % |
Class B | | | | | | | | | | | | | | | | |
Actual | | $ | 1,000.00 | | | $ | 1,053.65 | | | $ | 6.16 | | | | 1.20 | % |
Hypothetical (5% return before expenses) | | $ | 1,000.00 | | | $ | 1,019.00 | | | $ | 6.06 | | | | 1.20 | % |
Class C | | | | | | | | | | | | | | | | |
Actual | | $ | 1,000.00 | | | $ | 1,053.71 | | | $ | 6.16 | | | | 1.20 | % |
Hypothetical (5% return before expenses) | | $ | 1,000.00 | | | $ | 1,019.00 | | | $ | 6.06 | | | | 1.20 | % |
Administrator Class | | | | | | | | | | | | | | | | |
Actual | | $ | 1,000.00 | | | $ | 1,058.74 | | | $ | 1.29 | | | | 0.25 | % |
Hypothetical (5% return before expenses) | | $ | 1,000.00 | | | $ | 1,023.75 | | | $ | 1.26 | | | | 0.25 | % |
| Wells Fargo International Value Fund | | | | | | | | | | | | |
Class A | | | | | | | | | | | | | | | | |
Actual | | $ | 1,000.00 | | | $ | 1,012.47 | | | $ | 6.79 | | | | 1.35 | % |
Hypothetical (5% return before expenses) | | $ | 1,000.00 | | | $ | 1,018.25 | | | $ | 6.81 | | | | 1.35 | % |
Class C | | | | | | | | | | | | | | | | |
Actual | | $ | 1,000.00 | | | $ | 1,008.76 | | | $ | 10.55 | | | | 2.10 | % |
Hypothetical (5% return before expenses) | | $ | 1,000.00 | | | $ | 1,014.50 | | | $ | 10.58 | | | | 2.10 | % |
Administrator Class | | | | | | | | | | | | | | | | |
Actual | | $ | 1,000.00 | | | $ | 1,012.39 | | | $ | 6.29 | | | | 1.25 | % |
Hypothetical (5% return before expenses) | | $ | 1,000.00 | | | $ | 1,018.75 | | | $ | 6.31 | | | | 1.25 | % |
Institutional Class | | | | | | | | | | | | | | | | |
Actual | | $ | 1,000.00 | | | $ | 1,014.93 | | | $ | 5.04 | | | | 1.00 | % |
Hypothetical (5% return before expenses) | | $ | 1,000.00 | | | $ | 1,020.00 | | | $ | 5.05 | | | | 1.00 | % |
Please see footnote on page 20.
| | | | |
| 20 | | Wells Fargo Equity Gateway Funds | | Fund expenses (unaudited) |
| | | | | | | | | | | | | | | | |
| Wells Fargo Small Company Growth Fund | | Beginning
account value
6-1-2016 | | | Ending
account value
11-30-2016 | | | Expenses
paid during
the period¹ | | | Annualized net
expense ratio | |
Class A | | | | | | | | | | | | | | | | |
Actual | | $ | 1,000.00 | | | $ | 1,107.98 | | | $ | 7.06 | | | | 1.34 | % |
Hypothetical (5% return before expenses) | | $ | 1,000.00 | | | $ | 1,018.30 | | | $ | 6.76 | | | | 1.34 | % |
Class B | | | | | | | | | | | | | | | | |
Actual | | $ | 1,000.00 | | | $ | 1,103.90 | | | $ | 10.78 | | | | 2.05 | % |
Hypothetical (5% return before expenses) | | $ | 1,000.00 | | | $ | 1,014.75 | | | $ | 10.33 | | | | 2.05 | % |
Class C | | | | | | | | | | | | | | | | |
Actual | | $ | 1,000.00 | | | $ | 1,103.76 | | | $ | 10.99 | | | | 2.09 | % |
Hypothetical (5% return before expenses) | | $ | 1,000.00 | | | $ | 1,014.55 | | | $ | 10.53 | | | | 2.09 | % |
Class R6 | | | | | | | | | | | | | | | | |
Actual | | $ | 1,000.00 | | | $ | 1,110.39 | | | $ | 4.75 | | | | 0.90 | % |
Hypothetical (5% return before expenses) | | $ | 1,000.00 | | | $ | 1,020.50 | | | $ | 4.55 | | | | 0.90 | % |
Administrator Class | | | | | | | | | | | | | | | | |
Actual | | $ | 1,000.00 | | | $ | 1,108.58 | | | $ | 6.33 | | | | 1.20 | % |
Hypothetical (5% return before expenses) | | $ | 1,000.00 | | | $ | 1,019.00 | | | $ | 6.06 | | | | 1.20 | % |
Institutional Class | | | | | | | | | | | | | | | | |
Actual | | $ | 1,000.00 | | | $ | 1,109.94 | | | $ | 5.01 | | | | 0.95 | % |
Hypothetical (5% return before expenses) | | $ | 1,000.00 | | | $ | 1,020.25 | | | $ | 4.80 | | | | 0.95 | % |
| Wells Fargo Small Company Value Fund | | | | | | | | | | | | |
Class A | | | | | | | | | | | | | | | | |
Actual | | $ | 1,000.00 | | | $ | 1,153.39 | | | $ | 7.27 | | | | 1.35 | % |
Hypothetical (5% return before expenses) | | $ | 1,000.00 | | | $ | 1,018.25 | | | $ | 6.81 | | | | 1.35 | % |
Class C | | | | | | | | | | | | | | | | |
Actual | | $ | 1,000.00 | | | $ | 1,149.39 | | | $ | 11.28 | | | | 2.10 | % |
Hypothetical (5% return before expenses) | | $ | 1,000.00 | | | $ | 1,014.50 | | | $ | 10.58 | | | | 2.10 | % |
Class R6 | | | | | | | | | | | | | | | | |
Actual | | $ | 1,000.00 | | | $ | 1,155.03 | | | $ | 4.85 | | | | 0.90 | % |
Hypothetical (5% return before expenses) | | $ | 1,000.00 | | | $ | 1,020.50 | | | $ | 4.55 | | | | 0.90 | % |
Administrator Class | | | | | | | | | | | | | | | | |
Actual | | $ | 1,000.00 | | | $ | 1,154.48 | | | $ | 6.46 | | | | 1.20 | % |
Hypothetical (5% return before expenses) | | $ | 1,000.00 | | | $ | 1,019.00 | | | $ | 6.06 | | | | 1.20 | % |
Institutional Class | | | | | | | | | | | | | | | | |
Actual | | $ | 1,000.00 | | | $ | 1,155.51 | | | $ | 5.39 | | | | 1.00 | % |
Hypothetical (5% return before expenses) | | $ | 1,000.00 | | | $ | 1,020.00 | | | $ | 5.05 | | | | 1.00 | % |
| 1 | Expenses paid is equal to the annualized net expense ratio of each class multiplied by the average account value over the period, multiplied by the number of days in the most recent fiscal half-year divided by the number of days in the fiscal year (to reflect the one-half-year period). |
| | | | | | |
| Portfolios of investments—November 30, 2016 (unaudited) | | Wells Fargo Equity Gateway Funds | | | 21 | |
C&B LARGE CAP VALUE FUND
| | | | | | | | | | | | | | | | |
| Security name | | | | | | | | | | | Value | |
| | | | |
Investment Companies: 102.24% | | | | | | | | | | | | | | | | |
| | | | |
| Affiliated Master Portfolios: 102.24% | | | | | | | | | | | | | | | | |
Wells Fargo C&B Large Cap Value Portfolio | | | | | | | | | | | | | | $ | 304,745,262 | |
| | | | | | | | | | | | | | | | |
| | | | |
Total Investment Companies (Cost $234,987,202) | | | | | | | | | | | | | | | 304,745,262 | |
| | | | | | | | | | | | | | | | |
| | | | | | | | |
| Total investments in securities (Cost $234,987,202) * | | | 102.24 | % | | | 304,745,262 | |
Other assets and liabilities, net | | | (2.24 | ) | | | (6,688,212 | ) |
| | | | | | | | |
| Total net assets | | | 100.00 | % | | $ | 298,057,050 | |
| | | | | | | | |
| | | | | | | | |
* | | Cost for federal income tax purposes is $242,045,422 and unrealized gains (losses) consists of: |
| | Gross unrealized gains | | $ | 62,699,840 | | | |
| | Gross unrealized losses | | | 0 | | | |
| | | | | | | | |
| | Net unrealized gains | | $ | 62,699,840 | | | |
DIVERSIFIED EQUITY FUND
| | | | | | | | | | | | | | | | |
| Security name | | | | | | | | | | | Value | |
| | | | |
Investment Companies: 100.20% | | | | | | | | | | | | | | | | |
| | | | |
| Affiliated Master Portfolios: 100.20% | | | | | | | | | | | | | | | | |
Wells Fargo C&B Large Cap Value Portfolio | | | | | | | | | | | | | | $ | 16,602,205 | |
Wells Fargo Diversified Large Cap Growth Portfolio | | | | | | | | | | | | | | | 49,259,692 | |
Wells Fargo Emerging Growth Portfolio | | | | | | | | | | | | | | | 4,956,240 | |
Wells Fargo Index Portfolio | | | | | | | | | | | | | | | 49,742,870 | |
Wells Fargo International Growth Portfolio | | | | | | | | | | | | | | | 14,115,386 | |
Wells Fargo International Value Portfolio | | | | | | | | | | | | | | | 14,595,324 | |
Wells Fargo Large Company Value Portfolio | | | | | | | | | | | | | | | 33,446,061 | |
Wells Fargo Small Company Growth Portfolio | | | | | | | | | | | | | | | 4,967,409 | |
Wells Fargo Small Company Value Portfolio | | | | | | | | | | | | | | | 9,960,812 | |
| | | | |
Total Investment Companies (Cost $151,321,802) | | | | | | | | | | | | | | | 197,645,999 | |
| | | | | | | | | | | | | | | | |
| | | | | | | | |
| Total investments in securities (Cost $151,321,802) * | | | 100.20 | % | | | 197,645,999 | |
Other assets and liabilities, net | | | (0.20 | ) | | | (396,515 | ) |
| | | | | | | | |
| Total net assets | | | 100.00 | % | | $ | 197,249,484 | |
| | | | | | | | |
| | | | | | | | |
* | | Cost for federal income tax purposes is $159,201,774 and unrealized gains (losses) consists of: |
| | Gross unrealized gains | | $ | 38,444,225 | | | |
| | Gross unrealized losses | | | 0 | | | |
| | | | | | | | |
| | Net unrealized gains | | $ | 38,444,225 | | | |
The accompanying notes are an integral part of these financial statements.
| | | | |
| 22 | | Wells Fargo Equity Gateway Funds | | Portfolios of investments—November 30, 2016 (unaudited) |
EMERGING GROWTH FUND
| | | | | | | | | | | | | | | | |
| Security name | | | | | | | | | | | Value | |
| | | | |
Investment Companies: 100.19% | | | | | | | | | | | | | | | | |
| | | | |
| Affiliated Master Portfolios: 100.19% | | | | | | | | | | | | | | | | |
Wells Fargo Emerging Growth Portfolio | | | | | | | | | | | | | | $ | 725,992,088 | |
| | | | | | | | | | | | | | | | |
| | | | |
Total Investment Companies (Cost $530,430,620) | | | | | | | | | | | | | | | 725,992,088 | |
| | | | | | | | | | | | | | | | |
| | | | | | | | |
| Total investments in securities (Cost $530,430,620) * | | | 100.19 | % | | | 725,992,088 | |
Other assets and liabilities, net | | | (0.19 | ) | | | (1,404,044 | ) |
| | | | | | | | |
| Total net assets | | | 100.00 | % | | $ | 724,588,044 | |
| | | | | | | | |
| | | | | | | | |
* | | Cost for federal income tax purposes is $534,565,392 and unrealized gains (losses) consists of: |
| | Gross unrealized gains | | $ | 191,426,696 | | | |
| | Gross unrealized losses | | | 0 | | | |
| | | | | | | | |
| | Net unrealized gains | | $ | 191,426,696 | | | |
INDEX FUND
| | | | | | | | | | | | | | | | |
| Security name | | | | | | | | | | | Value | |
| | | | |
Investment Companies: 102.08% | | | | | | | | | | | | | | | | |
| | | | |
| Affiliated Master Portfolios: 102.08% | | | | | | | | | | | | | | | | |
Wells Fargo Index Portfolio | | | | | | | | | | | | | | $ | 2,124,721,219 | |
| | | | | | | | | | | | | | | | |
| | | | |
Total Investment Companies (Cost $782,040,965) | | | | | | | | | | | | | | | 2,124,721,219 | |
| | | | | | | | | | | | | | | | |
| | | | | | | | |
| Total investments in securities (Cost $782,040,965) * | | | 102.08 | % | | | 2,124,721,219 | |
Other assets and liabilities, net | | | (2.08 | ) | | | (43,266,481 | ) |
| | | | | | | | |
| Total net assets | | | 100.00 | % | | $ | 2,081,454,738 | |
| | | | | | | | |
| | | | | | | | |
* | | Cost for federal income tax purposes is $827,907,318 and unrealized gains (losses) consists of: |
| | Gross unrealized gains | | $ | 1,296,813,901 | | | |
| | Gross unrealized losses | | | 0 | | | |
| | | | | | | | |
| | Net unrealized gains | | $ | 1,296,813,901 | | | |
The accompanying notes are an integral part of these financial statements.
| | | | | | |
| Portfolios of investments—November 30, 2016 (unaudited) | | Wells Fargo Equity Gateway Funds | | | 23 | |
INTERNATIONAL VALUE FUND
| | | | | | | | | | | | | | | | |
| Security name | | | | | | | | | | | Value | |
| | | | |
Investment Companies: 99.87% | | | | | | | | | | | | | | | | |
| | | | |
| Affiliated Master Portfolios: 99.87% | | | | | | | | | | | | | | | | |
Wells Fargo International Value Portfolio | | | | | | | | | | | | | | $ | 509,621,732 | |
| | | | | | | | | | | | | | | | |
| | | | |
Total Investment Companies (Cost $552,248,832) | | | | | | | | | | | | | | | 509,621,732 | |
| | | | | | | | | | | | | | | | |
| | | | | | | | |
| Total investments in securities (Cost $552,248,832) * | | | 99.87 | % | | | 509,621,732 | |
Other assets and liabilities, net | | | 0.13 | | | | 688,634 | |
| | | | | | | | |
| Total net assets | | | 100.00 | % | | $ | 510,310,366 | |
| | | | | | | | |
| | | | | | | | |
* | | Cost for federal income tax purposes is $553,185,281 and unrealized gains (losses) consists of: |
| | Gross unrealized gains | | $ | 0 | | | |
| | Gross unrealized losses | | | (43,563,549 | ) | | |
| | | | | | | | |
| | Net unrealized losses | | $ | (43,563,549 | ) | | |
SMALL COMPANY GROWTH FUND
| | | | | | | | | | | | | | | | |
| Security name | | | | | | | | | | | Value | |
| | | | |
Investment Companies: 99.94% | | | | | | | | | | | | | | | | |
| | | | |
| Affiliated Master Portfolios: 99.94% | | | | | | | | | | | | | | | | |
Wells Fargo Small Company Growth Portfolio | | | | | | | | | | | | | | $ | 1,503,201,711 | |
| | | | | | | | | | | | | | | | |
| | | | |
Total Investment Companies (Cost $1,333,581,821) | | | | | | | | | | | | | | | 1,503,201,711 | |
| | | | | | | | | | | | | | | | |
| | | | | | | | |
| Total investments in securities (Cost $1,333,581,821) * | | | 99.94 | % | | | 1,503,201,711 | |
Other assets and liabilities, net | | | 0.06 | | | | 975,251 | |
| | | | | | | | |
| Total net assets | | | 100.00 | % | | $ | 1,504,176,962 | |
| | | | | | | | |
| | | | | | | | |
* | | Cost for federal income tax purposes is $1,354,460,536 and unrealized gains (losses) consists of: |
| | Gross unrealized gains | | $ | 148,741,175 | | | |
| | Gross unrealized losses | | | 0 | | | |
| | | | | | | | |
| | Net unrealized gains | | $ | 148,741,175 | | | |
The accompanying notes are an integral part of these financial statements.
| | | | |
| 24 | | Wells Fargo Equity Gateway Funds | | Portfolio of investments—November 30, 2016 (unaudited) |
SMALL COMPANY VALUE FUND
| | | | | | | | | | | | | | | | |
| Security name | | | | | | | | | | | Value | |
| | | | |
Investment Companies: 99.90% | | | | | | | | | | | | | | | | |
| | | | |
| Affiliated Master Portfolios: 99.90% | | | | | | | | | | | | | | | | |
Wells Fargo Small Company Value Portfolio | | | | | | | | | | | | | | $ | 130,386,544 | |
| | | | | | | | | | | | | | | | |
| | | | |
Total Investment Companies (Cost $111,805,587) | | | | | | | | | | | | | | | 130,386,544 | |
| | | | | | | | | | | | | | | | |
| | | | | | | | |
| Total investments in securities (Cost $111,805,587) * | | | 99.90 | % | | | 130,386,544 | |
Other assets and liabilities, net | | | 0.10 | | | | 124,904 | |
| | | | | | | | |
| Total net assets | | | 100.00 | % | | $ | 130,511,448 | |
| | | | | | | | |
| | | | | | | | |
* | | Cost for federal income tax purposes is $116,862,502 and unrealized gains (losses) consists of: |
| | Gross unrealized gains | | $ | 13,524,042 | | | |
| | Gross unrealized losses | | | 0 | | | |
| | | | | | | | |
| | Net unrealized gains | | $ | 13,524,042 | | | |
The accompanying notes are an integral part of these financial statements.
This page is intentionally left blank.
| | | | |
| 26 | | Wells Fargo Equity Gateway Funds | | Statements of assets and liabilities—November 30, 2016 (unaudited) |
| | | | | | | | |
| | | C&B Large Cap
Value Fund | | | Diversified
Equity Fund | |
| | |
Assets | | | | | | | | |
Investments in affiliated Master Portfolio(s), at value (see cost below) | | $ | 304,745,262 | | | $ | 197,645,999 | |
Receivable for Fund shares sold | | | 131,581 | | | | 54,306 | |
Receivable from manager | | | 14,545 | | | | 0 | |
Prepaid expenses and other assets | | | 58,035 | | | | 31,697 | |
| | | | |
Total assets | | | 304,949,423 | | | | 197,732,002 | |
| | | | |
| | |
Liabilities | | | | | | | | |
Payable for Fund shares redeemed | | | 6,806,383 | | | | 374,782 | |
Management fee payable | | | 0 | | | | 4,297 | |
Distribution fees payable | | | 4,553 | | | | 1,557 | |
Administration fees payable | | | 38,053 | | | | 26,180 | |
Shareholder report expenses payable | | | 4,783 | | | | 26,431 | |
Shareholder servicing fees payable | | | 23,426 | | | | 41,473 | |
Accrued expenses and other liabilities | | | 15,175 | | | | 7,798 | |
| | | | |
Total liabilities | | | 6,892,373 | | | | 482,518 | |
| | | | |
Total net assets | | $ | 298,057,050 | | | $ | 197,249,484 | |
| | | | |
| | |
NET ASSETS CONSIST OF | | | | | | | | |
Paid-in capital | | $ | 224,809,787 | | | $ | 144,679,935 | |
Undistributed (accumulated) net investment income (loss) | | | 2,072,449 | | | | 1,184,920 | |
Accumulated net realized gains (losses) on investments | | | 1,416,754 | | | | 5,060,432 | |
Net unrealized gains (losses) on investments | | | 69,758,060 | | | | 46,324,197 | |
| | | | |
Total net assets | | $ | 298,057,050 | | | $ | 197,249,484 | |
| | | | |
| | |
COMPUTATION OF NET ASSET VALUE AND OFFERING PRICE PER SHARE | | | | | | | | |
Net assets – Class A | | $ | 89,585,732 | | | $ | 65,764,655 | |
Shares outstanding – Class A1 | | | 6,639,726 | | | | 2,312,903 | |
Net asset value per share – Class A | | | $13.49 | | | | $28.43 | |
Maximum offering price per share – Class A2 | | | $14.31 | | | | $30.16 | |
Net assets – Class B | | $ | 68,464 | | | | N/A | |
Shares outstanding – Class B1 | | | 5,030 | | | | N/A | |
Net asset value per share – Class B | | | $13.61 | | | | N/A | |
Net assets – Class C | | $ | 7,526,272 | | | $ | 2,473,640 | |
Shares outstanding – Class C1 | | | 562,636 | | | | 94,904 | |
Net asset value per share – Class C | | | $13.38 | | | | $26.06 | |
Net assets – Class R6 | | $ | 26,612 | | | | N/A | |
Shares outstanding – Class R61 | | | 1,964 | | | | N/A | |
Net asset value per share – Class R6 | | | $13.55 | | | | N/A | |
Net assets – Administrator Class | | $ | 14,947,761 | | | $ | 129,011,189 | |
Shares outstanding – Administrator Class1 | | | 1,107,142 | | | | 4,519,005 | |
Net asset value per share – Administrator Class | | | $13.50 | | | | $28.55 | |
Net assets – Institutional Class | | $ | 185,902,209 | | | | N/A | |
Shares outstanding – Institutional Class1 | | | 13,720,792 | | | | N/A | |
Net asset value per share – Institutional Class | | | $13.55 | | | | N/A | |
| | |
Investments in affiliated Master Portfolio(s), at cost | | $ | 234,987,202 | | | $ | 151,321,802 | |
| | | | |
| 1 | Each Fund has an unlimited number of authorized shares. |
| 2 | Maximum offering price is computed as 100/94.25 of net asset value. On investments of $50,000 or more, the offering price is reduced. |
The accompanying notes are an integral part of these financial statements.
| | | | | | |
| Statements of assets and liabilities—November 30, 2016 (unaudited) | | Wells Fargo Equity Gateway Funds | | | 27 | |
| | | | | | | | | | | | | | | | | | |
Emerging Growth Fund | | | Index Fund | | | International
Value Fund | | | Small Company
Growth Fund | | | Small Company
Value Fund | |
| | | | |
| | | | | | | | | | | | | | | | | | |
| $ | 725,992,088 | | | $ | 2,124,721,219 | | | $ | 509,621,732 | | | $ | 1,503,201,711 | | | $ | 130,386,544 | |
| | 427,191 | | | | 7,315,032 | | | | 1,686,324 | | | | 2,634,740 | | | | 140,507 | |
| | 30,449 | | | | 180,046 | | | | 4,120 | | | | 0 | | | | 11,904 | |
| | 37,098 | | | | 78,046 | | | | 50,403 | | | | 176,496 | | | | 44,959 | |
| | |
| | 726,486,826 | | | | 2,132,294,343 | | | | 511,362,579 | | | | 1,506,012,947 | | | | 130,583,914 | |
| | |
| | | | |
| | | | | | | | | | | | | | | | | | |
| | 1,670,469 | | | | 50,142,935 | | | | 963,043 | | | | 1,525,480 | | | | 26,808 | |
| | 0 | | | | 0 | | | | 0 | | | | 13,731 | | | | 0 | |
| | 2,197 | | | | 51,575 | | | | 447 | | | | 14,631 | | | | 1,204 | |
| | 84,386 | | | | 274,894 | | | | 53,422 | | | | 139,392 | | | | 14,880 | |
| | 81,527 | | | | 47,763 | | | | 17,544 | | | | 61,143 | | | | 5,066 | |
| | 39,824 | | | | 262,963 | | | | 6,780 | | | | 53,190 | | | | 17,710 | |
| | 20,379 | | | | 59,475 | | | | 10,977 | | | | 28,418 | | | | 6,798 | |
| | |
| | 1,898,782 | | | | 50,839,605 | | | | 1,052,213 | | | | 1,835,985 | | | | 72,466 | |
| | |
| $ | 724,588,044 | | | $ | 2,081,454,738 | | | $ | 510,310,366 | | | $ | 1,504,176,962 | | | $ | 130,511,448 | |
| | |
| | | | |
| | | | | | | | | | | | | | | | | | |
| $ | 476,354,963 | | | $ | 548,419,758 | | | $ | 587,088,048 | | | $ | 1,438,223,610 | | | $ | 183,922,648 | |
| | (1,368,529 | ) | | | 37,076,785 | | | | 11,545,605 | | | | (2,606,072 | ) | | | 585,481 | |
| | 54,040,142 | | | | 153,277,941 | | | | (45,696,187 | ) | | | (101,060,466 | ) | | | (72,577,638 | ) |
| | 195,561,468 | | | | 1,342,680,254 | | | | (42,627,100 | ) | | | 169,619,890 | | | | 18,580,957 | |
| | |
| $ | 724,588,044 | | | $ | 2,081,454,738 | | | $ | 510,310,366 | | | $ | 1,504,176,962 | | | $ | 130,511,448 | |
| | |
| | | | |
| | | | | | | | | | | | | | | | | | |
| $ | 130,402,624 | | | $ | 646,386,322 | | | $ | 49,282,578 | | | $ | 107,931,647 | | | $ | 23,894,805 | |
| | 9,121,781 | | | | 9,723,801 | | | | 3,794,971 | | | | 2,584,746 | | | | 1,024,860 | |
| | $14.30 | | | | $66.47 | | | | $12.99 | | | | $41.76 | | | | $23.32 | |
| | $15.17 | | | | $70.53 | | | | $13.78 | | | | $44.31 | | | | $24.74 | |
| | N/A | | | $ | 612,004 | | | | N/A | | | $ | 9,567 | | | | N/A | |
| | N/A | | | | 9,032 | | | | N/A | | | | 258 | | | | N/A | |
| | N/A | | | | $67.76 | | | | N/A | | | | $37.08 | | | | N/A | |
| $ | 3,623,185 | | | $ | 84,218,865 | | | $ | 719,878 | | | $ | 24,008,474 | | | $ | 2,062,596 | |
| | 275,594 | | | | 1,266,249 | | | | 56,823 | | | | 639,381 | | | | 98,931 | |
| | $13.15 | | | | $66.51 | | | | $12.67 | | | | $37.55 | | | | $20.85 | |
| | N/A | | | | N/A | | | | N/A | | | $ | 324,564,640 | | | $ | 28,075 | |
| | N/A | | | | N/A | | | | N/A | | | | 7,349,303 | | | | 1,170 | |
| | N/A | | | | N/A | | | | N/A | | | | $44.16 | | | | $24.00 | |
| $ | 62,240,558 | | | $ | 1,350,237,547 | | | $ | 4,875,164 | | | $ | 128,312,320 | | | $ | 62,863,260 | |
| | 4,258,437 | | | | 20,137,043 | | | | 372,884 | | | | 2,964,015 | | | | 2,636,820 | |
| | $14.62 | | | | $67.05 | | | | $13.07 | | | | $43.29 | | | | $23.84 | |
| $ | 528,321,677 | | | | N/A | | | $ | 455,432,746 | | | $ | 919,350,314 | | | $ | 41,662,712 | |
| | 35,034,815 | | | | N/A | | | | 35,260,637 | | | | 20,836,934 | | | | 1,736,015 | |
| | $15.08 | | | | N/A | | | | $12.92 | | | | $44.12 | | | | $24.00 | |
| | | | |
| $ | 530,430,620 | | | $ | 782,040,965 | | | $ | 552,248,832 | | | $ | 1,333,581,821 | | | $ | 111,805,587 | |
| | |
The accompanying notes are an integral part of these financial statements.
| | | | |
| 28 | | Wells Fargo Equity Gateway Funds | | Statements of operations—six months ended November 30, 2016 (unaudited) |
| | | | | | | | |
| | | C&B Large Cap
Value Fund | | | Diversified
Equity Fund | |
| | |
Investment income | | | | | | | | |
Dividends allocated from affiliated Master Portfolio(s)* | | $ | 2,452,649 | | | $ | 1,803,186 | |
Securities lending income allocated from affiliated Master Portfolio(s) | | | 20,271 | | | | 39,421 | |
Affiliated income allocated from affiliated Master Portfolio(s) | | | 14,993 | | | | 5,972 | |
Interest allocated from affiliated Master Portfolio(s) | | | 0 | | | | 51 | |
Expenses allocated from affiliated Master Portfolio(s) | | | (941,047 | ) | | | (650,829 | ) |
Waivers allocated from affiliated Master Portfolio(s) | | | 0 | | | | 45,231 | |
| | | | |
Total investment income | | | 1,546,866 | | | | 1,243,032 | |
| | | | |
| | |
Expenses | | | | | | | | |
Management fee | | | 69,423 | | | | 312,095 | |
Administration fees | | | | | | | | |
Class A | | | 92,305 | | | | 70,185 | |
Class B | | | 90 | | | | 0 | 1 |
Class C | | | 7,684 | | | | 2,815 | |
Class R6 | | | 1 | 2 | | | N/A | |
Administrator Class | | | 13,607 | | | | 90,050 | |
Institutional Class | | | 104,938 | | | | N/A | |
Shareholder servicing fees | | | | | | | | |
Class A | | | 109,887 | | | | 83,554 | |
Class B | | | 108 | | | | 0 | 1 |
Class C | | | 9,148 | | | | 3,352 | |
Administrator Class | | | 26,167 | | | | 172,863 | |
Distribution fees | | | | | | | | |
Class B | | | 323 | | | | 0 | 1 |
Class C | | | 27,444 | | | | 10,055 | |
Custody and accounting fees | | | 5,904 | | | | 4,662 | |
Professional fees | | | 16,463 | | | | 15,789 | |
Registration fees | | | 33,099 | | | | 30,984 | |
Shareholder report expenses | | | 13,641 | | | | 15,507 | |
Trustees’ fees and expenses | | | 6,129 | | | | 6,509 | |
Interest expense | | | 0 | | | | 0 | |
Other fees and expenses | | | 6,217 | | | | 4,689 | |
| | | | |
Total expenses | | | 542,578 | | | | 823,109 | |
Less: Fee waivers and/or expense reimbursements | | | (157,350 | ) | | | (291,484 | ) |
| | | | |
Net expenses | | | 385,228 | | | | 531,625 | |
| | | | |
Net investment income (loss) | | | 1,161,638 | | | | 711,407 | |
| | | | |
| | |
REALIZED AND UNREALIZED GAINS (LOSSES) ON INVESTMENTS | | | | | | | | |
Net realized gains (losses) on securities transactions allocated from affiliated Master Portfolio(s) | | | 7,666,934 | | | | 7,044,561 | |
Net change in unrealized gains (losses) on securities transactions allocated from affiliated Master Portfolio(s) | | | 11,498,744 | | | | 772,172 | |
| | | | |
Net realized and unrealized gains (losses) on investments | | | 19,165,678 | | | | 7,816,733 | |
| | | | |
Net increase in net assets resulting from operations | | $ | 20,327,316 | | | $ | 8,528,140 | |
| | | | |
| | |
* Net of foreign dividend withholding taxes allocated from affiliated Master Portfolio(s) in the amount of | | | $63,272 | | | | $49,219 | |
| 1 | For the period from June 1, 2016 to June 6, 2016. Class B shares of the Fund were no longer offered to shareholders effective June 7, 2016. |
| 2 | For the period from October 31, 2016 (commencement of class operations) to November 30, 2016 |
The accompanying notes are an integral part of these financial statements.
| | | | | | |
| Statements of operations—six months ended November 30, 2016 (unaudited) | | Wells Fargo Equity Gateway Funds | | | 29 | |
| | | | | | | | | | | | | | | | | | |
Emerging
Growth Fund | | | Index Fund | | | International
Value Fund | | | Small Company
Growth Fund | | | Small Company
Value Fund | |
| | | | |
| | | | | | | | | | | | | | | | | | |
| $ | 3,259,684 | | | $ | 24,375,899 | | | $ | 6,273,768 | | | $ | 3,335,572 | | | $ | 974,711 | |
| | 614,607 | | | | 70,898 | | | | 247,509 | | | | 1,314,062 | | | | 37,981 | |
| | 22,483 | | | | 28,961 | | | | 2,898 | | | | 0 | | | | 0 | |
| | 0 | | | | 2,147 | | | | 0 | | | | 99,169 | | | | 6,296 | |
| | (3,106,991 | ) | | | (1,056,693 | ) | | | (2,084,516 | ) | | | (5,290,349 | ) | | | (516,261 | ) |
| | 0 | | | | 0 | | | | 0 | | | | 0 | | | | 0 | |
| | |
| | 789,783 | | | | 23,421,212 | | | | 4,439,659 | | | | (541,546 | ) | | | 502,727 | |
| | |
| | | | |
| | | | | | | | | | | | | | | | | | |
| | 192,238 | | | | 545,932 | | | | 116,502 | | | | 335,743 | | | | 30,632 | |
| | | | | | | | | | | | | | | | | | |
| | 139,454 | | | | 677,446 | | | | 8,285 | | | | 120,531 | | | | 23,896 | |
| | N/A | | | | 925 | | | | N/A | | | | 13 | | | | N/A | |
| | 4,149 | | | | 87,314 | | | | 800 | | | | 27,006 | | | | 2,066 | |
| | N/A | | | | N/A | | | | N/A | | | | 41,339 | | | | 1 | 2 |
| | 48,591 | | | | 945,428 | | | | 5,278 | | | | 87,059 | | | | 40,424 | |
| | 362,330 | | | | N/A | | | | 292,002 | | | | 515,400 | | | | 23,144 | |
| | | | | | | | | | | | | | | | | | |
| | 166,017 | | | | 806,483 | | | | 9,863 | | | | 143,489 | | | | 28,447 | |
| | N/A | | | | 1,101 | | | | N/A | | | | 15 | | | | N/A | |
| | 4,939 | | | | 103,946 | | | | 953 | | | | 32,150 | | | | 2,460 | |
| | 86,069 | | | | 721,795 | | | | 10,151 | | | | 167,421 | | | | 77,285 | |
| | | | | | | | | | | | | | | | | | |
| | N/A | | | | 3,303 | | | | N/A | | | | 46 | | | | N/A | |
| | 14,818 | | | | 311,838 | | | | 2,859 | | | | 96,451 | | | | 7,379 | |
| | 15,115 | | | | 41,642 | | | | 9,113 | | | | 25,816 | | | | 2,899 | |
| | 16,465 | | | | 15,963 | | | | 16,928 | | | | 15,011 | | | | 13,597 | |
| | 35,583 | | | | 38,844 | | | | 26,680 | | | | 86,746 | | | | 35,707 | |
| | 56,359 | | | | 56,225 | | | | 16,702 | | | | 122,681 | | | | 5,552 | |
| | 5,973 | | | | 2,767 | | | | 6,024 | | | | 9,618 | | | | 14,047 | |
| | 535 | | | | 552 | | | | 0 | | | | 0 | | | | 0 | |
| | 11,618 | | | | 16,006 | | | | 5,131 | | | | 11,773 | | | | 4,492 | |
| | |
| | 1,160,253 | | | | 4,377,510 | | | | 527,271 | | | | 1,838,308 | | | | 312,028 | |
| | (372,047 | ) | | | (1,659,626 | ) | | | (254,186 | ) | | | (285,417 | ) | | | (102,821 | ) |
| | |
| | 788,206 | | | | 2,717,884 | | | | 273,085 | | | | 1,552,891 | | | | 209,207 | |
| | |
| | 1,577 | | | | 20,703,328 | | | | 4,166,574 | | | | (2,094,437 | ) | | | 293,520 | |
| | |
| | | | |
| | | | | | | | | | | | | | | | | | |
| | 70,046,251 | | | | 113,216,942 | | | | (7,898,640 | ) | | | 7,428,083 | | | | 8,355,823 | |
| | 33,559,591 | | | | (10,686,580 | ) | | | 10,554,872 | | | | 135,143,044 | | | | 9,141,657 | |
| | |
| | 103,605,842 | | | | 102,530,362 | | | | 2,656,232 | | | | 142,571,127 | | | | 17,497,480 | |
| | |
| $ | 103,607,419 | | | $ | 123,233,690 | | | $ | 6,822,806 | | | $ | 140,476,690 | | | $ | 17,791,000 | |
| | |
| | | | |
| | $0 | | | | $22,964 | | | | $773,446 | | | | $20,540 | | | | $1,204 | |
The accompanying notes are an integral part of these financial statements.
| | | | |
| 30 | | Wells Fargo Equity Gateway Funds | | Statements of changes in net assets |
| | | | | | | | | | | | | | | | |
| | | C&B Large Cap Value Fund | |
| | | Six months ended
November 30, 2016
(unaudited) | | | Year ended
May 31, 2016 | |
| | | | |
Operations | | | | | | | | | | | | | | | | |
Net investment income | | | | | | $ | 1,161,638 | | | | | | | $ | 2,849,202 | |
Net realized gains on investments | | | | | | | 7,666,934 | | | | | | | | 11,830,809 | |
Net change in unrealized gains (losses) on investments | | | | | | | 11,498,744 | | | | | | | | (16,093,129 | ) |
| | | | |
Net increase (decrease) in net assets resulting from operations | | | | | | | 20,327,316 | | | | | | | | (1,413,118 | ) |
| | | | |
| | | | |
Distributions to shareholders from | | | | | | | | | | | | | | | | |
Net investment income | | | | | | | | | | | | | | | | |
Class A | | | | | | | 0 | | | | | | | | (704,407 | ) |
Class C | | | | | | | 0 | | | | | | | | (5,711 | ) |
Administrator Class | | | | | | | 0 | | | | | | | | (390,601 | ) |
Institutional Class | | | | | | | 0 | | | | | | | | (1,708,080 | ) |
Net realized gains | | | | | | | | | | | | | | | | |
Class A | | | | | | | 0 | | | | | | | | (2,768,349 | ) |
Class B | | | | | | | 0 | | | | | | | | (4,185 | ) |
Class C | | | | | | | 0 | | | | | | | | (226,860 | ) |
Administrator Class | | | | | | | 0 | | | | | | | | (1,238,469 | ) |
Institutional Class | | | | | | | 0 | | | | | | | | (4,289,359 | ) |
| | | | |
Total distributions to shareholders | | | | | | | 0 | | | | | | | | (11,336,021 | ) |
| | | | |
| | | | |
Capital share transactions | | | Shares | | | | | | | | Shares | | | | | |
Proceeds from shares sold | | | | | | | | | | | | | | | | |
Class A | | | 172,911 | | | | 2,224,197 | | | | 5,575,994 | | | | 70,098,722 | |
Class B | | | 0 | | | | 0 | | | | 1,293 | | | | 16,730 | |
Class C | | | 28,700 | | | | 368,593 | | | | 62,571 | | | | 770,614 | |
Class R6 | | | 1,964 | 1 | | | 25,000 | 1 | | | N/A | | | | N/A | |
Administrator Class | | | 51,271 | | | | 658,236 | | | | 262,362 | | | | 3,228,873 | |
Institutional Class | | | 5,275,384 | | | | 69,080,667 | | | | 4,202,150 | | | | 52,013,737 | |
Investor Class | | | N/A | | | | N/A | | | | 97,970 | 2 | | | 1,221,665 | 2 |
| | | | |
| | | | | | | 72,356,693 | | | | | | | | 127,350,341 | |
| | | | |
Reinvestment of distributions | | | | | | | | | | | | | | | | |
Class A | | | 0 | | | | 0 | | | | 283,128 | | | | 3,389,659 | |
Class B | | | 0 | | | | 0 | | | | 341 | | | | 4,144 | |
Class C | | | 0 | | | | 0 | | | | 18,836 | | | | 224,790 | |
Administrator Class | | | 0 | | | | 0 | | | | 129,270 | | | | 1,547,567 | |
Institutional Class | | | 0 | | | | 0 | | | | 125,571 | | | | 1,506,294 | |
| | | | |
| | | | | | | 0 | | | | | | | | 6,672,454 | |
| | | | |
Payment for shares redeemed | | | | | | | | | | | | | | | | |
Class A | | | (578,505 | ) | | | (7,426,990 | ) | | | (886,210 | ) | | | (10,862,850 | ) |
Class B | | | (3,230 | ) | | | (41,352 | ) | | | (14,555 | ) | | | (187,133 | ) |
Class C | | | (49,334 | ) | | | (633,921 | ) | | | (86,496 | ) | | | (1,042,353 | ) |
Administrator Class | | | (794,397 | ) | | | (10,449,995 | ) | | | (2,802,823 | ) | | | (34,387,115 | ) |
Institutional Class | | | (2,180,626 | ) | | | (28,690,874 | ) | | | (3,825,560 | ) | | | (47,032,229 | ) |
Investor Class | | | N/A | | | | N/A | | | | (5,539,205 | )2 | | | (69,791,462 | )2 |
| | | | |
| | | | | | | (47,243,132 | ) | | | | | | | (163,303,142 | ) |
| | | | |
Net increase (decrease) in net assets resulting from capital share transactions | | | | | | | 25,113,561 | | | | | | | | (29,280,347 | ) |
| | | | |
Total increase (decrease) in net assets | | | | | | | 45,440,877 | | | | | | | | (42,029,486 | ) |
| | | | |
| | | | |
Net assets | | | | | | | | | | | | | | | | |
Beginning of period | | | | | | | 252,616,173 | | | | | | | | 294,645,659 | |
| | | | |
End of period | | | | | | $ | 298,057,050 | | | | | | | $ | 252,616,173 | |
| | | | |
Undistributed net investment income | | | | | | $ | 2,072,449 | | | | | | | $ | 910,811 | |
| | | | |
| 1 | For the period from October 31, 2016 (commencement of class operations) to November 30, 2016 |
| 2 | For the period from June 1, 2015 to October 23, 2015. Effective at the close of business on October 23, 2015, Investor Class shares were converted to Class A shares and are no longer offered by the Fund. |
The accompanying notes are an integral part of these financial statements.
| | | | | | |
| Statements of changes in net assets | | Wells Fargo Equity Gateway Funds | | | 31 | |
| | | | | | | | | | | | | | | | |
| | | Diversified Equity Fund | |
| | | Six months ended
November 30, 2016
(unaudited) | | | Year ended
May 31, 2016 | |
| | | | |
Operations | | | | | | | | | | | | | | | | |
Net investment income | | | | | | $ | 711,407 | | | | | | | $ | 1,685,576 | |
Net realized gains on investments | | | | | | | 7,044,561 | | | | | | | | 13,338,712 | |
Net change in unrealized gains (losses) on investments | | | | | | | 772,172 | | | | | | | | (26,151,655 | ) |
| | | | |
Net increase (decrease) in net assets resulting from operations | | | | | | | 8,528,140 | | | | | | | | (11,127,367 | ) |
| | | | |
| | | | |
Distributions to shareholders from | | | | | | | | | | | | | | | | |
Net investment income | | | | | | | | | | | | | | | | |
Class A | | | | | | | 0 | | | | | | | | (221,131 | ) |
Administrator Class | | | | | | | 0 | | | | | | | | (839,164 | ) |
Net realized gains | | | | | | | | | | | | | | | | |
Class A | | | | | | | 0 | | | | | | | | (8,544,677 | ) |
Class B | | | | | | | 0 | 1 | | | | | | | (4,748 | ) |
Class C | | | | | | | 0 | | | | | | | | (466,528 | ) |
Administrator Class | | | | | | | 0 | | | | | | | | (17,061,026 | ) |
| | | | |
Total distributions to shareholders | | | | | | | 0 | | | | | | | | (27,137,274 | ) |
| | | | |
| | | | |
Capital share transactions | | | Shares | | | | | | | | Shares | | | | | |
Proceeds from shares sold | | | | | | | | | | | | | | | | |
Class A | | | 12,258 | | | | 342,939 | | | | 94,693 | | | | 2,811,823 | |
Class B | | | 0 | 1 | | | 0 | 1 | | | 230 | | | | 6,416 | |
Class C | | | 2,038 | | | | 51,760 | | | | 11,634 | | | | 316,337 | |
Administrator Class | | | 171,607 | | | | 4,794,999 | | | | 415,025 | | | | 11,962,561 | |
| | | | |
| | | | | | | 5,189,698 | | | | | | | | 15,097,137 | |
| | | | |
Reinvestment of distributions | | | | | | | | | | | | | | | | |
Class A | | | 0 | | | | 0 | | | | 320,487 | | | | 8,727,909 | |
Class B | | | 0 | 1 | | | 0 | 1 | | | 121 | | | | 2,943 | |
Class C | | | 0 | | | | 0 | | | | 17,905 | | | | 449,232 | |
Administrator Class | | | 0 | | | | 0 | | | | 649,470 | | | | 17,753,217 | |
| | | | |
| | | | | | | 0 | | | | | | | | 26,933,301 | |
| | | | |
Payment for shares redeemed | | | | | | | | | | | | | | | | |
Class A | | | (175,151 | ) | | | (4,871,909 | ) | | | (457,048 | ) | | | (12,951,934 | ) |
Class B | | | (29 | )1 | | | (717 | )1 | | | (1,838 | ) | | | (44,756 | ) |
Class C | | | (20,436 | ) | | | (521,816 | ) | | | (54,060 | ) | | | (1,358,279 | ) |
Administrator Class | | | (801,260 | ) | | | (22,481,467 | ) | | | (1,073,233 | ) | | | (31,084,914 | ) |
| | | | |
| | | | | | | (27,875,909 | ) | | | | | | | (45,439,883 | ) |
| | | | |
Net decrease in net assets resulting from capital share transactions | | | | | | | (22,686,211 | ) | | | | | | | (3,409,445 | ) |
| | | | |
Total decrease in net assets | | | | | | | (14,158,071 | ) | | | | | | | (41,674,086 | ) |
| | | | |
| | | | |
Net assets | | | | | | | | | | | | | | | | |
Beginning of period | | | | | | | 211,407,555 | | | | | | | | 253,081,641 | |
| | | | |
End of period | | | | | | $ | 197,249,484 | | | | | | | $ | 211,407,555 | |
| | | | |
Undistributed net investment income | | | | | | $ | 1,184,920 | | | | | | | $ | 473,513 | |
| | | | |
| 1 | For the period from June 1, 2016 to June 6, 2016. Class B shares of the Fund were no longer offered to shareholders effective June 7, 2016. |
The accompanying notes are an integral part of these financial statements.
| | | | |
| 32 | | Wells Fargo Equity Gateway Funds | | Statements of changes in net assets |
| | | | | | | | | | | | | | | | |
| | | Emerging Growth Fund | |
| | | Six months ended
November 30, 2016
(unaudited) | | | Year ended
May 31, 2016 | |
| | | | |
Operations | | | | | | | | | | | | | | | | |
Net investment income (loss) | | | | | | $ | 1,577 | | | | | | | $ | (5,604,076 | ) |
Net realized gains on investments | | | | | | | 70,046,251 | | | | | | | | 16,759,240 | |
Net change in unrealized gains (losses) on investments | | | | | | | 33,559,591 | | | | | | | | (161,957,206 | ) |
| | | | |
Net increase (decrease) in net assets resulting from operations | | | | | | | 103,607,419 | | | | | | | | (150,802,042 | ) |
| | | | |
| | | | |
Distributions to shareholders from | | | | | | | | | | | | | | | | |
Net realized gains | | | | | | | | | | | | | | | | |
Class A | | | | | | | 0 | | | | | | | | (17,578,574 | ) |
Class C | | | | | | | 0 | | | | | | | | (550,009 | ) |
Administrator Class | | | | | | | 0 | | | | | | | | (13,726,906 | ) |
Institutional Class | | | | | | | 0 | | | | | | | | (69,855,887 | ) |
| | | | |
Total distributions to shareholders | | | | | | | 0 | | | | | | | | (101,711,376 | ) |
| | | | |
| | | | |
Capital share transactions | | | Shares | | | | | | | | Shares | | | | | |
Proceeds from shares sold | | | | | | | | | | | | | | | | |
Class A | | | 116,918 | | | | 1,583,027 | | | | 3,191,945 | | | | 46,782,655 | |
Class C | | | 497 | | | | 6,317 | | | | 10,483 | | | | 144,504 | |
Administrator Class | | | 340,601 | | | | 4,711,274 | | | | 2,336,832 | | | | 33,830,513 | |
Institutional Class | | | 5,365,370 | | | | 76,504,121 | | | | 11,852,732 | | | | 173,650,959 | |
Investor Class | | | N/A | | | | N/A | | | | 89,491 | 1 | | | 1,444,439 | 1 |
| | | | |
| | | | | | | 82,804,739 | | | | | | | | 255,853,070 | |
| | | | |
Reinvestment of distributions | | | | | | | | | | | | | | | | |
Class A | | | 0 | | | | 0 | | | | 1,300,151 | | | | 17,174,997 | |
Class C | | | 0 | | | | 0 | | | | 41,108 | | | | 503,162 | |
Administrator Class | | | 0 | | | | 0 | | | | 810,410 | | | | 10,932,427 | |
Institutional Class | | | 0 | | | | 0 | | | | 4,771,143 | | | | 66,223,470 | |
| | | | |
| | | | | | | 0 | | | | | | | | 94,834,056 | |
| | | | |
Payment for shares redeemed | | | | | | | | | | | | | | | | |
Class A | | | (1,130,869 | ) | | | (15,503,981 | ) | | | (2,239,881 | ) | | | (30,073,121 | ) |
Class C | | | (54,330 | ) | | | (689,657 | ) | | | (47,632 | ) | | | (594,685 | ) |
Administrator Class | | | (3,867,525 | ) | | | (52,909,110 | ) | | | (4,765,394 | ) | | | (70,399,879 | ) |
Institutional Class | | | (14,550,149 | ) | | | (207,324,993 | ) | | | (14,016,874 | ) | | | (206,834,361 | ) |
Investor Class | | | N/A | | | | N/A | | | | (2,736,791 | )1 | | | (40,078,310 | )1 |
| | | | |
| | | | | | | (276,427,741 | ) | | | | | | | (347,980,356 | ) |
| | | | |
Net increase (decrease) in net assets resulting from capital share transactions | | | | | | | (193,623,002 | ) | | | | | | | 2,706,770 | |
| | | | |
Total decrease in net assets | | | | | | | (90,015,583 | ) | | | | | | | (249,806,648 | ) |
| | | | |
| | | | |
Net assets | | | | | | | | | | | | | | | | |
Beginning of period | | | | | | | 814,603,627 | | | | | | | | 1,064,410,275 | |
| | | | |
End of period | | | | | | $ | 724,588,044 | | | | | | | $ | 814,603,627 | |
| | | | |
Accumulated net investment loss | | | | | | $ | (1,368,529 | ) | | | | | | $ | (1,370,106 | ) |
| | | | |
| 1 | For the period from June 1, 2015 to October 23, 2015. Effective at the close of business on October 23, 2015, Investor Class shares were converted to Class A shares and are no longer offered by the Fund. |
The accompanying notes are an integral part of these financial statements.
| | | | | | |
| Statements of changes in net assets | | Wells Fargo Equity Gateway Funds | | | 33 | |
| | | | | | | | | | | | | | | | |
| | | Index Fund | |
| | | Six months ended
November 30, 2016
(unaudited) | | | Year ended
May 31, 2016 | |
| | | | |
Operations | | | | | | | | | | | | | | | | |
Net investment income | | | | | | $ | 20,703,328 | | | | | | | $ | 43,842,849 | |
Net realized gains on investments | | | | | | | 113,216,942 | | | | | | | | 145,902,899 | |
Net change in unrealized gains (losses) on investments | | | | | | | (10,686,580 | ) | | | | | | | (169,888,364 | ) |
| | | | |
Net increase in net assets resulting from operations | | | | | | | 123,233,690 | | | | | | | | 19,857,384 | |
| | | | |
| | | | |
Distributions to shareholders from | | | | | | | | | | | | | | | | |
Net investment income | | | | | | | | | | | | | | | | |
Class A | | | | | | | 0 | | | | | | | | (11,172,028 | ) |
Class B | | | | | | | 0 | | | | | | | | (6,396 | ) |
Class C | | | | | | | 0 | | | | | | | | (728,373 | ) |
Administrator Class | | | | | | | 0 | | | | | | | | (31,972,442 | ) |
Net realized gains | | | | | | | | | | | | | | | | |
Class A | | | | | | | 0 | | | | | | | | (39,384,515 | ) |
Class B | | | | | | | 0 | | | | | | | | (83,225 | ) |
Class C | | | | | | | 0 | | | | | | | | (4,840,929 | ) |
Administrator Class | | | | | | | 0 | | | | | | | | (97,917,183 | ) |
| | | | |
Total distributions to shareholders | | | | | | | 0 | | | | | | | | (186,105,091 | ) |
| | | | |
| | | | |
Capital share transactions | | | Shares | | | | | | | | Shares | | | | | |
Proceeds from shares sold | | | | | | | | | | | | | | | | |
Class A | | | 290,278 | | | | 18,727,409 | | | | 3,880,729 | | | | 256,525,864 | |
Class B | | | 304 | | | | 20,030 | | | | 149 | | | | 8,695 | |
Class C | | | 124,392 | | | | 8,014,912 | | | | 135,073 | | | | 8,323,805 | |
Administrator Class | | | 1,491,699 | | | | 97,243,172 | | | | 3,967,724 | | | | 247,773,885 | |
Investor Class | | | N/A | | | | N/A | | | | 142,837 | 1 | | | 9,251,027 | 1 |
| | | | |
| | | | | | | 124,005,523 | | | | | | | | 521,883,276 | |
| | | | |
Reinvestment of distributions | | | | | | | | | | | | | | | | |
Class A | | | 0 | | | | 0 | | | | 806,782 | | | | 49,545,858 | |
Class B | | | 0 | | | | 0 | | | | 1,408 | | | | 88,216 | |
Class C | | | 0 | | | | 0 | | | | 52,914 | | | | 3,262,843 | |
Administrator Class | | | 0 | | | | 0 | | | | 2,060,178 | | | | 127,480,756 | |
| | | | |
| | | | | | | 0 | | | | | | | | 180,377,673 | |
| | | | |
Payment for shares redeemed | | | | | | | | | | | | | | | | |
Class A | | | (741,937 | ) | | | (47,911,390 | ) | | | (1,123,946 | ) | | | (69,747,531 | ) |
Class B | | | (7,930 | ) | | | (522,329 | ) | | | (15,549 | ) | | | (1,010,540 | ) |
Class C | | | (123,364 | ) | | | (7,974,192 | ) | | | (162,173 | ) | | | (10,047,846 | ) |
Administrator Class | | | (5,076,178 | ) | | | (332,077,663 | ) | | | (9,338,168 | ) | | | (589,128,029 | ) |
Investor Class | | | N/A | | | | N/A | | | | (3,630,262 | )1 | | | (242,534,900 | )1 |
| | | | |
| | | | | | | (388,485,574 | ) | | | | | | | (912,468,846 | ) |
| | | | |
Net decrease in net assets resulting from capital share transactions | | | | | | | (264,480,051 | ) | | | | | | | (210,207,897 | ) |
| | | | |
Total decrease in net assets | | | | | | | (141,246,361 | ) | | | | | | | (376,455,604 | ) |
| | | | |
| | | | |
Net assets | | | | | | | | | | | | | | | | |
Beginning of period | | | | | | | 2,222,701,099 | | | | | | | | 2,599,156,703 | |
| | | | |
End of period | | | | | | $ | 2,081,454,738 | | | | | | | $ | 2,222,701,099 | |
| | | | |
Undistributed net investment income | | | | | | $ | 37,076,785 | | | | | | | $ | 16,373,457 | |
| | | | |
| 1 | For the period from June 1, 2015 to October 23, 2015. Effective at the close of business on October 23, 2015, Investor Class shares were converted to Class A shares and are no longer offered by the Fund. |
The accompanying notes are an integral part of these financial statements.
| | | | |
| 34 | | Wells Fargo Equity Gateway Funds | | Statements of changes in net assets |
| | | | | | | | | | | | | | | | |
| | | International Value Fund | |
| | | Six months ended November 30, 2016 (unaudited) | | | Year ended May 31, 2016 | |
| | | | |
Operations | | | | | | | | | | | | | | | | |
Net investment income | | | | | | $ | 4,166,574 | | | | | | | $ | 10,753,007 | |
Net realized losses on investments | | | | | | | (7,898,640 | ) | | | | | | | (1,414,408 | ) |
Net change in unrealized gains (losses) on investments | | | | | | | 10,554,872 | | | | | | | | (68,327,246 | ) |
| | | | |
Net increase (decrease) in net assets resulting from operations | | | | | | | 6,822,806 | | | | | | | | (58,988,647 | ) |
| | | | |
| | | | |
Distributions to shareholders from | | | | | | | | | | | | | | | | |
Net investment income | | | | | | | | | | | | | | | | |
Class A | | | | | | | 0 | | | | | | | | (74,978 | ) |
Class C | | | | | | | 0 | | | | | | | | (6,472 | ) |
Institutional Class | | | | | | | 0 | | | | | | | | (8,593,037 | ) |
| | | | |
Total distributions to shareholders | | | | | | | 0 | | | | | | | | (8,674,487 | ) |
| | | | |
| | | | |
Capital share transactions | | | Shares | | | | | | | | Shares | | | | | |
Proceeds from shares sold | | | | | | | | | | | | | | | | |
Class A | | | 3,656,559 | | | | 47,459,272 | | | | 137,751 | | | | 1,746,788 | |
Class C | | | 1,032 | | | | 12,701 | | | | 26,626 | | | | 345,603 | |
Administrator Class | | | 25,392 | | | | 317,550 | | | | 1,268,931 | | | | 18,094,801 | |
Institutional Class | | | 4,213,241 | | | | 53,696,317 | | | | 38,985,756 | | | | 524,060,776 | |
| | | | |
| | | | | | | 101,485,840 | | | | | | | | 544,247,968 | |
| | | | |
Reinvestment of distributions | | | | | | | | | | | | | | | | |
Class A | | | 0 | | | | 0 | | | | 5,589 | | | | 73,109 | |
Class C | | | 0 | | | | 0 | | | | 454 | | | | 5,827 | |
Institutional Class | | | 0 | | | | 0 | | | | 662,612 | | | | 8,587,447 | |
| | | | |
| | | | | | | 0 | | | | | | | | 8,666,383 | |
| | | | |
Payment for shares redeemed | | | | | | | | | | | | | | | | |
Class A | | | (249,913 | ) | | | (3,226,710 | ) | | | (143,571 | ) | | | (1,876,076 | ) |
Class B | | | N/A | | | | N/A | | | | (134 | )1 | | | (1,823 | )1 |
Class C | | | (6,550 | ) | | | (82,817 | ) | | | (28,008 | ) | | | (352,174 | ) |
Administrator Class | | | (572,458 | ) | | | (7,400,090 | ) | | | (33,457,218 | ) | | | (455,926,251 | ) |
Institutional Class | | | (4,780,493 | ) | | | (61,165,228 | ) | | | (4,077,552 | ) | | | (51,283,434 | ) |
| | | | |
| | | | | | | (71,874,845 | ) | | | | | | | (509,439,758 | ) |
| | | | |
Net increase in net assets resulting from capital share transactions | | | | | | | 29,610,995 | | | | | | | | 43,474,593 | |
| | | | |
Total increase (decrease) in net assets | | | | | | | 36,433,801 | | | | | | | | (24,188,541 | ) |
| | | | |
| | | | |
Net assets | | | | | | | | | | | | | | | | |
Beginning of period | | | | | | | 473,876,565 | | | | | | | | 498,065,106 | |
| | | | |
End of period | | | | | | $ | 510,310,366 | | | | | | | $ | 473,876,565 | |
| | | | |
Undistributed net investment income | | | | | | $ | 11,545,605 | | | | | | | $ | 7,379,031 | |
| | | | |
| 1 | For the period from June 1, 2015 to December 8, 2015. Class B shares of the Fund were no longer offered to shareholders effective December 9, 2015. |
The accompanying notes are an integral part of these financial statements.
| | | | | | |
| Statements of changes in net assets | | Wells Fargo Equity Gateway Funds | | | 35 | |
| | | | | | | | | | | | | | | | |
| | | Small Company Growth Fund | |
| | | Six months ended
November 30, 2016
(unaudited) | | | Year ended
May 31, 2016 | |
| | | | |
Operations | | | | | | | | | | | | | | | | |
Net investment loss | | | | | | $ | (2,094,437 | ) | | | | | | $ | (2,929,297 | ) |
Net realized gains (losses) on investments | | | | | | | 7,428,083 | | | | | | | | (96,538,450 | ) |
Net change in unrealized gains (losses) on investments | | | | | | | 135,143,044 | | | | | | | | (52,968,762 | ) |
| | | | |
Net increase (decrease) in net assets resulting from operations | | | | | | | 140,476,690 | | | | | | | | (152,436,509 | ) |
| | | | |
| | | | |
Distributions to shareholders from | | | | | | | | | | | | | | | | |
Net realized gains | | | | | | | | | | | | | | | | |
Class A | | | | | | | 0 | | | | | | | | (959,782 | ) |
Class B | | | | | | | 0 | | | | | | | | (390 | ) |
Class C | | | | | | | 0 | | | | | | | | (215,622 | ) |
Class R6 | | | | | | | 0 | | | | | | | | (879,243 | ) |
Administrator Class | | | | | | | 0 | | | | | | | | (1,038,580 | ) |
Institutional Class | | | | | | | 0 | | | | | | | | (4,261,265 | ) |
| | | | |
Total distributions to shareholders | | | | | | | 0 | | | | | | | | (7,354,882 | ) |
| | | | |
| | | | |
Capital share transactions | | | Shares | | | | | | | | Shares | | | | | |
Proceeds from shares sold | | | | | | | | | | | | | | | | |
Class A | | | 253,063 | | | | 10,057,268 | | | | 2,891,844 | | | | 116,614,639 | |
Class B | | | 0 | | | | 0 | | | | 550 | | | | 20,540 | |
Class C | | | 31,160 | | | | 1,122,067 | | | | 578,225 | | | | 21,398,369 | |
Class R6 | | | 2,355,487 | | | | 99,305,608 | | | | 6,430,379 | | | | 268,578,557 | |
Administrator Class | | | 264,183 | | | | 10,864,026 | | | | 1,812,201 | | | | 76,404,712 | |
Institutional Class | | | 7,246,093 | | | | 302,886,240 | | | | 13,905,905 | | | | 582,506,295 | |
| | | | |
| | | | | | | 424,235,209 | | | | | | | | 1,065,523,112 | |
| | | | |
Reinvestment of distributions | | | | | | | | | | | | | | | | |
Class A | | | 0 | | | | 0 | | | | 23,512 | | | | 924,981 | |
Class B | | | 0 | | | | 0 | | | | 10 | | | | 368 | |
Class C | | | 0 | | | | 0 | | | | 4,971 | | | | 177,103 | |
Class R6 | | | 0 | | | | 0 | | | | 20,281 | | | | 840,043 | |
Administrator Class | | | 0 | | | | 0 | | | | 25,417 | | | | 1,035,227 | |
Institutional Class | | | 0 | | | | 0 | | | | 79,935 | | | | 3,310,125 | |
| | | | |
| | | | | | | 0 | | | | | | | | 6,287,847 | |
| | | | |
Payment for shares redeemed | | | | | | | | | | | | | | | | |
Class A | | | (1,082,459 | ) | | | (42,524,662 | ) | | | (1,436,430 | ) | | | (53,673,216 | ) |
Class B | | | (250 | ) | | | (9,049 | ) | | | (1,960 | ) | | | (71,547 | ) |
Class C | | | (183,859 | ) | | | (6,609,966 | ) | | | (221,799 | ) | | | (7,390,685 | ) |
Class R6 | | | (773,797 | ) | | | (32,599,381 | ) | | | (696,900 | ) | | | (27,316,064 | ) |
Administrator Class | | | (632,291 | ) | | | (26,407,634 | ) | | | (2,556,843 | ) | | | (105,996,475 | ) |
Institutional Class | | | (3,485,327 | ) | | | (146,215,084 | ) | | | (6,761,785 | ) | | | (270,191,008 | ) |
| | | | |
| | | | | | | (254,365,776 | ) | | | | | | | (464,638,995 | ) |
| | | | |
Net increase in net assets resulting from capital share transactions | | | | | | | 169,869,433 | | | | | | | | 607,171,964 | |
| | | | |
Total increase in net assets | | | | | | | 310,346,123 | | | | | | | | 447,380,573 | |
| | | | |
| | | | |
Net assets | | | | | | | | | | | | | | | | |
Beginning of period | | | | | | | 1,193,830,839 | | | | | | | | 746,450,266 | |
| | | | |
End of period | | | | | | $ | 1,504,176,962 | | | | | | | $ | 1,193,830,839 | |
| | | | |
Accumulated net investment loss | | | | | | $ | (2,606,072 | ) | | | | | | $ | (511,635 | ) |
| | | | |
The accompanying notes are an integral part of these financial statements.
| | | | |
| 36 | | Wells Fargo Equity Gateway Funds | | Statements of changes in net assets |
| | | | | | | | | | | | | | | | |
| | | Small Company Value Fund | |
| | | Six months ended
November 30, 2016 (unaudited) | | | Year ended
May 31, 2016 | |
| | | | |
Operations | | | | | | | | | | | | | | | | |
Net investment income | | | | | | $ | 293,520 | | | | | | | $ | 281,447 | |
Net realized gains on investments | | | | | | | 8,355,823 | | | | | | | | 5,081,876 | |
Net change in unrealized gains (losses) on investments | | | | | | | 9,141,657 | | | | | | | | (11,987,449 | ) |
| | | | |
Net increase (decrease) in net assets resulting from operations | | | | | | | 17,791,000 | | | | | | | | (6,624,126 | ) |
| | | | |
| | | | |
Distributions to shareholders from | | | | | | | | | | | | | | | | |
Net investment income | | | | | | | | | | | | | | | | |
Class A | | | | | | | 0 | | | | | | | | (30,336 | ) |
Administrator Class | | | | | | | 0 | | | | | | | | (230,332 | ) |
Institutional Class | | | | | | | 0 | | | | | | | | (170,512 | ) |
| | | | |
Total distributions to shareholders | | | | | | | 0 | | | | | | | | (431,180 | ) |
| | | | |
| | | | |
Capital share transactions | | | Shares | | | | | | | | Shares | | | | | |
Proceeds from shares sold | | | | | | | | | | | | | | | | |
Class A | | | 109,572 | | | | 2,345,401 | | | | 184,247 | | | | 3,586,453 | |
Class B | | | N/A | | | | N/A | | | | 708 | 1 | | | 13,845 | 1 |
Class C | | | 2,315 | | | | 45,359 | | | | 18,509 | | | | 342,862 | |
Class R6 | | | 1,170 | 2 | | | 25,000 | 2 | | | N/A | | | | N/A | |
Administrator Class | | | 167,059 | | | | 3,606,623 | | | | 473,663 | | | | 9,486,626 | |
Institutional Class | | | 646,973 | | | | 14,145,454 | | | | 1,003,324 | | | | 20,946,201 | |
| | | | |
| | | | | | | 20,167,837 | | | | | | | | 34,375,987 | |
| | | | |
Reinvestment of distributions | | | | | | | | | | | | | | | | |
Class A | | | 0 | | | | 0 | | | | 1,492 | | | | 28,226 | |
Administrator Class | | | 0 | | | | 0 | | | | 11,843 | | | | 228,808 | |
Institutional Class | | | 0 | | | | 0 | | | | 8,652 | | | | 167,939 | |
| | | | |
| | | | | | | 0 | | | | | | | | 424,973 | |
| | | | |
Payment for shares redeemed | | | | | | | | | | | | | | | | |
Class A | | | (229,937 | ) | | | (4,787,951 | ) | | | (270,420 | ) | | | (5,299,278 | ) |
Class B | | | N/A | | | | N/A | | | | (1,264 | )1 | | | (21,882 | )1 |
Class C | | | (13,809 | ) | | | (261,114 | ) | | | (42,627 | ) | | | (755,968 | ) |
Administrator Class | | | (629,799 | ) | | | (13,635,965 | ) | | | (630,158 | ) | | | (12,681,576 | ) |
Institutional Class | | | (440,323 | ) | | | (9,708,235 | ) | | | (247,681 | ) | | | (4,876,787 | ) |
| | | | |
| | | | | | | (28,393,265 | ) | | | | | | | (23,635,491 | ) |
| | | | |
Net increase (decrease) in net assets resulting from capital share transactions | | | | | | | (8,225,428 | ) | | | | | | | 11,165,469 | |
| | | | |
Total increase in net assets | | | | | | | 9,565,572 | | | | | | | | 4,110,163 | |
| | | | |
| | | | |
Net assets | | | | | | | | | | | | | | | | |
Beginning of period | | | | | | | 120,945,876 | | | | | | | | 116,835,713 | |
| | | | |
End of period | | | | | | $ | 130,511,448 | | | | | | | $ | 120,945,876 | |
| | | | |
Undistributed net investment income | | | | | | $ | 585,481 | | | | | | | $ | 291,961 | |
| | | | |
| 1 | For the period from June 1, 2015 to January 7, 2016. Class B shares of the Fund were no longer offered to shareholders effective January 8, 2016. |
| 2 | For the period from October 31, 2016 (commencement of class operations) to November 30, 2016 |
The accompanying notes are an integral part of these financial statements.
This page is intentionally left blank.
| | | | |
| 38 | | Wells Fargo Equity Gateway Funds | | Financial highlights |
| | | | | | | | | | | | | | | | | | | | | | | | |
| C&B Large Cap Value Fund | | Beginning
net asset
value per
share | | | Net
investment
income (loss) | | | Net realized
and unrealized
gains (losses)
on investments | | | Distributions
from net
investment
income | | | Distributions
from net
realized gains | | | Ending
net asset
value per
share | |
Class A | | | | | | | | | | | | | | | | | | | | | | | | |
Six months ended November 30, 2016 (unaudited) | | $ | 12.55 | | | | 0.04 | | | | 0.90 | | | | 0.00 | | | | 0.00 | | | $ | 13.49 | |
Year ended May 31, 2016 | | $ | 13.07 | | | | 0.11 | 4 | | | (0.14 | ) | | | (0.10 | ) | | | (0.39 | ) | | $ | 12.55 | |
Year ended May 31, 2015 | | $ | 11.99 | | | | 0.10 | | | | 1.07 | | | | (0.09 | ) | | | 0.00 | | | $ | 13.07 | |
Year ended May 31, 2014 | | $ | 10.32 | | | | 0.09 | | | | 1.68 | | | | (0.10 | ) | | | 0.00 | | | $ | 11.99 | |
Year ended May 31, 2013 | | $ | 8.13 | | | | 0.12 | | | | 2.20 | | | | (0.13 | ) | | | 0.00 | | | $ | 10.32 | |
Year ended May 31, 2012 | | $ | 8.70 | | | | 0.12 | | | | (0.58 | ) | | | (0.11 | ) | | | 0.00 | | | $ | 8.13 | |
Class B | | | | | | | | | | | | | | | | | | | | | | | | |
Six months ended November 30, 2016 (unaudited) | | $ | 12.70 | | | | (0.01 | )4 | | | 0.92 | | | | 0.00 | | | | 0.00 | | | $ | 13.61 | |
Year ended May 31, 2016 | | $ | 13.22 | | | | 0.01 | 4 | | | (0.14 | ) | | | 0.00 | | | | (0.39 | ) | | $ | 12.70 | |
Year ended May 31, 2015 | | $ | 12.14 | | | | (0.01 | )4 | | | 1.09 | | | | 0.00 | | | | 0.00 | | | $ | 13.22 | |
Year ended May 31, 2014 | | $ | 10.43 | | | | 0.02 | 4 | | | 1.69 | | | | 0.00 | | | | 0.00 | | | $ | 12.14 | |
Year ended May 31, 2013 | | $ | 8.16 | | | | 0.05 | 4 | | | 2.22 | | | | 0.00 | | | | 0.00 | | | $ | 10.43 | |
Year ended May 31, 2012 | | $ | 8.68 | | | | 0.05 | 4 | | | (0.56 | ) | | | (0.01 | ) | | | 0.00 | | | $ | 8.16 | |
Class C | | | | | | | | | | | | | | | | | | | | | | | | |
Six months ended November 30, 2016 (unaudited) | | $ | 12.48 | | | | (0.01 | ) | | | 0.91 | | | | 0.00 | | | | 0.00 | | | $ | 13.38 | |
Year ended May 31, 2016 | | $ | 13.01 | | | | 0.01 | | | | (0.14 | ) | | | (0.01 | ) | | | (0.39 | ) | | $ | 12.48 | |
Year ended May 31, 2015 | | $ | 11.95 | | | | (0.00 | )5 | | | 1.07 | | | | (0.01 | ) | | | 0.00 | | | $ | 13.01 | |
Year ended May 31, 2014 | | $ | 10.29 | | | | 0.01 | | | | 1.67 | | | | (0.02 | ) | | | 0.00 | | | $ | 11.95 | |
Year ended May 31, 2013 | | $ | 8.11 | | | | 0.04 | | | | 2.20 | | | | (0.06 | ) | | | 0.00 | | | $ | 10.29 | |
Year ended May 31, 2012 | | $ | 8.66 | | | | 0.05 | | | | (0.56 | ) | | | (0.04 | ) | | | 0.00 | | | $ | 8.11 | |
Class R6 | | | | | | | | | | | | | | | | | | | | | | | | |
Period ended November 30, 2016 (unaudited)6 | | $ | 12.73 | | | | 0.02 | | | | 0.80 | | | | 0.00 | | | | 0.00 | | | $ | 13.55 | |
Administrator Class | | | | | | | | | | | | | | | | | | | | | | | | |
Six months ended November 30, 2016 (unaudited) | | $ | 12.54 | | | | 0.05 | 4 | | | 0.91 | | | | 0.00 | | | | 0.00 | | | $ | 13.50 | |
Year ended May 31, 2016 | | $ | 13.07 | | | | 0.13 | 4 | | | (0.15 | ) | | | (0.12 | ) | | | (0.39 | ) | | $ | 12.54 | |
Year ended May 31, 2015 | | $ | 12.00 | | | | 0.13 | | | | 1.06 | | | | (0.12 | ) | | | 0.00 | | | $ | 13.07 | |
Year ended May 31, 2014 | | $ | 10.32 | | | | 0.12 | 4 | | | 1.68 | | | | (0.12 | ) | | | 0.00 | | | $ | 12.00 | |
Year ended May 31, 2013 | | $ | 8.13 | | | | 0.13 | 4 | | | 2.21 | | | | (0.15 | ) | | | 0.00 | | | $ | 10.32 | |
Year ended May 31, 2012 | | $ | 8.69 | | | | 0.13 | 4 | | | (0.56 | ) | | | (0.13 | ) | | | 0.00 | | | $ | 8.13 | |
Institutional Class | | | | | | | | | | | | | | | | | | | | | | | | |
Six months ended November 30, 2016 (unaudited) | | $ | 12.58 | | | | 0.07 | | | | 0.90 | | | | 0.00 | | | | 0.00 | | | $ | 13.55 | |
Year ended May 31, 2016 | | $ | 13.11 | | | | 0.16 | | | | (0.14 | ) | | | (0.16 | ) | | | (0.39 | ) | | $ | 12.58 | |
Year ended May 31, 2015 | | $ | 12.03 | | | | 0.15 | | | | 1.08 | | | | (0.15 | ) | | | 0.00 | | | $ | 13.11 | |
Year ended May 31, 2014 | | $ | 10.35 | | | | 0.14 | | | | 1.69 | | | | (0.15 | ) | | | 0.00 | | | $ | 12.03 | |
Year ended May 31, 2013 | | $ | 8.16 | | | | 0.17 | | | | 2.19 | | | | (0.17 | ) | | | 0.00 | | | $ | 10.35 | |
Year ended May 31, 2012 | | $ | 8.73 | | | | 0.14 | | | | (0.56 | ) | | | (0.15 | ) | | | 0.00 | | | $ | 8.16 | |
| 1 | Ratios include net expenses allocated from the affiliated Master Portfolio. |
| 2 | Total return calculations do not include any sales charges. Returns for periods of less than one year are not annualized. |
| 3 | Portfolio turnover rate is calculated by aggregating the results of multiplying the Fund’s investment percentage in the affiliated Master Portfolio by the affiliated Master Portfolio’s portfolio turnover rate. |
| 4 | Calculated based upon average shares outstanding |
| 5 | Amount is less than $0.005. |
| 6 | For the period from October 31, 2016 (commencement of class operations) to November 30, 2016 |
The accompanying notes are an integral part of these financial statements.
| | | | | | |
| Financial highlights | | Wells Fargo Equity Gateway Funds | | | 39 | |
| | | | | | | | | | | | | | | | | | | | | | |
| Ratio to average net assets (annualized) | | | Total
return2 | | | Portfolio
turnover
rate3 | | | Net assets at
end of period
(000s omitted) | |
Net investment
income (loss) | | | Gross
expenses1 | | | Net
expenses1 | | | | |
| | | | | | | | | | | | | | | | | | | | | | |
| | 0.65 | % | | | 1.25 | % | | | 1.15 | % | | | 7.58 | % | | | 32 | % | | $ | 89,586 | |
| | 0.89 | % | | | 1.25 | % | | | 1.15 | % | | | (0.08 | )% | | | 29 | % | | $ | 88,387 | |
| | 0.73 | % | | | 1.29 | % | | | 1.15 | % | | | 9.78 | % | | | 35 | % | | $ | 27,085 | |
| | 0.86 | % | | | 1.31 | % | | | 1.15 | % | | | 17.25 | % | | | 22 | % | | $ | 29,537 | |
| | 1.25 | % | | | 1.30 | % | | | 1.15 | % | | | 28.82 | % | | | 18 | % | | $ | 23,571 | |
| | 1.33 | % | | | 1.30 | % | | | 1.15 | % | | | (5.23 | )% | | | 21 | % | | $ | 21,380 | |
| | | | | | | | | | | | | | | | | | | | | | |
| | (0.11 | )% | | | 1.99 | % | | | 1.90 | % | | | 7.17 | % | | | 32 | % | | $ | 68 | |
| | 0.08 | % | | | 2.00 | % | | | 1.90 | % | | | (0.81 | )% | | | 29 | % | | $ | 105 | |
| | (0.04 | )% | | | 2.04 | % | | | 1.90 | % | | | 8.90 | % | | | 35 | % | | $ | 280 | |
| | 0.17 | % | | | 2.06 | % | | | 1.90 | % | | | 16.40 | % | | | 22 | % | | $ | 469 | |
| | 0.57 | % | | | 2.03 | % | | | 1.89 | % | | | 27.82 | % | | | 18 | % | | $ | 1,167 | |
| | 0.61 | % | | | 2.05 | % | | | 1.90 | % | | | (5.84 | )% | | | 21 | % | | $ | 2,418 | |
| | | | | | | | | | | | | | | | | | | | | | |
| | (0.10 | )% | | | 2.00 | % | | | 1.90 | % | | | 7.21 | % | | | 32 | % | | $ | 7,526 | |
| | 0.11 | % | | | 2.00 | % | | | 1.90 | % | | | (0.82 | )% | | | 29 | % | | $ | 7,282 | |
| | (0.02 | )% | | | 2.04 | % | | | 1.90 | % | | | 8.93 | % | | | 35 | % | | $ | 7,654 | |
| | 0.11 | % | | | 2.06 | % | | | 1.90 | % | | | 16.39 | % | | | 22 | % | | $ | 7,262 | |
| | 0.51 | % | | | 2.05 | % | | | 1.90 | % | | | 27.76 | % | | | 18 | % | | $ | 5,818 | |
| | 0.58 | % | | | 2.05 | % | | | 1.90 | % | | | (5.81 | )% | | | 21 | % | | $ | 5,524 | |
| | | | | | | | | | | | | | | | | | | | | | |
| | 1.60 | % | | | 0.80 | % | | | 0.70 | % | | | 6.44 | % | | | 32 | % | | $ | 27 | |
| | | | | | | | | | | | | | | | | | | | | | |
| | 0.80 | % | | | 1.17 | % | | | 1.00 | % | | | 7.66 | % | | | 32 | % | | $ | 14,948 | |
| | 1.03 | % | | | 1.16 | % | | | 0.98 | % | | | 0.11 | % | | | 29 | % | | $ | 23,210 | |
| | 0.92 | % | | | 1.13 | % | | | 0.95 | % | | | 9.93 | % | | | 35 | % | | $ | 55,705 | |
| | 1.08 | % | | | 1.14 | % | | | 0.95 | % | | | 17.49 | % | | | 22 | % | | $ | 53,884 | |
| | 1.48 | % | | | 1.13 | % | | | 0.95 | % | | | 29.09 | % | | | 18 | % | | $ | 70,727 | |
| | 1.54 | % | | | 1.13 | % | | | 0.95 | % | | | (4.90 | )% | | | 21 | % | | $ | 81,999 | |
| | | | | | | | | | | | | | | | | | | | | | |
| | 0.99 | % | | | 0.92 | % | | | 0.80 | % | | | 7.80 | % | | | 32 | % | | $ | 185,902 | |
| | 1.25 | % | | | 0.92 | % | | | 0.77 | % | | | 0.33 | % | | | 29 | % | | $ | 133,632 | |
| | 1.18 | % | | | 0.86 | % | | | 0.70 | % | | | 10.15 | % | | | 35 | % | | $ | 132,768 | |
| | 1.34 | % | | | 0.88 | % | | | 0.70 | % | | | 17.86 | % | | | 22 | % | | $ | 104,758 | |
| | 1.68 | % | | | 0.87 | % | | | 0.70 | % | | | 29.32 | % | | | 18 | % | | $ | 130,015 | |
| | 1.78 | % | | | 0.87 | % | | | 0.70 | % | | | (4.72 | )% | | | 21 | % | | $ | 96,653 | |
The accompanying notes are an integral part of these financial statements.
| | | | |
| 40 | | Wells Fargo Equity Gateway Funds | | Financial highlights |
| | | | | | | | | | | | | | | | | | | | | | | | |
| Diversified Equity Fund | | Beginning
net asset
value per
share | | | Net
investment
income (loss) | | | Net realized
and unrealized
gains (losses)
on investments | | | Distributions
from net
investment
income | | | Distributions
from net
realized gains | | | Ending
net asset
value per
share | |
Class A | | | | | | | | | | | | | | | | | | | | | | | | |
Six months ended November 30, 2016 (unaudited) | | $ | 27.30 | | | | 0.07 | 4 | | | 1.06 | | | | 0.00 | | | | 0.00 | | | $ | 28.43 | |
Year ended May 31, 2016 | | $ | 32.37 | | | | 0.16 | | | | (1.55 | ) | | | (0.08 | ) | | | (3.60 | ) | | $ | 27.30 | |
Year ended May 31, 2015 | | $ | 32.78 | | | | 0.14 | | | | 2.79 | | | | (0.15 | ) | | | (3.19 | ) | | $ | 32.37 | |
Year ended May 31, 2014 | | $ | 30.65 | | | | 0.16 | | | | 5.48 | | | | (0.17 | ) | | | (3.34 | ) | | $ | 32.78 | |
Year ended May 31, 2013 | | $ | 26.08 | | | | 0.23 | 4 | | | 6.14 | | | | (0.24 | ) | | | (1.56 | ) | | $ | 30.65 | |
Year ended May 31, 2012 | | $ | 29.71 | | | | 0.15 | | | | (2.01 | ) | | | (0.18 | ) | | | (1.59 | ) | | $ | 26.08 | |
Class C | | | | | | | | | | | | | | | | | | | | | | | | |
Six months ended November 30, 2016 (unaudited) | | $ | 25.12 | | | | (0.03 | )4 | | | 0.97 | | | | 0.00 | | | | 0.00 | | | $ | 26.06 | |
Year ended May 31, 2016 | | $ | 30.22 | | | | (0.05 | )4 | | | (1.45 | ) | | | 0.00 | | | | (3.60 | ) | | $ | 25.12 | |
Year ended May 31, 2015 | | $ | 30.88 | | | | (0.12 | ) | | | 2.65 | | | | 0.00 | | | | (3.19 | ) | | $ | 30.22 | |
Year ended May 31, 2014 | | $ | 29.13 | | | | (0.08 | )4 | | | 5.18 | | | | (0.01 | ) | | | (3.34 | ) | | $ | 30.88 | |
Year ended May 31, 2013 | | $ | 24.88 | | | | 0.02 | 4 | | | 5.84 | | | | (0.05 | ) | | | (1.56 | ) | | $ | 29.13 | |
Year ended May 31, 2012 | | $ | 28.43 | | | | (0.59 | )4 | | | (1.37 | ) | | | 0.00 | | | | (1.59 | ) | | $ | 24.88 | |
Administrator Class | | | | | | | | | | | | | | | | | | | | | | | | |
Six months ended November 30, 2016 (unaudited) | | $ | 27.38 | | | | 0.11 | 4 | | | 1.06 | | | | 0.00 | | | | 0.00 | | | $ | 28.55 | |
Year ended May 31, 2016 | | $ | 32.45 | | | | 0.24 | | | | (1.55 | ) | | | (0.16 | ) | | | (3.60 | ) | | $ | 27.38 | |
Year ended May 31, 2015 | | $ | 32.84 | | | | 0.22 | 4 | | | 2.81 | | | | (0.23 | ) | | | (3.19 | ) | | $ | 32.45 | |
Year ended May 31, 2014 | | $ | 30.70 | | | | 0.23 | 4 | | | 5.49 | | | | (0.24 | ) | | | (3.34 | ) | | $ | 32.84 | |
Year ended May 31, 2013 | | $ | 26.12 | | | | 0.30 | 4 | | | 6.15 | | | | (0.31 | ) | | | (1.56 | ) | | $ | 30.70 | |
Year ended May 31, 2012 | | $ | 29.78 | | | | 0.33 | | | | (2.13 | ) | | | (0.27 | ) | | | (1.59 | ) | | $ | 26.12 | |
| 1 | Ratios include net expenses allocated from the affiliated Master Portfolios which were as follows: |
| | | | | | | | | | | | | | | | | | | | | | | | |
| | | Six months ended November 30, 2016 (unaudited) | | | Year ended May 31 | |
| | | | 2016 | | | 2015 | | | 2014 | | | 2013 | | | 2012 | |
Class A | | | 0.58 | % | | | 0.59 | % | | | 0.59 | % | | | 0.58 | % | | | 0.57 | % | | | 0.56 | % |
Class C | | | 0.58 | | | | 0.59 | | | | 0.59 | | | | 0.58 | | | | 0.57 | | | | 0.56 | |
Administrator Class | | | 0.58 | | | | 0.59 | | | | 0.59 | | | | 0.58 | | | | 0.57 | | | | 0.56 | |
| 2 | Total return calculations do not include any sales charges. Returns for periods of less than one year are not annualized. |
| 3 | Portfolio turnover rate is calculated by aggregating the results of multiplying the Fund’s investment percentage in each respective affiliated Master Portfolio by the corresponding affiliated Master Portfolio’s portfolio turnover rate. |
| 4 | Calculated based upon average shares outstanding |
The accompanying notes are an integral part of these financial statements.
| | | | | | |
| Financial highlights | | Wells Fargo Equity Gateway Funds | | | 41 | |
| | | | | | | | | | | | | | | | | | | | | | |
| Ratio to average net assets (annualized) | | | Total
return2 | | | Portfolio
turnover
rate3 | | | Net assets at
end of period
(000s omitted) | |
Net investment
income (loss) | | | Gross
expenses1 | | | Net
expenses1 | | | | |
| | | | | | | | | | | | | | | | | | | | | | |
| | 0.53 | % | | | 1.42 | % | | | 1.25 | % | | | 4.14 | % | | | 29 | % | | $ | 65,765 | |
| | 0.60 | % | | | 1.41 | % | | | 1.25 | % | | | (4.24 | )% | | | 39 | % | | $ | 67,597 | |
| | 0.44 | % | | | 1.44 | % | | | 1.25 | % | | | 9.39 | % | | | 38 | % | | $ | 81,502 | |
| | 0.48 | % | | | 1.43 | % | | | 1.25 | % | | | 19.10 | % | | | 37 | % | | $ | 82,186 | |
| | 0.81 | % | | | 1.43 | % | | | 1.25 | % | | | 25.42 | % | | | 44 | % | | $ | 75,640 | |
| | 0.74 | % | | | 1.41 | % | | | 1.25 | % | | | (5.91 | )% | | | 57 | % | | $ | 75,751 | |
| | | | | | | | | | | | | | | | | | | | | | |
| | (0.23 | )% | | | 2.17 | % | | | 2.00 | % | | | 3.74 | % | | | 29 | % | | $ | 2,474 | |
| | (0.17 | )% | | | 2.16 | % | | | 2.00 | % | | | (4.96 | )% | | | 39 | % | | $ | 2,846 | |
| | (0.31 | )% | | | 2.19 | % | | | 2.00 | % | | | 8.58 | % | | | 38 | % | | $ | 4,165 | |
| | (0.25 | )% | | | 2.19 | % | | | 2.00 | % | | | 18.23 | % | | | 37 | % | | $ | 4,292 | |
| | 0.07 | % | | | 2.18 | % | | | 2.00 | % | | | 24.50 | % | | | 44 | % | | $ | 2,667 | |
| | (0.02 | )% | | | 2.16 | % | | | 2.00 | % | | | (6.62 | )% | | | 57 | % | | $ | 2,499 | |
| | | | | | | | | | | | | | | | | | | | | | |
| | 0.78 | % | | | 1.34 | % | | | 1.00 | % | | | 4.27 | % | | | 29 | % | | $ | 129,011 | |
| | 0.85 | % | | | 1.33 | % | | | 1.00 | % | | | (3.98 | )% | | | 39 | % | | $ | 140,963 | |
| | 0.67 | % | | | 1.28 | % | | | 1.00 | % | | | 9.65 | % | | | 38 | % | | $ | 167,371 | |
| | 0.71 | % | | | 1.27 | % | | | 1.00 | % | | | 19.40 | % | | | 37 | % | | $ | 225,584 | |
| | 1.06 | % | | | 1.27 | % | | | 1.00 | % | | | 25.75 | % | | | 44 | % | | $ | 290,011 | |
| | 0.99 | % | | | 1.25 | % | | | 1.00 | % | | | (5.67 | )% | | | 57 | % | | $ | 293,895 | |
The accompanying notes are an integral part of these financial statements.
| | | | |
| 42 | | Wells Fargo Equity Gateway Funds | | Financial highlights |
| | | | | | | | | | | | | | | | | | | | |
| Emerging Growth Fund | | Beginning
net asset
value per
share | | | Net
investment Income (loss) | | | Net realized
and unrealized
gains (losses)
on investments | | | Distributions
from net
realized gains | | | Ending
net asset
value per
share | |
Class A | | | | | | | | | | | | | | | | | | | | |
Six months ended November 30, 2016 (unaudited) | | $ | 12.55 | | | | (0.05 | ) | | | 1.80 | | | | 0.00 | | | $ | 14.30 | |
Year ended May 31, 2016 | | $ | 16.70 | | | | (0.13 | )4 | | | (2.28 | ) | | | (1.74 | ) | | $ | 12.55 | |
Year ended May 31, 2015 | | $ | 14.61 | | | | (0.22 | ) | | | 3.51 | | | | (1.20 | ) | | $ | 16.70 | |
Year ended May 31, 2014 | | $ | 14.10 | | | | (0.19 | ) | | | 1.88 | | | | (1.18 | ) | | $ | 14.61 | |
Year ended May 31, 2013 | | $ | 12.44 | | | | (0.15 | ) | | | 2.49 | | | | (0.68 | ) | | $ | 14.10 | |
Year ended May 31, 2012 | | $ | 13.12 | | | | (0.14 | )4 | | | (0.54 | ) | | | 0.00 | | | $ | 12.44 | |
Class C | | | | | | | | | | | | | | | | | | | | |
Six months ended November 30, 2016 (unaudited) | | $ | 11.58 | | | | (0.07 | )4 | | | 1.64 | | | | 0.00 | | | $ | 13.15 | |
Year ended May 31, 2016 | | $ | 15.67 | | | | (0.21 | ) | | | (2.14 | ) | | | (1.74 | ) | | $ | 11.58 | |
Year ended May 31, 2015 | | $ | 13.88 | | | | (0.33 | ) | | | 3.32 | | | | (1.20 | ) | | $ | 15.67 | |
Year ended May 31, 2014 | | $ | 13.55 | | | | (0.32 | ) | | | 1.83 | | | | (1.18 | ) | | $ | 13.88 | |
Year ended May 31, 2013 | | $ | 12.06 | | | | (0.27 | ) | | | 2.44 | | | | (0.68 | ) | | $ | 13.55 | |
Year ended May 31, 2012 | | $ | 12.81 | | | | (0.23 | )4 | | | (0.52 | ) | | | 0.00 | | | $ | 12.06 | |
Administrator Class | | | | | | | | | | | | | | | | | | | | |
Six months ended November 30, 2016 (unaudited) | | $ | 12.82 | | | | (0.01 | )4 | | | 1.81 | | | | 0.00 | | | $ | 14.62 | |
Year ended May 31, 2016 | | $ | 17.00 | | | | (0.12 | )4 | | | (2.32 | ) | | | (1.74 | ) | | $ | 12.82 | |
Year ended May 31, 2015 | | $ | 14.83 | | | | (0.16 | )4 | | | 3.53 | | | | (1.20 | ) | | $ | 17.00 | |
Year ended May 31, 2014 | | $ | 14.28 | | | | (0.17 | )4 | | | 1.90 | | | | (1.18 | ) | | $ | 14.83 | |
Year ended May 31, 2013 | | $ | 12.56 | | | | (0.12 | ) | | | 2.52 | | | | (0.68 | ) | | $ | 14.28 | |
Year ended May 31, 2012 | | $ | 13.22 | | | | (0.12 | )4 | | | (0.54 | ) | | | 0.00 | | | $ | 12.56 | |
Institutional Class | | | | | | | | | | | | | | | | | | | | |
Six months ended November 30, 2016 (unaudited) | | $ | 13.20 | | | | 0.03 | | | | 1.85 | | | | 0.00 | | | $ | 15.08 | |
Year ended May 31, 2016 | | $ | 17.40 | | | | (0.07 | ) | | | (2.39 | ) | | | (1.74 | ) | | $ | 13.20 | |
Year ended May 31, 2015 | | $ | 15.11 | | | | (0.12 | ) | | | 3.61 | | | | (1.20 | ) | | $ | 17.40 | |
Year ended May 31, 2014 | | $ | 14.49 | | | | (0.11 | ) | | | 1.91 | | | | (1.18 | ) | | $ | 15.11 | |
Year ended May 31, 2013 | | $ | 12.70 | | | | (0.08 | ) | | | 2.55 | | | | (0.68 | ) | | $ | 14.49 | |
Year ended May 31, 2012 | | $ | 13.33 | | | | (0.08 | )4 | | | (0.55 | ) | | | 0.00 | | | $ | 12.70 | |
| 1 | Ratios include net expenses allocated from the affiliated Master Portfolio. |
| 2 | Total return calculations do not include any sales charges. Returns for periods of less than one year are not annualized. |
| 3 | Portfolio turnover rate is calculated by multiplying the Fund’s investment percentage in the affiliated Master Portfolio by the affiliated Master Portfolio’s portfolio turnover rate. |
| 4 | Calculated based upon average shares outstanding |
The accompanying notes are an integral part of these financial statements.
| | | | | | |
| Financial highlights | | Wells Fargo Equity Gateway Funds | | | 43 | |
| | | | | | | | | | | | | | | | | | | | | | |
| Ratio to average net assets (annualized) | | | Total
return2 | | | Portfolio
turnover
rate3 | | | Net assets at
end of period
(000s omitted) | |
Net investment
income (loss) | | | Gross
expenses1 | | | Net
expenses1 | | | | |
| | | | | | | | | | | | | | | | | | | | | | |
| | (0.37 | )% | | | 1.36 | % | | | 1.35 | % | | | 13.86 | % | | | 50 | % | | $ | 130,403 | |
| | (0.92 | )% | | | 1.35 | % | | | 1.35 | % | | | (14.94 | )% | | | 68 | % | | $ | 127,154 | |
| | (1.20 | )% | | | 1.39 | % | | | 1.37 | % | | | 23.32 | % | | | 56 | % | | $ | 131,638 | |
| | (1.20 | )% | | | 1.39 | % | | | 1.37 | % | | | 11.30 | % | | | 63 | % | | $ | 130,403 | |
| | (1.04 | )% | | | 1.40 | % | | | 1.37 | % | | | 19.89 | % | | | 65 | % | | $ | 125,070 | |
| | (1.13 | )% | | | 1.41 | % | | | 1.37 | % | | | (5.18 | )% | | | 75 | % | | $ | 125,113 | |
| | | | | | | | | | | | | | | | | | | | | | |
| | (1.13 | )% | | | 2.10 | % | | | 2.10 | % | | | 13.56 | % | | | 50 | % | | $ | 3,623 | |
| | (1.70 | )% | | | 2.10 | % | | | 2.10 | % | | | (15.59 | )% | | | 68 | % | | $ | 3,815 | |
| | (1.95 | )% | | | 2.14 | % | | | 2.12 | % | | | 22.35 | % | | | 56 | % | | $ | 5,101 | |
| | (1.95 | )% | | | 2.14 | % | | | 2.12 | % | | | 10.40 | % | | | 63 | % | | $ | 4,816 | |
| | (1.79 | )% | | | 2.15 | % | | | 2.12 | % | | | 19.09 | % | | | 65 | % | | $ | 4,878 | |
| | (1.89 | )% | | | 2.17 | % | | | 2.12 | % | | | (5.85 | )% | | | 75 | % | | $ | 5,114 | |
| | | | | | | | | | | | | | | | | | | | | | |
| | (0.15 | )% | | | 1.25 | % | | | 1.20 | % | | | 13.96 | % | | | 50 | % | | $ | 62,241 | |
| | (0.80 | )% | | | 1.23 | % | | | 1.20 | % | | | (14.80 | )% | | | 68 | % | | $ | 99,792 | |
| | (1.03 | )% | | | 1.21 | % | | | 1.20 | % | | | 23.45 | % | | | 56 | % | | $ | 159,813 | |
| | (1.03 | )% | | | 1.22 | % | | | 1.20 | % | | | 11.45 | % | | | 63 | % | | $ | 190,126 | |
| | (0.87 | )% | | | 1.23 | % | | | 1.20 | % | | | 20.19 | % | | | 65 | % | | $ | 200,140 | |
| | (0.95 | )% | | | 1.22 | % | | | 1.19 | % | | | (4.99 | )% | | | 75 | % | | $ | 185,744 | |
| | | | | | | | | | | | | | | | | | | | | | |
| | 0.12 | % | | | 1.02 | % | | | 0.90 | % | | | 14.24 | % | | | 50 | % | | $ | 528,322 | |
| | (0.50 | )% | | | 1.01 | % | | | 0.90 | % | | | (14.62 | )% | | | 68 | % | | $ | 583,843 | |
| | (0.73 | )% | | | 0.96 | % | | | 0.90 | % | | | 23.89 | % | | | 56 | % | | $ | 723,946 | |
| | (0.73 | )% | | | 0.96 | % | | | 0.90 | % | | | 11.77 | % | | | 63 | % | | $ | 650,650 | |
| | (0.57 | )% | | | 0.97 | % | | | 0.90 | % | | | 20.52 | % | | | 65 | % | | $ | 578,841 | |
| | (0.67 | )% | | | 0.98 | % | | | 0.90 | % | | | (4.73 | )% | | | 75 | % | | $ | 526,865 | |
The accompanying notes are an integral part of these financial statements.
| | | | |
| 44 | | Wells Fargo Equity Gateway Funds | | Financial highlights |
| | | | | | | | | | | | | | | | | | | | | | | | |
| Index Fund | | Beginning
net asset
value per
share | | | Net
investment
income | | | Net realized
and unrealized
gains (losses)
on investments | | | Distributions
from net
investment
income | | | Distributions
from net
realized gains | | | Ending
net asset
value per
share | |
Class A | | | | | | | | | | | | | | | | | | | | | | | | |
Six months ended November 30, 2016 (unaudited) | | $ | 62.85 | | | | 0.60 | | | | 3.02 | | | | 0.00 | | | | 0.00 | | | $ | 66.47 | |
Year ended May 31, 2016 | | $ | 67.32 | | | | 0.81 | | | | (0.17 | ) | | | (1.08 | ) | | | (4.03 | ) | | $ | 62.85 | |
Year ended May 31, 2015 | | $ | 62.14 | | | | 1.00 | | | | 5.91 | | | | (0.96 | ) | | | (0.77 | ) | | $ | 67.32 | |
Year ended May 31, 2014 | | $ | 54.00 | | | | 0.90 | | | | 9.59 | | | | (0.85 | ) | | | (1.50 | ) | | $ | 62.14 | |
Year ended May 31, 2013 | | $ | 44.25 | | | | 0.86 | | | | 10.66 | | | | (0.83 | ) | | | (0.94 | ) | | $ | 54.00 | |
Year ended May 31, 2012 | | $ | 47.17 | | | | 0.73 | | | | (1.35 | ) | | | (0.65 | ) | | | (1.65 | ) | | $ | 44.25 | |
Class B | | | | | | | | | | | | | | | | | | | | | | | | |
Six months ended November 30, 2016 (unaudited) | | $ | 64.31 | | | | 0.33 | 4 | | | 3.12 | | | | 0.00 | | | | 0.00 | | | $ | 67.76 | |
Year ended May 31, 2016 | | $ | 68.44 | | | | 0.61 | 4 | | | (0.42 | ) | | | (0.29 | ) | | | (4.03 | ) | | $ | 64.31 | |
Year ended May 31, 2015 | | $ | 62.99 | | | | 0.49 | 4 | | | 6.02 | | | | (0.29 | ) | | | (0.77 | ) | | $ | 68.44 | |
Year ended May 31, 2014 | | $ | 54.57 | | | | 0.45 | 4 | | | 9.70 | | | | (0.23 | ) | | | (1.50 | ) | | $ | 62.99 | |
Year ended May 31, 2013 | | $ | 44.53 | | | | 0.47 | 4 | | | 10.78 | | | | (0.27 | ) | | | (0.94 | ) | | $ | 54.57 | |
Year ended May 31, 2012 | | $ | 47.23 | | | | 0.38 | 4 | | �� | (1.29 | ) | | | (0.14 | ) | | | (1.65 | ) | | $ | 44.53 | |
Class C | | | | | | | | | | | | | | | | | | | | | | | | |
Six months ended November 30, 2016 (unaudited) | | $ | 63.12 | | | | 0.34 | | | | 3.05 | | | | 0.00 | | | | 0.00 | | | $ | 66.51 | |
Year ended May 31, 2016 | | $ | 67.55 | | | | 0.62 | 4 | | | (0.45 | ) | | | (0.57 | ) | | | (4.03 | ) | | $ | 63.12 | |
Year ended May 31, 2015 | | $ | 62.37 | | | | 0.50 | | | | 5.94 | | | | (0.49 | ) | | | (0.77 | ) | | $ | 67.55 | |
Year ended May 31, 2014 | | $ | 54.22 | | | | 0.47 | | | | 9.62 | | | | (0.44 | ) | | | (1.50 | ) | | $ | 62.37 | |
Year ended May 31, 2013 | | $ | 44.41 | | | | 0.48 | 4 | | | 10.71 | | | | (0.44 | ) | | | (0.94 | ) | | $ | 54.22 | |
Year ended May 31, 2012 | | $ | 47.27 | | | | 0.39 | 4 | | | (1.31 | ) | | | (0.29 | ) | | | (1.65 | ) | | $ | 44.41 | |
Administrator Class | | | | | | | | | | | | | | | | | | | | | | | | |
Six months ended November 30, 2016 (unaudited) | | $ | 63.33 | | | | 0.82 | | | | 2.90 | | | | 0.00 | | | | 0.00 | | | $ | 67.05 | |
Year ended May 31, 2016 | | $ | 67.80 | | | | 1.31 | | | | (0.51 | ) | | | (1.24 | ) | | | (4.03 | ) | | $ | 63.33 | |
Year ended May 31, 2015 | | $ | 62.56 | | | | 1.27 | | | | 5.90 | | | | (1.16 | ) | | | (0.77 | ) | | $ | 67.80 | |
Year ended May 31, 2014 | | $ | 54.34 | | | | 1.08 | | | | 9.66 | | | | (1.02 | ) | | | (1.50 | ) | | $ | 62.56 | |
Year ended May 31, 2013 | | $ | 44.52 | | | | 1.02 | | | | 10.71 | | | | (0.97 | ) | | | (0.94 | ) | | $ | 54.34 | |
Year ended May 31, 2012 | | $ | 47.45 | | | | 0.83 | | | | (1.32 | ) | | | (0.79 | ) | | | (1.65 | ) | | $ | 44.52 | |
| 1 | Ratios include net expenses allocated from the affiliated Master Portfolio. |
| 2 | Total return calculations do not include any sales charges. Returns for periods of less than one year are not annualized. |
| 3 | Portfolio turnover rate is calculated by multiplying the Fund’s investment percentage in the affiliated Master Portfolio by the affiliated Master Portfolio’s portfolio turnover rate. |
| 4 | Calculated based upon average shares outstanding |
The accompanying notes are an integral part of these financial statements.
| | | | | | |
| Financial highlights | | Wells Fargo Equity Gateway Funds | | | 45 | |
| | | | | | | | | | | | | | | | | | | | | | |
| Ratio to average net assets (annualized) | | | Total
return2 | | | Portfolio
turnover
rate3 | | | Net assets at
end of period
(000s omitted) | |
Net investment
income | | | Gross
expenses1 | | | Net
expenses1 | | | | |
| | | | | | | | | | | | | | | | | | | | | | |
| | 1.80 | % | | | 0.62 | % | | | 0.45 | % | | | 5.76 | % | | | 5 | % | | $ | 646,386 | |
| | 1.78 | % | | | 0.63 | % | | | 0.48 | % | | | 1.24 | % | | | 4 | % | | $ | 639,496 | |
| | 1.50 | % | | | 0.68 | % | | | 0.56 | % | | | 11.21 | % | | | 4 | % | | $ | 445,088 | |
| | 1.53 | % | | | 0.67 | % | | | 0.56 | % | | | 19.77 | % | | | 5 | % | | $ | 432,448 | |
| | 1.72 | % | | | 0.67 | % | | | 0.56 | % | | | 26.63 | % | | | 4 | % | | $ | 407,533 | |
| | 1.63 | % | | | 0.68 | % | | | 0.56 | % | | | (0.95 | )% | | | 9 | % | | $ | 347,412 | |
| | | | | | | | | | | | | | | | | | | | | | |
| | 0.99 | % | | | 1.37 | % | | | 1.20 | % | | | 5.36 | % | | | 5 | % | | $ | 612 | |
| | 0.95 | % | | | 1.39 | % | | | 1.25 | % | | | 0.48 | % | | | 4 | % | | $ | 1,071 | |
| | 0.74 | % | | | 1.43 | % | | | 1.31 | % | | | 10.39 | % | | | 4 | % | | $ | 2,098 | |
| | 0.77 | % | | | 1.42 | % | | | 1.31 | % | | | 18.86 | % | | | 5 | % | | $ | 3,412 | |
| | 0.95 | % | | | 1.42 | % | | | 1.31 | % | | | 25.66 | % | | | 4 | % | | $ | 5,453 | |
| | 0.85 | % | | | 1.43 | % | | | 1.31 | % | | | (1.68 | )% | | | 9 | % | | $ | 8,869 | |
| | | | | | | | | | | | | | | | | | | | | | |
| | 1.05 | % | | | 1.37 | % | | | 1.20 | % | | | 5.37 | % | | | 5 | % | | $ | 84,219 | |
| | 0.99 | % | | | 1.38 | % | | | 1.24 | % | | | 0.48 | % | | | 4 | % | | $ | 79,858 | |
| | 0.75 | % | | | 1.43 | % | | | 1.31 | % | | | 10.38 | % | | | 4 | % | | $ | 83,718 | |
| | 0.78 | % | | | 1.42 | % | | | 1.31 | % | | | 18.89 | % | | | 5 | % | | $ | 78,118 | |
| | 0.97 | % | | | 1.42 | % | | | 1.31 | % | | | 25.67 | % | | | 4 | % | | $ | 70,322 | |
| | 0.87 | % | | | 1.43 | % | | | 1.31 | % | | | (1.67 | )% | | | 9 | % | | $ | 65,245 | |
| | | | | | | | | | | | | | | | | | | | | | |
| | 1.99 | % | | | 0.39 | % | | | 0.25 | % | | | 5.87 | % | | | 5 | % | | $ | 1,350,238 | |
| | 1.97 | % | | | 0.40 | % | | | 0.25 | % | | | 1.49 | % | | | 4 | % | | $ | 1,502,276 | |
| | 1.81 | % | | | 0.37 | % | | | 0.25 | % | | | 11.56 | % | | | 4 | % | | $ | 1,832,814 | |
| | 1.84 | % | | | 0.36 | % | | | 0.25 | % | | | 20.13 | % | | | 5 | % | | $ | 1,984,845 | |
| | 2.03 | % | | | 0.36 | % | | | 0.25 | % | | | 27.02 | % | | | 4 | % | | $ | 1,832,524 | |
| | 1.94 | % | | | 0.37 | % | | | 0.25 | % | | | (0.63 | )% | | | 9 | % | | $ | 1,682,905 | |
The accompanying notes are an integral part of these financial statements.
| | | | |
| 46 | | Wells Fargo Equity Gateway Funds | | Financial highlights |
| | | | | | | | | | | | | | | | | | | | |
| International Value Fund | | Beginning
net asset
value per
share | | | Net
investment
income | | | Net realized
and unrealized
gains (losses)
on investments | | | Distributions
from net
investment
income | | | Ending
net asset
value per
share | |
Class A | | | | | | | | | | | | | | | | | | | | |
Six months ended November 30, 2016 (unaudited) | | $ | 12.83 | | | | 0.04 | 4 | | | 0.12 | | | | 0.00 | | | $ | 12.99 | |
Year ended May 31, 2016 | | $ | 14.85 | | | | 0.26 | | | | (2.08 | ) | | | (0.20 | ) | | $ | 12.83 | |
Year ended May 31, 2015 | | $ | 15.45 | | | | 0.26 | 4 | | | (0.53 | ) | | | (0.33 | ) | | $ | 14.85 | |
Year ended May 31, 2014 | | $ | 13.40 | | | | 0.36 | | | | 1.97 | | | | (0.28 | ) | | $ | 15.45 | |
Year ended May 31, 2013 | | $ | 10.64 | | | | 0.31 | | | | 2.71 | | | | (0.26 | ) | | $ | 13.40 | |
Year ended May 31, 2012 | | $ | 14.03 | | | | 0.34 | | | | (3.36 | ) | | | (0.37 | ) | | $ | 10.64 | |
Class C | | | | | | | | | | | | | | | | | | | | |
Six months ended November 30, 2016 (unaudited) | | $ | 12.56 | | | | 0.05 | 4 | | | 0.06 | | | | 0.00 | | | $ | 12.67 | |
Year ended May 31, 2016 | | $ | 14.54 | | | | 0.17 | | | | (2.05 | ) | | | (0.10 | ) | | $ | 12.56 | |
Year ended May 31, 2015 | | $ | 15.16 | | | | 0.13 | | | | (0.51 | ) | | | (0.24 | ) | | $ | 14.54 | |
Year ended May 31, 2014 | | $ | 13.18 | | | | 0.19 | | | | 2.00 | | | | (0.21 | ) | | $ | 15.16 | |
Year ended May 31, 2013 | | $ | 10.47 | | | | 0.19 | | | | 2.70 | | | | (0.18 | ) | | $ | 13.18 | |
Year ended May 31, 2012 | | $ | 13.79 | | | | 0.23 | 4 | | | (3.28 | ) | | | (0.27 | ) | | $ | 10.47 | |
Administrator Class | | | | | | | | | | | | | | | | | | | | |
Six months ended November 30, 2016 (unaudited) | | $ | 12.91 | | | | 0.10 | 4 | | | 0.06 | | | | 0.00 | | | $ | 13.07 | |
Year ended May 31, 2016 | | $ | 14.73 | | | | 0.14 | 4 | | | (1.96 | ) | | | 0.00 | | | $ | 12.91 | |
Year ended May 31, 2015 | | $ | 15.35 | | | | 0.28 | | | | (0.52 | ) | | | (0.38 | ) | | $ | 14.73 | |
Year ended May 31, 2014 | | $ | 13.31 | | | | 0.38 | | | | 1.98 | | | | (0.32 | ) | | $ | 15.35 | |
Year ended May 31, 2013 | | $ | 10.57 | | | | 0.33 | 4 | | | 2.70 | | | | (0.29 | ) | | $ | 13.31 | |
Year ended May 31, 2012 | | $ | 13.95 | | | | 0.35 | | | | (3.33 | ) | | | (0.40 | ) | | $ | 10.57 | |
Institutional Class | | | | | | | | | | | | | | | | | | | | |
Six months ended November 30, 2016 (unaudited) | | $ | 12.73 | | | | 0.12 | | | | 0.07 | | | | 0.00 | | | $ | 12.92 | |
Year ended May 31, 2016 | | $ | 14.75 | | | | 0.36 | | | | (2.12 | ) | | | (0.26 | ) | | $ | 12.73 | |
Year ended May 31, 2015 | | $ | 15.38 | | | | 0.29 | | | | (0.51 | ) | | | (0.41 | ) | | $ | 14.75 | |
Year ended May 31, 2014 | | $ | 13.34 | | | | 0.41 | | | | 1.98 | | | | (0.35 | ) | | $ | 15.38 | |
Year ended May 31, 2013 | | $ | 10.58 | | | | 0.35 | | | | 2.73 | | | | (0.32 | ) | | $ | 13.34 | |
Year ended May 31, 2012 | | $ | 13.98 | | | | 0.36 | | | | (3.33 | ) | | | (0.43 | ) | | $ | 10.58 | |
| 1 | Ratios include net expenses allocated from the affiliated Master Portfolio. |
| 2 | Total return calculations do not include any sales charges. Returns for periods of less than one year are not annualized. |
| 3 | Portfolio turnover rate is calculated by multiplying the Fund’s investment percentage in the affiliated Master Portfolio by the affiliated Master Portfolio’s portfolio turnover rate. |
| 4 | Calculated based upon average shares outstanding |
The accompanying notes are an integral part of these financial statements.
| | | | | | |
| Financial highlights | | Wells Fargo Equity Gateway Funds | | | 47 | |
| | | | | | | | | | | | | | | | | | | | | | |
| Ratio to average net assets (annualized) | | | Total
return2 | | | Portfolio
turnover
rate3 | | | Net assets at
end of period
(000s omitted) | |
Net investment
income | | | Gross
expenses1 | | | Net
expenses1 | | | | |
| | | | | | | | | | | | | | | | | | | | | | |
| | 0.63 | % | | | 1.41 | % | | | 1.35 | % | | | 1.25 | % | | | 15 | % | | $ | 49,283 | |
| | 1.98 | % | | | 1.46 | % | | | 1.39 | % | | | (12.31 | )% | | | 14 | % | | $ | 4,981 | |
| | 1.80 | % | | | 1.50 | % | | | 1.49 | % | | | (1.55 | )% | | | 18 | % | | $ | 5,768 | |
| | 2.45 | % | | | 1.51 | % | | | 1.50 | % | | | 17.48 | % | | | 11 | % | | $ | 6,725 | |
| | 2.35 | % | | | 1.51 | % | | | 1.50 | % | | | 28.58 | % | | | 16 | % | | $ | 5,922 | |
| | 2.81 | % | | | 1.46 | % | | | 1.46 | % | | | (21.53 | )% | | | 9 | % | | $ | 4,742 | |
| | | | | | | | | | | | | | | | | | | | | | |
| | 0.73 | % | | | 2.19 | % | | | 2.10 | % | | | 0.88 | % | | | 15 | % | | $ | 720 | |
| | 1.25 | % | | | 2.21 | % | | | 2.14 | % | | | (12.95 | )% | | | 14 | % | | $ | 783 | |
| | 1.07 | % | | | 2.25 | % | | | 2.24 | % | | | (2.37 | )% | | | 18 | % | | $ | 920 | |
| | 1.88 | % | | | 2.26 | % | | | 2.25 | % | | | 16.64 | % | | | 11 | % | | $ | 920 | |
| | 1.67 | % | | | 2.26 | % | | | 2.25 | % | | | 27.67 | % | | | 16 | % | | $ | 595 | |
| | 1.96 | % | | | 2.21 | % | | | 2.21 | % | | | (22.14 | )% | | | 9 | % | | $ | 441 | |
| | | | | | | | | | | | | | | | | | | | | | |
| | 1.61 | % | | | 1.36 | % | | | 1.25 | % | | | 1.24 | % | | | 15 | % | | $ | 4,875 | |
| | 0.99 | % | | | 1.36 | % | | | 1.25 | % | | | (12.36 | )% | | | 14 | % | | $ | 11,873 | |
| | 2.12 | % | | | 1.34 | % | | | 1.25 | % | | | (1.35 | )% | | | 18 | % | | $ | 487,582 | |
| | 2.76 | % | | | 1.34 | % | | | 1.25 | % | | | 17.81 | % | | | 11 | % | | $ | 459,415 | |
| | 2.67 | % | | | 1.34 | % | | | 1.25 | % | | | 28.90 | % | | | 16 | % | | $ | 372,187 | |
| | 3.04 | % | | | 1.29 | % | | | 1.25 | % | | | (21.37 | )% | | | 9 | % | | $ | 259,969 | |
| | | | | | | | | | | | | | | | | | | | | | |
| | 1.81 | % | | | 1.11 | % | | | 1.00 | % | | | 1.49 | % | | | 15 | % | | $ | 455,433 | |
| | 2.81 | % | | | 1.13 | % | | | 1.01 | % | | | (11.98 | )% | | | 14 | % | | $ | 456,239 | |
| | 2.42 | % | | | 1.07 | % | | | 1.05 | % | | | (1.19 | )% | | | 18 | % | | $ | 3,793 | |
| | 2.91 | % | | | 1.08 | % | | | 1.05 | % | | | 18.07 | % | | | 11 | % | | $ | 2,359 | |
| | 2.81 | % | | | 1.08 | % | | | 1.05 | % | | | 29.20 | % | | | 16 | % | | $ | 1,941 | |
| | 3.20 | % | | | 1.03 | % | | | 1.03 | % | | | (21.26 | )% | | | 9 | % | | $ | 1,505 | |
The accompanying notes are an integral part of these financial statements.
| | | | |
| 48 | | Wells Fargo Equity Gateway Funds | | Financial highlights |
| | | | | | | | | | | | | | | | | | | | | | | | |
| Small Company Growth Fund | | Beginning
net asset
value per
share | | | Net
investment
loss | | | Net realized
and unrealized
gains (losses)
on investments | | | Distributions
from net
investment
income | | | Distributions
from net
realized gains | | | Ending
net asset
value per
share | |
Class A | | | | | | | | | | | | | | | | | | | | | | | | |
Six months ended November 30, 2016 (unaudited) | | $ | 37.69 | | | | (0.13 | )4 | | | 4.20 | | | | 0.00 | | | | 0.00 | | | $ | 41.76 | |
Year ended May 31, 2016 | | $ | 44.23 | | | | (0.22 | )4 | | | (6.05 | ) | | | 0.00 | | | | (0.27 | ) | | $ | 37.69 | |
Year ended May 31, 2015 | | $ | 39.44 | | | | (0.37 | )4 | | | 7.08 | | | | 0.00 | | | | (1.92 | ) | | $ | 44.23 | |
Year ended May 31, 2014 | | $ | 34.23 | | | | (0.37 | )4 | | | 7.98 | | | | 0.00 | | | | (2.40 | ) | | $ | 39.44 | |
Year ended May 31, 2013 | | $ | 26.21 | | | | (0.15 | ) | | | 8.17 | | | | 0.00 | | | | 0.00 | | | $ | 34.23 | |
Year ended May 31, 2012 | | $ | 29.53 | | | | (0.18 | )4 | | | (3.14 | ) | | | 0.00 | | | | 0.00 | | | $ | 26.21 | |
Class B | | | | | | | | | | | | | | | | | | | | | | | | |
Six months ended November 30, 2016 (unaudited) | | $ | 33.59 | | | | (0.25 | )4 | | | 3.74 | | | | 0.00 | | | | 0.00 | | | $ | 37.08 | |
Year ended May 31, 2016 | | $ | 39.74 | | | | (0.50 | )4 | | | (5.38 | ) | | | 0.00 | | | | (0.27 | ) | | $ | 33.59 | |
Year ended May 31, 2015 | | $ | 35.88 | | | | (0.62 | )4 | | | 6.40 | | | | 0.00 | | | | (1.92 | ) | | $ | 39.74 | |
Year ended May 31, 2014 | | $ | 31.55 | | | | (0.60 | )4 | | | 7.33 | | | | 0.00 | | | | (2.40 | ) | | $ | 35.88 | |
Year ended May 31, 2013 | | $ | 24.35 | | | | (0.36 | )4 | | | 7.56 | | | | 0.00 | | | | 0.00 | | | $ | 31.55 | |
Year ended May 31, 2012 | | $ | 27.63 | | | | (0.37 | )4 | | | (2.91 | ) | | | 0.00 | | | | 0.00 | | | $ | 24.35 | |
Class C | | | | | | | | | | | | | | | | | | | | | | | | |
Six months ended November 30, 2016 (unaudited) | | $ | 34.02 | | | | (0.25 | )4 | | | 3.78 | | | | 0.00 | | | | 0.00 | | | $ | 37.55 | |
Year ended May 31, 2016 | | $ | 40.25 | | | | (0.46 | )4 | | | (5.50 | ) | | | 0.00 | | | | (0.27 | ) | | $ | 34.02 | |
Year ended May 31, 2015 | | $ | 36.32 | | | | (0.63 | )4 | | | 6.48 | | | | 0.00 | | | | (1.92 | ) | | $ | 40.25 | |
Year ended May 31, 2014 | | $ | 31.91 | | | | (0.62 | )4 | | | 7.43 | | | | 0.00 | | | | (2.40 | ) | | $ | 36.32 | |
Year ended May 31, 2013 | | $ | 24.62 | | | | (0.37 | )4 | | | 7.66 | | | | 0.00 | | | | 0.00 | | | $ | 31.91 | |
Year ended May 31, 2012 | | $ | 27.95 | | | | (0.36 | )4 | | | (2.97 | ) | | | 0.00 | | | | 0.00 | | | $ | 24.62 | |
Class R6 | | | | | | | | | | | | | | | | | | | | | | | | |
Six months ended November 30, 2016 (unaudited) | | $ | 39.77 | | | | (0.05 | ) | | | 4.44 | | | | 0.00 | | | | 0.00 | | | $ | 44.16 | |
Year ended May 31, 2016 | | $ | 46.45 | | | | (0.03 | ) | | | (6.38 | ) | | | 0.00 | | | | (0.27 | ) | | $ | 39.77 | |
Year ended May 31, 20155 | | $ | 42.98 | | | | (0.09 | )4 | | | 5.48 | | | | 0.00 | | | | (1.92 | ) | | $ | 46.45 | |
Administrator Class | | | | | | | | | | | | | | | | | | | | | | | | |
Six months ended November 30, 2016 (unaudited) | | $ | 39.05 | | | | (0.10 | )4 | | | 4.34 | | | | 0.00 | | | | 0.00 | | | $ | 43.29 | |
Year ended May 31, 2016 | | $ | 45.73 | | | | (0.19 | )4 | | | (6.22 | ) | | | 0.00 | | | | (0.27 | ) | | $ | 39.05 | |
Year ended May 31, 2015 | | $ | 40.64 | | | | (0.30 | )4 | | | 7.31 | | | | 0.00 | | | | (1.92 | ) | | $ | 45.73 | |
Year ended May 31, 2014 | | $ | 35.13 | | | | (0.26 | ) | | | 8.17 | | | | 0.00 | | | | (2.40 | ) | | $ | 40.64 | |
Year ended May 31, 2013 | | $ | 26.90 | | | | (0.09 | )4 | | | 8.38 | | | | (0.06 | ) | | | 0.00 | | | $ | 35.13 | |
Year ended May 31, 2012 | | $ | 30.22 | | | | (0.13 | )4 | | | (3.19 | ) | | | 0.00 | | | | 0.00 | | | $ | 26.90 | |
Institutional Class | | | | | | | | | | | | | | | | | | | | | | | | |
Six months ended November 30, 2016 (unaudited) | | $ | 39.75 | | | | (0.06 | ) | | | 4.43 | | | | 0.00 | | | | 0.00 | | | $ | 44.12 | |
Year ended May 31, 2016 | | $ | 46.44 | | | | (0.09 | ) | | | (6.33 | ) | | | 0.00 | | | | (0.27 | ) | | $ | 39.75 | |
Year ended May 31, 2015 | | $ | 41.14 | | | | (0.20 | )4 | | | 7.42 | | | | 0.00 | | | | (1.92 | ) | | $ | 46.44 | |
Year ended May 31, 2014 | | $ | 35.46 | | | | (0.20 | )4 | | | 8.28 | | | | 0.00 | | | | (2.40 | ) | | $ | 41.14 | |
Year ended May 31, 2013 | | $ | 27.15 | | | | (0.06 | )4 | | | 8.51 | | | | (0.14 | ) | | | 0.00 | | | $ | 35.46 | |
Year ended May 31, 2012 | | $ | 30.44 | | | | (0.07 | )4 | | | (3.22 | ) | | | 0.00 | | | | 0.00 | | | $ | 27.15 | |
| 1 | Ratios include net expenses allocated from the affiliated Master Portfolio. |
| 2 | Total return calculations do not include any sales charges. Returns for periods of less than one year are not annualized. |
| 3 | Portfolio turnover rate is calculated by multiplying the Fund’s investment percentage in the affiliated Master Portfolio by the affiliated Master Portfolio’s portfolio turnover rate. |
| 4 | Calculated based upon average shares outstanding |
| 5 | For the period from October 31, 2014 (commencement of class operations) to May 31, 2015 |
The accompanying notes are an integral part of these financial statements.
| | | | | | |
| Financial highlights | | Wells Fargo Equity Gateway Funds | | | 49 | |
| | | | | | | | | | | | | | | | | | | | | | |
| Ratio to average net assets (annualized) | | | Total
return2 | | | Portfolio
turnover
rate3 | | | Net assets at
end of period
(000s omitted) | |
Net investment
loss | | | Gross
expenses1 | | | Net
expenses1 | | | | |
| | | | | | | | | | | | | | | | | | | | | | |
| | (0.64 | )% | | | 1.34 | % | | | 1.34 | % | | | 10.80 | % | | | 35 | % | | $ | 107,932 | |
| | (0.57 | )% | | | 1.34 | % | | | 1.34 | % | | | (14.20 | )% | | | 49 | % | | $ | 128,675 | |
| | (0.90 | )% | | | 1.41 | % | | | 1.40 | % | | | 17.51 | % | | | 58 | % | | $ | 85,588 | |
| | (0.96 | )% | | | 1.45 | % | | | 1.41 | % | | | 22.63 | % | | | 77 | % | | $ | 30,364 | |
| | (0.58 | )% | | | 1.53 | % | | | 1.45 | % | | | 30.55 | % | | | 109 | % | | $ | 9,357 | |
| | (0.70 | )% | | | 1.46 | % | | | 1.44 | % | | | (11.18 | )% | | | 107 | % | | $ | 6,450 | |
| | | | | | | | | | | | | | | | | | | | | | |
| | (1.39 | )% | | | 2.05 | % | | | 2.05 | % | | | 10.39 | % | | | 35 | % | | $ | 10 | |
| | (1.38 | )% | | | 2.08 | % | | | 2.08 | % | | | (14.83 | )% | | | 49 | % | | $ | 17 | |
| | (1.65 | )% | | | 2.15 | % | | | 2.15 | % | | | 16.63 | % | | | 58 | % | | $ | 76 | |
| | (1.71 | )% | | | 2.20 | % | | | 2.16 | % | | | 21.74 | % | | | 77 | % | | $ | 101 | |
| | (1.33 | )% | | | 2.28 | % | | | 2.20 | % | | | 29.57 | % | | | 109 | % | | $ | 164 | |
| | (1.48 | )% | | | 2.21 | % | | | 2.19 | % | | | (11.87 | )% | | | 107 | % | | $ | 193 | |
| | | | | | | | | | | | | | | | | | | | | | |
| | (1.39 | )% | | | 2.09 | % | | | 2.09 | % | | | 10.38 | % | | | 35 | % | | $ | 24,008 | |
| | (1.32 | )% | | | 2.09 | % | | | 2.09 | % | | | (14.84 | )% | | | 49 | % | | $ | 26,946 | |
| | (1.64 | )% | | | 2.16 | % | | | 2.15 | % | | | 16.62 | % | | | 58 | % | | $ | 17,334 | |
| | (1.71 | )% | | | 2.20 | % | | | 2.16 | % | | | 21.75 | % | | | 77 | % | | $ | 6,546 | |
| | (1.31 | )% | | | 2.28 | % | | | 2.20 | % | | | 29.56 | % | | | 109 | % | | $ | 2,406 | |
| | (1.45 | )% | | | 2.22 | % | | | 2.19 | % | | | (11.85 | )% | | | 107 | % | | $ | 1,628 | |
| | | | | | | | | | | | | | | | | | | | | | |
| | (0.19 | )% | | | 0.91 | % | | | 0.90 | % | | | 11.04 | % | | | 35 | % | | $ | 324,565 | |
| | (0.09 | )% | | | 0.91 | % | | | 0.90 | % | | | (13.83 | )% | | | 49 | % | | $ | 229,391 | |
| | (0.34 | )% | | | 0.91 | % | | | 0.90 | % | | | 13.00 | % | | | 58 | % | | $ | 644 | |
| | | | | | | | | | | | | | | | | | | | | | |
| | (0.50 | )% | | | 1.26 | % | | | 1.20 | % | | | 10.86 | % | | | 35 | % | | $ | 128,312 | |
| | (0.46 | )% | | | 1.25 | % | | | 1.20 | % | | | (14.04 | )% | | | 49 | % | | $ | 130,104 | |
| | (0.70 | )% | | | 1.24 | % | | | 1.20 | % | | | 17.73 | % | | | 58 | % | | $ | 185,267 | |
| | (0.74 | )% | | | 1.29 | % | | | 1.20 | % | | | 22.92 | % | | | 77 | % | | $ | 118,456 | |
| | (0.30 | )% | | | 1.37 | % | | | 1.20 | % | | | 30.89 | % | | | 109 | % | | $ | 98,445 | |
| | (0.48 | )% | | | 1.30 | % | | | 1.20 | % | | | (10.99 | )% | | | 107 | % | | $ | 97,776 | |
| | | | | | | | | | | | | | | | | | | | | | |
| | (0.24 | )% | | | 1.01 | % | | | 0.95 | % | | | 10.99 | % | | | 35 | % | | $ | 919,350 | |
| | (0.18 | )% | | | 1.01 | % | | | 0.95 | % | | | (13.85 | )% | | | 49 | % | | $ | 678,699 | |
| | (0.45 | )% | | | 0.98 | % | | | 0.95 | % | | | 18.03 | % | | | 58 | % | | $ | 457,542 | |
| | (0.49 | )% | | | 1.02 | % | | | 0.95 | % | | | 23.19 | % | | | 77 | % | | $ | 186,581 | |
| | (0.19 | )% | | | 1.10 | % | | | 0.95 | % | | | 31.25 | % | | | 109 | % | | $ | 71,336 | |
| | (0.27 | )% | | | 1.03 | % | | | 0.95 | % | | | (10.78 | )% | | | 107 | % | | $ | 9,692 | |
The accompanying notes are an integral part of these financial statements.
| | | | |
| 50 | | Wells Fargo Equity Gateway Funds | | Financial highlights |
| | | | | | | | | | | | | | | | | | | | |
| Small Company Value Fund | | Beginning
net asset
value per
share | | | Net
investment
income (loss) | | | Net realized
and unrealized
gains (losses)
on investments | | | Distributions
from net
investment
income | | | Ending
net asset
value per
share | |
Class A | | | | | | | | | | | | | | | | | | | | |
Six months ended November 30, 2016 (unaudited) | | $ | 20.22 | | | | 0.03 | | | | 3.07 | | | | 0.00 | | | $ | 23.32 | |
Year ended May 31, 2016 | | $ | 21.42 | | | | 0.08 | | | | (1.25 | ) | | | (0.03 | ) | | $ | 20.22 | |
Year ended May 31, 2015 | | $ | 20.08 | | | | 0.07 | | | | 1.27 | | | | 0.00 | | | $ | 21.42 | |
Year ended May 31, 2014 | | $ | 17.10 | | | | 0.06 | | | | 2.92 | | | | 0.00 | | | $ | 20.08 | |
Year ended May 31, 2013 | | $ | 13.17 | | | | (0.00 | )4 | | | 3.93 | | | | 0.00 | | | $ | 17.10 | |
Year ended May 31, 2012 | | $ | 14.36 | | | | 0.03 | | | | (1.11 | ) | | | (0.11 | ) | | $ | 13.17 | |
Class C | | | | | | | | | | | | | | | | | | | | |
Six months ended November 30, 2016 (unaudited) | | $ | 18.15 | | | | (0.04 | )5 | | | 2.74 | | | | 0.00 | | | $ | 20.85 | |
Year ended May 31, 2016 | | $ | 19.34 | | | | (0.11 | )5 | | | (1.08 | ) | | | 0.00 | | | $ | 18.15 | |
Year ended May 31, 2015 | | $ | 18.27 | | | | (0.08 | )5 | | | 1.15 | | | | 0.00 | | | $ | 19.34 | |
Year ended May 31, 2014 | | $ | 15.68 | | | | (0.07 | )5 | | | 2.66 | | | | 0.00 | | | $ | 18.27 | |
Year ended May 31, 2013 | | $ | 12.16 | | | | (0.10 | )5 | | | 3.62 | | | | 0.00 | | | $ | 15.68 | |
Year ended May 31, 2012 | | $ | 13.30 | | | | (0.08 | )5 | | | (1.02 | ) | | | (0.04 | ) | | $ | 12.16 | |
Class R6 | | | | | | | | | | | | | | | | | | | | |
Period ended November 30, 2016 (unaudited)6 | | $ | 21.37 | | | | 0.01 | | | | 2.62 | | | | 0.00 | | | $ | 24.00 | |
Administrator Class | | | | | | | | | | | | | | | | | | | | |
Six months ended November 30, 2016 (unaudited) | | $ | 20.66 | | | | 0.05 | 5 | | | 3.13 | | | | 0.00 | | | $ | 23.84 | |
Year ended May 31, 2016 | | $ | 21.90 | | | | 0.13 | | | | (1.30 | ) | | | (0.07 | ) | | $ | 20.66 | |
Year ended May 31, 2015 | | $ | 20.49 | | | | 0.11 | | | | 1.30 | | | | 0.00 | | | $ | 21.90 | |
Year ended May 31, 2014 | | $ | 17.42 | | | | 0.12 | | | | 2.95 | | | | 0.00 | | | $ | 20.49 | |
Year ended May 31, 2013 | | $ | 13.39 | | | | 0.03 | 5 | | | 4.01 | | | | (0.01 | ) | | $ | 17.42 | |
Year ended May 31, 2012 | | $ | 14.60 | | | | 0.06 | | | | (1.13 | ) | | | (0.14 | ) | | $ | 13.39 | |
Institutional Class | | | | | | | | | | | | | | | | | | | | |
Six months ended November 30, 2016 (unaudited) | | $ | 20.77 | | | | 0.06 | 5 | | | 3.17 | | | | 0.00 | | | $ | 24.00 | |
Year ended May 31, 2016 | | $ | 22.02 | | | | 0.08 | 5 | | | (1.22 | ) | | | (0.11 | ) | | $ | 20.77 | |
Year ended May 31, 2015 | | $ | 20.57 | | | | 0.14 | | | | 1.31 | | | | 0.00 | | | $ | 22.02 | |
Year ended May 31, 2014 | | $ | 17.45 | | | | 0.13 | | | | 2.99 | | | | 0.00 | | | $ | 20.57 | |
Year ended May 31, 2013 | | $ | 13.41 | | | | 0.06 | 5 | | | 4.03 | | | | (0.05 | ) | | $ | 17.45 | |
Year ended May 31, 2012 | | $ | 14.63 | | | | 0.11 | | | | (1.17 | ) | | | (0.16 | ) | | $ | 13.41 | |
| 1 | Ratios include net expenses allocated from the affiliated Master Portfolio. |
| 2 | Total return calculations do not include any sales charges. Returns for periods of less than one year are not annualized. |
| 3 | Portfolio turnover rate is calculated by multiplying the Fund’s investment percentage in the affiliated Master Portfolio by the affiliated Master Portfolio’s portfolio turnover rate. |
| 4 | Amount is less than $0.005. |
| 5 | Calculated based upon average shares outstanding |
| 6 | For the period from October 31, 2016 (commencement of class operations) to November 30, 2016 |
The accompanying notes are an integral part of these financial statements.
| | | | | | |
| Financial highlights | | Wells Fargo Equity Gateway Funds | | | 51 | |
| | | | | | | | | | | | | | | | | | | | | | |
| Ratio to average net assets (annualized) | | | Total
return2 | | | Portfolio
turnover
rate3 | | | Net assets at
end of period
(000s omitted) | |
Net investment
income (loss) | | | Gross
expenses1 | | | Net
expenses1 | | | | |
| | | | | | | | | | | | | | | | | | | | | | |
| | 0.32 | % | | | 1.48 | % | | | 1.35 | % | | | 15.34 | % | | | 55 | % | | $ | 23,895 | |
| | 0.11 | % | | | 1.48 | % | | | 1.37 | % | | | (5.48 | )% | | | 72 | % | | $ | 23,151 | |
| | 0.33 | % | | | 1.50 | % | | | 1.40 | % | | | 6.62 | % | | | 54 | % | | $ | 26,339 | |
| | 0.33 | % | | | 1.56 | % | | | 1.42 | % | | | 17.43 | % | | | 47 | % | | $ | 26,517 | |
| | (0.02 | )% | | | 1.57 | % | | | 1.45 | % | | | 29.84 | % | | | 57 | % | | $ | 21,652 | |
| | 0.08 | % | | | 1.50 | % | | | 1.45 | % | | | (7.44 | )% | | | 60 | % | | $ | 18,605 | |
| | | | | | | | | | | | | | | | | | | | | | |
| | (0.43 | )% | | | 2.23 | % | | | 2.10 | % | | | 14.94 | % | | | 55 | % | | $ | 2,063 | |
| | (0.62 | )% | | | 2.23 | % | | | 2.12 | % | | | (6.20 | )% | | | 72 | % | | $ | 2,004 | |
| | (0.42 | )% | | | 2.26 | % | | | 2.15 | % | | | 5.86 | % | | | 54 | % | | $ | 2,602 | |
| | (0.42 | )% | | | 2.31 | % | | | 2.17 | % | | | 16.52 | % | | | 47 | % | | $ | 2,192 | |
| | (0.76 | )% | | | 2.32 | % | | | 2.20 | % | | | 28.95 | % | | | 57 | % | | $ | 1,814 | |
| | (0.68 | )% | | | 2.25 | % | | | 2.20 | % | | | (8.20 | )% | | | 60 | % | | $ | 1,557 | |
| | | | | | | | | | | | | | | | | | | | | | |
| | 0.73 | % | | | 1.02 | % | | | 0.90 | % | | | 12.26 | % | | | 55 | % | | $ | 28 | |
| | | | | | | | | | | | | | | | | | | | | | |
| | 0.47 | % | | | 1.40 | % | | | 1.20 | % | | | 15.45 | % | | | 55 | % | | $ | 62,863 | |
| | 0.28 | % | | | 1.39 | % | | | 1.20 | % | | | (5.36 | )% | | | 72 | % | | $ | 64,023 | |
| | 0.52 | % | | | 1.34 | % | | | 1.20 | % | | | 6.88 | % | | | 54 | % | | $ | 71,034 | |
| | 0.55 | % | | | 1.39 | % | | | 1.20 | % | | | 17.62 | % | | | 47 | % | | $ | 68,358 | |
| | 0.23 | % | | | 1.40 | % | | | 1.20 | % | | | 30.21 | % | | | 57 | % | | $ | 60,550 | |
| | 0.32 | % | | | 1.33 | % | | | 1.20 | % | | | (7.24 | )% | | | 60 | % | | $ | 60,333 | |
| | | | | | | | | | | | | | | | | | | | | | |
| | 0.66 | % | | | 1.15 | % | | | 1.00 | % | | | 15.55 | % | | | 55 | % | | $ | 41,663 | |
| | 0.40 | % | | | 1.14 | % | | | 1.00 | % | | | (5.13 | )% | | | 72 | % | | $ | 31,768 | |
| | 0.75 | % | | | 1.07 | % | | | 1.00 | % | | | 7.05 | % | | | 54 | % | | $ | 16,850 | |
| | 0.75 | % | | | 1.13 | % | | | 1.00 | % | | | 17.88 | % | | | 47 | % | | $ | 11,967 | |
| | 0.40 | % | | | 1.14 | % | | | 1.00 | % | | | 30.54 | % | | | 57 | % | | $ | 8,185 | |
| | 0.59 | % | | | 1.05 | % | | | 1.00 | % | | | (7.14 | )% | | | 60 | % | | $ | 62 | |
The accompanying notes are an integral part of these financial statements.
| | | | |
| 52 | | Wells Fargo Equity Gateway Funds | | Notes to financial statements (unaudited) |
1. ORGANIZATION
Wells Fargo Funds Trust (the “Trust”), a Delaware statutory trust organized on March 10, 1999, is an open-end management investment company registered under the Investment Company Act of 1940, as amended (the “1940 Act”). As an investment company, the Trust follows the accounting and reporting guidance in Financial Accounting Standards Board (“FASB”) Accounting Standards Codification Topic 946, Financial Services – Investment Companies. These financial statements report on the following funds: Wells Fargo C&B Large Cap Value Fund (“C&B Large Cap Value Fund”), Wells Fargo Diversified Equity Fund (“Diversified Equity Fund”), Wells Fargo Emerging Growth Fund (“Emerging Growth Fund”), Wells Fargo Index Fund (“Index Fund”), Wells Fargo International Value Fund (“International Value Fund”), Wells Fargo Small Company Growth Fund (“Small Company Growth Fund”), and Wells Fargo Small Company Value Fund (“Small Company Value Fund”) (each, a “Fund”, collectively, the “Funds”). Each Fund is a diversified series of the Trust.
After the close of business on October 23, 2015, Investor Class shares became Class A shares in a tax-free conversion. Shareholders of Investor Class in the applicable Funds received Class A shares at a value equal to the value of their Investor Class shares immediately prior to the conversion. Investor Class shares are no longer offered by the applicable Funds.
Class B shares of Diversified Equity Fund and Small Company Value Fund were no longer offered to shareholders effective June 7, 2016 and January 8, 2016, respectively.
Each Fund seeks to achieve its investment objective by investing all investable assets in separate diversified portfolios (each, an “affiliated Master Portfolio”, collectively, the “affiliated Master Portfolios”) of Wells Fargo Master Trust, a registered open-end management investment company. Each affiliated Master Portfolio directly acquires portfolio securities, and a Fund investing in an affiliated Master Portfolio acquires an indirect interest in those securities. Each Fund accounts for its investment in the affiliated Master Portfolios as partnership investments and records on a daily basis its share of the affiliated Master Portfolio’s income, expense and realized and unrealized gains and losses. The financial statements of the affiliated Master Portfolios for the six months ended November 30, 2016 are included in this report and should be read in conjunction with each Fund’s financial statements. As of November 30, 2016, the Funds own the following percentages of the affiliated Master Portfolios:
| | | | | | | | | | | | | | | | | | | | | | | | | | | | |
| | | C&B Large Cap Value Fund | | | Diversified Equity Fund | | | Emerging Growth Fund | | | Index Fund | | | International Value Fund | | | Small Company Growth Fund | | | Small Company Value Fund | |
Wells Fargo C&B Large Cap Value Portfolio | | | 89 | % | | | 5 | % | | | N/A | | | | N/A | | | | N/A | | | | N/A | | | | N/A | |
Wells Fargo Diversified Large Cap Growth Portfolio | | | N/A | | | | 46 | | | | N/A | | | | N/A | | | | N/A | | | | N/A | | | | N/A | |
Wells Fargo Emerging Growth Portfolio | | | N/A | | | | 1 | | | | 90 | % | | | N/A | | | | N/A | | | | N/A | | | | N/A | |
Wells Fargo Index Portfolio | | | N/A | | | | 2 | | | | N/A | | | | 95 | % | | | N/A | | | | N/A | | | | N/A | |
Wells Fargo International Growth Portfolio | | | N/A | | | | 11 | | | | N/A | | | | N/A | | | | N/A | | | | N/A | | | | N/A | |
Wells Fargo International Value Portfolio | | | N/A | | | | 3 | | | | N/A | | | | N/A | | | | 94 | % | | | N/A | | | | N/A | |
Wells Fargo Large Company Value Portfolio | | | N/A | | | | 45 | | | | N/A | | | | N/A | | | | N/A | | | | N/A | | | | N/A | |
Wells Fargo Small Company Growth Portfolio | | | N/A | | | | 0 | * | | | N/A | | | | N/A | | | | N/A | | | | 99 | % | | | N/A | |
Wells Fargo Small Company Value Portfolio | | | N/A | | | | 4 | | | | N/A | | | | N/A | | | | N/A | | | | N/A | | | | 58 | % |
| * | The amount owned is less than 1%. |
2. SIGNIFICANT ACCOUNTING POLICIES
The following significant accounting policies, which are consistently followed in the preparation of the financial statements of each Fund, are in conformity with U.S. generally accepted accounting principles which require management to make estimates and assumptions that affect the reported amounts of assets and liabilities, disclosure of contingent assets and liabilities at the date of the financial statements, and the reported amounts of revenues and expenses during the reporting period. Actual results could differ from those estimates.
Securities valuation
All investments are valued each business day as of the close of regular trading on the New York Stock Exchange (generally 4 p.m. Eastern Time), although a Fund may deviate from this calculation time under unusual or unexpected circumstances.
Investments in the affiliated Master Portfolios are valued daily based on each Fund’s proportionate share of each affiliated Master Portfolio’s net assets, which are also valued daily. Securities held in the affiliated Master Portfolios are valued as discussed in the Notes to Financial Statements of the affiliated Master Portfolios, which are included elsewhere in this report.
| | | | | | |
| Notes to financial statements (unaudited) | | Wells Fargo Equity Gateway Funds | | | 53 | |
Security transactions and income recognition
Securities transactions are recorded on a trade date basis in each affiliated Master Portfolio. Realized gains or losses in each affiliated Master Portfolio are recorded on the basis of identified cost.
Dividend income in each affiliated Master Portfolio is recognized on the ex-dividend date, except for certain dividends from foreign securities which are recorded as soon as the custodian verifies the ex-dividend date. Dividend income from foreign securities in each affiliated Master Portfolio is recorded net of foreign taxes withheld where recovery of such taxes is not assured.
Interest income is accrued daily and bond discounts are accreted and premiums are amortized daily based on the effective interest method by each affiliated Master Portfolio. To the extent debt obligations are placed on non-accrual status, any related interest income may be reduced by writing off interest receivables when the collection of all or a portion of interest has become doubtful based on consistently applied procedures. If the issuer subsequently resumes interest payments or when the collectability of interest is reasonably assured, the debt obligation is removed from non-accrual status.
Each Fund records daily its proportionate share of each affiliated Master Portfolio’s interest and dividend income and realized and unrealized gains or losses.
Distributions to shareholders
Distributions to shareholders from net investment income and net realized gains, if any, are recorded on the ex-dividend date. Such distributions are determined in conformity with federal income tax regulations, which may differ in amount or character from net investment income and realized gains recognized for purposes of U.S. generally accepted accounting principles.
Federal and other taxes
Each Fund is treated as a separate entity for federal income tax purposes. Each Fund intends to continue to qualify as a regulated investment company by distributing substantially all of its investment company taxable income and any net realized capital gains (after reduction for capital loss carryforwards) sufficient to relieve it from all, or substantially all, federal income taxes. Accordingly, no provision for federal income taxes was required.
Each Fund’s income and federal excise tax returns and all financial records supporting those returns for the prior three fiscal years are subject to examination by the federal and Delaware revenue authorities. Management has analyzed each Fund’s tax positions taken on federal, state, and foreign tax returns for all open tax years and does not believe that there are any uncertain tax positions that require recognition of a tax liability.
At May 31, 2016, capital loss carryforwards available to offset future net realized capital gains were as follows through the indicated expiration dates:
| | | | | | | | | | | | | | | | | | | | |
| | | | | | | | | | | | No expiration | |
| | | 2017 | | | 2018 | | | 2019 | | | Short-term | | | Long-term | |
International Value Fund | | $ | 0 | | | $ | 31,783,032 | | | $ | 4,561,591 | | | $ | 0 | | | $ | 19,415 | |
Small Company Growth Fund | | | 546,818 | | | | 0 | | | | 0 | | | | 58,698,280 | | | | 28,260,757 | |
Small Company Value Fund | | | 0 | | | | 75,262,378 | | | | 0 | | | | 0 | | | | 0 | |
At May 31, 2016, current year deferred post-October capital losses and late-year ordinary losses, which were recognized on the first day of the current fiscal year were as follows:
| | | | | | | | |
| | | Deferred post-October capital losses | | | Late-year ordinary losses
deferred | |
Emerging Growth Fund | | $ | 11,871,337 | | | $ | 1,370,106 | |
International Value Fund | | | 779,929 | | | | 0 | |
Small Company Growth Fund | | | 0 | | | | 615,614 | |
Small Company Value Fund | | | 614,168 | | | | 0 | |
| | | | |
| 54 | | Wells Fargo Equity Gateway Funds | | Notes to financial statements (unaudited) |
Class allocations
The separate classes of shares offered by each Fund differ principally in applicable sales charges, distribution, shareholder servicing, and administration fees. Class specific expenses are charged directly to that share class. Investment income, common expenses, and realized and unrealized gains (losses) on investments are allocated daily to each class of shares based on the relative proportion of net assets of each class.
3. FAIR VALUATION MEASUREMENTS
At November 30, 2016, each affiliated Master Portfolio of each Fund was measured at fair value using the net asset value per share (or its equivalent) as a practical expedient. The aggregate value of affiliated Master Portfolio(s) of each Fund was as follows:
| | | | |
| | | Aggregate value of affiliated
Master Portfolio(s) | |
C&B Large Cap Value Fund | | $ | 304,745,262 | |
Diversified Equity Fund | | | 197,645,999 | |
Emerging Growth Fund | | | 725,992,088 | |
Index Fund | | | 2,124,721,219 | |
International Value Fund | | | 509,621,732 | |
Small Company Growth Fund | | | 1,503,201,711 | |
Small Company Value Fund | | | 130,386,544 | |
The investment objective of each affiliated Master Portfolio is as follows:
| | |
| Affiliated Master Portfolio | | Investment objective |
Wells Fargo C&B Large Cap Value Portfolio | | Seeks maximum long-term total return (current income and capital appreciation), consistent with minimizing risk to principal |
Wells Fargo Diversified Large Cap Growth Portfolio | | Seeks long-term capital appreciation |
Wells Fargo Emerging Growth Portfolio | | Seeks long-term capital appreciation |
Wells Fargo Index Portfolio | | Seeks to replicate the total return of the S&P 500 Index, before expenses |
Wells Fargo International Growth Portfolio | | Seeks long-term capital appreciation |
Wells Fargo International Value Portfolio | | Seeks long-term capital appreciation |
Wells Fargo Large Company Value Portfolio | | Seeks long-term capital appreciation |
Wells Fargo Small Company Growth Portfolio | | Seeks long-term capital appreciation |
Wells Fargo Small Company Value Portfolio | | Seeks long-term capital appreciation |
Each affiliated Master Portfolio does not have a redemption period notice, can be redeemed daily and does not have any unfunded commitments.
4. TRANSACTIONS WITH AFFILIATES
Management fee
Wells Fargo Funds Management, LLC (“Funds Management”), an indirect wholly owned subsidiary of Wells Fargo & Company (“Wells Fargo”), is the manager of each Fund. Under the investment management agreement, Funds Management is responsible for, among other services, implementing the investment objectives and strategies of each Fund, supervising the applicable subadvisers, providing fund-level administrative services in connection with each Fund’s operations, and providing any other fund-level administrative services reasonably necessary for the operation of each Fund. For each Fund that continues to invest substantially all of its assets in a single affiliated Master Portfolio, each Fund pays Funds Management an investment management fee only for fund-level administrative services at an annual rate starting at 0.05% and declining to 0.03% as the average daily net assets of each Fund increase. For Diversified Equity Fund which invests in multiple affiliated Master Portfolios, Funds Management receives a management fee for providing advisory and fund-level administrative services, including the determination of the asset allocations of its investments in
| | | | | | |
| Notes to financial statements (unaudited) | | Wells Fargo Equity Gateway Funds | | | 55 | |
the various affiliated Master Portfolios, at an annual rate starting at 0.30% and declining to 0.22% as the average daily net assets of Diversified Equity Fund increase. For the six months ended November 30, 2016, the management fee was equivalent to an annual rate for each Fund as follows:
| | | | |
| | | Management fee | |
C&B Large Cap Value Fund | | | 0.05 | % |
Diversified Equity Fund | | | 0.30 | |
Emerging Growth Fund | | | 0.05 | |
Index Fund | | | 0.05 | |
International Value Fund | | | 0.05 | |
Small Company Growth Fund | | | 0.05 | |
Small Company Value Fund | | | 0.05 | |
Funds Management also serves as the adviser to each affiliated Master Portfolio and is entitled to receive a fee from each affiliated Master Portfolio for those services.
Administration fees
Under a class-level administration agreement, Funds Management provides class-level administrative services to the Fund, which includes paying fees and expenses for services provided by the transfer agent, sub-transfer agents, omnibus account servicers and record-keepers. As compensation for its services under the class-level administration agreement, Funds Management receives an annual fee which is calculated based on the average daily net assets of each class as follows:
| | | | |
| | | Class-level administration fee | |
Class A, Class B, Class C | | | 0.21 | % |
Class R6 | | | 0.03 | |
Administrator Class, Institutional Class | | | 0.13 | |
Funds Management has contractually waived and/or reimbursed management and administration fees to the extent necessary to maintain certain net operating expense ratios for the Funds. Waiver of fees and/or reimbursement of expenses by Funds Management were made first from fund level expenses on a proportionate basis and then from class specific expenses. Funds Management has committed to waive fees and/or reimburse expenses to the extent necessary to cap each Fund’s expenses as follows:
| | | | | | | | | | | | | | | | | | | | | | | | | | | | |
| | | Expiration date | | | Class A | | | Class B | | | Class C | | | Class R6 | | | Administrator
Class | | | Institutional
Class | |
C&B Large Cap Value Fund | | | September 30, 2017 | | | | 1.15 | % | | | 1.90 | % | | | 1.90 | % | | | 0.70 | %* | | | 1.00 | % | | | 0.80 | % |
Diversified Equity Fund | | | September 30, 2017 | | | | 1.25 | | | | N/A | | | | 2.00 | | | | N/A | | | | 1.00 | | | | N/A | |
Emerging Growth Fund | | | September 30, 2017 | | | | 1.35 | | | | N/A | | | | 2.10 | | | | N/A | | | | 1.20 | | | | 0.90 | |
Index Fund | | | September 30, 2017 | | | | 0.45 | | | | 1.20 | | | | 1.20 | | | | N/A | | | | 0.25 | | | | N/A | |
International Value Fund | | | September 30, 2017 | | | | 1.35 | | | | N/A | | | | 2.10 | | | | N/A | | | | 1.25 | | | | 1.00 | |
Small Company Growth Fund | | | September 30, 2017 | | | | 1.35 | | | | 2.10 | | | | 2.10 | | | | 0.90 | | | | 1.20 | | | | 0.95 | |
Small Company Value Fund | | | September 30, 2017 | | | | 1.35 | | | | N/A | | | | 2.10 | | | | 0.90 | * | | | 1.20 | | | | 1.00 | |
| * | The expiration date for Class R6 is September 30, 2018. |
Net expenses from affiliated Master Portfolio(s) are included in the expense caps. After the expiration date, each expense cap may be increased or the commitment to maintain the cap may be terminated only with the approval of the Board of Trustees.
Distribution fees
The Trust has adopted a Distribution Plan for Class B and Class C shares of the applicable Funds pursuant to Rule 12b-1 under the 1940 Act. Distribution fees are charged to the Class B and Class C shares and paid to Wells Fargo Funds Distributor, LLC (“Funds Distributor”), the principal underwriter of each Fund, at an annual rate of 0.75% of the average daily net assets of Class B and Class C shares.
| | | | |
| 56 | | Wells Fargo Equity Gateway Funds | | Notes to financial statements (unaudited) |
In addition, Funds Distributor is entitled to receive the front-end sales charge from the purchase of Class A shares and a contingent deferred sales charge on the redemption of certain Class A shares. Funds Distributor is also entitled to receive the contingent deferred sales charges from redemptions of Class B and Class C shares. For the six months ended November 30, 2016, Funds Distributor received the following amounts in front-end sales charges and contingent deferred sales charges.
| | | | | | | | |
| | | Front-end sales charges | | | Contingent deferred sales charges | |
| | | Class A | | | Class C | |
C&B Large Cap Value Fund | | $ | 2,929 | | | $ | 0 | |
Diversified Equity Fund | | | 1,159 | | | | 0 | |
Emerging Growth Fund | | | 516 | | | | 0 | |
Index Fund | | | 8,650 | | | | 258 | |
International Value Fund | | | 276 | | | | 25 | |
Small Company Growth Fund | | | 2,100 | | | | 782 | |
Small Company Value Fund | | | 290 | | | | 0 | |
Shareholder servicing fees
The Trust has entered into contracts with one or more shareholder servicing agents, whereby Class A, Class B, Class C, and Administrator Class of each applicable Fund are charged a fee at an annual rate of 0.25% of the average daily net assets of each respective class. Administrator Class of the Index Fund is charged a fee at an annual rate of 0.10% of its average daily net assets.
A portion of these total shareholder servicing fees were paid to affiliates of Wells Fargo.
5. INVESTMENT PORTFOLIO TRANSACTIONS
Purchases and sales of investments, excluding U.S. Government obligations (if any) and short-term securities, for the six months ended November 30, 2016 were as follows:
| | | | | | | | |
| | | Purchases at cost* | | | Sales proceeds* | |
C&B Large Cap Value Fund | | $ | 122,830,487 | | | $ | 87,345,957 | |
Diversified Equity Fund | | | 61,707,683 | | | | 68,594,874 | |
Emerging Growth Fund | | | 381,720,078 | | | | 401,265,754 | |
Index Fund | | | 100,513,208 | | | | 325,663,628 | |
International Value Fund | | | 111,782,020 | | | | 70,085,259 | |
Small Company Growth Fund | | | 783,371,690 | | | | 463,669,103 | |
Small Company Value Fund | | | 67,029,606 | | | | 74,453,193 | |
| * | The Funds seek to achieve their investment objective by investing some or all of their investable assets in affiliated Master Portfolios. Purchases and sales related to these investments have been calculated by aggregating the results of multiplying each Fund’s ownership percentage of the respective affiliated Master Portfolio by the corresponding affiliated Master Portfolio’s purchases and sales. |
6. BANK BORROWINGS
The Trust (excluding the money market funds and certain other funds) and Wells Fargo Variable Trust are parties to a $250,000,000 revolving credit agreement whereby the Fund is permitted to use bank borrowings for temporary or emergency purposes, such as to fund shareholder redemption requests. Interest under the credit agreement is charged to the Fund based on a borrowing rate equal to the higher of the Federal Funds rate in effect on that day plus 1.25% or the overnight LIBOR rate in effect on that day plus 1.25%. In addition, an annual commitment fee equal to 0.25% of the unused balance is allocated to each participating fund. Prior to August 30, 2016, the revolving credit agreement amount was $200,000,000 and the annual commitment fee was equal to 0.20% of the unused balance which was allocated to each participating fund.
| | | | | | |
| Notes to financial statements (unaudited) | | Wells Fargo Equity Gateway Funds | | | 57 | |
During the six month ended November 30, 2016, the Funds had the following borrowing activity:
| | | | | | | | | | | | |
| | | Average borrowings
outstanding | | | Weighted average
interest rate
(annualized) | | | Interest paid | |
Emerging Growth Fund | | $ | 31,657 | | | | 1.69 | % | | $ | 535 | |
Index Fund | | | 32,471 | | | | 1.70 | | | | 552 | |
7. CONCENTRATION RISKS
Concentration risks result from exposure to a limited number of sectors. Through their investments in affiliated Master Portfolio(s), Funds that invest a substantial portion of their assets in a sector may be more affected by changes in that sector than would be a fund whose investments are not heavily weighted in any sector.
8. INDEMNIFICATION
Under the Trust’s organizational documents, the officers and Trustees have been granted certain indemnification rights against certain liabilities that may arise out of performance of their duties to the Trust. Additionally, in the normal course of business, the Trust may enter into contracts with service providers that contain a variety of indemnification clauses. The Trust’s maximum exposure under these arrangements is dependent on future claims that may be made against the Funds and, therefore, cannot be estimated.
9. REGULATORY CHANGES
In October 2016, the Securities and Exchange Commission (“SEC”) adopted new rules and forms and amended existing rules and forms (together, “final rules”) intended to modernize and enhance the reporting and disclosure of information by registered investment companies and to enhance liquidity risk management by open-end mutual funds and exchange-traded funds. The final rules will enhance the quality of information available to investors and will allow the SEC to more effectively collect and use data reported by funds. In part, the final rules amend Regulation S-X and require standardized, enhanced disclosure about derivatives in the Fund’s financial statements, as well as other amendments. The compliance date for the amendments to Regulation S-X is August 1, 2017 while the compliance date for the new form types is June 1, 2018 and the compliance date for the liquidity risk management program requirements is December 1, 2018. Management is currently assessing the potential impact of these enhancements and their impact on the financial statement disclosures and reporting requirements.
10. SUBSEQUENT DISTRIBUTIONS
On December 7, 2016, the following Funds declared distributions from capital gains to shareholders of record on December 6, 2016. The per share amounts payable on December 8, 2016 were as follows:
| | | | | | | | | | | | | | | | |
| | | C&B Large
Cap Value
Fund | | | Diversified
Equity
Fund | | | Emerging
Growth
Fund | | | Index
Fund | |
Short-term capital gains | | | | | | | | | | | | | | | | |
Class A | | $ | 0.02672 | | | $ | 0.07290 | | | $ | 0.00000 | | | $ | 0.04923 | |
Class B | | | N/A | * | | | N/A | | | | N/A | | | | 0.04923 | |
Class C | | | 0.02672 | | | | 0.07290 | | | | 0.00000 | | | | 0.04923 | |
Class R6 | | | 0.02672 | | | | N/A | | | | N/A | | | | N/A | |
Administrator Class | | | 0.02672 | | | | 0.07290 | | | | 0.00000 | | | | 0.04923 | |
Institutional Class | | | 0.02672 | | | | N/A | | | | 0.00000 | | | | N/A | |
Long-term capital gains | | | | | | | | | | | | | | | | |
Class A | | $ | 0.20836 | | | $ | 1.71087 | | | $ | 0.84428 | | | $ | 4.93507 | |
Class B | | | N/A | * | | | N/A | | | | N/A | | | | 4.93507 | |
Class C | | | 0.20836 | | | | 1.71087 | | | | 0.84428 | | | | 4.93507 | |
Class R6 | | | 0.20836 | | | | N/A | | | | N/A | | | | N/A | |
Administrator Class | | | 0.20836 | | | | 1.71087 | | | | 0.84428 | | | | 4.93507 | |
Institutional Class | | | 0.20836 | | | | N/A | | | | 0.84428 | | | | N/A | |
| * | At the close of business on December 5, 2016, existing Class B shareholders were converted to Class A shareholders. Effective December 6, 2016, Class B shares are no longer offered by the Fund. |
| | | | |
| 58 | | Wells Fargo Equity Gateway Funds | | Notes to financial statements (unaudited) |
On December 16, 2016, the following Funds declared distributions from net investment income to shareholders of record on December 15, 2016. The per share amounts payable on December 19, 2016 were as follows:
| | | | | | | | | | | | | | | | |
| | | C&B Large
Cap Value
Fund | | | Diversified
Equity
Fund | | | Index
Fund | | | Small Company
Value Fund | |
Net investment income | | | | | | | | | | | | | | | | |
Class A | | $ | 0.07557 | | | $ | 0.22437 | | | $ | 1.15601 | | | $ | 0.01100 | |
Class B | | | N/A | * | | | N/A | | | | 0.19161 | | | | N/A | |
Class C | | | 0.00000 | | | | 0.01802 | | | | 0.71471 | | | | 0.00000 | |
Class R6 | | | 0.12355 | | | | N/A | | | | N/A | | | | 0.08959 | |
Administrator Class | | | 0.08040 | | | | 0.29134 | | | | 1.26926 | | | | 0.04453 | |
Institutional Class | | | 0.12092 | | | | N/A | | | | N/A | | | | 0.09186 | |
| * | At the close of business on December 5, 2016, existing Class B shareholders were converted to Class A shareholders. Effective December 6, 2016, Class B shares are no longer offered by the Fund. |
On December 29, 2016, the following Fund declared distributions from net investment income to shareholders of record on December 28, 2016. The per share amounts payable on December 30, 2016 was as follows:
| | | | |
| | | International
Value Fund | |
Net investment income | | | | |
Class A | | $ | 0.30204 | |
Class C | | | 0.16080 | |
Administrator Class | | | 0.24550 | |
Institutional Class | | | 0.31143 | |
These distributions are not reflected in the accompanying financial statements. The final determination of the source of all distributions is subject to change and made after the tax year-end of each Fund.
| | | | | | |
| Portfolio of investments—November 30, 2016 (unaudited) | | Wells Fargo Equity Gateway Funds | | | 59 | |
C&B LARGE CAP VALUE PORTFOLIO
| | | | | | | | | | | | | | | | |
| Security name | | | | | | | | Shares | | | Value | |
| | | | |
Common Stocks: 97.20% | | | | | | | | | | | | | | | | |
| | | | |
Consumer Discretionary: 13.25% | | | | | | | | | | | | | | | | |
| | | | |
| Hotels, Restaurants & Leisure: 3.14% | | | | | | | | | | | | | | | | |
Brinker International Incorporated « | | | | | | | | | | | 86,707 | | | $ | 4,605,009 | |
Carnival Corporation | | | | | | | | | | | 119,800 | | | | 6,158,918 | |
| |
| | | | 10,763,927 | |
| | | | | | | | | | | | | | | | |
| | | | |
| Household Durables: 1.56% | | | | | | | | | | | | | | | | |
Whirlpool Corporation | | | | | | | | | | | 32,900 | | | | 5,344,276 | |
| | | | | | | | | | | | | | | | |
| | | | |
| Media: 5.50% | | | | | | | | | | | | | | | | |
Omnicom Group Incorporated | | | | | | | | | | | 113,146 | | | | 9,836,913 | |
Twenty-First Century Fox Incorporated Class A | | | | | | | | | | | 321,351 | | | | 9,033,177 | |
| |
| | | | 18,870,090 | |
| | | | | | | | | | | | | | | | |
| | | | |
| Specialty Retail: 0.39% | | | | | | | | | | | | | | | | |
Tiffany & Company | | | | | | | | | | | 16,480 | | | | 1,359,270 | |
| | | | | | | | | | | | | | | | |
| | | | |
| Textiles, Apparel & Luxury Goods: 2.66% | | | | | | | | | | | | | | | | |
Gildan Activewear Incorporated | | | | | | | | | | | 335,432 | | | | 9,120,396 | |
| | | | | | | | | | | | | | | | |
| | | | |
Consumer Staples: 5.55% | | | | | | | | | | | | | | | | |
| | | | |
| Beverages: 1.81% | | | | | | | | | | | | | | | | |
Diageo plc ADR « | | | | | | | | | | | 61,320 | | | | 6,208,037 | |
| | | | | | | | | | | | | | | | |
| | | | |
| Personal Products: 2.32% | | | | | | | | | | | | | | | | |
Unilever NV ADR | | | | | | | | | | | 199,349 | | | | 7,940,071 | |
| | | | | | | | | | | | | | | | |
| | | | |
| Tobacco: 1.42% | | | | | | | | | | | | | | | | |
Philip Morris International | | | | | | | | | | | 55,300 | | | | 4,881,884 | |
| | | | | | | | | | | | | | | | |
| | | | |
Energy: 5.60% | | | | | | | | | | | | | | | | |
| | | | |
| Oil, Gas & Consumable Fuels: 5.60% | | | | | | | | | | | | | | | | |
Chevron Corporation | | | | | | | | | | | 34,400 | | | | 3,837,664 | |
Exxon Mobil Corporation | | | | | | | | | | | 90,400 | | | | 7,891,920 | |
World Fuel Services Corporation | | | | | | | | | | | 168,323 | | | | 7,483,641 | |
| |
| | | | 19,213,225 | |
| | | | | | | | | | | | | | | | |
| | | | |
Financials: 25.42% | | | | | | | | | | | | | | | | |
| | | | |
| Banks: 7.92% | | | | | | | | | | | | | | | | |
Bank of America Corporation | | | | | | | | | | | 359,850 | | | | 7,600,032 | |
JPMorgan Chase & Company | | | | | | | | | | | 136,700 | | | | 10,959,239 | |
PNC Financial Services Group Incorporated | | | | | | | | | | | 78,000 | | | | 8,622,120 | |
| |
| | | | 27,181,391 | |
| | | | | | | | | | | | | | | | |
| | | | |
| Capital Markets: 2.85% | | | | | | | | | | | | | | | | |
State Street Corporation | | | | | | | | | | | 124,200 | | | | 9,786,960 | |
| | | | | | | | | | | | | | | | |
The accompanying notes are an integral part of these financial statements.
| | | | |
| 60 | | Wells Fargo Equity Gateway Funds | | Portfolio of investments—November 30, 2016 (unaudited) |
C&B LARGE CAP VALUE PORTFOLIO
| | | | | | | | | | | | | | | | |
| Security name | | | | | | | | Shares | | | Value | |
| | | | |
| Consumer Finance: 2.13% | | | | | | | | | | | | | | | | |
American Express Company | | | | | | | | | | | 101,200 | | | $ | 7,290,448 | |
| | | | | | | | | | | | | | | | |
| | | | |
| Diversified Financial Services: 2.41% | | | | | | | | | | | | | | | | |
Berkshire Hathaway Incorporated Class B † | | | | | | | | | | | 52,440 | | | | 8,256,154 | |
| | | | | | | | | | | | | | | | |
| | | | |
| Insurance: 10.11% | | | | | | | | | | | | | | | | |
Chubb Limited | | | | | | | | | | | 54,900 | | | | 7,027,200 | |
FNF Group | | | | | | | | | | | 263,600 | | | | 8,419,384 | |
RenaissanceRe Holdings Limited | | | | | | | | | | | 79,290 | | | | 10,352,102 | |
The Progressive Corporation | | | | | | | | | | | 266,100 | | | | 8,861,130 | |
| |
| | | | 34,659,816 | |
| | | | | | | | | | | | | | | | |
| | | | |
Health Care: 14.15% | | | | | | | | | | | | | | | | |
| | | | |
| Health Care Equipment & Supplies: 4.02% | | | | | | | | | | | | | | | | |
Abbott Laboratories | | | | | | | | | | | 234,200 | | | | 8,915,994 | |
Becton Dickinson & Company | | | | | | | | | | | 28,800 | | | | 4,870,080 | |
| |
| | | | 13,786,074 | |
| | | | | | | | | | | | | | | | |
| | | | |
| Health Care Providers & Services: 7.39% | | | | | | | | | | | | | | | | |
Cardinal Health Incorporated | | | | | | | | | | | 94,440 | | | | 6,706,184 | |
Laboratory Corporation of America Holdings † | | | | | | | | | | | 85,650 | | | | 10,779,053 | |
UnitedHealth Group Incorporated | | | | | | | | | | | 49,615 | | | | 7,855,047 | |
| |
| | | | 25,340,284 | |
| | | | | | | | | | | | | | | | |
| | | | |
| Pharmaceuticals: 2.74% | | | | | | | | | | | | | | | | |
Allergan plc | | | | | | | | | | | 18,100 | | | | 3,516,830 | |
Johnson & Johnson | | | | | | | | | | | 53,015 | | | | 5,900,570 | |
| |
| | | | 9,417,400 | |
| | | | | | | | | | | | | | | | |
| | | | |
Industrials: 17.04% | | | | | | | | | | | | | | | | |
| | | | |
| Aerospace & Defense: 2.17% | | | | | | | | | | | | | | | | |
Rockwell Collins Incorporated | | | | | | | | | | | 80,367 | | | | 7,451,628 | |
| | | | | | | | | | | | | | | | |
| | | | |
| Air Freight & Logistics: 2.08% | | | | | | | | | | | | | | | | |
United Parcel Service Incorporated Class B | | | | | | | | | | | 61,500 | | | | 7,129,080 | |
| | | | | | | | | | | | | | | | |
| | | | |
| Electrical Equipment: 4.03% | | | | | | | | | | | | | | | | |
AMETEK Incorporated | | | | | | | | | | | 107,900 | | | | 5,109,065 | |
Eaton Corporation plc | | | | | | | | | | | 131,200 | | | | 8,726,112 | |
| |
| | | | 13,835,177 | |
| | | | | | | | | | | | | | | | |
| | | | |
| Industrial Conglomerates: 1.28% | | | | | | | | | | | | | | | | |
3M Company | | | | | | | | | | | 25,600 | | | | 4,396,544 | |
| | | | | | | | | | | | | | | | |
| | | | |
| Machinery: 4.44% | | | | | | | | | | | | | | | | |
Donaldson Company Incorporated | | | | | | | | | | | 181,000 | | | | 7,341,360 | |
Parker-Hannifin Corporation | | | | | | | | | | | 56,771 | | | | 7,887,195 | |
| |
| | | | 15,228,555 | |
| | | | | | | | | | | | | | | | |
The accompanying notes are an integral part of these financial statements.
| | | | | | |
| Portfolio of investments—November 30, 2016 (unaudited) | | Wells Fargo Equity Gateway Funds | | | 61 | |
C&B LARGE CAP VALUE PORTFOLIO
| | | | | | | | | | | | | | | | |
| Security name | | | | | | | | Shares | | | Value | |
| | | | |
| Trading Companies & Distributors: 3.04% | | | | | | | | | | | | | | | | |
AerCap Holdings NV † | | | | | | | | | | | 243,100 | | | $ | 10,416,835 | |
| | | | | | | | | | | | | | | | |
| | | | |
Information Technology: 8.91% | | | | | | | | | | | | | | | | |
| | | | |
| Electronic Equipment, Instruments & Components: 1.00% | | | | | | | | | | | | | | | | |
TE Connectivity Limited | | | | | | | | | | | 50,500 | | | | 3,415,820 | |
| | | | | | | | | | | | | | | | |
| | | | |
| IT Services: 5.73% | | | | | | | | | | | | | | | | |
Alliance Data Systems Corporation | | | | | | | | | | | 34,988 | | | | 8,004,555 | |
Cognizant Technology Solutions Corporation Class A † | | | | | | | | | | | 134,800 | | | | 7,424,784 | |
The Western Union Company | | | | | | | | | | | 199,900 | | | | 4,203,897 | |
| | | | |
| | | | | | | | | | | | | | | 19,633,236 | |
| | | | | | | | | | | | | | | | |
| | | | |
| Semiconductors & Semiconductor Equipment: 2.18% | | | | | | | | | | | | | | | | |
Linear Technology Corporation | | | | | | | | | | | 119,800 | | | | 7,491,094 | |
| | | | | | | | | | | | | | | | |
| | | | |
Materials: 5.67% | | | | | | | | | | | | | | | | |
| | | | |
| Chemicals: 2.14% | | | | | | | | | | | | | | | | |
Axalta Coating Systems Limited † | | | | | | | | | | | 278,550 | | | | 7,359,291 | |
| | | | | | | | | | | | | | | | |
| | | | |
| Containers & Packaging: 3.53% | | | | | | | | | | | | | | | | |
Ball Corporation | | | | | | | | | | | 67,800 | | | | 5,089,069 | |
Crown Holdings Incorporated † | | | | | | | | | | | 128,900 | | | | 7,010,871 | |
| | | | |
| | | | | | | | | | | | | | | 12,099,940 | |
| | | | | | | | | | | | | | | | |
| | | | |
Real Estate: 1.61% | | | | | | | | | | | | | | | | |
| | | | |
| Real Estate Management & Development: 1.61% | | | | | | | | | | | | | | | | |
CBRE Group Incorporated Class A † | | | | | | | | | | | 189,600 | | | | 5,505,981 | |
| | | | | | | | | | | | | | | | |
| | | | |
Total Common Stocks (Cost $252,599,693) | | | | | | | | | | | | | | | 333,382,884 | |
| | | | | | | | | | | | | | | | |
| | | | |
| | | Yield | | | | | | | | | | |
| | | | |
Short-Term Investments: 5.28% | | | | | | | | | | | | | | | | |
| | | | |
| Investment Companies: 5.28% | | | | | | | | | | | | | | | | |
Securities Lending Cash Investment LLC (l)(r)(u) | | | 0.65 | % | | | | | | | 6,884,213 | | | | 6,884,901 | |
Wells Fargo Government Money Market Fund Select Class (l)(u) | | | 0.31 | | | | | | | | 11,232,148 | | | | 11,232,148 | |
| | | | |
Total Short-Term Investments (Cost $18,117,000) | | | | | | | | | | | | | | | 18,117,049 | |
| | | | | | | | | | | | | | | | |
| | | | | | | | |
| Total investments in securities (Cost $270,716,693) * | | | 102.48 | % | | | 351,499,933 | |
Other assets and liabilities, net | | | (2.48 | ) | | | (8,502,706 | ) |
| | | | | | | | |
| Total net assets | | | 100.00 | % | | $ | 342,997,227 | |
| | | | | | | | |
| « | All or a portion of this security is on loan. |
| † | Non-income-earning security |
| (l) | The issuer of the security is an affiliated person of the Portfolio as defined in the Investment Company Act of 1940. |
| (r) | The investment is a non-registered investment vehicle purchased with cash collateral received from securities on loan. |
| (u) | The rate represents the 7-day annualized yield at period end. |
| * | Cost for federal income tax purposes is $271,791,273 and unrealized gains (losses) consists of: |
| | | | |
Gross unrealized gains | | $ | 82,237,521 | |
Gross unrealized losses | | | (2,528,861 | ) |
| | | | |
Net unrealized gains | | $ | 79,708,660 | |
The accompanying notes are an integral part of these financial statements.
| | | | |
| 62 | | Wells Fargo Equity Gateway Funds | | Portfolio of investments—November 30, 2016 (unaudited) |
DIVERSIFIED LARGE CAP GROWTH PORTFOLIO
| | | | | | | | | | | | | | | | |
| Security name | | | | | | | | Shares | | | Value | |
| | | | |
Common Stocks: 98.53% | | | | | | | | | | | | | | | | |
| | | | |
Consumer Discretionary: 20.20% | | | | | | | | | | | | | | | | |
| | | | |
| Auto Components: 0.03% | | | | | | | | | | | | | | | | |
Delphi Automotive plc | | | | | | | | | | | 570 | | | $ | 36,480 | |
| | | | | | | | | | | | | | | | |
| | | | |
| Distributors: 0.19% | | | | | | | | | | | | | | | | |
LKQ Corporation † | | | | | | | | | | | 6,270 | | | | 205,844 | |
| | | | | | | | | | | | | | | | |
| | | | |
| Hotels, Restaurants & Leisure: 2.88% | | | | | | | | | | | | | | | | |
Marriott International Incorporated Class A | | | | | | | | | | | 2,930 | | | | 230,825 | |
Starbucks Corporation | | | | | | | | | | | 35,748 | | | | 2,072,312 | |
Yum China Holdings Incorporated † | | | | | | | | | | | 220 | | | | 6,186 | |
Yum! Brands Incorporated | | | | | | | | | | | 11,620 | | | | 736,592 | |
| | | | |
| | | | | | | | | | | | | | | 3,045,915 | |
| | | | | | | | | | | | | | | | |
| | | | |
| Internet & Direct Marketing Retail: 6.19% | | | | | | | | | | | | | | | | |
Amazon.com Incorporated † | | | | | | | | | | | 7,980 | | | | 5,989,549 | |
The Priceline Group Incorporated † | | | | | | | | | | | 380 | | | | 571,398 | |
| | | | |
| | | | | | | | | | | | | | | 6,560,947 | |
| | | | | | | | | | | | | | | | |
| | | | |
| Media: 1.00% | | | | | | | | | | | | | | | | |
Charter Communications Incorporated Class A † | | | | | | | | | | | 3,500 | | | | 963,585 | |
The Walt Disney Company | | | | | | | | | | | 940 | | | | 93,173 | |
| | | | |
| | | | | | | | | | | | | | | 1,056,758 | |
| | | | | | | | | | | | | | | | |
| | | | |
| Multiline Retail: 2.30% | | | | | | | | | | | | | | | | |
Dollar Tree Incorporated † | | | | | | | | | | | 27,590 | | | | 2,432,334 | |
| | | | | | | | | | | | | | | | |
| | | | |
| Specialty Retail: 6.09% | | | | | | | | | | | | | | | | |
Burlington Stores Incorporated † | | | | | | | | | | | 2,560 | | | | 225,075 | |
O’Reilly Automotive Incorporated † | | | | | | | | | | | 7,210 | | | | 1,979,145 | |
The Home Depot Incorporated | | | | | | | | | | | 20,440 | | | | 2,644,936 | |
The TJX Companies Incorporated | | | | | | | | | | | 11,140 | | | | 872,708 | |
Tractor Supply Company | | | | | | | | | | | 6,730 | | | | 505,221 | |
ULTA Salon Cosmetics & Fragrance Incorporated † | | | | | | | | | | | 880 | | | | 228,360 | |
| | | | |
| | | | | | | | | | | | | | | 6,455,445 | |
| | | | | | | | | | | | | | | | |
| | | | |
| Textiles, Apparel & Luxury Goods: 1.52% | | | | | | | | | | | | | | | | |
Nike Incorporated Class B | | | | | | | | | | | 12,510 | | | | 626,376 | |
Under Armour Incorporated Class A « | | | | | | | | | | | 10,670 | | | | 328,636 | |
Under Armour Incorporated Class C † | | | | | | | | | | | 3,215 | | | | 82,883 | |
VF Corporation | | | | | | | | | | | 10,480 | | | | 571,265 | |
| | | | |
| | | | | | | | | | | | | | | 1,609,160 | |
| | | | | | | | | | | | | | | | |
| | | | |
Consumer Staples: 5.26% | | | | | | | | | | | | | | | | |
| | | | |
| Beverages: 2.39% | | | | | | | | | | | | | | | | |
Constellation Brands Incorporated Class A | | | | | | | | | | | 7,900 | | | | 1,194,006 | |
Monster Beverage Corporation † | | | | | | | | | | | 18,360 | | | | 821,610 | |
The Coca-Cola Company | | | | | | | | | | | 12,640 | | | | 510,024 | |
| | | | |
| | | | | | | | | | | | | | | 2,525,640 | |
| | | | | | | | | | | | | | | | |
The accompanying notes are an integral part of these financial statements.
| | | | | | |
| Portfolio of investments—November 30, 2016 (unaudited) | | Wells Fargo Equity Gateway Funds | | | 63 | |
DIVERSIFIED LARGE CAP GROWTH PORTFOLIO
| | | | | | | | | | | | | | | | |
| Security name | | | | | | | | Shares | | | Value | |
| | | | |
| Food & Staples Retailing: 0.95% | | | | | | | | | | | | | | | | |
Costco Wholesale Corporation | | | | | | | | | | | 6,730 | | | $ | 1,010,240 | |
| | | | | | | | | | | | | | | | |
| | | | |
| Household Products: 0.50% | | | | | | | | | | | | | | | | |
Colgate-Palmolive Company | | | | | | | | | | | 8,150 | | | | 531,625 | |
| | | | | | | | | | | | | | | | |
| | | | |
| Personal Products: 0.95% | | | | | | | | | | | | | | | | |
The Estee Lauder Companies Incorporated Class A | | | | | | | | | | | 12,930 | | | | 1,004,661 | |
| | | | | | | | | | | | | | | | |
| | | | |
| Tobacco: 0.47% | | | | | | | | | | | | | | | | |
Reynolds American Incorporated | | | | | | | | | | | 9,250 | | | | 500,425 | |
| | | | | | | | | | | | | | | | |
| | | | |
Energy: 1.68% | | | | | | | | | | | | | | | | |
| | | | |
| Energy Equipment & Services: 0.38% | | | | | | | | | | | | | | | | |
Schlumberger Limited | | | | | | | | | | | 4,850 | | | | 407,643 | |
| | | | | | | | | | | | | | | | |
| | | | |
| Oil, Gas & Consumable Fuels: 1.30% | | | | | | | | | | | | | | | | |
Concho Resources Incorporated † | | | | | | | | | | | 8,620 | | | | 1,232,832 | |
EOG Resources Incorporated | | | | | | | | | | | 1,210 | | | | 124,049 | |
Extraction Oil & Gas Incorporated † | | | | | | | | | | | 753 | | | | 17,718 | |
| | | | |
| | | | | | | | | | | | | | | 1,374,599 | |
| | | | | | | | | | | | | | | | |
| | | | |
Financials: 2.17% | | | | | | | | | | | | | | | | |
| | | | |
| Capital Markets: 2.17% | | | | | | | | | | | | | | | | |
Goldman Sachs Group Incorporated | | | | | | | | | | | 660 | | | | 144,731 | |
Intercontinental Exchange Incorporated | | | | | | | | | | | 16,200 | | | | 897,480 | |
S&P Global Incorporated | | | | | | | | | | | 4,810 | | | | 572,342 | |
TD Ameritrade Holding Corporation | | | | | | | | | | | 4,220 | | | | 173,062 | |
The Charles Schwab Corporation | | | | | | | | | | | 13,160 | | | | 508,766 | |
| | | | |
| | | | | | | | | | | | | | | 2,296,381 | |
| | | | | | | | | | | | | | | | |
| | | | |
Health Care: 12.84% | | | | | | | | | | | | | | | | |
| | | | |
| Biotechnology: 6.97% | | | | | | | | | | | | | | | | |
Alexion Pharmaceuticals Incorporated † | | | | | | | | | | | 3,740 | | | | 458,487 | |
Amgen Incorporated | | | | | | | | | | | 2,500 | | | | 360,175 | |
Biogen Incorporated † | | | | | | | | | | | 700 | | | | 205,849 | |
BioMarin Pharmaceutical Incorporated † | | | | | | | | | | | 12,020 | | | | 1,029,273 | |
Celgene Corporation † | | | | | | | | | | | 25,510 | | | | 3,023,190 | |
Incyte Corporation | | | | | | | | | | | 5,570 | | | | 569,755 | |
Regeneron Pharmaceuticals Incorporated † | | | | | | | | | | | 2,950 | | | | 1,118,758 | |
Tesaro Incorporated Ǡ | | | | | | | | | | | 1,180 | | | | 160,114 | |
Vertex Pharmaceuticals Incorporated † | | | | | | | | | | | 5,610 | | | | 457,832 | |
| | | | |
| | | | | | | | | | | | | | | 7,383,433 | |
| | | | | | | | | | | | | | | | |
| | | | |
| Health Care Equipment & Supplies: 2.41% | | | | | | | | | | | | | | | | |
Baxter International Incorporated | | | | | | | | | | | 13,380 | | | | 593,671 | |
Boston Scientific Corporation † | | | | | | | | | | | 26,200 | | | | 536,052 | |
Danaher Corporation | | | | | | | | | | | 7,650 | | | | 598,001 | |
Edwards Lifesciences Corporation † | | | | | | | | | | | 1,530 | | | | 126,761 | |
Intuitive Surgical Incorporated † | | | | | | | | | | | 1,090 | | | | 701,677 | |
| | | | |
| | | | | | | | | | | | | | | 2,556,162 | |
| | | | | | | | | | | | | | | | |
The accompanying notes are an integral part of these financial statements.
| | | | |
| 64 | | Wells Fargo Equity Gateway Funds | | Portfolio of investments—November 30, 2016 (unaudited) |
DIVERSIFIED LARGE CAP GROWTH PORTFOLIO
| | | | | | | | | | | | | | | | |
| Security name | | | | | | | | Shares | | | Value | |
| | | | |
| Health Care Providers & Services: 2.24% | | | | | | | | | | | | | | | | |
Acadia Healthcare Company Incorporated Ǡ | | | | | | | | | | | 23,230 | | | $ | 882,972 | |
UnitedHealth Group Incorporated | | | | | | | | | | | 8,460 | | | | 1,339,387 | |
VCA Incorporated † | | | | | | | | | | | 2,430 | | | | 152,118 | |
| | | | |
| | | | | | | | | | | | | | | 2,374,477 | |
| | | | | | | | | | | | | | | | |
| | | | |
| Pharmaceuticals: 1.22% | | | | | | | | | | | | | | | | |
Eli Lilly & Company | | | | | | | | | | | 3,070 | | | | 206,058 | |
Zoetis Incorporated | | | | | | | | | | | 21,522 | | | | 1,084,278 | |
| | | | |
| | | | | | | | | | | | | | | 1,290,336 | |
| | | | | | | | | | | | | | | | |
| | | | |
Industrials: 9.54% | | | | | | | | | | | | | | | | |
| | | | |
| Aerospace & Defense: 0.66% | | | | | | | | | | | | | | | | |
The Boeing Company | | | | | | | | | | | 4,610 | | | | 694,082 | |
| | | | | | | | | | | | | | | | |
| | | | |
| Air Freight & Logistics: 0.90% | | | | | | | | | | | | | | | | |
FedEx Corporation | | | | | | | | | | | 2,900 | | | | 555,843 | |
United Parcel Service Incorporated Class B | | | | | | | | | | | 3,440 | | | | 398,765 | |
| | | | |
| | | | | | | | | | | | | | | 954,608 | |
| | | | | | | | | | | | | | | | |
| | | | |
| Airlines: 0.11% | | | | | | | | | | | | | | | | |
Southwest Airlines Company | | | | | | | | | | | 2,443 | | | | 113,868 | |
| | | | | | | | | | | | | | | | |
| | | | |
| Building Products: 0.70% | | | | | | | | | | | | | | | | |
Johnson Controls International plc | | | | | | | | | | | 16,538 | | | | 743,879 | |
| | | | | | | | | | | | | | | | |
| | | | |
| Commercial Services & Supplies: 2.11% | | | | | | | | | | | | | | | | |
KAR Auction Services Incorporated | | | | | | | | | | | 18,011 | | | | 759,344 | |
Waste Connections Incorporated | | | | | | | | | | | 19,303 | | | | 1,475,521 | |
| | | | |
| | | | | | | | | | | | | | | 2,234,865 | |
| | | | | | | | | | | | | | | | |
| | | | |
| Electrical Equipment: 0.73% | | | | | | | | | | | | | | | | |
Acuity Brands Incorporated | | | | | | | | | | | 1,760 | | | | 442,482 | |
Rockwell Automation Incorporated | | | | | | | | | | | 2,500 | | | | 334,275 | |
| | | | |
| | | | | | | | | | | | | | | 776,757 | |
| | | | | | | | | | | | | | | | |
| | | | |
| Industrial Conglomerates: 0.81% | | | | | | | | | | | | | | | | |
3M Company | | | | | | | | | | | 3,480 | | | | 597,655 | |
Honeywell International Incorporated | | | | | | | | | | | 2,290 | | | | 260,923 | |
| | | | |
| | | | | | | | | | | | | | | 858,578 | |
| | | | | | | | | | | | | | | | |
| | | | |
| Machinery: 0.35% | | | | | | | | | | | | | | | | |
Fortive Corporation | | | | | | | | | | | 6,805 | | | | 374,207 | |
| | | | | | | | | | | | | | | | |
| | | | |
| Road & Rail: 3.17% | | | | | | | | | | | | | | | | |
Kansas City Southern | | | | | | | | | | | 10,610 | | | | 941,213 | |
Norfolk Southern Corporation | | | | | | | | | | | 5,470 | | | | 582,336 | |
Union Pacific Corporation | | | | | | | | | | | 18,090 | | | | 1,833,060 | |
| | | | |
| | | | | | | | | | | | | | | 3,356,609 | |
| | | | | | | | | | | | | | | | |
The accompanying notes are an integral part of these financial statements.
| | | | | | |
| Portfolio of investments—November 30, 2016 (unaudited) | | Wells Fargo Equity Gateway Funds | | | 65 | |
DIVERSIFIED LARGE CAP GROWTH PORTFOLIO
| | | | | | | | | | | | | | | | |
| Security name | | | | | | | | Shares | | | Value | |
| | | | |
Information Technology: 43.41% | | | | | | | | | | | | | | | | |
| | | | |
| Communications Equipment: 1.01% | | | | | | | | | | | | | | | | |
Harris Corporation | | | | | | | | | | | 7,180 | | | $ | 743,561 | |
Palo Alto Networks Incorporated † | | | | | | | | | | | 2,470 | | | | 331,894 | |
| | | | |
| | | | | | | | | | | | | | | 1,075,455 | |
| | | | | | | | | | | | | | | | |
| | | | |
| Internet Software & Services: 13.69% | | | | | | | | | | | | | | | | |
Alphabet Incorporated Class A † | | | | | | | | | | | 6,574 | | | | 5,100,635 | |
Alphabet Incorporated Class C † | | | | | | | | | | | 2,764 | | | | 2,095,223 | |
CoStar Group Incorporated † | | | | | | | | | | | 1,340 | | | | 256,087 | |
eBay Incorporated † | | | | | | | | | | | 31,680 | | | | 881,021 | |
Facebook Incorporated Class A † | | | | | | | | | | | 45,210 | | | | 5,353,768 | |
MercadoLibre Incorporated | | | | | | | | | | | 890 | | | | 140,460 | |
Tencent Holdings Limited ADR | | | | | | | | | | | 27,150 | | | | 677,121 | |
| | | | |
| | | | | | | | | | | | | | | 14,504,315 | |
| | | | | | | | | | | | | | | | |
| | | | |
| IT Services: 9.63% | | | | | | | | | | | | | | | | |
Accenture plc Class A | | | | | | | | | | | 7,300 | | | | 871,839 | |
Fidelity National Information Services Incorporated | | | | | | | | | | | 14,360 | | | | 1,108,448 | |
FleetCor Technologies Incorporated † | | | | | | | | | | | 5,120 | | | | 764,621 | |
Global Payments Incorporated | | | | | | | | | | | 770 | | | | 52,784 | |
MasterCard Incorporated Class A | | | | | | | | | | | 19,490 | | | | 1,991,878 | |
PayPal Holdings Incorporated † | | | | | | | | | | | 46,750 | | | | 1,836,340 | |
Visa Incorporated Class A | | | | | | | | | | | 46,290 | | | | 3,579,143 | |
| | | | |
| | | | | | | | | | | | | | | 10,205,053 | |
| | | | | | | | | | | | | | | | |
| | | | |
| Semiconductors & Semiconductor Equipment: 6.08% | | | | | | | | | | | | | | | | |
Broadcom Limited | | | | | | | | | | | 12,271 | | | | 2,092,083 | |
Microchip Technology Incorporated | | | | | | | | | | | 32,239 | | | | 2,133,577 | |
NXP Semiconductors NV † | | | | | | | | | | | 1,940 | | | | 192,351 | |
QUALCOMM Incorporated | | | | | | | | | | | 6,630 | | | | 451,702 | |
Texas Instruments Incorporated | | | | | | | | | | | 21,260 | | | | 1,571,752 | |
| | | | |
| | | | | | | | | | | | | | | 6,441,465 | |
| | | | | | | | | | | | | | | | |
| | | | |
| Software: 11.39% | | | | | | | | | | | | | | | | |
Activision Blizzard Incorporated | | | | | | | | | | | 3,270 | | | | 119,715 | |
Adobe Systems Incorporated † | | | | | | | | | | | 16,950 | | | | 1,742,630 | |
Electronic Arts Incorporated † | | | | | | | | | | | 10,430 | | | | 826,473 | |
Microsoft Corporation | | | | | | | | | | | 68,840 | | | | 4,148,298 | |
Red Hat Incorporated † | | | | | | | | | | | 3,840 | | | | 303,782 | |
Salesforce.com Incorporated † | | | | | | | | | | | 19,884 | | | | 1,431,648 | |
ServiceNow Incorporated † | | | | | | | | | | | 11,610 | | | | 965,372 | |
Splunk Incorporated † | | | | | | | | | | | 20,758 | | | | 1,196,076 | |
Symantec Corporation | | | | | | | | | | | 26,360 | | | | 642,920 | |
Ultimate Software Group Incorporated † | | | | | | | | | | | 3,376 | | | | 691,844 | |
| | | | |
| | | | | | | | | | | | | | | 12,068,758 | |
| | | | | | | | | | | | | | | | |
| | | | |
| Technology Hardware, Storage & Peripherals: 1.61% | | | | | | | | | | | | | | | | |
Apple Incorporated | | | | | | | | | | | 15,447 | | | | 1,707,202 | |
| | | | | | | | | | | | | | | | |
The accompanying notes are an integral part of these financial statements.
| | | | |
| 66 | | Wells Fargo Equity Gateway Funds | | Portfolio of investments—November 30, 2016 (unaudited) |
DIVERSIFIED LARGE CAP GROWTH PORTFOLIO
| | | | | | | | | | | | | | | | |
| Security name | | | | | | | | Shares | | | Value | |
| | | | |
Materials: 3.13% | | | | | | | | | | | | | | | | |
| | | | |
| Chemicals: 3.13% | | | | | | | | | | | | | | | | |
Ecolab Incorporated | | | | | | | | | | | 12,300 | | | $ | 1,435,779 | |
Praxair Incorporated | | | | | | | | | | | 11,000 | | | | 1,323,300 | |
The Sherwin-Williams Company | | | | | | | | | | | 2,100 | | | | 564,204 | |
| | | | |
| | | | | | | | | | | | | | | 3,323,283 | |
| | | | | | | | | | | | | | | | |
| | | | |
Real Estate: 0.30% | | | | | | | | | | | | | | | | |
| | | | |
| Equity REITs: 0.30% | | | | | | | | | | | | | | | | |
American Tower Corporation | | | | | | | | | | | 3,080 | | | | 314,992 | |
| | | | | | | | | | | | | | | | |
| | | | |
Total Common Stocks (Cost $71,168,423) | | | | | | | | | | | | | | | 104,406,481 | |
| | | | | | | | | | | | | | | | |
| | | | |
| | | Yield | | | | | | | | | | |
| Short-Term Investments: 2.37% | | | | | | | | | | | | | | | | |
| | | | |
| Investment Companies: 2.37% | | | | | | | | | | | | | | | | |
Securities Lending Cash Investment LLC (l)(r)(u) | | | 0.65 | % | | | | | | | 1,030,133 | | | | 1,030,236 | |
Wells Fargo Government Money Market Fund Select Class (l)(u) | | | 0.31 | | | | | | | | 1,480,422 | | | | 1,480,422 | |
| | | | |
Total Short-Term Investments (Cost $2,510,604) | | | | | | | | | | | | | | | 2,510,658 | |
| | | | | | | | | | | | | | | | |
| | | | | | | | |
| | |
| Total investments in securities (Cost $73,679,027) * | | | 100.90 | % | | | 106,917,139 | |
Other assets and liabilities, net | | | (0.90 | ) | | | (954,171 | ) |
| | | | | | | | |
| Total net assets | | | 100.00 | % | | $ | 105,962,968 | |
| | | | | | | | |
| † | Non-income-earning security |
| « | All or a portion of this security is on loan. |
| (l) | The issuer of the security is an affiliated person of the Portfolio as defined in the Investment Company Act of 1940. |
| (r) | The investment is a non-registered investment vehicle purchased with cash collateral received from securities on loan. |
| (u) | The rate represents the 7-day annualized yield at period end. |
| * | Cost for federal income tax purposes is $73,569,746 and unrealized gains (losses) consists of: |
| | | | |
Gross unrealized gains | | $ | 34,231,628 | |
Gross unrealized losses | | | (884,235 | ) |
| | | | |
Net unrealized gains | | $ | 33,347,393 | |
The accompanying notes are an integral part of these financial statements.
| | | | | | |
| Portfolio of investments—November 30, 2016 (unaudited) | | Wells Fargo Equity Gateway Funds | | | 67 | |
EMERGING GROWTH PORTFOLIO
| | | | | | | | | | | | | | | | |
| Security name | | | | | | | | Shares | | | Value | |
| | | | |
Common Stocks: 97.34% | | | | | | | | | | | | | | | | |
| | | | |
Consumer Discretionary: 12.14% | | | | | | | | | | | | | | | | |
| | | | |
| Auto Components: 1.38% | | | | | | | | | | | | | | | | |
Cooper-Standard Holdings Incorporated † | | | | | | | | | | | 34,100 | | | $ | 3,250,412 | |
Drew Industries Incorporated | | | | | | | | | | | 46,300 | | | | 4,866,130 | |
Motorcar Parts of America Incorporated † | | | | | | | | | | | 122,391 | | | | 2,993,684 | |
| |
| | | | 11,110,226 | |
| | | | | | | | | | | | | | | | |
| | | | |
| Diversified Consumer Services: 1.35% | | | | | | | | | | | | | | | | |
Grand Canyon Education Incorporated † | | | | | | | | | | | 190,420 | | | | 10,872,982 | |
| | | | | | | | | | | | | | | | |
| | | | |
| Hotels, Restaurants & Leisure: 2.85% | | | | | | | | | | | | | | | | |
Planet Fitness Incorporated Class A « | | | | | | | | | | | 344,231 | | | | 6,977,562 | |
The Habit Restaurants Incorporated Class A Ǡ | | | | | | | | | | | 483,908 | | | | 8,129,654 | |
Wingstop Incorporated « | | | | | | | | | | | 255,778 | | | | 7,849,827 | |
| |
| | | | 22,957,043 | |
| | | | | | | | | | | | | | | | |
| | | | |
| Household Durables: 0.30% | | | | | | | | | | | | | | | | |
Universal Electronics Incorporated † | | | | | | | | | | | 36,000 | | | | 2,424,600 | |
| | | | | | | | | | | | | | | | |
| | | | |
| Leisure Products: 1.16% | | | | | | | | | | | | | | | | |
MCBC Holdings Incorporated | | | | | | | | | | | 289,912 | | | | 3,896,417 | |
Nautilus Group Incorporated † | | | | | | | | | | | 315,800 | | | | 5,431,760 | |
| |
| | | | 9,328,177 | |
| | | | | | | | | | | | | | | | |
| | | | |
| Media: 1.36% | | | | | | | | | | | | | | | | |
IMAX Corporation † | | | | | | | | | | | 343,040 | | | | 10,960,128 | |
| | | | | | | | | | | | | | | | |
| | | | |
| Multiline Retail: 0.86% | | | | | | | | | | | | | | | | |
Ollie’s Bargain Outlet Holdings Incorporated «† | | | | | | | | | | | 231,900 | | | | 6,968,595 | |
| | | | | | | | | | | | | | | | |
| | | | |
| Specialty Retail: 2.88% | | | | | | | | | | | | | | | | |
Camping World Holdings Incorporated | | | | | | | | | | | 113,700 | | | | 3,172,230 | |
Five Below Incorporated † | | | | | | | | | | | 98,207 | | | | 3,865,428 | |
Lithia Motors Incorporated Class A | | | | | | | | | | | 121,720 | | | | 11,186,068 | |
Sportsman’s Warehouse Holdings Incorporated † | | | | | | | | | | | 555,463 | | | | 4,999,167 | |
| |
| | | | 23,222,893 | |
| | | | | | | | | | | | | | | | |
| | | | |
Energy: 3.62% | | | | | | | | | | | | | | | | |
| | | | |
| Oil, Gas & Consumable Fuels: 3.62% | | | | | | | | | | | | | | | | |
Extraction Oil & Gas Incorporated | | | | | | | | | | | 58,588 | | | | 1,378,576 | |
Matador Resources Company † | | | | | | | | | | | 157,236 | | | | 4,188,767 | |
PDC Energy Incorporated † | | | | | | | | | | | 135,190 | | | | 10,064,896 | |
RSP Permian Incorporated † | | | | | | | | | | | 302,358 | | | | 13,500,285 | |
| |
| | | | 29,132,524 | |
| | | | | | | | | | | | | | | | |
| | | | |
Financials: 6.25% | | | | | | | | | | | | | | | | |
| | | | |
| Capital Markets: 4.20% | | | | | | | | | | | | | | | | |
Financial Engines Incorporated « | | | | | | | | | | | 280,920 | | | | 9,790,062 | |
MarketAxess Holdings Incorporated | | | | | | | | | | | 145,041 | | | | 24,043,447 | |
| |
| | | | 33,833,509 | |
| | | | | | | | | | | | | | | | |
The accompanying notes are an integral part of these financial statements.
| | | | |
| 68 | | Wells Fargo Equity Gateway Funds | | Portfolio of investments—November 30, 2016 (unaudited) |
EMERGING GROWTH PORTFOLIO
| | | | | | | | | | | | | | | | |
| Security name | | | | | | | | Shares | | | Value | |
| | | | |
| Insurance: 0.29% | | | | | | | | | | | | | | | | |
Kinsale Capital Group Incorporated | | | | | | | | | | | 80,948 | | | $ | 2,307,827 | |
| | | | | | | | | | | | | | | | |
| | | | |
| Thrifts & Mortgage Finance: 1.76% | | | | | | | | | | | | | | | | |
LendingTree Incorporated † | | | | | | | | | | | 135,512 | | | | 14,201,658 | |
| | | | | | | | | | | | | | | | |
| | | | |
Health Care: 28.71% | | | | | | | | | | | | | | | | |
| | | | |
| Biotechnology: 6.13% | | | | | | | | | | | | | | | | |
Alder Biopharmaceuticals Incorporated Ǡ | | | | | | | | | | | 147,900 | | | | 3,483,045 | |
Ligand Pharmaceuticals Incorporated Ǡ | | | | | | | | | | | 178,380 | | | | 18,622,872 | |
Radius Health Incorporated Ǡ | | | | | | | | | | | 126,105 | | | | 6,711,308 | |
Repligen Corporation † | | | | | | | | | | | 306,850 | | | | 9,880,570 | |
Spark Therapeutics Incorporated Ǡ | | | | | | | | | | | 85,300 | | | | 4,692,353 | |
Ultragenyx Pharmaceutical Incorporated † | | | | | | | | | | | 76,734 | | | | 6,007,505 | |
| |
| | | | 49,397,653 | |
| | | | | | | | | | | | | | | | |
| | | | |
| Health Care Equipment & Supplies: 15.48% | | | | | | | | | | | | | | | | |
Abiomed Incorporated † | | | | | | | | | | | 34,330 | | | | 3,853,199 | |
Cerus Corporation Ǡ | | | | | | | | | | | 926,118 | | | | 4,834,336 | |
Cynosure Incorporated Class A † | | | | | | | | | | | 277,698 | | | | 12,593,604 | |
Entellus Medical Incorporated Ǡ | | | | | | | | | | | 188,772 | | | | 3,479,068 | |
Glaukos Corporation † | | | | | | | | | | | 366,672 | | | | 11,443,833 | |
Inogen Incorporated † | | | | | | | | | | | 136,170 | | | | 8,773,433 | |
Integra LifeSciences Holdings Corporation † | | | | | | | | | | | 138,000 | | | | 11,150,400 | |
iRhythm Technologies Incorporated † | | | | | | | | | | | 102,332 | | | | 3,121,126 | |
Natus Medical Incorporated † | | | | | | | | | | | 241,090 | | | | 9,607,437 | |
Nevro Corporation Ǡ | | | | | | | | | | | 166,165 | | | | 12,633,525 | |
NxStage Medical Incorporated † | | | | | | | | | | | 567,050 | | | | 14,017,476 | |
The Spectranetics Corporation † | | | | | | | | | | | 704,469 | | | | 15,392,640 | |
Zeltiq Aesthetics Incorporated Ǡ | | | | | | | | | | | 314,060 | | | | 13,821,781 | |
| |
| | | | 124,721,858 | |
| | | | | | | | | | | | | | | | |
| | | | |
| Health Care Providers & Services: 4.22% | | | | | | | | | | | | | | | | |
Acadia Healthcare Company Incorporated † | | | | | | | | | | | 349,530 | | | | 13,285,635 | |
HealthEquity Incorporated † | | | | | | | | | | | 367,842 | | | | 16,380,004 | |
Surgery Partners Incorporated † | | | | | | | | | | | 154,100 | | | | 2,272,975 | |
Teladoc Incorporated Ǡ | | | | | | | | | | | 112,059 | | | | 2,056,283 | |
| |
| | | | 33,994,897 | |
| | | | | | | | | | | | | | | | |
| | | | |
| Life Sciences Tools & Services: 2.26% | | | | | | | | | | | | | | | | |
ICON plc ADR † | | | | | | | | | | | 88,140 | | | | 6,666,910 | |
INC Research Holdings Incorporated Class A † | | | | | | | | | | | 232,945 | | | | 11,530,778 | |
| |
| | | | 18,197,688 | |
| | | | | | | | | | | | | | | | |
| | | | |
| Pharmaceuticals: 0.62% | | | | | | | | | | | | | | | | |
Heska Corporation † | | | | | | | | | | | 76,420 | | | | 5,052,126 | |
| | | | | | | | | | | | | | | | |
| | | | |
Industrials: 16.06% | | | | | | | | | | | | | | | | |
| | | | |
| Aerospace & Defense: 0.73% | | | | | | | | | | | | | | | | |
HEICO Corporation | | | | | | | | | | | 74,600 | | | | 5,856,100 | |
| | | | | | | | | | | | | | | | |
The accompanying notes are an integral part of these financial statements.
| | | | | | |
| Portfolio of investments—November 30, 2016 (unaudited) | | Wells Fargo Equity Gateway Funds | | | 69 | |
EMERGING GROWTH PORTFOLIO
| | | | | | | | | | | | | | | | |
| Security name | | | | | | | | Shares | | | Value | |
| | | | |
| Airlines: 0.96% | | | | | | | | | | | | | | | | |
SkyWest Incorporated | | | | | | | | | | | 209,960 | | | $ | 7,737,026 | |
| | | | | | | | | | | | | | | | |
| | | | |
| Building Products: 1.19% | | | | | | | | | | | | | | | | |
Apogee Enterprises Incorporated | | | | | | | | | | | 200,950 | | | | 9,585,315 | |
| | | | | | | | | | | | | | | | |
| | | |
| Commercial Services & Supplies: 0.58% | | | | | | | | | | | | | |
Advanced Disposal Services † | | | | | | | | | | | 134,432 | | | | 2,696,706 | |
Multi-Color Corporation | | | | | | | | | | | 27,130 | | | | 1,950,647 | |
| | | | |
| | | | | | | | | | | | | | | 4,647,353 | |
| | | | | | | | | | | | | | | | |
| | | |
| Construction & Engineering: 1.54% | | | | | | | | | | | | | |
Dycom Industries Incorporated Ǡ | | | | | | | | | | | 73,400 | | | | 5,375,082 | |
Granite Construction Incorporated | | | | | | | | | | | 119,590 | | | | 7,054,614 | |
| | | | |
| | | | | | | | | | | | | | | 12,429,696 | |
| | | | | | | | | | | | | | | | |
| | | |
| Machinery: 4.31% | | | | | | | | | | | | | |
John Bean Technologies Corporation | | | | | | | | | | | 156,410 | | | | 14,108,182 | |
Milacron Holdings Corporation † | | | | | | | | | | | 438,868 | | | | 7,412,481 | |
Mueller Water Products Incorporated Class A | | | | | | | | | | | 384,190 | | | | 5,082,834 | |
Rexnord Corporation † | | | | | | | | | | | 368,710 | | | | 8,111,620 | |
| | | | |
| | | | | | | | | | | | | | | 34,715,117 | |
| | | | | | | | | | | | | | | | |
| | | |
| Professional Services: 5.09% | | | | | | | | | | | | | |
On Assignment Incorporated † | | | | | | | | | | | 536,313 | | | | 22,144,364 | |
WageWorks Incorporated † | | | | | | | | | | | 255,824 | | | | 18,892,602 | |
| | | | |
| | | | | | | | | | | | | | | 41,036,966 | |
| | | | | | | | | | | | | | | | |
| | | |
| Trading Companies & Distributors: 1.66% | | | | | | | | | | | | | |
Beacon Roofing Supply Incorporated | | | | | | | | | | | 199,670 | | | | 9,262,691 | |
BMC Stock Holdings Incorporated † | | | | | | | | | | | 218,200 | | | | 4,113,070 | |
| | | | |
| | | | | | | | | | | | | | | 13,375,761 | |
| | | | | | | | | | | | | | | | |
| | | |
Information Technology: 30.56% | | | | | | | | | | | | | |
| | | |
| Communications Equipment: 0.36% | | | | | | | | | | | | | |
Quantenna Communications Incorporated Ǡ | | | | | | | | | | | 150,804 | | | | 2,863,768 | |
| | | | | | | | | | | | | | | | |
| | | |
| Electronic Equipment, Instruments & Components: 0.10% | | | | | | | | | | | | | |
Mercury Computer Systems Incorporated † | | | | | | | | | | | 27,500 | | | | 817,025 | |
| | | | | | | | | | | | | | | | |
| | | |
| Internet Software & Services: 10.74% | | | | | | | | | | | | | |
2U Incorporated † | | | | | | | | | | | 216,920 | | | | 7,171,375 | |
Benefitfocus Incorporated † | | | | | | | | | | | 2,039 | | | | 55,665 | |
Coupa Software Incorporated † | | | | | | | | | | | 30,805 | | | | 977,751 | |
Envestnet Incorporated † | | | | | | | | | | | 420,242 | | | | 15,170,736 | |
Five9 Incorporated † | | | | | | | | | | | 235,300 | | | | 3,724,799 | |
LogMeIn Incorporated | | | | | | | | | | | 147,500 | | | | 14,875,375 | |
Q2 Holdings Incorporated † | | | | | | | | | | | 665,143 | | | | 19,621,719 | |
SPS Commerce Incorporated † | | | | | | | | | | | 288,608 | | | | 19,991,876 | |
Xactly Corporation † | | | | | | | | | | | 350,967 | | | | 4,948,635 | |
| | | | |
| | | | | | | | | | | | | | | 86,537,931 | |
| | | | | | | | | | | | | | | | |
The accompanying notes are an integral part of these financial statements.
| | | | |
| 70 | | Wells Fargo Equity Gateway Funds | | Portfolio of investments—November 30, 2016 (unaudited) |
EMERGING GROWTH PORTFOLIO
| | | | | | | | | | | | | | | | |
| Security name | | | | | | | | Shares | | | Value | |
| | | |
| IT Services: 1.67% | | | | | | | | | | | | | |
InterXion Holding NV † | | | | | | | | | | | 393,470 | | | $ | 13,440,935 | |
| | | | | | | | | | | | | | | | |
| | | |
| Semiconductors & Semiconductor Equipment: 4.72% | | | | | | | | | | | | | |
Cavium Incorporated † | | | | | | | | | | | 151,880 | | | | 8,661,716 | |
MaxLinear Incorporated Class A † | | | | | | | | | | | 234,948 | | | | 4,799,988 | |
Microsemi Corporation † | | | | | | | | | | | 229,150 | | | | 12,545,963 | |
Monolithic Power Systems Incorporated | | | | | | | | | | | 146,910 | | | | 12,052,496 | |
| | | | |
| | | | | | | | | | | | | | | 38,060,163 | |
| | | | | | | | | | | | | | | | |
| | | | |
| Software: 12.97% | | | | | | | | | | | | | | | | |
BlackLine Incorporated † | | | | | | | | | | | 21,374 | | | | 575,816 | |
Callidus Software Incorporated † | | | | | | | | | | | 412,022 | | | | 6,468,745 | |
CommVault Systems Incorporated † | | | | | | | | | | | 113,070 | | | | 6,105,780 | |
CyberArk Software Limited † | | | | | | | | | | | 221,480 | | | | 11,297,695 | |
Guidewire Software Incorporated † | | | | | | | | | | | 64,781 | | | | 3,608,950 | |
HubSpot Incorporated † | | | | | | | | | | | 212,936 | | | | 11,945,710 | |
Paycom Software Incorporated † | | | | | | | | | | | 265,850 | | | | 11,928,690 | |
Paylocity Holding Corporation † | | | | | | | | | | | 127,353 | | | | 4,216,658 | |
Proofpoint Incorporated † | | | | | | | | | | | 270,460 | | | | 20,828,125 | |
Rapid7 Incorporated Ǡ | | | | | | | | | | | 83,928 | | | | 973,565 | |
Ringcentral Incorporated Class A † | | | | | | | | | | | 360,930 | | | | 7,778,042 | |
Synchronoss Technologies Incorporated † | | | | | | | | | | | 221,351 | | | | 10,731,096 | |
Talend SA Ǡ | | | | | | | | | | | 160,096 | | | | 3,696,617 | |
Tyler Technologies Incorporated † | | | | | | | | | | | 28,995 | | | | 4,317,356 | |
| | | | |
| | | | | | | | | | | | | | | 104,472,845 | |
| | | | | | | | | | | | | | | | |
| | | | |
Total Common Stocks (Cost $560,292,720) | | | | | | | | | | | | | | | 784,260,385 | |
| | | | | | | | | | | | | | | | |
| | | | |
| | | Yield | | | | | | | | | | |
| Short-Term Investments: 13.06% | | | | | | | | | | | | | | | | |
| | | | |
| Investment Companies: 13.06% | | | | | | | | | | | | | | | | |
Securities Lending Cash Investment LLC (l)(r)(u) | | | 0.65 | % | | | | | | | 85,987,308 | | | | 85,995,907 | |
Wells Fargo Government Money Market Fund Select Class (l)(u) | | | 0.31 | | | | | | | | 19,236,622 | | | | 19,236,622 | |
| | | | |
Total Short-Term Investments (Cost $105,224,647) | | | | | | | | | | | | | | | 105,232,529 | |
| | | | | | | | | | | | | | | | |
| | | | | | | | |
| Total investments in securities (Cost $665,517,367) * | | | 110.40 | % | | | 889,492,914 | |
Other assets and liabilities, net | | | (10.40 | ) | | | (83,761,636 | ) |
| | | | | | | | |
| Total net assets | | | 100.00 | % | | $ | 805,731,278 | |
| | | | | | | | |
| † | Non-income-earning security |
| « | All or a portion of this security is on loan. |
| (l) | The issuer of the security is an affiliated person of the Portfolio as defined in the Investment Company Act of 1940. |
| (r) | The investment is a non-registered investment vehicle purchased with cash collateral received from securities on loan. |
| (u) | The rate represents the 7-day annualized yield at period end. |
| * | Cost for federal income tax purposes is $669,076,405 and unrealized gains (losses) consists of: |
| | | | |
Gross unrealized gains | | $ | 236,058,540 | |
Gross unrealized losses | | | (15,642,031 | ) |
| | | | |
Net unrealized gains | | $ | 220,416,509 | |
The accompanying notes are an integral part of these financial statements.
| | | | | | |
| Summary portfolio of investments—November 30, 2016 (unaudited) | | Wells Fargo Equity Gateway Funds | | | 71 | |
INDEX PORTFOLIO
The Summary portfolio of investments shows the 50 largest portfolio holdings in unaffiliated issuers and any holdings exceeding 1% of the total net assets as of the report date. The remaining securities held are grouped as “Other securities” in each category.
| | | | | | | | | | | | | | | | | | | | |
| Security name | | | | | | | | Shares | | | Value | | | Percent of
net assets | |
| | | | | |
Common Stocks: 96.55% | | | | | | | | | | | | | | | | | | | | |
| | | | | |
Consumer Discretionary: 11.90% | | | | | | | | | | | | | | | | | | | | |
| | | | | |
| Auto Components: 0.17% | | | | | | | | | | | | | | | | | | | | |
Other securities | | | | | | | | | | | | | | $ | 3,711,162 | | | | 0.17 | % |
| | | | | | | | | | | | | | | | | | | | |
| | | | | |
| Automobiles: 0.54% | | | | | | | | | | | | | | | | | | | | |
Other securities | | | | | | | | | | | | | | | 12,109,380 | | | | 0.54 | |
| | | | | | | | | | | | | | | | | | | | |
| | | | | |
| Distributors: 0.12% | | | | | | | | | | | | | | | | | | | | |
Other securities | | | | | | | | | | | | | | | 2,772,162 | | | | 0.12 | |
| | | | | | | | | | | | | | | | | | | | |
| | | | | |
| Diversified Consumer Services: 0.03% | | | | | | | | | | | | | | | | | | | | |
Other securities | | | | | | | | | | | | | | | 551,319 | | | | 0.03 | |
| | | | | | | | | | | | | | | | | | | | |
| | | | | |
| Hotels, Restaurants & Leisure: 1.56% | | | | | | | | | | | | | | | | | | | | |
McDonald’s Corporation | | | | | | | | | | | 96,904 | | | | 11,557,740 | | | | 0.52 | |
Starbucks Corporation | | | | | | | | | | | 166,540 | | | | 9,654,324 | | | | 0.43 | |
Other securities | | | | | | | | | | | | | | | 13,620,653 | | | | 0.61 | |
| | | | | |
| | | | | | | | | | | | | | | 34,832,717 | | | | 1.56 | |
| | | | | | | | | | | | | | | | | | | | |
| | | | | |
| Household Durables: 0.46% | | | | | | | | | | | | | | | | | | | | |
Other securities | | | | | | | | | | | | | | | 10,293,517 | | | | 0.46 | |
| | | | | | | | | | | | | | | | | | | | |
| | | | | |
| Internet & Direct Marketing Retail: 2.24% | | | | | | | | | | | | | | | | | | | | |
Amazon.com Incorporated † | | | | | | | | | | | 44,682 | | | | 33,536,969 | | | | 1.50 | |
Other securities | | | | | | | | | | | | | | | 16,496,074 | | | | 0.74 | |
| | | | | |
| | | | | | | | | | | | | | | 50,033,043 | | | | 2.24 | |
| | | | | | | | | | | | | | | | | | | | |
| | | | | |
| Leisure Products: 0.10% | | | | | | | | | | | | | | | | | | | | |
Other securities | | | | | | | | | | | | | | | 2,315,540 | | | | 0.10 | |
| | | | | | | | | | | | | | | | | | | | |
| | | | | |
| Media: 2.97% | | | | | | | | | | | | | | | | | | | | |
Comcast Corporation Class A | | | | | | | | | | | 272,803 | | | | 18,962,537 | | | | 0.85 | |
The Walt Disney Company | | | | | | | | | | | 167,895 | | | | 16,641,752 | | | | 0.75 | |
Other securities | | | | | | | | | | | | | | | 30,642,403 | | | | 1.37 | |
| | | | | |
| | | | | | | | | | | | | | | 66,246,692 | | | | 2.97 | |
| | | | | | | | | | | | | | | | | | | | |
| | | | | |
| Multiline Retail: 0.58% | | | | | | | | | | | | | | | | | | | | |
Other securities | | | | | | | | | | | | | | | 12,992,294 | | | | 0.58 | |
| | | | | | | | | | | | | | | | | | | | |
| | | | | |
| Specialty Retail: 2.43% | | | | | | | | | | | | | | | | | | | | |
The Home Depot Incorporated | | | | | | | | | | | 140,306 | | | | 18,155,596 | | | | 0.81 | |
Other securities | | | | | | | | | | | | | | | 36,009,790 | | | | 1.62 | |
| | | | | |
| | | | | | | | | | | | | | | 54,165,386 | | | | 2.43 | |
| | | | | | | | | | | | | | | | | | | | |
| | | | | |
| Textiles, Apparel & Luxury Goods: 0.70% | | | | | | | | | | | | | | | | | | | | |
Other securities | | | | | | | | | | | | | | | 15,577,559 | | | | 0.70 | |
| | | | | | | | | | | | | | | | | | | | |
The accompanying notes are an integral part of these financial statements.
| | | | |
| 72 | | Wells Fargo Equity Gateway Funds | | Summary portfolio of investments—November 30, 2016 (unaudited) |
INDEX PORTFOLIO
| | | | | | | | | | | | | | | | | | | | |
| Security name | | | | | | | | Shares | | | Value | | | Percent of
net assets | |
| | | | | |
Consumer Staples: 8.94% | | | | | | | | | | | | | | | | | | | | |
| | | | | |
| Beverages: 1.97% | | | | | | | | | | | | | | | | | | | | |
PepsiCo Incorporated | | | | | | | | | | | 163,424 | | | $ | 16,358,742 | | | | 0.73 | % |
The Coca-Cola Company | | | | | | | | | | | 441,098 | | | | 17,798,304 | | | | 0.80 | |
Other securities | | | | | | | | | | | | | | | 9,916,817 | | | | 0.44 | |
| | | | | |
| | | | | | | | | | | | | | | 44,073,863 | | | | 1.97 | |
| | | | | | | | | | | | | | | | | | | | |
| | | | | |
| Food & Staples Retailing: 2.01% | | | | | | | | | | | | | | | | | | | | |
Wal-Mart Stores Incorporated | | | | | | | | | | | 172,116 | | | | 12,122,130 | | | | 0.54 | |
Other securities | | | | | | | | | | | | | | | 32,672,450 | | | | 1.47 | |
| | | | | |
| | | | | | | | | | | | | | | 44,794,580 | | | | 2.01 | |
| | | | | | | | | | | | | | | | | | | | |
| | | | | |
| Food Products: 1.51% | | | | | | | | | | | | | | | | | | | | |
Other securities | | | | | | | | | | | | | | | 33,728,636 | | | | 1.51 | |
| | | | | | | | | | | | | | | | | | | | |
| | | | | |
| Household Products: 1.76% | | | | | | | | | | | | | | | | | | | | |
The Procter & Gamble Company | | | | | | | | | | | 303,051 | | | | 24,989,585 | | | | 1.12 | |
Other securities | | | | | | | | | | | | | | | 14,304,799 | | | | 0.64 | |
| | | | | |
| | | | | | | | | | | | | | | 39,294,384 | | | | 1.76 | |
| | | | | | | | | | | | | | | | | | | | |
| | | | | |
| Personal Products: 0.13% | | | | | | | | | | | | | | | | | | | | |
Other securities | | | | | | | | | | | | | | | 2,951,710 | | | | 0.13 | |
| | | | | | | | | | | | | | | | | | | | |
| | | | | |
| Tobacco: 1.56% | | | | | | | | | | | | | | | | | | | | |
Altria Group Incorporated | | | | | | | | | | | 221,871 | | | | 14,184,213 | | | | 0.63 | |
Philip Morris International | | | | | | | | | | | 176,162 | | | | 15,551,581 | | | | 0.70 | |
Other securities | | | | | | | | | | | | | | | 5,085,833 | | | | 0.23 | |
| | | | | |
| | | | | | | | | | | | | | | 34,821,627 | | | | 1.56 | |
| | | | | | | | | | | | | | | | | | | | |
| | | | | |
Energy: 7.26% | | | | | | | | | | | | | | | | | | | | |
| | | | | |
| Energy Equipment & Services: 1.15% | | | | | | | | | | | | | | | | | | | | |
Schlumberger Limited | | | | | | | | | | | 157,921 | | | | 13,273,260 | | | | 0.60 | |
Other securities | | | | | | | | | | | | | | | 12,293,577 | | | | 0.55 | |
| | | | | |
| | | | | | | | | | | | | | | 25,566,837 | | | | 1.15 | |
| | | | | | | | | | | | | | | | | | | | |
| | | | | |
| Oil, Gas & Consumable Fuels: 6.11% | | | | | | | | | | | | | | | | | | | | |
Chevron Corporation | | | | | | | | | | | 214,225 | | | | 23,898,941 | | | | 1.07 | |
Exxon Mobil Corporation | | | | | | | | | | | 470,874 | | | | 41,107,300 | | | | 1.84 | |
Other securities | | | | | | | | | | | | | | | 71,507,310 | | | | 3.20 | |
| | | | | |
| | | | | | | | | | | | | | | 136,513,551 | | | | 6.11 | |
| | | | | | | | | | | | | | | | | | | | |
| | | | | |
Financials: 14.14% | | | | | | | | | | | | | | | | | | | | |
| | | | | |
| Banks: 6.31% | | | | | | | | | | | | | | | | | | | | |
Bank of America Corporation | | | | | | | | | | | 1,158,810 | | | | 24,474,067 | | | | 1.10 | |
Citigroup Incorporated | | | | | | | | | | | 329,921 | | | | 18,604,245 | | | | 0.83 | |
JPMorgan Chase & Company | | | | | | | | | | | 410,160 | | | | 32,882,527 | | | | 1.47 | |
Wells Fargo & Company (l) | | | | | | | | | | | 515,654 | | | | 27,288,410 | | | | 1.22 | |
Other securities | | | | | | | | | | | | | | | 37,619,996 | | | | 1.69 | |
| | | | | |
| | | | | | | | | | | | | | | 140,869,245 | | | | 6.31 | |
| | | | | | | | | | | | | | | | | | | | |
The accompanying notes are an integral part of these financial statements.
| | | | | | |
| Summary portfolio of investments—November 30, 2016 (unaudited) | | Wells Fargo Equity Gateway Funds | | | 73 | |
INDEX PORTFOLIO
| | | | | | | | | | | | | | | | | | | | |
| Security name | | | | | | | | Shares | | | Value | | | Percent of
net assets | |
| | | | | |
| Capital Markets: 2.76% | | | | | | | | | | | | | | | | | | | | |
Other securities | | | | | | | | | | | | | | $ | 61,662,693 | | | | 2.76 | % |
| | | | | | | | | | | | | | | | | | | | |
| | | | | |
| Consumer Finance: 0.81% | | | | | | | | | | | | | | | | | | | | |
Other securities | | | | | | | | | | | | | | | 18,013,042 | | | | 0.81 | |
| | | | | | | | | | | | | | | | | | | | |
| | | | | |
| Diversified Financial Services: 1.56% | | | | | | | | | | | | | | | | | | | | |
Berkshire Hathaway Incorporated Class B † | | | | | | | | | | | 215,602 | | | | 33,944,379 | | | | 1.52 | |
Other securities | | | | | | | | | | | | | | | 811,041 | | | | 0.04 | |
| | | | | |
| | | | | | | | | | | | | | | 34,755,420 | | | | 1.56 | |
| | | | | | | | | | | | | | | | | | | | |
| | | | | |
| Insurance: 2.70% | | | | | | | | | | | | | | | | | | | | |
Other securities | | | | | | | | | | | | | | | 60,394,672 | | | | 2.70 | |
| | | | | | | | | | | | | | | | | | | | |
| | | | | |
Health Care: 13.26% | | | | | | | | | | | | | | | | | | | | |
| | | | | |
| Biotechnology: 2.73% | | | | | | | | | | | | | | | | | | | | |
AbbVie Incorporated | | | | | | | | | | | 184,930 | | | | 11,243,744 | | | | 0.50 | |
Amgen Incorporated | | | | | | | | | | | 84,980 | | | | 12,243,069 | | | | 0.55 | |
Celgene Corporation † | | | | | | | | | | | 88,018 | | | | 10,431,013 | | | | 0.47 | |
Gilead Sciences Incorporated | | | | | | | | | | | 149,854 | | | | 11,044,240 | | | | 0.49 | |
Other securities | | | | | | | | | | | | | | | 15,985,152 | | | | 0.72 | |
| | | | | |
| | | | | | | | | | | | | | | 60,947,218 | | | | 2.73 | |
| | | | | | | | | | | | | | | | | | | | |
| | | | | |
| Health Care Equipment & Supplies: 2.37% | | | | | | | | | | | | | | | | | | | | |
Medtronic plc | | | | | | | | | | | 156,926 | | | | 11,457,167 | | | | 0.51 | |
Other securities | | | | | | | | | | | | | | | 41,532,294 | | | | 1.86 | |
| | | | | |
| | | | | | | | | | | | | | | 52,989,461 | | | | 2.37 | |
| | | | | | | | | | | | | | | | | | | | |
| | | | | |
| Health Care Providers & Services: 2.59% | | | | | | | | | | | | | | | | | | | | |
UnitedHealth Group Incorporated | | | | | | | | | | | 108,149 | | | | 17,122,150 | | | | 0.77 | |
Other securities | | | | | | | | | | | | | | | 40,699,861 | | | | 1.82 | |
| | | | | |
| | | | | | | | | | | | | | | 57,822,011 | | | | 2.59 | |
| | | | | | | | | | | | | | | | | | | | |
| | | | | |
| Health Care Technology: 0.08% | | | | | | | | | | | | | | | | | | | | |
Other securities | | | | | | | | | | | | | | | 1,698,991 | | | | 0.08 | |
| | | | | | | | | | | | | | | | | | | | |
| | | | | |
| Life Sciences Tools & Services: 0.59% | | | | | | | | | | | | | | | | | | | | |
Other securities | | | | | | | | | | | | | | | 13,215,735 | | | | 0.59 | |
| | | | | | | | | | | | | | | | | | | | |
| | | | | |
| Pharmaceuticals: 4.90% | | | | | | | | | | | | | | | | | | | | |
Bristol-Myers Squibb Company | | | | | | | | | | | 189,735 | | | | 10,708,643 | | | | 0.48 | |
Johnson & Johnson | | | | | | | | | | | 310,674 | | | | 34,578,016 | | | | 1.55 | |
Merck & Company Incorporated | | | | | | | | | | | 314,004 | | | | 19,213,905 | | | | 0.86 | |
Pfizer Incorporated | | | | | | | | | | | 688,788 | | | | 22,137,646 | | | | 0.99 | |
Other securities | | | | | | | | | | | | | | | 22,833,685 | | | | 1.02 | |
| | | | | |
| | | | | | | | | | | | | | | 109,471,895 | | | | 4.90 | |
| | | | | | | | | | | | | | | | | | | | |
The accompanying notes are an integral part of these financial statements.
| | | | |
| 74 | | Wells Fargo Equity Gateway Funds | | Summary portfolio of investments—November 30, 2016 (unaudited) |
INDEX PORTFOLIO
| | | | | | | | | | | | | | | | | | | | |
| Security name | | | | | | | | Shares | | | Value | | | Percent of
net assets | |
| | | | | |
Industrials: 10.10% | | | | | | | | | | | | | | | | | | | | |
| | | | | |
| Aerospace & Defense: 2.21% | | | | | | | | | | | | | | | | | | | | |
The Boeing Company | | | | | | | | | | | 65,880 | | | $ | 9,918,893 | | | | 0.44 | % |
United Technologies Corporation | | | | | | | | | | | 88,385 | | | | 9,520,832 | | | | 0.43 | |
Other securities | | | | | | | | | | | | | | | 29,940,927 | | | | 1.34 | |
| | | | | |
| | | | | | | | | | | | | | | 49,380,652 | | | | 2.21 | |
| | | | | | | | | | | | | | | | | | | | |
| | | | | |
| Air Freight & Logistics: 0.75% | | | | | | | | | | | | | | | | | | | | |
Other securities | | | | | | | | | | | | | | | 16,713,640 | | | | 0.75 | |
| | | | | | | | | | | | | | | | | | | | |
| | | | | |
| Airlines: 0.61% | | | | | | | | | | | | | | | | | | | | |
Other securities | | | | | | | | | | | | | | | 13,621,750 | | | | 0.61 | |
| | | | | | | | | | | | | | | | | | | | |
| | | | | |
| Building Products: 0.35% | | | | | | | | | | | | | | | | | | | | |
Other securities | | | | | | | | | | | | | | | 7,700,669 | | | | 0.35 | |
| | | | | | | | | | | | | | | | | | | | |
| | | | | |
| Commercial Services & Supplies: 0.31% | | | | | | | | | | | | | | | | | | | | |
Other securities | | | | | | | | | | | | | | | 6,800,344 | | | | 0.31 | |
| | | | | | | | | | | | | | | | | | | | |
| | | | | |
| Construction & Engineering: 0.10% | | | | | | | | | | | | | | | | | | | | |
Other securities | | | | | | | | | | | | | | | 2,279,623 | | | | 0.10 | |
| | | | | | | | | | | | | | | | | | | | |
| | | | | |
| Electrical Equipment: 0.54% | | | | | | | | | | | | | | | | | | | | |
Other securities | | | | | | | | | | | | | | | 12,026,066 | | | | 0.54 | |
| | | | | | | | | | | | | | | | | | | | |
| | | | | |
| Industrial Conglomerates: 2.46% | | | | | | | | | | | | | | | | | | | | |
3M Company | | | | | | | | | | | 68,633 | | | | 11,787,031 | | | | 0.53 | |
General Electric Company | | | | | | | | | | | 1,017,596 | | | | 31,301,253 | | | | 1.40 | |
Honeywell International Incorporated | | | | | | | | | | | 86,401 | | | | 9,844,530 | | | | 0.44 | |
Other securities | | | | | | | | | | | | | | | 2,084,214 | | | | 0.09 | |
| | | | | |
| | | | | | | | | | | | | | | 55,017,028 | | | | 2.46 | |
| | | | | | | | | | | | | | | | | | | | |
| | | | | |
| Machinery: 1.46% | | | | | | | | | | | | | | | | | | | | |
Other securities | | | | | | | | | | | | | | | 32,565,855 | | | | 1.46 | |
| | | | | | | | | | | | | | | | | | | | |
| | | | | |
| Professional Services: 0.26% | | | | | | | | | | | | | | | | | | | | |
Other securities | | | | | | | | | | | | | | | 5,842,339 | | | | 0.26 | |
| | | | | | | | | | | | | | | | | | | | |
| | | | | |
| Road & Rail: 0.87% | | | | | | | | | | | | | | | | | | | | |
Union Pacific Corporation | | | | | | | | | | | 94,582 | | | | 9,583,994 | | | | 0.43 | |
Other securities | | | | | | | | | | | | | | | 9,910,591 | | | | 0.44 | |
| | | | | |
| | | | | | | | | | | | | | | 19,494,585 | | | | 0.87 | |
| | | | | | | | | | | | | | | | | | | | |
| | | | | |
| Trading Companies & Distributors: 0.18% | | | | | | | | | | | | | | | | | | | | |
Other securities | | | | | | | | | | | | | | | 4,000,002 | | | | 0.18 | |
| | | | | | | | | | | | | | | | | | | | |
| | | | | |
Information Technology: 20.09% | | | | | | | | | | | | | | | | | | | | |
| | | | | |
| Communications Equipment: 1.00% | | | | | | | | | | | | | | | | | | | | |
Cisco Systems Incorporated | | | | | | | | | | | 571,151 | | | | 17,031,723 | | | | 0.76 | |
Other securities | | | | | | | | | | | | | | | 5,236,009 | | | | 0.24 | |
| | | | | |
| | | | | | | | | | | | | | | 22,267,732 | | | | 1.00 | |
| | | | | | | | | | | | | | | | | | | | |
The accompanying notes are an integral part of these financial statements.
| | | | | | |
| Summary portfolio of investments—November 30, 2016 (unaudited) | | Wells Fargo Equity Gateway Funds | | | 75 | |
INDEX PORTFOLIO
| | | | | | | | | | | | | | | | | | | | |
| Security name | | | | | | | | Shares | | | Value | | | Percent of
net assets | |
| | | | | |
| Electronic Equipment, Instruments & Components: 0.37% | | | | | | | | | | | | | | | | | | | | |
Other securities | | | | | | | | | | | | | | $ | 8,279,406 | | | | 0.37 | % |
| | | | | | | | | | | | | | | | | | | | |
| | | | | |
| Internet Software & Services: 4.13% | | | | | | | | | | | | | | | | | | | | |
Alphabet Incorporated Class A † | | | | | | | | | | | 33,481 | | | | 25,977,238 | | | | 1.16 | |
Alphabet Incorporated Class C † | | | | | | | | | | | 33,556 | | | | 25,436,790 | | | | 1.14 | |
Facebook Incorporated Class A † | | | | | | | | | | | 263,785 | | | | 31,237,420 | | | | 1.40 | |
Other securities | | | | | | | | | | | | | | | 9,549,730 | | | | 0.43 | |
| | | | | |
| | | | | | | | | | | | | | | 92,201,178 | | | | 4.13 | |
| | | | | | | | | | | | | | | | | | | | |
| | | | | |
| IT Services: 3.59% | | | | | | | | | | | | | | | | | | | | |
International Business Machines Corporation | | | | | | | | | | | 98,773 | | | | 16,022,956 | | | | 0.72 | |
MasterCard Incorporated Class A | | | | | | | | | | | 108,892 | | | | 11,128,762 | | | | 0.50 | |
Visa Incorporated Class A | | | | | | | | | | | 214,215 | | | | 16,563,104 | | | | 0.74 | |
Other securities | | | | | | | | | | | | | | | 36,488,992 | | | | 1.63 | |
| | | | | |
| | | | | | | | | | | | | | | 80,203,814 | | | | 3.59 | |
| | | | | | | | | | | | | | | | | | | | |
| | | | | |
| Semiconductors & Semiconductor Equipment: 3.20% | | | | | | | | | | | | | | | | | | | | |
Intel Corporation | | | | | | | | | | | 537,231 | | | | 18,641,916 | | | | 0.84 | |
QUALCOMM Incorporated | | | | | | | | | | | 167,341 | | | | 11,400,942 | | | | 0.51 | |
Other securities | | | | | | | | | | | | | | | 41,421,595 | | | | 1.85 | |
| | | | | |
| | | | | | | | | | | | | | | 71,464,453 | | | | 3.20 | |
| | | | | | | | | | | | | | | | | | | | |
| | | | | |
| Software: 4.23% | | | | | | | | | | | | | | | | | | | | |
Microsoft Corporation | | | | | | | | | | | 884,882 | | | | 53,322,989 | | | | 2.39 | |
Oracle Corporation | | | | | | | | | | | 341,756 | | | | 13,735,174 | | | | 0.61 | |
Other securities | | | | | | | | | | | | | | | 27,403,125 | | | | 1.23 | |
| | | | | |
| | | | | | | | | | | | | | | 94,461,288 | | | | 4.23 | |
| | | | | | | | | | | | | | | | | | | | |
| | | | | |
| Technology Hardware, Storage & Peripherals: 3.57% | | | | | | | | | | | | | | | | | | | | |
Apple Incorporated | | | | | | | | | | | 611,887 | | | | 67,625,751 | | | | 3.03 | |
Other securities | | | | | | | | | | | | | | | 12,054,487 | | | | 0.54 | |
| | | | | |
| | | | | | | | | | | | | | | 79,680,238 | | | | 3.57 | |
| | | | | | | | | | | | | | | | | | | | |
| | | | | |
Materials: 2.81% | | | | | | | | | | | | | | | | | | | | |
| | | | | |
| Chemicals: 2.04% | | | | | | | | | | | | | | | | | | | | |
Other securities | | | | | | | | | | | | | | | 45,536,718 | | | | 2.04 | |
| | | | | | | | | | | | | | | | | | | | |
| | | | | |
| Construction Materials: 0.16% | | | | | | | | | | | | | | | | | | | | |
Other securities | | | | | | | | | | | | | | | 3,479,615 | | | | 0.16 | |
| | | | | | | | | | | | | | | | | | | | |
| | | | | |
| Containers & Packaging: 0.33% | | | | | | | | | | | | | | | | | | | | |
Other securities | | | | | | | | | | | | | | | 7,305,967 | | | | 0.33 | |
| | | | | | | | | | | | | | | | | | | | |
| | | | | |
| Metals & Mining: 0.28% | | | | | | | | | | | | | | | | | | | | |
Other securities | | | | | | | | | | | | | | | 6,332,800 | | | | 0.28 | |
| | | | | | | | | | | | | | | | | | | | |
The accompanying notes are an integral part of these financial statements.
| | | | |
| 76 | | Wells Fargo Equity Gateway Funds | | Summary portfolio of investments—November 30, 2016 (unaudited) |
INDEX PORTFOLIO
| | | | | | | | | | | | | | | | | | | | |
| Security name | | | | | | | | Shares | | | Value | | | Percent of
net assets | |
| | | | | |
Real Estate: 2.67% | | | | | | | | | | | | | | | | | | | | |
| | | | | |
| Equity REITs: 2.63% | | | | | | | | | | | | | | | | | | | | |
Other securities | | | | | | | | | | | | | | $ | 58,634,333 | | | | 2.63 | % |
| | | | | | | | | | | | | | | | | | | | |
| | | | | |
| Real Estate Management & Development: 0.04% | | | | | | | | | | | | | | | | | | | | |
Other securities | | | | | | | | | | | | | | | 985,008 | | | | 0.04 | |
| | | | | | | | | | | | | | | | | | | | |
| | | | | |
Telecommunication Services: 2.41% | | | | | | | | | | | | | | | | | | | | |
| | | | | |
| Diversified Telecommunication Services: 2.41% | | | | | | | | | | | | | | | | | | | | |
AT&T Incorporated | | | | | | | | | | | 698,593 | | | | 26,986,648 | | | | 1.21 | |
Verizon Communications Incorporated | | | | | | | | | | | 462,886 | | | | 23,098,011 | | | | 1.03 | |
Other securities | | | | | | | | | | | | | | | 3,765,516 | | | | 0.17 | |
| | | | | |
| | | | | | | | | | | | | | | 53,850,175 | | | | 2.41 | |
| | | | | | | | | | | | | | | | | | | | |
| | | | | |
Utilities: 2.97% | | | | | | | | | | | | | | | | | | | | |
| | | | | |
| Electric Utilities: 1.84% | | | | | | | | | | | | | | | | | | | | |
Other securities | | | | | | | | | | | | | | | 41,064,531 | | | | 1.84 | |
| | | | | | | | | | | | | | | | | | | | |
| | | | | |
| Independent Power & Renewable Electricity Producers: 0.06% | | | | | | | | | | | | | | | | | | | | |
Other securities | | | | | | | | | | | | | | | 1,262,947 | | | | 0.06 | |
| | | | | | | | | | | | | | | | | | | | |
| | | | | |
| Multi-Utilities: 1.01% | | | | | | | | | | | | | | | | | | | | |
Other securities | | | | | | | | | | | | | | | 22,470,109 | | | | 1.01 | |
| | | | | | | | | | | | | | | | | | | | |
| | | | | |
| Water Utilities: 0.06% | | | | | | | | | | | | | | | | | | | | |
Other securities | | | | | | | | | | | | | | | 1,464,039 | | | | 0.06 | |
| | | | | | | | | | | | | | | | | | | | |
| | | | |
Total Common Stocks (Cost $964,325,647) | | | | | | | | | | | | 2,155,573,246 | | | | 96.55 | |
| | | | | | | | | | | | | | | | | | | | |
| | | | | |
| | | Yield | | | | | | | | | | | | | |
| Short-Term Investments: 0.62% | | | | | | | | | | | | | | | | | | | | |
| | | | | |
| Investment Companies: 0.54% | | | | | | | | | | | | | | | | | | | | |
Securities Lending Cash Investment LLC (l)(r)(u) | | | 0.65 | % | | | | | | | 12,148,091 | | | | 12,149,306 | | | | 0.54 | |
| | | | | | | | | | | | | | | | | | | | |
| | | | | |
| | | | | | Maturity date | | | Principal | | | | | | | |
| U.S. Treasury Securities: 0.08% | | | | | | | | | | | | | | | | | | | | |
U.S. Treasury Bill #(z) | | | 0.21 | | | | 12-15-2016 | | | $ | 535,000 | | | | 534,970 | | | | 0.02 | |
U.S. Treasury Bill #(z) | | | 0.31 | | | | 1-19-2017 | | | | 282,000 | | | | 281,867 | | | | 0.01 | |
U.S. Treasury Bill #(z) | | | 0.36 | | | | 1-5-2017 | | | | 331,000 | | | | 330,901 | | | | 0.02 | |
U.S. Treasury Bill #(z) | | | 0.41 | | | | 2-16-2017 | | | | 605,000 | | | | 604,419 | | | | 0.03 | |
U.S. Treasury Bill #(z) | | | 0.46 | | | | 2-23-2017 | | | | 50,000 | | | | 49,946 | | | | 0.00 | |
| | | | | |
| | | | | | | | | | | | | | | 1,802,103 | | | | 0.08 | |
| | | | | | | | | | | | | | | | | | | | |
| | | | |
Total Short-Term Investments (Cost $13,950,780) | | | | | | | | | | | | 13,951,409 | | | | 0.62 | |
| | | | | | | | | | | | | | | | | | | | |
| | | | | |
| Total investments in securities (Cost $978,276,427) * | | | | | | | | | | | | | | | 2,169,524,655 | | | | 97.17 | |
Other assets and liabilities, net | | | | | | | | | | | | | | | 63,087,873 | | | | 2.83 | |
| | | | | | | | | | | | | | | | | | | | |
| Total net assets | | | | | | | | | | | | | | $ | 2,232,612,528 | | | | 100.00 | % |
| | | | | | | | | | | | | | | | | | | | |
The accompanying notes are an integral part of these financial statements.
| | | | | | |
| Summary portfolio of investments—November 30, 2016 (unaudited) | | Wells Fargo Equity Gateway Funds | | | 77 | |
INDEX PORTFOLIO
| † | Non-income-earning security |
| (l) | The issuer of the security is an affiliated person of the Portfolio as defined in the Investment Company Act of 1940. |
| (r) | The investment is a non-registered investment vehicle purchased with cash collateral received from securities on loan. |
| (u) | The rate represents the 7-day annualized yield at period end. |
| # | All or a portion of this security is segregated as collateral for investments in derivative instruments. |
| (z) | Zero coupon security. The rate represents the current yield to maturity. |
| * | Cost for federal income tax purposes is $980,547,734 and unrealized gains (losses) consists of: |
| | | | |
Gross unrealized gains | | $ | 1,214,008,252 | |
Gross unrealized losses | | | (25,031,331 | ) |
| | | | |
Net unrealized gains | | $ | 1,188,976,921 | |
The accompanying notes are an integral part of these financial statements.
| | | | |
| 78 | | Wells Fargo Equity Gateway Funds | | Portfolio of investments—November 30, 2016 (unaudited) |
INTERNATIONAL GROWTH PORTFOLIO
| | | | | | | | | | | | | | | | |
| Security name | | | | | | | | Shares | | | Value | |
| | | | |
Common Stocks: 93.99% | | | | | | | | | | | | | | | | |
| | | | |
| Australia: 1.47% | | | | | | | | | | | | | | | | |
BHP Billiton Limited (Materials, Metals & Mining) | | | | | | | | | | | 35,733 | | | $ | 644,106 | |
Westpac Banking Corporation (Financials, Banks) | | | | | | | | | | | 57,349 | | | | 1,324,265 | |
| | | | |
| | | | | | | | | | | | | | | 1,968,371 | |
| | | | | | | | | | | | | | | | |
| | | | |
| Belgium: 0.97% | | | | | | | | | | | | | | | | |
Telenet Group Holding NV (Consumer Discretionary, Media) † | | | | | | | | | | | 24,727 | | | | 1,305,628 | |
| | | | | | | | | | | | | | | | |
| | | | |
| Canada: 4.23% | | | | | | | | | | | | | | | | |
Canadian Pacific Railway Limited (Industrials, Road & Rail) | | | | | | | | | | | 31,520 | | | | 4,830,440 | |
Rogers Communications Incorporated Class B (Telecommunication Services, Wireless Telecommunication Services) | | | | | | | | | | | 21,864 | | | | 844,742 | |
| | | | |
| | | | | | | | | | | | | | | 5,675,182 | |
| | | | | | | | | | | | | | | | |
| | | | |
| China: 5.72% | | | | | | | | | | | | | | | | |
Alibaba Group Holding Limited ADR (Information Technology, Internet Software & Services) † | | | | | | | | | | | 48,260 | | | | 4,537,405 | |
China Construction Bank H Shares (Financials, Banks) | | | | | | | | | | | 540,512 | | | | 402,780 | |
China Mobile Limited (Telecommunication Services, Wireless Telecommunication Services) | | | | | | | | | | | 158,500 | | | | 1,729,778 | |
Ctrip.com International Limited ADR (Consumer Discretionary, Internet & Direct Marketing Retail) † | | | | | | | | | | | 22,433 | | | | 1,014,645 | |
| | | | |
| | | | | | | | | | | | | | | 7,684,608 | |
| | | | | | | | | | | | | | | | |
| | | | |
| Denmark: 0.45% | | | | | | | | | | | | | | | | |
ISS AS (Industrials, Commercial Services & Supplies) | | | | | | | | | | | 17,616 | | | | 602,226 | |
| | | | | | | | | | | | | | | | |
| | | | |
| France: 4.12% | | | | | | | | | | | | | | | | |
AXA SA (Financials, Insurance) | | | | | | | | | | | 31,087 | | | | 732,424 | |
LVMH Moet Hennessy Louis Vuitton SA (Consumer Discretionary, Textiles, Apparel & Luxury Goods) « | | | | | | | | | | | 4,347 | | | | 791,051 | |
Pernod-Ricard SA (Consumer Staples, Beverages) | | | | | | | | | | | 8,852 | | | | 928,797 | |
Schneider Electric SE (Industrials, Electrical Equipment) | | | | | | | | | | | 3,347 | | | | 222,806 | |
Zodiac Aerospace SA (Industrials, Aerospace & Defense) | | | | | | | | | | | 128,822 | | | | 2,856,249 | |
| | | | |
| | | | | | | | | | | | | | | 5,531,327 | |
| | | | | | | | | | | | | | | | |
| | | | |
| Germany: 18.46% | | | | | | | | | | | | | | | | |
Allianz AG (Financials, Insurance) | | | | | | | | | | | 31,427 | | | | 4,989,523 | |
Beiersdorf AG (Consumer Staples, Personal Products) | | | | | | | | | | | 28,722 | | | | 2,346,393 | |
Deutsche Boerse AG (Financials, Diversified Financial Services) | | | | | | | | | | | 67,176 | | | | 5,428,730 | |
Deutsche Post AG (Industrials, Air Freight & Logistics) | | | | | | | | | | | 52,553 | | | | 1,642,542 | |
Linde AG (Materials, Chemicals) | | | | | | | | | | | 35,043 | | | | 5,838,457 | |
Vonovia SE (Real Estate, Real Estate Management & Development) | | | | | | | | | | | 60,926 | | | | 1,964,938 | |
Wirecard AG (Information Technology, IT Services) | | | | | | | | | | | 57,756 | | | | 2,576,748 | |
| | | | |
| | | | | | | | | | | | | | | 24,787,331 | |
| | | | | | | | | | | | | | | | |
| | | | |
| Hong Kong: 3.42% | | | | | | | | | | | | | | | | |
AIA Group Limited (Financials, Insurance) | | | | | | | | | | | 753,000 | | | | 4,591,878 | |
| | | | | | | | | | | | | | | | |
| | | | |
| Indonesia: 0.23% | | | | | | | | | | | | | | | | |
PT Bank Rakyat Indonesia Tbk (Financials, Banks) | | | | | | | | | | | 387,000 | | | | 311,256 | |
| | | | | | | | | | | | | | | | |
The accompanying notes are an integral part of these financial statements.
| | | | | | |
| Portfolio of investments—November 30, 2016 (unaudited) | | Wells Fargo Equity Gateway Funds | | | 79 | |
INTERNATIONAL GROWTH PORTFOLIO
| | | | | | | | | | | | | | | | |
| Security name | | | | | | | | Shares | | | Value | |
| | | | |
| Ireland: 5.29% | | | | | | | | | | | | | | | | |
Allegion plc (Industrials, Building Products) | | | | | | | | | | | 2,032 | | | $ | 135,961 | |
Medtronic plc (Health Care, Health Care Equipment & Supplies) | | | | | | | | | | | 72,196 | | | | 5,271,030 | |
Willis Towers Watson plc (Financials, Insurance) | | | | | | | | | | | 13,620 | | | | 1,693,919 | |
| | | | |
| | | | | | | | | | | | | | | 7,100,910 | |
| | | | | | | | | | | | | | | | |
| | | | |
| Italy: 1.96% | | | | | | | | | | | | | | | | |
Atlantia SpA (Industrials, Transportation Infrastructure) « | | | | | | | | | | | 56,331 | | | | 1,251,362 | |
Intesa Sanpaolo SpA (Financials, Banks) | | | | | | | | | | | 618,767 | | | | 1,374,557 | |
| | | | |
| | | | | | | | | | | | | | | 2,625,919 | |
| | | | | | | | | | | | | | | | |
| | | | |
| Japan: 12.47% | | | | | | | | | | | | | | | | |
Bridgestone Corporation (Consumer Discretionary, Auto Components) | | | | | | | | | | | 25,700 | | | | 981,005 | |
CALBEE Incorporated (Consumer Staples, Food Products) | | | | | | | | | | | 30,300 | | | | 944,185 | |
Japan Tobacco Incorporated (Consumer Staples, Tobacco) | | | | | | | | | | | 166,754 | | | | 5,751,596 | |
KDDI Corporation (Telecommunication Services, Wireless Telecommunication Services) | | | | | | | | | | | 92,800 | | | | 2,432,649 | |
Nippon Telegraph & Telephone Corporation (Telecommunication Services, Diversified Telecommunication Services) | | | | | | | | | | | 60,400 | | | | 2,441,764 | |
Nomura Holdings Incorporated (Financials, Capital Markets) | | | | | | | | | | | 14,500 | | | | 77,714 | |
NTT DOCOMO Incorporated (Telecommunication Services, Wireless Telecommunication Services) | | | | | | | | | | | 161,593 | | | | 3,706,307 | |
Seven & I Holdings Company Limited (Consumer Staples, Food & Staples Retailing) | | | | | | | | | | | 10,600 | | | | 410,917 | |
| | | | |
| | | | | | | | | | | | | | | 16,746,137 | |
| | | | | | | | | | | | | | | | |
| | | | |
| Luxembourg: 0.31% | | | | | | | | | | | | | | | | |
RTL Group SA (Consumer Discretionary, Media) | | | | | | | | | | | 6,064 | | | | 412,030 | |
| | | | | | | | | | | | | | | | |
| | | | |
| Netherlands: 4.79% | | | | | | | | | | | | | | | | |
Akzo Nobel NV (Materials, Chemicals) | | | | | | | | | | | 23,491 | | | | 1,462,944 | |
ASML Holding NV (Information Technology, Semiconductors & Semiconductor Equipment) | | | | | | | | | | | 11,856 | | | | 1,226,652 | |
Heineken NV (Consumer Staples, Beverages) | | | | | | | | | | | 4,147 | | | | 310,828 | |
ING Group NV (Financials, Banks) | | | | | | | | | | | 252,482 | | | | 3,438,570 | |
| | | | |
| | | | | | | | | | | | | | | 6,438,994 | |
| | | | | | | | | | | | | | | | |
| | | | |
| Russia: 0.27% | | | | | | | | | | | | | | | | |
MMC Norilsk Nickel PJSC (Materials, Metals & Mining) | | | | | | | | | | | 21,629 | | | | 362,935 | |
| | | | | | | | | | | | | | | | |
| | | | |
| South Korea: 0.01% | | | | | | | | | | | | | | | | |
Orion Corporation (Consumer Staples, Food Products) | | | | | | | | | | | 18 | | | | 10,470 | |
| | | | | | | | | | | | | | | | |
| | | | |
| Spain: 1.82% | | | | | | | | | | | | | | | | |
Grifols SA (Health Care, Biotechnology) | | | | | | | | | | | 44,705 | | | | 876,541 | |
Grifols SA ADR (Health Care, Biotechnology) | | | | | | | | | | | 100,677 | | | | 1,573,582 | |
| | | | |
| | | | | | | | | | | | | | | 2,450,123 | |
| | | | | | | | | | | | | | | | |
| | | | |
| Sweden: 1.16% | | | | | | | | | | | | | | | | |
Swedbank AB Class A (Financials, Banks) | | | | | | | | | | | 67,414 | | | | 1,556,191 | |
| | | | | | | | | | | | | | | | |
| | | | |
| Switzerland: 7.39% | | | | | | | | | | | | | | | | |
Actelion Limited (Health Care, Biotechnology) | | | | | | | | | | | 6,140 | | | | 1,183,673 | |
LafargeHolcim Limited (Materials, Construction Materials) | | | | | | | | | | | 24,233 | | | | 1,283,512 | |
Nestle SA (Consumer Staples, Food Products) | | | | | | | | | | | 73,051 | | | | 4,914,614 | |
The accompanying notes are an integral part of these financial statements.
| | | | |
| 80 | | Wells Fargo Equity Gateway Funds | | Portfolio of investments—November 30, 2016 (unaudited) |
INTERNATIONAL GROWTH PORTFOLIO
| | | | | | | | | | | | | | | | |
| Security name | | | | | | | | Shares | | | Value | |
| | | | |
| Switzerland (continued) | | | | | | | | | | | | | | | | |
Roche Holding AG (Health Care, Pharmaceuticals) | | | | | | | | | | | 3,060 | | | $ | 682,307 | |
UBS Group AG (Financials, Capital Markets) | | | | | | | | | | | 116,663 | | | | 1,855,455 | |
| | | | |
| | | | | | | | | | | | | | | 9,919,561 | |
| | | | | | | | | | | | | | | | |
| | | | |
| Taiwan: 2.11% | | | | | | | | | | | | | | | | |
Taiwan Semiconductor Manufacturing Company Limited (Information Technology, Semiconductors & Semiconductor Equipment) | | | | | | | | | | | 493,000 | | | | 2,830,578 | |
| | | | | | | | | | | | | | | | |
| | | | |
| Thailand: 0.14% | | | | | | | | | | | | | | | | |
Thai Beverage PCL (Consumer Staples, Beverages) | | | | | | | | | | | 311,500 | | | | 190,158 | |
| | | | | | | | | | | | | | | | |
| | | | |
| United Kingdom: 15.06% | | | | | | | | | | | | | | | | |
Aon plc (Financials, Insurance) | | | | | | | | | | | 37,872 | | | | 4,321,195 | |
BHP Billiton plc (Materials, Metals & Mining) | | | | | | | | | | | 51,436 | | | | 845,325 | |
British American Tobacco plc (Consumer Staples, Tobacco) | | | | | | | | | | | 25,681 | | | | 1,411,722 | |
Coca-Cola European Partners plc (Consumer Staples, Beverages) | | | | | | | | | | | 73,650 | | | | 2,390,679 | |
Conva Tec Limited (Health Care, Health Care Equipment & Supplies) †144A | | | | | | | | | | | 430,131 | | | | 1,280,868 | |
Imperial Tobacco Group plc (Consumer Staples, Tobacco) | | | | | | | | | | | 24,893 | | | | 1,069,246 | |
Liberty Global plc Class A (Consumer Discretionary, Media) | | | | | | | | | | | 61,931 | | | | 1,939,679 | |
Liberty Global plc Class C (Consumer Discretionary, Media) | | | | | | | | | | | 101,136 | | | | 3,079,591 | |
Liberty Global plc LiLAC Class A (Consumer Discretionary, Media) †« | | | | | | | | | | | 9,208 | | | | 198,709 | |
Liberty Global plc LiLAC Class C (Consumer Discretionary, Media) † | | | | | | | | | | | 14,073 | | | | 297,925 | |
St. James’s Place plc (Financials, Insurance) | | | | | | | | | | | 11,697 | | | | 137,572 | |
Unilever plc (Consumer Staples, Personal Products) | | | | | | | | | | | 34,191 | | | | 1,367,241 | |
Wolseley plc (Industrials, Trading Companies & Distributors) | | | | | | | | | | | 32,418 | | | | 1,884,076 | |
| | | | |
| | | | | | | | | | | | | | | 20,223,828 | |
| | | | | | | | | | | | | | | | |
| | | | |
| United States: 2.14% | | | | | | | | | | | | | | | | |
Amazon.com Incorporated (Consumer Discretionary, Internet & Direct Marketing Retail) † | | | | | | | | | | | 2,183 | | | | 1,638,494 | |
WABCO Holdings Incorporated (Industrials, Machinery) † | | | | | | | | | | | 12,575 | | | | 1,238,763 | |
| | | | |
| | | | | | | | | | | | | | | 2,877,257 | |
| | | | | | | | | | | | | | | | |
| | | | |
Total Common Stocks (Cost $123,698,895) | | | | | | | | | | | | | | | 126,202,898 | |
| | | | | | | | | | | | | | | | |
| | | | |
| | | | | | Expiration date | | | | | | | |
| Participation Notes: 2.22% | | | | | | | | | | | | | | | | |
| | | | |
| Ireland: 2.22% | | | | | | | | | | | | | | | | |
HSBC Bank plc (Ryanair Holdings plc) (Industrials, Airlines) | | | | | | | 10-29-2018 | | | | 203,815 | | | | 2,979,015 | |
| | | | | | | | | | | | | | | | |
| | | | |
Total Participation Notes (Cost $2,299,114) | | | | | | | | | | | | | | | 2,979,015 | |
| | | | | | | | | | | | | | | | |
| | | | |
| | | Dividend yield | | | | | | | | | | |
| Preferred Stocks: 1.49% | | | | | | | | | | | | | | | | |
| | | | |
| Germany: 1.49% | | | | | | | | | | | | | | | | |
Henkel AG & Company KGaA (Consumer Staples, Household Products) ± | | | 1.44 | % | | | | | | | 17,290 | | | | 2,002,901 | |
| | | | | | | | | | | | | | | | |
| | | | |
Total Preferred Stocks (Cost $1,464,874) | | | | | | | | | | | | | | | 2,002,901 | |
| | | | | | | | | | | | | | | | |
The accompanying notes are an integral part of these financial statements.
| | | | | | |
| Portfolio of investments—November 30, 2016 (unaudited) | | Wells Fargo Equity Gateway Funds | | | 81 | |
INTERNATIONAL GROWTH PORTFOLIO
| | | | | | | | | | | | | | | | |
| Security name | | Yield | | | | | | Shares | | | Value | |
| Short-Term Investments: 2.95% | | | | | | | | | | | | | | | | |
| | | | |
| Investment Companies: 2.95% | | | | | | | | | | | | | | | | |
Securities Lending Cash Investment LLC (l)(r)(u) | | | 0.65 | % | | | | | | | 2,197,894 | | | $ | 2,198,114 | |
Wells Fargo Government Money Market Fund Select Class (l)(u) | | | 0.31 | | | | | | | | 1,759,819 | | | | 1,759,819 | |
| | | | |
Total Short-Term Investments (Cost $3,957,933) | | | | | | | | | | | | | | | 3,957,933 | |
| | | | | | | | | | | | | | | | |
| | | | | | | | |
| Total investments in securities (Cost $131,420,816) * | | | 100.65 | % | | | 135,142,747 | |
Other assets and liabilities, net | | | (0.65 | ) | | | (867,980 | ) |
| | | | | | | | |
| Total net assets | | | 100.00 | % | | $ | 134,274,767 | |
| | | | | | | | |
| † | Non-income-earning security |
| « | All or a portion of this security is on loan. |
| 144A | The security may be resold in transactions exempt from registration, normally to qualified institutional buyers, pursuant to Rule 144A under the Securities Act of 1933. |
| ± | Variable rate investment. The rate shown is the rate in effect at period end. |
| (l) | The issuer of the security is an affiliated person of the Portfolio as defined in the Investment Company Act of 1940. |
| (r) | The investment is a non-registered investment vehicle purchased with cash collateral received from securities on loan. |
| (u) | The rate represents the 7-day annualized yield at period end. |
| * | Cost for federal income tax purposes is $131,355,071 and unrealized gains (losses) consists of: |
| | | | |
Gross unrealized gains | | $ | 9,514,811 | |
Gross unrealized losses | | | (5,727,135 | ) |
| | | | |
Net unrealized gains | | $ | 3,787,676 | |
The following table shows the percent of total long-term investments by sector as of November 30, 2016:
| | | | |
Financials | | | 24.57 | % |
Consumer Staples | | | 18.33 | |
Industrials | | | 13.45 | |
Consumer Discretionary | | | 8.89 | |
Information Technology | | | 8.52 | |
Telecommunication Services | | | 8.50 | |
Health Care | | | 8.28 | |
Materials | | | 7.96 | |
Real Estate | | | 1.50 | |
| | | | |
| | | 100.00 | % |
| | | | |
The accompanying notes are an integral part of these financial statements.
| | | | |
| 82 | | Wells Fargo Equity Gateway Funds | | Portfolio of investments—November 30, 2016 (unaudited) |
INTERNATIONAL VALUE PORTFOLIO
| | | | | | | | | | | | | | | | |
| Security name | | | | | | | | Shares | | | Value | |
| | | | |
Common Stocks: 97.38% | | | | | | | | | | | | | | | | |
| | | | |
| Australia: 5.64% | | | | | | | | | | | | | | | | |
Arrium Limited (Materials, Metals & Mining) †(a) | | | | | | | | | | | 3,063,400 | | | $ | 49,771 | |
Asaleo Care Limited (Consumer Staples, Personal Products) | | | | | | | | | | | 1,262,800 | | | | 1,436,072 | |
Automotive Holdings Group Limited (Consumer Discretionary, Specialty Retail) | | | | | | | | | | | 410,016 | | | | 1,111,189 | |
Bendigo Bank Limited (Financials, Banks) | | | | | | | | | | | 272,500 | | | | 2,424,793 | |
BlueScope Steel Limited (Materials, Metals & Mining) | | | | | | | | | | | 234,700 | | | | 1,563,294 | |
Boart Longyear Limited (Industrials, Construction & Engineering) † | | | | | | | | | | | 199,991 | | | | 18,460 | |
Cabcharge Australia Limited (Industrials, Commercial Services & Supplies) | | | | | | | | | | | 207,386 | | | | 565,102 | |
Challenger Financial Services Group Limited (Financials, Diversified Financial Services) | | | | | | | | | | | 200,200 | | | | 1,574,471 | |
CSR Limited (Materials, Construction Materials) | | | | | | | | | | | 754,900 | | | | 2,268,845 | |
Downer EDI Limited (Industrials, Commercial Services & Supplies) | | | | | | | | | | | 518,900 | | | | 2,172,640 | |
Fortescue Metals Group Limited (Materials, Metals & Mining) | | | | | | | | | | | 380,300 | | | | 1,648,487 | |
Harvey Norman Holdings Limited (Consumer Discretionary, Multiline Retail) | | | | | | | | | | | 455,500 | | | | 1,597,729 | |
Lendlease Corporation Limited (Real Estate, Real Estate Management & Development) | | | | | | | | | | | 350,500 | | | | 3,522,631 | |
McMillan Shakespeare Limited (Industrials, Professional Services) | | | | | | | | | | | 158,800 | | | | 1,158,587 | |
Metcash Limited (Consumer Staples, Food & Staples Retailing) †« | | | | | | | | | | | 1,164,200 | | | | 1,770,989 | |
Mincor Resources NL (Materials, Metals & Mining) †(i) | | | | | | | | | | | 550,994 | | | | 115,961 | |
Mineral Resources Limited (Industrials, Metals & Mining) | | | | | | | | | | | 144,300 | | | | 1,339,438 | |
Myer Holdings Limited (Consumer Discretionary, Multiline Retail) | | | | | | | | | | | 1,059,500 | | | | 997,544 | |
Panoramic Resources Limited (Materials, Metals & Mining) † | | | | | | | | | | | 180,600 | | | | 44,010 | |
Primary Health Care Limited (Health Care, Health Care Providers & Services) | | | | | | | | | | | 339,000 | | | | 918,728 | |
Qantas Airways Limited (Industrials, Airlines) | | | | | | | | | | | 821,700 | | | | 2,002,388 | |
Retail Food Group Limited (Consumer Discretionary, Food Products) | | | | | | | | | | | 269,500 | | | | 1,231,886 | |
Seven Group Holdings Limited (Industrials, Trading Companies & Distributors) | | | | | | | | | | | 157,700 | | | | 992,184 | |
| | | | |
| | | | | | | | | | | | | | | 30,525,199 | |
| | | | | | | | | | | | | | | | |
| | | | |
| Austria: 1.27% | | | | | | | | | | | | | | | | |
OMV AG (Energy, Oil, Gas & Consumable Fuels) | | | | | | | | | | | 62,900 | | | | 2,032,935 | |
Raiffeisen Bank International AG (Financials, Banks) † | | | | | | | | | | | 81,200 | | | | 1,478,938 | |
RHI AG (Materials, Construction Materials) | | | | | | | | | | | 64,721 | | | | 1,562,926 | |
Voestalpine AG (Materials, Metals & Mining) | | | | | | | | | | | 47,700 | | | | 1,807,588 | |
| | | | |
| | | | | | | | | | | | | | | 6,882,387 | |
| | | | | | | | | | | | | | | | |
| | | | |
| Brazil: 1.05% | | | | | | | | | | | | | | | | |
Banco do Brasil SA (Financials, Banks) | | | | | | | | | | | 309,500 | | | | 2,608,108 | |
Companhia de Saneamento de Minas Gerais SA (Utilities, Water Utilities) | | | | | | | | | | | 72,400 | | | | 729,769 | |
JBS SA (Consumer Staples, Food Products) | | | | | | | | | | | 805,600 | | | | 2,324,820 | |
| | | | |
| | | | | | | | | | | | | | | 5,662,697 | |
| | | | | | | | | | | | | | | | |
| | | | |
| Canada: 2.03% | | | | | | | | | | | | | | | | |
Magna International Incorporated (Consumer Discretionary, Auto Components) « | | | | | | | | | | | 131,600 | | | | 5,317,686 | |
Open Text Corporation (Information Technology, Software) | | | | | | | | | | | 59,700 | | | | 3,803,858 | |
WestJet Airlines Limited (Industrials, Airlines) | | | | | | | | | | | 120,000 | | | | 1,881,337 | |
| | | | |
| | | | | | | | | | | | | | | 11,002,881 | |
| | | | | | | | | | | | | | | | |
| | | | |
| China: 2.70% | | | | | | | | | | | | | | | | |
China BlueChemical Limited H Shares (Materials, Chemicals) | | | | | | | | | | | 1,984,000 | | | | 455,298 | |
China Communications Services Corporation Limited H Shares (Telecommunication Services, Diversified Telecommunication Services) | | | | | | | | | | | 2,836,000 | | | | 1,670,924 | |
The accompanying notes are an integral part of these financial statements.
| | | | | | |
| Portfolio of investments—November 30, 2016 (unaudited) | | Wells Fargo Equity Gateway Funds | | | 83 | |
INTERNATIONAL VALUE PORTFOLIO
| | | | | | | | | | | | | | | | |
| Security name | | | | | | | | Shares | | | Value | |
| | | | |
| China (continued) | | | | | | | | | | | | | | | | |
China Petroleum & Chemical Corporation H Shares (Energy, Oil, Gas & Consumable Fuels) | | | | | | | | | | | 2,970,000 | | | $ | 2,075,343 | |
China Railway Construction Corporation Limited H Shares (Industrials, Construction & Engineering) | | | | | | | | | | | 1,747,500 | | | | 2,482,750 | |
Dongfeng Motor Group Company Limited H Shares (Consumer Discretionary, Automobiles) | | | | | | | | | | | 1,730,000 | | | | 1,759,776 | |
PICC Property & Casualty Company Limited H Shares (Financials, Insurance) | | | | | | | | | | | 910,000 | | | | 1,525,172 | |
Shanghai Pharmaceuticals Holding Company Limited H Shares (Health Care, Health Care Providers & Services) | | | | | | | | | | | 676,200 | | | | 1,691,263 | |
Shenzhen International Holdings Limited H Shares (Industrials, Transportation Infrastructure) | | | | | | | | | | | 731,500 | | | | 1,076,997 | |
Xinyi Glass Holdings Limited (Consumer Discretionary, Auto Components) | | | | | | | | | | | 2,502,000 | | | | 1,864,444 | |
| | | | |
| | | | | | | | | | | | | | | 14,601,967 | |
| | | | | | | | | | | | | | | | |
| | | | |
| Czech Republic: 0.17% | | | | | | | | | | | | | | | | |
CEZ AS (Utilities, Electric Utilities) | | | | | | | | | | | 57,500 | | | | 933,331 | |
| | | | | | | | | | | | | | | | |
| | | | |
| Denmark: 0.95% | | | | | | | | | | | | | | | | |
Danske Bank AS (Financials, Banks) | | | | | | | | | | | 132,300 | | | | 3,865,153 | |
Sydbank AS (Financials, Banks) | | | | | | | | | | | 43,000 | | | | 1,264,823 | |
| | | | |
| | | | | | | | | | | | | | | 5,129,976 | |
| | | | | | | | | | | | | | | | |
| | | | |
| Finland: 0.23% | | | | | | | | | | | | | | | | |
Tieto Oyj (Information Technology, IT Services) | | | | | | | | | | | 48,200 | | | | 1,222,969 | |
| | | | | | | | | | | | | | | | |
| | | | |
| France: 9.40% | | | | | | | | | | | | | | | | |
Atos Origin SA (Information Technology, IT Services) | | | | | | | | | | | 42,800 | | | | 4,424,114 | |
AXA SA (Financials, Insurance) | | | | | | | | | | | 132,200 | | | | 3,114,693 | |
BNP Paribas SA (Financials, Banks) | | | | | | | | | | | 49,100 | | | | 2,850,676 | |
Carrefour SA (Consumer Staples, Food & Staples Retailing) | | | | | | | | | | | 133,200 | | | | 3,122,724 | |
Cie Generale des Establissements Michelin (Consumer Discretionary, Auto Components) | | | | | | | | | | | 32,700 | | | | 3,500,366 | |
Credit Agricole SA (Financials, Banks) | | | | | | | | | | | 219,328 | | | | 2,475,643 | |
Electricite de France SA (Utilities, Electric Utilities) « | | | | | | | | | | | 148,600 | | | | 1,574,149 | |
Engie SA (Utilities, Multi-Utilities) | | | | | | | | | | | 171,900 | | | | 2,122,492 | |
Orange SA (Telecommunication Services, Diversified Telecommunication Services) | | | | | | | | | | | 243,000 | | | | 3,542,511 | |
Renault SA (Consumer Discretionary, Automobiles) | | | | | | | | | | | 40,500 | | | | 3,190,964 | |
Sanofi SA (Health Care, Pharmaceuticals) | | | | | | | | | | | 123,800 | | | | 9,986,347 | |
SCOR SE (Financials, Insurance) | | | | | | | | | | | 109,700 | | | | 3,483,896 | |
Societe Generale SA (Financials, Banks) | | | | | | | | | | | 39,000 | | | | 1,677,546 | |
Thales SA (Industrials, Aerospace & Defense) | | | | | | | | | | | 13,500 | | | | 1,318,193 | |
Total SA (Energy, Oil, Gas & Consumable Fuels) | | | | | | | | | | | 93,700 | | | | 4,464,387 | |
| | | | |
| | | | | | | | | | | | | | | 50,848,701 | |
| | | | | | | | | | | | | | | | |
| | | | |
| Germany: 8.27% | | | | | | | | | | | | | | | | |
Allianz AG (Financials, Insurance) | | | | | | | | | | | 35,700 | | | | 5,667,928 | |
Aurubis AG (Materials, Metals & Mining) | | | | | | | | | | | 25,900 | | | | 1,371,545 | |
BASF SE (Materials, Chemicals) | | | | | | | | | | | 46,500 | | | | 3,991,431 | |
Bayer AG (Health Care, Pharmaceuticals) | | | | | | | | | | | 44,600 | | | | 4,187,587 | |
Bayerische Motoren Werke AG (Consumer Discretionary, Automobiles) | | | | | | | | | | | 31,200 | | | | 2,658,942 | |
Daimler AG (Consumer Discretionary, Automobiles) | | | | | | | | | | | 75,700 | | | | 5,035,274 | |
Deutsche Bank AG (Financials, Capital Markets) † | | | | | | | | | | | 130,100 | | | | 2,048,993 | |
Deutsche Post AG (Industrials, Air Freight & Logistics) | | | | | | | | | | | 74,100 | | | | 2,315,993 | |
E.ON SE (Utilities, Multi-Utilities) | | | | | | | | | | | 87,200 | | | | 575,492 | |
Hannover Rueck SE (Financials, Insurance) | | | | | | | | | | | 16,300 | | | | 1,730,146 | |
Metro AG (Consumer Staples, Food & Staples Retailing) | | | | | | | | | | | 108,100 | | | | 3,230,294 | |
The accompanying notes are an integral part of these financial statements.
| | | | |
| 84 | | Wells Fargo Equity Gateway Funds | | Portfolio of investments—November 30, 2016 (unaudited) |
INTERNATIONAL VALUE PORTFOLIO
| | | | | | | | | | | | | | | | |
| Security name | | | | | | | | Shares | | | Value | |
| | | | |
| Germany (continued) | | | | | | | | | | | | | | | | |
Muenchener Rueckversicherungs Gesellschaft AG (Financials, Insurance) | | | | | | | | | | | 23,200 | | | $ | 4,225,536 | |
Siemens AG (Industrials, Industrial Conglomerates) | | | | | | | | | | | 26,600 | | | | 3,005,267 | |
Stada Arzneimittel AG (Health Care, Pharmaceuticals) | | | | | | | | | | | 30,500 | | | | 1,489,878 | |
Uniper SE (Utilities, Independent Power & Renewable Electricity Producers) | | | | | | | | | | | 8,720 | | | | 108,638 | |
Volkswagen AG (Consumer Discretionary, Automobiles) | | | | | | | | | | | 22,600 | | | | 3,094,676 | |
| | | | |
| | | | | | | | | | | | | | | 44,737,620 | |
| | | | | | | | | | | | | | | | |
| | | | |
| Hong Kong: 2.13% | | | | | | | | | | | | | | | | |
China Resources Cement Holdings Limited (Materials, Construction Materials) | | | | | | | | | | | 2,350,000 | | | | 1,008,896 | |
Kingboard Laminates Holdings Limited (Information Technology, Electronic Equipment, Instruments & Components) (i) | | | | | | | | | | | 2,204,000 | | | | 1,952,102 | |
Lee & Man Paper Manufacturing Limited (Materials, Paper & Forest Products) | | | | | | | | | | | 2,338,000 | | | | 1,796,491 | |
Skyworth Digital Holdings Limited (Consumer Discretionary, Household Durables) | | | | | | | | | | | 3,680,000 | | | | 2,310,527 | |
Wheelock & Company Limited (Real Estate, Real Estate Management & Development) | | | | | | | | | | | 379,000 | | | | 2,252,549 | |
Yue Yuen Industrial Holdings Limited (Consumer Discretionary, Textiles, Apparel & Luxury Goods) | | | | | | | | | | | 611,500 | | | | 2,203,497 | |
| | | | |
| | | | | | | | | | | | | | | 11,524,062 | |
| | | | | | | | | | | | | | | | |
| | | | |
| Hungary: 0.22% | | | | | | | | | | | | | | | | |
Richter Gedeon (Health Care, Pharmaceuticals) | | | | | | | | | | | 58,400 | | | | 1,166,323 | |
| | | | | | | | | | | | | | | | |
| | | | |
| India: 0.31% | | | | | | | | | | | | | | | | |
Tata Motors Limited ADR (Consumer Discretionary, Automobiles) | | | | | | | | | | | 50,800 | | | | 1,679,956 | |
| | | | | | | | | | | | | | | | |
| | | | |
| Ireland: 0.71% | | | | | | | | | | | | | | | | |
C&C Group plc (Consumer Staples, Beverages) | | | | | | | | | | | 240,000 | | | | 884,932 | |
Smurfit Kappa Group plc (Materials, Containers & Packaging) | | | | | | | | | | | 130,200 | | | | 2,966,837 | |
| | | | |
| | | | | | | | | | | | | | | 3,851,769 | |
| | | | | | | | | | | | | | | | |
| | | | |
| Israel: 0.96% | | | | | | | | | | | | | | | | |
Bank Hapoalim Limited (Financials, Banks) | | | | | | | | | | | 542,900 | | | | 3,267,631 | |
Teva Pharmaceutical Industries Limited (Health Care, Pharmaceuticals) | | | | | | | | | | | 51,404 | | | | 1,905,194 | |
| | | | |
| | | | | | | | | | | | | | | 5,172,825 | |
| | | | | | | | | | | | | | | | |
| | | | |
| Italy: 1.61% | | | | | | | | | | | | | | | | |
A2A SpA (Utilities, Multi-Utilities) | | | | | | | | | | | 1,078,900 | | | | 1,286,406 | |
Enel SpA (Utilities, Electric Utilities) | | | | | | | | | | | 688,400 | | | | 2,782,696 | |
Leonardo-Finmeccanica SpA (Industrials, Aerospace & Defense) † | | | | | | | | | | | 184,000 | | | | 2,388,901 | |
Mediobanca SpA (Financials, Banks) | | | | | | | | | | | 324,800 | | | | 2,240,997 | |
| | | | |
| | | | | | | | | | | | | | | 8,699,000 | |
| | | | | | | | | | | | | | | | |
| | | | |
| Japan: 23.36% | | | | | | | | | | | | | | | | |
Adeka Corporation (Materials, Chemicals) | | | | | | | | | | | 155,300 | | | | 2,089,128 | |
Aisin Seiki Company Limited (Consumer Discretionary, Auto Components) | | | | | | | | | | | 46,400 | | | | 1,983,270 | |
Anritsu Corporation (Information Technology, Electronic Equipment, Instruments & Components) | | | | | | | | | | | 206,300 | | | | 1,044,078 | |
Aoyama Trading Company Limited (Consumer Discretionary, Specialty Retail) | | | | | | | | | | | 24,800 | | | | 842,166 | |
Aozora Bank Limited (Financials, Banks) | | | | | | | | | | | 427,000 | | | | 1,466,815 | |
Astellas Pharma Incorporated (Health Care, Pharmaceuticals) | | | | | | | | | | | 136,700 | | | | 1,887,310 | |
Calsonic Kansei Corporation (Consumer Discretionary, Auto Components) | | | | | | | | | | | 326,000 | | | | 4,998,068 | |
Central Glass Company Limited (Industrials, Building Products) | | | | | | | | | | | 444,000 | | | | 1,754,189 | |
CKD Corporation (Industrials, Machinery) | | | | | | | | | | | 171,200 | | | | 2,059,099 | |
The accompanying notes are an integral part of these financial statements.
| | | | | | |
| Portfolio of investments—November 30, 2016 (unaudited) | | Wells Fargo Equity Gateway Funds | | | 85 | |
INTERNATIONAL VALUE PORTFOLIO
| | | | | | | | | | | | | | | | |
| Security name | | | | | | | | Shares | | | Value | |
| | | | |
| Japan (continued) | | | | | | | | | | | | | | | | |
Cocokara Fine Incorporated (Consumer Staples, Food & Staples Retailing) | | | | | | | | | | | 15,100 | | | $ | 553,027 | |
DCM Holdings Company Limited (Consumer Discretionary, Specialty Retail) « | | | | | | | | | | | 143,100 | | | | 1,292,097 | |
Denka Company Limited (Materials, Chemicals) | | | | | | | | | | | 682,000 | | | | 3,010,445 | |
DIC Incorporated (Materials, Chemicals) | | | | | | | | | | | 100,700 | | | | 3,111,529 | |
Eizo Corporation (Information Technology, Technology Hardware, Storage & Peripherals) | | | | | | | | | | | 63,300 | | | | 1,864,613 | |
Fujikura Limited (Industrials, Electrical Equipment) | | | | | | | | | | | 348,000 | | | | 1,876,806 | |
Geo Holdings Corporation (Consumer Discretionary, Specialty Retail) | | | | | | | | | | | 91,700 | | | | 992,305 | |
Hitachi Limited (Information Technology, Electronic Equipment, Instruments & Components) | | | | | | | | | | | 327,800 | | | | 1,745,803 | |
Isuzu Motors Limited (Consumer Discretionary, Automobiles) | | | | | | | | | | | 221,400 | | | | 2,610,625 | |
Itochu Corporation (Industrials, Trading Companies & Distributors) | | | | | | | | | | | 200,700 | | | | 2,740,207 | |
Japan Airlines Company Limited (Industrials, Airlines) | | | | | | | | | | | 80,700 | | | | 2,387,741 | |
KDDI Corporation (Telecommunication Services, Wireless Telecommunication Services) | | | | | | | | | | | 245,400 | | | | 6,432,888 | |
Kureha Corporation (Materials, Chemicals) | | | | | | | | | | | 27,100 | | | | 1,106,219 | |
Kyorin Company Limited (Health Care, Pharmaceuticals) | | | | | | | | | | | 99,000 | | | | 2,078,563 | |
Maeda Road Construction Company Limited (Industrials, Construction & Engineering) | | | | | | | | | | | 148,000 | | | | 2,545,903 | |
Makino Milling Machine Company Limited (Industrials, Machinery) | | | | | | | | | | | 232,000 | | | | 1,638,530 | |
Marubeni Corporation (Industrials, Trading Companies & Distributors) | | | | | | | | | | | 516,000 | | | | 2,824,796 | |
Matsumotokiyoshi Holdings Company Limited (Consumer Staples, Food & Staples Retailing) | | | | | | | | | | | 60,500 | | | | 2,887,374 | |
Miraca Holdings Incorporated (Health Care, Health Care Providers & Services) | | | | | | | | | | | 25,100 | | | | 1,123,308 | |
Mitsubishi Gas Chemical Company Incorporated (Materials, Chemicals) | | | | | | | | | | | 278,200 | | | | 4,216,588 | |
Mitsubishi UFJ Financial Group Incorporated (Financials, Banks) | | | | | | | | | | | 657,100 | | | | 3,847,083 | |
Mizuho Financial Group Incorporated (Financials, Banks) | | | | | | | | | | | 2,244,400 | | | | 3,974,612 | |
Nippon Telegraph & Telephone Corporation (Telecommunication Services, Diversified Telecommunication Services) | | | | | | | | | | | 201,600 | | | | 8,149,993 | |
Nissan Motor Company Limited (Consumer Discretionary, Automobiles) | | | | | | | | | | | 505,000 | | | | 4,663,542 | |
Nisshinbo Holdings Incorporated (Industrials, Industrial Conglomerates) | | | | | | | | | | | 147,200 | | | | 1,425,616 | |
NTT DOCOMO Incorporated (Telecommunication Services, Wireless Telecommunication Services) | | | | | | | | | | | 98,600 | | | | 2,261,496 | |
ORIX Corporation (Financials, Diversified Financial Services) | | | | | | | | | | | 201,300 | | | | 3,134,618 | |
Resona Holdings Incorporated (Financials, Banks) | | | | | | | | | | | 1,013,300 | | | | 4,872,307 | |
Sankyu Incorporated (Industrials, Road & Rail) | | | | | | | | | | | 370,000 | | | | 2,150,693 | |
Sawai Pharmaceutical Company Limited (Health Care, Pharmaceuticals) | | | | | | | | | | | 36,200 | | | | 1,939,653 | |
Sojitz Corporation (Industrials, Trading Companies & Distributors) | | | | | | | | | | | 1,160,700 | | | | 2,942,205 | |
Sumitomo Corporation (Industrials, Trading Companies & Distributors) | | | | | | | | | | | 205,000 | | | | 2,445,916 | |
Sumitomo Heavy Industries Limited (Industrials, Machinery) | | | | | | | | | | | 256,000 | | | | 1,541,751 | |
Sumitomo Mitsui Financial Group Incorporated (Financials, Banks) | | | | | | | | | | | 100,400 | | | | 3,691,118 | |
Sumitomo Osaka Cement Company (Materials, Construction Materials) | | | | | | | | | | | 444,000 | | | | 1,567,904 | |
Suzuken Company Limited (Health Care, Health Care Providers & Services) | | | | | | | | | | | 67,000 | | | | 2,002,884 | |
T-Gaia Corporation (Consumer Discretionary, Specialty Retail) | | | | | | | | | | | 10,300 | | | | 153,683 | |
The Keiyo Bank Limited (Financials, Banks) | | | | | | | | | | | 62,000 | | | | 264,464 | |
Toho Holdings Company Limited (Health Care, Health Care Providers & Services) | | | | | | | | | | | 63,000 | | | | 1,220,296 | |
Toyo Ink SC Holding Company Limited (Materials, Chemicals) | | | | | | | | | | | 375,000 | | | | 1,704,471 | |
Toyo Tire & Rubber Company Limited (Consumer Discretionary, Auto Components) | | | | | | | | | | | 95,400 | | | | 1,164,930 | |
Tsumura & Company (Health Care, Pharmaceuticals) | | | | | | | | | | | 53,700 | | | | 1,452,747 | |
UBE Industries Limited (Materials, Chemicals) | | | | | | | | | | | 954,300 | | | | 1,985,258 | |
Yokohama Rubber Company Limited (Consumer Discretionary, Auto Components) | | | | | | | | | | | 148,500 | | | | 2,683,008 | |
| |
| | | | 126,403,738 | |
| | | | | | | | | | | | | | | | |
| | | | |
| Liechtenstein: 0.12% | | | | | | | | | | | | | | | | |
VP Bank AG (Financials, Capital Markets) | | | | | | | | | | | 6,558 | | | | 664,379 | |
| | | | | | | | | | | | | | | | |
The accompanying notes are an integral part of these financial statements.
| | | | |
| 86 | | Wells Fargo Equity Gateway Funds | | Portfolio of investments—November 30, 2016 (unaudited) |
INTERNATIONAL VALUE PORTFOLIO
| | | | | | | | | | | | | | | | |
| Security name | | | | | | | | Shares | | | Value | |
| | | | |
| Netherlands: 2.01% | | | | | | | | | | | | | | | | |
Aegon NV (Financials, Insurance) | | | | | | | | | | | 334,000 | | | $ | 1,698,443 | |
ING Group NV (Financials, Banks) | | | | | | | | | | | 237,100 | | | | 3,229,081 | |
Koninklijke Ahold NV (Consumer Staples, Food & Staples Retailing) | | | | | | | | | | | 267,032 | | | | 5,266,887 | |
X 5 Retail Group NV GDR (Consumer Staples, Food & Staples Retailing) † | | | | | | | | | | | 23,700 | | | | 711,000 | |
| |
| | | | 10,905,411 | |
| | | | | | | | | | | | | | | | |
| | | | |
| Norway: 1.24% | | | | | | | | | | | | | | | | |
Atea ASA (Information Technology, IT Services) (i) | | | | | | | | | | | 84,900 | | | | 777,829 | |
DNB Nor ASA (Financials, Banks) | | | | | | | | | | | 148,800 | | | | 2,191,705 | |
Marine Harvest ASA (Consumer Staples, Food Products) | | | | | | | | | | | 97,500 | | | | 1,753,321 | |
Yara International ASA (Materials, Chemicals) | | | | | | | | | | | 53,600 | | | | 1,983,157 | |
| |
| | | | 6,706,012 | |
| | | | | | | | | | | | | | | | |
| | | | |
| Poland: 0.38% | | | | | | | | | | | | | | | | |
Asseco Poland SA (Information Technology, Software) | | | | | | | | | | | 101,800 | | | | 1,273,802 | |
KGHM Polska Miedz SA (Materials, Metals & Mining) | | | | | | | | | | | 36,500 | | | | 758,676 | |
| |
| | | | 2,032,478 | |
| | | | | | | | | | | | | | | | |
| | | | |
| Portugal: 0.21% | | | | | | | | | | | | | | | | |
Sonae SGPS SA (Consumer Staples, Food & Staples Retailing) | | | | | | | | | | | 1,362,100 | | | | 1,147,679 | |
| | | | | | | | | | | | | | | | |
| | | | |
| Russia: 0.98% | | | | | | | | | | | | | | | | |
Gazprom Neft Sponsored ADR (Energy, Oil, Gas & Consumable Fuels) | | | | | | | | | | | 886 | | | | 13,600 | |
Gazprom Neft Sponsored ADR - London Exchange (Energy, Oil, Gas & Consumable Fuels) (i) | | | | | | | | | | | 150,014 | | | | 2,340,218 | |
LUKOIL OAO ADR (Energy, Oil, Gas & Consumable Fuels) | | | | | | | | | | | 60,400 | | | | 2,972,284 | |
| |
| | | | 5,326,102 | |
| | | | | | | | | | | | | | | | |
| | | | |
| Singapore: 0.81% | | | | | | | | | | | | | | | | |
DBS Group Holdings Limited (Financials, Banks) | | | | | | | | | | | 227,000 | | | | 2,779,398 | |
United Overseas Bank Limited (Financials, Banks) | | | | | | | | | | | 113,000 | | | | 1,609,049 | |
| |
| | | | 4,388,447 | |
| | | | | | | | | | | | | | | | |
| | | | |
| South Africa: 0.47% | | | | | | | | | | | | | | | | |
Barclays Africa Group Limited (Financials, Banks) | | | | | | | | | | | 161,100 | | | | 1,800,223 | |
Petra Diamonds Limited (Materials, Metals & Mining) † | | | | | | | | | | | 367,347 | | | | 757,461 | |
| |
| | | | 2,557,684 | |
| | | | | | | | | | | | | | | | |
| | | | |
| South Korea: 2.23% | | | | | | | | | | | | | | | | |
BNK Financial Group Incorporated (Financials, Banks) | | | | | | | | | | | 13,188 | | | | 101,077 | |
E-MART Limited (Consumer Staples, Food & Staples Retailing) | | | | | | | | | | | 8,500 | | | | 1,366,922 | |
Industrial Bank of Korea (Financials, Banks) | | | | | | | | | | | 192,500 | | | | 2,148,860 | |
KT&G Corporation (Consumer Staples, Tobacco) | | | | | | | | | | | 31,300 | | | | 2,811,257 | |
Kwangju Bank (Financials, Banks) | | | | | | | | | | | 13,510 | | | | 119,031 | |
SK Telecom Company Limited (Telecommunication Services, Wireless Telecommunication Services) | | | | | | | | | | | 19,000 | | | | 3,673,068 | |
Woori Bank (Financials, Banks) | | | | | | | | | | | 178,044 | | | | 1,827,576 | |
| |
| | | | 12,047,791 | |
| | | | | | | | | | | | | | | | |
The accompanying notes are an integral part of these financial statements.
| | | | | | |
| Portfolio of investments—November 30, 2016 (unaudited) | | Wells Fargo Equity Gateway Funds | | | 87 | |
INTERNATIONAL VALUE PORTFOLIO
| | | | | | | | | | | | | | | | |
| Security name | | | | | | | | Shares | | | Value | |
| | | | |
| Spain: 1.91% | | | | | | | | | | | | | | | | |
Banco Santander Central Hispano SA (Financials, Banks) | | | | | | | | | | | 429,681 | | | $ | 1,964,128 | |
Distribuidora Internacional SA (Consumer Staples, Food & Staples Retailing) | | | | | | | | | | | 483,500 | | | | 2,206,555 | |
Gas Natural SDG SA (Utilities, Gas Utilities) | | | | | | | | | | | 209,300 | | | | 3,582,499 | |
Iberdrola SA (Utilities, Electric Utilities) | | | | | | | | | | | 433,600 | | | | 2,609,789 | |
| |
| | | | 10,362,971 | |
| | | | | | | | | | | | | | | | |
| | | | |
| Sweden: 1.68% | | | | | | | | | | | | | | | | |
Boliden AB (Materials, Metals & Mining) | | | | | | | | | | | 122,600 | | | | 3,166,427 | |
Nordea Bank AB (Financials, Banks) | | | | | | | | | | | 177,300 | | | | 1,862,815 | |
Skandinaviska Enskilda Banken AB Class A (Financials, Banks) | | | | | | | | | | | 144,900 | | | | 1,443,847 | |
Telefonaktiebolaget LM Ericsson Class B (Information Technology, Communications Equipment) | | | | | | | | | | | 207,200 | | | | 1,066,913 | �� |
Telia Company AB (Telecommunication Services, Diversified Telecommunication Services) | | | | | | | | | | | 417,000 | | | | 1,567,118 | |
| |
| | | | 9,107,120 | |
| | | | | | | | | | | | | | | | |
| | | | |
| Switzerland: 6.98% | | | | | | | | | | | | | | | | |
Aryzta AG (Consumer Staples, Food Products) | | | | | | | | | | | 42,100 | | | | 1,793,815 | |
Baloise Holding AG (Financials, Insurance) | | | | | | | | | | | 28,800 | | | | 3,470,050 | |
Credit Suisse Group AG (Financials, Capital Markets) | | | | | | | | | | | 273,395 | | | | 3,635,586 | |
Georg Fischer AG (Industrials, Machinery) | | | | | | | | | | | 3,000 | | | | 2,567,129 | |
Helvetia Holding AG (Financials, Insurance) | | | | | | | | | | | 4,600 | | | | 2,391,168 | |
Roche Holding AG (Health Care, Pharmaceuticals) | | | | | | | | | | | 12,900 | | | | 2,876,394 | |
Swiss Life Holding AG (Financials, Insurance) | | | | | | | | | | | 17,800 | | | | 4,895,131 | |
Swiss Reinsurance AG (Financials, Insurance) | | | | | | | | | | | 75,700 | | | | 6,969,135 | |
UBS Group AG (Financials, Capital Markets) | | | | | | | | | | | 158,900 | | | | 2,527,209 | |
Valiant Holding AG (Financials, Banks) | | | | | | | | | | | 22,700 | | | | 2,173,547 | |
Zurich Insurance Group AG (Financials, Insurance) | | | | | | | | | | | 17,100 | | | | 4,482,296 | |
| |
| | | | 37,781,460 | |
| | | | | | | | | | | | | | | | |
| | | | |
| Taiwan: 1.10% | | | | | | | | | | | | | | | | |
Hon Hai Precision Industry Company Limited GDR (Information Technology, Electronic Equipment, Instruments & Components) | | | | | | | | | | | 49,100 | | | | 245,991 | |
Hon Hai Precision Industry Company Limited (Information Technology, Electronic Equipment, Instruments & Components) | | | | | | | | | | | 1,255,000 | | | | 3,228,752 | |
Pegatron Corporation (Information Technology, Technology Hardware, Storage & Peripherals) | | | | | | | | | | | 1,035,000 | | | | 2,464,672 | |
| |
| | | | 5,939,415 | |
| | | | | | | | | | | | | | | | |
| | | | |
| Thailand: 1.50% | | | | | | | | | | | | | | | | |
Bangchak Petroleum PCL (Energy, Oil, Gas & Consumable Fuels) | | | | | | | | | | | 2,188,900 | | | | 2,009,178 | |
Krung Thai Bank PCL (Financials, Banks) | | | | | | | | | | | 4,470,600 | | | | 2,205,260 | |
Thai Oil PCL (Energy, Oil, Gas & Consumable Fuels) | | | | | | | | | | | 1,003,900 | | | | 2,068,040 | |
Thanachart Capital PCL (Financials, Banks) | | | | | | | | | | | 1,481,500 | | | | 1,826,987 | |
| | | | |
| | | | | | | | | | | | | | | 8,109,465 | |
| | | | | | | | | | | | | | | | |
| | | | |
| United Kingdom: 14.75% | | | | | | | | | | | | | | | | |
3i Group plc (Financials, Capital Markets) | | | | | | | | | | | 409,100 | | | | 3,526,755 | |
AMEC Foster Wheeler plc (Energy, Energy Equipment & Services) | | | | | | | | | | | 83,300 | | | | 454,421 | |
AstraZeneca plc (Health Care, Pharmaceuticals) | | | | | | | | | | | 30,100 | | | | 1,562,748 | |
Aviva plc (Financials, Insurance) | | | | | | | | | | | 314,900 | | | | 1,761,192 | |
BAE Systems plc (Industrials, Aerospace & Defense) | | | | | | | | | | | 939,800 | | | | 7,061,144 | |
The accompanying notes are an integral part of these financial statements.
| | | | |
| 88 | | Wells Fargo Equity Gateway Funds | | Portfolio of investments—November 30, 2016 (unaudited) |
INTERNATIONAL VALUE PORTFOLIO
| | | | | | | | | | | | | | | | |
| Security name | | | | | | | | Shares | | | Value | |
| | | | |
| United Kingdom (continued) | | | | | | | | | | | | | | | | |
Barclays plc (Financials, Banks) | | | | | | | | | | | 715,000 | | | $ | 1,931,905 | |
Barratt Developments plc (Consumer Discretionary, Household Durables) | | | | | | | | | | | 345,800 | | | | 2,030,063 | |
Bellway plc (Consumer Discretionary, Household Durables) | | | | | | | | | | | 80,100 | | | | 2,447,399 | |
Berkeley Group Holdings plc (Consumer Discretionary, Household Durables) | | | | | | | | | | | 75,800 | | | | 2,349,210 | |
Bovis Homes Group plc (Consumer Discretionary, Household Durables) | | | | | | | | | | | 108,600 | | | | 1,104,707 | |
BP plc (Energy, Oil, Gas & Consumable Fuels) | | | | | | | | | | | 1,138,200 | | | | 6,543,098 | |
BT Group plc (Telecommunication Services, Diversified Telecommunication Services) | | | | | | | | | | | 252,200 | | | | 1,126,838 | |
Carillion plc (Industrials, Construction & Engineering) | | | | | | | | | | | 764,400 | | | | 2,360,437 | |
Centrica plc (Utilities, Multi-Utilities) | | | | | | | | | | | 898,500 | | | | 2,364,199 | |
Chemring Group plc (Industrials, Aerospace & Defense) † | | | | | | | | | | | 324,766 | | | | 674,536 | |
Crest Nicholson Holdings plc (Consumer Discretionary, Household Durables) | | | | | | | | | | | 264,876 | | | | 1,449,931 | |
Debenhams plc (Consumer Discretionary, Multiline Retail) | | | | | | | | | | | 1,238,200 | | | | 858,276 | |
easyJet plc (Industrials, Airlines) | | | | | | | | | | | 103,400 | | | | 1,280,803 | |
Firstgroup plc (Industrials, Road & Rail) † | | | | | | | | | | | 952,400 | | | | 1,213,092 | |
GlaxoSmithKline plc (Health Care, Pharmaceuticals) | | | | | | | | | | | 251,200 | | | | 4,700,376 | |
Inchcape plc (Consumer Discretionary, Distributors) | | | | | | | | | | | 25,400 | | | | 193,384 | |
Indivior plc (Health Care, Pharmaceuticals) | | | | | | | | | | | 371,600 | | | | 1,499,915 | |
International Consolidated Airlines Group SA (Industrials, Airlines) | | | | | | | | | | | 182,900 | | | | 992,040 | |
J Sainsbury plc (Consumer Staples, Food & Staples Retailing) | | | | | | | | | | | 1,211,800 | | | | 3,502,430 | |
Kingfisher plc (Consumer Discretionary, Specialty Retail) | | | | | | | | | | | 507,900 | | | | 2,243,895 | |
Lloyds Banking Group plc (Financials, Banks) | | | | | | | | | | | 2,460,500 | | | | 1,781,572 | |
Marks & Spencer Group plc (Consumer Discretionary, Multiline Retail) | | | | | | | | | | | 379,900 | | | | 1,562,412 | |
Marston’s plc (Consumer Discretionary, Hotels, Restaurants & Leisure) | | | | | | | | | | | 558,800 | | | | 940,384 | |
Meggitt plc (Industrials, Aerospace & Defense) | | | | | | | | | | | 316,900 | | | | 1,873,090 | |
Mitchells & Butlers plc (Consumer Discretionary, Hotels, Restaurants & Leisure) | | | | | | | | | | | 236,800 | | | | 673,157 | |
Mitie Group plc (Industrials, Commercial Services & Supplies) « | | | | | | | | | | | 539,300 | | | | 1,387,331 | |
Mondi plc (Materials, Paper & Forest Products) | | | | | | | | | | | 117,200 | | | | 2,394,641 | |
Old Mutual plc (Financials, Insurance) | | | | | | | | | | | 698,000 | | | | 1,658,468 | |
Paragon Group of Companies plc (Financials, Thrifts & Mortgage Finance) | | | | | | | | | | | 355,291 | | | | 1,624,349 | |
Premier Foods plc (Consumer Staples, Food Products) † | | | | | | | | | | | 73,926 | | | | 40,698 | |
Redrow plc (Consumer Discretionary, Household Durables) | | | | | | | | | | | 388,600 | | | | 1,986,679 | |
Restaurant Group plc (Consumer Discretionary, Hotels, Restaurants & Leisure) | | | | | | | | | | | 44,316 | | | | 179,985 | |
Royal Dutch Shell plc Class B (Energy, Oil, Gas & Consumable Fuels) | | | | | | | | | | | 104,800 | | | | 2,777,898 | |
Royal Mail plc (Industrials, Air Freight & Logistics) | | | | | | | | | | | 382,800 | | | | 2,244,403 | |
Tullett Prebon plc (Financials, Capital Markets) | | | | | | | | | | | 279,500 | | | | 1,555,162 | |
Vesuvius plc (Industrials, Machinery) | | | | | | | | | | | 145,400 | | | | 715,691 | |
William Morrison Supermarkets plc (Consumer Staples, Food & Staples Retailing) | | | | | | | | | | | 443,800 | | | | 1,207,739 | |
| | | | |
| | | | | | | | | | | | | | | 79,836,453 | |
| | | | | | | | | | | | | | | | |
| | | | |
Total Common Stocks (Cost $570,491,874) | | | | | | | | | | | | | | | 526,958,268 | |
| | | | | | | | | | | | | | | | |
| | | | |
| | | Dividend yield | | | | | | | | | | |
| | | | |
Preferred Stocks: 0.26% | | | | | | | | | | | | | | | | |
| | | | |
| Brazil: 0.26% | | | | | | | | | | | | | | | | |
Banco do Estado do Rio Grande do Sul SA (Financials, Banks) ± | | | 5.91 | % | | | | | | | 349,800 | | | | 1,164,604 | |
Companhia Energetica de Minas Gerais SA (Utilities, Electric Utilities) ± | | | 5.66 | | | | | | | | 109,056 | | | | 254,740 | |
| | | | |
Total Preferred Stocks (Cost $3,545,600) | | | | | | | | | | | | | | | 1,419,344 | |
| | | | | | | | | | | | | | | | |
The accompanying notes are an integral part of these financial statements.
| | | | | | |
| Portfolio of investments—November 30, 2016 (unaudited) | | Wells Fargo Equity Gateway Funds | | | 89 | |
INTERNATIONAL VALUE PORTFOLIO
| | | | | | | | | | | | | | | | |
| Security name | | Yield | | | | | | Shares | | | Value | |
| | | | |
Short-Term Investments: 2.96% | | | | | | | | | | | | | | | | |
| | | | |
| Investment Companies: 2.96% | | | | | | | | | | | | | | | | |
Securities Lending Cash Investment LLC (l)(r)(u) | | | 0.65 | % | | | | | | | 9,471,381 | | | $ | 9,472,329 | |
Wells Fargo Government Money Market Fund Select Class (l)(u) | | | 0.31 | | | | | | | | 6,504,594 | | | | 6,504,594 | |
| | | | |
Total Short-Term Investments (Cost $15,976,523) | | | | | | | | | | | | | | | 15,976,923 | |
| | | | | | | | | | | | | | | | |
| | | | | | | | |
| Total investments in securities (Cost $590,013,997) * | | | 100.60 | % | | | 544,354,535 | |
Other assets and liabilities, net | | | (0.60 | ) | | | (3,225,536 | ) |
| | | | | | | | |
| Total net assets | | | 100.00 | % | | $ | 541,128,999 | |
| | | | | | | | |
| † | Non-income-earning security |
| (a) | The security is fair valued in accordance with procedures approved by the Board of Trustees. |
| « | All or a portion of this security is on loan. |
| ± | Variable rate investment. The rate shown is the rate in effect at period end. |
| (l) | The issuer of the security is an affiliated person of the Portfolio as defined in the Investment Company Act of 1940. |
| (r) | The investment is a non-registered investment vehicle purchased with cash collateral received from securities on loan. |
| (u) | The rate represents the 7-day annualized yield at period end. |
| * | Cost for federal income tax purposes is $590,510,958 and unrealized gains (losses) consists of: |
| | | | |
Gross unrealized gains | | $ | 54,934,308 | |
Gross unrealized losses | | | (101,090,731 | ) |
| | | | |
Net unrealized losses | | $ | (46,156,423 | ) |
The following table shows the percent of total long-term investments by sector as of November 30, 2016:
| | | | |
Financials | | | 26.84 | % |
Consumer Discretionary | | | 14.56 | |
Industrials | | | 13.90 | |
Materials | | | 9.18 | |
Health Care | | | 8.27 | |
Consumer Staples | | | 7.20 | |
Telecommunication Services | | | 5.38 | |
Energy | | | 5.25 | |
Information Technology | | | 4.75 | |
Utilities | | | 3.58 | |
Real Estate | | | 1.09 | |
| | | | |
| | | 100.00 | % |
| | | | |
The accompanying notes are an integral part of these financial statements.
| | | | |
| 90 | | Wells Fargo Equity Gateway Funds | | Portfolio of investments—November 30, 2016 (unaudited) |
LARGE COMPANY VALUE PORTFOLIO
| | | | | | | | | | | | | | | | |
| Security name | | | | | | | | Shares | | | Value | |
| | | | |
Common Stocks: 100.26% | | | | | | | | | | | | | | | | |
| | | | |
Consumer Discretionary: 6.22% | | | | | | | | | | | | | | | | |
| | | | |
| Hotels, Restaurants & Leisure: 1.20% | | | | | | | | | | | | | | | | |
Norwegian Cruise Line Holdings Limited † | | | | | | | | | | | 22,588 | | | $ | 899,228 | |
| | | | | | | | | | | | | | | | |
| | | | |
| Leisure Products: 1.19% | | | | | | | | | | | | | | | | |
Mattel Incorporated | | | | | | | | | | | 28,289 | | | | 893,084 | |
| | | | | | | | | | | | | | | | |
| | | | |
| Media: 1.24% | | | | | | | | | | | | | | | | |
Scripps Networks Interactive Incorporated Class A | | | | | | | | | | | 13,361 | | | | 925,383 | |
| | | | | | | | | | | | | | | | |
| | | | |
| Specialty Retail: 1.63% | | | | | | | | | | | | | | | | |
Signet Jewelers Limited « | | | | | | | | | | | 7,442 | | | | 679,380 | |
Williams-Sonoma Incorporated | | | | | | | | | | | 9,848 | | | | 539,473 | |
| | | | |
| | | | | | | | | | | | | | | 1,218,853 | |
| | | | | | | | | | | | | | | | |
| | | | |
| Textiles, Apparel & Luxury Goods: 0.96% | | | | | | | | | | | | | | | | |
HanesBrands Incorporated | | | | | | | | | | | 30,807 | | | | 715,647 | |
| | | | | | | | | | | | | | | | |
| | | | |
Consumer Staples: 6.50% | | | | | | | | | | | | | | | | |
| | | | |
| Beverages: 0.78% | | | | | | | | | | | | | | | | |
Coca-Cola European Partners plc | | | | | | | | | | | 18,027 | | | | 585,156 | |
| | | | | | | | | | | | | | | | |
| | | | |
| Food & Staples Retailing: 0.91% | | | | | | | | | | | | | | | | |
CVS Health Corporation | | | | | | | | | | | 8,817 | | | | 677,939 | |
| | | | | | | | | | | | | | | | |
| | | | |
| Food Products: 3.02% | | | | | | | | | | | | | | | | |
ConAgra Foods Incorporated | | | | | | | | | | | 22,948 | | | | 841,962 | |
Lamb Weston Holdings Incorporated † | | | | | | | | | | | 24,397 | | | | 816,812 | |
TreeHouse Foods Incorporated † | | | | | | | | | | | 8,597 | | | | 595,944 | |
| | | | |
| | | | | | | | | | | | | | | 2,254,718 | |
| | | | | | | | | | | | | | | | |
| | | | |
| Household Products: 1.07% | | | | | | | | | | | | | | | | |
The Procter & Gamble Company | | | | | | | | | | | 9,735 | | | | 802,748 | |
| | | | | | | | | | | | | | | | |
| | | | |
| Personal Products: 0.72% | | | | | | | | | | | | | | | | |
Herbalife Limited †« | | | | | | | | | | | 11,002 | | | | 539,428 | |
| | | | | | | | | | | | | | | | |
| | | | |
Energy: 13.70% | | | | | | | | | | | | | | | | |
| | | | |
| Energy Equipment & Services: 1.71% | | | | | | | | | | | | | | | | |
Baker Hughes Incorporated | | | | | | | | | | | 19,922 | | | | 1,281,582 | |
| | | | | | | | | | | | | | | | |
| | | | |
| Oil, Gas & Consumable Fuels: 11.99% | | | | | | | | | | | | | | | | |
Apache Corporation | | | | | | | | | | | 14,744 | | | | 972,367 | |
Chevron Corporation | | | | | | | | | | | 10,225 | | | | 1,140,701 | |
ConocoPhillips | | | | | | | | | | | 33,992 | | | | 1,649,292 | |
Exxon Mobil Corporation | | | | | | | | | | | 25,922 | | | | 2,262,991 | |
Kinder Morgan Incorporated | | | | | | | | | | | 60,857 | | | | 1,351,025 | |
Noble Energy Incorporated | | | | | | | | | | | 41,675 | | | | 1,590,318 | |
| | | | |
| | | | | | | | | | | | | | | 8,966,694 | |
| | | | | | | | | | | | | | | | |
The accompanying notes are an integral part of these financial statements.
| | | | | | |
| Portfolio of investments—November 30, 2016 (unaudited) | | Wells Fargo Equity Gateway Funds | | | 91 | |
LARGE COMPANY VALUE PORTFOLIO
| | | | | | | | | | | | | | | | |
| Security name | | | | | | | | Shares | | | Value | |
| | | | |
Financials: 24.10% | | | | | | | | | | | | | | | | |
| | | | |
| Banks: 14.51% | | | | | | | | | | | | | | | | |
Bank of America Corporation | | | | | | | | | | | 88,457 | | | $ | 1,868,212 | |
BOK Financial Corporation « | | | | | | | | | | | 17,834 | | | | 1,432,427 | |
CIT Group Incorporated | | | | | | | | | | | 29,921 | | | | 1,222,273 | |
Citigroup Incorporated | | | | | | | | | | | 28,047 | | | | 1,581,570 | |
First Republic Bank | | | | | | | | | | | 10,675 | | | | 874,283 | |
FNB Corporation PA | | | | | | | | | | | 102,222 | | | | 1,561,952 | |
JPMorgan Chase & Company | | | | | | | | | | | 28,913 | | | | 2,317,955 | |
| | | | |
| | | | | | | | | | | | | | | 10,858,672 | |
| | | | | | | | | | | | | | | | |
| | | | |
| Capital Markets: 3.26% | | | | | | | | | | | | | | | | |
Affiliated Managers Group Incorporated † | | | | | | | | | | | 4,699 | | | | 695,922 | |
Ameriprise Financial Incorporated | | | | | | | | | | | 3,994 | | | | 456,155 | |
Goldman Sachs Group Incorporated | | | | | | | | | | | 5,871 | | | | 1,287,452 | |
| | | | |
| | | | | | | | | | | | | | | 2,439,529 | |
| | | | | | | | | | | | | | | | |
| | | | |
| Insurance: 6.33% | | | | | | | | | | | | | | | | |
American International Group Incorporated | | | | | | | | | | | 26,004 | | | | 1,646,833 | |
Arthur J. Gallagher & Company | | | | | | | | | | | 19,125 | | | | 962,944 | |
Chubb Limited | | | | | | | | | | | 8,758 | | | | 1,121,024 | |
MetLife Incorporated | | | | | | | | | | | 18,213 | | | | 1,001,897 | |
| | | | |
| | | | | | | | | | | | | | | 4,732,698 | |
| | | | | | | | | | | | | | | | |
| | | | |
Health Care: 10.28% | | | | | | | | | | | | | | | | |
| | | | |
| Biotechnology: 1.81% | | | | | | | | | | | | | | | | |
AbbVie Incorporated | | | | | | | | | | | 9,462 | | | | 575,290 | |
Shire plc ADR | | | | | | | | | | | 4,489 | | | | 783,779 | |
| | | | |
| | | | | | | | | | | | | | | 1,359,069 | |
| | | | | | | | | | | | | | | | |
| | | | |
| Health Care Providers & Services: 2.50% | | | | | | | | | | | | | | | | |
AmSurg Corporation †« | | | | | | | | | | | 8,848 | | | | 602,726 | |
Cigna Corporation | | | | | | | | | | | 5,034 | | | | 678,281 | |
HCA Holdings Incorporated † | | | | | | | | | | | 8,291 | | | | 587,749 | |
| | | | |
| | | | | | | | | | | | | | | 1,868,756 | |
| | | | | | | | | | | | | | | | |
| | | | |
| Pharmaceuticals: 5.97% | | | | | | | | | | | | | | | | |
Allergan plc | | | | | | | | | | | 3,972 | | | | 771,760 | |
Johnson & Johnson | | | | | | | | | | | 6,914 | | | | 769,528 | |
Mallinckrodt plc † | | | | | | | | | | | 14,270 | | | | 752,029 | |
Merck & Company Incorporated | | | | | | | | | | | 14,988 | | | | 917,116 | |
Pfizer Incorporated | | | | | | | | | | | 39,049 | | | | 1,255,035 | |
| | | | |
| | | | | | | | | | | | | | | 4,465,468 | |
| | | | | | | | | | | | | | | | |
| | | | |
Industrials: 10.60% | | | | | | | | | | | | | | | | |
| | | | |
| Aerospace & Defense: 2.55% | | | | | | | | | | | | | | | | |
Curtiss-Wright Corporation | | | | | | | | | | | 10,547 | | | | 1,060,184 | |
Orbital ATK Incorporated | | | | | | | | | | | 9,957 | | | | 849,631 | |
| | | | |
| | | | | | | | | | | | | | | 1,909,815 | |
| | | | | | | | | | | | | | | | |
The accompanying notes are an integral part of these financial statements.
| | | | |
| 92 | | Wells Fargo Equity Gateway Funds | | Portfolio of investments—November 30, 2016 (unaudited) |
LARGE COMPANY VALUE PORTFOLIO
| | | | | | | | | | | | | | | | |
| Security name | | | | | | | | Shares | | | Value | |
| | | | |
| Airlines: 1.09% | | | | | | | | | | | | | | | | |
United Continental Holdings Incorporated † | | | | | | | | | | | 11,852 | | | $ | 817,195 | |
| | | | | | | | | | | | | | | | |
| | | | |
| Electrical Equipment: 0.96% | | | | | | | | | | | | | | | | |
Eaton Corporation plc | | | | | | | | | | | 10,743 | | | | 714,517 | |
| | | | | | | | | | | | | | | | |
| | | | |
| Industrial Conglomerates: 1.61% | | | | | | | | | | | | | | | | |
General Electric Company | | | | | | | | | | | 39,096 | | | | 1,202,593 | |
| | | | | | | | | | | | | | | | |
| | | | |
| Machinery: 1.67% | | | | | | | | | | | | | | | | |
Stanley Black & Decker Incorporated | | | | | | | | | | | 10,506 | | | | 1,246,327 | |
| | | | | | | | | | | | | | | | |
| | | | |
| Road & Rail: 1.23% | | | | | | | | | | | | | | | | |
Norfolk Southern Corporation | | | | | | | | | | | 8,656 | | | | 921,518 | |
| | | | | | | | | | | | | | | | |
| | | | |
| Trading Companies & Distributors: 1.49% | | | | | | | | | | | | | | | | |
HD Supply Holdings Incorporated † | | | | | | | | | | | 28,463 | | | | 1,116,888 | |
| | | | | | | | | | | | | | | | |
| | | | |
Information Technology: 10.57% | | | | | | | | | | | | | | | | |
| | | | |
| Electronic Equipment, Instruments & Components: 2.12% | | | | | | | | | | | | | | | | |
Synnex Corporation | | | | | | | | | | | 7,320 | | | | 855,781 | |
TE Connectivity Limited | | | | | | | | | | | 10,754 | | | | 727,401 | |
| | | | |
| | | | | | | | | | | | | | | 1,583,182 | |
| | | | | | | | | | | | | | | | |
| | | | |
| Internet Software & Services: 1.38% | | | | | | | | | | | | | | | | |
Alphabet Incorporated Class C † | | | | | | | | | | | 1,362 | | | | 1,032,450 | |
| | | | | | | | | | | | | | | | |
| | | | |
| IT Services: 1.01% | | | | | | | | | | | | | | | | |
Alliance Data Systems Corporation | | | | | | | | | | | 3,290 | | | | 752,686 | |
| | | | | | | | | | | | | | | | |
| | | | |
| Semiconductors & Semiconductor Equipment: 2.71% | | | | | | | | | | | | | | | | |
NXP Semiconductors NV † | | | | | | | | | | | 8,734 | | | | 865,976 | |
Skyworks Solutions Incorporated | | | | | | | | | | | 15,126 | | | | 1,162,433 | |
| | | | |
| | | | | | | | | | | | | | | 2,028,409 | |
| | | | | | | | | | | | | | | | |
| | | | |
| Software: 0.79% | | | | | | | | | | | | | | | | |
Citrix Systems Incorporated † | | | | | | | | | | | 6,840 | | | | 593,233 | |
| | | | | | | | | | | | | | | | |
| | | | |
| Technology Hardware, Storage & Peripherals: 2.56% | | | | | | | | | | | | | | | | |
Apple Incorporated | | | | | | | | | | | 6,384 | | | | 705,560 | |
NCR Corporation † | | | | | | | | | | | 31,246 | | | | 1,210,783 | |
| | | | |
| | | | | | | | | | | | | | | 1,916,343 | |
| | | | | | | | | | | | | | | | |
| | | | |
Materials: 4.35% | | | | | | | | | | | | | | | | |
| | | | |
| Chemicals: 2.07% | | | | | | | | | | | | | | | | |
Cabot Corporation | | | | | | | | | | | 10,801 | | | | 550,095 | |
FMC Corporation | | | | | | | | | | | 17,826 | | | | 1,000,395 | |
| | | | |
| | | | | | | | | | | | | | | 1,550,490 | |
| | | | | | | | | | | | | | | | |
| | | | |
| Containers & Packaging: 2.28% | | | | | | | | | | | | | | | | |
Crown Holdings Incorporated † | | | | | | | | | | | 15,497 | | | | 842,882 | |
WestRock Company | | | | | | | | | | | 16,768 | | | | 858,522 | |
| | | | |
| | | | | | | | | | | | | | | 1,701,404 | |
| | | | | | | | | | | | | | | | |
The accompanying notes are an integral part of these financial statements.
| | | | | | |
| Portfolio of investments—November 30, 2016 (unaudited) | | Wells Fargo Equity Gateway Funds | | | 93 | |
LARGE COMPANY VALUE PORTFOLIO
| | | | | | | | | | | | | | | | |
| Security name | | | | | | | | Shares | | | Value | |
| | | | |
Real Estate: 6.39% | | | | | | | | | | | | | | | | |
| | | | |
| Equity REITs: 6.39% | | | | | | | | | | | | | | | | |
Alexandria Real Estate Equities Incorporated | | | | | | | | | | | 16,994 | | | $ | 1,862,372 | |
Prologis Incorporated | | | | | | | | | | | 16,426 | | | | 836,083 | |
SL Green Realty Corporation | | | | | | | | | | | 7,470 | | | | 787,039 | |
VEREIT Incorporated | | | | | | | | | | | 88,980 | | | | 737,644 | |
Vornado Realty Trust | | | | | | | | | | | 5,698 | | | | 556,980 | |
| | | | |
| | | | | | | | | | | | | | | 4,780,118 | |
| | | | | | | | | | | | | | | | |
| | | | |
Telecommunication Services: 2.12% | | | | | | | | | | | | | | | | |
| | | | |
| Diversified Telecommunication Services: 2.12% | | | | | | | | | | | | | | | | |
AT&T Incorporated | | | | | | | | | | | 20,511 | | | | 792,340 | |
Verizon Communications Incorporated | | | | | | | | | | | 15,997 | | | | 798,250 | |
| | | | |
| | | | | | | | | | | | | | | 1,590,590 | |
| | | | | | | | | | | | | | | | |
| | | | |
Utilities: 5.43% | | | | | | | | | | | | | | | | |
| | | | |
| Electric Utilities: 4.43% | | | | | | | | | | | | | | | | |
Duke Energy Corporation | | | | | | | | | | | 13,747 | | | | 1,014,116 | |
Great Plains Energy Incorporated | | | | | | | | | | | 45,713 | | | | 1,206,366 | |
The Southern Company | | | | | | | | | | | 23,409 | | | | 1,096,009 | |
| | | | |
| | | | | | | | | | | | | | | 3,316,491 | |
| | | | | | | | | | | | | | | | |
| | | | |
| Multi-Utilities: 1.00% | | | | | | | | | | | | | | | | |
Black Hills Corporation « | | | | | | | | | | | 12,675 | | | | 744,656 | |
| | | | | | | | | | | | | | | | |
| | | | |
Total Common Stocks (Cost $60,740,114) | | | | | | | | | | | | | | | 75,003,557 | |
| | | | | | | | | | | | | | | | |
| | | | |
| | | Yield | | | | | | | | | | |
| Short-Term Investments: 4.42% | | | | | | | | | | | | | | | | |
| | | | |
| Investment Companies: 4.42% | | | | | | | | | | | | | | | | |
Securities Lending Cash Investment LLC (l)(r)(u) | | | 0.65 | % | | | | | | | 3,310,979 | | | | 3,311,310 | |
| | | | | | | | | | | | | | | | |
| | | | |
Total Short-Term Investments (Cost $3,311,198) | | | | | | | | | | | | | | | 3,311,310 | |
| | | | | | | | | | | | | | | | |
| | | | | | | | |
| Total investments in securities (Cost $64,051,312) * | | | 104.68 | % | | | 78,314,867 | |
Other assets and liabilities, net | | | (4.68 | ) | | | (3,504,364 | ) |
| | | | | | | | |
| Total net assets | | | 100.00 | % | | $ | 74,810,503 | |
| | | | | | | | |
| † | Non-income-earning security |
| « | All or a portion of this security is on loan. |
| (l) | The issuer of the security is an affiliated person of the Portfolio as defined in the Investment Company Act of 1940. |
| (r) | The investment is a non-registered investment vehicle purchased with cash collateral received from securities on loan. |
| (u) | The rate represents the 7-day annualized yield at period end. |
| * | Cost for federal income tax purposes is $64,189,829 and unrealized gains (losses) consists of: |
| | | | |
Gross unrealized gains | | $ | 15,729,328 | |
Gross unrealized losses | | | (1,604,290 | ) |
| | | | |
Net unrealized gains | | $ | 14,125,038 | |
The accompanying notes are an integral part of these financial statements.
| | | | |
| 94 | | Wells Fargo Equity Gateway Funds | | Portfolio of investments—November 30, 2016 (unaudited) |
SMALL COMPANY GROWTH PORTFOLIO
| | | | | | | | | | | | | | | | |
| Security name | | | | | | | | Shares | | | Value | |
| | | | |
Common Stocks: 95.13% | | | | | | | | | | | | | | | | |
| | | | |
Consumer Discretionary: 13.25% | | | | | | | | | | | | | | | | |
| | | | |
| Auto Components: 1.39% | | | | | | | | | | | | | | | | |
Gentherm Incorporated † | | | | | | | | | | | 428,583 | | | $ | 13,650,369 | |
Tower International Incorporated | | | | | | | | | | | 280,761 | | | | 7,355,938 | |
| | | | |
| | | | | | | | | | | | | | | 21,006,307 | |
| | | | | | | | | | | | | | | | |
| | | | |
| Diversified Consumer Services: 0.49% | | | | | | | | | | | | | | | | |
Houghton Mifflin Harcourt Company † | | | | | | | | | | | 673,835 | | | | 7,445,877 | |
| | | | | | | | | | | | | | | | |
| | | | |
| Hotels, Restaurants & Leisure: 2.18% | | | | | | | | | | | | | | | | |
Del Taco Restaurants Incorporated † | | | | | | | | | | | 675,213 | | | | 9,804,093 | |
Extended Stay America Incorporated | | | | | | | | | | | 867,711 | | | | 13,501,583 | |
Zoe’s Kitchen Incorporated «† | | | | | | | | | | | 393,745 | | | | 9,709,752 | |
| | | | |
| | | | | | | | | | | | | | | 33,015,428 | |
| | | | | | | | | | | | | | | | |
| | | | |
| Household Durables: 1.18% | | | | | | | | | | | | | | | | |
Tempur-Pedic International Incorporated Ǡ | | | | | | | | | | | 137,287 | | | | 8,690,267 | |
William Lyon Homes Class A Ǡ | | | | | | | | | | | 465,911 | | | | 9,225,038 | |
| | | | |
| | | | | | | | | | | | | | | 17,915,305 | |
| | | | | | | | | | | | | | | | |
| | | | |
| Media: 2.45% | | | | | | | | | | | | | | | | |
IMAX Corporation Ǡ | | | | | | | | | | | 633,716 | | | | 20,247,226 | |
Lions Gate Entertainment Corporation « | | | | | | | | | | | 450,595 | | | | 10,543,923 | |
Media General Incorporated † | | | | | | | | | | | 346,667 | | | | 6,368,273 | |
| | | | |
| | | | | | | | | | | | | | | 37,159,422 | |
| | | | | | | | | | | | | | | | |
| | | | |
| Specialty Retail: 4.95% | | | | | | | | | | | | | | | | |
At Home Group Incorporated Ǡ | | | | | | | | | | | 334,908 | | | | 4,313,615 | |
Burlington Stores Incorporated † | | | | | | | | | | | 182,737 | | | | 16,066,237 | |
Chico’s FAS Incorporated | | | | | | | | | | | 607,888 | | | | 9,306,765 | |
Dick’s Sporting Goods Incorporated | | | | | | | | | | | 260,543 | | | | 15,390,275 | |
Monro Muffler Brake Incorporated | | | | | | | | | | | 180,411 | | | | 10,788,578 | |
Party City Holdco Incorporated Ǡ | | | | | | | | | | | 787,328 | | | | 12,636,614 | |
Sportsman’s Warehouse Holdings Incorporated † | | | | | | | | | | | 722,719 | | | | 6,504,471 | |
| | | | |
| | | | | | | | | | | | | | | 75,006,555 | |
| | | | | | | | | | | | | | | | |
| | | | |
| Textiles, Apparel & Luxury Goods: 0.61% | | | | | | | | | | | | | | | | |
Kate Spade & Company † | | | | | | | | | | | 620,807 | | | | 9,218,984 | |
| | | | | | | | | | | | | | | | |
| | | | |
Consumer Staples: 1.81% | | | | | | | | | | | | | | | | |
| | | | |
| Food Products: 0.91% | | | | | | | | | | | | | | | | |
Snyders Lance Incorporated | | | | | | | | | | | 371,994 | | | | 13,860,496 | |
| | | | | | | | | | | | | | | | |
| | | | |
| Household Products: 0.90% | | | | | | | | | | | | | | | | |
Central Garden & Pet Company Class A † | | | | | | | | | | | 496,937 | | | | 13,601,166 | |
| | | | | | | | | | | | | | | | |
The accompanying notes are an integral part of these financial statements.
| | | | | | |
| Portfolio of investments—November 30, 2016 (unaudited) | | Wells Fargo Equity Gateway Funds | | | 95 | |
SMALL COMPANY GROWTH PORTFOLIO
| | | | | | | | | | | | | | | | |
| Security name | | | | | | | | Shares | | | Value | |
| | | | |
Energy: 3.57% | | | | | | | | | | | | | | | | |
| | | | |
| Energy Equipment & Services: 0.54% | | | | | | | | | | | | | | | | |
Mammoth Energy Services Incorporated † | | | | | | | | | | | 246,374 | | | $ | 3,949,375 | |
Smart Sand Incorporated † | | | | | | | | | | | 308,988 | | | | 4,223,866 | |
| | | | |
| | | | | | | | | | | | | | | 8,173,241 | |
| | | | | | | | | | | | | | | | |
| | | | |
| Oil, Gas & Consumable Fuels: 3.03% | | | | | | | | | | | | | | | | |
Diamondback Energy Incorporated † | | | | | | | | | | | 86,343 | | | | 9,312,093 | |
GasLog Limited « | | | | | | | | | | | 520,749 | | | | 8,175,759 | |
Oasis Petroleum Incorporated † | | | | | | | | | | | 629,047 | | | | 9,416,834 | |
PDC Energy Incorporated † | | | | | | | | | | | 127,547 | | | | 9,495,874 | |
QEP Resources Incorporated | | | | | | | | | | | 486,916 | | | | 9,572,769 | |
| | | | |
| | | | | | | | | | | | | | | 45,973,329 | |
| | | | | | | | | | | | | | | | |
| | | | |
Financials: 9.27% | | | | | | | | | | | | | | | | |
| | | | |
| Banks: 2.85% | | | | | | | | | | | | | | | | |
ServisFirst Bancshares Incorporated | | | | | | | | | | | 157,518 | | | | 11,596,475 | |
Signature Bank † | | | | | | | | | | | 82,084 | | | | 12,305,212 | |
SVB Financial Group † | | | | | | | | | | | 122,193 | | | | 19,310,160 | |
| | | | |
| | | | | | | | | | | | | | | 43,211,847 | |
| | | | | | | | | | | | | | | | |
| | | | |
| Capital Markets: 3.81% | | | | | | | | | | | | | | | | |
Evercore Partners Incorporated Class A | | | | | | | | | | | 289,599 | | | | 19,518,973 | |
Stifel Financial Corporation † | | | | | | | | | | | 309,969 | | | | 15,451,955 | |
Virtu Financial Incorporated Class A | | | | | | | | | | | 799,166 | | | | 11,068,449 | |
Virtus Investment Partners Incorporated « | | | | | | | | | | | 100,356 | | | | 11,621,225 | |
| | | | |
| | | | | | | | | | | | | | | 57,660,602 | |
| | | | | | | | | | | | | | | | |
| | | | |
| Insurance: 1.33% | | | | | | | | | | | | | | | | |
Argo Group International Holdings Limited | | | | | | | | | | | 318,160 | | | | 20,187,252 | |
| | | | | | | | | | | | | | | | |
| | | | |
| Thrifts & Mortgage Finance: 1.28% | | | | | | | | | | | | | | | | |
Essent Group Limited † | | | | | | | | | | | 635,448 | | | | 19,393,873 | |
| | | | | | | | | | | | | | | | |
| | | | |
Health Care: 20.62% | | | | | | | | | | | | | | | | |
| | | | |
| Biotechnology: 3.71% | | | | | | | | | | | | | | | | |
Alder Biopharmaceuticals Incorporated Ǡ | | | | | | | | | | | 216,403 | | | | 5,096,291 | |
Alnylam Pharmaceuticals Incorporated † | | | | | | | | | | | 128,703 | | | | 5,646,201 | |
Emergent BioSolutions Incorporated | | | | | | | | | | | 184,706 | | | | 4,942,733 | |
Flexion Therapeutics Incorporated † | | | | | | | | | | | 453,599 | | | | 7,484,384 | |
Galapagos NV | | | | | | | | | | | 55,987 | | | | 3,309,951 | |
Intrexon Corporation Ǡ | | | | | | | | | | | 156,456 | | | | 4,565,386 | |
Ophthotech Corporation † | | | | | | | | | | | 148,610 | | | | 4,554,897 | |
Portola Pharmaceuticals Incorporated † | | | | | | | | | | | 282,149 | | | | 5,075,861 | |
Radius Health Incorporated Ǡ | | | | | | | | | | | 115,044 | | | | 6,122,642 | |
Tesaro Incorporated Ǡ | | | | | | | | | | | 68,924 | | | | 9,352,298 | |
| | | | |
| | | | | | | | | | | | | | | 56,150,644 | |
| | | | | | | | | | | | | | | | |
The accompanying notes are an integral part of these financial statements.
| | | | |
| 96 | | Wells Fargo Equity Gateway Funds | | Portfolio of investments—November 30, 2016 (unaudited) |
SMALL COMPANY GROWTH PORTFOLIO
| | | | | | | | | | | | | | | | |
| Security name | | | | | | | | Shares | | | Value | |
| | | | |
| Health Care Equipment & Supplies: 8.19% | | | | | | | | | | | | | | | | |
Accuray Incorporated Ǡ | | | | | | | | | | | 1,502,649 | | | $ | 7,588,377 | |
Analogic Corporation | | | | | | | | | | | 140,682 | | | | 12,963,846 | |
Atricure Incorporated Ǡ | | | | | | | | | | | 493,150 | | | | 8,871,769 | |
Cerus Corporation Ǡ | | | | | | | | | | | 2,023,805 | | | | 10,564,262 | |
DexCom Incorporated † | | | | | | | | | | | 156,767 | | | | 10,235,317 | |
Inogen Incorporated † | | | | | | | | | | | 231,853 | | | | 14,938,289 | |
K2M Group Holdings Incorporated Ǡ | | | | | | | | | | | 599,308 | | | | 11,266,990 | |
Nevro Corporation Ǡ | | | | | | | | | | | 197,741 | | | | 15,034,248 | |
Novocure Limited Ǡ | | | | | | | | | | | 693,104 | | | | 5,371,556 | |
Obalon Therapeutics Incorporated Ǡ | | | | | | | | | | | 175,558 | | | | 2,141,808 | |
The Spectranetics Corporation † | | | | | | | | | | | 576,206 | | | | 12,590,101 | |
Wright Medical Group NV Ǡ | | | | | | | | | | | 541,891 | | | | 12,485,169 | |
| | | | |
| | | | | | | | | | | | | | | 124,051,732 | |
| | | | | | | | | | | | | | | | |
| | | | |
| Health Care Providers & Services: 4.83% | | | | | | | | | | | | | | | | |
AMN Healthcare Services Incorporated † | | | | | | | | | | | 516,420 | | | | 17,196,786 | |
HealthEquity Incorporated † | | | | | | | | | | | 423,315 | | | | 18,850,217 | |
LifePoint Hospitals Incorporated † | | | | | | | | | | | 127,242 | | | | 6,991,948 | |
Surgery Partners Incorporated Ǡ | | | | | | | | | | | 665,808 | | | | 9,820,668 | |
Teladoc Incorporated Ǡ | | | | | | | | | | | 451,456 | | | | 8,284,218 | |
The Ensign Group Incorporated | | | | | | | | | | | 556,138 | | | | 12,023,704 | |
| | | | |
| | | | | | | | | | | | | | | 73,167,541 | |
| | | | | | | | | | | | | | | | |
| | | | |
| Health Care Technology: 1.74% | | | | | | | | | | | | | | | | |
Evolent Health Incorporated Class A Ǡ | | | | | | | | | | | 639,290 | | | | 12,018,652 | |
Medidata Solutions Incorporated † | | | | | | | | | | | 176,517 | | | | 9,749,034 | |
Vocera Communications Incorporated † | | | | | | | | | | | 253,550 | | | | 4,614,610 | |
| | | | |
| | | | | | | | | | | | | | | 26,382,296 | |
| | | | | | | | | | | | | | | | |
| | | | |
| Life Sciences Tools & Services: 1.68% | | | | | | | | | | | | | | | | |
ICON plc ADR † | | | | | | | | | | | 276,389 | | | | 20,906,064 | |
Pacific BioSciences of California Ǡ | | | | | | | | | | | 606,224 | | | | 4,613,365 | |
| | | | |
| | | | | | | | | | | | | | | 25,519,429 | |
| | | | | | | | | | | | | | | | |
| | | | |
| Pharmaceuticals: 0.47% | | | | | | | | | | | | | | | | |
Pacira Pharmaceuticals Incorporated † | | | | | | | | | | | 225,421 | | | | 7,179,659 | |
| | | | | | | | | | | | | | | | |
| | | | |
Industrials: 15.55% | | | | | | | | | | | | | | | | |
| | | | |
| Air Freight & Logistics: 0.70% | | | | | | | | | | | | | | | | |
Hub Group Incorporated Class A † | | | | | | | | | | | 248,722 | | | | 10,657,738 | |
| | | | | | | | | | | | | | | | |
| | | | |
| Building Products: 4.65% | | | | | | | | | | | | | | | | |
A.O. Smith Corporation | | | | | | | | | | | 343,834 | | | | 16,720,647 | |
Apogee Enterprises Incorporated « | | | | | | | | | | | 376,873 | | | | 17,976,842 | |
Masonite International Corporation † | | | | | | | | | | | 156,523 | | | | 10,142,690 | |
NCI Building Systems Incorporated † | | | | | | | | | | | 840,469 | | | | 14,035,832 | |
PGT Incorporated † | | | | | | | | | | | 1,043,239 | | | | 11,579,953 | |
| | | | |
| | | | | | | | | | | | | | | 70,455,964 | |
| | | | | | | | | | | | | | | | |
The accompanying notes are an integral part of these financial statements.
| | | | | | |
| Portfolio of investments—November 30, 2016 (unaudited) | | Wells Fargo Equity Gateway Funds | | | 97 | |
SMALL COMPANY GROWTH PORTFOLIO
| | | | | | | | | | | | | | | | |
| Security name | | | | | | | | Shares | | | Value | |
| | | | |
| Commercial Services & Supplies: 3.11% | | | | | | | | | | | | | | | | |
Copart Incorporated † | | | | | | | | | | | 399,834 | | | $ | 21,878,916 | |
KAR Auction Services Incorporated | | | | | | | | | | | 311,248 | | | | 13,122,216 | |
West Corporation | | | | | | | | | | | 507,728 | | | | 12,114,390 | |
| | | | |
| | | | | | | | | | | | | | | 47,115,522 | |
| | | | | | | | | | | | | | | | |
| | | | |
| Construction & Engineering: 1.73% | | | | | | | | | | | | | | | | |
Chicago Bridge & Iron Company NV | | | | | | | | | | | 267,979 | | | | 8,979,976 | |
Granite Construction Incorporated | | | | | | | | | | | 291,422 | | | | 17,190,984 | |
| | | | |
| | | | | | | | | | | | | | | 26,170,960 | |
| | | | | | | | | | | | | | | | |
| | | | |
| Machinery: 2.20% | | | | | | | | | | | | | | | | |
EnPro Industries Incorporated | | | | | | | | | | | 242,570 | | | | 14,748,256 | |
SPX Corporation † | | | | | | | | | | | 266,974 | | | | 6,522,175 | |
Wabash National Corporation † | | | | | | | | | | | 871,045 | | | | 12,011,711 | |
| | | | |
| | | | | | | | | | | | | | | 33,282,142 | |
| | | | | | | | | | | | | | | | |
| | | | |
| Professional Services: 1.48% | | | | | | | | | | | | | | | | |
On Assignment Incorporated † | | | | | | | | | | | 408,796 | | | | 16,879,187 | |
RPX Corporation † | | | | | | | | | | | 524,539 | | | | 5,481,433 | |
| | | | |
| | | | | | | | | | | | | | | 22,360,620 | |
| | | | | | | | | | | | | | | | |
| | | | |
| Road & Rail: 1.68% | | | | | | | | | | | | | | | | |
Genesee & Wyoming Incorporated Class A † | | | | | | | | | | | 177,927 | | | | 13,593,623 | |
Swift Transportation Company Ǡ | | | | | | | | | | | 478,378 | | | | 11,945,099 | |
| | | | |
| | | | | | | | | | | | | | | 25,538,722 | |
| | | | | | | | | | | | | | | | |
| | | | |
Information Technology: 27.24% | | | | | | | | | | | | | | | | |
| | | | |
| Communications Equipment: 0.93% | | | | | | | | | | | | | | | | |
Ciena Corporation † | | | | | | | | | | | 659,825 | | | | 14,153,246 | |
| | | | | | | | | | | | | | | | |
| | | | |
| Electronic Equipment, Instruments & Components: 0.89% | | | | | | | | | | | | | | | | |
OSI Systems Incorporated † | | | | | | | | | | | 178,599 | | | | 13,519,944 | |
| | | | | | | | | | | | | | | | |
| | | | |
| Internet Software & Services: 4.93% | | | | | | | | | | | | | | | | |
2U Incorporated Ǡ | | | | | | | | | | | 481,364 | | | | 15,913,894 | |
Benefitfocus Incorporated Ǡ | | | | | | | | | | | 395,772 | | | | 10,804,576 | |
Cornerstone OnDemand Incorporated † | | | | | | | | | | | 395,230 | | | | 14,192,709 | |
Hortonworks Incorporated Ǡ | | | | | | | | | | | 709,136 | | | | 6,446,046 | |
Mimecast Limited Ǡ | | | | | | | | | | | 308,131 | | | | 6,304,360 | |
Pandora Media Incorporated Ǡ | | | | | | | | | | | 632,881 | | | | 7,354,077 | |
Shopify Incorporated Class A † | | | | | | | | | | | 330,468 | | | | 13,770,602 | |
| | | | |
| | | | | | | | | | | | | | | 74,786,264 | |
| | | | | | | | | | | | | | | | |
| | | | |
| IT Services: 2.96% | | | | | | | | | | | | | | | | |
Acxiom Corporation † | | | | | | | | | | | 725,369 | | | | 19,244,040 | |
Maximus Incorporated | | | | | | | | | | | 183,650 | | | | 10,154,009 | |
Vantiv Incorporated Class A † | | | | | | | | | | | 272,902 | | | | 15,399,860 | |
| | | | |
| | | | | | | | | | | | | | | 44,797,909 | |
| | | | | | | | | | | | | | | | |
The accompanying notes are an integral part of these financial statements.
| | | | |
| 98 | | Wells Fargo Equity Gateway Funds | | Portfolio of investments—November 30, 2016 (unaudited) |
SMALL COMPANY GROWTH PORTFOLIO
| | | | | | | | | | | | | | | | |
| Security name | | | | | | | | Shares | | | Value | |
| | | | |
| Semiconductors & Semiconductor Equipment: 6.90% | | | | | | | | | | | | | | | | |
Applied Micro Circuits Corporation † | | | | | | | | | | | 1,446,062 | | | $ | 12,653,043 | |
Cypress Semiconductor Corporation | | | | | | | | | | | 1,370,032 | | | | 15,412,860 | |
FormFactor Incorporated † | | | | | | | | | | | 1,168,758 | | | | 13,090,090 | |
Microsemi Corporation † | | | | | | | | | | | 424,962 | | | | 23,266,670 | |
Nanometrics Incorporated † | | | | | | | | | | | 376,654 | | | | 9,005,797 | |
Silicon Motion Technology Corporation | | | | | | | | | | | 229,552 | | | | 10,557,096 | |
Teradyne Incorporated | | | | | | | | | | | 841,804 | | | | 20,523,182 | |
| | | | |
| | | | | | | | | | | | | | | 104,508,738 | |
| | | | | | | | | | | | | | | | |
| | | | |
| Software: 10.63% | | | | | | | | | | | | | | | | |
Cadence Design Systems Incorporated † | | | | | | | | | | | 735,628 | | | | 19,332,304 | |
CyberArk Software Limited Ǡ | | | | | | | | | | | 287,418 | | | | 14,661,192 | |
Nuance Communications Incorporated † | | | | | | | | | | | 814,495 | | | | 13,202,964 | |
PTC Incorporated † | | | | | | | | | | | 496,550 | | | | 24,186,951 | |
Realpage Incorporated † | | | | | | | | | | | 647,839 | | | | 18,528,195 | |
Secureworks Corporation Class A Ǡ | | | | | | | | | | | 285,547 | | | | 3,526,505 | |
SS&C Technologies Holdings Incorporated | | | | | | | | | | | 838,360 | | | | 25,159,184 | |
Synchronoss Technologies Incorporated † | | | | | | | | | | | 214,327 | | | | 10,390,573 | |
Talend SA † | | | | | | | | | | | 200,949 | | | | 4,639,912 | |
The Rubicon Project Incorporated † | | | | | | | | | | | 681,139 | | | | 5,142,599 | |
Ultimate Software Group Incorporated † | | | | | | | | | | | 54,951 | | | | 11,261,108 | |
Zendesk Incorporated † | | | | | | | | | | | 520,474 | | | | 11,080,891 | |
| | | | |
| | | | | | | | | | | | | | | 161,112,378 | |
| | | | | | | | | | | | | | | | |
| | | |
Materials: 2.71% | | | | | | | | | | | | | |
| | | |
| Construction Materials: 0.81% | | | | | | | | | | | | | |
Forterra Incorporated † | | | | | | | | | | | 616,847 | | | | 12,219,739 | |
| | | | | | | | | | | | | | | | |
| | | |
| Metals & Mining: 0.99% | | | | | | | | | | | | | |
Steel Dynamics Incorporated | | | | | | | | | | | 421,999 | | | | 14,972,525 | |
| | | | | | | | | | | | | | | | |
| | | |
| Paper & Forest Products: 0.91% | | | | | | | | | | | | | |
Boise Cascade Company † | | | | | | | | | | | 607,382 | | | | 13,848,310 | |
| | | | | | | | | | | | | | | | |
| | | |
Real Estate: 1.11% | | | | | | | | | | | | | |
| | | |
| Equity REITs: 1.11% | | | | | | | | | | | | | |
QTS Realty Trust Incorporated Class A | | | | | | | | | | | 359,619 | | | | 16,830,162 | |
| | | | | | | | | | | | | | | | |
| | | | |
Total Common Stocks (Cost $1,226,035,864) | | | | | | | | | | | | | | | 1,441,611,868 | |
| | | | | | | | | | | | | | | | |
| | | | |
| | | Yield | | | | | | | | | | |
| Short-Term Investments: 15.86% | | | | | | | | | | | | | | | | |
| | | | |
| Investment Companies: 15.86% | | | | | | | | | | | | | | | | |
Securities Lending Cash Investment LLC (l)(r)(u) | | | 0.65 | % | | | | | | | 165,095,831 | | | | 165,112,340 | |
Wells Fargo Government Money Market Fund Select Class (l)(u) | | | 0.31 | | | | | | | | 75,190,164 | | | | 75,190,164 | |
| | | | |
Total Short-Term Investments (Cost $240,287,228) | | | | | | | | | | | | | | | 240,302,504 | |
| | | | | | | | | | | | | | | | |
The accompanying notes are an integral part of these financial statements.
| | | | | | |
| Portfolio of investments—November 30, 2016 (unaudited) | | Wells Fargo Equity Gateway Funds | | | 99 | |
SMALL COMPANY GROWTH PORTFOLIO
| | | | | | | | |
| | | | | | Value | |
| Total investments in securities (Cost $1,466,323,092) * | | | 110.99 | % | | $ | 1,681,914,372 | |
Other assets and liabilities, net | | | (10.99 | ) | | | (166,551,894 | ) |
| | | | | | | | |
| Total net assets | | | 100.00 | % | | $ | 1,515,362,478 | |
| | | | | | | | |
| † | Non-income-earning security |
| « | All or a portion of this security is on loan. |
| (l) | The issuer of the security is an affiliated person of the Portfolio as defined in the Investment Company Act of 1940. |
| (r) | The investment is a non-registered investment vehicle purchased with cash collateral received from securities on loan. |
| (u) | The rate represents the 7-day annualized yield at period end. |
| * | Cost for federal income tax purposes is $1,510,671,686 and unrealized gains (losses) consists of: |
| | | | |
Gross unrealized gains | | $ | 279,923,404 | |
Gross unrealized losses | | | (108,680,718 | ) |
| | | | |
Net unrealized gains | | $ | 171,242,686 | |
The accompanying notes are an integral part of these financial statements.
| | | | |
| 100 | | Wells Fargo Equity Gateway Funds | | Portfolio of investments—November 30, 2016 (unaudited) |
SMALL COMPANY VALUE PORTFOLIO
| | | | | | | | | | | | | | | | |
| Security name | | | | | | | | Shares | | | Value | |
| | | | |
Common Stocks: 97.67% | | | | | | | | | | | | | | | | |
| | | | |
Consumer Discretionary: 17.61% | | | | | | | | | | | | | | | | |
| | | | |
| Auto Components: 1.81% | | | | | | | | | | | | | | | | |
Metaldyne Performance Group Incorporated | | | | | | | | | | | 93,100 | | | $ | 1,880,620 | |
Visteon Corporation | | | | | | | | | | | 27,790 | | | | 2,186,239 | |
| |
| | | | 4,066,859 | |
| | | | | | | | | | | | | | | | |
| | | | |
| Automobiles: 0.99% | | | | | | | | | | | | | | | | |
Thor Industries Incorporated | | | | | | | | | | | 22,110 | | | | 2,223,603 | |
| | | | | | | | | | | | | | | | |
| | | | |
| Diversified Consumer Services: 1.18% | | | | | | | | | | | | | | | | |
DeVry Incorporated « | | | | | | | | | | | 89,060 | | | | 2,658,441 | |
| | | | | | | | | | | | | | | | |
| | | | |
| Hotels, Restaurants & Leisure: 3.99% | | | | | | | | | | | | | | | | |
ClubCorp Holdings Incorporated | | | | | | | | | | | 155,424 | | | | 2,020,512 | |
Eldorado Resorts Incorporated Ǡ | | | | | | | | | | | 165,790 | | | | 2,279,613 | |
Penn National Gaming Incorporated † | | | | | | | | | | | 190,030 | | | | 2,523,598 | |
Red Robin Gourmet Burgers Incorporated † | | | | | | | | | | | 41,970 | | | | 2,159,357 | |
| |
| | | | 8,983,080 | |
| | | | | | | | | | | | | | | | |
| | | | |
| Household Durables: 2.60% | | | | | | | | | | | | | | | | |
Century Communities Incorporated † | | | | | | | | | | | 90,546 | | | | 1,878,830 | |
Taylor Morrison Home Corporation Class A † | | | | | | | | | | | 115,990 | | | | 2,297,762 | |
TRI Pointe Homes Incorporated † | | | | | | | | | | | 144,881 | | | | 1,683,517 | |
| |
| | | | 5,860,109 | |
| | | | | | | | | | | | | | | | |
| | | | |
| Internet & Direct Marketing Retail: 0.80% | | | | | | | | | | | | | | | | |
1-800-Flowers.com Incorporated Class A † | | | | | | | | | | | 170,400 | | | | 1,797,720 | |
| | | | | | | | | | | | | | | | |
| | | | |
| Media: 2.38% | | | | | | | | | | | | | | | | |
Lions Gate Entertainment Corporation « | | | | | | | | | | | 141,820 | | | | 3,318,588 | |
Scholastic Corporation | | | | | | | | | | | 45,933 | | | | 2,025,186 | |
| |
| | | | 5,343,774 | |
| | | | | | | | | | | | | | | | |
| | | | |
| Specialty Retail: 2.10% | | | | | | | | | | | | | | | | |
Asbury Automotive Group Incorporated † | | | | | | | | | | | 29,609 | | | | 1,739,529 | |
GNC Holdings Incorporated Class A | | | | | | | | | | | 56,970 | | | | 823,217 | |
Urban Outfitters Incorporated † | | | | | | | | | | | 68,450 | | | | 2,163,020 | |
| |
| | | | 4,725,766 | |
| | | | | | | | | | | | | | | | |
| | | | |
| Textiles, Apparel & Luxury Goods: 1.76% | | | | | | | | | | | | | | | | |
G-III Apparel Group Limited † | | | | | | | | | | | 60,000 | | | | 1,629,600 | |
Oxford Industries Incorporated | | | | | | | | | | | 32,000 | | | | 2,325,120 | |
| |
| | | | 3,954,720 | |
| | | | | | | | | | | | | | | | |
| | | | |
Consumer Staples: 2.14% | | | | | | | | | | | | | | | | |
| | | | |
| Food & Staples Retailing: 1.16% | | | | | | | | | | | | | | | | |
The Andersons Incorporated | | | | | | | | | | | 24,425 | | | | 961,124 | |
United Natural Foods Incorporated † | | | | | | | | | | | 35,120 | | | | 1,648,884 | |
| |
| | | | 2,610,008 | |
| | | | | | | | | | | | | | | | |
The accompanying notes are an integral part of these financial statements.
| | | | | | |
| Portfolio of investments—November 30, 2016 (unaudited) | | Wells Fargo Equity Gateway Funds | | | 101 | |
SMALL COMPANY VALUE PORTFOLIO
| | | | | | | | | | | | | | | | |
| Security name | | | | | | | | Shares | | | Value | |
| | | | |
| Food Products: 0.98% | | | | | | | | | | | | | | | | |
Darling Ingredients Incorporated † | | | | | | | | | | | 163,010 | | | $ | 2,202,265 | |
| | | | | | | | | | | | | | | | |
| | | | |
Energy: 5.04% | | | | | | | | | | | | | | | | |
| | | | |
| Energy Equipment & Services: 1.80% | | | | | | | | | | | | | | | | |
RPC Incorporated « | | | | | | | | | | | 98,300 | | | | 1,973,864 | |
Unit Corporation † | | | | | | | | | | | 85,160 | | | | 2,069,388 | |
| |
| | | | 4,043,252 | |
| | | | | | | | | | | | | | | | |
| | | | |
| Oil, Gas & Consumable Fuels: 3.24% | | | | | | | | | | | | | | | | |
Callon Petroleum Company † | | | | | | | | | | | 114,600 | | | | 2,021,544 | |
Carrizo Oil & Gas Incorporated † | | | | | | | | | | | 41,000 | | | | 1,735,940 | |
Delek US Holdings Incorporated | | | | | | | | | | | 112,900 | | | | 2,270,419 | |
Scorpio Tankers Incorporated | | | | | | | | | | | 301,400 | | | | 1,274,922 | |
| |
| | | | 7,302,825 | |
| | | | | | | | | | | | | | | | |
| | | | |
Financials: 27.50% | | | | | | | | | | | | | | | | |
| | | | |
| Banks: 19.50% | | | | | | | | | | | | | | | | |
BancorpSouth Incorporated | | | | | | | | | | | 78,592 | | | | 2,243,802 | |
Cathay General Bancorp | | | | | | | | | | | 67,300 | | | | 2,362,230 | |
Chemical Financial Corporation | | | | | | | | | | | 50,895 | | | | 2,640,433 | |
ConnectOne Bancorp Incorporated | | | | | | | | | | | 74,920 | | | | 1,760,620 | |
Customers Bancorp Incorporated † | | | | | | | | | | | 61,700 | | | | 1,881,850 | |
FCB Financial Holdings Class A † | | | | | | | | | | | 58,700 | | | | 2,597,475 | |
Great Western Bancorp Incorporated | | | | | | | | | | | 63,140 | | | | 2,525,600 | |
Independent Bank Group Incorporated | | | | | | | | | | | 48,700 | | | | 2,926,870 | |
MB Financial Incorporated | | | | | | | | | | | 56,400 | | | | 2,440,428 | |
Pinnacle Financial Partners Incorporated | | | | | | | | | | | 36,560 | | | | 2,358,120 | |
Renasant Corporation | | | | | | | | | | | 69,700 | | | | 2,889,762 | |
Sterling BanCorp | | | | | | | | | | | 100,673 | | | | 2,290,311 | |
Umpqua Holdings Corporation | | | | | | | | | | | 120,400 | | | | 2,139,508 | |
United Community Bank | | | | | | | | | | | 92,800 | | | | 2,522,304 | |
Webster Financial Corporation | | | | | | | | | | | 51,537 | | | | 2,556,751 | |
Western Alliance Bancorp † | | | | | | | | | | | 58,678 | | | | 2,741,436 | |
Wintrust Financial Corporation | | | | | | | | | | | 36,977 | | | | 2,434,566 | |
Yadkin Financial Corporation | | | | | | | | | | | 77,800 | | | | 2,548,728 | |
| |
| | | | 43,860,794 | |
| | | | | | | | | | | | | | | | |
| | | | |
| Capital Markets: 1.37% | | | | | | | | | | | | | | | | |
Stifel Financial Corporation † | | | | | | | | | | | 61,893 | | | | 3,085,366 | |
| | | | | | | | | | | | | | | | |
| | | | |
| Consumer Finance: 1.00% | | | | | | | | | | | | | | | | |
PRA Group Incorporated † | | | | | | | | | | | 62,470 | | | | 2,245,797 | |
| | | | | | | | | | | | | | | | |
| | | | |
| Insurance: 4.66% | | | | | | | | | | | | | | | | |
American Equity Investment Life Holding Company | | | | | | | | | | | 93,208 | | | | 1,932,202 | |
Horace Mann Educators Corporation | | | | | | | | | | | 66,210 | | | | 2,658,332 | |
Kemper Corporation | | | | | | | | | | | 54,310 | | | | 2,223,995 | |
OneBeacon Insurance Group Limited Class A | | | | | | | | | | | 95,256 | | | | 1,462,180 | |
Primerica Incorporated | | | | | | | | | | | 31,363 | | | | 2,217,364 | |
| |
| | | | 10,494,073 | |
| | | | | | | | | | | | | | | | |
The accompanying notes are an integral part of these financial statements.
| | | | |
| 102 | | Wells Fargo Equity Gateway Funds | | Portfolio of investments—November 30, 2016 (unaudited) |
SMALL COMPANY VALUE PORTFOLIO
| | | | | | | | | | | | | | | | |
| Security name | | | | | | | | Shares | | | Value | |
| | | | |
| Thrifts & Mortgage Finance: 0.97% | | | | | | | | | | | | | | | | |
Bofi Holding Incorporated Ǡ | | | | | | | | | | | 92,300 | | | $ | 2,181,049 | |
| | | | | | | | | | | | | | | | |
| | | | |
Health Care: 5.69% | | | | | | | | | | | | | | | | |
| | | | |
| Health Care Equipment & Supplies: 0.80% | | | | | | | | | | | | | | | | |
Merit Medical Systems Incorporated † | | | | | | | | | | | 76,410 | | | | 1,799,456 | |
| | | | | | | | | | | | | | | | |
| | | | |
| Health Care Providers & Services: 4.89% | | | | | | | | | | | | | | | | |
Magellan Health Services Incorporated † | | | | | | | | | | | 37,120 | | | | 2,702,336 | |
Molina Healthcare Incorporated † | | | | | | | | | | | 44,540 | | | | 2,354,384 | |
Owens & Minor Incorporated | | | | | | | | | | | 45,850 | | | | 1,554,774 | |
PharMerica Corporation † | | | | | | | | | | | 103,710 | | | | 2,494,226 | |
Select Medical Holdings Corporation † | | | | | | | | | | | 155,120 | | | | 1,884,708 | |
| |
| | | | 10,990,428 | |
| | | | | | | | | | | | | | | | |
| | | | |
Industrials: 10.21% | | | | | | | | | | | | | | | | |
| | | | |
| Aerospace & Defense: 0.97% | | | | | | | | | | | | | | | | |
Triumph Group Incorporated | | | | | | | | | | | 78,360 | | | | 2,178,408 | |
| | | | | | | | | | | | | | | | |
| | | | |
| Commercial Services & Supplies: 3.05% | | | | | | | | | | | | | | | | |
Interface Incorporated | | | | | | | | | | | 131,220 | | | | 2,283,228 | |
LSC Communications Incorporated | | | | | | | | | | | 96,461 | | | | 1,990,955 | |
West Corporation | | | | | | | | | | | 108,110 | | | | 2,579,505 | |
| |
| | | | 6,853,688 | |
| | | | | | | | | | | | | | | | |
| | | | |
| Construction & Engineering: 2.87% | | | | | | | | | | | | | | | | |
Argan Incorporated | | | | | | | | | | | 36,932 | | | | 2,232,539 | |
KBR Incorporated | | | | | | | | | | | 107,290 | | | | 1,792,816 | |
Tutor Perini Corporation † | | | | | | | | | | | 92,895 | | | | 2,424,560 | |
| |
| | | | 6,449,915 | |
| | | | | | | | | | | | | | | | |
| | | | |
| Electrical Equipment: 0.89% | | | | | | | | | | | | | | | | |
Generac Holdings Incorporated † | | | | | | | | | | | 49,090 | | | | 2,011,708 | |
| | | | | | | | | | | | | | | | |
| | | | |
| Professional Services: 1.23% | | | | | | | | | | | | | | | | |
Korn/Ferry International | | | | | | | | | | | 108,560 | | | | 2,755,253 | |
| | | | | | | | | | | | | | | | |
| | | | |
| Trading Companies & Distributors: 1.20% | | | | | | | | | | | | | | | | |
Air Lease Corporation | | | | | | | | | | | 75,500 | | | | 2,707,430 | |
| | | | | | | | | | | | | | | | |
| | | | |
Information Technology: 13.59% | | | | | | | | | | | | | | | | |
| | | | |
| Communications Equipment: 1.95% | | | | | | | | | | | | | | | | |
Comtech Telecommunications Corporation | | | | | | | | | | | 151,970 | | | | 1,747,655 | |
NetScout Systems Incorporated † | | | | | | | | | | | 84,350 | | | | 2,631,720 | |
| |
| | | | 4,379,375 | |
| | | | | | | | | | | | | | | | |
| | | | |
| Electronic Equipment, Instruments & Components: 3.30% | | | | | | | | | | | | | | | | |
Anixter International Incorporated † | | | | | | | | | | | 26,120 | | | | 2,041,278 | |
Jabil Circuit Incorporated | | | | | | | | | | | 123,910 | | | | 2,620,697 | |
VeriFone Systems Incorporated † | | | | | | | | | | | 98,000 | | | | 1,655,220 | |
Vishay Intertechnology Incorporated | | | | | | | | | | | 72,381 | | | | 1,098,418 | |
| |
| | | | 7,415,613 | |
| | | | | | | | | | | | | | | | |
The accompanying notes are an integral part of these financial statements.
| | | | | | |
| Portfolio of investments—November 30, 2016 (unaudited) | | Wells Fargo Equity Gateway Funds | | | 103 | |
SMALL COMPANY VALUE PORTFOLIO
| | | | | | | | | | | | | | | | |
| Security name | | | | | | | | Shares | | | Value | |
| | | | |
| IT Services: 1.13% | | | | | | | | | | | | | | | | |
Cardtronics Incorporated † | | | | | | | | | | | 51,610 | | | $ | 2,553,147 | |
| | | | | | | | | | | | | | | | |
| | | |
| Semiconductors & Semiconductor Equipment: 4.47% | | | | | | | | | | | | | |
Cirrus Logic Incorporated † | | | | | | | | | | | 60,070 | | | | 3,303,850 | |
Integrated Device Technology Incorporated † | | | | | | | | | | | 72,814 | | | | 1,703,848 | |
MKS Instruments Incorporated | | | | | | | | | | | 36,870 | | | | 2,121,869 | |
Veeco Instruments Incorporated † | | | | | | | | | | | 110,140 | | | | 2,935,231 | |
| | | | |
| | | | | | | | | | | | | | | 10,064,798 | |
| | | | | | | | | | | | | | | | |
| | | |
| Software: 2.27% | | | | | | | | | | | | | |
Nuance Communications Incorporated † | | | | | | | | | | | 147,450 | | | | 2,390,165 | |
Tivo Corporation † | | | | | | | | | | | 134,460 | | | | 2,722,815 | |
| | | | |
| | | | | | | | | | | | | | | 5,112,980 | |
| | | | | | | | | | | | | | | | |
| | | |
| Technology Hardware, Storage & Peripherals: 0.47% | | | | | | | | | | | | | |
Avid Technology Incorporated † | | | | | | | | | | | 250,880 | | | | 1,056,205 | |
| | | | | | | | | | | | | | | | |
| | | |
Materials: 3.18% | | | | | | | | | | | | | |
| | | |
| Chemicals: 2.04% | | | | | | | | | | | | | |
A. Schulman Incorporated | | | | | | | | | | | 78,000 | | | | 2,597,400 | |
Cabot Corporation | | | | | | | | | | | 39,200 | | | | 1,996,456 | |
| | | | |
| | | | | | | | | | | | | | | 4,593,856 | |
| | | | | | | | | | | | | | | | |
| | | |
| Metals & Mining: 1.14% | | | | | | | | | | | | | |
Ferroglobe plc (a) | | | | | | | | | | | 224,340 | | | | 0 | |
Ferroglobe plc | | | | | | | | | | | 224,340 | | | | 2,559,719 | |
| | | | |
| | | | | | | | | | | | | | | 2,559,719 | |
| | | | | | | | | | | | | | | | |
| | | |
Real Estate: 9.20% | | | | | | | | | | | | | |
| | | |
| Equity REITs: 8.41% | | | | | | | | | | | | | |
Brandywine Realty Trust | | | | | | | | | | | 139,500 | | | | 2,141,325 | |
Corporate Office Properties Trust | | | | | | | | | | | 75,600 | | | | 2,163,672 | |
Cousins Properties Incorporated | | | | | | | | | | | 281,500 | | | | 2,226,665 | |
Equity Commonwealth † | | | | | | | | | | | 76,200 | | | | 2,215,896 | |
Four Corners Property Trust Incorporated | | | | | | | | | | | 123,100 | | | | 2,361,058 | |
Kite Realty Group Trust | | | | | | | | | | | 83,100 | | | | 1,998,555 | |
Pennsylvania Real Estate Investment Trust | | | | | | | | | | | 94,500 | | | | 1,811,565 | |
Ramco-Gershenson Properties Trust | | | | | | | | | | | 101,721 | | | | 1,726,205 | |
Sunstone Hotel Investors Incorporated | | | | | | | | | | | 156,680 | | | | 2,278,127 | |
| | | | |
| | | | | | | | | | | | | | | 18,923,068 | |
| | | | | | | | | | | | | | | | |
| | | |
| Real Estate Management & Development: 0.79% | | | | | | | | | | | | | |
Alexander & Baldwin Incorporated | | | | | | | | | | | 40,281 | | | | 1,775,184 | |
| | | | | | | | | | | | | | | | |
| | | |
Utilities: 3.51% | | | | | | | | | | | | | |
| | | |
| Electric Utilities: 2.70% | | | | | | | | | | | | | |
El Paso Electric Company | | | | | | | | | | | 45,031 | | | | 2,028,647 | |
PNM Resources Incorporated | | | | | | | | | | | 61,127 | | | | 1,931,613 | |
Portland General Electric Company | | | | | | | | | | | 50,924 | | | | 2,118,438 | |
| | | | |
| | | | | | | | | | | | | | | 6,078,698 | |
| | | | | | | | | | | | | | | | |
The accompanying notes are an integral part of these financial statements.
| | | | |
| 104 | | Wells Fargo Equity Gateway Funds | | Portfolio of investments—November 30, 2016 (unaudited) |
SMALL COMPANY VALUE PORTFOLIO
| | | | | | | | | | | | | | | | |
| Security name | | | | | | | | Shares | | | Value | |
| | | |
| Gas Utilities: 0.81% | | | | | | | | | | | | | |
Southwest Gas Corporation | | | | | | | | | | | 24,490 | | | $ | 1,815,436 | |
| | | | | | | | | | | | | | | | |
| | | | |
Total Common Stocks (Cost $181,313,891) | | | | | | | | | | | | | | | 219,713,866 | |
| | | | | | | | | | | | | | | | |
| | | | |
| | | | | | Expiration date | | | | | | | |
| | | |
Warrants: 0.00% | | | | | | | | | | | | | |
| | | |
Health Care: 0.00% | | | | | | | | | | | | | |
| | | |
| Health Care Equipment & Supplies: 0.00% | | | | | | | | | | | | | |
EnteroMedics Incorporated †(a) | | | | | | | 2-15-2017 | | | | 9,104 | | | | 0 | |
| | | | | | | | | | | | | | | | |
| | | | |
Total Warrants (Cost $0) | | | | | | | | | | | | | | | 0 | |
| | | | | | | | | | | | | | | | |
| | | | |
| | | Yield | | | | | | | | | | |
| Short-Term Investments: 6.71% | | | | | | | | | | | | | | | | |
| | | | |
| Investment Companies: 6.71% | | | | | | | | | | | | | | | | |
Securities Lending Cash Investment LLC (l)(r)(u) | | | 0.65 | % | | | | | | | 11,761,436 | | | | 11,762,612 | |
Wells Fargo Government Money Market Fund Select Class (u) | | | 0.31 | | | | | | | | 3,332,087 | | | | 3,332,087 | |
| | | | |
Total Short-Term Investments (Cost $15,094,012) | | | | | | | | | | | | | | | 15,094,699 | |
| | | | | | | | | | | | | | | | |
| | | | | | | | |
| Total investments in securities (Cost $196,407,903) * | | | 104.38 | % | | | 234,808,565 | |
Other assets and liabilities, net | | | (4.38 | ) | | | (9,860,757 | ) |
| | | | | | | | |
| Total net assets | | | 100.00 | % | | $ | 224,947,808 | |
| | | | | | | | |
| « | All or a portion of this security is on loan. |
| † | Non-income-earning security |
| (a) | The security is fair valued in accordance with procedures approved by the Board of Trustees. |
| (l) | The issuer of the security is an affiliated person of the Portfolio as defined in the Investment Company Act of 1940. |
| (r) | The investment is a non-registered investment vehicle purchased with cash collateral received from securities on loan. |
| (u) | The rate represents the 7-day annualized yield at period end. |
| * | Cost for federal income tax purposes is $198,335,771 and unrealized gains (losses) consists of: |
| | | | |
Gross unrealized gains | | $ | 45,949,979 | |
Gross unrealized losses | | | (9,477,185 | ) |
| | | | |
Net unrealized gains | | $ | 36,472,794 | |
The accompanying notes are an integral part of these financial statements.
This page is intentionally left blank.
| | | | |
| 106 | | Wells Fargo Equity Gateway Funds | | Statements of assets and liabilities—November 30, 2016 (unaudited) |
| | | | | | | | |
| | | C&B Large
Cap Value
Portfolio | | | Diversified Large
Cap Growth
Portfolio | |
| | |
Assets | | | | | | | | |
Investments | | | | | | | | |
In unaffiliated securities (including securities on loan), at value (see cost below) | | $ | 333,382,884 | | | $ | 104,406,481 | |
In affiliated securities, at value (see cost below) | | | 18,117,049 | | | | 2,510,658 | |
| | | | |
Total investments, at value (see cost below) | | | 351,499,933 | | | | 106,917,139 | |
Foreign currency, at value (see cost below) | | | 0 | | | | 0 | |
Receivable for investments sold | | | 4,478,407 | | | | 963,672 | |
Receivable for dividends | | | 617,956 | | | | 154,365 | |
Receivable for daily variation margin on open futures contracts | | | 0 | | | | 0 | |
Receivable for securities lending income | | | 5,946 | | | | 1,412 | |
Prepaid expenses and other assets | | | 2,664 | | | | 0 | |
| | | | |
Total assets | | | 356,604,906 | | | | 108,036,588 | |
| | | | |
| | |
Liabilities | | | | | | | | |
Payable for investments purchased | | | 6,514,762 | | | | 944,357 | |
Payable upon receipt of securities loaned | | | 6,884,850 | | | | 1,030,168 | |
Payable for daily variation margin on open futures contracts | | | 0 | | | | 0 | |
Due to custodian bank | | | 0 | | | | 0 | |
Advisory fee payable | | | 179,778 | | | | 43,360 | |
Accrued expenses and other liabilities | | | 28,289 | | | | 55,735 | |
| | | | |
Total liabilities | | | 13,607,679 | | | | 2,073,620 | |
| | | | |
Total net assets | | $ | 342,997,227 | | | $ | 105,962,968 | |
| | | | |
| | |
Investments in unaffiliated securities (including securities on loan), at cost | | $ | 252,599,693 | | | $ | 71,168,423 | |
| | | | |
Investments in affiliated securities, at cost | | $ | 18,117,000 | | | $ | 2,510,604 | |
| | | | |
Total investments, at cost | | $ | 270,716,693 | | | $ | 73,679,027 | |
| | | | |
Securities on loan, at value | | $ | 6,741,288 | | | $ | 1,004,578 | |
| | | | |
Foreign currency, at cost | | $ | 0 | | | $ | 0 | |
| | | | |
The accompanying notes are an integral part of these financial statements.
| | | | | | |
| Statements of assets and liabilities—November 30, 2016 (unaudited) | | Wells Fargo Equity Gateway Funds | | | 107 | |
| | | | | | | | | | | | | | | | | | | | | | | | | | |
Emerging Growth Portfolio | | | Index Portfolio | | | International Growth
Portfolio | | | International Value
Portfolio | | | Large Company Value
Portfolio | | | Small Company Growth
Portfolio | | | Small Company Value
Portfolio | |
| | | | | | |
| | | | | | | | | | | | | | | | | | | | | | | | | | |
| | | | | | | | | | | | | | | | | | | | | | | | | | |
| $ | 784,260,385 | | | $ | 2,130,086,939 | | | $ | 131,184,814 | | | $ | 528,377,612 | | | $ | 75,003,557 | | | $ | 1,441,611,868 | | | $ | 219,713,866 | |
| | 105,232,529 | | | | 39,437,716 | | | | 3,957,933 | | | | 15,976,923 | | | | 3,311,310 | | | | 240,302,504 | | | | 15,094,699 | |
| | |
| | 889,492,914 | | | | 2,169,524,655 | | | | 135,142,747 | | | | 544,354,535 | | | | 78,314,867 | | | | 1,681,914,372 | | | | 234,808,565 | |
| | 0 | | | | 0 | | | | 129,529 | | | | 6,056,644 | | | | 0 | | | | 0 | | | | 0 | |
| | 6,071,508 | | | | 81,572,756 | | | | 2,484,487 | | | | 2,082,015 | | | | 11 | | | | 4,876,065 | | | | 7,523,952 | |
| | 988,515 | | | | 5,635,238 | | | | 368,292 | | | | 1,744,463 | | | | 188,595 | | | | 563,364 | | | | 189,002 | |
| | 0 | | | | 11,930 | | | | 0 | | | | 0 | | | | 0 | | | | 0 | | | | 0 | |
| | 58,139 | | | | 3,569 | | | | 5,007 | | | | 13,699 | | | | 1,404 | | | | 175,837 | | | | 5,811 | |
| | 0 | | | | 59,534 | | | | 0 | | | | 0 | | | | 0 | | | | 9,093 | | | | 562 | |
| | |
| | 896,611,076 | | | | 2,256,807,682 | | | | 138,130,062 | | | | 554,251,356 | | | | 78,504,877 | | | | 1,687,538,731 | | | | 242,527,892 | |
| | |
| | | | | | |
| | | | | | | | | | | | | | | | | | | | | | | | | | |
| | 4,316,099 | | | | 0 | | | | 1,497,296 | | | | 3,215,938 | | | | 0 | | | | 6,099,373 | | | | 5,647,301 | |
| | 85,985,863 | | | | 12,147,358 | | | | 2,197,722 | | | | 9,469,808 | | | | 3,311,197 | | | | 165,095,222 | | | | 11,761,925 | |
| | 0 | | | | 10,250 | | | | 0 | | | | 0 | | | | 0 | | | | 0 | | | | 0 | |
| | 0 | | | | 0 | | | | 0 | | | | 0 | | | | 316,141 | | | | 0 | | | | 0 | |
| | 511,877 | | | | 158,516 | | | | 89,665 | | | | 332,625 | | | | 37,729 | | | | 941,243 | | | | 143,619 | |
| | 65,959 | | | | 11,879,030 | | | | 70,612 | | | | 103,986 | | | | 29,307 | | | | 40,415 | | | | 27,239 | |
| | |
| | 90,879,798 | | | | 24,195,154 | | | | 3,855,295 | | | | 13,122,357 | | | | 3,694,374 | | | | 172,176,253 | | | | 17,580,084 | |
| | |
| $ | 805,731,278 | | | $ | 2,232,612,528 | | | $ | 134,274,767 | | | $ | 541,128,999 | | | $ | 74,810,503 | | | $ | 1,515,362,478 | | | $ | 224,947,808 | |
| | |
| | | | | | |
| $ | 560,292,720 | | | $ | 952,633,972 | | | $ | 127,462,883 | | | $ | 574,037,474 | | | $ | 60,740,114 | | | $ | 1,226,035,864 | | | $ | 181,313,891 | |
| | |
| $ | 105,224,647 | | | $ | 25,642,455 | | | $ | 3,957,933 | | | $ | 15,976,523 | | | $ | 3,311,198 | | | $ | 240,287,228 | | | $ | 15,094,012 | |
| | |
| $ | 665,517,367 | | | $ | 978,276,427 | | | $ | 131,420,816 | | | $ | 590,013,997 | | | $ | 64,051,312 | | | $ | 1,466,323,092 | | | $ | 196,407,903 | |
| | |
| $ | 83,950,774 | | | $ | 11,407,707 | | | $ | 2,094,957 | | | $ | 8,970,460 | | | $ | 3,241,542 | | | $ | 160,714,454 | | | $ | 11,468,149 | |
| | |
| $ | 0 | | | $ | 0 | | | $ | 131,433 | | | $ | 6,220,868 | | | $ | 0 | | | $ | 0 | | | $ | 0 | |
| | |
The accompanying notes are an integral part of these financial statements.
| | | | |
| 108 | | Wells Fargo Equity Gateway Funds | | Statements of operations—six months ended November 30, 2016 (unaudited) |
| | | | | | | | |
| | | C&B Large Cap Value Portfolio | | | Diversified Large
Cap Growth Portfolio | |
| | |
Investment income | | | | | | | | |
Dividends* | | $ | 2,806,863 | | | $ | 609,679 | |
Income from affiliated securities | | | 17,185 | | | | 2,589 | |
Securities lending income, net | | | 23,186 | | | | 6,747 | |
Interest | | | 0 | | | | 0 | |
| | | | |
Total investment income | | | 2,847,234 | | | | 619,015 | |
| | | | |
| | |
Expenses | | | | | | | | |
Advisory fee | | | 1,031,131 | | | | 369,429 | |
Custody and accounting fees | | | 11,931 | | | | 11,618 | |
Professional fees | | | 22,130 | | | | 24,088 | |
Shareholder report expenses | | | 531 | | | | 1,025 | |
Trustees’ fees and expenses | | | 6,301 | | | | 26,722 | |
Other fees and expenses | | | 4,552 | | | | 6,702 | |
| | | | |
Total expenses | | | 1,076,576 | | | | 439,584 | |
Less: Fee waivers and/or expense reimbursements | | | 0 | | | | (86,011 | ) |
| | | | |
Net expenses | | | 1,076,576 | | | | 353,573 | |
| | | | |
Net investment income (loss) | | | 1,770,658 | | | | 265,442 | |
| | | | |
| | |
REALIZED AND UNREALIZED GAINS (LOSSES) ON INVESTMENTS | | | | | | | | |
| | |
Net realized gains (losses) on: | | | | | | | | |
Unaffiliated securities | | | 8,791,368 | | | | 3,915,816 | |
Affiliated securities | | | 0 | | | | 0 | |
Futures transactions | | | 0 | | | | 0 | |
| | | | |
Net realized gain (losses) on investments | | | 8,791,368 | | | | 3,915,816 | |
| | | | |
| | |
Net change in unrealized gains (losses) on: | | | | | | | | |
Unaffiliated securities | | | 13,101,251 | | | | (3,207,811 | ) |
Affiliated securities | | | 49 | | | | 54 | |
Futures transactions | | | 0 | | | | 0 | |
| | | | |
Net change in unrealized gains (losses) on investments | | | 13,101,300 | | | | (3,207,757 | ) |
| | | | |
Net realized and unrealized gains (losses) on investments | | | 21,892,668 | | | | 708,059 | |
| | | | |
Net increase (decrease) in net assets resulting from operations | | $ | 23,663,326 | | | $ | 973,501 | |
| | | | |
| | |
* Net of foreign dividend withholding taxes in the amount of | | | $72,523 | | | | $2,418 | |
The accompanying notes are an integral part of these financial statements.
| | | | | | |
| Statements of operations—six months ended November 30, 2016 (unaudited) | | Wells Fargo Equity Gateway Funds | | | 109 | |
| | | | | | | | | | | | | | | | | | | | | | | | | | |
Emerging Growth Portfolio | | | Index Portfolio | | | International Growth
Portfolio | | | International
Value
Portfolio | | | Large Company
Value
Portfolio | | | Small Company
Growth
Portfolio | | | Small Company Value
Portfolio | |
| | | | | | |
| | | | | | | | | | | | | | | | | | | | | | | | | | |
| $ | 3,598,699 | | | $ | 25,227,234 | | | $ | 879,602 | | | $ | 6,732,564 | | | $ | 816,661 | | | $ | 3,366,760 | | | $ | 1,732,589 | |
| | 24,884 | | | | 450,895 | | | | 7,750 | | | | 3,094 | | | | 2,676 | | | | 100,092 | | | | 11,184 | |
| | 679,956 | | | | 74,593 | | | | 86,292 | | | | 265,478 | | | | 7,799 | | | | 1,326,542 | | | | 67,549 | |
| | 0 | | | | 2,259 | | | | 0 | | | | 0 | | | | 0 | | | | 0 | | | | 0 | |
| | |
| | 4,303,539 | | | | 25,754,981 | | | | 973,644 | | | | 7,001,136 | | | | 827,136 | | | | 4,793,394 | | | | 1,811,322 | |
| | |
| | | | | | |
| | | | | | | | | | | | | | | | | | | | | | | | | | |
| | 3,363,418 | | | | 986,981 | | | | 606,777 | | | | 2,077,052 | | | | 253,421 | | | | 5,256,376 | | | | 869,756 | |
| | 27,112 | | | | 70,665 | | | | 38,146 | | | | 94,073 | | | | 5,186 | | | | 40,181 | | | | 11,556 | |
| | 23,494 | | | | 30,361 | | | | 34,775 | | | | 30,416 | | | | 24,502 | | | | 24,297 | | | | 23,329 | |
| | 2,262 | | | | 3,561 | | | | 298 | | | | 1,323 | | | | 317 | | | | 992 | | | | 1,394 | |
| | 6,125 | | | | 4,773 | | | | 12,345 | | | | 5,982 | | | | 10,742 | | | | 5,971 | | | | 6,023 | |
| | 17,018 | | | | 15,565 | | | | 27,186 | | | | 26,969 | | | | 6,734 | | | | 12,515 | | | | 4,721 | |
| | |
| | 3,439,429 | | | | 1,111,906 | | | | 719,527 | | | | 2,235,815 | | | | 300,902 | | | | 5,340,332 | | | | 916,779 | |
| | 0 | | | | 0 | | | | 0 | | | | 0 | | | | (13,016 | ) | | | 0 | | | | 0 | |
| | |
| | 3,439,429 | | | | 1,111,906 | | | | 719,527 | | | | 2,235,815 | | | | 287,886 | | | | 5,340,332 | | | | 916,779 | |
| | |
| | 864,110 | | | | 24,643,075 | | | | 254,117 | | | | 4,765,321 | | | | 539,250 | | | | (546,938 | ) | | | 894,543 | |
| | |
| | | | | | |
| | | | | | | | | | | | | | | | | | | | | | | | | | |
| | | | | | |
| | | | | | | | | | | | | | | | | | | | | | | | | | |
| | 77,141,486 | | | | 114,919,856 | | | | 1,849,535 | | | | (8,467,844 | ) | | | 2,024,711 | | | | 7,468,252 | | | | 14,766,624 | |
| | 0 | | | | 1,344,108 | | | | 391 | | | | 2,122 | | | | 0 | | | | 0 | | | | 0 | |
| | 0 | | | | 2,844,137 | | | | 0 | | | | 0 | | | | 0 | | | | 0 | | | | 0 | |
| | |
| | 77,141,486 | | | | 119,108,101 | | | | 1,849,926 | | | | (8,465,722 | ) | | | 2,024,711 | | | | 7,468,252 | | | | 14,766,624 | |
| | |
| | | | | | |
| | | | | | | | | | | | | | | | | | | | | | | | | | |
| | 37,134,260 | | | | (9,907,265 | ) | | | (11,938,708 | ) | | | 11,362,749 | | | | 2,642,198 | | | | 136,434,698 | | | | 16,402,776 | |
| | 7,882 | | | | (314,536 | ) | | | 0 | | | | 400 | | | | 112 | | | | (1,842 | ) | | | 687 | |
| | 0 | | | | (1,096,995 | ) | | | 0 | | | | 0 | | | | 0 | | | | 0 | | | | 0 | |
| | |
| | 37,142,142 | | | | (11,318,796 | ) | | | (11,938,708 | ) | | | 11,363,149 | | | | 2,642,310 | | | | 136,432,856 | | | | 16,403,463 | |
| | |
| | 114,283,628 | | | | 107,789,305 | | | | (10,088,782 | ) | | | 2,897,427 | | | | 4,667,021 | | | | 143,901,108 | | | | 31,170,087 | |
| | |
| $ | 115,147,738 | | | $ | 132,432,380 | | | $ | (9,834,665 | ) | | $ | 7,662,748 | | | $ | 5,206,271 | | | $ | 143,354,170 | | | $ | 32,064,630 | |
| | |
| | | | | | |
| | 0 | | | | $24,170 | | | | $114,192 | | | | $829,962 | | | | $12,664 | | | | $20,750 | | | | $2,146 | |
The accompanying notes are an integral part of these financial statements.
| | | | |
| 110 | | Wells Fargo Equity Gateway Funds | | Statements of changes in net assets |
| | | | | | | | |
| | | C&B Large Cap Value Portfolio | |
| | | Six months ended
November 30, 2016 (unaudited) | | | Year ended
May 31, 2016 | |
| | |
Operations | | | | | | | | |
Net investment income | | $ | 1,770,658 | | | $ | 4,128,282 | |
Net realized gains on investments | | | 8,791,368 | | | | 14,000,084 | |
Net change in unrealized gains (losses) on investments | | | 13,101,300 | | | | (18,760,215 | ) |
| | | | |
Net increase (decrease) in net assets resulting from operations | | | 23,663,326 | | | | (631,849 | ) |
| | | | |
| | |
Capital share transactions | | | | | | | | |
Transactions in investors’ beneficial interests | | | | | | | | |
Contributions | | | 57,623,968 | | | | 38,393,377 | |
Withdrawals | | | (31,254,356 | ) | | | (80,332,043 | ) |
| | | | |
Net increase (decrease) in net assets resulting from capital share transactions | | | 26,369,612 | | | | (41,938,666 | ) |
| | | | |
Total increase (decrease) in net assets | | | 50,032,938 | | | | (42,570,515 | ) |
| | | | |
| | |
Net assets | | | | | | | | |
Beginning of period | | | 292,964,289 | | | | 335,534,804 | |
| | | | |
End of period | | $ | 342,997,227 | | | $ | 292,964,289 | |
| | | | |
The accompanying notes are an integral part of these financial statements.
| | | | | | |
| Statements of changes in net assets | | Wells Fargo Equity Gateway Funds | | | 111 | |
| | | | | | | | |
| | | Diversified Large Cap Growth Portfolio | |
| | | Six months ended
November 30, 2016 (unaudited) | | | Year ended
May 31, 2016 | |
| | |
Operations | | | | | | | | |
Net investment income | | $ | 265,442 | | | $ | 336,085 | |
Net realized gains on investments | | | 3,915,816 | | | | 5,117,947 | |
Net change in unrealized gains (losses) on investments | | | (3,207,757 | ) | | | (7,846,480 | ) |
| | | | |
Net increase (decrease) in net assets resulting from operations | | | 973,501 | | | | (2,392,448 | ) |
| | | | |
| | |
Capital share transactions | | | | | | | | |
Transactions in investors’ beneficial interests | | | | | | | | |
Contributions | | | 1,585,353 | | | | 7,089,759 | |
Withdrawals | | | (12,354,362 | ) | | | (12,268,696 | ) |
| | | | |
Net decrease in net assets resulting from capital share transactions | | | (10,769,009 | ) | | | (5,178,937 | ) |
| | | | |
Total decrease in net assets | | | (9,795,508 | ) | | | (7,571,385 | ) |
| | | | |
| | |
Net assets | | | | | | | | |
Beginning of period | | | 115,758,476 | | | | 123,329,861 | |
| | | | |
End of period | | $ | 105,962,968 | | | $ | 115,758,476 | |
| | | | |
The accompanying notes are an integral part of these financial statements.
| | | | |
| 112 | | Wells Fargo Equity Gateway Funds | | Statements of changes in net assets |
| | | | | | | | |
| | | Emerging Growth Portfolio | |
| | | Six months ended
November 30, 2016 (unaudited) | | | Year ended
May 31, 2016 | |
| | |
Operations | | | | | | | | |
Net investment income (loss) | | $ | 864,110 | | | $ | (3,962,052 | ) |
Net realized gains on investments | | | 77,141,486 | | | | 18,746,231 | |
Net change in unrealized gains (losses) on investments | | | 37,142,142 | | | | (175,228,106 | ) |
| | | | |
Net increase (decrease) in net assets resulting from operations | | | 115,147,738 | | | | (160,443,927 | ) |
| | | | |
| | |
Capital share transactions | | | | | | | | |
Transactions in investors’ beneficial interests | | | | | | | | |
Contributions | | | 39,242,680 | | | | 105,565,223 | |
Withdrawals | | | (247,146,805 | ) | | | (194,401,064 | ) |
| | | | |
Net decrease in net assets resulting from capital share transactions | | | (207,904,125 | ) | | | (88,835,841 | ) |
| | | | |
Total decrease in net assets | | | (92,756,387 | ) | | | (249,279,768 | ) |
| | | | |
| | |
Net assets | | | | | | | | |
Beginning of period | | | 898,487,665 | | | | 1,147,767,433 | |
| | | | |
End of period | | $ | 805,731,278 | | | $ | 898,487,665 | |
| | | | |
The accompanying notes are an integral part of these financial statements.
| | | | | | |
| Statements of changes in net assets | | Wells Fargo Equity Gateway Funds | | | 113 | |
| | | | | | | | |
| | | Index Portfolio | |
| | | Six months ended
November 30, 2016
(unaudited) | | | Year ended
May 31, 2016 | |
| | |
Operations | | | | | | | | |
Net investment income | | $ | 24,643,075 | | | $ | 51,941,420 | |
Net realized gains on investments | | | 119,108,101 | | | | 154,402,400 | |
Net change in unrealized gains (losses) on investments | | | (11,318,796 | ) | | | (179,622,273 | ) |
| | | | |
Net increase in net assets resulting from operations | | | 132,432,380 | | | | 26,721,547 | |
| | | | |
| | |
Capital share transactions | | | | | | | | |
Transactions in investors’ beneficial interests | | | | | | | | |
Contributions | | | 17,832,463 | | | | 66,728,942 | |
Withdrawals | | | (258,064,773 | ) | | | (523,281,965 | ) |
| | | | |
Net decrease in net assets resulting from capital share transactions | | | (240,232,310 | ) | | | (456,553,023 | ) |
| | | | |
Total decrease in net assets | | | (107,799,930 | ) | | | (429,831,476 | ) |
| | | | |
| | |
Net assets | | | | | | | | |
Beginning of period | | | 2,340,412,458 | | | | 2,770,243,934 | |
| | | | |
End of period | | $ | 2,232,612,528 | | | $ | 2,340,412,458 | |
| | | | |
The accompanying notes are an integral part of these financial statements.
| | | | |
| 114 | | Wells Fargo Equity Gateway Funds | | Statements of changes in net assets |
| | | | | | | | |
| | | International Growth Portfolio | |
| | | Six months ended
November 30, 2016
(unaudited) | | | Year ended
May 31, 2016 | |
| | |
Operations | | | | | | | | |
Net investment income | | $ | 254,117 | | | $ | 1,728,257 | |
Net realized gains (losses) on investments | | | 1,849,926 | | | | (1,635,815 | ) |
Net change in unrealized gains (losses) on investments | | | (11,938,708 | ) | | | (20,243,476 | ) |
| | | | |
Net decrease in net assets resulting from operations | | | (9,834,665 | ) | | | (20,151,034 | ) |
| | | | |
| | |
Capital share transactions | | | | | | | | |
Transactions in investors’ beneficial interests | | | | | | | | |
Contributions | | | 2,143,369 | | | | 15,674,750 | |
Withdrawals | | | (6,410,552 | ) | | | (5,551,430 | ) |
| | | | |
Net increase (decrease) in net assets resulting from capital share transactions | | | (4,267,183 | ) | | | 10,123,320 | |
| | | | |
Total decrease in net assets | | | (14,101,848 | ) | | | (10,027,714 | ) |
| | | | |
| | |
Net assets | | | | | | | | |
Beginning of period | | | 148,376,615 | | | | 158,404,329 | |
| | | | |
End of period | | $ | 134,274,767 | | | $ | 148,376,615 | |
| | | | |
The accompanying notes are an integral part of these financial statements.
| | | | | | |
| Statements of changes in net assets | | Wells Fargo Equity Gateway Funds | | | 115 | |
| | | | | | | | |
| | | International Value Portfolio | |
| | | Six months ended
November 30, 2016
(unaudited) | | | Year ended
May 31, 2016 | |
| | |
Operations | | | | | | | | |
Net investment income | | $ | 4,765,321 | | | $ | 12,349,092 | |
Net realized losses on investments | | | (8,465,722 | ) | | | (1,517,228 | ) |
Net change in unrealized gains (losses) on investments | | | 11,363,149 | | | | (73,474,825 | ) |
| | | | |
Net increase (decrease) in net assets resulting from operations | | | 7,662,748 | | | | (62,642,961 | ) |
| | | | |
| | |
Capital share transactions | | | | | | | | |
Transactions in investors’ beneficial interests | | | | | | | | |
Contributions | | | 62,062,545 | | | | 46,792,442 | |
Withdrawals | | | (36,915,264 | ) | | | (10,044,159 | ) |
| | | | |
Net increase in net assets resulting from capital share transactions | | | 25,147,281 | | | | 36,748,283 | |
| | | | |
Total increase (decrease) in net assets | | | 32,810,029 | | | | (25,894,678 | ) |
| | | | |
| | |
Net assets | | | | | | | | |
Beginning of period | | | 508,318,970 | | | | 534,213,648 | |
| | | | |
End of period | | $ | 541,128,999 | | | $ | 508,318,970 | |
| | | | |
The accompanying notes are an integral part of these financial statements.
| | | | |
| 116 | | Wells Fargo Equity Gateway Funds | | Statements of changes in net assets |
| | | | | | | | |
| | | Large Company Value Portfolio | |
| | | Six months ended
November 30, 2016
(unaudited) | | | Year ended
May 31, 2016 | |
| | |
Operations | | | | | | | | |
Net investment income | | $ | 539,250 | | | $ | 1,196,671 | |
Net realized gains (losses) on investments | | | 2,024,711 | | | | (1,089,821 | ) |
Net change in unrealized gains (losses) on investments | | | 2,642,310 | | | | (3,378,107 | ) |
| | | | |
Net increase (decrease) in net assets resulting from operations | | | 5,206,271 | | | | (3,271,257 | ) |
| | | | |
| | |
Capital share transactions | | | | | | | | |
Transactions in investors’ beneficial interests | | | | | | | | |
Contributions | | | 474,857 | | | | 6,867,155 | |
Withdrawals | | | (9,985,455 | ) | | | (6,977,356 | ) |
| | | | |
Net decrease in net assets resulting from capital share transactions | | | (9,510,598 | ) | | | (110,201 | ) |
| | | | |
Total decrease in net assets | | | (4,304,327 | ) | | | (3,381,458 | ) |
| | | | |
| | |
Net assets | | | | | | | | |
Beginning of period | | | 79,114,830 | | | | 82,496,288 | |
| | | | |
End of period | | $ | 74,810,503 | | | $ | 79,114,830 | |
| | | | |
The accompanying notes are an integral part of these financial statements.
| | | | | | |
| Statements of changes in net assets | | Wells Fargo Equity Gateway Funds | | | 117 | |
| | | | | | | | |
| | | Small Company Growth Portfolio | |
| | | Six months ended
November 30, 2016
(unaudited) | | | Year ended
May 31, 2016 | |
| | |
Operations | | | | | | | | |
Net investment loss | | $ | (546,938 | ) | | $ | (288,808 | ) |
Net realized gains (losses) on investments | | | 7,468,252 | | | | (95,998,247 | ) |
Net change in unrealized gains (losses) on investments | | | 136,432,856 | | | | (55,183,521 | ) |
| | | | |
Net increase (decrease) in net assets resulting from operations | | | 143,354,170 | | | | (151,470,576 | ) |
| | | | |
| | |
Capital share transactions | | | | | | | | |
Transactions in investors’ beneficial interests | | | | | | | | |
Contributions | | | 287,537,092 | | | | 708,902,550 | |
Withdrawals | | | (112,125,224 | ) | | | (112,220,954 | ) |
| | | | |
Net increase in net assets resulting from capital share transactions | | | 175,411,868 | | | | 596,681,596 | |
| | | | |
Total increase in net assets | | | 318,766,038 | | | | 445,211,020 | |
| | | | |
| | |
Net assets | | | | | | | | |
Beginning of period | | | 1,196,596,440 | | | | 751,385,420 | |
| | | | |
End of period | | $ | 1,515,362,478 | | | $ | 1,196,596,440 | |
| | | | |
The accompanying notes are an integral part of these financial statements.
| | | | |
| 118 | | Wells Fargo Equity Gateway Funds | | Statements of changes in net assets |
| | | | | | | | |
| | | Small Company Value Portfolio | |
| | | Six months ended
November 30, 2016 (unaudited) | | | Year ended
May 31, 2016 | |
| | |
Operations | | | | | | | | |
Net investment income | | $ | 894,543 | | | $ | 1,286,924 | |
Net realized gains on investments | | | 14,766,624 | | | | 12,552,384 | |
Net change in unrealized gains (losses) on investments | | | 16,403,463 | | | | (24,625,962 | ) |
| | | | |
Net increase (decrease) in net assets resulting from operations | | | 32,064,630 | | | | (10,786,654 | ) |
| | | | |
| | |
Capital share transactions | | | | | | | | |
Transactions in investors’ beneficial interests | | | | | | | | |
Contributions | | | 14,301,944 | | | | 36,132,062 | |
Withdrawals | | | (38,988,536 | ) | | | (23,471,861 | ) |
| | | | |
Net increase (decrease) in net assets resulting from capital share transactions | | | (24,686,592 | ) | | | 12,660,201 | |
| | | | |
Total increase in net assets | | | 7,378,038 | | | | 1,873,547 | |
| | | | |
| | |
Net assets | | | | | | | | |
Beginning of period | | | 217,569,770 | | | | 215,696,223 | |
| | | | |
End of period | | $ | 224,947,808 | | | $ | 217,569,770 | |
| | | | |
The accompanying notes are an integral part of these financial statements.
| | | | | | |
| Financial highlights | | Wells Fargo Equity Gateway Funds | | | 119 | |
| | | | | | | | | | | | | | | | | | | | |
| | | Ratio to average net assets (annualized) | | | Total
return1 | | | Portfolio turnover
rate | |
| | | Net investment
income (loss) | | | Gross
expenses | | | Net
expenses | | | |
| | | | | |
C&B Large Cap Value Portfolio | | | | | | | | | | | | | | | | | | | | |
Six months ended November 30, 2016 (unaudited) | | | 1.12 | % | | | 0.68 | % | | | 0.68 | % | | | 7.80 | % | | | 32 | % |
Year ended May 31, 2016 | | | 1.33 | % | | | 0.68 | % | | | 0.68 | % | | | 0.35 | % | | | 29 | % |
Year ended May 31, 2015 | | | 1.20 | % | | | 0.68 | % | | | 0.68 | % | | | 10.29 | % | | | 35 | % |
Year ended May 31, 2014 | | | 1.35 | % | | | 0.68 | % | | | 0.68 | % | | | 17.80 | % | | | 22 | % |
Year ended May 31, 2013 | | | 1.73 | % | | | 0.68 | % | | | 0.68 | % | | | 29.30 | % | | | 18 | % |
Year ended May 31, 2012 | | | 1.81 | % | | | 0.68 | % | | | 0.68 | % | | | (4.61 | )% | | | 21 | % |
| | | | | |
Diversified Large Cap Growth Portfolio | | | | | | | | | | | | | | | | | | | | |
Six months ended November 30, 2016 (unaudited) | | | 0.47 | % | | | 0.77 | % | | | 0.62 | % | | | 0.77 | % | | | 36 | % |
Year ended May 31, 2016 | | | 0.29 | % | | | 0.74 | % | | | 0.62 | % | | | (2.28 | )% | | | 59 | % |
Year ended May 31, 2015 | | | 0.28 | % | | | 0.72 | % | | | 0.62 | % | | | 13.11 | % | | | 46 | % |
Year ended May 31, 2014 | | | 0.15 | % | | | 0.72 | % | | | 0.62 | % | | | 21.70 | % | | | 54 | % |
Year ended May 31, 2013 | | | 0.51 | % | | | 0.71 | % | | | 0.62 | % | | | 20.30 | % | | | 56 | % |
Year ended May 31, 2012 | | | 0.24 | % | | | 0.71 | % | | | 0.62 | % | | | 1.26 | % | | | 79 | % |
| | | | | |
Emerging Growth Portfolio | | | | | | | | | | | | | | | | | | | | |
Six months ended November 30, 2016 (unaudited) | | | 0.20 | % | | | 0.81 | % | | | 0.81 | % | | | 14.08 | % | | | 50 | % |
Year ended May 31, 2016 | | | (0.40 | )% | | | 0.80 | % | | | 0.80 | % | | | (14.47 | )% | | | 66 | % |
Year ended May 31, 2015 | | | (0.63 | )% | | | 0.80 | % | | | 0.80 | % | | | 24.02 | % | | | 56 | % |
Year ended May 31, 2014 | | | (0.62 | )% | | | 0.80 | % | | | 0.80 | % | | | 11.92 | % | | | 63 | % |
Year ended May 31, 2013 | | | (0.47 | )% | | | 0.80 | % | | | 0.80 | % | | | 20.53 | % | | | 65 | % |
Year ended May 31, 2012 | | | (0.57 | )% | | | 0.80 | % | | | 0.80 | % | | | (4.83 | )% | | | 75 | % |
| | | | | |
Index Portfolio | | | | | | | | | | | | | | | | | | | | |
Six months ended November 30, 2016 (unaudited) | | | 2.15 | % | | | 0.10 | % | | | 0.10 | % | | | 5.95 | % | | | 5 | % |
Year ended May 31, 2016 | | | 2.12 | % | | | 0.11 | % | | | 0.10 | % | | | 1.62 | % | | | 4 | % |
Year ended May 31, 2015 | | | 1.96 | % | | | 0.11 | % | | | 0.11 | % | | | 11.69 | % | | | 4 | % |
Year ended May 31, 2014 | | | 1.99 | % | | | 0.10 | % | | | 0.10 | % | | | 20.33 | % | | | 5 | % |
Year ended May 31, 2013 | | | 2.20 | % | | | 0.09 | % | | | 0.09 | % | | | 27.22 | % | | | 4 | % |
Year ended May 31, 2012 | | | 2.09 | % | | | 0.10 | % | | | 0.10 | % | | | (0.52 | )% | | | 9 | % |
| | | | | |
International Growth Portfolio | | | | | | | | | | | | | | | | | | | | |
Six months ended November 30, 2016 (unaudited) | | | 0.35 | % | | | 0.99 | % | | | 0.99 | % | | | (6.84 | )% | | | 59 | % |
Year ended May 31, 2016 | | | 1.16 | % | | | 0.99 | % | | | 0.99 | % | | | (12.40 | )% | | | 62 | % |
Year ended May 31, 2015 | | | 0.76 | % | | | 1.00 | % | | | 1.00 | % | | | 5.13 | % | | | 51 | % |
Year ended May 31, 2014 | | | 1.13 | % | | | 1.00 | % | | | 1.00 | % | | | 16.45 | % | | | 46 | % |
Year ended May 31, 2013 | | | 1.63 | % | | | 1.04 | % | | | 1.04 | % | | | 30.34 | % | | | 46 | % |
Year ended May 31, 2012 | | | 2.04 | % | | | 0.97 | % | | | 0.90 | % | | | (9.44 | )% | | | 69 | % |
| | | | | |
International Value Portfolio | | | | | | | | | | | | | | | | | | | | |
Six months ended November 30, 2016 (unaudited) | | | 1.92 | % | | | 0.90 | % | | | 0.90 | % | | | 1.41 | % | | | 15 | % |
Year ended May 31, 2016 | | | 2.50 | % | | | 0.91 | % | | | 0.91 | % | | | (11.85 | )% | | | 14 | % |
Year ended May 31, 2015 | | | 2.45 | % | | | 0.91 | % | | | 0.91 | % | | | (1.04 | )% | | | 18 | % |
Year ended May 31, 2014 | | | 3.09 | % | | | 0.91 | % | | | 0.91 | % | | | 18.22 | % | | | 11 | % |
Year ended May 31, 2013 | | | 3.04 | % | | | 0.91 | % | | | 0.91 | % | | | 29.45 | % | | | 16 | % |
Year ended May 31, 2012 | | | 3.44 | % | | | 0.91 | % | | | 0.85 | % | | | (21.07 | )% | | | 9 | % |
| | | | | |
Large Company Value Portfolio | | | | | | | | | | | | | | | | | | | | |
Six months ended November 30, 2016 (unaudited) | | | 1.38 | % | | | 0.77 | % | | | 0.74 | % | | | 7.09 | % | | | 33 | % |
Year ended May 31, 2016 | | | 1.54 | % | | | 0.76 | % | | | 0.74 | % | | | (3.92 | )% | | | 50 | % |
Year ended May 31, 2015 | | | 1.09 | % | | | 0.74 | % | | | 0.74 | % | | | 7.90 | % | | | 72 | % |
Year ended May 31, 2014 | | | 0.99 | % | | | 0.73 | % | | | 0.73 | % | | | 20.26 | % | | | 62 | % |
Year ended May 31, 2013 | | | 1.49 | % | | | 0.78 | % | | | 0.74 | % | | | 28.91 | % | | | 95 | % |
Year ended May 31, 2012 | | | 1.67 | % | | | 0.77 | % | | | 0.74 | % | | | (6.06 | )% | | | 104 | % |
Please see footnote on page 120.
The accompanying notes are an integral part of these financial statements.
| | | | |
| 120 | | Wells Fargo Equity Gateway Funds | | Financial highlights |
| | | | | | | | | | | | | | | | | | | | |
| | | Ratio to average net assets (annualized) | | | Total
return1 | | | Portfolio turnover
rate | |
| | | Net investment
income (loss) | | | Gross
expenses | | | Net
expenses | | | |
| | | | | |
Small Company Growth Portfolio | | | | | | | | | | | | | | | | | | | | |
Six months ended November 30, 2016 (unaudited) | | | (0.08 | )% | | | 0.79 | % | | | 0.79 | % | | | 11.25 | % | | | 35 | % |
Year ended May 31, 2016 | | | (0.03 | )% | | | 0.80 | % | | | 0.80 | % | | | (13.86 | )% | | | 49 | % |
Year ended May 31, 2015 | | | (0.32 | )% | | | 0.82 | % | | | 0.82 | % | | | 18.07 | % | | | 58 | % |
Year ended May 31, 2014 | | | (0.37 | )% | | | 0.83 | % | | | 0.83 | % | | | 23.47 | % | | | 77 | % |
Year ended May 31, 2013 | | | (0.02 | )% | | | 0.86 | % | | | 0.86 | % | | | 31.39 | % | | | 109 | % |
Year ended May 31, 2012 | | | (0.12 | )% | | | 0.83 | % | | | 0.83 | % | | | (10.75 | )% | | | 107 | % |
| | | | | |
Small Company Value Portfolio | | | | | | | | | | | | | | | | | | | | |
Six months ended November 30, 2016 (unaudited) | | | 0.82 | % | | | 0.84 | % | | | 0.84 | % | | | 15.63 | % | | | 55 | % |
Year ended May 31, 2016 | | | 0.62 | % | | | 0.85 | % | | | 0.85 | % | | | (4.96 | )% | | | 72 | % |
Year ended May 31, 2015 | | | 0.89 | % | | | 0.84 | % | | | 0.84 | % | | | 7.29 | % | | | 54 | % |
Year ended May 31, 2014 | | | 0.89 | % | | | 0.85 | % | | | 0.85 | % | | | 18.09 | % | | | 47 | % |
Year ended May 31, 2013 | | | 0.58 | % | | | 0.85 | % | | | 0.85 | % | | | 30.76 | % | | | 57 | % |
Year ended May 31, 2012 | | | 0.69 | % | | | 0.84 | % | | | 0.84 | % | | | (7.17 | )% | | | 60 | % |
| 1 | Returns for periods of less than one year are not annualized. |
The accompanying notes are an integral part of these financial statements.
| | | | | | |
| Notes to financial statements (unaudited) | | Wells Fargo Equity Gateway Funds | | | 121 | |
1. ORGANIZATION
Wells Fargo Master Trust (the “Trust”), a Delaware statutory trust organized on March 10, 1999, is an open-end management investment company registered under the Investment Company Act of 1940, as amended (the “1940 Act”). As an investment company, the Trust follows the accounting and reporting guidance in Financial Accounting Standards Board (“FASB”) Accounting Standards Codification Topic 946, Financial Services – Investment Companies. These financial statements report on the following portfolios: Wells Fargo C&B Large Cap Value Portfolio (“C&B Large Cap Value Portfolio”), Wells Fargo Diversified Large Cap Growth Portfolio (“Diversified Large Cap Growth Portfolio”), Wells Fargo Emerging Growth Portfolio (“Emerging Growth Portfolio”), Wells Fargo Index Portfolio (“Index Portfolio”), Wells Fargo International Growth Portfolio (“International Growth Portfolio”), Wells Fargo International Value Portfolio (“International Value Portfolio”), Wells Fargo Large Company Value Portfolio (“Large Company Value Portfolio”), Wells Fargo Small Company Growth Portfolio (“Small Company Growth Portfolio”), and Wells Fargo Small Company Value Portfolio (“Small Company Value Portfolio”). Each Portfolio is a diversified series of the Trust.
The Portfolios, which are master portfolios in a master/feeder structure, offer their shares to multiple feeder funds and other affiliated master portfolios rather than directly to the public.
2. SIGNIFICANT ACCOUNTING POLICIES
The following significant accounting policies, which are consistently followed in the preparation of the financial statements of each Portfolio, are in conformity with U.S. generally accepted accounting principles which require management to make estimates and assumptions that affect the reported amounts of assets and liabilities, disclosure of contingent assets and liabilities at the date of the financial statements, and the reported amounts of revenues and expenses during the reporting period. Actual results could differ from those estimates.
Securities valuation
All investments are valued each business day as of the close of regular trading on the New York Stock Exchange (generally 4 p.m. Eastern Time), although the Portfolios may deviate from this calculation time under unusual or unexpected circumstances.
Equity securities and futures that are listed on a foreign or domestic exchange or market are valued at the official closing price or, if none, the last sales price. If no sale occurs on the principal exchange or market that day, the prior day’s price will be deemed “stale” and a fair value price will be determined in accordance with the Portfolio’s Valuation Procedures.
The values of securities denominated in foreign currencies are translated into U.S. dollars at rates provided by an independent foreign currency pricing source at a time each business day specified by the Management Valuation Team of Wells Fargo Funds Management, LLC (“Funds Management”).
Many securities markets and exchanges outside the U.S. close prior to the close of the New York Stock Exchange and therefore may not fully reflect trading or events that occur after the close of the principal exchange in which the foreign securities are traded, but before the close of the New York Stock Exchange. If such trading or events are expected to materially affect the value of such securities, then fair value pricing procedures approved by the Board of Trustees of the Portfolios are applied. These procedures take into account multiple factors including movements in U.S. securities markets after foreign exchanges close. Foreign securities that are fair valued under these procedures are categorized as Level 2 and the application of these procedures may result in transfers between Level 1 and Level 2. Depending on market activity, such fair valuations may be frequent. Such fair value pricing may result in net asset values that are higher or lower than net asset values based on the last reported sales price or latest quoted bid price. On November 30, 2016, such fair value pricing was not used in pricing foreign securities.
Debt securities are valued at the evaluated bid price provided by an independent pricing service or, if a reliable price is not available, the quoted bid price from an independent broker-dealer.
Investments in registered open-end investment companies are valued at net asset value. Interests in non-registered investment vehicles that are redeemable at net asset value are fair valued normally at net asset value.
Investments which are not valued using any of the methods discussed above are valued at their fair value, as determined in good faith by the Board of Trustees. The Board of Trustees has established a Valuation Committee comprised of the Trustees and has delegated to it the authority to take any actions regarding the valuation of portfolio securities that the Valuation Committee deems necessary or appropriate, including determining the fair value of portfolio securities, unless the determination has been delegated to the Management Valuation Team. The Board of Trustees retains the authority to make or ratify any valuation decisions or approve any changes to the Valuation Procedures as it deems appropriate. On a quarterly basis, the Board of Trustees receives reports on any valuation actions taken by the Valuation Committee or the Management Valuation Team which may include items for ratification.
| | | | |
| 122 | | Wells Fargo Equity Gateway Funds | | Notes to financial statements (unaudited) |
Valuations of fair valued securities are compared to the next actual sales price when available, or other appropriate market values, to assess the continued appropriateness of the fair valuation methodologies used. These securities are fair valued on a day-to-day basis, taking into consideration changes to appropriate market information and any significant changes to the inputs considered in the valuation process until there is a readily available price provided on an exchange or by an independent pricing service. Valuations received from an independent pricing service or independent broker-dealer quotes are periodically validated by comparisons to most recent trades and valuations provided by other independent pricing services in addition to the review of prices by the adviser and/or subadviser. Unobservable inputs used in determining fair valuations are identified based on the type of security, taking into consideration factors utilized by market participants in valuing the investment, knowledge about the issuer and the current market environment.
Foreign currency translation
The accounting records of the Portfolios are maintained in U.S. dollars. The value of other assets and liabilities denominated in foreign currencies are translated into U.S. dollars at rates provided by an independent foreign currency pricing source at a time each business day specified by the Management Valuation Team. Purchases and sales of securities, and income and expenses are converted at the rate of exchange on the respective dates of such transactions. Net realized foreign exchange gains or losses arise from sales of foreign currencies, currency gains or losses realized between the trade and settlement dates on securities transactions, and the difference between the amounts of dividends, interest and foreign withholding taxes recorded and the U.S. dollar equivalent of the amounts actually paid or received. Net unrealized foreign exchange gains and losses arise from changes in the fair value of assets and liabilities other than investments in securities resulting from changes in exchange rates. The changes in net assets arising from changes in exchange rates and the changes in net assets resulting from changes in market prices of securities are not separately presented. Such changes are included in net realized and unrealized gains or losses from investments.
Security loans
The Portfolios may lend its securities from time to time in order to earn additional income in the form of fees or interest on securities received as collateral or the investment of any cash received as collateral. The Portfolios continues to receive interest or dividends on the securities loaned. The Portfolios receives collateral in the form of cash or securities with a value at least equal to the value of the securities on loan. The value of the loaned securities is determined at the close of each business day and any additional required collateral is delivered to the Portfolios on the next business day. In a securities lending transaction, the net asset value of the Portfolio will be affected by an increase or decrease in the value of the securities loaned and by an increase or decrease in the value of the instrument in which collateral is invested. The amount of securities lending activity undertaken by the Portfolios fluctuates from time to time. In the event of default or bankruptcy by the borrower, the Portfolios may be prevented from recovering the loaned securities or gaining access to the collateral or may experience delays or costs in doing so. In addition, the investment of any cash collateral received may lose all or part of its value. The Portfolios has the right under the lending agreement to recover the securities from the borrower on demand.
The Portfolios lend their securities through an unaffiliated securities lending agent. Cash collateral received in connection with its securities lending transactions is invested in Securities Lending Cash Investments, LLC (the “Securities Lending Fund”). The Securities Lending Fund is exempt from registration under Section 3(c)(7) of the 1940 Act and is managed by Funds Management and is subadvised by Wells Capital Management Incorporated (“WellsCap”), an affiliate of Funds Management and an indirect wholly owned subsidiary of Wells Fargo & Company (“Wells Fargo”). Funds Management receives an advisory fee starting at 0.05% and declining to 0.01% as the average daily net assets of the Securities Lending Fund increase. All of the fees received by Funds Management are paid to WellsCap for its services as subadviser. The Securities Lending Fund seeks to provide a positive return compared to the daily Fed Funds Open Rate by investing in high-quality, U.S. dollar-denominated short-term money market instruments. Securities Lending Fund investments are valued at the evaluated bid price provided by an independent pricing service. Income earned from investment in the Securities Lending Fund is included in securities lending income on the Statements of Operations.
Futures contracts
The Portfolios are subject to interest rate risk or equity price risk in the normal course of pursuing its investment objectives. A Portfolio may buy and sell futures contracts in order to gain exposure to, or protect against, changes in security values and interest rates. The primary risks associated with the use of futures contracts are the imperfect correlation between changes in market values of securities held by the Portfolio and the prices of futures contracts, and the possibility of an illiquid market.
The aggregate principal amounts of the contracts are not recorded in the financial statements. Fluctuations in the value of the contracts are recorded in the Statements of Assets and Liabilities as an asset or liability and in the Statements of
| | | | | | |
| Notes to financial statements (unaudited) | | Wells Fargo Equity Gateway Funds | | | 123 | |
Operations as unrealized gains or losses until the contracts are closed, at which point they are recorded as net realized gains or losses on futures contracts. With futures contracts, there is minimal counterparty risk to the Portfolio since futures are exchange traded and the exchange’s clearinghouse, as counterparty to all exchange traded futures, guarantees the futures against default.
Security transactions and income recognition
Securities transactions are recorded on a trade date basis. Realized gains or losses are recorded on the basis of identified cost.
Dividend income is recognized on the ex-dividend date, except for certain dividends from foreign securities which are recorded as soon as the custodian verifies the ex-dividend date.
Interest income is accrued daily and bond discounts are accreted and premiums are amortized daily based on the effective interest method. To the extent debt obligations are placed on non-accrual status, any related interest income may be reduced by writing off interest receivables when the collection of all or a portion of interest has become doubtful based on consistently applied procedures. If the issuer subsequently resumes interest payments or when the collectability of interest is reasonably assured, the debt obligation is removed from non-accrual status.
Income from foreign securities is recorded net of foreign taxes withheld where recovery of such taxes is not assured.
Federal and other taxes
Each Portfolio is treated as a separate entity for federal income tax purposes. The Portfolios are not required to pay federal income taxes on their net investment income and net capital gain as they are treated as partnerships for federal income tax purposes. All interest, dividends, gains and losses of a Portfolio are deemed to have been “passed through” to the interest holders in proportion to their holdings of the Portfolio regardless of whether such interest, dividends and gains have been distributed by the Portfolio.
Each Portfolio’s income tax returns and all financial records supporting those returns for the prior three fiscal years are subject to examination by the federal revenue authority. Management has analyzed each Portfolio’s tax positions taken on federal, state, and foreign tax returns for all open tax years and does not believe that there are any uncertain tax positions that require recognition of a tax liability.
3. FAIR VALUATION MEASUREMENTS
Fair value measurements of investments are determined within a framework that has established a fair value hierarchy based upon the various data inputs utilized in determining the value of each Portfolio’s investments. The three-level hierarchy gives the highest priority to unadjusted quoted prices in active markets for identical assets or liabilities (Level 1) and the lowest priority to significant unobservable inputs (Level 3). Each Portfolio’s investments are classified within the fair value hierarchy based on the lowest level of input that is significant to the fair value measurement. The inputs are summarized into three broad levels as follows:
| ∎ | | Level 1 – quoted prices in active markets for identical securities |
| ∎ | | Level 2 – other significant observable inputs (including quoted prices for similar securities, interest rates, prepayment speeds, credit risk, use of amortized cost, etc.) |
| ∎ | | Level 3 – significant unobservable inputs (including the Portfolio’s own assumptions in determining the fair value of investments) |
The inputs or methodologies used for valuing investments in securities are not necessarily an indication of the risk associated with investing in those securities.
| | | | |
| 124 | | Wells Fargo Equity Gateway Funds | | Notes to financial statements (unaudited) |
The following is a summary of the inputs used in valuing each Portfolio’s assets and liabilities as of November 30, 2016:
| | | | | | | | | | | | | | | | |
| C&B Large Cap Value Portfolio | | Quoted prices
(Level 1) | | | Other significant
observable inputs
(Level 2) | | | Significant
unobservable inputs
(Level 3) | | | Total | |
Assets | | | | | | | | | | | | | | | | |
Investments in: | | | | | | | | | | | | | | | | |
| | | | |
Common stocks | | | | | | | | | | | | | | | | |
Consumer discretionary | | $ | 45,457,959 | | | $ | 0 | | | $ | 0 | | | $ | 45,457,959 | |
Consumer staples | | | 19,029,992 | | | | 0 | | | | 0 | | | | 19,029,992 | |
Energy | | | 19,213,225 | | | | 0 | | | | 0 | | | | 19,213,225 | |
Financials | | | 87,174,769 | | | | 0 | | | | 0 | | | | 87,174,769 | |
Health care | | | 48,543,758 | | | | 0 | | | | 0 | | | | 48,543,758 | |
Industrials | | | 58,457,819 | | | | 0 | | | | 0 | | | | 58,457,819 | |
Information technology | | | 30,540,150 | | | | 0 | | | | 0 | | | | 30,540,150 | |
Materials | | | 19,459,231 | | | | 0 | | | | 0 | | | | 19,459,231 | |
Real estate | | | 5,505,981 | | | | 0 | | | | 0 | | | | 5,505,981 | |
| | | | |
Short-term investments | | | | | | | | | | | | | | | | |
Investment companies | | | 11,232,148 | | | | 0 | | | | 0 | | | | 11,232,148 | |
| | | | |
Investments measured at net asset value* | | | | | | | | | | | | | | | 6,884,901 | |
Total assets | | $ | 344,615,032 | | | $ | 0 | | | $ | 0 | | | $ | 351,499,933 | |
| * | Investments that are measured at fair value using the net asset value per share (or its equivalent) as a practical expedient have not been categorized in the fair value hierarchy. The fair value amount presented in the table is intended to permit reconciliation of the fair value hierarchy to the amounts presented in the Statements of Assets and Liabilities. The Portfolio’s investment in Securities Lending Cash Investment, LLC valued at $6,884,901 does not have a redemption period notice, can be redeemed daily and does not have any unfunded commitments. |
| | | | | | | | | | | | | | | | |
| Diversified Large Cap Growth Portfolio | | Quoted prices
(Level 1) | | | Other significant
observable inputs
(Level 2) | | | Significant
unobservable inputs
(Level 3) | | | Total | |
Assets | | | | | | | | | | | | | | | | |
Investments in: | | | | | | | | | | | | | | | | |
| | | | |
Common stocks | | | | | | | | | | | | | | | | |
Consumer discretionary | | $ | 21,402,883 | | | $ | 0 | | | $ | 0 | | | $ | 21,402,883 | |
Consumer staples | | | 5,572,591 | | | | 0 | | | | 0 | | | | 5,572,591 | |
Energy | | | 1,782,242 | | | | 0 | | | | 0 | | | | 1,782,242 | |
Financials | | | 2,296,381 | | | | 0 | | | | 0 | | | | 2,296,381 | |
Health care | | | 13,604,408 | | | | 0 | | | | 0 | | | | 13,604,408 | |
Industrials | | | 10,107,453 | | | | 0 | | | | 0 | | | | 10,107,453 | |
Information technology | | | 46,002,248 | | | | 0 | | | | 0 | | | | 46,002,248 | |
Materials | | | 3,323,283 | | | | 0 | | | | 0 | | | | 3,323,283 | |
Real estate | | | 314,992 | | | | 0 | | | | 0 | | | | 314,992 | |
| | | | |
Short-term investments | | | | | | | | | | | | | | | | |
Investment companies | | | 1,480,422 | | | | 0 | | | | 0 | | | | 1,480,422 | |
| | | | |
Investments measured at net asset value* | | | | | | | | | | | | | | | 1,030,236 | |
Total assets | | $ | 105,886,903 | | | $ | 0 | | | $ | 0 | | | $ | 106,917,139 | |
| * | Investments that are measured at fair value using the net asset value per share (or its equivalent) as a practical expedient have not been categorized in the fair value hierarchy. The fair value amount presented in the table is intended to permit reconciliation of the fair value hierarchy to the amounts presented in the Statements of Assets and Liabilities. The Portfolio’s investment in Securities Lending Cash Investment, LLC valued at $1,030,236 does not have a redemption period notice, can be redeemed daily and does not have any unfunded commitments. |
| | | | | | |
| Notes to financial statements (unaudited) | | Wells Fargo Equity Gateway Funds | | | 125 | |
| | | | | | | | | | | | | | | | |
| Emerging Growth Portfolio | | Quoted prices
(Level 1) | | | Other significant
observable inputs
(Level 2) | | | Significant
unobservable inputs
(Level 3) | | | Total | |
Assets | | | | | | | | | | | | | | | | |
Investments in: | | | | | | | | | | | | | | | | |
| | | | |
Common stocks | | | | | | | | | | | | | | | | |
Consumer discretionary | | $ | 97,844,644 | | | $ | 0 | | | $ | 0 | | | $ | 97,844,644 | |
Energy | | | 29,132,524 | | | | 0 | | | | 0 | | | | 29,132,524 | |
Financials | | | 50,342,994 | | | | 0 | | | | 0 | | | | 50,342,994 | |
Health care | | | 231,364,222 | | | | 0 | | | | 0 | | | | 231,364,222 | |
Industrials | | | 129,383,334 | | | | 0 | | | | 0 | | | | 129,383,334 | |
Information technology | | | 246,192,667 | | | | 0 | | | | 0 | | | | 246,192,667 | |
| | | | |
Short-term investments | | | | | | | | | | | | | | | | |
Investment companies | | | 19,236,622 | | | | 0 | | | | 0 | | | | 19,236,622 | |
| | | | |
Investments measured at net asset value* | | | | | | | | | | | | | | | 85,995,907 | |
Total assets | | $ | 803,497,007 | | | $ | 0 | | | $ | 0 | | | $ | 889,492,914 | |
| * | Investments that are measured at fair value using the net asset value per share (or its equivalent) as a practical expedient have not been categorized in the fair value hierarchy. The fair value amount presented in the table is intended to permit reconciliation of the fair value hierarchy to the amounts presented in the Statements of Assets and Liabilities. The Portfolio’s investment in Securities Lending Cash Investment, LLC valued at $85,995,907 does not have a redemption period notice, can be redeemed daily and does not have any unfunded commitments. |
| | | | | | | | | | | | | | | | |
| Index Portfolio | | Quoted prices
(Level 1) | | | Other significant
observable inputs
(Level 2) | | | Significant
unobservable inputs
(Level 3) | | | Total | |
Assets | | | | | | | | | | | | | | | | |
Investments in: | | | | | | | | | | | | | | | | |
| | | | |
Common stocks | | | | | | | | | | | | | | | | |
Consumer discretionary | | $ | 265,600,771 | | | $ | 0 | | | $ | 0 | | | $ | 265,600,771 | |
Consumer staples | | | 199,664,800 | | | | 0 | | | | 0 | | | | 199,664,800 | |
Energy | | | 162,080,388 | | | | 0 | | | | 0 | | | | 162,080,388 | |
Financials | | | 315,695,072 | | | | 0 | | | | 0 | | | | 315,695,072 | |
Health care | | | 296,145,311 | | | | 0 | | | | 0 | | | | 296,145,311 | |
Industrials | | | 225,442,553 | | | | 0 | | | | 0 | | | | 225,442,553 | |
Information technology | | | 448,558,109 | | | | 0 | | | | 0 | | | | 448,558,109 | |
Materials | | | 62,655,100 | | | | 0 | | | | 0 | | | | 62,655,100 | |
Real estate | | | 59,619,341 | | | | 0 | | | | 0 | | | | 59,619,341 | |
Telecommuniciation services | | | 53,850,175 | | | | 0 | | | | 0 | | | | 53,850,175 | |
Utilities | | | 66,261,626 | | | | 0 | | | | 0 | | | | 66,261,626 | |
| | | | |
Short-term investments | | | | | | | | | | | | | | | | |
U.S. Treasury securities | | | 1,802,103 | | | | 0 | | | | 0 | | | | 1,802,103 | |
| | | | |
Investments measured at net asset value* | | | | | | | | | | | | | | | 12,149,306 | |
| | | 2,157,375,349 | | | | 0 | | | | 0 | | | | 2,169,524,655 | |
Futures contracts | | | 11,930 | | | | 0 | | | | 0 | | | | 11,930 | |
Total assets | | $ | 2,157,387,279 | | | $ | 0 | | | $ | 0 | | | $ | 2,169,536,585 | |
Liabilities | | | | | | | | | | | | | | | | |
Futures contracts | | $ | 10,250 | | | $ | 0 | | | $ | 0 | | | $ | 10,250 | |
Total liabilities | | $ | 10,250 | | | $ | 0 | | | $ | 0 | | | $ | 10,250 | |
| * | Investments that are measured at fair value using the net asset value per share (or its equivalent) as a practical expedient have not been categorized in the fair value hierarchy. The fair value amount presented in the table is intended to permit reconciliation of the fair value hierarchy to the amounts presented in the Statements of Assets and Liabilities. The Portfolio’s investment in Securities Lending Cash Investment, LLC valued at $12,149,306 does not have a redemption period notice, can be redeemed daily and does not have any unfunded commitments. |
| | | | |
| 126 | | Wells Fargo Equity Gateway Funds | | Notes to financial statements (unaudited) |
| | | | | | | | | | | | | | | | |
| International Growth Portfolio | | Quoted prices
(Level 1) | | | Other significant
observable inputs
(Level 2) | | | Significant
unobservable inputs
(Level 3) | | | Total | |
Assets | | | | | | | | | | | | | | | | |
Investments in: | | | | | | | | | | | | | | | | |
| | | | |
Common stocks | | | | | | | | | | | | | | | | |
Australia | | $ | 1,968,371 | | | $ | 0 | | | $ | 0 | | | $ | 1,968,371 | |
Belgium | | | 1,305,628 | | | | 0 | | | | 0 | | | | 1,305,628 | |
Canada | | | 5,675,182 | | | | 0 | | | | 0 | | | | 5,675,182 | |
China | | | 7,684,608 | | | | 0 | | | | 0 | | | | 7,684,608 | |
Denmark | | | 602,226 | | | | 0 | | | | 0 | | | | 602,226 | |
France | | | 5,531,327 | | | | 0 | | | | 0 | | | | 5,531,327 | |
Germany | | | 24,787,331 | | | | 0 | | | | 0 | | | | 24,787,331 | |
Hong Kong | | | 4,591,878 | | | | 0 | | | | 0 | | | | 4,591,878 | |
Indonesia | | | 311,256 | | | | 0 | | | | 0 | | | | 311,256 | |
Ireland | | | 7,100,910 | | | | 0 | | | | 0 | | | | 7,100,910 | |
Italy | | | 2,625,919 | | | | 0 | | | | 0 | | | | 2,625,919 | |
Japan | | | 16,746,137 | | | | 0 | | | | 0 | | | | 16,746,137 | |
Luxembourg | | | 412,030 | | | | 0 | | | | 0 | | | | 412,030 | |
Netherlands | | | 6,438,994 | | | | 0 | | | | 0 | | | | 6,438,994 | |
Russia | | | 362,935 | | | | 0 | | | | 0 | | | | 362,935 | |
South Korea | | | 10,470 | | | | 0 | | | | 0 | | | | 10,470 | |
Spain | | | 2,450,123 | | | | 0 | | | | 0 | | | | 2,450,123 | |
Sweden | | | 1,556,191 | | | | 0 | | | | 0 | | | | 1,556,191 | |
Switzerland | | | 9,919,561 | | | | 0 | | | | 0 | | | | 9,919,561 | |
Taiwan | | | 2,830,578 | | | | 0 | | | | 0 | | | | 2,830,578 | |
Thailand | | | 190,158 | | | | 0 | | | | 0 | | | | 190,158 | |
United Kingdom | | | 20,223,828 | | | | 0 | | | | 0 | | | | 20,223,828 | |
United States | | | 2,877,257 | | | | 0 | | | | 0 | | | | 2,877,257 | |
| | |
Participation Notes | | | | | | | | |
Ireland | | | 0 | | | | 2,979,015 | | | | 0 | | | | 2,979,015 | |
| | |
Preferred stocks | | | | | | | | |
Germany | | | 2,002,901 | | | | 0 | | | | 0 | | | | 2,002,901 | |
| | |
Short-term investments | | | | | | | | |
Investment companies | | | 1,759,819 | | | | 0 | | | | 0 | | | | 1,759,819 | |
| | | | |
Investments measured at net asset value* | | | | | | | | | | | | | | | 2,198,114 | |
Total assets | | $ | 129,965,618 | | | $ | 2,979,015 | | | $ | 0 | | | $ | 135,142,747 | |
| * | Investments that are measured at fair value using the net asset value per share (or its equivalent) as a practical expedient have not been categorized in the fair value hierarchy. The fair value amount presented in the table is intended to permit reconciliation of the fair value hierarchy to the amounts presented in the Statements of Assets and Liabilities. The Portfolio’s investment in Securities Lending Cash Investments, LLC valued at $2,198,114 does not have a redemption period notice, can be redeemed daily and does not have any unfunded commitments. |
| | | | | | |
| Notes to financial statements (unaudited) | | Wells Fargo Equity Gateway Funds | | | 127 | |
| | | | | | | | | | | | | | | | |
| International Value Portfolio | | Quoted prices
(Level 1) | | | Other significant
observable inputs
(Level 2) | | | Significant
unobservable inputs
(Level 3) | | | Total | |
Assets | | | | | | | | | | | | | | | | |
Investments in: | | | | | | | | | | | | | | | | |
| | | | |
Common stocks | | | | | | | | | | | | | | | | |
Australia | | $ | 30,475,428 | | | $ | 0 | | | $ | 49,771 | | | $ | 30,525,199 | |
Austria | | | 6,882,387 | | | | 0 | | | | 0 | | | | 6,882,387 | |
Brazil | | | 5,662,697 | | | | 0 | | | | 0 | | | | 5,662,697 | |
Canada | | | 11,002,881 | | | | 0 | | | | 0 | | | | 11,002,881 | |
China | | | 14,601,967 | | | | 0 | | | | 0 | | | | 14,601,967 | |
Czech Republic | | | 933,331 | | | | 0 | | | | 0 | | | | 933,331 | |
Denmark | | | 5,129,976 | | | | 0 | | | | 0 | | | | 5,129,976 | |
Finland | | | 1,222,969 | | | | 0 | | | | 0 | | | | 1,222,969 | |
France | | | 50,848,701 | | | | 0 | | | | 0 | | | | 50,848,701 | |
Germany | | | 44,737,620 | | | | 0 | | | | 0 | | | | 44,737,620 | |
Hong Kong | | | 11,524,062 | | | | 0 | | | | 0 | | | | 11,524,062 | |
Hungary | | | 1,166,323 | | | | 0 | | | | 0 | | | | 1,166,323 | |
India | | | 1,679,956 | | | | 0 | | | | 0 | | | | 1,679,956 | |
Ireland | | | 3,851,769 | | | | 0 | | | | 0 | | | | 3,851,769 | |
Israel | | | 5,172,825 | | | | 0 | | | | 0 | | | | 5,172,825 | |
Italy | | | 8,699,000 | | | | 0 | | | | 0 | | | | 8,699,000 | |
Japan | | | 126,403,738 | | | | 0 | | | | 0 | | | | 126,403,738 | |
Liechtenstein | | | 664,379 | | | | 0 | | | | 0 | | | | 664,379 | |
Netherlands | | | 10,905,411 | | | | 0 | | | | 0 | | | | 10,905,411 | |
Norway | | | 6,706,012 | | | | 0 | | | | 0 | | | | 6,706,012 | |
Poland | | | 2,032,478 | | | | 0 | | | | 0 | | | | 2,032,478 | |
Portugal | | | 1,147,679 | | | | 0 | | | | 0 | | | | 1,147,679 | |
Russia | | | 5,326,102 | | | | 0 | | | | 0 | | | | 5,326,102 | |
Singapore | | | 4,388,447 | | | | 0 | | | | 0 | | | | 4,388,447 | |
South Africa | | | 2,557,684 | | | | 0 | | | | 0 | | | | 2,557,684 | |
South Korea | | | 12,047,791 | | | | 0 | | | | 0 | | | | 12,047,791 | |
Spain | | | 10,362,971 | | | | 0 | | | | 0 | | |
| 10,362,971
|
|
Sweden | | | 9,107,120 | | | | 0 | | | | 0 | | | | 9,107,120 | |
Switzerland | | | 37,781,460 | | | | 0 | | | | 0 | | | | 37,781,460 | |
Taiwan | | | 5,939,415 | | | | 0 | | | | 0 | | | | 5,939,415 | |
Thailand | | | 8,109,465 | | | | 0 | | | | 0 | | | | 8,109,465 | |
United Kingdom | | | 79,836,453 | | | | 0 | | | | 0 | | | | 79,836,453 | |
| | | | |
Preferred stocks | | | | | | | | | | | | | | | | |
Brazil | | | 1,419,344 | | | | 0 | | | | 0 | | | | 1,419,344 | |
| | | | |
Short-term investments | | | | | | | | | | | | | | | | |
Investment companies | | | 6,504,594 | | | | 0 | | | | 0 | | | | 6,504,594 | |
| | | | |
Investments measured at net asset value* | | | | | | | | | | | | | | | 9,472,329 | |
Total assets | | $ | 534,832,435 | | | $ | 0 | | | $ | 49,771 | | | $ | 544,354,535 | |
| * | Investments that are measured at fair value using the net asset value per share (or its equivalent) as a practical expedient have not been categorized in the fair value hierarchy. The fair value amount presented in the table is intended to permit reconciliation of the fair value hierarchy to the amounts presented in the Statements of Assets and Liabilities. The Portfolio’s investment in Securities Lending Cash Investment, LLC valued at $9,472,329 does not have a redemption period notice, can be redeemed daily and does not have any unfunded commitments. |
| | | | |
| 128 | | Wells Fargo Equity Gateway Funds | | Notes to financial statements (unaudited) |
| | | | | | | | | | | | | | | | |
| Large Company Value Portfolio | | Quoted prices
(Level 1) | | | Other significant
observable inputs
(Level 2) | | | Significant
unobservable inputs
(Level 3) | | | Total | |
Assets | | | | | | | | | | | | | | | | |
Investments in: | | | | | | | | | | | | | | | | |
| | | | |
Common stocks | | | | | | | | | | | | | | | | |
Consumer discretionary | | $ | 4,652,195 | | | $ | 0 | | | $ | 0 | | | $ | 4,652,195 | |
Consumer staples | | | 4,859,989 | | | | 0 | | | | 0 | | | | 4,859,989 | |
Energy | | | 10,248,276 | | | | 0 | | | | 0 | | | | 10,248,276 | |
Financials | | | 18,030,899 | | | | 0 | | | | 0 | | | | 18,030,899 | |
Health care | | | 7,693,293 | | | | 0 | | | | 0 | | | | 7,693,293 | |
Industrials | | | 7,928,853 | | | | 0 | | | | 0 | | | | 7,928,853 | |
Information technology | | | 7,906,303 | | | | 0 | | | | 0 | | | | 7,906,303 | |
Materials | | | 3,251,894 | | | | 0 | | | | 0 | | | | 3,251,894 | |
Real estate | | | 4,780,118 | | | | 0 | | | | 0 | | | | 4,780,118 | |
Telecommunication services | | | 1,590,590 | | | | 0 | | | | 0 | | | | 1,590,590 | |
Utilities | | | 4,061,147 | | | | 0 | | | | 0 | | | | 4,061,147 | |
| | | | |
Investments measured at net asset value* | | | | | | | | | | | | | | | 3,311,310 | |
Total assets | | $ | 75,003,557 | | | $ | 0 | | | $ | 0 | | | $ | 78,314,867 | |
| * | Investments that are measured at fair value using the net asset value per share (or its equivalent) as a practical expedient have not been categorized in the fair value hierarchy. The fair value amount presented in the table is intended to permit reconciliation of the fair value hierarchy to the amounts presented in the Statements of Assets and Liabilities. The Portfolio’s investment in Securities Lending Cash Investment, LLC valued at $3,311,310 does not have a redemption period notice, can be redeemed daily and does not have any unfunded commitments. |
| | | | | | | | | | | | | | | | |
| Small Company Growth Portfolio | | Quoted prices (Level 1) | | | Other significant observable inputs (Level 2) | | | Significant unobservable inputs (Level 3) | | | Total | |
Assets | | | | | | | | |
Investments in: | | | | | | | | |
| | | | |
Common stocks | | | | | | | | | | | | | | | | |
Consumer discretionary | | $ | 200,767,878 | | | $ | 0 | | | $ | 0 | | | $ | 200,767,878 | |
Consumer staples | | | 27,461,662 | | | | 0 | | | | 0 | | | | 27,461,662 | |
Energy | | | 54,146,570 | | | | 0 | | | | 0 | | | | 54,146,570 | |
Financials | | | 140,453,574 | | | | 0 | | | | 0 | | | | 140,453,574 | |
Health care | | | 312,451,301 | | | | 0 | | | | 0 | | | | 312,451,301 | |
Industrials | | | 235,581,668 | | | | 0 | | | | 0 | | | | 235,581,668 | |
Information technology | | | 412,878,479 | | | | 0 | | | | 0 | | | | 412,878,479 | |
Materials | | | 41,040,574 | | | | 0 | | | | 0 | | | | 41,040,574 | |
Real estate | | | 16,830,162 | | | | 0 | | | | 0 | | | | 16,830,162 | |
| | | | |
Short-term investments | | | | | | | | | | | | | | | | |
Investment companies | | | 75,190,164 | | | | 0 | | | | 0 | | | | 75,190,164 | |
Investments measured at net asset value* | | | | | | | | | | | | | | | 165,112,340 | |
Total assets | | $ | 1,516,802,032 | | | $ | 0 | | | $ | 0 | | | $ | 1,681,914,372 | |
| * | Investments that are measured at fair value using the net asset value per share (or its equivalent) as a practical expedient have not been categorized in the fair value hierarchy. The fair value amount presented in the table is intended to permit reconciliation of the fair value hierarchy to the amounts presented in the Statements of Assets and Liabilities. The Portfolio’s investment in Securities Lending Cash Investment, LLC valued at $165,112,340 does not have a redemption period notice, can be redeemed daily and does not have any unfunded commitments. |
| | | | | | |
| Notes to financial statements (unaudited) | | Wells Fargo Equity Gateway Funds | | | 129 | |
| | | | | | | | | | | | | | | | |
| Small Company Value Portfolio | | Quoted prices (Level 1) | | | Other significant observable inputs (Level 2) | | | Significant unobservable inputs (Level 3) | | | Total | |
Assets | | | | | | | | |
Investments in: | | | | | | | | |
| | | | |
Common stocks | | | | | | | | | | | | | | | | |
Consumer discretionary | | $ | 39,614,072 | | | $ | 0 | | | $ | 0 | | | $ | 39,614,072 | |
Consumer staples | | | 4,812,273 | | | | 0 | | | | 0 | | | | 4,812,273 | |
Energy | | | 11,346,077 | | | | 0 | | | | 0 | | | | 11,346,077 | |
Financials | | | 61,867,079 | | | | 0 | | | | 0 | | | | 61,867,079 | |
Health care | | | 12,789,884 | | | | 0 | | | | 0 | | | | 12,789,884 | |
Industrials | | | 22,956,402 | | | | 0 | | | | 0 | | | | 22,956,402 | |
Information technology | | | 30,582,118 | | | | 0 | | | | 0 | | | | 30,582,118 | |
Materials | | | 7,153,575 | | | | 0 | | | | 0 | | | | 7,153,575 | |
Real estate | | | 20,698,252 | | | | 0 | | | | 0 | | | | 20,698,252 | |
Utilities | | | 7,894,134 | | | | 0 | | | | 0 | | | | 7,894,134 | |
| | | | |
Short-term investments | | | | | | | | | | | | | | | | |
Investment companies | | | 3,332,087 | | | | 0 | | | | 0 | | | | 3,332,087 | |
Investments measured at net asset value* | | | | | | | | | | | | | | | 11,762,612 | |
Total assets | | $ | 223,045,953 | | | $ | 0 | | | $ | 0 | | | $ | 234,808,565 | |
| * | Investments that are measured at fair value using the net asset value per share (or its equivalent) as a practical expedient have not been categorized in the fair value hierarchy. The fair value amount presented in the table is intended to permit reconciliation of the fair value hierarchy to the amounts presented in the Statements of Assets and Liabilities. The Portfolio’s investment in Securities Lending Cash Investment, LLC valued at $11,762,612 does not have a redemption period notice, can be redeemed daily and does not have any unfunded commitments. |
Futures contracts are reported at their variation margin at measurement date, which represents the amount due to/from the Portfolio at that date. All other assets and liabilities are reported at their market value at measurement date.
The Portfolios recognizes transfers between levels within the fair value hierarchy at the end of the reporting period. At November 30, 2016, the Portfolios did not have any transfers into/out of Level 1, Level 2, or Level 3.
4. TRANSACTIONS WITH AFFILIATES AND OTHER EXPENSES
Advisory fee
The Trust has entered into an advisory contract with Funds Management, an indirect wholly owned subsidiary of Wells Fargo. The adviser is responsible for implementing investment policies and guidelines and for supervising the subadvisers, who are responsible for day-to-day portfolio management of the Portfolios. Pursuant to the contract, Funds Management is entitled to receive an annual advisory fee which is calculated based on the average daily net assets of each Portfolio.
Funds Management has retained the services of certain subadvisers to provide daily portfolio management for the Portfolios. Funds Management has engaged WellsCap, Peregrine Capital Management, LLC (“Peregrine”), Artisan Partners Limited Partnership, Cooke & Bieler, L.P., Golden Capital Management, LLC (an affiliate of Funds Management), LSV Asset Management, Phocas Financial Corporation and Galliard Capital Management, Inc. (an affiliate of Funds Management and an indirect wholly owned subsidiary of Wells Fargo) as subadvisers. Peregine, Artisan Partners Limited Partnership, Cooke & Bieler, L.P., LSV Asset Management and Phocas Financial Corporation are not affiliates of Funds Management. As of August 25, 2016, Peregrine is no longer an affiliate of Funds Management as a result of a change in control through a buyout agreement between Wells Fargo and Peregrine. There was no change to the personnel or the operation of Peregrine and the subadvisory fee rates are identical to the prior subadvisory agreement.
The fees for subadvisory services are borne by Funds Management. The subadvisers are each entitled to receive from Funds Management an annual subadvisory fee which is calculated based on the average daily net assets of each Portfolio.
| | | | |
| 130 | | Wells Fargo Equity Gateway Funds | | Notes to financial statements (unaudited) |
The annual advisory and subadvisory fee rates for each Portfolio are as follows:
| | | | | | | | | | | | | | | | | | | | |
| | | Advisory fee | | | Effective rate for the six months ended November 30, 2016 | | | Subadviser | | Subadvisory fee | |
| | | starting at | | | declining to | | | | | starting at | | declining to | |
C&B Large Cap Value Portfolio | | | 0.65 | % | | | 0.475 | % | | | 0.65 | % | | Cooke & Bieler, L.P. | | 0.38% | | | 0.30 | % |
Diversified Large Cap Growth Portfolio | | | 0.65 | | | | 0.475 | | | | 0.65 | | | WellsCap | | 0.30 | | | 0.20 | |
Emerging Growth Portfolio | | | 0.80 | | | | 0.68 | | | | 0.79 | | | WellsCap | | 0.55 | | | 0.40 | |
Index Portfolio | | | 0.10 | | | | 0.05 | | | | 0.09 | | | Golden Capital Management, LLC | | 0.05 | | | 0.02 | |
International Growth Portfolio | | | 0.80 | * | | | 0.65 | * | | | 0.83 | | | Artisan Partners Limited Partnership | | 0.80 | | | 0.50 | |
International Value Portfolio | | | 0.80 | * | | | 0.65 | * | | | 0.83 | | | LSV Asset Management | | 0.35 | | | 0.30 | |
Large Company Value Portfolio | | | 0.65 | | | | 0.475 | | | | 0.65 | | | Phocas Financial Corporation | | 0.29 | | | 0.20 | |
Small Company Growth Portfolio | | | 0.80 | | | | 0.68 | | | | 0.78 | | | Peregrine | | 0.50 | | | 0.45 | |
Small Company Value Portfolio | | | 0.80 | | | | 0.68 | | | | 0.80 | | | Peregrine | | 0.45 | | | 0.40 | |
| * | Prior to July 1, 2016, the Adviser was entitled to receive a fee which started at 0.85% and declined to 0.70% as average net assets increased. |
Funds Management has voluntarily waived and/or reimbursed advisory fees to the extent necessary to maintain certain net operating expense ratios for the Portfolios.
5. INVESTMENT PORTFOLIO TRANSACTIONS
Purchases and sales of investments, excluding short-term securities, for the six months ended November 30, 2016 were as follows:
| | | | | | | | |
| | | Purchases at cost | | | Sales proceeds | |
C&B Large Cap Value Portfolio | | $ | 138,247,965 | | | $ | 98,309,476 | |
Diversified Large Cap Growth Portfolio | | | 39,874,152 | | | | 48,378,661 | |
Emerging Growth Portfolio | | | 423,646,223 | | | | 445,338,695 | |
Index Portfolio | | | 105,617,172 | | | | 342,200,515 | |
International Growth Portfolio | | | 86,810,483 | | | | 82,464,777 | |
International Value Portfolio | | | 118,692,922 | | | | 74,418,267 | |
Large Company Value Portfolio | | | 25,686,356 | | | | 29,271,036 | |
Small Company Growth Portfolio | | | 789,709,097 | | | | 467,420,144 | |
Small Company Value Portfolio | | | 115,642,016 | | | | 128,449,471 | |
6. INVESTMENTS IN AFFILIATES
An affiliated investment is a company which is under common ownership or control of the Portfolio or which the Portfolio has ownership of at least 5% of the outstanding voting shares. The following is a summary of transactions for the long-term holdings of issuers that were either affiliates of Index Portfolio at the beginning of the period or the end of the period.
| | | | | | | | | | | | | | | | | | | | | | | | | | | | |
| | | Shares,
beginning
of period | | | Shares
purchases | | | Shares
sold | | | Shares,
end of
period | | | Value, end
of period | | | Income
from
affiliated
securities | | | Realized gains
on affiliated
securities | |
Wells Fargo & Company | | | 583,952 | | | | 15,747 | | | | 84,045 | | | | 515,654 | | | $ | 27,288,410 | | | $ | 420,422 | | | $ | 1,342,812 | |
7. DERIVATIVE TRANSACTIONS
During the six months ended November 30, 2016, Index Portfolio used uninvested cash to enter into futures contracts to gain market exposure.
| | | | | | |
| Notes to financial statements (unaudited) | | Wells Fargo Equity Gateway Funds | | | 131 | |
At November 30, 2016, Index Portfolio had long futures contracts outstanding as follows:
| | | | | | | | | | | | | | |
| Expiration date | | Counterparty | | Contracts | | Type | | Contract
value at
November 30, 2016 | | | Unrealized gains (losses) | |
| 12-15-2016 | | Societe Generale | | 14 Long | | S&P 500 Index | | $ | 7,695,800 | | | $ | 31,255 | |
| 3-16-2017 | | Societe Generale | | 50 Long | | S&P 500 Index | | | 27,421,250 | | | | (10,250 | ) |
Index Portfolio had an average notional amount of $24,700,134 in long futures contracts outstanding during the six months ended November 30, 2016.
The receivable and payable for daily variation margin on open futures contracts reflected in the Statements of Assets and Liabilities only represents the current day’s variation margin. The realized gains or losses and change in unrealized gains or losses on derivative instruments are reflected in the Statements of Operations.
For certain types of derivative transactions, the Portfolios have entered into International Swaps and Derivatives Association, Inc. master agreements (“ISDA Master Agreements”) or similar agreements with approved counterparties. The ISDA Master Agreements or similar agreements may have requirements to deliver/deposit securities or cash to/with an exchange or broker-dealer as collateral and allows the Portfolios to offset, with each counterparty, certain derivative financial instrument’s assets and/or liabilities with collateral held or pledged. Collateral requirements differ by type of derivative. Collateral or margin requirements are set by the broker or exchange clearing house for exchange traded derivatives while collateral terms are contract specific for over-the-counter traded derivatives. Cash collateral that has been pledged to cover obligations of the Portfolios under ISDA Master Agreements or similar agreements, if any, will be reported separately in the Statements of Assets and Liabilities. Securities pledged as collateral, if any, for the same purpose are noted in the Portfolio of Investments or Summary Portfolio of Investments. With respect to balance sheet offsetting, absent an event of default by the counterparty or a termination of the agreement, the reported amounts of financial assets and financial liabilities in the Statements of Assets and Liabilities are not offset across transactions between the Portfolio and the applicable counterparty. A reconciliation of the gross amounts on the Statements of Assets and Liabilities to the net amounts by derivative type, including any collateral exposure, is as follows:
| | | | | | | | | | | | | | | | | | | | |
| | | Derivative type | | Counterparty | | Gross amounts
of assets in the
Statements of
Assets and
Liabilities | | | Amounts
subject to
netting
agreements | | | Collateral
received | | | Net amount
of assets | |
Index Portfolio | | Futures – variation margin | | Societe Generale | | $ | 11,930 | | | $ | (10,250 | ) | | $ | 0 | | | $ | 1,680 | |
| | | | | | | | | | | | | | | | | | | | |
| | | Derivative type | | Counterparty | | Gross amounts
of liabilities in the
Statements of
Assets and
Liabilities | | | Amounts
subject to
netting
agreements | | | Collateral
pledged | | | Net amount
of liabilities | |
Index Portfolio | | Futures – variation margin | | Societe Generale | | $ | 10,250 | | | $ | (10,250 | ) | | $ | 0 | | | $ | 0 | |
8. CONCENTRATION RISKS
Concentration risks result from exposure to a limited number of sectors. Portfolios that invest a substantial portion of their assets in a sector may be more affected by changes in that sector than would be a portfolio whose investments are not heavily weighted in any sector. The Portfolio of Investments or Summary Portfolio of Investments includes information on each Portfolio’s holdings, including sector composition, country and/or geographical composition as relevant.
9. INDEMNIFICATION
Under the Trust’s organizational documents, the officers and Trustees have been granted certain indemnification rights against certain liabilities that may arise out of performance of their duties to the Trust. Additionally, in the normal course of business, the Trust may enter into contracts with service providers that contain a variety of indemnification clauses. The Trust’s maximum exposure under these arrangements is dependent on future claims that may be made against the Portfolios and, therefore, cannot be estimated.
| | | | |
| 132 | | Wells Fargo Equity Gateway Funds | | Notes to financial statements (unaudited) |
10. REDEMPTION IN-KIND
After the close of business on July 15, 2016, Wells Fargo Emerging Growth Fund, which invests all of its assets in Emerging Growth Portfolio, redeemed assets through an in-kind redemption. In the redemption transaction, Wells Fargo Emerging Growth Fund issued securities which it received from Emerging Growth Portfolio with a value of $80,953,334 along with cash in the amount of $2,716,932. Emerging Growth Portfolio recognized gains in the amount of $30,973,586, which are reflected on the Statements of Operations. The redemption in-kind represented 9.01% of Emerging Growth Portfolio.
11. REGULATORY CHANGES
In October 2016, the Securities and Exchange Commission (“SEC”) adopted new rules and forms and amended existing rules and forms (together, “final rules”) intended to modernize and enhance the reporting and disclosure of information by registered investment companies and to enhance liquidity risk management by open-end mutual funds and exchange-traded funds. The final rules will enhance the quality of information available to investors and will allow the SEC to more effectively collect and use data reported by funds. In part, the final rules amend Regulation S-X and require standardized, enhanced disclosure about derivatives in the Fund’s financial statements, as well as other amendments. The compliance date for the amendments to Regulation S-X is August 1, 2017 while the compliance date for the new form types is June 1, 2018 and the compliance date for the liquidity risk management program requirements is December 1, 2018. Management is currently assessing the potential impact of these enhancements and their impact on the financial statement disclosures and reporting requirements.
| | | | | | |
| Other information (unaudited) | | Wells Fargo Equity Gateway Funds | | | 133 | |
TAX INFORMATION
Pursuant to Section 853 of the Internal Revenue Code, the following amounts have been designated as foreign taxes paid for the fiscal year ended May 31, 2016. This amount may be less than the actual foreign taxes paid for financial statement purposes. Foreign taxes paid or withheld should be included in taxable income with an offsetting deduction from gross income or as a credit for taxes paid to foreign governments. None of the income was derived from ineligible foreign sources as defined under Section 901(j) of the Internal Revenue Code.
| | | | | | |
| | | Creditable foreign taxes paid | | Per share amount | | Foreign income as % of ordinary income distributions |
International Value Fund | | $1,160,209 | | $0.0312 | | 100% |
PROXY VOTING INFORMATION
A description of the policies and procedures used to determine how to vote proxies relating to portfolio securities is available without charge, upon request, by calling 1-800-222-8222, visiting our website at wellsfargofunds.com, or visiting the SEC website at sec.gov. Information regarding how the proxies related to portfolio securities were voted during the most recent 12-month period ended June 30 is available on the website at wellsfargofunds.com or by visiting the SEC website at sec.gov.
PORTFOLIO HOLDINGS INFORMATION
The complete portfolio holdings are publicly available on the website (wellsfargofunds.com) on a one-month delayed basis. In addition, top ten holdings information (excluding derivative positions) is publicly available on the website on a monthly, seven-day or more delayed basis. Each Fund and Portfolio files its complete schedule of portfolio holdings with the SEC for the first and third quarters of each fiscal year on Form N-Q, which is available by visiting the SEC website at sec.gov. In addition, each Form N-Q may be reviewed and copied at the SEC’s Public Reference Room in Washington, DC, and at regional offices in New York City, at 233 Broadway, and in Chicago, at 175 West Jackson Boulevard, Suite 900. Information about the Public Reference Room may be obtained by calling 1-800-SEC-0330.
| | | | |
| 134 | | Wells Fargo Equity Gateway Funds | | Other information (unaudited) |
BOARD OF TRUSTEES AND OFFICERS
Each of the Trustees and Officers1 listed in the table below acts in identical capacities for each fund in the Wells Fargo family of funds, which consists of 139 mutual funds comprising the Wells Fargo Funds Trust, Wells Fargo Variable Trust, Wells Fargo Master Trust and four closed-end funds (collectively the “Fund Complex”). This table should be read in conjunction with the Prospectus and the Statement of Additional Information2. The mailing address of each Trustee and Officer is 525 Market Street, 12th Floor, San Francisco, CA 94105. Each Trustee and Officer serves an indefinite term, however, each Trustee serves such term until reaching the mandatory retirement age established by the Trustees.
Independent Trustees
| | | | | | |
Name and year of birth | | Position held and length of service* | | Principal occupations during past five years or longer | | Current other public company or investment company
directorships |
William R. Ebsworth (Born 1957) | | Trustee, since 2015 | | Retired. From 1984 to 2013, equities analyst, portfolio manager, research director and chief investment officer at Fidelity Management and Research Company in Boston, Tokyo, and Hong Kong and retired in 2013 as Chief Investment Officer of Fidelity Strategic Advisers, Inc. where he lead a team of investment professionals managing client assets. Prior thereto, Board member of Hong Kong Securities Clearing Co., Hong Kong Options Clearing Corp., the Thailand International Fund, Ltd., Fidelity Investments Life Insurance Company, and Empire Fidelity Investments Life Insurance Company. Mr. Ebsworth is a CFA® charterholder and an Adjunct Lecturer, Finance, at Babson College. | | Asset Allocation Trust |
Jane A. Freeman (Born 1953) | | Trustee, since 2015 | | Retired. From 2012 to 2014 and 1999 to 2008, Chief Financial Officer of Scientific Learning Corporation. From 2008 to 2012, Ms. Freeman provided consulting services related to strategic business projects. Prior to 1999, Portfolio Manager at Rockefeller & Co. and Scudder, Stevens & Clark. Board member of the Harding Loevner Funds from 1996 to 2014, serving as both Lead Independent Director and chair of the Audit Committee. Board member of the Russell Exchange Traded Funds Trust from 2011 to 2012 and the chair of the Audit Committee. Ms. Freeman is Chair of Taproot Foundation (non-profit organization), a Board Member of Ruth Bancroft Garden (non-profit organization) and an inactive chartered financial analyst. | | Asset Allocation Trust |
Peter G. Gordon** (Born 1942) | | Trustee, since 1998; Chairman, since 2005 | | Co-Founder, Retired Chairman, President and CEO of Crystal Geyser Water Company. Trustee Emeritus, Colby College. | | Asset Allocation Trust |
Isaiah Harris, Jr. (Born 1952) | | Trustee, since 2009 | | Retired. Chairman of the Board of CIGNA Corporation since 2009, and Director since 2005. From 2003 to 2011, Director of Deluxe Corporation. Prior thereto, President and CEO of BellSouth Advertising and Publishing Corp. from 2005 to 2007, President and CEO of BellSouth Enterprises from 2004 to 2005 and President of BellSouth Consumer Services from 2000 to 2003. Emeritus member of the Iowa State University Foundation Board of Governors. Emeritus Member of the Advisory Board of Iowa State University School of Business. Advisory Board Member, Palm Harbor Academy (charter school). Advisory Board Member, Child Evangelism Fellowship (non-profit). Mr. Harris is a certified public accountant (inactive status). | | CIGNA Corporation; Asset Allocation Trust |
Judith M. Johnson (Born 1949) | | Trustee, since 2008; Audit Committee Chairman, since 2008 | | Retired. Prior thereto, Chief Executive Officer and Chief Investment Officer of Minneapolis Employees Retirement Fund from 1996 to 2008. Ms. Johnson is an attorney, certified public accountant and a certified managerial accountant. | | Asset Allocation Trust |
David F. Larcker (Born 1950) | | Trustee, since 2009 | | James Irvin Miller Professor of Accounting at the Graduate School of Business, Stanford University, Director of the Corporate Governance Research Initiative and Senior Faculty of The Rock Center for Corporate Governance since 2006. From 2005 to 2008, Professor of Accounting at the Graduate School of Business, Stanford University. Prior thereto, Ernst & Young Professor of Accounting at The Wharton School, University of Pennsylvania from 1985 to 2005. | | Asset Allocation Trust |
| | | | | | |
| Other information (unaudited) | | Wells Fargo Equity Gateway Funds | | | 135 | |
| | | | | | |
Name and year of birth | | Position held and length of service* | | Principal occupations during past five years or longer | | Current other public company or investment company
directorships |
Olivia S. Mitchell (Born 1953) | | Trustee, since 2006 | | International Foundation of Employee Benefit Plans Professor, Wharton School of the University of Pennsylvania since 1993. Director of Wharton’s Pension Research Council and Boettner Center on Pensions & Retirement Research, and Research Associate at the National Bureau of Economic Research. Previously, Cornell University Professor from 1978 to 1993. | | Asset Allocation Trust |
Timothy J. Penny (Born 1951) | | Trustee, since 1996 | | President and Chief Executive Officer of Southern Minnesota Initiative Foundation, a non-profit organization, since 2007 and Senior Fellow at the Humphrey Institute Policy Forum at the University of Minnesota since 1995. Member of the Board of Trustees of NorthStar Education Finance, Inc., a non-profit organization, since 2007. | | Asset Allocation Trust |
Michael S. Scofield (Born 1943) | | Trustee, since 2010 | | Served on the Investment Company Institute’s Board of Governors and Executive Committee from 2008-2011 as well the Governing Council of the Independent Directors Council from 2006-2011 and the Independent Directors Council Executive Committee from 2008-2011. Chairman of the IDC from 2008-2010. Institutional Investor (Fund Directions) Trustee of Year in 2007. Trustee of the Evergreen Funds complex (and its predecessors) from 1984 to 2010. Chairman of the Evergreen Funds from 2000-2010. Former Trustee of the Mentor Funds. Retired Attorney, Law Offices of Michael S. Scofield. | | Asset Allocation Trust |
| * | Length of service dates reflect the Trustee’s commencement of service with the Trust’s predecessor entities, where applicable. |
| ** | Peter Gordon is expected to retire on December 31, 2017. |
Officers
| | | | | | |
Name and year of birth | | Position held and length of service | | Principal occupations during past five years or longer | | |
Andrew Owen3 (Born 1960) | | President, since 2017 | | Executive Vice President of Wells Fargo & Company and Head of Affiliated Managers, Wells Fargo Asset Management, since 2014. Executive Vice President responsible for marketing, investments and product development for Wells Fargo Funds Management, LLC, from 2009 to 2014. | | |
Nancy Wiser1 (Born 1967) | | Treasurer, since 2012 | | Executive Vice President of Wells Fargo Funds Management, LLC since 2011. Chief Operating Officer and Chief Compliance Officer at LightBox Capital Management LLC, from 2008 to 2011. | | |
Jeremy DePalma1 (Born 1974) | | Treasurer, since 2012 | | Senior Vice President of Wells Fargo Funds Management, LLC since 2009. Senior Vice President of Evergreen Investment Management Company, LLC from 2008 to 2010 and head of the Fund Reporting and Control Team within Fund Administration from 2005 to 2010. | | |
C. David Messman (Born 1960) | | Secretary, since 2000; Chief Legal Officer, since 2003 | | Senior Vice President and Secretary of Wells Fargo Funds Management, LLC since 2001. Assistant General Counsel of Wells Fargo Bank, N.A. since 2013 and Vice President and Managing Counsel of Wells Fargo Bank, N.A. from 1996 to 2013. | | |
Michael Whitaker (Born 1967) | | Chief Compliance Officer, since 2016 | | Executive Vice President of Wells Fargo Funds Management, LLC since 2016. Chief Compliance Officer of Fidelity’s Fixed Income Funds and Asset Allocation Funds from 2008 to 2016, Compliance Officer of FMR Co., Inc. from 2014 to 2016, Fidelity Investments Money Management, Inc. from 2014 to 2016, Fidelity Investments from 2007 to 2016. | | |
David Berardi (Born 1975) | | Assistant Treasurer, since 2009 | | Vice President of Wells Fargo Funds Management, LLC since 2009. Vice President of Evergreen Investment Management Company, LLC from 2008 to 2010. Manager of Fund Reporting and Control for Evergreen Investment Management Company, LLC from 2004 to 2010. | | |
| 1 | Jeremy DePalma acts as Treasurer of the International Value Fund, International Growth Portfolio, and International Value Portfolio and Assistant Treasurer of the remaining funds in this shareholder report. In addition, Jeremy DePalma acts as Treasurer of 66 other funds and Assistant Treasurer of 57 other funds in the Fund Complex. Nancy Wiser serves as Treasurer of the remaining funds in this shareholder report as well as 57 other funds in the Fund Complex. |
| 2 | The Statement of Additional Information includes additional information about the Trustees and is available, without charge, upon request, by calling 1-800-222-8222 or by visiting the website at wellsfargofunds.com. |
| 3 | Andrew Owen became President on January 1, 2017. |
| | | | |
| 136 | | Wells Fargo Equity Gateway Funds | | List of abbreviations |
The following is a list of common abbreviations for terms and entities that may have appeared in this report.
| ACA | — ACA Financial Guaranty Corporation |
| ADR | — American depositary receipt |
| ADS | — American depositary shares |
| AGC | — Assured Guaranty Corporation |
| AGM | — Assured Guaranty Municipal |
| Ambac | — Ambac Financial Group Incorporated |
| AMT | — Alternative minimum tax |
| BAN | — Bond anticipation notes |
| BHAC | — Berkshire Hathaway Assurance Corporation |
| CAB | — Capital appreciation bond |
| CCAB | — Convertible capital appreciation bond |
| CDA | — Community Development Authority |
| CDO | — Collateralized debt obligation |
| DRIVER | — Derivative inverse tax-exempt receipts |
| DW&P | — Department of Water & Power |
| DWR | — Department of Water Resources |
| ECFA | — Educational & Cultural Facilities Authority |
| EDA | — Economic Development Authority |
| EDFA | — Economic Development Finance Authority |
| ETF | — Exchange-traded fund |
| FDIC | — Federal Deposit Insurance Corporation |
| FFCB | — Federal Farm Credit Banks |
| FGIC | — Financial Guaranty Insurance Corporation |
| FHA | — Federal Housing Administration |
| FHLB | — Federal Home Loan Bank |
| FHLMC | — Federal Home Loan Mortgage Corporation |
| FICO | — The Financing Corporation |
| FNMA | — Federal National Mortgage Association |
| GDR | — Global depositary receipt |
| GNMA | — Government National Mortgage Association |
| HCFR | — Healthcare facilities revenue |
| HEFA | — Health & Educational Facilities Authority |
| HEFAR | — Higher education facilities authority revenue |
| HFA | — Housing Finance Authority |
| HFFA | — Health Facilities Financing Authority |
| HUD | — Department of Housing and Urban Development |
| IDA | — Industrial Development Authority |
| IDAG | — Industrial Development Agency |
| KRW | — Republic of Korea won |
| LIBOR | — London Interbank Offered Rate |
| LIFER | — Long Inverse Floating Exempt Receipts |
| LLC | — Limited liability company |
| LLLP | — Limited liability limited partnership |
| LLP | — Limited liability partnership |
| MBIA | — Municipal Bond Insurance Association |
| MFHR | — Multifamily housing revenue |
| MSTR | — Municipal securities trust receipts |
| MUD | — Municipal Utility District |
| National | — National Public Finance Guarantee Corporation |
| PCFA | — Pollution Control Financing Authority |
| PCL | — Public Company Limited |
| PCR | — Pollution control revenue |
| PFA | — Public Finance Authority |
| PFFA | — Public Facilities Financing Authority |
| PFOTER | — Puttable floating option tax-exempt receipts |
| plc | — Public limited company |
| PUTTER | — Puttable tax-exempt receipts |
| R&D | — Research & development |
| Radian | — Radian Asset Assurance |
| RAN | — Revenue anticipation notes |
| RDA | — Redevelopment Authority |
| RDFA | — Redevelopment Finance Authority |
| REIT | — Real estate investment trust |
| ROC | — Reset option certificates |
| SAVRS | — Select auction variable rate securities |
| SBA | — Small Business Authority |
| SDR | — Swedish depositary receipt |
| SFHR | — Single-family housing revenue |
| SFMR | — Single-family mortgage revenue |
| SPA | — Standby purchase agreement |
| SPDR | — Standard & Poor’s Depositary Receipts |
| SPEAR | — Short Puttable Exempt Adjustable Receipts |
| STRIPS | — Separate trading of registered interest and |
| TAN | — Tax anticipation notes |
| TIPS | — Treasury inflation-protected securities |
| TRAN | — Tax revenue anticipation notes |
| TTFA | — Transportation Trust Fund Authority |
| TVA | — Tennessee Valley Authority |

For more information
More information about Wells Fargo Funds is available free upon request. To obtain literature, please write, email, visit the Funds’ website, or call:
Wells Fargo Funds
P.O. Box 8266
Boston, MA 02266-8266
Email: fundservice@wellsfargo.com
Website: wellsfargofunds.com
Individual investors: 1-800-222-8222
Retail investment professionals: 1-888-877-9275
Institutional investment professionals: 1-866-765-0778
This report and the financial statements contained herein are submitted for the general information of the shareholders of Wells Fargo Funds. If this report is used for promotional purposes, distribution of the report must be accompanied or preceded by a current prospectus. Before investing, please consider the investment objectives, risks, charges, and expenses of the investment. For a current prospectus and, if available, a summary prospectus, containing this information, call 1-800-222-8222 or visit the Funds’ website at wellsfargofunds.com. Read the prospectus carefully before you invest or send money.
Wells Fargo Asset Management (WFAM) is a trade name used by the asset management businesses of Wells Fargo & Company. Wells Fargo Funds Management, LLC, a wholly owned subsidiary of Wells Fargo & Company, provides investment advisory and administrative services for Wells Fargo Funds. Other affiliates of Wells Fargo & Company provide subadvisory and other services for the funds. The funds are distributed by Wells Fargo Funds Distributor, LLC, Member FINRA, an affiliate of Wells Fargo & Company. Neither Wells Fargo Funds Management nor Wells Fargo Funds Distributor has Fund customer accounts/assets, and neither provides investment advice/recommendations or acts as an investment advice fiduciary to any investor.
NOT FDIC INSURED ◾ NO BANK GUARANTEE ◾ MAY LOSE VALUE
© 2016 Wells Fargo Funds Management, LLC. All rights reserved.
| | |
 | | 248013 01-17 SEGF/SAR111 11-16 |
Semi-Annual Report
November 30, 2016

Dynamic Target Date Funds

| ∎ | | Wells Fargo Dynamic Target Today Fund |
| ∎ | | Wells Fargo Dynamic Target 2015 Fund |
| ∎ | | Wells Fargo Dynamic Target 2020 Fund |
| ∎ | | Wells Fargo Dynamic Target 2025 Fund |
| ∎ | | Wells Fargo Dynamic Target 2030 Fund |
| ∎ | | Wells Fargo Dynamic Target 2035 Fund |
| ∎ | | Wells Fargo Dynamic Target 2040 Fund |
| ∎ | | Wells Fargo Dynamic Target 2045 Fund |
| ∎ | | Wells Fargo Dynamic Target 2050 Fund |
| ∎ | | Wells Fargo Dynamic Target 2055 Fund |
| ∎ | | Wells Fargo Dynamic Target 2060 Fund |

Reduce clutter. Save trees.
Sign up for electronic delivery of prospectuses and shareholder reports at wellsfargo.com/advantagedelivery
Contents
The views expressed and any forward-looking statements are as of November 30, 2016, unless otherwise noted, and are those of the Fund managers and/or Wells Fargo Funds Management, LLC. Discussions of individual securities, or the markets generally, or any Wells Fargo Fund are not intended as individual recommendations. Future events or results may vary significantly from those expressed in any forward-looking statements. The views expressed are subject to change at any time in response to changing circumstances in the market. Wells Fargo Funds Management, LLC and the Funds disclaim any obligation to publicly update or revise any views expressed or forward-looking statements.
NOT FDIC INSURED ◾ NO BANK GUARANTEE ◾ MAY LOSE VALUE
| | | | |
| 2 | | Wells Fargo Dynamic Target Date Funds | | Letter to shareholders (unaudited) |

Andrew Owen
President
Wells Fargo Funds
During much of the period, modestly positive economic data influenced global stock, bond, and commodity markets.
Throughout the period, economic and business data, while often uneven, appeared to be strengthening overall.
Dear Shareholder:
As the new president of Wells Fargo Funds now that Karla Rabusch is retiring from that position after nearly 14 years, I am pleased to offer you this semi-annual report for the Wells Fargo Dynamic Target Date Funds for the six-month period that ended November 30, 2016. During much of the period, modestly positive economic data influenced global stock, bond, and commodity markets. Late in the period, stocks moved higher and bond markets fell in reaction to global political events including the U.S. presidential election, efforts by the Organization of Petroleum Exporting Countries (OPEC) to increase oil prices, and interest-rate expectations.
The surprise Brexit vote rattled markets briefly before stocks rebounded.
Global investment markets trended lower at the end of June following the Brexit vote in the U.K. to leave the European Union (E.U.). The equity sell-off proved temporary. During July, better-than-expected corporate earnings, economic data, consumer confidence, and industrial output sent U.S. stocks higher.
Stocks drifted somewhat lower in the fall as the presidential campaign wore on toward the election. Following the November election, the S&P 500 Index1 reached several record all-time highs on its path to a 6.01% return for the six-month period that ended November 30, 2016. The Russell 2000® Index2 and S&P Midcap 400® Index3 delivered even more robust returns for the period at 15.37% and 9.93%, respectively.
International equity markets confronted challenging circumstances during the period.
During the period, political circumstances in countries outside of the U.S. challenged investor sentiment. In the U.K., a new prime minister took office following the Brexit vote and began setting the ground rules for the country’s exit from the E.U. In Brazil, the Senate removed the president from office, and the possibility of presidential impeachment due to a corruption scandal emerged in South Korea. The king of Thailand died. The French president lost a primary election and endorsed his rival. An attempted coup in Turkey, continued escalation of conflicts in Syria and Iraq, and North Korea’s testing of its nuclear weapons capabilities also caused uncertainty.
Throughout the period, economic and business data, while often uneven, appeared to be strengthening overall. After generating concern early in 2016, China’s economic growth demonstrated strength. The prime minister’s re-election in Japan offered the potential for new economic stimulus. India appointed a new central bank governor who many expected would continue the outgoing governor’s policies, which were considered effective. OPEC members agreed to production cuts intended to support increased prices for oil, which could benefit commodities markets that are economically important to many international
| 1 | The S&P 500 Index consists of 500 stocks chosen for market size, liquidity, and industry group representation. It is a market-value-weighted index with each stock’s weight in the index proportionate to its market value. You cannot invest directly in an index. |
| 2 | The Russell 2000® Index measures the performance of the 2,000 smallest companies in the Russell 3000® Index, which represents approximately 8% of the total market capitalization of the Russell 3000® Index. You cannot invest directly in an index. |
| 3 | The S&P MidCap 400® Index measures the performance of the mid-size company segment of the U.S. market; this index is used by more than 95% of U.S. managers and pension plan sponsors. More than $25 billion is indexed to the S&P MidCap 400® Index. You cannot invest directly in an index. |
| 4 | The Morgan Stanley Capital International (MSCI) Europe, Australasia, Far East (EAFE) Index (Net) is a free-float-adjusted market-capitalization-weighted index that is designed to measure the equity market performance of developed markets, excluding the United States and Canada. The MSCI EAFE Index (Net) consists of the following 21 developed markets country indexes: Australia, Austria, Belgium, Denmark, Finland, France, Germany, Hong Kong, Ireland, Israel, Italy, Japan, the Netherlands, New Zealand, Norway, Portugal, Singapore, Spain, Sweden, Switzerland, and the United Kingdom. Source: MSCI. MSCI makes no express or implied warranties or representations and shall have no liability whatsoever with respect to any MSCI data contained herein. The MSCI data may not be further redistributed or used as a basis for other indexes or any securities or financial products. This report is not approved, reviewed, or produced by MSCI. You cannot invest directly in an index. |
| | | | | | |
| Letter to shareholders (unaudited) | | Wells Fargo Dynamic Target Date Funds | | | 3 | |
developed and emerging markets. Developed international markets as measured by the Morgan Stanley Capital International (MSCI) Europe, Australasia, Far East (EAFE) Index (Net)4 ended the period 1.25% lower. Stocks in emerging markets delivered an 8.42% gain for the period as measured by the MSCI Emerging Markets Index (Net).5
Fixed-income markets were volatile before the U.S. election and declined post-election.
Global fixed-income markets were volatile during the period, particularly following the U.S. election. Investors appeared to be anticipating U.S. interest-rate increases and waiting for clarity from central bank policymakers outside of the U.S. When investors expect interest rates to rise, they often seek higher yields on their investments to compensate for inflation’s eroding effect on real returns, tending to favor equities and high-yield bonds, for example, over investment-grade bonds.
Also, currency values in several European and Asian countries fell relative to the U.S. dollar during the period, restraining investor interest in foreign bond markets. While the Bloomberg Barclays Aggregate Bond Index6 suffered a 0.92% loss during the period, the 4.97% loss for the Bloomberg Barclays Global Aggregate Bond ex-USD Index7 reflects the relatively more difficult conditions for bonds outside of the U.S.
Don’t let short-term uncertainty derail long-term investment goals.
Periods of investment uncertainty can present challenges, but experience has taught us that maintaining long-term investment goals can be an effective way to plan for the future. To help you create a sound strategy based on your personal goals and risk tolerance, Wells Fargo Funds offers more than 100 mutual funds spanning a wide range of asset classes and investment styles. Although diversification cannot guarantee an investment profit or prevent losses, we believe it can be an effective way to manage investment risk and potentially smooth out overall portfolio performance. We encourage investors to know their investments and to understand that appropriate levels of risk-taking may unlock opportunities.
Thank you for choosing to invest with Wells Fargo Funds. We appreciate your confidence in us and remain committed to helping you meet your financial needs.
Sincerely,

Andrew Owen
President
Wells Fargo Funds
For further information about your Fund, contact your investment professional, visit our website at wellsfargofunds.com, or call us directly at 1-800-222-8222. We are available 24 hours a day, 7 days a week.
| 5 | The MSCI Emerging Markets (EM) Index (Net) is a free-float-adjusted market-capitalization-weighted index that is designed to measure the equity market performance of emerging markets. The MSCI EM Index consists of the following 23 emerging markets country indexes: Brazil, Chile, China, Colombia, Czech Republic, Egypt, Greece, Hungary, India, Indonesia, Korea, Malaysia, Mexico, Peru, the Philippines, Poland, Qatar, Russia, South Africa, Taiwan, Thailand, Turkey, and United Arab Emirates. You cannot invest directly in an index. |
| 6 | The Bloomberg Barclays U.S. Aggregate Bond Index (formerly known as Barclays U.S. Aggregate Bond Index) is a broad-based benchmark that measures the investment-grade, U.S. dollar–denominated, fixed-rate taxable bond market, including Treasuries, government-related and corporate securities, mortgage-backed securities (agency fixed-rate and hybrid adjustable-rate mortgage pass-throughs), asset-backed securities, and commercial mortgage-backed securities. You cannot invest directly in an index. |
| 7 | The Bloomberg Barclays Global Aggregate ex U.S. Dollar Bond Index (formerly known as Barclays Global Aggregate ex U.S. Dollar Bond Index) tracks an international basket of government, corporate, agency, and mortgage-related bonds. You cannot invest directly in an index. |
| | | | |
| 4 | | Wells Fargo Dynamic Target Date Funds | | Performance highlights (unaudited) |
Wells Fargo Dynamic Target Date Funds
Investment objective
Each Fund seeks total return over time, consistent with its strategic target allocation.
| | |
Wells Fargo Dynamic Target Date Funds | | Corresponding S&P Target Date Index |
| Dynamic Target Today Fund | | S&P Target Date Retirement Income Index |
| Dynamic Target 2015 Fund | | S&P Target Date 2015 Index |
| Dynamic Target 2020 Fund | | S&P Target Date 2020 Index |
| Dynamic Target 2025 Fund | | S&P Target Date 2025 Index |
| Dynamic Target 2030 Fund | | S&P Target Date 2030 Index |
| Dynamic Target 2035 Fund | | S&P Target Date 2035 Index |
| Dynamic Target 2040 Fund | | S&P Target Date 2040 Index |
| Dynamic Target 2045 Fund | | S&P Target Date 2045 Index |
| Dynamic Target 2050 Fund | | S&P Target Date 2050 Index |
| Dynamic Target 2055 Fund | | S&P Target Date 2055+ Index |
| Dynamic Target 2060 Fund | | S&P Target Date 2055+ Index |
Manager
Wells Fargo Funds Management, LLC
Subadviser
Wells Capital Management Incorporated
Portfolio managers
Kandarp Acharya, CFA®, FRM
Petros Bocray, CFA®, FRM
Christian Chan, CFA®
The target date represents the year in which investors may likely begin withdrawing assets. The Funds gradually seek to reduce market risk as the target date approaches and after it arrives by decreasing equity exposure and increasing fixed income exposure. The principal value is not guaranteed at any time, including at the target date.
The Funds invest using alternative investment strategies such as equity hedged, event driven, global macro, and relative value, which are speculative and entail a high degree of risk. Alternative investments, such as short sales, commodities and merger arbitrage strategies, are speculative and entail a high degree of risk. Stock values fluctuate in response to the activities of individual companies and general market and economic conditions. Bond values fluctuate in response to the financial condition of individual issuers, general market and economic conditions, and changes in interest rates. Changes in market conditions and government policies may lead to periods of heightened volatility in the bond market and reduced liquidity for certain bonds held by each Fund. In general, when interest rates rise, bond values fall and investors may lose principal value. Interest-rate changes and their impact on each Fund and its share price can be sudden and unpredictable. High-yield securities have a greater risk of default and tend to be more volatile than higher-rated debt securities. The use of derivatives may reduce returns and/or increase volatility. Securities issued by U.S. government agencies or government-sponsored entities may not be guaranteed by the U.S. Treasury. Certain investment strategies tend to increase the total risk of an investment (relative to the broader market). Each Fund is exposed to foreign investment risk, mortgage- and asset-backed securities risk, new fund risk, regulatory risk, and smaller-company investment risk. Consult each Fund’s prospectus for additional information on these and other risks.
Please see footnotes on page 19.
| | | | | | |
| Performance highlights (unaudited) | | Wells Fargo Dynamic Target Date Funds | | | 5 | |
Dynamic Target Today Fund
Average annual total returns (%) as of November 30, 2016
| | | | | | | | | | | | | | | | | | | | | | | | | | |
| | | | | Including sales charge | | | Excluding sales charge | | | Expense ratios1 (%) | |
| | | Inception date | | 1 year | | | Since inception | | | 1 year | | | Since inception | | | Gross | | | Net2 | |
| Class A (WDYAX) | | 11-30-2015 | | | (3.55 | ) | | | (3.55 | ) | | | 2.33 | | | | 2.33 | | | | 5.68 | | | | 0.98 | |
| Class C (WDYCX) | | 11-30-2015 | | | 0.54 | | | | 0.54 | | | | 1.54 | | | | 1.54 | | | | 6.43 | | | | 1.73 | |
| Class R (WDYRX) | | 11-30-2015 | | | – | | | | – | | | | 2.06 | | | | 2.06 | | | | 5.93 | | | | 1.23 | |
| Class R4 (WDYYX) | | 11-30-2015 | | | – | | | | – | | | | 2.60 | | | | 2.60 | | | | 5.40 | | | | 0.67 | |
| Class R6 (WDYZX) | | 11-30-2015 | | | – | | | | – | | | | 2.83 | | | | 2.83 | | | | 5.25 | | | | 0.52 | |
| S&P Target Date Retirement Income Index3 | | – | | | – | | | | – | | | | 3.20 | | | | 3.20 | | | | – | | | | – | |
Figures quoted represent past performance, which is no guarantee of future results, and do not reflect taxes that a shareholder may pay on fund distributions or the redemption of fund shares. Investment return and principal value of an investment will fluctuate so that an investor’s shares, when redeemed, may be worth more or less than their original cost. Performance shown without sales charges would be lower if sales charges were reflected. Current performance may be lower or higher than the performance data quoted and assumes the reinvestment of dividends and capital gains. Current month-end performance is available on the Fund’s website, wellsfargofunds.com.
Index returns do not include transaction costs associated with buying and selling securities, any mutual fund fees or expenses, or any taxes. It is not possible to invest directly in an index.
For Class A shares, the maximum front-end sales charge is 5.75%. For Class C shares, the maximum contingent deferred sales charge is 1.00%. Performance including a contingent deferred sales charge assumes the sales charge for the corresponding time period. Class R, Class R4 and Class R6 shares are sold without a front-end sales charge or contingent deferred sales charge.
Please see footnotes on page 19.
| | | | |
| 6 | | Wells Fargo Dynamic Target Date Funds | | Performance highlights (unaudited) |
Dynamic Target 2015 Fund
Average annual total returns (%) as of November 30, 2016
| | | | | | | | | | | | | | | | | | | | | | | | | | |
| | | | | Including sales charge | | | Excluding sales charge | | | Expense ratios4 (%) | |
| | | Inception date | | 1 year | | | Since inception | | | 1 year | | | Since inception | | | Gross | | | Net2 | |
| Class A (WDTAX) | | 11-30-2015 | | | (3.45 | ) | | | (3.45 | ) | | | 2.44 | | | | 2.44 | | | | 5.69 | | | | 1.00 | |
| Class C (WDTCX) | | 11-30-2015 | | | 0.63 | | | | 0.63 | | | | 1.63 | | | | 1.63 | | | | 6.44 | | | | 1.75 | |
| Class R (WDTRX) | | 11-30-2015 | | | – | | | | – | | | | 2.14 | | | | 2.14 | | | | 5.94 | | | | 1.25 | |
| Class R4 (WDTYX) | | 11-30-2015 | | | – | | | | – | | | | 2.79 | | | | 2.79 | | | | 5.41 | | | | 0.69 | |
| Class R6 (WDTZX) | | 11-30-2015 | | | – | | | | – | | | | 2.92 | | | | 2.92 | | | | 5.26 | | | | 0.54 | |
| S&P Target Date 2015 Index3 | | – | | | – | | | | – | | | | 3.88 | | | | 3.88 | | | | – | | | | – | |
Figures quoted represent past performance, which is no guarantee of future results, and do not reflect taxes that a shareholder may pay on fund distributions or the redemption of fund shares. Investment return and principal value of an investment will fluctuate so that an investor’s shares, when redeemed, may be worth more or less than their original cost. Performance shown without sales charges would be lower if sales charges were reflected. Current performance may be lower or higher than the performance data quoted and assumes the reinvestment of dividends and capital gains. Current month-end performance is available on the Fund’s website, wellsfargofunds.com.
Index returns do not include transaction costs associated with buying and selling securities, any mutual fund fees or expenses, or any taxes. It is not possible to invest directly in an index.
For Class A shares, the maximum front-end sales charge is 5.75%. For Class C shares, the maximum contingent deferred sales charge is 1.00%. Performance including a contingent deferred sales charge assumes the sales charge for the corresponding time period. Class R, Class R4 and Class R6 shares are sold without a front-end sales charge or contingent deferred sales charge.
Please see footnotes on page 19.
| | | | | | |
| Performance highlights (unaudited) | | Wells Fargo Dynamic Target Date Funds | | | 7 | |
Dynamic Target 2020 Fund
Average annual total returns (%) as of November 30, 2016
| | | | | | | | | | | | | | | | | | | | | | | | | | |
| | | | | Including sales charge | | | Excluding sales charge | | | Expense ratios5 (%) | |
| | | Inception date | | 1 year | | | Since inception | | | 1 year | | | Since inception | | | Gross | | | Net2 | |
| Class A (WDTDX) | | 11-30-2015 | | | (2.96 | ) | | | (2.96 | ) | | | 2.96 | | | | 2.96 | | | | 5.71 | | | | 1.02 | |
| Class C (WDTEX) | | 11-30-2015 | | | 1.12 | | | | 1.12 | | | | 2.12 | | | | 2.12 | | | | 6.46 | | | | 1.77 | |
| Class R (WDTFX) | | 11-30-2015 | | | – | | | | – | | | | 2.67 | | | | 2.67 | | | | 5.96 | | | | 1.27 | |
| Class R4 (WDTGX) | | 11-30-2015 | | | – | | | | – | | | | 3.22 | | | | 3.22 | | | | 5.43 | | | | 0.71 | |
| Class R6 (WDTHX) | | 11-30-2015 | | | – | | | | – | | | | 3.44 | | | | 3.44 | | | | 5.28 | | | | 0.56 | |
| S&P Target Date 2020 Index3 | | – | | | – | | | | – | | | | 4.16 | | | | 4.16 | | | | – | | | | – | |
Figures quoted represent past performance, which is no guarantee of future results, and do not reflect taxes that a shareholder may pay on fund distributions or the redemption of fund shares. Investment return and principal value of an investment will fluctuate so that an investor’s shares, when redeemed, may be worth more or less than their original cost. Performance shown without sales charges would be lower if sales charges were reflected. Current performance may be lower or higher than the performance data quoted and assumes the reinvestment of dividends and capital gains. Current month-end performance is available on the Fund’s website, wellsfargofunds.com.
Index returns do not include transaction costs associated with buying and selling securities, any mutual fund fees or expenses, or any taxes. It is not possible to invest directly in an index.
For Class A shares, the maximum front-end sales charge is 5.75%. For Class C shares, the maximum contingent deferred sales charge is 1.00%. Performance including a contingent deferred sales charge assumes the sales charge for the corresponding time period. Class R, Class R4 and Class R6 shares are sold without a front-end sales charge or contingent deferred sales charge.
Please see footnotes on page 19.
| | | | |
| 8 | | Wells Fargo Dynamic Target Date Funds | | Performance highlights (unaudited) |
Dynamic Target 2025 Fund
Average annual total returns (%) as of November 30, 2016
| | | | | | | | | | | | | | | | | | | | | | | | | | |
| | | | | Including sales charge | | | Excluding sales charge | | | Expense ratios6 (%) | |
| | | Inception date | | 1 year | | | Since inception | | | 1 year | | | Since inception | | | Gross | | | Net2 | |
| Class A (WDTIX) | | 11-30-2015 | | | (3.07 | ) | | | (3.07 | ) | | | 2.84 | | | | 2.84 | | | | 5.75 | | | | 1.04 | |
| Class C (WDTJX) | | 11-30-2015 | | | 1.07 | | | | 1.07 | | | | 2.07 | | | | 2.07 | | | | 6.50 | | | | 1.79 | |
| Class R (WDTKX) | | 11-30-2015 | | | – | | | | – | | | | 2.62 | | | | 2.62 | | | | 6.00 | | | | 1.29 | |
| Class R4 (WDTLX) | | 11-30-2015 | | | – | | | | – | | | | 3.17 | | | | 3.17 | | | | 5.47 | | | | 0.73 | |
| Class R6 (WDTMX) | | 11-30-2015 | | | – | | | | – | | | | 3.29 | | | | 3.29 | | | | 5.32 | | | | 0.58 | |
| S&P Target Date 2025 Index3 | | – | | | – | | | | – | | | | 4.42 | | | | 4.42 | | | | – | | | | – | |
Figures quoted represent past performance, which is no guarantee of future results, and do not reflect taxes that a shareholder may pay on fund distributions or the redemption of fund shares. Investment return and principal value of an investment will fluctuate so that an investor’s shares, when redeemed, may be worth more or less than their original cost. Performance shown without sales charges would be lower if sales charges were reflected. Current performance may be lower or higher than the performance data quoted and assumes the reinvestment of dividends and capital gains. Current month-end performance is available on the Fund’s website, wellsfargofunds.com.
Index returns do not include transaction costs associated with buying and selling securities, any mutual fund fees or expenses, or any taxes. It is not possible to invest directly in an index.
For Class A shares, the maximum front-end sales charge is 5.75%. For Class C shares, the maximum contingent deferred sales charge is 1.00%. Performance including a contingent deferred sales charge assumes the sales charge for the corresponding time period. Class R, Class R4 and Class R6 shares are sold without a front-end sales charge or contingent deferred sales charge.
Please see footnotes on page 19.
| | | | | | |
| Performance highlights (unaudited) | | Wells Fargo Dynamic Target Date Funds | | | 9 | |
Dynamic Target 2030 Fund
Average annual total returns (%) as of November 30, 2016
| | | | | | | | | | | | | | | | | | | | | | | | | | |
| | | | | Including sales charge | | | Excluding sales charge | | | Expense ratios7 (%) | |
| | | Inception date | | 1 year | | | Since inception | | | 1 year | | | Since inception | | | Gross | | | Net2 | |
| Class A (WDTNX) | | 11-30-2015 | | | (3.04 | ) | | | (3.04 | ) | | | 2.87 | | | | 2.87 | | | | 5.80 | | | | 1.06 | |
| Class C (WDTOX) | | 11-30-2015 | | | 1.11 | | | | 1.11 | | | | 2.11 | | | | 2.11 | | | | 6.55 | | | | 1.81 | |
| Class R (WDTPX) | | 11-30-2015 | | | – | | | | – | | | | 2.66 | | | | 2.66 | | | | 6.05 | | | | 1.31 | |
| Class R4 (WDTQX) | | 11-30-2015 | | | – | | | | – | | | | 3.22 | | | | 3.22 | | | | 5.52 | | | | 0.75 | |
| Class R6 (WDTSX) | | 11-30-2015 | | | – | | | | – | | | | 3.43 | | | | 3.43 | | | | 5.37 | | | | 0.60 | |
| S&P Target Date 2030 Index3 | | – | | | – | | | | – | | | | 4.64 | | | | 4.64 | | | | – | | | | – | |
Figures quoted represent past performance, which is no guarantee of future results, and do not reflect taxes that a shareholder may pay on fund distributions or the redemption of fund shares. Investment return and principal value of an investment will fluctuate so that an investor’s shares, when redeemed, may be worth more or less than their original cost. Performance shown without sales charges would be lower if sales charges were reflected. Current performance may be lower or higher than the performance data quoted and assumes the reinvestment of dividends and capital gains. Current month-end performance is available on the Fund’s website, wellsfargofunds.com.
Index returns do not include transaction costs associated with buying and selling securities, any mutual fund fees or expenses, or any taxes. It is not possible to invest directly in an index.
For Class A shares, the maximum front-end sales charge is 5.75%. For Class C shares, the maximum contingent deferred sales charge is 1.00%. Performance including a contingent deferred sales charge assumes the sales charge for the corresponding time period. Class R, Class R4 and Class R6 shares are sold without a front-end sales charge or contingent deferred sales charge.
Please see footnotes on page 19.
| | | | |
| 10 | | Wells Fargo Dynamic Target Date Funds | | Performance highlights (unaudited) |
Dynamic Target 2035 Fund
Average annual total returns (%) as of November 30, 2016
| | | | | | | | | | | | | | | | | | | | | | | | | | |
| | | | | Including sales charge | | | Excluding sales charge | | | Expense ratios8 (%) | |
| | | Inception date | | 1 year | | | Since inception | | | 1 year | | | Since inception | | | Gross | | | Net2 | |
| Class A (WDTTX) | | 11-30-2015 | | | (2.92 | ) | | | (2.92 | ) | | | 3.00 | | | | 3.00 | | | | 5.84 | | | | 1.07 | |
| Class C (WDCTX) | | 11-30-2015 | | | 1.24 | | | | 1.24 | | | | 2.24 | | | | 2.24 | | | | 6.59 | | | | 1.82 | |
| Class R (WDTUX) | | 11-30-2015 | | | – | | | | – | | | | 2.69 | | | | 2.69 | | | | 6.09 | | | | 1.32 | |
| Class R4 (WDTVX) | | 11-30-2015 | | | – | | | | – | | | | 3.24 | | | | 3.24 | | | | 5.56 | | | | 0.76 | |
| Class R6 (WDTWX) | | 11-30-2015 | | | – | | | | – | | | | 3.46 | | | | 3.46 | | | | 5.41 | | | | 0.61 | |
| S&P Target Date 2035 Index3 | | – | | | – | | | | – | | | | 4.85 | | | | 4.85 | | | | – | | | | – | |
Figures quoted represent past performance, which is no guarantee of future results, and do not reflect taxes that a shareholder may pay on fund distributions or the redemption of fund shares. Investment return and principal value of an investment will fluctuate so that an investor’s shares, when redeemed, may be worth more or less than their original cost. Performance shown without sales charges would be lower if sales charges were reflected. Current performance may be lower or higher than the performance data quoted and assumes the reinvestment of dividends and capital gains. Current month-end performance is available on the Fund’s website, wellsfargofunds.com.
Index returns do not include transaction costs associated with buying and selling securities, any mutual fund fees or expenses, or any taxes. It is not possible to invest directly in an index.
For Class A shares, the maximum front-end sales charge is 5.75%. For Class C shares, the maximum contingent deferred sales charge is 1.00%. Performance including a contingent deferred sales charge assumes the sales charge for the corresponding time period. Class R, Class R4 and Class R6 shares are sold without a front-end sales charge or contingent deferred sales charge.
Please see footnotes on page 19.
| | | | | | |
| Performance highlights (unaudited) | | Wells Fargo Dynamic Target Date Funds | | | 11 | |
Dynamic Target 2040 Fund
Average annual total returns (%) as of November 30, 2016
| | | | | | | | | | | | | | | | | | | | | | | | | | |
| | | | | Including sales charge | | | Excluding sales charge | | | Expense ratios8 (%) | |
| | | Inception date | | 1 year | | | Since inception | | | 1 year | | | Since inception | | | Gross | | | Net2 | |
| Class A (WTDAX) | | 11-30-2015 | | | (3.09 | ) | | | (3.09 | ) | | | 2.83 | | | | 2.83 | | | | 5.86 | | | | 1.08 | |
| Class C (WTDCX) | | 11-30-2015 | | | 1.17 | | | | 1.17 | | | | 2.17 | | | | 2.17 | | | | 6.61 | | | | 1.83 | |
| Class R (WTDDX) | | 11-30-2015 | | | – | | | | – | | | | 2.62 | | | | 2.62 | | | | 6.11 | | | | 1.33 | |
| Class R4 (WTDEX) | | 11-30-2015 | | | – | | | | – | | | | 3.27 | | | | 3.27 | | | | 5.58 | | | | 0.77 | |
| Class R6 (WTDFX) | | 11-30-2015 | | | – | | | | – | | | | 3.39 | | | | 3.39 | | | | 5.43 | | | | 0.62 | |
| S&P Target Date 2040 Index3 | | – | | | – | | | | – | | | | 5.01 | | | | 5.01 | | | | – | | | | – | |
Figures quoted represent past performance, which is no guarantee of future results, and do not reflect taxes that a shareholder may pay on fund distributions or the redemption of fund shares. Investment return and principal value of an investment will fluctuate so that an investor’s shares, when redeemed, may be worth more or less than their original cost. Performance shown without sales charges would be lower if sales charges were reflected. Current performance may be lower or higher than the performance data quoted and assumes the reinvestment of dividends and capital gains. Current month-end performance is available on the Fund’s website, wellsfargofunds.com.
Index returns do not include transaction costs associated with buying and selling securities, any mutual fund fees or expenses, or any taxes. It is not possible to invest directly in an index.
For Class A shares, the maximum front-end sales charge is 5.75%. For Class C shares, the maximum contingent deferred sales charge is 1.00%. Performance including a contingent deferred sales charge assumes the sales charge for the corresponding time period. Class R, Class R4 and Class R6 shares are sold without a front-end sales charge or contingent deferred sales charge.
Please see footnotes on page 19.
| | | | |
| 12 | | Wells Fargo Dynamic Target Date Funds | | Performance highlights (unaudited) |
Dynamic Target 2045 Fund
Average annual total returns (%) as of November 30, 2016
| | | | | | | | | | | | | | | | | | | | | | | | | | |
| | | | | Including sales charge | | | Excluding sales charge | | | Expense ratios9 (%) | |
| | | Inception date | | 1 year | | | Since inception | | | 1 year | | | Since inception | | | Gross | | | Net2 | |
| Class A (WTDGX) | | 11-30-2015 | | | (2.80 | ) | | | (2.80 | ) | | | 3.13 | | | | 3.13 | | | | 5.89 | | | | 1.08 | |
| Class C (WTDHX) | | 11-30-2015 | | | 1.37 | | | | 1.37 | | | | 2.37 | | | | 2.37 | | | | 6.64 | | | | 1.83 | |
| Class R (WTDIX) | | 11-30-2015 | | | – | | | | – | | | | 2.92 | | | | 2.92 | | | | 6.14 | | | | 1.33 | |
| Class R4 (WTDJX) | | 11-30-2015 | | | – | | | | – | | | | 3.48 | | | | 3.48 | | | | 5.61 | | | | 0.77 | |
| Class R6 (WTDKX) | | 11-30-2015 | | | – | | | | – | | | | 3.59 | | | | 3.59 | | | | 5.46 | | | | 0.62 | |
| S&P Target Date 2045 Index3 | | – | | | – | | | | – | | | | 5.15 | | | | 5.15 | | | | – | | | | – | |
Figures quoted represent past performance, which is no guarantee of future results, and do not reflect taxes that a shareholder may pay on fund distributions or the redemption of fund shares. Investment return and principal value of an investment will fluctuate so that an investor’s shares, when redeemed, may be worth more or less than their original cost. Performance shown without sales charges would be lower if sales charges were reflected. Current performance may be lower or higher than the performance data quoted and assumes the reinvestment of dividends and capital gains. Current month-end performance is available on the Fund’s website, wellsfargofunds.com.
Index returns do not include transaction costs associated with buying and selling securities, any mutual fund fees or expenses, or any taxes. It is not possible to invest directly in an index.
For Class A shares, the maximum front-end sales charge is 5.75%. For Class C shares, the maximum contingent deferred sales charge is 1.00%. Performance including a contingent deferred sales charge assumes the sales charge for the corresponding time period. Class R, Class R4 and Class R6 shares are sold without a front-end sales charge or contingent deferred sales charge.
Please see footnotes on page 19.
| | | | | | |
| Performance highlights (unaudited) | | Wells Fargo Dynamic Target Date Funds | | | 13 | |
Dynamic Target 2050 Fund
Average annual total returns (%) as of November 30, 2016
| | | | | | | | | | | | | | | | | | | | | | | | | | |
| | | | | Including sales charge | | | Excluding sales charge | | | Expense ratios9 (%) | |
| | | Inception date | | 1 year | | | Since inception | | | 1 year | | | Since inception | | | Gross | | | Net2 | |
| Class A (WTDLX) | | 11-30-2015 | | | (2.78 | ) | | | (2.78 | ) | | | 3.15 | | | | 3.15 | | | | 5.79 | | | | 1.08 | |
| Class C (WTDMX) | | 11-30-2015 | | | 1.37 | | | | 1.37 | | | | 2.37 | | | | 2.37 | | | | 6.54 | | | | 1.83 | |
| Class R (WTDNX) | | 11-30-2015 | | | – | | | | – | | | | 2.92 | | | | 2.92 | | | | 6.04 | | | | 1.33 | |
| Class R4 (WTDOX) | | 11-30-2015 | | | – | | | | – | | | | 3.48 | | | | 3.48 | | | | 5.51 | | | | 0.77 | |
| Class R6 (WTDPX) | | 11-30-2015 | | | – | | | | – | | | | 3.59 | | | | 3.59 | | | | 5.36 | | | | 0.62 | |
| S&P Target Date 2050 Index3 | | – | | | – | | | | – | | | | 5.21 | | | | 5.21 | | | | – | | | | – | |
Figures quoted represent past performance, which is no guarantee of future results, and do not reflect taxes that a shareholder may pay on fund distributions or the redemption of fund shares. Investment return and principal value of an investment will fluctuate so that an investor’s shares, when redeemed, may be worth more or less than their original cost. Performance shown without sales charges would be lower if sales charges were reflected. Current performance may be lower or higher than the performance data quoted and assumes the reinvestment of dividends and capital gains. Current month-end performance is available on the Fund’s website, wellsfargofunds.com.
Index returns do not include transaction costs associated with buying and selling securities, any mutual fund fees or expenses, or any taxes. It is not possible to invest directly in an index.
For Class A shares, the maximum front-end sales charge is 5.75%. For Class C shares, the maximum contingent deferred sales charge is 1.00%. Performance including a contingent deferred sales charge assumes the sales charge for the corresponding time period. Class R, Class R4 and Class R6 shares are sold without a front-end sales charge or contingent deferred sales charge.
Please see footnotes on page 19.
| | | | |
| 14 | | Wells Fargo Dynamic Target Date Funds | | Performance highlights (unaudited) |
Dynamic Target 2055 Fund
Average annual total returns (%) as of November 30, 2016
| | | | | | | | | | | | | | | | | | | | | | | | | | |
| | | | | Including sales charge | | | Excluding sales charge | | | Expense ratios9 (%) | |
| | | Inception date | | 1 year | | | Since inception | | | 1 year | | | Since inception | | | Gross | | | Net2 | |
| Class A (WTDQX) | | 11-30-2015 | | | (2.78 | ) | | | (2.78 | ) | | | 3.15 | | | | 3.15 | | | | 5.77 | | | | 1.08 | |
| Class C (WTDRX) | | 11-30-2015 | | | 1.37 | | | | 1.37 | | | | 2.37 | | | | 2.37 | | | | 6.52 | | | | 1.83 | |
| Class R (WTDSX) | | 11-30-2015 | | | – | | | | – | | | | 2.92 | | | | 2.92 | | | | 6.02 | | | | 1.33 | |
| Class R4 (WTDTX) | | 11-30-2015 | | | – | | | | – | | | | 3.48 | | | | 3.48 | | | | 5.49 | | | | 0.77 | |
| Class R6 (WTDUX) | | 11-30-2015 | | | – | | | | – | | | | 3.59 | | | | 3.59 | | | | 5.34 | | | | 0.62 | |
| S&P Target Date 2055+ Index3 | | – | | | – | | | | – | | | | 5.30 | | | | 5.30 | | | | – | | | | – | |
Figures quoted represent past performance, which is no guarantee of future results, and do not reflect taxes that a shareholder may pay on fund distributions or the redemption of fund shares. Investment return and principal value of an investment will fluctuate so that an investor’s shares, when redeemed, may be worth more or less than their original cost. Performance shown without sales charges would be lower if sales charges were reflected. Current performance may be lower or higher than the performance data quoted and assumes the reinvestment of dividends and capital gains. Current month-end performance is available on the Fund’s website, wellsfargofunds.com.
Index returns do not include transaction costs associated with buying and selling securities, any mutual fund fees or expenses, or any taxes. It is not possible to invest directly in an index.
For Class A shares, the maximum front-end sales charge is 5.75%. For Class C shares, the maximum contingent deferred sales charge is 1.00%. Performance including a contingent deferred sales charge assumes the sales charge for the corresponding time period. Class R, Class R4 and Class R6 shares are sold without a front-end sales charge or contingent deferred sales charge.
Please see footnotes on page 19.
| | | | | | |
| Performance highlights (unaudited) | | Wells Fargo Dynamic Target Date Funds | | | 15 | |
Dynamic Target 2060 Fund
Average annual total returns (%) as of November 30, 2016
| | | | | | | | | | | | | | | | | | | | | | | | | | |
| | | | | Including sales charge | | | Excluding sales charge | | | Expense ratios9 (%) | |
| | | Inception date | | 1 year | | | Since inception | | | 1 year | | | Since inception | | | Gross | | | Net2 | |
| Class A (WTDVX) | | 11-30-2015 | | | (2.69 | ) | | | (2.69 | ) | | | 3.25 | | | | 3.25 | | | | 5.78 | | | | 1.08 | |
| Class C (WTDWX) | | 11-30-2015 | | | 1.47 | | | | 1.47 | | | | 2.47 | | | | 2.47 | | | | 6.53 | | | | 1.83 | |
| Class R (WTDYX) | | 11-30-2015 | | | – | | | | – | | | | 3.03 | | | | 3.03 | | | | 6.03 | | | | 1.33 | |
| Class R4 (WTDZX) | | 11-30-2015 | | | – | | | | – | | | | 3.58 | | | | 3.58 | | | | 5.50 | | | | 0.77 | |
| Class R6 (WTSZX) | | 11-30-2015 | | | – | | | | – | | | | 3.79 | | | | 3.79 | | | | 5.35 | | | | 0.62 | |
| S&P Target Date 2055+ Index3 | | – | | | – | | | | – | | | | 5.30 | | | | 5.30 | | | | – | | | | – | |
Figures quoted represent past performance, which is no guarantee of future results, and do not reflect taxes that a shareholder may pay on fund distributions or the redemption of fund shares. Investment return and principal value of an investment will fluctuate so that an investor’s shares, when redeemed, may be worth more or less than their original cost. Performance shown without sales charges would be lower if sales charges were reflected. Current performance may be lower or higher than the performance data quoted and assumes the reinvestment of dividends and capital gains. Current month-end performance is available on the Fund’s website, wellsfargofunds.com.
Index returns do not include transaction costs associated with buying and selling securities, any mutual fund fees or expenses, or any taxes. It is not possible to invest directly in an index.
For Class A shares, the maximum front-end sales charge is 5.75%. For Class C shares, the maximum contingent deferred sales charge is 1.00%. Performance including a contingent deferred sales charge assumes the sales charge for the corresponding time period. Class R, Class R4 and Class R6 shares are sold without a front-end sales charge or contingent deferred sales charge.
Please see footnotes on page 19.
| | | | |
| 16 | | Wells Fargo Dynamic Target Date Funds | | Performance highlights (unaudited) |
Ten largest holdings (%) as of November 30, 201610
| | | | | | | | | | |
| Dynamic Target Today Fund | | | | | Dynamic Target 2015 Fund | | | |
Wells Fargo Core Bond Portfolio | | | 12.91 | | | Schwab U.S. Broad Market ETF | | | 13.24 | |
Schwab U.S. Aggregate Bond ETF | | | 10.76 | | | Wells Fargo Core Bond Portfolio | | | 9.61 | |
Wells Fargo Short-Term Bond Fund Institutional Class | | | 9.91 | | | Schwab U.S. Aggregate Bond ETF | | | 8.00 | |
Wells Fargo Strategic Income Fund Institutional Class | | | 9.85 | | | Wells Fargo Short-Term Bond Fund Institutional Class | | | 7.36 | |
Schwab U.S. Broad Market ETF | | | 9.32 | | | Wells Fargo Strategic Income Fund Institutional Class | | | 7.31 | |
Wells Fargo Real Return Portfolio | | | 5.41 | | | Wells Fargo Diversified International Fund Class R6 | | | 6.31 | |
Wells Fargo International Bond Fund Class R6 | | | 5.13 | | | Schwab International Equity ETF | | | 5.34 | |
Calamos Market Neutral Income Fund Class I | | | 5.06 | | | Calamos Market Neutral Income Fund Class I | | | 5.05 | |
Wells Fargo Diversified International Fund Class R6 | | | 4.47 | | | Wells Fargo Real Return Portfolio | | | 4.03 | |
Schwab International Equity ETF | | | 3.78 | | | Wells Fargo International Bond Fund Class R6 | | | 3.85 | |
| | | | | | | | | | |
| Dynamic Target 2020 Fund | | | | | Dynamic Target 2025 Fund | | | |
Schwab U.S. Broad Market ETF | | | 15.73 | | | Schwab U.S. Broad Market ETF | | | 18.14 | |
Wells Fargo Core Bond Portfolio | | | 7.52 | | | Wells Fargo Diversified International Fund Class R6 | | | 8.64 | |
Wells Fargo Diversified International Fund Class R6 | | | 7.51 | | | Schwab International Equity ETF | | | 7.33 | |
Schwab International Equity ETF | | | 6.36 | | | Calamos Market Neutral Income Fund Class I | | | 5.01 | |
Schwab U.S. Aggregate Bond ETF | | | 6.28 | | | Wells Fargo Premier Large Company Growth Fund Class R6 | | | 4.75 | |
Wells Fargo Short-Term Bond Fund Institutional Class | | | 5.75 | | | Wells Fargo Endeavor Select Fund Institutional Class | | | 4.75 | |
Wells Fargo Strategic Income Fund Institutional Class | | | 5.72 | | | Schwab U.S. Aggregate Bond ETF | | | 4.70 | |
Calamos Market Neutral Income Fund Class I | | | 5.03 | | | Wells Fargo Short-Term Bond Fund Institutional Class | | | 4.30 | |
Wells Fargo Endeavor Select Fund Institutional Class | | | 4.12 | | | Wells Fargo Strategic Income Fund Institutional Class | | | 4.27 | |
Wells Fargo Premier Large Company Growth Fund Class R6 | | | 4.10 | | | Wells Fargo Emerging Markets Equity Income Fund Class R6 | | | 3.90 | |
| | | | | | | | | | |
| Dynamic Target 2030 Fund | | | | | Dynamic Target 2035 Fund | | | |
Schwab U.S. Broad Market ETF | | | 20.38 | | | Schwab U.S. Broad Market ETF | | | 22.15 | |
Wells Fargo Diversified International Fund Class R6 | | | 9.72 | | | Wells Fargo Diversified International Fund Class R6 | | | 10.52 | |
Schwab International Equity ETF | | | 8.25 | | | Schwab International Equity ETF | | | 8.91 | |
Wells Fargo Premier Large Company Growth Fund Class R6 | | | 5.33 | | | Wells Fargo Endeavor Select Fund Institutional Class | | | 5.78 | |
Wells Fargo Endeavor Select Fund Institutional Class | | | 5.32 | | | Wells Fargo Premier Large Company Growth Fund Class R6 | | | 5.76 | |
Calamos Market Neutral Income Fund Class I | | | 4.97 | | | Calamos Market Neutral Income Fund Class I | | | 5.00 | |
Wells Fargo Emerging Markets Equity Income Fund Class R6 | | | 4.43 | | | Wells Fargo Emerging Markets Equity Income Fund Class R6 | | | 7.75 | |
Wells Fargo Special Mid Cap Value Fund Class R6 | | | 4.04 | | | Wells Fargo Special Mid Cap Value Fund Class R6 | | | 4.38 | |
Wells Fargo Enterprise Fund Class R6 | | | 3.90 | | | Wells Fargo Enterprise Fund Class R6 | | | 4.23 | |
Wells Fargo Intrinsic Value Fund Class R6 | | | 3.66 | | | Wells Fargo Intrinsic Value Fund Class R6 | | | 3.97 | |
Please see footnotes on page 19.
| | | | | | |
| Performance highlights (unaudited) | | Wells Fargo Dynamic Target Date Funds | | | 17 | |
| | | | | | | | | | |
| Dynamic Target 2040 Fund | | | | | Dynamic Target 2045 Fund | | | |
Schwab U.S. Broad Market ETF | | | 22.96 | | | Schwab U.S. Broad Market ETF | | | 23.59 | |
Wells Fargo Diversified International Fund Class R6 | | | 11.13 | | | Wells Fargo Diversified International Fund Class R6 | | | 11.20 | |
Schwab International Equity ETF | | | 9.43 | | | Schwab International Equity ETF | | | 9.48 | |
Wells Fargo Endeavor Select Fund Institutional Class | | | 6.08 | | | Wells Fargo Endeavor Select Fund Institutional Class | | | 6.15 | |
Wells Fargo Premier Large Company Growth Fund Class R6 | | | 6.06 | | | Wells Fargo Premier Large Company Growth Fund Class R6 | | | 6.13 | |
Wells Fargo Emerging Markets Equity Income Fund Class R6 | | | 5.22 | | | Wells Fargo Emerging Markets Equity Income Fund Class R6 | | | 5.06 | |
Calamos Market Neutral Income Fund Class I | | | 4.92 | | | Calamos Market Neutral Income Fund Class I | | | 4.98 | |
Wells Fargo Special Mid Cap Value Fund Class R6 | | | 4.52 | | | Wells Fargo Special Mid Cap Value Fund Class R6 | | | 4.65 | |
Wells Fargo Enterprise Fund Class R6 | | | 4.37 | | | Wells Fargo Enterprise Fund Class R6 | | | 4.49 | |
Wells Fargo Large Company Value Portfolio | | | 4.17 | | | Wells Fargo Large Company Value Portfolio | | | 4.29 | |
| | | | | | | | | | |
| Dynamic Target 2050 Fund | | | | | Dynamic Target 2055 Fund | | | |
Schwab U.S. Broad Market ETF | | | 23.62 | | | Schwab U.S. Broad Market ETF | | | 23.61 | |
Wells Fargo Diversified International Fund Class R6 | | | 11.21 | | | Wells Fargo Diversified International Fund Class R6 | | | 11.21 | |
Schwab International Equity ETF | | | 9.51 | | | Schwab International Equity ETF | | | 9.50 | |
Wells Fargo Endeavor Select Fund Institutional Class | | | 6.16 | | | Wells Fargo Endeavor Select Fund Institutional Class | | | 6.16 | |
Wells Fargo Premier Large Company Growth Fund Class R6 | | | 6.14 | | | Wells Fargo Premier Large Company Growth Fund Class R6 | | | 6.13 | |
Wells Fargo Emerging Markets Equity Income Fund Class R6 | | | 5.07 | | | Wells Fargo Emerging Markets Equity Income Fund Class R6 | | | 5.06 | |
Calamos Market Neutral Income Fund Class I | | | 4.97 | | | Calamos Market Neutral Income Fund Class I | | | 4.98 | |
Wells Fargo Special Mid Cap Value Fund Class R6 | | | 4.66 | | | Wells Fargo Special Mid Cap Value Fund Class R6 | | | 4.66 | |
Wells Fargo Enterprise Fund Class R6 | | | 4.51 | | | Wells Fargo Enterprise Fund Class R6 | | | 4.50 | |
Wells Fargo Large Company Value Portfolio | | | 4.29 | | | Wells Fargo Large Company Value Portfolio | | | 4.29 | |
| | | | |
| Dynamic Target 2060 Fund | | | |
Schwab U.S. Broad Market ETF | | | 23.62 | |
Wells Fargo Diversified International Fund Class R6 | | | 11.21 | |
Schwab International Equity ETF | | | 9.50 | |
Wells Fargo Endeavor Select Fund Institutional Class | | | 6.15 | |
Wells Fargo Premier Large Company Growth Fund Class R6 | | | 6.13 | |
Wells Fargo Emerging Markets Equity Income Fund Class R6 | | | 5.07 | |
Calamos Market Neutral Income Fund Class I | | | 4.97 | |
Wells Fargo Special Mid Cap Value Fund Class R6 | | | 4.66 | |
Wells Fargo Enterprise Fund Class R6 | | | 4.50 | |
Wells Fargo Large Company Value Portfolio | | | 4.29 | |
Please see footnotes on page 19.
| | | | |
| 18 | | Wells Fargo Dynamic Target Date Funds | | Performance highlights (unaudited) |
Allocations as of November 30, 201611
| | | | | | | | | | | | | | | | | | |
| Dynamic Target Today Fund | | Effective
Allocation | | | Strategic
Target
Allocation | | | Dynamic Target 2015 Fund | | Effective
Allocation | | | Strategic
Target
Allocation | |
Equity | | | 36% | | | | 35% | | | Equity | | | 51% | | | | 50% | |
Fixed Income | | | 46% | | | | 50% | | | Fixed Income | | | 34% | | | | 37% | |
Alternative Investments | | | 16% | | | | 15% | | | Alternative Investments | | | 13% | | | | 13% | |
Effective Cash | | | 2% | | | | 0% | | | Effective Cash | | | 2% | | | | 0% | |
| | | | | | | | | | | | | | | | | | |
| Dynamic 2020 Today Fund | | Effective
Allocation | | | Strategic
Target
Allocation | | | Dynamic 2025 Today Fund | | Effective
Allocation | | | Strategic
Target
Allocation | |
Equity | | | 61% | | | | 59% | | | Equity | | | 69% | | | | 68% | |
Fixed Income | | | 26% | | | | 29% | | | Fixed Income | | | 19% | | | | 22% | |
Alternative Investments | | | 11% | | | | 12% | | | Alternative Investments | | | 10% | | | | 10% | |
Effective Cash | | | 2% | | | | 0% | | | Effective Cash | | | 2% | | | | 0% | |
| | | | | | | | | | | | | | | | | | |
| Dynamic 2030 Today Fund | | Effective
Allocation | | | Strategic
Target
Allocation | | | Dynamic 2035 Today Fund | | Effective
Allocation | | | Strategic
Target
Allocation | |
Equity | | | 78% | | | | 77% | | | Equity | | | 85% | | | | 84% | |
Fixed Income | | | 12% | | | | 15% | | | Fixed Income | | | 7% | | | | 10% | |
Alternative Investments | | | 8% | | | | 8% | | | Alternative Investments | | | 6% | | | | 6% | |
Effective Cash | | | 2% | | | | 0% | | | Effective Cash | | | 2% | | | | 0% | |
| | | | | | | | | | | | | | | | | | |
| Dynamic 2040 Today Fund | | Effective
Allocation | | | Strategic
Target
Allocation | | | Dynamic 2045 Today Fund | | Effective
Allocation | | | Strategic
Target
Allocation | |
Equity | | | 88% | | | | 88% | | | Equity | | | 90% | | | | 90% | |
Fixed Income | | | 4% | | | | 6% | | | Fixed Income | | | 2% | | | | 5% | |
Alternative Investments | | | 6% | | | | 6% | | | Alternative Investments | | | 6% | | | | 5% | |
Effective Cash | | | 2% | | | | 0% | | | Effective Cash | | | 2% | | | | 0% | |
| | | | | | | | | | | | | | | | | | |
| Dynamic 2050 Today Fund | | Effective
Allocation | | | Strategic
Target
Allocation | | | Dynamic 2055 Today Fund | | Effective
Allocation | | | Strategic
Target
Allocation | |
Equity | | | 90% | | | | 90% | | | Equity | | | 90% | | | | 90% | |
Fixed Income | | | 2% | | | | 5% | | | Fixed Income | | | 2% | | | | 5% | |
Alternative Investments | | | 6% | | | | 5% | | | Alternative Investments | | | 6% | | | | 5% | |
Effective Cash | | | 2% | | | | 0% | | | Effective Cash | | | 2% | | | | 0% | |
Please see footnotes on page 19.
| | | | | | |
| Performance highlights (unaudited) | | Wells Fargo Dynamic Target Date Funds | | | 19 | |
| | | | | | | | |
| Dynamic 2060 Today Fund | | Effective
Allocation | | | Strategic
Target
Allocation | |
Equity | | | 90% | | | | 90% | |
Fixed Income | | | 2% | | | | 5% | |
Alternative Investments | | | 6% | | | | 5% | |
Effective Cash | | | 2% | | | | 0% | |
| 1 | Reflects the expense ratios as stated in the most recent prospectuses, which include the impact of 0.46% of acquired fund fees and expenses and net expenses from affiliated Master Portfolios. The expense ratios shown are subject to change and may differ from the annualized expense ratios shown in the financial highlights of this report, which do not include acquired fund fees and expenses and net expenses from affiliated Master Portfolios. |
| 2 | The manager has committed through September 30, 2017, to waive fees and/or reimburse expenses to the extent necessary to cap the Fund’s Total Annual Fund Operating Expenses After Fee Waiver, excluding certain expenses, at the amounts shown. After this time, the cap may be increased or the commitment to maintain the cap may be terminated only with the approval of the Board of Trustees. Brokerage commissions, stamp duty fees, interest, taxes, acquired money market fund fees and expenses (if any) and extraordinary expenses are excluded from the cap. All other acquired fund fees and expenses and net expenses from the affiliated Master Portfolios are included in the expense cap. Without this cap, the Fund’s returns would have been lower. |
| 3 | The S&P Target Date Indexes (each, an index, or collectively, the indexes) are a series of indexes designed as benchmarks for multi-asset class portfolios with risk profiles that become more conservative over time, each corresponding to a target retirement date. The index series reflects the market consensus for asset allocations for different target date horizons. In particular, each index is representative of the investment opportunity available to investors for the corresponding target date horizon, with asset class exposures driven by a survey of available target date funds for that horizon. The index returns include hypothetical back-tested performance. You cannot invest directly in an index. |
| 4 | Reflects the expense ratios as stated in the most recent prospectuses, which include the impact of 0.48% of acquired fund fees and expenses and net expenses from affiliated Master Portfolios. The expense ratios shown are subject to change and may differ from the annualized expense ratios shown in the financial highlights of this report, which do not include acquired fund fees and expenses and net expenses from affiliated Master Portfolios. |
| 5 | Reflects the expense ratios as stated in the most recent prospectuses, which include the impact of 0.49% of acquired fund fees and expenses and net expenses from affiliated Master Portfolios. The expense ratios shown are subject to change and may differ from the annualized expense ratios shown in the financial highlights of this report, which do not include acquired fund fees and expenses and net expenses from affiliated Master Portfolios. |
| 6 | Reflects the expense ratios as stated in the most recent prospectuses, which include the impact of 0.50% of acquired fund fees and expenses and net expenses from affiliated Master Portfolios. The expense ratios shown are subject to change and may differ from the annualized expense ratios shown in the financial highlights of this report, which do not include acquired fund fees and expenses and net expenses from affiliated Master Portfolios. |
| 7 | Reflects the expense ratios as stated in the most recent prospectuses, which include the impact of 0.52% of acquired fund fees and expenses and net expenses from affiliated Master Portfolios. The expense ratios shown are subject to change and may differ from the annualized expense ratios shown in the financial highlights of this report, which do not include acquired fund fees and expenses and net expenses from affiliated Master Portfolios. |
| 8 | Reflects the expense ratios as stated in the most recent prospectuses, which include the impact of 0.53% of acquired fund fees and expenses and net expenses from affiliated Master Portfolios. The expense ratios shown are subject to change and may differ from the annualized expense ratios shown in the financial highlights of this report, which do not include acquired fund fees and expenses and net expenses from affiliated Master Portfolios. |
| 9 | Reflects the expense ratios as stated in the most recent prospectuses, which include the impact of 0.54% of acquired fund fees and expenses and net expenses from affiliated Master Portfolios. The expense ratios shown are subject to change and may differ from the annualized expense ratios shown in the financial highlights of this report, which do not include acquired fund fees and expenses and net expenses from affiliated Master Portfolios. |
| 10 | The ten largest holdings, excluding cash and cash equivalents, are calculated based on the value of the investments divided by total net assets of the Fund. Holdings are subject to change and may have changed since the date specified. |
| 11 | The effective allocation includes the effect of any tactical futures overlay that may be in place. Effective cash is comprised of the net impact of long and/or short futures contracts held as part of dynamic risk management strategy. The amounts are subject to change and may have changed since the date specified. |
| | | | |
| 20 | | Wells Fargo Dynamic Target Date Funds | | Fund expenses (unaudited) |
As a shareholder of the Fund, you incur two types of costs: (1) transaction costs, including sales charges (loads) on purchase payments and contingent deferred sales charges (if any) on redemptions and (2) ongoing costs, including management fees, distribution (12b-1) and/or shareholder servicing fees, and other Fund expenses. This example is intended to help you understand your ongoing costs (in dollars) of investing in the Fund and to compare these costs with the ongoing costs of investing in other mutual funds.
The example is based on an investment of $1,000 invested at the beginning of the six-month period and held for the entire period from June 1, 2016 to November 30, 2016.
Actual expenses
The “Actual” line of the table below provides information about actual account values and actual expenses. You may use the information in this line, together with the amount you invested, to estimate the expenses that you paid over the period. Simply divide your account value by $1,000 (for example, an $8,600 account value divided by $1,000 = 8.6), then multiply the result by the number in the “Actual” line under the heading entitled “Expenses paid during period” for your applicable class of shares to estimate the expenses you paid on your account during this period.
Hypothetical example for comparison purposes
The “Hypothetical” line of the table below provides information about hypothetical account values and hypothetical expenses based on the Fund’s actual expense ratio and an assumed rate of return of 5% per year before expenses, which is not the Fund’s actual return. The hypothetical account values and expenses may not be used to estimate the actual ending account balance or expenses you paid for the period. You may use this information to compare the ongoing costs of investing in the Fund and other funds. To do so, compare this 5% hypothetical example with the 5% hypothetical examples that appear in the shareholder reports of the other funds.
Please note that the expenses shown in the table are meant to highlight your ongoing costs only and do not reflect any transactional costs, such as sales charges (loads) and contingent deferred sales charges. Therefore, the “Hypothetical” line of the table is useful in comparing ongoing costs only and will not help you determine the relative total costs of owning different funds. In addition, if these transactional costs were included, your costs would have been higher.
| | | | | | | | | | | | | | | | |
| Dynamic Target Today Fund | | Beginning
account value
6-1-2016 | | | Ending
account value
11-30-2016 | | | Expenses
paid during
the period¹ | | | Annualized net
expense ratio | |
Class A | | | | | | | | | | | | | | | | |
Actual | | $ | 1,000.00 | | | $ | 1,015.73 | | | $ | 2.67 | | | | 0.53 | % |
Hypothetical (5% return before expenses) | | $ | 1,000.00 | | | $ | 1,022.35 | | | $ | 2.68 | | | | 0.53 | % |
Class C | | | | | | | | | | | | | | | | |
Actual | | $ | 1,000.00 | | | $ | 1,011.60 | | | $ | 6.44 | | | | 1.28 | % |
Hypothetical (5% return before expenses) | | $ | 1,000.00 | | | $ | 1,018.60 | | | $ | 6.46 | | | | 1.28 | % |
Class R | | | | | | | | | | | | | | | | |
Actual | | $ | 1,000.00 | | | $ | 1,014.22 | | | $ | 3.88 | | | | 0.77 | % |
Hypothetical (5% return before expenses) | | $ | 1,000.00 | | | $ | 1,021.15 | | | $ | 3.89 | | | | 0.77 | % |
Class R4 | | | | | | | | | | | | | | | | |
Actual | | $ | 1,000.00 | | | $ | 1,016.09 | | | $ | 1.11 | | | | 0.22 | % |
Hypothetical (5% return before expenses) | | $ | 1,000.00 | | | $ | 1,023.90 | | | $ | 1.11 | | | | 0.22 | % |
Class R6 | | | | | | | | | | | | | | | | |
Actual | | $ | 1,000.00 | | | $ | 1,018.20 | | | $ | 0.35 | | | | 0.07 | % |
Hypothetical (5% return before expenses) | | $ | 1,000.00 | | | $ | 1,024.65 | | | $ | 0.35 | | | | 0.07 | % |
Please see footnote on page 24.
| | | | | | |
| Fund expenses (unaudited) | | Wells Fargo Dynamic Target Date Funds | | | 21 | |
| | | | | | | | | | | | | | | | |
| Dynamic Target 2015 Fund | | Beginning
account value
6-1-2016 | | | Ending
account value
11-30-2016 | | | Expenses
paid during
the period¹ | | | Annualized net
expense ratio | |
Class A | | | | | | | | | | | | | | | | |
Actual | | $ | 1,000.00 | | | $ | 1,021.94 | | | $ | 2.68 | | | | 0.53 | % |
Hypothetical (5% return before expenses) | | $ | 1,000.00 | | | $ | 1,022.35 | | | $ | 2.68 | | | | 0.53 | % |
Class C | | | | | | | | | | | | | | | | |
Actual | | $ | 1,000.00 | | | $ | 1,017.63 | | | $ | 6.46 | | | | 1.28 | % |
Hypothetical (5% return before expenses) | | $ | 1,000.00 | | | $ | 1,018.60 | | | $ | 6.46 | | | | 1.28 | % |
Class R | | | | | | | | | | | | | | | | |
Actual | | $ | 1,000.00 | | | $ | 1,020.27 | | | $ | 3.84 | | | | 0.76 | % |
Hypothetical (5% return before expenses) | | $ | 1,000.00 | | | $ | 1,021.20 | | | $ | 3.84 | | | | 0.76 | % |
Class R4 | | | | | | | | | | | | | | | | |
Actual | | $ | 1,000.00 | | | $ | 1,024.14 | | | $ | 1.11 | | | | 0.22 | % |
Hypothetical (5% return before expenses) | | $ | 1,000.00 | | | $ | 1,023.90 | | | $ | 1.11 | | | | 0.22 | % |
Class R6 | | | | | | | | | | | | | | | | |
Actual | | $ | 1,000.00 | | | $ | 1,024.23 | | | $ | 0.30 | | | | 0.06 | % |
Hypothetical (5% return before expenses) | | $ | 1,000.00 | | | $ | 1,024.70 | | | $ | 0.30 | | | | 0.06 | % |
| Dynamic Target 2020 Fund | | | | | | | | | | | | |
Class A | | | | | | | | | | | | | | | | |
Actual | | $ | 1,000.00 | | | $ | 1,027.05 | | | $ | 2.69 | | | | 0.53 | % |
Hypothetical (5% return before expenses) | | $ | 1,000.00 | | | $ | 1,022.35 | | | $ | 2.68 | | | | 0.53 | % |
Class C | | | | | | | | | | | | | | | | |
Actual | | $ | 1,000.00 | | | $ | 1,022.11 | | | $ | 6.52 | | | | 1.29 | % |
Hypothetical (5% return before expenses) | | $ | 1,000.00 | | | $ | 1,018.55 | | | $ | 6.51 | | | | 1.29 | % |
Class R | | | | | | | | | | | | | | | | |
Actual | | $ | 1,000.00 | | | $ | 1,025.08 | | | $ | 3.90 | | | | 0.77 | % |
Hypothetical (5% return before expenses) | | $ | 1,000.00 | | | $ | 1,021.15 | | | $ | 3.89 | | | | 0.77 | % |
Class R4 | | | | | | | | | | | | | | | | |
Actual | | $ | 1,000.00 | | | $ | 1,028.03 | | | $ | 1.17 | | | | 0.23 | % |
Hypothetical (5% return before expenses) | | $ | 1,000.00 | | | $ | 1,023.85 | | | $ | 1.16 | | | | 0.23 | % |
Class R6 | | | | | | | | | | | | | | | | |
Actual | | $ | 1,000.00 | | | $ | 1,029.00 | | | $ | 0.36 | | | | 0.07 | % |
Hypothetical (5% return before expenses) | | $ | 1,000.00 | | | $ | 1,024.65 | | | $ | 0.35 | | | | 0.07 | % |
| Dynamic Target 2025 Fund | | | | | | | | | | | | |
Class A | | | | | | | | | | | | | | | | |
Actual | | $ | 1,000.00 | | | $ | 1,031.25 | | | $ | 2.74 | | | | 0.54 | % |
Hypothetical (5% return before expenses) | | $ | 1,000.00 | | | $ | 1,022.30 | | | $ | 2.73 | | | | 0.54 | % |
Class C | | | | | | | | | | | | | | | | |
Actual | | $ | 1,000.00 | | | $ | 1,027.30 | | | $ | 6.54 | | | | 1.29 | % |
Hypothetical (5% return before expenses) | | $ | 1,000.00 | | | $ | 1,018.55 | | | $ | 6.51 | | | | 1.29 | % |
Class R | | | | | | | | | | | | | | | | |
Actual | | $ | 1,000.00 | | | $ | 1,030.27 | | | $ | 3.96 | | | | 0.78 | % |
Hypothetical (5% return before expenses) | | $ | 1,000.00 | | | $ | 1,021.10 | | | $ | 3.94 | | | | 0.78 | % |
Class R4 | | | | | | | | | | | | | | | | |
Actual | | $ | 1,000.00 | | | $ | 1,032.19 | | | $ | 1.17 | | | | 0.23 | % |
Hypothetical (5% return before expenses) | | $ | 1,000.00 | | | $ | 1,023.85 | | | $ | 1.16 | | | | 0.23 | % |
Class R6 | | | | | | | | | | | | | | | | |
Actual | | $ | 1,000.00 | | | $ | 1,033.20 | | | $ | 0.41 | | | | 0.08 | % |
Hypothetical (5% return before expenses) | | $ | 1,000.00 | | | $ | 1,024.60 | | | $ | 0.40 | | | | 0.08 | % |
Please see footnote on page 24.
| | | | |
| 22 | | Wells Fargo Dynamic Target Date Funds | | Fund expenses (unaudited) |
| | | | | | | | | | | | | | | | |
| Dynamic Target 2030 Fund | | Beginning
account value
6-1-2016 | | | Ending
account value
11-30-2016 | | | Expenses
paid during
the period¹ | | | Annualized net
expense ratio | |
Class A | | | | | | | | | | | | | | | | |
Actual | | $ | 1,000.00 | | | $ | 1,034.38 | | | $ | 2.80 | | | | 0.55 | % |
Hypothetical (5% return before expenses) | | $ | 1,000.00 | | | $ | 1,022.25 | | | $ | 2.78 | | | | 0.55 | % |
Class C | | | | | | | | | | | | | | | | |
Actual | | $ | 1,000.00 | | | $ | 1,030.43 | | | $ | 6.60 | | | | 1.30 | % |
Hypothetical (5% return before expenses) | | $ | 1,000.00 | | | $ | 1,018.50 | | | $ | 6.56 | | | | 1.30 | % |
Class R | | | | | | | | | | | | | | | | |
Actual | | $ | 1,000.00 | | | $ | 1,033.40 | | | $ | 4.02 | | | | 0.79 | % |
Hypothetical (5% return before expenses) | | $ | 1,000.00 | | | $ | 1,021.05 | | | $ | 3.99 | | | | 0.79 | % |
Class R4 | | | | | | | | | | | | | | | | |
Actual | | $ | 1,000.00 | | | $ | 1,035.32 | | | $ | 1.22 | | | | 0.24 | % |
Hypothetical (5% return before expenses) | | $ | 1,000.00 | | | $ | 1,023.80 | | | $ | 1.21 | | | | 0.24 | % |
Class R6 | | | | | | | | | | | | | | | | |
Actual | | $ | 1,000.00 | | | $ | 1,037.34 | | | $ | 0.46 | | | | 0.09 | % |
Hypothetical (5% return before expenses) | | $ | 1,000.00 | | | $ | 1,024.55 | | | $ | 0.46 | | | | 0.09 | % |
| Dynamic Target 2035 Fund | | | | | | | | | | | | |
Class A | | | | | | | | | | | | | | | | |
Actual | | $ | 1,000.00 | | | $ | 1,038.54 | | | $ | 2.80 | | | | 0.55 | % |
Hypothetical (5% return before expenses) | | $ | 1,000.00 | | | $ | 1,022.25 | | | $ | 2.78 | | | | 0.55 | % |
Class C | | | | | | | | | | | | | | | | |
Actual | | $ | 1,000.00 | | | $ | 1,035.64 | | | $ | 6.62 | | | | 1.30 | % |
Hypothetical (5% return before expenses) | | $ | 1,000.00 | | | $ | 1,018.50 | | | $ | 6.56 | | | | 1.30 | % |
Class R | | | | | | | | | | | | | | | | |
Actual | | $ | 1,000.00 | | | $ | 1,036.55 | | | $ | 4.02 | | | | 0.79 | % |
Hypothetical (5% return before expenses) | | $ | 1,000.00 | | | $ | 1,021.05 | | | $ | 3.99 | | | | 0.79 | % |
Class R4 | | | | | | | | | | | | | | | | |
Actual | | $ | 1,000.00 | | | $ | 1,039.51 | | | $ | 1.22 | | | | 0.24 | % |
Hypothetical (5% return before expenses) | | $ | 1,000.00 | | | $ | 1,023.80 | | | $ | 1.21 | | | | 0.24 | % |
Class R6 | | | | | | | | | | | | | | | | |
Actual | | $ | 1,000.00 | | | $ | 1,041.54 | | | $ | 0.41 | | | | 0.08 | % |
Hypothetical (5% return before expenses) | | $ | 1,000.00 | | | $ | 1,024.60 | | | $ | 0.40 | | | | 0.08 | % |
| Dynamic Target 2040 Fund | | | | | | | | | | | | |
Class A | | | | | | | | | | | | | | | | |
Actual | | $ | 1,000.00 | | | $ | 1,039.67 | | | $ | 2.80 | | | | 0.55 | % |
Hypothetical (5% return before expenses) | | $ | 1,000.00 | | | $ | 1,022.35 | | | $ | 2.78 | | | | 0.55 | % |
Class C | | | | | | | | | | | | | | | | |
Actual | | $ | 1,000.00 | | | $ | 1,036.73 | | | $ | 6.62 | | | | 1.30 | % |
Hypothetical (5% return before expenses) | | $ | 1,000.00 | | | $ | 1,018.50 | | | $ | 6.56 | | | | 1.30 | % |
Class R | | | | | | | | | | | | | | | | |
Actual | | $ | 1,000.00 | | | $ | 1,038.70 | | | $ | 4.03 | | | | 0.79 | % |
Hypothetical (5% return before expenses) | | $ | 1,000.00 | | | $ | 1,021.05 | | | $ | 3.99 | | | | 0.79 | % |
Class R4 | | | | | | | | | | | | | | | | |
Actual | | $ | 1,000.00 | | | $ | 1,042.68 | | | $ | 1.23 | | | | 0.24 | % |
Hypothetical (5% return before expenses) | | $ | 1,000.00 | | | $ | 1,023.80 | | | $ | 1.21 | | | | 0.24 | % |
Class R6 | | | | | | | | | | | | | | | | |
Actual | | $ | 1,000.00 | | | $ | 1,042.64 | | | $ | 0.46 | | | | 0.09 | % |
Hypothetical (5% return before expenses) | | $ | 1,000.00 | | | $ | 1,024.55 | | | $ | 0.46 | | | | 0.09 | % |
Please see footnote on page 24.
| | | | | | |
| Fund expenses (unaudited) | | Wells Fargo Dynamic Target Date Funds | | | 23 | |
| | | | | | | | | | | | | | | | |
| Dynamic Target 2045 Fund | | Beginning
account value
6-1-2016 | | | Ending
account value
11-30-2016 | | | Expenses
paid during
the period¹ | | | Annualized net
expense ratio | |
Class A | | | | | | | | | | | | | | | | |
Actual | | $ | 1,000.00 | | | $ | 1,041.67 | | | $ | 2.81 | | | | 0.55 | % |
Hypothetical (5% return before expenses) | | $ | 1,000.00 | | | $ | 1,022.25 | | | $ | 2.78 | | | | 0.55 | % |
Class C | | | | | | | | | | | | | | | | |
Actual | | $ | 1,000.00 | | | $ | 1,037.72 | | | $ | 6.62 | | | | 1.30 | % |
Hypothetical (5% return before expenses) | | $ | 1,000.00 | | | $ | 1,018.50 | | | $ | 6.56 | | | | 1.30 | % |
Class R | | | | | | | | | | | | | | | | |
Actual | | $ | 1,000.00 | | | $ | 1,040.69 | | | $ | 4.03 | | | | 0.79 | % |
Hypothetical (5% return before expenses) | | $ | 1,000.00 | | | $ | 1,021.05 | | | $ | 3.99 | | | | 0.79 | % |
Class R4 | | | | | | | | | | | | | | | | |
Actual | | $ | 1,000.00 | | | $ | 1,042.60 | | | $ | 1.23 | | | | 0.24 | % |
Hypothetical (5% return before expenses) | | $ | 1,000.00 | | | $ | 1,023.80 | | | $ | 1.21 | | | | 0.24 | % |
Class R6 | | | | | | | | | | | | | | | | |
Actual | | $ | 1,000.00 | | | $ | 1,043.61 | | | $ | 0.46 | | | | 0.09 | % |
Hypothetical (5% return before expenses) | | $ | 1,000.00 | | | $ | 1,024.55 | | | $ | 0.46 | | | | 0.09 | % |
| Dynamic Target 2050 Fund | | | | | | | | | | | | |
Class A | | | | | | | | | | | | | | | | |
Actual | | $ | 1,000.00 | | | $ | 1,041.67 | | | $ | 2.81 | | | | 0.55 | % |
Hypothetical (5% return before expenses) | | $ | 1,000.00 | | | $ | 1,022.25 | | | $ | 2.78 | | | | 0.55 | % |
Class C | | | | | | | | | | | | | | | | |
Actual | | $ | 1,000.00 | | | $ | 1,037.72 | | | $ | 6.62 | | | | 1.30 | % |
Hypothetical (5% return before expenses) | | $ | 1,000.00 | | | $ | 1,018.50 | | | $ | 6.56 | | | | 1.30 | % |
Class R | | | | | | | | | | | | | | | | |
Actual | | $ | 1,000.00 | | | $ | 1,040.69 | | | $ | 4.08 | | | | 0.80 | % |
Hypothetical (5% return before expenses) | | $ | 1,000.00 | | | $ | 1,021.00 | | | $ | 4.04 | | | | 0.80 | % |
Class R4 | | | | | | | | | | | | | | | | |
Actual | | $ | 1,000.00 | | | $ | 1,042.60 | | | $ | 1.23 | | | | 0.24 | % |
Hypothetical (5% return before expenses) | | $ | 1,000.00 | | | $ | 1,023.80 | | | $ | 1.21 | | | | 0.24 | % |
Class R6 | | | | | | | | | | | | | | | | |
Actual | | $ | 1,000.00 | | | $ | 1,043.61 | | | $ | 0.46 | | | | 0.09 | % |
Hypothetical (5% return before expenses) | | $ | 1,000.00 | | | $ | 1,024.55 | | | $ | 0.46 | | | | 0.09 | % |
| Dynamic Target 2055 Fund | | | | | | | | | | | | |
Class A | | | | | | | | | | | | | | | | |
Actual | | $ | 1,000.00 | | | $ | 1,040.61 | | | $ | 2.81 | | | | 0.55 | % |
Hypothetical (5% return before expenses) | | $ | 1,000.00 | | | $ | 1,022.25 | | | $ | 2.78 | | | | 0.55 | % |
Class C | | | | | | | | | | | | | | | | |
Actual | | $ | 1,000.00 | | | $ | 1,036.66 | | | $ | 6.62 | | | | 1.30 | % |
Hypothetical (5% return before expenses) | | $ | 1,000.00 | | | $ | 1,018.50 | | | $ | 6.56 | | | | 1.30 | % |
Class R | | | | | | | | | | | | | | | | |
Actual | | $ | 1,000.00 | | | $ | 1,039.63 | | | $ | 4.08 | | | | 0.80 | % |
Hypothetical (5% return before expenses) | | $ | 1,000.00 | | | $ | 1,021.00 | | | $ | 4.04 | | | | 0.80 | % |
Class R4 | | | | | | | | | | | | | | | | |
Actual | | $ | 1,000.00 | | | $ | 1,042.60 | | | $ | 1.23 | | | | 0.24 | % |
Hypothetical (5% return before expenses) | | $ | 1,000.00 | | | $ | 1,023.80 | | | $ | 1.21 | | | | 0.24 | % |
Class R6 | | | | | | | | | | | | | | | | |
Actual | | $ | 1,000.00 | | | $ | 1,042.55 | | | $ | 0.46 | | | | 0.09 | % |
Hypothetical (5% return before expenses) | | $ | 1,000.00 | | | $ | 1,024.55 | | | $ | 0.46 | | | | 0.09 | % |
Please see footnote on page 24.
| | | | |
| 24 | | Wells Fargo Dynamic Target Date Funds | | Fund expenses (unaudited) |
| | | | | | | | | | | | | | | | |
| Dynamic Target 2060 Fund | | Beginning
account value
6-1-2016 | | | Ending
account value
11-30-2016 | | | Expenses
paid during
the period¹ | | | Annualized net
expense ratio | |
Class A | | | | | | | | | | | | | | | | |
Actual | | $ | 1,000.00 | | | $ | 1,040.57 | | | $ | 2.81 | | | | 0.55 | % |
Hypothetical (5% return before expenses) | | $ | 1,000.00 | | | $ | 1,022.25 | | | $ | 2.78 | | | | 0.55 | % |
Class C | | | | | | | | | | | | | | | | |
Actual | | $ | 1,000.00 | | | $ | 1,036.62 | | | $ | 6.62 | | | | 1.30 | % |
Hypothetical (5% return before expenses) | | $ | 1,000.00 | | | $ | 1,018.50 | | | $ | 6.56 | | | | 1.30 | % |
Class R | | | | | | | | | | | | | | | | |
Actual | | $ | 1,000.00 | | | $ | 1,039.59 | | | $ | 4.08 | | | | 0.80 | % |
Hypothetical (5% return before expenses) | | $ | 1,000.00 | | | $ | 1,021.00 | | | $ | 4.04 | | | | 0.80 | % |
Class R4 | | | | | | | | | | | | | | | | |
Actual | | $ | 1,000.00 | | | $ | 1,042.55 | | | $ | 1.23 | | | | 0.24 | % |
Hypothetical (5% return before expenses) | | $ | 1,000.00 | | | $ | 1,023.80 | | | $ | 1.21 | | | | 0.24 | % |
Class R6 | | | | | | | | | | | | | | | | |
Actual | | $ | 1,000.00 | | | $ | 1,043.52 | | | $ | 0.46 | | | | 0.09 | % |
Hypothetical (5% return before expenses) | | $ | 1,000.00 | | | $ | 1,024.55 | | | $ | 0.46 | | | | 0.09 | % |
| 1 | Expenses paid is equal to the annualized net expense ratio of each class multiplied by the average account value over the period, multiplied by the number of days in the most recent fiscal half-year divided by the number of days in the fiscal year (to reflect the one-half-year period). |
| | | | | | |
| Portfolio of investments—November 30, 2016 (unaudited) | | Wells Fargo Dynamic Target Date Funds | | | 25 | |
DYNAMIC TARGET TODAY FUND
| | | | | | | | | | | | | | | | |
| Security name | | | | | | | | Shares | | | Value | |
| | | | |
Exchange-Traded Funds: 28.78% | | | | | | | | | | | | | | | | |
iShares Global Infrastructure ETF | | | | | | | | | | | 2,567 | | | $ | 99,035 | |
Schwab International Equity ETF | | | | | | | | | | | 7,040 | | | | 195,149 | |
Schwab U.S. Aggregate Bond ETF | | | | | | | | | | | 10,731 | | | | 555,222 | |
Schwab U.S. Broad Market ETF | | | | | | | | | | | 8,994 | | | | 480,999 | |
Schwab U.S. REIT ETF | | | | | | | | | | | 3,885 | | | | 154,235 | |
| | | |
Total Exchange-Traded Funds (Cost $1,464,671) | | | | | | | | | | | | 1,484,640 | |
| | | | | | | | | | | | | | | | |
| | | |
Investment Companies: 70.55% | | | | | | | | | | | | | |
| | | | |
| Affiliated Master Portfolios: 23.93% | | | | | | | | | | | | | | | | |
Wells Fargo C&B Large Cap Value Portfolio | | | | | | | | | | | | | | | 87,115 | |
Wells Fargo Core Bond Portfolio | | | | | | | | | | | | | | | 666,148 | |
Wells Fargo Large Company Value Portfolio | | | | | | | | | | | | | | | 87,389 | |
Wells Fargo Real Return Portfolio | | | | | | | | | | | | | | | 279,290 | |
Wells Fargo Small Company Growth Portfolio | | | | | | | | | | | | | | | 56,567 | |
Wells Fargo Small Company Value Portfolio | | | | | | | | | | | | | | | 57,798 | |
| | | | |
| | | | | | | | | | | | | | | 1,234,307 | |
| | | | | | | | | | | | | | | | |
| | | |
| Bond Funds: 24.89% | | | | | | | | | | | | | |
Wells Fargo International Bond Fund Class R6 (l)† | | | | | | | | | | | 27,418 | | | | 264,587 | |
Wells Fargo Short-Term Bond Fund Institutional Class (l) | | | | | | | | | | | 58,481 | | | | 511,122 | |
Wells Fargo Strategic Income Fund Institutional Class (l) | | | | | | | | | | | 55,424 | | | | 508,234 | |
| | | | |
| | | | | | | | | | | | | | | 1,283,943 | |
| | | | | | | | | | | | | | | | |
| | | |
| Stock Funds: 21.73% | | | | | | | | | | | | | |
Calamos Market Neutral Income Fund Class I | | | | | | | | | | | 19,954 | | | | 260,792 | |
Wells Fargo Diversified International Fund Class R6 (l) | | | | | | | | | | | 20,715 | | | | 230,761 | |
Wells Fargo Emerging Markets Equity Income Fund Class R6 (l) | | | | | | | | | | | 10,597 | | | | 104,066 | |
Wells Fargo Endeavor Select Fund Institutional Class (l)† | | | | | | | | | | | 13,354 | | | | 126,062 | |
Wells Fargo Enterprise Fund Class R6 (l)† | | | | | | | | | | | 2,026 | | | | 91,998 | |
Wells Fargo Intrinsic Value Fund Class R6 (l) | | | | | | | | | | | 7,035 | | | | 86,180 | |
Wells Fargo Premier Large Company Growth Fund Class R6 (l)† | | | | | | | | | | | 8,632 | | | | 126,283 | |
Wells Fargo Special Mid Cap Value Fund Class R6 (l) | | | | | | | | | | | 2,653 | | | | 94,939 | |
| | | | |
| | | | | | | | | | | | | | | 1,121,081 | |
| | | | | | | | | | | | | | | | |
| | | |
Total Investment Companies (Cost $3,653,630) | | | | | | | | | | | | 3,639,331 | |
| | | | | | | | | | | | | | | | |
| | | | |
| | | Yield | | | Maturity date | | | Principal | | | | |
| Short-Term Investments: 0.08% | | | | | | | | | | | | | | | | |
| | | |
| U.S. Treasury Securities: 0.08% | | | | | | | | | | | | | |
U.S. Treasury Bill (z)# | | | 0.00 | % | | | 12-1-2016 | | | $ | 2,000 | | | | 2,000 | |
U.S. Treasury Bill (z)# | | | 0.35 | | | | 12-29-2016 | | | | 2,000 | | | | 1,999 | |
| | | |
| | | | | | | | | | | | 3,999 | |
| | | | | | | | | | | | | | | | |
| | | | |
Total Short-Term Investments (Cost $3,999) | | | | | | | | | | | | | | | 3,999 | |
| | | | | | | | | | | | | | | | |
| | | | | | | | |
| Total investments in securities (Cost $5,122,300) * | | | 99.41 | % | | | 5,127,970 | |
Other assets and liabilities, net | | | 0.59 | | | | 30,581 | |
| | | | | | | | |
| Total net assets | | | 100.00 | % | | $ | 5,158,551 | |
| | | | | | | | |
The accompanying notes are an integral part of these financial statements.
| | | | |
| 26 | | Wells Fargo Dynamic Target Date Funds | | Portfolio of investments—November 30, 2016 (unaudited) |
DYNAMIC TARGET TODAY FUND
| (l) | The issuer of the security is an affiliated person of the Fund as defined in the Investment Company Act of 1940. |
| † | Non-income-earning security |
| (z) | Zero coupon security. The rate represents the current yield to maturity. |
| # | All or a portion of this security is segregated as collateral for investments in derivative instruments. |
| * | Cost for federal income tax purposes is $5,121,718 and unrealized gains (losses) consists of: |
| | | | |
Gross unrealized gains | | $ | 89,379 | |
Gross unrealized losses | | | (83,127 | ) |
| | | | |
Net unrealized gains | | $ | 6,252 | |
The accompanying notes are an integral part of these financial statements.
| | | | | | |
| Portfolio of investments—November 30, 2016 (unaudited) | | Wells Fargo Dynamic Target Date Funds | | | 27 | |
DYNAMIC TARGET 2015 FUND
| | | | | | | | | | | | | | | | |
| Security name | | | | | | | | Shares | | | Value | |
| | |
Exchange-Traded Funds: 30.53% | | | | | | | | | |
iShares Global Infrastructure ETF | | | | | | | | | | | 2,669 | | | $ | 102,970 | |
Schwab International Equity ETF | | | | | | | | | | | 10,432 | | | | 289,175 | |
Schwab U.S. Aggregate Bond ETF | | | | | | | | | | | 8,368 | | | | 432,960 | |
Schwab U.S. Broad Market ETF | | | | | | | | | | | 13,394 | | | | 716,311 | |
Schwab U.S. REIT ETF | | | | | | | | | | | 2,796 | | | | 111,001 | |
| | | |
Total Exchange-Traded Funds (Cost $1,620,956) | | | | | | | | | | | | 1,652,417 | |
| | | | | | | | | | | | | | | | |
| | | |
Investment Companies: 68.78% | | | | | | | | | | | | | |
| | | | |
| Affiliated Master Portfolios: 21.62% | | | | | | | | | | | | | | | | |
Wells Fargo C&B Large Cap Value Portfolio | | | | | | | | | | | | | | | 130,211 | |
Wells Fargo Core Bond Portfolio | | | | | | | | | | | | | | | 520,070 | |
Wells Fargo Large Company Value Portfolio | | | | | | | | | | | | | | | 130,320 | |
Wells Fargo Real Return Portfolio | | | | | | | | | | | | | | | 218,052 | |
Wells Fargo Small Company Growth Portfolio | | | | | | | | | | | | | | | 84,551 | |
Wells Fargo Small Company Value Portfolio | | | | | | | | | | | | | | | 86,552 | |
| | | | |
| | | | | | | | | | | | | | | 1,169,756 | |
| | | | | | | | | | | | | | | | |
| | | |
| Bond Funds: 18.52% | | | | | | | | | | | | | |
Wells Fargo International Bond Fund Class R6 (l)† | | | | | | | | | | | 21,602 | | | | 208,455 | |
Wells Fargo Short-Term Bond Fund Institutional Class (l) | | | | | | | | | | | 45,561 | | | | 398,204 | |
Wells Fargo Strategic Income Fund Institutional Class (l) | | | | | | | | | | | 43,153 | | | | 395,718 | |
| | | | |
| | | | | | | | | | | | | | | 1,002,377 | |
| | | | | | | | | | | | | | | | |
| | | |
| Stock Funds: 28.64% | | | | | | | | | | | | | |
Calamos Market Neutral Income Fund Class I | | | | | | | | | | | 20,920 | | | | 273,425 | |
Wells Fargo Diversified International Fund Class R6 (l) | | | | | | | | | | | 30,664 | | | | 341,598 | |
Wells Fargo Emerging Markets Equity Income Fund Class R6 (l) | | | | | | | | | | | 15,747 | | | | 154,639 | |
Wells Fargo Endeavor Select Fund Institutional Class (l)† | | | | | | | | | | | 19,842 | | | | 187,309 | |
Wells Fargo Enterprise Fund Class R6 (l)† | | | | | | | | | | | 3,012 | | | | 136,728 | |
Wells Fargo Intrinsic Value Fund Class R6 (l) | | | | | | | | | | | 10,506 | | | | 128,700 | |
Wells Fargo Premier Large Company Growth Fund Class R6 (l)† | | | | | | | | | | | 12,808 | | | | 187,388 | |
Wells Fargo Special Mid Cap Value Fund Class R6 (l) | | | | | | | | | | | 3,918 | | | | 140,175 | |
| | | | |
| | | | | | | | | | | | | | | 1,549,962 | |
| | | | | | | | | | | | | | | | |
| | | |
Total Investment Companies (Cost $3,740,987) | | | | | | | | | | | | 3,722,095 | |
| | | | | | | | | | | | | | | | |
| | | | |
| | | Yield | | | Maturity date | | | Principal | | | | |
| Short-Term Investments: 0.07% | | | | | | | | | | | | | | | | |
| | | |
| U.S. Treasury Securities: 0.07% | | | | | | | | | | | | | |
U.S. Treasury Bill (z)# | | | 0.00 | % | | | 12-1-2016 | | | $ | 2,000 | | | | 2,000 | |
U.S. Treasury Bill (z)# | | | 0.35 | | | | 12-29-2016 | | | | 2,000 | | | | 1,999 | |
| | | |
Total Short-Term Investments (Cost $3,999) | | | | | | | | | | | | 3,999 | |
| | | | | | | | | | | | | | | | |
| | | | | | | | |
| Total investments in securities (Cost $5,365,942) * | | | 99.38 | % | | | 5,378,511 | |
Other assets and liabilities, net | | | 0.62 | | | | 33,342 | |
| | | | | | | | |
| Total net assets | | | 100.00 | % | | $ | 5,411,853 | |
| | | | | | | | |
The accompanying notes are an integral part of these financial statements.
| | | | |
| 28 | | Wells Fargo Dynamic Target Date Funds | | Portfolio of investments—November 30, 2016 (unaudited) |
DYNAMIC TARGET 2015 FUND
| (l) | The issuer of the security is an affiliated person of the Fund as defined in the Investment Company Act of 1940. |
| † | Non-income-earning security |
| (z) | Zero coupon security. The rate represents the current yield to maturity. |
| # | All or a portion of this security is segregated as collateral for investments in derivative instruments. |
| * | Cost for federal income tax purposes is $5,362,754 and unrealized gains (losses) consists of: |
| | | | |
Gross unrealized gains | | $ | 128,600 | |
Gross unrealized losses | | | (112,843 | ) |
| | | | |
Net unrealized gains | | $ | 15,757 | |
The accompanying notes are an integral part of these financial statements.
| | | | | | |
| Portfolio of investments—November 30, 2016 (unaudited) | | Wells Fargo Dynamic Target Date Funds | | | 29 | |
DYNAMIC TARGET 2020 FUND
| | | | | | | | | | | | | | | | |
| Security name | | | | | | | | Shares | | | Value | |
| | | | |
Exchange-Traded Funds: 31.41% | | | | | | | | | | | | | | | | |
iShares Global Infrastructure ETF | | | | | | | | | | | 1,512 | | | $ | 58,333 | |
Schwab International Equity ETF | | | | | | | | | | | 12,302 | | | | 341,011 | |
Schwab U.S. Aggregate Bond ETF | | | | | | | | | | | 6,510 | | | | 336,827 | |
Schwab U.S. Broad Market ETF | | | | | | | | | | | 15,780 | | | | 843,914 | |
Schwab U.S. REIT ETF | | | | | | | | | | | 2,644 | | | | 104,967 | |
| | | | |
Total Exchange-Traded Funds (Cost $1,652,689) | | | | | | | | | | | | | | | 1,685,052 | |
| | | | | | | | | | | | | | | | |
| | | | |
Investment Companies: 67.82% | | | | | | | | | | | | | | | | |
| | | | |
| Affiliated Master Portfolios: 20.17% | | | | | | | | | | | | | | | | |
Wells Fargo C&B Large Cap Value Portfolio | | | | | | | | | | | | | | | 153,114 | |
Wells Fargo Core Bond Portfolio | | | | | | | | | | | | | | | 403,593 | |
Wells Fargo Large Company Value Portfolio | | | | | | | | | | | | | | | 153,879 | |
Wells Fargo Real Return Portfolio | | | | | | | | | | | | | | | 169,272 | |
Wells Fargo Small Company Growth Portfolio | | | | | | | | | | | | | | | 99,709 | |
Wells Fargo Small Company Value Portfolio | | | | | | | | | | | | | | | 102,461 | |
| | | | |
| | | | | | | | | | | | | | | 1,082,028 | |
| | | | | | | | | | | | | | | | |
| | | | |
| Bond Funds: 14.53% | | | | | | | | | | | | | | | | |
Wells Fargo International Bond Fund Class R6 (l)† | | | | | | | | | | | 16,993 | | | | 163,987 | |
Wells Fargo Short-Term Bond Fund Institutional Class (l) | | | | | | | | | | | 35,305 | | | | 308,566 | |
Wells Fargo Strategic Income Fund Institutional Class (l) | | | | | | | | | | | 33,459 | | | | 306,816 | |
| | | | |
| | | | | | | | | | | | | | | 779,369 | |
| | | | | | | | | | | | | | | | |
| | | | |
| Stock Funds: 33.12% | | | | | | | | | | | | | | | | |
Calamos Market Neutral Income Fund Class I | | | | | | | | | | | 20,642 | | | | 269,788 | |
Wells Fargo Diversified International Fund Class R6 (l) | | | | | | | | | | | 36,160 | | | | 402,823 | |
Wells Fargo Emerging Markets Equity Income Fund Class R6 (l) | | | | | | | | | | | 18,562 | | | | 182,281 | |
Wells Fargo Endeavor Select Fund Institutional Class (l)† | | | | | | | | | | | 23,417 | | | | 221,054 | |
Wells Fargo Enterprise Fund Class R6 (l)† | | | | | | | | | | | 3,557 | | | | 161,504 | |
Wells Fargo Intrinsic Value Fund Class R6 (l) | | | | | | | | | | | 12,355 | | | | 151,351 | |
Wells Fargo Premier Large Company Growth Fund Class R6 (l)† | | | | | | | | | | | 15,048 | | | | 220,151 | |
Wells Fargo Special Mid Cap Value Fund Class R6 (l) | | | | | | | | | | | 4,683 | | | | 167,549 | |
| | | | |
| | | | | | | | | | | | | | | 1,776,501 | |
| | | | | | | | | | | | | | | | |
| | | |
Total Investment Companies (Cost $3,669,123) | | | | | | | | | | | | 3,637,898 | |
| | | | | | | | | | | | | | | | |
| | | | |
| | | Yield | | | Maturity date | | | Principal | | | | |
| Short-Term Investments: 0.08% | | | | | | | | | | | | | | | | |
| | | |
| U.S. Treasury Securities: 0.08% | | | | | | | | | | | | | |
U.S. Treasury Bill (z)# | | | 0.00 | % | | | 12-1-2016 | | | $ | 2,000 | | | | 2,000 | |
U.S. Treasury Bill (z)# | | | 0.35 | | | | 12-29-2016 | | | | 2,000 | | | | 1,999 | |
| | | |
Total Short-Term Investments (Cost $3,999) | | | | | | | | | | | | 3,999 | |
| | | | | | | | | | | | | | | | |
| | | | | | | | |
| Total investments in securities (Cost $5,325,811) * | | | 99.31 | % | | | 5,326,949 | |
Other assets and liabilities, net | | | 0.69 | | | | 37,244 | |
| | | | | | | | |
| Total net assets | | | 100.00 | % | | $ | 5,364,193 | |
| | | | | | | | |
The accompanying notes are an integral part of these financial statements.
| | | | |
| 30 | | Wells Fargo Dynamic Target Date Funds | | Portfolio of investments—November 30, 2016 (unaudited) |
DYNAMIC TARGET 2020 FUND
| (l) | The issuer of the security is an affiliated person of the Fund as defined in the Investment Company Act of 1940. |
| † | Non-income-earning security |
| (z) | Zero coupon security. The rate represents the current yield to maturity. |
| # | All or a portion of this security is segregated as collateral for investments in derivative instruments. |
| * | Cost for federal income tax purposes is $5,321,236 and unrealized gains (losses) consists of: |
| | | | |
Gross unrealized gains | | $ | 145,666 | |
Gross unrealized losses | | | (139,953 | ) |
| | | | |
Net unrealized gains | | $ | 5,713 | |
The accompanying notes are an integral part of these financial statements.
| | | | | | |
| Portfolio of investments—November 30, 2016 (unaudited) | | Wells Fargo Dynamic Target Date Funds | | | 31 | |
DYNAMIC TARGET 2025 FUND
| | | | | | | | | | | | | | | | |
| Security name | | | | | | | | Shares | | | Value | |
| | | | |
Exchange-Traded Funds: 32.41% | | | | | | | | | | | | | | | | |
iShares Global Infrastructure ETF | | | | | | | | | | | 1,349 | | | $ | 52,044 | |
Schwab International Equity ETF | | | | | | | | | | | 14,395 | | | | 399,029 | |
Schwab U.S. Aggregate Bond ETF | | | | | | | | | | | 4,951 | | | | 256,165 | |
Schwab U.S. Broad Market ETF | | | | | | | | | | | 18,471 | | | | 987,830 | |
Schwab U.S. REIT ETF | | | | | | | | | | | 1,556 | | | | 61,773 | |
| | | |
Total Exchange-Traded Funds (Cost $1,716,817) | | | | | | | | | | | | 1,756,841 | |
| | | | | | | | | | | | | | | | |
| | | |
Investment Companies: 67.52% | | | | | | | | | | | | | |
| | | | |
| Affiliated Master Portfolios: 19.05% | | | | | | | | | | | | | | | | |
Wells Fargo C&B Large Cap Value Portfolio | | | | | | | | | | | | | | | 179,674 | |
Wells Fargo Core Bond Portfolio | | | | | | | | | | | | | | | 306,681 | |
Wells Fargo Large Company Value Portfolio | | | | | | | | | | | | | | | 179,743 | |
Wells Fargo Real Return Portfolio | | | | | | | | | | | | | | | 128,401 | |
Wells Fargo Small Company Growth Portfolio | | | | | | | | | | | | | | | 117,461 | |
Wells Fargo Small Company Value Portfolio | | | | | | | | | | | | | | | 120,457 | |
| | | | |
| | | | | | | | | | | | | | | 1,032,417 | |
| | | | | | | | | | | | | | | | |
| | | | |
| Bond Funds: 10.93% | | | | | | | | | | | | | | | | |
Wells Fargo International Bond Fund Class R6 (l)† | | | | | | | | | | | 12,959 | | | | 125,050 | |
Wells Fargo Short-Term Bond Fund Institutional Class (l) | | | | | | | | | | | 26,818 | | | | 234,393 | |
Wells Fargo Strategic Income Fund Institutional Class (l) | | | | | | | | | | | 25,377 | | | | 232,708 | |
| | | | |
| | | | | | | | | | | | | | | 592,151 | |
| | | | | | | | | | | | | | | | |
| | | | |
| Stock Funds: 37.54% | | | | | | | | | | | | | | | | |
Calamos Market Neutral Income Fund Class I | | | | | | | | | | | 20,889 | | | | 273,016 | |
Wells Fargo Diversified International Fund Class R6 (l) | | | | | | | | | | | 42,244 | | | | 470,601 | |
Wells Fargo Emerging Markets Equity Income Fund Class R6 (l) | | | | | | | | | | | 21,648 | | | | 212,587 | |
Wells Fargo Endeavor Select Fund Institutional Class (l)† | | | | | | | | | | | 27,370 | | | | 258,368 | |
Wells Fargo Enterprise Fund Class R6 (l)† | | | | | | | | | | | 4,169 | | | | 189,284 | |
Wells Fargo Intrinsic Value Fund Class R6 (l) | | | | | | | | | | | 14,473 | | | | 177,290 | |
Wells Fargo Premier Large Company Growth Fund Class R6 (l)† | | | | | | | | | | | 17,665 | | | | 258,436 | |
Wells Fargo Special Mid Cap Value Fund Class R6 (l) | | | | | | | | | | | 5,461 | | | | 195,396 | |
| | | | |
| | | | | | | | | | | | | | | 2,034,978 | |
| | | | | | | | | | | | | | | | |
| | | | |
Total Investment Companies (Cost $3,687,794) | | | | | | | | | | | | | | | 3,659,546 | |
| | | | | | | | | | | | | | | | |
| | | | |
| | | Yield | | | Maturity date | | | Principal | | | | |
| Short-Term Investments: 0.07% | | | | | | | | | | | | | |
| | | |
| U.S. Treasury Securities: 0.07% | | | | | | | | | | | | | |
U.S. Treasury Bill (z)# | | | 0.00 | % | | | 12-1-2016 | | | $ | 2,000 | | | | 2,000 | |
U.S. Treasury Bill (z)# | | | 0.35 | | | | 12-29-2016 | | | | 2,000 | | | | 1,999 | |
| | | | |
| | | | | | | | | | | | | | | 3,999 | |
| | | | | | | | | | | | | | | | |
| | | |
Total Short-Term Investments (Cost $3,999) | | | | | | | | | | | | 3,999 | |
| | | | | | | | | | | | | | | | |
| | | | | | | | |
| Total investments in securities (Cost $5,408,610) * | | | 99.54 | % | | | 5,420,386 | |
Other assets and liabilities, net | | | 0.46 | | | | 24,930 | |
| | | | | | | | |
| Total net assets | | | 100.00 | % | | $ | 5,445,316 | |
| | | | | | | | |
The accompanying notes are an integral part of these financial statements.
| | | | |
| 32 | | Wells Fargo Dynamic Target Date Funds | | Portfolio of investments—November 30, 2016 (unaudited) |
DYNAMIC TARGET 2025 FUND
| (l) | The issuer of the security is an affiliated person of the Fund as defined in the Investment Company Act of 1940. |
| † | Non-income-earning security |
| (z) | Zero coupon security. The rate represents the current yield to maturity. |
| # | All or a portion of this security is segregated as collateral for investments in derivative instruments. |
| * | Cost for federal income tax purposes is $5,404,328 and unrealized gains (losses) consists of: |
| | | | |
Gross unrealized gains | | $ | 83,107 | |
Gross unrealized losses | | | (67,049 | ) |
| | | | |
Net unrealized gains | | $ | 16,058 | |
The accompanying notes are an integral part of these financial statements.
| | | | | | |
| Portfolio of investments—November 30, 2016 (unaudited) | | Wells Fargo Dynamic Target Date Funds | | | 33 | |
DYNAMIC TARGET 2030 FUND
| | | | | | | | | | | | | | | | |
| Security name | | | | | | | | Shares | | | Value | |
| | | | |
Exchange-Traded Funds: 32.93% | | | | | | | | | | | | | | | | |
iShares Global Infrastructure ETF | | | | | | | | | | | 201 | | | $ | 7,755 | |
Schwab International Equity ETF | | | | | | | | | | | 16,004 | | | | 443,631 | |
Schwab U.S. Aggregate Bond ETF | | | | | | | | | | | 3,301 | | | | 170,794 | |
Schwab U.S. Broad Market ETF | | | | | | | | | | | 20,497 | | | | 1,096,180 | |
Schwab U.S. REIT ETF | | | | | | | | | | | 1,330 | | | | 52,801 | |
| | | |
Total Exchange-Traded Funds (Cost $1,728,738) | | | | | | | | | | | | 1,771,161 | |
| | | | | | | | | | | | | | | | |
| | | |
Investment Companies: 66.44% | | | | | | | | | | | | | |
| | | | |
| Affiliated Master Portfolios: 17.73% | | | | | | | | | | | | | | | | |
Wells Fargo C&B Large Cap Value Portfolio | | | | | | | | | | | | | | | 199,232 | |
Wells Fargo Core Bond Portfolio | | | | | | | | | | | | | | | 204,481 | |
Wells Fargo Large Company Value Portfolio | | | | | | | | | | | | | | | 200,269 | |
Wells Fargo Real Return Portfolio | | | | | | | | | | | | | | | 85,367 | |
Wells Fargo Small Company Growth Portfolio | | | | | | | | | | | | | | | 130,367 | |
Wells Fargo Small Company Value Portfolio | | | | | | | | | | | | | | | 133,710 | |
| | | | |
| | | | | | | | | | | | | | | 953,426 | |
| | | | | | | | | | | | | | | | |
| | | | |
| Bond Funds: 7.35% | | | | | | | | | | | | | | | | |
Wells Fargo International Bond Fund Class R6 (l)† | | | | | | | | | | | 8,777 | | | | 84,699 | |
Wells Fargo Short-Term Bond Fund Institutional Class (l) | | | | | | | | | | | 17,807 | | | | 155,635 | |
Wells Fargo Strategic Income Fund Institutional Class (l) | | | | | | | | | | | 16,906 | | �� | | 155,030 | |
| | | | |
| | | | | | | | | | | | | | | 395,364 | |
| | | | | | | | | | | | | | | | |
| | | | |
| Stock Funds: 41.36% | | | | | | | | | | | | | | | | |
Calamos Market Neutral Income Fund Class I | | | | | | | | | | | 20,431 | | | | 267,036 | |
Wells Fargo Diversified International Fund Class R6 (l) | | | | | | | | | | | 46,930 | | | | 522,805 | |
Wells Fargo Emerging Markets Equity Income Fund Class R6 (l) | | | | | | | | | | | 24,244 | | | | 238,075 | |
Wells Fargo Endeavor Select Fund Institutional Class (l)† | | | | | | | | | | | 30,307 | | | | 286,094 | |
Wells Fargo Enterprise Fund Class R6 (l)† | | | | | | | | | | | 4,626 | | | | 210,004 | |
Wells Fargo Intrinsic Value Fund Class R6 (l) | | | | | | | | | | | 16,054 | | | | 196,662 | |
Wells Fargo Premier Large Company Growth Fund Class R6 (l)† | | | | | | | | | | | 19,596 | | | | 286,691 | |
Wells Fargo Special Mid Cap Value Fund Class R6 (l) | | | | | | | | | | | 6,075 | | | | 217,371 | |
| | | | |
| | | | | | | | | | | | | | | 2,224,738 | |
| | | | | | | | | | | | | | | | |
| | | | |
Total Investment Companies (Cost $3,607,846) | | | | | | | | | | | | | | | 3,573,528 | |
| | | | | | | | | | | | | | | | |
| | | | |
| | | Yield | | | Maturity date | | | Principal | | | | |
| Short-Term Investments: 0.16% | | | | | | | | | | | | | |
| | | |
| U.S. Treasury Securities: 0.16% | | | | | | | | | | | | | |
U.S. Treasury Bill (z)# | | | 0.00 | % | | | 12-1-2016 | | | $ | 7,000 | | | | 7,000 | |
U.S. Treasury Bill (z)# | | | 0.35 | | | | 12-29-2016 | | | | 2,000 | | | | 1,999 | |
| | | | |
| | | | | | | | | | | | | | | 8,999 | |
| | | | | | | | | | | | | | | | |
| | | |
Total Short-Term Investments (Cost $8,999) | | | | | | | | | | | | 8,999 | |
| | | | | | | | | | | | | | | | |
| | | | | | | | |
| Total investments in securities (Cost $5,345,583) * | | | 99.53 | % | | | 5,353,688 | |
Other assets and liabilities, net | | | 0.47 | | | | 25,043 | |
| | | | | | | | |
| Total net assets | | | 100.00 | % | | $ | 5,378,731 | |
| | | | | | | | |
The accompanying notes are an integral part of these financial statements.
| | | | |
| 34 | | Wells Fargo Dynamic Target Date Funds | | Portfolio of investments—November 30, 2016 (unaudited) |
DYNAMIC TARGET 2030 FUND
| (l) | The issuer of the security is an affiliated person of the Fund as defined in the Investment Company Act of 1940. |
| † | Non-income-earning security |
| (z) | Zero coupon security. The rate represents the current yield to maturity. |
| # | All or a portion of this security is segregated as collateral for investments in derivative instruments. |
| * | Cost for federal income tax purposes is $5,339,491 and unrealized gains (losses) consists of: |
| | | | |
Gross unrealized gains | | $ | 88,848 | |
Gross unrealized losses | | | (74,651 | ) |
| | | | |
Net unrealized gains | | $ | 14,197 | |
The accompanying notes are an integral part of these financial statements.
| | | | | | |
| Portfolio of investments—November 30, 2016 (unaudited) | | Wells Fargo Dynamic Target Date Funds | | | 35 | |
DYNAMIC TARGET 2035 FUND
| | | | | | | | | | | | | | | | |
| Security name | | | | | | | | Shares | | | Value | |
| | | | |
Exchange-Traded Funds: 33.29% | | | | | | | | | | | | | | | | |
Schwab International Equity ETF | | | | | | | | | | | 16,844 | | | $ | 466,916 | |
Schwab U.S. Aggregate Bond ETF | | | | | | | | | | | 2,110 | | | | 109,171 | |
Schwab U.S. Broad Market ETF | | | | | | | | | | | 21,697 | | | | 1,160,356 | |
Schwab U.S. REIT ETF | | | | | | | | | | | 197 | | | | 7,821 | |
| | | | |
Total Exchange-Traded Funds (Cost $1,699,737) | | | | | | | | | | | | | | | 1,744,264 | |
| | | | | | | | | | | | | | | | |
| | | | |
Investment Companies: 66.06% | | | | | | | | | | | | | | | | |
| | | | |
| Affiliated Master Portfolios: 16.88% | | | | | | | | | | | | | | | | |
Wells Fargo C&B Large Cap Value Portfolio | | | | | | | | | | | | | | | 210,490 | |
Wells Fargo Core Bond Portfolio | | | | | | | | | | | | | | | 130,640 | |
Wells Fargo Large Company Value Portfolio | | | | | | | | | | | | | | | 210,771 | |
Wells Fargo Real Return Portfolio | | | | | | | | | | | | | | | 54,492 | |
Wells Fargo Small Company Growth Portfolio | | | | | | | | | | | | | | | 136,885 | |
Wells Fargo Small Company Value Portfolio | | | | | | | | | | | | | | | 141,217 | |
| | | | |
| | | | | | | | | | | | | | | 884,495 | |
| | | | | | | | | | | | | | | | |
| | | | |
| Bond Funds: 4.81% | | | | | | | | | | | | | | | | |
Wells Fargo International Bond Fund Class R6 (l)† | | | | | | | | | | | 5,585 | | | | 53,898 | |
Wells Fargo Short-Term Bond Fund Institutional Class (l) | | | | | | | | | | | 11,370 | | | | 99,370 | |
Wells Fargo Strategic Income Fund Institutional Class (l) | | | | | | | | | | | 10,805 | | | | 99,082 | |
| | | | |
| | | | | | | | | | | | | | | 252,350 | |
| | | | | | | | | | | | | | | | |
| | | | |
| Stock Funds: 44.37% | | | | | | | | | | | | | | | | |
Calamos Market Neutral Income Fund Class I | | | | | | | | | | | 20,031 | | | | 261,805 | |
Wells Fargo Diversified International Fund Class R6 (l) | | | | | | | | | | | 49,463 | | | | 551,022 | |
Wells Fargo Emerging Markets Equity Income Fund Class R6 (l) | | | | | | | | | | | 25,322 | | | | 248,659 | |
Wells Fargo Endeavor Select Fund Institutional Class (l)† | | | | | | | | | | | 32,092 | | | | 302,952 | |
Wells Fargo Enterprise Fund Class R6 (l)† | | | | | | | | | | | 4,877 | | | | 221,398 | |
Wells Fargo Intrinsic Value Fund Class R6 (l) | | | | | | | | | | | 16,968 | | | | 207,858 | |
Wells Fargo Premier Large Company Growth Fund Class R6 (l)† | | | | | | | | | | | 20,633 | | | | 301,860 | |
Wells Fargo Special Mid Cap Value Fund Class R6 (l) | | | | | | | | | | | 6,407 | | | | 229,228 | |
| | | | |
| | | | | | | | | | | | | | | 2,324,782 | |
| | | | | | | | | | | | | | | | |
| | | | |
Total Investment Companies (Cost $3,497,369) | | | | | | | | | | | | | | | 3,461,627 | |
| | | | | | | | | | | | | | | | |
| | | | |
| | | Yield | | | Maturity date | | | Principal | | | | |
| Short-Term Investments: 0.17% | | | | | | | | | | | | | | | | |
| | | | |
| U.S. Treasury Securities: 0.17% | | | | | | | | | | | | | | | | |
U.S. Treasury Bill (z)# | | | 0.00 | % | | | 12-1-2016 | | | $ | 7,000 | | | | 7,000 | |
U.S. Treasury Bill (z)# | | | 0.35 | | | | 12-29-2016 | | | | 2,000 | | | | 1,999 | |
| | | | |
Total Short-Term Investments (Cost $8,999) | | | | | | | | | | | | | | | 8,999 | |
| | | | | | | | | | | | | | | | |
| | | | | | | | |
| Total investments in securities (Cost $5,206,105) * | | | 99.52 | % | | | 5,214,890 | |
Other assets and liabilities, net | | | 0.48 | | | | 24,891 | |
| | | | | | | | |
| Total net assets | | | 100.00 | % | | $ | 5,239,781 | |
| | | | | | | | |
The accompanying notes are an integral part of these financial statements.
| | | | |
| 36 | | Wells Fargo Dynamic Target Date Funds | | Portfolio of investments—November 30, 2016 (unaudited) |
DYNAMIC TARGET 2035 FUND
| (l) | The issuer of the security is an affiliated person of the Fund as defined in the Investment Company Act of 1940. |
| † | Non-income-earning security |
| (z) | Zero coupon security. The rate represents the current yield to maturity. |
| # | All or a portion of this security is segregated as collateral for investments in derivative instruments. |
| * | Cost for federal income tax purposes is $5,195,411 and unrealized gains (losses) consists of: |
| | | | |
Gross unrealized gains | | $ | 93,399 | |
Gross unrealized losses | | | (73,920 | ) |
| | | | |
Net unrealized gains | | $ | 19,479 | |
The accompanying notes are an integral part of these financial statements.
| | | | | | |
| Portfolio of investments—November 30, 2016 (unaudited) | | Wells Fargo Dynamic Target Date Funds | | | 37 | |
DYNAMIC TARGET 2040 FUND
| | | | | | | | | | | | | | | | |
| Security name | | | | | | | | Shares | | | Value | |
| | | | |
Exchange-Traded Funds: 33.70% | | | | | | | | | | | | | | | | |
Schwab International Equity ETF | | | | | | | | | | | 17,987 | | | $ | 498,600 | |
Schwab U.S. Aggregate Bond ETF | | | | | | | | | | | 1,338 | | | | 69,228 | |
Schwab U.S. Broad Market ETF | | | | | | | | | | | 22,701 | | | | 1,214,049 | |
| | | | |
Total Exchange-Traded Funds (Cost $1,733,733) | | | | | | | | | | | | | | | 1,781,877 | |
| | | | | | | | | | | | | | | | |
| | | | |
Investment Companies: 65.48% | | | | | | | | | | | | | | | | |
| | | | |
| Affiliated Master Portfolios: 16.02% | | | | | | | | | | | | | | | | |
Wells Fargo C&B Large Cap Value Portfolio | | | | | | | | | | | | | | | 220,184 | |
Wells Fargo Core Bond Portfolio | | | | | | | | | | | | | | | 83,215 | |
Wells Fargo Large Company Value Portfolio | | | | | | | | | | | | | | | 220,454 | |
Wells Fargo Real Return Portfolio | | | | | | | | | | | | | | | 34,994 | |
Wells Fargo Small Company Growth Portfolio | | | | | | | | | | | | | | | 141,886 | |
Wells Fargo Small Company Value Portfolio | | | | | | | | | | | | | | | 146,547 | |
| | | | |
| | | | | | | | | | | | | | | 847,280 | |
| | | | | | | | | | | | | | | | |
| | | | |
| Fixed-Income Funds: 3.03% | | | | | | | | | | | | | | | | |
Wells Fargo International Bond Fund Class R6 (l)† | | | | | | | | | | | 3,616 | | | | 34,894 | |
Wells Fargo Short-Term Bond Fund Institutional Class (l) | | | | | | | | | | | 7,180 | | | | 62,755 | |
Wells Fargo Strategic Income Fund Institutional Class (l) | | | | | | | | | | | 6,828 | | | | 62,611 | |
| | | | |
| | | | | | | | | | | | | | | 160,260 | |
| | | | | | | | | | | | | | | | |
| | | | |
| Equity Funds: 46.43% | | | | | | | | | | | | | | | | |
Calamos Market Neutral Income Fund Class I | | | | | | | | | | | 19,898 | | | | 260,073 | |
Wells Fargo Diversified International Fund Class R6 (l) | | | | | | | | | | | 52,846 | | | | 588,701 | |
Wells Fargo Emerging Markets Equity Income Fund Class R6 (l) | | | | | | | | | | | 28,099 | | | | 275,932 | |
Wells Fargo Endeavor Select Fund Institutional Class (l)† | | | | | | | | | | | 34,054 | | | | 321,469 | |
Wells Fargo Enterprise Fund Class R6 (l)† | | | | | | | | | | | 5,095 | | | | 231,315 | |
Wells Fargo Intrinsic Value Fund Class R6 (l) | | | | | | | | | | | 17,779 | | | | 217,794 | |
Wells Fargo Premier Large Company Growth Fund Class R6 (l)† | | | | | | | | | | | 21,914 | | | | 320,595 | |
Wells Fargo Special Mid Cap Value Fund Class R6 (l) | | | | | | | | | | | 6,681 | | | | 239,062 | |
| | | | |
| | | | | | | | | | | | | | | 2,454,941 | |
| | | | | | | | | | | | | | | | |
| | | | |
Total Investment Companies (Cost $3,495,065) | | | | | | | | | | | | | | | 3,462,481 | |
| | | | | | | | | | | | | | | | |
| | | | |
| | | Yield | | | Maturity date | | | Principal | | | | |
| Short-Term Investments: 0.17% | | | | | | | | | | | | | | | | |
| | | | |
| U.S. Treasury Securities: 0.17% | | | | | | | | | | | | | | | | |
U.S. Treasury Bill (z)# | | | 0.00 | % | | | 12-1-2016 | | | $ | 7,000 | | | | 7,000 | |
U.S. Treasury Bill (z)# | | | 0.35 | | | | 12-29-2016 | | | | 2,000 | | | | 1,999 | |
| | | | |
Total Short-Term Investments (Cost $8,999) | | | | | | | | | | | | | | | 8,999 | |
| | | | | | | | | | | | | | | | |
| | | | | | | | |
| Total investments in securities (Cost $5,237,797) * | | | 99.35 | % | | | 5,253,357 | |
Other assets and liabilities, net | | | 0.65 | | | | 34,469 | |
| | | | | | | | |
| Total net assets | | | 100.00 | % | | $ | 5,287,826 | |
| | | | | | | | |
The accompanying notes are an integral part of these financial statements.
| | | | |
| 38 | | Wells Fargo Dynamic Target Date Funds | | Portfolio of investments—November 30, 2016 (unaudited) |
DYNAMIC TARGET 2040 FUND
| (l) | The issuer of the security is an affiliated person of the Fund as defined in the Investment Company Act of 1940. |
| † | Non-income-earning security |
| (z) | Zero coupon security. The rate represents the current yield to maturity. |
| # | All or a portion of this security is segregated as collateral for investments in derivative instruments. |
| * | Cost for federal income tax purposes is $5,229,177 and unrealized gains (losses) consists of: |
| | | | |
Gross unrealized gains | | $ | 208,645 | |
Gross unrealized losses | | | (184,465 | ) |
| | | | |
Net unrealized gains | | $ | 24,180 | |
The accompanying notes are an integral part of these financial statements.
| | | | | | |
| Portfolio of investments—November 30, 2016 (unaudited) | | Wells Fargo Dynamic Target Date Funds | | | 39 | |
DYNAMIC TARGET 2045 FUND
| | | | | | | | | | | | | | | | |
| Security name | | | | | | | | Shares | | | Value | |
| | | | |
Exchange-Traded Funds: 34.07% | | | | | | | | | | | | | | | | |
Schwab International Equity ETF | | | | | | | | | | | 17,793 | | | $ | 493,222 | |
Schwab U.S. Aggregate Bond ETF | | | | | | | | | | | 1,008 | | | | 52,154 | |
Schwab U.S. Broad Market ETF | | | | | | | | | | | 22,939 | | | | 1,226,778 | |
| | | | |
Total Exchange-Traded Funds (Cost $1,724,106) | | | | | | | | | | | | | | | 1,772,154 | |
| | | | | | | | | | | | | | | | |
| | | | |
Investment Companies: 65.14% | | | | | | | | | | | | | | | | |
| | | | |
| Affiliated Master Portfolios: 15.93% | | | | | | | | | | | | | | | | |
Wells Fargo C&B Large Cap Value Portfolio | | | | | | | | | | | | | | | 222,682 | |
Wells Fargo Core Bond Portfolio | | | | | | | | | | | | | | | 62,785 | |
Wells Fargo Large Company Value Portfolio | | | | | | | | | | | | | | | 222,873 | |
Wells Fargo Real Return Portfolio | | | | | | | | | | | | | | | 26,452 | |
Wells Fargo Small Company Growth Portfolio | | | | | | | | | | | | | | | 144,398 | |
Wells Fargo Small Company Value Portfolio | | | | | | | | | | | | | | | 149,493 | |
| | | | |
| | | | | | | | | | | | | | | 828,683 | |
| | | | | | | | | | | | | | | | |
| | | | |
| Fixed-Income Funds: 2.33% | | | | | | | | | | | | | | | | |
Wells Fargo International Bond Fund Class R6 (l)† | | | | | | | | | | | 2,733 | | | | 26,374 | |
Wells Fargo Short-Term Bond Fund Institutional Class (l) | | | | | | | | | | | 5,420 | | | | 47,375 | |
Wells Fargo Strategic Income Fund Institutional Class (l) | | | | | | | | | | | 5,156 | | | | 47,278 | |
| | | | |
| | | | | | | | | | | | | | | 121,027 | |
| | | | | | | | | | | | | | | | |
| | | | |
| Equity Funds: 46.88% | | | | | | | | | | | | | | | | |
Calamos Market Neutral Income Fund Class I | | | | | | | | | | | 19,804 | | | | 258,835 | |
Wells Fargo Diversified International Fund Class R6 (l) | | | | | | | | | | | 52,266 | | | | 582,239 | |
Wells Fargo Emerging Markets Equity Income Fund Class R6 (l) | | | | | | | | | | | 26,794 | | | | 263,112 | |
Wells Fargo Endeavor Select Fund Institutional Class (l)† | | | | | | | | | | | 33,890 | | | | 319,918 | |
Wells Fargo Enterprise Fund Class R6 (l)† | | | | | | | | | | | 5,145 | | | | 233,604 | |
Wells Fargo Intrinsic Value Fund Class R6 (l) | | | | | | | | | | | 17,944 | | | | 219,818 | |
Wells Fargo Premier Large Company Growth Fund Class R6 (l)† | | | | | | | | | | | 21,777 | | | | 318,600 | |
Wells Fargo Special Mid Cap Value Fund Class R6 (l) | | | | | | | | | | | 6,758 | | | | 241,794 | |
| | | | |
| | | | | | | | | | | | | | | 2,437,920 | |
| | | | | | | | | | | | | | | | |
| | | | |
Total Investment Companies (Cost $3,422,674) | | | | | | | | | | | | | | | 3,387,630 | |
| | | | | | | | | | | | | | | | |
| | | | |
| | | Yield | | | Maturity date | | | Principal | | | | |
| Short-Term Investments: 0.17% | | | | | | | | | | | | | | | | |
| | | | |
| U.S. Treasury Securities: 0.17% | | | | | | | | | | | | | | | | |
U.S. Treasury Bill (z)# | | | 0.00 | % | | | 12-1-2016 | | | $ | 7,000 | | | | 7,000 | |
U.S. Treasury Bill (z)# | | | 0.35 | | | | 12-29-2016 | | | | 2,000 | | | | 1,999 | |
| | | | |
Total Short-Term Investments (Cost $8,999) | | | | | | | | | | | | | | | 8,999 | |
| | | | | | | | | | | | | | | | |
| | | | | | | | |
| Total investments in securities (Cost $5,155,779) * | | | 99.38 | % | | | 5,168,783 | |
Other assets and liabilities, net | | | 0.62 | | | | 32,101 | |
| | | | | | | | |
| Total net assets | | | 100.00 | % | | $ | 5,200,884 | |
| | | | | | | | |
The accompanying notes are an integral part of these financial statements.
| | | | |
| 40 | | Wells Fargo Dynamic Target Date Funds | | Portfolio of investments—November 30, 2016 (unaudited) |
DYNAMIC TARGET 2045 FUND
| (l) | The issuer of the security is an affiliated person of the Fund as defined in the Investment Company Act of 1940. |
| † | Non-income-earning security |
| (z) | Zero coupon security. The rate represents the current yield to maturity. |
| # | All or a portion of this security is segregated as collateral for investments in derivative instruments. |
| * | Cost for federal income tax purposes is $5,147,157 and unrealized gains (losses) consists of: |
| | | | |
Gross unrealized gains | | $ | 209,279 | |
Gross unrealized losses | | | (187,653 | ) |
| | | | |
Net unrealized gains | | $ | 21,626 | |
The accompanying notes are an integral part of these financial statements.
| | | | | | |
| Portfolio of investments—November 30, 2016 (unaudited) | | Wells Fargo Dynamic Target Date Funds | | | 41 | |
DYNAMIC TARGET 2050 FUND
| | | | | | | | | | | | | | | | |
| Security name | | | | | | | | Shares | | | Value | |
| | | | |
Exchange-Traded Funds: 34.11% | | | | | | | | | | | | | | | | |
Schwab International Equity ETF | | | | | | | | | | | 17,793 | | | $ | 493,222 | |
Schwab U.S. Aggregate Bond ETF | | | | | | | | | | | 983 | | | | 50,860 | |
Schwab U.S. Broad Market ETF | | | | | | | | | | | 22,918 | | | | 1,225,656 | |
| | | | |
Total Exchange-Traded Funds (Cost $1,721,766) | | | | | | | | | | | | | | | 1,769,738 | |
| | | | | | | | | | | | | | | | |
| | | | |
Investment Companies: 65.12% | | | | | | | | | | | | | | | | |
| | | | |
| Affiliated Master Portfolios: 15.91% | | | | | | | | | | | | | | | | |
Wells Fargo C&B Large Cap Value Portfolio | | | | | | | | | | | | | | | 222,585 | |
Wells Fargo Core Bond Portfolio | | | | | | | | | | | | | | | 60,945 | |
Wells Fargo Large Company Value Portfolio | | | | | | | | | | | | | | | 222,806 | |
Wells Fargo Real Return Portfolio | | | | | | | | | | | | | | | 25,471 | |
Wells Fargo Small Company Growth Portfolio | | | | | | | | | | | | | | | 144,595 | |
Wells Fargo Small Company Value Portfolio | | | | | | | | | | | | | | | 149,184 | |
| | | | |
| | | | | | | | | | | | | | | 825,586 | |
| | | | | | | | | | | | | | | | |
| | | | |
| Fixed Income Funds: 2.26% | | | | | | | | | | | | | | | | |
Wells Fargo International Bond Fund Class R6 (l) † | | | | | | | | | | | 2,632 | | | | 25,397 | |
Wells Fargo Short-Term Bond Fund Institutional Class (l) | | | | | | | | | | | 5,253 | | | | 45,909 | |
Wells Fargo Strategic Income Fund Institutional Class (l) | | | | | | | | | | | 4,996 | | | | 45,814 | |
| | | | |
| | | | | | | | | | | | | | | 117,120 | |
| | | | | | | | | | | | | | | | |
| | | | |
| Equity Funds: 46.95% | | | | | | | | | | | | | | | | |
Calamos Market Neutral Income Fund Class I | | | | | | | | | | | 19,747 | | | | 258,092 | |
Wells Fargo Diversified International Fund Class R6 (l) | | | | | | | | | | | 52,227 | | | | 581,814 | |
Wells Fargo Emerging Markets Equity Income Fund Class R6 (l) | | | | | | | | | | | 26,771 | | | | 262,893 | |
Wells Fargo Endeavor Select Fund Institutional Class (l)† | | | | | | | | | | | 33,845 | | | | 319,493 | |
Wells Fargo Enterprise Fund Class R6 (l)† | | | | | | | | | | | 5,150 | | | | 233,818 | |
Wells Fargo Intrinsic Value Fund Class R6 (l) | | | | | | | | | | | 17,935 | | | | 219,705 | |
Wells Fargo Premier Large Company Growth Fund Class R6 (l)† | | | | | | | | | | | 21,783 | | | | 318,688 | |
Wells Fargo Special Mid Cap Value Fund Class R6 (l) | | | | | | | | | | | 6,752 | | | | 241,571 | |
| | | | |
| | | | | | | | | | | | | | | 2,436,074 | |
| | | | | | | | | | | | | | | | |
| | | | |
Total Investment Companies (Cost $3,413,618) | | | | | | | | | | | | | | | 3,378,780 | |
| | | | | | | | | | | | | | | | |
| | | | |
| | | Yield | | | Maturity date | | | Principal | | | | |
| Short-Term Investments: 0.17% | | | | | | | | | | | | | | | | |
| | | | |
| U.S. Treasury Securities: 0.17% | | | | | | | | | | | | | | | | |
U.S. Treasury Bill #(z) | | | 0.00 | % | | | 12-1-2016 | | | $ | 7,000 | | | | 7,000 | |
U.S. Treasury Bill #(z) | | | 0.35 | | | | 12-29-2016 | | | | 2,000 | | | | 1,999 | |
| | | | |
Total Short-Term Investments (Cost $8,999) | | | | | | | | | | | | | | | 8,999 | |
| | | | | | | | | | | | | | | | |
| | | | | | | | |
| Total investments in securities (Cost $5,144,383) * | | | 99.40 | % | | | 5,157,517 | |
Other assets and liabilities, net | | | 0.60 | | | | 31,011 | |
| | | | | | | | |
| Total net assets | | | 100.00 | % | | $ | 5,188,528 | |
| | | | | | | | |
The accompanying notes are an integral part of these financial statements.
| | | | |
| 42 | | Wells Fargo Dynamic Target Date Funds | | Portfolio of investments—November 30, 2016 (unaudited) |
DYNAMIC TARGET 2050 FUND
| (l) | The issuer of the security is an affiliated person of the Fund as defined in the Investment Company Act of 1940. |
| † | Non-income-earning security |
| # | All or a portion of this security is segregated as collateral for investments in derivative instruments. |
| (z) | Zero coupon security. The rate represents the current yield to maturity. |
| * | Cost for federal income tax purposes is $5,135,694 and unrealized gains (losses) consists of: |
| | | | |
Gross unrealized gains | | $ | 208,960 | |
Gross unrealized losses | | | (187,137 | ) |
| | | | |
Net unrealized gains | | $ | 21,823 | |
The accompanying notes are an integral part of these financial statements.
| | | | | | |
| Portfolio of investments—November 30, 2016 (unaudited) | | Wells Fargo Dynamic Target Date Funds | | | 43 | |
DYNAMIC TARGET 2055 FUND
| | | | | | | | | | | | | | | | |
| Security name | | | | | | | | Shares | | | Value | |
| | | | |
Exchange-Traded Funds: 34.09% | | | | | | | | | | | | | | | | |
Schwab International Equity ETF | | | | | | | | | | | 17,759 | | | $ | 492,279 | |
Schwab U.S. Aggregate Bond ETF | | | | | | | | | | | 981 | | | | 50,757 | |
Schwab U.S. Broad Market ETF | | | | | | | | | | | 22,891 | | | | 1,224,212 | |
| | | | |
Total Exchange-Traded Funds (Cost $1,719,435) | | | | | | | | | | | | | | | 1,767,248 | |
| | | | | | | | | | | | | | | | |
| | | | |
Investment Companies: 65.07% | | | | | | | | | | | | | | | | |
| | | | |
| Affiliated Master Portfolios: 15.89% | | | | | | | | | | | | | | | | |
Wells Fargo C&B Large Cap Value Portfolio | | | | | | | | | | | | | | | 222,297 | |
Wells Fargo Core Bond Portfolio | | | | | | | | | | | | | | | 60,837 | |
Wells Fargo Large Company Value Portfolio | | | | | | | | | | | | | | | 222,518 | |
Wells Fargo Real Return Portfolio | | | | | | | | | | | | | | | 25,423 | |
Wells Fargo Small Company Growth Portfolio | | | | | | | | | | | | | | | 143,846 | |
Wells Fargo Small Company Value Portfolio | | | | | | | | | | | | | | | 148,939 | |
| | | | |
| | | | | | | | | | | | | | | 823,860 | |
| | | | | | | | | | | | | | | | |
| | | | |
| Fixed-Income Funds: 2.26% | | | | | | | | | | | | | | | | |
Wells Fargo International Bond Fund Class R6 (l)† | | | | | | | | | | | 2,627 | | | | 25,351 | |
Wells Fargo Short-Term Bond Fund Institutional Class (l) | | | | | | | | | | | 5,243 | | | | 45,827 | |
Wells Fargo Strategic Income Fund Institutional Class (l) | | | | | | | | | | | 4,987 | | | | 45,729 | |
| | | | |
| | | | | | | | | | | | | | | 116,907 | |
| | | | | | | | | | | | | | | | |
| | | | |
| Equity Funds: 46.92% | | | | | | | | | | | | | | | | |
Calamos Market Neutral Income Fund Class I | | | | | | | | | | | 19,744 | | | | 258,048 | |
Wells Fargo Diversified International Fund Class R6 (l) | | | | | | | | | | | 52,151 | | | | 580,959 | |
Wells Fargo Emerging Markets Equity Income Fund Class R6 (l) | | | | | | | | | | | 26,737 | | | | 262,557 | |
Wells Fargo Endeavor Select Fund Institutional Class (l)† | | | | | | | | | | | 33,815 | | | | 319,215 | |
Wells Fargo Enterprise Fund Class R6 (l)† | | | | | | | | | | | 5,136 | | | | 233,190 | |
Wells Fargo Intrinsic Value Fund Class R6 (l) | | | | | | | | | | | 17,914 | | | | 219,449 | |
Wells Fargo Premier Large Company Growth Fund Class R6 (l)† | | | | | | | | | | | 21,727 | | | | 317,866 | |
Wells Fargo Special Mid Cap Value Fund Class R6 (l) | | | | | | | | | | | 6,749 | | | | 241,483 | |
| | | | |
| | | | | | | | | | | | | | | 2,432,767 | |
| | | | | | | | | | | | | | | | |
| | | | |
Total Investment Companies (Cost $3,409,296) | | | | | | | | | | | | | | | 3,373,534 | |
| | | | | | | | | | | | | | | | |
| | | | |
| | | Yield | | | Maturity date | | | Principal | | | | |
| Short-Term Investments: 0.17% | | | | | | | | | | | | | | | | |
| | | | |
| U.S. Treasury Securities: 0.17% | | | | | | | | | | | | | | | | |
U.S. Treasury Bill #(z) | | | 0.00 | % | | | 12-1-2016 | | | $ | 7,000 | | | | 7,000 | |
U.S. Treasury Bill #(z) | | | 0.35 | | | | 12-29-2016 | | | | 2,000 | | | | 1,999 | |
| | | | |
Total Short-Term Investments (Cost $8,999) | | | | | | | | | | | | | | | 8,999 | |
| | | | | | | | | | | | | | | | |
| | | | | | | | |
| Total investments in securities (Cost $5,137,730) * | | | 99.33 | % | | | 5,149,781 | |
Other assets and liabilities, net | | | 0.67 | | | | 34,734 | |
| | | | | | | | |
| Total net assets | | | 100.00 | % | | $ | 5,184,515 | |
| | | | | | | | |
The accompanying notes are an integral part of these financial statements.
| | | | |
| 44 | | Wells Fargo Dynamic Target Date Funds | | Portfolio of investments—November 30, 2016 (unaudited) |
DYNAMIC TARGET 2055 FUND
| (l) | The issuer of the security is an affiliated person of the Fund as defined in the Investment Company Act of 1940. |
| † | Non-income-earning security |
| # | All or a portion of this security is segregated as collateral for investments in derivative instruments. |
| (z) | Zero coupon security. The rate represents the current yield to maturity. |
| * | Cost for federal income tax purposes is $5,129,233 and unrealized gains (losses) consists of: |
| | | | |
Gross unrealized gains | | $ | 208,554 | |
Gross unrealized losses | | | (188,006 | ) |
| | | | |
Net unrealized gains | | $ | 20,548 | |
The accompanying notes are an integral part of these financial statements.
| | | | | | |
| Portfolio of investments—November 30, 2016 (unaudited) | | Wells Fargo Dynamic Target Date Funds | | | 45 | |
DYNAMIC TARGET 2060 FUND
| | | | | | | | | | | | | | | | |
| Security name | | | | | | | | Shares | | | Value | |
| | | | |
Exchange-Traded Funds: 34.11% | | | | | | | | | | | | | | | | |
Schwab International Equity ETF | | | | | | | | | | | 17,793 | | | $ | 493,222 | |
Schwab U.S. Aggregate Bond ETF | | | | | | | | | | | 988 | | | | 51,119 | |
Schwab U.S. Broad Market ETF | | | | | | | | | | | 22,926 | | | | 1,226,084 | |
| | | | |
Total Exchange-Traded Funds (Cost $1,722,367) | | | | | | | | | | | | | | | 1,770,425 | |
| | | | | | | | | | | | | | | | |
| | | | |
Investment Companies: 65.11% | | | | | | | | | | | | | | | | |
| | | | |
| Affiliated Master Portfolios: 15.91% | | | | | | | | | | | | | | | | |
Wells Fargo C&B Large Cap Value Portfolio | | | | | | | | | | | | | | | 222,665 | |
Wells Fargo Core Bond Portfolio | | | | | | | | | | | | | | | 61,291 | |
Wells Fargo Large Company Value Portfolio | | | | | | | | | | | | | | | 222,868 | |
Wells Fargo Real Return Portfolio | | | | | | | | | | | | | | | 25,611 | |
Wells Fargo Small Company Growth Portfolio | | | | | | | | | | | | | | | 144,370 | |
Wells Fargo Small Company Value Portfolio | | | | | | | | | | | | | | | 149,238 | |
| | | | |
| | | | | | | | | | | | | | | 826,043 | |
| | | | | | | | | | | | | | | | |
| | | | |
| Fixed Income Funds: 2.27% | | | | | | | | | | | | | | | | |
Wells Fargo International Bond Fund Class R6 (l)† | | | | | | | | | | | 2,647 | | | | 25,541 | |
Wells Fargo Short-Term Bond Fund Institutional Class (l) | | | | | | | | | | | 5,282 | | | | 46,164 | |
Wells Fargo Strategic Income Fund Institutional Class (l) | | | | | | | | | | | 5,023 | | | | 46,065 | |
| | | | |
| | | | | | | | | | | | | | | 117,770 | |
| | | | | | | | | | | | | | | | |
| | | | |
| Equity Funds: 46.93% | | | | | | | | | | | | | | | | |
Calamos Market Neutral Income Fund Class I | | | | | | | | | | | 19,743 | | | | 258,036 | |
Wells Fargo Diversified International Fund Class R6 (l) | | | | | | | | | | | 52,246 | | | | 582,021 | |
Wells Fargo Emerging Markets Equity Income Fund Class R6 (l) | | | | | | | | | | | 26,779 | | | | 262,965 | |
Wells Fargo Endeavor Select Fund Institutional Class (l)† | | | | | | | | | | | 33,828 | | | | 319,333 | |
Wells Fargo Enterprise Fund Class R6 (l)† | | | | | | | | | | | 5,148 | | | | 233,699 | |
Wells Fargo Intrinsic Value Fund Class R6 (l) | | | | | | | | | | | 17,940 | | | | 219,766 | |
Wells Fargo Premier Large Company Growth Fund Class R6 (l)† | | | | | | | | | | | 21,763 | | | | 318,390 | |
Wells Fargo Special Mid Cap Value Fund Class R6 (l) | | | | | | | | | | | 6,754 | | | | 241,656 | |
| | | | |
| | | | | | | | | | | | | | | 2,435,866 | |
| | | | | | | | | | | | | | | | |
| | | | |
Total Investment Companies (Cost $3,415,486) | | | | | | | | | | | | | | | 3,379,679 | |
| | | | | | | | | | | | | | | | |
| | | | |
| | | Yield | | | Maturity date | | | Principal | | | | |
| Short-Term Investments: 0.18% | | | | | | | | | | | | | | | | |
| | | | |
| U.S. Treasury Securities: 0.18% | | | | | | | | | | | | | | | | |
U.S. Treasury Bill #(z) | | | 0.00 | % | | | 12-1-2016 | | | $ | 7,000 | | | | 7,000 | |
U.S. Treasury Bill #(z) | | | 0.35 | | | | 12-29-2016 | | | | 2,000 | | | | 1,999 | |
| | | | |
Total Short-Term Investments (Cost $8,999) | | | | | | | | | | | | | | | 8,999 | |
| | | | | | | | | | | | | | | | |
| | | | | | | | |
| Total investments in securities (Cost $5,146,852) * | | | 99.40 | % | | | 5,159,103 | |
Other assets and liabilities, net | | | 0.60 | | | | 31,392 | |
| | | | | | | | |
| Total net assets | | | 100.00 | % | | $ | 5,190,495 | |
| | | | | | | | |
The accompanying notes are an integral part of these financial statements.
| | | | |
| 46 | | Wells Fargo Dynamic Target Date Funds | | Portfolio of investments—November 30, 2016 (unaudited) |
DYNAMIC TARGET 2060 FUND
| (l) | The issuer of the security is an affiliated person of the Fund as defined in the Investment Company Act of 1940. |
| † | Non-income-earning security |
| # | All or a portion of this security is segregated as collateral for investments in derivative instruments. |
| (z) | Zero coupon security. The rate represents the current yield to maturity. |
| * | Cost for federal income tax purposes is $5,137,972 and unrealized gains (losses) consists of: |
| | | | |
Gross unrealized gains | | $ | 208,957 | |
Gross unrealized losses | | | (187,826 | ) |
| | | | |
Net unrealized gains | | $ | 21,131 | |
The accompanying notes are an integral part of these financial statements.
This page is intentionally left blank.
| | | | |
| 48 | | Wells Fargo Dynamic Target Date Funds | | Statements of assets and liabilities—November 30, 2016 (unaudited) |
| | | | | | | | |
| | | Dynamic Target
Today Fund | | | Dynamic Target
2015 Fund | |
| | |
Assets | | | | | | | | |
Investments | | | | | | | | |
In affiliated Underlying Funds, at value (see cost below) | | $ | 2,144,232 | | | $ | 2,278,914 | |
In unaffiliated Underlying Funds and securities, at value (see cost below) | | | 1,749,431 | | | | 1,929,841 | |
In affiliated Master Portfolios, at value (see cost below) | | | 1,234,307 | | | | 1,169,756 | |
| | | | |
Total investments, at value (see cost below) | | | 5,127,970 | | | | 5,378,511 | |
Cash | | | 0 | | | | 0 | |
Receivable for investments sold | | | 4,028 | | | | 4,779 | |
Receivable for dividends | | | 624 | | | | 486 | |
Receivable for daily variation margin on open futures contracts | | | 594 | | | | 594 | |
Receivable from manager | | | 17,361 | | | | 16,876 | |
Prepaid expenses and other assets | | | 73,094 | | | | 76,010 | |
| | | | |
Total assets | | | 5,223,671 | | | | 5,477,256 | |
| | | | |
| | |
Liabilities | | | | | | | | |
Payable for investments purchased | | | 3,314 | | | | 3,850 | |
Due to custodian bank | | | 4,040 | | | | 4,792 | |
Distribution fees payable | | | 84 | | | | 83 | |
Administration fees payable | | | 180 | | | | 222 | |
Shareholder report expenses payable | | | 26,822 | | | | 26,323 | |
Custodian and accounting fees payable | | | 19,806 | | | | 19,204 | |
Professional fees payable | | | 9,520 | | | | 9,520 | |
Accrued expenses and other liabilities | | | 1,354 | | | | 1,409 | |
| | | | |
Total liabilities | | | 65,120 | | | | 65,403 | |
| | | | |
Total net assets | | $ | 5,158,551 | | | $ | 5,411,853 | |
| | | | |
| | |
NET ASSETS CONSIST OF | | | | | | | | |
Paid-in capital | | $ | 5,095,017 | | | $ | 5,333,843 | |
Undistributed net investment income | | | 8,287 | | | | 6,536 | |
Accumulated net realized gains on investments | | | 49,367 | | | | 58,695 | |
Net unrealized gains on investments | | | 5,880 | | | | 12,779 | |
| | | | |
Total net assets | | $ | 5,158,551 | | | $ | 5,411,853 | |
| | | | |
| | |
COMPUTATION OF NET ASSET VALUE AND OFFERING PRICE PER SHARE | | | | | | | | |
Net assets – Class A | | $ | 124,188 | | | $ | 372,330 | |
Shares outstanding – Class A1 | | | 12,241 | | | | 36,692 | |
Net asset value per share – Class A | | | $10.15 | | | | $10.15 | |
Maximum offering price per share – Class A2 | | | $10.77 | | | | $10.77 | |
Net assets – Class C | | $ | 101,547 | | | $ | 101,650 | |
Shares outstanding – Class C1 | | | 10,054 | | | | 10,052 | |
Net asset value per share – Class C | | | $10.10 | | | | $10.11 | |
Net assets – Class R | | $ | 102,058 | | | $ | 102,163 | |
Shares outstanding – Class R1 | | | 10,095 | | | | 10,094 | |
Net asset value per share – Class R | | | $10.11 | | | | $10.12 | |
Net assets – Class R4 | | $ | 102,630 | | | $ | 102,735 | |
Share outstanding – Class R41 | | | 10,138 | | | | 10,137 | |
Net asset value per share – Class R4 | | | $10.12 | | | | $10.13 | |
Net assets – Class R6 | | $ | 4,728,128 | | | $ | 4,732,975 | |
Shares outstanding – Class R61 | | | 466,940 | | | | 466,877 | |
Net asset value per share – Class R6 | | | $10.13 | | | | $10.14 | |
| | |
Investments in affiliated Underlying Funds, at cost | | $ | 2,203,224 | | | $ | 2,363,520 | |
| | | | |
Investments in unaffiliated Underlying Funds and securities, at cost | | $ | 1,726,793 | | | $ | 1,895,244 | |
| | | | |
Investments in affiliated Master Portfolios, at cost | | $ | 1,192,283 | | | $ | 1,107,178 | |
| | | | |
Total investments, at cost | | $ | 5,122,300 | | | $ | 5,365,942 | |
| | | | |
| 1 | Each Fund has an unlimited number of authorized shares. |
| 2 | Maximum offering price is computed as 100/94.25 of net asset value. On investments of $50,000 or more, the offering price is reduced. |
The accompanying notes are an integral part of these financial statements.
| | | | | | |
| Statements of assets and liabilities—November 30, 2016 (unaudited) | | Wells Fargo Dynamic Target Date Funds | | | 49 | |
| | | | | | | | | | | | | | | | | | | | | | | | | | |
Dynamic Target
2020 Fund | | | Dynamic Target
2025 Fund | | | Dynamic Target
2030 Fund | | | Dynamic Target
2035 Fund | | | Dynamic Target
2040 Fund | | | Dynamic Target
2045 Fund | | | Dynamic Target
2050 Fund | |
| | | | | | |
| | | | | | | | | | | | | | | | | | | | | | | | | | |
| | | | | | | | | | | | | | | | | | | | | | | | | | |
| $ | 2,286,082 | | | $ | 2,354,113 | | | $ | 2,353,066 | | | $ | 2,315,327 | | | $ | 2,355,128 | | | $ | 2,300,112 | | | $ | 2,295,102 | |
| | 1,958,839 | | | | 2,033,856 | | | | 2,047,196 | | | | 2,015,068 | | | | 2,050,949 | | | | 2,039,988 | | | | 2,036,829 | |
| | 1,082,028 | | | | 1,032,417 | | | | 953,426 | | | | 884,495 | | | | 847,280 | | | | 828,683 | | | | 825,586 | |
| | |
| | 5,326,949 | | | | 5,420,386 | | | | 5,353,688 | | | | 5,214,890 | | | | 5,253,357 | | | | 5,168,783 | | | | 5,157,517 | |
| | 0 | | | | 0 | | | | 1,922 | | | | 0 | | | | 0 | | | | 0 | | | | 0 | |
| | 3,752 | | | | 3,859 | | | | 3,591 | | | | 4,020 | | | | 2,840 | | | | 4,127 | | | | 4,019 | |
| | 377 | | | | 286 | | | | 188 | | | | 121 | | | | 75 | | | | 58 | | | | 56 | |
| | 594 | | | | 594 | | | | 594 | | | | 594 | | | | 594 | | | | 594 | | | | 594 | |
| | 16,364 | | | | 18,592 | | | | 18,624 | | | | 18,637 | | | | 16,741 | | | | 17,134 | | | | 17,849 | |
| | 78,928 | | | | 64,594 | | | | 64,058 | | | | 64,057 | | | | 75,028 | | | | 73,464 | | | | 68,792 | |
| | |
| | 5,426,964 | | | | 5,508,311 | | | | 5,442,665 | | | | 5,302,319 | | | | 5,348,635 | | | | 5,264,160 | | | | 5,248,827 | |
| | |
| | | | | | |
| | | | | | | | | | | | | | | | | | | | | | | | | | |
| | 5,738 | | | | 3,646 | | | | 9,052 | | | | 5,488 | | | | 5,438 | | | | 3,434 | | | | 5,436 | |
| | 1,752 | | | | 3,860 | | | | 0 | | | | 1,998 | | | | 834 | | | | 4,099 | | | | 1,995 | |
| | 84 | | | | 91 | | | | 83 | | | | 83 | | | | 83 | | | | 83 | | | | 83 | |
| | 210 | | | | 224 | | | | 207 | | | | 187 | | | | 191 | | | | 180 | | | | 177 | |
| | 26,222 | | | | 26,565 | | | | 26,343 | | | | 26,373 | | | | 26,556 | | | | 26,378 | | | | 24,333 | |
| | 18,901 | | | | 18,466 | | | | 18,127 | | | | 18,308 | | | | 18,172 | | | | 18,228 | | | | 18,371 | |
| | 8,474 | | | | 8,743 | | | | 8,743 | | | | 8,743 | | | | 8,181 | | | | 9,520 | | | | 8,563 | |
| | 1,390 | | | | 1,400 | | | | 1,379 | | | | 1,358 | | | | 1,354 | | | | 1,354 | | | | 1,341 | |
| | |
| | 62,771 | | | | 62,995 | | | | 63,934 | | | | 62,538 | | | | 60,809 | | | | 63,276 | | | | 60,299 | |
| | |
| $ | 5,364,193 | | | $ | 5,445,316 | | | $ | 5,378,731 | | | $ | 5,239,781 | | | $ | 5,287,826 | | | $ | 5,200,884 | | | $ | 5,188,528 | |
| | |
| | | | | | |
| | | | | | | | | | | | | | | | | | | | | | | | | | |
| $ | 5,219,431 | | | $ | 5,300,010 | | | $ | 5,236,033 | | | $ | 5,100,838 | | | $ | 5,151,718 | | | $ | 5,055,859 | | | $ | 5,043,780 | |
| | 50,584 | | | | 46,067 | | | | 41,274 | | | | 38,177 | | | | 36,048 | | | | 35,531 | | | | 35,448 | |
| | 92,830 | | | | 87,253 | | | | 93,109 | | | | 91,771 | | | | 84,290 | | | | 96,280 | | | | 95,956 | |
| | 1,348 | | | | 11,986 | | | | 8,315 | | | | 8,995 | | | | 15,770 | | | | 13,214 | | | | 13,344 | |
| | |
| $ | 5,364,193 | | | $ | 5,445,316 | | | $ | 5,378,731 | | | $ | 5,239,781 | | | $ | 5,287,826 | | | $ | 5,200,884 | | | $ | 5,188,528 | |
| | |
| | | | | | |
| | | | | | | | | | | | | | | | | | | | | | | | | | |
| $ | 300,435 | | | $ | 373,831 | | | $ | 315,891 | | | $ | 174,528 | | | $ | 225,245 | | | $ | 127,518 | | | $ | 114,880 | |
| | 29,330 | | | | 36,547 | | | | 30,873 | | | | 17,053 | | | | 22,040 | | | | 12,445 | | | | 11,212 | |
| | $10.24 | | | | $10.23 | | | | $10.23 | | | | $10.23 | | | | $10.22 | | | | $10.25 | | | | $10.25 | |
| | $10.86 | | | | $10.85 | | | | $10.85 | | | | $10.85 | | | | $10.84 | | | | $10.88 | | | | $10.88 | |
| $ | 102,138 | | | $ | 114,056 | | | $ | 102,118 | | | $ | 102,167 | | | $ | 102,113 | | | $ | 102,331 | | | $ | 102,337 | |
| | 10,041 | | | | 11,228 | | | | 10,050 | | | | 10,053 | | | | 10,056 | | | | 10,056 | | | | 10,056 | |
| | $10.17 | | | | $10.16 | | | | $10.16 | | | | $10.16 | | | | $10.15 | | | | $10.18 | | | | $10.18 | |
| $ | 102,657 | | | $ | 102,572 | | | $ | 102,645 | | | $ | 102,694 | | | $ | 102,640 | | | $ | 102,858 | | | $ | 102,861 | |
| | 10,046 | | | | 10,051 | | | | 10,055 | | | | 10,058 | | | | 10,061 | | | | 10,061 | | | | 10,061 | |
| | $10.22 | | | | $10.21 | | | | $10.21 | | | | $10.21 | | | | $10.20 | | | | $10.22 | | | | $10.22 | |
| $ | 103,229 | | | $ | 103,141 | | | $ | 103,206 | | | $ | 103,257 | | | $ | 103,202 | | | $ | 103,423 | | | $ | 103,429 | |
| | 10,051 | | | | 10,056 | | | | 10,060 | | | | 10,063 | | | | 10,065 | | | | 10,066 | | | | 10,066 | |
| | $10.27 | | | | $10.26 | | | | $10.26 | | | | $10.26 | | | | $10.25 | | | | $10.27 | | | | $10.28 | |
| $ | 4,755,734 | | | $ | 4,751,716 | | | $ | 4,754,871 | | | $ | 4,757,135 | | | $ | 4,754,626 | | | $ | 4,764,754 | | | $ | 4,765,021 | |
| | 462,410 | | | | 462,646 | | | | 462,826 | | | | 462,960 | | | | 463,073 | | | | 463,098 | | | | 463,100 | |
| | $10.28 | | | | $10.27 | | | | $10.27 | | | | $10.28 | | | | $10.27 | | | | $10.29 | | | | $10.29 | |
| | | | | | |
| $ | 2,395,085 | | | $ | 2,472,899 | | | $ | 2,489,080 | | | $ | 2,459,261 | | | $ | 2,501,176 | | | $ | 2,450,080 | | | $ | 2,444,729 | |
| | |
| $ | 1,923,461 | | | $ | 1,990,640 | | | $ | 2,001,582 | | | $ | 1,967,341 | | | $ | 1,999,479 | | | $ | 1,988,670 | | | $ | 1,985,582 | |
| | |
| $ | 1,007,265 | | | $ | 945,071 | | | $ | 854,921 | | | $ | 779,503 | | | $ | 737,142 | | | $ | 717,029 | | | $ | 714,072 | |
| | |
| $ | 5,325,811 | | | $ | 5,408,610 | | | $ | 5,345,583 | | | $ | 5,206,105 | | | $ | 5,237,797 | | | $ | 5,155,779 | | | $ | 5,144,383 | |
| | |
The accompanying notes are an integral part of these financial statements.
| | | | |
| 50 | | Wells Fargo Dynamic Target Date Funds | | Statements of assets and liabilities—November 30, 2016 (unaudited) |
| | | | | | | | |
| | | Dynamic Target
2055 Fund | | | Dynamic Target
2060 Fund | |
| | |
Assets | | | | | | | | |
Investments | | | | | | | | |
In affiliated Underlying Funds, at value (see cost below) | | $ | 2,291,626 | | | $ | 2,295,600 | |
In unaffiliated Underlying Funds and securities, at value (see cost below) | | | 2,034,295 | | | | 2,037,460 | |
In affiliated Master Portfolios, at value (see cost below) | | | 823,860 | | | | 826,043 | |
| | | | |
Total investments, at value (see cost below) | | | 5,149,781 | | | | 5,159,103 | |
Receivable for investments sold | | | 4,073 | | | | 3,966 | |
Receivable for dividends | | | 56 | | | | 56 | |
Receivable for daily variation margin on open futures contracts | | | 594 | | | | 594 | |
Receivable from manager | | | 17,250 | | | | 17,793 | |
Prepaid expenses and other assets | | | 73,083 | | | | 69,115 | |
| | | | |
Total assets | | | 5,244,837 | | | | 5,250,627 | |
| | | | |
| | |
Liabilities | | | | | | | | |
Payable for investments purchased | | | 3,430 | | | | 3,430 | |
Due to custodian bank | | | 4,054 | | | | 3,948 | |
Distribution fees payable | | | 83 | | | | 83 | |
Administration fees payable | | | 177 | | | | 176 | |
Shareholder report expenses payable | | | 24,335 | | | | 24,353 | |
Custodian and accounting fees payable | | | 18,313 | | | | 18,213 | |
Professional fees payable | | | 8,562 | | | | 8,562 | |
Accrued expenses and other liabilities | | | 1,368 | | | | 1,367 | |
| | | | |
Total liabilities | | | 60,322 | | | | 60,132 | |
| | | | |
Total net assets | | $ | 5,184,515 | | | $ | 5,190,495 | |
| | | | |
| | |
NET ASSETS CONSIST OF | | | | | | | | |
Paid-in capital | | $ | 5,038,727 | | | $ | 5,038,573 | |
Undistributed net investment income | | | 35,425 | | | | 35,497 | |
Accumulated net realized gains on investments | | | 98,102 | | | | 103,964 | |
Net unrealized gains on investments | | | 12,261 | | | | 12,461 | |
| | | | |
Total net assets | | $ | 5,184,515 | | | $ | 5,190,495 | |
| | | | |
| | |
COMPUTATION OF NET ASSET VALUE AND OFFERING PRICE PER SHARE | | | | | | | | |
Net assets – Class A | | $ | 109,632 | | | $ | 109,215 | |
Shares outstanding – Class A1 | | | 10,698 | | | | 10,643 | |
Net asset value per share – Class A | | | $10.25 | | | | $10.26 | |
Maximum offering price per share – Class A2 | | | $10.88 | | | | $10.89 | |
Net assets – Class C | | $ | 102,362 | | | $ | 102,490 | |
Shares outstanding – Class C1 | | | 10,056 | | | | 10,056 | |
Net asset value per share – Class C | | | $10.18 | | | | $10.19 | |
Net assets – Class R | | $ | 102,886 | | | $ | 103,016 | |
Shares outstanding – Class R1 | | | 10,061 | | | | 10,061 | |
Net asset value per share – Class R | | | $10.23 | | | | $10.24 | |
Net assets – Class R4 | | $ | 103,454 | | | $ | 103,584 | |
Share outstanding – Class R41 | | | 10,066 | | | | 10,066 | |
Net asset value per share – Class R4 | | | $10.28 | | | | $10.29 | |
Net assets – Class R6 | | $ | 4,766,181 | | | $ | 4,772,190 | |
Shares outstanding – Class R61 | | | 463,100 | | | | 463,099 | |
Net asset value per share – Class R6 | | | $10.29 | | | | $10.30 | |
| | |
Investments in affiliated Underlying Funds, at cost | | $ | 2,441,987 | | | $ | 2,446,142 | |
| | | | |
Investments in unaffiliated Underlying Funds and securities, at cost | | $ | 1,983,211 | | | $ | 1,986,177 | |
| | | | |
Investments in affiliated Master Portfolios, at cost | | $ | 712,532 | | | $ | 714,533 | |
| | | | |
Total investments, at cost | | $ | 5,137,730 | | | $ | 5,146,852 | |
| | | | |
| 1 | Each Fund has an unlimited number of authorized shares. |
| 2 | Maximum offering price is computed as 100/94.25 of net asset value. On investments of $50,000 or more, the offering price is reduced. |
The accompanying notes are an integral part of these financial statements.
This page is intentionally left blank.
| | | | |
| 52 | | Wells Fargo Dynamic Target Date Funds | | Statements of operations—six months ended November 30, 2016 (unaudited) |
| | | | | | | | |
| | | Dynamic Target
Today Fund | | | Dynamic Target
2015 Fund | |
| | |
Investment income | | | | | | | | |
Dividends from unaffiliated Underlying Funds | | $ | 14,832 | | | $ | 14,753 | |
Dividends from affiliated Underlying Funds | | | 10,741 | | | | 9,392 | |
Dividends allocated from affiliated Master Portfolios* | | | 2,745 | | | | 3,692 | |
Interest allocated from affiliated Master Portfolios** | | | 10,595 | | | | 8,130 | |
Interest | | | 4 | | | | 6 | |
Securities lending income allocated from affiliated Master Portfolios | | | 167 | | | | 190 | |
Affiliated income allocated from affiliated Master Portfolios | | | 74 | | | | 68 | |
Expenses allocated from affiliated Master Portfolios | | | (3,014 | ) | | | (3,070 | ) |
Waivers allocated from affiliated Master Portfolios | | | 169 | | | | 140 | |
| | | | |
Total investment income | | | 36,313 | | | | 33,301 | |
| | | | |
| | |
Expenses | | | | | | | | |
Management fee | | | 5,195 | | | | 5,384 | |
Administration fees | | | | | | | | |
Class A | | | 131 | | | | 357 | |
Class C | | | 108 | | | | 107 | |
Class R | | | 108 | | | | 108 | |
Class R4 | | | 42 | | | | 41 | |
Class R6 | | | 714 | | | | 711 | |
Shareholder servicing fees | | | | | | | | |
Class A | | | 156 | | | | 425 | |
Class C | | | 128 | | | | 128 | |
Class R | | | 129 | | | | 128 | |
Class R4 | | | 52 | | | | 51 | |
Distribution fees | | | | | | | | |
Class C | | | 385 | | | | 383 | |
Class R | | | 129 | | | | 128 | |
Custody and accounting fees | | | 12,997 | | | | 13,001 | |
Professional fees | | | 13,889 | | | | 13,889 | |
Registration fees | | | 38,651 | | | | 35,735 | |
Shareholder report expenses | | | 27,419 | | | | 27,346 | |
Trustees’ fees and expenses | | | 12,057 | | | | 12,057 | |
Other fees and expenses | | | 1,792 | | | | 1,829 | |
| | | | |
Total expenses | | | 114,082 | | | | 111,808 | |
Less: Fee waivers and/or expense reimbursements | | | (110,986 | ) | | | (108,237 | ) |
| | | | |
Net expenses | | | 3,096 | | | | 3,571 | |
| | | | |
Net investment income | | | 33,217 | | | | 29,730 | |
| | | | |
| | |
REALIZED AND UNREALIZED GAINS (LOSSES) ON INVESTMENTS | | | | | | | | |
| | |
Net realized gains (losses) on: | | | | | | | | |
Unaffiliated Underlying Funds | | | 1,224 | | | | 23 | |
Affiliated Underlying Funds | | | (1,163 | ) | | | (2,741 | ) |
Futures transactions | | | 5,650 | | | | 3,664 | |
Securities transactions allocated from affiliated Master Portfolios | | | 13,967 | | | | 16,807 | |
| | | | |
Net realized gains on investments | | | 19,678 | | | | 17,753 | |
| | | | |
| | |
Net change in unrealized gains (losses) on: | | | | | | | | |
Unaffiliated Underlying Funds | | | 13,013 | | | | 30,292 | |
Affiliated Underlying Funds | | | 14,373 | | | | 25,938 | |
Futures transactions | | | 841 | | | | 841 | |
Securities transactions allocated from affiliated Master Portfolios | | | (2,119 | ) | | | 9,303 | |
| | | | |
Net change in unrealized gains (losses) on investments | | | 26,108 | | | | 66,374 | |
| | | | |
Net realized and unrealized gains (losses) on investments | | | 45,786 | | | | 84,127 | |
| | | | |
Net increase in net assets resulting from operations | | $ | 79,003 | | | $ | 113,857 | |
| | | | |
| | |
* Net of foreign dividend withholding taxes allocated from affiliated Master Portfolios in the amount of | | | $52 | | | | $65 | |
** Net of foreign interest withholding taxes allocated from affiliated Master Portfolios in the amount of | | | $5 | | | | $4 | |
The accompanying notes are an integral part of these financial statements.
| | | | | | |
| Statements of operations—six months ended November 30, 2016 (unaudited) | | Wells Fargo Dynamic Target Date Funds | | | 53 | |
| | | | | | | | | | | | | | | | | | | | | | | | | | |
Dynamic Target
2020 Fund | | | Dynamic Target
2025 Fund | | | Dynamic Target
2030 Fund | | | Dynamic Target
2035 Fund | | | Dynamic Target
2040 Fund | | | Dynamic Target
2045 Fund | | | Dynamic Target
2050 Fund | |
| | | | | | |
| | | | | | | | | | | | | | | | | | | | | | | | | | |
| $ | 13,848 | | | $ | 13,360 | | | $ | 12,510 | | | $ | 11,879 | | | $ | 11,830 | | | $ | 11,755 | | | $ | 11,722 | |
| | 8,204 | | | | 7,266 | | | | 6,261 | | | | 5,564 | | | | 5,107 | | | | 4,887 | | | | 4,857 | |
| | 4,179 | | | | 4,688 | | | | 5,118 | | | | 5,371 | | | | 5,580 | | | | 5,623 | | | | 5,613 | |
| | 6,274 | | | | 4,695 | | | | 3,077 | | | | 2,011 | | | | 1,233 | | | | 968 | | | | 943 | |
| | 7 | | | | 8 | | | | 12 | | | | 12 | | | | 12 | | | | 13 | | | | 13 | |
| | 197 | | | | 208 | | | | 215 | | | | 219 | | | | 222 | | | | 222 | | | | 222 | |
| | 60 | | | | 55 | | | | 49 | | | | 46 | | | | 43 | | | | 42 | | | | 41 | |
| | (3,007 | ) | | | (2,998 | ) | | | (2,937 | ) | | | (2,891 | ) | | | (2,864 | ) | | | (2,842 | ) | | | (2,833 | ) |
| | 117 | | | | 98 | | | | 77 | | | | 63 | | | | 54 | | | | 50 | | | | 49 | |
| | |
| | 29,879 | | | | 27,380 | | | | 24,382 | | | | 22,274 | | | | 21,217 | | | | 20,718 | | | | 20,627 | |
| | |
| | | | | | |
| | | | | | | | | | | | | | | | | | | | | | | | | | |
| | 5,306 | | | | 5,312 | | | | 5,234 | | | | 5,156 | | | | 5,149 | | | | 5,117 | | | | 5,104 | |
| | | | | | | | | | | | | | | | | | | | | | | | | | |
| | 271 | | | | 293 | | | | 237 | | | | 168 | | | | 172 | | | | 131 | | | | 117 | |
| | 107 | | | | 117 | | | | 106 | | | | 106 | | | | 106 | | | | 106 | | | | 106 | |
| | 108 | | | | 107 | | | | 107 | | | | 106 | | | | 106 | | | | 106 | | | | 106 | |
| | 41 | | | | 41 | | | | 41 | | | | 41 | | | | 41 | | | | 41 | | | | 41 | |
| | 711 | | | | 708 | | | | 706 | | | | 704 | | | | 702 | | | | 703 | | | | 703 | |
| | | | | | | | | | | | | | | | | | | | | | | | | | |
| | 323 | | | | 348 | | | | 282 | | | | 200 | | | | 205 | | | | 156 | | | | 139 | |
| | 128 | | | | 139 | | | | 127 | | | | 126 | | | | 126 | | | | 126 | | | | 126 | |
| | 128 | | | | 128 | | | | 127 | | | | 127 | | | | 126 | | | | 127 | | | | 127 | |
| | 51 | | | | 51 | | | | 51 | | | | 51 | | | | 51 | | | | 51 | | | | 51 | |
| | | | | | | | | | | | | | | | | | | | | | | | | | |
| | 383 | | | | 417 | | | | 380 | | | | 379 | | | | 378 | | | | 379 | | | | 379 | |
| | 128 | | | | 128 | | | | 127 | | | | 127 | | | | 126 | | | | 127 | | | | 127 | |
| | 12,999 | | | | 12,999 | | | | 12,998 | | | | 12,996 | | | | 12,996 | | | | 12,996 | | | | 12,994 | |
| | 13,882 | | | | 13,921 | | | | 13,921 | | | | 13,921 | | | | 13,840 | | | | 13,889 | | | | 13,792 | |
| | 32,982 | | | | 46,397 | | | | 46,930 | | | | 46,930 | | | | 35,494 | | | | 37,920 | | | | 42,397 | |
| | 27,207 | | | | 27,470 | | | | 27,342 | | | | 27,342 | | | | 27,417 | | | | 27,265 | | | | 27,247 | |
| | 12,057 | | | | 12,055 | | | | 12,055 | | | | 12,055 | | | | 12,056 | | | | 12,057 | | | | 12,056 | |
| | 1,779 | | | | 1,801 | | | | 1,800 | | | | 1,802 | | | | 1,801 | | | | 1,804 | | | | 1,793 | |
| | |
| | 108,591 | | | | 122,432 | | | | 122,571 | | | | 122,337 | | | | 110,892 | | | | 113,101 | | | | 117,405 | |
| | (105,030 | ) | | | (118,641 | ) | | | (118,764 | ) | | | (118,743 | ) | | | (107,181 | ) | | | (109,537 | ) | | | (113,878 | ) |
| | |
| | 3,561 | | | | 3,791 | | | | 3,807 | | | | 3,594 | | | | 3,711 | | | | 3,564 | | | | 3,527 | |
| | |
| | 26,318 | | | | 23,589 | | | | 20,575 | | | | 18,680 | | | | 17,506 | | | | 17,154 | | | | 17,100 | |
| | |
| | | | | | |
| | | | | | | | | | | | | | | | | | | | | | | | | | |
| | | | | | |
| | | | | | | | | | | | | | | | | | | | | | | | | | |
| | 339 | | | | (78 | ) | | | 44 | | | | (193 | ) | | | (306 | ) | | | (263 | ) | | | (270 | ) |
| | (2,146 | ) | | | (2,658 | ) | | | (4,616 | ) | | | (4,327 | ) | | | (5,496 | ) | | | (5,628 | ) | | | (5,763 | ) |
| | 3,295 | | | | 231 | | | | (3,958 | ) | | | 644 | | | | (1,502 | ) | | | (17 | ) | | | (16 | ) |
| | 18,232 | | | | 19,830 | | | | 21,060 | | | | 21,756 | | | | 22,332 | | | | 22,471 | | | | 22,420 | |
| | |
| | 19,720 | | | | 17,325 | | | | 12,530 | | | | 17,880 | | | | 15,028 | | | | 16,563 | | | | 16,371 | |
| | |
| | | | | | |
| | | | | | | | | | | | | | | | | | | | | | | | | | |
| | 41,520 | | | | 52,299 | | | | 62,512 | | | | (122,251 | ) | | | 73,997 | | | | 74,930 | | | | 74,839 | |
| | 32,799 | | | | 38,955 | | | | 46,965 | | | | 242,223 | | | | 54,836 | | | | 55,360 | | | | 55,457 | |
| | 841 | | | | 841 | | | | 841 | | | | 841 | | | | 841 | | | | 841 | | | | 841 | |
| | 17,349 | | | | 24,319 | | | | 31,480 | | | | 35,290 | | | | 38,599 | | | | 39,559 | | | | 39,618 | |
| | |
| | 92,509 | | | | 116,414 | | | | 141,798 | | | | 156,103 | | | | 168,273 | | | | 170,690 | | | | 170,755 | |
| | |
| | 112,229 | | | | 133,739 | | | | 154,328 | | | | 173,983 | | | | 183,301 | | | | 187,253 | | | | 187,126 | |
| | |
| $ | 138,547 | | | $ | 157,328 | | | $ | 174,903 | | | $ | 192,663 | | | $ | 200,807 | | | $ | 204,407 | | | $ | 204,226 | |
| | |
| | | | | | |
| | $71 | | | | $77 | | | | $82 | | | | $85 | | | | $87 | | | | $88 | | | | $88 | |
| | $3 | | | | $2 | | | | $1 | | | | $1 | | | | $0 | | | | $0 | | | | $0 | |
The accompanying notes are an integral part of these financial statements.
| | | | |
| 54 | | Wells Fargo Dynamic Target Date Funds | | Statements of operations—six months ended November 30, 2016 (unaudited) |
| | | | | | | | |
| | | Dynamic Target
2055 Fund | | | Dynamic Target
2060 Fund | |
| | |
Investment income | | | | | | | | |
Dividends from unaffiliated Underlying Funds | | $ | 11,713 | | | $ | 11,727 | |
Dividends from affiliated Underlying Funds | | | 4,851 | | | | 4,857 | |
Dividends allocated from affiliated Master Portfolios* | | | 5,608 | | | | 5,615 | |
Interest allocated from affiliated Master Portfolios | | | 942 | | | | 943 | |
Interest | | | 12 | | | | 12 | |
Securities lending income allocated from affiliated Master Portfolios | | | 221 | | | | 222 | |
Affiliated income allocated from affiliated Master Portfolios | | | 41 | | | | 41 | |
Expenses allocated from affiliated Master Portfolios | | | (2,830 | ) | | | (2,833 | ) |
Waivers allocated from affiliated Master Portfolios | | | 49 | | | | 49 | |
| | | | |
Total investment income | | | 20,607 | | | | 20,633 | |
| | | | |
| | |
Expenses | | | | | | | | |
Management fee | | | 5,101 | | | | 5,105 | |
Administration fees | | | | | | | | |
Class A | | | 112 | | | | 110 | |
Class C | | | 106 | | | | 106 | |
Class R | | | 106 | | | | 107 | |
Class R4 | | | 41 | | | | 41 | |
Class R6 | | | 703 | | | | 704 | |
Shareholder servicing fees | | | | | | | | |
Class A | | | 133 | | | | 131 | |
Class C | | | 126 | | | | 126 | |
Class R | | | 127 | | | | 127 | |
Class R4 | | | 51 | | | | 51 | |
Distribution fees | | | | | | | | |
Class C | | | 379 | | | | 379 | |
Class R | | | 127 | | | | 127 | |
Custody and accounting fees | | | 12,996 | | | | 12,995 | |
Professional fees | | | 13,792 | | | | 13,793 | |
Registration fees | | | 38,718 | | | | 42,030 | |
Shareholder report expenses | | | 27,247 | | | | 27,247 | |
Trustees’ fees and expenses | | | 12,056 | | | | 12,056 | |
Other fees and expenses | | | 1,827 | | | | 1,821 | |
| | | | |
Total expenses | | | 113,748 | | | | 117,056 | |
Less: Fee waivers and/or expense reimbursements | | | (110,228 | ) | | | (113,541 | ) |
| | | | |
Net expenses | | | 3,520 | | | | 3,515 | |
| | | | |
Net investment income | | | 17,087 | | | | 17,118 | |
| | | | |
| | |
REALIZED AND UNREALIZED GAINS (LOSSES) ON INVESTMENTS | | | | | | | | |
| | |
Net realized gains (losses) on: | | | | | | | | |
Securities transactions allocated from affiliated Master Portfolios | | | 22,398 | | | | 22,470 | |
Unaffiliated Underlying Funds | | | (288 | ) | | | (303 | ) |
Affiliated Underlying Funds | | | (5,692 | ) | | | (5,805 | ) |
Futures transactions | | | (1,137 | ) | | | (1,139 | ) |
| | | | |
Net realized gains on investments | | | 15,281 | | | | 15,223 | |
| | | | |
| | |
Net change in unrealized gains (losses) on: | | | | | | | | |
Securities transactions allocated from affiliated Master Portfolios | | | 39,500 | | | | 39,571 | |
Unaffiliated Underlying Funds | | | 74,787 | | | | 74,844 | |
Affiliated Underlying Funds | | | 55,343 | | | | 55,406 | |
Futures transactions | | | 841 | | | | 841 | |
| | | | |
Net change in unrealized gains (losses) on investments | | | 170,471 | | | | 170,662 | |
| | | | |
Net realized and unrealized gains (losses) on investments | | | 185,752 | | | | 185,885 | |
| | | | |
Net increase in net assets resulting from operations | | $ | 202,839 | | | $ | 203,003 | |
| | | | |
| | |
* Net of foreign dividend withholding taxes allocated from affiliated Master Portfolios in the amount of | | | $87 | | | | $88 | |
The accompanying notes are an integral part of these financial statements.
| | | | | | |
| Statements of changes in net assets | | Wells Fargo Dynamic Target Date Funds | | | 55 | |
| | | | | | | | | | | | | | | | |
| | | Dynamic Target Today Fund | |
| | | Six months ended November 30, 2016 (unaudited) | | | Year ended May 31, 20161 | |
| | | | |
Operations | | | | | | | | | | | | | | | | |
Net investment income | | | | | | $ | 33,217 | | | | | | | $ | 42,317 | |
Net realized gains on investments | | | | | | | 19,678 | | | | | | | | 35,759 | |
Net change in unrealized gains (losses) on investments | | | | | | | 26,108 | | | | | | | | (20,228 | ) |
| | | | |
Net increase in net assets resulting from operations | | | | | | | 79,003 | | | | | | | | 57,848 | |
| | | | |
| | | | |
Distributions to shareholders from | | | | | | | | | | | | | | | | |
Net investment income | | | | | | | | | | | | | | | | |
Class A | | | | | | | (586 | ) | | | | | | | (341 | ) |
Class C | | | | | | | (262 | ) | | | | | | | (274 | ) |
Class R | | | | | | | (625 | ) | | | | | | | (321 | ) |
Class R4 | | | | | | | (1,017 | ) | | | | | | | (368 | ) |
Class R6 | | | | | | | (51,873 | ) | | | | | | | (17,595 | ) |
| | | | |
Total distributions to shareholders | | | | | | | (54,363 | ) | | | | | | | (18,899 | ) |
| | | | |
| | | | |
Capital share transactions | | | Shares | | | | | | | | Shares | | | | | |
Proceeds from shares sold | | | | | | | | | | | | | | | | |
Class A | | | 2,149 | | | | 21,700 | | | | 10,000 | | | | 100,000 | |
Class C | | | 0 | | | | 0 | | | | 10,000 | | | | 100,000 | |
Class R | | | 0 | | | | 0 | | | | 10,000 | | | | 100,000 | |
Class R4 | | | 0 | | | | 0 | | | | 10,000 | | | | 100,000 | |
Class R6 | | | 0 | | | | 0 | | | | 460,000 | | | | 4,600,000 | |
| | | | |
| | | | | | | 21,700 | | | | | | | | 5,000,000 | |
| | | | |
Reinvestment of distributions | | | | | | | | | | | | | | | | |
Class A | | | 57 | | | | 586 | | | | 35 | | | | 341 | |
Class C | | | 26 | | | | 262 | | | | 28 | | | | 274 | |
Class R | | | 62 | | | | 625 | | | | 33 | | | | 321 | |
Class R4 | | | 101 | | | | 1,017 | | | | 37 | | | | 368 | |
Class R6 | | | 5,156 | | | | 51,873 | | | | 1,784 | | | | 17,595 | |
| | | | |
| | | | | | | 54,363 | | | | | | | | 18,899 | |
| | | | |
Net increase in net assets resulting from capital share transactions | | | | | | | 76,063 | | | | | | | | 5,018,899 | |
| | | | |
Total increase in net assets | | | | | | | 100,703 | | | | | | | | 5,057,848 | |
| | | | |
| | | | |
Net assets | | | | | | | | | | | | | | | | |
Beginning of period | | | | | | | 5,057,848 | | | | | | | | 0 | |
| | | | |
End of period | | | | | | $ | 5,158,551 | | | | | | | $ | 5,057,848 | |
| | | | |
Undistributed net investment income | | | | | | $ | 8,287 | | | | | | | $ | 29,433 | |
| | | | |
| 1 | For the period from November 30, 2015 (commencement of operations) to May 31, 2016 |
The accompanying notes are an integral part of these financial statements.
| | | | |
| 56 | | Wells Fargo Dynamic Target Date Funds | | Statements of changes in net assets |
| | | | | | | | | | | | | | | | |
| | | Dynamic Target 2015 Fund | |
| | | Six months ended
November 30, 2016
(unaudited) | | | Year ended
May 31, 20161 | |
| | | |
Operations | | | | | | | | | | | | |
Net investment income | | | | | | $ | 29,730 | | | | | | | $ | 42,044 | |
Net realized gains on investments | | | | | | | 17,753 | | | | | | | | 48,714 | |
Net change in unrealized gains (losses) on investments | | | | | | | 66,374 | | | | | | | | (53,595 | ) |
| | | | |
Net increase in net assets resulting from operations | | | | | | | 113,857 | | | | | | | | 37,163 | |
| | | | |
| | | | |
Distributions to shareholders from | | | | | | | | | | | | | | | | |
Net investment income | | | | | | | | | | | | | | | | |
Class A | | | | | | | (1,517 | ) | | | | | | | (429 | ) |
Class C | | | | | | | (154 | ) | | | | | | | (361 | ) |
Class R | | | | | | | (516 | ) | | | | | | | (409 | ) |
Class R4 | | | | | | | (900 | ) | | | | | | | (457 | ) |
Class R6 | | | | | | | (46,460 | ) | | | | | | | (21,726 | ) |
| | | | |
Total distributions to shareholders | | | | | | | (49,547 | ) | | | | | | | (23,382 | ) |
| | | | |
| | | | |
Capital share transactions | | | Shares | | | | | | | | Shares | | | | | |
Proceeds from shares sold | | | | | | | | | | | | | | | | |
Class A | | | 19,056 | | | | 194,009 | | | | 20,347 | | | | 196,247 | |
Class C | | | 0 | | | | 0 | | | | 10,000 | | | | 100,000 | |
Class R | | | 0 | | | | 0 | | | | 10,000 | | | | 100,000 | |
Class R4 | | | 0 | | | | 0 | | | | 10,000 | | | | 100,000 | |
Class R6 | | | 0 | | | | 0 | | | | 460,000 | | | | 4,600,000 | |
| | | | |
| | | | | | | 194,009 | | | | | | | | 5,096,247 | |
| | | | |
Reinvestment of distributions | | | | | | | | | | | | | | | | |
Class A | | | 150 | | | | 1,517 | | | | 44 | | | | 429 | |
Class C | | | 15 | | | | 154 | | | | 37 | | | | 361 | |
Class R | | | 52 | | | | 516 | | | | 42 | | | | 409 | |
Class R4 | | | 90 | | | | 900 | | | | 47 | | | | 457 | |
Class R6 | | | 4,665 | | | | 46,460 | | | | 2,212 | | | | 21,726 | |
| | | | |
| | | | | | | 49,547 | | | | | | | | 23,382 | |
| | | | |
Payment for shares redeemed | | | | | | | | | | | | | | | | |
Class A | | | (2,395 | ) | | | (24,423 | ) | | | (510 | ) | | | (5,000 | ) |
| | | | |
Net increase in net assets resulting from capital share transactions | | | | | | | 219,133 | | | | | | | | 5,114,629 | |
| | | | |
Total increase in net assets | | | | | | | 283,443 | | | | | | | | 5,128,410 | |
| | | | |
| | | | |
Net assets | | | | | | | | | | | | | | | | |
Beginning of period | | | | | | | 5,128,410 | | | | | | | | 0 | |
| | | | |
End of period | | | | | | $ | 5,411,853 | | | | | | | $ | 5,128,410 | |
| | | | |
Undistributed net investment income | | | | | | $ | 6,536 | | | | | | | $ | 26,353 | |
| | | | |
| 1 | For the period from November 30, 2015 (commencement of operations) to May 31, 2016 |
The accompanying notes are an integral part of these financial statements.
| | | | | | |
| Statements of changes in net assets | | Wells Fargo Dynamic Target Date Funds | | | 57 | |
| | | | | | | | | | | | | | | | |
| | | Dynamic Target 2020 Fund | |
| | | Six months ended
November 30, 2016
(unaudited) | | | Year ended
May 31, 20161 | |
| | | |
Operations | | | | | | | | | | | | |
Net investment income | | | | | | $ | 26,318 | | | | | | | $ | 41,009 | |
Net realized gains on investments | | | | | | | 19,720 | | | | | | | | 81,951 | |
Net change in unrealized gains (losses) on investments | | | | | | | 92,509 | | | | | | | | (91,161 | ) |
| | | | |
Net increase in net assets resulting from operations | | | | | | | 138,547 | | | | | | | | 31,799 | |
| | | | |
| | | | |
Distributions to shareholders from | | | | | | | | | | | | | | | | |
Net investment income | | | | | | | | | | | | | | | | |
Class A | | | | | | | 0 | | | | | | | | (520 | ) |
Class C | | | | | | | 0 | | | | | | | | (402 | ) |
Class R | | | | | | | 0 | | | | | | | | (451 | ) |
Class R4 | | | | | | | 0 | | | | | | | | (499 | ) |
Class R6 | | | | | | | 0 | | | | | | | | (23,616 | ) |
| | | | |
Total distributions to shareholders | | | | | | | 0 | | | | | | | | (25,488 | ) |
| | | | |
| | | | |
Capital share transactions | | | Shares | | | | | | | | Shares | | | | | |
Proceeds from shares sold | | | | | | | | | | | | | | | | |
Class A | | | 19,488 | | | | 196,012 | | | | 13,233 | | | | 131,778 | |
Class C | | | 0 | | | | 0 | | | | 10,000 | | | | 100,000 | |
Class R | | | 0 | | | | 0 | | | | 10,000 | | | | 100,000 | |
Class R4 | | | 0 | | | | 0 | | | | 10,000 | | | | 100,000 | |
Class R6 | | | 0 | | | | 0 | | | | 460,000 | | | | 4,600,000 | |
| | | | |
| | | | | | | 196,012 | | | | | | | | 5,031,778 | |
| | | | |
Reinvestment of distributions | | | | | | | | | | | | | | | | |
Class A | | | 0 | | | | 0 | | | | 53 | | | | 520 | |
Class C | | | 0 | | | | 0 | | | | 41 | | | | 402 | |
Class R | | | 0 | | | | 0 | | | | 46 | | | | 451 | |
Class R4 | | | 0 | | | | 0 | | | | 51 | | | | 499 | |
Class R6 | | | 0 | | | | 0 | | | | 2,410 | | | | 23,616 | |
| | | | |
| | | | | | | 0 | | | | | | | | 25,488 | |
| | | | |
Payment for shares redeemed | | | | | | | | | | | | | | | | |
Class A | | | (2,055 | ) | | | (20,863 | ) | | | (1,389 | ) | | | (13,080 | ) |
| | | | |
Net increase in net assets resulting from capital share transactions | | | | | | | 175,149 | | | | | | | | 5,044,186 | |
| | | | |
Total increase in net assets | | | | | | | 313,696 | | | | | | | | 5,050,497 | |
| | | | |
| | | | |
Net assets | | | | | | | | | | | | | | | | |
Beginning of period | | | | | | | 5,050,497 | | | | | | | | 0 | |
| | | | |
End of period | | | | | | $ | 5,364,193 | | | | | | | $ | 5,050,497 | |
| | | | |
Undistributed net investment income | | | | | | $ | 50,584 | | | | | | | $ | 24,266 | |
| | | | |
| 1 | For the period from November 30, 2015 (commencement of operations) to May 31, 2016 |
The accompanying notes are an integral part of these financial statements.
| | | | |
| 58 | | Wells Fargo Dynamic Target Date Funds | | Statements of changes in net assets |
| | | | | | | | | | | | | | | | |
| | | Dynamic Target 2025 Fund | |
| | | Six months ended
November 30, 2016
(unaudited) | | | Year ended
May 31, 20161 | |
| | | |
Operations | | | | | | | | | | | | |
Net investment income | | | | | | $ | 23,589 | | | | | | | $ | 40,675 | |
Net realized gains on investments | | | | | | | 17,325 | | | | | | | | 79,735 | |
Net change in unrealized gains (losses) on investments | | | | | | | 116,414 | | | | | | | | (104,428 | ) |
| | | | |
Net increase in net assets resulting from operations | | | | | | | 157,328 | | | | | | | | 15,982 | |
| | | | |
| | | | |
Distributions to shareholders from | | | | | | | | | | | | | | | | |
Net investment income | | | | | | | | | | | | | | | | |
Class A | | | | | | | 0 | | | | | | | | (520 | ) |
Class C | | | | | | | 0 | | | | | | | | (451 | ) |
Class R | | | | | | | 0 | | | | | | | | (500 | ) |
Class R4 | | | | | | | 0 | | | | | | | | (548 | ) |
Class R6 | | | | | | | 0 | | | | | | | | (25,875 | ) |
| | | | |
Total distributions to shareholders | | | | | | | 0 | | | | | | | | (27,894 | ) |
| | | | |
| | | | |
Capital share transactions | | | Shares | | | | | | | | Shares | | | | | |
Proceeds from shares sold | | | | | | | | | | | | | | | | |
Class A | | | 18,095 | | | | 184,419 | | | | 18,841 | | | | 180,465 | |
Class C | | | 1,182 | | | | 11,622 | | | | 10,000 | | | | 100,000 | |
Class R | | | 0 | | | | 0 | | | | 10,000 | | | | 100,000 | |
Class R4 | | | 0 | | | | 0 | | | | 10,000 | | | | 100,000 | |
Class R6 | | | 0 | | | | 0 | | | | 460,000 | | | | 4,600,000 | |
| | | | |
| | | | | | | 196,041 | | | | | | | | 5,080,465 | |
| | | | |
Reinvestment of distributions | | | | | | | | | | | | | | | | |
Class A | | | 0 | | | | 0 | | | | 53 | | | | 520 | |
Class C | | | 0 | | | | 0 | | | | 46 | | | | 451 | |
Class R | | | 0 | | | | 0 | | | | 51 | | | | 500 | |
Class R4 | | | 0 | | | | 0 | | | | 56 | | | | 548 | |
Class R6 | | | 0 | | | | 0 | | | | 2,646 | | | | 25,875 | |
| | | | |
| | | | | | | 0 | | | | | | | | 27,894 | |
| | | | |
Payment for shares redeemed | | | | | | | | | | | | | | | | |
Class A | | | (442 | ) | | | (4,500 | ) | | | 0 | | | | 0 | |
| | | | |
Net increase in net assets resulting from capital share transactions | | | | | | | 191,541 | | | | | | | | 5,108,359 | |
| | | | |
Total increase in net assets | | | | | | | 348,869 | | | | | | | | 5,096,447 | |
| | | | |
| | | | |
Net assets | | | | | | | | | | | | | | | | |
Beginning of period | | | | | | | 5,096,447 | | | | | | | | 0 | |
| | | | |
End of period | | | | | | $ | 5,445,316 | | | | | | | $ | 5,096,447 | |
| | | | |
Undistributed net investment income | | | | | | $ | 46,067 | | | | | | | $ | 22,478 | |
| | | | |
| 1 | For the period from November 30, 2015 (commencement of operations) to May 31, 2016 |
The accompanying notes are an integral part of these financial statements.
| | | | | | |
| Statements of changes in net assets | | Wells Fargo Dynamic Target Date Funds | | | 59 | |
| | | | | | | | | | | | | | | | |
| | | Dynamic Target 2030 Fund | |
| | | Six months ended
November 30, 2016
(unaudited) | | | Year ended
May 31, 20161 | |
| | | |
Operations | | | | | | | | | | | | |
Net investment income | | | | | | $ | 20,575 | | | | | | | $ | 39,856 | |
Net realized gains on investments | | | | | | | 12,530 | | | | | | | | 91,357 | |
Net change in unrealized gains (losses) on investments | | | | | | | 141,798 | | | | | | | | (133,483 | ) |
| | | | |
Net increase (decrease) in net assets resulting from operations | | | | | | | 174,903 | | | | | | | | (2,270 | ) |
| | | | |
| | | | |
Distributions to shareholders from | | | | | | | | | | | | | | | | |
Net investment income | | | | | | | | | | | | | | | | |
Class A | | | | | | | 0 | | | | | | | | (584 | ) |
Class C | | | | | | | 0 | | | | | | | | (490 | ) |
Class R | | | | | | | 0 | | | | | | | | (536 | ) |
Class R4 | | | | | | | 0 | | | | | | | | (586 | ) |
Class R6 | | | | | | | 0 | | | | | | | | (27,614 | ) |
| | | | |
Total distributions to shareholders | | | | | | | 0 | | | | | | | | (29,810 | ) |
| | | | |
| | | | |
Capital share transactions | | | Shares | | | | | | | | Shares | | | | | |
Proceeds from shares sold | | | | | | | | | | | | | | | | |
Class A | | | 14,566 | | | | 146,733 | | | | 17,435 | | | | 171,391 | |
Class C | | | 0 | | | | 0 | | | | 10,000 | | | | 100,000 | |
Class R | | | 0 | | | | 0 | | | | 10,000 | | | | 100,000 | |
Class R4 | | | 0 | | | | 0 | | | | 10,000 | | | | 100,000 | |
Class R6 | | | 0 | | | | 0 | | | | 460,000 | | | | 4,600,000 | |
| | | | |
| | | | | | | 146,733 | | | | | | | | 5,071,391 | |
| | | | |
Reinvestment of distributions | | | | | | | | | | | | | | | | |
Class A | | | 0 | | | | 0 | | | | 60 | | | | 584 | |
Class C | | | 0 | | | | 0 | | | | 50 | | | | 490 | |
Class R | | | 0 | | | | 0 | | | | 55 | | | | 536 | |
Class R4 | | | 0 | | | | 0 | | | | 60 | | | | 586 | |
Class R6 | | | 0 | | | | 0 | | | | 2,826 | | | | 27,614 | |
| | | | |
| | | | | | | 0 | | | | | | | | 29,810 | |
| | | | |
Payment for shares redeemed | | | | | | | | | | | | | | | | |
Class A | | | (1,188 | ) | | | (12,026 | ) | | | 0 | | | | 0 | |
| | | | |
Net increase in net assets resulting from capital share transactions | | | | | | | 134,707 | | | | | | | | 5,101,201 | |
| | | | |
Total increase in net assets | | | | | | | 309,610 | | | | | | | | 5,069,121 | |
| | | | |
| | | | |
Net assets | | | | | | | | | | | | | | | | |
Beginning of period | | | | | | | 5,069,121 | | | | | | | | 0 | |
| | | | |
End of period | | | | | | $ | 5,378,731 | | | | | | | $ | 5,069,121 | |
| | | | |
Undistributed net investment income | | | | | | $ | 41,274 | | | | | | | $ | 20,699 | |
| | | | |
| 1 | For the period from November 30, 2015 (commencement of operations) to May 31, 2016 |
The accompanying notes are an integral part of these financial statements.
| | | | |
| 60 | | Wells Fargo Dynamic Target Date Funds | | Statements of changes in net assets |
| | | | | | | | | | | | | | | | |
| | | Dynamic Target 2035 Fund | |
| | | Six months ended
November 30, 2016
(unaudited) | | | Year ended
May 31, 20161 | |
| | | | |
Operations | | | | | | | | | | | | | | | | |
Net investment income | | | | | | $ | 18,680 | | | | | | | $ | 39,429 | |
Net realized gains on investments | | | | | | | 17,880 | | | | | | | | 85,319 | |
Net change in unrealized gains (losses) on investments | | | | | | | 156,103 | | | | | | | | (147,108 | ) |
| | | | |
Net increase (decrease) in net assets resulting from operations | | | | | | | 192,663 | | | | | | | | (22,360 | ) |
| | | | |
| | | | |
Distributions to shareholders from | | | | | | | | | | | | | | | | |
Net investment income | | | | | | | | | | | | | | | | |
Class A | | | | | | | 0 | | | | | | | | (676 | ) |
Class C | | | | | | | 0 | | | | | | | | (517 | ) |
Class R | | | | | | | 0 | | | | | | | | (564 | ) |
Class R4 | | | | | | | 0 | | | | | | | | (613 | ) |
Class R6 | | | | | | | 0 | | | | | | | | (28,856 | ) |
| | | | |
Total distributions to shareholders | | | | | | | 0 | | | | | | | | (31,226 | ) |
| | | | |
| | | | |
Capital share transactions | | | Shares | | | | | | | | Shares | | | | | |
Proceeds from shares sold | | | | | | | | | | | | | | | | |
Class A | | | 4,987 | | | | 49,991 | | | | 11,997 | | | | 119,487 | |
Class C | | | 0 | | | | 0 | | | | 10,000 | | | | 100,000 | |
Class R | | | 0 | | | | 0 | | | | 10,000 | | | | 100,000 | |
Class R4 | | | 0 | | | | 0 | | | | 10,000 | | | | 100,000 | |
Class R6 | | | 0 | | | | 0 | | | | 460,000 | | | | 4,600,000 | |
| | | | |
| | | | | | | 49,991 | | | | | | | | 5,019,487 | |
| | | | |
Reinvestment of distributions | | | | | | | | | | | | | | | | |
Class A | | | 0 | | | | 0 | | | | 69 | | | | 676 | |
Class C | | | 0 | | | | 0 | | | | 53 | | | | 517 | |
Class R | | | 0 | | | | 0 | | | | 58 | | | | 564 | |
Class R4 | | | 0 | | | | 0 | | | | 63 | | | | 613 | |
Class R6 | | | 0 | | | | 0 | | | | 2,960 | | | | 28,856 | |
| | | | |
| | | | | | | 0 | | | | | | | | 31,226 | |
| | | | |
Net increase in net assets resulting from capital share transactions | | | | | | | 49,991 | | | | | | | | 5,050,713 | |
| | | | |
Total increase in net assets | | | | | | | 242,654 | | | | | | | | 4,997,127 | |
| | | | |
| | | | |
Net assets | | | | | | | | | | | | | | | | |
Beginning of period | | | | | | | 4,997,127 | | | | | | | | 0 | |
| | | | |
End of period | | | | | | $ | 5,239,781 | | | | | | | $ | 4,997,127 | |
| | | | |
Undistributed net investment income | | | | | | $ | 38,177 | | | | | | | $ | 19,497 | |
| | | | |
| 1 | For the period from November 30, 2015 (commencement of operations) to May 31, 2016 |
The accompanying notes are an integral part of these financial statements.
| | | | | | |
| Statements of changes in net assets | | Wells Fargo Dynamic Target Date Funds | | | 61 | |
| | | | | | | | | | | | | | | | |
| | | Dynamic Target 2040 Fund | |
| | | Six months ended
November 30, 2016
(unaudited) | | | Year ended
May 31, 20161 | |
| | | |
Operations | | | | | | | | | | | | |
Net investment income | | | | | | $ | 17,506 | | | | | | | $ | 39,222 | |
Net realized gains on investments | | | | | | | 15,028 | | | | | | | | 81,116 | |
Net change in unrealized gains (losses) on investments | | | | | | | 168,273 | | | | | | | | (152,503 | ) |
| | | | |
Net increase (decrease) in net assets resulting from operations | | | | | | | 200,807 | | | | | | | | (32,165 | ) |
| | | | |
| | | | |
Distributions to shareholders from | | | | | | | | | | | | | | | | |
Net investment income | | | | | | | | | | | | | | | | |
Class A | | | | | | | 0 | | | | | | | | (695 | ) |
Class C | | | | | | | 0 | | | | | | | | (544 | ) |
Class R | | | | | | | 0 | | | | | | | | (589 | ) |
Class R4 | | | | | | | 0 | | | | | | | | (637 | ) |
Class R6 | | | | | | | 0 | | | | | | | | (29,928 | ) |
| | | | |
Total distributions to shareholders | | | | | | | 0 | | | | | | | | (32,393 | ) |
| | | | |
| | | | |
Capital share transactions | | | Shares | | | | | | | | Shares | | | | | |
Proceeds from shares sold | | | | | | | | | | | | | | | | |
Class A | | | 6,843 | | | | 69,348 | | | | 15,876 | | | | 157,099 | |
Class C | | | 0 | | | | 0 | | | | 10,000 | | | | 100,000 | |
Class R | | | 0 | | | | 0 | | | | 10,000 | | | | 100,000 | |
Class R4 | | | 0 | | | | 0 | | | | 10,000 | | | | 100,000 | |
Class R6 | | | 0 | | | | 0 | | | | 460,000 | | | | 4,600,000 | |
| | | | |
| | | | | | | 69,348 | | | | | | | | 5,057,099 | |
| | | | |
Reinvestment of distributions | | | | | | | | | | | | | | | | |
Class A | | | 0 | | | | 0 | | | | 71 | | | | 695 | |
Class C | | | 0 | | | | 0 | | | | 56 | | | | 544 | |
Class R | | | 0 | | | | 0 | | | | 61 | | | | 589 | |
Class R4 | | | 0 | | | | 0 | | | | 65 | | | | 637 | |
Class R6 | | | 0 | | | | 0 | | | | 3,073 | | | | 29,928 | |
| | | | |
| | | | | | | 0 | | | | | | | | 32,393 | |
| | | | |
Payment for shares redeemed | | | | | | | | | | | | | | | | |
Class A | | | (750 | ) | | | (7,263 | ) | | | 0 | | | | 0 | |
| | | | |
Net increase in net assets resulting from capital share transactions | | | | | | | 62,085 | | | | | | | | 5,089,492 | |
| | | | |
Total increase in net assets | | | | | | | 262,892 | | | | | | | | 5,024,934 | |
| | | | |
| | | | |
Net assets | | | | | | | | | | | | | | | | |
Beginning of period | | | | | | | 5,024,934 | | | | | | | | 0 | |
| | | | |
End of period | | | | | | $ | 5,287,826 | | | | | | | $ | 5,024,934 | |
| | | | |
Undistributed net investment income | | | | | | $ | 36,048 | | | | | | | $ | 18,542 | |
| | | | |
| 1 | For the period from November 30, 2015 (commencement of operations) to May 31, 2016 |
The accompanying notes are an integral part of these financial statements.
| | | | |
| 62 | | Wells Fargo Dynamic Target Date Funds | | Statements of changes in net assets |
| | | | | | | | | | | | | | | | |
| | | Dynamic Target 2045 Fund | |
| | | Six months ended
November 30, 2016
(unaudited) | | | Year ended
May 31, 20161 | |
| | | | |
Operations | | | | | | | | | | | | | | | | |
Net investment income | | | | | | $ | 17,154 | | | | | | | $ | 39,213 | |
Net realized gains on investments | | | | | | | 16,563 | | | | | | | | 91,680 | |
Net change in unrealized gains (losses) on investments | | | | | | | 170,690 | | | | | | | | (157,476 | ) |
| | | | |
Net increase (decrease) in net assets resulting from operations | | | | | | | 204,407 | | | | | | | | (26,583 | ) |
| | | | |
| | | | |
Distributions to shareholders from | | | | | | | | | | | | | | | | |
Net investment income | | | | | | | | | | | | | | | | |
Class A | | | | | | | 0 | | | | | | | | (695 | ) |
Class C | | | | | | | 0 | | | | | | | | (549 | ) |
Class R | | | | | | | 0 | | | | | | | | (595 | ) |
Class R4 | | | | | | | 0 | | | | | | | | (642 | ) |
Class R6 | | | | | | | 0 | | | | | | | | (30,176 | ) |
| | | | |
Total distributions to shareholders | | | | | | | 0 | | | | | | | | (32,657 | ) |
| | | | |
| | | | |
Capital share transactions | | | Shares | | | | | | | | Shares | | | | | |
Proceeds from shares sold | | | | | | | | | | | | | | | | |
Class A | | | 160 | | | | 1,600 | | | | 12,214 | | | | 121,460 | |
Class C | | | 0 | | | | 0 | | | | 10,000 | | | | 100,000 | |
Class R | | | 0 | | | | 0 | | | | 10,000 | | | | 100,000 | |
Class R4 | | | 0 | | | | 0 | | | | 10,000 | | | | 100,000 | |
Class R6 | | | 0 | | | | 0 | | | | 460,000 | | | | 4,600,000 | |
| | | | |
| | | | | | | 1,600 | | | | | | | | 5,021,460 | |
| | | | |
Reinvestment of distributions | | | | | | | | | | | | | | | | |
Class A | | | 0 | | | | 0 | | | | 71 | | | | 695 | |
Class C | | | 0 | | | | 0 | | | | 56 | | | | 549 | |
Class R | | | 0 | | | | 0 | | | | 61 | | | | 595 | |
Class R4 | | | 0 | | | | 0 | | | | 66 | | | | 642 | |
Class R6 | | | 0 | | | | 0 | | | | 3,098 | | | | 30,176 | |
| | | | |
| | | | | | | 0 | | | | | | | | 32,657 | |
| | | | |
Net increase in net assets resulting from capital share transactions | | | | | | | 1,600 | | | | | | | | 5,054,117 | |
| | | | |
Total increase in net assets | | | | | | | 206,007 | | | | | | | | 4,994,877 | |
| | | | |
| | | | |
Net assets | | | | | | | | | | | | | | | | |
Beginning of period | | | | | | | 4,994,877 | | | | | | | | 0 | |
| | | | |
End of period | | | | | | $ | 5,200,884 | | | | | | | $ | 4,994,877 | |
| | | | |
Undistributed net investment income | | | | | | $ | 35,531 | | | | | | | $ | 18,377 | |
| | | | |
| 1 | For the period from November 30, 2015 (commencement of operations) to May 31, 2016 |
The accompanying notes are an integral part of these financial statements.
| | | | | | |
| Statements of changes in net assets | | Wells Fargo Dynamic Target Date Funds | | | 63 | |
| | | | | | | | | | | | | | | | |
| | | Dynamic Target 2050 Fund | |
| | | Six months ended
November 30, 2016
(unaudited) | | | Year ended
May 31, 20161 | |
| | | | |
Operations | | | | | | | | | | | | | | | | |
Net investment income | | | | | | $ | 17,100 | | | | | | | $ | 39,113 | |
Net realized gains on investments | | | | | | | 16,371 | | | | | | | | 91,547 | |
Net change in unrealized gains (losses) on investments | | | | | | | 170,755 | | | | | | | | (157,411 | ) |
| | | | |
Net increase (decrease) in net assets resulting from operations | | | | | | | 204,226 | | | | | | | | (26,751 | ) |
| | | | |
| | | | |
Distributions to shareholders from | | | | | | | | | | | | | | | | |
Net investment income | | | | | | | | | | | | | | | | |
Class A | | | | | | | 0 | | | | | | | | (614 | ) |
Class C | | | | | | | 0 | | | | | | | | (546 | ) |
Class R | | | | | | | 0 | | | | | | | | (593 | ) |
Class R4 | | | | | | | 0 | | | | | | | | (642 | ) |
Class R6 | | | | | | | 0 | | | | | | | | (30,190 | ) |
| | | | |
Total distributions to shareholders | | | | | | | 0 | | | | | | | | (32,585 | ) |
| | | | |
| | | | |
Capital share transactions | | | Shares | | | | | | | | Shares | | | | | |
Proceeds from shares sold | | | | | | | | | | | | | | | | |
Class A | | | 219 | | | | 2,200 | | | | 10,930 | | | | 108,853 | |
Class C | | | 0 | | | | 0 | | | | 10,000 | | | | 100,000 | |
Class R | | | 0 | | | | 0 | | | | 10,000 | | | | 100,000 | |
Class R4 | | | 0 | | | | 0 | | | | 10,000 | | | | 100,000 | |
Class R6 | | | 0 | | | | 0 | | | | 460,000 | | | | 4,600,000 | |
| | | | |
| | | | | | | 2,200 | | | | | | | | 5,008,853 | |
| | | | |
Reinvestment of distributions | | | | | | | | | | | | | | | | |
Class A | | | 0 | | | | 0 | | | | 63 | | | | 614 | |
Class C | | | 0 | | | | 0 | | | | 56 | | | | 546 | |
Class R | | | 0 | | | | 0 | | | | 61 | | | | 593 | |
Class R4 | | | 0 | | | | 0 | | | | 66 | | | | 642 | |
Class R6 | | | 0 | | | | 0 | | | | 3,100 | | | | 30,190 | |
| | | | |
| | | | | | | 0 | | | | | | | | 32,585 | |
| | | | |
Net increase in net assets resulting from capital share transactions | | | | | | | 2,200 | | | | | | | | 5,041,438 | |
| | | | |
Total increase in net assets | | | | | | | 206,426 | | | | | | | | 4,982,102 | |
| | | | |
| | | | |
Net assets | | | | | | | | | | | | | | | | |
Beginning of period | | | | | | | 4,982,102 | | | | | | | | 0 | |
| | | | |
End of period | | | | | | $ | 5,188,528 | | | | | | | $ | 4,982,102 | |
| | | | |
Undistributed net investment income | | | | | | $ | 35,448 | | | | | | | $ | 18,348 | |
| | | | |
| 1 | For the period from November 30, 2015 (commencement of operations) to May 31, 2016 |
The accompanying notes are an integral part of these financial statements.
| | | | |
| 64 | | Wells Fargo Dynamic Target Date Funds | | Statements of changes in net assets |
| | | | | | | | | | | | | | | | |
| | | Dynamic Target 2055 Fund | |
| | | Six months ended
November 30, 2016
(unaudited) | | | Year ended
May 31, 20161 | |
| | | | |
Operations | | | | | | | | | | | | | | | | |
Net investment income | | | | | | $ | 17,087 | | | | | | | $ | 39,103 | |
Net realized gains on investments | | | | | | | 15,281 | | | | | | | | 94,783 | |
Net change in unrealized gains (losses) on investments | | | | | | | 170,471 | | | | | | | | (158,210 | ) |
| | | | |
Net increase (decrease) in net assets resulting from operations | | | | | | | 202,839 | | | | | | | | (24,324 | ) |
| | | | |
| | | | |
Distributions to shareholders from | | | | | | | | | | | | | | | | |
Net investment income | | | | | | | | | | | | | | | | |
Class A | | | | | | | 0 | | | | | | | | (614 | ) |
Class C | | | | | | | 0 | | | | | | | | (546 | ) |
Class R | | | | | | | 0 | | | | | | | | (593 | ) |
Class R4 | | | | | | | 0 | | | | | | | | (642 | ) |
Class R6 | | | | | | | 0 | | | | | | | | (30,190 | ) |
| | | | |
Total distributions to shareholders | | | | | | | 0 | | | | | | | | (32,585 | ) |
| | | | |
| | | | |
Capital share transactions | | | Shares | | | | | | | | Shares | | | | | |
Proceeds from shares sold | | | | | | | | | | | | | | | | |
Class A | | | 305 | | | | 3,000 | | | | 10,330 | | | | 103,000 | |
Class C | | | 0 | | | | 0 | | | | 10,000 | | | | 100,000 | |
Class R | | | 0 | | | | 0 | | | | 10,000 | | | | 100,000 | |
Class R4 | | | 0 | | | | 0 | | | | 10,000 | | | | 100,000 | |
Class R6 | | | 0 | | | | 0 | | | | 460,000 | | | | 4,600,000 | |
| | | | |
| | | | | | | 3,000 | | | | | | | | 5,003,000 | |
| | | | |
Reinvestment of distributions | | | | | | | | | | | | | | | | |
Class A | | | 0 | | | | 0 | | | | 63 | | | | 614 | |
Class C | | | 0 | | | | 0 | | | | 56 | | | | 546 | |
Class R | | | 0 | | | | 0 | | | | 61 | | | | 593 | |
Class R4 | | | 0 | | | | 0 | | | | 66 | | | | 642 | |
Class R6 | | | 0 | | | | 0 | | | | 3,100 | | | | 30,190 | |
| | | | |
| | | | | | | 0 | | | | | | | | 32,585 | |
| | | | |
Net increase in net assets resulting from capital share transactions | | | | | | | 3,000 | | | | | | | | 5,035,585 | |
| | | | |
Total increase in net assets | | | | | | | 205,839 | | | | | | | | 4,978,676 | |
| | | | |
| | | | |
Net assets | | | | | | | | | | | | | | | | |
Beginning of period | | | | | | | 4,978,676 | | | | | | | | 0 | |
| | | | |
End of period | | | | | | $ | 5,184,515 | | | | | | | $ | 4,978,676 | |
| | | | |
Undistributed net investment income | | | | | | $ | 35,425 | | | | | | | $ | 18,338 | |
| | | | |
| 1 | For the period from November 30, 2015 (commencement of operations) to May 31, 2016 |
The accompanying notes are an integral part of these financial statements.
| | | | | | |
| Statements of changes in net assets | | Wells Fargo Dynamic Target Date Funds | | | 65 | |
| | | | | | | | | | | | | | | | |
| | | Dynamic Target 2060 Fund | |
| | | Six months ended
November 30, 2016
(unaudited) | | | Year ended
May 31, 20161 | |
| | | | |
Operations | | | | | | | | | | | | | | | | |
Net investment income | | | | | | $ | 17,118 | | | | | | | $ | 39,147 | |
Net realized gains on investments | | | | | | | 15,223 | | | | | | | | 100,701 | |
Net change in unrealized gains (losses) on investments | | | | | | | 170,662 | | | | | | | | (158,201 | ) |
| | | | |
Net increase (decrease) in net assets resulting from operations | | | | | | | 203,003 | | | | | | | | (18,353 | ) |
| | | | |
| | | | |
Distributions to shareholders from | | | | | | | | | | | | | | | | |
Net investment income | | | | | | | | | | | | | | | | |
Class A | | | | | | | 0 | | | | | | | | (615 | ) |
Class C | | | | | | | 0 | | | | | | | | (549 | ) |
Class R | | | | | | | 0 | | | | | | | | (595 | ) |
Class R4 | | | | | | | 0 | | | | | | | | (642 | ) |
Class R6 | | | | | | | 0 | | | | | | | | (30,185 | ) |
| | | | |
Total distributions to shareholders | | | | | | | 0 | | | | | | | | (32,586 | ) |
| | | | |
| | | | |
Capital share transactions | | | Shares | | | | | | | | Shares | | | | | |
Proceeds from shares sold | | | | | | | | | | | | | | | | |
Class A | | | 396 | | | | 4,037 | | | | 10,184 | | | | 101,808 | |
Class C | | | 0 | | | | 0 | | | | 10,000 | | | | 100,000 | |
Class R | | | 0 | | | | 0 | | | | 10,000 | | | | 100,000 | |
Class R4 | | | 0 | | | | 0 | | | | 10,000 | | | | 100,000 | |
Class R6 | | | 0 | | | | 0 | | | | 460,000 | | | | 4,600,000 | |
| | | | |
| | | | | | | 4,037 | | | | | | | | 5,001,808 | |
| | | | |
Reinvestment of distributions | | | | | | | | | | | | | | | | |
Class A | | | 0 | | | | 0 | | | | 63 | | | | 615 | |
Class C | | | 0 | | | | 0 | | | | 56 | | | | 549 | |
Class R | | | 0 | | | | 0 | | | | 61 | | | | 595 | |
Class R4 | | | 0 | | | | 0 | | | | 66 | | | | 642 | |
Class R6 | | | 0 | | | | 0 | | | | 3,099 | | | | 30,185 | |
| | | | |
| | | | | | | 0 | | | | | | | | 32,586 | |
| | | | |
Net increase in net assets resulting from capital share transactions | | | | | | | 4,037 | | | | | | | | 5,034,394 | |
| | | | |
Total increase in net assets | | | | | | | 207,040 | | | | | | | | 4,983,455 | |
| | | | |
| | | | |
Net assets | | | | | | | | | | | | | | | | |
Beginning of period | | | | | | | 4,983,455 | | | | | | | | 0 | |
| | | | |
End of period | | | | | | $ | 5,190,495 | | | | | | | $ | 4,983,455 | |
| | | | |
Undistributed net investment income | | | | | | $ | 35,497 | | | | | | | $ | 18,379 | |
| | | | |
| 1 | For the period from November 30, 2015 (commencement of operations) to May 31, 2016 |
The accompanying notes are an integral part of these financial statements.
| | | | |
| 66 | | Wells Fargo Dynamic Target Date Funds | | Financial highlights |
| | | | | | | | | | | | | | | | | | | | |
| Dynamic Target Today Fund | | Beginning
net asset
value per
share | | | Net
investment
income | | | Net realized
and unrealized
gains (losses)
on investments | | | Distributions
from net
investment
income | | | Ending
net asset
value per
share | |
Class A | | | | | | | | | | | | | | | | | | | | |
Six months ended November 30, 2016 (unaudited) | | $ | 10.06 | | | | 0.04 | | | | 0.10 | | | | (0.05 | ) | | $ | 10.15 | |
Year ended May 31, 20163 | | $ | 10.00 | | | | 0.06 | | | | 0.03 | | | | (0.03 | ) | | $ | 10.06 | |
Class C | | | | | | | | | | | | | | | | | | | | |
Six months ended November 30, 2016 (unaudited) | | $ | 10.03 | | | | 0.01 | | | | 0.09 | | | | (0.03 | ) | | $ | 10.10 | |
Year ended May 31, 20163 | | $ | 10.00 | | | | 0.03 | | | | 0.03 | | | | (0.03 | ) | | $ | 10.03 | |
Class R | | | | | | | | | | | | | | | | | | | | |
Six months ended November 30, 2016 (unaudited) | | $ | 10.05 | | | | 0.03 | | | | 0.09 | | | | (0.06 | ) | | $ | 10.11 | |
Year ended May 31, 20163 | | $ | 10.00 | | | | 0.05 | | | | 0.03 | | | | (0.03 | ) | | $ | 10.05 | |
Class R4 | | | | | | | | | | | | | | | | | | | | |
Six months ended November 30, 2016 (unaudited) | | $ | 10.07 | | | | 0.06 | | | | 0.09 | | | | (0.10 | ) | | $ | 10.12 | |
Year ended May 31, 20163 | | $ | 10.00 | | | | 0.08 | | | | 0.03 | | | | (0.04 | ) | | $ | 10.07 | |
Class R6 | | | | | | | | | | | | | | | | | | | | |
Six months ended November 30, 2016 (unaudited) | | $ | 10.08 | | | | 0.07 | | | | 0.09 | | | | (0.11 | ) | | $ | 10.13 | |
Year ended May 31, 20163 | | $ | 10.00 | | | | 0.09 | | | | 0.03 | | | | (0.04 | ) | | $ | 10.08 | |
| 1 | Ratios do not reflect net expenses allocated from the affiliated Master Portfolios. Including net expenses allocated from the affiliated Master Portfolios, the expense ratios would be increased by the following amounts: |
| | | | | | | | |
| | | Six months ended
November 30, 2016
(unaudited) | | | Year ended May 31, 20163 | |
Class A | | | 0.11 | % | | | 0.11 | % |
Class C | | | 0.11 | % | | | 0.10 | % |
Class R | | | 0.11 | % | | | 0.11 | % |
Class R4 | | | 0.11 | % | | | 0.11 | % |
Class R6 | | | 0.11 | % | | | 0.11 | % |
| 2 | Total return calculations do not include any sales charges. Returns for periods of less than one year are not annualized. |
| 3 | For the period from November 30, 2015 (commencement of class operations) to May 31, 2016 |
The accompanying notes are an integral part of these financial statements.
| | | | | | |
| Financial highlights | | Wells Fargo Dynamic Target Date Funds | | | 67 | |
| | | | | | | | | | | | | | | | | | | | | | |
| Ratio to average net assets (annualized) | | | | | | Portfolio
turnover
rate | | | Net assets at
end of period
(000s omitted) | |
Net investment
income | | | Gross
expenses1 | | | Net
expenses1 | | | Total
return2 | | | |
| | | | | | | | | | | | | | | | | | | | | | |
| | 0.87 | % | | | 4.77 | % | | | 0.53 | % | | | 1.57 | % | | | 39 | % | | $ | 124 | |
| | 1.31 | % | | | 5.22 | % | | | 0.53 | % | | | 0.95 | % | | | 66 | % | | $ | 101 | |
| | | | | | | | | | | | | | | | | | | | | | |
| | 0.12 | % | | | 5.52 | % | | | 1.28 | % | | | 1.16 | % | | | 39 | % | | $ | 102 | |
| | 0.56 | % | | | 5.97 | % | | | 1.28 | % | | | 0.58 | % | | | 66 | % | | $ | 101 | |
| | | | | | | | | | | | | | | | | | | | | | |
| | 0.62 | % | | | 5.02 | % | | | 0.77 | % | | | 1.42 | % | | | 39 | % | | $ | 102 | |
| | 1.06 | % | | | 5.47 | % | | | 0.77 | % | | | 0.83 | % | | | 66 | % | | $ | 101 | |
| | | | | | | | | | | | | | | | | | | | | | |
| | 1.18 | % | | | 4.49 | % | | | 0.22 | % | | | 1.61 | % | | | 39 | % | | $ | 103 | |
| | 1.62 | % | | | 4.94 | % | | | 0.22 | % | | | 1.08 | % | | | 66 | % | | $ | 101 | |
| | | | | | | | | | | | | | | | | | | | | | |
| | 1.33 | % | | | 4.34 | % | | | 0.07 | % | | | 1.82 | % | | | 39 | % | | $ | 4,728 | |
| | 1.77 | % | | | 4.79 | % | | | 0.07 | % | | | 1.19 | % | | | 66 | % | | $ | 4,654 | |
The accompanying notes are an integral part of these financial statements.
| | | | |
| 68 | | Wells Fargo Dynamic Target Date Funds | | Financial highlights |
| | | | | | | | | | | | | | | | | | | | |
| Dynamic Target 2015 Fund | | Beginning
net asset
value per
share | | | Net
investment
income (loss) | | | Net realized
and unrealized
gains (losses)
on investments | | | Distributions
from net
investment
income | | | Ending
net asset
value per
share | |
Class A | | | | | | | | | | | | | | | | | | | | |
Six months ended November 30, 2016 (unaudited) | | $ | 9.99 | | | | 0.02 | | | | 0.19 | | | | (0.05 | ) | | $ | 10.15 | |
Year ended May 31, 20164 | | $ | 10.00 | | | | 0.07 | | | | (0.04 | ) | | | (0.04 | ) | | $ | 9.99 | |
Class C | | | | | | | | | | | | | | | | | | | | |
Six months ended November 30, 2016 (unaudited) | | $ | 9.97 | | | | (0.00 | )3 | | | 0.16 | | | | (0.02 | ) | | $ | 10.11 | |
Year ended May 31, 20164 | | $ | 10.00 | | | | 0.03 | | | | (0.02 | ) | | | (0.04 | ) | | $ | 9.97 | |
Class R | | | | | | | | | | | | | | | | | | | | |
Six months ended November 30, 2016 (unaudited) | | $ | 9.99 | | | | 0.02 | | | | 0.16 | | | | (0.05 | ) | | $ | 10.12 | |
Year ended May 31, 20164 | | $ | 10.00 | | | | 0.05 | | | | (0.02 | ) | | | (0.04 | ) | | $ | 9.99 | |
Class R4 | | | | | | | | | | | | | | | | | | | | |
Six months ended November 30, 2016 (unaudited) | | $ | 10.01 | | | | 0.05 | | | | 0.16 | | | | (0.09 | ) | | $ | 10.13 | |
Year ended May 31, 20164 | | $ | 10.00 | | | | 0.08 | | | | (0.02 | ) | | | (0.05 | ) | | $ | 10.01 | |
Class R6 | | | | | | | | | | | | | | | | | | | | |
Six months ended November 30, 2016 (unaudited) | | $ | 10.01 | | | | 0.06 | | | | 0.17 | | | | (0.10 | ) | | $ | 10.14 | |
Year ended May 31, 20164 | | $ | 10.00 | | | | 0.09 | | | | (0.03 | ) | | | (0.05 | ) | | $ | 10.01 | |
| 1 | Ratios do not reflect net expenses allocated from the affiliated Master Portfolios. Including net expenses allocated from the affiliated Master Portfolios, the expense ratios would be increased by the following amounts: |
| | | | | | | | |
| | | Six months ended
November 30, 2016
(unaudited) | | | Year ended May 31, 20164 | |
Class A | | | 0.11 | % | | | 0.10 | % |
Class C | | | 0.10 | % | | | 0.10 | % |
Class R | | | 0.12 | % | | | 0.12 | % |
Class R4 | | | 0.10 | % | | | 0.10 | % |
Class R6 | | | 0.11 | % | | | 0.11 | % |
| 2 | Total return calculations do not include any sales charges. Returns for periods of less than one year are not annualized. |
| 3 | Amount is less than $0.005. |
| 4 | For the period from November 30, 2015 (commencement of class operations) to May 31, 2016 |
The accompanying notes are an integral part of these financial statements.
| | | | | | |
| Financial highlights | | Wells Fargo Dynamic Target Date Funds | | | 69 | |
| | | | | | | | | | | | | | | | | | | | | | |
| Ratio to average net assets (annualized) | | | Total
return2 | | | Portfolio
turnover
rate | | | Net assets at
end of period
(000s omitted) | |
Net investment
income (loss) | | | Gross
expenses1 | | | Net
expenses1 | | | | |
| | | | | | | | | | | | | | | | | | | | | | |
| | 0.63 | % | | | 4.51 | % | | | 0.53 | % | | | 2.19 | % | | | 31 | % | | $ | 372 | |
| | 1.16 | % | | | 5.21 | % | | | 0.45 | % | | | 0.34 | % | | | 38 | % | | $ | 199 | |
| | | | | | | | | | | | | | | | | | | | | | |
| | (0.03 | )% | | | 5.27 | % | | | 1.28 | % | | | 1.76 | % | | | 31 | % | | $ | 102 | |
| | 0.56 | % | | | 5.96 | % | | | 1.28 | % | | | 0.07 | % | | | 38 | % | | $ | 100 | |
| | | | | | | | | | | | | | | | | | | | | | |
| | 0.47 | % | | | 4.77 | % | | | 0.76 | % | | | 2.03 | % | | | 31 | % | | $ | 102 | |
| | 1.06 | % | | | 5.46 | % | | | 0.77 | % | | | 0.32 | % | | | 38 | % | | $ | 100 | |
| | | | | | | | | | | | | | | | | | | | | | |
| | 1.03 | % | | | 4.24 | % | | | 0.22 | % | | | 2.41 | % | | | 31 | % | | $ | 103 | |
| | 1.61 | % | | | 4.93 | % | | | 0.22 | % | | | 0.57 | % | | | 38 | % | | $ | 101 | |
| | | | | | | | | | | | | | | | | | | | | | |
| | 1.18 | % | | | 4.09 | % | | | 0.06 | % | | | 2.42 | % | | | 31 | % | | $ | 4,733 | |
| | 1.77 | % | | | 4.78 | % | | | 0.06 | % | | | 0.58 | % | | | 38 | % | | $ | 4,629 | |
The accompanying notes are an integral part of these financial statements.
| | | | |
| 70 | | Wells Fargo Dynamic Target Date Funds | | Financial highlights |
| | | | | | | | | | | | | | | | | | | | |
| Dynamic Target 2020 Fund | | Beginning
net asset
value per
share | | | Net
investment
income (loss) | | | Net realized
and unrealized
gains (losses)
on investments | | | Distributions
from net
investment
income | | | Ending
net asset
value per
share | |
Class A | | | | | | | | | | | | | | | | | | | | |
Six months ended November 30, 2016 (unaudited) | | $ | 9.99 | | | | 0.03 | 3 | | | 0.22 | | | | 0.00 | | | $ | 10.24 | |
Year ended May 31, 20164 | | $ | 10.00 | | | | 0.06 | | | | (0.03 | ) | | | (0.04 | ) | | $ | 9.99 | |
Class C | | | | | | | | | | | | | | | | | | | | |
Six months ended November 30, 2016 (unaudited) | | $ | 9.96 | | | | (0.01 | ) | | | 0.22 | | | | 0.00 | | | $ | 10.17 | |
Year ended May 31, 20164 | | $ | 10.00 | | | | 0.03 | | | | (0.03 | ) | | | (0.04 | ) | | $ | 9.96 | |
Class R | | | | | | | | | | | | | | | | | | | | |
Six months ended November 30, 2016 (unaudited) | | $ | 9.99 | | | | 0.02 | | | | 0.21 | | | | 0.00 | | | $ | 10.22 | |
Year ended May 31, 20164 | | $ | 10.00 | | | | 0.05 | | | | (0.01 | ) | | | (0.05 | ) | | $ | 9.99 | |
Class R4 | | | | | | | | | | | | | | | | | | | | |
Six months ended November 30, 2016 (unaudited) | | $ | 10.01 | | | | 0.05 | | | | 0.21 | | | | 0.00 | | | $ | 10.27 | |
Year ended May 31, 20164 | | $ | 10.00 | | | | 0.08 | | | | (0.02 | ) | | | (0.05 | ) | | $ | 10.01 | |
Class R6 | | | | | | | | | | | | | | | | | | | | |
Six months ended November 30, 2016 (unaudited) | | $ | 10.01 | | | | 0.05 | | | | 0.22 | | | | 0.00 | | | $ | 10.28 | |
Year ended May 31, 20164 | | $ | 10.00 | | | | 0.08 | | | | (0.02 | ) | | | (0.05 | ) | | $ | 10.01 | |
| 1 | Ratios do not reflect net expenses allocated from the affiliated Master Portfolios. Including net expenses allocated from the affiliated Master Portfolios, the expense ratios would be increased by the following amounts: |
| | | | | | | | |
| | | Six months ended
November 30, 2016
(unaudited) | | | Year ended May 31, 20164 | |
Class A | | | 0.11 | % | | | 0.10 | % |
Class C | | | 0.10 | % | | | 0.10 | % |
Class R | | | 0.12 | % | | | 0.11 | % |
Class R4 | | | 0.10 | % | | | 0.10 | % |
Class R6 | | | 0.11 | % | | | 0.11 | % |
| 2 | Total return calculations do not include any sales charges. Returns for periods of less than one year are not annualized. |
| 3 | Calculated based upon average shares outstanding |
| 4 | For the period from November 30, 2015 (commencement of class operations) to May 31, 2016 |
The accompanying notes are an integral part of these financial statements.
| | | | | | |
| Financial highlights | | Wells Fargo Dynamic Target Date Funds | | | 71 | |
| | | | | | | | | | | | | | | | | | | | | | |
| Ratio to average net assets (annualized) | | | Total
return2 | | | Portfolio
turnover
rate | | | Net assets at
end of period
(000s omitted) | |
Net investment
income (loss) | | | Gross
expenses1 | | | Net
expenses1 | | | | |
| | | | | | | | | | | | | | | | | | | | | | |
| | 0.52 | % | | | 4.45 | % | | | 0.53 | % | | | 2.71 | % | | | 26 | % | | $ | 300 | |
| | 1.33 | % | | | 5.21 | % | | | 0.54 | % | | | 0.35 | % | | | 38 | % | | $ | 119 | |
| | | | | | | | | | | | | | | | | | | | | | |
| | (0.15 | )% | | | 5.22 | % | | | 1.29 | % | | | 2.21 | % | | | 26 | % | | $ | 102 | |
| | 0.53 | % | | | 5.97 | % | | | 1.29 | % | | | 0.01 | % | | | 38 | % | | $ | 100 | |
| | | | | | | | | | | | | | | | | | | | | | |
| | 0.35 | % | | | 4.71 | % | | | 0.77 | % | | | 2.51 | % | | | 26 | % | | $ | 103 | |
| | 1.03 | % | | | 5.47 | % | | | 0.77 | % | | | 0.36 | % | | | 38 | % | | $ | 100 | |
| | | | | | | | | | | | | | | | | | | | | | |
| | 0.91 | % | | | 4.18 | % | | | 0.23 | % | | | 2.80 | % | | | 26 | % | | $ | 103 | |
| | 1.59 | % | | | 4.94 | % | | | 0.23 | % | | | 0.61 | % | | | 38 | % | | $ | 101 | |
| | | | | | | | | | | | | | | | | | | | | | |
| | 1.06 | % | | | 4.03 | % | | | 0.07 | % | | | 2.90 | % | | | 26 | % | | $ | 4,756 | |
| | 1.74 | % | | | 4.79 | % | | | 0.07 | % | | | 0.62 | % | | | 38 | % | | $ | 4,631 | |
The accompanying notes are an integral part of these financial statements.
| | | | |
| 72 | | Wells Fargo Dynamic Target Date Funds | | Financial highlights |
| | | | | | | | | | | | | | | | | | | | |
| Dynamic Target 2025 Fund | | Beginning
net asset
value per
share | | | Net
investment
income (loss) | | | Net realized
and unrealized
gains (losses)
on investments | | | Distributions
from net
investment
income | | | Ending
net asset
value per
share | |
Class A | | | | | | | | | | | | | | | | | | | | |
Six months ended November 30, 2016 (unaudited) | | $ | 9.94 | | | | 0.02 | 3 | | | 0.27 | | | | 0.00 | | | $ | 10.23 | |
Year ended May 31, 20164 | | $ | 10.00 | | | | 0.07 | | | | (0.08 | ) | | | (0.05 | ) | | $ | 9.94 | |
Class C | | | | | | | | | | | | | | | | | | | | |
Six months ended November 30, 2016 (unaudited) | | $ | 9.91 | | | | (0.01 | ) | | | 0.26 | | | | 0.00 | | | $ | 10.16 | |
Year ended May 31, 20164 | | $ | 10.00 | | | | 0.02 | | | | (0.06 | ) | | | (0.05 | ) | | $ | 9.91 | |
Class R | | | | | | | | | | | | | | | | | | | | |
Six months ended November 30, 2016 (unaudited) | | $ | 9.93 | | | | 0.01 | | | | 0.27 | | | | 0.00 | | | $ | 10.21 | |
Year ended May 31, 20164 | | $ | 10.00 | | | | 0.05 | | | | (0.07 | ) | | | (0.05 | ) | | $ | 9.93 | |
Class R4 | | | | | | | | | | | | | | | | | | | | |
Six months ended November 30, 2016 (unaudited) | | $ | 9.96 | | | | 0.04 | | | | 0.26 | | | | 0.00 | | | $ | 10.26 | |
Year ended May 31, 20164 | | $ | 10.00 | | | | 0.08 | | | | (0.07 | ) | | | (0.05 | ) | | $ | 9.96 | |
Class R6 | | | | | | | | | | | | | | | | | | | | |
Six months ended November 30, 2016 (unaudited) | | $ | 9.96 | | | | 0.05 | | | | 0.26 | | | | 0.00 | | | $ | 10.27 | |
Year ended May 31, 20164 | | $ | 10.00 | | | | 0.08 | | | | (0.06 | ) | | | (0.06 | ) | | $ | 9.96 | |
| 1 | Ratios do not reflect net expenses allocated from the affiliated Master Portfolios. Including annualized net expenses allocated from the affiliated Master Portfolios, the expense ratios would be increased by the following amounts: |
| | | | | | | | |
| | | Six months ended
November 30, 2016 (unaudited) | | | Year ended
May 31, 20164 | |
Class A | | | 0.11 | % | | | 0.10 | % |
Class C | | | 0.10 | % | | | 0.10 | % |
Class R | | | 0.12 | % | | | 0.12 | % |
Class R4 | | | 0.10 | % | | | 0.10 | % |
Class R6 | | | 0.11 | % | | | 0.11 | % |
| 2 | Total return calculations do not include any sales charges. Returns for periods of less than one year are not annualized. |
| 3 | Calculated based upon average shares outstanding |
| 4 | For the period from November 30, 2015 (commencement of class operations) to May 31, 2016 |
The accompanying notes are an integral part of these financial statements.
| | | | | | |
| Financial highlights | | Wells Fargo Dynamic Target Date Funds | | | 73 | |
| | | | | | | | | | | | | | | | | | | | | | |
| Ratio to average net assets (annualized) | | | Total
return2 | | | Portfolio
turnover
rate | | | Net assets at
end of period
(000s omitted) | |
Net investment
income (loss) | | | Gross
expenses1 | | | Net
expenses1 | | | | |
| | | | | | | | | | | | | | | | | | | | | | |
| | 0.40 | % | | | 4.96 | % | | | 0.54 | % | | | 3.12 | % | | | 22 | % | | $ | 374 | |
| | 1.09 | % | | | 5.25 | % | | | 0.46 | % | | | (0.07 | )% | | | 38 | % | | $ | 188 | |
| | | | | | | | | | | | | | | | | | | | | | |
| | (0.28 | )% | | | 5.73 | % | | | 1.29 | % | | | 2.73 | % | | | 22 | % | | $ | 114 | |
| | 0.52 | % | | | 6.00 | % | | | 1.30 | % | | | (0.44 | )% | | | 38 | % | | $ | 100 | |
| | | | | | | | | | | | | | | | | | | | | | |
| | 0.26 | % | | | 5.23 | % | | | 0.78 | % | | | 3.03 | % | | | 22 | % | | $ | 103 | |
| | 1.02 | % | | | 5.50 | % | | | 0.78 | % | | | (0.19 | )% | | | 38 | % | | $ | 100 | |
| | | | | | | | | | | | | | | | | | | | | | |
| | 0.81 | % | | | 4.70 | % | | | 0.23 | % | | | 3.22 | % | | | 22 | % | | $ | 103 | |
| | 1.58 | % | | | 4.97 | % | | | 0.23 | % | | | 0.16 | % | | | 38 | % | | $ | 100 | |
| | | | | | | | | | | | | | | | | | | | | | |
| | 0.96 | % | | | 4.55 | % | | | 0.08 | % | | | 3.32 | % | | | 22 | % | | $ | 4,752 | |
| | 1.73 | % | | | 4.82 | % | | | 0.08 | % | | | 0.17 | % | | | 38 | % | | $ | 4,609 | |
The accompanying notes are an integral part of these financial statements.
| | | | |
| 74 | | Wells Fargo Dynamic Target Date Funds | | Financial highlights |
| | | | | | | | | | | | | | | | | | | | |
| Dynamic Target 2030 Fund | | Beginning
net asset
value per
share | | | Net
investment
income (loss) | | | Net realized
and unrealized
gains (losses)
on investments | | | Distributions
from net
investment
income | | | Ending
net asset
value per
share | |
Class A | | | | | | | | | | | | | | | | | | | | |
Six months ended November 30, 2016 (unaudited) | | $ | 9.91 | | | | 0.02 | 3 | | | 0.30 | | | | 0.00 | | | $ | 10.23 | |
Year ended May 31, 20164 | | $ | 10.00 | | | | 0.06 | | | | (0.10 | ) | | | (0.05 | ) | | $ | 9.91 | |
Class C | | | | | | | | | | | | | | | | | | | | |
Six months ended November 30, 2016 (unaudited) | | $ | 9.88 | | | | (0.02 | ) | | | 0.30 | | | | 0.00 | | | $ | 10.16 | |
Year ended May 31, 20164 | | $ | 10.00 | | | | 0.02 | | | | (0.09 | ) | | | (0.05 | ) | | $ | 9.88 | |
Class R | | | | | | | | | | | | | | | | | | | | |
Six months ended November 30, 2016 (unaudited) | | $ | 9.90 | | | | 0.01 | | | | 0.30 | | | | 0.00 | | | $ | 10.21 | |
Year ended May 31, 20164 | | $ | 10.00 | | | | 0.05 | | | | (0.10 | ) | | | (0.05 | ) | | $ | 9.90 | |
Class R4 | | | | | | | | | | | | | | | | | | | | |
Six months ended November 30, 2016 (unaudited) | | $ | 9.93 | | | | 0.04 | | | | 0.29 | | | | 0.00 | | | $ | 10.26 | |
Year ended May 31, 20164 | | $ | 10.00 | | | | 0.07 | | | | (0.08 | ) | | | (0.06 | ) | | $ | 9.93 | |
Class R6 | | | | | | | | | | | | | | | | | | | | |
Six months ended November 30, 2016 (unaudited) | | $ | 9.93 | | | | 0.04 | | | | 0.30 | | | | 0.00 | | | $ | 10.27 | |
Year ended May 31, 20164 | | $ | 10.00 | | | | 0.08 | | | | (0.09 | ) | | | (0.06 | ) | | $ | 9.93 | |
| 1 | Ratios do not reflect net expenses allocated from the affiliated Master Portfolios. Including annualized net expenses allocated from the affiliated Master Portfolios, the expense ratios would be increased by the following amounts: |
| | | | | | | | |
| | | Six months ended
November 30, 2016 (unaudited) | | | Year ended
May 31, 20164 | |
Class A | | | 0.11 | % | | | 0.10 | % |
Class C | | | 0.11 | % | | | 0.10 | % |
Class R | | | 0.12 | % | | | 0.11 | % |
Class R4 | | | 0.11 | % | | | 0.10 | % |
Class R6 | | | 0.11 | % | | | 0.11 | % |
| 2 | Total return calculations do not include any sales charges. Returns for periods of less than one year are not annualized. |
| 3 | Calculated based upon average shares outstanding |
| 4 | For the period from November 30, 2015 (commencement of class operations) to May 31, 2016 |
The accompanying notes are an integral part of these financial statements.
| | | | | | |
| Financial highlights | | Wells Fargo Dynamic Target Date Funds | | | 75 | |
| | | | | | | | | | | | | | | | | | | | | | |
| Ratio to average net assets (annualized) | | | Total
return2 | | | Portfolio
turnover
rate | | | Net assets at
end of period
(000s omitted) | |
Net investment
income (loss) | | | Gross
expenses1 | | | Net
expenses1 | | | | |
| | | | | | | | | | | | | | | | | | | | | | |
| | 0.35 | % | | | 5.05 | % | | | 0.55 | % | | | 3.44 | % | | | 18 | % | | $ | 316 | |
| | 1.19 | % | | | 5.29 | % | | | 0.45 | % | | | (0.34 | )% | | | 22 | % | | $ | 173 | |
| | | | | | | | | | | | | | | | | | | | | | |
| | (0.37 | )% | | | 5.81 | % | | | 1.30 | % | | | 3.04 | % | | | 18 | % | | $ | 102 | |
| | 0.49 | % | | | 6.03 | % | | | 1.30 | % | | | (0.70 | )% | | | 22 | % | | $ | 99 | |
| | | | | | | | | | | | | | | | | | | | | | |
| | 0.15 | % | | | 5.31 | % | | | 0.79 | % | | | 3.34 | % | | | 18 | % | | $ | 103 | |
| | 1.00 | % | | | 5.53 | % | | | 0.79 | % | | | (0.46 | )% | | | 22 | % | | $ | 100 | |
| | | | | | | | | | | | | | | | | | | | | | |
| | 0.69 | % | | | 4.78 | % | | | 0.24 | % | | | 3.53 | % | | | 18 | % | | $ | 103 | |
| | 1.55 | % | | | 5.00 | % | | | 0.24 | % | | | (0.10 | )% | | | 22 | % | | $ | 100 | |
| | | | | | | | | | | | | | | | | | | | | | |
| | 0.85 | % | | | 4.63 | % | | | 0.09 | % | | | 3.73 | % | | | 18 | % | | $ | 4,755 | |
| | 1.70 | % | | | 4.85 | % | | | 0.09 | % | | | (0.09 | )% | | | 22 | % | | $ | 4,597 | |
The accompanying notes are an integral part of these financial statements.
| | | | |
| 76 | | Wells Fargo Dynamic Target Date Funds | | Financial highlights |
| | | | | | | | | | | | | | | | | | | | |
| Dynamic Target 2035 Fund | | Beginning
net asset
value per
share | | | Net
investment
income (loss) | | | Net realized
and unrealized
gains (losses)
on investments | | | Distributions
from net
investment
income | | | Ending
net asset
value per
share | |
Class A | | | | | | | | | | | | | | | | | | | | |
Six months ended November 30, 2016 (unaudited) | | $ | 9.88 | | | | 0.01 | | | | 0.34 | | | | 0.00 | | | $ | 10.23 | |
Year ended May 31, 20164 | | $ | 10.00 | | | | 0.06 | | | | (0.12 | ) | | | (0.06 | ) | | $ | 9.88 | |
Class C | | | | | | | | | | | | | | | | | | | | |
Six months ended November 30, 2016 (unaudited) | | $ | 9.84 | | | | (0.02 | ) | | | 0.34 | | | | 0.00 | | | $ | 10.16 | |
Year ended May 31, 20164 | | $ | 10.00 | | | | 0.02 | | | | (0.13 | ) | | | (0.05 | ) | | $ | 9.84 | |
Class R | | | | | | | | | | | | | | | | | | | | |
Six months ended November 30, 2016 (unaudited) | | $ | 9.87 | | | | 0.00 | 3 | | | 0.34 | | | | 0.00 | | | $ | 10.21 | |
Year ended May 31, 20164 | | $ | 10.00 | | | | 0.05 | | | | (0.12 | ) | | | (0.06 | ) | | $ | 9.87 | |
Class R4 | | | | | | | | | | | | | | | | | | | | |
Six months ended November 30, 2016 (unaudited) | | $ | 9.89 | | | | 0.03 | | | | 0.34 | | | | 0.00 | | | $ | 10.26 | |
Year ended May 31, 20164 | | $ | 10.00 | | | | 0.07 | | | | (0.12 | ) | | | (0.06 | ) | | $ | 9.89 | |
Class R6 | | | | | | | | | | | | | | | | | | | | |
Six months ended November 30, 2016 (unaudited) | | $ | 9.89 | | | | 0.04 | | | | 0.35 | | | | 0.00 | | | $ | 10.28 | |
Year ended May 31, 20164 | | $ | 10.00 | | | | 0.08 | | | | (0.13 | ) | | | (0.06 | ) | | $ | 9.89 | |
| 1 | Ratios do not reflect net expenses allocated from the affiliated Master Portfolios. Including annualized net expenses allocated from the affiliated Master Portfolios, the expense ratios would be increased by the following amounts: |
| | | | | | | | |
| | | Six months ended
November 30, 2016 (unaudited) | | | Year ended
May 31, 20164 | |
Class A | | | 0.11 | % | | | 0.10 | % |
Class C | | | 0.10 | % | | | 0.10 | % |
Class R | | | 0.12 | % | | | 0.12 | % |
Class R4 | | | 0.10 | % | | | 0.10 | % |
Class R6 | | | 0.11 | % | | | 0.11 | % |
| 2 | Total return calculations do not include any sales charges. Returns for periods of less than one year are not annualized. |
| 3 | Amount is less than $0.005. |
| 4 | For the period from November 30, 2015 (commencement of class operations) to May 31, 2016 |
The accompanying notes are an integral part of these financial statements.
| | | | | | |
| Financial highlights | | Wells Fargo Dynamic Target Date Funds | | | 77 | |
| | | | | | | | | | | | | | | | | | | | | | |
| Ratio to average net assets (annualized) | | | Total
return2 | | | Portfolio
turnover
rate | | | Net assets at
end of period
(000s omitted) | |
Net investment
income (loss) | | | Gross
expenses1 | | | Net
expenses1 | | | | |
| | | | | | | | | | | | | | | | | | | | | | |
| | 0.27 | % | | | 5.11 | % | | | 0.55 | % | | | 3.85 | % | | | 14 | % | | $ | 175 | |
| | 1.24 | % | | | 5.32 | % | | | 0.55 | % | | | (0.62 | )% | | | 19 | % | | $ | 119 | |
| | | | | | | | | | | | | | | | | | | | | | |
| | (0.43 | )% | | | 5.87 | % | | | 1.30 | % | | | 3.56 | % | | | 14 | % | | $ | 102 | |
| | 0.48 | % | | | 6.06 | % | | | 1.30 | % | | | (1.08 | )% | | | 19 | % | | $ | 99 | |
| | | | | | | | | | | | | | | | | | | | | | |
| | 0.08 | % | | | 5.37 | % | | | 0.79 | % | | | 3.65 | % | | | 14 | % | | $ | 103 | |
| | 0.99 | % | | | 5.57 | % | | | 0.79 | % | | | (0.73 | )% | | | 19 | % | | $ | 99 | |
| | | | | | | | | | | | | | | | | | | | | | |
| | 0.63 | % | | | 4.84 | % | | | 0.24 | % | | | 3.95 | % | | | 14 | % | | $ | 103 | |
| | 1.54 | % | | | 5.03 | % | | | 0.24 | % | | | (0.48 | )% | | | 19 | % | | $ | 99 | |
| | | | | | | | | | | | | | | | | | | | | | |
| | 0.78 | % | | | 4.69 | % | | | 0.08 | % | | | 4.15 | % | | | 14 | % | | $ | 4,757 | |
| | 1.69 | % | | | 4.88 | % | | | 0.08 | % | | | (0.46 | )% | | | 19 | % | | $ | 4,580 | |
The accompanying notes are an integral part of these financial statements.
| | | | |
| 78 | | Wells Fargo Dynamic Target Date Funds | | Financial highlights |
| | | | | | | | | | | | | | | | | | | | |
| Dynamic Target 2040 Fund | | Beginning
net asset
value per
share | | | Net
investment
income (loss) | | | Net realized
and unrealized
gains (losses)
on investments | | | Distributions
from net
investment
income | | | Ending
net asset
value per
share | |
Class A | | | | | | | | | | | | | | | | | | | | |
Six months ended November 30, 2016 (unaudited) | | $ | 9.85 | | | | 0.00 | 4 | | | 0.37 | | | | 0.00 | | | $ | 10.22 | |
Year ended May 31, 20163 | | $ | 10.00 | | | | 0.06 | | | | (0.15 | ) | | | (0.06 | ) | | $ | 9.85 | |
Class C | | | | | | | | | | | | | | | | | | | | |
Six months ended November 30, 2016 (unaudited) | | $ | 9.82 | | | | (0.02 | ) | | | 0.35 | | | | 0.00 | | | $ | 10.15 | |
Year ended May 31, 20163 | | $ | 10.00 | | | | 0.02 | | | | (0.15 | ) | | | (0.05 | ) | | $ | 9.82 | |
Class R | | | | | | | | | | | | | | | | | | | | |
Six months ended November 30, 2016 (unaudited) | | $ | 9.84 | | | | 0.00 | 4 | | | 0.36 | | | | 0.00 | | | $ | 10.20 | |
Year ended May 31, 20163 | | $ | 10.00 | | | | 0.05 | | | | (0.15 | ) | | | (0.06 | ) | | $ | 9.84 | |
Class R4 | | | | | | | | | | | | | | | | | | | | |
Six months ended November 30, 2016 (unaudited) | | $ | 9.86 | | | | 0.03 | | | | 0.36 | | | | 0.00 | | | $ | 10.25 | |
Year ended May 31, 20163 | | $ | 10.00 | | | | 0.07 | | | | (0.15 | ) | | | (0.06 | ) | | $ | 9.86 | |
Class R6 | | | | | | | | | | | | | | | | | | | | |
Six months ended November 30, 2016 (unaudited) | | $ | 9.87 | | | | 0.04 | | | | 0.36 | | | | 0.00 | | | $ | 10.27 | |
Year ended May 31, 20163 | | $ | 10.00 | | | | 0.08 | | | | (0.14 | ) | | | (0.07 | ) | | $ | 9.87 | |
| 1 | Ratios do not reflect net expenses allocated from the affiliated Master Portfolios. Including annualized net expenses allocated from the affiliated Master Portfolios, the expense ratios would be increased by the following amounts: |
| | | | | | | | |
| | | Six months ended
November 30, 2016
(unaudited) | | | Year ended
May 31, 20163 | |
Class A | | | 0.10 | % | | | 0.10 | % |
Class C | | | 0.11 | % | | | 0.10 | % |
Class R | | | 0.12 | % | | | 0.11 | % |
Class R4 | | | 0.11 | % | | | 0.10 | % |
Class R6 | | | 0.11 | % | | | 0.11 | % |
| 2 | Total return calculations do not include any sales charges. Returns for periods of less than one year are not annualized. |
| 3 | For the period from November 30, 2015 (commencement of class operations) to May 31, 2016 |
| 4 | Amount is less than $0.005. |
The accompanying notes are an integral part of these financial statements.
| | | | | | |
| Financial highlights | | Wells Fargo Dynamic Target Date Funds | | | 79 | |
| | | | | | | | | | | | | | | | | | | | | | |
| Ratio to average net assets (annualized) | | | Total
return2 | | | Portfolio
turnover
rate | | | Net assets at
end of period
(000s omitted) | |
Net investment
income (loss) | | | Gross
expenses1 | | | Net
expenses1 | | | | |
| | | | | | | | | | | | | | | | | | | | | | |
| | 0.27 | % | | | 4.68 | % | | | 0.55 | % | | | 3.97 | % | | | 12 | % | | $ | 225 | |
| | 1.22 | % | | | 5.33 | % | | | 0.53 | % | | | (0.90 | )% | | | 15 | % | | $ | 157 | |
| | | | | | | | | | | | | | | | | | | | | | |
| | (0.48 | )% | | | 5.44 | % | | | 1.30 | % | | | 3.67 | % | | | 12 | % | | $ | 102 | |
| | 0.47 | % | | | 6.07 | % | | | 1.30 | % | | | (1.25 | )% | | | 15 | % | | $ | 99 | |
| | | | | | | | | | | | | | | | | | | | | | |
| | (0.04 | )% | | | 4.93 | % | | | 0.79 | % | | | 3.87 | % | | | 12 | % | | $ | 103 | |
| | 0.99 | % | | | 5.58 | % | | | 0.80 | % | | | (1.00 | )% | | | 15 | % | | $ | 99 | |
| | | | | | | | | | | | | | | | | | | | | | |
| | 0.58 | % | | | 4.41 | % | | | 0.24 | % | | | 4.27 | % | | | 12 | % | | $ | 103 | |
| | 1.53 | % | | | 5.04 | % | | | 0.24 | % | | | (0.76 | )% | | | 15 | % | | $ | 99 | |
| | | | | | | | | | | | | | | | | | | | | | |
| | 0.74 | % | | | 4.25 | % | | | 0.09 | % | | | 4.26 | % | | | 12 | % | | $ | 4,755 | |
| | 1.69 | % | | | 4.90 | % | | | 0.09 | % | | | (0.64 | )% | | | 15 | % | | $ | 4,571 | |
The accompanying notes are an integral part of these financial statements.
| | | | |
| 80 | | Wells Fargo Dynamic Target Date Funds | | Financial highlights |
| | | | | | | | | | | | | | | | | | | | |
| Dynamic Target 2045 Fund | | Beginning
net asset
value per
share | | | Net
investment
income (loss) | | | Net realized
and unrealized
gains (losses)
on investments | | | Distributions
from net
investment
income | | | Ending
net asset
value per
share | |
Class A | | | | | | | | | | | | | | | | | | | | |
Six months ended November 30, 2016 (unaudited) | | $ | 9.86 | | | | 0.01 | | | | 0.38 | | | | 0.00 | | | $ | 10.25 | |
Year ended May 31, 20163 | | $ | 10.00 | | | | 0.06 | | | | (0.14 | ) | | | (0.06 | ) | | $ | 9.86 | |
Class C | | | | | | | | | | | | | | | | | | | | |
Six months ended November 30, 2016 (unaudited) | | $ | 9.83 | | | | (0.02 | ) | | | 0.37 | | | | 0.00 | | | $ | 10.18 | |
Year ended May 31, 20163 | | $ | 10.00 | | | | 0.02 | | | | (0.14 | ) | | | (0.05 | ) | | $ | 9.83 | |
Class R | | | | | | | | | | | | | | | | | | | | |
Six months ended November 30, 2016 (unaudited) | | $ | 9.85 | | | | 0.00 | 4 | | | 0.37 | | | | 0.00 | | | $ | 10.22 | |
Year ended May 31, 20163 | | $ | 10.00 | | | | 0.05 | | | | (0.14 | ) | | | (0.06 | ) | | $ | 9.85 | |
Class R4 | | | | | | | | | | | | | | | | | | | | |
Six months ended November 30, 2016 (unaudited) | | $ | 9.88 | | | | 0.03 | | | | 0.36 | | | | 0.00 | | | $ | 10.27 | |
Year ended May 31, 20163 | | $ | 10.00 | | | | 0.07 | | | | (0.13 | ) | | | (0.06 | ) | | $ | 9.88 | |
Class R6 | | | | | | | | | | | | | | | | | | | | |
Six months ended November 30, 2016 (unaudited) | | $ | 9.88 | | | | 0.04 | | | | 0.37 | | | | 0.00 | | | $ | 10.29 | |
Year ended May 31, 20163 | | $ | 10.00 | | | | 0.08 | | | | (0.13 | ) | | | (0.07 | ) | | $ | 9.88 | |
| 1 | Ratios do not reflect net expenses allocated from the affiliated Master Portfolios. Including annualized net expenses allocated from the affiliated Master Portfolios, the expense ratios would be increased by the following amounts: |
| | | | | | | | |
| | | Six months ended November 30, 2016
(unaudited) | | | Year ended
May 31, 20163 | |
Class A | | | 0.10 | % | | | 0.10 | % |
Class C | | | 0.11 | % | | | 0.10 | % |
Class R | | | 0.11 | % | | | 0.11 | % |
Class R4 | | | 0.11 | % | | | 0.10 | % |
Class R6 | | | 0.11 | % | | | 0.11 | % |
| 2 | Total return calculations do not include any sales charges. Returns for periods of less than one year are not annualized. |
| 3 | For the period from November 30, 2015 (commencement of class operations) to May 31, 2016 |
| 4 | Amount is less than $0.005. |
The accompanying notes are an integral part of these financial statements.
| | | | | | |
| Financial highlights | | Wells Fargo Dynamic Target Date Funds | | | 81 | |
| | | | | | | | | | | | | | | | | | | | | | |
| Ratio to average net assets (annualized) | | | Total
return2 | | | Portfolio
turnover
rate | | | Net assets at
end of period
(000s omitted) | |
Net investment
income (loss) | | | Gross
expenses1 | | | Net
expenses1 | | | | |
| | | | | | | | | | | | | | | | | | | | | | |
| | 0.26 | % | | | 4.80 | % | | | 0.55 | % | | | 4.17 | % | | | 11 | % | | $ | 128 | |
| | 1.23 | % | | | 5.36 | % | | | 0.53 | % | | | (0.79 | )% | | | 14 | % | | $ | 121 | |
| | | | | | | | | | | | | | | | | | | | | | |
| | (0.49 | )% | | | 5.55 | % | | | 1.30 | % | | | 3.77 | % | | | 11 | % | | $ | 102 | |
| | 0.48 | % | | | 6.10 | % | | | 1.30 | % | | | (1.15 | )% | | | 14 | % | | $ | 99 | |
| | | | | | | | | | | | | | | | | | | | | | |
| | 0.03 | % | | | 5.05 | % | | | 0.79 | % | | | 4.07 | % | | | 11 | % | | $ | 103 | |
| | 0.99 | % | | | 5.60 | % | | | 0.80 | % | | | (0.90 | )% | | | 14 | % | | $ | 99 | |
| | | | | | | | | | | | | | | | | | | | | | |
| | 0.57 | % | | | 4.52 | % | | | 0.24 | % | | | 4.26 | % | | | 11 | % | | $ | 103 | |
| | 1.54 | % | | | 5.07 | % | | | 0.24 | % | | | (0.55 | )% | | | 14 | % | | $ | 99 | |
| | | | | | | | | | | | | | | | | | | | | | |
| | 0.72 | % | | | 4.37 | % | | | 0.09 | % | | | 4.36 | % | | | 11 | % | | $ | 4,765 | |
| | 1.69 | % | | | 4.92 | % | | | 0.09 | % | | | (0.53 | )% | | | 14 | % | | $ | 4,576 | |
The accompanying notes are an integral part of these financial statements.
| | | | |
| 82 | | Wells Fargo Dynamic Target Date Funds | | Financial highlights |
| | | | | | | | | | | | | | | | | | | | |
| Dynamic Target 2050 Fund | | Beginning
net asset
value per
share | | | Net
investment
income (loss) | | | Net realized
and unrealized
gains (losses)
on investments | | | Distributions
from net
investment
income | | | Ending
net asset
value per
share | |
Class A | | | | | | | | | | | | | | | | | | | | |
Six months ended November 30, 2016 (unaudited) | | $ | 9.86 | | | | 0.01 | | | | 0.38 | | | | 0.00 | | | $ | 10.25 | |
Year ended May 31, 20163 | | $ | 10.00 | | | | 0.06 | | | | (0.14 | ) | | | (0.06 | ) | | $ | 9.86 | |
Class C | | | | | | | | | | | | | | | | | | | | |
Six months ended November 30, 2016 (unaudited) | | $ | 9.83 | | | | (0.02 | ) | | | 0.37 | | | | 0.00 | | | $ | 10.18 | |
Year ended May 31, 20163 | | $ | 10.00 | | | | 0.02 | | | | (0.14 | ) | | | (0.05 | ) | | $ | 9.83 | |
Class R | | | | | | | | | | | | | | | | | | | | |
Six months ended November 30, 2016 (unaudited) | | $ | 9.85 | | | | 0.00 | 4 | | | 0.37 | | | | 0.00 | | | $ | 10.22 | |
Year ended May 31, 20163 | | $ | 10.00 | | | | 0.05 | | | | (0.14 | ) | | | (0.06 | ) | | $ | 9.85 | |
Class R4 | | | | | | | | | | | | | | | | | | | | |
Six months ended November 30, 2016 (unaudited) | | $ | 9.88 | | | | 0.03 | | | | 0.37 | | | | 0.00 | | | $ | 10.28 | |
Year ended May 31, 20163 | | $ | 10.00 | | | | 0.07 | | | | (0.13 | ) | | | (0.06 | ) | | $ | 9.88 | |
Class R6 | | | | | | | | | | | | | | | | | | | | |
Six months ended November 30, 2016 (unaudited) | | $ | 9.88 | | | | 0.04 | | | | 0.37 | | | | 0.00 | | | $ | 10.29 | |
Year ended May 31, 20163 | | $ | 10.00 | | | | 0.08 | | | | (0.13 | ) | | | (0.07 | ) | | $ | 9.88 | |
| 1 | Ratios do not reflect net expenses allocated from the affiliated Master Portfolios. Including annualized net expenses allocated from the affiliated Master Portfolios, the expense ratios would be increased by the following amounts: |
| | | | | | | | |
| | | Six months ended
November 30, 2016
(unaudited) | | | Year ended
May 31, 20163 | |
Class A | | | 0.11 | % | | | 0.10 | % |
Class C | | | 0.11 | % | | | 0.10 | % |
Class R | | | 0.11 | % | | | 0.11 | % |
Class R4 | | | 0.11 | % | | | 0.10 | % |
Class R6 | | | 0.11 | % | | | 0.11 | % |
| 2 | Total return calculations do not include any sales charges. Returns for periods of less than one year are not annualized. |
| 3 | For the period from November 30, 2015 (commencement of class operations) to May 31, 2016 |
| 4 | Amount is less than $0.005. |
The accompanying notes are an integral part of these financial statements.
| | | | | | |
| Financial highlights | | Wells Fargo Dynamic Target Date Funds | | | 83 | |
| | | | | | | | | | | | | | | | | | | | | | |
| Ratio to average net assets (annualized) | | | Total
return2 | | | Portfolio
turnover
rate | | | Net assets at
end of period
(000s omitted) | |
Net investment
income (loss) | | | Gross
expenses1 | | | Net
expenses1 | | | | |
| | | | | | | | | | | | | | | | | | | | | | |
| | 0.26 | % | | | 4.98 | % | | | 0.55 | % | | | 4.17 | % | | | 11 | % | | $ | 115 | |
| | 1.22 | % | | | 5.25 | % | | | 0.53 | % | | | (0.78 | )% | | | 14 | % | | $ | 108 | |
| | | | | | | | | | | | | | | | | | | | | | |
| | (0.49 | )% | | | 5.73 | % | | | 1.30 | % | | | 3.77 | % | | | 11 | % | | $ | 102 | |
| | 0.48 | % | | | 6.00 | % | | | 1.30 | % | | | (1.15 | )% | | | 14 | % | | $ | 99 | |
| | | | | | | | | | | | | | | | | | | | | | |
| | 0.02 | % | | | 5.23 | % | | | 0.80 | % | | | 4.07 | % | | | 11 | % | | $ | 103 | |
| | 0.98 | % | | | 5.51 | % | | | 0.80 | % | | | (0.90 | )% | | | 14 | % | | $ | 99 | |
| | | | | | | | | | | | | | | | | | | | | | |
| | 0.57 | % | | | 4.70 | % | | | 0.24 | % | | | 4.26 | % | | | 11 | % | | $ | 103 | |
| | 1.53 | % | | | 4.97 | % | | | 0.24 | % | | | (0.55 | )% | | | 14 | % | | $ | 99 | |
| | | | | | | | | | | | | | | | | | | | | | |
| | 0.72 | % | | | 4.55 | % | | | 0.09 | % | | | 4.36 | % | | | 11 | % | | $ | 4,765 | |
| | 1.69 | % | | | 4.82 | % | | | 0.09 | % | | | (0.53 | )% | | | 14 | % | | $ | 4,576 | |
The accompanying notes are an integral part of these financial statements.
| | | | |
| 84 | | Wells Fargo Dynamic Target Date Funds | | Financial highlights |
| | | | | | | | | | | | | | | | | | | | |
| Dynamic Target 2055 Fund | | Beginning
net asset
value per
share | | | Net
investment
income (loss) | | | Net realized
and unrealized
gains (losses)
on investments | | | Distributions
from net
investment
income | | | Ending
net asset
value per
share | |
Class A | | | | | | | | | | | | | | | | | | | | |
Six months ended November 30, 2016 (unaudited) | | $ | 9.87 | | | | 0.01 | | | | 0.37 | | | | 0.00 | | | $ | 10.25 | |
Year ended May 31, 20163 | | $ | 10.00 | | | | 0.06 | | | | (0.13 | ) | | | (0.06 | ) | | $ | 9.87 | |
Class C | | | | | | | | | | | | | | | | | | | | |
Six months ended November 30, 2016 (unaudited) | | $ | 9.84 | | | | (0.02 | ) | | | 0.36 | | | | 0.00 | | | $ | 10.18 | |
Year ended May 31, 20163 | | $ | 10.00 | | | | 0.02 | | | | (0.13 | ) | | | (0.05 | ) | | $ | 9.84 | |
Class R | | | | | | | | | | | | | | | | | | | | |
Six months ended November 30, 2016 (unaudited) | | $ | 9.86 | | | | 0.00 | 4 | | | 0.37 | | | | 0.00 | | | $ | 10.23 | |
Year ended May 31, 20163 | | $ | 10.00 | | | | 0.05 | | | | (0.13 | ) | | | (0.06 | ) | | $ | 9.86 | |
Class R4 | | | | | | | | | | | | | | | | | | | | |
Six months ended November 30, 2016 (unaudited) | | $ | 9.88 | | | | 0.03 | | | | 0.37 | | | | 0.00 | | | $ | 10.28 | |
Year ended May 31, 20163 | | $ | 10.00 | | | | 0.07 | | | | (0.13 | ) | | | (0.06 | ) | | $ | 9.88 | |
Class R6 | | | | | | | | | | | | | | | | | | | | |
Six months ended November 30, 2016 (unaudited) | | $ | 9.89 | | | | 0.04 | | | | 0.36 | | | | 0.00 | | | $ | 10.29 | |
Year ended May 31, 20163 | | $ | 10.00 | | | | 0.08 | | | | (0.12 | ) | | | (0.07 | ) | | $ | 9.89 | |
| 1 | Ratios do not reflect net expenses allocated from the affiliated Master Portfolios. Including annualized net expenses allocated from the affiliated Master Portfolios, the expense ratios would be increased by the following amounts: |
| | | | | | | | |
| | | Six months ended
November 30, 2016
(unaudited) | | | Year ended
May 31, 20163 | |
Class A | | | 0.11 | % | | | 0.10 | % |
Class C | | | 0.11 | % | | | 0.10 | % |
Class R | | | 0.11 | % | | | 0.11 | % |
Class R4 | | | 0.11 | % | | | 0.10 | % |
Class R6 | | | 0.11 | % | | | 0.11 | % |
| 2 | Total return calculations do not include any sales charges. Returns for periods of less than one year are not annualized. |
| 3 | For the period from November 30, 2015 (commencement of class operations) to May 31, 2016 |
| 4 | Amount is less than $0.005. |
The accompanying notes are an integral part of these financial statements.
| | | | | | |
| Financial highlights | | Wells Fargo Dynamic Target Date Funds | | | 85 | |
| | | | | | | | | | | | | | | | | | | | | | |
| Ratio to average net assets (annualized) | | | Total
return2 | | | Portfolio
turnover
rate | | | Net assets at
end of period
(000s omitted) | |
Net investment
income (loss) | | | Gross
expenses1 | | | Net
expenses1 | | | | |
| | | | | | | | | | | | | | | | | | | | | | |
| | 0.25 | % | | | 4.84 | % | | | 0.55 | % | | | 4.06 | % | | | 11 | % | | $ | 110 | |
| | 1.21 | % | | | 5.23 | % | | | 0.54 | % | | | (0.88 | )% | | | 14 | % | | $ | 103 | |
| | | | | | | | | | | | | | | | | | | | | | |
| | (0.49 | )% | | | 5.59 | % | | | 1.30 | % | | | 3.67 | % | | | 11 | % | | $ | 102 | |
| | 0.47 | % | | | 5.98 | % | | | 1.30 | % | | | (1.05 | )% | | | 14 | % | | $ | 99 | |
| | | | | | | | | | | | | | | | | | | | | | |
| | 0.02 | % | | | 5.09 | % | | | 0.80 | % | | | 3.96 | % | | | 11 | % | | $ | 103 | |
| | 0.98 | % | | | 5.48 | % | | | 0.80 | % | | | (0.80 | )% | | | 14 | % | | $ | 99 | |
| | | | | | | | | | | | | | | | | | | | | | |
| | 0.57 | % | | | 4.56 | % | | | 0.24 | % | | | 4.26 | % | | | 11 | % | | $ | 103 | |
| | 1.53 | % | | | 4.95 | % | | | 0.24 | % | | | (0.55 | )% | | | 14 | % | | $ | 99 | |
| | | | | | | | | | | | | | | | | | | | | | |
| | 0.72 | % | | | 4.41 | % | | | 0.09 | % | | | 4.26 | % | | | 11 | % | | $ | 4,766 | |
| | 1.69 | % | | | 4.80 | % | | | 0.09 | % | | | (0.43 | )% | | | 14 | % | | $ | 4,579 | |
The accompanying notes are an integral part of these financial statements.
| | | | |
| 86 | | Wells Fargo Dynamic Target Date Funds | | Financial highlights |
| | | | | | | | | | | | | | | | | | | | |
| Dynamic Target 2060 Fund | | Beginning
net asset
value per
share | | | Net
investment
income (loss) | | | Net realized
and unrealized
gains (losses)
on investments | | | Distributions
from net
investment
income | | | Ending
net asset
value per
share | |
Class A | | | | | | | | | | | | | | | | | | | | |
Six months ended November 30, 2016 (unaudited) | | $ | 9.88 | | | | 0.01 | | | | 0.37 | | | | 0.00 | | | $ | 10.26 | |
Year ended May 31, 20163 | | $ | 10.00 | | | | 0.06 | | | | (0.12 | ) | | | (0.06 | ) | | $ | 9.88 | |
Class C | | | | | | | | | | | | | | | | | | | | |
Six months ended November 30, 2016 (unaudited) | | $ | 9.85 | | | | (0.02 | ) | | | 0.36 | | | | 0.00 | | | $ | 10.19 | |
Year ended May 31, 20163 | | $ | 10.00 | | | | 0.02 | | | | (0.12 | ) | | | (0.05 | ) | | $ | 9.85 | |
Class R | | | | | | | | | | | | | | | | | | | | |
Six months ended November 30, 2016 (unaudited) | | $ | 9.87 | | | | 0.00 | 4 | | | 0.37 | | | | 0.00 | | | $ | 10.24 | |
Year ended May 31, 20163 | | $ | 10.00 | | | | 0.05 | | | | (0.12 | ) | | | (0.06 | ) | | $ | 9.87 | |
Class R4 | | | | | | | | | | | | | | | | | | | | |
Six months ended November 30, 2016 (unaudited) | | $ | 9.89 | | | | 0.03 | | | | 0.37 | | | | 0.00 | | | $ | 10.29 | |
Year ended May 31, 20163 | | $ | 10.00 | | | | 0.07 | | | | (0.12 | ) | | | (0.06 | ) | | $ | 9.89 | |
Class R6 | | | | | | | | | | | | | | | | | | | | |
Six months ended November 30, 2016 (unaudited) | | $ | 9.90 | | | | 0.04 | | | | 0.36 | | | | 0.00 | | | $ | 10.30 | |
Year ended May 31, 20163 | | $ | 10.00 | | | | 0.08 | | | | (0.11 | ) | | | (0.07 | ) | | $ | 9.90 | |
| 1 | Ratios do not reflect net expenses allocated from the affiliated Master Portfolios. Including annualized net expenses allocated from the affiliated Master Portfolios, the expense ratios would be increased by the following amounts: |
| | | | | | | | |
| | | Six months ended
November 30, 2016
(unaudited) | | | Year ended
May 31, 20163 | |
Class A | | | 0.11 | % | | | 0.10 | % |
Class C | | | 0.11 | % | | | 0.10 | % |
Class R | | | 0.10 | % | | | 0.11 | % |
Class R4 | | | 0.11 | % | | | 0.10 | % |
Class R6 | | | 0.11 | % | | | 0.11 | % |
| 2 | Total return calculations do not include any sales charges. Returns for periods of less than one year are not annualized. |
| 3 | For the period from November 30, 2015 (commencement of class operations) to May 31, 2016 |
| 4 | Amount is less than $0.005. |
The accompanying notes are an integral part of these financial statements.
| | | | | | |
| Financial highlights | | Wells Fargo Dynamic Target Date Funds | | | 87 | |
| | | | | | | | | | | | | | | | | | | | | | |
| Ratio to average net assets (annualized) | | | Total
return2 | | | Portfolio
turnover
rate | | | Net assets at
end of period
(000s omitted) | |
Net investment
income (loss) | | | Gross
expenses1 | | | Net
expenses1 | | | | |
| | | | | | | | | | | | | | | | | | | | | | |
| | 0.25 | % | | | 4.97 | % | | | 0.55 | % | | | 4.06 | % | | | 11 | % | | $ | 109 | |
| | 1.22 | % | | | 5.24 | % | | | 0.55 | % | | | (0.58 | )% | | | 14 | % | | $ | 101 | |
| | | | | | | | | | | | | | | | | | | | | | |
| | (0.49 | )% | | | 5.72 | % | | | 1.30 | % | | | 3.66 | % | | | 11 | % | | $ | 102 | |
| | 0.48 | % | | | 5.99 | % | | | 1.30 | % | | | (0.94 | )% | | | 14 | % | | $ | 99 | |
| | | | | | | | | | | | | | | | | | | | | | |
| | 0.02 | % | | | 5.22 | % | | | 0.80 | % | | | 3.96 | % | | | 11 | % | | $ | 103 | |
| | 0.98 | % | | | 5.50 | % | | | 0.80 | % | | | (0.70 | )% | | | 14 | % | | $ | 99 | |
| | | | | | | | | | | | | | | | | | | | | | |
| | 0.57 | % | | | 4.69 | % | | | 0.24 | % | | | 4.26 | % | | | 11 | % | | $ | 104 | |
| | 1.53 | % | | | 4.96 | % | | | 0.24 | % | | | (0.45 | )% | | | 14 | % | | $ | 100 | |
| | | | | | | | | | | | | | | | | | | | | | |
| | 0.72 | % | | | 4.54 | % | | | 0.09 | % | | | 4.35 | % | | | 11 | % | | $ | 4,772 | |
| | 1.69 | % | | | 4.81 | % | | | 0.09 | % | | | (0.33 | )% | | | 14 | % | | $ | 4,584 | |
The accompanying notes are an integral part of these financial statements.
| | | | |
| 88 | | Wells Fargo Dynamic Target Date Funds | | Notes to financial statements (unaudited) |
1. ORGANIZATION
Wells Fargo Funds Trust (the “Trust”), a Delaware statutory trust organized on March 10, 1999, is an open-end management investment company registered under the Investment Company Act of 1940, as amended (the “1940 Act”). As an investment company, the Trust follows the accounting and reporting guidance in Financial Accounting Standards Board (“FASB”) Accounting Standards Codification Topic 946, Financial Services – Investment Companies. These financial statements report on the following funds: Wells Fargo Dynamic Target Today Fund (“Dynamic Target Today Fund”), Wells Fargo Dynamic Target 2015 Fund (“Dynamic Target 2015 Fund”), Wells Fargo Dynamic Target 2020 Fund (“Dynamic Target 2020 Fund” ), Well Fargo Dynamic Target 2025 Fund (“Dynamic Target 2025 Fund”), Wells Fargo Dynamic Target 2030 Fund (“Dynamic Target 2030 Fund”), Wells Fargo Dynamic Target 2035 Fund (“Dynamic Target 2035 Fund”), Wells Fargo Dynamic Target 2040 Fund (“Dynamic Target 2040 Fund”), Wells Fargo Dynamic Target 2045 Fund (“Dynamic Target 2045 Fund”), Wells Fargo Dynamic Target 2050 Fund (“Dynamic Target 2050 Fund”), Well Fargo Dynamic Target 2055 Fund (“Dynamic Target 2055 Fund”), and Wells Fargo Dynamic Target 2060 Fund (“Dynamic Target 2060 Fund” ) (each, a “Fund”, collectively, the “Funds”). Each Fund is a diversified series of the Trust.
Each Fund is a fund-of-funds that primarily invests in various affiliated mutual funds, unaffiliated mutual funds and exchange-traded funds (collectively, the “Underlying Funds”) to pursue its investment objective. The Underlying Funds incur separate expenses in seeking to achieve their investment objectives. Investments in affiliated mutual funds may also include investments in one or more separate diversified portfolios (each, an “affiliated Master Portfolio”, collectively, the “affiliated Master Portfolios”) of Wells Fargo Master Trust, a registered open-end management investment company. Each affiliated Master Portfolio directly acquires portfolio securities, and a Fund investing in an affiliated Master Portfolio acquires an indirect interest in those securities. Each Fund accounts for its investment in the affiliated Master Portfolios as partnership investments and records on a daily basis its share of the affiliated Master Portfolio’s income, expense and realized and unrealized gains and losses. The financial statements and financial highlights for the Underlying Funds are presented in separate financial statements and may be obtained by contacting Investor Services for the Wells Fargo Funds or by contacting the servicing agent of the unaffiliated mutual funds.
2. SIGNIFICANT ACCOUNTING POLICIES
The following significant accounting policies, which are consistently followed in the preparation of the financial statements of each Fund, are in conformity with U.S. generally accepted accounting principles which require management to make estimates and assumptions that affect the reported amounts of assets and liabilities, disclosure of contingent assets and liabilities at the date of the financial statements, and the reported amounts of revenues and expenses during the reporting period. Actual results could differ from those estimates.
Securities valuation
All investments are valued each business day as of the close of regular trading on the New York Stock Exchange (generally 4 p.m. Eastern Time), although the Funds may deviate from this calculation time under unusual or unexpected circumstances.
Investments in mutual funds are valued at net asset per share as reported by the Underlying Funds as of the close of the regular trading on the New York Stock Exchange on each day the exchange is open for trading. Investments in affiliated Master Portfolios are valued daily based on each Fund’s proportionate share of each affiliated Master Portfolio’s net assets, which are also valued daily.
Equity securities and futures that are listed on a foreign or domestic exchange or market are valued at the official closing price or, if none, the last sales price. If no sale occurs on the principal exchange or market that day, the prior day’s price will be deemed “stale” and a fair value price will be determined in accordance with the Fund’s Valuation Procedures.
Debt securities are valued at the evaluated bid price provided by an independent pricing service or, if a reliable price is not available, the quoted bid price from an independent broker-dealer.
Investments which are not valued using any of the methods discussed above are valued at their fair value, as determined in good faith by the Board of Trustees of the Funds. The Board of Trustees has established a Valuation Committee comprised of the Trustees and has delegated to it the authority to take any actions regarding the valuation of portfolio securities that the Valuation Committee deems necessary or appropriate, including determining the fair value of portfolio securities, unless the determination has been delegated to the Management Valuation Team of Wells Fargo Funds Management, LLC (“Funds Management”). The Board of Trustees retains the authority to make or ratify any valuation decisions or approve any changes to the Valuation Procedures as it deems appropriate. On a quarterly basis, the Board of Trustees receives reports on any valuation actions taken by the Valuation Committee or the Management Valuation Team which may include items for ratification.
| | | | | | |
| Notes to financial statements (unaudited) | | Wells Fargo Dynamic Target Date Funds | | | 89 | |
Valuations of fair valued securities are compared to the next actual sales price when available, or other appropriate market values, to assess the continued appropriateness of the fair valuation methodologies used. These securities are fair valued on a day-to-day basis, taking into consideration changes to appropriate market information and any significant changes to the inputs considered in the valuation process until there is a readily available price provided on an exchange or by an independent pricing service. Valuations received from an independent pricing service or independent broker-dealer quotes are periodically validated by comparisons to most recent trades and valuations provided by other independent pricing services in addition to the review of prices by the manager and/or subadviser. Unobservable inputs used in determining fair valuations are identified based on the type of security, taking into consideration factors utilized by market participants in valuing the investment, knowledge about the issuer and the current market environment.
Futures contracts
Each Fund is subject to interest rate risk and equity price risk in the normal course of pursuing its investment objectives. The Fund may buy and sell futures contracts in order to effect tactical allocation changes in the Fund. The primary risks associated with the use of futures contracts are the imperfect correlation between changes in market values of securities held by the Fund and the prices of futures contracts, and the possibility of an illiquid market.
The aggregate principal amounts of the contracts are not recorded in the financial statements. Fluctuations in the value of the contracts are recorded in the Statements of Assets and Liabilities as an asset or liability and in the Statements of Operations as unrealized gains or losses until the contracts are closed, at which point they are recorded as net realized gains or losses on futures contracts. With futures contracts, there is minimal counterparty risk to the Fund since futures are exchange traded and the exchange’s clearinghouse, as counterparty to all exchange traded futures, guarantees the futures against default.
Security transactions and income recognition
Securities transactions are recorded on a trade date basis. Realized gains or losses are recorded on the basis of identified cost.
Income dividends and capital gain distributions from Underlying Funds are recorded on the ex-dividend date. Capital gain distributions from Underlying Funds are treated as realized gains.
Interest income is accrued daily and bond discounts are accreted and premiums are amortized daily based on the effective interest method. To the extent debt obligations are placed on non-accrual status, any related interest income may be reduced by writing off interest receivables when the collection of all or a portion of interest has become doubtful based on consistently applied procedures. If the issuer subsequently resumes interest payments or when the collectability of interest is reasonably assured, the debt obligation is removed from non-accrual status.
Each Fund records on a daily basis its proportionate share of each affiliated Master Portfolio’s interest and dividend income, in addition to expenses and realized and unrealized gains or losses.
Income from foreign securities in each affiliated Master Portfolio is recorded net of foreign taxes withheld where recovery of such taxes is not assured.
Distributions to shareholders
Distributions to shareholders from net investment income and net realized gains, if any, are recorded on the ex-dividend date. Such distributions are determined in conformity with federal income tax regulations, which may differ in amount or character from net investment income and realized gains recognized for purposes of U.S. generally accepted accounting principles.
Federal and other taxes
Each Fund is treated as a separate entity for federal income tax purposes. Each Fund intends to continue to qualify as a regulated investment company by distributing substantially all of its investment company taxable income and any net realized capital gains (after reduction for capital loss carryforwards) sufficient to relieve it from all, or substantially all, federal income taxes. Accordingly, no provision for federal income taxes was required.
Each Fund’s income and federal excise tax returns and all financial records supporting the returns for the fiscal years since commencement of operations will be subject to examination by the federal and Delaware revenue authorities. Each Fund is not subject to examination by federal and state tax authorities for tax years before 2015, the year the Fund commenced operations.
Class allocations
The separate classes of shares offered by each Fund differ principally in applicable sales charges, distribution, shareholder servicing, and administration fees. Class specific expenses are charged directly to that share class. Investment income, common expenses, and realized and unrealized gains (losses) on investments are allocated daily to each class of shares based on the relative proportion of net assets of each class.
| | | | |
| 90 | | Wells Fargo Dynamic Target Date Funds | | Notes to financial statements (unaudited) |
3. FAIR VALUATION MEASUREMENTS
Fair value measurements of investments are determined within a framework that has established a fair value hierarchy based upon the various data inputs utilized in determining the value of each Fund’s investments. The three-level hierarchy gives the highest priority to unadjusted quoted prices in active markets for identical assets or liabilities (Level 1) and the lowest priority to significant unobservable inputs (Level 3). Each Fund’s investments are classified within the fair value hierarchy based on the lowest level of input that is significant to the fair value measurement. The inputs are summarized into three broad levels as follows:
| ∎ | | Level 1 – quoted prices in active markets for identical securities |
| ∎ | | Level 2 – other significant observable inputs (including quoted prices for similar securities, interest rates, prepayment speeds, credit risk, use of amortized cost, etc.) |
| ∎ | | Level 3 – significant unobservable inputs (including the Fund’s own assumptions in determining the fair value of investments) |
The inputs or methodologies used for valuing investments in securities are not necessarily an indication of the risk associated with investing in those securities.
The following is a summary of the inputs used in valuing each Fund’s assets and liabilities as of November 30, 2016:
| | | | | | | | | | | | | | | | |
| Dynamic Target Today Fund | | Quoted prices
(Level 1) | | | Other significant
observable inputs
(Level 2) | | | Significant
unobservable inputs (Level 3) | | | Total | |
Assets | | | | | | | | | | | | | | | | |
Investments in: | | | | | | | | | | | | | | | | |
| | | | |
Exchange-traded funds | | $ | 1,484,640 | | | $ | 0 | | | $ | 0 | | | $ | 1,484,640 | |
| | | | |
Investment companies | | | 2,405,024 | | | | 0 | | | | 0 | | | | 2,405,024 | |
| | | | |
Short-term investments | | | | | | | | | | | | | | | | |
U.S. Treasury securities | | | 3,999 | | | | 0 | | | | 0 | | | | 3,999 | |
Investments measured at net asset value* | | | | | | | | | | | | | | | 1,234,307 | |
| | | 3,893,663 | | | | 0 | | | | 0 | | | | 5,127,970 | |
Futures contracts | | | 594 | | | | 0 | | | | 0 | | | | 594 | |
Total assets | | $ | 3,894,257 | | | $ | 0 | | | $ | 0 | | | $ | 5,128,564 | |
| * | Investments that are measured at fair value using the net asset value per share (or its equivalent) as a practical expedient have not been categorized in the fair value hierarchy. The fair value amount presented in the table is intended to permit reconciliation of the fair value hierarchy to the amounts presented in the Statements of Assets and Liabilities. At November 30, 2016, the aggregated affiliated Master Portfolios measured at fair value using the net asset value per share (or its equivalent) were valued at $1,234,307. Each affiliated Master Portfolio does not have a redemption period notice, can be redeemed daily and does not have any unfunded commitments. |
| | | | | | | | | | | | | | | | |
| Dynamic Target 2015 Fund | | Quoted prices
(Level 1) | | | Other significant
observable inputs
(Level 2) | | | Significant
unobservable inputs (Level 3) | | | Total | |
Assets | | | | | | | | | | | | | | | | |
Investments in: | | | | | | | | | | | | | | | | |
| | | | |
Exchange-traded funds | | $ | 1,652,417 | | | $ | 0 | | | $ | 0 | | | $ | 1,652,417 | |
| | | | |
Investment companies | | | 2,552,339 | | | | 0 | | | | 0 | | | | 2,552,339 | |
| | | | |
Short-term investments | | | | | | | | | | | | | | | | |
U.S. Treasury securities | | | 3,999 | | | | 0 | | | | 0 | | | | 3,999 | |
Investments measured at net asset value* | | | | | | | | | | | | | | | 1,169,756 | |
| | | 4,208,755 | | | | 0 | | | | 0 | | | | 5,378,511 | |
Futures contracts | | | 594 | | | | 0 | | | | 0 | | | | 594 | |
Total assets | | $ | 4,209,349 | | | $ | 0 | | | $ | 0 | | | $ | 5,379,105 | |
| * | Investments that are measured at fair value using the net asset value per share (or its equivalent) as a practical expedient have not been categorized in the fair value hierarchy. The fair value amount presented in the table is intended to permit reconciliation of the fair value hierarchy to the amounts presented in the Statements of Assets and Liabilities. At November 30, 2016, the aggregated affiliated Master Portfolios measured at fair value using the net asset value per share (or its equivalent) were valued at $1,169,756. Each affiliated Master Portfolio does not have a redemption period notice, can be redeemed daily and does not have any unfunded commitments. |
| | | | | | |
| Notes to financial statements (unaudited) | | Wells Fargo Dynamic Target Date Funds | | | 91 | |
| | | | | | | | | | | | | | | | |
| Dynamic Target 2020 Fund | | Quoted prices
(Level 1) | | | Other significant
observable inputs
(Level 2) | | | Significant
unobservable inputs (Level 3) | | | Total | |
Assets | | | | | | | | | | | | | | | | |
Investments in: | | | | | | | | | | | | | | | | |
| | | | |
Exchange-traded funds | | $ | 1,685,052 | | | $ | 0 | | | $ | 0 | | | $ | 1,685,052 | |
| | | | |
Investment companies | | | 2,555,870 | | | | 0 | | | | 0 | | | | 2,555,870 | |
| | | | |
Short-term investments | | | | | | | | | | | | | | | | |
U.S. Treasury securities | | | 3,999 | | | | 0 | | | | 0 | | | | 3,999 | |
Investments measured at net asset value* | | | | | | | | | | | | | | | 1,082,028 | |
| | | 4,244,921 | | | | 0 | | | | 0 | | | | 5,326,949 | |
Futures contracts | | | 594 | | | | 0 | | | | 0 | | | | 594 | |
Total assets | | $ | 4,245,515 | | | $ | 0 | | | $ | 0 | | | $ | 5,327,543 | |
| * | Investments that are measured at fair value using the net asset value per share (or its equivalent) as a practical expedient have not been categorized in the fair value hierarchy. The fair value amount presented in the table is intended to permit reconciliation of the fair value hierarchy to the amounts presented in the Statements of Assets and Liabilities. At November 30, 2016, the aggregated affiliated Master Portfolios measured at fair value using the net asset value per share (or its equivalent) were valued at $1,082,028. Each affiliated Master Portfolio does not have a redemption period notice, can be redeemed daily and does not have any unfunded commitments. |
| | | | | | | | | | | | | | | | |
| Dynamic Target 2025 Fund | | Quoted prices
(Level 1) | | | Other significant
observable inputs
(Level 2) | | | Significant
unobservable inputs (Level 3) | | | Total | |
Assets | | | | | | | | | | | | | | | | |
Investments in: | | | | | | | | | | | | | | | | |
| | | | |
Exchange-traded funds | | $ | 1,756,841 | | | $ | 0 | | | $ | 0 | | | $ | 1,756,841 | |
| | | | |
Investment companies | | | 2,627,129 | | | | 0 | | | | 0 | | | | 2,627,129 | |
| | | | |
Short-term investments | | | | | | | | | | | | | | | | |
U.S. Treasury securities | | | 3,999 | | | | 0 | | | | 0 | | | | 3,999 | |
Investments measured at net asset value* | | | | | | | | | | | | | | | 1,032,417 | |
| | | 4,387,969 | | | | 0 | | | | 0 | | | | 5,420,386 | |
Futures contracts | | | 594 | | | | 0 | | | | 0 | | | | 594 | |
Total assets | | $ | 4,388,563 | | | $ | 0 | | | $ | 0 | | | $ | 5,420,980 | |
| * | Investments that are measured at fair value using the net asset value per share (or its equivalent) as a practical expedient have not been categorized in the fair value hierarchy. The fair value amount presented in the table is intended to permit reconciliation of the fair value hierarchy to the amounts presented in the Statements of Assets and Liabilities. At November 30, 2016, the aggregated affiliated Master Portfolios measured at fair value using the net asset value per share (or its equivalent) were valued at $1,032,417. Each affiliated Master Portfolio does not have a redemption period notice, can be redeemed daily and does not have any unfunded commitments. |
| | | | | | | | | | | | | | | | |
| Dynamic Target 2030 Fund | | Quoted prices
(Level 1) | | | Other significant
observable inputs
(Level 2) | | | Significant
unobservable inputs (Level 3) | | | Total | |
Assets | | | | | | | | | | | | | | | | |
Investments in: | | | | | | | | | | | | | | | | |
| | | | |
Exchange-traded funds | | $ | 1,771,161 | | | $ | 0 | | | $ | 0 | | | $ | 1,771,161 | |
| | | | |
Investment companies | | | 2,620,102 | | | | 0 | | | | 0 | | | | 2,620,102 | |
| | | | |
Short-term investments | | | | | | | | | | | | | | | | |
U.S. Treasury securities | | | 8,999 | | | | 0 | | | | 0 | | | | 8,999 | |
Investments measured at net asset value* | | | | | | | | | | | | | | | 953,426 | |
| | | 4,400,262 | | | | 0 | | | | 0 | | | | 5,353,688 | |
Futures contracts | | | 594 | | | | 0 | | | | 0 | | | | 594 | |
Total assets | | $ | 4,400,856 | | | $ | 0 | | | $ | 0 | | | $ | 5,354,282 | |
| * | Investments that are measured at fair value using the net asset value per share (or its equivalent) as a practical expedient have not been categorized in the fair value hierarchy. The fair value amount presented in the table is intended to permit reconciliation of the fair value hierarchy to the amounts presented in the Statements of Assets and Liabilities. At November 30, 2016, the aggregated affiliated Master Portfolios measured at fair value using the net asset value per share (or its equivalent) were valued at $953,426. Each affiliated Master Portfolio does not have a redemption period notice, can be redeemed daily and does not have any unfunded commitments. |
| | | | |
| 92 | | Wells Fargo Dynamic Target Date Funds | | Notes to financial statements (unaudited) |
| | | | | | | | | | | | | | | | |
| Dynamic Target 2035 Fund | | Quoted prices
(Level 1) | | | Other significant
observable inputs
(Level 2) | | | Significant
unobservable inputs (Level 3) | | | Total | |
Assets | | | | | | | | | | | | | | | | |
Investments in: | | | | | | | | | | | | | | | | |
| | | | |
Exchange-traded funds | | $ | 1,744,264 | | | $ | 0 | | | $ | 0 | | | $ | 1,744,264 | |
| | | | |
Investment companies | | | 2,577,132 | | | | 0 | | | | 0 | | | | 2,577,132 | |
| | | | |
Short-term investments | | | | | | | | | | | | | | | | |
U.S. Treasury securities | | | 8,999 | | | | 0 | | | | 0 | | | | 8,999 | |
Investments measured at net asset value* | | | | | | | | | | | | | | | 884,495 | |
| | | 4,330,395 | | | | 0 | | | | 0 | | | | 5,214,890 | |
Futures contracts | | | 594 | | | | 0 | | | | 0 | | | | 594 | |
Total assets | | $ | 4,330,989 | | | $ | 0 | | | $ | 0 | | | $ | 5,215,484 | |
| * | Investments that are measured at fair value using the net asset value per share (or its equivalent) as a practical expedient have not been categorized in the fair value hierarchy. The fair value amount presented in the table is intended to permit reconciliation of the fair value hierarchy to the amounts presented in the Statements of Assets and Liabilities. At November 30, 2016, the aggregated affiliated Master Portfolios measured at fair value using the net asset value per share (or its equivalent) were valued at $884,495. Each affiliated Master Portfolio does not have a redemption period notice, can be redeemed daily and does not have any unfunded commitments. |
| | | | | | | | | | | | | | | | |
| Dynamic Target 2040 Fund | | Quoted prices
(Level 1) | | | Other significant
observable inputs
(Level 2) | | | Significant
unobservable inputs (Level 3) | | | Total | |
Assets | | | | | | | | | | | | | | | | |
Investments in: | | | | | | | | | | | | | | | | |
| | | | |
Exchange-traded funds | | $ | 1,781,877 | | | $ | 0 | | | $ | 0 | | | $ | 1,781,877 | |
| | | | |
Investment companies | | | 2,615,201 | | | | 0 | | | | 0 | | | | 2,615,201 | |
| | | | |
Short-term investments | | | | | | | | | | | | | | | | |
U.S. Treasury securities | | | 8,999 | | | | 0 | | | | 0 | | | | 8,999 | |
Investments measured at net asset value* | | | | | | | | | | | | | | | 847,280 | |
| | | 4,406,077 | | | | 0 | | | | 0 | | | | 5,253,357 | |
Futures contracts | | | 594 | | | | 0 | | | | 0 | | | | 594 | |
Total assets | | $ | 4,406,671 | | | $ | 0 | | | $ | 0 | | | $ | 5,253,951 | |
| * | Investments that are measured at fair value using the net asset value per share (or its equivalent) as a practical expedient have not been categorized in the fair value hierarchy. The fair value amount presented in the table is intended to permit reconciliation of the fair value hierarchy to the amounts presented in the Statements of Assets and Liabilities. At November 30, 2016, the aggregated affiliated Master Portfolios measured at fair value using the net asset value per share (or its equivalent) were valued at $847,280. Each affiliated Master Portfolio does not have a redemption period notice, can be redeemed daily and does not have any unfunded commitments. |
| | | | | | | | | | | | | | | | |
| Dynamic Target 2045 Fund | | Quoted prices
(Level 1) | | | Other significant
observable inputs
(Level 2) | | | Significant
unobservable inputs (Level 3) | | | Total | |
Assets | | | | | | | | | | | | | | | | |
Investments in: | | | | | | | | | | | | | | | | |
| | | | |
Exchange-traded funds | | $ | 1,772,154 | | | $ | 0 | | | $ | 0 | | | $ | 1,772,154 | |
| | | | |
Investment companies | | | 2,558,947 | | | | 0 | | | | 0 | | | | 2,558,947 | |
| | | | |
Short-term investments | | | | | | | | | | | | | | | | |
U.S. Treasury securities | | | 8,999 | | | | 0 | | | | 0 | | | | 8,999 | |
Investments measured at net asset value* | | | | | | | | | | | | | | | 828,683 | |
| | | 4,340,100 | | | | 0 | | | | 0 | | | | 5,168,783 | |
Futures contracts | | | 594 | | | | 0 | | | | 0 | | | | 594 | |
Total assets | | $ | 4,340,694 | | | $ | 0 | | | $ | 0 | | | $ | 5,169,377 | |
| * | Investments that are measured at fair value using the net asset value per share (or its equivalent) as a practical expedient have not been categorized in the fair value hierarchy. The fair value amount presented in the table is intended to permit reconciliation of the fair value hierarchy to the amounts presented in the Statements of Assets and Liabilities. At November 30, 2016, the aggregated affiliated Master Portfolios measured at fair value using the net asset value per share (or its equivalent) were valued at $828,683. Each affiliated Master Portfolio does not have a redemption period notice, can be redeemed daily and does not have any unfunded commitments. |
| | | | | | |
| Notes to financial statements (unaudited) | | Wells Fargo Dynamic Target Date Funds | | | 93 | |
| | | | | | | | | | | | | | | | |
| Dynamic Target 2050 Fund | | Quoted prices
(Level 1) | | | Other significant
observable inputs
(Level 2) | | | Significant
unobservable inputs (Level 3) | | | Total | |
Assets | | | | | | | | | | | | | | | | |
Investments in: | | | | | | | | | | | | | | | | |
| | | | |
Exchange-traded funds | | $ | 1,769,738 | | | $ | 0 | | | $ | 0 | | | $ | 1,769,738 | |
| | | | |
Investment companies | | | 2,553,194 | | | | 0 | | | | 0 | | | | 2,553,194 | |
| | | | |
Short-term investments | | | | | | | | | | | | | | | | |
U.S. Treasury securities | | | 8,999 | | | | 0 | | | | 0 | | | | 8,999 | |
Investments measured at net asset value* | | | | | | | | | | | | | | | 825,586 | |
| | | 4,331,931 | | | | 0 | | | | 0 | | | | 5,157,517 | |
Futures contracts | | | 594 | | | | 0 | | | | 0 | | | | 594 | |
Total assets | | $ | 4,332,525 | | | $ | 0 | | | $ | 0 | | | $ | 5,158,111 | |
| * | Investments that are measured at fair value using the net asset value per share (or its equivalent) as a practical expedient have not been categorized in the fair value hierarchy. The fair value amount presented in the table is intended to permit reconciliation of the fair value hierarchy to the amounts presented in the Statements of Assets and Liabilities. At November 30, 2016, the aggregated affiliated Master Portfolios measured at fair value using the net asset value per share (or its equivalent) were valued at $825,586. Each affiliated Master Portfolio does not have a redemption period notice, can be redeemed daily and does not have any unfunded commitments. |
| | | | | | | | | | | | | | | | |
| Dynamic Target 2055 Fund | | Quoted prices
(Level 1) | | | Other significant
observable inputs
(Level 2) | | | Significant
unobservable inputs (Level 3) | | | Total | |
Assets | | | | | | | | | | | | | | | | |
Investments in: | | | | | | | | | | | | | | | | |
| | | | |
Exchange-traded funds | | $ | 1,767,248 | | | $ | 0 | | | $ | 0 | | | $ | 1,767,248 | |
| | | | |
Investment companies | | | 2,549,674 | | | | 0 | | | | 0 | | | | 2,549,674 | |
| | | | |
Short-term investments | | | | | | | | | | | | | | | | |
U.S. Treasury securities | | | 8,999 | | | | 0 | | | | 0 | | | | 8,999 | |
Investments measured at net asset value* | | | | | | | | | | | | | | | 823,860 | |
| | | 4,325,921 | | | | 0 | | | | 0 | | | | 5,149,781 | |
Futures contracts | | | 594 | | | | 0 | | | | 0 | | | | 594 | |
Total assets | | $ | 4,326,515 | | | $ | 0 | | | $ | 0 | | | $ | 5,150,375 | |
| * | Investments that are measured at fair value using the net asset value per share (or its equivalent) as a practical expedient have not been categorized in the fair value hierarchy. The fair value amount presented in the table is intended to permit reconciliation of the fair value hierarchy to the amounts presented in the Statements of Assets and Liabilities. At November 30, 2016, the aggregated affiliated Master Portfolios measured at fair value using the net asset value per share (or its equivalent) were valued at $823,860. Each affiliated Master Portfolio does not have a redemption period notice, can be redeemed daily and does not have any unfunded commitments. |
| | | | | | | | | | | | | | | | |
| Dynamic Target 2060 Fund | | Quoted prices
(Level 1) | | | Other significant
observable inputs
(Level 2) | | | Significant
unobservable inputs (Level 3) | | | Total | |
Assets | | | | | | | | | | | | | | | | |
Investments in: | | | | | | | | | | | | | | | | |
| | | | |
Exchange-traded funds | | $ | 1,770,425 | | | $ | 0 | | | $ | 0 | | | $ | 1,770,425 | |
| | | | |
Investment companies | | | 2,553,636 | | | | 0 | | | | 0 | | | | 2,553,636 | |
| | | | |
Short-term investments | | | | | | | | | | | | | | | | |
U.S. Treasury securities | | | 8,999 | | | | 0 | | | | 0 | | | | 8,999 | |
Investments measured at net asset value* | | | | | | | | | | | | | | | 826,043 | |
| | | 4,333,060 | | | | 0 | | | | 0 | | | | 5,159,103 | |
Futures contracts | | | 594 | | | | 0 | | | | 0 | | | | 594 | |
Total assets | | $ | 4,333,654 | | | $ | 0 | | | $ | 0 | | | $ | 5,159,697 | |
| * | Investments that are measured at fair value using the net asset value per share (or its equivalent) as a practical expedient have not been categorized in the fair value hierarchy. The fair value amount presented in the table is intended to permit reconciliation of the fair value hierarchy to the amounts presented in the Statements of Assets and Liabilities. At November 30, 2016, the aggregated affiliated Master Portfolios measured at fair value using the net asset value per share (or its equivalent) were valued at $826,043. Each affiliated Master Portfolio does not have a redemption period notice, can be redeemed daily and does not have any unfunded commitments. |
| | | | |
| 94 | | Wells Fargo Dynamic Target Date Funds | | Notes to financial statements (unaudited) |
Futures contracts are reported at their variation margin at measurement date, which represents the amount due to the Funds at that date. All other assets and liabilities are reported at their market value at measurement date.
The Funds recognize transfers between levels within the fair value hierarchy at the end of the reporting period. At November 30, 2016, the Fund did not have any transfers into/out of Level 1, Level 2, or Level 3.
The investment objective of each affiliated Master Portfolio is as follows:
| | |
| Affiliated Master Portfolio | | Investment objective |
Wells Fargo C&B Large Cap Value Portfolio | | Seeks maximum long-term total return (current income and capital appreciation), consistent with minimizing risk to principal |
Wells Fargo Core Bond Portfolio | | Seeks total return, consisting of income and capital appreciation |
Wells Fargo Large Company Value Portfolio | | Seeks long-term capital appreciation |
Wells Fargo Real Return Portfolio | | Seeks returns that exceed the rate of inflation over the long-term |
Wells Fargo Small Company Growth Portfolio | | Seeks long-term capital appreciation |
Wells Fargo Small Company Value Portfolio | | Seeks long-term capital appreciation |
4. TRANSACTIONS WITH AFFILIATES
Management fee
Funds Management, an indirect wholly owned subsidiary of Wells Fargo & Company (“Wells Fargo”), is the manager of each Fund and provides advisory and fund-level administrative services under an investment management agreement. Under the investment management agreement, Funds Management is responsible for, among other services, implementing the investment objectives and strategies of each Fund, supervising the subadviser, providing fund-level administrative services in connection with each Fund’s operations, and providing any other fund-level administrative services reasonably necessary for the operation of each Fund. As compensation for its services under the investment management agreement, Funds Management is entitled to receive an annual management fee starting at 0.20% and declining to 0.18% as the average daily net assets of each Fund increase. For the six months ended November 30, 2016, the management fee was equivalent to an annual rate of 0.20% for each Fund.
Funds Management also serves as the manager to each affiliated Underlying Fund and the adviser to each affiliated Master Portfolio.
Funds Management has retained the services of a subadviser to provide daily portfolio management to the Funds. The fee for subadvisory services is borne by Funds Management. Wells Capital Management Incorporated, an affiliate of Funds Management and an indirect, wholly owned subsidiary of Wells Fargo, is the subadviser to each Fund and is paid an annual subadvisory fee starting at 0.15% and declining to 0.08% as the average daily net assets of each Fund increase.
Administration fees
Under a class-level administration agreement, Funds Management provides class-level administrative services to each Fund, which includes paying fees and expenses for services provided by the transfer agent, sub-transfer agents, omnibus account servicers and record-keepers. As compensation for its services under the class-level administration agreement, Funds Management receives an annual fee which is calculated based on the average daily net assets of each class as follows:
| | | | |
| | | Class-level
administration fee | |
Class A, Class C, Class R | | | 0.21 | % |
Class R4 | | | 0.08 | |
Class R6 | | | 0.03 | |
Funds Management has contractually waived and/or reimbursed management and administration fees to the extent necessary to maintain certain net operating expense ratios for the Funds. Waiver of fees and/or reimbursement of expenses by Funds Management were made first from fund level expenses on a proportionate basis and then from class
| | | | | | |
| Notes to financial statements (unaudited) | | Wells Fargo Dynamic Target Date Funds | | | 95 | |
specific expenses. Funds Management has committed through September 30, 2017 to waive fees and/or reimburse expenses to the extent necessary to cap each Fund’s expenses as follows:
| | | | | | | | | | | | | | | | | | | | |
| | | Class A | | | Class C | | | Class R | | | Class R4 | | | Class R6 | |
Dynamic Target Today Fund | | | 0.98 | % | | | 1.73 | % | | | 1.23 | % | | | 0.67 | % | | | 0.52 | % |
Dynamic Target 2015 Fund | | | 1.00 | % | | | 1.75 | % | | | 1.25 | % | | | 0.69 | % | | | 0.54 | % |
Dynamic Target 2020 Fund | | | 1.02 | % | | | 1.77 | % | | | 1.27 | % | | | 0.71 | % | | | 0.56 | % |
Dynamic Target 2025 Fund | | | 1.04 | % | | | 1.79 | % | | | 1.29 | % | | | 0.73 | % | | | 0.58 | % |
Dynamic Target 2030 Fund | | | 1.06 | % | | | 1.81 | % | | | 1.31 | % | | | 0.75 | % | | | 0.60 | % |
Dynamic Target 2035 Fund | | | 1.07 | % | | | 1.82 | % | | | 1.32 | % | | | 0.76 | % | | | 0.61 | % |
Dynamic Target 2040 Fund | | | 1.08 | % | | | 1.83 | % | | | 1.33 | % | | | 0.77 | % | | | 0.62 | % |
Dynamic Target 2045 Fund | | | 1.08 | % | | | 1.83 | % | | | 1.33 | % | | | 0.77 | % | | | 0.62 | % |
Dynamic Target 2050 Fund | | | 1.08 | % | | | 1.83 | % | | | 1.33 | % | | | 0.77 | % | | | 0.62 | % |
Dynamic Target 2055 Fund | | | 1.08 | % | | | 1.83 | % | | | 1.33 | % | | | 0.77 | % | | | 0.62 | % |
Dynamic Target 2060 Fund | | | 1.08 | % | | | 1.83 | % | | | 1.33 | % | | | 0.77 | % | | | 0.62 | % |
Net expenses from the underlying affiliated Master Portfolios and acquired fund fees and expenses are included in the expense caps. After the expiration date, each expense cap may be increased or the commitment to maintain the cap may be terminated only with the approval of the Board of Trustees.
Distribution fees
The Trust has adopted a Distribution Plan for Class C and Class R shares of each Fund pursuant to Rule 12b-1 under the 1940 Act. Distribution fees are charged to the Class C and Class R shares and paid to Wells Fargo Funds Distributor, LLC (“Funds Distributor”), the principal underwriter of each Fund, at an annual rate of 0.75% of the average daily net assets of Class C shares and 0.25% of the average daily net assets of Class R shares.
In addition, Funds Distributor is entitled to receive the front-end sales charge from the purchase of Class A shares and a contingent deferred sales charge on the redemption of certain Class A shares. Funds Distributor is also entitled to receive the contingent deferred sales charges from redemptions of Class C shares. For the six months ended November 30, 2016, Funds Distributor received $12 in front-end sales charges on Class A shares from Dynamic Target 2060 Fund.
Shareholder servicing fees
The Trust has entered into contracts with one or more shareholder servicing agents, whereby Class A, Class C, and Class R shares of each Fund are charged a fee at an annual rate of 0.25% of the average daily net assets of each respective class. Class R4 shares are charged a fee at an annual rate of 0.10% of its average daily net assets.
A portion of these total shareholder servicing fees are paid to affiliates of Wells Fargo.
| | | | |
| 96 | | Wells Fargo Dynamic Target Date Funds | | Notes to financial statements (unaudited) |
5. INVESTMENT PORTFOLIO TRANSACTIONS
Purchases and sales of investments, excluding short-term securities, for the six months ended November 30, 2016 were as follows:
| | | | | | | | | | | | |
| | | Purchases at cost* | | | Sales proceeds* | |
| | | U.S.
government | | Non-U.S.
government | | | U.S.
government | | Non-U.S.
government | |
Dynamic Target Today Fund | | $1,495,219 | | $ | 808,801 | | | $1,376,743 | | $ | 618,677 | |
Dynamic Target 2015 Fund | | 1,167,336 | | | 868,024 | | | 1,074,840 | | | 593,748 | |
Dynamic Target 2020 Fund | | 905,901 | | | 781,751 | | | 834,115 | | | 518,679 | |
Dynamic Target 2025 Fund | | 688,347 | | | 771,444 | | | 633,819 | | | 498,236 | |
Dynamic Target 2030 Fund | | 458,931 | | | 692,442 | | | 422,598 | | | 483,642 | |
Dynamic Target 2035 Fund | | 293,199 | | | 593,582 | | | 269,990 | | | 453,678 | |
Dynamic Target 2040 Fund | | 186,793 | | | 576,540 | | | 171,984 | | | 438,195 | |
Dynamic Target 2045 Fund | | 140,940 | | | 518,798 | | | 129,761 | | | 431,296 | |
Dynamic Target 2050 Fund | | 136,786 | | | 524,213 | | | 125,954 | | | 432,152 | |
Dynamic Target 2055 Fund | | 136,543 | | | 521,216 | | | 125,731 | | | 432,072 | |
Dynamic Target 2060 Fund | | 137,563 | | | 468,862 | | | 126,670 | | | 430,227 | |
| * | The Funds seek to achieve their investment objective by investing some of their investable assets in affiliated Master Portfolios. Purchases and sales related to these investments have been calculated by aggregating the results of multiplying such Fund’s ownership percentage of the respective affiliated Master Portfolio by the corresponding affiliated Master Portfolio’s purchases and sales. Purchases and sales of the affiliated and unaffiliated Underlying Funds in which the Funds invest are actual aggregate purchases and sales of those investments. |
6. INVESTMENTS IN AFFILIATES
An affiliated investment is a company which is under common ownership or control of the Fund or which the Fund has ownership of at least 5% of the outstanding voting shares. The following is a summary of transactions for the long-term holdings of issuers that were either affiliates of the Fund at the beginning of the period or the end of the period.
| | | | | | | | | | | | | | | | | | | | | | | | | | | | |
| | | Shares,
beginning
of period | | | Shares
purchased | | | Shares
sold | | | Shares,
end of
period | | | Value, end
of period | | | Dividends
from
affiliated
Underlying
Funds | | | Capital gain
distributions
from
affiliated
Underlying
Funds | |
Dynamic Target Today Fund | | | | | | | | | | | | | | | | | | | | | | | | | | | | |
Wells Fargo Diversified International Fund Class R6 | | | 20,420 | | | | 576 | | | | 281 | | | | 20,715 | | | $ | 230,761 | | | $ | 0 | | | $ | 0 | |
Wells Fargo Emerging Markets Equity Income Fund Class R6 | | | 10,965 | | | | 279 | | | | 647 | | | | 10,597 | | | | 104,066 | | | | 1,618 | | | | 0 | |
Wells Fargo Endeavor Select Fund Institutional Class | | | 13,451 | | | | 109 | | | | 206 | | | | 13,354 | | | | 126,062 | | | | 0 | | | | 0 | |
Wells Fargo Enterprise Fund Class R6 | | | 2,082 | | | | 64 | | | | 120 | | | | 2,026 | | | | 91,998 | | | | 0 | | | | 0 | |
Wells Fargo International Bond Fund Class R6 | | | 26,414 | | | | 1,799 | | | | 795 | | | | 27,418 | | | | 264,587 | | | | 0 | | | | 0 | |
Wells Fargo Intrinsic Value Fund Class R6 | | | 7,085 | | | | 47 | | | | 97 | | | | 7,035 | | | | 86,180 | | | | 0 | | | | 0 | |
Wells Fargo Premier Large Company Growth Fund Class R6 | | | 8,539 | | | | 254 | | | | 161 | | | | 8,632 | | | | 126,283 | | | | 0 | | | | 0 | |
Wells Fargo Short-Term Bond Fund Institutional Class | | | 56,295 | | | | 3,140 | | | | 954 | | | | 58,481 | | | | 511,122 | | | | 4,035 | | | | 0 | |
Wells Fargo Special Mid Cap Value Fund Class R6 | | | 2,795 | | | | 10 | | | | 152 | | | | 2,653 | | | | 94,939 | | | | 0 | | | | 0 | |
Wells Fargo Strategic Income Fund Institutional Class | | | 54,721 | | | | 2,028 | | | | 1,325 | | | | 55,424 | | | | 508,234 | | | | 5,088 | | | | 0 | |
| | | | | | | | | | | | | | | | | | | $ | 2,144,232 | | | $ | 10,741 | | | $ | 0 | |
| | | | | | |
| Notes to financial statements (unaudited) | | Wells Fargo Dynamic Target Date Funds | | | 97 | |
| | | | | | | | | | | | | | | | | | | | | | | | | | | | |
| | | Shares,
beginning
of period | | | Shares
purchased | | | Shares
sold | | | Shares,
end of
period | | | Value, end
of period | | | Dividends
from
affiliated
Underlying
Funds | | | Capital gain
distributions
from
affiliated
Underlying
Funds | |
Dynamic Target 2015 Fund | | | | | | | | | | | | | | | | | | | | | | | | | | | | |
Wells Fargo Diversified International Fund Class R6 | | | 29,792 | | | | 1,733 | | | | 861 | | | | 30,664 | | | | 341,598 | | | $ | 0 | | | $ | 0 | |
Wells Fargo Emerging Markets Equity Income Fund Class R6 | | | 15,909 | | | | 665 | | | | 827 | | | | 15,747 | | | | 154,639 | | | | 2,397 | | | | 0 | |
Wells Fargo Endeavor Select Fund Institutional Class | | | 19,614 | | | | 628 | | | | 400 | | | | 19,842 | | | | 187,309 | | | | 0 | | | | 0 | |
Wells Fargo Enterprise Fund Class R6 | | | 3,023 | | | | 146 | | | | 157 | | | | 3,012 | | | | 136,728 | | | | 0 | | | | 0 | |
Wells Fargo International Bond Fund Class R6 | | | 19,765 | | | | 2,963 | | | | 1,126 | | | | 21,602 | | | | 208,455 | | | | 0 | | | | 0 | |
Wells Fargo Intrinsic Value Fund Class R6 | | | 10,319 | | | | 281 | | | | 94 | | | | 10,506 | | | | 128,700 | | | | 0 | | | | 0 | |
Wells Fargo Premier Large Company Growth Fund Class R6 | | | 12,459 | | | | 586 | | | | 237 | | | | 12,808 | | | | 187,388 | | | | 0 | | | | 0 | |
Wells Fargo Short-Term Bond Fund Institutional Class | | | 41,805 | | | | 5,044 | | | | 1,288 | | | | 45,561 | | | | 398,204 | | | | 3,105 | | | | 0 | |
Wells Fargo Special Mid Cap Value Fund Class R6 | | | 4,068 | | | | 97 | | | | 247 | | | | 3,918 | | | | 140,175 | | | | 0 | | | | 0 | |
Wells Fargo Strategic Income Fund Institutional Class | | | 40,667 | | | | 3,961 | | | | 1,475 | | | | 43,153 | | | | 395,718 | | | | 3,890 | | | | 0 | |
| | | | | | | | | | | | | | | | | | | $ | 2,278,914 | | | $ | 9,392 | | | $ | 0 | |
Dynamic Target 2020 Fund | | | | | | | | | | | | | | | | | | | | | | | | | | | | |
Wells Fargo Diversified International Fund Class R6 | | | 34,923 | | | | 2,063 | | | | 826 | | | | 36,160 | | | $ | 402,823 | | | $ | 0 | | | $ | 0 | |
Wells Fargo Emerging Markets Equity Income Fund Class R6 | | | 18,721 | | | | 637 | | | | 796 | | | | 18,562 | | | | 182,281 | | | | 2,798 | | | | 0 | |
Wells Fargo Endeavor Select Fund Institutional Class | | | 23,007 | | | | 648 | | | | 238 | | | | 23,417 | | | | 221,054 | | | | 0 | | | | 0 | |
Wells Fargo Enterprise Fund Class R6 | | | 3,573 | | | | 165 | | | | 181 | | | | 3,557 | | | | 161,504 | | | | 0 | | | | 0 | |
Wells Fargo International Bond Fund Class R6 | | | 15,093 | | | | 2,750 | | | | 850 | | | | 16,993 | | | | 163,987 | | | | 0 | | | | 0 | |
Wells Fargo Intrinsic Value Fund Class R6 | | | 12,107 | | | | 421 | | | | 173 | | | | 12,355 | | | | 151,351 | | | | 0 | | | | 0 | |
Wells Fargo Premier Large Company Growth Fund Class R6 | | | 14,603 | | | | 592 | | | | 147 | | | | 15,048 | | | | 220,151 | | | | 0 | | | | 0 | |
Wells Fargo Short-Term Bond Fund Institutional Class | | | 32,087 | | | | 4,046 | | | | 828 | | | | 35,305 | | | | 308,566 | | | | 2,396 | | | | 0 | |
Wells Fargo Special Mid Cap Value Fund Class R6 | | | 4,789 | | | | 80 | | | | 186 | | | | 4,683 | | | | 167,549 | | | | 0 | | | | 0 | |
Wells Fargo Strategic Income Fund Institutional Class | | | 31,187 | | | | 3,264 | | | | 992 | | | | 33,459 | | | | 306,816 | | | | 3,010 | | | | 0 | |
| | | | | | | | | | | | | | | | | | | $ | 2,286,082 | | | $ | 8,204 | | | $ | 0 | |
Dynamic Target 2025 Fund | | | | | | | | | | | | | | | | | | | | | | | | | | | | |
Wells Fargo Diversified International Fund Class R6 | | | 40,448 | | | | 2,660 | | | | 864 | | | | 42,244 | | | $ | 470,601 | | | $ | 0 | | | $ | 0 | |
Wells Fargo Emerging Markets Equity Income Fund Class R6 | | | 21,645 | | | | 952 | | | | 949 | | | | 21,648 | | | | 212,587 | | | | 3,224 | | | | 0 | |
Wells Fargo Endeavor Select Fund Institutional Class | | | 26,665 | | | | 1,002 | | | | 297 | | | | 27,370 | | | | 258,368 | | | | 0 | | | | 0 | |
Wells Fargo Enterprise Fund Class R6 | | | 4,136 | | | | 252 | | | | 219 | | | | 4,169 | | | | 189,284 | | | | 0 | | | | 0 | |
Wells Fargo International Bond Fund Class R6 | | | 11,328 | | | | 2,574 | | | | 943 | | | | 12,959 | | | | 125,050 | | | | 0 | | | | 0 | |
Wells Fargo Intrinsic Value Fund Class R6 | | | 14,010 | | | | 600 | | | | 137 | | | | 14,473 | | | | 177,290 | | | | 0 | | | | 0 | |
Wells Fargo Premier Large Company Growth Fund Class R6 | | | 16,918 | | | | 872 | | | | 125 | | | | 17,665 | | | | 258,436 | | | | 0 | | | | 0 | |
Wells Fargo Short-Term Bond Fund Institutional Class | | | 24,065 | | | | 3,904 | | | | 1,151 | | | | 26,818 | | | | 234,393 | | | | 1,793 | | | | 0 | |
Wells Fargo Special Mid Cap Value Fund Class R6 | | | 5,546 | | | | 148 | | | | 233 | | | | 5,461 | | | | 195,396 | | | | 0 | | | | 0 | |
Wells Fargo Strategic Income Fund Institutional Class | | | 23,392 | | | | 3,298 | | | | 1,313 | | | | 25,377 | | | | 232,708 | | | | 2,249 | | | | 0 | |
| | | | | | | | | | | | | | | | | | | $ | 2,354,113 | | | $ | 7,266 | | | $ | 0 | |
Dynamic Target 2030 Fund | | | | | | | | | | | | | | | | | | | | | | | | | | | | |
Wells Fargo Diversified International Fund Class R6 | | | 45,343 | | | | 2,703 | | | | 1,116 | | | | 46,930 | | | $ | 522,805 | | | $ | 0 | | | $ | 0 | |
Wells Fargo Emerging Markets Equity Income Fund Class R6 | | | 24,282 | | | | 1,355 | | | | 1,393 | | | | 24,244 | | | | 238,075 | | | | 3,609 | | | | 0 | |
Wells Fargo Endeavor Select Fund Institutional Class | | | 29,879 | | | | 1,019 | | | | 591 | | | | 30,307 | | | | 286,094 | | | | 0 | | | | 0 | |
Wells Fargo Enterprise Fund Class R6 | | | 4,608 | | | | 261 | | | | 243 | | | | 4,626 | | | | 210,004 | | | | 0 | | | | 0 | |
Wells Fargo International Bond Fund Class R6 | | | 7,426 | | | | 2,246 | | | | 895 | | | | 8,777 | | | | 84,699 | | | | 0 | | | | 0 | |
Wells Fargo Intrinsic Value Fund Class R6 | | | 15,710 | | | | 453 | | | | 109 | | | | 16,054 | | | | 196,662 | | | | 0 | | | | 0 | |
Wells Fargo Premier Large Company Growth Fund Class R6 | | | 18,961 | | | | 893 | | | | 258 | | | | 19,596 | | | | 286,691 | | | | 0 | | | | 0 | |
Wells Fargo Short-Term Bond Fund Institutional Class | | | 15,716 | | | | 3,406 | | | | 1,315 | | | | 17,807 | | | | 155,635 | | | | 1,171 | | | | 0 | |
Wells Fargo Special Mid Cap Value Fund Class R6 | | | 6,195 | | | | 159 | | | | 279 | | | | 6,075 | | | | 217,371 | | | | 0 | | | | 0 | |
Wells Fargo Strategic Income Fund Institutional Class | | | 15,278 | | | | 2,889 | | | | 1,261 | | | | 16,906 | | | | 155,030 | | | | 1,481 | | | | 0 | |
| | | | | | | | | | | | | | | | | | | $ | 2,353,066 | | | $ | 6,261 | | | $ | 0 | |
| | | | |
| 98 | | Wells Fargo Dynamic Target Date Funds | | Notes to financial statements (unaudited) |
| | | | | | | | | | | | | | | | | | | | | | | | | | | | |
| | | Shares,
beginning
of period | | | Shares
purchased | | | Shares
sold | | | Shares,
end of
period | | | Value, end
of period | | | Dividends
from
affiliated
Underlying
Funds | | | Capital gain
distributions
from
affiliated
Underlying
Funds | |
Dynamic Target 2035 Fund | | | | | | | | | | | | | | | | | | | | | | | | | | | | |
Wells Fargo Diversified International Fund Class R6 | | | 48,108 | | | | 2,322 | | | | 967 | | | | 49,463 | | | $ | 551,022 | | | $ | 0 | | | $ | 0 | |
Wells Fargo Emerging Markets Equity Income Fund Class R6 | | | 25,721 | | | | 779 | | | | 1,178 | | | | 25,322 | | | | 248,659 | | | | 3,832 | | | | 0 | |
Wells Fargo Endeavor Select Fund Institutional Class | | | 31,745 | | | | 905 | | | | 558 | | | | 32,092 | | | | 302,952 | | | | 0 | | | | 0 | |
Wells Fargo Enterprise Fund Class R6 | | | 4,907 | | | | 218 | | | | 248 | | | | 4,877 | | | | 221,398 | | | | 0 | | | | 0 | |
Wells Fargo International Bond Fund Class R6 | | | 4,862 | | | | 1,448 | | | | 725 | | | | 5,585 | | | | 53,898 | | | | 0 | | | | 0 | |
Wells Fargo Intrinsic Value Fund Class R6 | | | 16,667 | | | | 428 | | | | 127 | | | | 16,968 | | | | 207,858 | | | | 0 | | | | 0 | |
Wells Fargo Premier Large Company Growth Fund Class R6 | | | 20,115 | | | | 709 | | | | 191 | | | | 20,633 | | | | 301,860 | | | | 0 | | | | 0 | |
Wells Fargo Short-Term Bond Fund Institutional Class | | | 10,291 | | | | 2,194 | | | | 1,115 | | | | 11,370 | | | | 99,370 | | | | 768 | | | | 0 | |
Wells Fargo Special Mid Cap Value Fund Class R6 | | | 6,592 | | | | 99 | | | | 284 | | | | 6,407 | | | | 229,228 | | | | 0 | | | | 0 | |
Wells Fargo Strategic Income Fund Institutional Class | | | 10,002 | | | | 1,863 | | | | 1,060 | | | | 10,805 | | | | 99,082 | | | | 964 | | | | 0 | |
| | | | | | | | | | | | | | | | | | | $ | 2,315,327 | | | $ | 5,564 | | | $ | 0 | |
Dynamic Target 2040 Fund | | | | | | | | | | | | | | | | | | | | | | | | | | | | |
Wells Fargo Diversified International Fund Class R6 | | | 50,806 | | | | 2,732 | | | | 692 | | | | 52,846 | | | $ | 588,701 | | | $ | 0 | | | $ | 0 | |
Wells Fargo Emerging Markets Equity Income Fund Class R6 | | | 27,749 | | | | 2,346 | | | | 1,996 | | | | 28,099 | | | | 275,932 | | | | 4,042 | | | | 0 | |
Wells Fargo Endeavor Select Fund Institutional Class | | | 33,204 | | | | 1,608 | | | | 758 | | | | 34,054 | | | | 321,469 | | | | 0 | | | | 0 | |
Wells Fargo Enterprise Fund Class R6 | | | 5,128 | | | | 194 | | | | 227 | | | | 5,095 | | | | 231,315 | | | | 0 | | | | 0 | |
Wells Fargo International Bond Fund Class R6 | | | 3,052 | | | | 1,169 | | | | 605 | | | | 3,616 | | | | 34,894 | | | | 0 | | | | 0 | |
Wells Fargo Intrinsic Value Fund Class R6 | | | 17,620 | | | | 387 | | | | 228 | | | | 17,779 | | | | 217,794 | | | | 0 | | | | 0 | |
Wells Fargo Premier Large Company Growth Fund Class R6 | | | 21,100 | | | | 1,102 | | | | 288 | | | | 21,914 | | | | 320,595 | | | | 0 | | | | 0 | |
Wells Fargo Short-Term Bond Fund Institutional Class | | | 6,399 | | | | 1,708 | | | | 927 | | | | 7,180 | | | | 62,755 | | | | 469 | | | | 0 | |
Wells Fargo Special Mid Cap Value Fund Class R6 | | | 6,898 | | | | 60 | | | | 277 | | | | 6,681 | | | | 239,062 | | | | 0 | | | | 0 | |
Wells Fargo Strategic Income Fund Institutional Class | | | 6,216 | | | | 1,502 | | | | 890 | | | | 6,828 | | | | 62,611 | | | | 596 | | | | 0 | |
| | | | | | | | | | | | | | | | | | | $ | 2,355,128 | | | $ | 5,107 | | | $ | 0 | |
Dynamic Target 2045 Fund | | | | | | | | | | | | | | | | | | | | | | | | | | | | |
Wells Fargo Diversified International Fund Class R6 | | | 51,090 | | | | 1,840 | | | | 664 | | | | 52,266 | | | $ | 582,239 | | | $ | 0 | | | $ | 0 | |
Wells Fargo Emerging Markets Equity Income Fund Class R6 | | | 27,405 | | | | 799 | | | | 1,410 | | | | 26,794 | | | | 263,112 | | | | 4,054 | | | | 0 | |
Wells Fargo Endeavor Select Fund Institutional Class | | | 33,574 | | | | 1,115 | | | | 799 | | | | 33,890 | | | | 319,918 | | | | 0 | | | | 0 | |
Wells Fargo Enterprise Fund Class R6 | | | 5,165 | | | | 209 | | | | 229 | | | | 5,145 | | | | 233,604 | | | | 0 | | | | 0 | |
Wells Fargo International Bond Fund Class R6 | | | 2,400 | | | | 866 | | | | 533 | | | | 2,733 | | | | 26,374 | | | | 0 | | | | 0 | |
Wells Fargo Intrinsic Value Fund Class R6 | | | 17,713 | | | | 484 | | | | 253 | | | | 17,944 | | | | 219,818 | | | | 0 | | | | 0 | |
Wells Fargo Premier Large Company Growth Fund Class R6 | | | 21,347 | | | | 732 | | | | 302 | | | | 21,777 | | | | 318,600 | | | | 0 | | | | 0 | |
Wells Fargo Short-Term Bond Fund Institutional Class | | | 5,029 | | | | 1,202 | | | | 811 | | | | 5,420 | | | | 47,375 | | | | 369 | | | | 0 | |
Wells Fargo Special Mid Cap Value Fund Class R6 | | | 6,958 | | | | 78 | | | | 278 | | | | 6,758 | | | | 241,794 | | | | 0 | | | | 0 | |
Wells Fargo Strategic Income Fund Institutional Class | | | 4,884 | | | | 1,076 | | | | 804 | | | | 5,156 | | | | 47,278 | | | | 464 | | | | 0 | |
| | | | | | | | | | | | | | | | | | | $ | 2,300,112 | | | $ | 4,887 | | | $ | 0 | |
Dynamic Target 2050 Fund | | | | | | | | | | | | | | | | | | | | | | | | | | | | |
Wells Fargo Diversified International Fund Class R6 | | | 50,959 | | | | 1,953 | | | | 685 | | | | 52,227 | | | $ | 581,814 | | | $ | 0 | | | $ | 0 | |
Wells Fargo Emerging Markets Equity Income Fund Class R6 | | | 27,289 | | | | 858 | | | | 1,376 | | | | 26,771 | | | | 262,893 | | | | 4,046 | | | | 0 | |
Wells Fargo Endeavor Select Fund Institutional Class | | | 33,498 | | | | 1,165 | | | | 818 | | | | 33,845 | | | | 319,493 | | | | 0 | | | | 0 | |
Wells Fargo Enterprise Fund Class R6 | | | 5,158 | | | | 226 | | | | 234 | | | | 5,150 | | | | 233,818 | | | | 0 | | | | 0 | |
Wells Fargo International Bond Fund Class R6 | | | 2,354 | | | | 806 | | | | 528 | | | | 2,632 | | | | 25,397 | | | | 0 | | | | 0 | |
Wells Fargo Intrinsic Value Fund Class R6 | | | 17,669 | | | | 524 | | | | 258 | | | | 17,935 | | | | 219,705 | | | | 0 | | | | 0 | |
Wells Fargo Premier Large Company Growth Fund Class R6 | | | 21,287 | | | | 795 | | | | 299 | | | | 21,783 | | | | 318,688 | | | | 0 | | | | 0 | |
Wells Fargo Short-Term Bond Fund Institutional Class | | | 4,947 | | | | 1,110 | | | | 804 | | | | 5,253 | | | | 45,909 | | | | 359 | | | | 0 | |
Wells Fargo Special Mid Cap Value Fund Class R6 | | | 6,945 | | | | 85 | | | | 278 | | | | 6,752 | | | | 241,571 | | | | 0 | | | | 0 | |
Wells Fargo Strategic Income Fund Institutional Class | | | 4,804 | | | | 984 | | | | 792 | | | | 4,996 | | | | 45,814 | | | | 452 | | | | 0 | |
| | | | | | | | | | | | | | | | | | | $ | 2,295,102 | | | $ | 4,857 | | | $ | 0 | |
| | | | | | |
| Notes to financial statements (unaudited) | | Wells Fargo Dynamic Target Date Funds | | | 99 | |
| | | | | | | | | | | | | | | | | | | | | | | | | | | | |
| | | Shares,
beginning
of period | | | Shares
purchased | | | Shares
sold | | | Shares,
end of
period | | | Value, end
of period | | | Dividends
from
affiliated
Underlying
Funds | | | Capital gain
distributions
from
affiliated
Underlying
Funds | |
Dynamic Target 2055 Fund | | | | | | | | | | | | | | | | | | | | | | | | | | | | |
Wells Fargo Diversified International Fund Class R6 | | | 50,920 | | | | 1,940 | | | | 709 | | | | 52,151 | | | $ | 580,959 | | | $ | 0 | | | $ | 0 | |
Wells Fargo Emerging Markets Equity Income Fund Class R6 | | | 27,258 | | | | 850 | | | | 1,371 | | | | 26,737 | | | | 262,557 | | | | 4,040 | | | | 0 | |
Wells Fargo Endeavor Select Fund Institutional Class | | | 33,480 | | | | 1,133 | | | | 798 | | | | 33,815 | | | | 319,215 | | | | 0 | | | | 0 | |
Wells Fargo Enterprise Fund Class R6 | | | 5,158 | | | | 214 | | | | 236 | | | | 5,136 | | | | 233,190 | | | | 0 | | | | 0 | |
Wells Fargo International Bond Fund Class R6 | | | 2,352 | | | | 806 | | | | 531 | | | | 2,627 | | | | 25,351 | | | | 0 | | | | 0 | |
Wells Fargo Intrinsic Value Fund Class R6 | | | 17,654 | | | | 513 | | | | 253 | | | | 17,914 | | | | 219,449 | | | | 0 | | | | 0 | |
Wells Fargo Premier Large Company Growth Fund Class R6 | | | 21,272 | | | | 750 | | | | 295 | | | | 21,727 | | | | 317,866 | | | | 0 | | | | 0 | |
Wells Fargo Short-Term Bond Fund Institutional Class | | | 4,942 | | | | 1,107 | | | | 806 | | | | 5,243 | | | | 45,827 | | | | 359 | | | | 0 | |
Wells Fargo Special Mid Cap Value Fund Class R6 | | | 6,941 | | | | 84 | | | | 276 | | | | 6,749 | | | | 241,483 | | | | 0 | | | | 0 | |
Wells Fargo Strategic Income Fund Institutional Class | | | 4,800 | | | | 980 | | | | 793 | | | | 4,987 | | | | 45,729 | | | | 452 | | | | 0 | |
| | | | | | | | | | | | | | | | | | | $ | 2,291,626 | | | $ | 4,851 | | | $ | 0 | |
Dynamic Target 2060 Fund | | | | | | | | | | | | | | | | | | | | | | | | | | | | |
Wells Fargo Diversified International Fund Class R6 | | | 50,970 | | | | 1,910 | | | | 634 | | | | 52,246 | | | $ | 582,021 | | | $ | 0 | | | $ | 0 | |
Wells Fargo Emerging Markets Equity Income Fund Class R6 | | | 27,299 | | | | 852 | | | | 1,372 | | | | 26,779 | | | | 262,965 | | | | 4,046 | | | | 0 | |
Wells Fargo Endeavor Select Fund Institutional Class | | | 33,509 | | | | 1,139 | | | | 820 | | | | 33,828 | | | | 319,333 | | | | 0 | | | | 0 | |
Wells Fargo Enterprise Fund Class R6 | | | 5,158 | | | | 219 | | | | 229 | | | | 5,148 | | | | 233,699 | | | | 0 | | | | 0 | |
Wells Fargo International Bond Fund Class R6 | | | 2,358 | | | | 810 | | | | 521 | | | | 2,647 | | | | 25,541 | | | | 0 | | | | 0 | |
Wells Fargo Intrinsic Value Fund Class R6 | | | 17,674 | | | | 528 | | | | 262 | | | | 17,940 | | | | 219,766 | | | | 0 | | | | 0 | |
Wells Fargo Premier Large Company Growth Fund Class R6 | | | 21,293 | | | | 767 | | | | 297 | | | | 21,763 | | | | 318,390 | | | | 0 | | | | 0 | |
Wells Fargo Short-Term Bond Fund Institutional Class | | | 4,955 | | | | 1,138 | | | | 811 | | | | 5,282 | | | | 46,164 | | | | 359 | | | | 0 | |
Wells Fargo Special Mid Cap Value Fund Class R6 | | | 6,946 | | | | 86 | | | | 278 | | | | 6,754 | | | | 241,656 | | | | 0 | | | | 0 | |
Wells Fargo Strategic Income Fund Institutional Class | | | 4,810 | | | | 1,008 | | | | 795 | | | | 5,023 | | | | 46,065 | | | | 452 | | | | 0 | |
| | | | | | | | | | | | | | | | | | | $ | 2,295,600 | | | $ | 4,857 | | | $ | 0 | |
In addition, each Fund’s ownership of affiliated Master Portfolios was as follows:
| | | | | | | | | | | | |
| | | % of ownership,
beginning of
period | | | % of ownership,
end of period | | | Value, end of period | |
Dynamic Target Today Fund | | | | | | | | | | | | |
Wells Fargo C&B Large Cap Value Portfolio | | | 0.03 | % | | | 0.03 | % | | $ | 87,115 | |
Wells Fargo Core Bond Portfolio | | | 0.02 | | | | 0.01 | | | | 666,148 | |
Wells Fargo Large Company Value Portfolio | | | 0.11 | | | | 0.12 | | | | 87,389 | |
Wells Fargo Real Return Portfolio | | | 0.43 | | | | 0.38 | | | | 279,290 | |
Wells Fargo Small Company Growth Portfolio | | | 0.00 | * | | | 0.00 | * | | | 56,567 | |
Wells Fargo Small Company Value Portfolio | | | 0.02 | | | | 0.03 | | | | 57,798 | |
| | | | | | | | | | | $ | 1,234,307 | |
Dynamic Target 2015 Fund | | | | | | | | | | | | |
Wells Fargo C&B Large Cap Value Portfolio | | | 0.04 | % | | | 0.04 | % | | $ | 130,211 | |
Wells Fargo Core Bond Portfolio | | | 0.01 | | | | 0.01 | | | | 520,070 | |
Wells Fargo Large Company Value Portfolio | | | 0.15 | | | | 0.17 | | | | 130,320 | |
Wells Fargo Real Return Portfolio | | | 0.32 | | | | 0.30 | | | | 218,052 | |
Wells Fargo Small Company Growth Portfolio | | | 0.01 | | | | 0.01 | | | | 84,551 | |
Wells Fargo Small Company Value Portfolio | | | 0.04 | | | | 0.04 | | | | 86,552 | |
| | | | | | | | | | | $ | 1,169,756 | |
| | | | |
| 100 | | Wells Fargo Dynamic Target Date Funds | | Notes to financial statements (unaudited) |
| | | | | | | | | | | | |
| | | % of ownership,
beginning of
period | | | % of ownership,
end of period | | | Value, end of period | |
Dynamic Target 2020 Fund | | | | | | | | | | | | |
Wells Fargo C&B Large Cap Value Portfolio | | | 0.05 | % | | | 0.04 | % | | $ | 153,114 | |
Wells Fargo Core Bond Portfolio | | | 0.01 | | | | 0.01 | | | | 403,593 | |
Wells Fargo Large Company Value Portfolio | | | 0.18 | | | | 0.21 | | | | 153,879 | |
Wells Fargo Real Return Portfolio | | | 0.24 | | | | 0.23 | | | | 169,272 | |
Wells Fargo Small Company Growth Portfolio | | | 0.01 | | | | 0.01 | | | | 99,709 | |
Wells Fargo Small Company Value Portfolio | | | 0.04 | | | | 0.05 | | | | 102,461 | |
| | | | | | | | | | | $ | 1,082,028 | |
Dynamic Target 2025 Fund | | | | | | | | | | | | |
Wells Fargo C&B Large Cap Value Portfolio | | | 0.06 | % | | | 0.05 | % | | $ | 179,674 | |
Wells Fargo Core Bond Portfolio | | | 0.01 | | | | 0.01 | | | | 306,681 | |
Wells Fargo Large Company Value Portfolio | | | 0.21 | | | | 0.24 | | | | 179,743 | |
Wells Fargo Real Return Portfolio | | | 0.18 | | | | 0.18 | | | | 128,401 | |
Wells Fargo Small Company Growth Portfolio | | | 0.01 | | | | 0.01 | | | | 117,461 | |
Wells Fargo Small Company Value Portfolio | | | 0.05 | | | | 0.05 | | | | 120,457 | |
| | | | | | | | | | | $ | 1,032,417 | |
Dynamic Target 2030 Fund | | | | | | | | | | | | |
Wells Fargo C&B Large Cap Value Portfolio | | | 0.06 | % | | | 0.06 | % | | $ | 199,232 | |
Wells Fargo Core Bond Portfolio | | | 0.00 | * | | | 0.00 | * | | | 204,481 | |
Wells Fargo Large Company Value Portfolio | | | 0.23 | | | | 0.27 | | | | 200,269 | |
Wells Fargo Real Return Portfolio | | | 0.12 | | | | 0.12 | | | | 85,367 | |
Wells Fargo Small Company Growth Portfolio | | | 0.01 | | | | 0.01 | | | | 130,367 | |
Wells Fargo Small Company Value Portfolio | | | 0.06 | | | | 0.06 | | | | 133,710 | |
| | | | | | | | | | | $ | 953,426 | |
Dynamic Target 2035 Fund | | | | | | | | | | | | |
Wells Fargo C&B Large Cap Value Portfolio | | | 0.07 | % | | | 0.06 | % | | $ | 210,490 | |
Wells Fargo Core Bond Portfolio | | | 0.00 | * | | | 0.00 | * | | | 130,640 | |
Wells Fargo Large Company Value Portfolio | | | 0.25 | | | | 0.28 | | | | 210,771 | |
Wells Fargo Real Return Portfolio | | | 0.08 | | | | 0.07 | | | | 54,492 | |
Wells Fargo Small Company Growth Portfolio | | | 0.01 | | | | 0.01 | | | | 136,885 | |
Wells Fargo Small Company Value Portfolio | | | 0.06 | | | | 0.06 | | | | 141,217 | |
| | | | | | | | | | | $ | 884,495 | |
Dynamic Target 2040 Fund | | | | | | | | | | | | |
Wells Fargo C&B Large Cap Value Portfolio | | | 0.07 | % | | | 0.06 | % | | $ | 220,184 | |
Wells Fargo Core Bond Portfolio | | | 0.00 | * | | | 0.00 | * | | | 83,215 | |
Wells Fargo Large Company Value Portfolio | | | 0.26 | | | | 0.29 | | | | 220,454 | |
Wells Fargo Real Return Portfolio | | | 0.05 | | | | 0.05 | | | | 34,994 | |
Wells Fargo Small Company Growth Portfolio | | | 0.01 | | | | 0.01 | | | | 141,886 | |
Wells Fargo Small Company Value Portfolio | | | 0.06 | | | | 0.07 | | | | 146,547 | |
| | | | | | | | | | | $ | 847,280 | |
Dynamic Target 2045 Fund | | | | | | | | | | | | |
Wells Fargo C&B Large Cap Value Portfolio | | | 0.07 | % | | | 0.06 | % | | $ | 222,682 | |
Wells Fargo Core Bond Portfolio | | | 0.00 | * | | | 0.00 | * | | | 62,785 | |
Wells Fargo Large Company Value Portfolio | | | 0.26 | | | | 0.30 | | | | 222,873 | |
Wells Fargo Real Return Portfolio | | | 0.04 | | | | 0.04 | | | | 26,452 | |
Wells Fargo Small Company Growth Portfolio | | | 0.01 | | | | 0.01 | | | | 144,398 | |
Wells Fargo Small Company Value Portfolio | | | 0.06 | | | | 0.07 | | | | 149,493 | |
| | | | | | | | | | | $ | 828,683 | |
| | | | | | |
| Notes to financial statements (unaudited) | | Wells Fargo Dynamic Target Date Funds | | | 101 | |
| | | | | | | | | | | | |
| | | % of ownership,
beginning of
period | | | % of ownership,
end of period | | | Value, end of period | |
Dynamic Target 2050 Fund | | | | | | | | | | | | |
Wells Fargo C&B Large Cap Value Portfolio | | | 0.07 | % | | | 0.06 | % | | $ | 222,585 | |
Wells Fargo Core Bond Portfolio | | | 0.00 | * | | | 0.00 | * | | | 60,945 | |
Wells Fargo Large Company Value Portfolio | | | 0.26 | | | | 0.30 | | | | 222,806 | |
Wells Fargo Real Return Portfolio | | | 0.04 | | | | 0.03 | | | | 25,471 | |
Wells Fargo Small Company Growth Portfolio | | | 0.01 | | | | 0.01 | | | | 144,595 | |
Wells Fargo Small Company Value Portfolio | | | 0.06 | | | | 0.07 | | | | 149,184 | |
| | | | | | | | | | | $ | 825,586 | |
Dynamic Target 2055 Fund | | | | | | | | | | | | |
Wells Fargo C&B Large Cap Value Portfolio | | | 0.07 | % | | | 0.06 | % | | $ | 222,297 | |
Wells Fargo Core Bond Portfolio | | | 0.00 | * | | | 0.00 | * | | | 60,837 | |
Wells Fargo Large Company Value Portfolio | | | 0.26 | | | | 0.30 | | | | 222,518 | |
Wells Fargo Real Return Portfolio | | | 0.04 | | | | 0.03 | | | | 25,423 | |
Wells Fargo Small Company Growth Portfolio | | | 0.01 | | | | 0.01 | | | | 143,846 | |
Wells Fargo Small Company Value Portfolio | | | 0.06 | | | | 0.07 | | | | 148,939 | |
| | | | | | | | | | | $ | 823,860 | |
Dynamic Target 2060 Fund | | | | | | | | | | | | |
Wells Fargo C&B Large Cap Value Portfolio | | | 0.07 | % | | | 0.06 | % | | $ | 222,665 | |
Wells Fargo Core Bond Portfolio | | | 0.00 | * | | | 0.00 | * | | | 61,291 | |
Wells Fargo Large Company Value Portfolio | | | 0.26 | | | | 0.30 | | | | 222,868 | |
Wells Fargo Real Return Portfolio | | | 0.04 | | | | 0.04 | | | | 25,611 | |
Wells Fargo Small Company Growth Portfolio | | | 0.01 | | | | 0.01 | | | | 144,370 | |
Wells Fargo Small Company Value Portfolio | | | 0.06 | | | | 0.07 | | | | 149,238 | |
| | | | | | | | | | | $ | 826,043 | |
| * | The amount invested is less than 0.005%. |
7. DERIVATIVE TRANSACTIONS
During the six months ended November 30, 2016, the Funds entered into futures contracts for to gain market exposure to certain asset classes consistent with an active asset allocation strategy.
At November 30, 2016, the Fund had short futures contracts outstanding as follows:
| | | | | | | | | | | | | | | | | | | | |
| | | Expiration date | | Counterparty | | Contracts | | | Type | | | Contract value at
November 30, 2016 | | | Unrealized
gains | |
Dynamic Target Today Fund | | 3-22-2017 | | Goldman Sachs | | | 1 Short | | | | 10-Year U.S. Treasury Notes | | | $ | 124,516 | | | $ | 210 | |
Dynamic Target 2015 Fund | | 3-22-2017 | | Goldman Sachs | | | 1 Short | | | | 10-Year U.S. Treasury Notes | | | | 124,516 | | | | 210 | |
Dynamic Target 2020 Fund | | 3-22-2017 | | Goldman Sachs | | | 1 Short | | | | 10-Year U.S. Treasury Notes | | | | 124,516 | | | | 210 | |
Dynamic Target 2025 Fund | | 3-22-2017 | | Goldman Sachs | | | 1 Short | | | | 10-Year U.S. Treasury Notes | | | | 124,516 | | | | 210 | |
Dynamic Target 2030 Fund | | 3-22-2017 | | Goldman Sachs | | | 1 Short | | | | 10-Year U.S. Treasury Notes | | | | 124,516 | | | | 210 | |
Dynamic Target 2035 Fund | | 3-22-2017 | | Goldman Sachs | | | 1 Short | | | | 10-Year U.S. Treasury Notes | | | | 124,516 | | | | 210 | |
Dynamic Target 2040 Fund | | 3-22-2017 | | Goldman Sachs | | | 1 Short | | | | 10-Year U.S. Treasury Notes | | | | 124,516 | | | | 210 | |
Dynamic Target 2045 Fund | | 3-22-2017 | | Goldman Sachs | | | 1 Short | | | | 10-Year U.S. Treasury Notes | | | | 124,516 | | | | 210 | |
Dynamic Target 2050 Fund | | 3-22-2017 | | Goldman Sachs | | | 1 Short | | | | 10-Year U.S. Treasury Notes | | | | 124,516 | | | | 210 | |
Dynamic Target 2055 Fund | | 3-22-2017 | | Goldman Sachs | | | 1 Short | | | | 10-Year U.S. Treasury Notes | | | | 124,516 | | | | 210 | |
Dynamic Target 2060 Fund | | 3-22-2017 | | Goldman Sachs | | | 1 Short | | | | 10-Year U.S. Treasury Notes | | | | 124,516 | | | | 210 | |
| | | | |
| 102 | | Wells Fargo Dynamic Target Date Funds | | Notes to financial statements (unaudited) |
During the six months ended November 30, 2016, the Funds had average notional amounts in futures contracts outstanding as follows:
| | | | |
| | | Short contracts | |
Dynamic Target Today Fund | | $ | 314,805 | |
Dynamic Target 2015 Fund | | | 315,901 | |
Dynamic Target 2020 Fund | | | 319,569 | |
Dynamic Target 2025 Fund | | | 328,009 | |
Dynamic Target 2030 Fund | | | 340,769 | |
Dynamic Target 2035 Fund | | | 346,989 | |
Dynamic Target 2040 Fund | | | 350,572 | |
Dynamic Target 2045 Fund | | | 351,639 | |
Dynamic Target 2050 Fund | | | 351,639 | |
Dynamic Target 2055 Fund | | | 351,158 | |
Dynamic Target 2060 Fund | | | 351,158 | |
The fair value of derivative instruments for each Fund is reflected in the Statements of Assets and Liabilities.
The effect of derivative instruments on the Statements of Operations for the six months ended November 30, 2016 was as follows for the Funds:
| | | | | | | | | | | | | | | | | | | | | | | | |
| | �� | Amount of realized gains
(losses) on derivatives | | | Change in unrealized gains
(losses) on derivatives | |
| | | Interest rate
contracts | | | Equity
contracts | | | Total | | | Interest rate
contracts | | | Equity
contracts | | | Total | |
Dynamic Target Today Fund | | $ | 1,124 | | | $ | 4,526 | | | $ | 5,650 | | | $ | 841 | | | $ | 0 | | | $ | 841 | |
Dynamic Target 2015 Fund | | | 2,775 | | | | 889 | | | | 3,664 | | | | 841 | | | | 0 | | | | 841 | |
Dynamic Target 2020 Fund | | | 2,775 | | | | 520 | | | | 3,295 | | | | 841 | | | | 0 | | | | 841 | |
Dynamic Target 2025 Fund | | | 2,775 | | | | (2,544 | ) | | | 231 | | | | 841 | | | | 0 | | | | 841 | |
Dynamic Target 2030 Fund | | | 2,775 | | | | (6,733 | ) | | | (3,958 | ) | | | 841 | | | | 0 | | | | 841 | |
Dynamic Target 2035 Fund | | | 2,775 | | | | (2,131 | ) | | | 644 | | | | 841 | | | | 0 | | | | 841 | |
Dynamic Target 2040 Fund | | | 2,789 | | | | (4,291 | ) | | | (1,502 | ) | | | 841 | | | | 0 | | | | 841 | |
Dynamic Target 2045 Fund | | | 2,791 | | | | (2,808 | ) | | | (17 | ) | | | 841 | | | | 0 | | | | 841 | |
Dynamic Target 2050 Fund | | | 2,791 | | | | (2,807 | ) | | | (16 | ) | | | 841 | | | | 0 | | | | 841 | |
Dynamic Target 2055 Fund | | | 2,792 | | | | (3,929 | ) | | | (1,137 | ) | | | 841 | | | | 0 | | | | 841 | |
Dynamic Target 2060 Fund | | | 2,790 | | | | (3,929 | ) | | | (1,139 | ) | | | 841 | | | | 0 | | | | 841 | |
For certain types of derivative transactions, the Funds have entered into International Swaps and Derivatives Association, Inc. master agreements (“ISDA Master Agreements”) or similar agreements with approved counterparties. The ISDA Master Agreements or similar agreements may have requirements to deliver/deposit securities or cash to/with an exchange or broker-dealer as collateral and allows the Funds to offset, with each counterparty, certain derivative financial instrument’s assets and/or liabilities with collateral held or pledged. Collateral requirements differ by type of derivative. Collateral or margin requirements are set by the broker or exchange clearing house for exchange traded derivatives while collateral terms are contract specific for over-the-counter traded derivatives. Cash collateral that has been pledged to cover obligations of the Funds under ISDA Master Agreements or similar agreements, if any, are reported separately in the Statements of Assets and Liabilities. Securities pledged as collateral, if any, are noted in the Portfolio of Investments. With respect to balance sheet offsetting, absent an event of default by the counterparty or a termination of the agreement, the reported amounts of financial assets and financial liabilities in the Statements of Assets and Liabilities are not offset across
| | | | | | |
| Notes to financial statements (unaudited) | | Wells Fargo Dynamic Target Date Funds | | | 103 | |
transactions between the Funds and the applicable counterparty. A reconciliation of the gross amounts on the Statements of Assets and Liabilities to the net amounts by derivative type, including any collateral exposure, is as follows:
| | | | | | | | | | | | | | | | | | | | |
| | | Derivative type | | Counterparty | | Gross amounts
of assets in the
Statements of
Assets and
Liabilities | | | Amounts
subject to
netting
agreements | | | Collateral
received | | | Net amount
of assets | |
Dynamic Target Today Fund | | Futures – variation margin | | Goldman Sachs | | $ | 594 | | | $ | 0 | | | $ | 0 | | | $ | 594 | |
Dynamic Target 2015 Fund | | Futures – variation margin | | Goldman Sachs | | | 594 | | | | 0 | | | | 0 | | | | 594 | |
Dynamic Target 2020 Fund | | Futures – variation margin | | Goldman Sachs | | | 594 | | | | 0 | | | | 0 | | | | 594 | |
Dynamic Target 2025 Fund | | Futures – variation margin | | Goldman Sachs | | | 594 | | | | 0 | | | | 0 | | | | 594 | |
Dynamic Target 2030 Fund | | Futures – variation margin | | Goldman Sachs | | | 594 | | | | 0 | | | | 0 | | | | 594 | |
Dynamic Target 2035 Fund | | Futures – variation margin | | Goldman Sachs | | | 594 | | | | 0 | | | | 0 | | | | 594 | |
Dynamic Target 2040 Fund | | Futures – variation margin | | Goldman Sachs | | | 594 | | | | 0 | | | | 0 | | | | 594 | |
Dynamic Target 2045 Fund | | Futures – variation margin | | Goldman Sachs | | | 594 | | | | 0 | | | | 0 | | | | 594 | |
Dynamic Target 2050 Fund | | Futures – variation margin | | Goldman Sachs | | | 594 | | | | 0 | | | | 0 | | | | 594 | |
Dynamic Target 2055 Fund | | Futures – variation margin | | Goldman Sachs | | | 594 | | | | 0 | | | | 0 | | | | 594 | |
Dynamic Target 2060 Fund | | Futures – variation margin | | Goldman Sachs | | | 594 | | | | 0 | | | | 0 | | | | 594 | |
8. CONCENTRATION OF OWNERSHIP
As of November 30, 2016, the Funds were primarily owned by Wells Fargo. Investment by and/or voting activities of Wells Fargo with respect to their holdings in each Fund could have a material impact on the Fund. At November 30, 2016, Wells Fargo’s ownership of each Fund was as follows:
| | | | |
| | | % of ownership | |
Dynamic Target Today Fund | | | 99.58 | % |
Dynamic Target 2015 Fund | | | 95.02 | |
Dynamic Target 2020 Fund | | | 96.30 | |
Dynamic Target 2025 Fund | | | 98.27 | |
Dynamic Target 2030 Fund | | | 98.54 | |
Dynamic Target 2035 Fund | | | 99.60 | |
Dynamic Target 2040 Fund | | | 97.68 | |
Dynamic Target 2045 Fund | | | 99.53 | |
Dynamic Target 2050 Fund | | | 99.77 | |
Dynamic Target 2055 Fund | | | 99.87 | |
Dynamic Target 2060 Fund | | | 99.88 | |
9. INDEMNIFICATION
Under the Trust’s organizational documents, the officers and Trustees have been granted certain indemnification rights against certain liabilities that may arise out of performance of their duties to the Trust. Additionally, in the normal course of business, the Trust may enter into contracts with service providers that contain a variety of indemnification clauses. The Trust’s maximum exposure under these arrangements is dependent on future claims that may be made against the Funds and, therefore, cannot be estimated.
10. REGULATORY CHANGES
In October 2016, the Securities and Exchange Commission (“SEC”) adopted new rules and forms and amended existing rules and forms (together, “final rules”) intended to modernize and enhance the reporting and disclosure of information by registered investment companies and to enhance liquidity risk management by open-end mutual funds and exchange-traded funds. The final rules will enhance the quality of information available to investors and will allow the SEC to more effectively collect and use data reported by funds. In part, the final rules amend Regulation S-X and require
| | | | |
| 104 | | Wells Fargo Dynamic Target Date Funds | | Notes to financial statements (unaudited) |
standardized, enhanced disclosure about derivatives in the Fund’s financial statements, as well as other amendments. The compliance date for the amendments to Regulation S-X is August 1, 2017 while the compliance date for the new form types is June 1, 2018 and the compliance date for the liquidity risk management program requirements is December 1, 2018. Management is currently assessing the potential impact of these enhancements and their impact on the financial statement disclosures and reporting requirements.
11. SUBSEQUENT DISTRIBUTIONS
On December 7, 2016, the Fund declared distributions from short-term capital gains and long-term capital gains to shareholders of record on December 6, 2016. The per share amounts payable on December 8, 2016 were as follows:
| | | | | | | | | | | | | | | | | | | | | | | | | | | | | | | | | | | | | | | | | | | | |
| | | Dynamic
Target
Today
Fund | | | Dynamic
Target
2015
Fund | | | Dynamic
Target
2020
Fund | | | Dynamic
Target
2025
Fund | | | Dynamic
Target
2030
Fund | | | Dynamic
Target
2035
Fund | | | Dynamic
Target
2040
Fund | | | Dynamic
Target
2045
Fund | | | Dynamic
Target
2050
Fund | | | Dynamic
Target
2055
Fund | | | Dynamic
Target
2060
Fund | |
Short-term capital gains | | | | | | | | | | | | | | | | | | | | | | | | | | | | | | | | | |
Class A | | $ | 0.01606 | | | $ | 0.01013 | | | $ | 0.01068 | | | $ | 0.00365 | | | $ | 0.00000 | | | $ | 0.00237 | | | $ | 0.00107 | | | $ | 0.00150 | | | $ | 0.00134 | | | $ | 0.00015 | | | $ | 0.00075 | |
Class C | | | 0.01606 | | | | 0.01013 | | | | 0.01068 | | | | 0.00365 | | | | 0.00000 | | | | 0.00237 | | | | 0.00107 | | | | 0.00150 | | | | 0.00134 | | | | 0.00015 | | | | 0.00075 | |
Class R | | | 0.01606 | | | | 0.01013 | | | | 0.01068 | | | | 0.00365 | | | | 0.00000 | | | | 0.00237 | | | | 0.00107 | | | | 0.00150 | | | | 0.00134 | | | | 0.00015 | | | | 0.00075 | |
Class R4 | | | 0.01606 | | | | 0.01013 | | | | 0.01068 | | | | 0.00365 | | | | 0.00000 | | | | 0.00237 | | | | 0.00107 | | | | 0.00150 | | | | 0.00134 | | | | 0.00015 | | | | 0.00075 | |
Class R6 | | | 0.01606 | | | | 0.01013 | | | | 0.01068 | | | | 0.00365 | | | | 0.00000 | | | | 0.00237 | | | | 0.00107 | | | | 0.00150 | | | | 0.00134 | | | | 0.00015 | | | | 0.00075 | |
| | | | | | | | | |
Long-term capital gains | | | | | | | | | | | | | | | | | | | | | | | | | | | | | | | | | | | | | |
Class A | | $ | 0.07391 | | | $ | 0.09667 | | | $ | 0.16261 | | | $ | 0.16151 | | | $ | 0.18786 | | | $ | 0.20376 | | | $ | 0.20312 | | | $ | 0.22404 | | | $ | 0.22498 | | | $ | 0.22923 | | | $ | 0.23996 | |
Class C | | | 0.07391 | | | | 0.09667 | | | | 0.16261 | | | | 0.16151 | | | | 0.18786 | | | | 0.20376 | | | | 0.20312 | | | | 0.22404 | | | | 0.22498 | | | | 0.22923 | | | | 0.23996 | |
Class R | | | 0.07391 | | | | 0.09667 | | | | 0.16261 | | | | 0.16151 | | | | 0.18786 | | | | 0.20376 | | | | 0.20312 | | | | 0.22404 | | | | 0.22498 | | | | 0.22923 | | | | 0.23996 | |
Class R4 | | | 0.07391 | | | | 0.09667 | | | | 0.16261 | | | | 0.16151 | | | | 0.18786 | | | | 0.20376 | | | | 0.20312 | | | | 0.22404 | | | | 0.22498 | | | | 0.22923 | | | | 0.23996 | |
Class R6 | | | 0.07391 | | | | 0.09667 | | | | 0.16261 | | | | 0.16151 | | | | 0.18786 | | | | 0.20376 | | | | 0.20312 | | | | 0.22404 | | | | 0.22498 | | | | 0.22923 | | | | 0.23996 | |
On December 29, 2016, the Fund declared distributions from net investment income to shareholders of record on December 28, 2016. The per share amounts payable on December 30, 2016 were as follows:
| | | | | | | | | | | | | | | | | | | | | | | | | | | | | | | | | | | | | | | | | | | | |
| | | Dynamic
Target
Today
Fund | | | Dynamic
Target
2015
Fund | | | Dynamic
Target
2020
Fund | | | Dynamic
Target
2025
Fund | | | Dynamic
Target
2030
Fund | | | Dynamic
Target
2035
Fund | | | Dynamic
Target
2040
Fund | | | Dynamic
Target
2045
Fund | | | Dynamic
Target
2050
Fund | | | Dynamic
Target
2055
Fund | | | Dynamic
Target
2060
Fund | |
Net investment income | | | | | | | | | | | | | | | | | | | | | | | | | | | | | | | | | | | | | |
Class A | | $ | 0.04186 | | | $ | 0.04398 | | | $ | 0.12194 | | | $ | 0.11583 | | | $ | 0.11405 | | | $ | 0.10986 | | | $ | 0.10568 | | | $ | 0.10375 | | | $ | 0.09429 | | | $ | 0.09444 | | | $ | 0.09449 | |
Class C | | | 0.02017 | | | | 0.02230 | | | | 0.03709 | | | | 0.03426 | | | | 0.02361 | | | | 0.02178 | | | | 0.01975 | | | | 0.01963 | | | | 0.02120 | | | | 0.02110 | | | | 0.02097 | |
Class R | | | 0.03463 | | | | 0.03669 | | | | 0.08173 | | | | 0.07655 | | | | 0.07175 | | | | 0.06965 | | | | 0.06770 | | | | 0.06750 | | | | 0.06895 | | | | 0.06883 | | | | 0.06880 | |
Class R4 | | | 0.05002 | | | | 0.05205 | | | | 0.13352 | | | | 0.12818 | | | | 0.12307 | | | | 0.12071 | | | | 0.11876 | | | | 0.11851 | | | | 0.11982 | | | | 0.11972 | | | | 0.11984 | |
Class R6 | | | 0.05438 | | | | 0.05639 | | | | 0.14827 | | | | 0.14282 | | | | 0.13764 | | | | 0.13520 | | | | 0.13326 | | | | 0.13300 | | | | 0.13426 | | | | 0.13416 | | | | 0.13432 | |
These distributions are not reflected in the accompanying financial statements. The final determination of the source of all distributions is subject to change and made after the tax year-end of each Fund.
| | | | | | |
| Other information (unaudited) | | Wells Fargo Dynamic Target Date Funds | | | 105 | |
PROXY VOTING INFORMATION
A description of the policies and procedures used to determine how to vote proxies relating to portfolio securities is available without charge, upon request, by calling 1-800-222-8222, visiting our website at wellsfargofunds.com, or visiting the SEC website at sec.gov. Information regarding how the proxies related to portfolio securities were voted during the most recent 12-month period ended June 30 is available on the website at wellsfargofunds.com or by visiting the SEC website at sec.gov.
PORTFOLIO HOLDINGS INFORMATION
The complete portfolio holdings are publicly available on the website (wellsfargofunds.com) on a one-month delayed basis. In addition, top ten holdings information (excluding derivative positions) is publicly available on the website on a monthly, seven-day or more delayed basis. Each Fund files its complete schedule of portfolio holdings with the SEC for the first and third quarters of each fiscal year on Form N-Q, which is available by visiting the SEC website at sec.gov. In addition, each Form N-Q may be reviewed and copied at the SEC’s Public Reference Room in Washington, DC, and at regional offices in New York City, at 233 Broadway, and in Chicago, at 175 West Jackson Boulevard, Suite 900. Information about the Public Reference Room may be obtained by calling 1-800-SEC-0330.
| | | | |
| 106 | | Wells Fargo Dynamic Target Date Funds | | Other information (unaudited) |
BOARD OF TRUSTEES AND OFFICERS
Each of the Trustees and Officers1 listed in the table below acts in identical capacities for each fund in the Wells Fargo family of funds, which consists of 139 mutual funds comprising the Wells Fargo Funds Trust, Wells Fargo Variable Trust, Wells Fargo Master Trust and four closed-end funds (collectively the “Fund Complex”). This table should be read in conjunction with the Prospectus and the Statement of Additional Information2. The mailing address of each Trustee and Officer is 525 Market Street, 12th Floor, San Francisco, CA 94105. Each Trustee and Officer serves an indefinite term, however, each Trustee serves such term until reaching the mandatory retirement age established by the Trustees.
Independent Trustees
| | | | | | |
Name and year of birth | | Position held and length of service* | | Principal occupations during past five years or longer | | Current other public company or
investment company
directorships |
| William R. Ebsworth (Born 1957) | | Trustee, since 2015 | | Retired. From 1984 to 2013, equities analyst, portfolio manager, research director and chief investment officer at Fidelity Management and Research Company in Boston, Tokyo, and Hong Kong and retired in 2013 as Chief Investment Officer of Fidelity Strategic Advisers, Inc. where he lead a team of investment professionals managing client assets. Prior thereto, Board member of Hong Kong Securities Clearing Co., Hong Kong Options Clearing Corp., the Thailand International Fund, Ltd., Fidelity Investments Life Insurance Company, and Empire Fidelity Investments Life Insurance Company. Mr. Ebsworth is a CFA® charterholder and an Adjunct Lecturer, Finance, at Babson College. | | Asset Allocation Trust |
| Jane A. Freeman (Born 1953) | | Trustee, since 2015 | | Retired. From 2012 to 2014 and 1999 to 2008, Chief Financial Officer of Scientific Learning Corporation. From 2008 to 2012, Ms. Freeman provided consulting services related to strategic business projects. Prior to 1999, Portfolio Manager at Rockefeller & Co. and Scudder, Stevens & Clark. Board member of the Harding Loevner Funds from 1996 to 2014, serving as both Lead Independent Director and chair of the Audit Committee. Board member of the Russell Exchange Traded Funds Trust from 2011 to 2012 and the chair of the Audit Committee. Ms. Freeman is Chair of Taproot Foundation (non-profit organization), a Board Member of Ruth Bancroft Garden (non-profit organization) and an inactive chartered financial analyst. | | Asset Allocation Trust |
| Peter G. Gordon** (Born 1942) | | Trustee, since 1998; Chairman, since 2005 | | Co-Founder, Retired Chairman, President and CEO of Crystal Geyser Water Company. Trustee Emeritus, Colby College. | | Asset Allocation Trust |
| Isaiah Harris, Jr. (Born 1952) | | Trustee, since 2009 | | Retired. Chairman of the Board of CIGNA Corporation since 2009, and Director since 2005. From 2003 to 2011, Director of Deluxe Corporation. Prior thereto, President and CEO of BellSouth Advertising and Publishing Corp. from 2005 to 2007, President and CEO of BellSouth Enterprises from 2004 to 2005 and President of BellSouth Consumer Services from 2000 to 2003. Emeritus member of the Iowa State University Foundation Board of Governors. Emeritus Member of the Advisory Board of Iowa State University School of Business. Advisory Board Member, Palm Harbor Academy (charter school). Advisory Board Member, Child Evangelism Fellowship (non-profit). Mr. Harris is a certified public accountant (inactive status). | | CIGNA Corporation; Asset Allocation Trust |
| Judith M. Johnson (Born 1949) | | Trustee, since 2008;
Audit Committee Chairman, since 2008 | | Retired. Prior thereto, Chief Executive Officer and Chief Investment Officer of Minneapolis Employees Retirement Fund from 1996 to 2008. Ms. Johnson is an attorney, certified public accountant and a certified managerial accountant. | | Asset Allocation Trust |
| David F. Larcker (Born 1950) | | Trustee, since 2009 | | James Irvin Miller Professor of Accounting at the Graduate School of Business, Stanford University, Director of the Corporate Governance Research Initiative and Senior Faculty of The Rock Center for Corporate Governance since 2006. From 2005 to 2008, Professor of Accounting at the Graduate School of Business, Stanford University. Prior thereto, Ernst & Young Professor of Accounting at The Wharton School, University of Pennsylvania from 1985 to 2005. | | Asset Allocation Trust |
| | | | | | |
| Other information (unaudited) | | Wells Fargo Dynamic Target Date Funds | | | 107 | |
| | | | | | |
Name and year of birth | | Position held and length of service* | | Principal occupations during past five years or longer | | Current other public company or
investment company
directorships |
| Olivia S. Mitchell (Born 1953) | | Trustee, since 2006 | | International Foundation of Employee Benefit Plans Professor, Wharton School of the University of Pennsylvania since 1993. Director of Wharton’s Pension Research Council and Boettner Center on Pensions & Retirement Research, and Research Associate at the National Bureau of Economic Research. Previously, Cornell University Professor from 1978 to 1993. | | Asset Allocation Trust |
| Timothy J. Penny (Born 1951) | | Trustee, since 1996 | | President and Chief Executive Officer of Southern Minnesota Initiative Foundation, a non-profit organization, since 2007 and Senior Fellow at the Humphrey Institute Policy Forum at the University of Minnesota since 1995. Member of the Board of Trustees of NorthStar Education Finance, Inc., a non-profit organization, since 2007. | | Asset Allocation Trust |
| Michael S. Scofield (Born 1943) | | Trustee, since 2010 | | Served on the Investment Company Institute’s Board of Governors and Executive Committee from 2008-2011 as well the Governing Council of the Independent Directors Council from 2006-2011 and the Independent Directors Council Executive Committee from 2008-2011. Chairman of the IDC from 2008-2010. Institutional Investor (Fund Directions) Trustee of Year in 2007. Trustee of the Evergreen Funds complex (and its predecessors) from 1984 to 2010. Chairman of the Evergreen Funds from 2000-2010. Former Trustee of the Mentor Funds. Retired Attorney, Law Offices of Michael S. Scofield. | | Asset Allocation Trust |
| * | Length of service dates reflect the Trustee’s commencement of service with the Trust’s predecessor entities, where applicable. |
| ** | Peter Gordon is expected to retire on December 31, 2017. |
Officers
| | | | | | |
Name and
year of birth | | Position held and
length of service | | Principal occupations during past five years or longer | | |
Andrew Owen3 (Born 1960) | | President, since 2017 | | Executive Vice President of Wells Fargo & Company and Head of Affiliated Managers, Wells Fargo Asset Management, since 2014. Executive Vice President responsible for marketing, investments and product development for Wells Fargo Funds Management, LLC, from 2009 to 2014. | | |
Jeremy DePalma1 (Born 1974) | | Treasurer, since 2012 | | Senior Vice President of Wells Fargo Funds Management, LLC since 2009. Senior Vice President of Evergreen Investment Management Company, LLC from 2008 to 2010 and head of the Fund Reporting and Control Team within Fund Administration from 2005 to 2010. | | |
C. David Messman (Born 1960) | | Secretary, since 2000; Chief Legal Officer, since 2003 | | Senior Vice President and Secretary of Wells Fargo Funds Management, LLC since 2001. Assistant General Counsel of Wells Fargo Bank, N.A. since 2013 and Vice President and Managing Counsel of Wells Fargo Bank, N.A. from 1996 to 2013. | | |
Michael Whitaker (Born 1967) | | Chief Compliance Officer, since 2016 | | Executive Vice President of Wells Fargo Funds Management, LLC since 2016. Chief Compliance Officer of Fidelity’s Fixed Income Funds and Asset Allocation Funds from 2008 to 2016, Compliance Officer of FMR Co., Inc. from 2014 to 2016, Fidelity Investments Money Management, Inc. from 2014 to 2016, Fidelity Investments from 2007 to 2016. | | |
David Berardi (Born 1975) | | Assistant Treasurer, since 2009 | | Vice President of Wells Fargo Funds Management, LLC since 2009. Vice President of Evergreen Investment Management Company, LLC from 2008 to 2010. Manager of Fund Reporting and Control for Evergreen Investment Management Company, LLC from 2004 to 2010. | | |
| 1 | Jeremy DePalma acts as Treasurer of 69 funds and Assistant Treasurer of 70 funds in the Fund Complex. |
| 2 | The Statement of Additional Information includes additional information about the Trustees and is available, without charge, upon request, by calling 1-800-222-8222 or by visiting the website at wellsfargofunds.com. |
| 3 | Andrew Owen became President on January 1, 2017. |
| | | | |
| 108 | | Wells Fargo Dynamic Target Date Funds | | List of abbreviations |
The following is a list of common abbreviations for terms and entities that may have appeared in this report.
| ACA | — ACA Financial Guaranty Corporation |
| ADR | — American depositary receipt |
| ADS | — American depositary shares |
| AGC | — Assured Guaranty Corporation |
| AGM | — Assured Guaranty Municipal |
| Ambac | — Ambac Financial Group Incorporated |
| AMT | — Alternative minimum tax |
| BAN | — Bond anticipation notes |
| BHAC | — Berkshire Hathaway Assurance Corporation |
| CAB | — Capital appreciation bond |
| CCAB | — Convertible capital appreciation bond |
| CDA | — Community Development Authority |
| CDO | — Collateralized debt obligation |
| DRIVER | — Derivative inverse tax-exempt receipts |
| DW&P | — Department of Water & Power |
| DWR | — Department of Water Resources |
| ECFA | — Educational & Cultural Facilities Authority |
| EDA | — Economic Development Authority |
| EDFA | — Economic Development Finance Authority |
| ETF | — Exchange-traded fund |
| FDIC | — Federal Deposit Insurance Corporation |
| FFCB | — Federal Farm Credit Banks |
| FGIC | — Financial Guaranty Insurance Corporation |
| FHA | — Federal Housing Administration |
| FHLB | — Federal Home Loan Bank |
| FHLMC | — Federal Home Loan Mortgage Corporation |
| FICO | — The Financing Corporation |
| FNMA | — Federal National Mortgage Association |
| GDR | — Global depositary receipt |
| GNMA | — Government National Mortgage Association |
| HCFR | — Healthcare facilities revenue |
| HEFA | — Health & Educational Facilities Authority |
| HEFAR | — Higher education facilities authority revenue |
| HFA | — Housing Finance Authority |
| HFFA | — Health Facilities Financing Authority |
| HUD | — Department of Housing and Urban Development |
| IDA | — Industrial Development Authority |
| IDAG | — Industrial Development Agency |
| KRW | — Republic of Korea won |
| LIBOR | — London Interbank Offered Rate |
| LIFER | — Long Inverse Floating Exempt Receipts |
| LLC | — Limited liability company |
| LLLP | — Limited liability limited partnership |
| LLP | — Limited liability partnership |
| MBIA | — Municipal Bond Insurance Association |
| MFHR | — Multifamily housing revenue |
| MSTR | — Municipal securities trust receipts |
| MUD | — Municipal Utility District |
| National | — National Public Finance Guarantee Corporation |
| PCFA | — Pollution Control Financing Authority |
| PCL | — Public Company Limited |
| PCR | — Pollution control revenue |
| PFA | — Public Finance Authority |
| PFFA | — Public Facilities Financing Authority |
| PFOTER | — Puttable floating option tax-exempt receipts |
| plc | — Public limited company |
| PUTTER | — Puttable tax-exempt receipts |
| R&D | — Research & development |
| Radian | — Radian Asset Assurance |
| RAN | — Revenue anticipation notes |
| RDA | — Redevelopment Authority |
| RDFA | — Redevelopment Finance Authority |
| REIT | — Real estate investment trust |
| ROC | — Reset option certificates |
| SAVRS | — Select auction variable rate securities |
| SBA | — Small Business Authority |
| SDR | — Swedish depositary receipt |
| SFHR | — Single-family housing revenue |
| SFMR | — Single-family mortgage revenue |
| SPA | — Standby purchase agreement |
| SPDR | — Standard & Poor’s Depositary Receipts |
| SPEAR | — Short Puttable Exempt Adjustable Receipts |
| STRIPS | — Separate trading of registered interest and |
| TAN | — Tax anticipation notes |
| TIPS | — Treasury inflation-protected securities |
| TRAN | — Tax revenue anticipation notes |
| TTFA | — Transportation Trust Fund Authority |
| TVA | — Tennessee Valley Authority |

For more information
More information about Wells Fargo Funds is available free upon request. To obtain literature, please write, email, visit the Funds’ website, or call:
Wells Fargo Funds
P.O. Box 8266
Boston, MA 02266-8266
Email: fundservice@wellsfargo.com
Website: wellsfargofunds.com
Individual investors: 1-800-222-8222
Retail investment professionals: 1-888-877-9275
Institutional investment professionals: 1-866-765-0778
This report and the financial statements contained herein are submitted for the general information of the shareholders of Wells Fargo Funds. If this report is used for promotional purposes, distribution of the report must be accompanied or preceded by a current prospectus. Before investing, please consider the investment objectives, risks, charges, and expenses of the investment. For a current prospectus and, if available, a summary prospectus, containing this information, call 1-800-222-8222 or visit the Funds’ website at wellsfargofunds.com. Read the prospectus carefully before you invest or send money.
Wells Fargo Asset Management (WFAM) is a trade name used by the asset management businesses of Wells Fargo & Company. Wells Fargo Funds Management, LLC, a wholly owned subsidiary of Wells Fargo & Company, provides investment advisory and administrative services for Wells Fargo Funds. Other affiliates of Wells Fargo & Company provide subadvisory and other services for the funds. The funds are distributed by Wells Fargo Funds Distributor, LLC, Member FINRA, an affiliate of Wells Fargo & Company. Neither Wells Fargo Funds Management nor Wells Fargo Funds Distributor has Fund customer accounts/assets, and neither provides investment advice/recommendations or acts as an investment advice fiduciary to any investor.
NOT FDIC INSURED ◾ NO BANK GUARANTEE ◾ MAY LOSE VALUE
© 2016 Wells Fargo Funds Management, LLC. All rights reserved.
| | |
 | | 248014 01-17 SDTD/SAR104 11-16 |
Semi-Annual Report
November 30, 2016

Income Funds

| ∎ | | Wells Fargo Core Bond Fund |
| ∎ | | Wells Fargo Real Return Fund |

Reduce clutter. Save trees.
Sign up for electronic delivery of prospectuses and shareholder reports at wellsfargo.com/advantagedelivery
Contents
| * | A complete schedule of portfolio holdings as of the report date may be obtained, free of charge, by accessing the following website: https://www.wellsfargofunds.com/assets/edocs/regulatory/holdings/core-bond-semi.pdf or by calling Wells Fargo Funds at 1-800-222-8222. This complete schedule, filed on Form N-CSRS, is also available on the SEC’s website at sec.gov. |
The views expressed and any forward-looking statements are as of November 30, 2016, unless otherwise noted, and are those of the Fund managers and/or Wells Fargo Funds Management, LLC. Discussions of individual securities, or the markets generally, or any Wells Fargo Fund are not intended as individual recommendations. Future events or results may vary significantly from those expressed in any forward-looking statements. The views expressed are subject to change at any time in response to changing circumstances in the market. Wells Fargo Funds Management, LLC and the Fund disclaim any obligation to publicly update or revise any views expressed or forward-looking statements.
NOT FDIC INSURED ◾ NO BANK GUARANTEE ◾ MAY LOSE VALUE
| | | | |
| 2 | | Wells Fargo Income Funds | | Letter to shareholders (unaudited) |

Andrew Owen
President
Wells Fargo Funds
The Fed continued an easy monetary policy, keeping the federal funds rate steady between 0.25% and 0.50%.
Dear Shareholder:
As the new president of Wells Fargo Funds now that Karla Rabusch is retiring from that position after nearly 14 years, I am pleased to offer you this semi-annual report for the Wells Fargo Income Funds for the six-month period that ended November 30, 2016. During this period, yields rose amid expectations for a U.S. Federal Reserve (Fed) interest-rate hike and anticipation of more fiscal stimulus under president-elect Trump.
Major central banks continued to provide stimulus, helping support global economies and keep interest rates low.
The Fed continued an easy monetary policy, keeping the federal funds rate steady between 0.25% and 0.50%. Meanwhile, the European Central Bank kept all three of its short-term rates steady during the reporting period and continued its asset-purchase program. After the United Kingdom voted to leave the European Union (E.U.) in June 2016, the Bank of England announced that it would buy corporate bonds with the goal of lowering borrowing costs and encouraging businesses to invest. In Japan, the Bank of Japan maintained an aggressive monetary program aimed at combating deflation.
The U.S. economy proved resilient; non-U.S. economies generally were weaker.
The divergence between U.S. and non-U.S. economic growth continued, with persistent weakness in European and Japanese inflation, risks of sharply slower growth in China, and the recalibration of energy and commodity prices weighing on the markets. Oil prices appeared to stabilize, however, ranging between $43 and $54 per barrel during the reporting period. In the U.S., economic growth advanced and inflation trended higher but remained tame. For example, the Consumer Price Index advanced 1.6% from a year earlier as of October 2016. In addition, the U.K. vote on June 23, 2016, to exit the E.U. exacerbated uncertainty about the U.K.’s economic growth, financial markets, and political responses to a number of policy issues.
Yields rose from low levels.
Ten-year U.S. government bond yields declined to 1.36% in early July and then rose to 2.29% by the end of the reporting period. The bulk of the increase in yields occurred during November after Donald Trump won the U.S. presidential election and market participants began to expect more economic growth and modestly greater inflation due to Trump’s call for tax cuts, less regulation, and increased infrastructure spending. The Bloomberg Barclays U.S. Aggregate Bond Index1 returned -0.92% during the six-month reporting period that ended November 30, 2016. Meanwhile, investment-grade bond returns (a subset of the Bloomberg Barclays U.S. Aggregate Bond Index) were little changed, and high-yield bonds as measured by the Bloomberg Barclays U.S. Corporate High Yield Bond Index2 returned 6.43% due to its income component.
Since the end of the financial crisis, structural changes in the fixed-income markets have reduced trading liquidity (the degree to which assets can be bought or sold
| 1 | The Bloomberg Barclays U.S. Aggregate Bond Index (formerly known as Barclays U.S. Aggregate Bond Index) is a broad-based benchmark that measures the investment-grade, U.S. dollar–denominated, fixed-rate taxable bond market, including Treasuries, government-related and corporate securities, mortgage-backed securities (agency fixed-rate and hybrid adjustable-rate mortgage pass-throughs), asset-backed securities, and commercial mortgage-backed securities. You cannot invest directly in an index. |
| 2 | The Bloomberg Barclays U.S. Corporate High Yield Bond Index (formerly known as Barclays U.S. Corporate High Yield Bond Index) is an unmanaged, U.S. dollar–denominated, nonconvertible, non-investment-grade debt index. The index consists of domestic corporate bonds rated Ba and below with a minimum outstanding amount of $150 million. You cannot invest directly in an index. |
| | | | | | |
| Letter to shareholders (unaudited) | | Wells Fargo Income Funds | | | 3 | |
without affecting the price). New regulations and capital requirements have caused traditional liquidity suppliers (banks and broker/dealers) to be more risk-averse and hold less inventory. Meanwhile, corporate debt issuance has spiked as companies finance themselves at record-low yields, bond mutual funds hold larger amounts of this new debt supply, trading volumes are lower, and large-size trades are more difficult to execute. However, fixed-income markets appeared to function well over the past year with sufficient liquidity.
Don’t let short-term uncertainty derail long-term investment goals.
Periods of uncertainty can present challenges, but experience has taught us that maintaining long-term investment goals can be an effective way to plan for the future. To help you create a sound strategy based on your personal goals and risk tolerance, Wells Fargo Funds offers more than 100 mutual funds spanning a wide range of asset classes and investment styles. Although diversification cannot guarantee an investment profit or prevent losses, we believe it can be an effective way to manage investment risk and potentially smooth out overall portfolio performance. We encourage investors to know their investments and to understand that appropriate levels of risk-taking may unlock opportunities.
Thank you for choosing to invest in Wells Fargo Funds. We appreciate your confidence in us and remain committed to helping you meet your financial needs.
Sincerely,

Andrew Owen
President
Wells Fargo Funds
Periods of uncertainty can present challenges, but experience has taught us that maintaining long-term investment goals can be an effective way to plan for the future.
For further information about your Fund, contact your investment professional, visit our website at wellsfargofunds.com, or call us directly at 1-800-222-8222. We are available 24 hours a day, 7 days a week.
| | | | |
| 4 | | Wells Fargo Income Funds | | Performance highlights (unaudited) |
Wells Fargo Core Bond Fund1
Investment objective
The Fund seeks total return, consisting of income and capital appreciation.
Manager
Wells Fargo Funds Management, LLC
Subadviser for the affiliated master portfolio
Wells Capital Management Incorporated
Portfolio managers
Troy Ludgood
Thomas O’Connor, CFA®
Average annual total returns (%) as of November 30, 20162
| | | | | | | | | | | | | | | | | | | | | | | | | | | | | | | | | | |
| | | | | Including sales charge | | | Excluding sales charge | | | Expense ratios3 (%) | |
| | | Inception date | | 1 year | | | 5 year | | | 10 year | | | 1 year | | | 5 year | | | 10 year | | | Gross | | | Net4 | |
| Class A (MBFAX) | | 10-31-2001 | | | (2.82 | ) | | | 1.66 | | | | 4.14 | | | | 1.76 | | | | 2.60 | | | | 4.62 | | | | 0.83 | | | | 0.78 | |
| Class B (MBFBX)* | | 10-31-2001 | | | (4.08 | ) | | | 1.44 | | | | 4.04 | | | | 0.92 | | | | 1.82 | | | | 4.04 | | | | 1.58 | | | | 1.53 | |
| Class C (MBFCX) | | 10-31-2001 | | | 0.00 | | | | 1.83 | | | | 3.80 | | | | 1.00 | | | | 1.83 | | | | 3.80 | | | | 1.58 | | | | 1.53 | |
| Class R (WTRRX) | | 7-9-2010 | | | – | | | | – | | | | – | | | | 1.51 | | | | 2.34 | | | | 4.33 | | | | 1.08 | | | | 1.03 | |
| Class R4 (MBFRX) | | 11-30-2012 | | | – | | | | – | | | | – | | | | 2.03 | | | | 2.87 | | | | 4.89 | | | | 0.60 | | | | 0.52 | |
| Class R6 (WTRIX) | | 11-30-2012 | | | – | | | | – | | | | – | | | | 2.11 | | | | 3.01 | | | | 5.01 | | | | 0.45 | | | | 0.37 | |
| Administrator Class (MNTRX) | | 6-30-1997 | | | – | | | | – | | | | – | | | | 1.85 | | | | 2.68 | | | | 4.71 | | | | 0.77 | | | | 0.70 | |
| Institutional Class (MBFIX) | | 10-31-2001 | | | – | | | | – | | | | – | | | | 2.14 | | | | 2.97 | | | | 4.99 | | | | 0.50 | | | | 0.42 | |
| Bloomberg Barclays U.S. Aggregate Bond Index5 | | – | | | – | | | | – | | | | – | | | | 2.17 | | | | 2.43 | | | | 4.27 | | | | – | | | | – | |
| * | | At the close of business on December 5, 2016, existing Class B shareholders were converted to Class A shareholders. Effective December 6, 2016, Class B shares are no longer offered by the Fund. |
Figures quoted represent past performance, which is no guarantee of future results, and do not reflect taxes that a shareholder may pay on fund distributions or the redemption of fund shares. Investment return and principal value of an investment will fluctuate so that an investor’s shares, when redeemed, may be worth more or less than their original cost. Performance shown without sales charges would be lower if sales charges were reflected. Current performance may be lower or higher than the performance data quoted, which assumes the reinvestment of dividends and capital gains. Current month-end performance is available on the Fund’s website, wellsfargofunds.com.
Index returns do not include transaction costs associated with buying and selling securities, any mutual fund fees or expenses, or any taxes. It is not possible to invest directly in an index.
For Class A shares, the maximum front-end sales charge is 4.50%. For Class B shares, the maximum contingent deferred sales charge is 5.00%. For Class C shares, the maximum contingent deferred sales charge is 1.00%. Performance including a contingent deferred sales charge assumes the sales charge for the corresponding time period. Class R, Class R4, Class R6, Administrator Class, and Institutional Class shares are sold without a front-end sales charge or contingent deferred sales charge.
Please see footnotes on page 5.
| | | | | | |
| Performance highlights (unaudited) | | Wells Fargo Income Funds | | | 5 | |
Wells Fargo Core Bond Fund (continued)
| | | | |
| Ten largest holdings (%) as of November 30, 20166 | |
U.S. Treasury Note, 0.75%, 9-30-2018 | | | 5.31 | |
U.S. Treasury Note, 1.00%, 10-15-2019 | | | 3.19 | |
U.S. Treasury Note, 1.50%, 8-15-2026 | | | 3.04 | |
U.S. Treasury Note, 2.13%, 8-15-2021 | | | 2.90 | |
U.S. Treasury Note, 1.00%, 11-15-2019 | | | 2.84 | |
GNMA, 3.50%, 12-20-2046 | | | 2.10 | |
FNMA, 3.00%, 1-18-2047 | | | 2.10 | |
FNMA, 3.50%, 12-13-2046 | | | 1.70 | |
U.S. Treasury Note, 0.75%, 7-13-2018 | | | 1.66 | |
U.S. Treasury Note, 1.38%, 1-31-2021 | | | 1.40 | |
|
| Portfolio allocation as of November 30, 20167 |
|
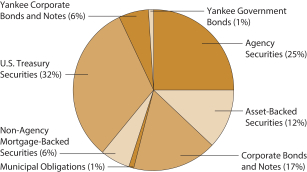
|
Bond values fluctuate in response to the financial condition of individual issuers, general market and economic conditions, and changes in interest rates. Changes in market conditions and government policies may lead to periods of heightened volatility in the bond market and reduced liquidity for certain bonds held by the Fund. In general, when interest rates rise, bond values fall and investors may lose principal value. Interest-rate changes and their impact on the Fund and its share price can be sudden and unpredictable. The use of derivatives may reduce returns and/or increase volatility. Certain investment strategies tend to increase the total risk of an investment (relative to the broader market). Securities issued by U.S. government agencies or government-sponsored entities may not be guaranteed by the U.S. Treasury. The Fund is exposed to foreign investment risk and mortgage- and asset-backed securities risk. Consult the Fund’s prospectus for additional information on these and other risks.
| 1 | The Fund is a gateway feeder fund that invests all of its assets in a single affiliated master portfolio of the Wells Fargo Master Trust with a substantially similar investment objective and substantially similar investment strategies. References to the investment activities of the Fund are intended to refer to the investment activities of the affiliated master portfolio in which it invests. |
| 2 | Historical performance shown for Class R shares prior to their inception reflects the performance of Administrator Class shares, adjusted to reflect the higher expenses applicable to Class R shares. Historical performance shown for Class R4 shares prior to their inception reflects the performance of Institutional Class shares, adjusted to reflect the higher expenses applicable to Class R4 shares. Historical performance shown for Class R6 shares prior to their inception reflects the performance of Institutional Class shares and includes the higher expenses applicable to Institutional Class shares. If these expenses had not been included, returns would be higher. |
| 3 | Reflects the expense ratios as stated in the most recent prospectuses. The expense ratios shown are subject to change and may differ from the annualized expense ratios shown in the financial highlights of this report. |
| 4 | The manager has contractually committed through September 30, 2017, to waive fees and/or reimburse expenses to the extent necessary to cap the Fund’s Total Annual Fund Operating Expenses After Fee Waiver at the amounts shown. After this time, the cap may be increased or the commitment to maintain the cap may be terminated only with the approval of the Board of Trustees. Brokerage commissions, stamp duty fees, interest, taxes, acquired fund fees and expenses, and extraordinary expenses are excluded from the expense cap. Net expenses from the affiliated master portfolio are included in the cap. Without this cap, the Fund’s returns would have been lower. |
| 5 | The Bloomberg Barclays U.S. Aggregate Bond Index (formerly known as Barclays U.S. Aggregate Bond Index) is a broad-based benchmark that measures the investment-grade, U.S. dollar–denominated, fixed-rate taxable bond market, including Treasuries, government-related and corporate securities, mortgage-backed securities (agency fixed-rate and hybrid adjustable-rate mortgage pass-throughs), asset-backed securities, and commercial mortgage-backed securities. You cannot invest directly in an index. |
| 6 | The ten largest holdings, excluding cash and cash equivalents, are calculated based on the value of the securities of the affiliated master portfolio allocable to the Fund divided by the total net assets of the Fund. Holdings are subject to change and may have changed since the date specified. |
| 7 | Amounts represent the portfolio allocation of the affiliated master portfolio which are calculated based on the total long-term investments of the affiliated master portfolio. These amounts are subject to change and may have changed since the date specified. |
| | | | |
| 6 | | Wells Fargo Income Funds | | Performance highlights (unaudited) |
Wells Fargo Real Return Fund1
Investment objective
The Fund seeks returns that exceed the rate of inflation over the long-term.
Manager
Wells Fargo Funds Management, LLC
Subadviser for the affiliated master portfolio
Wells Capital Management Incorporated
Portfolio managers
| | |
| Kandarp R. Acharya, CFA®, FRM | | Ann M. Miletti |
| Michael Bradshaw, CFA® | | Jay N. Mueller, CFA® |
| Petros Bocray, CFA®, FRM | | Thomas M. Price, CFA® |
| Christian L. Chan, CFA® | | Dale Winner, CFA® |
Average annual total returns (%) as of November 30, 2016
| | | | | | | | | | | | | | | | | | | | | | | | | | | | | | | | | | |
| | | | | Including sales charge | | | Excluding sales charge | | | Expense ratios2 (%) | |
| | | Inception date | | 1 year | | | 5 year | | | 10 year | | | 1 year | | | 5 year | | | 10 year | | | Gross | | | Net3 | |
| Class A (IPBAX) | | 2-28-2003 | | | (0.27 | ) | | | (0.21 | ) | | | 3.08 | | | | 4.43 | | | | 0.71 | | | | 3.56 | | | | 1.19 | | | | 0.85 | |
| Class B (IPBBX)* | | 2-28-2003 | | | 1.08 | | | | 0.02 | | | | 3.05 | | | | 6.08 | | | | 0.41 | | | | 3.05 | | | | 1.94 | | | | 1.60 | |
| Class C (IPBCX) | | 2-28-2003 | | | 2.61 | | | | (0.04 | ) | | | 2.82 | | | | 3.61 | | | | (0.04 | ) | | | 2.82 | | | | 1.94 | | | | 1.60 | |
| Class R6 (IPBJX)4 | | 10-31-2016 | | | – | | | | – | | | | – | | | | 4.80 | | | | 0.98 | | | | 3.86 | | | | 0.81 | | | | 0.47 | |
| Administrator Class (IPBIX) | | 2-28-2003 | | | – | | | | – | | | | – | | | | 4.77 | | | | 0.97 | | | | 3.86 | | | | 1.13 | | | | 0.60 | |
| Institutional Class (IPBNX)4 | | 10-31-2016 | | | – | | | | – | | | | – | | | | 4.80 | | | | 0.98 | | | | 3.86 | | | | 0.86 | | | | 0.52 | |
| Bloomberg Barclays U.S. TIPS Index5 | | – | | | – | | | | – | | | | – | | | | 3.96 | | | | 0.92 | | | | 4.13 | | | | – | | | | – | |
| Consumer Price Index6 | | – | | | – | | | | – | | | | – | | | | 1.69 | | | | 1.30 | | | | 1.82 | | | | – | | | | – | |
| * | | At the close of business on December 5, 2016, existing Class B shareholders were converted to Class A shareholders. Effective December 6, 2016, Class B shares are no longer offered by the Fund. |
Figures quoted represent past performance, which is no guarantee of future results, and do not reflect taxes that a shareholder may pay on fund distributions or the redemption of fund shares. Investment return and principal value of an investment will fluctuate so that an investor’s shares, when redeemed, may be worth more or less than their original cost. Performance shown without sales charges would be lower if sales charges were reflected. Current performance may be lower or higher than the performance data quoted, which assumes the reinvestment of dividends and capital gains. Current month-end performance is available on the Fund’s website, wellsfargofunds.com.
Index returns do not include transaction costs associated with buying and selling securities, any mutual fund fees or expenses, or any taxes. It is not possible to invest directly in an index.
For Class A shares, the maximum front-end sales charge is 4.50%. For Class B shares, the maximum contingent deferred sales charge is 5.00%. For Class C shares, the maximum contingent deferred sales charge is 1.00%. Performance including a contingent deferred sales charge assumes the sales charge for the corresponding time period. Class R6, Administrator Class, and Institutional Class shares are sold without a front-end sales charge or contingent deferred sales charge.
Please see footnotes on page 7.
| | | | | | |
| Performance highlights (unaudited) | | Wells Fargo Income Funds | | | 7 | |
Wells Fargo Real Return Fund (continued)
| | | | |
| Ten largest holdings (%) as of November 30, 20167 | |
TIPS, 0.13%, 4-15-2020 | | | 5.29 | |
TIPS, 0.63%, 1-15-2026 | | | 3.82 | |
TIPS, 0.13%, 4-15-2021 | | | 3.20 | |
TIPS, 0.13%, 7-15-2022 | | | 3.12 | |
TIPS, 0.38%, 7-15-2023 | | | 3.06 | |
TIPS, 0.25%, 1-15-2025 | | | 2.58 | |
TIPS, 0.13%, 7-15-2024 | | | 2.53 | |
TIPS, 0.38%, 7-15-2025 | | | 2.46 | |
TIPS, 0.63%, 1-15-2024 | | | 2.43 | |
TIPS, 1.25%, 1-15-2021 | | | 2.41 | |
|
| Portfolio allocation as of November 30, 20168 |
|
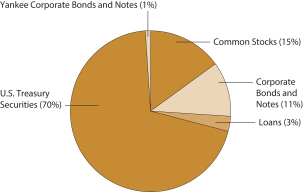 |
Bond values fluctuate in response to the financial condition of individual issuers, general market and economic conditions, and changes in interest rates. Changes in market conditions and government policies may lead to periods of heightened volatility in the bond market and reduced liquidity for certain bonds held by the Fund. In general, when interest rates rise, bond values fall and investors may lose principal value. Interest-rate changes and their impact on the Fund and its share price can be sudden and unpredictable. Stock values fluctuate in response to the activities of individual companies and general market and economic conditions. High-yield securities have a greater risk of default and tend to be more volatile than higher-rated debt securities. Loans are subject to risks similar to those associated with other below investment-grade bond investments, such as credit risk (for example, risk of issuer default), below-investment-grade bond risk (for example, risk of greater volatility in value), and risk that the loan may become illiquid or difficult to price. The use of derivatives may reduce returns and/or increase volatility. Foreign investments are especially volatile and can rise or fall dramatically due to differences in the political and economic conditions of the host country. These risks are generally intensified in emerging markets. The Fund is exposed to mortgage- and asset-backed securities risk and small company securities risk. Securities issued by U.S. government agencies or government-sponsored entities may not be guaranteed by the U.S. Treasury. Consult the Fund’s prospectus for additional information on these and other risks.
| 1 | The Fund is a gateway feeder fund that invests all of its assets in a single affiliated master portfolio of the Wells Fargo Master Trust with a substantially similar investment objective and substantially similar investment strategies. References to the investment activities of the Fund are intended to refer to the investment activities of the affiliated master portfolio in which it invests. |
| 2 | Reflects the expense ratios as stated in the most recent prospectuses. The expense ratios shown are subject to change and may differ from the annualized expense ratios shown in the financial highlights of this report. |
| 3 | The manager has contractually committed through September 30, 2017 (September 30, 2018 for Class R6 and the Institutional Class), to waive fees and/or reimburse expenses to the extent necessary to cap the Fund’s Total Annual Fund Operating Expenses After Fee Waiver at the amounts shown. After this time, the cap may be increased or the commitment to maintain the cap may be terminated only with the approval of the Board of Trustees. Brokerage commissions, stamp duty fees, interest, taxes, acquired fund fees and expenses, and extraordinary expenses are excluded from the expense cap. Net expenses from the affiliated master portfolio are included in the cap. Without this cap, the Fund’s returns would have been lower. |
| 4 | Historical performance shown for the Class R6 shares prior to their inception reflects the performance of the Administrator Class shares, and is not adjusted to reflect Class R6 expenses. If these expenses had been included, returns for Class R6 would be higher. Historical performance shown for the Institutional Class shares prior to their inception reflects the performance of the Administrator Class shares, and is adjusted to reflect the higher expenses applicable to Institutional Class shares expenses. |
| 5 | The Bloomberg Barclays U.S. Treasury Inflation-Protected Securities (TIPS) Index (formerly known as Barclays U.S. Treasury Inflation-Protected Securities (TIPS) Index) is an index of inflation-indexed-linked U.S. Treasury securities. You cannot invest directly in an index. |
| 6 | The Consumer Price Index (CPI) for All Urban Consumers in U.S. All Items is published monthly by the U.S. government as an indicator of changes in price levels (or inflation) paid by urban consumers for a representative basket of goods and services. You cannot invest directly in an index. |
| 7 | The ten largest holdings, excluding cash and cash equivalents, are calculated based on the value of the securities of the affiliated master portfolio allocable to the Fund divided by the total net assets of the Fund. Holdings are subject to change and may have changed since the date specified. |
| 8 | Amounts represent the portfolio allocation of the affiliated master portfolio which are calculated based on the total long-term investments of the affiliated master portfolio. These amounts are subject to change and may have changed since the date specified. |
| | | | |
| 8 | | Wells Fargo Income Funds | | Fund expenses (unaudited) |
As a shareholder of the Fund, you incur two types of costs: (1) transaction costs, including sales charges (loads) on purchase payments and contingent deferred sales charges (if any) on redemptions and (2) ongoing costs, including management fees, distribution (12b-1) and/or shareholder servicing fees, and other Fund expenses. This example is intended to help you understand your ongoing costs (in dollars) of investing in the Fund and to compare these costs with the ongoing costs of investing in other mutual funds.
The example is based on an investment of $1,000 invested at the beginning of the six-month period and held for the entire period from June 1, 2016 to November 30, 2016.
Actual expenses
The “Actual” line of the table below provides information about actual account values and actual expenses. You may use the information in this line, together with the amount you invested, to estimate the expenses that you paid over the period. Simply divide your account value by $1,000 (for example, an $8,600 account value divided by $1,000 = 8.6), then multiply the result by the number in the “Actual” line under the heading entitled “Expenses paid during period” for your applicable class of shares to estimate the expenses you paid on your account during this period.
Hypothetical example for comparison purposes
The “Hypothetical” line of the table below provides information about hypothetical account values and hypothetical expenses based on the Fund’s actual expense ratio and an assumed rate of return of 5% per year before expenses, which is not the Fund’s actual return. The hypothetical account values and expenses may not be used to estimate the actual ending account balance or expenses you paid for the period. You may use this information to compare the ongoing costs of investing in the Fund and other funds. To do so, compare this 5% hypothetical example with the 5% hypothetical examples that appear in the shareholder reports of the other funds.
Please note that the expenses shown in the table are meant to highlight your ongoing costs only and do not reflect any transactional costs, such as sales charges (loads) and contingent deferred sales charges. Therefore, the “Hypothetical” line of the table is useful in comparing ongoing costs only and will not help you determine the relative total costs of owning different funds. In addition, if these transactional costs were included, your costs would have been higher.
| | | | | | | | | | | | | | | | |
| Core Bond Fund | | Beginning
account value
6-1-2016 | | | Ending
account value
11-30-2016 | | | Expenses
paid during
the period¹ | | | Annualized net
expense ratio | |
Class A | | | | | | | | | | | | | | | | |
Actual | | $ | 1,000.00 | | | $ | 991.29 | | | $ | 3.88 | | | | 0.78 | % |
Hypothetical (5% return before expenses) | | $ | 1,000.00 | | | $ | 1,021.10 | | | $ | 3.94 | | | | 0.78 | % |
Class B | | | | | | | | | | | | | | | | |
Actual | | $ | 1,000.00 | | | $ | 986.80 | | | $ | 7.60 | | | | 1.53 | % |
Hypothetical (5% return before expenses) | | $ | 1,000.00 | | | $ | 1,017.35 | | | $ | 7.72 | | | | 1.53 | % |
Class C | | | | | | | | | | | | | | | | |
Actual | | $ | 1,000.00 | | | $ | 987.42 | | | $ | 7.60 | | | | 1.53 | % |
Hypothetical (5% return before expenses) | | $ | 1,000.00 | | | $ | 1,017.35 | | | $ | 7.72 | | | | 1.53 | % |
Class R | | | | | | | | | | | | | | | | |
Actual | | $ | 1,000.00 | | | $ | 989.68 | | | $ | 5.12 | | | | 1.03 | % |
Hypothetical (5% return before expenses) | | $ | 1,000.00 | | | $ | 1,019.85 | | | $ | 5.20 | | | | 1.03 | % |
Class R4 | | | | | | | | | | | | | | | | |
Actual | | $ | 1,000.00 | | | $ | 992.19 | | | $ | 2.59 | | | | 0.52 | % |
Hypothetical (5% return before expenses) | | $ | 1,000.00 | | | $ | 1,022.40 | | | $ | 2.63 | | | | 0.52 | % |
Class R6 | | | | | | | | | | | | | | | | |
Actual | | $ | 1,000.00 | | | $ | 992.94 | | | $ | 1.84 | | | | 0.37 | % |
Hypothetical (5% return before expenses) | | $ | 1,000.00 | | | $ | 1,023.15 | | | $ | 1.87 | | | | 0.37 | % |
| | | | | | |
| Fund expenses (unaudited) | | Wells Fargo Income Funds | | | 9 | |
| | | | | | | | | | | | | | | | |
| Core Bond Fund (continued) | | Beginning
account value
6-1-2016 | | | Ending
account value
11-30-2016 | | | Expenses
paid during
the period¹ | | | Annualized net
expense ratio | |
Administrator Class | | | | | | | | | | | | | | | | |
Actual | | $ | 1,000.00 | | | $ | 991.32 | | | $ | 3.48 | | | | 0.70 | % |
Hypothetical (5% return before expenses) | | $ | 1,000.00 | | | $ | 1,021.50 | | | $ | 3.54 | | | | 0.70 | % |
Institutional Class | | | | | | | | | | | | | | | | |
Actual | | $ | 1,000.00 | | | $ | 992.70 | | | $ | 2.09 | | | | 0.42 | % |
Hypothetical (5% return before expenses) | | $ | 1,000.00 | | | $ | 1,022.90 | | | $ | 2.12 | | | | 0.42 | % |
| Real Return Fund | | | | | | | | | | | | |
Class A | | | | | | | | | | | | | | | | |
Actual | | $ | 1,000.00 | | | $ | 1,001.07 | | | $ | 4.25 | | | | 0.85 | % |
Hypothetical (5% return before expenses) | | $ | 1,000.00 | | | $ | 1,020.75 | | | $ | 4.29 | | | | 0.85 | % |
Class B | | | | | | | | | | | | | | | | |
Actual | | $ | 1,000.00 | | | $ | 1,020.50 | | | $ | 8.08 | | | | 1.60 | % |
Hypothetical (5% return before expenses) | | $ | 1,000.00 | | | $ | 1,017.00 | | | $ | 8.07 | | | | 1.60 | % |
Class C | | | | | | | | | | | | | | | | |
Actual | | $ | 1,000.00 | | | $ | 997.75 | | | $ | 7.99 | | | | 1.60 | % |
Hypothetical (5% return before expenses) | | $ | 1,000.00 | | | $ | 1,017.00 | | | $ | 8.07 | | | | 1.60 | % |
Class R6 | | | | | | | | | | | | | | | | |
Actual | | $ | 1,000.00 | | | $ | 1,003.53 | | | $ | 2.35 | | | | 0.47 | % |
Hypothetical (5% return before expenses) | | $ | 1,000.00 | | | $ | 1,022.65 | | | $ | 2.38 | | | | 0.47 | % |
Administrator Class | | | | | | | | | | | | | | | | |
Actual | | $ | 1,000.00 | | | $ | 1,003.21 | | | $ | 3.00 | | | | 0.60 | % |
Hypothetical (5% return before expenses) | | $ | 1,000.00 | | | $ | 1,022.00 | | | $ | 3.03 | | | | 0.60 | % |
Institutional Class | | | | | | | | | | | | | | | | |
Actual | | $ | 1,000.00 | | | $ | 1,003.53 | | | $ | 2.60 | | | | 0.52 | % |
Hypothetical (5% return before expenses) | | $ | 1,000.00 | | | $ | 1,022.40 | | | $ | 2.63 | | | | 0.52 | % |
| 1 | Expenses paid is equal to the annualized net expense ratio of each class multiplied by the average account value over the period, multiplied by the number of days in the most recent fiscal half-year divided by the number of days in the fiscal year (to reflect the one-half-year period). |
| | | | |
| 10 | | Wells Fargo Income Funds | | Portfolios of investments—November 30, 2016 (unaudited) |
CORE BOND FUND
| | | | | | | | | | | | | | | | |
| Security name | | | | | | | | | | | Value | |
| | | | |
Investment Companies: 99.80% | | | | | | | | | | | | | | | | |
| | | | |
| Affiliated Master Portfolios: 99.80% | | | | | | | | | | | | | | | | |
Wells Fargo Core Bond Portfolio | | | | | | | | | | | | | | $ | 4,811,118,137 | |
| | | | | | | | | | | | | | | | |
| | | | |
Total Investment Companies (Cost $4,900,696,674) | | | | | | | | | | | | | | | 4,811,118,137 | |
| | | | | | | | | | | | | | | | |
| | | | | | | | |
| Total investments in securities (Cost $4,900,696,674) * | | | 99.80 | % | | | 4,811,118,137 | |
Other assets and liabilities, net | | | 0.20 | | | | 9,461,118 | |
| | | | | | | | |
| Total net assets | | | 100.00 | % | | $ | 4,820,579,255 | |
| | | | | | | | |
| | | | | | | | |
* | | Cost for federal income tax purposes is $4,904,289,169 and unrealized gains (losses) consists of: |
| | Gross unrealized gains | | $ | 0 | | | |
| | Gross unrealized losses | | | (93,171,032 | ) | | |
| | | | | | | | |
| | Net unrealized losses | | $ | (93,171,032 | ) | | |
REAL RETURN FUND
| | | | | | | | | | | | | | | | |
| Security name | | | | | | | | | | | Value | |
| | | | |
Investment Companies: 98.11% | | | | | | | | | | | | | | | | |
| | | | |
| Affiliated Master Portfolios: 98.11% | | | | | | | | | | | | | | | | |
Wells Fargo Real Return Portfolio | | | | | | | | | | | | | | $ | 55,534,972 | |
| | | | | | | | | | | | | | | | |
| | | | |
Total Investment Companies (Cost $55,271,164) | | | | | | | | | | | | | | | 55,534,972 | |
| | | | | | | | | | | | | | | | |
| | | | | | | | |
| Total investments in securities (Cost $55,271,164) * | | | 98.11 | % | | | 55,534,972 | |
Other assets and liabilities, net | | | 1.89 | | | | 1,068,584 | |
| | | | | | | | |
| Total net assets | | | 100.00 | % | | $ | 56,603,556 | |
| | | | | | | | |
| | | | | | | | |
* | | Cost for federal income tax purposes is $55,212,221 and unrealized gains (losses) consists of: |
| | Gross unrealized gains | | $ | 322,751 | | | |
| | Gross unrealized losses | | | 0 | | | |
| | | | | | | | |
| | Net unrealized gains | | $ | 322,751 | | | |
The accompanying notes are an integral part of these financial statements.
| | | | | | |
| Statements of assets and liabilities—November 30, 2016 (unaudited) | | Wells Fargo Income Funds | | | 11 | |
| | | | | | | | |
| | | Core Bond
Fund | | | Real Return
Fund | |
| | |
Assets | | | | | | | | |
Investment in the affiliated Master Portfolio, at value (see cost below) | | $ | 4,811,118,137 | | | $ | 55,534,972 | |
Receivable for Fund shares sold | | | 30,421,471 | | | | 6,172,559 | |
Receivable from administrator | | | 0 | | | | 7,743 | |
Prepaid expenses and other assets | | | 290,318 | | | | 71,903 | |
| | | | |
Total assets | | | 4,841,829,926 | | | | 61,787,177 | |
| | | | |
| | |
Liabilities | | | | | | | | |
Dividends payable | | | 1,379,963 | | | | 0 | |
Payable for Fund shares redeemed | | | 19,011,166 | | | | 5,160,513 | |
Distribution fees payable | | | 44,027 | | | | 2,857 | |
Administration fees payable | | | 251,112 | | | | 0 | |
Accrued expenses and other liabilities | | | 564,403 | | | | 20,251 | |
| | | | |
Total liabilities | | | 21,250,671 | | | | 5,183,621 | |
| | | | |
Total net assets | | $ | 4,820,579,255 | | | $ | 56,603,556 | |
| | | | |
| | |
NET ASSETS CONSIST OF | | | | | | | | |
Paid-in capital | | $ | 4,906,011,448 | | | $ | 55,972,012 | |
Undistributed net investment income | | | 2,087,791 | | | | 201,260 | |
Accumulated net realized gains on investments | | | 2,058,553 | | | | 166,476 | |
Net unrealized gains (losses) on investments | | | (89,578,537 | ) | | | 263,808 | |
| | | | |
Total net assets | | $ | 4,820,579,255 | | | $ | 56,603,556 | |
| | | | |
| | |
COMPUTATION OF NET ASSET VALUE AND OFFERING PRICE PER SHARE | | | | | | | | |
Net assets – Class A | | $ | 673,109,421 | | | $ | 24,037,923 | |
Shares outstanding – Class A1 | | | 51,477,118 | | | | 2,437,495 | |
Net asset value per share – Class A | | | $13.08 | | | | $9.86 | |
Maximum offering price per share – Class A2 | | | $13.70 | | | | $10.32 | |
Net assets – Class B | | $ | 303,999 | | | $ | 5,863 | |
Shares outstanding – Class B1 | | | 23,325 | | | | 588 | |
Net asset value per share – Class B | | | $13.03 | | | | $9.97 | |
Net assets – Class C | | $ | 64,295,963 | | | $ | 4,741,905 | |
Shares outstanding – Class C1 | | | 4,964,494 | | | | 487,299 | |
Net asset value per share – Class C | | | $12.95 | | | | $9.73 | |
Net assets – Class R | | $ | 16,458,163 | | | | N/A | |
Shares outstanding – Class R1 | | | 1,289,244 | | | | N/A | |
Net asset value per share – Class R | | | $12.77 | | | | N/A | |
Net assets – Class R4 | | $ | 42,082,214 | | | | N/A | |
Share outstanding – Class R41 | | | 3,300,854 | | | | N/A | |
Net asset value per share – Class R4 | | | $12.75 | | | | N/A | |
Net assets – Class R6 | | $ | 579,201,992 | | | $ | 24,541 | |
Shares outstanding – Class R61 | | | 45,426,146 | | | | 2,465 | |
Net asset value per share – Class R6 | | | $12.75 | | | | $9.96 | |
Net assets – Administrator Class | | $ | 405,393,081 | | | $ | 17,934,351 | |
Shares outstanding – Administrator Class1 | | | 31,754,581 | | | | 1,801,252 | |
Net asset value per share – Administrator Class | | | $12.77 | | | | $9.96 | |
Net assets – Institutional Class | | $ | 3,039,734,422 | | | $ | 9,858,973 | |
Shares outstanding – Institutional Class1 | | | 238,455,654 | | | | 989,903 | |
Net asset value per share – Institutional Class | | | $12.75 | | | | $9.96 | |
| | |
Investments in the affiliated Master Portfolio, at cost | | $ | 4,900,696,674 | | | $ | 55,271,164 | |
| | | | |
| 1 | Each Fund has an unlimited number of authorized shares. |
| 2 | Maximum offering price is computed as 100/95.50 of net asset value. On investments of $50,000 or more, the offering price is reduced. |
The accompanying notes are an integral part of these financial statements.
| | | | |
| 12 | | Wells Fargo Income Funds | | Statements of operations—six months ended November 30, 2016 (unaudited) |
| | | | | | | | |
| | | Core Bond
Fund | | | Real Return
Fund | |
| | |
Investment income | | | | | | | | |
Interest allocated from the affiliated Master Portfolio* | | $ | 45,533,335 | | | $ | 661,884 | |
Dividends allocated from the affiliated Master Portfolio** | | | 0 | | | | 97,338 | |
Affiliated income allocated from the affiliated Master Portfolio | | | 277,673 | | | | 3,335 | |
Securities lending income allocated from the affiliated Master Portfolio | | | 246,898 | | | | 8,333 | |
Expenses allocated from the affiliated Master Portfolio | | | (7,928,003 | ) | | | (137,606 | ) |
Waivers allocated from the affiliated Master Portfolio | | | 124,471 | | | | 24,723 | |
| | | | |
Total investment income | | | 38,254,374 | | | | 658,007 | |
| | | | |
| | |
Expenses | | | | | | | | |
Management fee | | | 1,116,652 | | | | 12,910 | |
Administration fees | | | | | | | | |
Class A | | | 557,067 | | | | 16,427 | |
Class B | | | 336 | | | | 7 | |
Class C | | | 54,080 | | | | 4,053 | |
Class R | | | 13,703 | | | | N/A | |
Class R4 | | | 17,214 | | | | N/A | |
Class R6 | | | 78,798 | | | | 1 | 1 |
Administrator Class | | | 237,872 | | | | 12,893 | |
Institutional Class | | | 1,056,411 | | | | 97 | 1 |
Shareholder servicing fees | | | | | | | | |
Class A | | | 870,418 | | | | 25,667 | |
Class B | | | 525 | | | | 11 | |
Class C | | | 84,501 | | | | 6,333 | |
Class R | | | 21,410 | | | | N/A | |
Class R4 | | | 21,517 | | | | N/A | |
Administrator Class | | | 591,053 | | | | 30,852 | |
Distribution fees | | | | | | | | |
Class B | | | 1,575 | | | | 32 | |
Class C | | | 253,501 | | | | 18,998 | |
Class R | | | 21,410 | | | | N/A | |
Custody and accounting fees | | | 84,444 | | | | 1,704 | |
Professional fees | | | 13,081 | | | | 15,138 | |
Registration fees | | | 119,283 | | | | 27,785 | |
Shareholder report expenses | | | 163,673 | | | | 183 | |
Trustees’ fees and expenses | | | 109,233 | | | | 15,696 | |
Other fees and expenses | | | 22,868 | | | | 741 | |
| | | | |
Total expenses | | | 5,510,625 | | | | 189,528 | |
Less: Fee waivers and/or expense reimbursements | | | (1,694,898 | ) | | | (96,749 | ) |
| | | | |
Net expenses | | | 3,815,727 | | | | 92,779 | |
| | | | |
Net investment income | | | 34,438,647 | | | | 565,228 | |
| | | | |
| | |
REALIZED AND UNREALIZED GAINS (LOSSES) ON INVESTMENTS | | | | | | | | |
Net realized gains on securities transaction allocated from affiliated Master Portfolio | | | 24,808,967 | | | | 150,089 | |
| | | | |
Net change in unrealized gains (losses) on securities transactions allocated from affiliated Master Portfolio | | | (117,522,733 | ) | | | (819,647 | ) |
| | | | |
Net realized and unrealized gains (losses) on investments | | | (92,713,766 | ) | | | (669,558 | ) |
| | | | |
Net decrease in net assets resulting from operations | | $ | (58,275,119 | ) | | $ | (104,330 | ) |
| | | | |
| | |
* Net of foreign interest withholding taxes allocated from affiliated Master Portfolio in the amount of | | | $30,383 | | | | $0 | |
** Net of foreign dividend withholding taxes allocated from affiliated Master Portfolio in the amount of | | | 0 | | | | 3,386 | |
| 1 | For the period from October 31, 2016 (commencement of class operations) to November 30, 2016 |
The accompanying notes are an integral part of these financial statements.
| | | | | | |
| Statements of changes in net assets | | Wells Fargo Income Funds | | | 13 | |
| | | | | | | | | | | | | | | | |
| | | Core Bond Fund | |
| | | Six months ended
November 30, 2016
(unaudited) | | | Year ended
May 31, 2016 | |
| | | |
Operations | | | | | | | | | | | | |
Net investment income | | | | | | $ | 34,438,647 | | | | | | | $ | 56,885,063 | |
Net realized gains on investments | | | | | | | 24,808,967 | | | | | | | | 30,089,873 | |
Net change in unrealized gains (losses) on investments | | | | | | | (117,522,733 | ) | | | | | | | 4,892,256 | |
| | | | |
Net increase (decrease) in net assets resulting from operations | | | | | | | (58,275,119 | ) | | | | | | | 91,867,192 | |
| | | | |
| | | |
Distributions to shareholders from | | | | | | | | | | | | |
Net investment income | | | | | | | | | | | | | | | | |
Class A | | | | | | | (4,463,747 | ) | | | | | | | (8,389,835 | ) |
Class B | | | | | | | (1,117 | ) | | | | | | | (6,347 | ) |
Class C | | | | | | | (179,287 | ) | | | | | | | (461,896 | ) |
Class R | | | | | | | (88,453 | ) | | | | | | | (192,416 | ) |
Class R4 | | | | | | | (331,536 | ) | | | | | | | (721,295 | ) |
Class R6 | | | | | | | (4,439,741 | ) | | | | | | | (10,656,813 | ) |
Administrator Class | | | | | | | (3,235,642 | ) | | | | | | | (7,206,291 | ) |
Institutional Class | | | | | | | (21,709,370 | ) | | | | | | | (28,855,628 | ) |
Investor Class | | | | | | | N/A | | | | | | | | (390,665 | )1 |
| | | | |
Total distributions to shareholders | | | | | | | (34,448,893 | ) | | | | | | | (56,881,186 | ) |
| | | | |
| | | | |
Capital share transactions | | | Shares | | | | | | | | Shares | | | | | |
Proceeds from shares sold | | | | | | | | | | | | | | | | |
Class A | | | 8,039,655 | | | | 107,596,893 | | | | 30,562,544 | | | | 401,063,165 | |
Class B | | | 749 | | | | 10,017 | | | | 7,110 | | | | 92,496 | |
Class C | | | 560,572 | | | | 7,479,790 | | | | 1,245,714 | | | | 16,170,020 | |
Class R | | | 272,331 | | | | 3,577,263 | | | | 516,463 | | | | 6,608,967 | |
Class R4 | | | 464,872 | | | | 6,121,293 | | | | 457,816 | | | | 5,844,509 | |
Class R6 | | | 13,102,623 | | | | 172,678,196 | | | | 22,221,787 | | | | 284,183,219 | |
Administrator Class | | | 4,087,081 | | | | 53,713,244 | | | | 20,672,744 | | | | 264,372,378 | |
Institutional Class | | | 96,794,693 | | | | 1,272,508,214 | | | | 91,619,539 | | | | 1,171,763,978 | |
Investor Class | | | N/A | | | | N/A | | | | 428,364 | 1 | | | 5,459,036 | 1 |
| | | | |
| | | | | | | 1,623,684,910 | | | | | | | | 2,155,557,768 | |
| | | | |
Reinvestment of distributions | | | | | | | | | | | | | | | | |
Class A | | | 307,226 | | | | 4,131,065 | | | | 581,976 | | | | 7,639,126 | |
Class B | | | 81 | | | | 1,086 | | | | 470 | | | | 6,137 | |
Class C | | | 7,177 | | | | 95,530 | | | | 17,152 | | | | 222,796 | |
Class R | | | 1,733 | | | | 22,751 | | | | 5,857 | | | | 74,968 | |
Class R4 | | | 25,293 | | | | 331,487 | | | | 56,422 | | | | 721,295 | |
Class R6 | | | 339,005 | | | | 4,439,741 | | | | 793,053 | | | | 10,128,176 | |
Administrator Class | | | 242,080 | | | | 3,179,865 | | | | 554,050 | | | | 7,096,753 | |
Institutional Class | | | 1,147,576 | | | | 15,021,415 | | | | 1,683,434 | | | | 21,533,371 | |
Investor Class | | | N/A | | | | N/A | | | | 25,095 | 1 | | | 319,617 | 1 |
| | | | |
| | | | | | | 27,222,940 | | | | | | | | 47,742,239 | |
| | | | |
Please see footnote on page 14.
The accompanying notes are an integral part of these financial statements.
| | | | |
| 14 | | Wells Fargo Income Funds | | Statements of changes in net assets |
| | | | | | | | | | | | | | | | |
| | | Core Bond Fund | |
| | | Six months ended
November 30, 2016
(unaudited) | | | Year ended
May 31, 2016 | |
| | | | |
| | | Shares | | | | | | Shares | | | | |
| | | | |
Capital share transactions (continued) | | | | | | | | | | | | | | | | |
Payment for shares redeemed | | | | | | | | | | | | | | | | |
Class A | | | (9,524,604 | ) | | $ | (128,025,523 | ) | | | (16,942,422 | ) | | $ | (222,433,710 | ) |
Class B | | | (15,453 | ) | | | (207,582 | ) | | | (72,544 | ) | | | (947,339 | ) |
Class C | | | (667,379 | ) | | | (8,889,044 | ) | | | (1,783,639 | ) | | | (23,130,654 | ) |
Class R | | | (371,900 | ) | | | (4,880,778 | ) | | | (412,502 | ) | | | (5,265,096 | ) |
Class R4 | | | (376,668 | ) | | | (4,930,087 | ) | | | (1,165,926 | ) | | | (14,848,260 | ) |
Class R6 | | | (2,826,153 | ) | | | (36,965,458 | ) | | | (44,787,565 | ) | | | (570,876,875 | ) |
Administrator Class | | | (13,413,810 | ) | | | (176,484,273 | ) | | | (18,365,649 | ) | | | (234,906,387 | ) |
Institutional Class | | | (21,841,721 | ) | | | (285,260,878 | ) | | | (36,979,227 | ) | | | (472,735,235 | ) |
Investor Class | | | N/A | | | | N/A | | | | (6,089,488 | )1 | | | (77,924,960 | )1 |
| | | | |
| | | | | | | (645,643,623 | ) | | | | | | | (1,623,068,516 | ) |
| | | | |
Net increase in net assets resulting from capital share transactions | | | | | | | 1,005,264,227 | | | | | | | | 580,231,491 | |
| | | | |
Total increase in net assets | | | | | | | 912,540,215 | | | | | | | | 615,217,497 | |
| | | | |
| | |
Net assets | | | | | | | | |
Beginning of period | | | | | | | 3,908,039,040 | | | | | | | | 3,292,821,543 | |
| | | | |
End of period | | | | | | $ | 4,820,579,255 | | | | | | | $ | 3,908,039,040 | |
| | | | |
Undistributed net investment income | | | | | | $ | 2,087,791 | | | | | | | $ | 2,098,037 | |
| | | | |
| 1 | For the period from June 1, 2015 to October 23, 2015. Effective at the close of business on October 23, 2015, Investor Class shares were converted to Class A shares and are no longer offered by the Fund. |
The accompanying notes are an integral part of these financial statements.
| | | | | | |
| Statements of changes in net assets | | Wells Fargo Income Funds | | | 15 | |
| | | | | | | | | | | | | | | | |
| | | Real Return Fund | |
| | | Six months ended
November 30, 2016
(unaudited) | | | Year ended
May 31, 2016 | |
| | | |
Operations | | | | | | | | | | | | |
Net investment income | | | | | | $ | 565,228 | | | | | | | $ | 369,571 | |
Net realized gains (losses) on investments | | | | | | | 150,089 | | | | | | | | (94,342 | ) |
Net change in unrealized gains (losses) on investments | | | | | | | (819,647 | ) | | | | | | | 448,378 | |
| | | | |
Net increase (decrease) in net assets resulting from operations | | | | | | | (104,330 | ) | | | | | | | 723,607 | |
| | | | |
| | | |
Distributions to shareholders from | | | | | | | | | | | | |
Net investment income | | | | | | | | | | | | | | | | |
Class A | | | | | | | (213,220 | ) | | | | | | | (105,174 | ) |
Class B | | | | | | | 0 | | | | | | | | (215 | ) |
Class C | | | | | | | (8,490 | ) | | | | | | | (19,227 | ) |
Class R6 | | | | | | | (67 | )1 | | | | | | | N/A | |
Administrator Class | | | | | | | (257,745 | ) | | | | | | | (118,294 | ) |
Institutional Class | | | | | | | (13,315 | )1 | | | | | | | N/A | |
Net realized gains | | | | | | | | | | | | | | | | |
Class A | | | | | | | 0 | | | | | | | | (240,328 | ) |
Class B | | | | | | | 0 | | | | | | | | (692 | ) |
Class C | | | | | | | 0 | | | | | | | | (113,074 | ) |
Administrator Class | | | | | | | 0 | | | | | | | | (250,329 | ) |
| | | | |
Total distributions to shareholders | | | | | | | (492,837 | ) | | | | | | | (847,333 | ) |
| | | | |
| | | | |
Capital share transactions | | | Shares | | | | | | | | Shares | | | | | |
Proceeds from shares sold | | | | | | | | | | | | | | | | |
Class A | | | 784,277 | | | | 7,870,976 | | | | 1,242,256 | | | | 12,000,616 | |
Class C | | | 70,717 | | | | 700,323 | | | | 195,517 | | | | 1,891,126 | |
Class R6 | | | 2,458 | 1 | | | 25,000 | 1 | | | N/A | | | | N/A | |
Administrator Class | | | 1,056,313 | | | | 10,790,407 | | | | 1,653,728 | | | | 16,251,043 | |
Institutional Class | | | 996,110 | 1 | | | 9,931,326 | 1 | | | N/A | | | | N/A | |
| | | | |
| | | | | | | 29,318,032 | | | | | | | | 30,142,785 | |
| | | | |
Reinvestment of distributions | | | | | | | | | | | | | | | | |
Class A | | | 18,781 | | | | 188,687 | | | | 30,219 | | | | 289,502 | |
Class B | | | 0 | | | | 0 | | | | 97 | | | | 907 | |
Class C | | | 752 | | | | 7,314 | | | | 12,509 | | | | 117,358 | |
Class R6 | | | 7 | 1 | | | 67 | 1 | | | N/A | | | | N/A | |
Administrator Class | | | 21,363 | | | | 217,050 | | | | 34,404 | | | | 332,457 | |
Institutional Class | | | 1,340 | 1 | | | 13,315 | 1 | | | N/A | | | | N/A | |
| | | | |
| | | | | | | 426,433 | | | | | | | | 740,224 | |
| | | | |
Payment for shares redeemed | | | | | | | | | | | | | | | | |
Class A | | | (269,313 | ) | | | (2,727,193 | ) | | | (657,483 | ) | | | (6,397,152 | ) |
Class B | | | (1,547 | ) | | | (15,355 | ) | | | (7,500 | ) | | | (71,235 | ) |
Class C | | | (162,768 | ) | | | (1,629,583 | ) | | | (382,563 | ) | | | (3,632,916 | ) |
Administrator Class | | | (1,330,705 | ) | | | (13,315,914 | ) | | | (686,150 | ) | | | (6,659,978 | ) |
Institutional Class | | | (7,547 | )1 | | | (75,072 | )1 | | | N/A | | | | N/A | |
| | | | |
| | | | | | | (17,763,117 | ) | | | | | | | (16,761,281 | ) |
| | | | |
Net increase in net assets resulting from capital share transactions | | | | | | | 11,981,348 | | | | | | | | 14,121,728 | |
| | | | |
Total increase in net assets | | | | | | | 11,384,181 | | | | | | | | 13,998,002 | |
| | | | |
| | |
Net assets | | | | | | | | |
Beginning of period | | | | | | | 45,219,375 | | | | | | | | 31,221,373 | |
| | | | |
End of period | | | | | | $ | 56,603,556 | | | | | | | $ | 45,219,375 | |
| | | | |
Undistributed net investment income | | | | | | $ | 201,260 | | | | | | | $ | 128,869 | |
| | | | |
| 1 | For the period from October 31, 2016 (commencement of class operations) to November 30, 2016 |
The accompanying notes are an integral part of these financial statements.
| | | | |
| 16 | | Wells Fargo Income Funds | | Financial highlights |
| | | | | | | | | | | | | | | | | | | | | | | | |
| Core Bond Fund | | Beginning
net asset
value per
share | | | Net
investment
income | | | Net realized
and unrealized
gains (losses)
on investments | | | Distributions
from net
investment
income | | | Distributions
from net
realized gains | | | Ending
net asset
value per
share | |
Class A | | | | | | | | | | | | | | | | | | | | | | | | |
Six months ended November 30, 2016 (unaudited) | | $ | 13.28 | | | | 0.09 | | | | (0.20 | ) | | | (0.09 | ) | | | 0.00 | | | $ | 13.08 | |
Year ended May 31, 2016 | | $ | 13.16 | | | | 0.19 | 4 | | | 0.12 | | | | (0.19 | ) | | | 0.00 | | | $ | 13.28 | |
Year ended May 31, 2015 | | $ | 12.98 | | | | 0.18 | | | | 0.19 | | | | (0.19 | ) | | | 0.00 | | | $ | 13.16 | |
Year ended May 31, 2014 | | $ | 13.02 | | | | 0.19 | | | | 0.12 | | | | (0.20 | ) | | | (0.15 | ) | | $ | 12.98 | |
Year ended May 31, 2013 | | $ | 13.46 | | | | 0.18 | | | | 0.12 | | | | (0.18 | ) | | | (0.56 | ) | | $ | 13.02 | |
Year ended May 31, 2012 | | $ | 13.05 | | | | 0.26 | | | | 0.72 | | | | (0.26 | ) | | | (0.31 | ) | | $ | 13.46 | |
Class B | | | | | | | | | | | | | | | | | | | | | | | | |
Six months ended November 30, 2016 (unaudited) | | $ | 13.24 | | | | 0.04 | 4 | | | (0.21 | ) | | | (0.04 | ) | | | 0.00 | | | $ | 13.03 | |
Year ended May 31, 2016 | | $ | 13.12 | | | | 0.09 | 4 | | | 0.12 | | | | (0.09 | ) | | | 0.00 | | | $ | 13.24 | |
Year ended May 31, 2015 | | $ | 12.94 | | | | 0.09 | 4 | | | 0.18 | | | | (0.09 | ) | | | 0.00 | | | $ | 13.12 | |
Year ended May 31, 2014 | | $ | 12.98 | | | | 0.10 | 4 | | | 0.12 | | | | (0.11 | ) | | | (0.15 | ) | | $ | 12.94 | |
Year ended May 31, 2013 | | $ | 13.43 | | | | 0.08 | 4 | | | 0.10 | | | | (0.07 | ) | | | (0.56 | ) | | $ | 12.98 | |
Year ended May 31, 2012 | | $ | 13.01 | | | | 0.16 | | | | 0.73 | | | | (0.16 | ) | | | (0.31 | ) | | $ | 13.43 | |
Class C | | | | | | | | | | | | | | | | | | | | | | | | |
Six months ended November 30, 2016 (unaudited) | | $ | 13.15 | | | | 0.04 | | | | (0.20 | ) | | | (0.04 | ) | | | 0.00 | | | $ | 12.95 | |
Year ended May 31, 2016 | | $ | 13.03 | | | | 0.09 | | | | 0.12 | | | | (0.09 | ) | | | 0.00 | | | $ | 13.15 | |
Year ended May 31, 2015 | | $ | 12.86 | | | | 0.09 | | | | 0.17 | | | | (0.09 | ) | | | 0.00 | | | $ | 13.03 | |
Year ended May 31, 2014 | | $ | 12.90 | | | | 0.10 | | | | 0.12 | | | | (0.11 | ) | | | (0.15 | ) | | $ | 12.86 | |
Year ended May 31, 2013 | | $ | 13.34 | | | | 0.07 | | | | 0.12 | | | | (0.07 | ) | | | (0.56 | ) | | $ | 12.90 | |
Year ended May 31, 2012 | | $ | 12.93 | | | | 0.16 | | | | 0.72 | | | | (0.16 | ) | | | (0.31 | ) | | $ | 13.34 | |
Class R | | | | | | | | | | | | | | | | | | | | | | | | |
Six months ended November 30, 2016 (unaudited) | | $ | 12.97 | | | | 0.07 | 4 | | | (0.20 | ) | | | (0.07 | ) | | | 0.00 | | | $ | 12.77 | |
Year ended May 31, 2016 | | $ | 12.85 | | | | 0.15 | | | | 0.12 | | | | (0.15 | ) | | | 0.00 | | | $ | 12.97 | |
Year ended May 31, 2015 | | $ | 12.67 | | | | 0.15 | | | | 0.18 | | | | (0.15 | ) | | | 0.00 | | | $ | 12.85 | |
Year ended May 31, 2014 | | $ | 12.71 | | | | 0.16 | | | | 0.12 | | | | (0.17 | ) | | | (0.15 | ) | | $ | 12.67 | |
Year ended May 31, 2013 | | $ | 13.16 | | | | 0.14 | 4 | | | 0.11 | | | | (0.14 | ) | | | (0.56 | ) | | $ | 12.71 | |
Year ended May 31, 2012 | | $ | 12.76 | | | | 0.22 | | | | 0.71 | | | | (0.22 | ) | | | (0.31 | ) | | $ | 13.16 | |
Class R4 | | | | | | | | | | | | | | | | | | | | | | | | |
Six months ended November 30, 2016 (unaudited) | | $ | 12.95 | | | | 0.10 | | | | (0.20 | ) | | | (0.10 | ) | | | 0.00 | | | $ | 12.75 | |
Year ended May 31, 2016 | | $ | 12.83 | | | | 0.22 | | | | 0.12 | | | | (0.22 | ) | | | 0.00 | | | $ | 12.95 | |
Year ended May 31, 2015 | | $ | 12.66 | | | | 0.21 | | | | 0.18 | | | | (0.22 | ) | | | 0.00 | | | $ | 12.83 | |
Year ended May 31, 2014 | | $ | 12.70 | | | | 0.22 | | | | 0.12 | | | | (0.23 | ) | | | (0.15 | ) | | $ | 12.66 | |
Year ended May 31, 20135 | | $ | 13.46 | | | | 0.10 | 4 | | | (0.21 | ) | | | (0.09 | ) | | | (0.56 | ) | | $ | 12.70 | |
Class R6 | | | | | | | | | | | | | | | | | | | | | | | | |
Six months ended November 30, 2016 (unaudited) | | $ | 12.95 | | | | 0.11 | | | | (0.20 | ) | | | (0.11 | ) | | | 0.00 | | | $ | 12.75 | |
Year ended May 31, 2016 | | $ | 12.83 | | | | 0.24 | | | | 0.12 | | | | (0.24 | ) | | | 0.00 | | | $ | 12.95 | |
Year ended May 31, 2015 | | $ | 12.66 | | | | 0.23 | | | | 0.17 | | | | (0.23 | ) | | | 0.00 | | | $ | 12.83 | |
Year ended May 31, 2014 | | $ | 12.70 | | | | 0.24 | | | | 0.12 | | | | (0.25 | ) | | | (0.15 | ) | | $ | 12.66 | |
Year ended May 31, 20135 | | $ | 13.46 | | | | 0.11 | 4 | | | (0.21 | ) | | | (0.10 | ) | | | (0.56 | ) | | $ | 12.70 | |
Administrator Class | | | | | | | | | | | | | | | | | | | | | | | | |
Six months ended November 30, 2016 (unaudited) | | $ | 12.97 | | | | 0.09 | 4 | | | (0.20 | ) | | | (0.09 | ) | | | 0.00 | | | $ | 12.77 | |
Year ended May 31, 2016 | | $ | 12.85 | | | | 0.19 | | | | 0.12 | | | | (0.19 | ) | | | 0.00 | | | $ | 12.97 | |
Year ended May 31, 2015 | | $ | 12.67 | | | | 0.19 | 4 | | | 0.18 | | | | (0.19 | ) | | | 0.00 | | | $ | 12.85 | |
Year ended May 31, 2014 | | $ | 12.71 | | | | 0.21 | | | | 0.11 | | | | (0.21 | ) | | | (0.15 | ) | | $ | 12.67 | |
Year ended May 31, 2013 | | $ | 13.16 | | | | 0.19 | | | | 0.10 | | | | (0.18 | ) | | | (0.56 | ) | | $ | 12.71 | |
Year ended May 31, 2012 | | $ | 12.76 | | | | 0.27 | | | | 0.71 | | | | (0.27 | ) | | | (0.31 | ) | | $ | 13.16 | |
Institutional Class | | | | | | | | | | | | | | | | | | | | | | | | |
Six months ended November 30, 2016 (unaudited) | | $ | 12.95 | | | | 0.11 | | | | (0.20 | ) | | | (0.11 | ) | | | 0.00 | | | $ | 12.75 | |
Year ended May 31, 2016 | | $ | 12.83 | | | | 0.23 | | | | 0.12 | | | | (0.23 | ) | | | 0.00 | | | $ | 12.95 | |
Year ended May 31, 2015 | | $ | 12.66 | | | | 0.22 | | | | 0.18 | | | | (0.23 | ) | | | 0.00 | | | $ | 12.83 | |
Year ended May 31, 2014 | | $ | 12.70 | | | | 0.23 | | | | 0.12 | | | | (0.24 | ) | | | (0.15 | ) | | $ | 12.66 | |
Year ended May 31, 2013 | | $ | 13.14 | | | | 0.22 | | | | 0.12 | | | | (0.22 | ) | | | (0.56 | ) | | $ | 12.70 | |
Year ended May 31, 2012 | | $ | 12.75 | | | | 0.31 | | | | 0.69 | | | | (0.30 | ) | | | (0.31 | ) | | $ | 13.14 | |
| 1 | Ratios include net expenses allocated from the affiliated Master Portfolio. |
| 2 | Total return calculations do not include any sales charges. Returns for periods of less than one year are not annualized. |
| 3 | Portfolio turnover rate is calculated by multiplying the Fund’s investment percentage in the affiliated Master Portfolio by the affiliated Master Portfolio’s portfolio turnover rate. |
| 4 | Calculated based upon average shares outstanding |
| 5 | For the period from November 30, 2012 (commencement of class operations) to May 31, 2013 |
The accompanying notes are an integral part of these financial statements.
| | | | | | |
| Financial highlights | | Wells Fargo Income Funds | | | 17 | |
| | | | | | | | | | | | | | | | | | | | | | |
| Ratio to average net assets (annualized) | | | Total
return2 | | | Portfolio
turnover
rate3 | | | Net assets at
end of period
(000s omitted) | |
Net investment
income | | | Gross
expenses1 | | | Net
expenses1 | | | | |
| | | | | | | | | | | | | | | | | | | | | | |
| | 1.28 | % | | | 0.83 | % | | | 0.78 | % | | | (0.87 | )% | | | 252 | % | | $ | 673,109 | |
| | 1.43 | % | | | 0.83 | % | | | 0.78 | % | | | 2.36 | % | | | 667 | % | | $ | 699,273 | |
| | 1.39 | % | | | 0.83 | % | | | 0.78 | % | | | 2.85 | % | | | 586 | % | | $ | 506,043 | |
| | 1.52 | % | | | 0.83 | % | | | 0.78 | % | | | 2.46 | % | | | 646 | % | | $ | 397,780 | |
| | 1.31 | % | | | 0.83 | % | | | 0.80 | % | | | 2.14 | % | | | 547 | % | | $ | 408,864 | |
| | 1.91 | % | | | 0.82 | % | | | 0.82 | % | | | 7.65 | % | | | 803 | % | | $ | 450,013 | |
| | | | | | | | | | | | | | | | | | | | | | |
| | 0.53 | % | | | 1.58 | % | | | 1.53 | % | | | (1.32 | )% | | | 252 | % | | $ | 304 | |
| | 0.68 | % | | | 1.58 | % | | | 1.53 | % | | | 1.60 | % | | | 667 | % | | $ | 502 | |
| | 0.67 | % | | | 1.58 | % | | | 1.53 | % | | | 2.09 | % | | | 586 | % | | $ | 1,350 | |
| | 0.77 | % | | | 1.58 | % | | | 1.53 | % | | | 1.70 | % | | | 646 | % | | $ | 2,742 | |
| | 0.56 | % | | | 1.57 | % | | | 1.55 | % | | | 1.31 | % | | | 547 | % | | $ | 8,208 | |
| | 1.23 | % | | | 1.57 | % | | | 1.57 | % | | | 6.95 | % | | | 803 | % | | $ | 11,998 | |
| | | | | | | | | | | | | | | | | | | | | | |
| | 0.53 | % | | | 1.58 | % | | | 1.53 | % | | | (1.26 | )% | | | 252 | % | | $ | 64,296 | |
| | 0.68 | % | | | 1.58 | % | | | 1.53 | % | | | 1.61 | % | | | 667 | % | | $ | 66,612 | |
| | 0.65 | % | | | 1.58 | % | | | 1.53 | % | | | 2.02 | % | | | 586 | % | | $ | 72,798 | |
| | 0.77 | % | | | 1.58 | % | | | 1.53 | % | | | 1.71 | % | | | 646 | % | | $ | 81,187 | |
| | 0.53 | % | | | 1.58 | % | | | 1.55 | % | | | 1.39 | % | | | 547 | % | | $ | 116,837 | |
| | 1.18 | % | | | 1.57 | % | | | 1.57 | % | | | 6.90 | % | | | 803 | % | | $ | 127,677 | |
| | | | | | | | | | | | | | | | | | | | | | |
| | 1.03 | % | | | 1.08 | % | | | 1.03 | % | | | (1.03 | )% | | | 252 | % | | $ | 16,458 | |
| | 1.18 | % | | | 1.08 | % | | | 1.03 | % | | | 2.13 | % | | | 667 | % | | $ | 17,985 | |
| | 1.15 | % | | | 1.08 | % | | | 1.03 | % | | | 2.63 | % | | | 586 | % | | $ | 16,411 | |
| | 1.27 | % | | | 1.08 | % | | | 1.03 | % | | | 2.23 | % | | | 646 | % | | $ | 17,077 | |
| | 1.04 | % | | | 1.07 | % | | | 1.05 | % | | | 1.83 | % | | | 547 | % | | $ | 19,548 | |
| | 1.67 | % | | | 1.07 | % | | | 1.07 | % | | | 7.43 | % | | | 803 | % | | $ | 20,088 | |
| | | | | | | | | | | | | | | | | | | | | | |
| | 1.54 | % | | | 0.60 | % | | | 0.52 | % | | | (0.78 | )% | | | 252 | % | | $ | 42,082 | |
| | 1.69 | % | | | 0.60 | % | | | 0.52 | % | | | 2.65 | % | | | 667 | % | | $ | 41,272 | |
| | 1.53 | % | | | 0.59 | % | | | 0.52 | % | | | 3.07 | % | | | 586 | % | | $ | 49,261 | |
| | 1.78 | % | | | 0.58 | % | | | 0.52 | % | | | 2.75 | % | | | 646 | % | | $ | 17 | |
| | 1.56 | % | | | 0.57 | % | | | 0.52 | % | | | (0.84 | )% | | | 547 | % | | $ | 10 | |
| | | | | | | | | | | | | | | | | | | | | | |
| | 1.69 | % | | | 0.45 | % | | | 0.37 | % | | | (0.71 | )% | | | 252 | % | | $ | 579,202 | |
| | 1.84 | % | | | 0.45 | % | | | 0.37 | % | | | 2.81 | % | | | 667 | % | | $ | 450,791 | |
| | 1.76 | % | | | 0.45 | % | | | 0.37 | % | | | 3.23 | % | | | 586 | % | | $ | 726,165 | |
| | 1.94 | % | | | 0.45 | % | | | 0.37 | % | | | 2.91 | % | | | 646 | % | | $ | 290,977 | |
| | 1.72 | % | | | 0.45 | % | | | 0.37 | % | | | (0.77 | )% | | | 547 | % | | $ | 205,225 | |
| | | | | | | | | | | | | | | | | | | | | | |
| | 1.36 | % | | | 0.77 | % | | | 0.70 | % | | | (0.87 | )% | | | 252 | % | | $ | 405,393 | |
| | 1.51 | % | | | 0.77 | % | | | 0.70 | % | | | 2.47 | % | | | 667 | % | | $ | 529,530 | |
| | 1.47 | % | | | 0.77 | % | | | 0.70 | % | | | 2.96 | % | | | 586 | % | | $ | 487,981 | |
| | 1.60 | % | | | 0.77 | % | | | 0.70 | % | | | 2.57 | % | | | 646 | % | | $ | 412,419 | |
| | 1.43 | % | | | 0.76 | % | | | 0.70 | % | | | 2.19 | % | | | 547 | % | | $ | 526,028 | |
| | 2.08 | % | | | 0.76 | % | | | 0.70 | % | | | 7.83 | % | | | 803 | % | | $ | 802,788 | |
| | | | | | | | | | | | | | | | | | | | | | |
| | 1.64 | % | | | 0.50 | % | | | 0.42 | % | | | (0.73 | )% | | | 252 | % | | $ | 3,039,734 | |
| | 1.79 | % | | | 0.50 | % | | | 0.42 | % | | | 2.76 | % | | | 667 | % | | $ | 2,102,073 | |
| | 1.75 | % | | | 0.50 | % | | | 0.42 | % | | | 3.17 | % | | | 586 | % | | $ | 1,360,398 | |
| | 1.88 | % | | | 0.50 | % | | | 0.42 | % | | | 2.85 | % | | | 646 | % | | $ | 1,208,745 | |
| | 1.67 | % | | | 0.50 | % | | | 0.42 | % | | | 2.56 | % | | | 547 | % | | $ | 1,505,192 | |
| | 2.32 | % | | | 0.49 | % | | | 0.42 | % | | | 8.05 | % | | | 803 | % | | $ | 1,965,338 | |
The accompanying notes are an integral part of these financial statements.
| | | | |
| 18 | | Wells Fargo Income Funds | | Financial highlights |
| | | | | | | | | | | | | | | | | | | | | | | | |
| Real Return Fund | | Beginning
net asset
value per
share | | | Net
investment
income
(loss) | | | Net realized
and unrealized
gains (losses)
on investments | | | Distributions
from net
investment
income | | | Distributions
from net
realized gains | | | Ending
net asset
value per
share | |
Class A | | | | | | | | | | | | | | | | | | | | | | | | |
Six months ended November 30, 2016 (unaudited) | | $ | 9.95 | | | | 0.13 | | | | (0.12 | ) | | | (0.10 | ) | | | 0.00 | | | $ | 9.86 | |
Year ended May 31, 2016 | | $ | 10.07 | | | | 0.10 | 4 | | | (0.01 | ) | | | (0.07 | ) | | | (0.14 | ) | | $ | 9.95 | |
Year ended May 31, 2015 | | $ | 10.11 | | | | 0.05 | 4 | | | 0.07 | | | | (0.08 | ) | | | (0.08 | ) | | $ | 10.07 | |
Year ended May 31, 2014 | | $ | 10.85 | | | | 0.10 | 4 | | | (0.21 | ) | | | (0.09 | ) | | | (0.54 | ) | | $ | 10.11 | |
Year ended May 31, 2013 | | $ | 11.66 | | | | 0.11 | | | | (0.36 | ) | | | (0.21 | ) | | | (0.35 | ) | | $ | 10.85 | |
Year ended May 31, 2012 | | $ | 10.84 | | | | 0.27 | | | | 1.01 | | | | (0.36 | ) | | | (0.10 | ) | | $ | 11.66 | |
Class B | | | | | | | | | | | | | | | | | | | | | | | | |
Six months ended November 30, 2016 (unaudited) | | $ | 9.77 | | | | 0.32 | 4 | | | (0.12 | ) | | | 0.00 | | | | 0.00 | | | $ | 9.97 | |
Year ended May 31, 2016 | | $ | 9.91 | | | | 0.06 | 4 | | | (0.04 | ) | | | (0.02 | ) | | | (0.14 | ) | | $ | 9.77 | |
Year ended May 31, 2015 | | $ | 9.99 | | | | (0.03 | )4 | | | 0.07 | | | | (0.04 | ) | | | (0.08 | ) | | $ | 9.91 | |
Year ended May 31, 2014 | | $ | 10.75 | | | | 0.01 | 4 | | | (0.20 | ) | | | (0.03 | ) | | | (0.54 | ) | | $ | 9.99 | |
Year ended May 31, 2013 | | $ | 11.58 | | | | 0.03 | 4 | | | (0.36 | ) | | | (0.15 | ) | | | (0.35 | ) | | $ | 10.75 | |
Year ended May 31, 2012 | | $ | 10.76 | | | | 0.19 | 4 | | | 1.00 | | | | (0.27 | ) | | | (0.10 | ) | | $ | 11.58 | |
Class C | | | | | | | | | | | | | | | | | | | | | | | | |
Six months ended November 30, 2016 (unaudited) | | $ | 9.77 | | | | 0.08 | 4 | | | (0.10 | ) | | | (0.02 | ) | | | 0.00 | | | $ | 9.73 | |
Year ended May 31, 2016 | | $ | 9.92 | | | | 0.03 | 4 | | | (0.02 | ) | | | (0.02 | ) | | | (0.14 | ) | | $ | 9.77 | |
Year ended May 31, 2015 | | $ | 10.00 | | | | (0.03 | )4 | | | 0.08 | | | | (0.05 | ) | | | (0.08 | ) | | $ | 9.92 | |
Year ended May 31, 2014 | | $ | 10.76 | | | | 0.03 | 4 | | | (0.21 | ) | | | (0.04 | ) | | | (0.54 | ) | | $ | 10.00 | |
Year ended May 31, 2013 | | $ | 11.59 | | | | 0.04 | | | | (0.37 | ) | | | (0.15 | ) | | | (0.35 | ) | | $ | 10.76 | |
Year ended May 31, 2012 | | $ | 10.77 | | | | 0.19 | | | | 1.00 | | | | (0.27 | ) | | | (0.10 | ) | | $ | 11.59 | |
Class R6 | | | | | | | | | | | | | | | | | | | | | | | | |
Period ended November 30, 2016 (unaudited)5 | | $ | 10.17 | | | | 0.02 | | | | (0.20 | ) | | | (0.03 | ) | | | 0.00 | | | $ | 9.96 | |
Administrator Class | | | | | | | | | | | | | | | | | | | | | | | | |
Six months ended November 30, 2016 (unaudited) | | $ | 10.03 | | | | 0.16 | | | | (0.13 | ) | | | (0.10 | ) | | | 0.00 | | | $ | 9.96 | |
Year ended May 31, 2016 | | $ | 10.15 | | | | 0.13 | 4 | | | (0.02 | ) | | | (0.09 | ) | | | (0.14 | ) | | $ | 10.03 | |
Year ended May 31, 2015 | | $ | 10.17 | | | | 0.10 | 4 | | | 0.06 | | | | (0.10 | ) | | | (0.08 | ) | | $ | 10.15 | |
Year ended May 31, 2014 | | $ | 10.90 | | | | 0.13 | 4 | | | (0.22 | ) | | | (0.10 | ) | | | (0.54 | ) | | $ | 10.17 | |
Year ended May 31, 2013 | | $ | 11.71 | | | | 0.15 | 4 | | | (0.37 | ) | | | (0.24 | ) | | | (0.35 | ) | | $ | 10.90 | |
Year ended May 31, 2012 | | $ | 10.89 | | | | 0.39 | 4 | | | 0.92 | | | | (0.39 | ) | | | (0.10 | ) | | $ | 11.71 | |
Institutional Class | | | | | | | | | | | | | | | | | | | | | | | | |
Period ended November 30, 2016 (unaudited)5 | | $ | 10.17 | | | | 0.02 | 4 | | | (0.20 | ) | | | (0.03 | ) | | | 0.00 | | | $ | 9.96 | |
| 1 | Ratios include net expenses allocated from the affiliated Master Portfolio. |
| 2 | Total return calculations do not include any sales charges. Returns for periods of less than one year are not annualized. |
| 3 | Portfolio turnover rate is calculated by multiplying the Fund’s investment percentage in the affiliated Master Portfolio by the affiliated Master Portfolio’s portfolio turnover rate. |
| 4 | Calculated based upon average shares outstanding |
| 5 | For the period from October 31, 2016 (commencement of class operations) to November 30, 2016 |
The accompanying notes are an integral part of these financial statements.
| | | | | | |
| Financial highlights | | Wells Fargo Income Funds | | | 19 | |
| | | | | | | | | | | | | | | | | | | | | | |
| Ratio to average net assets (annualized) | | | Total
return2 | | | Portfolio
turnover
rate3 | | | Net assets at
end of period
(000s omitted) | |
Net investment
income | | | Gross
expenses1 | | | Net
expenses1 | | | | |
| | | | | | | | | | | | | | | | | | | | | | |
| | 2.15 | % | | | 1.14 | % | | | 0.85 | % | | | 0.11 | % | | | 10 | % | | $ | 24,038 | |
| | 0.98 | % | | | 1.20 | % | | | 0.85 | % | | | 1.01 | % | | | 29 | % | | $ | 18,938 | |
| | 0.47 | % | | | 1.31 | % | | | 0.85 | % | | | 1.24 | % | | | 57 | % | | $ | 12,977 | |
| | 0.96 | % | | | 1.20 | % | | | 0.85 | % | | | (0.76 | )% | | | 9 | % | | $ | 15,415 | |
| | 1.09 | % | | | 1.08 | % | | | 0.85 | % | | | (2.27 | )% | | | 15 | % | | $ | 28,298 | |
| | 2.42 | % | | | 1.11 | % | | | 0.85 | % | | | 12.02 | % | | | 23 | % | | $ | 36,935 | |
| | | | | | | | | | | | | | | | | | | | | | |
| | 6.20 | % | | | 1.81 | % | | | 1.60 | % | | | 2.05 | % | | | 10 | % | | $ | 6 | |
| | 0.65 | % | | | 1.95 | % | | | 1.60 | % | | | 0.31 | % | | | 29 | % | | $ | 21 | |
| | (0.30 | )% | | | 2.05 | % | | | 1.60 | % | | | 0.45 | % | | | 57 | % | | $ | 95 | |
| | 0.09 | % | | | 1.95 | % | | | 1.60 | % | | | (1.53 | )% | | | 9 | % | | $ | 190 | |
| | 0.29 | % | | | 1.83 | % | | | 1.60 | % | | | (3.02 | )% | | | 15 | % | | $ | 571 | |
| | 1.69 | % | | | 1.84 | % | | | 1.60 | % | | | 11.25 | % | | | 23 | % | | $ | 899 | |
| | | | | | | | | | | | | | | | | | | | | | |
| | 1.52 | % | | | 1.88 | % | | | 1.60 | % | | | (0.23 | )% | | | 10 | % | | $ | 4,742 | |
| | 0.30 | % | | | 1.95 | % | | | 1.60 | % | | | 0.21 | % | | | 29 | % | | $ | 5,654 | |
| | (0.33 | )% | | | 2.06 | % | | | 1.60 | % | | | 0.46 | % | | | 57 | % | | $ | 7,471 | |
| | 0.29 | % | | | 1.95 | % | | | 1.60 | % | | | (1.46 | )% | | | 9 | % | | $ | 9,095 | |
| | 0.39 | % | | | 1.83 | % | | | 1.60 | % | | | (3.01 | )% | | | 15 | % | | $ | 13,774 | |
| | 1.68 | % | | | 1.86 | % | | | 1.60 | % | | | 11.24 | % | | | 23 | % | | $ | 15,631 | |
| | | | | | | | | | | | | | | | | | | | | | |
| | 2.75 | % | | | 0.72 | % | | | 0.47 | % | | | (1.80 | )% | | | 10 | % | | $ | 25 | |
| | | | | | | | | | | | | | | | | | | | | | |
| | 2.34 | % | | | 1.06 | % | | | 0.60 | % | | | 0.32 | % | | | 10 | % | | $ | 17,934 | |
| | 1.30 | % | | | 1.13 | % | | | 0.60 | % | | | 1.21 | % | | | 29 | % | | $ | 20,607 | |
| | 0.99 | % | | | 1.27 | % | | | 0.60 | % | | | 1.56 | % | | | 57 | % | | $ | 10,679 | |
| | 1.31 | % | | | 1.14 | % | | | 0.60 | % | | | (0.51 | )% | | | 9 | % | | $ | 6,320 | |
| | 1.34 | % | | | 1.02 | % | | | 0.60 | % | | | (2.08 | )% | | | 15 | % | | $ | 8,271 | |
| | 3.42 | % | | | 1.01 | % | | | 0.60 | % | | | 12.26 | % | | | 23 | % | | $ | 9,833 | |
| | | | | | | | | | | | | | | | | | | | | | |
| | 2.66 | % | | | 0.79 | % | | | 0.52 | % | | | (1.80 | )% | | | 10 | % | | $ | 9,859 | |
The accompanying notes are an integral part of these financial statements.
| | | | |
| 20 | | Wells Fargo Income Funds | | Notes to financial statements (unaudited) |
1. ORGANIZATION
Wells Fargo Funds Trust (the “Trust”), a Delaware statutory trust organized on March 10, 1999, is an open-end management investment company registered under the Investment Company Act of 1940, as amended (the “1940 Act”). As an investment company, the Trust follows the accounting and reporting guidance in Financial Accounting Standards Board (“FASB”) Accounting Standards Codification Topic 946, Financial Services – Investment Companies. These financial statements report on the following funds: Wells Fargo Core Bond Fund (“Core Bond Fund”) and Wells Fargo Real Return Fund (“Real Return Fund”) (each, a “Fund”, collectively, the “Funds”). Each Fund is a diversified series of the Trust.
After the close of business on October 23, 2015, Investor Class shares became Class A shares in a tax-free conversion. Investor Class shareholders of Core Bond Fund received Class A shares at a value equal to the value of their Investor Class shares immediately prior to the conversion. Investor Class shares are no longer offered by Core Bond Fund.
Each Fund seeks to achieve its investment objective by investing all investable assets in a separate diversified portfolio (an “affiliated Master Portfolio”) of Wells Fargo Master Trust, a registered open-end management investment company. Each affiliated Master Portfolio directly acquires portfolio securities, and a Fund investing in an affiliated Master Portfolio acquires an indirect interest in those securities. Each Fund accounts for its investment in the affiliated Master Portfolio as a partnership investment and records on a daily basis its share of the affiliated Master Portfolio’s income, expense, and realized and unrealized gains and losses. The financial statements of each affiliated Master Portfolio for the six months ended November 30, 2016 are included in this report and should be read in conjunction with each Fund’s financial statements. As of November 30, 2016, Core Bond Fund owned 92% of Wells Fargo Core Bond Portfolio and Real Return Fund owned 76% of Wells Fargo Real Return Portfolio.
2. SIGNIFICANT ACCOUNTING POLICIES
The following significant accounting policies, which are consistently followed in the preparation of the financial statements of each Fund, are in conformity with U.S. generally accepted accounting principles which require management to make estimates and assumptions that affect the reported amounts of assets and liabilities, disclosure of contingent assets and liabilities at the date of the financial statements, and the reported amounts of revenues and expenses during the reporting period. Actual results could differ from those estimates.
Securities valuation
All investments are valued each business day as of the close of regular trading on the New York Stock Exchange (generally 4 p.m. Eastern Time), although the Funds may deviate from this calculation time under unusual or unexpected circumstances.
An investment in an affiliated Master Portfolio is valued daily based on each Fund’s proportionate share of each affiliated Master Portfolio’s net assets, which is also valued daily. Securities held in the affiliated Master Portfolio are valued as discussed in the Notes to Financial Statements of the affiliated Master Portfolio, which are included elsewhere in this report.
Security transactions and income recognition
Securities transactions are recorded on a trade date basis in each affiliated Master Portfolio. Realized gains or losses in each affiliated Master Portfolio are recorded on the basis of identified cost.
Interest income is accrued daily and bond discounts are accreted and premiums are amortized daily based on the effective interest method by each affiliated Master Portfolio. To the extent debt obligations are placed on non-accrual status, any related interest income may be reduced by writing off interest receivables when the collection of all or a portion of interest has become doubtful based on consistently applied procedures. If the issuer subsequently resumes interest payments or when the collectability of interest is reasonably assured, the debt obligation is removed from non-accrual status.
Dividend income in each affiliated Master Portfolio is recognized on the ex-dividend date, except for certain dividends from foreign securities which are recorded as soon as the custodian verifies the ex-dividend date.
Income from foreign securities in each affiliated Master Portfolio is recorded net of foreign taxes withheld where recovery of such taxes is not assured.
Each Fund records daily its proportionate share of each affiliated Master Portfolio’s interest and dividend income and realized and unrealized gains or losses.
| | | | | | |
| Notes to financial statements (unaudited) | | Wells Fargo Income Funds | | | 21 | |
Distributions to shareholders
For Core Bond Fund, distributions to shareholders from net investment income are accrued daily and paid monthly. For Real Return Fund, distributions to shareholders from net investment income are recorded on the ex-dividend date. Distributions from net realized gains, if any, are recorded on the ex-dividend date. Such distributions are determined in conformity with federal income tax regulations, which may differ in amount or character from net investment income and realized gains recognized for purposes of U.S. generally accepted accounting principles.
Federal and other taxes
Each Fund is treated as a separate entity for federal income tax purposes. Each Fund intends to continue to qualify as a regulated investment company by distributing substantially all of its investment company taxable income and any net realized capital gains (after reduction for capital loss carryforwards) sufficient to relieve it from all, or substantially all, federal income taxes. Accordingly, no provision for federal income taxes was required.
Each Fund’s income and federal excise tax returns and all financial records supporting those returns for the prior three fiscal years are subject to examination by the federal and Delaware revenue authorities. Management has analyzed each Fund’s tax positions taken on federal, state, and foreign tax returns for all open tax years and does not believe that there are any uncertain tax positions that require recognition of a tax liability.
As of May 31, 2016, capital loss carryforwards available to offset future net realized capital gains were as follows through the indicated expiration dates:
| | | | | | | | | | | | |
| | | | | | No expiration | |
| | | 2017 | | | Short-term | | | Long-term | |
Core Bond Fund | | $ | 17,505,682 | | | $ | 0 | | | $ | 0 | |
Real Return Fund | | | 0 | | | | 19,900 | | | $ | 22,656 | |
As of May 31, 2016, Core Bond Fund had $1,802,544 of current year deferred post-October capital losses, which was recognized on the first day of the current fiscal year.
Class allocations
The separate classes of shares offered by each Fund differ principally in applicable sales charges, distribution, shareholder servicing, and administration fees. Class specific expenses are charged directly to that share class. Investment income, common expenses, and realized and unrealized gains (losses) on investments are allocated daily to each class of shares based on the relative proportion of net assets of each class.
3. FAIR VALUATION MEASUREMENTS
At November 30, 2016, the affiliated Master Portfolio of each Fund was measured at fair value using the net asset value per share (or its equivalent) as a practical expedient. The investment objective of each affiliate Master Portfolio and the value of each affiliated Master Portfolio was as follows:
| | | | | | |
| Affiliated Master Portfolio | | Investment objective | | Value of affiliated Master Portfolio | |
Wells Fargo Core Bond Porfolio | | Seeks total return, consisting of income and capital appreciation | | $ | 4,811,118,137 | |
Wells Fargo Real Return Portfolio | | Seeks returns that exceed the rate of inflation over the long-term | | | 55,534,972 | |
Each affiliated Master Portfolio does not have a redemption period notice, can be redeemed daily and does not have any unfunded commitments.
4. TRANSACTIONS WITH AFFILIATES
Management fee
Wells Fargo Funds Management, LLC (“Funds Management”), an indirect wholly owned subsidiary of Wells Fargo & Company (“Wells Fargo”), is the manager of each Fund and provides advisory and fund-level administrative services under an investment management agreement. Under the investment management agreement, Funds Management is responsible for, among other services, implementing the investment objectives and strategies of each Fund, supervising the subadviser, providing fund-level administrative services in connection with each Fund’s operations, and providing
| | | | |
| 22 | | Wells Fargo Income Funds | | Notes to financial statements (unaudited) |
any other fund-level administrative services reasonably necessary for the operation of each Fund. As long as each Fund continues to invest substantially all of its assets in a single affiliated Master Portfolio, each Fund pays Funds Management an investment management fee only for fund-level administrative services. As compensation for its services under the investment management agreement, Funds Management is entitled to receive an annual management fee starting at 0.05% and declining to 0.03% as the average daily net assets of each Fund increase. For the six months ended November 30, 2016, the management fee was equivalent to an annual rate of 0.05% of each Fund’s average daily net assets.
Funds Management also serves as the adviser to each affiliated Master Portfolio and is entitled to receive a fee from each affiliated Master Portfolio for those services.
Administration fees
Under a class-level administration agreement, Funds Management provides class-level administrative services to each Fund, which includes paying fees and expenses for services provided by the transfer agent, sub-transfer agents, omnibus account servicers and record-keepers. As compensation for its services under the class-level administration agreement, Funds Management receives an annual fee which is calculated based on the average daily net assets of each class as follows:
| | | | |
| | | Class level administration fee | |
Class A, Class B, Class C, Class R | | | 0.16 | % |
Class R4, Institutional Class | | | 0.08 | |
Class R6 | | | 0.03 | |
Administrator Class | | | 0.10 | |
Funds Management has contractually waived and/or reimbursed management and administration fees to the extent necessary to maintain certain net operating expense ratios for the Funds. Waiver of fees and/or reimbursement of expenses by Funds Management were made first from fund level expenses on a proportionate basis and then from class specific expenses. Funds Management has committed to waive fees and/or reimburse expenses to the extent necessary to cap each Fund’s expenses as follows:
| | | | | | | | | | | | | | | | | | | | | | | | | | | | | | | | | | | | |
| | | Expiration date | | | Class A | | | Class B | | | Class C | | | Class R | | | Class R4 | | | Class R6 | | | Administrator Class | | | Institutional Class | |
Core Bond Fund | | | September 30, 2017 | | | | 0.78 | % | | | 1.53 | % | | | 1.53 | % | | | 1.03 | % | | | 0.52 | % | | | 0.37 | % | | | 0.70 | % | | | 0.42 | % |
Real Return Fund | | | September 30, 2017 | | | | 0.85 | | | | 1.60 | | | | 1.60 | | | | N/A | | | | N/A | | | | 0.47 | * | | | 0.60 | | | | 0.52 | * |
| * | The expiration date for Class R6 and Institutional Class is September 30, 2018. |
Net expenses from the affiliated Master Portfolio are included in the expense caps. After the expiration date, each expense cap may be increased or the commitment to maintain the cap may be terminated only with the approval of the Board of Trustees.
Distribution fees
The Trust has adopted a distribution plan for Class B, Class C and Class R shares of the applicable Funds pursuant to Rule 12b-1 under the 1940 Act. Distribution fees are charged to the Class B, Class C and Class R shares and paid to Wells Fargo Funds Distributor, LLC (“Funds Distributor”), the principal underwriter of each Fund, at an annual rate of 0.75% of the average daily net assets of Class B and Class C shares and 0.25% of the average daily net assets of Class R shares.
In addition, Funds Distributor is entitled to receive the front-end sales charge from the purchase of Class A shares and a contingent deferred sales charge on the redemption of certain Class A shares. Funds Distributor is also entitled to receive the contingent deferred sales charges from redemptions of Class B and Class C shares. For the six months ended November 30, 2016, Funds Distributor received the following amounts in front-end sales charges and contingent deferred sales charges:
| | | | | | | | |
| | | Front-end sales charges | | | Contingent deferred sales charges | |
| | | Class A | | | Class C | |
Core Bond Fund | | $ | 5,946 | | | $ | 15 | |
Real Return Fund | | | 3,539 | | | | 0 | |
| | | | | | |
| Notes to financial statements (unaudited) | | Wells Fargo Income Funds | | | 23 | |
Shareholder servicing fees
The Trust has entered into contracts with one or more shareholder servicing agents, whereby Class A, Class B, Class C, Class R and Administrator Class of each applicable Fund is charged a fee at an annual rate of 0.25% of the average daily net assets of each respective class. Class R4 shares are charged a fee at an annual rate of 0.10% of its average daily net assets.
A portion of these total shareholder servicing fees were paid to affiliates of Wells Fargo.
5. INVESTMENT PORTFOLIO TRANSACTIONS
Purchases and sales of investments, excluding short-term securities, for the six months ended November 30, 2016 were as follows:
| | | | | | | | | | | | | | | | |
| | | Purchases at cost* | | | Sales proceeds* | |
| | | U.S. government | | | Non-U.S.
government | | | U.S. government | | | Non-U.S.
government | |
Core Bond Fund | | $ | 10,568,154,250 | | | $ | 2,815,311,467 | | | $ | 9,899,550,985 | | | $ | 2,088,001,449 | |
Real Return Fund | | | 6,353,088 | | | | 5,388,593 | | | | 1,202,842 | | | | 3,702,981 | |
| * | The Funds seek to achieve their investment objective by investing all of their investable assets in a single affiliated Master Portfolio. Purchases and sales have been calculated by multiplying each Fund’s ownership percentage of the respective affiliated Master Portfolio by the affiliated Master Portfolio’s purchases and sales. |
6. BANK BORROWINGS
The Trust (excluding the money market funds and certain other funds) and Wells Fargo Variable Trust are parties to a $250,000,000 revolving credit agreement whereby the Fund is permitted to use bank borrowings for temporary or emergency purposes, such as to fund shareholder redemption requests. Interest under the credit agreement is charged to the Fund based on a borrowing rate equal to the higher of the Federal Funds rate in effect on that day plus 1.25% or the overnight LIBOR rate in effect on that day plus 1.25%. In addition, an annual commitment fee equal to 0.25% of the unused balance is allocated to each participating fund. Prior to August 30, 2016, the revolving credit agreement amount was $200,000,000 and the annual commitment fee was equal to 0.20% of the unused balance which was allocated to each participating fund.
For the six months ended November 30, 2016, there were no borrowings by the Funds under the agreement.
7. INDEMNIFICATION
Under the Trust’s organizational documents, the officers and Trustees have been granted certain indemnification rights against certain liabilities that may arise out of performance of their duties to the Trust. Additionally, in the normal course of business, the Trust may enter into contracts with service providers that contain a variety of indemnification clauses. The Trust’s maximum exposure under these arrangements is dependent on future claims that may be made against the Funds and, therefore, cannot be estimated.
8. REGULATORY CHANGES
In October 2016, the Securities and Exchange Commission (“SEC”) adopted new rules and forms and amended existing rules and forms (together, “final rules”) intended to modernize and enhance the reporting and disclosure of information by registered investment companies and to enhance liquidity risk management by open-end mutual funds and exchange-traded funds. The final rules will enhance the quality of information available to investors and will allow the SEC to more effectively collect and use data reported by funds. In part, the final rules amend Regulation S-X and require standardized, enhanced disclosure about derivatives in the Fund’s financial statements, as well as other amendments. The compliance date for the amendments to Regulation S-X is August 1, 2017 while the compliance date for the new form types is June 1, 2018 and the compliance date for the liquidity risk management program requirements is December 1, 2018. Management is currently assessing the potential impact of these enhancements and their impact on the financial statement disclosures and reporting requirements.
| | | | |
| 24 | | Wells Fargo Income Funds | | Notes to financial statements (unaudited) |
9. SUBSEQUENT DISTRIBUTIONS
On December 7, 2016, Core Bond Fund and Real Return Fund declared distributions from capital gains to shareholders of record on December 6, 2016. The per share amounts payable on December 8, 2016 were as follows:
| | | | | | | | |
| | | Core Bond Fund | | | Real Return Fund | |
Short-term capital gains | | | | | | | | |
Class A | | $ | 0.05253 | | | $ | 0.00055 | |
Class C | | | 0.05253 | | | | 0.00055 | |
Class R | | | 0.05253 | | | | N/A | |
Class R4 | | | 0.05253 | | | | N/A | |
Class R6 | | | 0.05253 | | | | 0.00055 | |
Administrator Class | | | 0.05253 | | | | 0.00055 | |
Institutional Class | | | 0.05253 | | | | 0.00055 | |
| | |
Long-term capital gains | | | | | | | | |
Class A | | $ | 0.01087 | | | $ | 0.01298 | |
Class C | | | 0.01087 | | | | 0.01298 | |
Class R | | | 0.01087 | | | | N/A | |
Class R4 | | | 0.01087 | | | | N/A | |
Class R6 | | | 0.01087 | | | | 0.01298 | |
Administrator Class | | | 0.01087 | | | | 0.01298 | |
Institutional Class | | | 0.01087 | | | | 0.01298 | |
On December 29, 2016, Real Return Fund declared distributions from net investment income to shareholders of record on December 28, 2016. The per share amounts payable on December 30, 2016 were as follows:
| | | | |
| | | Net investment
income | |
Class A | | $ | 0.04733 | |
Class C | | | 0.03763 | |
Class R6 | | | 0.05218 | |
Administrator Class | | | 0.04771 | |
Institutional Class | | | 0.05175 | |
These distributions are not reflected in the accompanying financial statements. The final determination of the source of all distributions is subject to change and made after the tax year-end of each Fund.
| | | | | | |
| Summary portfolio of investments—November 30, 2016 (unaudited) | | Wells Fargo Income Funds | | | 25 | |
CORE BOND PORTFOLIO
The Summary portfolio of investments shows the 50 largest portfolio holdings in unaffiliated issuers and any holdings exceeding 1% of the total net assets as of the report date. The remaining securities held are grouped as “Other securities” in each category.
| | | | | | | | | | | | | | | | | | | | |
| Security name | | Interest rate | | | Maturity date | | | Principal | | | Value | | | Percent of
net assets | |
| | | | | |
Agency Securities: 27.20% | | | | | | | | | | | | | | | | | | | | |
FHLMC | | | 1.24-7.00 | % | | | 8-1-2017 to 12-13-2046 | | | $ | 160,588,888 | | | $ | 169,079,765 | | | | 3.22 | % |
FHLMC %% | | | 3.00 | | | | 12-13-2046 | | | | 44,100,000 | | | | 43,838,156 | | | | 0.84 | |
FHLMC | | | 3.50 | | | | 7-1-2032 | | | | 14,165,419 | | | | 14,699,881 | | | | 0.28 | |
FHLMC | | | 4.00 | | | | 8-1-2044 | | | | 18,453,037 | | | | 19,619,382 | | | | 0.38 | |
FHLMC Series 300 Class 300 | | | 3.00 | | | | 1-15-2043 | | | | 14,386,497 | | | | 14,443,906 | | | | 0.28 | |
FNMA | | | 0.00-8.12 | | | | 4-1-2017 to 11-1-2046 | | | | 479,910,237 | | | | 504,096,462 | | | | 9.68 | |
FNMA | | | 3.00 | | | | 6-1-2031 | | | | 14,469,882 | | | | 14,930,795 | | | | 0.29 | |
FNMA %% | | | 3.00 | | | | 12-13-2046 | | | | 34,100,000 | | | | 33,918,844 | | | | 0.65 | |
FNMA %% | | | 3.00 | | | | 1-18-2047 | | | | 110,500,000 | | | | 109,684,200 | | | | 2.10 | |
FNMA | | | 3.50 | | | | 6-1-2045 | | | | 17,691,683 | | | | 18,218,372 | | | | 0.35 | |
FNMA %% | | | 3.50 | | | | 12-13-2046 | | | | 86,500,000 | | | | 88,743,594 | | | | 1.70 | |
FNMA %% | | | 3.50 | | | | 1-18-2047 | | | | 23,600,000 | | | | 24,202,343 | | | | 0.46 | |
FNMA %% | | | 4.00 | | | | 12-13-2046 | | | | 23,500,000 | | | | 24,722,207 | | | | 0.47 | |
FNMA | | | 4.50 | | | | 2-1-2044 | | | | 13,480,624 | | | | 14,806,106 | | | | 0.28 | |
FNMA | | | 4.50 | | | | 3-1-2046 | | | | 14,991,505 | | | | 16,378,521 | | | | 0.31 | |
FNMA Series 2015-18 Class HE | | | 4.00 | | | | 9-25-2041 | | | | 14,738,307 | | | | 15,668,393 | | | | 0.30 | |
GNMA %% | | | 3.00 | | | | 12-20-2046 | | | | 35,200,000 | | | | 35,699,125 | | | | 0.68 | |
GNMA %% | | | 3.50 | | | | 12-20-2046 | | | | 105,500,000 | | | | 109,715,875 | | | | 2.10 | |
GNMA | | | 3.50-5.00 | | | | 3-15-2041 to 12-20-2046 | | | | 66,644,891 | | | | 71,970,810 | | | | 1.37 | |
Other securities | | | | | | | | | | | | | | | 75,256,391 | | | | 1.46 | |
| | | | |
Total Agency Securities (Cost $1,436,765,054) | | | | | | | | | | | | 1,419,693,128 | | | | 27.20 | |
| | | | | | | | | | | | | | | | | | | | |
| | | | | |
Asset-Backed Securities: 12.48% | | | | | | | | | | | | | | | | | | | | |
Capital Auto Receivables Asset Trust | | | 1.39-2.01 | | | | 2-20-2018 to 10-20-2020 | | | | 60,002,588 | | | | 60,131,465 | | | | 1.14 | |
SLM Student Loan Trust | | | 0.92-3.74 | | | | 4-25-2019 to 1-25-2072 | | | | 138,293,380 | | | | 134,680,958 | | | | 2.60 | |
SMB Private Education Loan Trust Series 2016-B
Class A2A 144A | | | 2.43 | | | | 2-17-2032 | | | | 16,726,000 | | | | 16,451,744 | | | | 0.31 | |
Other securities | | | | | | | | | | | | | | | 440,050,191 | | | | 8.43 | |
| | | | |
Total Asset-Backed Securities (Cost $652,378,051) | | | | | | | | | | | | 651,314,358 | | | | 12.48 | |
| | | | | | | | | | | | | | | | | | | | |
| | | | | |
Corporate Bonds and Notes: 18.61% | | | | | | | | | | | | | | | | | | | | |
| | | | | |
Consumer Discretionary: 1.07% | | | | | | | | | | | | | | | | | | | | |
| | | | | |
| Automobiles: 0.09% | | | | | | | | | | | | | | | | | | | | |
Other securities | | | | | | | | | | | | | | | 4,584,220 | | | | 0.09 | |
| | | | | | | | | | | | | | | | | | | | |
| | | | | |
| Hotels, Restaurants & Leisure: 0.17% | | | | | | | | | | | | | | | | | | | | |
Other securities | | | | | | | | | | | | | | | 8,773,757 | | | | 0.17 | |
| | | | | | | | | | | | | | | | | | | | |
| | | | | |
| Household Durables: 0.14% | | | | | | | | | | | | | | | | | | | | |
Other securities | | | | | | | | | | | | | | | 7,599,477 | | | | 0.14 | |
| | | | | | | | | | | | | | | | | | | | |
| | | | | |
| Media: 0.67% | | | | | | | | | | | | | | | | | | | | |
Other securities | | | | | | | | | | | | | | | 34,860,933 | | | | 0.67 | |
| | | | | | | | | | | | | | | | | | | | |
The accompanying notes are an integral part of these financial statements.
| | | | |
| 26 | | Wells Fargo Income Funds | | Summary portfolio of investments—November 30, 2016 (unaudited) |
CORE BOND PORTFOLIO
| | | | | | | | | | | | | | | | | | | | |
| Security name | | Interest rate | | | Maturity date | | | Principal | | | Value | | | Percent of
net assets | |
| | | | | |
Consumer Staples: 1.18% | | | | | | | | | | | | | | | | | | | | |
| | | | | |
| Beverages: 0.26% | | | | | | | | | | | | | | | | | | | | |
Other securities | | | | | | | | | | | | | | $ | 13,789,725 | | | | 0.26 | % |
| | | | | | | | | | | | | | | | | | | | |
| | | | | |
| Food & Staples Retailing: 0.15% | | | | | | | | | | | | | | | | | | | | |
Other securities | | | | | | | | | | | | | | | 7,948,054 | | | | 0.15 | |
| | | | | | | | | | | | | | | | | | | | |
| | | | | |
| Food Products: 0.63% | | | | | | | | | | | | | | | | | | | | |
Other securities | | | | | | | | | | | | | | | 32,710,454 | | | | 0.63 | |
| | | | | | | | | | | | | | | | | | | | |
| | | | | |
| Tobacco: 0.14% | | | | | | | | | | | | | | | | | | | | |
Other securities | | | | | | | | | | | | | | | 7,009,791 | | | | 0.14 | |
| | | | | | | | | | | | | | | | | | | | |
| | | | | |
Energy: 1.98% | | | | | | | | | | | | | | | | | | | | |
| | | | | |
| Energy Equipment & Services: 0.06% | | | | | | | | | | | | | | | | | | | | |
Other securities | | | | | | | | | | | | | | | 3,186,815 | | | | 0.06 | |
| | | | | | | | | | | | | | | | | | | | |
| | | | | |
| Oil, Gas & Consumable Fuels: 1.92% | | | | | | | | | | | | | | | | | | | | |
Other securities | | | | | | | | | | | | | | | 100,232,644 | | | | 1.92 | |
| | | | | | | | | | | | | | | | | | | | |
| | | | | |
Financials: 5.42% | | | | | | | | | | | | | | | | | | | | |
| | | | | |
| Banks: 1.85% | | | | | | | | | | | | | | | | | | | | |
Bank of America Corporation | | | 3.25 | % | | | 10-21-2027 | | | $ | 17,750,000 | | | | 16,951,747 | | | | 0.32 | |
Other securities | | | | | | | | | | | | | | | 79,753,520 | | | | 1.53 | |
| | | | | |
| | | | | | | | | | | | | | | 96,705,267 | | | | 1.85 | |
| | | | | | | | | | | | | | | | | | | | |
| | | | | |
| Capital Markets: 1.49% | | | | | | | | | | | | | | | | | | | | |
Morgan Stanley | | | 2.63 | | | | 11-17-2021 | | | | 15,250,000 | | | | 15,073,405 | | | | 0.29 | |
Other securities | | | | | | | | | | | | | | | 62,346,176 | | | | 1.20 | |
| | | | | |
| | | | | | | | | | | | | | | 77,419,581 | | | | 1.49 | |
| | | | | | | | | | | | | | | | | | | | |
| | | | | |
| Consumer Finance: 0.98% | | | | | | | | | | | | | | | | | | | | |
Other securities | | | | | | | | | | | | | | | 51,170,711 | | | | 0.98 | |
| | | | | | | | | | | | | | | | | | | | |
| | | | | |
| Diversified Financial Services: 0.18% | | | | | | | | | | | | | | | | | | | | |
Other securities | | | | | | | | | | | | | | | 9,340,849 | | | | 0.18 | |
| | | | | | | | | | | | | | | | | | | | |
| | | | | |
| Insurance: 0.92% | | | | | | | | | | | | | | | | | | | | |
Other securities | | | | | | | | | | | | | | | 48,059,262 | | | | 0.92 | |
| | | | | | | | | | | | | | | | | | | | |
| | | | | |
Health Care: 1.37% | | | | | | | | | | | | | | | | | | | | |
| | | | | |
| Biotechnology: 0.67% | | | | | | | | | | | | | | | | | | | | |
Other securities | | | | | | | | | | | | | | | 34,688,992 | | | | 0.67 | |
| | | | | | | | | | | | | | | | | | | | |
| | | | | |
| Health Care Providers & Services: 0.15% | | | | | | | | | | | | | | | | | | | | |
Other securities | | | | | | | | | | | | | | | 7,647,661 | | | | 0.15 | |
| | | | | | | | | | | | | | | | | | | | |
| | | | | |
| Life Sciences Tools & Services: 0.10% | | | | | | | | | | | | | | | | | | | | |
Other securities | | | | | | | | | | | | | | | 5,433,610 | | | | 0.10 | |
| | | | | | | | | | | | | | | | | | | | |
The accompanying notes are an integral part of these financial statements.
| | | | | | |
| Summary portfolio of investments—November 30, 2016 (unaudited) | | Wells Fargo Income Funds | | | 27 | |
CORE BOND PORTFOLIO
| | | | | | | | | | | | | | | | | | | | |
| Security name | | | | | | | | | | | Value | | | Percent of
net assets | |
| | | | | |
| Pharmaceuticals: 0.45% | | | | | | | | | | | | | | | | | | | | |
Other securities | | | | | | | | | | | | | | $ | 23,649,922 | | | | 0.45 | % |
| | | | | | | | | | | | | | | | | | | | |
| | | | | |
Industrials: 1.11% | | | | | | | | | | | | | | | | | | | | |
| | | | | |
| Aerospace & Defense: 0.51% | | | | | | | | | | | | | | | | | | | | |
Other securities | | | | | | | | | | | | | | | 26,595,110 | | | | 0.51 | |
| | | | | | | | | | | | | | | | | | | | |
| | | | | |
| Air Freight & Logistics: 0.10% | | | | | | | | | | | | | | | | | | | | |
Other securities | | | | | | | | | | | | | | | 5,034,524 | | | | 0.10 | |
| | | | | | | | | | | | | | | | | | | | |
| | | | | |
| Construction & Engineering: 0.05% | | | | | | | | | | | | | | | | | | | | |
Other securities | | | | | | | | | | | | | | | 2,424,627 | | | | 0.05 | |
| | | | | | | | | | | | | | | | | | | | |
| | | | | |
| Machinery: 0.08% | | | | | | | | | | | | | | | | | | | | |
Other securities | | | | | | | | | | | | | | | 4,410,650 | | | | 0.08 | |
| | | | | | | | | | | | | | | | | | | | |
| | | | | |
| Road & Rail: 0.37% | | | | | | | | | | | | | | | | | | | | |
Other securities | | | | | | | | | | | | | | | 19,583,744 | | | | 0.37 | |
| | | | | | | | | | | | | | | | | | | | |
| | | | | |
Information Technology: 2.28% | | | | | | | | | | | | | | | | | | | | |
| | | | | |
| Communications Equipment: 0.64% | | | | | | | | | | | | | | | | | | | | |
Other securities | | | | | | | | | | | | | | | 33,600,473 | | | | 0.64 | |
| | | | | | | | | | | | | | | | | | | | |
| | | | | |
| IT Services: 0.31% | | | | | | | | | | | | | | | | | | | | |
Other securities | | | | | | | | | | | | | | | 16,013,261 | | | | 0.31 | |
| | | | | | | | | | | | | | | | | | | | |
| | | | | |
| Semiconductors & Semiconductor Equipment: 0.36% | | | | | | | | | | | | | | | | | | | | |
Other securities | | | | | | | | | | | | | | | 18,933,701 | | | | 0.36 | |
| | | | | | | | | | | | | | | | | | | | |
| | | | | |
| Software: 0.69% | | | | | | | | | | | | | | | | | | | | |
Other securities | | | | | | | | | | | | | | | 35,714,356 | | | | 0.69 | |
| | | | | | | | | | | | | | | | | | | | |
| | | | | |
| Technology Hardware, Storage & Peripherals: 0.28% | | | | | | | | | | | | | | | | | | | | |
Other securities | | | | | | | | | | | | | | | 14,574,189 | | | | 0.28 | |
| | | | | | | | | | | | | | | | | | | | |
| | | | | |
Materials: 0.38% | | | | | | | | | | | | | | | | | | | | |
| | | | | |
| Chemicals: 0.26% | | | | | | | | | | | | | | | | | | | | |
Other securities | | | | | | | | | | | | | | | 13,555,869 | | | | 0.26 | |
| | | | | | | | | | | | | | | | | | | | |
| | | | | |
| Containers & Packaging: 0.08% | | | | | | | | | | | | | | | | | | | | |
Other securities | | | | | | | | | | | | | | | 4,416,591 | | | | 0.08 | |
| | | | | | | | | | | | | | | | | | | | |
| | | | | |
| Metals & Mining: 0.04% | | | | | | | | | | | | | | | | | | | | |
Other securities | | | | | | | | | | | | | | | 1,958,873 | | | | 0.04 | |
| | | | | | | | | | | | | | | | | | | | |
| | | | | |
Real Estate: 0.58% | | | | | | | | | | | | | | | | | | | | |
| | | | | |
| Equity REITs: 0.45% | | | | | | | | | | | | | | | | | | | | |
Other securities | | | | | | | | | | | | | | | 23,783,659 | | | | 0.45 | |
| | | | | | | | | | | | | | | | | | | | |
The accompanying notes are an integral part of these financial statements.
| | | | |
| 28 | | Wells Fargo Income Funds | | Summary portfolio of investments—November 30, 2016 (unaudited) |
CORE BOND PORTFOLIO
| | | | | | | | | | | | | | | | | | | | |
| Security name | | | | | | | | | | | Value | | | Percent of
net assets | |
| | | | | |
| Real Estate Management & Development: 0.13% | | | | | | | | | | | | | | | | | | | | |
Other securities | | | | | | | | | | | | | | $ | 6,606,640 | | | | 0.13 | % |
| | | | | | | | | | | | | | | | | | | | |
| | | | | |
Telecommunication Services: 1.38% | | | | | | | | | | | | | | | | | | | | |
| | | | | |
| Diversified Telecommunication Services: 1.26% | | | | | | | | | | | | | | | | | | | | |
Other securities | | | | | | | | | | | | | | | 65,888,791 | | | | 1.26 | |
| | | | | | | | | | | | | | | | | | | | |
| | | | | |
| Wireless Telecommunication Services: 0.12% | | | | | | | | | | | | | | | | | | | | |
Other securities | | | | | | | | | | | | | | | 6,305,725 | | | | 0.12 | |
| | | | | | | | | | | | | | | | | | | | |
| | | | | |
Utilities: 1.86% | | | | | | | | | | | | | | | | | | | | |
| | | | | |
| Electric Utilities: 1.25% | | | | | | | | | | | | | | | | | | | | |
Other securities | | | | | | | | | | | | | | | 65,133,988 | | | | 1.25 | |
| | | | | | | | | | | | | | | | | | | | |
| | | | | |
| Gas Utilities: 0.09% | | | | | | | | | | | | | | | | | | | | |
Other securities | | | | | | | | | | | | | | | 4,755,915 | | | | 0.09 | |
| | | | | | | | | | | | | | | | | | | | |
| | | | | |
Independent Power & Renewable Electricity
Producers: 0.07% | | | | | | | | | | | | | | | | | | | | |
Other securities | | | | | | | | | | | | | | | 3,744,067 | | | | 0.07 | |
| | | | | | | | | | | | | | | | | | | | |
| | | | | |
| Multi-Utilities: 0.45% | | | | | | | | | | | | | | | | | | | | |
Other securities | | | | | | | | | | | | | | | 23,452,864 | | | | 0.45 | |
| | | | | | | | | | | | | | | | | | | | |
| | | | | |
Total Corporate Bonds and Notes (Cost $990,186,671) | | | | | | | | | | | | | | | 971,299,342 | | | | 18.61 | |
| | | | | | | | | | | | | | | | | | | | |
| | | | | |
Government Agency Debt: 0.39% | | | | | | | | | | | | | | | | | | | | |
Other securities | | | | | | | | | | | | | | | 20,555,046 | | | | 0.39 | |
| | | | | | | | | |
| | | | | |
Total Government Agency Debt (Cost $21,113,777) | | | | | | | | | | | | | | | 20,555,046 | | | | 0.39 | |
| | | | | | | | | | | | | | | | | | | | |
| | | | | |
Municipal Obligations: 0.76% | | | | | | | | | | | | | | | | | | | | |
| | | | | |
| California: 0.23% | | | | | | | | | | | | | | | | | | | | |
Other securities | | | | | | | | | | | | | | | 12,140,785 | | | | 0.23 | |
| | | | | | | | | | | | | | | | | | | | |
| | | | | |
| Nevada: 0.12% | | | | | | | | | | | | | | | | | | | | |
Other securities | | | | | | | | | | | | | | | 6,354,442 | | | | 0.12 | |
| | | | | | | | | | | | | | | | | | | | |
| | | | | |
| New Jersey: 0.11% | | | | | | | | | | | | | | | | | | | | |
Other securities | | | | | | | | | | | | | | | 5,526,055 | | | | 0.11 | |
| | | | | | | | | | | | | | | | | | | | |
| | | | | |
| New York: 0.13% | | | | | | | | | | | | | | | | | | | | |
Other securities | | | | | | | | | | | | | | | 6,614,413 | | | | 0.13 | |
| | | | | | | | | | | | | | | | | | | | |
| | | | | |
| Ohio: 0.04% | | | | | | | | | | | | | | | | | | | | |
Other securities | | | | | | | | | | | | | | | 1,933,085 | | | | 0.04 | |
| | | | | | | | | | | | | | | | | | | | |
| | | | | |
| Texas: 0.13% | | | | | | | | | | | | | | | | | | | | |
Other securities | | | | | | | | | | | | | | | 6,929,864 | | | | 0.13 | |
| | | | | | | | | | | | | | | | | | | | |
| | | | | |
Total Municipal Obligations (Cost $34,858,655) | | | | | | | | | | | | | | | 39,498,644 | | | | 0.76 | |
| | | | | | | | | | | | | | | | | | | | |
The accompanying notes are an integral part of these financial statements.
| | | | | | |
| Summary portfolio of investments—November 30, 2016 (unaudited) | | Wells Fargo Income Funds | | | 29 | |
CORE BOND PORTFOLIO
| | | | | | | | | | | | | | | | | | | | |
| Security name | | Interest rate | | | Maturity date | | | Principal | | | Value | | | Percent of
net assets | |
| | |
Non-Agency Mortgage-Backed Securities: 5.49% | | | | | | | | | |
SMB Private Education Loan Trust Series 2016-C Class A2A 144A | | | 2.34 | % | | | 9-15-2034 | | | $ | 14,672,000 | | | $ | 14,497,770 | | | | 0.28 | % |
Verizon Owner Trust Series 2016-2A Class A 144A | | | 1.68 | | | | 5-20-2021 | | | | 13,972,000 | | | | 13,948,459 | | | | 0.27 | |
Other securities | | | | | | | | | | | | | | | 258,081,189 | | | | 4.94 | |
| | | |
Total Non-Agency Mortgage-Backed Securities (Cost $289,024,528) | | | | | | | | 286,527,418 | | | | 5.49 | |
| | | | | | | | | | | | | | | | | | | | |
| | | | | |
U.S. Treasury Securities: 34.66% | | | | | | | | | | | | | | | | | | | | |
U.S. Treasury Bond « | | | 2.25 | | | | 8-15-2046 | | | | 73,660,000 | | | | 62,038,441 | | | | 1.19 | |
U.S. Treasury Bond | | | 2.50 | | | | 2-15-2046 | | | | 49,355,000 | | | | 43,983,794 | | | | 0.84 | |
U.S. Treasury Bond | | | 2.50 | | | | 5-15-2046 | | | | 38,269,000 | | | | 34,089,298 | | | | 0.65 | |
U.S. Treasury Bond | | | 2.88 | | | | 11-15-2046 | | | | 26,020,000 | | | | 25,174,350 | | | | 0.48 | |
U.S. Treasury Bond | | | 3.00 | | | | 11-15-2045 | | | | 27,871,000 | | | | 27,579,219 | | | | 0.53 | |
U.S. Treasury Note | | | 0.75 | | | | 7-31-2018 | | | | 87,096,000 | | | | 86,629,862 | | | | 1.66 | |
U.S. Treasury Note ## | | | 0.75 | | | | 9-30-2018 | | | | 279,439,000 | | | | 277,616,219 | | | | 5.32 | |
U.S. Treasury Note | | | 0.75-2.00 | | | | 10-31-2018 to 11-30-2023 | | | | 29,024,000 | | | | 28,771,763 | | | | 0.55 | |
U.S. Treasury Note | | | 0.88 | | | | 7-15-2018 | | | | 27,343,000 | | | | 27,266,111 | | | | 0.52 | |
U.S. Treasury Note | | | 1.00 | | | | 11-30-2018 | | | | 42,967,000 | | | | 42,862,934 | | | | 0.82 | |
U.S. Treasury Note | | | 1.00 | | | | 10-15-2019 | | | | 168,848,000 | | | | 167,001,141 | | | | 3.20 | |
U.S. Treasury Note | | | 1.00 | | | | 11-15-2019 | | | | 150,115,000 | | | | 148,379,370 | | | | 2.84 | |
U.S. Treasury Note | | | 1.13 | | | | 6-15-2018 | | | | 17,877,000 | | | | 17,897,952 | | | | 0.34 | |
U.S. Treasury Note | | | 1.13 | | | | 6-30-2021 | | | | 51,083,000 | | | | 49,488,648 | | | | 0.95 | |
U.S. Treasury Note | | | 1.13 | | | | 7-31-2021 | | | | 16,549,000 | | | | 16,013,739 | | | | 0.31 | |
U.S. Treasury Note | | | 1.13 | | | | 9-30-2021 | | | | 61,169,000 | | | | 59,071,087 | | | | 1.13 | |
U.S. Treasury Note | | | 1.25 | | | | 12-15-2018 | | | | 23,639,000 | | | | 23,687,933 | | | | 0.45 | |
U.S. Treasury Note | | | 1.25 | | | | 10-31-2021 | | | | 43,614,000 | | | | 42,336,241 | | | | 0.81 | |
U.S. Treasury Note | | | 1.38 | | | | 2-29-2020 | | | | 16,496,000 | | | | 16,426,403 | | | | 0.31 | |
U.S. Treasury Note | | | 1.38 | | | | 1-31-2021 | | | | 74,478,000 | | | | 73,325,900 | | | | 1.41 | |
U.S. Treasury Note | | | 1.38 | | | | 4-30-2021 | | | | 55,396,000 | | | | 54,383,306 | | | | 1.04 | |
U.S. Treasury Note « | | | 1.50 | | | | 8-15-2026 | | | | 172,381,000 | | | | 158,933,903 | | | | 3.05 | |
U.S. Treasury Note | | | 1.63 | | | | 5-15-2026 | | | | 6,515,000 | | | | 6,089,492 | | | | 0.12 | |
U.S. Treasury Note | | | 1.75 | | | | 11-30-2021 | | | | 44,442,000 | | | | 44,235,434 | | | | 0.85 | |
U.S. Treasury Note | | | 2.00 | | | | 8-31-2021 | | | | 33,853,000 | | | | 34,032,827 | | | | 0.65 | |
U.S. Treasury Note | | | 2.00 | | | | 10-31-2021 | | | | 47,323,000 | | | | 47,530,038 | | | | 0.91 | |
U.S. Treasury Note | | | 2.00 | | | | 11-15-2026 | | | | 28,004,000 | | | | 27,046,823 | | | | 0.52 | |
U.S. Treasury Note ## | | | 2.13 | | | | 8-15-2021 | | | | 149,754,000 | | | | 151,427,052 | | | | 2.90 | |
U.S. Treasury Note | | | 2.13 | | | | 9-30-2021 | | | | 15,782,000 | | | | 15,948,453 | | | | 0.31 | |
| | | | |
Total U.S. Treasury Securities (Cost $1,852,142,157) | | | | | | | | | | | | 1,809,267,733 | | | | 34.66 | |
| | | | | | | | | | | | | | | | | | | | |
| | | | | |
Yankee Corporate Bonds and Notes: 6.05% | | | | | | | | | | | | | | | | | | | | |
| | | | | |
Consumer Discretionary: 0.08% | | | | | | | | | | | | | | | | | | | | |
| | | | | |
| Media: 0.08% | | | | | | | | | | | | | | | | | | | | |
Other securities | | | | | | | | | | | | | | | 4,062,162 | | | | 0.08 | |
| | | | | | | | | | | | | | | | | | | | |
| | | | | |
Energy: 0.85% | | | | | | | | | | | | | | | | | | | | |
| | | | | |
| Oil, Gas & Consumable Fuels: 0.85% | | | | | | | | | | | | | | | | | | | | |
Other securities | | | | | | | | | | | | | | | 44,580,982 | | | | 0.85 | |
| | | | | | | | | | | | | | | | | | | | |
The accompanying notes are an integral part of these financial statements.
| | | | |
| 30 | | Wells Fargo Income Funds | | Summary portfolio of investments—November 30, 2016 (unaudited) |
CORE BOND PORTFOLIO
| | | | | | | | | | | | | | | | | | | | |
| Security name | | Interest rate | | | Maturity date | | | Principal | | | Value | | | Percent of
net assets | |
| | | | | |
Financials: 3.92% | | | | | | | | | | | | | | | | | | | | |
| | | | | |
| Banks: 2.56% | | | | | | | | | | | | | | | | | | | | |
HSBC Holdings plc | | | 2.65 | % | | | 1-5-2022 | | | $ | 13,920,000 | | | $ | 13,542,587 | | | | 0.26 | % |
KFW | | | 1.00 | | | | 7-15-2019 | | | | 28,907,000 | | | | 28,466,226 | | | | 0.54 | |
Other securities | | | | | | | | | | | | | | | 91,792,637 | | | | 1.76 | |
| | | | | |
| | | | | | | | | | | | | | | 133,801,450 | | | | 2.56 | |
| | | | | | | | | | | | | | | | | | | | |
| | | | | |
| Capital Markets: 0.25% | | | | | | | | | | | | | | | | | | | | |
Other securities | | | | | | | | | | | | | | | 12,994,394 | | | | 0.25 | |
| | | | | | | | | | | | | | | | | | | | |
| | | | | |
| Diversified Financial Services: 0.98% | | | | | | | | | | | | | | | | | | | | |
Other securities | | | | | | | | | | | | | | | 51,217,702 | | | | 0.98 | |
| | | | | | | | | | | | | | | | | | | | |
| | | | | |
| Insurance: 0.02% | | | | | | | | | | | | | | | | | | | | |
Other securities | | | | | | | | | | | | | | | 924,177 | | | | 0.02 | |
| | | | | | | | | | | | | | | | | | | | |
| | | | | |
| Thrifts & Mortgage Finance: 0.11% | | | | | | | | | | | | | | | | | | | | |
Other securities | | | | | | | | | | | | | | | 5,698,968 | | | | 0.11 | |
| | | | | | | | | | | | | | | | | | | | |
| | | | | |
Health Care: 0.65% | | | | | | | | | | | | | | | | | | | | |
| | | | | |
| Pharmaceuticals: 0.65% | | | | | | | | | | | | | | | | | | | | |
Other securities | | | | | | | | | | | | | | | 33,764,288 | | | | 0.65 | |
| | | | | | | | | | | | | | | | | | | | |
| | | | | |
Industrials: 0.18% | | | | | | | | | | | | | | | | | | | | |
| | | | | |
| Chemicals: 0.18% | | | | | | | | | | | | | | | | | | | | |
Other securities | | | | | | | | | | | | | | | 9,187,406 | | | | 0.18 | |
| | | | | | | | | | | | | | | | | | | | |
| | | | | |
Materials: 0.13% | | | | | | | | | | | | | | | | | | | | |
| | | | | |
| Metals & Mining: 0.13% | | | | | | | | | | | | | | | | | | | | |
Other securities | | | | | | | | | | | | | | | 6,541,034 | | | | 0.13 | |
| | | | | | | | | | | | | | | | | | | | |
| | | | | |
Utilities: 0.24% | | | | | | | | | | | | | | | | | | | | |
| | | | | |
| Electric Utilities: 0.24% | | | | | | | | | | | | | | | | | | | | |
Other securities | | | | | | | | | | | | | | | 12,785,354 | | | | 0.24 | |
| | | | | | | | | | | | | | | | | | | | |
| | | | |
Total Yankee Corporate Bonds and Notes (Cost $324,477,592) | | | | | | | | | | | | 315,557,917 | | | | 6.05 | |
| | | | | | | | | | | | | | | | | | | | |
| | | | | |
Yankee Government Bonds: 1.49% | | | | | | | | | | | | | | | | | | | | |
Other securities | | | | | | | | | | | | | | | 77,693,478 | | | | 1.49 | |
| | | | | | | | | | | | | | | | | | | | |
| | | | |
Total Yankee Government Bonds (Cost $80,078,070) | | | | | | | | | | | | 77,693,478 | | | | 1.49 | |
| | | | | | | | | | | | | | | | | | | | |
| | | | | |
| | | Yield | | | | | | Shares | | | | | | | |
| Short-Term Investments: 7.06% | | | | | | | | | | | | | | | | | | | | |
| | | | | |
| Investment Companies: 7.06% | | | | | | | | | | | | | | | | | | | | |
Securities Lending Cash Investment LLC (l)(r)(u) | | | 0.65 | | | | | | | | 230,736,112 | | | | 230,759,186 | | | | 4.42 | |
Wells Fargo Government Money Market Fund Select Class (l)(u)## | | | 0.31 | | | | | | | | 137,895,059 | | | | 137,895,059 | | | | 2.64 | |
| | | |
Total Short-Term Investments (Cost $368,654,047) | | | | | | | | 368,654,245 | | | | 7.06 | |
| | | | | | | | | | | | | | | | | | | | |
| | | | |
| Total investments in securities (Cost $6,049,678,602) * | | | | | | | | | | | | 5,960,061,309 | | | | 114.19 | % |
Other assets and liabilities, net | | | | (740,715,159 | ) | | | (14.19 | ) |
| | | | | | | | | | | | | | | | | | | | |
| Total net assets | | | $ | 5,219,346,150 | | | | 100.00 | % |
| | | | | | | | | | | | | | | | | | | | |
The accompanying notes are an integral part of these financial statements.
| | | | | | |
| Summary portfolio of investments—November 30, 2016 (unaudited) | | Wells Fargo Income Funds | | | 31 | |
CORE BOND PORTFOLIO
| %% | Security issued on a when-issued basis |
| 144A | The security may be resold in transactions exempt from registration, normally to qualified institutional buyers, pursuant to Rule 144A under the Securities Act of 1933. |
| « | All or a portion of this security is on loan. |
| ## | All or a portion of this security has been segregated for when-issued securities. |
| (l) | The issuer of the security is an affiliated person of the Portfolio as defined in the Investment Company Act of 1940. |
| (r) | The investment is a non-registered investment vehicle purchased with cash collateral received from securities on loan. |
| (u) | The rate represents the 7-day annualized yield at period end. |
| * | Cost for federal income tax purposes is $6,074,405,459 and unrealized gains (losses) consists of: |
| | | | |
Gross unrealized gains | | $ | 15,025,520 | |
Gross unrealized losses | | | (129,369,670 | ) |
| | | | |
Net unrealized losses | | $ | (114,344,150 | ) |
The accompanying notes are an integral part of these financial statements.
| | | | |
| 32 | | Wells Fargo Income Funds | | Portfolios of investments—November 30, 2016 (unaudited) |
REAL RETURN PORTFOLIO
| | | | | | | | | | | | | | | | |
| Security name | | | | | | | | Shares | | | Value | |
| | | | | | | | | | | | | | | | |
| | | | |
Common Stocks: 14.12% | | | | | | | | | | | | | | | | |
| | | | |
Consumer Staples: 3.47% | | | | | | | | | | | | | | | | |
| | | | |
| Beverages: 0.28% | | | | | | | | | | | | | | | | |
The Coca-Cola Company | | | | | | | | | | | 5,100 | | | $ | 205,785 | |
| | | | | | | | | | | | | | | | |
| | | | |
| Food & Staples Retailing: 0.67% | | | | | | | | | | | | | | | | |
The Kroger Company | | | | | | | | | | | 5,132 | | | | 165,764 | |
Wal-Mart Stores Incorporated | | | | | | | | | | | 1,718 | | | | 120,999 | |
Walgreens Boots Alliance Incorporated | | | | | | | | | | | 2,326 | | | | 197,082 | |
| | | | |
| | | | | | | | | | | | | | | 483,845 | |
| | | | | | | | | | | | | | | | |
| | | | |
| Food Products: 1.09% | | | | | | | | | | | | | | | | |
Biostime International Holdings Limited Ǡ | | | | | | | | | | | 79,000 | | | | 258,190 | |
JBS SA | | | | | | | | | | | 52,100 | | | | 150,351 | |
Marine Harvest ASA | | | | | | | | | | | 4,555 | | | | 81,912 | |
Mead Johnson Nutrition Company | | | | | | | | | | | 1,122 | | | | 80,885 | |
Mondelez International Incorporated Class A | | | | | | | | | | | 2,537 | | | | 104,626 | |
The Hershey Company | | | | | | | | | | | 476 | | | | 46,001 | |
The Kraft Heinz Company | | | | | | | | | | | 889 | | | | 72,587 | |
| | | | |
| | | | | | | | | | | | | | | 794,552 | |
| | | | | | | | | | | | | | | | |
| | | | |
| Household Products: 1.11% | | | | | | | | | | | | | | | | |
Church & Dwight Company Incorporated | | | | | | | | | | | 2,528 | | | | 110,701 | |
Reckitt Benckiser Group plc | | | | | | | | | | | 4,626 | | | | 391,446 | |
The Clorox Company | | | | | | | | | | | 502 | | | | 58,011 | |
The Procter & Gamble Company | | | | | | | | | | | 3,032 | | | | 250,019 | |
| | | | |
| | | | | | | | | | | | | | | 810,177 | |
| | | | | | | | | | | | | | | | |
| | | | |
| Personal Products: 0.08% | | | | | | | | | | | | | | | | |
The Estee Lauder Companies Incorporated Class A | | | | | | | | | | | 771 | | | | 59,907 | |
| | | | | | | | | | | | | | | | |
| | | | |
| Tobacco: 0.24% | | | | | | | | | | | | | | | | |
Philip Morris International | | | | | | | | | | | 1,965 | | | | 173,470 | |
| | | | | | | | | | | | | | | | |
| | | | |
Energy: 3.70% | | | | | | | | | | | | | | | | |
| | | | |
| Energy Equipment & Services: 0.60% | | | | | | | | | | | | | | | | |
AMEC Foster Wheeler plc | | | | | | | | | | | 27,787 | | | | 151,584 | |
Halliburton Company | | | | | | | | | | | 3,763 | | | | 199,778 | |
Schlumberger Limited | | | | | | | | | | | 1,073 | | | | 90,186 | |
| | | | |
| | | | | | | | | | | | | | | 441,548 | |
| | | | | | | | | | | | | | | | |
| | | | |
| Oil, Gas & Consumable Fuels: 3.10% | | | | | | | | | | | | | | | | |
Anadarko Petroleum Corporation | | | | | | | | | | | 2,011 | | | | 139,061 | |
BP plc | | | | | | | | | | | 106,870 | | | | 614,357 | |
Chevron Corporation | | | | | | | | | | | 3,127 | | | | 348,848 | |
Cimarex Energy Company | | | | | | | | | | | 1,073 | | | | 147,945 | |
Eni SpA | | | | | | | | | | | 32,056 | | | | 446,425 | |
EOG Resources Incorporated | | | | | | | | | | | 1,815 | | | | 186,074 | |
Occidental Petroleum Corporation | | | | | | | | | | | 2,104 | | | | 150,141 | |
Phillips 66 Company | | | | | | | | | | | 1,119 | | | | 92,967 | |
Pioneer Natural Resources Company | | | | | | | | | | | 699 | | | | 133,537 | |
| | | | |
| | | | | | | | | | | | | | | 2,259,355 | |
| | | | | | | | | | | | | | | | |
The accompanying notes are an integral part of these financial statements.
| | | | | | |
| Portfolio of investments—November 30, 2016 (unaudited) | | Wells Fargo Income Funds | | | 33 | |
REAL RETURN PORTFOLIO
| | | | | | | | | | | | | | | | |
| Security name | | | | | | | | Shares | | | Value | |
| | | | | | | | | | | | | | | | |
| | | | |
Materials: 3.66% | | | | | | | | | | | | | | | | |
| | | | |
| Chemicals: 0.78% | | | | | | | | | | | | | | | | |
Axalta Coating Systems Limited † | | | | | | | | | | | 1,809 | | | $ | 47,794 | |
Dow Chemical Company | | | | | | | | | | | 2,028 | | | | 113,000 | |
Ecolab Incorporated | | | | | | | | | | | 506 | | | | 59,065 | |
International Flavors & Fragrances Incorporated | | | | | | | | | | | 493 | | | | 59,678 | |
LyondellBasell Industries NV Class A | | | | | | | | | | | 1,018 | | | | 91,946 | |
PolyOne Corporation | | | | | | | | | | | 1,895 | | | | 62,478 | |
PPG Industries Incorporated | | | | | | | | | | | 788 | | | | 75,593 | |
Praxair Incorporated | | | | | | | | | | | 500 | | | | 60,150 | |
| | | | |
| | | | | | | | | | | | | | | 569,704 | |
| | | | | | | | | | | | | | | | |
| | | | |
| Construction Materials: 0.09% | | | | | | | | | | | | | | | | |
Martin Marietta Materials Incorporated | | | | | | | | | | | 309 | | | | 67,810 | |
| | | | | | | | | | | | | | | | |
| | | | |
| Containers & Packaging: 0.10% | | | | | | | | | | | | | | | | |
Crown Holdings Incorporated † | | | | | | | | | | | 1,375 | | | | 74,786 | |
| | | | | | | | | | | | | | | | |
| | | | |
| Metals & Mining: 2.69% | | | | | | | | | | | | | | | | |
Agnico-Eagle Mines Limited-U.S. Exchange Traded Shares | | | | | | | | | | | 3,600 | | | | 147,780 | |
Barrick Gold Corporation | | | | | | | | | | | 5,000 | | | | 75,100 | |
Detour Gold Corporation † | | | | | | | | | | | 9,800 | | | | 124,898 | |
Fresnillo plc | | | | | | | | | | | 6,800 | | | | 102,098 | |
Goldcorp Incorporated-U.S. Exchange Traded Shares | | | | | | | | | | | 5,171 | | | | 68,205 | |
Kinross Gold Corporation † | | | | | | | | | | | 20,000 | | | | 66,106 | |
Lundin Mining Corporation † | | | | | | | | | | | 53,049 | | | | 260,249 | |
Newmont Mining Corporation | | | | | | | | | | | 7,600 | | | | 246,544 | |
Randgold Resources Limited ADR | | | | | | | | | | | 3,050 | | | | 219,234 | |
Royal Gold Incorporated | | | | | | | | | | | 3,759 | | | | 261,777 | |
Silver Wheaton Corporation-U.S. Exchange Traded Shares | | | | | | | | | | | 10,000 | | | | 182,300 | |
Steel Dynamics Incorporated | | | | | | | | | | | 1,981 | | | | 70,286 | |
Tahoe Resources Incorporated | | | | | | | | | | | 14,000 | | | | 134,549 | |
| | | | |
| | | | | | | | | | | | | | | 1,959,126 | |
| | | | | | | | | | | | | | | | |
| | | | |
Real Estate: 3.29% | | | | | | | | | | | | | | | | |
| | | | |
| Equity REITs: 3.29% | | | | | | | | | | | | | | | | |
American Homes 4 Rent Class A | | | | | | | | | | | 3,633 | | | | 76,547 | |
American Tower Corporation | | | | | | | | | | | 2,796 | | | | 285,947 | |
AvalonBay Communities Incorporated | | | | | | | | | | | 1,195 | | | | 196,566 | |
Boston Properties Incorporated | | | | | | | | | | | 1,885 | | | | 233,514 | |
Camden Property Trust | | | | | | | | | | | 1,746 | | | | 137,428 | |
Equinix Incorporated | | | | | | | | | | | 439 | | | | 148,716 | |
Essex Property Trust Incorporated | | | | | | | | | | | 472 | | | | 101,914 | |
General Growth Properties Incorporated | | | | | | | | | | | 6,912 | | | | 175,150 | |
Hersha Hospitality Trust | | | | | | | | | | | 1,971 | | | | 39,755 | |
Host Hotels & Resorts Incorporated | | | | | | | | | | | 6,076 | | | | 108,396 | |
Mid-America Apartment Communities Incorporated | | | | | | | | | | | 679 | | | | 62,217 | |
Physicians Realty Trust | | | | | | | | | | | 12,345 | | | | 223,691 | |
Prologis Incorporated | | | | | | | | | | | 3,416 | | | | 173,874 | |
Public Storage Incorporated | | | | | | | | | | | 568 | | | | 118,882 | |
The accompanying notes are an integral part of these financial statements.
| | | | |
| 34 | | Wells Fargo Income Funds | | Portfolios of investments—November 30, 2016 (unaudited) |
REAL RETURN PORTFOLIO
| | | | | | | | | | | | | | | | |
| Security name | | | | | | | | Shares | | | Value | |
| | | | | | | | | | | | | | | | |
| | | | |
| Equity REITs (continued) | | | | | | | | | | | | | | | | |
Simon Property Group Incorporated | | | | | | | | | | | 1,018 | | | $ | 182,884 | |
Ventas Incorporated | | | | | | | | | | | 2,228 | | | | 134,616 | |
| | | | |
| | | | | | | | | | | | | | | 2,400,097 | |
| | | | | | | | | | | | | | | | |
| | | | |
Total Common Stocks (Cost $9,929,361) | | | | | | | | | | | | | | | 10,300,162 | |
| | | | | | | | | | | | | | | | |
| | | Interest rate | | | Maturity date | | | Principal | | | | |
| | | | |
Corporate Bonds and Notes: 10.01% | | | | | | | | | | | | | | | | |
| | | | |
Consumer Discretionary: 3.32% | | | | | | | | | | | | | | | | |
| | | | |
| Auto Components: 0.33% | | | | | | | | | | | | | | | | |
American Axle & Manufacturing Incorporated « | | | 6.25 | % | | | 3-15-2021 | | | $ | 100,000 | | | | 102,000 | |
American Axle & Manufacturing Incorporated | | | 7.75 | | | | 11-15-2019 | | | | 25,000 | | | | 27,688 | |
Cooper Tire & Rubber Company (i) | | | 8.00 | | | | 12-15-2019 | | | | 20,000 | | | | 22,250 | |
Goodyear Tire & Rubber Company | | | 7.00 | | | | 5-15-2022 | | | | 85,000 | | | | 89,144 | |
| | | | |
| | | | | | | | | | | | | | | 241,082 | |
| | | | | | | | | | | | | | | | |
| | | | |
| Diversified Consumer Services: 0.14% | | | | | | | | | | | | | | | | |
Service Corporation International | | | 5.38 | | | | 1-15-2022 | | | | 100,000 | | | | 103,500 | |
| | | | | | | | | | | | | | | | |
| | | | |
| Hotels, Restaurants & Leisure: 0.58% | | | | | | | | | | | | | | | | |
GLP Capital LP/GLP Financing II Incorporated | | | 4.88 | | | | 11-1-2020 | | | | 75,000 | | | | 78,750 | |
Hilton Worldwide Finance LLC | | | 5.63 | | | | 10-15-2021 | | | | 100,000 | | | | 103,248 | |
MGM Resorts International | | | 8.63 | | | | 2-1-2019 | | | | 100,000 | | | | 111,000 | |
NCL Corporation Limited 144A | | | 5.25 | | | | 11-15-2019 | | | | 125,000 | | | | 126,875 | |
| | | | |
| | | | | | | | | | | | | | | 419,873 | |
| | | | | | | | | | | | | | | | |
| | | | |
| Household Durables: 0.35% | | | | | | | | | | | | | | | | |
CalAtlantic Group Incorporated | | | 6.63 | | | | 5-1-2020 | | | | 15,000 | | | | 16,463 | |
DR Horton Incorporated | | | 3.63 | | | | 2-15-2018 | | | | 135,000 | | | | 136,688 | |
Lennar Corporation | | | 4.50 | | | | 6-15-2019 | | | | 100,000 | | | | 103,000 | |
| | | | |
| | | | | | | | | | | | | | | 256,151 | |
| | | | | | | | | | | | | | | | |
| | | | |
| Media: 1.17% | | | | | | | | | | | | | | | | |
CCO Holdings LLC | | | 6.63 | | | | 1-31-2022 | | | | 125,000 | | | | 129,844 | |
CSC Holdings LLC | | | 7.63 | | | | 7-15-2018 | | | | 75,000 | | | | 79,500 | |
DISH DBS Corporation | | | 4.25 | | | | 4-1-2018 | | | | 130,000 | | | | 132,600 | |
DISH DBS Corporation | | | 7.88 | | | | 9-1-2019 | | | | 25,000 | | | | 27,688 | |
LIN Television Corporation | | | 6.38 | | | | 1-15-2021 | | | | 40,000 | | | | 41,400 | |
Mediacom LLC/Mediacom Capital Corporation | | | 7.25 | | | | 2-15-2022 | | | | 70,000 | | | | 72,450 | |
National CineMedia LLC | | | 6.00 | | | | 4-15-2022 | | | | 100,000 | | | | 103,000 | |
Nexstar Broadcasting Group Incorporated | | | 6.88 | | | | 11-15-2020 | | | | 75,000 | | | | 77,250 | |
Sinclair Television Group Incorporated | | | 6.13 | | | | 10-1-2022 | | | | 100,000 | | | | 103,750 | |
TEGNA Incorporated | | | 5.13 | | | | 10-15-2019 | | | | 50,000 | | | | 51,267 | |
TEGNA Incorporated | | | 5.13 | | | | 7-15-2020 | | | | 30,000 | | | | 30,975 | |
| | | | |
| | | | | | | | | | | | | | | 849,724 | |
| | | | | | | | | | | | | | | | |
| | | | |
| Multiline Retail: 0.14% | | | | | | | | | | | | | | | | |
Dollar Tree Incorporated | | | 5.25 | | | | 3-1-2020 | | | | 100,000 | | | | 103,250 | |
| | | | | | | | | | | | | | | | |
The accompanying notes are an integral part of these financial statements.
| | | | | | |
| Portfolio of investments—November 30, 2016 (unaudited) | | Wells Fargo Income Funds | | | 35 | |
REAL RETURN PORTFOLIO
| | | | | | | | | | | | | | | | |
| Security name | | Interest rate | | | Maturity date | | | Principal | | | Value | |
| | | | |
| Specialty Retail: 0.36% | | | | | | | | | | | | | | | | |
Best Buy Company Incorporated | | | 5.00 | % | | | 8-1-2018 | | | $ | 100,000 | | | $ | 104,795 | |
International Game Technology | | | 7.50 | | | | 6-15-2019 | | | | 50,000 | | | | 54,625 | |
Sally Beauty Holdings Incorporated | | | 5.75 | | | | 6-1-2022 | | | | 100,000 | | | | 103,625 | |
| | | | |
| | | | | | | | | | | | | | | 263,045 | |
| | | | | | | | | | | | | | | | |
| | | | |
| Textiles, Apparel & Luxury Goods: 0.25% | | | | | | | | | | | | | | | | |
Levi Strauss & Company | | | 6.88 | | | | 5-1-2022 | | | | 75,000 | | | | 78,750 | |
The William Carter Company | | | 5.25 | | | | 8-15-2021 | | | | 100,000 | | | | 103,600 | |
| | | | |
| | | | | | | | | | | | | | | 182,350 | |
| | | | | | | | | | | | | | | | |
| | | | |
Consumer Staples: 0.70% | | | | | | | | | | | | | | | | |
| | | | |
| Beverages: 0.14% | | | | | | | | | | | | | | | | |
Cott Beverages Incorporated | | | 6.75 | | | | 1-1-2020 | | | | 100,000 | | | | 103,500 | |
| | | | | | | | | | | | | | | | |
| | | | |
| Food Products: 0.56% | | | | | | | | | | | | | | | | |
B&G Foods Incorporated | | | 4.63 | | | | 6-1-2021 | | | | 85,000 | | | | 86,700 | |
Pinnacle Foods Incorporated | | | 4.88 | | | | 5-1-2021 | | | | 100,000 | | | | 102,250 | |
Post Holdings Incorporated 144A | | | 6.75 | | | | 12-1-2021 | | | | 90,000 | | | | 95,850 | |
Smithfield Foods Incorporated | | | 7.75 | | | | 7-1-2017 | | | | 120,000 | | | | 123,660 | |
| | | | |
| | | | | | | | | | | | | | | 408,460 | |
| | | | | | | | | | | | | | | | |
| | | | |
Energy: 0.74% | | | | | | | | | | | | | | | | |
| | | | |
| Energy Equipment & Services: 0.17% | | | | | | | | | | | | | | | | |
NGPL PipeCo LLC 144A | | | 7.12 | | | | 12-15-2017 | | | | 120,000 | | | | 124,500 | |
| | | | | | | | | | | | | | | | |
| | | | |
| Oil, Gas & Consumable Fuels: 0.57% | | | | | | | | | | | | | | | | |
Crestwood Midstream Partners LP | | | 6.00 | | | | 12-15-2020 | | | | 30,000 | | | | 30,525 | |
Kinder Morgan Incorporated | | | 7.00 | | | | 6-15-2017 | | | | 60,000 | | | | 61,592 | |
Rockies Express Pipeline LLC 144A | | | 6.00 | | | | 1-15-2019 | | | | 125,000 | | | | 130,000 | |
Sabine Pass Liquefaction LLC | | | 5.63 | | | | 2-1-2021 | | | | 60,000 | | | | 63,750 | |
Tesoro Corporation | | | 4.25 | | | | 10-1-2017 | | | | 65,000 | | | | 66,056 | |
Tesoro Logistics LP | | | 5.88 | | | | 10-1-2020 | | | | 65,000 | | | | 67,106 | |
| | | | |
| | | | | | | | | | | | | | | 419,029 | |
| | | | | | | | | | | | | | | | |
| | | | |
Financials: 1.01% | | | | | | | | | | | | | | | | |
| | | | |
| Banks: 0.22% | | | | | | | | | | | | | | | | |
CIT Group Incorporated | | | 4.25 | | | | 8-15-2017 | | | | 105,000 | | | | 106,604 | |
CIT Group Incorporated | | | 5.25 | | | | 3-15-2018 | | | | 25,000 | | | | 25,856 | |
CIT Group Incorporated 144A | | | 5.50 | | | | 2-15-2019 | | | | 25,000 | | | | 26,391 | |
| | | | |
| | | | | | | | | | | | | | | 158,851 | |
| | | | | | | | | | | | | | | | |
| | | | |
| Consumer Finance: 0.79% | | | | | | | | | | | | | | | | |
Ally Financial Incorporated | | | 3.75 | | | | 11-18-2019 | | | | 65,000 | | | | 65,073 | |
Ally Financial Incorporated | | | 6.25 | | | | 12-1-2017 | | | | 60,000 | | | | 62,100 | |
Diamond 1 Finance Corporation 144A | | | 3.48 | | | | 6-1-2019 | | | | 40,000 | | | | 40,763 | |
General Motors Financial Company Incorporated | | | 3.25 | | | | 5-15-2018 | | | | 135,000 | | | | 136,331 | |
Navient Corporation | | | 4.63 | | | | 9-25-2017 | | | | 130,000 | | | | 131,950 | |
Toll Brothers Finance Corporation | | | 4.00 | | | | 12-31-2018 | | | | 135,000 | | | | 138,796 | |
| | | | |
| | | | | | | | | | | | | | | 575,013 | |
| | | | | | | | | | | | | | | | |
The accompanying notes are an integral part of these financial statements.
| | | | |
| 36 | | Wells Fargo Income Funds | | Portfolios of investments—November 30, 2016 (unaudited) |
REAL RETURN PORTFOLIO
| | | | | | | | | | | | | | | | |
| Security name | | Interest rate | | | Maturity date | | | Principal | | | Value | |
| | | | |
Health Care: 0.83% | | | | | | | | | | | | | | | | |
| | | | |
| Health Care Providers & Services: 0.79% | | | | | | | | | | | | | | | | |
Centene Corporation | | | 5.63 | % | | | 2-15-2021 | | | $ | 115,000 | | | $ | 118,450 | |
Fresenius Medical Care Holdings Incorporated | | | 6.88 | | | | 7-15-2017 | | | | 125,000 | | | | 128,125 | |
HCA Incorporated | | | 8.00 | | | | 10-1-2018 | | | | 115,000 | | | | 124,775 | |
MPT Operating Partnership LP | | | 6.38 | | | | 2-15-2022 | | | | 100,000 | | | | 102,625 | |
Tenet Healthcare Corporation | | | 6.25 | | | | 11-1-2018 | | | | 100,000 | | | | 104,250 | |
| | | | |
| | | | | | | | | | | | | | | 578,225 | |
| | | | | | | | | | | | | | | | |
| | | | |
| Life Sciences Tools & Services: 0.04% | | | | | | | | | | | | | | | | |
inVentiv Health Incorporated 144A | | | 9.00 | | | | 1-15-2018 | | | | 30,000 | | | | 30,227 | |
| | | | | | | | | | | | | | | | |
| | | | |
Industrials: 1.13% | | | | | | | | | | | | | | | | |
| | | | |
| Aerospace & Defense: 0.06% | | | | | | | | | | | | | | | | |
Huntington Ingalls Industries Incorporated 144A | | | 5.00 | | | | 12-15-2021 | | | | 40,000 | | | | 41,600 | |
| | | | | | | | | | | | | | | | |
| | | | |
| Airlines: 0.28% | | | | | | | | | | | | | | | | |
American Airlines Group Incorporated | | | 6.13 | | | | 6-1-2018 | | | | 100,000 | | | | 103,375 | |
United Continental Holdings Incorporated | | | 6.38 | | | | 6-1-2018 | | | | 100,000 | | | | 103,500 | |
| | | | |
| | | | | | | | | | | | | | | 206,875 | |
| | | | | | | | | | | | | | | | |
| | | | |
| Building Products: 0.12% | | | | | | | | | | | | | | | | |
USG Corporation | | | 9.75 | | | | 1-15-2018 | | | | 80,000 | | | | 84,400 | |
| | | | | | | | | | | | | | | | |
| | | | |
| Commercial Services & Supplies: 0.29% | | | | | | | | | | | | | | | | |
ACCO Brands Corporation | | | 6.75 | | | | 4-30-2020 | | | | 105,000 | | | | 109,988 | |
Clean Harbors Incorporated | | | 5.13 | | | | 6-1-2021 | | | | 100,000 | | | | 102,250 | |
| | | | |
| | | | | | | | | | | | | | | 212,238 | |
| | | | | | | | | | | | | | | | |
| | | | |
| Machinery: 0.09% | | | | | | | | | | | | | | | | |
Case New Holland Industrial Incorporated | | | 7.88 | | | | 12-1-2017 | | | | 65,000 | | | | 68,501 | |
| | | | | | | | | | | | | | | | |
| | | | |
| Trading Companies & Distributors: 0.29% | | | | | | | | | | | | | | | | |
Aircastle Limited | | | 4.63 | | | | 12-15-2018 | | | | 100,000 | | | | 104,375 | |
Ashtead Capital Incorporated 144A | | | 6.50 | | | | 7-15-2022 | | | | 100,000 | | | | 104,625 | |
| | | | |
| | | | | | | | | | | | | | | 209,000 | |
| | | | | | | | | | | | | | | | |
| | | | |
Information Technology: 0.42% | | | | | | | | | | | | | | | | |
| | | | |
| Communications Equipment: 0.08% | | | | | | | | | | | | | | | | |
ViaSat Incorporated | | | 6.88 | | | | 6-15-2020 | | | | 55,000 | | | | 56,753 | |
| | | | | | | | | | | | | | | | |
| | | | |
| Electronic Equipment, Instruments & Components: 0.11% | | | | | | | | | | | | | | | | |
Jabil Circuit Incorporated | | | 8.25 | | | | 3-15-2018 | | | | 75,000 | | | | 80,614 | |
| | | | | | | | | | | | | | | | |
| | | | |
| Internet Software & Services: 0.15% | | | | | | | | | | | | | | | | |
IAC/InterActiveCorp | | | 4.88 | | | | 11-30-2018 | | | | 109,000 | | | | 110,635 | |
| | | | | | | | | | | | | | | | |
| | | | |
| Technology Hardware, Storage & Peripherals: 0.08% | | | | | | | | | | | | | | | | |
EMC Corporation | | | 1.88 | | | | 6-1-2018 | | | | 60,000 | | | | 59,119 | |
| | | | | | | | | | | | | | | | |
The accompanying notes are an integral part of these financial statements.
| | | | | | |
| Portfolio of investments—November 30, 2016 (unaudited) | | Wells Fargo Income Funds | | | 37 | |
REAL RETURN PORTFOLIO
| | | | | | | | | | | | | | | | |
| Security name | | Interest rate | | | Maturity date | | | Principal | | | Value | |
| | | | |
Materials: 0.57% | | | | | | | | | | | | | | | | |
| | | | |
| Chemicals: 0.11% | | | | | | | | | | | | | | | | |
Ashland Incorporated | | | 3.88 | % | | | 4-15-2018 | | | $ | 80,000 | | | $ | 81,600 | |
| | | | | | | | | | | | | | | | |
| | | | |
| Containers & Packaging: 0.30% | | | | | | | | | | | | | | | | |
Owens-Illinois Incorporated | | | 7.80 | | | | 5-15-2018 | | | | 120,000 | | | | 128,400 | |
Reynolds Group Holdings | | | 5.75 | | | | 10-15-2020 | | | | 85,000 | | | | 87,444 | |
| | | | |
| | | | | | | | | | | | | | | 215,844 | |
| | | | | | | | | | | | | | | | |
| | | | |
| Metals & Mining: 0.16% | | | | | | | | | | | | | | | | |
Alcoa Incorporated | | | 6.75 | | | | 7-15-2018 | | | | 60,000 | | | | 63,825 | |
Steel Dynamics Incorporated | | | 6.13 | | | | 8-15-2019 | | | | 50,000 | | | | 51,700 | |
| | | | |
| | | | | | | | | | | | | | | 115,525 | |
| | | | | | | | | | | | | | | | |
| | | | |
Real Estate: 0.60% | | | | | | | | | | | | | | | | |
| | | | |
| Equity REITs: 0.44% | | | | | | | | | | | | | | | | |
ARC Properties Operating Partnership LP | | | 3.00 | | | | 2-6-2019 | | | | 100,000 | | | | 99,780 | |
Equinix Incorporated | | | 5.38 | | | | 1-1-2022 | | | | 100,000 | | | | 104,250 | |
Iron Mountain Incorporated 144A | | | 6.00 | | | | 10-1-2020 | | | | 100,000 | | | | 105,250 | |
VEREIT Operating Partnership LP | | | 4.13 | | | | 6-1-2021 | | | | 10,000 | | | | 10,250 | |
| | | | |
| | | | | | | | | | | | | | | 319,530 | |
| | | | | | | | | | | | | | | | |
| | | | |
| Real Estate Management & Development: 0.16% | | | | | | | | | | | | | | | | |
KB Home | | | 4.75 | | | | 5-15-2019 | | | | 60,000 | | | | 60,750 | |
Taylor Morrison Communities Incorporated 144A | | | 5.25 | | | | 4-15-2021 | | | | 60,000 | | | | 61,350 | |
| | | | |
| | | | | | | | | | | | | | | 122,100 | |
| | | | | | | | | | | | | | | | |
| | | | |
Telecommunication Services: 0.69% | | | | | | | | | | | | | | | | |
| | | | |
| Diversified Telecommunication Services: 0.35% | | | | | | | | | | | | | | | | |
CenturyLink Incorporated | | | 5.63 | | | | 4-1-2020 | | | | 90,000 | | | | 93,713 | |
Frontier Communications Corporation | | | 8.13 | | | | 10-1-2018 | | | | 75,000 | | | | 79,973 | |
Hughes Satellite Systems Corporation | | | 6.50 | | | | 6-15-2019 | | | | 75,000 | | | | 80,625 | |
| | | | |
| | | | | | | | | | | | | | | 254,311 | |
| | | | | | | | | | | | | | | | |
| | | | |
| Wireless Telecommunication Services: 0.34% | | | | | | | | | | | | | | | | |
Sprint Communications Incorporated 144A | | | 9.00 | | | | 11-15-2018 | | | | 130,000 | | | | 142,675 | |
T-Mobile USA Incorporated | | | 6.25 | | | | 4-1-2021 | | | | 5,000 | | | | 5,213 | |
T-Mobile USA Incorporated | | | 6.46 | | | | 4-28-2019 | | | | 100,000 | | | | 101,625 | |
| | | | |
| | | | | | | | | | | | | | | 249,513 | |
| | | | | | | | | | | | | | | | |
| | | | |
Total Corporate Bonds and Notes (Cost $7,319,812) | | | | | | | | | | | | | | | 7,304,938 | |
| | | | | | | | | | | | | | | | |
| | | | |
Loans: 3.24% | | | | | | | | | | | | | | | | |
| | | | |
Consumer Discretionary: 0.46% | | | | | | | | | | | | | | | | |
| | | | |
| Auto Components: 0.08% | | | | | | | | | | | | | | | | |
Allison Transmission Incorporated ± | | | 3.25 | | | | 9-23-2022 | | | | 56,713 | | | | 57,188 | |
| | | | | | | | | | | | | | | | |
The accompanying notes are an integral part of these financial statements.
| | | | |
| 38 | | Wells Fargo Income Funds | | Portfolios of investments—November 30, 2016 (unaudited) |
REAL RETURN PORTFOLIO
| | | | | | | | | | | | | | | | |
| Security name | | Interest rate | | | Maturity date | | | Principal | | | Value | |
| | | | |
| Household Products: 0.18% | | | | | | | | | | | | | | | | |
Michaels Stores Incorporated ± | | | 3.75 | % | | | 1-27-2023 | | | $ | 132,238 | | | $ | 133,148 | |
| | | | | | | | | | | | | | | | |
| | | | |
| Internet & Direct Marketing Retail: 0.08% | | | | | | | | | | | | | | | | |
Ancestry.com Incorporated ± | | | 5.25 | | | | 10-19-2023 | | | | 55,000 | | | | 55,092 | |
| | | | | | | | | | | | | | | | |
| | | | |
| Media: 0.12% | | | | | | | | | | | | | | | | |
Virgin Media Investment Holdings Limited ± | | | 3.50 | | | | 6-30-2023 | | | | 90,898 | | | | 91,381 | |
| | | | | | | | | | | | | | | | |
| | | | |
Financials: 0.18% | | | | | | | | | | | | | | | | |
| | | | |
| Diversified Financial Services: 0.18% | | | | | | | | | | | | | | | | |
Delos Finance SARL ± | | | 3.59 | | | | 3-6-2021 | | | | 135,000 | | | | 135,748 | |
| | | | | | | | | | | | | | | | |
| | | | |
Health Care: 0.27% | | | | | | | | | | | | | | | | |
| | | | |
| Health Care Equipment & Supplies: 0.11% | | | | | | | | | | | | | | | | |
Prestige Brands Incorporated ± | | | 3.50 | | | | 9-3-2021 | | | | 83,048 | | | | 83,549 | |
| | | | | | | | | | | | | | | | |
| | | | |
| Health Care Providers & Services: 0.16% | | | | | | | | | | | | | | | | |
Community Health Systems Incorporated ± | | | 4.16 | | | | 12-31-2018 | | | | 118,263 | | | | 114,473 | |
| | | | | | | | | | | | | | | | |
| | | | |
Industrials: 0.85% | | | | | | | | | | | | | | | | |
| | | | |
| Aerospace & Defense: 0.16% | | | | | | | | | | | | | | | | |
TransDigm Incorporated ± | | | 3.82 | | | | 2-28-2020 | | | | 117,909 | | | | 118,137 | |
| | | | | | | | | | | | | | | | |
| | | | |
| Airlines: 0.19% | | | | | | | | | | | | | | | | |
Delta Air Lines Incorporated ± | | | 3.25 | | | | 8-24-2022 | | | | 133,650 | | | | 134,628 | |
| | | | | | | | | | | | | | | | |
| | | | |
| Commercial Services & Supplies: 0.50% | | | | | | | | | | | | | | | | |
Huntsman International LLC ±%%< | | | 0.00 | | | | 4-1-2023 | | | | 100,000 | | | | 100,438 | |
KAR Auction Services Incorporated ± | | | 4.06 | | | | 3-9-2021 | | | | 131,865 | | | | 132,579 | |
ServiceMaster Company ± | | | 3.11 | | | | 11-3-2023 | | | | 135,000 | | | | 134,691 | |
| | | | |
| | | | | | | | | | | | | | | 367,708 | |
| | | | | | | | | | | | | | | | |
| | | | |
Information Technology: 0.45% | | | | | | | | | | | | | | | | |
| | | | |
| Internet Software & Services: 0.09% | | | | | | | | | | | | | | | | |
Zayo Group LLC ± | | | 3.75 | | | | 5-6-2021 | | | | 62,460 | | | | 62,633 | |
| | | | | | | | | | | | | | | | |
| | | | |
| IT Services: 0.13% | | | | | | | | | | | | | | | | |
First Data Corporation ± | | | 4.33 | | | | 7-8-2022 | | | | 93,295 | | | | 93,697 | |
| | | | | | | | | | | | | | | | |
| | | | |
| Semiconductors & Semiconductor Equipment: 0.23% | | | | | | | | | | | | | | | | |
Avago Technologies ± | | | 3.54 | | | | 2-1-2023 | | | | 97,397 | | | | 98,290 | |
Micron Technology Incorporated ±%%< | | | 4.36 | | | | 4-26-2022 | | | | 20,000 | | | | 20,211 | |
NXP Semiconductors NV ± | | | 3.41 | | | | 12-7-2020 | | | | 53,320 | | | | 53,462 | |
| | | | |
| | | | | | | | | | | | | | | 171,963 | |
| | | | | | | | | | | | | | | | |
| | | | |
Materials: 0.54% | | | | | | | | | | | | | | | | |
| | | | |
| Chemicals: 0.18% | | | | | | | | | | | | | | | | |
Ineos US Finance LLC ± | | | 3.75 | | | | 12-15-2020 | | | | 132,301 | | | | 132,538 | |
| | | | | | | | | | | | | | | | |
The accompanying notes are an integral part of these financial statements.
| | | | | | |
| Portfolio of investments—November 30, 2016 (unaudited) | | Wells Fargo Income Funds | | | 39 | |
REAL RETURN PORTFOLIO
| | | | | | | | | | | | | | | | |
| Security name | | Interest rate | | | Maturity date | | | Principal | | | Value | |
| | | | |
| Containers & Packaging: 0.22% | | | | | | | | | | | | | | | | |
Berry Plastics Group Incorporated ± | | | 3.50 | % | | | 2-8-2020 | | | $ | 132,259 | | | $ | 132,604 | |
Reynolds Group Holdings Incorporated ± | | | 4.25 | | | | 2-5-2023 | | | | 30,000 | | | | 30,146 | |
| | | | |
| | | | | | | | | | | | | | | 162,750 | |
| | | | | | | | | | | | | | | | |
| | | | |
| Metals & Mining: 0.14% | | | | | | | | | | | | | | | | |
Novelis Incorporated ± | | | 4.00 | | | | 6-2-2022 | | | | 99,747 | | | | 99,919 | |
| | | | | | | | | | | | | | | | |
| | | | |
Real Estate: 0.16% | | | | | | | | | | | | | | | | |
| | | | |
| Equity REITs: 0.16% | | | | | | | | | | | | | | | | |
MGM Growth Properties LLC ± | | | 3.50 | | | | 4-25-2023 | | | | 114,712 | | | | 115,190 | |
| | | | | | | | | | | | | | | | |
| | | | |
Telecommunication Services: 0.19% | | | | | | | | | | | | | | | | |
| | | | |
| Diversified Telecommunication Services: 0.19% | | | | | | | | | | | | | | | | |
Level 3 Financing Incorporated ± | | | 3.50 | | | | 5-31-2022 | | | | 135,000 | | | | 135,929 | |
| | | | | | | | | | | | | | | | |
| | | | |
Utilities: 0.14% | | | | | | | | | | | | | | | | |
| | | | |
| Independent Power & Renewable Electricity Producers: 0.14% | | | | | | | | | | | | | | | | |
Calpine Corporation ± | | | 3.59 | | | | 5-27-2022 | | | | 99,747 | | | | 99,922 | |
| | | | | | | | | | | | | | | | |
| | | | |
Total Loans (Cost $2,357,822) | | | | | | | | | | | | | | | 2,365,593 | |
| | | | | | | | | | | | | | | | |
|
U.S. Treasury Securities: 66.55% | |
TIPS | | | 0.13 | | | | 4-15-2018 | | | | 287,194 | | | | 289,086 | |
TIPS | | | 0.13 | | | | 4-15-2019 | | | | 1,586,585 | | | | 1,602,435 | |
TIPS | | | 0.13 | | | | 4-15-2020 | | | | 3,901,843 | | | | 3,934,934 | |
TIPS | | | 0.13 | | | | 4-15-2021 | | | | 2,368,175 | | | | 2,378,536 | |
TIPS | | | 0.13 | | | | 1-15-2022 | | | | 1,557,236 | | | | 1,559,109 | |
TIPS | | | 0.13 | | | | 7-15-2022 | | | | 2,314,743 | | | | 2,320,798 | |
TIPS | | | 0.13 | | | | 1-15-2023 | | | | 1,762,291 | | | | 1,749,389 | |
TIPS | | | 0.13 | | | | 7-15-2024 | | | | 1,911,377 | | | | 1,878,607 | |
TIPS | | | 0.13 | | | | 7-15-2026 | | | | 1,641,606 | | | | 1,593,198 | |
TIPS | | | 0.25 | | | | 1-15-2025 | | | | 1,946,729 | | | | 1,916,458 | |
TIPS | | | 0.38 | | | | 7-15-2023 | | | | 2,251,050 | | | | 2,272,891 | |
TIPS | | | 0.38 | | | | 7-15-2025 | | | | 1,837,472 | | | | 1,830,464 | |
TIPS | | | 0.63 | | | | 7-15-2021 | | | | 1,435,274 | | | | 1,480,930 | |
TIPS | | | 0.63 | | | | 1-15-2024 | | | | 1,774,373 | | | | 1,807,183 | |
TIPS | | | 0.63 | | | | 1-15-2026 | | | | 2,809,185 | | | | 2,844,356 | |
TIPS | | | 0.63 | | | | 2-15-2043 | | | | 577,506 | | | | 535,493 | |
TIPS | | | 0.75 | | | | 2-15-2042 | | | | 860,038 | | | | 823,317 | |
TIPS | | | 0.75 | | | | 2-15-2045 | | | | 1,189,197 | | | | 1,131,609 | |
TIPS | | | 1.00 | | | | 2-15-2046 | | | | 916,956 | | | | 934,203 | |
TIPS | | | 1.13 | | | | 1-15-2021 | | | | 1,710,534 | | | | 1,791,377 | |
TIPS | | | 1.25 | | | | 7-15-2020 | | | | 1,284,062 | | | | 1,354,132 | |
TIPS | | | 1.38 | | | | 7-15-2018 | | | | 576,543 | | | | 597,203 | |
TIPS | | | 1.38 | | | | 1-15-2020 | | | | 1,172,178 | | | | 1,230,701 | |
TIPS | | | 1.38 | | | | 2-15-2044 | | | | 895,993 | | | | 988,252 | |
TIPS | | | 1.63 | | | | 1-15-2018 | | | | 316,891 | | | | 324,836 | |
TIPS | | | 1.75 | | | | 1-15-2028 | | | | 685,636 | | | | 769,370 | |
TIPS | | | 1.88 | | | | 7-15-2019 | | | | 531,391 | | | | 565,060 | |
The accompanying notes are an integral part of these financial statements.
| | | | |
| 40 | | Wells Fargo Income Funds | | Portfolios of investments—November 30, 2016 (unaudited) |
REAL RETURN PORTFOLIO
| | | | | | | | | | | | | | | | |
| Security name | | Interest rate | | | Maturity date | | | Principal | | | Value | |
| | | | |
U.S. Treasury Securities (continued) | | | | | | | | | | | | | | | | |
TIPS | | | 2.00 | % | | | 1-15-2026 | | | $ | 729,780 | | | $ | 825,417 | |
TIPS | | | 2.13 | | | | 1-15-2019 | | | | 466,626 | | | | 492,619 | |
TIPS | | | 2.13 | | | | 2-15-2040 | | | | 390,919 | | | | 488,940 | |
TIPS | | | 2.13 | | | | 2-15-2041 | | | | 567,721 | | | | 714,627 | |
TIPS | | | 2.38 | | | | 1-15-2025 | | | | 1,165,446 | | | | 1,342,108 | |
TIPS | | | 2.38 | | | | 1-15-2027 | | | | 658,394 | | | | 775,250 | |
TIPS | | | 2.50 | | | | 1-15-2029 | | | | 669,018 | | | | 811,363 | |
TIPS | | | 2.63 | | | | 7-15-2017 | | | | 58,239 | | | | 59,639 | |
TIPS | | | 3.38 | | | | 4-15-2032 | | | | 204,008 | | | | 283,980 | |
TIPS | | | 3.63 | | | | 4-15-2028 | | | | 1,052,262 | | | | 1,391,475 | |
TIPS | | | 3.88 | | | | 4-15-2029 | | | | 631,446 | | | | 868,806 | |
| | | | |
Total U.S. Treasury Securities (Cost $47,673,223) | | | | | | | | | | | | | | | 48,558,151 | |
| | | | | | | | | | | | | | | | |
|
Yankee Corporate Bonds and Notes: 0.93% | |
|
Consumer Discretionary: 0.14% | |
|
| Automobiles: 0.14% | |
Jaguar Land Rover Automotive plc 144A | | | 4.13 | | | | 12-15-2018 | | | | 100,000 | | | | 102,000 | |
| | | | | | | | | | | | | | | | |
|
Consumer Staples: 0.14% | |
|
| Food & Staples Retailing: 0.14% | |
Tesco plc 144A | | | 5.50 | | | | 11-15-2017 | | | | 100,000 | | | | 102,878 | |
| | | | | | | | | | | | | | | | |
|
Financials: 0.23% | |
|
| Banks: 0.23% | |
Nielsen Holding and Finance BV 144A | | | 5.50 | | | | 10-1-2021 | | | | 80,000 | | | | 83,200 | |
Royal Bank of Scotland Group plc | | | 4.70 | | | | 7-3-2018 | | | | 80,000 | | | | 81,428 | |
| | | | |
| | | | | | | | | | | | | | | 164,628 | |
| | | | | | | | | | | | | | | | |
| | | | |
Health Care: 0.14% | | | | | | | | | | | | | | | | |
| | | | |
| Pharmaceuticals: 0.14% | | | | | | | | | | | | | | | | |
Mallinckrodt International Finance SA | | | 3.50 | | | | 4-15-2018 | | | | 100,000 | | | | 99,500 | |
| | | | | | | | | | | | | | | | |
| | | | |
Information Technology: 0.14% | | | | | | | | | | | | | | | | |
| | | | |
| Communications Equipment: 0.14% | | | | | | | | | | | | | | | | |
Nokia Corporation | | | 5.38 | | | | 5-15-2019 | | | | 100,000 | | | | 104,750 | |
| | | | | | | | | | | | | | | | |
| | | | |
Materials: 0.14% | | | | | | | | | | | | | | | | |
| | | | |
| Containers & Packaging: 0.14% | | | | | | | | | | | | | | | | |
Ardagh Packaging Finance plc 144A± | | | 3.85 | | | | 12-15-2019 | | | | 100,000 | | | | 101,743 | |
| | | | | | | | | | | | | | | | |
| | | | |
Total Yankee Corporate Bonds and Notes (Cost $671,391) | | | | | | | | | | | | | | | 675,499 | |
| | | | | | | | | | | | | | | | |
| | | | |
| | | Yield | | | | | | Shares | | | | |
| Short-Term Investments: 5.78% | | | | | | | | | | | | | | | | |
| | | | |
| Investment Companies: 5.71% | | | | | | | | | | | | | | | | |
Securities Lending Cash Investment LLC (l)(r)(u) | | | 0.65 | | | | | | | | 371,298 | | | | 371,335 | |
Wells Fargo Government Money Market Fund Select Class (l)(u)## | | | 0.31 | | | | | | | | 3,792,921 | | | | 3,792,921 | |
| | | | |
| | | | | | | | | | | | | | | 4,164,256 | |
| | | | | | | | | | | | | | | | |
The accompanying notes are an integral part of these financial statements.
| | | | | | |
| Portfolio of investments—November 30, 2016 (unaudited) | | Wells Fargo Income Funds | | | 41 | |
REAL RETURN PORTFOLIO
| | | | | | | | | | | | | | | | |
| Security name | | Yield | | | Maturity date | | | Principal | | | Value | |
| U.S. Treasury Securities: 0.07% | | | | | | | | | | | | | | | | |
U.S. Treasury Bill (z)# | | | 0.32 | % | | | 12-15-2016 | | | $ | 50,000 | | | $ | 49,997 | |
| | | | | | | | | | | | | | | | |
| | | | |
Total Short-Term Investments (Cost $4,214,228) | | | | | | | | | | | | | | | 4,214,253 | |
| | | | | | | | | | | | | | | | |
| | | | | | | | |
| Total investments in securities (Cost $72,165,837) * | | | 100.63 | % | | | 73,418,596 | |
Other assets and liabilities, net | | | (0.63 | ) | | | (458,627 | ) |
| | | | | | | | |
| Total net assets | | | 100.00 | % | | $ | 72,959,969 | |
| | | | | | | | |
| « | All or a portion of this security is on loan. |
| † | Non-income-earning security |
| 144A | The security may be resold in transactions exempt from registration, normally to qualified institutional buyers, pursuant to Rule 144A under the Securities Act of 1933. |
| ± | Variable rate investment. The rate shown is the rate in effect at period end. |
| %% | The security is issued on a when-issued basis. |
| < | All or a portion of the position represents an unfunded loan commitment. |
| (l) | The issuer of the security is an affiliated person of the Portfolio as defined in the Investment Company Act of 1940. |
| (r) | The investment is a non-registered investment vehicle purchased with cash collateral received from securities on loan. |
| (u) | The rate represents the 7-day annualized yield at period end. |
| ## | All or a portion of this security is segregated for unfunded loans. |
| (z) | Zero coupon security. The rate represents the current yield to maturity. |
| # | All or a portion of this security is segregated as collateral for investments in derivative instruments. |
| * | Cost for federal income tax purposes is $72,130,823 and unrealized gains (losses) consists of: |
| | | | |
Gross unrealized gains | | $ | 2,188,040 | |
Gross unrealized losses | | | (900,267 | ) |
| | | | |
Net unrealized gains | | $ | 1,287,773 | |
The accompanying notes are an integral part of these financial statements.
| | | | |
| 42 | | Wells Fargo Income Funds | | Statements of assets and liabilities—November 30, 2016 (unaudited) |
| | | | | | | | |
| | | Core Bond
Portfolio | | | Real Return
Portfolio | |
| | |
Assets | | | | | | | | |
Investments | | | | | | | | |
In unaffiliated securities (including securities on loan), at value (see cost below) | | $ | 5,591,407,064 | | | $ | 69,254,340 | |
In affiliated securities, at value (see cost below) | | | 368,654,245 | | | | 4,164,256 | |
| | | | | | | | |
Total investments, at value (see cost below) | | | 5,960,061,309 | | | | 73,418,596 | |
Segregated cash | | | 3,960,000 | | | | 0 | |
Foreign currency, at value (see cost below) | | | 0 | | | | 1,231 | |
Receivable for investments sold | | | 502,646,058 | | | | 0 | |
Principal paydown receivable | | | 115,974 | | | | 0 | |
Receivable for interest | | | 22,492,204 | | | | 273,229 | |
Receivable for daily variation margin on open futures contracts | | | 0 | | | | 3,656 | |
Receivable for securities lending income | | | 69,413 | | | | 1,831 | |
Prepaid expenses and other assets | | | 66,298 | | | | 2,050 | |
| | | | | | | | |
Total assets | | | 6,489,411,256 | | | | 73,700,593 | |
| | | | | | | | |
| | |
Liabilities | | | | | | | | |
Payable for investments purchased | | | 1,037,430,406 | | | | 323,565 | |
Payable upon receipt of securities loaned | | | 230,753,814 | | | | 371,300 | |
Payable for daily variation margin on open futures contracts | | | 0 | | | | 1,781 | |
Due to custodian bank | | | 275,520 | | | | 0 | |
Advisory fee payable | | | 1,489,078 | | | | 18,078 | |
Accrued expenses and other liabilities | | | 116,288 | | | | 25,900 | |
| | | | | | | | |
Total liabilities | | | 1,270,065,106 | | | | 740,624 | |
| | | | | | | | |
Total net assets | | $ | 5,219,346,150 | | | $ | 72,959,969 | |
| | | | | | | | |
| | |
Investments in unaffiliated securities (including securities on loan), at cost | | $ | 5,681,024,555 | | | $ | 68,001,602 | |
| | | | | | | | |
Investments in affiliated securities, at cost | | $ | 368,654,047 | | | $ | 4,164,235 | |
| | | | | | | | |
Total investments, at cost | | $ | 6,049,678,602 | | | $ | 72,165,837 | |
| | | | | | | | |
Securities on loan, at value | | $ | 226,218,264 | | | $ | 355,661 | |
| | | | | | | | |
Foreign currency, at cost | | $ | 0 | | | $ | 1,234 | |
| | | | | | | | |
The accompanying notes are an integral part of these financial statements.
| | | | | | |
| Statements of operations—six months ended November 30, 2016 (unaudited) | | Wells Fargo Income Funds | | | 43 | |
| | | | | | | | |
| | | Core Bond
Portfolio | | | Real Return
Portfolio | |
| | |
Investment income | | | | | | | | |
Interest* | | $ | 49,944,640 | | | $ | 912,547 | |
Income from affiliated securities | | | 304,382 | | | | 4,546 | |
Securities lending income, net | | | 270,195 | | | | 11,296 | |
Dividends** | | | 0 | | | | 132,805 | |
| | | | | | | | |
Total investment income | | | 50,519,217 | | | | 1,061,194 | |
| | | | | | | | |
| | |
Expenses | | | | | | | | |
Advisory fee | | | 8,514,246 | | | | 140,793 | |
Custody and accounting fees | | | 123,471 | | | | 6,885 | |
Professional fees | | | 39,202 | | | | 23,413 | |
Shareholder report expenses | | | 2,033 | | | | 717 | |
Trustees’ fees and expenses | | | 5,722 | | | | 12,127 | |
Other fees and expenses | | | 11,526 | | | | 4,288 | |
| | | | | | | | |
Total expenses | | | 8,696,200 | | | | 188,223 | |
Less: Fee waivers and/or expense reimbursements | | | (137,093 | ) | | | (33,844 | ) |
| | | | | | | | |
Net expenses | | | 8,559,107 | | | | 154,379 | |
| | | | | | | | |
Net investment income | | | 41,960,110 | | | | 906,815 | |
| | | | | | | | |
| | |
REALIZED AND UNREALIZED GAINS (LOSSES) ON INVESTMENTS | | | | | | | | |
| | |
Net realized gains (losses) on: | | | | | | | | |
Unaffiliated securities | | | 27,555,391 | | | | 212,438 | |
Futures transactions | | | 0 | | | | (6,048 | ) |
TBA sale commitments | | | 129,865 | | | | 0 | |
| | | | | | | | |
Net realized gains on investments | | | 27,685,256 | | | | 206,390 | |
| | | | | | | | |
| | |
Net change in unrealized gains (losses) on: | | | | | | | | |
Unaffiliated securities | | | (126,597,189 | ) | | | (1,032,338 | ) |
Affiliated securities | | | 198 | | | | 21 | |
Futures transactions | | | 0 | | | | 7,216 | |
| | | | | | | | |
Net change in unrealized gains (losses) on investments | | | (126,596,991 | ) | | | (1,025,101 | ) |
| | | | | | | | |
Net realized and unrealized gains (losses) on investments | | | (98,911,735 | ) | | | (818,711 | ) |
| | | | | | | | |
Net increase (decrease) in net assets resulting from operations | | $ | (56,951,625 | ) | | $ | 88,104 | |
| | | | | | | | |
| | |
* Net of foreign interest withholding taxes in the amount of | | | $33,358 | | | | $0 | |
** Net of foreign dividend withholding taxes in the amount of | | | $0 | | | | $4,566 | |
The accompanying notes are an integral part of these financial statements.
| | | | |
| 44 | | Wells Fargo Income Funds | | Statements of changes in net assets |
| | | | | | | | |
| | | Core Bond Portfolio | |
| | | Six months ended
November 30, 2016 (unaudited) | | | Year ended
May 31, 2016 | |
| | |
Operations | | | | | | | | |
Net investment income | | $ | 41,960,110 | | | $ | 71,646,971 | |
Net realized gains on investments | | | 27,685,256 | | | | 33,744,871 | |
Net change in unrealized gains (losses) on investments | | | (126,596,991 | ) | | | 4,164,647 | |
| | | | |
Net increase (decrease) in net assets resulting from operations | | | (56,951,625 | ) | | | 109,556,489 | |
| | | | |
| | |
Capital share transactions | | | | | | | | |
Transactions in investors’ beneficial interests | | | | | | | | |
Contributions | | | 1,064,955,273 | | | | 1,207,036,360 | |
Withdrawals | | | (129,492,556 | ) | | | (728,304,768 | ) |
| | | | |
Net increase in net assets resulting from capital share transactions | | | 935,462,717 | | | | 478,731,592 | |
| | | | |
Total increase in net assets | | | 878,511,092 | | | | 588,288,081 | |
| | | | |
| | |
Net assets | | | | | | | | |
Beginning of period | | | 4,340,835,058 | | | | 3,752,546,977 | |
| | | | |
End of period | | $ | 5,219,346,150 | | | $ | 4,340,835,058 | |
| | | | |
The accompanying notes are an integral part of these financial statements.
| | | | | | |
| Statements of changes in net assets | | Wells Fargo Income Funds | | | 45 | |
| | | | | | | | |
| | | Real Return Portfolio | |
| | | Six months ended
November 30, 2016
(unaudited) | | | Year ended
May 31, 2016 | |
| | |
Operations | | | | | | | | |
Net investment income | | $ | 906,815 | | | $ | 809,383 | |
Net realized gains (losses) on investments | | | 206,390 | | | | (131,670 | ) |
Net change in unrealized gains (losses) on investments | | | (1,025,101 | ) | | | 484,975 | |
| | | | |
Net increase in net assets resulting from operations | | | 88,104 | | | | 1,162,688 | |
| | | | |
| | |
Capital share transactions | | | | | | | | |
Transactions in investors’ beneficial interests | | | | | | | | |
Contributions | | | 15,019,507 | | | | 29,489,684 | |
Withdrawals | | | (6,245,523 | ) | | | (14,951,275 | ) |
| | | | |
Net increase in net assets resulting from capital share transactions | | | 8,773,984 | | | | 14,538,409 | |
| | | | |
Total increase in net assets | | | 8,862,088 | | | | 15,701,097 | |
| | | | |
| | |
Net assets | | | | | | | | |
Beginning of period | | | 64,097,881 | | | | 48,396,784 | |
| | | | |
End of period | | $ | 72,959,969 | | | $ | 64,097,881 | |
| | | | |
The accompanying notes are an integral part of these financial statements.
| | | | |
| 46 | | Wells Fargo Income Funds | | Financial highlights |
| | | | | | | | | | | | | | | | | | | | |
| | | Ratio to average net assets (annualized) | | | Total
return1 | | | Portfolio turnover
rate | |
| | | Net investment
income (loss) | | | Gross
expenses | | | Net
expenses | | | |
| | | | | |
Core Bond Portfolio | | | | | | | | | | | | | | | | | | | | |
Six months ended November 30, 2016 (unaudited) | | | 1.71 | % | | | 0.35 | % | | | 0.35 | % | | | (0.70 | )% | | | 252 | % |
Year ended May 31, 2016 | | | 1.86 | % | | | 0.36 | % | | | 0.35 | % | | | 2.78 | % | | | 667 | % |
Year ended May 31, 2015 | | | 1.82 | % | | | 0.37 | % | | | 0.35 | % | | | 3.22 | % | | | 586 | % |
Year ended May 31, 2014 | | | 1.94 | % | | | 0.37 | % | | | 0.35 | % | | | 2.90 | % | | | 646 | % |
Year ended May 31, 2013 | | | 1.75 | % | | | 0.37 | % | | | 0.35 | % | | | 2.61 | % | | | 547 | % |
Year ended May 31, 2012 | | | 2.33 | % | | | 0.37 | % | | | 0.35 | % | | | 8.20 | % | | | 803 | % |
| | | | | |
Real Return Portfolio | | | | | | | | | | | | | | | | | | | | |
Six months ended November 30, 2016 (unaudited) | | | 2.58 | % | | | 0.53 | % | | | 0.44 | % | | | 0.38 | % | | | 10 | % |
Year ended May 31, 2016 | | | 1.45 | % | | | 0.56 | % | | | 0.44 | % | | | 1.29 | % | | | 29 | % |
Year ended May 31, 2015 | | | 0.89 | % | | | 0.57 | % | | | 0.44 | % | | | 1.50 | % | | | 57 | % |
Year ended May 31, 2014 | | | 1.45 | % | | | 0.53 | % | | | 0.44 | % | | | (0.26 | )% | | | 9 | % |
Year ended May 31, 2013 | | | 1.52 | % | | | 0.50 | % | | | 0.44 | % | | | (1.86 | )% | | | 15 | % |
Year ended May 31, 2012 | | | 3.00 | % | | | 0.48 | % | | | 0.44 | % | | | 12.62 | % | | | 23 | % |
| 1 | Returns for periods of less than one year are not annualized. |
The accompanying notes are an integral part of these financial statements.
| | | | | | |
| Notes to financial statements (unaudited) | | Wells Fargo Income Funds | | | 47 | |
1. ORGANIZATION
Wells Fargo Master Trust (the “Trust”), a Delaware statutory trust organized on March 10, 1999, is an open-end management investment company registered under the Investment Company Act of 1940, as amended (the “1940 Act”). As an investment company, the Trust follows the accounting and reporting guidance in Financial Accounting Standards Board (“FASB”) Accounting Standards Codification Topic 946, Financial Services – Investment Companies. These financial statements report on the following portfolios: the Wells Fargo Core Bond Portfolio (“Core Bond Portfolio”) and the Wells Fargo Real Return Portfolio (“Real Return Portfolio”) (each, a “Portfolio”, collectively, the “Portfolios”). Each Portfolio is a diversified series of the Trust.
The Portfolios, which are master portfolios in a master/feeder structure, offer their shares to multiple feeder funds and other affiliated master portfolios rather than directly to the public.
2. SIGNIFICANT ACCOUNTING POLICIES
The following significant accounting policies, which are consistently followed in the preparation of the financial statements of each Portfolio, are in conformity with U.S. generally accepted accounting principles which require management to make estimates and assumptions that affect the reported amounts of assets and liabilities, disclosure of contingent assets and liabilities at the date of the financial statements, and the reported amounts of revenues and expenses during the reporting period. Actual results could differ from those estimates.
Securities valuation
All investments are valued each business day as of the close of regular trading on the New York Stock Exchange (generally 4 p.m. Eastern Time), although the Portfolios may deviate from this calculation time under unusual or unexpected circumstances.
Debt securities are valued at the evaluated bid price provided by an independent pricing service or, if a reliable price is not available, the quoted bid price from an independent broker-dealer.
Equity securities and futures that are listed on a foreign or domestic exchange or market are valued at the official closing price or, if none, the last sales price. If no sale occurs on the principal exchange or market that day, the prior day’s price will be deemed “stale” and a fair value price will be determined in accordance with the Portfolio’s Valuation Procedures.
The values of securities denominated in foreign currencies are translated into U.S. dollars at rates provided by an independent foreign currency pricing source at a time each business day specified by the Management Valuation Team of Wells Fargo Funds Management, LLC (“Funds Management”).
Many securities markets and exchanges outside the U.S. close prior to the close of the New York Stock Exchange and therefore may not fully reflect trading or events that occur after the close of the principal exchange in which the foreign securities are traded, but before the close of the New York Stock Exchange. If such trading or events are expected to materially affect the value of such securities, then fair value pricing procedures approved by the Board of Trustees of the Portfolio are applied. These procedures take into account multiple factors including movements in U.S. securities markets after foreign exchanges close. Foreign securities that are fair valued under these procedures are categorized as Level 2 and the application of these procedures may result in transfers between Level 1 and Level 2. Depending on market activity, such fair valuations may be frequent. Such fair value pricing may result in net asset values that are higher or lower than net asset values based on the last reported sales price or latest quoted bid price. On November 30, 2016, such fair value pricing was not used in pricing foreign securities.
Investments in registered open-end investment companies are valued at net asset value. Interests in non-registered investment vehicles that are redeemable at net asset value are fair valued normally at net asset value.
Investments which are not valued using any of the methods discussed above are valued at their fair value, as determined in good faith by the Board of Trustees. The Board of Trustees has established a Valuation Committee comprised of the Trustees and has delegated to it the authority to take any actions regarding the valuation of portfolio securities that the Valuation Committee deems necessary or appropriate, including determining the fair value of portfolio securities, unless the determination has been delegated to the Management Valuation Team. The Board of Trustees retains the authority to make or ratify any valuation decisions or approve any changes to the Valuation Procedures as it deems appropriate. On a quarterly basis, the Board of Trustees receives reports on any valuation actions taken by the Valuation Committee or the Management Valuation Team which may include items for ratification.
Valuations of fair valued securities are compared to the next actual sales price when available, or other appropriate market values, to assess the continued appropriateness of the fair valuation methodologies used. These securities are fair
| | | | |
| 48 | | Wells Fargo Income Funds | | Notes to financial statements (unaudited) |
valued on a day-to-day basis, taking into consideration changes to appropriate market information and any significant changes to the inputs considered in the valuation process until there is a readily available price provided on an exchange or by an independent pricing service. Valuations received from an independent pricing service or independent broker-dealer quotes are periodically validated by comparisons to most recent trades and valuations provided by other independent pricing services in addition to the review of prices by the adviser and/or subadviser. Unobservable inputs used in determining fair valuations are identified based on the type of security, taking into consideration factors utilized by market participants in valuing the investment, knowledge about the issuer and the current market environment.
Security loans
The Portfolios may lend its securities from time to time in order to earn additional income in the form of fees or interest on securities received as collateral or the investment of any cash received as collateral. The Portfolios continues to receive interest or dividends on the securities loaned. The Portfolios receives collateral in the form of cash or securities with a value at least equal to the value of the securities on loan. The value of the loaned securities is determined at the close of each business day and any additional required collateral is delivered to the Portfolios on the next business day. In a securities lending transaction, the net asset value of the Portfolio will be affected by an increase or decrease in the value of the securities loaned and by an increase or decrease in the value of the instrument in which collateral is invested. The amount of securities lending activity undertaken by the Portfolios fluctuates from time to time. In the event of default or bankruptcy by the borrower, the Portfolios may be prevented from recovering the loaned securities or gaining access to the collateral or may experience delays or costs in doing so. In addition, the investment of any cash collateral received may lose all or part of its value. The Portfolios has the right under the lending agreement to recover the securities from the borrower on demand.
The Portfolios lend their securities through an unaffiliated securities lending agent. Cash collateral received in connection with its securities lending transactions is invested in Securities Lending Cash Investments, LLC (the “Securities Lending Fund”). The Securities Lending Fund is exempt from registration under Section 3(c)(7) of the 1940 Act and is managed by Funds Management and is subadvised by Wells Capital Management Incorporated (“WellsCap”), an affiliate of Funds Management and an indirect wholly owned subsidiary of Wells Fargo & Company (“Wells Fargo”). Funds Management receives an advisory fee starting at 0.05% and declining to 0.01% as the average daily net assets of the Securities Lending Fund increase. All of the fees received by Funds Management are paid to WellsCap for its services as subadviser. The Securities Lending Fund seeks to provide a positive return compared to the daily Fed Funds Open Rate by investing in high-quality, U.S. dollar-denominated short-term money market instruments. Securities Lending Fund investments are valued at the evaluated bid price provided by an independent pricing service. Income earned from investment in the Securities Lending Fund is included in securities lending income on the Statements of Operations.
When-issued transactions
Each Portfolio may purchase securities on a forward commitment or when-issued basis. A Portfolio records a when-issued transaction on the trade date and will segregate assets in an amount at least equal in value to the Portfolio’s commitment to purchase when-issued securities. Securities purchased on a when-issued basis are marked-to-market daily and the Portfolio begins earning interest on the settlement date. Losses may arise due to changes in the market value of the underlying securities or if the counterparty does not perform under the contract.
Loans
The Portfolios may invest in direct debt instruments which are interests in amounts owed to lenders by corporate or other borrowers. The loans pay interest at rates which are periodically reset by reference to a base lending rate plus a spread. Investments in loans may be in the form of participations in loans or assignments of all or a portion of loans from third parties. When the Portfolio purchases participations, it generally has no rights to enforce compliance with terms of the loan agreement with the borrower. As a result, the Portfolio assumes the credit risk of both the borrower and the lender that is selling the participation. When the Portfolio purchases assignments from lenders, it acquires direct rights against the borrower on the loan and may enforce compliance by the borrower with the terms of the loan agreement. Loans may include fully funded term loans or unfunded loan commitments, which are contractual obligations for future funding.
Futures contracts
The Portfolios are subject to interest rate risk in the normal course of pursuing its investment objectives. A Portfolio may buy and sell futures contracts in order to gain exposure to, or protect against, changes in security values and interest rates. The primary risks associated with the use of futures contracts are the imperfect correlation between changes in market values of securities held by the Portfolio and the prices of futures contracts, and the possibility of an illiquid market.
| | | | | | |
| Notes to financial statements (unaudited) | | Wells Fargo Income Funds | | | 49 | |
The aggregate principal amounts of the contracts are not recorded in the financial statements. Fluctuations in the value of the contracts are recorded in the Statements of Assets and Liabilities as an asset or liability and in the Statements of Operations as unrealized gains or losses until the contracts are closed, at which point they are recorded as net realized gains or losses on futures contracts. With futures contracts, there is minimal counterparty risk to the Portfolio since futures are exchange traded and the exchange’s clearinghouse, as counterparty to all exchange traded futures, guarantees the futures against default.
TBA sale commitments
Each Portfolio may enter into To Be Announced (“TBA”) sale commitments to hedge its portfolio positions or to sell mortgage-backed securities it owns under delayed delivery arrangements. Proceeds of TBA sale commitments are not received until the contractual settlement date. During the time a TBA sale commitment is outstanding, equivalent deliverable securities or offsetting TBA purchase commitments, which are deliverable on or before the sale commitment date, are held as “cover” for the transaction. Unsettled TBA sale commitments are valued at the current market value of the underlying securities, generally according to the procedures described under “Securities valuation”. The contract is marked-to-market daily and the change in market value is recorded by the Portfolio as an unrealized gain or loss. If the TBA sale commitment is closed through the acquisition of an offsetting purchase commitment, the Portfolio realizes a gain or loss. If the Portfolio delivers securities under the commitment, the Portfolio realizes a gain or a loss from the sale of the securities based upon the unit price established at the date the commitment was entered into.
Inflation-indexed bonds and TIPS
Each Portfolio may invest in inflation-indexed bonds, including Treasury inflation-protected securities (TIPS). Inflation-indexed bonds are fixed income securities whose principal value is periodically adjusted according to the rate of inflation. If the index measuring inflation falls, the principal value of inflation-indexed bonds (other than municipal inflation indexed bonds and certain corporate inflation-indexed bonds) will be adjusted downward, and consequently the interest payable on these securities (calculated with respect to a smaller principal amount) will be reduced. Repayment of the original bond principal upon maturity (as adjusted for inflation) is guaranteed in the case of U.S. Treasury inflation-indexed bonds. For bonds that do not provide a similar guarantee, the adjusted principal value of the bond repaid at maturity may be less than the original principal. The value of inflation-indexed bonds is expected to change in response to changes in real interest rates. Real interest rates are tied to the relationship between nominal interest rates and the rate of inflation. If nominal interest rates increase at a faster rate than inflation, real interest rates may rise, leading to a decrease in value of inflation-indexed bonds. Inflation-indexed bonds, including TIPS, decline in value when real interest rates rise. In certain interest rate environments, such as when real interest rates are rising faster than nominal interest rates, inflation-indexed bonds may experience greater losses than other fixed income securities with similar durations.
Security transactions and income recognition
Securities transactions are recorded on a trade date basis. Realized gains or losses are recorded on the basis of identified cost.
Interest income is accrued daily and bond discounts are accreted and premiums are amortized daily based on the effective interest method. To the extent debt obligations are placed on non-accrual status, any related interest income may be reduced by writing off interest receivables when the collection of all or a portion of interest has become doubtful based on consistently applied procedures. If the issuer subsequently resumes interest payments or when the collectability of interest is reasonably assured, the debt obligation is removed from non-accrual status.
Dividend income is recognized on the ex-dividend date, except for certain dividends from foreign securities which are recorded as soon as the custodian verifies the ex-dividend date.
Income from foreign securities is recorded net of foreign taxes withheld where recovery of such taxes is not assured.
Federal and other taxes
Each Portfolio is treated as a separate entity for federal income tax purposes. The Portfolios are not required to pay federal income taxes on their net investment income and net capital gain as they are treated as partnerships for federal income tax purposes. All interest, dividends, gains and losses of a Portfolio are deemed to have been “passed through” to the interest holders in proportion to their holdings of the Portfolio regardless of whether such interest, dividends and gains have been distributed by the Portfolio.
Each Portfolio’s income tax returns and all financial records supporting those returns for the prior three fiscal years are subject to examination by the federal revenue authority. Management has analyzed each Portfolio’s tax positions taken on federal, state, and foreign tax returns for all open tax years and does not believe that there are any uncertain tax positions that require recognition of a tax liability.
| | | | |
| 50 | | Wells Fargo Income Funds | | Notes to financial statements (unaudited) |
3. FAIR VALUATION MEASUREMENTS
Fair value measurements of investments are determined within a framework that has established a fair value hierarchy based upon the various data inputs utilized in determining the value of each Portfolio’s investments. The three-level hierarchy gives the highest priority to unadjusted quoted prices in active markets for identical assets or liabilities (Level 1) and the lowest priority to significant unobservable inputs (Level 3). Each Portfolio’s investments are classified within the fair value hierarchy based on the lowest level of input that is significant to the fair value measurement. The inputs are summarized into three broad levels as follows:
| ∎ | | Level 1 – quoted prices in active markets for identical securities |
| ∎ | | Level 2 – other significant observable inputs (including quoted prices for similar securities, interest rates, prepayment speeds, credit risk, use of amortized cost, etc.) |
| ∎ | | Level 3 – significant unobservable inputs (including the Portfolio’s own assumptions in determining the fair value of investments) |
The inputs or methodologies used for valuing investments in securities are not necessarily an indication of the risk associated with investing in those securities.
The following is a summary of the inputs used in valuing each Portfolio’s assets and liabilities as of November 30, 2016:
| | | | | | | | | | | | | | | | |
| Core Bond Portfolio | | Quoted prices (Level 1) | | | Other significant observable inputs (Level 2) | | | Significant unobservable inputs (Level 3) | | | Total | |
Assets | | | | | | | | | | | | | | | | |
Investments in: | | | | | | | | | | | | | | | | |
| | | | |
Agency securities | | $ | 0 | | | $ | 1,419,693,128 | | | $ | 0 | | | $ | 1,419,693,128 | |
| | | | |
Asset-backed securities | | | 0 | | | | 651,314,358 | | | | 0 | | | | 651,314,358 | |
| | | | |
Corporate bonds and notes | | | 0 | | | | 971,299,342 | | | | 0 | | | | 971,299,342 | |
| | | | |
Government agency | | | 0 | | | | 20,555,046 | | | | 0 | | | | 20,555,046 | |
| | | | |
Municipal obligations | | | 0 | | | | 39,498,644 | | | | 0 | | | | 39,498,644 | |
| | | | |
Non-agency mortgage-backed securities | | | 0 | | | | 286,527,418 | | | | 0 | | | | 286,527,418 | |
| | | | |
U.S. Treasury securities | | | 1,809,267,733 | | | | 0 | | | | 0 | | | | 1,809,267,733 | |
| | | | |
Yankee corporate bonds and notes | | | 0 | | | | 315,557,917 | | | | 0 | | | | 315,557,917 | |
| | | | |
Yankee government bonds | | | 0 | | | | 77,693,478 | | | | 0 | | | | 77,693,478 | |
| | | | |
Short-term investments | | | | | | | | | | | | | | | | |
Investment companies | | | 137,895,059 | | | | 0 | | | | 0 | | | | 137,895,059 | |
Investments measured at net asset value* | | | | | | | | | | | | | | | 230,759,186 | |
Total assets | | $ | 1,947,162,792 | | | $ | 3,782,139,331 | | | $ | 0 | | | $ | 5,960,061,309 | |
| * | Investments that are measured at fair value using the net asset value per share (or its equivalent) as a practical expedient have not been categorized in the fair value hierarchy. The fair value amount presented in the table is intended to permit reconciliation of the fair value hierarchy to the amounts presented in the Statements of Assets and Liabilities. The Portfolio’s investment in Securities Lending Cash Investment, LLC valued at $230,759,186 does not have a redemption period notice, can be redeemed daily and does not have any unfunded commitments. |
| | | | | | |
| Notes to financial statements (unaudited) | | Wells Fargo Income Funds | | | 51 | |
| | | | | | | | | | | | | | | | |
| Real Return Portfolio | | Quoted prices (Level 1) | | | Other significant observable inputs (Level 2) | | | Significant unobservable inputs (Level 3) | | | Total | |
Assets | | | | | | | | | | | | | | | | |
Investments in: | | | | | | | | | | | | | | | | |
| | | | |
Common stocks | | | | | | | | | | | | | | | | |
Consumer staples | | $ | 2,527,736 | | | $ | 0 | | | $ | 0 | | | $ | 2,527,736 | |
Energy | | | 2,700,903 | | | | 0 | | | | 0 | | | | 2,700,903 | |
Materials | | | 2,671,426 | | | | 0 | | | | 0 | | | | 2,671,426 | |
Real estate | | | 2,400,097 | | | | 0 | | | | 0 | | | | 2,400,097 | |
| | | | |
Corporate bonds and notes | | | 0 | | | | 7,304,938 | | | | 0 | | | | 7,304,938 | |
| | | | |
Loans | | | 0 | | | | 2,265,155 | | | | 100,438 | | | | 2,365,593 | |
| | | | |
U.S. Treasury securities | | | 48,558,151 | | | | 0 | | | | 0 | | | | 48,558,151 | |
| | | | |
Yankee corporate bonds and notes | | | 0 | | | | 675,499 | | | | 0 | | | | 675,499 | |
| | | | |
Short-term investments | | | | | | | | | | | | | | | | |
Investment companies | | | 3,792,921 | | | | 0 | | | | 0 | | | | 3,792,921 | |
U.S. Treasury securities | | | 49,997 | | | | 0 | | | | 0 | | | | 49,997 | |
Investments measured at net asset value* | | | | | | | | | | | | | | | 371,335 | |
| | | 62,701,231 | | | | 10,245,592 | | | | 100,438 | | | | 73,418,596 | |
| | | | |
Futures contracts | | | 3,656 | | | | 0 | | | | 0 | | | | 3,656 | |
Total assets | | $ | 62,704,887 | | | $ | 10,245,592 | | | $ | 100,438 | | | $ | 73,422,252 | |
Liabilities | | | | | | | | | | | | | | | | |
| | | | |
Futures contracts | | $ | 1,781 | | | $ | 0 | | | $ | 0 | | | $ | 1,781 | |
Total liabilities | | $ | 1,781 | | | $ | 0 | | | $ | 0 | | | $ | 1,781 | |
| * | Investments that are measured at fair value using the net asset value per share (or its equivalent) as a practical expedient have not been categorized in the fair value hierarchy. The fair value amount presented in the table is intended to permit reconciliation of the fair value hierarchy to the amounts presented in the Statements of Assets and Liabilities. The Portfolio’s investment in Securities Lending Cash Investment, LLC valued at $371,335 does not have a redemption period notice, can be redeemed daily and does not have any unfunded commitments. |
Futures contracts are reported at their variation margin at measurement date, which represents the amount due to/from the Portfolio at that date. All other assets and liabilities are reported at their market value at measurement date.
The Portfolios recognizes transfers between levels within the fair value hierarchy at the end of the reporting period. At November 30, 2016, the Portfolios did not have any transfers into/out of Level 1, Level 2, or Level 3.
4. TRANSACTIONS WITH AFFILIATES
Advisory fee
The Trust has entered into an advisory contract with Funds Management, an indirect wholly owned subsidiary of Wells Fargo. The adviser is responsible for implementing investment policies and guidelines and for supervising the subadviser, who is responsible for day-to-day portfolio management of the Portfolios.
Pursuant to the contract, Funds Management is entitled to receive an annual advisory fee starting at 0.40% and declining to 0.30% as the average daily net assets of each Portfolio increase. For the six months ended November 30, 2016, the advisory fee for Core Bond Portfolio and Real Return Portfolio was equivalent to an annual rate of 0.35% and 0.40%, respectively, of each Portfolio’s average daily net assets.
Funds Management has retained the services of a subadviser to provide daily portfolio management to the Portfolios. The fees for subadvisory services are borne by Funds Management. WellsCap is the subadviser to each Portfolio. The subadviser is entitled to receive from Funds Management an annual subadvisory fee which is calculated based on the average daily net assets of the Portfolio as follows:
| | | | | | | | |
| | | Subadvisory fee | |
| | | starting at | | | declining to | |
Core Bond Portfolio | | | 0.20 | % | | | 0.10 | % |
Real Return Portfolio | | | 0.28 | | | | 0.18 | |
| | | | |
| 52 | | Wells Fargo Income Funds | | Notes to financial statements (unaudited) |
Funds Management has voluntarily waived and/or reimbursed advisory fees to the extent necessary to maintain certain net operating expense ratios for the Portfolios.
5. INVESTMENT PORTFOLIO TRANSACTIONS
Purchases and sales of investments, excluding short-term securities, for the six months ended November 30, 2016 were as follows:
| | | | | | | | | | | | | | | | |
| | | Purchases at cost | | | Sales proceeds | |
| | | U.S. government | | | Non-U.S. government | | | U.S. government | | | Non-U.S. government | |
Core Bond Portfolio | | $ | 11,464,870,789 | | | $ | 3,054,192,949 | | | $ | 10,739,535,990 | | | $ | 2,265,170,181 | |
Real Return Portfolio | | | 8,346,402 | | | | 7,079,293 | | | | 1,580,240 | | | | 4,864,811 | |
As of November 30, 2016, Real Return Portfolio had unfunded term loan commitments of $116,006.
The Portfolios may purchase or sell investment securities to other Wells Fargo funds under procedures adopted by the Board of Trustees. The procedures have been designed to ensure that these interfund transactions, which generally do not incur broker commissions, are effected at current market prices. Interfund trades are included within the respective purchases and sales amount shown.
6. DERIVATIVE TRANSACTIONS
During the six months ended November 30, 2016, Real Return Portfolio entered into futures contracts to speculate on interest rates and to help manage the duration of the portfolio.
At November 30, 2016, the Real Return Portfolio had long and short futures contracts outstanding as follows:
| | | | | | | | | | | | | | | | |
| Expiration date | | Counterparty | | Contracts | | Type | | | Contract value at May 31, 2016 | | | Unrealized
gains
(losses) | |
3-22-2017 | | JPMorgan | | 3 Long | | | 10-Year U.S. Treasury Notes | | | $ | 373,547 | | | $ | (1,390 | ) |
3-31-2017 | | JPMorgan | | 13 Short | | | 5-Year U.S. Treasury Notes | | | | 1,531,969 | | | | 3,152 | |
Real Return Portfolio had an average notional amount of $300,788 and $2,093,099 in long and short futures contracts, respectively, during the six months ended November 30, 2016.
The receivable and payable for daily variation margin on open futures contracts reflected in the Statements of Assets and Liabilities only represents the current day’s variation margin. The realized gains or losses and change in unrealized gains or losses on derivative instruments are reflected in the Statements of Operations.
For certain types of derivative transactions, the Portfolios have entered into International Swaps and Derivatives Association, Inc. master agreements (“ISDA Master Agreements”) or similar agreements with approved counterparties. The ISDA Master Agreements or similar agreements may have requirements to deliver/deposit securities or cash to/with an exchange or broker-dealer as collateral and allows the Portfolio to offset, with each counterparty, certain derivative financial instrument’s assets and/or liabilities with collateral held or pledged. Collateral requirements differ by type of derivative. Collateral or margin requirements are set by the broker or exchange clearing house for exchange traded derivatives while collateral terms are contract specific for over-the-counter traded derivatives. Cash collateral that has been pledged to cover obligations of the Portfolios under ISDA Master Agreements or similar agreements, if any, will be reported separately in the Statements of Assets and Liabilities. Securities pledged as collateral, if any, for the same purpose are noted in the Portfolio of Investments or Summary Portfolio of Investments. With respect to balance sheet offsetting, absent an event of default by the counterparty or a termination of the agreement, the reported amounts of financial assets and financial liabilities in the Statements of Assets and Liabilities are not offset across transactions between the Portfolio and the applicable counterparty. A reconciliation of the gross amounts on the Statements of Assets and Liabilities to the net amounts by derivative type, including any collateral exposure, is as follows:
| | | | | | | | | | | | | | | | | | | | |
| | | Derivative type | | Counterparty | | Gross amounts of assets in the Statements of Assets and Liabilities | | | Amounts subject to netting agreements | | | Collateral received | | | Net amount of assets | |
Real Return Portfolio | | Futures – variation margin | | JPMorgan | | $ | 3,656 | | | $ | (1,781 | ) | | $ | 0 | | | $ | 1,875 | |
| | | | | | |
| Notes to financial statements (unaudited) | | Wells Fargo Income Funds | | | 53 | |
| | | | | | | | | | | | | | | | | | | | |
| | | Derivative type | | Counterparty | | Gross amounts of liabilities in the Statements of Assets and Liabilities | | | Amounts subject to netting agreements | | | Collateral pledged | | | Net amount
of liabilities | |
Real Return Portfolio | | Futures – variation margin | | JPMorgan | | $ | 1,781 | | | $ | (1,781 | ) | | $ | 0 | | | | 0 | |
7. INDEMNIFICATION
Under the Trust’s organizational documents, the officers and Trustees have been granted certain indemnification rights against certain liabilities that may arise out of performance of their duties to the Trust. Additionally, in the normal course of business, the Trust may enter into contracts with service providers that contain a variety of indemnification clauses. The Trust’s maximum exposure under these arrangements is dependent on future claims that may be made against the Portfolios and, therefore, cannot be estimated.
8. REGULATORY CHANGES
In October 2016, the Securities and Exchange Commission (“SEC”) adopted new rules and forms and amended existing rules and forms (together, “final rules”) intended to modernize and enhance the reporting and disclosure of information by registered investment companies and to enhance liquidity risk management by open-end mutual funds and exchange-traded funds. The final rules will enhance the quality of information available to investors and will allow the SEC to more effectively collect and use data reported by funds. In part, the final rules amend Regulation S-X and require standardized, enhanced disclosure about derivatives in the Fund’s financial statements, as well as other amendments. The compliance date for the amendments to Regulation S-X is August 1, 2017 while the compliance date for the new form types is June 1, 2018 and the compliance date for the liquidity risk management program requirements is December 1, 2018. Management is currently assessing the potential impact of these enhancements and their impact on the financial statement disclosures and reporting requirements.
| | | | |
| 54 | | Wells Fargo Income Funds | | Other information (unaudited) |
PROXY VOTING INFORMATION
A description of the policies and procedures used to determine how to vote proxies relating to portfolio securities is available without charge, upon request, by calling 1-800-222-8222, visiting our website at wellsfargofunds.com, or visiting the SEC website at sec.gov. Information regarding how the proxies related to portfolio securities were voted during the most recent 12-month period ended June 30 is available on the website at wellsfargofunds.com or by visiting the SEC website at sec.gov.
PORTFOLIO HOLDINGS INFORMATION
The complete portfolio holdings are publicly available on the website (wellsfargofunds.com) on a one-month delayed basis. In addition, top ten holdings information (excluding derivative positions) is publicly available on the website on a monthly, seven-day or more delayed basis. Each Fund and Portfolio files its complete schedule of portfolio holdings with the SEC for the first and third quarters of each fiscal year on Form N-Q, which is available by visiting the SEC website at sec.gov. In addition, each Form N-Q may be reviewed and copied at the SEC’s Public Reference Room in Washington, DC, and at regional offices in New York City, at 233 Broadway, and in Chicago, at 175 West Jackson Boulevard, Suite 900. Information about the Public Reference Room may be obtained by calling 1-800-SEC-0330.
| | | | | | |
| Other information (unaudited) | | Wells Fargo Income Funds | | | 55 | |
BOARD OF TRUSTEES AND OFFICERS
Each of the Trustees and Officers1 listed in the table below acts in identical capacities for each fund in the Wells Fargo family of funds, which consists of 139 mutual funds comprising the Wells Fargo Funds Trust, Wells Fargo Variable Trust, Wells Fargo Master Trust and four closed-end funds (collectively the “Fund Complex”). This table should be read in conjunction with the Prospectus and the Statement of Additional Information2. The mailing address of each Trustee and Officer is 525 Market Street, 12th Floor, San Francisco, CA 94105. Each Trustee and Officer serves an indefinite term, however, each Trustee serves such term until reaching the mandatory retirement age established by the Trustees.
Independent Trustees
| | | | | | |
Name and year of birth | | Position held and length of service* | | Principal occupations during past five years or longer | | Current other public company or investment company directorships |
William R. Ebsworth (Born 1957) | | Trustee, since 2015 | | Retired. From 1984 to 2013, equities analyst, portfolio manager, research director and chief investment officer at Fidelity Management and Research Company in Boston, Tokyo, and Hong Kong and retired in 2013 as Chief Investment Officer of Fidelity Strategic Advisers, Inc. where he lead a team of investment professionals managing client assets. Prior thereto, Board member of Hong Kong Securities Clearing Co., Hong Kong Options Clearing Corp., the Thailand International Fund, Ltd., Fidelity Investments Life Insurance Company, and Empire Fidelity Investments Life Insurance Company. Mr. Ebsworth is a CFA® charterholder and an Adjunct Lecturer, Finance, at Babson College. | | Asset Allocation Trust |
Jane A. Freeman (Born 1953) | | Trustee, since 2015 | | Retired. From 2012 to 2014 and 1999 to 2008, Chief Financial Officer of Scientific Learning Corporation. From 2008 to 2012, Ms. Freeman provided consulting services related to strategic business projects. Prior to 1999, Portfolio Manager at Rockefeller & Co. and Scudder, Stevens & Clark. Board member of the Harding Loevner Funds from 1996 to 2014, serving as both Lead Independent Director and chair of the Audit Committee. Board member of the Russell Exchange Traded Funds Trust from 2011 to 2012 and the chair of the Audit Committee. Ms. Freeman is Chair of Taproot Foundation (non-profit organization), a Board Member of Ruth Bancroft Garden (non-profit organization) and an inactive chartered financial analyst. | | Asset Allocation Trust |
Peter G. Gordon** (Born 1942) | | Trustee, since 1998; Chairman, since 2005 | | Co-Founder, Retired Chairman, President and CEO of Crystal Geyser Water Company. Trustee Emeritus, Colby College. | | Asset Allocation Trust |
Isaiah Harris, Jr. (Born 1952) | | Trustee, since 2009 | | Retired. Chairman of the Board of CIGNA Corporation since 2009, and Director since 2005. From 2003 to 2011, Director of Deluxe Corporation. Prior thereto, President and CEO of BellSouth Advertising and Publishing Corp. from 2005 to 2007, President and CEO of BellSouth Enterprises from 2004 to 2005 and President of BellSouth Consumer Services from 2000 to 2003. Emeritus member of the Iowa State University Foundation Board of Governors. Emeritus Member of the Advisory Board of Iowa State University School of Business. Advisory Board Member, Palm Harbor Academy (charter school). Advisory Board Member, Child Evangelism Fellowship (non-profit). Mr. Harris is a certified public accountant (inactive status). | | CIGNA Corporation; Asset Allocation Trust |
Judith M. Johnson (Born 1949) | | Trustee, since 2008;
Audit Committee Chairman, since 2008 | | Retired. Prior thereto, Chief Executive Officer and Chief Investment Officer of Minneapolis Employees Retirement Fund from 1996 to 2008. Ms. Johnson is an attorney, certified public accountant and a certified managerial accountant. | | Asset Allocation Trust |
David F. Larcker (Born 1950) | | Trustee, since 2009 | | James Irvin Miller Professor of Accounting at the Graduate School of Business, Stanford University, Director of the Corporate Governance Research Initiative and Senior Faculty of The Rock Center for Corporate Governance since 2006. From 2005 to 2008, Professor of Accounting at the Graduate School of Business, Stanford University. Prior thereto, Ernst & Young Professor of Accounting at The Wharton School, University of Pennsylvania from 1985 to 2005. | | Asset Allocation Trust |
| | | | |
| 56 | | Wells Fargo Income Funds | | Other information (unaudited) |
| | | | | | |
Name and year of birth | | Position held and length of service* | | Principal occupations during past five years or longer | | Current other public company or investment company directorships |
Olivia S. Mitchell (Born 1953) | | Trustee, since 2006 | | International Foundation of Employee Benefit Plans Professor, Wharton School of the University of Pennsylvania since 1993. Director of Wharton’s Pension Research Council and Boettner Center on Pensions & Retirement Research, and Research Associate at the National Bureau of Economic Research. Previously, Cornell University Professor from 1978 to 1993. | | Asset Allocation Trust |
Timothy J. Penny (Born 1951) | | Trustee, since 1996 | | President and Chief Executive Officer of Southern Minnesota Initiative Foundation, a non-profit organization, since 2007 and Senior Fellow at the Humphrey Institute Policy Forum at the University of Minnesota since 1995. Member of the Board of Trustees of NorthStar Education Finance, Inc., a non-profit organization, since 2007. | | Asset Allocation Trust |
Michael S. Scofield (Born 1943) | | Trustee, since 2010 | | Served on the Investment Company Institute’s Board of Governors and Executive Committee from 2008-2011 as well the Governing Council of the Independent Directors Council from 2006-2011 and the Independent Directors Council Executive Committee from 2008-2011. Chairman of the IDC from 2008-2010. Institutional Investor (Fund Directions) Trustee of Year in 2007. Trustee of the Evergreen Funds complex (and its predecessors) from 1984 to 2010. Chairman of the Evergreen Funds from 2000-2010. Former Trustee of the Mentor Funds. Retired Attorney, Law Offices of Michael S. Scofield. | | Asset Allocation Trust |
| * | Length of service dates reflect the Trustee’s commencement of service with the Trust’s predecessor entities, where applicable. |
| ** | Peter Gordon is expected to retire on December 31, 2017. |
Officers
| | | | | | |
Name and year of birth | | Position held and
length of service | | Principal occupations during past five years or longer | | |
Andrew Owen3 (Born 1960) | | President, since 2017 | | Executive Vice President of Wells Fargo & Company and Head of Affiliated Managers, Wells Fargo Asset Management, since 2014. Executive Vice President responsible for marketing, investments and product development for Wells Fargo Funds Management, LLC, from 2009 to 2014. | | |
Nancy Wiser1 (Born 1967) | | Treasurer, since 2012 | | Executive Vice President of Wells Fargo Funds Management, LLC since 2011. Chief Operating Officer and Chief Compliance Officer at LightBox Capital Management LLC, from 2008 to 2011. | | |
C. David Messman (Born 1960) | | Secretary, since 2000; Chief Legal Officer, since 2003 | | Senior Vice President and Secretary of Wells Fargo Funds Management, LLC since 2001. Assistant General Counsel of Wells Fargo Bank, N.A. since 2013 and Vice President and Managing Counsel of Wells Fargo Bank, N.A. from 1996 to 2013. | | |
Michael Whitaker (Born 1967) | | Chief Compliance Officer, since 2016 | | Executive Vice President of Wells Fargo Funds Management, LLC since 2016. Chief Compliance Officer of Fidelity’s Fixed Income Funds and Asset Allocation Funds from 2008 to 2016, Compliance Officer of FMR Co., Inc. from 2014 to 2016, Fidelity Investments Money Management, Inc. from 2014 to 2016, Fidelity Investments from 2007 to 2016. | | |
Jeremy DePalma1 (Born 1974) | | Treasurer, since 2012 | | Senior Vice President of Wells Fargo Funds Management, LLC since 2009. Senior Vice President of Evergreen Investment Management Company, LLC from 2008 to 2010 and head of the Fund Reporting and Control Team within Fund Administration from 2005 to 2010. | | |
David Berardi (Born 1975) | | Assistant Treasurer, since 2009 | | Vice President of Wells Fargo Funds Management, LLC since 2009. Vice President of Evergreen Investment Management Company, LLC from 2008 to 2010. Manager of Fund Reporting and Control for Evergreen Investment Management Company, LLC from 2004 to 2010. | | |
| 1 | Nancy Wiser acts as Treasurer of 70 funds in the Fund Complex. Jeremy DePalma acts as Treasurer of 69 funds and Assistant Treasurer of 70 funds in the Fund Complex. |
| 2 | The Statement of Additional Information includes additional information about the Trustees and is available, without charge, upon request, by calling 1-800-222-8222 or by visiting the website at wellsfargofunds.com. |
| 3 | Andrew Owen became President on January 1, 2017. |
| | | | | | |
| List of abbreviations | | Wells Fargo Income Funds | | | 57 | |
The following is a list of common abbreviations for terms and entities that may have appeared in this report.
| ACA | — ACA Financial Guaranty Corporation |
| ADR | — American depositary receipt |
| ADS | — American depositary shares |
| AGC | — Assured Guaranty Corporation |
| AGM | — Assured Guaranty Municipal |
| Ambac | — Ambac Financial Group Incorporated |
| AMT | — Alternative minimum tax |
| BAN | — Bond anticipation notes |
| BHAC | — Berkshire Hathaway Assurance Corporation |
| CAB | — Capital appreciation bond |
| CCAB | — Convertible capital appreciation bond |
| CDA | — Community Development Authority |
| CDO | — Collateralized debt obligation |
| DRIVER | — Derivative inverse tax-exempt receipts |
| DW&P | — Department of Water & Power |
| DWR | — Department of Water Resources |
| ECFA | — Educational & Cultural Facilities Authority |
| EDA | — Economic Development Authority |
| EDFA | — Economic Development Finance Authority |
| ETF | — Exchange-traded fund |
| FDIC | — Federal Deposit Insurance Corporation |
| FFCB | — Federal Farm Credit Banks |
| FGIC | — Financial Guaranty Insurance Corporation |
| FHA | — Federal Housing Administration |
| FHLB | — Federal Home Loan Bank |
| FHLMC | — Federal Home Loan Mortgage Corporation |
| FICO | — The Financing Corporation |
| FNMA | — Federal National Mortgage Association |
| GDR | — Global depositary receipt |
| GNMA | — Government National Mortgage Association |
| HCFR | — Healthcare facilities revenue |
| HEFA | — Health & Educational Facilities Authority |
| HEFAR | — Higher education facilities authority revenue |
| HFA | — Housing Finance Authority |
| HFFA | — Health Facilities Financing Authority |
| HUD | — Department of Housing and Urban Development |
| IDA | — Industrial Development Authority |
| IDAG | — Industrial Development Agency |
| KRW | — Republic of Korea won |
| LIBOR | — London Interbank Offered Rate |
| LIFER | — Long Inverse Floating Exempt Receipts |
| LLC | — Limited liability company |
| LLLP | — Limited liability limited partnership |
| LLP | — Limited liability partnership |
| MBIA | — Municipal Bond Insurance Association |
| MFHR | — Multifamily housing revenue |
| MSTR | — Municipal securities trust receipts |
| MUD | — Municipal Utility District |
| National | — National Public Finance Guarantee Corporation |
| PCFA | — Pollution Control Financing Authority |
| PCL | — Public Company Limited |
| PCR | — Pollution control revenue |
| PFA | — Public Finance Authority |
| PFFA | — Public Facilities Financing Authority |
| PFOTER | — Puttable floating option tax-exempt receipts |
| plc | — Public limited company |
| PUTTER | — Puttable tax-exempt receipts |
| R&D | — Research & development |
| Radian | — Radian Asset Assurance |
| RAN | — Revenue anticipation notes |
| RDA | — Redevelopment Authority |
| RDFA | — Redevelopment Finance Authority |
| REIT | — Real estate investment trust |
| ROC | — Reset option certificates |
| SAVRS | — Select auction variable rate securities |
| SBA | — Small Business Authority |
| SDR | — Swedish depositary receipt |
| SFHR | — Single-family housing revenue |
| SFMR | — Single-family mortgage revenue |
| SPA | — Standby purchase agreement |
| SPDR | — Standard & Poor’s Depositary Receipts |
| SPEAR | — Short Puttable Exempt Adjustable Receipts |
| STRIPS | — Separate trading of registered interest and |
| TAN | — Tax anticipation notes |
| TIPS | — Treasury inflation-protected securities |
| TRAN | — Tax revenue anticipation notes |
| TTFA | — Transportation Trust Fund Authority |
| TVA | — Tennessee Valley Authority |
This page is intentionally left blank.
This page is intentionally left blank.
This page is intentionally left blank.

For more information
More information about Wells Fargo Funds is available free upon request. To obtain literature, please write, email, visit the Funds’ website, or call:
Wells Fargo Funds
P.O. Box 8266
Boston, MA 02266-8266
Email: fundservice@wellsfargo.com
Website: wellsfargofunds.com
Individual investors: 1-800-222-8222
Retail investment professionals: 1-888-877-9275
Institutional investment professionals: 1-866-765-0778
This report and the financial statements contained herein are submitted for the general information of the shareholders of Wells Fargo Funds. If this report is used for promotional purposes, distribution of the report must be accompanied or preceded by a current prospectus. Before investing, please consider the investment objectives, risks, charges, and expenses of the investment. For a current prospectus and, if available, a summary prospectus, containing this information, call 1-800-222-8222 or visit the Funds’ website at wellsfargofunds.com. Read the prospectus carefully before you invest or send money.
Wells Fargo Asset Management (WFAM) is a trade name used by the asset management businesses of Wells Fargo & Company. Wells Fargo Funds Management, LLC, a wholly owned subsidiary of Wells Fargo & Company, provides investment advisory and administrative services for Wells Fargo Funds. Other affiliates of Wells Fargo & Company provide subadvisory and other services for the funds. The funds are distributed by Wells Fargo Funds Distributor, LLC, Member FINRA, an affiliate of Wells Fargo & Company. Neither Wells Fargo Funds Management nor Wells Fargo Funds Distributor has Fund customer accounts/assets, and neither provides investment advice/recommendations or acts as an investment advice fiduciary to any investor.
NOT FDIC INSURED ◾ NO BANK GUARANTEE ◾ MAY LOSE VALUE
© 2016 Wells Fargo Funds Management, LLC. All rights reserved.
| | |
 | | 248015 01-17 SILD/SAR103 11-16 |
Semi-Annual Report
November 30, 2016

WealthBuilder Portfolios

| ∎ | | Wells Fargo WealthBuilder Conservative Allocation Portfolio |
| ∎ | | Wells Fargo WealthBuilder Moderate Balanced Portfolio |
| ∎ | | Wells Fargo WealthBuilder Growth Balanced Portfolio |
| ∎ | | Wells Fargo WealthBuilder Growth Allocation Portfolio |
| ∎ | | Wells Fargo WealthBuilder Equity Portfolio (formerly, Wells Fargo WealthBuilder Tactical Equity Portfolio) |

Reduce clutter. Save trees.
Sign up for electronic delivery of prospectuses and shareholder reports at wellsfargo.com/advantagedelivery
Contents
The views expressed and any forward-looking statements are as of November 30, 2016, unless otherwise noted, and are those of the Fund managers and/or Wells Fargo Funds Management, LLC. Discussions of individual securities, or the markets generally, or any Wells Fargo Fund are not intended as individual recommendations. Future events or results may vary significantly from those expressed in any forward-looking statements. The views expressed are subject to change at any time in response to changing circumstances in the market. Wells Fargo Funds Management, LLC and the Funds disclaim any obligation to publicly update or revise any views expressed or forward-looking statements.
NOT FDIC INSURED ◾ NO BANK GUARANTEE ◾ MAY LOSE VALUE
| | | | |
| 2 | | Wells Fargo WealthBuilder Portfolios | | Letter to shareholders (unaudited) |

Andrew Owen
President
Wells Fargo Funds
During much of the period, modestly positive economic data influenced global stock, bond, and commodity markets.
Throughout the period, economic and business data, while often uneven, appeared to be strengthening overall.
Dear Shareholder:
As the new president of Wells Fargo Funds now that Karla Rabusch is retiring from that position after nearly 14 years, I am pleased to offer you this semi-annual report for the Wells Fargo WealthBuilder Portfolios for the six-month period that ended November 30, 2016. During much of the period, modestly positive economic data influenced global stock, bond, and commodity markets. Late in the period, stocks moved higher and bond markets fell in reaction to global political events including the U.S. presidential election, efforts by the Organization of Petroleum Exporting Countries (OPEC) to increase oil prices, and interest-rate expectations.
The surprise Brexit vote rattled markets briefly before stocks rebounded.
Global investment markets trended lower at the end of June following the Brexit vote in the U.K. to leave the European Union (E.U.). The equity sell-off proved temporary. During July, better-than-expected corporate earnings, economic data, consumer confidence, and industrial output sent U.S. stocks higher.
Stocks drifted somewhat lower in the fall as the presidential campaign wore on toward the election. Following the November election, the S&P 500 Index1 reached several record all-time highs on its path to a 6.01% return for the six-month period that ended November 30, 2016. The Russell 2000® Index2 and S&P Midcap 400® Index3 delivered even more robust returns for the period at 15.37% and 9.93%, respectively.
International equity markets confronted challenging circumstances during the period.
During the period, political circumstances in countries outside of the U.S. challenged investor sentiment. In the U.K., a new prime minister took office following the Brexit vote and began setting the ground rules for the country’s exit from the E.U. In Brazil, the Senate removed the president from office, and the possibility of presidential impeachment due to a corruption scandal emerged in South Korea. The king of Thailand died. The French president lost a primary election and endorsed his rival. An attempted coup in Turkey, continued escalation of conflicts in Syria and Iraq, and North Korea’s testing of its nuclear weapons capabilities also caused uncertainty.
Throughout the period, economic and business data, while often uneven, appeared to be strengthening overall. After generating concern early in 2016, China’s economic growth demonstrated strength. The prime minister’s re-election in Japan offered the potential for new economic stimulus. India appointed a new central bank governor who many expected would continue the outgoing governor’s policies, which were considered effective. OPEC members agreed to production cuts intended to support increased prices for oil, which could benefit commodities markets that are economically important to many international developed and emerging markets. Developed international markets as measured by the Morgan Stanley Capital International (MSCI) Europe, Australasia, Far East (EAFE) Index (Net)4
| 1 | The S&P 500 Index consists of 500 stocks chosen for market size, liquidity, and industry group representation. It is a market-value-weighted index with each stock’s weight in the index proportionate to its market value. You cannot invest directly in an index. |
| 2 | The Russell 2000® Index measures the performance of the 2,000 smallest companies in the Russell 3000® Index, which represents approximately 8% of the total market capitalization of the Russell 3000® Index. You cannot invest directly in an index. |
| 3 | The S&P MidCap 400® Index measures the performance of the mid-size company segment of the U.S. market; this index is used by more than 95% of U.S. managers and pension plan sponsors. More than $25 billion is indexed to the S&P MidCap 400® Index. You cannot invest directly in an index. |
| 4 | The Morgan Stanley Capital International (MSCI) EAFE (Europe, Australasia, Far East) Index (Net) is a free-float-adjusted market-capitalization-weighted index that is designed to measure the equity market performance of developed markets, excluding the United States and Canada. The MSCI EAFE Index (Net) consists of the following 21 developed markets country indexes: Australia, Austria, Belgium, Denmark, Finland, France, Germany, Hong Kong, Ireland, Israel, Italy, Japan, the Netherlands, New Zealand, Norway, Portugal, Singapore, Spain, Sweden, Switzerland, and the United Kingdom. Source: MSCI. MSCI makes no express or implied warranties or representations and shall have no liability whatsoever with respect to any MSCI data contained herein. The MSCI data may not be further redistributed or used as a basis for other indexes or any securities or financial products. This report is not approved, reviewed, or produced by MSCI. You cannot invest directly in an index. |
| | | | | | |
| Letter to shareholders (unaudited) | | Wells Fargo WealthBuilder Portfolios | | | 3 | |
ended the period 1.25% lower. Stocks in emerging markets delivered an 8.42% gain for the period as measured by the MSCI Emerging Markets Index (Net).5
Fixed-income markets were volatile before the U.S. election and declined post-election.
Global fixed-income markets were volatile during the period, particularly following the U.S. election. Investors appeared to be anticipating U.S. interest-rate increases and waiting for clarity from central bank policymakers outside of the U.S. When investors expect interest rates to rise, they often seek higher yields on their investments to compensate for inflation’s eroding effect on real returns, tending to favor equities and high-yield bonds, for example, over investment-grade bonds.
Also, currency values in several European and Asian countries fell relative to the U.S. dollar during the period, restraining investor interest in foreign bond markets. While the Bloomberg Barclays Aggregate Bond Index6 suffered a 0.92% loss during the period, the 4.97% loss for the Bloomberg Barclays Global Aggregate Bond ex-USD Index7 reflects the relatively more difficult conditions for bonds outside of the U.S.
Don’t let short-term uncertainty derail long-term investment goals.
Periods of investment uncertainty can present challenges, but experience has taught us that maintaining long-term investment goals can be an effective way to plan for the future. To help you create a sound strategy based on your personal goals and risk tolerance, Wells Fargo Funds offers more than 100 mutual funds spanning a wide range of asset classes and investment styles. Although diversification cannot guarantee an investment profit or prevent losses, we believe it can be an effective way to manage investment risk and potentially smooth out overall portfolio performance. We encourage investors to know their investments and to understand that appropriate levels of risk-taking may unlock opportunities.
Thank you for choosing to invest with Wells Fargo Funds. We appreciate your confidence in us and remain committed to helping you meet your financial needs.
Sincerely,

Andrew Owen
President
Wells Fargo Funds
For further information about your Fund, contact your investment professional, visit our website at wellsfargofunds.com, or call us directly at 1-800-222-8222. We are available 24 hours a day, 7 days a week.
| 5 | The Morgan Stanley Capital International (MSCI) Emerging Markets Index (EM) Index (Net) is a free-float-adjusted market-capitalization-weighted index that is designed to measure the equity market performance of emerging markets. The MSCI EM Index (Net) consists of the following 23 emerging markets country indexes: Brazil, Chile, China, Colombia, Czech Republic, Egypt, Greece, Hungary, India, Indonesia, Korea, Malaysia, Mexico, Peru, the Philippines, Poland, Qatar, Russia, South Africa, Taiwan, Thailand, Turkey, and United Arab Emirates. You cannot invest directly in an index. |
| 6 | The Bloomberg Barclays U.S. Aggregate Bond Index (formerly known as Barclays U.S. Aggregate Bond Index) is a broad-based benchmark that measures the investment-grade, U.S. dollar-denominated, fixed-rate taxable bond market, including Treasuries, government-related and corporate securities, mortgage-backed securities (agency fixed-rate and hybrid adjustable-rate mortgage pass-throughs), asset-backed securities, and commercial mortgage-backed securities. You cannot invest directly in an index. |
| 7 | The Bloomberg Barclays Global Aggregate ex-U.S. Dollar Bond Index (formerly known as Barclays Global Aggregate ex-U.S. Dollar Bond Index) tracks an international basket of government, corporate, agency, and mortgage-related bonds. You cannot invest directly in an index. |
| | | | |
| 4 | | Wells Fargo WealthBuilder Portfolios | | Performance highlights (unaudited) |
Wells Fargo WealthBuilder Conservative Allocation Portfolio
Investment objective
The Portfolio seeks current income with a secondary emphasis on capital appreciation.
Manager
Wells Fargo Funds Management, LLC
Subadviser
Wells Capital Management Incorporated
Portfolio managers
Kandarp R. Acharya, CFA®, FRM
Petros Bocray, CFA®, FRM
Christian L. Chan, CFA®
Average annual total returns (%) as of November 30, 2016
| | | | | | | | | | | | | | | | | | | | | | | | | | | | | | | | | | |
| | | | | Including sales charge | | | Excluding sales charge | | | Expense ratios1 (%) | |
| | | Inception date | | 1 year | | | 5 year | | | 10 year | | | 1 year | | | 5 year | | | 10 year | | | Gross | | | Net2 | |
| Wells Fargo WealthBuilder Conservative Allocation Portfolio (WBCAX) | | 9-30-2004 | | | 0.28 | | | | 2.49 | | | | 2.78 | | | | 1.80 | | | | 2.80 | | | | 2.93 | | | | 2.03 | | | | 2.03 | |
| WealthBuilder Conservative Allocation Blended Index3 | | – | | | – | | | | – | | | | – | | | | 3.01 | | | | 4.26 | | | | 4.70 | | | | – | | | | – | |
| Bloomberg Barclays U.S. Aggregate Bond Index4 | | – | | | – | | | | – | | | | – | | | | 2.17 | | | | 2.43 | | | | 4.27 | | | | – | | | | – | |
| MSCI ACWI ex USA Index (Net)5 | | – | | | – | | | | – | | | | – | | | | (0.03 | ) | | | 4.24 | | | | 1.02 | | | | – | | | | – | |
| Russell 3000® Index6 | | – | | | – | | | | – | | | | – | | | | 8.31 | | | | 14.41 | | | | 7.00 | | | | – | | | | – | |
Figures quoted represent past performance, which is no guarantee of future results, and do not reflect taxes that a shareholder may pay on fund distributions or the redemption of fund shares. Investment return and principal value of an investment will fluctuate so that an investor’s shares, when redeemed, may be worth more or less than their original cost. Performance shown without sales charges would be lower if sales charges were reflected. Current performance may be lower or higher than the performance data quoted, which assumes the reinvestment of dividends and capital gains. Current month-end performance is available on the Portfolio’s website, wellsfargofunds.com.
Index returns do not include transaction costs associated with buying and selling securities, any mutual fund fees or expenses, or any taxes. It is not possible to invest directly in an index.
For WealthBuilder Portfolios, the maximum front-end sales charge is 1.50%.
Balanced funds may invest in stocks and bonds. Stock values fluctuate in response to the activities of individual companies and general market and economic conditions. Bond values fluctuate in response to the financial condition of individual issuers, general market and economic conditions, and changes in interest rates. Changes in market conditions and government policies may lead to periods of heightened volatility in the bond market and reduced liquidity for certain bonds held by the Portfolio. In general, when interest rates rise, bond values fall and investors may lose principal value. Interest-rate changes and their impact on the Portfolio and its share price can be sudden and unpredictable. The use of derivatives may reduce returns and/or increase volatility. The Portfolio will indirectly be exposed to all of the risks of an investment in the underlying funds and will indirectly bear expenses of the underlying funds. Certain investment strategies tend to increase the total risk of an investment (relative to the broader market). The Portfolio is exposed to alternative investment risk, foreign investment risk, high-yield securities risk, mortgage- and asset-backed securities risk, and smaller-company investment risk. Consult the Portfolio’s prospectus for additional information on these and other risks.
Please see footnotes on page 5.
| | | | | | |
| Performance highlights (unaudited) | | Wells Fargo WealthBuilder Portfolios | | | 5 | |
Wells Fargo WealthBuilder Conservative Allocation Portfolio (continued)
| | | | |
| Ten largest holdings (%) as of November 30, 20167 | |
Wells Fargo Core Bond Portfolio | | | 23.89 | |
Wells Fargo Short Duration Government Bond Fund Class R6 | | | 18.51 | |
Wells Fargo Government Securities Fund Institutional Class | | | 14.09 | |
PIMCO High Yield Fund Institutional Class | | | 7.70 | |
Oppenheimer International Bond Fund Class I | | | 4.53 | |
MFS Value Fund Class I | | | 3.03 | |
PIMCO CommodityRealReturn Strategy Fund Institutional Class | | | 2.76 | |
Federated Institutional High Yield Bond Fund Institutional Class | | | 2.56 | |
Thornburg International Value Fund Institutional Class | | | 1.82 | |
Voya Global Real Estate Fund Class I | | | 1.73 | |
|
| Current target allocation as of November 30, 20168 |
|
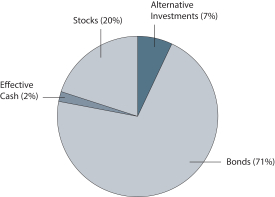 |
|
| Neutral target allocation |
|
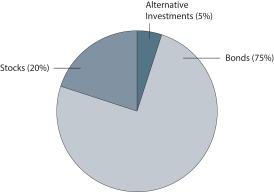 |
| 1 | Reflects the expense ratios as stated in the most recent prospectus, which include the impact of 0.53% of acquired fund fees and expenses and net expenses from affiliated master portfolios. The expense ratios shown are subject to change and may differ from the annualized expense ratios shown in the financial highlights of this report, which do not include acquired fund fees and expenses and net expenses from affiliated master portfolios. |
| 2 | The manager has contractually committed through September 30, 2017, to waive fees and/or reimburse expenses to the extent necessary to cap the Portfolio’s Total Annual Fund Operating Expenses After Fee Waiver at 1.50%. After this time, the cap may be increased or the commitment to maintain the cap may be terminated only with the approval of the Board of Trustees. Brokerage commissions, stamp duty fees, interest, taxes, acquired fund fees and expenses, net expenses from affiliated master portfolios, and extraordinary expenses are excluded from the expense cap. Without this cap, the Portfolio’s returns would have been lower. |
| 3 | Source: Wells Fargo Funds Management, LLC. The WealthBuilder Conservative Allocation Blended Index is comprised of the following indexes: Bloomberg Barclays U.S. Aggregate Bond Index (80%), MSCI ACWI ex USA Index (Net) (6%) and Russell 3000® Index (14%). You cannot invest directly in an index. |
| 4 | The Bloomberg Barclays U.S. Aggregate Bond Index (formerly known as Barclays U.S. Aggregate Bond Index) is a broad-based benchmark that measures the investment-grade, U.S. dollar–denominated, fixed-rate taxable bond market, including Treasuries, government-related and corporate securities, mortgage-backed securities (agency fixed-rate and hybrid adjustable rate mortgage pass-throughs), asset-backed securities, and commercial mortgage-backed securities. You cannot invest directly in an index. |
| 5 | The Morgan Stanley Capital International (MSCI) All Country World Index (ACWI) ex USA Index (Net) is a free-float-adjusted market-capitalization-weighted index that is designed to measure the equity market performance of developed markets, excluding the United States and Canada. Source: MSCI. MSCI makes no express or implied warranties or representations and shall have no liability whatsoever with respect to any MSCI data contained herein. The MSCI data may not be further redistributed or used as a basis for other indexes or any securities or financial products. This report is not approved, reviewed, or produced by MSCI. You cannot invest directly in an index. |
| 6 | The Russell 3000® Index measures the performance of the 3,000 largest U.S. companies based on total market capitalization, which represents approximately 98% of the investable U.S. equity market. You cannot invest directly in an index. |
| 7 | The ten largest holdings, excluding cash and cash equivalents, are calculated based on the value of the investments divided by the total net assets of the Portfolio. Holdings are subject to change and may have changed since the date specified. |
| 8 | Current target allocation includes the effect of any tactical futures overlay that may be in place. Effective cash is comprised of the net impact of long and/ or short futures contracts held as part of dynamic risk management strategy. The amounts are subject to change and may have changed since the date specified. |
| | | | |
| 6 | | Wells Fargo WealthBuilder Portfolios | | Performance highlights (unaudited) |
Wells Fargo WealthBuilder Moderate Balanced Portfolio
Investment objective
The Portfolio seeks a combination of current income and capital appreciation.
Manager
Wells Fargo Funds Management, LLC
Subadviser
Wells Capital Management Incorporated
Portfolio managers
Kandarp R. Acharya, CFA®, FRM
Petros Bocray, CFA®, FRM
Christian L. Chan, CFA®
Average annual total returns (%) as of November 30, 2016
| | | | | | | | | | | | | | | | | | | | | | | | | | | | | | | | | | |
| | | | | Including sales charge | | | Excluding sales charge | | | Expense ratios1 (%) | |
| | | Inception date | | 1 year | | | 5 year | | | 10 year | | | 1 year | | | 5 year | | | 10 year | | | Gross | | | Net2 | |
| Wells Fargo WealthBuilder Moderate Balanced Portfolio (WBBBX) | | 9-30-2004 | | | 0.93 | | | | 4.74 | | | | 3.11 | | | | 2.46 | | | | 5.05 | | | | 3.27 | | | | 2.10 | | | | 2.10 | |
| WealthBuilder Moderate Balanced Blended Index3 | | – | | | – | | | | – | | | | – | | | | 3.79 | | | | 6.07 | | | | 5.01 | | | | – | | | | – | |
| Bloomberg Barclays U.S. Aggregate Bond Index4 | | – | | | – | | | | – | | | | – | | | | 2.17 | | | | 2.43 | | | | 4.27 | | | | – | | | | – | |
| MSCI ACWI ex USA Index (Net)5 | | – | | | – | | | | – | | | | – | | | | (0.03 | ) | | | 4.24 | | | | 1.02 | | | | – | | | | – | |
| Russell 3000® Index6 | | – | | | – | | | | – | | | | – | | | | 8.31 | | | | 14.41 | | | | 7.00 | | | | – | | | | – | |
Figures quoted represent past performance, which is no guarantee of future results, and do not reflect taxes that a shareholder may pay on fund distributions or the redemption of fund shares. Investment return and principal value of an investment will fluctuate so that an investor’s shares, when redeemed, may be worth more or less than their original cost. Performance shown without sales charges would be lower if sales charges were reflected. Current performance may be lower or higher than the performance data quoted, which assumes the reinvestment of dividends and capital gains. Current month-end performance is available on the Portfolio’s website, wellsfargofunds.com.
Index returns do not include transaction costs associated with buying and selling securities, any mutual fund fees or expenses, or any taxes. It is not possible to invest directly in an index.
For WealthBuilder Portfolios, the maximum front-end sales charge is 1.50%.
Balanced funds may invest in stocks and bonds. Stock values fluctuate in response to the activities of individual companies and general market and economic conditions. Bond values fluctuate in response to the financial condition of individual issuers, general market and economic conditions, and changes in interest rates. Changes in market conditions and government policies may lead to periods of heightened volatility in the bond market and reduced liquidity for certain bonds held by the Portfolio. In general, when interest rates rise, bond values fall and investors may lose principal value. Interest-rate changes and their impact on the Portfolio and its share price can be sudden and unpredictable. The use of derivatives may reduce returns and/or increase volatility. The Portfolio will indirectly be exposed to all of the risks of an investment in the underlying funds and will indirectly bear expenses of the underlying funds. Certain investment strategies tend to increase the total risk of an investment (relative to the broader market). The Portfolio is exposed to alternative investment risk, foreign investment risk, high-yield securities risk, mortgage-and asset-backed securities risk, and smaller-company investment risk. Consult the Portfolio’s prospectus for additional information on these and other risks.
Please see footnotes on page 7.
| | | | | | |
| Performance highlights (unaudited) | | Wells Fargo WealthBuilder Portfolios | | | 7 | |
Wells Fargo WealthBuilder Moderate Balanced Portfolio (continued)
| | | | |
| Ten largest holdings (%) as of November 30, 20167 | |
Wells Fargo Core Bond Portfolio | | | 17.17 | |
Wells Fargo Short Duration Government Bond Fund Class R6 | | | 10.70 | |
Wells Fargo Government Securities Fund Institutional Class | | | 10.38 | |
PIMCO High Yield Fund Institutional Class | | | 6.41 | |
MFS Value Fund Class I | | | 6.09 | |
Oppenheimer International Bond Fund Class I | | | 4.32 | |
Thornburg International Value Fund Institutional Class | | | 3.63 | |
T. Rowe Price Blue Chip Growth Fund Retail Class | | | 3.23 | |
Invesco Growth and Income Fund Class R6 | | | 3.08 | |
Oakmark Fund Class I | | | 3.07 | |
|
| Current target allocation as of November 30, 20168 |
|
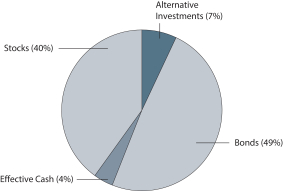 |
|
| Neutral target allocation |
|
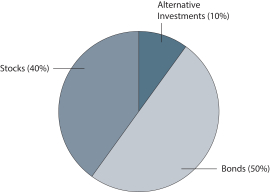 |
| 1 | Reflects the expense ratios as stated in the most recent prospectus, which include the impact of 0.61% of acquired fund fees and expenses and net expenses from affiliated master portfolios. The expense ratios shown are subject to change and may differ from the annualized expense ratios shown in the financial highlights of this report, which do not include acquired fund fees and expenses and net expenses from affiliated master portfolios. |
| 2 | The manager has contractually committed through September 30, 2017, to waive fees and/or reimburse expenses to the extent necessary to cap the Portfolio’s Total Annual Fund Operating Expenses After Fee Waiver at 1.50%. After this time, the cap may be increased or the commitment to maintain the cap may be terminated only with the approval of the Board of Trustees. Brokerage commissions, stamp duty fees, interest, taxes, acquired fund fees and expenses, net expenses from affiliated master portfolios, and extraordinary expenses are excluded from the expense cap. Without this cap, the Portfolio’s returns would have been lower. |
| 3 | Source: Wells Fargo Funds Management, LLC. The WealthBuilder Moderate Balanced Blended Index is comprised of the following indexes: Bloomberg Barclays U.S. Aggregate Bond Index (60%), MSCI ACWI ex USA Index (Net) (12%) and Russell 3000® Index (28%). You cannot invest directly in an index. |
| 4 | The Bloomberg Barclays U.S. Aggregate Bond Index (formerly known as Barclays U.S. Aggregate Bond Index) is a broad-based benchmark that measures the investment-grade, U.S. dollar–denominated, fixed-rate taxable bond market, including Treasuries, government-related and corporate securities, mortgage-backed securities (agency fixed-rate and hybrid adjustable rate mortgage pass-throughs), asset-backed securities, and commercial mortgage-backed securities. You cannot invest directly in an index. |
| 5 | The Morgan Stanley Capital International (MSCI) All Country World Index (ACWI) ex USA Index (Net) is a free-float-adjusted market-capitalization-weighted index that is designed to measure the equity market performance of developed markets, excluding the United States and Canada. Source: MSCI. MSCI makes no express or implied warranties or representations and shall have no liability whatsoever with respect to any MSCI data contained herein. The MSCI data may not be further redistributed or used as a basis for other indexes or any securities or financial products. This report is not approved, reviewed, or produced by MSCI. You cannot invest directly in an index. |
| 6 | The Russell 3000® Index measures the performance of the 3,000 largest U.S. companies based on total market capitalization, which represents approximately 98% of the investable U.S. equity market. You cannot invest directly in an index. |
| 7 | The ten largest holdings, excluding cash and cash equivalents, are calculated based on the value of the investments divided by the total net assets of the Portfolio. Holdings are subject to change and may have changed since the date specified. |
| 8 | Current target allocation includes the effect of any tactical futures overlay that may be in place. Effective cash is comprised of the net impact of long and/ or short futures contracts held as part of dynamic risk management strategy. The amounts are subject to change and may have changed since the date specified. |
| | | | |
| 8 | | Wells Fargo WealthBuilder Portfolios | | Performance highlights (unaudited) |
Wells Fargo WealthBuilder Growth Balanced Portfolio
Investment objective
The Portfolio seeks a combination of current income and capital appreciation.
Manager
Wells Fargo Funds Management, LLC
Subadviser
Wells Capital Management Incorporated
Portfolio managers
Kandarp R. Acharya, CFA®, FRM
Petros Bocray, CFA®, FRM
Christian L. Chan, CFA®
Average annual total returns (%) as of November 30, 2016
| | | | | | | | | | | | | | | | | | | | | | | | | | | | | | | | | | |
| | | | | Including sales charge | | | Excluding sales charge | | | Expense ratios1 (%) | |
| | | Inception date | | 1 year | | | 5 year | | | 10 year | | | 1 year | | | 5 year | | | 10 year | | | Gross | | | Net2 | |
| Wells Fargo WealthBuilder Growth Balanced Portfolio (WBGBX) | | 10-1-1997 | | | 1.24 | | | | 7.10 | | | | 3.16 | | | | 2.78 | | | | 7.42 | | | | 3.32 | | | | 2.17 | | | | 2.17 | |
| WealthBuilder Growth Balanced Blended Index3 | | – | | | – | | | | – | | | | – | | | | 4.52 | | | | 7.86 | | | | 5.21 | | | | – | | | | – | |
| Bloomberg Barclays U.S. Aggregate Bond Index4 | | – | | | – | | | | – | | | | – | | | | 2.17 | | | | 2.43 | | | | 4.27 | | | | – | | | | – | |
| MSCI ACWI ex USA Index (Net)5 | | – | | | – | | | | – | | | | – | | | | (0.03 | ) | | | 4.24 | | | | 1.02 | | | | – | | | | – | |
| Russell 3000® Index6 | | – | | | – | | | | – | | | | – | | | | 8.31 | | | | 14.41 | | | | 7.00 | | | | – | | | | – | |
Figures quoted represent past performance, which is no guarantee of future results, and do not reflect taxes that a shareholder may pay on fund distributions or the redemption of fund shares. Investment return and principal value of an investment will fluctuate so that an investor’s shares, when redeemed, may be worth more or less than their original cost. Performance shown without sales charges would be lower if sales charges were reflected. Current performance may be lower or higher than the performance data quoted, which assumes the reinvestment of dividends and capital gains. Current month-end performance is available on the Portfolio’s website, wellsfargofunds.com.
Index returns do not include transaction costs associated with buying and selling securities, any mutual fund fees or expenses, or any taxes. It is not possible to invest directly in an index.
For WealthBuilder Portfolios, the maximum front-end sales charge is 1.50%.
Balanced funds may invest in stocks and bonds. Stock values fluctuate in response to the activities of individual companies and general market and economic conditions. Bond values fluctuate in response to the financial condition of individual issuers, general market and economic conditions, and changes in interest rates. Changes in market conditions and government policies may lead to periods of heightened volatility in the bond market and reduced liquidity for certain bonds held by the Portfolio. In general, when interest rates rise, bond values fall and investors may lose principal value. Interest-rate changes and their impact on the Portfolio and its share price can be sudden and unpredictable. The use of derivatives may reduce returns and/or increase volatility. The Portfolio will indirectly be exposed to all of the risks of an investment in the underlying funds and will indirectly bear expenses of the underlying funds. Certain investment strategies tend to increase the total risk of an investment (relative to the broader market). The Portfolio is exposed to alternative investment risk, foreign investment risk, high-yield securities risk, mortgage- and asset-backed securities risk, and smaller-company investment risk. Consult the Portfolio’s prospectus for additional information on these and other risks.
Please see footnotes on page 9.
| | | | | | |
| Performance highlights (unaudited) | | Wells Fargo WealthBuilder Portfolios | | | 9 | |
Wells Fargo WealthBuilder Growth Balanced Portfolio (continued)
| | | | |
| Ten largest holdings (%) as of November 30, 20167 | |
Wells Fargo Core Bond Portfolio | | | 11.19 | |
MFS Value Fund Class I | | | 9.27 | |
Wells Fargo Government Securities Fund Institutional Class | | | 8.85 | |
Thornburg International Value Fund Institutional Class | | | 5.38 | |
T. Rowe Price Blue Chip Growth Fund Retail Class | | | 4.88 | |
PIMCO High Yield Fund Institutional Class | | | 4.85 | |
Invesco Growth and Income Fund Class R6 | | | 4.73 | |
Oakmark Fund Class I | | | 4.70 | |
Oppenheimer International Bond Fund Class I | | | 4.59 | |
American Century Growth Fund Institutional Class | | | 3.50 | |
|
| Current target allocation as of November 30, 20168 |
|
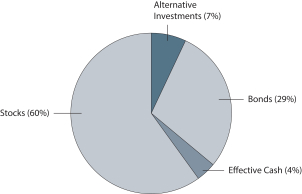 |
|
| Neutral target allocation |
|
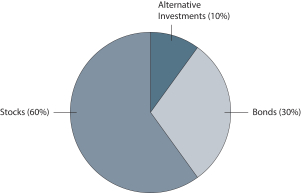 |
| 1 | Reflects the expense ratios as stated in the most recent prospectus, which include the impact of 0.68% of acquired fund fees and expenses and net expenses from affiliated master portfolios. The expense ratios shown are subject to change and may differ from the annualized expense ratios shown in the financial highlights of this report, which do not include acquired fund fees and expenses and net expenses from affiliated master portfolios. |
| 2 | The manager has contractually committed through September 30, 2017, to waive fees and/or reimburse expenses to the extent necessary to cap the Portfolio’s Total Annual Fund Operating Expenses After Fee Waiver at 1.50%. After this time, the cap may be increased or the commitment to maintain the cap may be terminated only with the approval of the Board of Trustees. Brokerage commissions, stamp duty fees, interest, taxes, acquired fund fees and expenses, net expenses from affiliated master portfolios, and extraordinary expenses are excluded from the expense cap. Without this cap, the Portfolio’s returns would have been lower. |
| 3 | Source: Wells Fargo Funds Management, LLC. The WealthBuilder Growth Balanced Blended Index is comprised of the following indexes: Bloomberg Barclays U.S. Aggregate Bond Index (40%), MSCI ACWI ex USA Index (Net) (18%) and Russell 3000® Index (42%). You cannot invest directly in an index. |
| 4 | The Bloomberg Barclays U.S. Aggregate Bond Index (formerly known as Barclays U.S. Aggregate Bond Index) is a broad-based benchmark that measures the investment-grade, U.S. dollar–denominated, fixed-rate taxable bond market, including Treasuries, government-related and corporate securities, mortgage-backed securities (agency fixed-rate and hybrid adjustable rate mortgage pass-throughs), asset-backed securities, and commercial mortgage-backed securities. You cannot invest directly in an index. |
| 5 | The Morgan Stanley Capital International (MSCI) All Country World Index (ACWI) ex USA Index (Net) is a free-float-adjusted market-capitalization-weighted index that is designed to measure the equity market performance of developed markets, excluding the United States and Canada. Source: MSCI. MSCI makes no express or implied warranties or representations and shall have no liability whatsoever with respect to any MSCI data contained herein. The MSCI data may not be further redistributed or used as a basis for other indexes or any securities or financial products. This report is not approved, reviewed, or produced by MSCI. You cannot invest directly in an index. |
| 6 | The Russell 3000® Index measures the performance of the 3,000 largest U.S. companies based on total market capitalization, which represents approximately 98% of the investable U.S. equity market. You cannot invest directly in an index. |
| 7 | The ten largest holdings, excluding cash and cash equivalents, are calculated based on the value of the investments divided by the total net assets of the Portfolio. Holdings are subject to change and may have changed since the date specified. |
| 8 | Current target allocation includes the effect of any tactical futures overlay that may be in place. Effective cash is comprised of the net impact of long and/ or short futures contracts held as part of dynamic risk management strategy. The amounts are subject to change and may have changed since the date specified. |
| | | | |
| 10 | | Wells Fargo WealthBuilder Portfolios | | Performance highlights (unaudited) |
Wells Fargo WealthBuilder Growth Allocation Portfolio
Investment objective
The Portfolio seeks capital appreciation with a secondary emphasis on current income.
Manager
Wells Fargo Funds Management, LLC
Subadviser
Wells Capital Management Incorporated
Portfolio managers
Kandarp R. Acharya, CFA®, FRM
Petros Bocray, CFA®, FRM
Christian L. Chan, CFA®
Average annual total returns (%) as of November 30, 2016
| | | | | | | | | | | | | | | | | | | | | | | | | | | | | | | | | | |
| | | | | Including sales charge | | | Excluding sales charge | | | Expense ratios1 (%) | |
| | | Inception date | | 1 year | | | 5 year | | | 10 year | | | 1 year | | | 5 year | | | 10 year | | | Gross | | | Net2 | |
| Wells Fargo WealthBuilder Growth Allocation Portfolio (WBGGX) | | 9-30-2004 | | | 1.23 | | | | 8.19 | | | | 3.09 | | | | 2.77 | | | | 8.52 | | | | 3.24 | | | | 2.25 | | | | 2.24 | |
| WealthBuilder Growth Allocation Blended Index3 | | – | | | – | | | | – | | | | – | | | | 5.20 | | | | 9.61 | | | | 5.29 | | | | – | | | | – | |
| Bloomberg Barclays U.S. Aggregate Bond Index4 | | – | | | – | | | | – | | | | – | | | | 2.17 | | | | 2.43 | | | | 4.27 | | | | – | | | | – | |
| MSCI ACWI ex USA Index (Net)5 | | – | | | – | | | | – | | | | – | | | | (0.03 | ) | | | 4.24 | | | | 1.02 | | | | – | | | | – | |
| Russell 3000® Index6 | | – | | | – | | | | – | | | | – | | | | 8.31 | | | | 14.41 | | | | 7.00 | | | | – | | | | – | |
Figures quoted represent past performance, which is no guarantee of future results, and do not reflect taxes that a shareholder may pay on fund distributions or the redemption of fund shares. Investment return and principal value of an investment will fluctuate so that an investor’s shares, when redeemed, may be worth more or less than their original cost. Performance shown without sales charges would be lower if sales charges were reflected. Current performance may be lower or higher than the performance data quoted, which assumes the reinvestment of dividends and capital gains. Current month-end performance is available on the Portfolio’s website, wellsfargofunds.com.
Index returns do not include transaction costs associated with buying and selling securities, any mutual fund fees or expenses, or any taxes. It is not possible to invest directly in an index.
For WealthBuilder Portfolios, the maximum front-end sales charge is 1.50%.
Balanced funds may invest in stocks and bonds. Stock values fluctuate in response to the activities of individual companies and general market and economic conditions. Bond values fluctuate in response to the financial condition of individual issuers, general market and economic conditions, and changes in interest rates. Changes in market conditions and government policies may lead to periods of heightened volatility in the bond market and reduced liquidity for certain bonds held by the Portfolio. In general, when interest rates rise, bond values fall and investors may lose principal value. Interest-rate changes and their impact on the Portfolio and its share price can be sudden and unpredictable. The use of derivatives may reduce returns and/or increase volatility. The Portfolio will indirectly be exposed to all of the risks of an investment in the underlying funds and will indirectly bear expenses of the underlying funds. Certain investment strategies tend to increase the total risk of an investment (relative to the broader market). The Portfolio is exposed to alternative investment risk, foreign investment risk, high-yield securities risk, mortgage- and asset-backed securities risk, and smaller-company investment risk. Consult the Portfolio’s prospectus for additional information on these and other risks.
Please see footnotes on page 11.
| | | | | | |
| Performance highlights (unaudited) | | Wells Fargo WealthBuilder Portfolios | | | 11 | |
Wells Fargo WealthBuilder Growth Allocation Portfolio (continued)
| | | | |
| Ten largest holdings (%) as of November 30, 20167 | |
MFS Value Fund Class I | | | 12.25 | |
Thornburg International Value Fund Institutional Class | | | 7.05 | |
T. Rowe Price Blue Chip Growth Fund Retail Class | | | 6.43 | |
Invesco Growth and Income Fund Class R6 | | | 6.29 | |
Oakmark Fund Class I | | | 6.23 | |
American Century Growth Fund Institutional Class | | | 4.62 | |
Wells Fargo Large Cap Growth Fund Class R6 | | | 3.68 | |
Wells Fargo Endeavor Select Fund Institutional Class | | | 3.64 | |
Royce Pennsylvania Mutal Fund Institutional Class | | | 3.18 | |
Wells Fargo Small Cap Value Fund Class R6 | | | 3.13 | |
|
| Current target allocation as of November 30, 20168 |
|
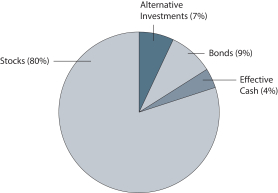 |
|
| Neutral target allocation |
|
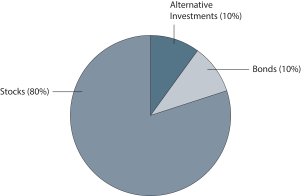 |
| 1 | Reflects the expense ratios as stated in the most recent prospectus, which include the impact of 0.74% of acquired fund fees and expenses and net expenses from affiliated master portfolios. The expense ratios shown are subject to change and may differ from the annualized expense ratios shown in the financial highlights of this report, which do not include acquired fund fees and expenses and net expenses from affiliated master portfolios. |
| 2 | The manager has contractually committed through September 30, 2017, to waive fees and/or reimburse expenses to the extent necessary to cap the Portfolio’s Total Annual Fund Operating Expenses After Fee Waiver at 1.50%. After this time, the cap may be increased or the commitment to maintain the cap may be terminated only with the approval of the Board of Trustees. Brokerage commissions, stamp duty fees, interest, taxes, acquired fund fees and expenses, net expenses from affiliated master portfolios, and extraordinary expenses are excluded from the expense cap. Without this cap, the Portfolio’s returns would have been lower. |
| 3 | Source: Wells Fargo Funds Management, LLC. The WealthBuilder Growth Allocation Blended Index is comprised of the following indexes: Bloomberg Barclays U.S. Aggregate Bond Index (20%), MSCI ACWI ex USA Index (Net) (24%) and Russell 3000® Index (56%). You cannot invest directly in an index. |
| 4 | The Bloomberg Barclays U.S. Aggregate Bond Index (formerly known as Barclays U.S. Aggregate Bond Index) is a broad-based benchmark that measures the investment-grade, U.S. dollar–denominated, fixed-rate taxable bond market, including Treasuries, government-related and corporate securities, mortgage-backed securities (agency fixed-rate and hybrid adjustable rate mortgage pass-throughs), asset-backed securities, and commercial mortgage-backed securities. You cannot invest directly in an index. |
| 5 | The Morgan Stanley Capital International (MSCI) All Country World Index (ACWI) ex USA Index (Net) is a free-float-adjusted market-capitalization-weighted index that is designed to measure the equity market performance of developed markets, excluding the United States and Canada. Source: MSCI. MSCI makes no express or implied warranties or representations and shall have no liability whatsoever with respect to any MSCI data contained herein. The MSCI data may not be further redistributed or used as a basis for other indexes or any securities or financial products. This report is not approved, reviewed, or produced by MSCI. You cannot invest directly in an index. |
| 6 | The Russell 3000® Index measures the performance of the 3,000 largest U.S. companies based on total market capitalization, which represents approximately 98% of the investable U.S. equity market. You cannot invest directly in an index. |
| 7 | The ten largest holdings, excluding cash and cash equivalents, are calculated based on the value of the investments divided by the total net assets of the Portfolio. Holdings are subject to change and may have changed since the date specified. |
| 8 | Current target allocation includes the effect of any tactical futures overlay that may be in place. Effective cash is comprised of the net impact of long and/ or short futures contracts held as part of dynamic risk management strategy. The amounts are subject to change and may have changed since the date specified. |
| | | | |
| 12 | | Wells Fargo WealthBuilder Portfolios | | Performance highlights (unaudited) |
Wells Fargo WealthBuilder Equity Portfolio
Investment objective
The Portfolio seeks long-term capital appreciation with no emphasis on income.
Manager
Wells Fargo Funds Management, LLC
Subadviser
Wells Capital Management Incorporated
Portfolio managers
Kandarp R. Acharya, CFA®, FRM
Petros Bocray, CFA®, FRM
Christian L. Chan, CFA®
Average annual total returns (%) as of November 30, 2016
| | | | | | | | | | | | | | | | | | | | | | | | | | | | | | | | | | |
| | | | | Including sales charge | | | Excluding sales charge | | | Expense ratios1 (%) | |
| | | Inception date | | 1 year | | | 5 year | | | 10 year | | | 1 year | | | 5 year | | | 10 year | | | Gross | | | Net2 | |
| Wells Fargo WealthBuilder Equity Portfolio (WBGAX) | | 10-1-1997 | | | 0.66 | | | | 8.63 | | | | 3.02 | | | | 2.19 | | | | 8.96 | | | | 3.17 | | | | 2.27 | | | | 2.27 | |
| WealthBuilder Equity Blended Index3 | | – | | | – | | | | – | | | | – | | | | 5.81 | | | | 11.34 | | | | 5.26 | | | | – | | | | – | |
| MSCI ACWI ex USA Index (Net)4 | | – | | | – | | | | – | | | | – | | | | (0.03 | ) | | | 4.24 | | | | 1.02 | | | | – | | | | – | |
| Russell 3000® Index5 | | – | | | – | | | | – | | | | – | | | | 8.31 | | | | 14.41 | | | | 7.00 | | | | – | | | | – | |
Figures quoted represent past performance, which is no guarantee of future results, and do not reflect taxes that a shareholder may pay on fund distributions or the redemption of fund shares. Investment return and principal value of an investment will fluctuate so that an investor’s shares, when redeemed, may be worth more or less than their original cost. Performance shown without sales charges would be lower if sales charges were reflected. Current performance may be lower or higher than the performance data quoted, which assumes the reinvestment of dividends and capital gains. Current month-end performance is available on the Portfolio’s website, wellsfargofunds.com.
Index returns do not include transaction costs associated with buying and selling securities, any mutual fund fees or expenses, or any taxes. It is not possible to invest directly in an index.
For WealthBuilder Portfolios, the maximum front-end sales charge is 1.50%.
Stock values fluctuate in response to the activities of individual companies and general market and economic conditions. The Portfolio will indirectly be exposed to all of the risks of an investment in the underlying funds and will indirectly bear expenses of the underlying funds. The use of derivatives may reduce returns and/or increase volatility. Certain investment strategies tend to increase the total risk of an investment (relative to the broader market). The Portfolio is exposed to alternative investment risk, foreign investment risk and smaller-company investment risk. Consult the Portfolio’s prospectus for additional information on these and other risks.
Please see footnotes on page 13.
| | | | | | |
| Performance highlights (unaudited) | | Wells Fargo WealthBuilder Portfolios | | | 13 | |
Wells Fargo WealthBuilder Equity Portfolio (continued)
| | | | |
| Ten largest holdings (%) as of November 30, 20166 | |
MFS Value Fund Class I | | | 15.22 | |
Thornburg International Value Fund Institutional Class | | | 8.73 | |
T. Rowe Price Blue Chip Growth Fund Retail Class | | | 7.99 | |
Invesco Growth and Income Fund Class R6 | | | 7.81 | |
Oakmark Fund Class I | | | 7.75 | |
American Century Growth Fund Institutional Class | | | 5.74 | |
Wells Fargo International Growth Portfolio | | | 5.64 | |
Wells Fargo Large Cap Growth Fund Class R6 | | | 4.57 | |
Wells Fargo Endeavor Select Fund Institutional Class | | | 4.52 | |
Wells Fargo Small Company Value Portfolio | | | 3.95 | |
|
| Portfolio allocation as of November 30, 20167 |
|
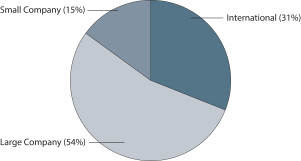 |
| 1 | Reflects the expense ratios as stated in the most recent prospectus, which include the impact of 0.77% of acquired fund fees and expenses and net expenses from affiliated master portfolios. The expense ratios shown are subject to change and may differ from the annualized expense ratios shown in the financial highlights of this report, which do not include acquired fund fees and expenses and net expenses from affiliated master portfolios. |
| 2 | The manager has contractually committed through September 30, 2017, to waive fees and/or reimburse expenses to the extent necessary to cap the Portfolio’s Total Annual Fund Operating Expenses After Fee Waiver at 1.50%. After this time, the cap may be increased or the commitment to maintain the cap may be terminated only with the approval of the Board of Trustees. Brokerage commissions, stamp duty fees, interest, taxes, acquired fund fees and expenses, net expenses from affiliated master portfolios, and extraordinary expenses are excluded from the expense cap. Without this cap, the Portfolio’s returns would have been lower. |
| 3 | Source: Wells Fargo Funds Management, LLC. The WealthBuilder Equity Blended Index is weighted 30% in the MSCI ACWI ex USA Index (Net) and 70% in the Russell 3000® Index. You cannot invest directly in an index. |
| 4 | The Morgan Stanley Capital International (MSCI) All Country World Index (ACWI) ex USA Index (Net) is a free-float-adjusted market-capitalization-weighted index that is designed to measure the equity market performance of developed markets, excluding the United States and Canada. Source: MSCI. MSCI makes no express or implied warranties or representations and shall have no liability whatsoever with respect to any MSCI data contained herein. The MSCI data may not be further redistributed or used as a basis for other indexes or any securities or financial products. This report is not approved, reviewed, or produced by MSCI. You cannot invest directly in an index. |
| 5 | The Russell 3000® Index measures the performance of the 3,000 largest U.S. companies based on total market capitalization, which represents approximately 98% of the investable U.S. equity market. You cannot invest directly in an index. |
| 6 | The ten largest holdings, excluding cash and cash equivalents, are calculated based on the value of the investments divided by the total net assets of the Portfolio. Holdings are subject to change and may have changed since the date specified. |
| 7 | Amounts are calculated based on the long-term investments of the Portfolio. These amounts are subject to change and may have changed since the date specified. |
| | | | |
| 14 | | Wells Fargo WealthBuilder Portfolios | | Fund expenses (unaudited) |
As a shareholder of the Portfolio, you incur two types of costs: (1) transaction costs, including sales charges (loads) on purchase payments and (2) ongoing costs, including management fees, distribution (12b-1) and/or shareholder servicing fees, and other Portfolio expenses. This example is intended to help you understand your ongoing costs (in dollars) of investing in the Portfolio and to compare these costs with the ongoing costs of investing in other mutual funds.
The example is based on an investment of $1,000 invested at the beginning of the six-month period and held for the entire period from June 1, 2016 to November 30, 2016.
Actual expenses
The “Actual” line of the table below provides information about actual account values and actual expenses. You may use the information in this line, together with the amount you invested, to estimate the expenses that you paid over the period. Simply divide your account value by $1,000 (for example, an $8,600 account value divided by $1,000 = 8.6), then multiply the result by the number in the “Actual” line under the heading entitled “Expenses paid during period” for your applicable class of shares to estimate the expenses you paid on your account during this period.
Hypothetical example for comparison purposes
The “Hypothetical” line of the table below provides information about hypothetical account values and hypothetical expenses based on the Portfolio’s actual expense ratio and an assumed rate of return of 5% per year before expenses, which is not the Portfolio’s actual return. The hypothetical account values and expenses may not be used to estimate the actual ending account balance or expenses you paid for the period. You may use this information to compare the ongoing costs of investing in the Portfolio and other funds. To do so, compare this 5% hypothetical example with the 5% hypothetical examples that appear in the shareholder reports of the other funds.
Please note that the expenses shown in the table are meant to highlight your ongoing costs only and do not reflect any transactional costs, such as sales charges (loads) and contingent deferred sales charges. Therefore, the “Hypothetical” line of the table is useful in comparing ongoing costs only and will not help you determine the relative total costs of owning different funds. In addition, if these transactional costs were included, your costs would have been higher.
| | | | | | | | | | | | | | | | |
| | | Beginning
account value
6-1-2016 | | | Ending
account value
11-30-2016 | | | Expenses
paid during
the period¹ | | | Annualized net
expense ratio | |
Wells Fargo WealthBuilder Conservative Allocation Portfolio | | | | | | | | | | | | | | | | |
Actual | | $ | 1,000.00 | | | $ | 1,006.54 | | | $ | 7.52 | | | | 1.50 | % |
Hypothetical (5% return before expenses) | | $ | 1,000.00 | | | $ | 1,017.50 | | | $ | 7.57 | | | | 1.50 | % |
Wells Fargo WealthBuilder Moderate Balanced Portfolio | | | | | | | | | | | | | | | | |
Actual | | $ | 1,000.00 | | | $ | 1,018.96 | | | $ | 7.52 | | | | 1.49 | % |
Hypothetical (5% return before expenses) | | $ | 1,000.00 | | | $ | 1,017.55 | | | $ | 7.52 | | | | 1.49 | % |
Wells Fargo WealthBuilder Growth Balanced Portfolio | | | | | | | | | | | | | | | | |
Actual | | $ | 1,000.00 | | | $ | 1,030.10 | | | $ | 7.56 | | | | 1.49 | % |
Hypothetical (5% return before expenses) | | $ | 1,000.00 | | | $ | 1,017.55 | | | $ | 7.52 | | | | 1.49 | % |
Wells Fargo WealthBuilder Growth Allocation Portfolio | | | | | | | | | | | | | | | | |
Actual | | $ | 1,000.00 | | | $ | 1,040.33 | | | $ | 7.65 | | | | 1.50 | % |
Hypothetical (5% return before expenses) | | $ | 1,000.00 | | | $ | 1,017.50 | | | $ | 7.57 | | | | 1.50 | % |
Wells Fargo WealthBuilder Equity Portfolio | | | | | | | | | | | | | | | | |
Actual | | $ | 1,000.00 | | | $ | 1,048.77 | | | $ | 7.68 | | | | 1.50 | % |
Hypothetical (5% return before expenses) | | $ | 1,000.00 | | | $ | 1,017.50 | | | $ | 7.57 | | | | 1.50 | % |
| 1 | Expenses paid is equal to the annualized net expense ratio multiplied by the average account value over the period, multiplied by the number of days in the most recent fiscal half-year divided by the number of days in the fiscal year (to reflect the one-half-year period). |
| | | | | | |
| Portfolio of investments—November 30, 2016 (unaudited) | | Wells Fargo WealthBuilder Portfolios | | | 15 | |
WEALTHBUILDER CONSERVATIVE ALLOCATION PORTFOLIO
| | | | | | | | | | | | | | | | |
| Security name | | | | | | | | Shares | | | Value | |
| | | | |
Exchange-Traded Funds: 2.05% | | | | | | | | | | | | | | | | |
iShares MSCI Germany ETF | | | | | | | | | | | 39,711 | | | $ | 986,024 | |
iShares MSCI Japan ETF | | | | | | | | | | | 30,167 | | | | 1,505,032 | |
iShares National AMT-Free Municipal Bond ETF | | | | | | | | | | | 66,977 | | | | 7,146,446 | |
SPDR S&P 500 ETF | | | | | | | | | | | 2,269 | | | | 500,042 | |
| | | | |
Total Exchange-Traded Funds (Cost $10,087,108) | | | | | | | | | | | | | | | 10,137,544 | |
| | | | | | | | | | | | | | | | |
| | | | |
Investment Companies: 98.25% | | | | | | | | | | | | | | | | |
| | | | |
| Affiliated Master Portfolios: 26.55% | | | | | | | | | | | | | | | | |
Wells Fargo Core Bond Portfolio | | | | | | | | | | | | | | | 118,275,543 | |
Wells Fargo Emerging Growth Portfolio | | | | | | | | | | | | | | | 3,669,422 | |
Wells Fargo International Growth Portfolio | | | | | | | | | | | | | | | 5,797,655 | |
Wells Fargo Small Company Value Portfolio | | | | | | | | | | | | | | | 3,719,598 | |
| | | | |
| | | | | | | | | | | | | | | 131,462,218 | |
| | | | | | | | | | | | | | | | |
| | | | |
| Alternative Investment Funds: 6.48% | | | | | | | | | | | | | | | | |
AQR Managed Futures Strategy Fund Class R6 | | | | | | | | | | | 514,098 | | | | 4,806,812 | |
PIMCO CommodityRealReturn Strategy Fund Institutional Class | | | | | | | | | | | 1,946,013 | | | | 13,680,474 | |
The Arbitrage Fund Class I † | | | | | | | | | | | 377,322 | | | | 4,999,515 | |
Voya Global Real Estate Fund Class I | | | | | | | | | | | 460,957 | | | | 8,587,634 | |
| | | | |
| | | | | | | | | | | | | | | 32,074,435 | |
| | | | | | | | | | | | | | | | |
| | | | |
| Bond Funds: 47.39% | | | | | | | | | | | | | | | | |
Federated Institutional High Yield Bond Fund Institutional Class | | | | | | | | | | | 1,301,209 | | | | 12,673,777 | |
Oppenheimer International Bond Fund Class I | | | | | | | | | | | 4,008,887 | | | | 22,409,679 | |
PIMCO High Yield Fund Institutional Class | | | | | | | | | | | 4,384,357 | | | | 38,143,910 | |
Wells Fargo Government Securities Fund Institutional Class (l) | | | | | | | | | | | 6,272,472 | | | | 69,749,890 | |
Wells Fargo Short Duration Government Bond Fund Class R6 (l) | | | | | | | | | | | 9,237,125 | | | | 91,632,284 | |
| | | | |
| | | | | | | | | | | | | | | 234,609,540 | |
| | | | | | | | | | | | | | | | |
| | | | |
| Stock Funds: 17.83% | | | | | | | | | | | | | | | | |
American Century Growth Fund Institutional Class | | | | | | | | | | | 192,703 | | | | 5,696,302 | |
Calamos Market Neutral Income Fund Class I | | | | | | | | | | | 383,003 | | | | 5,005,848 | |
DFA International Small Cap Value Portfolio Institutional Class | | | | | | | | | | | 104,286 | | | | 2,002,291 | |
Dodge & Cox International Stock Fund | | | | | | | | | | | 78,368 | | | | 3,021,072 | |
Invesco Growth and Income Fund Class R6 | | | | | | | | | | | 275,131 | | | | 7,563,358 | |
MFS Value Fund Class I | | | | | | | | | | | 410,030 | | | | 14,998,904 | |
Oakmark Fund Class I | | | | | | | | | | | 105,610 | | | | 7,535,262 | |
Oppenheimer Developing Markets Fund Class I | | | | | | | | | | | 45,378 | | | | 1,464,350 | |
Royce Pennsylvania Mutual Fund Institutional Class | | | | | | | | | | | 323,541 | | | | 3,730,427 | |
T. Rowe Price Blue Chip Growth Fund Retail Class † | | | | | | | | | | | 109,150 | | | | 7,977,772 | |
T. Rowe Price International Discovery Fund | | | | | | | | | | | 36,624 | | | | 1,975,846 | |
Templeton Institutional Foreign Equity Fund Primary Class | | | | | | | | | | | 161,846 | | | | 3,021,663 | |
Thornburg International Value Fund Institutional Class | | | | | | | | | | | 388,709 | | | | 9,018,051 | |
Wells Fargo Emerging Markets Equity Fund Class R6 (l) | | | | | | | | | | | 119,124 | | | | 2,421,799 | |
Wells Fargo Endeavor Select Fund Institutional Class †(l) | | | | | | | | | | | 482,657 | | | | 4,556,284 | |
Wells Fargo Large Cap Growth Fund Class R6 (l) | | | | | | | | | | | 99,395 | | | | 4,550,297 | |
Wells Fargo Small Cap Value Fund Class R6 †(l) | | | | | | | | | | | 170,036 | | | | 3,720,397 | |
| | | | |
| | | | | | | | | | | | | | | 88,259,923 | |
| | | | | | | | | | | | | | | | |
| | | | |
Total Investment Companies (Cost $473,208,647) | | | | | | | | | | | | | | | 486,406,116 | |
| | | | | | | | | | | | | | | | |
The accompanying notes are an integral part of these financial statements.
| | | | |
| 16 | | Wells Fargo WealthBuilder Portfolios | | Portfolio of investments—November 30, 2016 (unaudited) |
WEALTHBUILDER CONSERVATIVE ALLOCATION PORTFOLIO
| | | | | | | | | | | | | | | | |
| Security name | | Yield | | | | | | Shares | | | Value | |
| | | | |
Short-Term Investments: 0.07% | | | | | | | | | | | | | | | | |
| | | | |
| Investment Companies: 0.02% | | | | | | | | | | | | | | | | |
Wells Fargo Cash Investment Money Market Fund Select Class (l)(u) | | | 0.56 | % | | | | | | | 102,403 | | | $ | 102,403 | |
| | | | | | | | | | | | | | | | |
| | | | |
| | | | | | Maturity date | | | Principal | | | | |
| U.S. Treasury Securities: 0.05% | | | | | | | | | | | | | | | | |
U.S. Treasury Bill (z)# | | | 0.00 | | | | 12-1-2016 | | | $ | 110,000 | | | | 110,000 | |
U.S. Treasury Bill (z)# | | | 0.34 | | | | 12-29-2016 | | | | 110,000 | | | | 109,969 | |
| | |
| | | | | | | | 219,969 | |
| | | | | | | | | | | | | | | | |
| | |
Total Short-Term Investments (Cost $322,372) | | | | | | | | 322,372 | |
| | | | | | | | | | | | | | | | |
| | | | | | | | |
| Total investments in securities (Cost $483,618,127) * | | | 100.37 | % | | | 496,866,032 | |
Other assets and liabilities, net | | | (0.37 | ) | | | (1,809,998 | ) |
| | | | | | | | |
| Total net assets | | | 100.00 | % | | $ | 495,056,034 | |
| | | | | | | | |
| † | Non-income-earning security |
| (l) | The issuer of the security is an affiliated person of the Portfolio as defined in the Investment Company Act of 1940. |
| (u) | The rate represents the 7-day annualized yield at period end. |
| (z) | Zero coupon security. The rate represents the current yield to maturity. |
| # | All or a portion of this security is segregated as collateral for investments in derivative instruments. |
| * | Cost for federal income tax purposes is $480,975,139 and unrealized gains (losses) consists of: |
| | | | |
Gross unrealized gains | | $ | 30,595,500 | |
Gross unrealized losses | | | (14,704,607 | ) |
| | | | |
Net unrealized gains | | $ | 15,890,893 | |
The accompanying notes are an integral part of these financial statements.
| | | | | | |
| Portfolio of investments—November 30, 2016 (unaudited) | | Wells Fargo WealthBuilder Portfolios | | | 17 | |
WEALTHBUILDER MODERATE BALANCED PORTFOLIO
| | | | | | | | | | | | | | | | |
| Security name | | | | | | | | Shares | | | Value | |
| | | | |
Exchange-Traded Funds: 2.25% | | | | | | | | | | | | | | | | |
iShares MSCI Germany ETF | | | | | | | | | | | 123,119 | | | $ | 3,057,045 | |
iShares MSCI Japan ETF | | | | | | | | | | | 94,419 | | | | 4,710,564 | |
iShares National AMT-Free Municipal Bond ETF | | | | | | | | | | | 75,294 | | | | 8,033,870 | |
SPDR S&P 500 ETF | | | | | | | | | | | 7,179 | | | | 1,582,108 | |
| | | | |
Total Exchange-Traded Funds (Cost $17,039,262) | | | | | | | | | | | | | | | 17,383,587 | |
| | | | | | | | | | | | | | | | |
| | | | |
Investment Companies: 98.01% | | | | | | | | | | | | | | | | |
| | | | |
| Affiliated Master Portfolios: 22.60% | | | | | | | | | | | | | | | | |
Wells Fargo Core Bond Portfolio | | | | | | | | | | | | | | | 133,042,234 | |
Wells Fargo Emerging Growth Portfolio | | | | | | | | | | | | | | | 11,591,136 | |
Wells Fargo International Growth Portfolio | | | | | | | | | | | | | | | 18,033,515 | |
Wells Fargo Small Company Value Portfolio | | | | | | | | | | | | | | | 11,763,483 | |
| | | | |
| | | | | | | | | | | | | | | 174,430,368 | |
| | | | | | | | | | | | | | | | |
| | | | |
| Alternative Investment Funds: 6.46% | | | | | | | | | | | | | | | | |
AQR Managed Futures Strategy Fund Class R6 | | | | | | | | | | | 788,511 | | | | 7,372,574 | |
PIMCO CommodityRealReturn Strategy Fund Institutional Class | | | | | | | | | | | 3,037,808 | | | | 21,355,793 | |
The Arbitrage Fund Class I † | | | | | | | | | | | 591,992 | | | | 7,843,897 | |
Voya Global Real Estate Fund Class I | | | | | | | | | | | 712,886 | | | | 13,281,066 | |
| | | | |
| | | | | | | | | | | | | | | 49,853,330 | |
| | | | | | | | | | | | | | | | |
| | | | |
| Bond Funds: 34.08% | | | | | | | | | | | | | | | | |
Federated Institutional High Yield Bond Fund Institutional Class | | | | | | | | | | | 1,696,298 | | | | 16,521,942 | |
Oppenheimer International Bond Fund Class I | | | | | | | | | | | 5,985,304 | | | | 33,457,852 | |
PIMCO High Yield Fund Institutional Class | | | | | | | | | | | 5,705,357 | | | | 49,636,605 | |
Wells Fargo Government Securities Fund Institutional Class (l) | | | | | | | | | | | 7,232,623 | | | | 80,426,766 | |
Wells Fargo Short Duration Government Bond Fund Class R6 (l) | | | | | | | | | | | 8,361,780 | | | | 82,948,854 | |
| | | | |
| | | | | | | | | | | | | | | 262,992,019 | |
| | | | | | | | | | | | | | | | |
| | | | |
| Stock Funds: 34.87% | | | | | | | | | | | | | | | | |
American Century Growth Fund Institutional Class | | | | | | | | | | | 605,803 | | | | 17,907,548 | |
Calamos Market Neutral Income Fund Class I | | | | | | | | | | | 600,657 | | | | 7,850,587 | |
DFA International Small Cap Value Portfolio Institutional Class | | | | | | | | | | | 326,774 | | | | 6,274,057 | |
Dodge & Cox International Stock Fund | | | | | | | | | | | 244,128 | | | | 9,411,139 | |
Invesco Growth and Income Fund Class R6 | | | | | | | | | | | 867,483 | | | | 23,847,107 | |
MFS Value Fund Class I | | | | | | | | | | | 1,289,507 | | | | 47,170,182 | |
Oakmark Fund Class I | | | | | | | | | | | 333,486 | | | | 23,794,221 | |
Oppenheimer Developing Markets Fund Class I | | | | | | | | | | | 140,300 | | | | 4,527,468 | |
Royce Pennsylvania Mutual Fund Institutional Class | | | | | | | | | | | 1,021,493 | | | | 11,777,815 | |
T. Rowe Price Blue Chip Growth Fund Retail Class † | | | | | | | | | | | 342,797 | | | | 25,055,019 | |
T. Rowe Price International Discovery Fund | | | | | | | | | | | 114,139 | | | | 6,157,797 | |
Templeton Institutional Foreign Equity Fund Primary Class | | | | | | | | | | | 504,698 | | | | 9,422,709 | |
Thornburg International Value Fund Institutional Class | | | | | | | | | | | 1,212,506 | | | | 28,130,148 | |
Wells Fargo Emerging Markets Equity Fund Class R6 (l) | | | | | | | | | | | 367,806 | | | | 7,477,495 | |
Wells Fargo Endeavor Select Fund Institutional Class †(l) | | | | | | | | | | | 1,513,491 | | | | 14,287,356 | |
Wells Fargo Large Cap Growth Fund Class R6 (l) | | | | | | | | | | | 312,337 | | | | 14,298,768 | |
Wells Fargo Small Cap Value Fund Class R6 †(l) | | | | | | | | | | | 536,428 | | | | 11,737,051 | |
| | | | |
| | | | | | | | | | | | | | | 269,126,467 | |
| | | | | | | | | | | | | | | | |
| | | | |
Total Investment Companies (Cost $725,836,772) | | | | | | | | | | | | | | | 756,402,184 | |
| | | | | | | | | | | | | | | | |
The accompanying notes are an integral part of these financial statements.
| | | | |
| 18 | | Wells Fargo WealthBuilder Portfolios | | Portfolio of investments—November 30, 2016 (unaudited) |
WEALTHBUILDER MODERATE BALANCED PORTFOLIO
| | | | | | | | | | | | | | | | |
| Security name | | Yield | | | | | | Shares | | | Value | |
| | | | |
Short-Term Investments: 0.15% | | | | | | | | | | | | | | | | |
| | | | |
| Investment Companies: 0.06% | | | | | | | | | | | | | | | | |
Wells Fargo Cash Investment Money Market Fund Select Class (l)(u) | | | 0.56 | % | | | | | | | 457,714 | | | $ | 457,714 | |
| | | | | | | | | | | | | | | | |
| | | | |
| | | | | | Maturity date | | | Principal | | | | |
| U.S. Treasury Securities: 0.09% | | | | | | | | | | | | | | | | |
U.S. Treasury Bill (z)# | | | 0.00 | | | | 12-1-2016 | | | $ | 349,000 | | | | 349,000 | |
U.S. Treasury Bill (z)# | | | 0.34 | | | | 12-29-2016 | | | | 349,000 | | | | 348,903 | |
| | |
| | | | | | | | 697,903 | |
| | | | | | | | | | | | | | | | |
| | |
Total Short-Term Investments (Cost $1,155,617) | | | | | | | | 1,155,617 | |
| | | | | | | | | | | | | | | | |
| | | | | | | | |
| Total investments in securities (Cost $744,031,651) * | | | 100.41 | % | | | 774,941,388 | |
Other assets and liabilities, net | | | (0.41 | ) | | | (3,146,586 | ) |
| | | | | | | | |
| Total net assets | | | 100.00 | % | | $ | 771,794,802 | |
| | | | | | | | |
| † | Non-income-earning security |
| (l) | The issuer of the security is an affiliated person of the Portfolio as defined in the Investment Company Act of 1940. |
| (u) | The rate represents the 7-day annualized yield at period end. |
| (z) | Zero coupon security. The rate represents the current yield to maturity. |
| # | All or a portion of this security is segregated as collateral for investments in derivative instruments. |
| * | Cost for federal income tax purposes is $736,559,480 and unrealized gains (losses) consists of: |
| | | | |
Gross unrealized gains | | $ | 61,941,832 | |
Gross unrealized losses | | | (23,559,924 | ) |
| | | | |
Net unrealized gains | | $ | 38,381,908 | |
The accompanying notes are an integral part of these financial statements.
| | | | | | |
| Portfolio of investments—November 30, 2016 (unaudited) | | Wells Fargo WealthBuilder Portfolios | | | 19 | |
WEALTHBUILDER GROWTH BALANCED PORTFOLIO
| | | | | | | | | | | | | | | | |
| Security name | | | | | | | | Shares | | | Value | |
| | | | |
Exchange-Traded Funds: 2.45% | | | | | | | | | | | | | | | | |
iShares MSCI Germany ETF | | | | | | | | | | | 217,850 | | | $ | 5,409,216 | |
iShares MSCI Japan ETF | | | | | | | | | | | 168,740 | | | | 8,418,439 | |
iShares National AMT-Free Municipal Bond ETF | | | | | | | | | | | 55,458 | | | | 5,917,369 | |
SPDR S&P 500 ETF | | | | | | | | | | | 13,137 | | | | 2,895,132 | |
| | | | |
Total Exchange-Traded Funds (Cost $21,945,852) | | | | | | | | | | | | | | | 22,640,156 | |
| | | | | | | | | | | | | | | | |
| | | | |
Investment Companies: 97.55% | | | | | | | | | | | | | | | | |
| | | | |
| Affiliated Master Portfolios: 19.30% | | | | | | | | | | | | | | | | |
Wells Fargo Core Bond Portfolio | | | | | | | | | | | | | | | 103,331,192 | |
Wells Fargo Emerging Growth Portfolio | | | | | | | | | | | | | | | 21,184,878 | |
Wells Fargo International Growth Portfolio | | | | | | | | | | | | | | | 31,840,777 | |
Wells Fargo Small Company Value Portfolio | | | | | | | | | | | | | | | 21,860,208 | |
| | | | |
| | | | | | | | | | | | | | | 178,217,055 | |
| | | | | | | | | | | | | | | | |
| | | | |
| Alternative Investment Funds: 6.32% | | | | | | | | | | | | | | | | |
AQR Managed Futures Strategy Fund Class R6 | | | | | | | | | | | 910,368 | | | | 8,511,939 | |
PIMCO CommodityRealReturn Strategy Fund Institutional Class | | | | | | | | | | | 3,552,467 | | | | 24,973,846 | |
The Arbitrage Fund Class I † | | | | | | | | | | | 707,549 | | | | 9,375,023 | |
Voya Global Real Estate Fund Class I | | | | | | | | | | | 832,848 | | | | 15,515,951 | |
| | | | |
| | | | | | | | | | | | | | | 58,376,759 | |
| | | | | | | | | | | | | | | | |
| | | | |
| Bond Funds: 19.90% | | | | | | | | | | | | | | | | |
Federated Institutional High Yield Bond Fund Institutional Class | | | | | | | | | | | 1,515,651 | | | | 14,762,439 | |
Oppenheimer International Bond Fund Class I | | | | | | | | | | | 7,584,892 | | | | 42,399,545 | |
PIMCO High Yield Fund Institutional Class | | | | | | | | | | | 5,149,303 | | | | 44,798,935 | |
Wells Fargo Government Securities Fund Institutional Class (l) | | | | | | | | | | | 7,348,215 | | | | 81,712,155 | |
| | | | |
| | | | | | | | | | | | | | | 183,673,074 | |
| | | | | | | | | | | | | | | | |
| | | | |
| Stock Funds: 52.03% | | | | | | | | | | | | | | | | |
American Century Growth Fund Institutional Class | | | | | | | | | | | 1,091,683 | | | | 32,270,154 | |
Calamos Market Neutral Income Fund Class I | | | | | | | | | | | 702,203 | | | | 9,177,795 | |
DFA International Small Cap Value Portfolio Institutional Class | | | | | | | | | | | 581,047 | | | | 11,156,108 | |
Dodge & Cox International Stock Fund | | | | | | | | | | | 434,037 | | | | 16,732,121 | |
Invesco Growth and Income Fund Class R6 | | | | | | | | | | | 1,589,703 | | | | 43,700,934 | |
MFS Value Fund Class I | | | | | | | | | | | 2,339,919 | | | | 85,594,246 | |
Oakmark Fund Class I | | | | | | | | | | | 608,525 | | | | 43,418,287 | |
Oppenheimer Developing Markets Fund Class I | | | | | | | | | | | 248,033 | | | | 8,004,033 | |
Royce Pennsylvania Mutual Fund Institutional Class | | | | | | | | | | | 1,898,806 | | | | 21,893,229 | |
T. Rowe Price Blue Chip Growth Fund Retail Class † | | | | | | | | | | | 616,015 | | | | 45,024,517 | |
T. Rowe Price International Discovery Fund | | | | | | | | | | | 201,139 | | | | 10,851,461 | |
Templeton Institutional Foreign Equity Fund Primary Class | | | | | | | | | | | 894,640 | | | | 16,702,932 | |
Thornburg International Value Fund Institutional Class | | | | | | | | | | | 2,138,825 | | | | 49,620,747 | |
Wells Fargo Emerging Markets Equity Fund Class R6 (l) | | | | | | | | | | | 651,054 | | | | 13,235,931 | |
Wells Fargo Endeavor Select Fund Institutional Class †(l) | | | | | | | | | | | 2,704,011 | | | | 25,525,862 | |
Wells Fargo Large Cap Growth Fund Class R6 (l) | | | | | | | | | | | 562,068 | | | | 25,731,488 | |
Wells Fargo Small Cap Value Fund Class R6 †(l) | | | | | | | | | | | 989,243 | | | | 21,644,633 | |
| | | | |
| | | | | | | | | | | | | | | 480,284,478 | |
| | | | | | | | | | | | | | | | |
| | | | |
Total Investment Companies (Cost $838,244,382) | | | | | | | | | | | | | | | 900,551,366 | |
| | | | | | | | | | | | | | | | |
The accompanying notes are an integral part of these financial statements.
| | | | |
| 20 | | Wells Fargo WealthBuilder Portfolios | | Portfolio of investments—November 30, 2016 (unaudited) |
WEALTHBUILDER GROWTH BALANCED PORTFOLIO
| | | | | | | | | | | | | | | | |
| Security name | | Yield | | | | | | Shares | | | Value | |
| | | | |
Short-Term Investments: 0.33% | | | | | | | | | | | | | | | | |
| | | | |
| Investment Companies: 0.24% | | | | | | | | | | | | | | | | |
Wells Fargo Cash Investment Money Market Fund Select Class (l)(u) | | | 0.56 | % | | | | | | | 2,180,471 | | | $ | 2,180,471 | |
| | | | | | | | | | | | | | | | |
| | | | |
| | | | | | Maturity date | | | Principal | | | | |
| U.S. Treasury Securities: 0.09% | | | | | | | | | | | | | | | | |
U.S. Treasury Bill (z)# | | | 0.00 | | | | 12-1-2016 | | | $ | 411,000 | | | | 411,000 | |
U.S. Treasury Bill (z)# | | | 0.34 | | | | 12-29-2016 | | | | 411,000 | | | | 410,886 | |
| | | | |
| | | | | | | | | | | | | | | 821,886 | |
| | | | | | | | | | | | | | | | |
| | | | |
Total Short-Term Investments (Cost $3,002,357) | | | | | | | | | | | | | | | 3,002,357 | |
| | | | | | | | | | | | | | | | |
| | | | | | | | |
| Total investments in securities (Cost $863,192,591) * | | | 100.33 | % | | | 926,193,879 | |
Other assets and liabilities, net | | | (0.33 | ) | | | (3,074,084 | ) |
| | | | | | | | |
| Total net assets | | | 100.00 | % | | $ | 923,119,795 | |
| | | | | | | | |
| † | Non-income-earning security |
| (l) | The issuer of the security is an affiliated person of the Portfolio as defined in the Investment Company Act of 1940. |
| (u) | The rate represents the 7-day annualized yield at period end. |
| (z) | Zero coupon security. The rate represents the current yield to maturity. |
| # | All or a portion of this security is segregated as collateral for investments in derivative instruments. |
| * | Cost for federal income tax purposes is $852,371,992 and unrealized gains (losses) consists of: |
| | | | |
Gross unrealized gains | | $ | 112,570,693 | |
Gross unrealized losses | | | (38,748,806 | ) |
| | | | |
Net unrealized gains | | $ | 73,821,887 | |
The accompanying notes are an integral part of these financial statements.
| | | | | | |
| Portfolio of investments—November 30, 2016 (unaudited) | | Wells Fargo WealthBuilder Portfolios | | | 21 | |
WEALTHBUILDER GROWTH ALLOCATION PORTFOLIO
| | | | | | | | | | | | | | | | |
| Security name | | | | | | | | Shares | | | Value | |
| | | | |
Exchange-Traded Funds: 2.62% | | | | | | | | | | | | | | | | |
iShares MSCI Germany ETF | | | | | | | | | | | 127,473 | | | $ | 3,165,155 | |
iShares MSCI Japan ETF | | | | | | | | | | | 98,332 | | | | 4,905,783 | |
iShares National AMT-Free Municipal Bond ETF | | | | | | | | | | | 9,739 | | | | 1,039,151 | |
SPDR S&P 500 ETF | | | | | | | | | | | 7,646 | | | | 1,685,025 | |
| | | | |
Total Exchange-Traded Funds (Cost $10,352,940) | | | | | | | | | | | | | | | 10,795,114 | |
| | | | | | | | | | | | | | | | |
| | | | |
Investment Companies: 97.11% | | | | | | | | | | | | | | | | |
| | | | |
| Affiliated Master Portfolios: 15.26% | | | | | | | | | | | | | | | | |
Wells Fargo Core Bond Portfolio | | | | | | | | | | | | | | | 18,548,387 | |
Wells Fargo Emerging Growth Portfolio | | | | | | | | | | | | | | | 12,530,989 | |
Wells Fargo International Growth Portfolio | | | | | | | | | | | | | | | 18,640,774 | |
Wells Fargo Small Company Value Portfolio | | | | | | | | | | | | | | | 13,074,162 | |
| | | | |
| | | | | | | | | | | | | | | 62,794,312 | |
| | | | | | | | | | | | | | | | |
| | | | |
| Alternative Investment Funds: 6.25% | | | | | | | | | | | | | | | | |
AQR Managed Futures Strategy Fund Class R6 | | | | | | | | | | | 395,112 | | | | 3,694,301 | |
PIMCO CommodityRealReturn Strategy Fund Institutional Class | | | | | | | | | | | 1,580,085 | | | | 11,108,000 | |
The Arbitrage Fund Class I † | | | | | | | | | | | 310,564 | | | | 4,114,971 | |
Voya Global Real Estate Fund Class I | | | | | | | | | | | 366,188 | | | | 6,822,087 | |
| | | | |
| | | | | | | | | | | | | | | 25,739,359 | |
| | | | | | | | | | | | | | | | |
| | | | |
| Bond Funds: 7.21% | | | | | | | | | | | | | | | | |
Federated Institutional High Yield Bond Fund Institutional Class | | | | | | | | | | | 276,600 | | | | 2,694,080 | |
Oppenheimer International Bond Fund Class I | | | | | | | | | | | 1,399,347 | | | | 7,822,352 | |
PIMCO High Yield Fund Institutional Class | | | | | | | | | | | 945,753 | | | | 8,228,047 | |
Wells Fargo Government Securities Fund Institutional Class (l) | | | | | | | | | | | 981,918 | | | | 10,918,924 | |
| | | | |
| | | | | | | | | | | | | | | 29,663,403 | |
| | | | | | | | | | | | | | | | |
| | | | |
| Stock Funds: 68.39% | | | | | | | | | | | | | | | | |
American Century Growth Fund Institutional Class | | | | | | | | | | | 642,824 | | | | 19,001,888 | |
Calamos Market Neutral Income Fund Class I | | | | | | | | | | | 313,919 | | | | 4,102,920 | |
DFA International Small Cap Value Portfolio Institutional Class | | | | | | | | | | | 339,871 | | | | 6,525,517 | |
Dodge & Cox International Stock Fund | | | | | | | | | | | 254,123 | | | | 9,796,425 | |
Invesco Growth and Income Fund Class R6 | | | | | | | | | | | 941,171 | | | | 25,872,783 | |
MFS Value Fund Class I | | | | | | | | | | | 1,378,529 | | | | 50,426,592 | |
Oakmark Fund Class I | | | | | | | | | | | 359,460 | | | | 25,647,454 | |
Oppenheimer Developing Markets Fund Class I | | | | | | | | | | | 145,132 | | | | 4,683,424 | |
Royce Pennsylvania Mutual Fund Institutional Class | | | | | | | | | | | 1,134,228 | | | | 13,077,644 | |
T. Rowe Price Blue Chip Growth Fund Retail Class † | | | | | | | | | | | 362,249 | | | | 26,476,782 | |
T. Rowe Price International Discovery Fund | | | | | | | | | | | 117,883 | | | | 6,359,762 | |
Templeton Institutional Foreign Equity Fund Primary Class | | | | | | | | | | | 523,723 | | | | 9,777,911 | |
Thornburg International Value Fund Institutional Class | | | | | | | | | | | 1,250,158 | | | | 29,003,666 | |
Wells Fargo Emerging Markets Equity Fund Class R6 (l) | | | | | | | | | | | 381,797 | | | | 7,761,942 | |
Wells Fargo Endeavor Select Fund Institutional Class †(l) | | | | | | | | | | | 1,587,349 | | | | 14,984,571 | |
Wells Fargo Large Cap Growth Fund Class R6 (l) | | | | | | | | | | | 330,853 | | | | 15,146,468 | |
Wells Fargo Small Cap Value Fund Class R6 †(l) | | | | | | | | | | | 589,123 | | | | 12,890,002 | |
| | | | |
| | | | | | | | | | | | | | | 281,535,751 | |
| | | | | | | | | | | | | | | | |
| | | | |
Total Investment Companies (Cost $368,662,312) | | | | | | | | | | | | | | | 399,732,825 | |
| | | | | | | | | | | | | | | | |
The accompanying notes are an integral part of these financial statements.
| | | | |
| 22 | | Wells Fargo WealthBuilder Portfolios | | Portfolio of investments—November 30, 2016 (unaudited) |
WEALTHBUILDER GROWTH ALLOCATION PORTFOLIO
| | | | | | | | | | | | | | | | |
| Security name | | Yield | | | | | | Shares | | | Value | |
| | | | |
Short-Term Investments: 0.29% | | | | | | | | | | | | | | | | |
| | | | |
| Investment Companies: 0.20% | | | | | | | | | | | | | | | | |
Wells Fargo Cash Investment Money Market Fund Select Class (l)(u) | | | 0.56 | % | | | | | | | 842,952 | | | $ | 842,952 | |
| | | | | | | | | | | | | | | | |
| | | | |
| | | | | | Maturity date | | | Principal | | | | |
| U.S. Treasury Securities: 0.09% | | | | | | | | | | | | | | | | |
U.S. Treasury Bill (z)# | | | 0.00 | | | | 12-1-2016 | | | $ | 181,000 | | | | 181,000 | |
U.S. Treasury Bill (z)# | | | 0.34 | | | | 12-29-2016 | | | | 181,000 | | | | 180,950 | |
| | | | |
| | | | | | | | | | | | | | | 361,950 | |
| | | | | | | | | | | | | | | | |
| | | | |
Total Short-Term Investments (Cost $1,204,902) | | | | | | | | | | | | | | | 1,204,902 | |
| | | | | | | | | | | | | | | | |
| | | | | | | | |
| Total investments in securities (Cost $380,220,154) * | | | 100.02 | % | | | 411,732,841 | |
Other assets and liabilities, net | | | (0.02 | ) | | | (80,521 | ) |
| | | | | | | | |
| Total net assets | | | 100.00 | % | | $ | 411,652,320 | |
| | | | | | | | |
| † | Non-income-earning security |
| (l) | The issuer of the security is an affiliated person of the Portfolio as defined in the Investment Company Act of 1940. |
| (u) | The rate represents the 7-day annualized yield at period end. |
| (z) | Zero coupon security. The rate represents the current yield to maturity. |
| # | All or a portion of this security is segregated as collateral for investments in derivative instruments. |
| * | Cost for federal income tax purposes is $373,205,568 and unrealized gains (losses) consists of: |
| | | | |
Gross unrealized gains | | $ | 52,315,835 | |
Gross unrealized losses | | | (13,788,562 | ) |
| | | | |
Net unrealized gains | | $ | 38,527,273 | |
The accompanying notes are an integral part of these financial statements.
| | | | | | |
| Portfolio of investments—November 30, 2016 (unaudited) | | Wells Fargo WealthBuilder Portfolios | | | 23 | |
WEALTHBUILDER EQUITY PORTFOLIO
| | | | | | | | | | | | | | | | |
| Security name | | | | | | | | Shares | | | Value | |
| | | | |
Exchange-Traded Funds: 2.94% | | | | | | | | | | | | | | | | |
iShares MSCI Germany ETF | | | | | | | | | | | 201,848 | | | $ | 5,011,886 | |
iShares MSCI Japan ETF | | | | | | | | | | | 154,588 | | | | 7,712,395 | |
SPDR S&P 500 ETF | | | | | | | | | | | 12,442 | | | | 2,741,968 | |
| | | | |
Total Exchange-Traded Funds (Cost $14,783,276) | | | | | | | | | | | | | | | 15,466,249 | |
| | | | | | | | | | | | | | | | |
| | | | |
Investment Companies: 97.04% | | | | | | | | | | | | | | | | |
| | | | |
| Affiliated Master Portfolios: 13.38% | | | | | | | | | | | | | | | | |
Wells Fargo Emerging Growth Portfolio | | | | | | | | | | | | | | | 19,985,779 | |
Wells Fargo International Growth Portfolio | | | | | | | | | | | | | | | 29,688,276 | |
Wells Fargo Small Company Value Portfolio | | | | | | | | | | | | | | | 20,786,711 | |
| | | | |
| | | | | | | | | | | | | | | 70,460,766 | |
| | | | | | | | | | | | | | | | |
| | | | |
| Stock Funds: 83.66% | | | | | | | | | | | | | | | | |
American Century Growth Fund Institutional Class | | | | | | | | | | | 1,022,367 | | | | 30,221,154 | |
DFA International Small Cap Value Portfolio Institutional Class | | | | | | | | | | | 536,009 | | | | 10,291,374 | |
Dodge & Cox International Stock Fund | | | | | | | | | | | 403,233 | | | | 15,544,616 | |
Invesco Growth and Income Fund Class R6 | | | | | | | | | | | 1,495,705 | | | | 41,116,943 | |
MFS Value Fund Class I | | | | | | | | | | | 2,191,067 | | | | 80,149,220 | |
Oakmark Fund Class I | | | | | | | | | | | 571,857 | | | | 40,801,977 | |
Oppenheimer Developing Markets Fund Class I | | | | | | | | | | | 230,260 | | | | 7,430,498 | |
Royce Pennsylvania Mutual Fund Institutional Class | | | | | | | | | | | 1,801,562 | | | | 20,772,008 | |
T. Rowe Price Blue Chip Growth Fund Retail Class † | | | | | | | | | | | 575,668 | | | | 42,075,548 | |
T. Rowe Price International Discovery Fund | | | | | | | | | | | 186,180 | | | | 10,044,422 | |
Templeton Institutional Foreign Equity Fund Primary Class | | | | | | | | | | | 826,484 | | | | 15,430,464 | |
Thornburg International Value Fund Institutional Class | | | | | | | | | | | 1,981,286 | | | | 45,965,839 | |
Wells Fargo Emerging Markets Equity Fund Class R6 (l) | | | | | | | | | | | 605,331 | | | | 12,306,381 | |
Wells Fargo Endeavor Select Fund Institutional Class †(l) | | | | | | | | | | | 2,519,486 | | | | 23,783,951 | |
Wells Fargo Large Cap Growth Fund Class R6 (l) | | | | | | | | | | | 525,941 | | | | 24,077,560 | |
Wells Fargo Small Cap Value Fund Class R6 †(l) | | | | | | | | | | | 935,207 | | | | 20,462,338 | |
| | | | |
| | | | | | | | | | | | | | | 440,474,293 | |
| | | | | | | | | | | | | | | | |
| | | | |
Total Investment Companies (Cost $436,777,394) | | | | | | | | | | | | | | | 510,935,059 | |
| | | | | | | | | | | | | | | | |
| | | | |
| | | Yield | | | | | | | | | | |
| Short-Term Investments: 0.35% | | | | | | | | | | | | | | | | |
| | | | |
| Investment Companies: 0.35% | | | | | | | | | | | | | | | | |
Wells Fargo Cash Investment Money Market Fund Select Class (l)(u) | | | 0.56 | % | | | | | | | 1,874,865 | | | | 1,874,865 | |
| | | | | | | | | | | | | | | | |
| | | | |
Total Short-Term Investments (Cost $1,874,865) | | | | | | | | | | | | | | | 1,874,865 | |
| | | | | | | | | | | | | | | | |
| | | | | | | | |
| Total investments in securities (Cost $453,435,535) * | | | 100.33 | % | | | 528,276,173 | |
Other assets and liabilities, net | | | (0.33 | ) | | | (1,753,778 | ) |
| | | | | | | | |
| Total net assets | | | 100.00 | % | | $ | 526,522,395 | |
| | | | | | | | |
| † | Non-income-earning security |
| (l) | The issuer of the security is an affiliated person of the Portfolio as defined in the Investment Company Act of 1940. |
| (u) | The rate represents the 7-day annualized yield at period end. |
| * | Cost for federal income tax purposes is $446,319,908 and unrealized gains (losses) consists of: |
| | | | |
Gross unrealized gains | | $ | 92,058,020 | |
Gross unrealized losses | | | (10,101,755 | ) |
| | | | |
Net unrealized gains | | $ | 81,956,265 | |
The accompanying notes are an integral part of these financial statements.
| | | | |
| 24 | | Wells Fargo WealthBuilder Portfolios | | Statements of assets and liabilities—November 30, 2016 (unaudited) |
| | | | | | | | |
| | | WealthBuilder
Conservative
Allocation
Portfolio | | | WealthBuilder
Moderate
Balanced Portfolio | |
| | |
Assets | | | | | | | | |
Investments | | | | | | | | |
In unaffiliated Underlying Funds and securities, at value (see cost below) | | $ | 188,670,460 | | | $ | 388,877,016 | |
In affiliated Underlying Funds, at value (see cost below) | | | 176,733,354 | | | | 211,634,004 | |
In affiliated Master Portfolios, at value (see cost below) | | | 131,462,218 | | | | 174,430,368 | |
| | | | |
Total investments, at value (see cost below) | | | 496,866,032 | | | | 774,941,388 | |
Cash | | | 897,289 | | | | 788,625 | |
Receivable for investments sold | | | 600,621 | | | | 1,617,584 | |
Receivable for Portfolio shares sold | | | 90,458 | | | | 390,826 | |
Receivable for dividends | | | 588,760 | | | | 709,227 | |
Receivable for daily variation margin on open futures contracts | | | 42,750 | | | | 135,375 | |
Prepaid expenses and other assets | | | 27,318 | | | | 43,621 | |
| | | | |
Total assets | | | 499,113,228 | | | | 778,626,646 | |
| | | | |
| | |
Liabilities | | | | | | | | |
Payable for investments purchased | | | 1,200,693 | | | | 2,643,607 | |
Payable for Portfolio shares redeemed | | | 2,214,160 | | | | 3,193,949 | |
Due to custodian bank | | | 0 | | | | 0 | |
Management fee payable | | | 102,673 | | | | 160,554 | |
Distribution fee payable | | | 310,136 | | | | 481,662 | |
Administration fee payable | | | 86,838 | | | | 134,865 | |
Accrued expenses and other liabilities | | | 142,694 | | | | 217,207 | |
| | | | |
Total liabilities | | | 4,057,194 | | | | 6,831,844 | |
| | | | |
Total net assets | | $ | 495,056,034 | | | $ | 771,794,802 | |
| | | | |
| | |
NET ASSETS CONSIST OF | | | | | | | | |
Paid-in capital | | $ | 480,480,776 | | | $ | 721,107,393 | |
Undistributed (accumulated) net investment income (loss) | | | 223,399 | | | | 728,413 | |
Accumulated net realized gains (losses) on investments | | | 1,088,844 | | | | 19,001,410 | |
Net unrealized gains on investments | | | 13,263,015 | | | | 30,957,586 | |
| | | | |
Total net assets | | $ | 495,056,034 | | | $ | 771,794,802 | |
| | | | |
| | |
COMPUTATION OF NET ASSET VALUE AND OFFERING PRICE PER SHARE | | | | | | | | |
Net assets | | $ | 495,056,034 | | | $ | 771,794,802 | |
Shares outstanding1 | | | 47,754,369 | | | | 66,551,551 | |
Net asset value per share | | | $10.37 | | | | $11.60 | |
Maximum offering price per share2 | | | $10.53 | | | | $11.78 | |
| | |
Investments in unaffiliated Underlying Funds and securities, at cost | | $ | 173,486,472 | | | $ | 351,669,542 | |
| | | | |
Investments in affiliated Underlying Funds, at cost | | $ | 174,790,377 | | | $ | 210,528,177 | |
| | | | |
Investments in affiliated Master Portfolios, at cost | | $ | 135,341,278 | | | $ | 181,833,932 | |
| | | | |
Total investments, at cost | | $ | 483,618,127 | | | $ | 744,031,651 | |
| | | | |
| 1 | Each Portfolio has an unlimited number of authorized shares. |
| 2 | Maximum offering price is computed as 100/98.50 of net asset value. On investments of $50,000 or more, the offering price is reduced. |
The accompanying notes are an integral part of these financial statements.
| | | | | | |
| Statements of assets and liabilities—November 30, 2016 (unaudited) | | Wells Fargo WealthBuilder Portfolios | | | 25 | |
| | | | | | | | | | |
WealthBuilder
Growth Balanced
Portfolio | | | WealthBuilder
Growth Allocation
Portfolio | | | WealthBuilder
Equity Portfolio | |
| | |
| | | | | | | | | | | |
| | | | | | | | | | | |
| $ | 577,946,284 | | | $ | 286,393,670 | | | $ | 375,310,312 | |
| | 170,030,540 | | | | 62,544,859 | | | | 82,505,095 | |
| | 178,217,055 | | | | 62,794,312 | | | | 70,460,766 | |
| | |
| | 926,193,879 | | | | 411,732,841 | | | | 528,276,173 | |
| | 436,293 | | | | 0 | | | | 202,695 | |
| | 2,932,570 | | | | 1,825,654 | | | | 3,072,903 | |
| | 914,437 | | | | 1,116,404 | | | | 129,343 | |
| | 580,080 | | | | 101,419 | | | | 0 | |
| | 159,719 | | | | 70,063 | | | | 0 | |
| | 36,393 | | | | 33,685 | | | | 44,654 | |
| | |
| | 931,253,371 | | | | 414,880,066 | | | | 531,725,768 | |
| | |
| | |
| | | | | | | | | | | |
| | 3,890,980 | | | | 1,969,995 | | | | 2,750,507 | |
| | 3,043,819 | | | | 720,929 | | | | 1,771,271 | |
| | 0 | | | | 14,396 | | | | 0 | |
| | 190,324 | | | | 80,758 | | | | 106,111 | |
| | 570,971 | | | | 252,285 | | | | 323,116 | |
| | 159,872 | | | | 70,640 | | | | 90,472 | |
| | 277,610 | | | | 118,743 | | | | 161,896 | |
| | |
| | 8,133,576 | | | | 3,227,746 | | | | 5,203,373 | |
| | |
| $ | 923,119,795 | | | $ | 411,652,320 | | | $ | 526,522,395 | |
| | |
| | |
| | | | | | | | | | | |
| $ | 837,309,612 | | | $ | 365,218,339 | | | $ | 473,305,665 | |
| | 486,491 | | | | (1,233,906 | ) | | | (2,991,235 | ) |
| | 22,265,950 | | | | 16,130,436 | | | | (18,632,673 | ) |
| | 63,057,742 | | | | 31,537,451 | | | | 74,840,638 | |
| | |
| $ | 923,119,795 | | | $ | 411,652,320 | | | $ | 526,522,395 | |
| | |
| | |
| | | | | | | | | | | |
| $ | 923,119,795 | | | $ | 411,652,320 | | | $ | 526,522,395 | |
| | 67,436,079 | | | | 29,555,322 | | | | 27,503,475 | |
| | $13.69 | | | | $13.93 | | | | $19.14 | |
| | $13.90 | | | | $14.14 | | | | $19.43 | |
| | |
| $ | 504,325,093 | | | $ | 247,820,240 | | | $ | 295,347,459 | |
| | |
| $ | 169,781,713 | | | $ | 64,524,764 | | | $ | 80,067,837 | |
| | |
| $ | 189,085,785 | | | $ | 67,875,150 | | | $ | 78,020,239 | |
| | |
| $ | 863,192,591 | | | $ | 380,220,154 | | | $ | 453,435,535 | |
| | |
The accompanying notes are an integral part of these financial statements.
| | | | |
| 26 | | Wells Fargo WealthBuilder Portfolios | | Statements of operations—six months ended November 30, 2016 (unaudited) |
| | | | | | | | |
| | | WealthBuilder
Conservative
Allocation
Portfolio | | | WealthBuilder
Moderate
Balanced
Portfolio | |
| | |
Investment income | | | | | | | | |
Dividends from unaffiliated Underlying Funds | | $ | 2,895,591 | | | $ | 4,899,582 | |
Dividends from affiliated Underlying Funds | | | 1,530,487 | | | | 1,530,035 | |
Interest allocated from affiliated Master Portfolios* | | | 1,270,327 | | | | 1,448,711 | |
Dividends allocated from affiliated Master Portfolios ** | | | 83,422 | | | | 299,269 | |
Affiliated income allocated from affiliated Master Portfolios | | | 8,337 | | | | 10,795 | |
Securities lending income allocated from affiliated Master Portfolios | | | 14,704 | | | | 33,001 | |
Interest | | | 224 | | | | 747 | |
Expenses allocated from affiliated Master Portfolios | | | (283,988 | ) | | | (450,730 | ) |
Waivers allocated from affiliated Master Portfolios | | | 3,626 | | | | 4,144 | |
| | | | |
Total investment income | | | 5,522,730 | | | | 7,775,554 | |
| | | | |
| | |
Expenses | | | | | | | | |
Management fee | | | 653,791 | | | | 1,025,914 | |
Administration fee | | | 549,184 | | | | 861,768 | |
Shareholder servicing fees | | | 652,736 | | | | 1,024,607 | |
Distribution fee | | | 1,961,372 | | | | 3,077,742 | |
Custody and accounting fees | | | 36,254 | | | | 34,467 | |
Professional fees | | | 16,532 | | | | 16,532 | |
Registration fees | | | 27,697 | | | | 25,699 | |
Shareholder report expenses | | | 15,315 | | | | 25,499 | |
Trustees’ fees and expenses | | | 5,973 | | | | 6,381 | |
Other fees and expenses | | | 6,052 | | | | 8,717 | |
| | | | |
Total expenses | | | 3,924,906 | | | | 6,107,326 | |
Less: Fee waivers and/or expense reimbursements | | | (2,470 | ) | | | 0 | |
| | | | |
Net expenses | | | 3,922,436 | | | | 6,107,326 | |
| | | | |
Net investment income (loss) | | | 1,600,294 | | | | 1,668,228 | |
| | | | |
| | |
REALIZED AND UNREALIZED GAINS (LOSSES) ON INVESTMENTS | | | | | | | | |
| | |
Net realized gains (losses) on: | | | | | | | | |
Unaffiliated Underlying Funds | | | (1,501,275 | ) | | | (8,044,104 | ) |
Affiliated Underlying Funds | | | (434,879 | ) | | | 4,943,589 | |
Futures transactions | | | 167,668 | | | | 487,481 | |
Capital gain distributions from unaffiliated Underlying Funds | | | 146,338 | | | | 462,268 | |
Capital gain distributions from affiliated Underlying Funds | | | 321,138 | | | | 1,021,966 | |
Securities transactions allocated from affiliated Master Portfolios | | | 1,538,245 | | | | 3,181,587 | |
| | | | |
Net realized gain (losses) on investments | | | 237,235 | | | | 2,052,787 | |
| | | | |
| | |
Net change in unrealized gains (losses) on: | | | | | | | | |
Unaffiliated Underlying Funds | | | 5,348,070 | | | | 12,747,453 | |
Affiliated Underlying Funds | | | (1,081,532 | ) | | | 1,813,691 | |
Futures transactions | | | 133,141 | | | | 430,105 | |
Securities transactions allocated from affiliated Master Portfolios | | | (2,656,194 | ) | | | (3,027,829 | ) |
| | | | |
Net change in unrealized gains (losses) on investments | | | 1,743,485 | | | | 11,963,420 | |
| | | | |
Net realized and unrealized gains (losses) on investments | | | 1,980,720 | | | | 14,016,207 | |
| | | | |
Net increase in net assets resulting from operations | | $ | 3,581,014 | | | $ | 15,684,435 | |
| | | | |
| | |
* Net of foreign interest withholding taxes allocated from affiliated Master Portfolios in the amount of | | | $855 | | | | $978 | |
** Net of foreign dividend withholding taxes allocated from affiliated Master Portfolios in the amount of | | | $4,851 | | | | $15,457 | |
The accompanying notes are an integral part of these financial statements.
| | | | | | |
| Statements of operations—six months ended November 30, 2016 (unaudited) | | Wells Fargo WealthBuilder Portfolios | | | 27 | |
| | | | | | | | | | |
WealthBuilder
Growth
Balanced
Portfolio | | | WealthBuilder
Growth
Allocation
Portfolio | | | WealthBuilder
Equity
Portfolio | |
| | |
| | | | | | | | | | | |
| $ | 6,143,120 | | | $ | 2,380,563 | | | $ | 2,308,273 | |
| | 633,473 | | | | 85,456 | | | | 2,535 | |
| | 1,107,028 | | | | 199,477 | | | | 0 | |
| | 471,085 | | | | 308,062 | | | | 398,432 | |
| | 10,333 | | | | 3,306 | | | | 3,070 | |
| | 50,201 | | | | 27,086 | | | | 36,048 | |
| | 838 | | | | 374 | | | | 41 | |
| | (541,790 | ) | | | (239,027 | ) | | | (303,709 | ) |
| | 3,159 | | | | 569 | | | | 0 | |
| | |
| | 7,877,447 | | | | 2,765,866 | | | | 2,444,690 | |
| | |
| | |
| | | | | | | | | | | |
| | 1,197,408 | | | | 528,717 | | | | 630,480 | |
| | 1,005,823 | | | | 444,122 | | | | 529,603 | |
| | 1,195,848 | | | | 528,015 | | | | 626,690 | |
| | 3,592,224 | | | | 1,586,150 | | | | 1,891,439 | |
| | 42,322 | | | | 29,540 | | | | 29,111 | |
| | 16,282 | | | | 16,280 | | | | 17,092 | |
| | 34,164 | | | | 24,251 | | | | 26,348 | |
| | 38,340 | | | | 21,373 | | | | 12,391 | |
| | 6,473 | | | | 6,473 | | | | 22,719 | |
| | 8,076 | | | | 4,753 | | | | 6,788 | |
| | |
| | 7,136,960 | | | | 3,189,674 | | | | 3,792,661 | |
| | 0 | | | | (17,372 | ) | | | (12,752 | ) |
| | |
| | 7,136,960 | | | | 3,172,302 | | | | 3,779,909 | |
| | |
| | 740,487 | | | | (406,436 | ) | | | (1,335,219 | ) |
| | |
| | |
| | | | | | | | | | | |
| | |
| | | | | | | | | | | |
| | (3,830,571 | ) | | | (11,105,000 | ) | | | 831,250 | |
| | (3,447,333 | ) | | | 7,239,273 | | | | 6,063,680 | |
| | 29,422 | | | | (225,420 | ) | | | (1,209,575 | ) |
| | 834,942 | | | | 492,344 | | | | 781,703 | |
| | 1,814,374 | | | | 1,048,964 | | | | 1,257,180 | |
| | 4,632,062 | | | | 2,416,585 | | | | (6,274,848 | ) |
| | |
| | 32,896 | | | | (133,254 | ) | | | 1,449,390 | |
| | |
| | |
| | | | | | | | | | | |
| | 24,292,771 | | | | 13,712,302 | | | | 36,920,646 | |
| | 4,864,877 | | | | 3,651,073 | | | | (3,353,093 | ) |
| | 659,463 | | | | 361,309 | | | | 350,245 | |
| | (2,507,606 | ) | | | (519,522 | ) | | | (10,533,463 | ) |
| | |
| | 27,309,505 | | | | 17,205,162 | | | | 23,384,335 | |
| | |
| | 27,342,401 | | | | 17,071,908 | | | | 24,833,725 | |
| | |
| $ | 28,082,888 | | | $ | 16,665,472 | | | $ | 23,498,506 | |
| | |
| | |
| | $746 | | | | $134 | | | | $0 | |
| | $26,831 | | | | $15,810 | | | | $22,526 | |
The accompanying notes are an integral part of these financial statements.
| | | | |
| 28 | | Wells Fargo WealthBuilder Portfolios | | Statements of changes in net assets |
| | | | | | | | | | | | | | | | |
| | | WealthBuilder Conservative Allocation Portfolio | |
| | | Six months ended
November 30, 2016
(unaudited) | | | Year ended
May 31, 2016 | |
| | | |
Operations | | | | | | | | | | | | |
Net investment income | | | | | | $ | 1,600,294 | | | | | | | $ | 3,555,221 | |
Net realized gains on investments | | | | | | | 237,235 | | | | | | | | 11,813,160 | |
Net change in unrealized gains (losses) on investments | | | | | | | 1,743,485 | | | | | | | | (21,780,570 | ) |
| | | | |
Net increase (decrease) in net assets resulting from operations | | | | | | | 3,581,014 | | | | | | | | (6,412,189 | ) |
| | | | |
| | | |
Distributions to shareholders from | | | | | | | | | | | | |
Net investment income | | | | | | | (1,382,288 | ) | | | | | | | (4,111,475 | ) |
Net realized gains | | | | | | | 0 | | | | | | | | (13,989,868 | ) |
| | | | |
Total distributions to shareholders | | | | | | | (1,382,288 | ) | | | | | | | (18,101,343 | ) |
| | | | |
| | | | |
Capital share transactions | | | Shares | | | | | | | | Shares | | | | | |
Proceeds from shares sold | | | 3,507,313 | | | | 36,707,888 | | | | 11,262,600 | | | | 116,710,681 | |
Reinvestment of distributions | | | 131,603 | | | | 1,376,782 | | | | 1,769,710 | | | | 18,074,814 | |
Payment for shares redeemed | | | (6,600,095 | ) | | | (69,059,260 | ) | | | (12,671,692 | ) | | | (131,499,027 | ) |
| | | | |
Net increase (decrease) in net assets resulting from capital share transactions | | | | | | | (30,974,590 | ) | | | | | | | 3,286,468 | |
| | | | |
Total decrease in net assets | | | | | | | (28,775,864 | ) | | | | | | | (21,227,064 | ) |
| | | | |
| | |
Net assets | | | | | | | | |
Beginning of period | | | | | | | 523,831,898 | | | | | | | | 545,058,962 | |
| | | | |
End of period | | | | | | $ | 495,056,034 | | | | | | | $ | 523,831,898 | |
| | | | |
Undistributed net investment income | | | | | | $ | 223,399 | | | | | | | $ | 5,393 | |
| | | | |
The accompanying notes are an integral part of these financial statements.
| | | | | | |
| Statements of changes in net assets | | Wells Fargo WealthBuilder Portfolios | | | 29 | |
| | | | | | | | | | | | | | | | |
| | | WealthBuilder Moderate Balanced Portfolio | |
| | | Six months ended
November 30, 2016
(unaudited) | | | Year ended
May 31, 2016 | |
| | | |
Operations | | | | | | | | | | | | |
Net investment income | | | | | | $ | 1,668,228 | | | | | | | $ | 4,103,910 | |
Net realized gains on investments | | | | | | | 2,052,787 | | | | | | | | 33,049,669 | |
Net change in unrealized gains (losses) on investments | | | | | | | 11,963,420 | | | | | | | | (56,977,733 | ) |
| | | | |
Net increase (decrease) in net assets resulting from operations | | | | | | | 15,684,435 | | | | | | | | (19,824,154 | ) |
| | | | |
| | | |
Distributions to shareholders from | | | | | | | | | | | | |
Net investment income | | | | | | | (1,134,247 | ) | | | | | | | (5,066,403 | ) |
Net realized gains | | | | | | | 0 | | | | | | | | (33,712,193 | ) |
| | | | |
Total distributions to shareholders | | | | | | | (1,134,247 | ) | | | | | | | (38,778,596 | ) |
| | | | |
| | | | |
Capital share transactions | | | Shares | | | | | | | | Shares | | | | | |
Proceeds from shares sold | | | 3,209,417 | | | | 37,122,088 | | | | 12,731,081 | | | | 147,098,031 | |
Reinvestment of distributions | | | 99,213 | | | | 1,132,312 | | | | 3,437,045 | | | | 38,720,686 | |
Payment for shares redeemed | | | (9,861,353 | ) | | | (114,227,429 | ) | | | (16,329,458 | ) | | | (187,173,600 | ) |
| | | | |
Net decrease in net assets resulting from capital share transactions | | | | | | | (75,973,029 | ) | | | | | | | (1,354,883 | ) |
| | | | |
Total decrease in net assets | | | | | | | (61,422,841 | ) | | | | | | | (59,957,633 | ) |
| | | | |
| | |
Net assets | | | | | | | | |
Beginning of period | | | | | | | 833,217,643 | | | | | | | | 893,175,276 | |
| | | | |
End of period | | | | | | $ | 771,794,802 | | | | | | | $ | 833,217,643 | |
| | | | |
Undistributed net investment income | | | | | | $ | 728,413 | | | | | | | $ | 194,432 | |
| | | | |
The accompanying notes are an integral part of these financial statements.
| | | | |
| 30 | | Wells Fargo WealthBuilder Portfolios | | Statements of changes in net assets |
| | | | | | | | | | | | | | | | |
| | | WealthBuilder Growth Balanced Portfolio | |
| | | Six months ended
November 30, 2016
(unaudited) | | | Year ended
May 31, 2016 | |
| | | |
Operations | | | | | | | | | | | | |
Net investment income | | | | | | $ | 740,487 | | | | | | | $ | 2,571,491 | |
Net realized gains (losses) on investments | | | | | | | 32,896 | | | | | | | | 53,926,296 | |
Net change in unrealized gains (losses) on investments | | | | | | | 27,309,505 | | | | | | | | (92,513,666 | ) |
| | | | |
Net increase (decrease) in net assets resulting from operations | | | | | | | 28,082,888 | | | | | | | | (36,015,879 | ) |
| | | | |
| | | |
Distributions to shareholders from | | | | | | | | | | | | |
Net investment income | | | | | | | 0 | | | | | | | | (4,755,991 | ) |
Net realized gains | | | | | | | 0 | | | | | | | | (47,555,710 | ) |
| | | | |
Total distributions to shareholders | | | | | | | 0 | | | | | | | | (52,311,701 | ) |
| | | | |
| | | | |
Capital share transactions | | | Shares | | | | | | | | Shares | | | | | |
Proceeds from shares sold | | | 3,177,746 | | | | 43,037,310 | | | | 11,752,345 | | | | 160,180,764 | |
Reinvestment of distributions | | | 0 | | | | 0 | | | | 3,970,170 | | | | 52,269,033 | |
Payment for shares redeemed | | | (8,477,994 | ) | | | (114,932,581 | ) | | | (13,141,127 | ) | | | (175,600,976 | ) |
| | | | |
Net increase (decrease) in net assets resulting from capital share transactions | | | | | | | (71,895,271 | ) | | | | | | | 36,848,821 | |
| | | | |
Total decrease in net assets | | | | | | | (43,812,383 | ) | | | | | | | (51,478,759 | ) |
| | | | |
| | |
Net assets | | | | | | | | |
Beginning of period | | | | | | | 966,932,178 | | | | | | | | 1,018,410,937 | |
| | | | |
End of period | | | | | | $ | 923,119,795 | | | | | | | $ | 966,932,178 | |
| | | | |
Undistributed (overdistributed) net investment income | | | | | | $ | 486,491 | | | | | | | $ | (253,996 | ) |
| | | | |
The accompanying notes are an integral part of these financial statements.
| | | | | | |
| Statements of changes in net assets | | Wells Fargo WealthBuilder Portfolios | | | 31 | |
| | | | | | | | | | | | | | | | |
| | | WealthBuilder Growth Allocation Portfolio | |
| | | Six months ended
November 30, 2016
(unaudited) | | | Year ended
May 31, 2016 | |
| | | |
Operations | | | | | | | | | | | | |
Net investment loss | | | | | | $ | (406,436 | ) | | | | | | $ | (264,589 | ) |
Net realized gains (losses) on investments | | | | | | | (133,254 | ) | | | | | | | 27,847,764 | |
Net change in unrealized gains (losses) on investments | | | | | | | 17,205,162 | | | | | | | | (50,418,355 | ) |
| | | | |
Net increase (decrease) in net assets resulting from operations | | | | | | | 16,665,472 | | | | | | | | (22,835,180 | ) |
| | | | |
| | | |
Distributions to shareholders from | | | | | | | | | | | | |
Net investment income | | | | | | | 0 | | | | | | | | (1,351,047 | ) |
Net realized gains | | | | | | | 0 | | | | | | | | (24,150,116 | ) |
| | | | |
Total distributions to shareholders | | | | | | | 0 | | | | | | | | (25,501,163 | ) |
| | | | |
| | | | |
Capital share transactions | | | Shares | | | | | | | | Shares | | | | | |
Proceeds from shares sold | | | 1,267,090 | | | | 17,282,278 | | | | 5,396,148 | | | | 74,412,404 | |
Reinvestment of distributions | | | 0 | | | | 0 | | | | 1,913,338 | | | | 25,485,665 | |
Payment for shares redeemed | | | (3,803,441 | ) | | | (51,923,026 | ) | | | (5,456,680 | ) | | | (73,073,460 | ) |
| | | | |
Net increase (decrease) in net assets resulting from capital share transactions | | | | | | | (34,640,748 | ) | | | | | | | 26,824,609 | |
| | | | |
Total decrease in net assets | | | | | | | (17,975,276 | ) | | | | | | | (21,511,734 | ) |
| | | | |
| | |
Net assets | | | | | | | | |
Beginning of period | | | | | | | 429,627,596 | | | | | | | | 451,139,330 | |
| | | | |
End of period | | | | | | $ | 411,652,320 | | | | | | | $ | 429,627,596 | |
| | | | |
Accumulated net investment loss | | | | | | $ | (1,233,906 | ) | | | | | | $ | (827,470 | ) |
| | | | |
The accompanying notes are an integral part of these financial statements.
| | | | |
| 32 | | Wells Fargo WealthBuilder Portfolios | | Statements of changes in net assets |
| | | | | | | | | | | | | | | | |
| | | WealthBuilder Equity Portfolio | |
| | | Six months ended
November 30, 2016
(unaudited) | | | Year ended
May 31, 2016 | |
| | | |
Operations | | | | | | | | | | | | |
Net investment loss | | | | | | $ | (1,335,219 | ) | | | | | | $ | (1,950,709 | ) |
Net realized gains (losses) on investments | | | | | | | 1,449,390 | | | | | | | | 34,892,385 | |
Net change in unrealized gains (losses) on investments | | | | | | | 23,384,335 | | | | | | | | (61,294,966 | ) |
| | | | |
Net increase (decrease) in net assets resulting from operations | | | | | | | 23,498,506 | | | | | | | | (28,353,290 | ) |
| | | | |
| | | | |
Capital share transactions | | | Shares | | | | | | | | Shares | | | | | |
Proceeds from shares sold | | | 815,942 | | | | 15,186,496 | | | | 3,205,454 | | | | 58,573,911 | |
Payment for shares redeemed | | | (3,567,930 | ) | | | (66,718,763 | ) | | | (3,286,179 | ) | | | (59,408,002 | ) |
Net asset value of shares issued in acquistion | | | 7,072,695 | | | | 131,447,569 | | | | 0 | | | | 0 | |
| | | | |
Net increase (decrease) in net assets resulting from capital share transactions | | | | | | | 79,915,302 | | | | | | | | (834,091 | ) |
| | | | |
Total increase (decrease) in net assets | | | | | | | 103,413,808 | | | | | | | | (29,187,381 | ) |
| | | | |
| | |
Net assets | | | | | | | | |
Beginning of period | | | | | | | 423,108,587 | | | | | | | | 452,295,968 | |
| | | | |
End of period | | | | | | $ | 526,522,395 | | | | | | | $ | 423,108,587 | |
| | | | |
Accumulated net investment loss | | | | | | $ | (2,991,235 | ) | | | | | | $ | (1,656,016 | ) |
| | | | |
The accompanying notes are an integral part of these financial statements.
This page is intentionally left blank.
| | | | |
| 34 | | Wells Fargo WealthBuilder Portfolios | | Financial highlights |
| | | | | | | | | | | | | | | | | | | | | | | | |
| | | Beginning
net asset
value per
share | | | Net
investment
income
(loss) | | | Net realized
and unrealized
gains (losses)
on investments | | | Distributions
from net
investment
income | | | Distributions
from net
realized gains | | | Ending
net asset
value per
share | |
| | | | | | |
WealthBuilder Conservative Allocation Portfolio | | | | | | | | | | | | | | | | | | | | | | | | |
Six months ended November 30, 2016 (unaudited) | | $ | 10.33 | | | | 0.03 | | | | 0.04 | | | | (0.03 | ) | | | 0.00 | | | $ | 10.37 | |
Year ended May 31, 2016 | | $ | 10.82 | | | | 0.07 | | | | (0.20 | ) | | | (0.08 | ) | | | (0.28 | ) | | $ | 10.33 | |
Year ended May 31, 2015 | | $ | 10.92 | | | | 0.04 | | | | 0.15 | | | | (0.05 | ) | | | (0.24 | ) | | $ | 10.82 | |
Year ended May 31, 2014 | | $ | 10.95 | | | | 0.03 | | | | 0.42 | | | | (0.05 | ) | | | (0.43 | ) | | $ | 10.92 | |
Year ended May 31, 2013 | | $ | 10.57 | | | | 0.06 | | | | 0.59 | | | | (0.08 | ) | | | (0.19 | ) | | $ | 10.95 | |
Year ended May 31, 2012 | | $ | 11.02 | | | | 0.16 | | | | (0.20 | ) | | | (0.21 | ) | | | (0.20 | ) | | $ | 10.57 | |
| | | | | | |
WealthBuilder Moderate Balanced Portfolio | | | | | | | | | | | | | | | | | | | | | | | | |
Six months ended November 30, 2016 (unaudited) | | $ | 11.40 | | | | 0.02 | | | | 0.20 | | | | (0.02 | ) | | | 0.00 | | | $ | 11.60 | |
Year ended May 31, 2016 | | $ | 12.19 | | | | 0.05 | | | | (0.30 | ) | | | (0.07 | ) | | | (0.47 | ) | | $ | 11.40 | |
Year ended May 31, 2015 | | $ | 12.21 | | | | 0.03 | | | | 0.39 | | | | (0.07 | ) | | | (0.37 | ) | | $ | 12.19 | |
Year ended May 31, 2014 | | $ | 12.03 | | | | 0.02 | | | | 0.91 | | | | (0.04 | ) | | | (0.71 | ) | | $ | 12.21 | |
Year ended May 31, 2013 | | $ | 10.96 | | | | 0.04 | 3 | | | 1.21 | | | | (0.06 | ) | | | (0.12 | ) | | $ | 12.03 | |
Year ended May 31, 2012 | | $ | 11.50 | | | | 0.13 | 3 | | | (0.48 | ) | | | (0.19 | ) | | | (0.00 | )4 | | $ | 10.96 | |
| | | | | | |
WealthBuilder Growth Balanced Portfolio | | | | | | | | | | | | | | | | | | | | | | | | |
Six months ended November 30, 2016 (unaudited) | | $ | 13.29 | | | | 0.01 | | | | 0.39 | | | | 0.00 | | | | 0.00 | | | $ | 13.69 | |
Year ended May 31, 2016 | | $ | 14.52 | | | | 0.03 | | | | (0.53 | ) | | | (0.06 | ) | | | (0.67 | ) | | $ | 13.29 | |
Year ended May 31, 2015 | | $ | 14.42 | | | | 0.01 | | | | 0.67 | | | | (0.10 | ) | | | (0.48 | ) | | $ | 14.52 | |
Year ended May 31, 2014 | | $ | 12.90 | | | | 0.01 | | | | 1.55 | | | | (0.04 | ) | | | 0.00 | | | $ | 14.42 | |
Year ended May 31, 2013 | | $ | 10.97 | | | | 0.01 | | | | 1.95 | | | | (0.03 | ) | | | 0.00 | | | $ | 12.90 | |
Year ended May 31, 2012 | | $ | 11.82 | | | | 0.09 | | | | (0.82 | ) | | | (0.12 | ) | | | 0.00 | | | $ | 10.97 | |
| | | | | | |
WealthBuilder Growth Allocation Portfolio | | | | | | | | | | | | | | | | | | | | | | | | |
Six months ended November 30, 2016 (unaudited) | | $ | 13.39 | | | | (0.02 | ) | | | 0.56 | | | | 0.00 | | | | 0.00 | | | $ | 13.93 | |
Year ended May 31, 2016 | | $ | 14.92 | | | | (0.01 | ) | | | (0.71 | ) | | | (0.04 | ) | | | (0.77 | ) | | $ | 13.39 | |
Year ended May 31, 2015 | | $ | 14.78 | | | | (0.02 | ) | | | 0.89 | | | | (0.12 | ) | | | (0.61 | ) | | $ | 14.92 | |
Year ended May 31, 2014 | | $ | 13.08 | | | | (0.03 | ) | | | 1.89 | | | | (0.00 | )4 | | | (0.16 | ) | | $ | 14.78 | |
Year ended May 31, 2013 | | $ | 10.87 | | | | (0.01 | ) | | | 2.23 | | | | (0.01 | ) | | | 0.00 | | | $ | 13.08 | |
Year ended May 31, 2012 | | $ | 11.83 | | | | 0.05 | 3 | | | (0.94 | ) | | | (0.07 | ) | | | 0.00 | | | $ | 10.87 | |
| | | | | | |
WealthBuilder Equity Portfolio | | | | | | | | | | | | | | | | | | | | | | | | |
Six months ended November 30, 2016 (unaudited) | | $ | 18.25 | | | | (0.04 | ) | | | 0.93 | | | | 0.00 | | | | 0.00 | | | $ | 19.14 | |
Year ended May 31, 2016 | | $ | 19.44 | | | | (0.08 | ) | | | (1.11 | ) | | | 0.00 | | | | 0.00 | | | $ | 18.25 | |
Year ended May 31, 2015 | | $ | 18.07 | | | | (0.08 | ) | | | 1.45 | | | | 0.00 | | | | 0.00 | | | $ | 19.44 | |
Year ended May 31, 2014 | | $ | 15.61 | | | | (0.08 | ) | | | 2.54 | | | | 0.00 | | | | 0.00 | | | $ | 18.07 | |
Year ended May 31, 2013 | | $ | 13.12 | | | | (0.07 | ) | | | 2.58 | | | | (0.02 | ) | | | 0.00 | | | $ | 15.61 | |
Year ended May 31, 2012 | | $ | 13.89 | | | | (0.08 | )3 | | | (0.69 | ) | | | 0.00 | | | | 0.00 | | | $ | 13.12 | |
| 1 | Ratios do not reflect net expenses allocated from the affiliated Master Portfolios. Including net expenses allocated from the affiliated Master Portfolios, the expense ratios would be increased by the following amounts: |
| | | | | | | | | | | | | | | | | | | | | | | | |
| | | Six months ended November 30, 2016 (unaudited) | | | Year ended May 31 | |
| | | | 2016 | | | 2015 | | | 2014 | | | 2013 | | | 2012 | |
WealthBuilder Conservative Allocation Portfolio | | | 0.11 | % | | | 0.11 | % | | | 0.11 | % | | | 0.09 | % | | | 0.10 | % | | | 0.10 | % |
WealthBuilder Moderate Balanced Portfolio | | | 0.11 | % | | | 0.11 | % | | | 0.11 | % | | | 0.10 | % | | | 0.12 | % | | | 0.11 | % |
WealthBuilder Growth Balanced Portfolio | | | 0.11 | % | | | 0.11 | % | | | 0.11 | % | | | 0.12 | % | | | 0.15 | % | | | 0.14 | % |
WealthBuilder Growth Allocation Portfolio | | | 0.11 | % | | | 0.11 | % | | | 0.11 | % | | | 0.12 | % | | | 0.15 | % | | | 0.15 | % |
WealthBuilder Equity Portfolio | | | 0.12 | % | | | 0.12 | % | | | 0.12 | % | | | 0.13 | % | | | 0.17 | % | | | 0.16 | % |
| 2 | Total return calculations do not include any sales charges. Returns for periods of less than one year are not annualized. |
| 3 | Calculated based upon average shares outstanding |
| 4 | Amount is less than $0.005. |
The accompanying notes are an integral part of these financial statements.
| | | | | | |
| Financial highlights | | Wells Fargo WealthBuilder Portfolios | | | 35 | |
| | | | | | | | | | | | | | | | | | | | | | |
| Ratio to average net assets (annualized) | | | Total
return2 | | | Portfolio
turnover
rate | | | Net assets at
end of period
(000s omitted) | |
Net investment
income | | | Gross
expenses1 | | | Net
expenses1 | | | | |
| | | | | |
| | | | | | | | | | | | | | | | | | | | | | | |
| | 0.61 | % | | | 1.50 | % | | | 1.50 | % | | | 0.65 | % | | | 79 | % | | $ | 495,056 | |
| | 0.68 | % | | | 1.51 | % | | | 1.50 | % | | | (1.11 | )% | | | 198 | % | | $ | 523,832 | |
| | 0.34 | % | | | 1.55 | % | | | 1.50 | % | | | 1.75 | % | | | 169 | % | | $ | 545,059 | |
| | 0.32 | % | | | 1.55 | % | | | 1.50 | % | | | 4.19 | % | | | 139 | % | | $ | 580,937 | |
| | 0.53 | % | | | 1.54 | % | | | 1.50 | % | | | 6.19 | % | | | 128 | % | | $ | 659,977 | |
| | 1.51 | % | | | 1.54 | % | | | 1.50 | % | | | (0.32 | )% | | | 176 | % | | $ | 662,092 | |
| | | | | |
| | | | | | | | | | | | | | | | | | | | | | | |
| | 0.41 | % | | | 1.49 | % | | | 1.49 | % | | | 1.90 | % | | | 65 | % | | $ | 771,795 | |
| | 0.48 | % | | | 1.49 | % | | | 1.49 | % | | | (2.02 | )% | | | 150 | % | | $ | 833,218 | |
| | 0.21 | % | | | 1.55 | % | | | 1.50 | % | | | 3.44 | % | | | 129 | % | | $ | 893,175 | |
| | 0.17 | % | | | 1.54 | % | | | 1.50 | % | | | 7.94 | % | | | 110 | % | | $ | 867,327 | |
| | 0.34 | % | | | 1.54 | % | | | 1.50 | % | | | 11.42 | % | | | 115 | % | | $ | 799,251 | |
| | 1.20 | % | | | 1.54 | % | | | 1.50 | % | | | (2.96 | )% | | | 145 | % | | $ | 709,801 | |
| | | | | |
| | | | | | | | | | | | | | | | | | | | | | | |
| | 0.15 | % | | | 1.49 | % | | | 1.49 | % | | | 3.01 | % | | | 51 | % | | $ | 923,120 | |
| | 0.26 | % | | | 1.49 | % | | | 1.49 | % | | | (3.39 | )% | | | 100 | % | | $ | 966,932 | |
| | 0.06 | % | | | 1.54 | % | | | 1.50 | % | | | 4.89 | % | | | 89 | % | | $ | 1,018,411 | |
| | 0.04 | % | | | 1.54 | % | | | 1.50 | % | | | 12.07 | % | | | 94 | % | | $ | 936,593 | |
| | 0.06 | % | | | 1.54 | % | | | 1.50 | % | | | 17.85 | % | | | 117 | % | | $ | 788,285 | |
| | 0.84 | % | | | 1.54 | % | | | 1.50 | % | | | (6.17 | )% | | | 131 | % | | $ | 689,816 | |
| | | | | |
| | | | | | | | | | | | | | | | | | | | | | | |
| | (0.19 | )% | | | 1.51 | % | | | 1.50 | % | | | 4.03 | % | | | 30 | % | | $ | 411,652 | |
| | (0.06 | )% | | | 1.51 | % | | | 1.50 | % | | | (4.79 | )% | | | 59 | % | | $ | 429,628 | |
| | (0.20 | )% | | | 1.55 | % | | | 1.50 | % | | | 6.14 | % | | | 53 | % | | $ | 451,139 | |
| | (0.19 | )% | | | 1.57 | % | | | 1.50 | % | | | 14.28 | % | | | 60 | % | | $ | 402,238 | |
| | (0.13 | )% | | | 1.57 | % | | | 1.50 | % | | | 20.39 | % | | | 98 | % | | $ | 324,723 | |
| | 0.49 | % | | | 1.57 | % | | | 1.50 | % | | | (7.47 | )% | | | 96 | % | | $ | 276,657 | |
| | | | | |
| | | | | | | | | | | | | | | | | | | | | | | |
| | (0.53 | )% | | | 1.50 | % | | | 1.50 | % | | | 4.88 | % | | | 19 | % | | $ | 526,522 | |
| | (0.46 | )% | | | 1.51 | % | | | 1.50 | % | | | (6.12 | )% | | | 27 | % | | $ | 423,109 | |
| | (0.44 | )% | | | 1.55 | % | | | 1.50 | % | | | 7.58 | % | | | 27 | % | | $ | 452,296 | |
| | (0.45 | )% | | | 1.56 | % | | | 1.50 | % | | | 15.76 | % | | | 23 | % | | $ | 421,949 | |
| | (0.49 | )% | | | 1.56 | % | | | 1.50 | % | | | 19.16 | % | | | 67 | % | | $ | 371,334 | |
| | (0.58 | )% | | | 1.56 | % | | | 1.50 | % | | | (5.54 | )% | | | 31 | % | | $ | 346,832 | |
The accompanying notes are an integral part of these financial statements.
| | | | |
| 36 | | Wells Fargo WealthBuilder Portfolios | | Notes to financial statements (unaudited) |
1. ORGANIZATION
Wells Fargo Funds Trust (the “Trust”), a Delaware statutory trust organized on March 10, 1999, is an open-end management investment company registered under the Investment Company Act of 1940, as amended (the “1940 Act”). As an investment company, the Trust follows the accounting and reporting guidance in Financial Accounting Standards Board (“FASB”) Accounting Standards Codification Topic 946, Financial Services – Investment Companies. These financial statements report on the following funds: Wells Fargo WealthBuilder Conservative Allocation Portfolio (“WealthBuilder Conservative Allocation Portfolio”), Wells Fargo WealthBuilder Moderate Balanced Portfolio (“WealthBuilder Moderate Balanced Portfolio”), Wells Fargo WealthBuilder Growth Balanced Portfolio (“WealthBuilder Growth Balanced Portfolio”), Wells Fargo WealthBuilder Growth Allocation Portfolio (“WealthBuilder Growth Allocation Portfolio”) and Wells Fargo WealthBuilder Equity Portfolio (“WealthBuilder Equity Portfolio”) (formerly, Wells Fargo WealthBuilder Tactical Equity Portfolio) (each, a “Portfolio”, collectively, the “Portfolios”). Each Portfolio is a diversified series of the Trust.
Each Portfolio is a fund-of-funds that may invest in various affiliated mutual funds, unaffiliated mutual funds and exchange-traded funds (collectively, the “Underlying Funds”) to pursue its invesetment objective. The Underlying Funds incur separate expenses in seeking to achieve their investment objectives. Investments in affiliated funds may also include investments in one or more separate diversified portfolios (each, an “affiliated Master Portfolio”, collectively, the “affiliated Master Portfolios”) of Wells Fargo Master Trust, a registered open-end management investment company. Each affiliated Master Portfolio directly acquires portfolio securities, and a Portfolio investing in an affiliated Master Portfolio acquires an indirect interest in those securities. Each Portfolio accounts for its investment in the affiliated Master Portfolios as partnership investments and records on a daily basis its share of the affiliated Master Portfolio’s income, expense and realized and unrealized gains and losses. The financial statements and financial highlights for the Underlying Funds are presented in separate financial statements and may be obtained by contacting Investor Services for the Wells Fargo Funds or by contacting the servicing agent of the unaffiliated mutual funds.
2. SIGNIFICANT ACCOUNTING POLICIES
The following significant accounting policies, which are consistently followed in the preparation of the financial statements of each Portfolio, are in conformity with U.S. generally accepted accounting principles which require management to make estimates and assumptions that affect the reported amounts of assets and liabilities, disclosure of contingent assets and liabilities at the date of the financial statements, and the reported amounts of revenues and expenses during the reporting period. Actual results could differ from those estimates.
Securities valuation
All investments are valued each business day as of the close of regular trading on the New York Stock Exchange (generally 4 p.m. Eastern Time), although the Portfolios may deviate from this calculation time under unusual or unexpected circumstances.
Investments in mutual funds are valued at net asset per share as reported by the Underlying Funds as of the close of the regular trading on the New York Stock Exchange on each day the exchange is open for trading. Investments in affiliated Master Portfolios are valued daily based on each Portfolio’s proportionate share of each affiliated Master Portfolio’s net assets, which are also valued daily.
Equity securities and futures that are listed on a foreign or domestic exchange or market are valued at the official closing price or, if none, the last sales price. If no sale occurs on the principal exchange or market that day, the prior day’s price will be deemed “stale” and a fair value price will be determined in accordance with the Portfolio’s Valuation Procedures.
Debt securities are valued at the evaluated bid price provided by an independent pricing service or, if a reliable price is not available, the quoted bid price from an independent broker-dealer.
Investments which are not valued using any of the methods discussed above are valued at their fair value, as determined in good faith by the Board of Trustees of the Portfolios. The Board of Trustees has established a Valuation Committee comprised of the Trustees and has delegated to it the authority to take any actions regarding the valuation of portfolio securities that the Valuation Committee deems necessary or appropriate, including determining the fair value of portfolio securities, unless the determination has been delegated to the Management Valuation Team of Wells Fargo Funds Management, LLC (“Funds Management”). The Board of Trustees retains the authority to make or ratify any valuation decisions or approve any changes to the Valuation Procedures as it deems appropriate. On a quarterly basis, the Board of Trustees receives reports on any valuation actions taken by the Valuation Committee or the Management Valuation Team which may include items for ratification.
| | | | | | |
| Notes to financial statements (unaudited) | | Wells Fargo WealthBuilder Portfolios | | | 37 | |
Valuations of fair valued securities are compared to the next actual sales price when available, or other appropriate market values, to assess the continued appropriateness of the fair valuation methodologies used. These securities are fair valued on a day-to-day basis, taking into consideration changes to appropriate market information and any significant changes to the inputs considered in the valuation process until there is a readily available price provided on an exchange or by an independent pricing service. Valuations received from an independent pricing service or independent broker-dealer quotes are periodically validated by comparisons to most recent trades and valuations provided by other independent pricing services in addition to the review of prices by the manager and/or subadviser. Unobservable inputs used in determining fair valuations are identified based on the type of security, taking into consideration factors utilized by market participants in valuing the investment, knowledge about the issuer and the current market environment.
Futures contracts
Each Portfolio may enter into futures contracts and may be subject to interest rate risk, equity price risk, and foreign exchange rate risk in the normal course of pursuing its investment objectives. A Portfolio may buy and sell futures contracts in order to effect tactical allocations changes in a Portfolio. The primary risks associated with the use of futures contracts are the imperfect correlation between changes in market values of securities held by the Portfolio and the prices of futures contracts, and the possibility of an illiquid market.
The aggregate principal amounts of the contracts are not recorded in the financial statements. Fluctuations in the value of the contracts are recorded in the Statements of Assets and Liabilities as an asset or liability and in the Statements of Operations as unrealized gains or losses until the contracts are closed, at which point they are recorded as net realized gains or losses on futures contracts. With futures contracts, there is minimal counterparty risk to the Portfolio since futures are exchange traded and the exchange’s clearinghouse, as counterparty to all exchange traded futures, guarantees the futures against default.
Security transactions and income recognition
Securities transactions are recorded on a trade date basis. Realized gains or losses are recorded on the basis of identified cost.
Income dividends and capital gain distributions from Underlying Funds are recorded on the ex-dividend date. Capital gain distributions from Underlying Funds are treated as realized gains.
Interest income is accrued daily and bond discounts are accreted and premiums are amortized daily based on the effective interest method. To the extent debt obligations are placed on non-accrual status, any related interest income may be reduced by writing off interest receivables when the collection of all or a portion of interest has become doubtful based on consistently applied procedures. If the issuer subsequently resumes interest payments or when the collectability of interest is reasonably assured, the debt obligation is removed from non-accrual status.
Each Portfolio records on a daily basis its proportionate share of each affiliated Master Portfolio’s interest and dividend income, in addition to expenses and realized and unrealized gains and losses.
Distributions to shareholders
Distributions to shareholders from net investment income and net realized gains, if any, are recorded on the ex-dividend date. Such distributions are determined in conformity with federal income tax regulations, which may differ in amount or character from net investment income and realized gains recognized for purposes of U.S. generally accepted accounting principles.
Federal and other taxes
Each Portfolio is treated as a separate entity for federal income tax purposes. Each Portfolio intends to continue to qualify as a regulated investment company by distributing substantially all of its investment company taxable income and any net realized capital gains (after reduction for capital loss carryforwards) sufficient to relieve it from all, or substantially all, federal income taxes. Accordingly, no provision for federal income taxes was required.
Each Portfolio’s income and federal excise tax returns and all financial records supporting those returns for the prior three fiscal years are subject to examination by the federal and Delaware revenue authorities. Management has analyzed each Portfolio’s tax positions taken on federal, state, and foreign tax returns for all open tax years and does not believe that there are any uncertain tax positions that require recognition of a tax liability.
As of May 31, 2016, WealthBuilder Equity Portfolio had capital loss carryforwards that are available to offset future net realized capital gains in the amount of $21,843,731 expiring in 2018.
| | | | |
| 38 | | Wells Fargo WealthBuilder Portfolios | | Notes to financial statements (unaudited) |
At May 31, 2016, late-year ordinary losses which was recognized on the first day of the current fiscal year were as follows:
| | | | |
| | | Late-year ordinary losses
deferred | |
WealthBuilder Growth Balanced Portfolio | | $ | 330,925 | |
WealthBuilder Growth Allocation Portfolio | | | 847,057 | |
WealthBuilder Equity Portfolio | | | 1,751,638 | |
3. FAIR VALUATION MEASUREMENTS
Fair value measurements of investments are determined within a framework that has established a fair value hierarchy based upon the various data inputs utilized in determining the value of each Portfolio’s investments. The three-level hierarchy gives the highest priority to unadjusted quoted prices in active markets for identical assets or liabilities (Level 1) and the lowest priority to significant unobservable inputs (Level 3). Each Portfolio’s investments are classified within the fair value hierarchy based on the lowest level of input that is significant to the fair value measurement. The inputs are summarized into three broad levels as follows:
| ∎ | | Level 1 – quoted prices in active markets for identical securities |
| ∎ | | Level 2 – other significant observable inputs (including quoted prices for similar securities, interest rates, prepayment speeds, credit risk, use of amortized cost, etc.) |
| ∎ | | Level 3 – significant unobservable inputs (including the Portfolio’s own assumptions in determining the fair value of investments) |
The inputs or methodologies used for valuing investments in securities are not necessarily an indication of the risk associated with investing in those securities.
The following is a summary of the inputs used in valuing each Portfolio ‘s assets and liabilities as of November 30, 2016:
| | | | | | | | | | | | | | | | |
| | | Quoted prices
(Level 1) | | | Other significant
observable inputs
(Level 2) | | | Significant
unobservable inputs (Level 3) | | | Total | |
WealthBuilder Conservative Allocation Portfolio | | | | | | | | | | | | | | | | |
Assets | | | | | | | | | | | | | | | | |
| | | | |
Investments in: | | | | | | | | | | | | | | | | |
| | | | |
Exchange-traded funds | | $ | 10,137,544 | | | $ | 0 | | | $ | 0 | | | $ | 10,137,544 | |
| | | | |
Investment companies | | | 354,943,898 | | | | 0 | | | | 0 | | | | 354,943,898 | |
| | | | |
Short-term investments | | | | | | | | | | | | | | | | |
Investment companies | | | 102,403 | | | | 0 | | | | 0 | | | | 102,403 | |
U.S. Treasury securities | | | 219,969 | | | | 0 | | | | 0 | | | | 219,969 | |
Investments measured at net asset value* | | | | | | | | | | | | | | | 131,462,218 | |
| | | 365,403,814 | | | | 0 | | | | 0 | | | | 496,866,032 | |
Futures contracts | | | 42,750 | | | | 0 | | | | 0 | | | | 42,750 | |
Total assets | | $ | 365,446,564 | | | $ | 0 | | | $ | 0 | | | $ | 496,908,782 | |
| * | Investments that are measured at fair value using the net asset value per share (or its equivalent) as a practical expedient have not been categorized in the fair value hierarchy. The fair value amount presented in the table is intended to permit reconciliation of the fair value hierarchy to the amounts presented in the Statements of Assets and Liabilities. At November 30, 2016, the aggregated affiliated Master Portfolios measured at fair value using the net asset value per share (or its equivalent) were valued at $131,462,218. Each affiliated Master Portfolio does not have a redemption period notice, can be redeemed daily and does not have any unfunded commitments. |
| | | | | | |
| Notes to financial statements (unaudited) | | Wells Fargo WealthBuilder Portfolios | | | 39 | |
| | | | | | | | | | | | | | | | |
| | | Quoted prices
(Level 1) | | | Other significant
observable inputs
(Level 2) | | | Significant
unobservable inputs (Level 3) | | | Total | |
WealthBuilder Moderate Balanced Portfolio | | | | | | | | | | | | | | | | |
Assets | | | | | | | | | | | | | | | | |
| | | | |
Investments in: | | | | | | | | | | | | | | | | |
| | | | |
Exchange-traded funds | | $ | 17,383,587 | | | $ | 0 | | | $ | 0 | | | $ | 17,383,587 | |
| | | | |
Investment companies | | | 581,971,816 | | | | 0 | | | | 0 | | | | 581,971,816 | |
| | | | |
Short-term investments | | | | | | | | | | | | | | | | |
Investment companies | | | 457,714 | | | | 0 | | | | 0 | | | | 457,714 | |
U.S. Treasury securities | | | 697,903 | | | | 0 | | | | 0 | | | | 697,903 | |
Investments measured at net asset value* | | | | | | | | | | | | | | | 174,430,368 | |
| | | 600,511,020 | | | | 0 | | | | 0 | | | | 774,941,388 | |
Futures contracts | | | 135,375 | | | | 0 | | | | 0 | | | | 135,375 | |
Total assets | | $ | 600,646,395 | | | $ | 0 | | | $ | 0 | | | $ | 775,076,763 | |
| * | Investments that are measured at fair value using the net asset value per share (or its equivalent) as a practical expedient have not been categorized in the fair value hierarchy. The fair value amount presented in the table is intended to permit reconciliation of the fair value hierarchy to the amounts presented in the Statements of Assets and Liabilities. At November 30, 2016, the aggregated affiliated Master Portfolios measured at fair value using the net asset value per share (or its equivalent) were valued at $174,430,368. Each affiliated Master Portfolio does not have a redemption period notice, can be redeemed daily and does not have any unfunded commitments. |
| | | | | | | | | | | | | | | | |
| | | Quoted prices
(Level 1) | | | Other significant
observable inputs
(Level 2) | | | Significant
unobservable inputs (Level 3) | | | Total | |
WealthBuilder Growth Balanced Portfolio | | | | | | | | | | | | | | | | |
Assets | | | | | | | | | | | | | | | | |
| | | | |
Investments in: | | | | | | | | | | | | | | | | |
| | | | |
Exchange-traded funds | | $ | 22,640,156 | | | $ | 0 | | | $ | 0 | | | $ | 22,640,156 | |
| | | | |
Investment companies | | | 722,334,311 | | | | 0 | | | | 0 | | | | 722,334,311 | |
| | | | |
Short-term investments | | | | | | | | | | | | | | | | |
Investment companies | | | 2,180,471 | | | | 0 | | | | 0 | | | | 2,180,471 | |
U.S. Treasury securities | | | 821,886 | | | | 0 | | | | 0 | | | | 821,886 | |
Investments measured at net asset value* | | | | | | | | | | | | | | | 178,217,055 | |
| | | 747,976,824 | | | | 0 | | | | 0 | | | | 926,193,879 | |
Futures contracts | | | 159,719 | | | | 0 | | | | 0 | | | | 159,719 | |
Total assets | | $ | 748,136,543 | | | $ | 0 | | | $ | 0 | | | $ | 926,353,598 | |
| * | Investments that are measured at fair value using the net asset value per share (or its equivalent) as a practical expedient have not been categorized in the fair value hierarchy. The fair value amount presented in the table is intended to permit reconciliation of the fair value hierarchy to the amounts presented in the Statements of Assets and Liabilities. At November 30, 2016, the aggregated affiliated Master Portfolios measured at fair value using the net asset value per share (or its equivalent) were valued at $178,217,055. Each affiliated Master Portfolio does not have a redemption period notice, can be redeemed daily and does not have any unfunded commitments. |
| | | | |
| 40 | | Wells Fargo WealthBuilder Portfolios | | Notes to financial statements (unaudited) |
| | | | | | | | | | | | | | | | |
| | | Quoted prices
(Level 1) | | | Other significant
observable inputs
(Level 2) | | | Significant
unobservable inputs (Level 3) | | | Total | |
WealthBuilder Growth Allocation Portfolio | | | | | | | | | | | | | | | | |
Assets | | | | | | | | | | | | | | | | |
| | | | |
Investments in: | | | | | | | | | | | | | | | | |
| | | | |
Exchange-traded funds | | $ | 10,795,114 | | | $ | 0 | | | $ | 0 | | | $ | 10,795,114 | |
| | | | |
Investment companies | | | 336,938,513 | | | | 0 | | | | 0 | | | | 336,938,513 | |
| | | | |
Short-term investments | | | | | | | | | | | | | | | | |
Investment companies | | | 842,952 | | | | 0 | | | | 0 | | | | 842,952 | |
U.S. Treasury securities | | | 361,950 | | | | 0 | | | | 0 | | | | 361,950 | |
Investments measured at net asset value* | | | | | | | | | | | | | | | 62,794,312 | |
| | | 348,938,529 | | | | 0 | | | | 0 | | | | 411,732,841 | |
Futures contracts | | | 70,063 | | | | 0 | | | | 0 | | | | 70,063 | |
Total assets | | $ | 349,008,592 | | | $ | 0 | | | $ | 0 | | | $ | 411,802,904 | |
| * | Investments that are measured at fair value using the net asset value per share (or its equivalent) as a practical expedient have not been categorized in the fair value hierarchy. The fair value amount presented in the table is intended to permit reconciliation of the fair value hierarchy to the amounts presented in the Statements of Assets and Liabilities. At November 30, 2016, the aggregated affiliated Master Portfolios measured at fair value using the net asset value per share (or its equivalent) were valued at $62,794,312. Each affiliated Master Portfolio does not have a redemption period notice, can be redeemed daily and does not have any unfunded commitments. |
| | | | | | | | | | | | | | | | |
| | | Quoted prices
(Level 1) | | | Other significant
observable inputs
(Level 2) | | | Significant
unobservable inputs (Level 3) | | | Total | |
WealthBuilder Equity Portfolio | | | | | | | | | | | | | | | | |
Assets | | | | | | | | | | | | | | | | |
| | | | |
Investments in: | | | | | | | | | | | | | | | | |
| | | | |
Exchange-traded funds | | $ | 15,466,249 | | | $ | 0 | | | $ | 0 | | | $ | 15,466,249 | |
| | | | |
Investment companies | | | 440,474,293 | | | | 0 | | | | 0 | | | | 440,474,293 | |
| | | | |
Short-term investments | | | | | | | | | | | | | | | | |
Investment companies | | | 1,874,865 | | | | 0 | | | | 0 | | | | 1,874,865 | |
Investments measured at net asset value* | | | | | | | | | | | | | | | 70,460,766 | |
Total assets | | $ | 457,815,407 | | | $ | 0 | | | $ | 0 | | | $ | 528,276,173 | |
| * | Investments that are measured at fair value using the net asset value per share (or its equivalent) as a practical expedient have not been categorized in the fair value hierarchy. The fair value amount presented in the table is intended to permit reconciliation of the fair value hierarchy to the amounts presented in the Statements of Assets and Liabilities. At November 30, 2016, the aggregated affiliated Master Portfolios measured at fair value using the net asset value per share (or its equivalent) were valued at $70,460,766. Each affiliated Master Portfolio does not have a redemption period notice, can be redeemed daily and does not have any unfunded commitments. |
Futures contracts are reported at their variation margin at measurement date, which represents the amount due to the Portfolio at that date. All other assets and liabilities are reported at their market value at measurement date.
The Portfolios recognize transfers between levels within the fair value hierarchy at the end of the reporting period. At November 30, 2016, the Portfolios did not have any transfers into/out of Level 1, Level 2, or Level 3.
The investment objective of each affiliated Master Portfolio is as follows:
| | |
| Affiliated Master Portfolio | | Investment objective |
Wells Fargo Core Bond Portfolio | | Seeks total return, consisting of income and capital appreciation |
Wells Fargo Emerging Growth Portfolio | | Seeks long-term capital appreciation |
Wells Fargo International Growth Portfolio | | Seeks long-term capital appreciation |
Wells Fargo Small Company Value Portfolio | | Seeks long-term capital appreciation |
| | | | | | |
| Notes to financial statements (unaudited) | | Wells Fargo WealthBuilder Portfolios | | | 41 | |
4. TRANSACTIONS WITH AFFILIATES
Management fee
Funds Management, an indirect wholly owned subsidiary of Wells Fargo & Company (“Wells Fargo”), is the manager of each Portfolio and provides advisory and fund-level administrative services under an investment management agreement. Under the investment management agreement, Funds Management is responsible for, among other services, implementing the investment objectives and strategies of each Portfolio, supervising the subadviser, providing fund-level administrative services in connection with each Portfolio’s operations, and providing any other fund-level administrative services reasonably necessary for the operation of each Portfolio. As compensation for its services under the investment management agreement, Funds Management is entitled to receive an annual management fee starting at 0.25% and declining to 0.18% as the average daily net assets of each Portfolio increase. For the six months ended November 30, 2016, the management fee was equivalent to an annual rate of 0.25% of each Portfolio’s average daily net assets.
Funds Management also serves as the adviser to and is entitled to receive a fee from each affiliated Master Portfolio and affiliated Underlying Fund for those services.
Funds Management has retained the services of a subadviser to provide daily portfolio management to the Portfolios. The fee for subadvisory services is borne by Funds Management. Wells Capital Management Incorporated, an affiliate of Funds Management and an indirect wholly owned subsidiary of Wells Fargo, is the subadviser to each Portfolio and is paid an annual subadvisory fee of 0.15% of the daily net assets of each Portfolio.
Administration fees
Under a class-level administration agreement, Funds Management provides class-level administrative services to each Portfolio, which includes paying fees and expenses for services provided by the transfer agent, sub-transfer agents, omnibus account servicers and record-keepers. As compensation for its services under the class-level administration agreement, Funds Management receives a fee at an annual rate of 0.21% of the average daily net assets of each Portfolio.
Funds Management has contractually waived and/or reimbursed management and administration fees to the extent necessary to maintain certain net operating expense ratios for the Portfolios. Funds Management has committed through September 30, 2017 to waive fees and/or reimburse expenses to the extent necessary to cap each Portfolio’s expenses at 1.50%. Acquired fund fees and expenses and net expenses from underlying affiliated Master Portfolios are excluded from the expense caps. After this time, the cap may be increased or the commitment to maintain the cap may be terminated only with the approval of the Board of Trustees.
Distribution fee
The Trust has adopted a Distribution Plan for each Portfolio pursuant to Rule 12b-1 under the 1940 Act. Distribution fees are charged and paid to Wells Fargo Funds Distributor, LLC (“Funds Distributor”), the principal underwriter of each Portfolio, at an annual rate of 0.75% of each Portfolio’s average daily net assets.
In addition, Funds Distributor is entitled to receive the front-end sales charge from the purchase of Portfolio shares. For the six months ended November 30, 2016, Funds Distributor received the following amounts in front-end sales charges:
| | | | |
| | | Front-end
sales charges | |
WealthBuilder Conservative Allocation Portfolio | | $ | 3,070 | |
WealthBuilder Moderate Balanced Portfolio | | | 7,151 | |
WealthBuilder Growth Balanced Portfolio | | | 5,264 | |
WealthBuilder Growth Allocation Portfolio | | | 1,884 | |
WealthBuilder Equity Portfolio | | | 1,351 | |
Shareholder servicing fees
The Trust has entered into contracts with one or more shareholder servicing agents, whereby each Portfolio is charged a fee at an annual rate of 0.25% of its average daily net assets.
A portion of these total shareholder servicing fees were paid to affiliates of Wells Fargo.
| | | | |
| 42 | | Wells Fargo WealthBuilder Portfolios | | Notes to financial statements (unaudited) |
5. INVESTMENT PORTFOLIO TRANSACTIONS
Purchases and sales of investments, excluding short-term securities, for the six months ended November 30, 2016 were as follows:
| | | | | | | | | | | | | | | | |
| | | Purchases at cost* | | | Sales proceeds* | |
| | | U.S.
government | | | Non-U.S.
government | | | U.S.
government | | | Non-U.S.
government | |
WealthBuilder Conservative Allocation Portfolio | | $ | 259,805,340 | | | $ | 171,971,260 | | | $ | 243,368,534 | | | $ | 173,837,359 | |
WealthBuilder Moderate Balanced Portfolio | | | 292,242,013 | | | | 243,529,012 | | | | 273,753,074 | | | | 274,928,104 | |
WealthBuilder Growth Balanced Portfolio | | | 226,978,416 | | | | 260,980,465 | | | | 212,618,434 | | | | 296,982,866 | |
WealthBuilder Growth Allocation Portfolio | | | 40,743,587 | | | | 87,263,461 | | | | 38,165,909 | | | | 112,548,787 | |
WealthBuilder Equity Portfolio | | | 0 | | | | 93,339,743 | | | | 0 | | | | 139,748,024 | |
| * | The Portfolios seek to achieve their investment objective by investing some of their investable assets in affiliated Master Portfolios. Purchases and sales related to these investments have been calculated by aggregating the results of multiplying such Portfolio’s ownership percentage of the respective affiliated Master Portfolio by the corresponding affiliated Master Portfolio’s purchases and sales. Purchases and sales of the affiliated and unaffiliated Underlying Funds in which the Portfolios invest are actual aggregate purchases and sales of those investments. |
6. INVESTMENTS IN AFFILIATES
An affiliated investment is a company which is under common ownership or control of the Portfolio or which the Portfolio has ownership of at least 5% of the outstanding voting shares. The following is a summary of transactions for the long-term holdings of issuers that were affiliates of each Portfolio at the end of the period.
| | | | | | | | | | | | | | | | | | | | | | | | | | | | |
| | | Shares,
beginning
of period | | | Shares
purchases | | | Shares
sold | | | Shares, end
of period | | | Value, end of
period | | | Dividends
from affiliated
Underlying
Funds | | | Capital gain
distributions from
affiliated
Underlying Funds | |
WealthBuilder Conservative Allocation Portfolio | | | | | | | | | | | | | | | | | | | | | | | | | | | | |
Wells Fargo Emerging Markets Equity Fund Class R6 | | | 139,881 | | | | 1,667 | | | | 22,424 | | | | 119,124 | | | $ | 2,421,799 | | | $ | 0 | | | $ | 0 | |
Wells Fargo Endeavor Select Fund Institutional Class | | | 571,104 | | | | 4,815 | | | | 93,262 | | | | 482,657 | | | | 4,556,284 | | | | 0 | | | | 0 | |
Wells Fargo Government Securities Fund Institutional Class | | | 6,475,834 | | | | 160,105 | | | | 363,467 | | | | 6,272,472 | | | | 69,749,890 | | | | 539,785 | | | | 0 | |
Wells Fargo Large Cap Growth Fund Class R6 | | | 116,760 | | | | 2,668 | | | | 20,033 | | | | 99,395 | | | | 4,550,297 | | | | 0 | | | | 0 | |
Wells Fargo Short Duration Government Bond Fund Class R6 | | | 9,604,049 | | | | 264,646 | | | | 631,570 | | | | 9,237,125 | | | | 91,632,284 | | | | 989,397 | | | | 0 | |
Wells Fargo Small Cap Value Fund Class R6 | | | 194,282 | | | | 18,012 | | | | 42,258 | | | | 170,036 | | | | 3,720,397 | | | | 0 | | | | 321,138 | |
| | | | | | | | | | | | | | | | | | | $ | 176,630,951 | | | $ | 1,529,182 | | | $ | 321,138 | |
WealthBuilder Moderate Balanced Portfolio | | | | | | | | | | | | | | | | | | | | | | | | | | | | |
Wells Fargo Emerging Markets Equity Fund Class R6 | | | 439,818 | | | | 249 | | | | 72,261 | | | | 367,806 | | | $ | 7,477,495 | | | $ | 0 | | | $ | 0 | |
Wells Fargo Endeavor Select Fund Institutional Class | | | 1,825,750 | | | | 0 | | | | 312,259 | | | | 1,513,491 | | | | 14,287,356 | | | | 0 | | | | 0 | |
Wells Fargo Government Securities Fund Institutional Class | | | 7,628,131 | | | | 136,353 | | | | 531,861 | | | | 7,232,623 | | | | 80,426,766 | | | | 630,819 | | | | 0 | |
Wells Fargo Large Cap Growth Fund Class R6 | | | 371,415 | | | | 24 | | | | 59,102 | | | | 312,337 | | | | 14,298,768 | | | | 0 | | | | 0 | |
Wells Fargo Short Duration Government Bond Fund Class R6 | | | 8,779,414 | | | | 206,249 | | | | 623,883 | | | | 8,361,780 | | | | 82,948,854 | | | | 897,817 | | | | 0 | |
Wells Fargo Small Cap Value Fund Class R6 | | | 619,765 | | | | 50,262 | | | | 133,599 | | | | 536,428 | | | | 11,737,051 | | | | 0 | | | | 1,021,966 | |
| | | | | | | | | | | | | | | | | | | $ | 211,176,290 | | | $ | 1,528,636 | | | $ | 1,021,966 | |
WealthBuilder Growth Balanced Portfolio | | | | | | | | | | | | | | | | | | | | | | | | | | | | |
Wells Fargo Emerging Markets Equity Fund Class R6 | | | 770,740 | | | | 0 | | | | 119,686 | | | | 651,054 | | | $ | 13,235,931 | | | $ | 0 | | | $ | 0 | |
Wells Fargo Endeavor Select Fund Institutional Class | | | 3,160,092 | | | | 0 | | | | 456,081 | | | | 2,704,011 | | | | 25,525,862 | | | | 0 | | | | 0 | |
Wells Fargo Government Securities Fund Institutional Class | | | 7,584,472 | | | | 234,258 | | | | 470,515 | | | | 7,348,215 | | | | 81,712,155 | | | | 631,740 | | | | 0 | |
Wells Fargo Large Cap Growth Fund Class R6 | | | 644,959 | | | | 306 | | | | 83,197 | | | | 562,068 | | | | 25,731,488 | | | | 0 | | | | 0 | |
Wells Fargo Small Cap Value Fund Class R6 | | | 1,083,617 | | | | 89,110 | | | | 183,484 | | | | 989,243 | | | | 21,644,633 | | | | 0 | | | | 1,814,374 | |
| | | | | | | | | | | | | | | | | | | $ | 167,850,069 | | | $ | 631,740 | | | $ | 1,814,374 | |
| | | | | | |
| Notes to financial statements (unaudited) | | Wells Fargo WealthBuilder Portfolios | | | 43 | |
| | | | | | | | | | | | | | | | | | | | | | | | | | | | |
| | | Shares,
beginning
of period | | | Shares
purchases | | | Shares
sold | | | Shares, end
of period | | | Value, end of
period | | | Dividends
from affiliated
Underlying
Funds | | | Capital gain
distributions from
affiliated
Underlying Funds | |
WealthBuilder Growth Allocation Portfolio | | | | | | | | | | | | | | | | | | | | | | | | | | | | |
Wells Fargo Emerging Markets Equity Fund Class R6 | | | 450,592 | | | | 0 | | | | 68,795 | | | | 381,797 | | | $ | 7,761,942 | | | $ | 0 | | | $ | 0 | |
Wells Fargo Endeavor Select Fund Institutional Class | | | 1,862,181 | | | | 0 | | | | 274,832 | | | | 1,587,349 | | | | 14,984,571 | | | | 0 | | | | 0 | |
Wells Fargo Government Securities Fund Institutional Class | | | 1,029,283 | | | | 42,769 | | | | 90,134 | | | | 981,918 | | | | 10,918,924 | | | | 84,654 | | | | 0 | |
Wells Fargo Large Cap Growth Fund Class R6 | | | 379,154 | | | | 0 | | | | 48,301 | | | | 330,853 | | | | 15,146,468 | | | | 0 | | | | 0 | |
Wells Fargo Small Cap Value Fund Class R6 | | | 634,547 | | | | 51,496 | | | | 96,920 | | | | 589,123 | | | | 12,890,002 | | | | 0 | | | | 1,048,964 | |
| | | | | | | | | | | | | | | | | | | $ | 61,701,907 | | | $ | 84,654 | | | $ | 1,048,964 | |
WealthBuilder Equity Portfolio | | | | | | | | | | | | | | | | | | | | | | | | | | | | |
Wells Fargo Emerging Markets Equity Fund Class R6 | | | 553,651 | | | | 161,360 | | | | 109,680 | | | | 605,331 | | | $ | 12,306,381 | | | $ | 0 | | | $ | 0 | |
Wells Fargo Endeavor Select Fund Institutional Class | | | 2,260,399 | | | | 830,801 | | | | 571,714 | | | | 2,519,486 | | | | 23,783,951 | | | | 0 | | | | 0 | |
Wells Fargo Large Cap Growth Fund Class R6 | | | 464,289 | | | | 170,685 | | | | 109,033 | | | | 525,941 | | | | 24,077,560 | | | | 0 | | | | 0 | |
Wells Fargo Small Cap Value Fund Class R6 | | | 773,175 | | | | 302,457 | | | | 140,425 | | | | 935,207 | | | | 20,462,338 | | | | 0 | | | | 1,257,180 | |
| | | | | | | | | | | | | | | | | | | $ | 80,630,230 | | | $ | 0 | | | $ | 1,257,180 | |
In addition, each Portfolio’s ownership of affiliated Master Portfolios was as follows:
| | | | | | | | | | | | |
| | | % of ownership,
beginning of period | | | % of ownership,
end of period | | | Value, end of
period | |
WealthBuilder Conservative Allocation Portfolio | | | | | | | | | | | | |
Wells Fargo Core Bond Portfolio | | | 3 | % | | | 2 | % | | $ | 118,275,543 | |
Wells Fargo Emerging Growth Portfolio | | | 0 | * | | | 0 | * | | | 3,669,422 | |
Wells Fargo International Growth Portfolio | | | 4 | | | | 4 | | | | 5,797,655 | |
Wells Fargo Small Company Value Portfolio | | | 2 | | | | 2 | | | | 3,719,598 | |
WealthBuilder Moderate Balanced Portfolio | | | | | | | | | | | | |
Wells Fargo Core Bond Portfolio | | | 3 | | | | 3 | | | $ | 133,042,234 | |
Wells Fargo Emerging Growth Portfolio | | | 1 | | | | 1 | | | | 11,591,136 | |
Wells Fargo International Growth Portfolio | | | 13 | | | | 13 | | | | 18,033,515 | |
Wells Fargo Small Company Value Portfolio | | | 6 | | | | 5 | | | | 11,763,483 | |
WealthBuilder Growth Balanced Portfolio | | | | | | | | | | | | |
Wells Fargo Core Bond Portfolio | | | 3 | | | | 2 | | | $ | 103,331,192 | |
Wells Fargo Emerging Growth Portfolio | | | 2 | | | | 3 | | | | 21,184,878 | |
Wells Fargo International Growth Portfolio | | | 23 | | | | 24 | | | | 31,840,777 | |
Wells Fargo Small Company Value Portfolio | | | 10 | | | | 10 | | | | 21,860,208 | |
WealthBuilder Growth Allocation Portfolio | | | | | | | | | | | | |
Wells Fargo Core Bond Portfolio | | | 0 | * | | | 0 | * | | $ | 18,548,387 | |
Wells Fargo Emerging Growth Portfolio | | | 1 | | | | 2 | | | | 12,530,989 | |
Wells Fargo International Growth Portfolio | | | 14 | | | | 14 | | | | 18,640,774 | |
Wells Fargo Small Company Value Portfolio | | | 6 | | | | 6 | | | | 13,074,162 | |
WealthBuilder Equity Portfolio | | | | | | | | | | | | |
Wells Fargo Emerging Growth Portfolio | | | 2 | | | | 2 | | | $ | 19,985,779 | |
Wells Fargo International Growth Portfolio | | | 17 | | | | 22 | | | | 29,688,276 | |
Wells Fargo Small Company Value Portfolio | | | 7 | | | | 9 | | | | 20,786,711 | |
| * | The amount invested is less than 1%. |
7. DERIVATIVE TRANSACTIONS
During the six months ended November 30, 2016, the Portfolios entered into futures contracts to gain market exposure to certain asset classes consistent with an active asset allocation strategy.
| | | | |
| 44 | | Wells Fargo WealthBuilder Portfolios | | Notes to financial statements (unaudited) |
At November 30, 2016, the Portfolios had short futures contracts outstanding as follows:
| | | | | | | | | | | | | | | | |
| | | Expiration date | | Counterparty | | Contracts | | Type | | Contract value at November 30, 2016 | | | Unrealized
gains | |
WealthBuilder Conservative Allocation Portfolio | | 3-22-2017 | | Goldman Sachs | | 72 Short | | 10-Year U.S. Treasury Notes | | $ | 8,965,125 | | | $ | 15,110 | |
WealthBuilder Moderate Balanced Portfolio | | 3-22-2017 | | Goldman Sachs | | 228 Short | | 10-Year U.S. Treasury Notes | | | 28,389,563 | | | | 47,849 | |
WealthBuilder Growth Balanced Portfolio | | 3-22-2017 | | Goldman Sachs | | 269 Short | | 10-Year U.S. Treasury Notes | | | 33,494,703 | | | | 56,454 | |
WealthBuilder Growth Allocation Portfolio | | 3-22-2017 | | Goldman Sachs | | 118 Short | | 10-Year U.S. Treasury Notes | | | 14,692,844 | | | | 24,764 | |
The Portfolios had average notional amounts in futures contracts outstanding during the six months ended November 30, 2016 as follows:
| | | | |
| | | Short contracts | |
WealthBuilder Conservative Allocation Portfolio | | $ | 2,427,580 | |
WealthBuilder Moderate Balanced Portfolio | | | 5,543,389 | |
WealthBuilder Growth Balanced Portfolio | | | 6,605,090 | |
WealthBuilder Growth Allocation Portfolio | | | 2,873,309 | |
A summary of derivative instruments by primary risk exposure is outlined in the following tables, unless the only primary risk exposure category is already reflected in the appropriate financial statements.
The fair value of derivative instruments as of November 30, 2016 was as follows for WealthBuilder Conservative Allocation Portfolio:
| | | | | | | | | | | | |
| | | Asset derivatives | | | Liability derivatives | |
| | | Statements of Assets and
Liabilities location | | Fair value | | | Statements of Assets and
Liabilities location | | Fair value | |
Interest rate risk | | Receivable for daily variation margin on open futures contracts | | $ | 42,750 | * | | Payable for daily variation margin on open futures contracts | | $ | 0 | * |
| | | | $ | 42,750 | | | | | $ | 0 | |
| * | Only the current day’s variation margin as of November 30, 2016 is reported separately on the Statements of Assets and Liabilities. |
The effect of derivative instruments on the Statements of Operations for the year ended November 30, 2016 was as follows for WealthBuilder Conservative Allocation Portfolio:
| | | | | | | | |
| | | Amount of realized
gains (losses) on
derivatives | | | Change in unrealized
gains (losses) on
derivatives | |
Interest rate risk | | $ | 298,784 | | | $ | 46,015 | |
Equity risk | | | 169,698 | | | | 0 | |
Foreign currency risk | | | (300,814 | ) | | | 87,126 | |
| | | $ | 167,668 | | | $ | 133,141 | |
The fair value of derivative instruments as of November 30, 2016 was as follows for WealthBuilder Moderate Balanced Portfolio:
| | | | | | | | | | | | |
| | | Asset derivatives | | | Liability derivatives | |
| | | Statements of Assets and
Liabilities location | | Fair value | | | Statements of Assets and
Liabilities location | | Fair value | |
Interest rate risk | | Receivable for daily variation margin on open futures contracts | | $ | 135,375 | * | | Payable for daily variation margin on open futures contracts | | $ | 0 | * |
| | | | $ | 135,375 | | | | | $ | 0 | |
| * | Only the current day’s variation margin as of November 30, 2016 is reported separately on the Statements of Assets and Liabilities. |
| | | | | | |
| Notes to financial statements (unaudited) | | Wells Fargo WealthBuilder Portfolios | | | 45 | |
The effect of derivative instruments on the Statements of Operations for the year ended November 30, 2016 was as follows for WealthBuilder Moderate Balanced Portfolio:
| | | | | | | | |
| | | Amount of realized
gains (losses) on
derivatives | | | Change in unrealized
gains (losses) on
derivatives | |
Interest rate risk | | $ | 923,648 | | | $ | 147,818 | |
Equity risk | | | 540,204 | | | | 0 | |
Foreign currency risk | | | (976,371 | ) | | | 282,287 | |
| | | $ | 487,481 | | | $ | 430,105 | |
The fair value of derivative instruments as of November 30, 2016 was as follows for WealthBuilder Growth Balanced Portfolio:
| | | | | | | | | | | | |
| | | Asset derivatives | | | Liability derivatives | |
| | | Statements of Assets and
Liabilities location | | Fair value | | | Statements of Assets and
Liabilities location | | Fair value | |
Interest rate risk | | Receivable for daily variation margin on open futures contracts | | $ | 159,719 | * | | Payable for daily variation margin on open futures contracts | | $ | 0 | * |
| | | | $ | 159,719 | | | | | $ | 0 | |
| * | Only the current day’s variation margin as of November 30, 2016 is reported separately on the Statements of Assets and Liabilities. |
The effect of derivative instruments on the Statements of Operations for the year ended November 30, 2016 was as follows for WealthBuilder Growth Balanced Portfolio:
| | | | | | | | |
| | | Amount of realized
gains (losses) on
derivatives | | | Change in unrealized
gains (losses) on
derivatives | |
Interest rate risk | | $ | 1,077,612 | | | $ | 171,560 | |
Equity risk | | | (1,684,556 | ) | | | 0 | |
Foreign currency risk | | | 636,366 | | | | 487,903 | |
| | | $ | 29,422 | | | $ | 659,463 | |
The fair value of derivative instruments as of November 30, 2016 was as follows for WealthBuilder Growth Allocation Portfolio:
| | | | | | | | | | | | |
| | | Asset derivatives | | | Liability derivatives | |
| | | Statements of Assets and
Liabilities location | | Fair value | | | Statements of Assets and
Liabilities location | | Fair value | |
Interest rate risk | | Receivable for daily variation margin on open futures contracts | | $ | 70,063 | * | | Payable for daily variation margin on open futures contracts | | $ | 0 | * |
| | | | $ | 70,063 | | | | | $ | 0 | |
| * | Only the current day’s variation margin as of November 30, 2016 is reported separately on the Statements of Assets and Liabilities. |
The effect of derivative instruments on the Statements of Operations for the year ended November 30, 2016 was as follows for WealthBuilder Growth Allocation Portfolio:
| | | | | | | | |
| | | Amount of realized
gains (losses) on
derivatives | | | Change in unrealized
gains (losses) on
derivatives | |
Interest rate risk | | $ | 469,115 | | | $ | 75,537 | |
Equity risk | | | 280,001 | | | | 0 | |
Foreign currency risk | | | (974,536 | ) | | | 285,772 | |
| | | $ | (225,420 | ) | | $ | 361,309 | |
For WealthBuilder Equity Portfolio, the receivable for daily variation margin on open futures contracts reflected in the Statements of Assets and Liabilities only represents the current day’s variation margin. The realized gains (losses) and change in unrealized gain/losses on futures contracts are reflected in the Statements of Operations.
| | | | |
| 46 | | Wells Fargo WealthBuilder Portfolios | | Notes to financial statements (unaudited) |
For certain types of derivative transactions, the Portfolios have entered into International Swaps and Derivatives Association, Inc. master agreements (“ISDA Master Agreements”) or similar agreements with approved counterparties. The ISDA Master Agreements or similar agreements may have requirements to deliver/deposit securities or cash to/with an exchange or broker-dealer as collateral and allows the Portfolios to offset, with each counterparty, certain derivative financial instrument’s assets and/or liabilities with collateral held or pledged. Collateral requirements differ by type of derivative. Collateral or margin requirements are set by the broker or exchange clearing house for exchange traded derivatives while collateral terms are contract specific for over-the-counter traded derivatives. Cash collateral that has been pledged to cover obligations of the Portfolios under ISDA Master Agreements or similar agreements, if any, are reported separately in the Statements of Assets and Liabilities. Securities pledged as collateral, if any, are noted in the Portfolio of Investments. With respect to balance sheet offsetting, absent an event of default by the counterparty or a termination of the agreement, the reported amounts of financial assets and financial liabilities in the Statements of Assets and Liabilities are not offset across transactions between each Portfolio and the applicable counterparty. A reconciliation of the gross amounts on the Statements of Assets and Liabilities to the net amounts by derivative type, including any collateral exposure, is as follows:
| | | | | | | | | | | | | | | | | | | | |
| | | Derivative type | | Counterparty | | Gross amounts
of assets in the
Statements of
Assets and
Liabilities | | | Amounts
subject to
netting
agreements | | | Collateral
received | | | Net amount
of assets | |
WealthBuilder Conservative Allocation Portfolio | | Futures – variation margin | | Goldman Sachs | | $ | 42,750 | | | $ | 0 | | | $ | 0 | | | $ | 42,750 | |
WealthBuilder Moderate Balanced Portfolio | | Futures – variation margin | | Goldman Sachs | | | 135,375 | | | | 0 | | | | 0 | | | | 135,375 | |
WealthBuilder Growth Balanced Portfolio | | Futures – variation margin | | Goldman Sachs | | | 159,719 | | | | 0 | | | | 0 | | | | 159,719 | |
WealthBuilder Growth Allocation Portfolio | | Futures – variation margin | | Goldman Sachs | | | 70,063 | | | | 0 | | | | 0 | | | | 70,063 | |
8. ACQUISITION
After the close of business on July 22, 2016, WealthBuilder Tactical Equity Portfolio acquired the net assets of WealthBuilder Equity Portfolio. The purpose of the transaction was to combine two funds with similar investment objectives and strategies. The acquisition was accomplished by a tax-free exchange of all of the shares of WealthBuilder Equity Portfolio Fund for 7,072,695 shares WealthBuilder Tactical Equity Portfolio valued at $131,447,569 at an exchange ratio of 0.81. The investment portfolio of WealthBuilder Equity Portfolio with a fair value of $116,820,114, identified cost of $94,433,807 and unrealized gains of $22,386,307 at July 22, 2016 were the principal assets acquired by WealthBuilder Tactical Equity Portfolio. The aggregate net assets of WealthBuilder Equity Portfolio and WealthBuilder Tactical Equity Portfolio immediately prior to the acquisition were $131,447,569 and $362,873,519, respectively. The aggregate net assets of WealthBuilder Tactical Equity Portfolio Fund immediately after the acquisition were $494,321,088. For financial reporting purposes, assets received and shares issued by WealthBuilder Tactical Equity Portfolio were recorded at fair value; however, the cost basis of the investments received from WealthBuilder Equity Portfolio was carried forward to align ongoing reporting of WealthBuilder Tactical Equity Portfolio’s realized and unrealized gains and losses with amounts distributable to shareholders for tax purposes. In addition to the acquisition transaction, WealthBuilder Tactical Equity Portfolio changed its name to WealthBuilder Equity Portfolio.
Assuming the acquisition had been completed June 1, 2016, the beginning of the annual reporting period for WealthBuilder Equity Portfolio, the pro forma results of operations for the year ended May 31, 2016 would have been:
| | | | |
Net investment loss | | $ | (4,781,306 | ) |
Net realized and unrealized gains on investments | | | 23,709,325 | |
Net increase in net assets resulting from operations | | | 18,928,019 | |
Because the combined investment portfolios have been managed as a single integrated portfolio since the acquisition was completed, it is not practicable to separate the amounts of revenue and earnings of the acquired fund that have been included in WealthBuilder Equity Portfolio’s Statement of Operations since July 25, 2016.
| | | | | | |
| Notes to financial statements (unaudited) | | Wells Fargo WealthBuilder Portfolios | | | 47 | |
9. BANK BORROWINGS
The Trust (excluding the money market funds and certain other funds) and Wells Fargo Variable Trust are parties to a $250,000,000 revolving credit agreement whereby each Portfolio is permitted to use bank borrowings for temporary or emergency purposes, such as to fund shareholder redemption requests. Interest under the credit agreement is charged to each Portfolio based on a borrowing rate equal to the higher of the Federal Funds rate in effect on that day plus 1.25% or the overnight LIBOR rate in effect on that day plus 1.25%. In addition, an annual commitment fee equal to 0.25% of the unused balance is allocated to each participating Portfolio. Prior to August 30, 2016, the revolving credit agreement amount was $200,000,000 and the annual commitment fee was equal to 0.20% of the unused balance which was allocated to each participating Portfolio.
For the six months ended November 30, 2016, there were no borrowings by the Portfolios under the agreement.
10. INDEMNIFICATION
Under the Trust’s organizational documents, the officers and Trustees have been granted certain indemnification rights against certain liabilities that may arise out of performance of their duties to the Trust. Additionally, in the normal course of business, the Trust may enter into contracts with service providers that contain a variety of indemnification clauses. The Trust’s maximum exposure under these arrangements is dependent on future claims that may be made against the Portfolios and, therefore, cannot be estimated.
11. REGULATORY CHANGES
In October 2016, the Securities and Exchange Commission (“SEC”) adopted new rules and forms and amended existing rules and forms (together, “final rules”) intended to modernize and enhance the reporting and disclosure of information by registered investment companies and to enhance liquidity risk management by open-end mutual funds and exchange-traded funds. The final rules will enhance the quality of information available to investors and will allow the SEC to more effectively collect and use data reported by funds. In part, the final rules amend Regulation S-X and require standardized, enhanced disclosure about derivatives in the Fund’s financial statements, as well as other amendments. The compliance date for the amendments to Regulation S-X is August 1, 2017 while the compliance date for the new form types is June 1, 2018 and the compliance date for the liquidity risk management program requirements is December 1, 2018. Management is currently assessing the potential impact of these enhancements and their impact on the financial statement disclosures and reporting requirements.
12. SUBSEQUENT DISTRIBUTIONS
On December 7, 2016, the Portfolios declared distributions from short-term capital gains and long-term capital gains to shareholders of record on December 6, 2016. The per share amounts payable on December 8, 2016 were as follows:
| | | | | | | | |
| | | Short-term capital gains | | | Long-term capital gains | |
WealthBuilder Conservative Allocation Portfolio | | $ | 0.00930 | | | $ | 0.16412 | |
WealthBuilder Moderate Balanced Portfolio | | | 0.00318 | | | | 0.34910 | |
WealthBuilder Growth Balanced Portfolio | | | 0.00000 | | | | 0.52760 | |
WealthBuilder Growth Allocation Portfolio | | | 0.00000 | | | | 0.64167 | |
WealthBuilder Equity Portfolio | | | 0.00000 | | | | 0.00456 | |
On December 29, 2016, the Portfolios declared distributions from net investment income to shareholders of record on December 28, 2016. The per share amounts payable on December 30, 2016 were as follows:
| | | | |
| | | Net investment income | |
WealthBuilder Conservative Allocation Portfolio | | $ | 0.03836 | |
WealthBuilder Moderate Balanced Portfolio | | | 0.01481 | |
On January 25, 2017, WealthBuilder Conservative Allocation Portfolio declared distributions from net investment income in the amount of $0.01234 per share to shareholders of record on January 24, 2017. This amount was paid to shareholders on January 26, 2017.
These distributions are not reflected in the accompanying financial statements. The final determination of the source of all distributions is subject to change and made after the tax year-end of each Portfolio.
| | | | |
| 48 | | Wells Fargo WealthBuilder Portfolios | | Other information (unaudited) |
PROXY VOTING INFORMATION
A description of the policies and procedures used to determine how to vote proxies relating to portfolio securities is available without charge, upon request, by calling 1-800-222-8222, visiting our website at wellsfargofunds.com, or visiting the SEC website at sec.gov. Information regarding how the proxies related to portfolio securities were voted during the most recent 12-month period ended June 30 is available on the website at wellsfargofunds.com or by visiting the SEC website at sec.gov.
PORTFOLIO HOLDINGS INFORMATION
The complete portfolio holdings are publicly available on the website (wellsfargofunds.com) on a one-month delayed basis. In addition, top ten holdings information (excluding derivative positions) is publicly available on the website on a monthly, seven-day or more delayed basis. Each Portfolio files its complete schedule of portfolio holdings with the SEC for the first and third quarters of each fiscal year on Form N-Q, which is available by visiting the SEC website at sec.gov. In addition, each Form N-Q may be reviewed and copied at the SEC’s Public Reference Room in Washington, DC, and at regional offices in New York City, at 233 Broadway, and in Chicago, at 175 West Jackson Boulevard, Suite 900. Information about the Public Reference Room may be obtained by calling 1-800-SEC-0330.
| | | | | | |
| Other information (unaudited) | | Wells Fargo WealthBuilder Portfolios | | | 49 | |
BOARD OF TRUSTEES AND OFFICERS
Each of the Trustees and Officers1 listed in the table below acts in identical capacities for each fund in the Wells Fargo family of funds, which consists of 139 mutual funds comprising the Wells Fargo Funds Trust, Wells Fargo Variable Trust, Wells Fargo Master Trust and four closed-end funds (collectively the “Fund Complex”). This table should be read in conjunction with the Prospectus and the Statement of Additional Information2. The mailing address of each Trustee and Officer is 525 Market Street, 12th Floor, San Francisco, CA 94105. Each Trustee and Officer serves an indefinite term, however, each Trustee serves such term until reaching the mandatory retirement age established by the Trustees.
Independent Trustees
| | | | | | |
Name and year of birth | | Position held and length of service* | | Principal occupations during past five years or longer | | Current other public company or investment company directorships |
William R. Ebsworth (Born 1957) | | Trustee, since 2015 | | Retired. From 1984 to 2013, equities analyst, portfolio manager, research director and chief investment officer at Fidelity Management and Research Company in Boston, Tokyo, and Hong Kong and retired in 2013 as Chief Investment Officer of Fidelity Strategic Advisers, Inc. where he lead a team of investment professionals managing client assets. Prior thereto, Board member of Hong Kong Securities Clearing Co., Hong Kong Options Clearing Corp., the Thailand International Fund, Ltd., Fidelity Investments Life Insurance Company, and Empire Fidelity Investments Life Insurance Company. Mr. Ebsworth is a CFA® charterholder and an Adjunct Lecturer, Finance, at Babson College. | | Asset Allocation Trust |
Jane A. Freeman (Born 1953) | | Trustee, since 2015 | | Retired. From 2012 to 2014 and 1999 to 2008, Chief Financial Officer of Scientific Learning Corporation. From 2008 to 2012, Ms. Freeman provided consulting services related to strategic business projects. Prior to 1999, Portfolio Manager at Rockefeller & Co. and Scudder, Stevens & Clark. Board member of the Harding Loevner Funds from 1996 to 2014, serving as both Lead Independent Director and chair of the Audit Committee. Board member of the Russell Exchange Traded Funds Trust from 2011 to 2012 and the chair of the Audit Committee. Ms. Freeman is Chair of Taproot Foundation (non-profit organization), a Board Member of Ruth Bancroft Garden (non-profit organization) and an inactive chartered financial analyst. | | Asset Allocation Trust |
Peter G. Gordon** (Born 1942) | | Trustee, since 1998; Chairman, since 2005 | | Co-Founder, Retired Chairman, President and CEO of Crystal Geyser Water Company. Trustee Emeritus, Colby College. | | Asset Allocation Trust |
Isaiah Harris, Jr. (Born 1952) | | Trustee, since 2009 | | Retired. Chairman of the Board of CIGNA Corporation since 2009, and Director since 2005. From 2003 to 2011, Director of Deluxe Corporation. Prior thereto, President and CEO of BellSouth Advertising and Publishing Corp. from 2005 to 2007, President and CEO of BellSouth Enterprises from 2004 to 2005 and President of BellSouth Consumer Services from 2000 to 2003. Emeritus member of the Iowa State University Foundation Board of Governors. Emeritus Member of the Advisory Board of Iowa State University School of Business. Advisory Board Member, Palm Harbor Academy (charter school). Advisory Board Member, Child Evangelism Fellowship (non-profit). Mr. Harris is a certified public accountant (inactive status). | | CIGNA Corporation; Asset Allocation Trust |
Judith M. Johnson (Born 1949) | | Trustee, since 2008; Audit Committee Chairman, since 2008 | | Retired. Prior thereto, Chief Executive Officer and Chief Investment Officer of Minneapolis Employees Retirement Fund from 1996 to 2008. Ms. Johnson is an attorney, certified public accountant and a certified managerial accountant. | | Asset Allocation Trust |
David F. Larcker (Born 1950) | | Trustee, since 2009 | | James Irvin Miller Professor of Accounting at the Graduate School of Business, Stanford University, Director of the Corporate Governance Research Initiative and Senior Faculty of The Rock Center for Corporate Governance since 2006. From 2005 to 2008, Professor of Accounting at the Graduate School of Business, Stanford University. Prior thereto, Ernst & Young Professor of Accounting at The Wharton School, University of Pennsylvania from 1985 to 2005. | | Asset Allocation Trust |
| | | | |
| 50 | | Wells Fargo WealthBuilder Portfolios | | Other information (unaudited) |
| | | | | | |
Name and year of birth | | Position held and length of service* | | Principal occupations during past five years or longer | | Current other public company or investment company directorships |
Olivia S. Mitchell (Born 1953) | | Trustee, since 2006 | | International Foundation of Employee Benefit Plans Professor, Wharton School of the University of Pennsylvania since 1993. Director of Wharton’s Pension Research Council and Boettner Center on Pensions & Retirement Research, and Research Associate at the National Bureau of Economic Research. Previously, Cornell University Professor from 1978 to 1993. | | Asset Allocation Trust |
Timothy J. Penny (Born 1951) | | Trustee, since 1996 | | President and Chief Executive Officer of Southern Minnesota Initiative Foundation, a non-profit organization, since 2007 and Senior Fellow at the Humphrey Institute Policy Forum at the University of Minnesota since 1995. Member of the Board of Trustees of NorthStar Education Finance, Inc., a non-profit organization, since 2007. | | Asset Allocation Trust |
Michael S. Scofield (Born 1943) | | Trustee, since 2010 | | Served on the Investment Company Institute’s Board of Governors and Executive Committee from 2008-2011 as well the Governing Council of the Independent Directors Council from 2006-2011 and the Independent Directors Council Executive Committee from 2008-2011. Chairman of the IDC from 2008-2010. Institutional Investor (Fund Directions) Trustee of Year in 2007. Trustee of the Evergreen Funds complex (and its predecessors) from 1984 to 2010. Chairman of the Evergreen Funds from 2000-2010. Former Trustee of the Mentor Funds. Retired Attorney, Law Offices of Michael S. Scofield. | | Asset Allocation Trust |
| * | Length of service dates reflect the Trustee’s commencement of service with the Trust’s predecessor entities, where applicable. |
| ** | Peter Gordon is expected to retire on December 31, 2017. |
Officers
| | | | | | |
Name and year of birth | | Position held and length of service | | Principal occupations during past five years or longer | | |
Andrew Owen3 (Born 1960) | | President, since 2017 | | Executive Vice President of Wells Fargo & Company and Head of Affiliated Managers, Wells Fargo Asset Management, since 2014. Executive Vice President responsible for marketing, investments and product development for Wells Fargo Funds Management, LLC, from 2009 to 2014. | | |
Jeremy DePalma1 (Born 1974) | | Treasurer, since 2012 | | Senior Vice President of Wells Fargo Funds Management, LLC since 2009. Senior Vice President of Evergreen Investment Management Company, LLC from 2008 to 2010 and head of the Fund Reporting and Control Team within Fund Administration from 2005 to 2010. | | |
C. David Messman (Born 1960) | | Secretary, since 2000; Chief Legal Officer, since 2003 | | Senior Vice President and Secretary of Wells Fargo Funds Management, LLC since 2001. Assistant General Counsel of Wells Fargo Bank, N.A. since 2013 and Vice President and Managing Counsel of Wells Fargo Bank, N.A. from 1996 to 2013. | | |
Michael Whitaker (Born 1967) | | Chief Compliance Officer, since 2016 | | Executive Vice President of Wells Fargo Funds Management, LLC since 2016. Chief Compliance Officer of Fidelity’s Fixed Income Funds and Asset Allocation Funds from 2008 to 2016, Compliance Officer of FMR Co., Inc. from 2014 to 2016, Fidelity Investments Money Management, Inc. from 2014 to 2016, Fidelity Investments from 2007 to 2016. | | |
David Berardi (Born 1975) | | Assistant Treasurer, since 2009 | | Vice President of Wells Fargo Funds Management, LLC since 2009. Vice President of Evergreen Investment Management Company, LLC from 2008 to 2010. Manager of Fund Reporting and Control for Evergreen Investment Management Company, LLC from 2004 to 2010. | | |
| 1 | Jeremy DePalma acts as Treasurer of 69 funds and Assistant Treasurer of 70 funds in the Fund Complex. |
| 2 | The Statement of Additional Information includes additional information about the Trustees and is available, without charge, upon request, by calling
1-800-222-8222 or by visiting the website at wellsfargofunds.com. |
| 3 | Andrew Owen became President on January 1, 2017. |
| | | | | | |
| List of abbreviations | | Wells Fargo WealthBuilder Portfolios | | | 51 | |
The following is a list of common abbreviations for terms and entities that may have appeared in this report.
| ACA | — ACA Financial Guaranty Corporation |
| ADR | — American depositary receipt |
| ADS | — American depositary shares |
| AGC | — Assured Guaranty Corporation |
| AGM | — Assured Guaranty Municipal |
| Ambac | — Ambac Financial Group Incorporated |
| AMT | — Alternative minimum tax |
| BAN | — Bond anticipation notes |
| BHAC | — Berkshire Hathaway Assurance Corporation |
| CAB | — Capital appreciation bond |
| CCAB | — Convertible capital appreciation bond |
| CDA | — Community Development Authority |
| CDO | — Collateralized debt obligation |
| DRIVER | — Derivative inverse tax-exempt receipts |
| DW&P | — Department of Water & Power |
| DWR | — Department of Water Resources |
| ECFA | — Educational & Cultural Facilities Authority |
| EDA | — Economic Development Authority |
| EDFA | — Economic Development Finance Authority |
| ETF | — Exchange-traded fund |
| FDIC | — Federal Deposit Insurance Corporation |
| FFCB | — Federal Farm Credit Banks |
| FGIC | — Financial Guaranty Insurance Corporation |
| FHA | — Federal Housing Administration |
| FHLB | — Federal Home Loan Bank |
| FHLMC | — Federal Home Loan Mortgage Corporation |
| FICO | — The Financing Corporation |
| FNMA | — Federal National Mortgage Association |
| GDR | — Global depositary receipt |
| GNMA | — Government National Mortgage Association |
| HCFR | — Healthcare facilities revenue |
| HEFA | — Health & Educational Facilities Authority |
| HEFAR | — Higher education facilities authority revenue |
| HFA | — Housing Finance Authority |
| HFFA | — Health Facilities Financing Authority |
| HUD | — Department of Housing and Urban Development |
| IDA | — Industrial Development Authority |
| IDAG | — Industrial Development Agency |
| KRW | — Republic of Korea won |
| LIBOR | — London Interbank Offered Rate |
| LIFER | — Long Inverse Floating Exempt Receipts |
| LLC | — Limited liability company |
| LLLP | — Limited liability limited partnership |
| LLP | — Limited liability partnership |
| MBIA | — Municipal Bond Insurance Association |
| MFHR | — Multifamily housing revenue |
| MSTR | — Municipal securities trust receipts |
| MUD | — Municipal Utility District |
| National | — National Public Finance Guarantee Corporation |
| PCFA | — Pollution Control Financing Authority |
| PCL | — Public Company Limited |
| PCR | — Pollution control revenue |
| PFA | — Public Finance Authority |
| PFFA | — Public Facilities Financing Authority |
| PFOTER | — Puttable floating option tax-exempt receipts |
| plc | — Public limited company |
| PUTTER | — Puttable tax-exempt receipts |
| R&D | — Research & development |
| Radian | — Radian Asset Assurance |
| RAN | — Revenue anticipation notes |
| RDA | — Redevelopment Authority |
| RDFA | — Redevelopment Finance Authority |
| REIT | — Real estate investment trust |
| ROC | — Reset option certificates |
| SAVRS | — Select auction variable rate securities |
| SBA | — Small Business Authority |
| SDR | — Swedish depositary receipt |
| SFHR | — Single-family housing revenue |
| SFMR | — Single-family mortgage revenue |
| SPA | — Standby purchase agreement |
| SPDR | — Standard & Poor’s Depositary Receipts |
| SPEAR | — Short Puttable Exempt Adjustable Receipts |
| STRIPS | — Separate trading of registered interest and |
| TAN | — Tax anticipation notes |
| TIPS | — Treasury inflation-protected securities |
| TRAN | — Tax revenue anticipation notes |
| TTFA | — Transportation Trust Fund Authority |
| TVA | — Tennessee Valley Authority |
This page is intentionally left blank.

For more information
More information about Wells Fargo Funds is available free upon request. To obtain literature, please write, email, visit the Funds’ website, or call:
Wells Fargo Funds
P.O. Box 8266
Boston, MA 02266-8266
Email: fundservice@wellsfargo.com
Website: wellsfargofunds.com
Individual investors: 1-800-222-8222
Retail investment professionals: 1-888-877-9275
Institutional investment professionals: 1-866-765-0778
This report and the financial statements contained herein are submitted for the general information of the shareholders of Wells Fargo Funds. If this report is used for promotional purposes, distribution of the report must be accompanied or preceded by a current prospectus. Before investing, please consider the investment objectives, risks, charges, and expenses of the investment. For a current prospectus and, if available, a summary prospectus, containing this information, call 1-800-222-8222 or visit the Funds’ website at wellsfargofunds.com. Read the prospectus carefully before you invest or send money.
Wells Fargo Asset Management (WFAM) is a trade name used by the asset management businesses of Wells Fargo & Company. Wells Fargo Funds Management, LLC, a wholly owned subsidiary of Wells Fargo & Company, provides investment advisory and administrative services for Wells Fargo Funds. Other affiliates of Wells Fargo & Company provide subadvisory and other services for the funds. The funds are distributed by Wells Fargo Funds Distributor, LLC, Member FINRA, an affiliate of Wells Fargo & Company. Neither Wells Fargo Funds Management nor Wells Fargo Funds Distributor has Fund customer accounts/assets, and neither provides investment advice/recommendations or acts as an investment advice fiduciary to any investor.
NOT FDIC INSURED ◾ NO BANK GUARANTEE ◾ MAY LOSE VALUE
© 2016 Wells Fargo Funds Management, LLC. All rights reserved.
| | |
 | | 248016 01-17 SWBP/SAR102 11-16 |
ITEM 2. CODE OF ETHICS
Not applicable.
ITEM 3. AUDIT COMMITTEE FINANCIAL EXPERT
Not applicable.
ITEM 4. PRINCIPAL ACCOUNTANT FEES AND SERVICES
Not applicable.
ITEM 5. AUDIT COMMITTEE OF LISTED REGISTRANTS
Not applicable.
ITEM 6. INVESTMENTS
A Portfolio of Investments for each series of Wells Fargo Funds Trust is included as part of the report to shareholders filed under Item 1 of this Form.
ITEM 7. DISCLOSURE OF PROXY VOTING POLICIES AND PROCEDURES FOR CLOSED-END MANAGEMENT INVESTMENT COMPANIES
Not applicable.
ITEM 8. PORTFOLIO MANAGERS OF CLOSED-END MANAGEMENT INVESTMENT COMPANIES
Not applicable.
ITEM 9. PURCHASES OF EQUITY SECURITIES BY CLOSED-END MANAGEMEENT INVESTMENT COMPANY AND AFFILIATED PURCHASERS
Not applicable.
ITEM 10. SUBMISSION OF MATTERS TO A VOTE OF SECURITY HOLDERS
There have been no material changes to the procedures by which shareholders may recommend nominees to the registrant’s Board of Trustees that have been implemented since the registrant’s last provided disclosure in response to the requirements of this Item.
ITEM 11. CONTROLS AND PROCEDURES
(a) The President and Treasurer have concluded that the Wells Fargo Funds Trust (the “Trust”) disclosure controls and procedures (as defined in Rule 30a-3(c) under the Investment Company Act of 1940) provide reasonable assurances that material information relating to the Trust is made known to them by the appropriate persons, based on their evaluation of these controls and procedures as of a date within 90 days of the filing of this report.
(b) There were no significant changes in the Trust’s internal controls over financial reporting (as defined in Rule 30a-3(d) under the Investment Company Act of 1940) that occurred during the second fiscal quarter of the period covered by this report that materially affected, or is reasonably likely to materially affect, the registrant’s internal control over financial reporting.
ITEM 12. EXHIBITS
(a)(1) Not applicable.
(a)(2) Certification pursuant to Rule 30a-2(a) under the Investment Company Act of 1940 (17 CFR 270.30a-2(a)) is filed and attached hereto as Exhibit 99.CERT.
(a)(3) Not applicable.
(b) Certification pursuant to Rule 30a-2(b) under the Investment Company Act of 1940 (17 CFR 270.30a-2(b)) is filed and attached hereto as Exhibit 99.906CERT.
SIGNATURES
Pursuant to the requirements of the Securities Exchange Act of 1934 and the Investment Company Act of 1940, the registrant has duly caused this report to be signed on its behalf by the undersigned, thereunto duly authorized.
| | |
| Wells Fargo Funds Trust |
| |
| By: | | /s/ Andrew Owen |
| |
| | Andrew Owen |
| | President |
| |
| Date: | | January 25, 2017 |
Pursuant to the requirements of the Securities Exchange Act of 1934 and the Investment Company Act of 1940, this report has been signed below by the following persons on behalf of the registrant and in the capacities and on the date indicated.
| | |
| Wells Fargo Funds Trust |
| |
| By: | | /s/ Andrew Owen |
| |
| | Andrew Owen |
| | President |
| |
| Date: | | January 25, 2017 |
| |
| By: | | /s/ Nancy Wiser |
| |
| | Nancy Wiser |
| | Treasurer |
| |
| Date: | | January 25, 2017 |
| |
| By: | | /s/ Jeremy DePalma |
| |
| | Jeremy DePalma |
| | Treasurer |
| |
| Date | | : January 25, 2017 |